Embed Size (px)
Citation preview

Performance and Growth of Large
Firms in China
Young-Sam Kang and Keun Lee *1
This study examines the impacts of several factors, such as
internal capital markets, technology transfer via FDI, and
in-house R&D activities on the performance and growth of firms
using data gathered from the top 200 companies in China
during the period 1998-2003. A finance company, as an affiliate
in the business group, is used as proxy for the internal capital
market. The foreign joint venture firms and in-house research
center are used as proxies for technology transfer and for the
existence of in-house R&D activities, respectively. This paper
finds that having foreign joint ventures is positively correlated
with the firms’ growth but not with the financial and market
performance of firms. In contrast, doing in-house R&D activities
is positively correlated with the financial and market perfor-
mances, as well as the growth of firms.
Keywords: Finance company, Internal capital market, Joint
venture, Technology transfer, R&D activity
JEL Classification: O31, O32, G32
I. Introduction
A great deal of research has been done in identifying the factors
that determine the performance and growth of firms in emerging
economies, as well as in developing economies. There is also a series
* Postdoctoral Fellow, Department of Economics, Seoul National University,
Seoul 151-746, Korea, (E-mail) [email protected]; Professor, Department of
Economics, Seoul National University, Seoul 151-746, Korea, (Tel) +82-2-
880-6367, (E-mail) [email protected], respectively. An earlier version of this
paper was presented at the 15th Seoul Journal of Economics International
Symposium held in Seoul, October 23, 2007. The authors would like to thank
two commentators for their useful inputs.
[Seoul Journal of Economics 2008, Vol. 21, No. 1]

SEOUL JOURNAL OF ECONOMICS230
of articles which share the view that the business group makes up
for the market failure in developing countries (Leff 1978; Goto 1982;
Khanna and Palepu 1997). This line of research suggests that firms
affiliated with a business group outperform standalone firms in
certain conditions. In addition, it is well-known that technological
progress is a critical factor for sustained economic growth and catch
up (Barney 1991; Lee and Temesgen 2005; Choo, Lee, Ryu, and
Yoon Forthcoming). Numerous studies are devoted to investigating
the impact of technological progress on the performance and growth
of firms.
China is one of the most successful emerging economies in the
world. It has been growing at a fast rate over the last two decades
and it has become a major economic player in the world. In the
course of the economic development of China, capital and technology
have been the most critical factors for sustained growth of the
economy. The government has a clear understanding of the problem,
and thus, has encouraged the FDI since the economic reform which
started in the late 1970s. Two stock markets were established in
December 1990 and July 1991 in Shanghai and Shenzhen,
respectively, and the government also has driven the reform of 4
state-owned commercial banks in order to allocate capital more
efficiently. The Chinese government also has promoted building joint
ventures with foreign firms aimed at technology transfer from
advanced countries and encouraged R&D investments for technical
catch-up (de Bruijin and Jia 1993).
Further research has been done to explore the determining factors
of performance of firms in China. However, a number of issues
regarding growth and performance of firms have remained
unexplored primarily because of the difficulties in getting access to
appropriate data regarding the organizational details of these firms.
This study uses the existence of a finance company as an affiliate
within a business group as proxy for the operation of the internal
capital market in that business group. This study also employs
having joint ventures with foreign companies and R&D centers
within the business groups as proxies for technology transfer and
R&D activities, respectively. This study then aims to explore the
impact of these variables, such as access to internal capital markets,
technology transfer, and R&D activities, on the performance and
growth of firms in China.
This paper is organized as follows. In the following section, we
PERFORMANCE AND GROWTH OF LARGE FIRMS IN CHINA 231
briefly examine the nature of the finance company, the joint venture,
and the R&D center in large-sized firms in China, and draw several
hypotheses for empirical analysis. Section III provides a statistical
profile of the top 200 firms that comprise our data set. The
regression results and findings are provided in Section IV, and a
conclusion is drawn in Section V.
II. Key Performance Factors and Hypotheses
A. Market Failures and Business Groups
a) The Literature
One theory that explains the existence of business groups is
transaction cost economics with a focus on market failure. They
contend that business groups emerge in order to make up for
market failure in developing countries. This observation was first
made by Leff (1978). He sees the business group as a microeconomic
response to market failure and “an organizational structure for
appropriating quasi rents which accrue from access to scarce and
imperfectly marketed inputs” (Leff 1978). Under circumstances of
market failure, guaranteeing access to capital by the business group
is a critical condition for better performance and for sustaining the
growth of a firm in less-developed countries. Goto (1982) also argues
that the business group is “an institutional device designed to cope
with market failure.” He sees that under certain circumstances, the
business group provides more efficient transactions among affiliated
firms than markets do. When it comes to transaction of capital,
firms can obtain broader and more secure opportunities to invest in
member firms in the group by joining the group.
Khanna and Palepu (1997, 2000b) further developed this theory
and proposed the concept of ‘institutional voids’ to explain the
emergence and existence of the diversified business group in
emerging markets. Since many of the institutions that support
business activities are absent or not fully developed in emerging
markets, the business group emerges to fill institutional voids. An
intentionally developed enterprise in a large business group can
function as an intermediary among individual entrepreneurs and
imperfect markets. Business groups can smooth out income flows by
using their broad scope and thereby provide their affiliates with
access to internal finance. They point out that several kinds of

SEOUL JOURNAL OF ECONOMICS232
institutional voids include those of capital markets, product markets,
and labor markets. They argue that, for example, almost all the
institutional mechanisms that enable capital markets to function well
in advanced economies are absent or ineffective in emerging markets.
With little information and few safeguards, investors are likely to
avoid putting money into new business. In this situation, business
groups with large and well-established companies have superior
positions in getting access to capital markets, so they can raise
capital and supply funds for new enterprises more easily. Business
groups also play the role of lending institution to existing member
firms.
Similar problems take place in product markets. Buyers and
sellers usually suffer from severe lack of information, not only
because the communication infrastructure in emerging markets is
underdeveloped but also because there are no mechanisms to
confirm the claims made by sellers or consumers. As a result, firms
in emerging markets confront much higher costs in building credible
brands than their counterparts in advanced economies. In turn,
established brands have strong power. A conglomerate with a
reputation for quality products and services can use its group name
to enter new businesses more easily. In the case of the labor market,
most emerging economies suffer from scarcity of well-trained people.
However, groups can create value by developing promising managers
and can share efficient management throughout the businesses in
the group.
There are many studies that argue that group affiliation enhances
performance of firms in emerging countries with empirical evidence.
Khanna and Rivkin (2001) examined the effects of group affiliation
on profitability using data from 14 emerging markets in Asia, Latin
America, and South Africa. They found that the mean of estimated
group effects in three countries is positive and statistically
significant, while that in one country is negative and statistically
significant. These results show that in more countries, a group-
affiliated firm outperforms an independent firm operating in the
same industry and within the same time period. They also reported
that group membership in 13 out of 14 countries is related to a
statistically significant amount of variation in their profitability
measures, which means that group effects collectively explain more
of the variation than industry effects do in many countries. Keister
(2000) shows that group affiliation enhances affiliated firms’ financial

PERFORMANCE AND GROWTH OF LARGE FIRMS IN CHINA 233
performance and productivity, using Chinese business group data
from the late 1980s. She also found out that they performed better
when they were members of more centralized groups.
The performance of group-affiliated businesses seems to be related
to group size and group diversification (Khanna 2000). Using 182
listed firms’ data in Korea, Chang and Choi (1988) found that
business group affiliated firms outperform unaffiliated firms and that
affiliates of the largest four Korean chaebol, the most diversified
groups in their classification, perform better than smaller chaebol-
affiliated and unaffiliated firms, after controlling some variables
including firm size, annual growth, advertising, and intensity.
Khanna and Palepu (2000a) analyze the data of 1309 public firms in
India and report a curvilinear relationship between group diversi-
fication and performance using ROA and Tobin’s q measure, which
indicates that group affiliated firms only outperform unaffiliated firms
beyond a certain threshold diversification level, but not under it.
They also document similar results analyzing Chilean firms’ data
(Khanna and Palepu 2000b).
These studies, however, do not concentrate on capital market
intermediation but on various intermediations including product
markets and labor markets because this line of research takes into
account that market imperfection in emerging economies is not a
phenomenon confined to capital markets but applied to other
markets as well (Khanna and Palepu 1997; Khanna 2000). Therefore,
group affiliation itself or proxies for combined intermediation are
used for their studies. However, some studies have been performed
to examine the isolated effect of internal capital markets on firms’
performance in emerging markets. Chang and Hong (2000) examined
the effects of product and capital market intermediation separately
and suggested that the internal market of business groups play some
role in supplementing imperfect external capital markets. Using late
80’s panel data on China’s 40 largest business groups and their
member firms, Keister (1998) showed that firms in business groups
with a finance company experienced better performance than firms
in groups without a finance company.
b) The Finance Companies in Chinese business groups
This study examines the effect of the internal capital market on
firms’ performance using data on the largest public companies in
China. Some business groups in China have a finance company as

SEOUL JOURNAL OF ECONOMICS234
one of their affiliates. In the process of economic development in
China, underdeveloped Chinese financial markets provided no
guarantee that funds would be efficiently supplied or distributed.
Finance companies (caiwugongsi in Chinese) emerged to facilitate
their affiliates’ access to capital markets as an alternative measure
for underdeveloped capital markets in China. A finance company is a
non-bank financial firm responsible for a business group’s finance
activity.1 Group member firms (including the core firm) primarily
create relationships with finance companies by doing equity
investment over them.
The finance companies have several roles. First, the finance
companies in business groups are supposed to manage the idle or
extra financial resources of the affiliated firms of the business
groups. However, they are prohibited by law to accept deposits from
individuals who work for member firms but are allowed to get loans
from the government through one of the state’s four specialized
banks. Based on these funds, they can make loans and provide
other financial services to group member firms. By doing so, the
finance companies make it possible for their member firms to meet
production, research and development, and marketing needs that
may not be satisfied without such access to capital.2 Finance
companies affiliated to a group are not allowed to lend funds to
individuals or firms that are not member firms.3 Furthermore,
finance companies help member firms make proper investment
decisions, regarding both intra-group investments and investment
towards outside opportunities. They are expected to perform better
based on their superior manpower in the areas of finance. Finally,
the finance company plays a central role in coordinating the
horizontal and vertical integration across firms and separation of
some firms from the group (Keister 2000). In summary, the finance
company has offered an alternative role to imperfect capital markets
1It is “an independent legal entity with an independent management
system,” and “solely responsible for its economic decisions” (Keister 2000).2Member firms recognize that they deposit money in the finance company
at higher interest than they do in commercial banks and lend money from it
at lower interest rate than from commercial banks (Qingdao Heir Annual
Report 2003). 3It was enacted as a part of bank reform after the 1993 inflation, reflecting
the concern of the government, which considered the finance company to be
a source of inflation by lending its reservoir to outside companies (Keister
2000).

PERFORMANCE AND GROWTH OF LARGE FIRMS IN CHINA 235
TABLE 1
NUMBER OF THE TOP 200 FIRMS RELATED TO A FINANCE COMPANY
Year 1998 1999 2000 2001 2002 2003
No. of sample firms related to
a finance company27 31 34 38 39 38
Source: Authors’
in China by creating and running the internal capital market in a
business group.
This study collects information about finance companies from
annual reports of the top 200 listed companies. To examine how the
internal capital market affects the performance and growth of firms,
a dummy for access to the finance company is employed. Out of the
top 200 companies, 27 are confirmed to be affiliated with business
groups that have a finance company as a subsidiary in 1998, and
the number has increased to 38 in 2003.4
As discussed above, the finance companies seem to play a role as
an internal capital market for firms affiliated to business groups;
thus, the use of a finance company within a business group the firm
belongs to as a proxy for access to internal capital markets. This
paper intends to test the following hypothesis.
Hypothesis 1: Access to an internal capital market run by the
business groups and its finance company is positively correlated
with the performance and growth of a firm listed in stock market.
B. Technology Transfer via FDI and R&D Activity
a) The General Literature
Technological progress is a critical ingredient for sustained
economic growth and catch-up. In emerging economies, access to
process-related knowledge, such as technology and operational
know-how as well as access to capital, is a critical condition for
sustained growth of firms (Barney 1991; Guillen 2000). Technology
transfer refers to the transfer, absorption, and adaptation of
technology, including technology know-how and technology services
4There were 74 finance companies that were affiliated with a business
group in 2004 (China Banking Regulatory Commission, Jingjicankaobao,
2004. 5. 21).

SEOUL JOURNAL OF ECONOMICS236
(Andresosso-O’callaghan and Qian 1999). The essence of technology
transfer is a learning process that allows the latecomer to narrow the
technology gap by shifting the emphasis towards innovation, and
ultimately to catch up (Shin 1996).
According to Mansfield (1975), there are three phases of
technological transfer. The first phase refers to the so called ‘material
transfer’ which involves the transfer of a new material or products to
a country. The second phase corresponds to the transfer of designs
and blueprints that facilitate the manufacturing process of the new
product or material. The last phase refers to ‘capacity transfer’ and
involves adapting a new item to the specific conditions of the
recipient country. The last phase is much more difficult to achieve
because of differences in markets, quality, tastes, and etc.
In relation to the first two phases, a direct form or pathway of
spatial technology diffusion is represented by the acquisition of
factories on a turn-key basis. The indirect form of technology transfer
includes licensing, co-production, joint ventures with majority/
minority equity participation, and wholly or partly-owned subsidiaries
established through the FDI.
b) The Chinese Case
The joint venture law was issued in 1979, and thereafter, China
began to introduce laws and regulations to establish an institutional
and legislative infrastructure in order to stimulate foreign invest-
ment. The Chinese government encouraged foreign investors to build
up joint ventures with Chinese firms aimed at obtaining foreign
exchange, increasing industrial efficiency, realizing import substitu-
tion, and creating new jobs.5 In general, foreign investors have
several motivations for creating joint ventures such as access to the
Chinese market, utilization of low labor costs, and favorable
treatment from the Chinese government (exemption, obtaining
finance, and so on). The aims of Chinese firms for building up joint
ventures are to obtain advanced technology, to get access to foreign
markets, to have instruments for advancement in the local market,
and to develop research and development capacity (de Bruijin and
5 Due to WTO-related deregulations, foreign firms are no longer required to
have Chinese venture partners to invest in most high-tech industries. As a
result, more and more R&D facilities in China are wholly foreign owned
(Lundin and Serger 2007).
PERFORMANCE AND GROWTH OF LARGE FIRMS IN CHINA 237
Jia, 1993).
In the case of China, most of the technology has been transferred
via the FDI, and more specifically with the help of joint ventures.6
Technology transfer through joint ventures is very often associated
with training of labor and management skills (Andresosso-O’callaghan
and Qian 1999). In addition, a lot of recent studies report that
foreign firms, including joint ventures, function as an important
venue of technological transfer (Andreosso-Ocallaghan and Qian
1999; Hu et al. 2003). After these, many researchers have devoted
themselves to exploring how technology transfer contributes to
economic growth or, more specifically, how it affects productivity
and/or indigenous innovation activity. However, the results vary.
Lundin and Serger (2007) report the R&D activities of most foreign
firms are still predominantly development-focused, rather than
research-focused, to support local business and customers, although
large multinational enterprises (MNEs) have begun to locate inno-
vative R&D in China in recent years. In contrast, they report both
state-owned and private firms, which have higher R&D intensity
than the FDI firms based on the analysis of a dataset of Chinese
manufacturing firms for the period 1998-2004.
Motohasi (2006) reports similar findings. According to him, the
R&D intensity of foreign-owned firms is relatively weaker than that of
domestic firms, which stems from the fact that foreign-owned firms
are operating by relying on technological capability at home. He
confirms that the major motivation of foreign R&D in China is
“market driven” instead of “technology driven” or “human resource
driven” based on statistical analysis.
Hu, Jefferson, and Qian (2003) examined the contributions of each
of the three avenues of technological advance, such as domestic
R&D, technology transfer, and foreign direct investment as well as
their interactions to productivity within Chinese industry using
6Joint ventures represented more than 70% of China’s total production in
1995 (Andresosso-O’Callaghan and Qian 1999). Shanghai Volkswagen
Automobile Corporation, a 50-50 joint venture between Volkswagenwerk AG
and the Shanghai Automobile Industry Corporation founded in 1984, has
become the largest joint venture in terms of sales of all recorded JVs in any
industrial sector since 1990. European motor manufacturers have secured a
strong foothold in China. According to Andresosso-O’Callaghan and Qian
(1999), broadening technology transfer provided the basis for the early
success of European motor firms.

SEOUL JOURNAL OF ECONOMICS238
firm-level data during a period of five years from 1995 to 1999. They
measured foreign (domestic) technology transfer by a firm’s
expenditure on disembodied technology purchased from a foreign
(domestic) provider, such as patent licensing and payment for
blueprints of technology. They reported two interesting findings. The
first one is that the effects of both domestic and foreign market-
mediated technology transfer on firm productivity are significant only
when they are combined with in-house R&D. The second finding is
that the market-mediated technology transfer does not have any
impacts on the FDI firms except when foreign market-mediated
technology transfer is combined with indigenous R&D.
This last study seems to suggest the importance of indigenous
R&D effort by local Chinese firms or partners, and the need to pay
more attention of in-house R&D activities by local Chinese firms.
Before economic reform, firms had no incentive to perform R&D in
China because the technology acquired as a result of the R&D had
strong characteristics of public goods. Under the planned economy,
government required enterprises to have “cooperation spirits,” and
thus, technology was commonly transferred free of charge. This free
technology sharing existed for a long time even after the reform
started (Kong 2003).
In March 1985, the Chinese government issued the Decision on
S&T (science and technology) System, which became the landmark of
Chinese S&T system reform. This decision shaped the transformation
of corporate R&D in several ways. First, the government required
that technology be transferred with fees. Second, the Chinese
government encouraged technology development institutes to be
combined with firms in several ways and encouraged S&T institutes
to develop into firms or enter into firms.7 Large firms were supposed
to strengthen their technology exploitation departments or research
organizations. Small firms under certain conditions could still have
their own technology exploitation capabilities. Firms could allocate
the technology exploitation fees into costs according to regulations
and apply for technology exploitation loans from banks. Third, the
government required that technology imports focus on production
7 According to Kong (2003), many institutes entered into firms via other
ways. In 1987, one third of 5568 research institutes entered into enterprises
by entering into LMEs (large and medium sized enterprises) and business
groups, forming small firms, participating and becoming industrial technology
exploitation units, etc.
PERFORMANCE AND GROWTH OF LARGE FIRMS IN CHINA 239
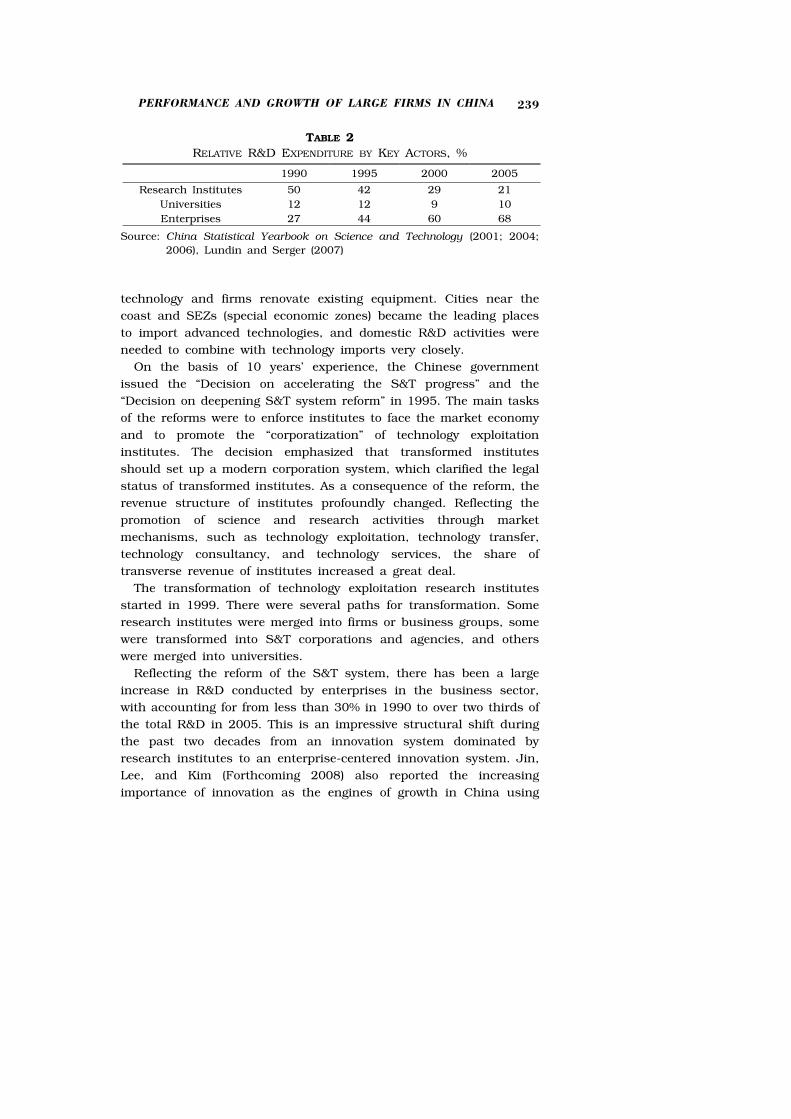
TABLE 2
RELATIVE R&D EXPENDITURE BY KEY ACTORS, %
1990 1995 2000 2005
Research Institutes 50 42 29 21
Universities 12 12 9 10
Enterprises 27 44 60 68
Source: China Statistical Yearbook on Science and Technology (2001; 2004;
2006), Lundin and Serger (2007)
technology and firms renovate existing equipment. Cities near the
coast and SEZs (special economic zones) became the leading places
to import advanced technologies, and domestic R&D activities were
needed to combine with technology imports very closely.
On the basis of 10 years’ experience, the Chinese government
issued the “Decision on accelerating the S&T progress” and the
“Decision on deepening S&T system reform” in 1995. The main tasks
of the reforms were to enforce institutes to face the market economy
and to promote the “corporatization” of technology exploitation
institutes. The decision emphasized that transformed institutes
should set up a modern corporation system, which clarified the legal
status of transformed institutes. As a consequence of the reform, the
revenue structure of institutes profoundly changed. Reflecting the
promotion of science and research activities through market
mechanisms, such as technology exploitation, technology transfer,
technology consultancy, and technology services, the share of
transverse revenue of institutes increased a great deal.
The transformation of technology exploitation research institutes
started in 1999. There were several paths for transformation. Some
research institutes were merged into firms or business groups, some
were transformed into S&T corporations and agencies, and others
were merged into universities.
Reflecting the reform of the S&T system, there has been a large
increase in R&D conducted by enterprises in the business sector,
with accounting for from less than 30% in 1990 to over two thirds of
the total R&D in 2005. This is an impressive structural shift during
the past two decades from an innovation system dominated by
research institutes to an enterprise-centered innovation system. Jin,
Lee, and Kim (Forthcoming 2008) also reported the increasing
importance of innovation as the engines of growth in China using
SEOUL JOURNAL OF ECONOMICS240
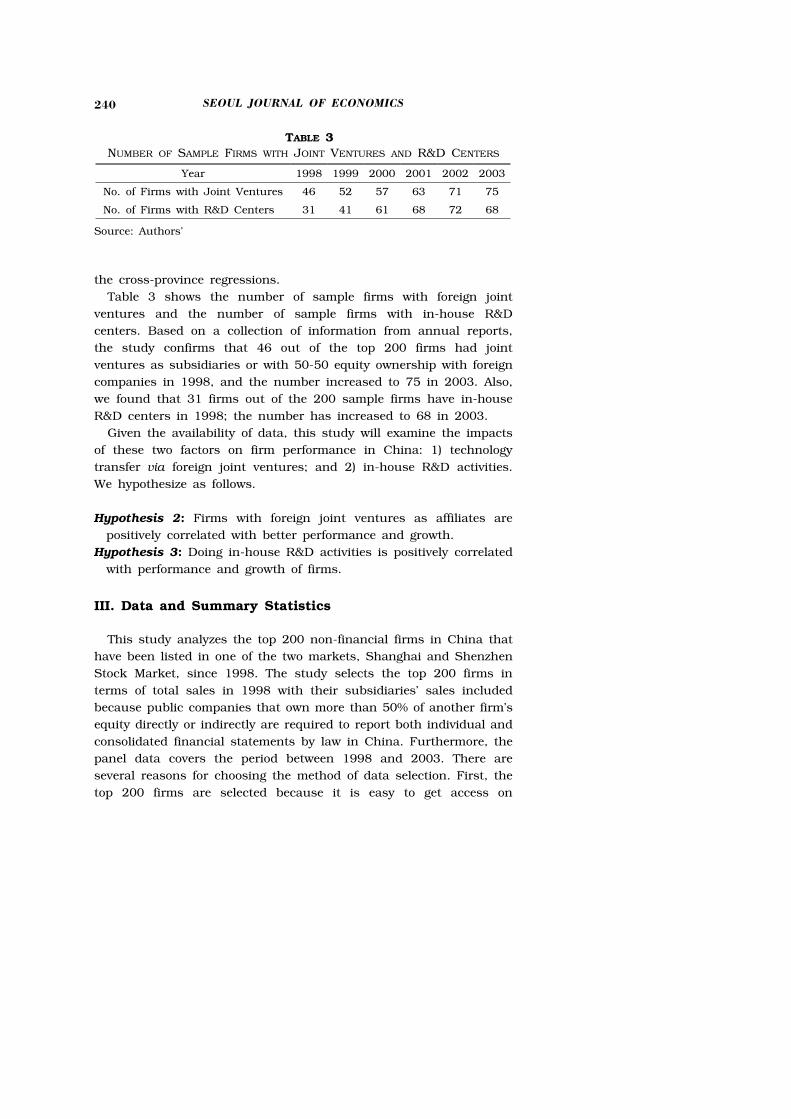
TABLE 3
NUMBER OF SAMPLE FIRMS WITH JOINT VENTURES AND R&D CENTERS
Year 1998 1999 2000 2001 2002 2003
No. of Firms with Joint Ventures 46 52 57 63 71 75
No. of Firms with R&D Centers 31 41 61 68 72 68
Source: Authors’
the cross-province regressions.
Table 3 shows the number of sample firms with foreign joint
ventures and the number of sample firms with in-house R&D
centers. Based on a collection of information from annual reports,
the study confirms that 46 out of the top 200 firms had joint
ventures as subsidiaries or with 50-50 equity ownership with foreign
companies in 1998, and the number increased to 75 in 2003. Also,
we found that 31 firms out of the 200 sample firms have in-house
R&D centers in 1998; the number has increased to 68 in 2003.
Given the availability of data, this study will examine the impacts
of these two factors on firm performance in China: 1) technology
transfer via foreign joint ventures; and 2) in-house R&D activities.
We hypothesize as follows.
Hypothesis 2: Firms with foreign joint ventures as affiliates are
positively correlated with better performance and growth.
Hypothesis 3: Doing in-house R&D activities is positively correlated
with performance and growth of firms.
III. Data and Summary Statistics
This study analyzes the top 200 non-financial firms in China that
have been listed in one of the two markets, Shanghai and Shenzhen
Stock Market, since 1998. The study selects the top 200 firms in
terms of total sales in 1998 with their subsidiaries’ sales included
because public companies that own more than 50% of another firm’s
equity directly or indirectly are required to report both individual and
consolidated financial statements by law in China. Furthermore, the
panel data covers the period between 1998 and 2003. There are
several reasons for choosing the method of data selection. First, the
top 200 firms are selected because it is easy to get access on
PERFORMANCE AND GROWTH OF LARGE FIRMS IN CHINA 241
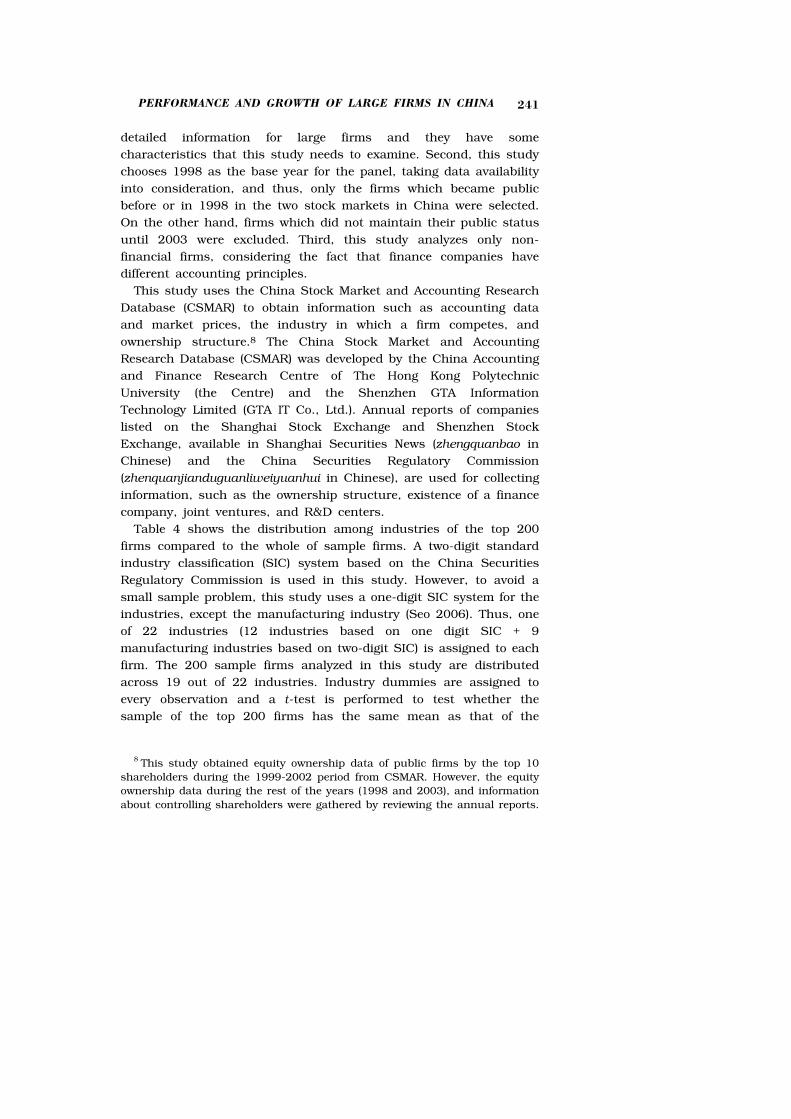
detailed information for large firms and they have some
characteristics that this study needs to examine. Second, this study
chooses 1998 as the base year for the panel, taking data availability
into consideration, and thus, only the firms which became public
before or in 1998 in the two stock markets in China were selected.
On the other hand, firms which did not maintain their public status
until 2003 were excluded. Third, this study analyzes only non-
financial firms, considering the fact that finance companies have
different accounting principles.
This study uses the China Stock Market and Accounting Research
Database (CSMAR) to obtain information such as accounting data
and market prices, the industry in which a firm competes, and
ownership structure.8 The China Stock Market and Accounting
Research Database (CSMAR) was developed by the China Accounting
and Finance Research Centre of The Hong Kong Polytechnic
University (the Centre) and the Shenzhen GTA Information
Technology Limited (GTA IT Co., Ltd.). Annual reports of companies
listed on the Shanghai Stock Exchange and Shenzhen Stock
Exchange, available in Shanghai Securities News (zhengquanbao in
Chinese) and the China Securities Regulatory Commission
(zhenquanjianduguanliweiyuanhui in Chinese), are used for collecting
information, such as the ownership structure, existence of a finance
company, joint ventures, and R&D centers.
Table 4 shows the distribution among industries of the top 200
firms compared to the whole of sample firms. A two-digit standard
industry classification (SIC) system based on the China Securities
Regulatory Commission is used in this study. However, to avoid a
small sample problem, this study uses a one-digit SIC system for the
industries, except the manufacturing industry (Seo 2006). Thus, one
of 22 industries (12 industries based on one digit SIC + 9
manufacturing industries based on two-digit SIC) is assigned to each
firm. The 200 sample firms analyzed in this study are distributed
across 19 out of 22 industries. Industry dummies are assigned to
every observation and a t-test is performed to test whether the
sample of the top 200 firms has the same mean as that of the
8This study obtained equity ownership data of public firms by the top 10
shareholders during the 1999-2002 period from CSMAR. However, the equity
ownership data during the rest of the years (1998 and 2003), and information
about controlling shareholders were gathered by reviewing the annual reports.

SEOUL JOURNAL OF ECONOMICS242
TABLE 4
DISTRIBUTION OF INDUSTRIES OF SAMPLE FIRMS
Industry
Code
Whole Sample Top 200 (A) Other Firms (B) Difference
No. of
FirmsPercentage
No. of
FirmsPercentage
No. of
FirmsPercentage
t-test
for mean
A 18 2.19 2 1.00 16 2.58 -1.58
B 6 0.73 1 0.50 5 0.81 -0.31
C0 38 4.63 13 6.50 25 4.03 2.47
C1 33 4.02 10 5.00 23 3.70 1.3
C2 1 0.12 0 0.00 1 0.16 -0.16
C3 17 2.07 0 0.00 17 2.74 -2.74*
C4 93 11.33 18 9.00 75 12.08 -3.08
C5 27 3.29 11 5.50 16 2.58 2.92*
C6 74 9.01 22 11.00 52 8.37 2.63
C7 129 15.71 37 18.50 92 14.81 3.69
C8 38 4.63 9 4.50 29 4.67 -0.17
C9 7 0.85 1 0.50 6 0.97 -0.47
D 31 3.78 6 3.00 25 4.03 -1.03
E 13 1.58 6 3.00 7 1.13 1.87†
F 25 3.05 1 0.50 24 3.86 -3.36*
G 43 5.24 9 4.50 34 5.48 -0.98
H 85 10.35 39 19.50 46 7.41 12.09***
I 0 0.00 0 0.00 0 0.00 0
J 29 3.53 6 3.00 23 3.70 -0.7
K 28 3.41 3 1.50 25 4.03 -2.53†
L 9 1.10 6 3.00 9 1.45 -1.45†
M 76 9.26 2 1.00 71 11.43 -8.93***
Total 821 100 200 100 621 100
Notes: 1) †, *, **, and *** denote statistical significance at a 10 percent, 5
percent, 1 percent, and a 0.1 percent level, respectively.
2) Industry Code
A: Farming, Forestry, Animal Husbandry, and Fishery
B: Mining C0: Food and Beverage Manufacturing
C1: Textile, Apparel, Fur, and Leather Industry
C2: Wood products and Furniture C3: Paper and Printing
C4: Petroleum, Chemical, Plastic & Rubber
C5: Electronics C6: Metal, Non-Metal
C7: Machinery, Equipment & Instrument
C8: Medicine and Biological Products C9: Other Manufacturing
D: Utilities E: Construction
F: Transportation and Warehousing G: Information Technology
H: Wholesale and Retail Trade I: Finance and Insurance
J: Real Estate K: Social Services
L: Communication and Cultural Industries
M: Others
Source: China Securities Regulatory Commission
PERFORMANCE AND GROWTH OF LARGE FIRMS IN CHINA 243
TABLE 5
CHARACTERISTICS OF TOP 200 FIRMS
Variable
Top 200 Firms Other Firms Difference
ObservationMean
(Median)Observation
Mean
(Median)
Mean
(Median)
Age (Year) 200 5.27
(5.33)
608 5.74
(5.59)
-0.47
(-0.26†)
Total Assets
(Million Yuan)
200 2,890
(1,950)
610 855
(675)
2,035***
(1,275***)
Sales
(Million Yuan)
200 1,950
(1,270)
608 282
(249)
1,668***
(1,021***)
ROIC (%) 174 9.69
(8.76)
533 8.24
(8.92)
1.45
(-0.16)
Tobin's q 200 2.20
(2.08)
609 3.00
(2.72)
-0.79***
(-0.64***)
Leverage 200 0.113
(0.042)
610 0.106
(0.025)
0.01
(0.02*)
Liquidity 200 1.62
(1.44)
610 2.14
(1.63)
-0.52***
(-0.19***)
Notes: 1) t-test and Wilcoxon z-test (Mann-Whitney) are performed to test
the equality of the mean and median, respectively, between the
panel sample and unselected firms.
2) †, *, **, and *** denote statistical significance at a 10 percent, 5
percent, 1 percent, and 0.1 percent level, respectively.
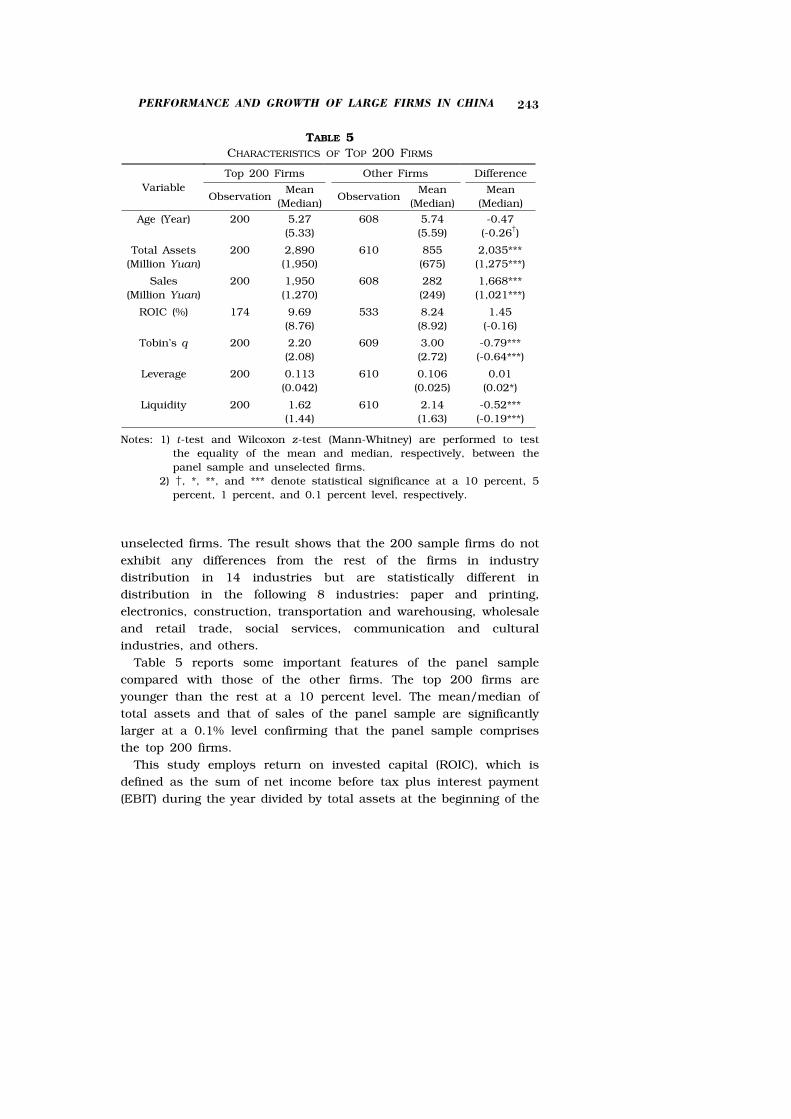
unselected firms. The result shows that the 200 sample firms do not
exhibit any differences from the rest of the firms in industry
distribution in 14 industries but are statistically different in
distribution in the following 8 industries: paper and printing,
electronics, construction, transportation and warehousing, wholesale
and retail trade, social services, communication and cultural
industries, and others.
Table 5 reports some important features of the panel sample
compared with those of the other firms. The top 200 firms are
younger than the rest at a 10 percent level. The mean/median of
total assets and that of sales of the panel sample are significantly
larger at a 0.1% level confirming that the panel sample comprises
the top 200 firms.
This study employs return on invested capital (ROIC), which is
defined as the sum of net income before tax plus interest payment
(EBIT) during the year divided by total assets at the beginning of the

SEOUL JOURNAL OF ECONOMICS244
year, as a dependent variable to measure firm-level economic
performance. Most studies analyzing financial performance of public
firms in China use ROA. This study, however, uses ROIC as a proxy
for cash flow return because this measure of performance enables us
to analyze firms’ performance without being biased by the different
degrees of debt-equity ratios. Test results show that the mean/
median ROIC of the panel is not different from the mean/median of
the rest of the firms. A proxy for the Tobin’s q, defined as the sum of
the market value of equity plus book value of debt divided by book
value of assets, is used for analyzing market performance. A more
accurate measurement of the Tobin’s q is not allowed because the
required data are unavailable. According to the test results, the
mean/median value of the Tobin’s q of the top 200 firms is much
smaller than that of the remaining firms.
This study also uses two variables, the indicator of liquidity and
the level of debt carried by the firm, to control for the availability of
capital raised (Myers 1977; Myers and Majluf 1984; Chang 2003).
The leverage ratio is calculated by long term loans divided by the
book value of equity while the liquidity ratio is defined as liquid
assets divided by current liabilities. A high debt-equity ratio will
increase the likelihood of bankruptcy and financial distress and
thereby limit the firm’s ability to finance its investment by borrowing
(Froot, Scharfstein, and Stein 1994). It is expected that firms with
more cash and debt-carrying capacity can finance their investment
more easily; therefore, they experience higher performance (Chang
2003). The median value of the leverage ratio of the panel sample is
bigger than that of the rest (significant at a 5% level). The top 200
firms have a lesser liquidity ratio compared to the unselected firms
and the difference is statistically significant, which means the larger
the firm the lesser the liquidity ratio.
IV. Results and Findings
A. Financial Performance: Cash Flow Return
Because the dataset used in this study covers a five-year period, it
is necessary to employ an appropriate method to analyze the panel
data. If Xkit is defined as the kth independent variable of firm i at
time t, the model can be expressed as follows.

PERFORMANCE AND GROWTH OF LARGE FIRMS IN CHINA 245
Industry adjusted cash flow returnit (IACRit)=β0+β1X1it+β2X2it+ui+εit
where,
X1: control variables,
X2: variables capture firm’s characteristics: explanatory variables
ui: the firm individual effect, taken to be constant over time t and
specific to the individual firm i.
εit: the reminder stochastic disturbance term, assumed inde-
pendent of the Xit for all i and t. ε it~ iid (0, δε2).
Two basic frameworks are used to generalize the panel regression.
The fixed effects approach takes ui to be a group specific constant
term in the regression model while the random effects approach
considers ui as a group specific random disturbance, similar to ε it except that it is constant through time (Greene 2002). Fixed effects
always give consistent results; thus, it is reasonable to run fixed
effects with panel data even when ui is assumed to be correlated
with Xit, but they may not be the most efficient model to run.
Random effects will yield a better P-value as they are a more efficient
estimator, but they can be used under the very strict assumption
that ui is not correlated with the firm’s behavior Xit. In other words,
it is recommended that one run random effects if it is statistically
justifiable to do so. The Hausman test checks a more efficient model
against a less efficient but consistent model to make sure that the
more efficient model also gives consistent results.
Industry-adjusted cash flow, which returns to assets, is used as
the dependent variable to examine the effects of explanatory
variables on financial performance of a firm. It is practical to use the
industry-adjusted measure in controlling industry-related factors as
well as annual noises. As mentioned before, this study uses return
on invested capital (ROIC) as a cash flow return measure, which is
defined as pretax income plus interest payments (EBIT) during the
year divided by total assets at the beginning of the year. Industry
adjusted cash flow returns to assets is calculated by subtracting the
industry median of cash flow returns to assets at time t from raw
cash flow returns to assets at time t.
The natural log value of sales is used to control for firm size. This
study adds the liquidity and leverage ratio of a firm, defined as
liquidity assets divided by current liabilities at the beginning of year
t and long term debt divided by equity at the beginning of the year t,

SEOUL JOURNAL OF ECONOMICS246
respectively, to control for the availability of capital raised.
Dummy variables for the characteristics of control shareholder are
included as control variables. Many studies report that firms
controlled by the state are outperformed by legal person-controlled
firms in China (Xu and Wang 1999). Equity ownership by the top
shareholder is also used as control variable. Wang et al. (2004)
report that the degree of ownership concentration is positively
correlated with the operating performance using public company data
for the period 1994 to 2000.
The finance company captures the internal financial market. In
regression analyses, if a firm is affiliated with a business group
which has a finance company, 1 is assigned; otherwise, 0 is
assigned. The joint venture captures technology transfer from firms
in advanced countries and R&D centers capture indigenous R&D
activities. The dummy value 1 is assigned to a firm, which has 50%
or a greater percentage of ownership directly or indirectly of one or
several joint ventures with foreign companies; 0 is assigned
otherwise. If a firm has R&D departments or R&D centers in it or as
a subsidiary, the dummy value is set equal to one. The last variable,
outside guarantees, is built to capture resource exchanges between
firms. This study assigns 1 as a dummy value when a firm provides
a guarantee to outside companies. There is a good possibility of
causality between performance and explanatory variables, such as
the finance company, joint ventures, and R&D centers. To eliminate
the causality problem, this study uses lagged variables of them in
regression analysis.
Table 6 reports regression results. The panel regression analyzes
almost 1,000 observations with 200 groups. As mentioned above,
this study controls for firm size by including the log value of total
sales. Results show that the firm size measured by the log of total
sales is positively correlated with cash flow. Two variables, such as
the leverage and liquidity ratio control the availability of capital
raised. The estimated coefficients of the leverage ratio are negative
and statistically significant in all regressions at least at the 5 %
level, indicating that the leverage ratio has negative effects on cash
flow return. These results are similar to those of Korean firms
(Chang and Hong 2000). The estimated coefficients of the liquidity
ratio are not statistically significant.
The state controlled firms as well as the state-owned legal person
controlled firms are significantly outperformed by the legal person

PERFORMANCE AND GROWTH OF LARGE FIRMS IN CHINA 247
TABLE 6
REGRESSION RESULTS OF FINANCIAL PERFORMANCE
Regression (1) Regression (2) Regression (3)
Fixed Random Fixed Random Fixed Random
Constant-0.3352**
(-2.91)
-0.4096***
(-6.41)
-0.3530***
(-3.17)
-0.4163***
(-6.37)
-0.3224**
(-2.76)
-0.4030***
(-6.18)
log(sales)0.0167***
(3.29)
0.0191***
(6.44)
0.0163**
(3.12)
0.0194***
(6.4)
0.0160**
(3.08)
0.0188***
(6.16)
Leverage-0.0311**
(-2.73)
-0.0254**
(-2.57)
-0.0259*
(-2.25)
-0.0226*
(-2.27)
-0.0293*
(-2.56)
-0.0230*
(-2.32)
Liquidity0.0004
(0.14)
0.0018***
(0.72)
0.0018
(0.6)
0.0026
(1.05)
0.0010
(0.34)
0.0015
(0.58)
State
controlled
-0.0599***
(-3.67)
-0.0292***
(-3.46)
-0.0596***
(-3.67)
-0.0276**
(-3.17)
SLP
controlled
-0.0683**
(-2.86)
-0.0402***
(-3.67)
-0.0694**
(-2.91)
-0.0394***
(-3.56)
Top
shareholder
0.0006
(1.23)
0.0005**
(2.76)
0.0006
(1.23)
0.0005**
(2.95)
Fnc_cmpnyl-0.0025
(-0.19)
-0.0072
(-0.97)
-0.0016
(-0.12)
-0.0072
(-0.97)
Jnt_venturel0.0179
(1.61)
0.0013
(0.21)
0.0160
(1.44)
0.0012
(0.19)
R&D_cnterl0.0112
(1.49)
0.0051
(0.9)
0.0132†
(1.76)
0.0061
(1.06)
Guarantee-0.0101
(-1.38)
-0.0075
(-1.42)
-0.0106
(-1.47)
-0.0066
(-1.27)
No_obs 988 988 960 960 960 960
No_groups 200 200 200 200 200 200
F/Wald chi2
5.59*** 68.66*** 3.39** 55.56*** 4.18*** 73.34***
R-squared 0.0776 0.1003 0.0661 0.09 0.0717 0.1071
Hausman chi2 6.75 6.04 11.99
Prob>chi2
0.3442 0.5353 0.2854
Notes: 1) “State controlled” refers to the firms whose control shareholder is
the state. “SLP controlled” stands for the firms controlled by the
state legal person shareholder. “Top shareholder” indicates equity
ownership by the top shareholder. Fnc_cmpnyl, Jnt_venturel, and
R&D_cnterl denote lagged variables for the finance company, the
joint venture, and the R&D center, respectively.
2) Fixed effects regression and random effects generalized least
square regression are performed and Hausman test results are
reported. Numbers in parentheses are t-values.
3) †, *, **, and *** denote statistical significance at 10 percent, 5
percent, 1 percent, and 0.1 percent level, respectively.

SEOUL JOURNAL OF ECONOMICS248
controlled firms, which is in line with the results of previous studies.
The signs of estimated coefficients of the dummy for financial
companies are all negative but none of them are statistically
significant, indicating that Hypothesis 1 is not supported. Thus, the
market imperfection theory is not supported. The estimated coeffi-
cients of the joint venture are all positive in 3 regressions but are
not statistically significant. The results suggest that technology
transfer through joint ventures is not very successful; thus, its
existence does not have significant effects on the performance of
firms in China. However, the R&D center has significant and positive
effects on it when the variables capturing the ownership structure
are controlled in regression 3; thus, the results support Hypothesis 3.
B. Stock Market Performance: Tobin’s Q
As mentioned before, this study constructs a proxy for the Tobin’s
q, which is defined as (market value of equity + book value of debt) /
book value of assets, to examine market performance. The industry
adjusted Tobin’s q, calculated by subtracting the industry median of
the Tobin’s q from the raw Tobin’s q of the firm, is used as the
dependent variable in the regression analysis to control for
industry-related factors as well as annual fluctuations. The control
variables are firm size measured by the logarithm of sales and age of
the firm expressed in the number of years.
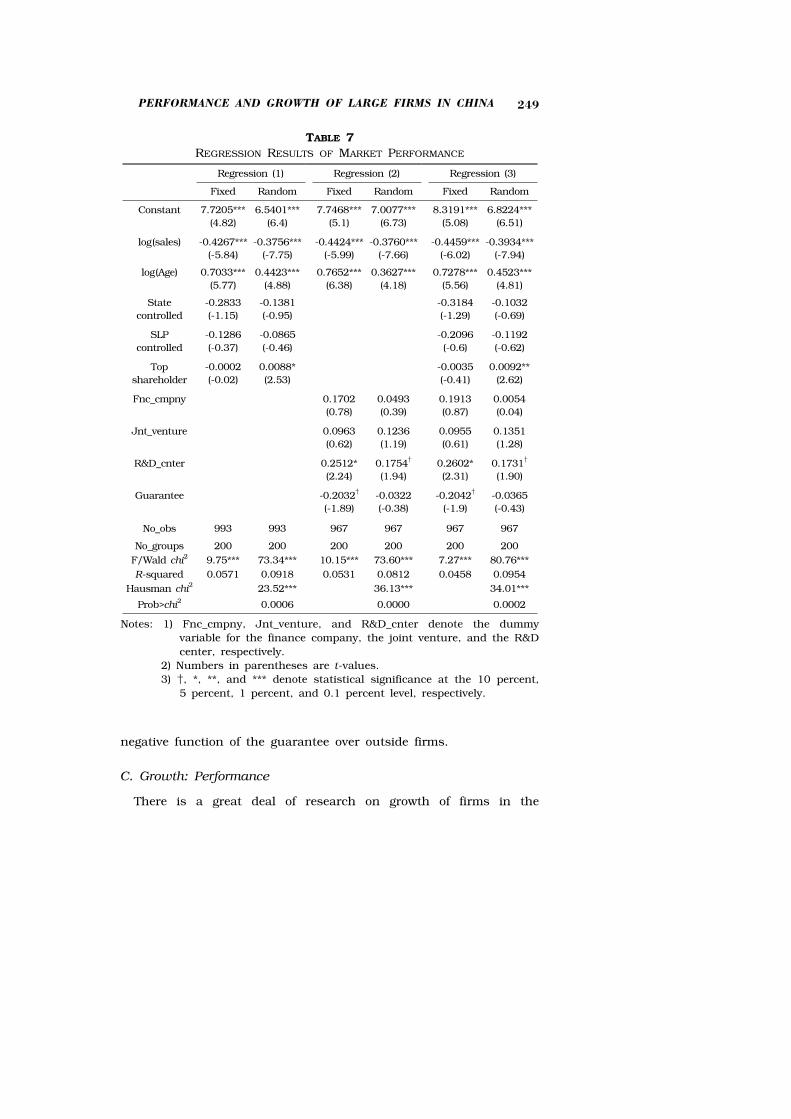
The regression is carried out on the 200 panel firms. Regression
results in Table 7 show that firm size, measured by log value of total
sales, is negatively correlated with market performance. Further,
market performance is a positive function of firm age. In contrast to
financial performance analysis, variables capturing ownership
structure have no significant effect on a firm’s performance.
Estimated coefficients of ownership concentration (captured by
variable “Top shareholders”) have significant values in random effects
in regression (1) and (3), but results of the Hausman test lead us to
reject the null hypothesis that the coefficients estimated by the
efficient random effects estimator are consistent at the 5% level.
The estimated coefficients of the finance company are positive, but
none of them are statistically significant. The joint venture has
positive coefficients, but statistically insignificant ones. The R&D
center is positively correlated with market performance in regression
(2)-(3), which support Hypothesis 3. Market performance is a
PERFORMANCE AND GROWTH OF LARGE FIRMS IN CHINA 249
TABLE 7
REGRESSION RESULTS OF MARKET PERFORMANCE
Regression (1) Regression (2) Regression (3)
Fixed Random Fixed Random Fixed Random
Constant 7.7205***
(4.82)
6.5401***
(6.4)
7.7468***
(5.1)
7.0077***
(6.73)
8.3191***
(5.08)
6.8224***
(6.51)
log(sales) -0.4267***
(-5.84)
-0.3756***
(-7.75)
-0.4424***
(-5.99)
-0.3760***
(-7.66)
-0.4459***
(-6.02)
-0.3934***
(-7.94)
log(Age) 0.7033***
(5.77)
0.4423***
(4.88)
0.7652***
(6.38)
0.3627***
(4.18)
0.7278***
(5.56)
0.4523***
(4.81)
State
controlled
-0.2833
(-1.15)
-0.1381
(-0.95)
-0.3184
(-1.29)
-0.1032
(-0.69)
SLP
controlled
-0.1286
(-0.37)
-0.0865
(-0.46)
-0.2096
(-0.6)
-0.1192
(-0.62)
Top
shareholder
-0.0002
(-0.02)
0.0088*
(2.53)
-0.0035
(-0.41)
0.0092**
(2.62)
Fnc_cmpny 0.1702
(0.78)
0.0493
(0.39)
0.1913
(0.87)
0.0054
(0.04)
Jnt_venture 0.0963
(0.62)
0.1236
(1.19)
0.0955
(0.61)
0.1351
(1.28)
R&D_cnter 0.2512*
(2.24)
0.1754†
(1.94)
0.2602*
(2.31)
0.1731†
(1.90)
Guarantee -0.2032†
(-1.89)
-0.0322
(-0.38)
-0.2042†
(-1.9)
-0.0365
(-0.43)
No_obs 993 993 967 967 967 967
No_groups 200 200 200 200 200 200
F/Wald chi2 9.75*** 73.34*** 10.15*** 73.60*** 7.27*** 80.76***
R-squared 0.0571 0.0918 0.0531 0.0812 0.0458 0.0954
Hausman chi2
23.52*** 36.13*** 34.01***
Prob>chi2 0.0006 0.0000 0.0002
Notes: 1) Fnc_cmpny, Jnt_venture, and R&D_cnter denote the dummy
variable for the finance company, the joint venture, and the R&D
center, respectively.
2) Numbers in parentheses are t-values.
3) †, *, **, and *** denote statistical significance at the 10 percent,
5 percent, 1 percent, and 0.1 percent level, respectively.
negative function of the guarantee over outside firms.
C. Growth: Performance
There is a great deal of research on growth of firms in the

SEOUL JOURNAL OF ECONOMICS250
advanced economies. Gibrat (1931) argues that firm growth is
independent of firm size. Mansfield (1962) reports that the firm size
is negatively correlated with the firm growth and raises the
possibility of departure from Gibrat’s law. Jovanovic (1982) argues
that the firms uncover their true efficiencies over time through
learning in his theory and suggests an inverse-relationship between
the firm age and growth.
In classical works on firm growth in advanced economies, Evans
(1987a, 1987b) found that the firm age and size are important
determinants of firm growth because firm growth decreases with firm
age and size. He also found that the relationship between firm
growth and firm size is highly nonlinear; thus, the growth-size
relationship varies over the size distribution of firms. These papers
deal with the classical question of the relationship between the size,
age, and growth of the firm.
For developing countries, Shanmugam and Bhaduri (2002)
examined the effects of firm size and age on firm growth using the
data of Indian firms, following tradition. Tybout (2000) performed an
important survey on firms in developing countries, focusing on the
impact of regulatory and protection regimes on technical efficiency
and turnover. Sleuwaegen and Goedhuys (2002) examined firm
growth related to certain other factors, such as access to capital
market, resources, infrastructure and financial services. Lee and
Temesgen (2005) explored the effects of various resources at different
levels, such as physical capital, human capital, managerial capital,
and R&D capital, on firm growth using data from 8 developing
countries.
According to Evans (1987a), firm growth is given the following
function:
St+1=[G (At, St)]d (St) et (1)
where St denotes size at time t,
At denotes age at time t,
d stands for time difference=t’-t et is a log normally distributed error term with possibly a
non-constant variance.
From Equation (1), we get the following regression framework.

PERFORMANCE AND GROWTH OF LARGE FIRMS IN CHINA 251
(ln St’-ln St)/d=ln G (At, St)+ut (2)
where St stands for size at time t,
ut is normally distributed with mean zero and possibly a
non-zero constant variance and is independent of size and
age.
Taking a second order logarithmic expansion of ln G (A, S) yields
ln G=b0+b1 ln S+b2 ln A+b3 (ln S)2+b4 (ln A)2+b5 (ln S)(ln A)+u (3)
Equation (2) can be modified as follows:
(ln St’-ln St)/d=ln G (At, St)+BXt+ut (4)
where, BXt is the vector of firm specific characteristics that affect
firm growth including dummies for the finance company, joint
venture, and research center.
From Equations (3) and (4), the following equation for the
regression analysis used in this study can be obtained:
(lnSt’-lnSt)/d=a0+a1lnSt+a2lnAt+a3(lnSt)2+a4(lnAt)
2+a5(lnSt)(lnAt)
+BXt+ut
The dependent variable, (lnSt’-lnSt)/d, denotes average growth rate
of sales of a firm for the period. The sample used in this study
spans a period of five years, 1998 to 2003. Data used in this
regression are analogous to those in the previous sections. Age is
calculated by deducting the birth date of a firm expressed in year
terms from the time when our analysis period started.
This study employs industry-adjusted measures to eliminate
industry-related effects from the observed actual values. The industry
medians of average growth rates for the period are calculated among
the firms that operate in each industry. The industry adjusted value
is calculated by deducting the industry median from the actual
value.
Explanatory variables are defined as follows. If the median value of
the lagged dummy value of the finance company during the 5-year
period is one, one is assigned and zero, otherwise. Example, if a firm
SEOUL JOURNAL OF ECONOMICS252
TABLE 8
REGRESSION RESULTS OF FIRM GROWTH
(1) (2) (3) (4) (5) (6)
Constant -5.6724
(-0.6)
-5.7282
(-0.6)
-3.6394
(-0.38)
-6.0347
(-0.65)
-6.2970
(-0.65)
-5.0791
(-0.51)
log(Sales) 0.4239
(0.48)
0.4251
(0.48)
0.2179
(0.24)
0.4487
(0.51)
0.4782
(0.53)
0.3386
(0.37)
log(Age) 1.2845*
(2.2)
1.3107*
(2.2)
1.5224*
(2.56)
1.4394*
(2.46)
1.3797*
(2.34)
1.7544**
(2.84)
log(Sales)*
log(Age)
-0.0669*
(-2.37)
-0.0679*
(-2.35)
-0.0791**
(-2.73)
-0.0749**
(-2.64)
-0.0714*
(-2.49)
-0.0901**
(-2.98)
(log(Sales))2 -0.0068
(-0.33)
-0.0068
-0.32
-0.0016
(-0.08)
-0.0072
-0.35
-0.0079
(-0.38)
-0.0040
(-0.19)
(log(Age))2
0.0355*
(2.18)
0.0339*
(2.03)
0.0395*
(2.35)
0.0385*
(2.34)
0.0354*
(2.16)
0.0398*
(2.37)
Fnc_cmpny5 -0.0274
(-0.79)
-0.0272
(-0.8)
Jnt_venture5 0.0645*
(2.31)
0.0536†
(1.92)
R&D_cnter5 0.0539*
(2.06)
0.0470†
(1.83)
Guarantee5 -0.0245
(-1.02)
-0.0286
(-1.18)
Number of
observations200 200 200 200 200 200
F-statistic 3.24** 2.82** 3.64*** 3.28*** 2.88** 2.92***
Prob>F 0.0011 0.0027 0.0002 0.0006 0.0023 0.0007
R-squared 0.091 0.0947 0.1198 0.1108 0.0955 0.1413
Root MSE 0.15769 0.15778 0.15557 0.15637 0.1577 0.15489
Notes: 1) Fnc_cmpny5, Jnt_venture 5, R&D_cnter5, and Guarantee5 denote
the median value of the lagged dummy value of the finance
company during the 5-year period, the median value of the lagged
dummy value of the joint venture during the same period, the
median value of the lagged dummy value of the R&D center
during the same period, and the median value of the dummy
value of guarantees during the same period, respectively.
2) White's heteroscedasticy-consistent t-statistics are reported in
parentheses.
3) †, *, **, and *** denote statistical significance at the 10 percent, 5
percent, 1 percent, and 0.1 percent level, respectively.
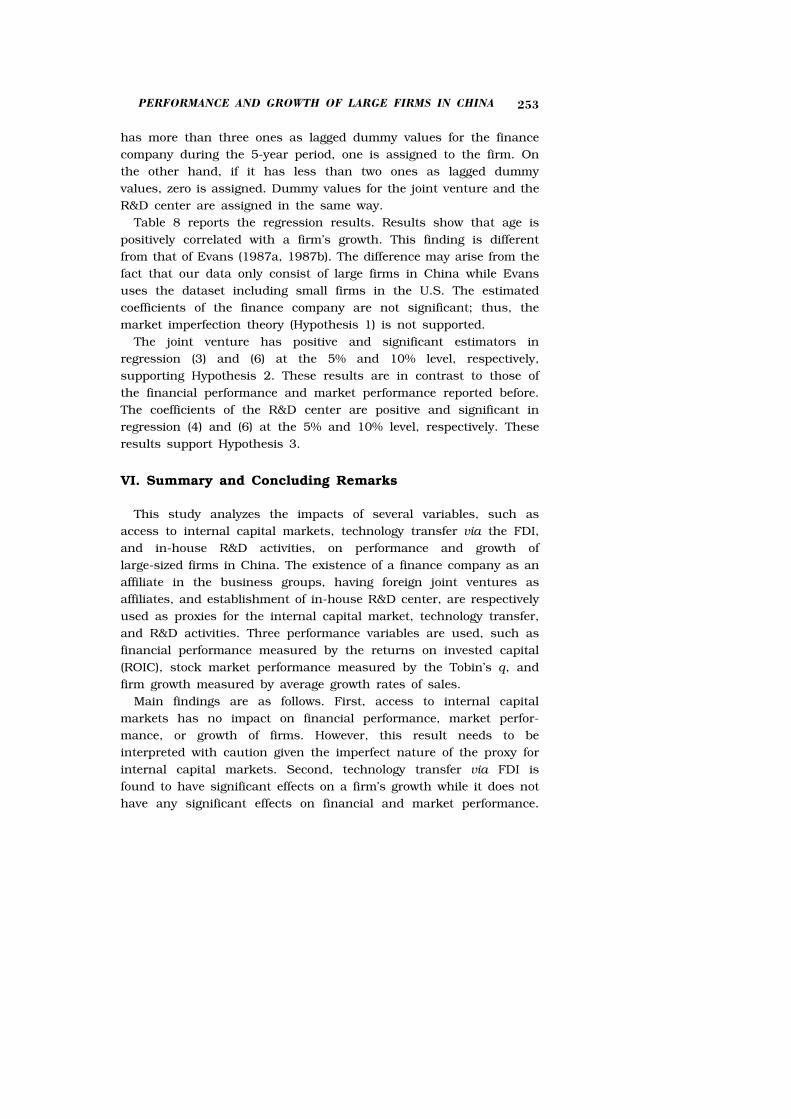
PERFORMANCE AND GROWTH OF LARGE FIRMS IN CHINA 253
has more than three ones as lagged dummy values for the finance
company during the 5-year period, one is assigned to the firm. On
the other hand, if it has less than two ones as lagged dummy
values, zero is assigned. Dummy values for the joint venture and the
R&D center are assigned in the same way.
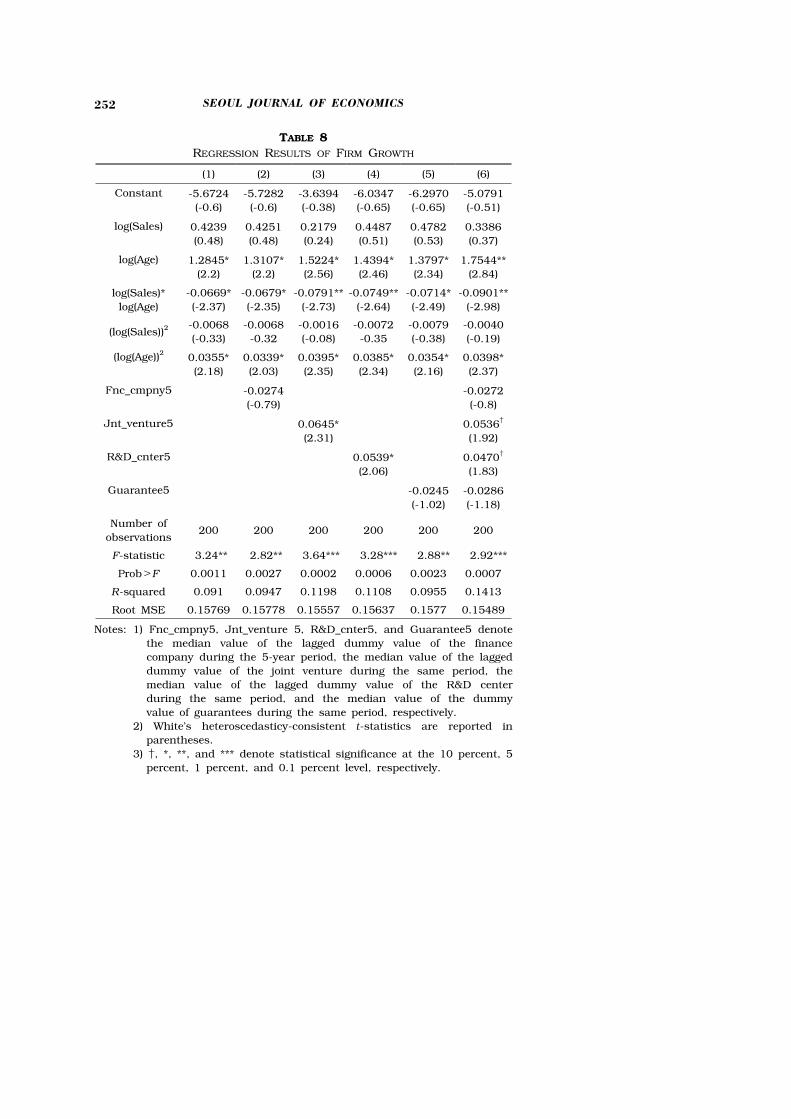
Table 8 reports the regression results. Results show that age is
positively correlated with a firm’s growth. This finding is different
from that of Evans (1987a, 1987b). The difference may arise from the
fact that our data only consist of large firms in China while Evans
uses the dataset including small firms in the U.S. The estimated
coefficients of the finance company are not significant; thus, the
market imperfection theory (Hypothesis 1) is not supported.
The joint venture has positive and significant estimators in
regression (3) and (6) at the 5% and 10% level, respectively,
supporting Hypothesis 2. These results are in contrast to those of
the financial performance and market performance reported before.
The coefficients of the R&D center are positive and significant in
regression (4) and (6) at the 5% and 10% level, respectively. These
results support Hypothesis 3.
VI. Summary and Concluding Remarks
This study analyzes the impacts of several variables, such as
access to internal capital markets, technology transfer via the FDI,
and in-house R&D activities, on performance and growth of
large-sized firms in China. The existence of a finance company as an
affiliate in the business groups, having foreign joint ventures as
affiliates, and establishment of in-house R&D center, are respectively
used as proxies for the internal capital market, technology transfer,
and R&D activities. Three performance variables are used, such as
financial performance measured by the returns on invested capital
(ROIC), stock market performance measured by the Tobin’s q, and
firm growth measured by average growth rates of sales.
Main findings are as follows. First, access to internal capital
markets has no impact on financial performance, market perfor-
mance, or growth of firms. However, this result needs to be
interpreted with caution given the imperfect nature of the proxy for
internal capital markets. Second, technology transfer via FDI is
found to have significant effects on a firm’s growth while it does not
have any significant effects on financial and market performance.

SEOUL JOURNAL OF ECONOMICS254
Third, in-house R&D activities are found to have significant impacts
on financial performance and market performance as well as on
growth of firms.
These results imply that in-house R&D activities have strongest
impacts on performance and growth of large firms in China,
compared to technology transfer via the FDI or access to internal
capital markets. This result is consistent with the recent policy
re-direction or initiatives by the Chinese government putting more
emphasis on indigenous firms and their innovation capabilities, as
compared to the past emphasis on FDI. Furthermore, foreign firms in
China also started to increase and deepen their R&D activities in the
country in order to consolidate securely their presence in the
Chinese market (Gaulier et al. 2005). This study is limited only the
on largest firms, which are analyzed here, and therefore, further
studies with larger data on other types of firms are still needed.
(Received 16 October 2007; Revised 24 February 2008)
References
Andreosso-O’callaghan, Bernadette, and Qian, Wei. “Technology
Transfer: A Mode of Collaboration between the European
Union and China.” Europe-Asia Studies 51 (No. 1 1999):
123-42.
Barney, Jay B. “Firm Resources and Sustained Competitive
Advantage.” Journal of Management 17 (No. 1 1991): 99-120.
Chang, Sea Jin. Financial Crisis and Transformation of Korean
Business Groups. Cambridge, UK; New York: Cambridge
University Press, 2003.
Chang, Sea Jin, and Choi, Unghwan. “Strategy, Structure and
Performance of Korean Business Groups: A Transactions Cost
Approach.” The Journal of Industrial Economics 37 (No. 2
1988): 141-58.
Chang, Sea Jin, and Hong, Jeabom. “Economic Performance of
Group-Affiliated Companies in Korea: Intragroup Resource
Sharing and Internal Business Transactions.” Academy of
Management Journal 43 (No. 3 2000): 429-88.
China Securities Regulatory Commission. Listed Companies Classifi-
cation and Code. http://www.csrc.gov.cn/n575458/index.html,
2005.
PERFORMANCE AND GROWTH OF LARGE FIRMS IN CHINA 255
Choo, Kineung, Lee, Keun, Ryu, Keunkwan, and Yoon, Jung Mo.
Changing Performance of the Business Groups over Two
Decades: Investment Inefficiency and Technological Capabilities.
Economic Development and Cultural Change, 2009 (Forthcoming).
de Bruijin, Erik J., and Jia, Xianfeng. “Transferring Technology to
China by Means of Joint Ventures.” Research Technology
Management 36 (No. 1 1993): 17-22.
Evans, D. S. “Test of Alternative Theories of Firm Growth.” Journal
of Political Economy 95 (No. 4 1987a): 657-74.
. “The Relationship between Firm Growth, Size, and Age:
Estimates for 100 Manufacturing Industries.” The Journal of
Industrial Economics 35 (No. 4 1987b): 567-81.
Froot, Knneth, Scharfstein, David, and Stein, Jeremy. “A
Framework for Risk Management.” Harvard Business Review
72 (No. 6 1994): 91-103.
Gaulier, Guillaume, Lemoine, Francoise, and Unal-Kesenci, Deniz.
China’s Integration in East Asia: Production Sharing, FDI
and High-Tech Trade. CEPII Working Paper, 2005.
Gibrat, R. Les Inegalites Economiques. Paris: Librairie du Recueil
Sirey, 1931.
Goto, Akira. “Business Groups in Market Economy.” European
Economic Review 19 (No. 1 1982): 53-70.
Greene, William H. Econometric Analysis. Prentice-Hall, Inc., 2002.
Guillen, Mauro F. “Business Groups in Emerging Economies: A
Resource-Based View.” Academy of Management Journal 43
(No. 3 2000): 362-80.
Hu, Albert G. Z., Jefferson, Gary H., and Qian, Jinchang. R&D and
Technology Transfer: Firm-Level Evidence from Chinese
Industry. Working Paper, 2003.
Jingjicankaobao. China, 2004. 5. 21.
Jin, Furong, Lee, Keun, and Kim, Yee-kyoung. “Changing Engines
of Growth in China.” China and the World Economy. 2008
Forthcoming.
Jovanovic, Boyan. “Selection and the Evolution of Industry.”
Econometrica 50 (No. 3 1982): 649-70.
Keister, Lisa A. “Engineering Growth: Business Group Structure
and Firm Performance in China’s Transition Economy.”
American Journal of Sociology 104 (No. 2 1998): 404-40.
. Chinese Business Groups: The Structure and Impact of
Interfirm Relations during Economic Development. New York:

SEOUL JOURNAL OF ECONOMICS256
Oxford University Press, 2000.
Khanna, Tarun “Business Groups and Social Welfare in Emerging
Markets: Existing Evidence and Unanswered Questions.”
European Economic Review 44 (Nos. 4-6 2000): 748-61.
Khanna, Tarun, and Palepu, Krishna. “Why Focused Strategies May
Be Wrong for Emerging Markets.” Harvard Business Review
75 (No. 4 1997): 41-51.
. “Is Group Affiliation Profitable in Emerging Markets? An
Analysis of Diversified Indian Business Group.” The Journal of
Finance 55 (No. 2 2000a): 867-91.
. “The Future of Business Groups in Emerging Markets:
Long-Run Evidence from Chile.” The Academy of Management
Journal 43 (No. 3 2000b): 268-85.
Khanna, Tarun, and Rivkin, Jan W. “Estimating the Performance
Effects of Groups in Emerging Markets.” Strategic Management
Journal 22 (No. 1 2001): 45-74.
Kong, Xinxin. Corporate R&D in China: The Role of Research
Institutes. Working Paper. 2003.
Lee, Keun, and Temesgen, Tilahun. Determinants of Firms Growth
in Developing Countries: An Extension of the Resource-Based
Theory of Firm Growth. Presented at the WIDER Jubilee
Conference on the Future of Development Economics, 2005.
Leff, Nathaniel H. “Industrial Organization and Entrepreneurship in
the Developing Countries: The Economic Group.” Economic
Development and Cultural Change 26 (No. 4 1978): 661-75.
Lundin, Nannan, and Serger, Sylvia Schwaag. Globalization of R&D
and China? Empirical Observations and Policy Implications.
IFN Working Paper. Research Institute of Industrial Economics,
2007.
Mansfield, Edwin. “Entry, Gibrat’s Law, Innovation, and the Growth
of Firms.” American Economic Review 52 (No. 5 1962):
1023-51.
. “International Technology Transfer: Forms, Resource
Requirements and Policies.” American Economic Review 65 (No.
2 1975): 372-6.
Motohashi, Kazuyuki. R&D of Multinationals in China: Structure,
Motivations and Regional Difference. REITI Discussion Paper
Series. 2006.
Myers, Stuart. “Determinants of Corporate Borrowing.” Journal of
Financial Economics 5 (No. 2 1977): 147-75.

PERFORMANCE AND GROWTH OF LARGE FIRMS IN CHINA 257
Myers, Stuart, and Majluf, Nicholas. “Corporate Financing and
Investment Decisions When Firms Have Information That
Investors Do Not Have.” Journal of Financial Economics 13
(No. 2 1984): 187-221.
National Bureau of Statistics (NBS). China Statistical Yearbook on
Science and Technology. Beijing: China Statistical Press,
2001.
. China Statistical Yearbook on Science and Technology.
Beijing: China Statistical Press, 2004.
. China Statistical Yearbook on Science and Technology.
Beijing: China Statistical Press, 2006.
Qingdaohai’eryouxiangongsi. Annual Report in 2003, 2003.
Seo, Bong Kyo. The Time Trend in the Performance of Business
Groups in Emerging Economies: The Case of Business
Groups in China. Doctoral dissertation. 2006.
Shanmugam, K. R., and Bhaduri, Saumitra. “Size, Age, and Firm
Growth in the Indian Manufacturing Sector.” Applied
Economics Letters 9 (No. 9 2002): 607-13.
Shin, J. S. The Economics of the Latecomers: Catching-Up,
Technology Transfer and Institutions in Germany, Japan and
South Korea. London: Routeldge, 1996.
Sleuwaegen, L., and Goedhuys, M. “Growth of Firms in Developing
Countries, Evidence from Cote d’Ivoire’.” Journal of
Development Economics 68 (No. 1 2002): 117-35.
Tybout, James R. “Manufacturing Firms in Developing Countries:
How Well Do They Do, and Why?” Journal of Economic
Literature 38 (No. 1 2000): 11-44.
Wang, Xiaozu, Xu, Lixin Colin, and Zhu, Tian. “State-Owned
Enterprises Going Public ― The Case of China.” Economics of
Transition 12 (No. 3 2004): 467-87.
Xu, Xiaonia, and Wang, Yan. “Ownership Structure and Corporate
Governance in Chinese Stock Companies.” Chinese Economic
Review 10 (No. 1 1999): 75-98.

SEOUL JOURNAL OF ECONOMICS258
Comments and Discussion
Comments by Shiyong Zhao*9
This is a very standard economic research. First, the author
derives five hypotheses based on three economic theories, namely,
market imperfection theory, agency theory, and resource-based view.
By the way, the author did a very good literature review on the three
theories. Interestingly, hypotheses derived from these theories are
conflicting. And then the author uses the panel data of the Chinese
large-sized public firms to test (either to confirm or refute) the
hypotheses.
This paper identifies capital and technology as two most important
factors affecting the growth and performance of firms. With regard to
capital, we know capital sources of firms are various, but the author
only considers the internal capital market with finance company as
the proxy. I think it is not enough that is probably why the
regression results do not support the conflicting hypotheses of 1 and
1’. The author gives an excellent description about the role of finance
companies. There is no problem that the author uses finance
company as the proxy for internal capital market of large firms. But
the role of finance company substitutes part of the commercial
banks, so it is very hard for business groups to get approval for
establishing a finance company. So I guess there are two few firms
that have finance companies. The other two constructions, joint
venture and R&D investment as proxies for technology transfer and
technology accumulation, make good sense and thus are convincing,
in my opinion.
The paper finds that “joint ventures have significant effects on firm
growth. It is partially because joint ventures are related to foreign
markets as well as technology transfer.” This result is consistent
*Associate Research Fellow, Institute of Economics, Chinese Academy of
Social Sciences, 2 Yuetan Beixiaojie, Xicheng District, Beijing 100836,
People's Republic of China, (Tel) +8610-6803-4420, (E-mail) zhaoshiyong@
yahoo.com.cn
PERFORMANCE AND GROWTH OF LARGE FIRMS IN CHINA 259
with the reality, according to my knowledge, because Chinese
exporting products are mainly produced by foreign-invested
enterprises (FIEs), including joint ventures. Moreover, the paper also
finds that “the research center or R&D investment has significant
effects on not only performance but also growth of firms in China.”
This implies that China has caught up with advanced technologies in
many industries. Otherwise, the role of R&D should not be so
significant. These are important findings.
Another critic is that, according to the content of the paper, the
focus is on the determinants that might affect the growth and
performance of Chinese largest firms. So the title performance and
growth of the largest firms in China is a little bit too general and
vague.
Another limitation of the paper is that it is not very convincing
just to use 200 public companies listed on the stock market to
represent the population of Chinese largest firms. Moreover, most of
the firms in the sample are state-owned enterprises (SOEs). So the
findings of the research cannot be extended to all large firms in
China, since private firms are playing a more and more important
role in the Chinese economy. But private firms hesitate to list on the
stock market because of the stringent requirements such as
information disclosure, financial standardization, etc.