Embed Size (px)
Citation preview


PS'-msy tmpy.m - .
WP
X,. .fe?w S7-W-
vi
y.%
' * • ' - ' - ^
l
' • ' . ' - • = • • - > ( &
• « : ••'•' ."-; .•vA ly* t?
A l mm
< • *
A'/l
Tom
\JWr
4i mm
en,Aft s?6e.riA>6- <S?AA e& M>Z<U
• * * . 0/Ztj/Wi IAT'OAJ »l^tn^ i Uu u j
<nlw )*V ft) *M *rf ^.V ^
3i$x&e<i
Cocc'w-s...
"Tt-f-J l *
'•&< CAGJZA^AT- - -
J V V .... /4V\\1<L.\\ . . .
C n.t\lwicW.
WcrAV:,, ;._ ; .
CstXl-0 5 .
«•!*-. t»-iA.i
ft UC\l*i
A
i£\ _S/v/<)O*A/A/ ev_ mm
AmM^
... ^ 0 * 0 .
«•!*-. t»-
—^fyy^S^i^xiXiA^ -. $ TArt40/*ltAL}(f4foo*T3*l)
. E?A/oSW~ _ . , 3 T A . •_ 0 A X b a?) ^. ...x fleco ..oic^t $4 A. .WJ!. ^
£ # 9 / ^ * ^ 3 y > " ^t MPtf/^&U~AAAl--20Zyz. ¥7S-r 7VA5
7*3-£&-?£*/
Zi<S»-Sfi>l-6*l,'l
v7)
AXCw • 4*^w<*&iot£e
Al
6" / / J ^ _ _ a (^^J) 3$£- 7??7
,^1 . APA - 7 f y
crxi =i JJ* 2 • C D £= O "' O I
5- 5 L g: ^ rJ •
•a rt g c o O | I* o rt 2. — I S-g:" ? z+\
m aPzpto I g-TO toZ*'
i°rt3| 3CD r3t*5=f* 3— • 1-
o o J*
•m^MmiMum,

yl
j K&
' V ' W ••
IK ' « " V *
f * J ' Se ,,
m?{m^y>>m' W^^ ,X {f iw, » --• i / 7 ,? ' V i - a
8-***
L
API Comments on Pre l iminary Draft Report t o Congress
O i l , Gas and Geothermal Wastes
General Comments & Quest ions
Chapter I Chapter I I Chapter I I I
Chapter IV
Chapter V Chapter VI Chapter VII
Introduction Description of Industry Current and Alternative Waste
Management Practices Damages Caused by Oil & Gas
Operations Risk Assessment Costs and Impacts Current Regulatory Programs
H. W. Yates
H. W. Yates
B. D. Freeman
B. D. Freeman
H. W. Yates N. K. Springer J. H. Robins M. T. Heffner
i, CO § CD
CD
erxx a t—o tpzj o
S g » O «< P to m |
^> _. C D -b I *to P ,+ 1
°O Zi 3 at a £ " 3 rt ZT —- _ CD =r j ;* 3 | =L • to I
e O- CD

p~
GENERAL COMMENTS & QUESTIONS
API would welcome the opportunity to answer questions on its recently completed study or discuss its content in any forum of EPA's choice.
to Z2
How much additional material (risk, economics, damages) will be included in the Draft Report? When will it be available?
Has EPA management responsible for administration of injection wells (Safe Drinking Water Act/UIC) and Clean Water Act (NPDES) discharges been involved in assessing the adequacy of their programs? Does EPA believe these programs are covered by RCRA? API's understanding of the legal framework is attached.
Will the proposed TCLP test be used in the Draft Report in view of its problems and reevaluation (May 18, 1987 Federal Register)? When will the decision be made?
% P.yi -i .*• f * y$
.w,*>w m. !x^' i S . - . A (M, * | A<
Is there any opportunity for API to comment on the Draft Report to Congress prior to the planned February-March, 1988, public meetings? Will EPA accept API written comment on the Draft Report?
How will EPA use the analyses of waste contained invconstitu^ ents and comparisons to hazardous waste regulatory limits in the Draft Report? How do they compare to API analyses exchanged with EPA?
Will Chapter 7 information on State and Federal Regulations
information be incorporated into discussions of industry
practices, damage cases and health and environmental impacts?

i • i» .* * * • • Mjii.m..
r
1
V\ , ,
j¥m i ASM
mm;r - w I Ft . . I ' I A ,. 5 J
npi -,*
I
l
!-.<•> .18?*
API continues to disagree with EPA that waters used in additional recovery projects are wastes under RCRA. API believes they are a necessary part of the oil recovery process and are therefore excluded from the definition of solid waste. Will EPA provide any separation of impacts for additional recovery waters in its analysis?
API disagrees with the Draft Report "PFS" concept and
believes the exemption is improperly redefined in the report.
Has EPA provided prior guidance supporting this concept and
are EPA regions using this interpretation?
What use will the Draft Report make of damage cases from non-waste issues such as oil spills, Clean Water Act discharges, etc?
Is there additional documentation regarding damage cases and information contained in API and state comments that would be useful to EPA?
How will enforcement issues be addressed in determining the need for additional regulations?
How will the LLM model and input parameters be qualified or
validated to ensure its results are matched with actual field
observation and damage cases? Will the qualitative assess^
ment of risk to environmental resources be verified against
field observations and damage cases?
Will LLM input parameters reflect API Column test data and
other scientific studies on reduced mobility and attenuation
found in reserve pits?
Have the methodology and input parameters for modeling
releases from injection wells been revised from the Interim
Report based on API comments?
eCC DDr
5— -• PO J
C O "5* ° £ C D
CC DD IZ CX "' O C—D =r25 CO O
| ""* _. to - *
• CD
tO 2 - rt- C D
to z£
= ° rt = •• 3 rt zr ~ to zr w7^ a a co to rt ta

IIjm I * i »
z *
\x
A
i* 'J r \ is
if A
r f J '?
fe
'f
'I
IK-^
How will the significance of the qualitative determination of risk to natural resources be assessed, and what methodology will be used to determine the acceptability of these estimated risks?
Why does the Draft Report contain non-hazardous waste management scenarios in the economic impact section? Why does the economic impact analysis assume for its non-hazardous cases that Clean Water Act discharges (not regulated by RCRA) will not be allowed?
What costs are included for industry's 168,000 injection wells? Does the cost model recognize that regulation of these wells as hazardous waste wells would require redrilling or modifying non Class I producing and injection wells within "areas of review"?
How will the economic analysis relate the 21 well models to
industry's 842,000 producing and 168,000 injection wells?
erxx a co cz o 5'fiL zi
ta• = * ozs>: rtt>*
co cz o - o _m "rj to o
o J * * .* O _. | ^ — to rt I rt c o ^ rt" zr ~ zr m <° § * r t CD I
3 ztor w„ f3o
ta CD

j ~ ~
'KKV
!ti€«
wmm
Legal Framework for EPA study of Oil and
Gas Waste under Section 8002fm) of RCRA
Section 3001(a) (2) (A) exempts drilling fluids, produced waters and other oil and gas associated wastes from regulation as hazardous waste under Subtitle C of RCRA until the Section 8002(m) study is completed, EPA determines such regulation is necessary and any proposed regulations are approved by Act of Congress.
even if EPA determines that the overall exemption should be removed, it is only authorized under Subtitle C RCRA to regulate "hazardous Wastes." Consequently, only those oil and gas materials which are hazardous wastes can be regulated under Subtitle C
under Section 1004(5) of RCRA a "hazardous waste" waste must be a "solid waste"
Section 1004(27) defines "solid waste" to mean only garbage, refuse, sludge or "other discarded material"
produced water used for enhanced oil recovery operations is an integral part of the production process - it is not "discarded" and therefore it is not a "solid waste" subject to RCRA regulation
This position was upheld by the United States Court of Appeals for the D. C. Circuit the week of July 27, 1987 in American Mining Congress v. EPA which invalidated EPA's attempt to regulate secondary materials reused with an industry's ongoing production process as a hazardous waste under subtitle c. The court held that since such secondary materials resulting from primary processing were not "discharged" they were not "solid
CO vr.a 3 (D cr o
S g g S «< i ° CO
2- o «• — —i i ° m PS-" 2 . _. <» co P>
CD a. c CD
c + CD
co =r s 3 I 3 co w p> I *•** tta •
CD •

r »•»• f ' • " " " U -
r
f •>
jjl
{J
lf( J -
Jir-t1
* •*]
A c**
1 *! i, -i -'.w
W '
.Or-:, ' < v
if?' ^ A a
* « > - < •
waste" and therefore not covered by RCRA. This case is directly on point with respect to produced water for enhanced oil recovery.
Since produced water used for enhanced oil recovery is not subject to regulation as a "solid waste" under RCRA, it should be excluded from the Section 8000(m) study
Section 1003 of RCRA provides that its objective is to protect human health and environment from activities involving solid waste activities - it does not cover the regulation of activities not involving not-solid wastes practices or issues including the production of crude oil or the handling of products etc. covered by such other statutes such as OSHA
Section 1006 or RCRA and 40 CPR Section 261.4(a) (2) exempt discharges subject to the NPDES program under the Clean Water Act from regulation as a solid waste under RCRA. Conse^ quently, such discharges should not be included in the Section 8002(m) study.
immm
r
• • • * * • - ,
> /'
Chapter I-Introduction
API feels redefining the scope of the exemption at this time
is unwarranted. Any modifications of the exemption such as
the proposed narrowing (PFS concept) would constitute a
regulatory determination with immediate implications for
industry. See Chapter II comments for further discussion.
The description of damage cases should recognize a number of
cases are based on pending court cases where facts have yet
to be established. And, in other cases, the scientific
evidence used was provided by private citizens or attorneys
alleging damage and seeking compensation.
It is noted that 249 damage cases were referenced versus the
228 that were included in the Interim Report. If these
additional cases are used for background or risk assessment
information, API would appreciate the opportunity to review
and comment upon the additional cases.
API agrees with the logic that the damage cases because they
are almost all violations of current state and federal
regulations cannot be used to demonstrate adequacy of state
of federal enforcement efforts. Such an investigation would
require significant additional effort to gather necessary
data. However, it is felt that when the cases are grouped
into "damage" categories that they are useful in
demonstrating the extent of the current regulatory framework
present for oil and gas wastes. See comments on Chapter IV.
As described, the risk assessment modeling section is
intended to be a screening procedure to indicate potential
CD ocor xciz ao
—* to rt —
- * • < - co
5 ^ _ to LtrOtSg*P rt.- C D
| S - = 3 |
a32 •z+r w
z„ t=3o
• \
CD rt ta i

r
i m y pS:XY.pyMjl
IWAZiiiSppAim^M 5 Ipiy P XP-S-ZPyZiiZi mx-ypxyZiM | fW^-V'AW«
§mmfi XV AXAX;X TipiXX Yp! Is- ' ;A* m•M'm ;A!;*»*S
^fXAAXAX
•ImmmismM iftiyiHpisyyXyiM
0>mmsmm mzzsmymm iwmxmsAm
IfiW';
concerns with management of E&P wastes. If the screening
model results indicate potential problem areas, what are
EPA's plans to more rigorously determine the actual levels
of risk to human health and the environment?
API comments on Chapter V on risk assessment address our concerns that any risks predicted must be correlated or validated against real world occurrences. Also, as presented in API's comments on the Interim Report, API has concerns with the model used and quality of selected input data.
While useful information may be gathered in the approach proposed for the "Review of State Programs" Chapter, it should be recognized that state and federal programs have evolved based upon reacting to problems versus looking for inconsistencies and gaps in coverage between regulatory bodies. Also, because the purpose of this study as mandated by Congress is to determine if additional regulations are warranted, it would be useful to review the findings of this chapter against the damage cases.
The "alternative" nonhazardous waste economic case described as "uniform nationwide use of the most up-to-date and effective controls now being applied by any of the states" in effect applies the lowest common denominator approach to regulation and does not account for wide variations in geographical and environmental situations. It would require many unnecessary expenditures that would not result in incremental environmental protection.
erxx a zz' -z. to tz o m Q a S L £ ^ =1 •=> rt S » o 1 ! "^ — tort\ 2. rt 5 " to^
to g - rt C D
3 rt ZT—-. to ZT wZZ' 3 a CD so \ rt CO I
CD I
ttiimnt-MiiM

r
J A
W " .'• Y \ * P
"-c^w <\uj
CHAPTER II - "DESCRIPTION OF INDUSTRY"
A summary of API comments on this Chapter follows:
EPA's Chapter II reflects a fairly accurate assessment of industry operations.
The API data base has been reviewed by academia (Dr. Gordon Otto, University of Houston) and provides reasonably accurate volumetric estimates.
EPA has introduced the PFS concept which severely limits the extent of the Congressional exemption. API believes redefining the exemption at this time is unwarranted. This issue deserves further review and consideration by the agency.
The report makes some incorrect statements in this chapter about exploration and production activities. The following corrections should be made:
Natural gas is not used as a gaseous drilling fluid. API's previous comments addressed the dangerous nature of such an operation.
Oil-based drilling fluids account for not more than 5%
(1986 API Survey) of the total volume of drilling fluids
nationwide.
Crude oil treated with chemicals or skimmed from surface
impoundments are recycled, not discarded, similarly,
oil stained soil and gravel are properly disposed of,
not discarded.
The disposal of the various wastes cited on page 7
(conclusions) are appropriately regulated by states.
erxt a ms - z l co c o o 5' E. Z+ zr -3 <° rt S co O
3 3 , rt 2. _. CD -*•»
% <-rt- C O
zr CD CX
CZ
S* to to zl © fz —
CD rr ZZ. -5 zr w^ 3 CD to
ta
o
o ro

r
mmyzmm Ypyyy-:y::Zy» WYpyyy
ySZZy 'AsiimXmmAi
\mmziZ0 ^^•j'V'.*
iwimyysksyisAZmMs™m $AZY iX'Zpyp 'iZi Si5
A description of industry wastes comparing API and EPA field sampling and analysis results should be included discussing the constituents of concern present in the waste and the concentrations at which they occur.
The report makes the determination that "all produced water is solid waste, regardless of its end use or disposal method." The act defines solid waste as that which is discarded.
Nearly 70% of all produced or makeup waters utilized in EOR projects is returned to an oil bearing formation and consequently stays in a recycling mode. This produced water is not discarded.
Another 5% of all produced water is designated as "beneficial use" as (as defined under the Clean Water Act) and is used for watering stock and vegetation and is, therefore, not discarded. This is particularly relevant to the Rock Mountain states.
In the context of commingling waste streams in the field, EPA's UIC regulations address the integral nature of gas plant (process) waste waters and other waste streams such as steam generator scrubber water. These streams are allowed to be commingled prior to injection under the Class II UIC program providing they are not classified as hazardous at the time of injection.
The report attempts to define the scope of the current exemption under § 3001(a) (2) (A) in Chapter II.B.2 "Defini^ tion of Exempted Wastes". The attempted definition is clearly erroneous and fails to follow the statutory language or the legislature history of the exemption. Attached are detailed comments on the proposed scope of the exemption.
to ID Cx O t~o O l =* PJ rt — ^ |
«_o,*<rtgP ttoo mo IP CD O.
r r
co ex o
CD
rt
CO
CL c
. CD
rt O
CD
S rt-rt to
to ZP.
rt3
to =3; •
to ta CD
•iiiiiiiiiiiirimii'iiiiiiii'ir"'"""*

5 v-V-'-iyv'/yy"
fipSYyPP.y-' 'i. •'
tizzX
lll^AiiliiP I tYSpiipy: ••;;
i•}$ vpmpPxpiY'Pm, yv'^wts;,i*)y»A •ipy.**
mZZZZSSZxm y , A W A V V A A - ' I S f v . A 7-7'7.*V':7.rv, ,',7-io
^ < A ' '
; WxZZ ZPiZpy^y^ tWYY-. 4 YPY Xyy$0M
wiZiipS. ASSy ZiAA
IV"V.7 lifltfi
ibj-A
Comments to Draft of Draft RTC - Chapter II.B.2,
"Definition of Exempted Wastes"
In attempting to define the scope of wastes currently exempt under §3001(a)(2)(A), EPA erroneously relies on the f o l l o w i n g three "assumptions":
• that "drilling fluids and produced waters," as well as "other wastes" must be "intrinsically derived from primary field operations" to be covered by the exemption,
• that only wastes injected into the ground or extracted from the ground are covered by the exemption, and
• all produced water, regardless of whether i t is i n j e c t e d f o r disposal or enhanced recovery purposes, are wastes and therefore not covered b y the exemption.
None of those "assumptions" are supported by §3001(a)(2)(A) or its legislative history.1
The express language of §3001(a)(2)(A) on its face broadly defines the exemption to cover " d r i l l i n g fluids, produced waters, a n d other wastes associated with the exploration, development, or production of crude oil or natural gas." The legislative history is limited but i s best i l l u s t r a t e d b y the Conference Report submitted by the House of Representatives on the 1980 RCRA Amendments.« However, the Conference Report only attempts to define the scope of "other wastes" which it indicated had to be "intrinsically derived from primary field operations." The Conference Report noted that "intrinsically derived from primary field operations" was intended to distinguish exploration, development a n d production f r o m transportation a n d manufacturing.
In its "assumptions" E P A erroneously concluded that " d r i l l i n g fluids and produced waters" was also subject to the"intrinsically derived from primary f i e l d operations" qualification f o r " o t h e r wastes." This is not supported by the language of §3001(a)(2)(A) or the legislative history. EPA also erroneously concluded that the only wastes covered by the exemption are those extracted from the ground or injected into the ground - this conclusion again is
erxx a CD c o a' B L - -<•=•> s s
§
2 . 3• — ^ * _ . CD
rt C D CD CX CZ
ex- CD
3to rztr m„=' r 3-
a to (o rt ta
CD
1 The third assumption is not addressed specifically here but is subject to separate comments.
2 H . Conf. Rep. N o . 96-1444, 96th Congress, reprinted in 1980 U.S. Code Cong. + Adm. News 5019. A copy of the most relevant provisions are attached.
-muni

:
iszX
•'v'A'A%
pill iwA-WA
Xp-XA
iiifsr.
not supported by the language of the statute or the legislative history.
Compounding these erroneous conclusions, EPA attempts to limit the scope of the exemption to the "Primary Field Site" - a term not defined or discussed in the statute or the legislative history. The attempt is to artificially restrict the scope of the exemption to the narrowest production entity, i.e., operations upstream and including a tank battery. The Agency then concludes that any waste - including produced water -extracted outside of the Primary Field Site is not covered by the exemption.
One glaring conflict with the "Primary Field Site" concept is it restricts the exemption for produced waters to those separated or otherwise removed at or near the wellhead. It ignores the fact that a significant amount of water produced with gas may be removed at centralized dehydration facilities or gas plants which, because of economic, geographic or even environmental concerns, may not be located on the "Primary Field Site," as defined by EPA. This is in clear conflict with §3001(a)(2)(B) and the legislative history which places no geographic limitation of the exemption for produced water. Even with "other wastes," the "Primary Field Site" limitation is overly restrictive. The Agency failed to recognize that Congress' use of the term "intrinsically derived from primary field operations" (presumably from where the "Primary Field Site" derives) was only intended to distinguish clearly "upstream" functions involving exploration/development/production from "downstream" functions, i.e., transportation to market or manufacturing (e.g., petroleum refining). It clearly was not intended to geographically restrict the scope of the exemption.
The "assumption" that only wastes extracted from the ground or injected into the ground is covered by the exemption is also not supported by §3001(a)(2)(A) or the legislative history. It also fails to recognize that many important materials crucial to production operations may not fit in those categories, i.e., treatment chemicals, corrosion inhibitors, etc. This also results in the erroneous specific conclusions that spent iron sponge, filters, etc. are not covered by the exemption.
Other conclusions reached by the Agency which are not supported by §3001(a)(2)(A) or the legislative history are as follows:
• the "uniquely associated" requirement - particularly applied to the possible relatively minor mixture or commingling of non-exempt wastes
CD CZ O CzOz
« rtg to n l ^ rr I
_ . CD" rt I z r m ^ ^ \
e*n> ? -* t> Zt ^ at
to _.. "*•
CD CO to
CO CD
mtfffi

r
* > \ ,
1 i, >
W I
tr- ^ w ),tcXtY j i > . ,
aP'-* W * i
I* v,v< H ?
&W ? t . < • ^ / * ' < " , - •
t. 4 i
lmfr<
il.
the implicit assumption that all gas plants wastes are not covered by the exemption because they are not located on the Primary Field Site or are incorrectly viewed as resulting from a manufacturing operation
erxx CD tz
= EL to ;*? -h«<
CD
ex.
o
a
en^
s '
ex. cz co
rt
to
CD PJ
rt tZoT
a
St
<-H"» O
rt
to rt, a
•CD Z•T •^ *3•'I' = C D ™ to I rt* ^ •
CD •

W^'VJj
WPiP
i mzZ : ;
0}0Z$ys±$Mk »WWSv#'Kfe4?l53»
••Sfexs-' vWi^ypiyjyjgH
»fe'V^f#0'yKy^M
feAvVvyy-wv^
tgpW .•••.
ig?
ml*tfr-y#y*»-.. *
L
The term 'other wastes associated' is spe^ cifically included to designate waste materi^ al intrinsically derived from the primary field operations associated with the exploration, development, or production of crude oil, natural gas, or geothermal energy. It would cover such substances as: Hydrocarbon bearing soil in and around the related facilities; drill cuttings; materials (such as hydrocarbon, water, sand, and emulsion) produced from a well in conjunction with crude oil, natural gas, or geothermal energy; and the accumulated material (such as hydro^ carbon, water, sand, and emulsion) from production separators, fluid treating ves^ sels, storage vessels and production impound^ ments.
The phrase 'intrinsically derived from the primary field operations . . . • is intended to differentiate exploration, development, and production operations from transportation (from the point of custody transfer or of production separation and dehydration) and manufacturing operations.
ATTACHMENT
cr-o - i r z l CD c o m ol «a sE-. S- - Sa o-H| • rt, «< - to rn I a£ 2 ^ , —rt C2D.1-!*>. •I
2.rt-0> to ,+ • ar T a p | » g-g-CD I g*ro to?* O§ r° r=rt
3 ctoo CD
mo 30 > • •
o io
I 3

F—»•
j ~ ~
v«|
/ *
AZAl
- i i> M-l*
• .- i * y
$?• '/si W I
L_
CHAPTER III - CURRENT AND ALTERNATIVE
WASTE MANAGEMENT PRACTICES
The major issues in this Chapter are as follows:
The report indicates seepage in drilling pits is part of
the pit dewatering phase during pit closure.
— Landspreading is not characterized correctly for onsite pit closure operations.
Drilling fluids are not necessarily injected down surface pipe because they contain objectionable levels of contaminants.
State UIC programs may be different, but there is a minimum standard requirement by EPA before primacy is delegated to the states.
There are many incentives including economic ones for operators to assure saltwater disposal wells have mechanical integrity.
While the present draft reflects significant improvements over the Interim Report, EPA's contractor still uses outdated information in certain sections of the Chapter. For example, Table 2 still lists galena (PbS) and sodium chromate as additives used in drilling mud, even though they are no longer used in U.S. drilling operations. Further, the 1978 estimated diesel volume used in drilling is too high and should be adjusted for present usage. The quotes on page 34 about state program requirements for identifying USDW's are also outdated and not completely correct. For example, Mississippi requires surface casing on wells to be set at depths based upon the total depth of the well being drilled, not TDS values.
w
erxx CD cz CO rt —
| o t•o o f> m r+
o 7+ 2 . _ . ^ » _ . CD - b
"to P > ,+ 1
5 T « =>"l
° c ex
*t3tao CD
o o 33 > ;
o
innffl-flWlt

r
r-:: : fr< •:•
& • ' : • • • ' . .
fcv
• | ^ 1
-.••:•>•.•; A : ! w ^
jgp-
l@ni
fe^.i'l'.iV'.-Vf.v: .•.;••• v-^i-, A IB
-* • ';"m ill
ii
•lililfifl fciliiill
The report inaccurately indicates seepage in drilling pits is part of the pit closure techniques on page 13. If seepage occurs in a drilling pit, it is not design. Seepage is kept to a minimum in all drilling pits due to the self sealing properties of drilling muds. Column leach studies (furnished to EPA by API) substantiate that filter cakes with permeabilities of 1 x 10⁻⁶ or lower cm/sec can be created in drilling pits, seepage of fluids from drilling pits is not part of a pit closure technique nor do we believe it is a significant contributor to USDW contamination. The fact is that 37% of drilling pits have artificial liners installed where highly permeable soils exist over shallow groundwater or where bentonite is not added to the drilling fluid.
The report characterizes landspreading incorrectly. Land spreading is not, in most cases, a supplemental step taken to dispose of excess muds squeezed out during burial of pit solids in a pit closure operation. This technique requires the operator to remove the drilling solids form the pit and spread those solids on the ground, provided that metal, salts and hydrocarbon concentrations comply with state constituent criteria. As incorrectly described by the report, land-spreading is not an after-thought in a pit closure operation and is not normally done without a planned design.
In the discussion of Alaskan North Slope drilling wastes, the report refers to "road watering" as the only disposal alternative to decanting reserve pit fluids to the tundra. It should be noted that annular injection and conventional Class II disposal are also current practices.
The report's discussion of reconditioning and reusing drilling muds fails to note that the ability to reuse mud economically varies widely with the distance between drilling operations, frequency and continuity of the drilling schedule and the compatibility between muds and formations among drilling sites.
CTJO =J S - Z to c o " o I 5" p> d: =r -« I _ P
_^«< i ° eo m
r t o P
p»
CD - *

|P—«-
p\
^
The statement that pits are generally built or excavated into permeable surface soils or into unconsolidated sediments is not correct. Pit construction practices recognize surface soil conditions and distances to groundwater. In fact, 37% of pits throughout the U. S. were lined to prevent potential seepage to groundwater. Many of these liners were necessary to comply with state regulations and permit conditions.
The point (page 14) that disposal of drilling fluids down surface pipe is generally used when drilling fluids contain objectionable levels of contaminants is not correct. In fact, many operators use this technique because it is less expensive than hauling to remote disposal sites or treating the fluids to comply with discharge criteria (see Chapter VII.B. for state regulatory requirements). Moreover, this phase of pit closure does not address solids disposal. The disposal of solids is addressed by using burial, solidifica^ tion, or landspreading techniques.
The report stresses ( page 1 6 ) that annuar disposal has numerous problems. For example, the draft report implies that surface pipe does not adequately protect groundwater. State regulations require that surface pipe cover all USDW's and be cemented to the surface in newly drilled wells. Further, most states regulate when annuar injection can be used and limit injection pressures to prevent fracturing of the confining zone between the bottom of the surface pipe and lowermost USDW. Finally, most shallow shale beds are usually continuous in the major sedimentary basins.
The statement (page 21) that "nationally, approximately 60 -
70 percent of all produced waters are disposed of in
injection wells" is underestimated. This value should range
from 8 0 - 9 0 percent.
The report refers (page 32) to the potential for an injection
formation becoming "pressurized" by having several high
tC5zD"rx t£xz . Zfoa *
m - - o o
•< i" co S
2 ^ * C D
2.rt5
O O c 3 CD
-e>—x - ^
rt ZT — _
C D W P> I ta •
\(o

-•-^•w-ww-T"
:m&.y z
zW3%
•;g
•mmmi
yyMM •vZ''.-A-X.A^ !• '•Z'PP'A•'•''•' ,'i7 '*5|
y-uix-:'••••'•'<•••'•:-.-iYxs •i'x.A.yp.;**. s ' ->\-'.-:•" . ''••/.* A V j i
iW •
pi il fi
P \%-: %-:iP'' "" " "'"'"''
p: sZiA AzA*SM
MrnXxASU; li 0mmiXX{ Aw \m-;iy.ppr.ii.1-ii:iYpY$i i %Sy;pP:P:.,yppYtejif
!|iliillK 3 sfeiW ISpiY mypysypyiiYiPm
mm mM$^k mmyZmzz§m
wAZxiZspPpiZZ.
wppASpy
pWr,H MS*.-
!
pressure injection wells operating i n an EOR project. A problem would then exist for migration of injected fluid to a USDW through improperly plugged wells. This is possible, but not likely. Water injection in enhanced recovery operations is not usually i n i t i a t e d until the pressure i n the producing reservoir has declined s i g n i f i c a n t l y below the original reservoir pressure. Further, under the UIC program, a l l states either limit injection pressures or specifically permit an approved pressure. Most EOR projects are subject to constant pressure a n d volume monitoring, reducing the potential for this problem.
The report discusses variation of state programs as if it implies corresponding variation i n effectiveness. There are many valid reasons f o r variations, some of which are r e q u i r e d by statute. For example, section 1425 of the Safe Drinking Water Act required EPA to recognize differences in state programs in awarding primacy. However, in 1981, the EPA office of Drinking Water issued minimum guidelines for assessing adequate state programs. These guidelines address permitting, area of review, enforcement authority, and other major requirements f o r assuring that a state program i s acceptable. As a result, there may be certain state programs that are different but there i s a minimum standard they must ali meet to obtain primacy. These minimum standards imposed by EPA are adequate to protect USDW's.
The report criticizes (page 35) the present UIC program as allowing the grandfathering of existing Class II wells thereby circumventing the responsibility of the operator to identify possible channels of communication between the injection zone and freshwater zones. The operator must report annually ( a n d weekly or monthly depending on permit requirement) injection well pressures as required by the present regulations in both primacy and non-primacy states. The operator also must comply with MIT test requirements a t least every five years a n d more frequently as required b y their permits. More importantly, sound operations practices
17
CT.O CD C
«* 5-<8-»•
zii " CD — Q . rztr CO
o " o
r5
a. — fCDi*-> r,\
rt to
° 2 " W\ 3 rt a- — • to ZT to' 3 \ a co m to \

• "• « i *
p~
. !fe"V
IP
-CI £*s$
5 I t - / - ; v.-'::-.;/^;.;::r-;i1--'"
|l-s;^"tf-:;i:'--3
!I ^
? r ; v : ^ , ;v ;.-;••-A,.; •*••••• J
4 .'#&£ .V •;'-.,.%.> '*>'.&•
wmmm^im ? - ! , . , , - . T . . ; » r ••:••:• ,.-..V^V'.V%:2 w
u
Wm
J i l l 5 1
" V' . , - . - --,T|r'-U;.-:-S'i*
dictate an operator observe the performance of its injection
wells on a daily basis. The point is that the present
program does not relieve the operator of maintaining
compliance, i.e., preventing contamination of USDW's.
The report's assessment of incentives (page 35) for assuring
the integrity of disposal wells is incorrect. There are many
types of waste disposal processes used in industry whereby
the incentive for assuring proper disposal is environmental
protection and regulatory compliance. There is also an
economic incentive from the heavy fines and pipeline
severances that can be imposed if the regulations are
ignored. Further, the report states that most disposal wells
are usually old, heavily patched and difficulty to maintain.
This is not true. Many disposal wells are new because
converting a producing well in the field would reduce crude
oil production. Also, in many smaller fields, the salt water
disposal (SWD) well is the difference between revenue and no
revenue, if the injection well goes down, production has to
be shut in. Moreover, most enhanced recovery wells are
converted form producing wells. The idea that all disposal
wells are old and heavily patched and enhanced recovery wells
are new and without problems is incorrect.
The report describes (page 36) the use of percolation and
evaporation pits for areas where underlying waters are not
suitable for use. However, the report then sees a potential
for these same pits to contaminate usable ground water. This
is a contradiction and such pits require state permits before
they can be used for these purposes.
In discussing surface water discharges the report alludes to
the potential for damage to the aquatic communities from
discharges. Industry has reviewed many studies of coastal
estuaries and bays where aquatic life has been found to
5" P» a: =r -H I ^SgSol , «< S° to m
5 =• « 3
!a o >
O ro

r-v
r>r" A:1fe
<>W* j I J • rU ' I, (
coexist successfully with industry operations. A listing of these studies can be provided. Also, EPA itself has responsibility for regulating these discharges through enforcement of the Clean Water Act NPDES program and does not require additional authority under RCRA.
0"J3l CD C 5'fiL
CO j y -#,«< of th
e do
Im
ed
o
3 CD 3 e-h
Z} O
O *
€+
5" ex c CD
f-f O r * 3 " CD
NO
TIC
is les
« m if the fi
clear tha
~ * sr =:•
CO CD

' I I i
s ,W' . ' • "
T A A 'A.'
* J V
• -j V
CHAPTER IV - DAMAGES CAUSED BY OIL
AND GAS OPERATIONS
SUMMARY
API's analysis centers on presenting information on the 62
cases contained in the Draft Report to Congress.
Cases are analyzed and conclusions presented as to whether
adequate regulations exist to regulate "damage" incidents
regardless of whether API believed the cases are appropriate
for inclusion in EPA's study. Adequate regulation exist in
these cases.
API continues to disagree that damage cases from outdated
practices prevented by current regulations and non-waste,
non-RCRA issues such as oil spills, producing operations and
Clean Water Act discharges are appropriate for this study
because the study was mandated by Congress to determine the
need for additional waste management regulations.
API is concerned that no questions were posed regarding its
500+ page submittal on the 228 cases included in the Interim
Report. API is available to discuss any additional documen^
tation needs or answer questions in whatever manner would be
helpful to EPA.
API is concerned the Draft Report refers to 249 or 21 cases
not in the Interim Report's 228. If these and other cases
are used for background or other purposes in the report,
industry should be provided the opportunity to comment upon
these cases. We are also concerned with the use of cases
that did not pass EPA's "test of proof" for "overview
discussions...and supporting the risk assessment." From the
62 cases API reviewed, the attached list of statements from
the damage cases overview discussion do not appear to be
supported.
erxx a co cz o
<5Q* P . !± rt-8
ZH** *_ 3 3 ,^
CD co CO
o _ CD
CD o.
O CX
tz 3 rt- zr --o zr two" 3 a co fo
CD
CD to z?..
o O 30 >P o

p-w
r*
61. *
; i w k
ft; v
St ' »( f w
ft
'"V
v > *>
b^
In analyzing the damage cases, API has provided a character
ization of the cases compared to current regulations, a
summary of cases by damage category and detailed comments on
each care to supplement its original comments in EPA's
docket.
O CO §1 CD C 5" £L a: „ —• «= s-' g S O _£«< - <» m 1? 2. «+ — Z.
c» a . _^ £ • CD
O
o e 3 CD =1
P>
» 3 p>
CO CD

r~
•••: TT "k
mzz mm wz'-y
|vl;Ay;v?Iil|i| MZzmss0
!KV 'SpPPZ'ZZi :
mAi^mXiimm
iM^ZyiiyppiAiixp
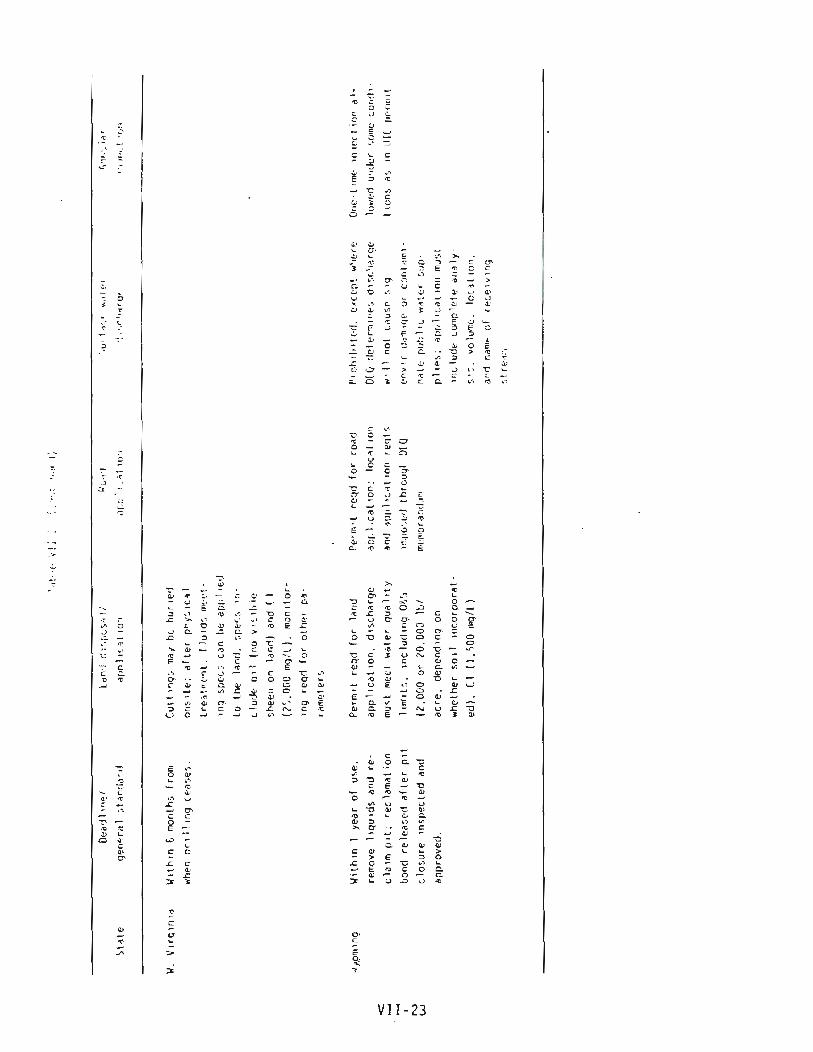
Damage Cafe Overview Statements
Appalachian Basin..."Because of these marginal economic conditions, the costs of environmentally protective practices and proper well abandonment practices can make the difference between profitability and unprofitability."
Ohio..."The State has recently banned all saltwater disposal pits, but a current legislative initiative is attempting to overturn that ban."
West Virginia..."Enforcement is difficult both because of limited availability of State inspection and enforcement manpower and because of the remote location of many drill sites."
Pennsylvania..."In Pennsylvania, disposing of oil and gas wastes into streams prior to 1985 violated the State's general water quality criteria, but the regulations were rarely enforced."
West Virginia..."Land spreading o f drilling muds containing up t o 25,000 ppm chlorides is allowed."
Pennsylvania..."Even though spills are accidental releases, and thus do not constitute wastes routinely associated with the extraction of oil and gas under the sense of the Section 3001 exemption, "spills" in this area of Pennsylvania appear to represent deliberate, routine, and continuing illegal disposal of waste oil."
Louisiana..."drilling muds f r o m onshore operations may be discharged into estuaries of the Gulf of Mexico, ...Since the muds can contain high levels of toxic metals, bioaccumulation of these metals in shellfish or finfish are of concern:"
Arkansas..."The State of Arkansas has limited resources for inspecting disposal facilities associated with oil and gas production."
Kansas..."Recently the Kansas Corporation Commission added new "lease maintenance" rules to their oil and gas regulations. The question of concern is how stringently these rules will be enforced, especially, as these cases show, in the light of the evident reluctance of some operators to comply even when faced with repeated orders for corrections."
Texas..."While the Texas Railroad Commission has not stopped the practice of coastal discharge, they are currently evaluating the need to preclude this type of discharge by collecting data from new applications."
Wyoming..."Enforcement of state regulations is made difficult as resources are scarce and areas to be patrolled are large and remote."
o* CD
a ta
3 CaD.
Xi
2L
o -l>
rt CD
ex.
CX 1=
CD a
a rt
o"
rt
to ex. CtZo
C+ o
to
CO
co" CO CO
CD
' to -J rt *-r a
rt to
-H O
rt* rt
to rt. 3 wm.m

" » • • " • - - * » "
, W
1 t
New Mexico..."Over 20,000 unlined produced water disposal pits are still in existence in New Mexico."
Alaska..."Inspection of oil and gas activities and enforcement of state regulations on the North Slope is difficult due to resource constraints, .."
i l f
»• < 1*1-*
' -*•
<J -v "* 7 - ' , ' « .
s w * A J '• '• 'V
#:s •- %
fifei^W ^Y7IM
sVvl'' *1* * * AiVkif
>-/ xS y$A
|Y * < i ' > "Wj
S| ( , > v * . A « mi 4 , , -> J
'J i i *
i
l {•(6
•I
w 23

"j u ^'SWwt'Y* - £ „ > ii - yyyy w J-' " ~ * - « • * * * •** - - -' >* -i,V''-1*''^'. "W--'.-Af. W - ^ -<- - -
jV A
DRAFT REPORT TO CONGRESS DAMAGE CASE CHARACTERIZATION
CATEGORY
AGENCY CASE STUDY
TOTAL WOULD OR NO. VIOLATE NOT SITE
CASES CURR REGS SPECIFIC
OIL OR SW
SPILL
ALLOWED OR
PERMITTED DISCHARGE
CIVIL SUIT FOR
DAMAGES WORKOVER PROBLEM
DRILLING RELATED DAMAGES
CONTAMINATION OF GND WATER FROM RESERVE PITS SURF DAMAGE-LANDSPREADING OF RESERVE PITS ALLOWABLE DISCHARGE OF MUDS ON GULF COAST ARTIC NORTH SLOPE DRILLING RESERVE PITS DAMAGE FROM KENAI AREA DRILLING
SUBTOTAL DRILLING
5 1 1 4
4 1 1 i
PRODUCTION RELATED DAMAGES
ILLEGAL DISPOSAL PROD WATER AND DISPOSAL PITS LEACHING ALLOWABLE DISCHARGE INTO STREAMS CONTAMINATION FROM UNDERGROUND INJECTION CONTAMINATION FROM IMPROPERLY PLUGGED WELLS DAMAGE FROM POOR LEASE MAINTENANCE DISCHARGE INTO THE TEXAS GULF COAST DAMAGE FROM ARTIC OPERATIONS DAMAGE FOLLOWING FRACTURING OPERATIONS DAMAGE FROM OIL OR SALTWATER SPILLS IMPROPERLY COMPLETED PRODUCING WELLS
SUBTOTAL PRODUCING
17
4 6 7
16
1 6 4 2 1 1 i
49
TOTAL NO. CASES
uo yaoo pswjij. 6u;aq
;u9iunoop 914; | 0 Ki\\inb 9 i | " ) . O } anp si ;J 'aojiou S jq ; UBl | ; JB9|0 SS9| 81
96-euij ium • m 1 ! :30liON

ysspy.: : fayyp-p • yxPSipYP
ZjpM
-Ivvv'VWi
§iaw:yili| »fey •;;Vv:-H-vr'-vvy;|y:y|Wj^p
] ysAZPs, iYYAZ(.0m imzzympwm imzyYSYpzMm KW!A> yy ipZz0
fc;A is. .•;'«'•'••.•-.••>• ; W I iii''f " T .ii,.A i '-y -yypYi- A ' ^ S
L
DRAFT REPORT TO CONGRESS SUMMARY OF DAMAGE CASES BY CATEGORY
DRILLING RELATED CASES;
Contamination of Groundwater from Reserve Pits - 5 Cases (0H49,MI04,OK08,OK02,KS05)
- Only two of the five cases appear to be the result of Leachate from reserve pits (MI04 and OK08). In both cases the States have regulations addressing this type damage that would make it a violation today.
- Of the three remaining cases, OK02 is a civil suit case seeking damages for a 1973 drill well where the information from the plaintiff's attorney cannot be verified by the OCC or defendant. The two other cases OH49 and KS05 appear to be damages from old produced water pits. Nevertheless, Ohio and Kansas do have regula^ tions that pertain to both reserve pit construction and operation and produced water pits that would have made these cases violations today.
- Additional regulatory authority or regulations are not justified by these cases.
Surface Damage Related to Landspreading of Reserve Pit Contents - 1 Case (WV13)
- West Virginia state regulations at the time of the discharge permitted landfarming of pit fluids with chloride levels above those discharged. Since then, revised regulations would have banned this landfarming incident (see case writeup for new regula^ tory limits).
- Existing regulations are adequate and can be changed if needed to reduce chloride limits in the future.
Allowable Discharge of Drilling Mud Into Gulf Coast Estuaries - 1 Case (LA20)
- Louisiana has regulations in place for discharges into inland and coastal waters. In this case, the state ordered a legal discharge stopped under its authority to regulate discharges.
- No additional regulatory authority is needed.
Xhx
erxx a to' ZZ\ tz o o CD"-2-*?5wT =» a : g c o o
a 2 . S * " — m-• 2 " * _ C D - b
S. £ « Q H-» g*rt-«
° "i c3° rZot t — a3*5 " \ C D ZT ^ 3 \

j ~ ~
vW'WWsKg SPZyZHm
IpVvr- ;V ; v. ZASp?pZ3
v YyM
Ipsjiflvy %y:zzAZiM
\ ^0sASmiiiX:AXM
^XXWAim
•PXYm
•pMf.tf
mps:
Damage from Arctic North Slope Drilling Reserve Pits - 4 Cases (AK06,AK07,AK08,AK12)
- Three of the cases are studies (AK06, AK07, AK08).
- Two of the studies (AK06, AK08) investigated the impacts of permitted discharges to the tundra. AK06 was a draft study by FWS that is unavailable to EPA or the public for review. ADEC drawing on AK08 and other information has recently promulgated new dis^ charge requirements to additionally protect the tundra. The regulations were promulgated under existing authority.
- One of the studies (AK07) is not damage related and found only that reserve pits and Arctic ponds support different levels of Daphnia which is a species sometimes used in toxicity testing.
- On case AK12 is an example of a practice now banned by the ADEC. Exploration pits are now required to be closed within one year of cessation of operations and can no longer be left open indefinitely as was U.S. government's practice on the NPRA.
- The need for additional regulatory authority requirements or regulations are not demonstrated by these cases.
Damage Related to Alaska Drilling in the Kenai Area - 2 Cases (AK01,AK03)
- Both cases refer to sites that current regulations would prohibit using.
- One site (AK01) received materials initially from an oil and gas operator but became an open dump.
- One site was a commercial site which is no longer used and would not be in compliance with ADEC regulation 18 AAC 60.3106 requiring groundwater monitoring and other requirements for commercial sites.
- No additional regulation or regulatory authority is justified by these cases.
*..(&
zr o s r o

r
•1'
W V j # ? g
, ^ ^ A ^ W ' ' J ' v V C ; r '7V, |p> VK'iiV-'':7'-'.ivV.7V 7. .v'i7^V '^J iB3»V ' A **-.• • ; A - V ' A A - A I
»EyyW;?V;.;:.7?'{;:'.7;!,;jjJ.^*;
V • • ;.,.% " * ;, W * ' ,••'•'-; Pi'Tp
PRODUCTION RELATED CASES:
Illegal Disposal i n Production Operations - 1 7 Cases (LA45,LA64,LA90,OH07,OH12,OH45,AR07,AR04,TX21,TX22,WY03,WY05,WV18, LA15,AR10,WV20,PA09)
- Sixteen of the incidents involve activities in violation o f state or federal regulations for either waste disposal or reporting of oil spills as required under the Clean Water Act Section 311.
- One case (LA64) is an accidental saltwater spill incident where the landowner refused remedial action by the operator a n d d e m a n d e d instead a cash settlement.
- Additional regulation is not justified as 16 o f 17 of the cases are already illegal and the seventeenth was an accidental spill that should not have been i n c l u d e d i n this category.
Produced Water and Oil Field Waste Pit Contents Leaching Into Groundwater - 3 Cases (NM02,NM05,LA67)
- All three cases involve practices which are no longer authorized and are extensively regulated by the states of New Mexico and Louisiana.
- O n e case (NM02) w a s erroneously reported. N o damage occurred, and n o violation o f state groundwater standards existed.
- N o additional regulations a r e r e q u i r e d o r justified because these practices a r e n o longer allowed.
Allowable Discharge o f Water Into Surface Streams a n d Ephemal Streams - 4 Cases (WY07,CA21,CA08,PA02)
- Three of the cases are allowed discharges under the Clean Water Act's NPDES program. One ( P A 0 2 ) reports on a s t u d y on discharges that would violate state and federal NPDES requirements i f they were occurring today.
- The surface discharge of produced waters (WY07) is specifically allowed west of the 98th meridian under the Agricultural and Wildlife Water Use provision of the Clean Water Act (40CFR Part 435 Subpart E). These discharges are extensively regulated under the federal NPDES programs implemented by the EPA and/or under existing state water quality standards. Further, many of these waters are of high quality and represent a major water source for many land^ owners in arid regions o f the Western U.S.
- The California cases (CA21, CA08) represent an example of a situation that may require additional regulatory attention. Regulation of this type incident are covered under the Clean Water Act NPDES program. These cases are under active regulatory review using existing regulatory authority by the EPA and California. I f changes are required, they will be incorporated into revised permit conditions.
-LI
to a a
c ° wto O l EL zt. j r * -H
<ex a - ' S to I-to CD
«CC ZO+
2 o ^rt CZ3DT
3 r t = r = -c o z r ^ 3 a CD ™ to rt ta
CD
I 0o 3) >i o
Bsaag-g

r
i-y-zw
WZXy
m; rxtfwm •/:x-.•-*m:,•:••m: p.-pip-
yi0ZpZ:ZxS'"
SiliiiSi p.-yp
mi Mt r xspp ixxxyi WSZZ-ySsZSZ^
iyyZPiPZApM xsiypsppTpm SSZYSPPZP4
SWv y
ZS
L
- Further regulations are not justified based on documented damage or a lack of current regulatory authority from there cases.
Contamination from Improperly Plugged Wells - 7 Cases (KS03,KS14,TX05,TX11,TX15,LA65,KS03)
- Four of the cases (KS03,KS14,TX05,TX15) are examples of wells not plugged in accordance with current regulatory requirements. Current regulations require placing cement plugs across producing or injection zones and separate plugs immediately below USDW's to protect groundwater.
- One case (TX11) did not cite a specific well but alleged wide^ spread salt seeps across Texas resulted from improperly abandoned wells. If the wells exist, the Texas Railroad Commission is responsible for properly abandoning them if the operator cannot be found.
- Two cases (LA65,KS03) are currently in litigation and the source of pollution and responsible parties has not been determined (see LA. Office of Conservation comments in EPA's docket on LA65 and KCC comments on KS03).
- No additional regulatory authority or regulations are justified by these cases.
Damage related to Lease Maintenance - 2 Cases (KS01,KS08)
- Both cases (KS01, KS08) involved violations to Kansas regula^ tions. Further, these events occurred prior to the issuance of KCC's "Lease Maintenance Rules" (K.A.R. 82-3-600 through 603) in May 13, 1987. These rules require permitting of all pits (includ^ ing drilling pits, previously not required by KDHE), emptying of emergency pits within 48 hours, notification of spills within 24 hours and specific administrative penalties for each violation.
- On July 1, 1986, KCC gained complete authority over all oil and gas activities. Prior to that date they shared certain aspects of environmental regulation authority with the KDHE. KCC, unlike KDHE, has the authority to shut down an operator should the situa^ tion require such action and is also staffed with more field agents.
- Existing regulations are adequate.
Discharge of Produced Water and Drilling Mud Into Bays and Estuar^ ies of the Texas Gulf Coast - 3 Cases (TX55,TX31,TX29)
- All three cases were permitted by the Texas Railroad Commission and are subject to EPA regulation under the Clean Water Act.
- In two cases (TX55, TX31) no evidence of damage to tidal areas was documented.
£<P
CTJO a co tz ex
<a° r2Lt- rg—+
rt^ -
ex r+ — l
a°rtSL S ^ * C D
-r ' a- •
• g-g:»l
3 rt zr zz- m CD * r W* j * 3 l = C D to I rt to •
CD •

f~~
iSSSIi! rM V rM V
• t wss-mmtm
xy
R'VviWs^i «.;W-«?***
- One case, TX29 where damage occurred to fresh water resulted in the discharge permit being revoked.
- No additional discharge regulations are warranted by these cases.
Damage Related to Arctic Production Operations - 1 Case (AK10)
- This case is an example of illegal storage and handling of used drums by a commercial salvage company. Alaska took action under 18 AAC 75.080 and required cleanup and monitoring of adjacent tundra and pond areas.
- No additional regulations are justified to regulate this type incident.
Damage to Water Wells Following Fracturing Operations on Producing Wells - 2 Cases (WV17,PA08)
- One case (WV17) resulted in a workover operation fracturing into groundwater as a result of equipment failure or accident. As described in the detail writeup this is not a normal result of fracturing as it ruins the productive capability of the wells.
- One case (PA08) is not the result of fracturing but of habitual violations of an operator who unsuccessfully sought bankruptcy to avoid state enforcement actions.
- No additional regulations are justified by these cases.
Damage Related To Production Operations Spills - 2 Cases (AK09,MI05)
- Both cases are spills with AK09 an oil spill and MI05 an oil and saltwater spill.
- Both state and federal regulations are in place to address such incidents. The Clean Water Act requires the preparation of Spill Prevention Control and Countermeasures (SPCC) plans under 40 CFR part 112. Also, immediate notification and prompt cleanup of Alaska oil spills are required under ADEC rules 18 AAC 75.080. The U.S. Coast Guard also has cleanup and enforcement responsibility under their regulations 33 CFR part 153.
- No further regulatory authority or regulations are justified by these incidents.
Groundwater Contamination from Improperly Completed Wells - 2 Cases (NM03,NM04)
- Both cases are violations of state producing regulations. In addition to states having authority for environmental protection, they are charged with preventing waste of natural resources.
Z-'TI
erxx a mzz- z CD tz o o 5* P > 2*. =r -H
«° rt gCD « ? o CO
= 5 *
S
O
Z+
£>
.rt«P
CD ttzo S"zs
3 t o "z r *z** * .. -33 a CD w to
ta CD
L

ft .
ip,-. - y l
0 - X.ASXAM
t> mxm is * A>ft
"A •- # Wy tmjm ^hh ? i&($m
fi***!-*?,,.»**• * « A 'S
mrfy * n iiX% \i > w
?z A y •> xH"
f i <,
^ i •W K
- The Hobbs case (NM04) referencing oil on an aquifer uses 1965 data. Numerous regulations have been placed in effect since that time (see detailed case writeup).
- No additional regulations or regulatory authority are justified by these cases.
SO
CTJQ S J = • a s co er o - o l 5_ * 2toL «± — zj I 2toL •P — ZZ' to —
. co m : o 1 ~" _. to—-•> I
8 . 3 . . j»g. s* * pr-* t> Zt* 3 a\ § O rt I 3 rt- =^ — -cao -cJo- w5 * p 3> rt- CO I

.4:
><^
WZ^Z'-.y(AtA4
CHAPTER V - RISK ASSESSMENT
Some API data (waste volumes, pit sizes) have been adopted by the Agency. Will the final report also use column leaching data, statistics for pit liners, or information on arsenic provided by API?
This draft reflects few revisions to risk model scenarios for underground injection as well as reserve pits. Will API's suggested changes be incorporated into the final draft?
In Chapter 2.C, EPA's contractor has evaluated "risk" posed by wastes by calculating ratios of waste concentrations to multiples of health based factors. These calculations and the constituents emphasized are inconsistent with the risk approach taken in Chapter V. Will these sections be removed from the final report to eliminate this inconsistency?
API supports EPA's efforts to make its risk analysis region-specific. However, the description of the weighting process employed to accomplish this is extremely vague and unclear. Will this be clarified in the final report?
The risk analysis still does not address actual cases of environmental damage for human health, aquatic organisms, or natural resources, will damage cases be addressed in final risk analysis?
This draft still contains no conclusions concerning risks
posed by these wastes. What preliminary conclusions has EPA
drawn considering a) the very conservative 90% percentile
worst case risk to human health from medium sized pits is
rather low (1.6xl0~6 for cancer. 6.3xl0~5 for less severe
hypertension), b) the occurrence of oil and gas activities in
sensitive environments is rather low (less than 5-10% of any
area affected) and c) there is no mention of damage docu^
mented in sensitive environments?
3|
mCO mCO =
er.a a co e fot = fiL - • CD — - • •= > rt g c » O I _;,<< -1-to m j

r
•y
* yAA « - i , - i ' - t^* Ju
'* •• • ? 4* A
hi -.\Apji* /J"f
fjvF<u V'"
Km- <^M ^* W- , "A
I-'W4 I >;$
I I I
if ; s ! j
.is*
Are there areas in the qualitative Arctic risk assessment where additional information that could be supplied by API would be useful?
Appendix A contains waste analyses and comparisons to multipliers of health-based standards. Will the final report address the significance of the waste analyses and include comparisons to API results?
3<L
-t>«<
nmiMTmMww

I • IL.
r
iwmimwm f l»3Wv:lS|i8
imzzzy^m &W-APSYP*:r.ip?X?!iX*i:
[pS<Spiy-p i)ri'YiipSjiiiiiX yPpPP^xP-.Sipy.piipPf^iy ^sZPi^rP iiyYPiiPZif•$ sJ^%^»4p5S,^7'§7^
Sv.'-'V'';.'-1-iyz-yi.p.. T --P --py-fix
WWi ffltfSX f W W V ; W i f t l s l
1
•* ; « vl
;R*SV'
£&iii
3
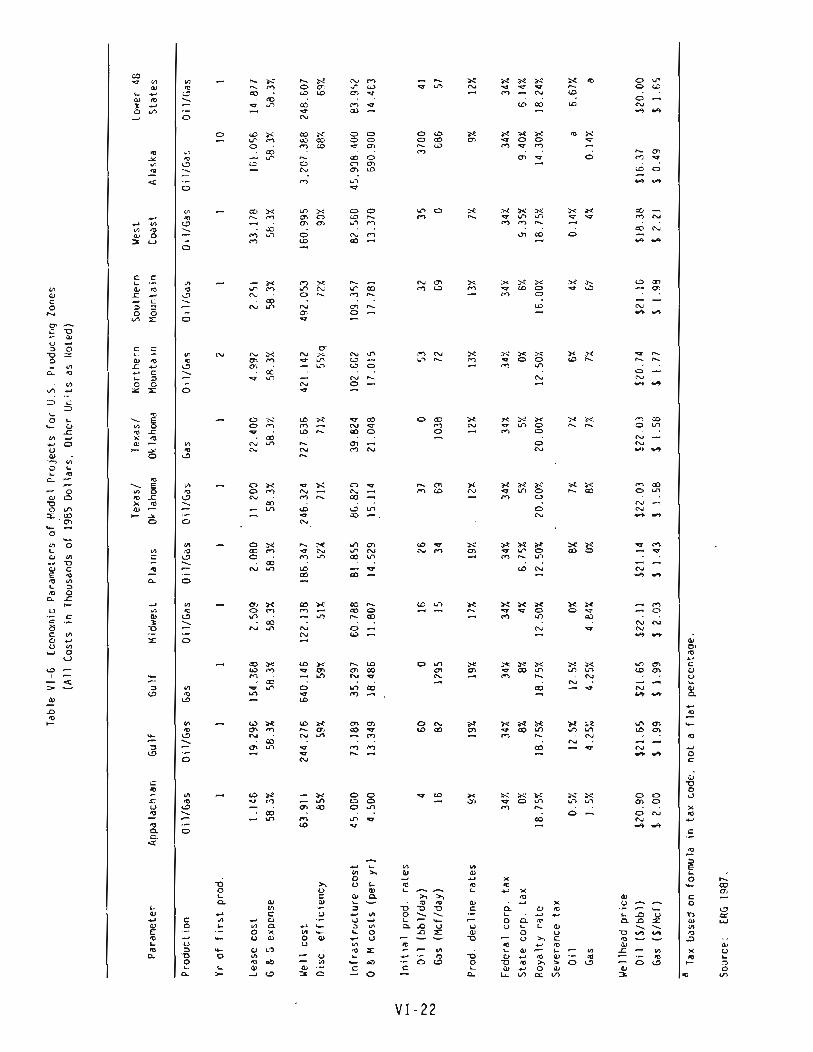
CHAPTER VI - C O S T S AND IMPACTS
We support the inclusion o f API's 1 9 8 5 "Production Waste Survey" into the data base used for this report. We also support the reduction o f the decline rates a n d the use o f current prices.
API's concern that the extreme variation i n the type o f operations present in the oil and gas industry cannot be adequately represented by 21 model projects is still relevant.
The national cost level projections in Table 11 indicate additional cost for disposal of 20% of produced water in the non-hazardous scenario, while the reason is not discussed, it appears that it replaces discharge points with injection wells. If so, the inclusion of surface discharges permitted under the NPDES program is inappropriate. These point sources are specifically e x c l u d e d i n 40 CFR Part 261 a n d should not be included in this study. Therefore, the intermediate scenario should indicate no change for the management of produced water.
RCRA Subtitle C scenario i s unclear regarding the onsite management of drilling waste. API has estimated the cost of drilling waste disposal in hazardous waste facilities at $25 per barrel versus EPA's contractors figure of $17.78 per barrel. The contractor's cost also appears low in view of additional costs that would be incurred for closed drilling systems or other equipment necessary to contain hazardous waste.
The logic f o r the selection o f waste management scenarios i s
not described. The report is unclear regarding whether the
liners required for non-hazardous waste reserve pits in the
"immediate scenario" would also be required * i n the "RCRA
Subtitle C scenario." It is also not clear why the "RCRA
1*
i. CTJQ CD C O 5" £.£•-° rt-g to Ol
CO
CD
g O 3* O _m.
2 £ r ^ t t—o etO> -^<
* c " rt C D
So = 3 | 3 rt a =r a CD CO
PJ tcx CD

•fc i-A • ' w Y ^ 1 ySmmSzii'W
I $:XAXm*A^mxmX \ ^{'ii-'v';.'0w'.; ^mA'XlY&iw
V7
kyPiT,rprpPTpiS$ii hp pi ipp\P,:': i.ipygtfp'i
SjiySiXsyZxYXZv
AZZxiZiZM^ wSAASPSMAAZA §SfiX:ZiZiXZiP0
v^i$sisyy:ppsspPif tKiA'i.VAVi V ' •>^'7•',i.'7'.V't*Al
PM^B^v^'fe^-vi ••• i i i - ^ i ^
^Sf|VV
SIVA
livW
•y•• w i i i s - ^'is^ vyvVj-i'A'c ' .,:V'y?i5"
VvSiA
L
Subtitle C" scenarios assume that 10% or 70% of projects generate hazardous waste. If these percentages are based on sampling data, the basic information should be open to comment. However, if based on sampling data, the sample size may not be representative.
The unit cost estimates from the Inerim Report serve as the basis for the national level Lower-48 composite model project. API has documented in previous comments our concern that the manner in which the dollar per barrel costs were calculated results in understated cost. These comments are still applicable. Using these values as a basis for modeling will result in an understated overall industry impact.
It is unclear how the economic methodology will account for reductions in drilling activity. It appears the impact on newly discovered reserved may not recognize that, in addition to drilling costs, newly developed reserves will also have to support production costs associated with additional regula^ tions .
The costs per barrel for hazardous waste compliance depends on reserves used. The reserves used in the calculations in Table 10 should not be checked against DOE estimates to insure that they are not overstated, which would understate the impact on new project rates of return.
It appears that impacts on commercial facilities are either overlooked or understated. The impact on existing commercial facilities that receive non-hazardous drilling waste is not included. Also, the impact of the increased demand on an already capacity-limited commercial hazardous waste disposal industry is not adequately addressed. This situation would serve to increase the unit cost of disposal dramatically under the RCRA Subtitle C Scenario.
As commented upon in the Interim Report, costs of transporta^
tion under the RCRA Subtitle C scenario are underestimated.
3W
eCDrxtxz ao •™%- o z —• 03 rt —
to zz tx — co to to
O
— to rtx\
rt.1 CD CX
g-« to =s; ty rta —\ = ' rt ZT — * co zr w 3 \ a CD to \ rt ta '
[gH

W i I .
WA'
W '•Ams b
'.x::-:.my~-::i • • • ' • ' . . ' . - ; "
, ••.••Wr'-J
iApmsyzm ksYyZpypSip --.p'Y'Pf
.iwiZiPmZp.rzi'pmiXpsy-\zz
mzyzyxxxi lkmss iM'SZy'" MSA 'k>-.'--••
# v V $YY>
piiXriPii§
'W
'iXMx^mmAXM
SIiilSfelj
! $0^msAmx
ii^lllwlipSi 0p:yysm iPiZ'S
pllllllSilii
fit;; -:**•'••',-
# A W W w y . g;vV!v-
vvyyvy
The lack of hazardous waste disposal facilities in certain parts of the country, the impact of an overall lack of hazardous waste disposal capacity and the remoteness of oil and gas operations will all contribute to high transportation costs and all are inadequately addressed. Particularly understated is the assumption that a Class I well will be available within an average of 30 miles from oil and gas operations. It is also probably optimistic to assume that new Class I wells will be located the same distance from producing wells in new projects as a Class II facilities would have been.
Costing of produced water management must recognize that 128,000 of industry's 168,000 Class II wells are used in enhanced oil recovery projects and cannot be relocated. This water must be reused onsite for reinfection in enhanced recovery operations. Conversions or replacement of these existing wells to strict Class I wells could also require workover or replacement of producing wells within areas of review.
Development of baseline economic case data incorrectly assumes that average per well producing rates are typical producing rates. In fact, most wells produce at rates below the mathematical average rate. This assumption generates overstated initial producing rates that will understate the impact of additional regulatory costs.
The derivation of economic limits based upon waste management
costs should be discussed in more detail.
The economic analysis methodology is limited to oil industry
impacts on exploration, development, and production. It
fails to address oil industry employment. It also does not
address the major restructuring of state and national
economics and employment losses outside the oil industry that
would result from hazardous waste regulations.
Si
CO C D C O C-*O" O 5* P» ZT. zr -H • = rt g to o I zzr © I* o =i a . rt- .-=i a . 3 -b £ . rt to P » rt. I
:i CD a.
go *»rt tao 3
5 ° **• 3 rt- ZT — to ZT to' 3 a to (o rt ta
"•*$}•

p
l P-'-*'!-.-';.-i.;''."-..i/".|.'ii.**:7,;Vg
BW. YYYpii&a
''i'Mss
•cpy$
wwi-s ;&mz\mxmmI'vW^$ivSd'-il \ #.y m m: mzTmr^'M j. v^-y-'x-x! Y ; x -'-pAA:-H-'ik^M
•ftwwi vv. -'W<'"-mmSr^yl
illllllllil
CHAPTER VII - CURRENT REGULATORY PROGRAMS
The following comments address EPA's discussion on state regu^ latory programs.
• API believes that the information provided on current state regulations and damage cases must be incorporated into the chapters on current industry practices and risk assessment. Otherwise a through and fully accurate analysis of the adequacy of current regulations and industry practice cannot be conducted to satisfy the congressional mandate to determine if additional regulations are required.
• API's June 15th comments provide evidence that states actively enforce regulations. Damage cases involving viola^ tions of state regulations resulted in administrative or enforcement actions in 95% of the cases.
• Fines are not the only mechanism available to states to insure compliance. The permitting process is another tool. Permit review procedures take into account past compliance of the applicant. Special permit conditions, which can include specific reporting requirements, may also be applied o n f i e l d conditions and/or past compliance history.
• Data, such as that submitted to the EPA contractor by states, should be utilized when studying the enforcement issue. The only state enforcement data used by the contractor concerns the number of field inspectors (Attachment A ) .
Oklahoma, for example, submitted a package describing how
they track the effectiveness of their regulatory program.
This type o f data s h o u l d be i n c l u d e d i n an assessment o f
state regulatory effectiveness.
5<o
= EL -
zr o 310 r.t*
CD
CJ.
O
CD
rt
CD
rt
to
to rt
ex rt
to
M
toZi
o_ C3D ~*-b
r t - C D
P> ZZ
rti-ZT —
to 3 ta

r
s n s 5 ' - A * , i 1.;' *
L
Statistics like those submitted by Oklahoma should be incorporated into EPA's assessment of the state regulatory program's effectiveness. For example, the following comments were provided to amplify on Oklahoma's program (see attach^ ment B) .
Field operations inspectors and managers achieved a high rate of success in resolving complaints and rules violations. Of 138,750 complaints investigated, 110,566 (79.68%) were resolved in the field. Only 206 com^ plaints required legal action to obtain compliance.
Installation of computers in the four district offices gave field personnel instant access to intent-to-drill and surety information.
Field inspectors worked 122,535.5 man hours in FY86. The largest share (27.64%) was spent conducting inspections. The second largest share (14.07%) was spent investigating and resolving complaints.
API generally concurs with EPA's assessment of state
regulations. Several comments relative to specific state
programs are included in attachment C.
^7
erxx a CD cr o a EL —
ta a: ex * CD
m rt,<<
ZZ ^ CD
co O
2 W =>"B D \I » . rzrt- CD_ \
rt=^| o 3
§ r°t=^|rt-3 rt ZT -CD ZT ^ 3 a co to
ta co

iBriiig-SsSiHg'W^
^ul^^T^Va^iKite«^l«»l= *= 4»i&yiite£§a^i^^ IsgaSSSSisSr-iaiisai Sa IsgaSSSSisSr-iaiisai SatMiiigi^gS^Siigaai^iii^i^iA'-M <&&s^jj&il&&¥&Sb&8&ttia4iii<2..
Stala
Milk*
CaMo-ma
l a i M
Ca* r iatfucI lM OH Pf**wlil
IU.OOO
1*4.443 Urnd IMS
4*3.000 U a d l « M
illoMGae anil
U I .3M. t2 l t&
l t .7 IS.MU
423.MO.OOOB
KM
*-*.482
MCMOM-ad IM4
S.SS7.000Unrf IM4
pMWHftVWIU
WailVauna
«vta»a
MOlIOOMnd. IMS
l-CJOOMnd IMS
ISS.000Uad. IM4
S M S O O O U K I IMS
l«2.S0DUmd IMS
M L W I M IMS
TSjajaSStS
44t.S4S.00SM
74.500.00081*
l4.M7.St2**-**
153.250.000 A h
4.t2S.OOOBMi I
430.OOS.OOO E h
.(00.000 tUm I
l30.M4.tl~ DM.
MM
I4 .« t
14.30*
l . l t l
t.4M
S&.07*
2SJZS
2I.M
ln |Ml iM a-aUa
4 l 3 C U u l 42SEOR 4/HB|«IVH
1.211 Claw • 2JUllin »720n|ioaal I II.OMCiaaat 10.047 E O I 1.0141
l O O n M i a m l m - M
U M ^ j I M d M l M S
c o a v f a u d i a l M S
14.802 O w n I t . s i s E a n 5,534 OupoMl
C M Q w l l . 2 t3EOH 3,153 Oafos j l
31.343
23.S4/
24.060
32.M0
-U20
2 M I 0
MJ030
20.73*
12.214
3.471 C k u l 3.504 EGR 343 Pfoaal 3.064 D M t 127 t o n 3.l2tOiaen-4 22.403 O n * • n . » i { a n 7.902 Pwpotd
3.413 K M M b
coawlaladalMS
S U / M o n l m IMS
•aaacy
C M an* C M Caaaamton r a w m i
UHMrtwrt ol f nwiowiiwiKI Ointanumn (M
QapMMMKcilPuSdion Control j n d t q j t a g r
O a f a . O M u m o l C H a n d G a a
Hapaima.* ol f a h and Gama l(M«aaCa<po<aanaCtiaa—n
OoaaHaw4alEn»acinaaHjlOiMl«y
O t g a c l C o a a a c v a a o a - hqartion and aSnw-fl
P a i a a a a a l
3 anbnjanianl p o u u n t
2 antoreamam potaaint
30 anfeccaaMnl pouoim
• a t s Eaaigr and Maataai flap mania . I M S CM C o a i a M a i a Hum-in
S.297a
t . l T t n
l U d a u t 4.315 EOfl 1,4*4 Om-OM-J3 . I4 I Q u i • 45.223 CO« 7.114 UnjJMd IS I O u s t
M 7 E U H
5.440 ClU4« S.2S7EOH S23UajjQMl
la IMS
4.S27a
2S.72U • H I M
m a y M a d i a l M S
o u a f M a d M l M S
O N D Oa-aaiUHal cd Natiaal H a i o u K U . Demon cd 0 * a a d G M
OUafKaaa Ca-*pofitioa Goaaai&Mjn 52 anluKajaanl potauns
58
Oap-aa*-nanlolCa»-*uaauiaal'~la«Mrcaa. Biaaaa 4i CM and CiM M-mgaaMM
Waal ttagaaa ftapMaianl c i Enwgy
CM « i d C M Caaaareaaon C o a r a u a j n
| P a > n l m a H a l EnwonaianUI (XuMf
34 anlmcamani uosaKuis
poiaxms
4S atdwcamaid pouiunj,
24 aidutcaaiaal poiMtuox
7 anfaftanMM posawni,
4 5 aiduM—wid |»j\a«Mi>
&3 '
s§3 l-H
00
izo vaoo p9Ui|jj. Buigq
;u9tunoop aq; jo Aijienb aq; o) anp si, -.i 'soj-^ou s j q ; UBq ; JB9|0 SS9| S J
9BBUII IIIIIJ, g q ; j ] : 3 Q U 0 N

NORMA EAQUETON Gonvnitsionot
O K L A H O M A
r rporation Commiss
ATTAOT-ENT B ;TOWNSE>,-TO COMENT ON nm-M-on^ CHAPTER VII - CURRENT REGULATORY PROGRAM
xmm XMM
* ; ? ; & * • • W!v XX i .W.»S
wAmfXWsMw
erxx a CD c o 5" EL -to zz cx £T P a 2.
3 rt, teox. rt. . toz
-CtoD
Ms. Carla Greathouse Versar Inc. 6850 Versar Center Springfield, VA 22151
Dear M s . Greathouse:
This is in response to your verbal request for information concerning the organizational structure and responsibilities of the O i l and G a s Conservation Division of the Oklahoma Corporation Commission. Your special interest was directed to the Field Operations Department of this Division. Attached is information that we trust will satisfy that request. »
T h e r e i s a l w a y s concern about h o w information such a s y o u are being furnished w i l l b e used o r interpreted. Based on some o f the comments o n p a g e s 1 2 a n d 1 3 o f chapter 3 o f y o u r Interim Report d a t e d April 30, 1987 t h e r e i s s t r o n g implication that t h e states a r e doing a n inadequate j o b o f t a k i n g c a r e o f their environmental b u s i n e s s . In m y judgment, much of what is written is suppositional and judgmental rather than factual. We in Oklahoma feel we have good regulatory programs with adequate, dedicated staff and enforcement capability to properly protect the state's environment.
Much of what is stated on pages 12 and 13 would, if applicable, be as difficult t o contend with whether or not the programs are managed b y state o r federal agencies. In reality a well run state program has more sensitivity t o site specific problems and is far more cost effective than a federal program.
W i t h all d u e respect, w e don't necessarily mean t o b e argumentive b u t h a v i n g r e a d m u c h of t h e Interim Report it appears t o h a v e a strong anti-state bias.
The Oklahoma Corporation Commission has recently promulgated Soil Farming rules for utilization o . f fresh water drilling fluids and cuttings from reserve pits that we believe will be models for other states t o follow. Further, we would be pleased to have your firm visit u s f o r a firsthand appraisal o f our regulatory efforts.
mmmmum

' f " •
Y
X
< , H
L* fMii,
' ' '* *" wv
tf?«, h ,Z H i * * S JKV''I" i''«'>-»,ni|
'*}^
We are most pleased to furnish information we feel will be used in > constructive way, so should you have additional needs, please so atjse!
Sincerely,
VXr-WaULTUZ&^C-
C. D . Davidson, Director Oil and Gas Conservation Division Oklahoma Corporation Commission
jph
attachments
CD £c= Oo " O trxx a CD £c= Oo
"—=> to rt-O
CD
rt " _ . | to V rt* g* rt C D I
|g«-wr=PIrS !
3 rt zr — a CD 3 - w 5 - 3 1 a to p i I rt ta •
CD B

•^"•"•W****! * IL
,y /
f '-ww-si
w\, * '•, A i ?7'i
«*?> i ' v^-5
Wiv-V-A-
-*• ; * - , ' ' • C
» ii
r » < *-*
£ .
1.
2.
Organization Chart - FY86 Annual report attached.
Field Qperatlona Staffing
Oklahoma City Department Staffing
Manager - 1 Complaints Coordinator - 1 Field Inspector -
District I
Manager Assistant Manager -Office Staff -Field Inspectors -
District II
Manager -Assistant Manager Office Staff -Field Inspectors •
District III
Manager -Assistant Manager Office Staff -Field Inspectors -
District IV
Manager -Assistant Manager Office Staff -Field Inspectors -
Total Staff Plus four vacancies
1 3
1 1 2
il 16
1 1 2
13 17
1 1 2
1J5 19
1 1 2
il
15
70
>
, 0.
erxx
CO jy -b«<
CD
O
CD a
a
CD
rt CO
CX. tZ CD
rt cx rt
CD
to"
to to
— CtoD
-I rt ztor
a
rt to'
m
rt rt
zCrD
rt. 3
p>

r~
ASM
liHISi
t&APfiA-Ty^'A^Smk !^gYZYxYyPsY<imi>ZmyPZMZi
i;ft!i'iSV!.*:^*
p . * . * *
J ••'$
3* Duties of Field Inspectors
Supervises, production pressure, o complaints, and officia complaints; advises com operations work over, Commission drilling pr pertaining abandonment other opera complied wi for various
witn poten r gas conf Is of make plain upon Plug, rules actic to dr sal
tions th; r perm
esses tial, -oil ers w othe s rec ant o recei and and es to illin t wat util eport its a
tes casi ratio ith o r sta ommen f act pt of aband regul insu 8 t ca er di ized s vio nd re
ts and rec ng setting
Investi il company te agencie dations ba ion taken, notice of on wells t ations. I re that ru sing, ceme sposal, us by the pet lations. commends a
ords data on we , cementing, bo gates pollution personnel, Ian s concerning su sed on the find Checks field intention to d
o insure compli nspects product les and regulat nting, plugging e of earthen pi roleum industry Investigates ap pproval or disa
11 ttom hole
d owners, ch
rill, ance with ion and ions and
ts, and are plication pproval.
C D C O "" o
-*b«—< CD CD _ 2 ,
= T © rt 2. _. | 2a."^to —toto -r*t.1I
m g*rt-» I o • |^3 i •= ° rt | 3 rt zr — - _
•« 3 I CO • CD •
CD
IO

?IV
Oil £ Gas Conservation Division
The Corporation Conmission is charged by statute to prevent waste of Oklahoma's hydrocarbon reserves, protect the environ^ ment from oil and gas-related pollution and preserve the correlative rights of all parties who have the right to benefit from the production and sale of oil and gas.
Administrative and technical phases of this responsibility are handled by the Oil and Gas Conservation Division. During FY86, the division operated at maximum strength of 134 clerical, technical and management specialists--63 in the Oklahoma City headquarters and 71 working in or from district offices at Bristow, King^ fisher, Duncan and Ada.
Charles D . (Jack) Davidson was named director of the Oil and Gas Conservation Division in December 1985. He was select-i d from among more than 100 candidates. Davidson assumed his duties just two
months after retiring from Phillips Petro^ leum Co. as president and general manager of Phillips' Norway Exploration and Pro^ duction Group, the company's North Sea operations group responsible for man^ agement of assets valued at about $7 bil^ lion. Davidson is a graduate of the Uni^ versity of Kansas, with a bachelor's degree in petroleum engineering and geolo^ gy, and the Harvard Business School's Advanced Management Prograa. He worked for Phillips Petroleum 31 years.
New technical capabilities and addi^ tional responsibilities highlighted Oil and Gas Division activities in FY86.
The first two phases of the Veil Data Maintenance System (VDMS), a computerised well information tracking and storage system, went on line in FY86. Those two phases—Surety and Intent-to-Drill— collect and process data concerning pro^ posed wells from application for a drill^ ing permit to spudding.
In March 1986, the division became the Ylahoma-agent for the federal Environmen-al Protection Agency for a survey to locate underground tanks used for storage of petroleum products and other hazardous substances.
The survey wss the first phase of • nationwide EPA program to protect people
-25-
Charles D . Davidson, Director
and the environment from leaking under^ ground tanks. The division also estab^ lished a LUST (Leaking Underground Storage Tanks) unit to work with the EPA on later phases of the federal program..
The Oil and Gas Division has four departments: Administrative, Field Opera^ tions, Pollution Abatement and Technical.
Administrative
The Administrative Department is responsible for document handling and processing, word processing, well records management, public information services and oil a n d gas production records.
The Veil Records Section is the offi^ cial repository for all geographic, geo^ logic, and operational information about all oil and gas wells drilled, produced and abandonded in Oklahoma. The documents are available for public review and are primary research tools for Commission regulatory actions and industry planning of new drilling activities.
Steps were taken in FY66 to improve and enhance public accessibility to oil and gas records. To comply with the Open Records Act, which became effective Nov. 1, 1965, tbe Veil Records Section established a copying station exclusively for making copies of paper records avail^ able for public purchase. In March 19B6, a service window was installed to speed handling of requests for microfilm and •icroficbe records.
Revised Oil and Gas Rules and Regula^ tions were published in January 1986. A charge of $6 per book was established to cover the cost of providing updates when rules are revised. The automatic update system assures that operators will always have current information available on the regulatory requirements of the Corporation Commission.
During FY86, the Veil Records Section processed and filed 9,921 naw records, a decline of 16% from the 11,827 new records in FY85. The decline resulted from a downturn in Oklahoma oil and gas activity.
The Information/Public Interest Sec-
erxx a •£• zz. C D tZ O -*" O 3" P > d*. zr -i I
.-* C D — I
P to rt-2^.'
or_ t>*Z
—<Z~
3 rt C D' -> I
to g - r t » ° * tO to -*>
g3 ° r t 3 I rt zr -• .
C D ZT ^ 3 a co " to \ rt ta i
o o J3 > v
o
'ttY^AiriY
mwmmmmmiiaitrtimmm

r ->•••'$.
A
:
*? •••'
fe.A
WiP
mXXX-
Ib2A..;...~
Bnergeney Team members Totmy Duncan (left) and L. F. Fegal demonstrate life support equipment at a seminar on hydrogen sulfide survival. E-Tecon members are speeially trained field inapeetore who oaaiat low enforcement offioera in oil field BJS em^ ergencies and teach BJS safety.
tion was created in 1981 by the legisla^ ture as the Complaints and Information Departaent t6 serve ss an advoeate for mineral and surface owners In dealings with oil and gas producers and buyers.
Responsibilities have been expanded to Include providing general information on oil and gas aatters by telephone and dis^ tribution of printed materials. The name of this unit was changed in FY66 to pro^ ject a more positive image and reflect a declining number of complaints received.
During FY86, the Information/Public jterest Section handled 10,006 public
contacts, a 26.6% decline from the 13,648 contacts in FY84 and 13,639 contacts in FY85. In response, staffing was reduced froa three to two investigators.
The Oil a n d Gas Production Allowables Section tracks production from approxi^ mately 102,000 oil wells and 25,000 gas wells to assure production does not exceed amounts authorized by the Corporation Commission. During FY86, 54 oil and 792 gas wells were identified as overproduc^ ing, and appropriate actions were taken to bring the wells back into compliance with Commission orders.
Field Operations
The Field Operations Department enforces rules and regulations for oil -ind gas wells and related structures such as reserve pits, disposal wells and pits, tank batteries and piping, a n d the move^ ment and storage or disposal of crude oil, drilling chemicals and salt water.
The downturn in drilling activity not reduce the field inspectors' workload. While drilling decreased, well pluggings and well abandonments increased.
Pollution control was a top priority for field operations personnel in FY86. Inspectors investigated all proposed off-site disposal pit locations, checking for soil type, surface proximity of under^ ground water and the engineering design of fluid disposal ponds. Tbey also monitored operations of licensed pits and investi^ gated pollution problems caused by unplugged abandonded wells, reserve pit cuts, illegal dumping of drilling wastes, oil spills and pipeline leaks.
Field operations inspectors and manag^ ers continued to achieve a high rate of success in resolving complaints and rules violations. Of 138,750 complaints investigated, 110,566 (79.68%) were resolved ia the field. Only 206 com^ plaints required legal action to obtain compliance.
Installation of computers in tbe four district offices gave field person' instant access to intent-to-drill a-surety information.
Field inspectors worked 122,535.5 man hours in FY86. The largest share (27.64%) was spent conducting inspections. The second largest share (14.07Z) was spent
-26-
erxx a m; * z | to tz o o
ta
; o ;
— ao zz ex Z-zt* e > rt-
zr ^ zr C D g - ^ C D
2- to 5 5 -y rtar--
zr ^ 3 to
ta CD
"*»«"'»"»•»•"

rn-
* . . . •
p S i r - S ' * 4 ^ •Bd " » o l v i n * complaints.
w, c l L mS" tad 5 2 - 8 hellcopt" «*•*
Pollution Abatement
The Pollution Abatement Department evaluates environmental pollution situa^ tions and develops recommendations for corrective action. The department also coordinates research toward new techniques for dealing with contemporary oil field pollution problems.
Primary focus is on off-site disposal pits, abandonded oil and gas wells, soil farming and pollution violation enforce^ ment. During FY86, department investiga^ tions led to recommendations for closing one pit and closing or reworking 10 oth^ ers. The department slso developed meth^ ods for improving evaporation in pits in eastern Oklahoma which were plagued by excessive rainfall.
Near the end of FYS6, the Pollution Control Department formulated guidelines for a pilot study of soil farming, a meth^ od of disposing of certain types of drill^ ing fluid wastes by mixing them into soil. The guidelines culminated an 18-month study in cooperation with other Pollution Control Coordinating Board member agencies to evaluate the feasibility of soil farm^ ing. The eventual goal of soil farming research is development of procedures that will allow safe soil farming of wastes *M an alternative to off-site pit disposal.
In addition to dealing with specific pollution issues, the Pollution Abatement Departaent upgraded its off-site pit information inventory to improve tracking o f all p i t s ' operational status a n d prob^ lem history.
The departaent also developed guide^ lines for site suitability, to help avoid location of pits at geologically unstable or otherwise inappropriate sites. Studies also produced recommendations for changes t o strengthen requirements f o r pit permit^ ting, construction, operation, maintenance and closure.
To help reduce processing time and roeedures, an information booklet was
developed for pit permit applicants. Tha booklet describes the permitting process, including information required by the
-27-
Commission, and lists rules tions f o r p i t operations.
Technical
and regula
The Technical Department provides . multitude of engineering and geologies! services.
A aajor Engineering Section activitj in FY86 was processing and making recom^ mendations on a large number of applica^ tions for hardship and distressed gas well status, due to the soft market f o r natural gas. A Commission priority schedule requires that gas purchased from Oklahoma producers be taken first from hardship and distressed wells--wells that would sustain damage if they are not produced.
The Engineering Section also processes applications for commingling of production (producing fluids from more than one for^ mation through a single tubing string) and venting and flaring of natural gas, reviews production information needed to determine if a well should be classified as a gas well or oil well, a n d r e c o m m e n d s amendments to special field rules as safe^ guards to prevent psoduction and pollution problems in individual fields.
The Geology Section investigates all geologic aspects of drilling f o r a n d pro^ ducing oil and gas. This includes screen^ ing drilling permit applications to make sure the proposed drilling plan and loca^ tion aeet state requirements for fresh water and environment protection.
The Geology Section also collects, ebecks and records surface casing, elec^ tric logs and cement bond logs data. The data are monitored to determine compliance with Corporation Commission rules and regulations.
During FY86, the Technical Department began a prehearing screening process for well spacing, location exception and increased density applications.
This allows discovery and resolution of many technical problems prior to hear^ ings, reducing the cost and time of delays required to settle technical disputes after hearings have been conducted.
During FY86, tbe Technical Departaent reviewed 1,560 spacing, 1,650 location exception and 1,098 increased density applications. The review process resulted In disapproval recommendations for 574
5 f»o5 Ss-Sl
rt g co o
erxx a zz-co cz cx <"
fo
*5 S -8 Ico m" « •= » rt g c o o _<,•<- to m
3 rt, «-js-=*
Ico m"If
f3 art,s «s-js.-"=*; | 2. rt to to I
<° g0-rt r gcx"*rt tao z—*3
= ° n -3 rt- zr — to zr m%• 3 a CD to rt ca
to
itKift inmimmmmim
o o >A O IO
PZ

p
t
MTYS-IZ
l
mm
;;.:'W '
_.___i_J
of the 4,308 applications . (13.32%) reviewed.
The Natural Gas Policy Act (NGPA) Section classifies gas wells in Oklahoma according to categories established by the federal Natural Gas Policy Act of 1978. Classification is required to permit oper^ ators to sell nstural gas at price levels established for each of the categories.
Classification applications require froa four months to e i g h t months f o r pro^ cessing due to a backlog of applications and the complex geological and engineering data that aust be evaluated to match each veil's profile against federal NGPA requireaents that define well categories.
Although about 6 0 % of the nation's natural gas supply was deregulated in early 1985, the NGPA Section operated at full capacity in FY66. The NGPA Section received 3,173 classification applications and processed 4,179 spplications. At the end o f the year, approximately 850 filings were awaiting processing with additional applications being received at a rate of about 250 per month.
The Underground Injection Control Section protects underground fresh water supplies by assuring that underground
wells used for disposal of salt water «„H Injection of fluids in enhanced til Td gas recovery projects are constructed H operate properly. a
The UIC Section processes injection «•» •PPlications to determine siti tlit-ability sad well construction require^ aents, a n d recommends issuance o r d e n i a l of permits. During FY86, the UIC r.ce^d « d processed 1,049 applications f " various typ.. of injection wells Hd recommended 915, or 87.2%, f o r p e r m i t t i n g m n Thr ?u *h i°»P«ctions and .testing, the UIC monitors well operation* to l'lTl mechanical integrity i n accord with f « d e " al Environmental Protection Agency stan-*t« Si',?"^?"0? ° f ™d***™™4 fresh
water. Veil monitoring i s done b y O i l a n d Gas Division field inspectors and thro^h
S M S S ? * ' wlth thB 0kl'hOBa D*pa"»««
UIC information files and control procedures are being upgraded in antic^ ipation of increasing injection well activity ., Oklahoma's mJtu™ oil fiSJJ require more and more secondary and ter-IL?7 r " o v , r y work *o produce remaining hydrocarbon reserves. *
erxx CD cz
ta zz t> £T P
OIL t GAS CONSERVATION DIVISION
Deputy Director
ADMINISTRATION
TECHNICAL OPERATIONS POLLUTION ABATEMENT
-28-
o m 3 S, * — — I a —to " " * » I
tO ^ C D l
g-"- to z*'
1 ° ~ 3 3to =rt *5 a3r--mI a «t> OT to I
H
— ;
O © 30 >
o to
^44ms^^M^)ummt,^i,m^temii^^

r
X of Total
erxx a
S.rt» CD ex.
ex. CD
°2 CD a-
m'f>
co O to m
o_
rt C O
p> I S
ZT -•
to CD
Tslaphons
7.262 12,030 11.977 8.742
8,827 13.648 13.639 10,006
7.312 19.204 30.019 12.919 16.837 10.779 7.986

• • • * • II p inny.
f
msy 'Z'X'i iZ.X
& W :
Ivy:
myz-sfiSxii
|jV pS:Xpyy:iZip$A UyyyXziimA
'AVvVv^ySlvpl
Y syxypP:xwk ::'. '• . i- : i- ; - • •'. • 'iTYfyy
fi?7jV"VA YPPrpy.iSYii
^$Ayrzm$xm
wmmmm is&Zxpy -y Yym 'ia^-..:i|7'. •*:-> '.•:,-T-irii ','•',r.rr
AAiAZx$A
isys wry.
'ipfe* V
ATTACHMENT C
TO COMMENT ON
CHAPTER VII - CURRENT REGULATORY PROGRAMS
In addition to State laws a n d regulations governing: 1 ) Reserve P i t
Design, 2 ) Construction and Operation, 3 ) Reserve Pit Closure/Waste
Removal, 4 ) Produced Water Surface Discharge Limits, 5 ) Produced
Water Injection Well Construction, and 6 ) Well Abandonment/Plugging,
the Bureau of Land Management strictly regulates these activities on
federally controlled lands under 30 CFR.
Specific comments include:
California - Table 4, "Produced Water Surface Discharge Limits."
Column titled "Onshore" should be deleted as this is not a
limitation.
Louisiana - Table 2 , "Reserve Pit Closure/Waste Removal." Column
titled "Surface Water Discharge" should include a statement that
"discharges must conform to applicable State and Federal discharge
programs." These programs may require additional limits other than
those stated and this column should incorporate that fact.
New Mexico - Table 5, "Produced Water Injection Well Construction."
Column "MIT Pressure and Duration". Rule 704 states that a minimum
pressure of 300 psi should be used unless an exception is obtained
from the New Mexico Oil and Gas Commission.
Oklahoma - Table 3, "Produced Water Pit Design and Construction."
Column "General Statement of Objective/Purpose" should delete ..."in
addition offsite pits must contain fluids with less than 3,500 ppm
Cl." This should be replaced with "General and Area guidelines
provide specific design and construction limits for commercial and
non-commercial reserve pits."
cr a -zz- z JO m
CD tz o o a £ L ZZ zr - H <° rt S » OI
- j , < < P to m |
I ^ — to -o
S.rt^B'rt; « > g*rt;»
°rtl= ° Z? a \ 3 rt zr — •. CD zr (p 3 \ a co to \ rt ca I
IO o >o
IL—.,.,.

p~
t
xpPSiXyypy^M^ S
ti-V -P: • • - - ••' • • : ' - A ':&i J
iiiiittiis w"w^ • 5 • '- '• ' ^ ' '•'' '*'A
. W$&MMP£WMM
• v'^-y v'^-y
W. Virginia - Table 2 , "Reserve Pit Closure/Waste Removal." Column
"Surface Water Discharge" should include the statement "Permit
Req'd. Discharges unfit for domestic livestock or other general use
prohibited." This is applicable to reserve pits also.
Texas - Table 4 , "Produced Water Surface Discharge Limits" Column
"Coastal/Tidal" should delete ..."but skimming required to prevent
oil in tidal waters." This should be replaced with "discharges must
meet 15 mg/1 Oil and Grease limit."
Ohio - Table 2 , "Reserve Pit Closure/Waste Removal." Column "Land
Disposal/Application" should delete "Drilling fluids may be disposed
of by land application." This should be replaced with "contamina^
tion of the surface of the land is prohibited."
The Column "Road Application" should include "Individual Permit;
Specifications Prescribed in Regulation." Ohio law permits local
Government to allow surface application of brine. "Brine" has a
broad definition and includes drilling fluids'.
Arkansas - Table 1, "Reserve Pit Design, Construction Design and
Operations." Column "General Statement of Obejctive/Purpose" should
delete ..."but regulatory basis and legal enforceability not
supported by (OGC)." This is not correct. The Oil and Gas Commis^
sion (OGC) has authority over the oil a n d gas industry and takes an
active part in enforcing rules and regulations applicable to the O&G
industry. The Department of Pollution Control and Ecology (DPCE)
has authority to enforce environmental laws and regulations. OGC
and DPCE work together to see that the O&G industry is in compli^
ance.
Wyoming - Table 4 , "Produced Water Surface Discharge Limits."
Column "Beneficial Use" should contain "Same As Onshore."
CO erxx a C5D* cto ort. * —~ Zoj
-"_ °,,«r-<•"t~ PSZZ «tCoD° mommm j? 3, rt £ L 1! a — to -•>
Zrtto to ^ t° §* rt C D §-"• to =S ° Zf ^ a 3CD
CO CD
^ i

i&-fsi*$ijj^{yf!!Jiij*^ . ->
igl$&1S!i£ii££}J£&&&2^^ jfe&ii^Sifiasfisaai^*^
. p-.y.-yipr-i^-.s ~]
jfe&ii^Sifiasfisaai^*^ .7.u*rfek: I
CONTAMINATION OF GROUNDWATER FRON RESERVE PITS
EPA CASE
NQ.
EPA N O N N O N PEW)- VIOLATES UNSUB-DAHASE RCRA CURRNT IN6 CURR STAN-
CATAGORY ISSUE PRACTICE CASE RE6S TIATED
MAJOR FACTS
DISPUTED CO. NAME
CONTAIN RESOURCE
ADHIN/
CONTAIN ENFORCE HASTE HENT
ACTION
EPA CASE DESCRIPTION
0H49 PROD NOT LIST GND HTR H U D DAHA6E TO FRESH HATER HELL, INSUFFICIENT DETAIL ON EXACT SOURCE
THE SOURCE OF DANAGE TO THE FRESH HATER HELLS IS UNCERTAIN. IT HAS UNDETERMINED HHETHER DAHAGE HAS RELATED TO DRILLING OR HORE LIKELY FROH HATER ANALYSIS OLD PRODUCTION PITS. THE EPA CONTRACTOR DESCRIPTION OF OPERATIONS LISTS THE CATEGORY A S 'PRODUCTION'. IN ANY CASE, THE CASE IS A VIOLATION OF CURRENT OHIO REGULATIONS RE6ARDIN6 DRILLING HUD AND PRODUCED HATERS. OHIO REGULATIONS FOR DRILLING HUDS: 1) PROHIBIT ESCAPE OF BRINE AND CONTAMINATION OF LAND, SURFACE NATER AND GROUNDWATER 2) REQUIRE LINERS IN HYDR06EOL06IC BASINS (LINERS HOULD BE REQUIRED IN THE AREA OF THIS DAHA6E CASE). ALSO,
OHIO REGULATIONS FOR PRODUCED HATER REQUIRE SURFACE PITS CONTAINING PRODUCED HATER HUST BE LIQUID TIGHT, PRODUCED HATER CANNOT B Y STORED HORE THAN 180 DAYS AND PITS CANNOT B E USED FOR ULTIMATE DISPOSAL.
MI04 PROD/DRLG Y Y NOT LIST GND HTR HUD/PROD PIT H T R THIS CASE OCCURRED IN 1975. SINCE 1975, MICHIGAN HAS ADOPTED REQUIREHENTS (299.1304; 299.1601FF) FOR THE USE OF LINED PITS IS THIS AREA.
1975 CASE DEALING HITH UNLINED PITS CURRENTLY BANNED
OKOB DRLG Y HI-HISC GND/SURF H U D Y HTR i SOIL
IN THIS CASE, EPA'S CONTRACTOR INCLUDED STATE COHHENTS HHICH UNDERLINE THE FACT THAT THE OCC ACTED ON A COMPLAINT BY A LANDONNER AND DIRECTED THE OPERATOR TO REMOVE THE CONTENTS OF A PIT THAT VIOLATED OCC RULES B Y CONSTRUCTION O F THE PIT I N A FRACTURED SHALE. FURTHERMORE, THE OCC I S IN THE PROCESS OF DEVELOPING ADDITIONAL REGULATION TO PREVENT THE LEACHIN6 OF HIGH SALT HUDS INTO GRPUNDHATER.
IN ADDITION, COLUMN TESTS CONDUCTED IN THE API PRODUCTION HASTE STUDY AS HELL AS RESEARCH CONDUCTED BY DR. L. CANTER OF THE UNIV. OF OKLAHOMA ENVIRONMENTAL DEPARTMENT PRESENTED A T THE 1986 DRILLING MUD SYSPOSIUH I N NORHAN OKLAHOMA CONCLUDE THAT METALS OF CONCERN ARE VERY TISHTLY HEALD I N DRILLING MUDS BENTONITE CLAY MOLECULAR STRUCTURE AND THERE I S N O D A T A TD SUPPORT POLLUTION MIGRATION O F BARIUH, CHROMIUH O R ARSENIC.
LEAKING PIT IN VIOLATION OF OCC RULES ORDERED CLOSED
130 vaoo paui|y. Bui.aq
;uauunoop a q ; jo ityj-enb aq; o ; anp s; ;J 'ao^ou siq; u-eq; j-eap ssa| s;
36BUII ui|!i aq; i\ :30ilON

KS05
V NOT LIST SURF/GND H U D HTR 4 SOIL
API COMMENTS IN EPA'S DOCKET INDICATE NO DAMAGE HAS BEEN DOCUMENTED FROM THIS CASE. EPA'S CONTRACTOR I S REPORTING ON A CASE HHERE THE ONLY DATA SOURCE USED I S THE PLAINTIFFS ATTORNEY I N A PENDING LAN SUIT I N CIVIL COURT FOR DAMAGES. API'S COMMENTS HHICH HERE REJECTED FOR A LACK OF DOCUMENTATION HERE OBTAINED FROH THE OKLAHOMA CORPORATION COMMISSION AND THE DEFENDANT'S ATTORNEY. API IS CONCERNED THAT EPA'S CONTRACTOR MAY BE USIN6 A DIFFERENT STANDARD FOR DOCUMENTATION FOR THEIR INFORMATION THAN API'S. THIS CASE IS AN EXAHPLE OF DIFFICULTIES USING DATA FROM PENDING LAN SUITS HHERE FACTS HAVE YET TO BE EVALUATED AND JUDGEMENTS HADE BY THE COURT.
NEVERTHELESS, OKLAHOMA HAS PERFORMANCE STANDARDS PROHIBITING LEAKAGE OF RESERVE PITS INTO GROUNDWATER (SEE 0KO8 COHKENTS FOR ADDITIONAL DETAILS)
1973 CLOSED DRILLING PIT ALLEGEDLY SEEPING INTO SURF HTR., CASE PEND1N6
DRLG NOT LIST GRN HTR SALT HTR Y UNLINED DRILLIN6 PIT THOUBHT TO BE LEACHING SALT INTO FRESHHATER HELL
KDHE AND KCC HAVE SUBHITTED COHHENTS IN EPA'S DOCKET SUBSTANTIATING THAT THE POLLUTION SOURCE HAS NOT THE REFERENCED DRILLING RESERVE PIT. EPA'S CONTRACTOR DISPUTES THE STATE AGENCY FACTS DESPITE EXTENSIVE INVESTIGATION INTO THIS INCIDENT BY THO STATE A6ENCIES.
NEVERTHELESS, KANSAS ISSUED 'LEASE MAINTENANCE' RULES ON MAY 13, 1987 THAT SHOULD SERVE TO PREVENT THIS TYPE DAMAGE. THE RULES REQUIRE PERMITS FOR ALL PITS (DRILLINS AND PRODUCING), EMPTYIN6 OF EMERGENCY PITS HITHIN 48 HOURS, NOTIFICATION OF SPILLS WITHIN 24 HOURS AND SPECIFIC PENALTIES APPLICABLE FOR EACH VIOLATION. IN ADDITION, KCC HAS AUTHORITY TO SHUTDOHN AN OPERATOR TO ENFORCE ITS REGULATIONS.
ijlrfiiYj-l'iim^t^wft^
/ L C I /_ /_/ C I
i 30 vaoo pawiij. 6ujaq
;uawnoop aq; ^o £;i|Bnb aq; o; anp s| ;; 'ao;;ou sjq; ueq; .reap ssa| si
a6BUji W|!j. aq; j] -30UON

•ftU.^AS
" - W ^T^WT^: W V - * ~ ' < " - *-' , x -l a
ii^-sS*(-MM»gSBiHM*>t^i*.^ vt.jigj*^**^' '
~]
SURFACE DAMAGE RELATED TO LANDSPREADING OF RESERVE PIT CONTENTS
EPA E P A N O N N O N PEND- VIOLATES UNSUB- MAJOR CASE DAMAGE RCRA CURRNT IN6 CURR STAN- FACTS NO. CATAGORY ISSUE PRACTICE CASE REGS TIATED DISPUTED
ADMIN/ CONTAIN CONTAIN ENFORCE-
CO. RESOURCE HASTE HENT NAME ACTION
HV13 DRLG TOHER DRL6 SOIL
EPA CASE DESCRIPTION
LANDFARMING OF DRILLING MUDS DAMAGED VEGETATION FROM SALT CONTENT
THIS CASE DOES NOT DEHONSTRATE A NEED FOR ADDITIONAL REGULATION
THE CASE I S I N ERROR RE6ARDING STATE REGULATIONS ON ALLOHABLE LANDSPREADING
SINCE THIS INCIDENT ADDITIONAL REGULATIONS HAVE BEEN PROMULGATED LIMITING CHLORIDES LANDSPREAD TO 12,500 PPH N O DISCHARGES OVER 25,000 6ALL0NS PER ACRE AND NO CHLORIDE LOADINGS OVER 600 LB PER ACRE. ' HVDNR COMMENTS TO EPA'S INTERIM REPORT PROVIDE ADDITIONAL DOCUMENTATION AND STATE DAMAGE FROM THIS 1986 INCIDENT HAS SHORT TERM AND HAS FULLY RECOVERED.
mas^'imtmimis^-P.vSL^/•:•<. ;yri
IO L C I j /_/ U C I
SKS*^*'1
vzo vaoo pauj|jj. 6ujaq
;uauinoop aq; jo A;j|Bnb a q ; o ; anp SJ ;; 'aoj;ou siq; UBq; .reap sse| SI.
aSBuij UijiJ. aq; <M :30I10N
M M M

«•. i • -i—
f, ->tf %. , \ "'•* " - ^*>w yw t/f->*Cv - * -, ~ " -.
•vi*- jr- yyyZ ~yx x , "* r -. ^i
AA*i " f " r^-W-* V **.5s* i
fe^8^^»8^^ftma<l-MiM*-a»- i ^ l ^ ^ g r ^ ^ < ^ ^ J . ! » ^ S « & » ^ 1 ^ ^ V S f * a r ^ t - - , r ^ y ^n
^
LA20
ALLOHABLE DISCHARGE OF DRILLING MUD INTO 6ULF COAST ESTUARIES
EPA E P A N O N N O N PEND- VIOLATES UNSUB- HAJOR CASE DAHAGE RCRA CURRNT IN6 CURR STAN- FACTS NO. CATAGORY ISSUE PRACTICE CASE REGS TIATED DISPUTED
ADMIN/ CONTAIN CONTAIN ENFORCE-
CD. RESOURCE HASTE NENT NAME ACTION
EPA CASE DESCRIPTION
DISCHARGE Y HOODS PET SURF HTR H U D PERMITTED DISCHARGE OF MUD THAT STATE ORDERED STOPPED
THIS CASE DOES NOT DEMONSTRATE A NEED FOR ADDITIONAL REGULATION AND CONTAINS SEVERAL ERRORS. THE DISCHARGE FROM THIS 1985 DRILLING OPERATION HAS INITIALLY AUTHORIZED BY THE HPCD.
UPON ADDITIONAL STUDY, THE HPCD ORDERED THE DISCHARGE DISCONTINUED DUE TO ITS PROXIMITY TO
OYSTER BEDS. THE STATE FILE CONTAINS NO INFORMATION ON DAHAGE TO THE OYSTERS OR BIOACCUHULATION. THE STATEMENTS ABOUT MUDS CONTAINING HIGH LEVELS OF TOXICS IS UNSUBSTANTIATED. SINCE 1985, LOUISIANA HAS ADOPTED ADDITIONAL REGULATIONS CONTROLLING DISCHARGES INTO INLAND AND COASTAL HATERS UTILIZING INDIVIDUAL PERMITS. IN ADDITION, OPERATORS ARE NOT ALLOHED TO DISCHAR6E WITHIN 1300 FEET OF OYSTER BEDS.
THE CASE SHOULD REFLECT STATE ACTION (PERHITS) ARE REQUIRED TO DISCHAR6E AND NOT TO CEASE DISCHARGES ADDITIONAL DOCUHENTATION HAY BE FOUND IN STATE FILE NO. 6P00249A
IVZO^UQO pauiUj. 6u;aq
;uauinoop aq; jo X;i|Bnb aq; o; anp si ;j *aoj;ou siq; UBq; .reap ssa| SI
a 6 B U i ! mm aq; j | :3QU0N

r
j?^3*^ii^-fejgS'»&-^^ * '^^ *-i*^lr^z± * » * - W ^ « f r W ~ ~ - - * * * £ W rS - ' =>'
•.•*•.. - . ^A.3rf
DAHAGE FROH ARTIC NORTH SLOPE DRILLING RESERVE PITS
EPA E P A N O N N O N FEND- VIOLATES UNSUB- HAJOR CASE DAMAGE RCRA CURRNT I N G CURR STAN- FACTS NO. CATAGORY ISSUE PRACTICE CASE RE6S TIATED DISPUTED
CO. NAME
CONTAIN RESOURCE
ADMIN/ CONTAIN ENFORCE HASTE HENT
ACTION
EPA CASE DESCRIPTION
AK06
AK07
AK08
DISCH/PIT N/S OPERATORS SURF HTR H U D DRAFT STUDY OF PERHITTED DISCHARGES
AK06 IS A REPORT ON CONCERNS RAISED B Y STUDIES CONDUCTED ON RELEASES FROH RESERVE PITS. THE REPORT HAS CRITICIZED FOR LACK OF TECHNICAL SOUNDNESS AND FHS HILL NOT RELEASE A FINAL STUDY
FOR REVIEH TO EITHER THE STATE OR INDUSTRY. THEREFORE, IT IS IHPROPER TO CHARACTERIZE THE STUDY DRAFT FINDINGS AS 'DAHAGES'. IT SHOULD ALSO BE NOTED THAT ALASKA DELIBERATED OVER THE
ALLOHABLE DISCHAR6E LIHITS FOR THE CONTAHINANTS OF CONCERN (EG METALS). PUBLIC HEARINGS HERE CONDUCTED. AS A RESULT, THE ALASKA DEPARTMENT OF ENVIRONMENTAL CONSERVATION (ADEC) BELIEVES THAT THE PERMITTED DISCHARGES TO THE TUNDRA DO NOT POSE A THREAT TO HUHAN HEALTH OR THE ENVIRONMENT.
DISCH/PIT N/S OPERATORS SURF HTR MUD STUDY OF RESERVE PIT FLUID TOXICITY ON DAPHNIA
AK07 IS ALSO A FISH AND WILDLIFE STUDY THAT DRAH5 UNSUBSTANTIATED CONCLUSIONS. REPORT
FINDINGS SUBSTANTIATED ONLY THAT RESERVE PITS AND ARCTIC PONDS DIFFER IN ABILITY TO SUPPORT DAPHNIA POPULATIONS. DAPHNIA ARE A SPECIES BEIN6 CONSIDERED FOR USE A S A TOXICITY INDICATOR. SEE ALSO COMHENTS ON AK06 REGARDIN6 TUNDRA DISCHARGES.
DISCH/PIT N/S OPERATORS SURF HTR H U D STUDY OF EFFECT OF DRILLING FLUIDS ON FISH AND HATERFOHL HABITAT
AK08, LIKE AK06 AND AK07 SHOULD NOT BE CHARACTERIZED A S A DAHA6E CASE. I T DOES NOT ESTABLISH A LINK BETHEEN ELEVATED LEVELS OF 0R6ANIC OR INORGANIC CDHP0UND5 IN PONDS AND LOHER PRODUCTIVITY OF THOSE PONDS. FURTHER, THE STUDY IGNORES THE FACT THAT RESERVE PIT DISCHARGES ARE PROHIBITED HITHIN ONE YEAR OF THE LAST PIT USA6E AND THAT NATURAL RUNOFF DURING THE SPRING THAN EFFECTIVELY "FLUSHES" THE TUNDRA AND HOULD
PREVENT THE ACCUHULATION OF ORGANIC/INORGANIC COHPOUNDS IN TUNDRA PONDS. SEE ALSO COHHENTS ON AK06 RE6ARDIN6 RUNDRA DISCHARGES.
AK12 DISCH/PIT Y Y US 60VERNHENT HTR/SOIL H U D AK12 IS AN NPRA RESERVE PIT WHICH FAILED AFTER OPERATIONS CEASED. PAST US GOVERNMENT DRILLING PRACTICES IN THE NPRA HERE TO LEAVE RESERVE PITS FOR EXPLORATION HELLS OPEN INDEFININITELY. HOHEVER, CURRENT REGULATIONS REQUIRE THAT DRILLING PITS BE CLOSED HITHIN ONE YEAR FROH THE CESSATION OF OPERATIONS. IT SHOULD ALSO BE NOTED THAT HELL SITE PLANTS HERE GROWING VIGOROUSLY BY THE TIME THE SITE ASSESSMENT WAS COMPLETED IN 1984.
NPRA RESERVE PIT FAILURE DUE TO PAST US GOVERNMENT DRILLING PRACTICES
LZQ VU90 pauim 6ujaq
;uauinoop a q ; jo A;;|-enb aq; o ; anp si ; ; 'aoj;ou sjq; UBq; JBS|O ssa| S;
36BUIJ U J I J J . a q ; }\ :3Q|10N

****- " >•* * , "' •"'-' Yx&Px A * - y jr o " > > . ' " ' - * , * - » * • ' - - ", - I . \ ,->•-? j->i v n
DAMAGE RELATED TO ALASKA DRILLING IN THE KENAI AREA
EPA E P A N O N N O N PEND- VIOLATES UNSUB-CASE DAHAGE RCRA CURRNT I N G CURR STAN-NO. CATA60RY ISSUE PRACTICE CASE REGS HATED
MAJOR FACTS
DISPUTED CO. NAHE
CONTAIN RESOURCE
ADMIN/ CONTAIN ENFORCE-HASTE HENT
ACTION
EPA CASE DESCRIPTION
HTR/SOIL MUD/SN Y AK01 6RAVEL Y Y Y Y UNION PIT THIS CASE INVOLVES DISPOSAL OF SPOIL MATERIAL WHICH WAS UNREGULATED PRIOR TO 1972. NO EVIDENCE OF GROUNDWATER CONTAHINATION WAS EVER FOUND. CLAIMED HEALTH EFFECTS BY NEIGHBORING RESIDENTS ARE ALL BY INDIVIDUALS RESIDING UP THE GROUNDWATER 6RADIENT OF THE GRAVEL PIT AND WHOSE HELL NATER HAS NEVER SHOWN ANY SIGN OF CONTAHINATION. CURRENT REGULATIONS PROHIBIT DUMPING ON THIS SITE. GENERAL REGULATORY REQUIREMENTS ARE COVERED IN ADEC REGULATION 18 AAC 60.520.
UNION WAS ORDERED TO CLEAN UP A DUMP SITE
AK03 COMMERCIAL Y Y MAR ENTERPRISE GND HTR HUD/PROD COHPANY WASTE THE IHPACT IN THIS CASE IS NOT DUE TO DRILLING ACTIVITY BUT RATHER OF IHPROPER HANDLING BY AN INDEPENDENT COHHERCIAL WASTE DISPOSAL OPERATOR. ACTIVITY AT THE SITE IS LLLE6AL PER ADEC REGULATION 18 AAC 60.3106 WHICH REQUIRES QUARTERLY REP0RTIN6 AND GROUNDWATER MONITORING PR06RAHS.
ALLEGED PERMIT VIOLATIONS AT STATE PERMITTED DISPOSAL SITE
IZOJtUDQ pauilli 6u;aq
;uaiunoop aq; 40 A;i|-enb aq; 0; anp s| ;J -90i;ou sjq; UBq; j-eap ssa| si
86BU1! UJ|!i m i\ :30I10N

m
* \*a \ y ( - ^
; u w ^<>* * -< * •
J* -^-- „* *W l i* ,
**ffiw-igMir|j&^^ ^-"v^^mas^y-A^^^ ' -
\
\x *S£4xAmx AA^~y~,AZA Z K Y , - ' - , . _ , -
ILLEGAL DISPOSAL IN PRODUCTION OPERATIONS
EPA E P A N O N N O N PEND- VIOLATES UNSUB- HAJOR CASE DAMAGE RCRA CURRNT I N G CURR STAN- FACTS C O . NO. CATA60RY ISSUE PRACTICE CASE REGS TIATED DISPUTED NAME
CONTAIN RESOURCE
ADMIN/ CONTAIN ENFORCE-WASTE NENT
ACTION
EPA CASE DESCRIPTION
LA45 DISCHARGE Y KEDCO OIL SURF/GND PROD WTR Y
HTR & SOIL THE OPERATOR OF A PRODUCTION FACILITY INSTALLED A PIPE AND DISCHARGED PRODUCED HATER INTO A FRESHWATER SHAHP WITHOUT A PERMIT. THIS VIOLATES STATE AND FEDERAL REGULATIONS. THE STATE A6ENCY INSPECTED THE SITE AFTER COMPLAINTS AND ISSUED KEDCO A NOTICE OF VIOLATION. T H E OPERATOR HAS FINED $ 9,500.
ILLEGAL DISCHARGE OF PRODUCED HATER TO FRESHWATER SWAMP
LA64 PROD SOIL PROD WTR ALLEGED IHPROPER SALTWATER DISPOSAL
THIS CASE ALLEGES THAT THE OPERATOR PURPOSELY DISCHARGED SALTWATER ON AN ADJACENT CANE FIELD CAUSING SEVERE DAHAGE TO THE CROP. THE FACT IS AN ACCIDENTAL LEAK OCCURRED AT THE FACILITY WHICH CAUSED THE PROBLEH. THE OPERATOR HIRED A CONSULTANT TO DEVELOP A PLAN TO RECLAIM THE
LAND, BUT THE FARMER WOULD NOT COOPERATE. THE FARMER WANTED DAHA6ES AND WOULD WOT ALLOW THE OPERATOR TO RECLAIM THE SITE. THIS CASE SHOULD NOT BE USED IN THIS CATEGORY.
LA90 COMMERCIAL Y Y Y Y CHEVCO/KENGO SURF/6ND HASH HTR
SITE WTR t SOIL THIS CASE ALLEGES THAT THE OPERATOR PURPOSELY DISCHARGED WASH WATER INTO A ROADSIDE DITCH LEADIN6 TO A COULEE IN VIOLATION OF STATE LANS AND REGULATIONS. NEARLY ALL OF THE CASE DESCRIPTION OF THREATS TO HEALTH AND THE ENVIRONMENT ARE NOT DOCUMENTED IN STATE FILES. I N FACT, THE STATE AGENCY FELT THAT THE DISCHARGE HAS AN ACCIDENT AND NOT ILLEGAL DUMPING. T H E STATE DID NOT ISSUE A NOTICE OF VIOLATION. THIS CASE SHOULD BE REMOVED FROH THIS CATEGORY BECAUSE 1) THE OPERATOR DID NOT PURPOSELY DISCHARGE AND 2) THE FACTS IN THE CASE ARE SUSPECT.
NEVERTHELESS, LOUISIANA REGULATIONS PROHIBITS THE ALLEGED TYPE OF DISCHARGE.
IT SHOULD BE FURTHER NOTED, THE PLANTIFF'S ATTORNEY STATED 5/22/B7 THAT THIS CASE IS CURRENTLY IN LITIGATION AND HAS NOT BEEN SETTLED OUT OF COURT AS DESCRIBED IN EPA'S CONTRACTOR REPORT.
ALLEGED DISCHAR6E OF VACUUM TRUCK HASH HATER TO COULEE
I .Z O vuoo pauiljj. Buiaq
;uauinoop aq ; jo A ; i |B n b aq; o; anp SJ ;i 'aoj;ou s i q ; UBq; JB9|O s s a | S;
aBBUij uj|!j. aq; j j :30H0N

•ahj-* . "*** " J . '~^-*2f rt*1-_%• TT^*" i - t , J_ ? r-'"*> - " " j - * v - - * * • * • — - v ~^ * * •**• — " * "
< - 3 % & * - * * « - *. '*>« >=V ' ^ > F • ; * • > • - , • - *- . - -
*• " A , , " **< ' . £ , ' - - -v- - - * 5-- r,r , - Yz~i&f*Y -*-*i. * • -
•ahj-fc t w » y y y % ^
Uh-.i.' DI3C.Hi-.hbE Y EQUITY SURF HTR PROD HTR Y
THIS IS AN ILLEGAL DISCHAR6E THAT VIOLATED OHIO REGULATIONS. OPERATOR HAS CITED AND CEASED PRACTICE.
ILLEGAL DISCHARGE OF PRODUCED WATER
0H!2 DISCHARGE Y y ZENITH SURF/GND PROD HTR Y
HTR t SOIL
THIS I S A N ILLEGAL DISCHARGE THAT VIOLATED OHIO REGULATIONS. OPERATOR HAS CITED AND FINED.
ADDITIONAL RULE MAKING SINCE INCIDENT - SB 501 - PROHIBITS PRODUCED HATER DISPOSAL PITS AFTER 7/1/86
ILLEGAL PIT DISCHARGING PRODUCED HATER TO SURFACE DITCH
0H45 DUMP Y MILLER S&6 SURF/GND MUD/PROD WTR 1 SOILHTR
THIS CASE ALLEGES THAT AN ACTIVE SAND AND GRAVEL PIT HAS USED AS AN ILLEGAL DUMPING SITE FOR O I L F i a D HASTE AN INVESTIGATION BY THE OHIO DIVISION OF HASTEWATER POLLUTION SHOWED THAT CONTAMINATION OF THE SURROUNDING SWAMP WAS 0CCUR1NG. THIS DISCHARGE IS PROHIBITED BY STATE REGULATIONS. ADDITIONAL REGULATIONS HOWEVER COULD NOT PREVENT THIS TYPE O F IHPROPER ACTION.
SAND AND GRAVEL PIT USED ILLEGALLY TO DUHP WASTE
AR07 OIL SPILL
THIS I S A NON-RCRA OIL SPILL INCIDENT RATHER THAN ILLEGAL DUMPING OF SUCH SPILLS.
J LANGLELY SURF/GND PROD WTR/ WTR t SOIL OIL
ARKANSAS REQUIRES REPORTING
OIL SPILL ILLEGALLY NOT REPORTED THAT DAMAGED ADJACENT PROPERTY
flRM PR0I> Y J. ROBERTSON SURF/GND PROD WTR Y
HTR i SOIL THIS DAMAGE CASE DESCRIBES VIOLATIONS OF DRILLING PERMIS ISSUED TO THE OPERATOR. IT APPEARS THE OPERATOR CONSTRUCTED ILLEGAL ROADS, PITS AND WELL LOCATIONS IN VIOLATION OF PERMIT CONDITIONS. AS A RESULT, DESTRUCTION OF WETLANDS RESULTED. THE DAMAGE CASE ALSO ALLEGES THAT THE REGULATORY AGENCIES IN ARKANSAS LACK AUTHORITY TO PREVENT FURTHER CAMAGES AND ILLEGAL OPERATIONS BY THE OPERATOR. THIS IS NOT THE CASE AND THE ARKANSAS WATER AND AIR POLLUTION ACT GIVES AUTHORITY AT SEVERAL LEVELS TO REQUIRE CLEANUP OF THESE ILLEGAL ACTIVITIES AND TO PREVENT FUTURE OCCURRENCES
ILLEGAL DISCHARGE OF PRODUCED HATER TO BLACK CREEK
vzo vuoo pawijj. 6uiaq
;uauinoop aq; 40 A;i|Bnb aq; 0; anp sj ;i 'aoj;ou s i q ; U B q ; JB9|D s s a | S I
aBBUij mjij. aq; }\ :3QH0N

~i
Js^^a^ »w.*' \,'.^ -& £ g ^ j i ^ ^ ^ <£•£•£?&-•&
»w.*' \,'.^ -:i'^^l <£•£•£?&-•&
TX21
TX22
HY03
HY05
HVlfl
DRLG ESENJAY SURF HTR H U D ILLEGAL DISCHARGE OF MUD RESULTED IN OPERATOR FINE AND CLEANING SITE
THIS CASE STATES THAT THE OPERATOR BREACHED A DRILLING PIT DIKE ALLOHING MUD TO DISCHARGE INTO HARDY SANDY CREEK. THIS DISCHARGE TO WATERS OF THE UNITED STATES WAS ILLEGAL AND THE TEXAS RAILROAD COMMISSION FINED THE OPERATOR $ 10,000. ADDITIONAL REGULATIONS WOULD NOT HAVE PREVENTED THIS POLLUTION INCIDENT.
DRLG TXO PROD SURF WTR H U D Y SURFACE DISCHARGE OF DRILLING HUD, OPERATOR FINED
THIS CASE ALLE6ES THAT THE OPERATOR BROKE A DRILLING PIT DIKE AND ALLOWED DRILLING FLUIDS TO FLOW OFFSITE INTO A STOCK TANK. AS A RESULT, FISH I N THE TANK WERE KILLED. THE CASE ALLEGES THE FISH FATALITIES WERE CAUSED BY HIGH LEVELS OF METAL IN THE HUD, HOWEVER, THIS REPORT IS SPECULATIVE AS LAB RESULTS SHOWED LOW HETAL CONCENTRATIONS IN THE HATER. LABORATORY TESTS SUGGEST OXYGEN DEPLETION HAS THE HOST LIKELY CAUSE. IN ADDITION, EXTREHELY COLD HEATHER OCCURRED DURING THIS TIME THAT COULD HAVE COHPUNDED OR EVEN CAUSED THE PROBLEM. THIS TYPE POLLUTION INCIDENT IS ADDRESSED BY TEXAS REGULATIONS AS THE OPERATOR HAS FINED AND THE LANDOHNER COMPENSATED FOR DAHA6ES.
PROD Y ALTEX OIL SURF/6ND PROD WTR Y HTR I SOIL
ALTEX OIL PURCHASED THE PROPERTY IN THIS CASE IN 1984 AND UPON INSPECTION OF THE FACILITIES FOLLOWING A COMPLAINT TO THE STATE CEASED SURFACE DISCHAR6E OF PRODUCED WATER WHICH WAS IN VIOLATION OF STATE REGULATIONS.
ILLE6AL DISCHAR6E OF PRODUCED WATERS
PROD MARATHON SURF/GND CHEMICAL Y HTR t SOIL
THIS CASE STATES THAT THE OPERATOR DURIN6 CLEANUP OF A DRUM STORAGE AREA PUNCTURED DRUHS AND ALLOHED CHEHICALS TO DRAIN TO A DITCH. THE CASE DESCRIPTION IS INCORRECT. THE OPERATOR THINKING THAT THE DRUMS HAD TO BE COMPLETELY EMPTY BEFORE TRANSPORTING THEM OFFSITE TURNED THE DRUHS UPSIDE DOHN AND DRAINED APPROXIHATELY 420 6ALL0NH INTO THE DITCH. HOWEVER, THE EHPTYINS OF CHEHICAL INTO A DITCH HAS ILLEGAL. I N ADDITION I T HAS DISCOVERED THAT THO TRANSFORMERS HERE LEAKING PCB CONTAMINATED TRANSFORMER OIL AT THE SITE. THE CHEMICALS AND PCD CONTAMINATED OILS HERE REHOVED AND THE HASTE SOIL DISPOSED AT A LICENSED DISPOSAL FACILITY. GROUNDWATER MONITORING NELLS SHOHED NO CONTAHINATION OCCURRED. THE OPERATOR HAS ASSESSED A FINE FOR VIOLATIONS OF STATE REGULATIONS. ADDITIONAL REGULATIONS WOULD NOT PREVENT THIS TYPE POLLUTION INCIDENT.
ILLE6AL DISCHARGE OF CHEMICALS
DISCHARGE Y Y Y ALLEGHANY HURF/GND PROD HTR Y LANDS HTR 4 SOIL
THE OPERATOR DISCHARED OILFIELD HASTES FROM DRILLING PITS INTO A DITCH RUNNING I N T O BEVERLIN FORK. THE OPERATOR ALLOHED THE LANDOWNER'S LIVESTOCK TO DRINK FROH THE PITS. THE REPORT STATES
ILLEGAL HASTE DISCHARGE INTO BEVERLIN FORK
VZO V H 9 0 pauuijj. Bujaq
;uauinoop aq; jo X;||Bnb aq; o; anp s i ;J '9OI;OU
siq; UBq; JB9|o ssa| s; aBBuii UJIIJ. a q ; 4 1 -3OLLON

*•. • •
m i'li'-iPlpllifj^^
igii^i^^f^ii^fea^ '
LA15
AR10
WV20
PA09
THAT THE LIVESTOCK WERE POISONED CAUSIN6 NUMEROUS PROBLEMS INCLUDING DEATH. THIS WAS A PRACTICE BEGUN IN 1979 WITH THE CONSENT OF BOTH THE LANDOHNER AND OPERATOR. THIS CASE
CENTERS AROUND THE SUITABILITY OF THE LIQUIDS FOR LIVESTOCK CONSUMPTION, NOT DISCHARGE OFFSITE TO HATERS OF THE U S. OR LEACHING TO GROUNDWATER. HOWEVER, STATE REGULATIONS ARE IN PLACE FOR DISCHARGES TO THE SURFACE OR GROUNDWATER. THE OPERATOR PAID A * 39,000 FINE PLUS
INTEREST AND COSTS. SUFFICIENT REGULATIONS ARE IN PLACE TO DEAL WITH THESE TYPE OCCURRENCES.
PROD SUN SURF WTR HUD/OIL Y ILLEGAL DISCHARGE OF PRODUCED WATER INTO FRESHWATER MARSH
THIS CASE STATES THE OPERATOR DISCHARGED SALTWATER INTO THE ADJACENT HARSH FROH A FACILITY PIT AND TANK BATTERY RING LEVEE. THE DISCHARGE FROH THE RING LEVEE WOULD BE LEGAL IF USED UNDER SPCC PLANS. HOHEVER, SALT WATER CANNOT BE DRAINED FROH RING LEVEES UNDER SPCC PLANS AND THEREFORE THIS WAS A VIOLATION AND A NOTICE OF VIOLATION HAS ISSUED AND THE PROBLEH CORRECTED.
DISCHARGE J.BEEBE SURF/6ND PROD HTR Y HTR i SOIL
THIS CASE STATES THAT SALTHATER HAS DISCHARGED FROM A SALTHATER DISPOSAL WELL INTO SHACKOVER CREEK THIS DISCHAR6E WAS CORRECTED BY THE OPERATOR BUT A LATER INVESTIGATION FOUND THAT ADDITIONAL DISCHARGES WERE C0MIN6 FORM FACILITY PITS. TWO PITS WERE DISCHARGING IN VIOLATION OF ARKANSAS REGULATIONS. A NOTICE OF VIOLATION WAS ISSUED BY THE ADPC AND CIVIL PENALTY ASSESSED.
USE OF ILLEGAL SALTWATER PITS FLOWING INTO SHACKOVER CREEK
DISCHARGE HARRIETTA ROY SURF HTR H U D ILLEGAL DISCHARGE OF DRILLING HUD TO STILLWELL CREEK
THE OPERATOR WILLFULLY SYPHONED FLUIDS FROH THE DRILLING PIT INTO STILLWELL CREEK WITHOUT A PERHIT. THIS DISCHARGE I N TO THE CREEK WAS A DIRECT VIOLATION OF WEST VIRGINIA CODE 20-5A-19A AND THE OPERATOR HAS FINED.
PROD NOT LIST SURF/6ND HUD/PROD Y HTR i SOILHTR/OIL
THIS CASE REPRESENTS THE OLDEST COMMERCIAL OIL PRODUCING REGION IN THE WORLD. CHRONIC LOW LEVEL RELEASES HAVE OCCURRED IN THIS AREA FOR YEARS. THESE DISCHARGES SHOULD NOT BE CHARACTERIZED AS ILLEGAL DUMPING BECAUSE THE LEAKS OCCUR AS A RESULT OF OLD, PAST PRACTICES AND NOT BECAUSE OF DUMPING BY IRRESPOSIBLE OPERATORS. CURRENTLY, LEAKS INTO STREAMS ARE PROHIBITED BY STATE AMD FEDERAL REGULATIONS AND THESE AGENCIES ARE ENFORCING THEIR REGULATIONS. IN ADDITION, IF DISCHARGES OF OIL ARE PURPOSEFULLY OCCURRING THESE ARE REGULATED BY EPA'S SPCC REGULATIONS UNDER THE CLEAN HATER ACT. ENFORCEMENT OF VIOLATIONS IS THE RESPONSIBILITY OF THE U.S. COAST GUARD WHO HUST CORRECT AND LEVY FINES FOR VIOLATIONS.
DAHAGE FROM OLD PRACTICES AND SPILLS
izo vaoo pauuijj. Buiaq
;uauinoop a q ; jo *;i|Bnb a q ; o ; anp si ; ; *90i;ou sjq; UBq; JB9|O ssa| s;
36BUIJ UJHJ. a q ; j | : 3 0 U 0 N

m. i • •
-*>— I- ~~~-*»~n»«^»Jlfr;*&"Sl*
iy*jg*^*^y^^
- ~«. w-* - L *%&^*t t - . * - - i , ' ^ W W . ^ W ^ A ^ ., • ' . v
. - -i < * ^ 4 — - >** - A -. j — _ A ] *• ~ - . " " - 7* - j J-r X ' P l - f C \ * . . - t . , "- - - \ j. j
r — W -m AASZ^A. I, .ICawV ^ / C f . , U * „ "f-~* " T
~i
PRODUCED WATER AND OIL FIELD WASTE PIT CONTENTS LEACHING INTO GROUND NATER
EPA E P A N O N N O N PEND- VIOLATES UNSUB- HAJOR CASE DAHA6E RCRA CURRNT I N G CURR STAN- FACTS NO. CATAGORY ISSUE PRACTICE CASE REGS TIATED DISPUTED
NN02
NH05
LA67
CO. NAME
CONTAIN RESOURCE
ADHIN/ CONTAIN ENFORCE WASTE HENT
ACTION
EPA CASE DESCRIPTION
PROD STUDY NONE NONE STUDY ON USE OF SHALL SH PITS BANNED IN 1985 IN THE SAN JUAN BASIN
THE EPA CONTRACTOR HRITEUP OF THIS CASE IS ERRONEOUS. NO VIOLATION OF STATE 6R0UNDNATER STANDARDS HERE FOUND (SEE API AND NEH MEXICO COHHENTS IN DOCKET). IN ADDITION, PRESENT REGULATIONS REQUIRE DISPOSAL PITS TO BE PERMITTED AND LIMITED TO 5 BARRELS A DAY IN THE SAN JUAN BASIN AREA OF NEH MEXICO. FURTHER, THE STATEMENT THERE ARE OVER 20,000 UNLINED PRODUCED HATER DISPOSAL PITS IN NEH MEXICO HAS BEEN REFUTED IN IN A JUNE 15, 1987 LETTER FROM GOVERNOR CARRUTHERS TO J. WINSTON PORTER. GOVERNOR CARRUTHERS IN HIS LETTER STATES 'UNLINED PITS IN FRESH NATER AREAS IN SOUTHEAST NEW MEXICO WERE BANNED BEGINNING IN 1956, WITH A GENERAL PROHIBITION ADOPTED IN 1967.'
COMMERCIAL Y Y Y BLM 6ND HTR HUD/PROD Y SITE H T R
PRESENT REGULATIONS PROHIBIT UNLINED DISPOSAL PITS. CURRENT REGULATIONS REQUIRE LINED PITS AND MONITORING WELLS WITH LEAK DETECTION FOR COMMERCIAL DISPOSAL PITS SUCH AS THE ONE REFERENCED IN THIS CASE.
PAST DISPOSAL SITE USING UNLINED PITS CLOSED IN 1985
PAB CO GND WTR PROD
HASTE
COHHERCIAL Y Y SITE PAB HAS OPERATING HHEN LOUISIANA PR0HUL6ATED ITS FIRST COHHERCIAL OIL FIELD FACILITY REGULATIONS. PAB EITHER COULD NOT OR HOULD NOT UPGRADE TO HEET THE NEH REGULATIONS AND HAS SHUT DOHN AND SEALED BY LOUISIANA'S OFFICE OF CONSERVATION. FOR ADDITIONAL DOCUHENTATION, SEE LETTER IN DOCKET FROH LA. OFFICE OF CONSERVATION TO R.H. HALL OF EPA DATED APRIL 16, 1987
Y ILLEGAL USE OF OIL SKIMMING PITS, STATE SHUT DOHN OPERATIONS
pmtms--°>x>y. - -TV,*.—'4r-' " W A-^S. •WWWWB"****-**
—HOUJH
LSO vaoo ^ ? ,
paujijj. 6u;aq ;uauinoop aq; ^o A;i|Bnb aq; o ; anp S J ;; *aoi;ou s i q ; UBq; J B 3 | 0 S S 9 | SJ
aBBUij mm. aq; JI :30I10N

AZZiSiZSYASA:($
^WAXyAXAM
YpSAW
mmmmm illlSii
I wZZZZiiZZAAZM i mXzxmxm kmmmzsm
yw.
l«K;-^.Vj-'.l.^'V'-'-'''W^i';..:^*.',.*ria
yw.
K;-^.Vj-'.l.^'V'-'-
c a u i H> Q u £ u
UJ H-QC CJ tn 01 h-
os t n ui ca •- »— r-a cj =D <E CC Ou ac Lt S5
<c a c o J 3 LU
a C D cn
as c c =a a u cn 35 cc cn
OC
cc
cn
<r
ac
•—
oe
ca
cn
«•»-
a .
cn
cu cn
UJ
ca
- j
n
ca
J
CC
cn
•m
<c
cn
ca
cn
a . aa
cn
ro
•nr a .
-o
oe
tn
cn
<r
<c
cc:
CD
cn
ca oa
OC
cc
oe
cn
cn
ca
ca
tn
ae
Li.
cn
ca
u .
ca ae
ca
a
<c
•
cn
ae
oe
a
a*:
«X
cn
a .
cn cn
Ul
cn
<c
ca cn
—4
cn
tn
=c
<n
OC
> •
«x
<r
ca
•a.
cn
cn
a
i—
a .
•">
Q_
ac
cn
cn
a=
cn
a.
LU
ca as *x
en ae
cc
<x
a Lu
CJ
zz:
Ul C3
CJ CJ f— ca ui UJ oa o e c n
cn u . tn u . a s
> <s to o
« U > -•Cau. a c «x
cn
-r-
a= za
CJ
LU
ca
ca
<r CJ
Ul
ar ac o ca
cn OS
ca
<r ca
oe - s u i o - z a u j x x o i s
tn
*-**a
cn
cn
as
c r : sz
<e
cn
OC
a :
a
•>— ar
ae =a
cn
<r
cn
CD
cn
rn
UC
<r -j
m
cc
u-
a=
O. <r
p — i
ca
cc
cn
ca
ca
cn
tn
_i
oe
cc ac
o
rn LU
IZ
cc
•=>
_ J C-3 C 3 <C
<r J— i— =
cr xx a wj;* Z • to c o o I
-*«< - ° > r n | 5s 2. «• — — • S ^ — to - » I S.H;(» P r t - B
• c ? » !
3 r « - zr — _ a > =r wj ; * 3 | -a c o p • rt" < Q •
CD •

\ X - * r A • " 4 # % - 5 j - 5 ? , - , ' ? ^-y -- - ~ ' ~ r 4.^, _ - • _ - i 1
•^»W8Sfe«8CS>.-«iU-4r!t .-&JC3JsJna^ J I V I O > .^rf^f lr.A.^*j-
PA02 DISCHARGE V STUDY SURF HTR PROD HTR STUDY ON IHPACT OF SURFACE HATER DISCHARGES IN VIOLATION OF STATE REGS
THIS CASE REFERENCES A STUDY CONDUCTED BY THE U.S. FISH AND WILDLIFE SERVICE TO DETERMINE CHANGES IN AQUATIC LIFE FROH 1982-1985 RESULTING FROH SURFACE DISCHARGES OF OIL FIELD HASTE. SPECIFIC STATE STANDARDS CONCERNING THESE DISCHARGES HERE ESTABLISHED IN 1985. PRESENTLY, DISCHARGES
OF PRODUCED HATERS ARE ALLOHED ONLY VIA THE NPDES PERHIT SYSTEH AS IS REQUIRED BY FEDERAL AND STATE LAN. PERHITS ARE ISSUED HITH REGARD TO HATER QUALITY STANDARDS DESIGNED TO PROTECT AQUATIC LIFE. THUS, THE STATE HAS USED ITS AUTHORITY UNDER THE EXISTING REGULATORY FRAMEHORK TO DEVELOP A HECHANISH TO ADDRESS THE ISSUE. IF ADDITIONAL REGULATION OR ENFORCEHENT HERE PROVEN TO BE NECESSARY THESE STEPS COULD BE TAKEN BY EPA OR PA. UNDER THE CLEAN HATER ACT.
THESE
o n L i XZQ vaoo pauiljj. Buiaq
;u8mnoop aq; jo A;;|Bnb aq; o ; anp SJ ;J 'aoj;ou Sjq; UBq; JB9|O ssa| si
aBBuii ui|!i aq; } \ :30I10N

a*»*i!iiaag
~i
.«w^^..,i^^a-itoii«f«tfBa*»*i!iiaag
GROUNDHATER CONTAMINATION FROH UNDERGROUND INJECTION
EPA E P A N O N N O N PEND- VIOLATES UNSUB-CASE DAHAGE RCRA CURRNT ING CURR STAN-NO. CATA60RY ISSUE PRACTICE CASE REGS TIATED
HAJOR FACTS
DISPUTED CO. NAHE
CONTAIN RESOURCE
ADMIN/
CONTAIN ENFORCE HASTE HENT
ACTION
EPA CASE DESCRIPTION
AR12 U I C Y J. HCCLAIN SURF/GND PROD HTR Y
HTR I SOIL ANNULAR INJECTION AND INJECTION HITH OUT A PERHIT IS A VIOLATION OF UNDERGROUND INJECTION CONTROL REGULATIONS. VIOLATION OF EHERGENCY PIT USE FOR CONTINUOUS PRODUCED HASTE CONTAINMENT, HOHEVER IS THE HOST PROBABLE CAUSE OF THIS DAHAGE CASE. VIOLATIONS HAVE BEEN CORRECTED AS A RESULT OF STATE ACTIONS. THE STATE ALSO REINSPECTED THE SITE HHICH HAS BEEN FOUND TO BE IN COHPLIANCE.
ILLE6AL NONPERHITTED OISPOSAL HELL AND USE OF ILLEGAL SH DISPOSAL PITS
0H38
NHOl
KS06
UIC NOT LIST GND HTR PROD HTR Y
CONTAHINATION EXISTED PRIOR TO UIC REGULATIONS HHICH PROVIDE THE REGULATORY AUTHORITY
TD REQUIRE INTE6RITY OF INJECTION HELLS. OHIO IS THE ONLY STATE TO ALLDH ANNULAR INJECTION OF PRODUCED HATER AND HAS ENACTED SPECIAL REQUIREHENT TO CONTROL THE PLACEMENT OF FLUIDS AND CORROSION OF CASINGS. THIS HELL PROBABLY HAS DAMAGED BEFORE ENACTMENT OF THESE REGULATIONS AND COULD NOT PASS THE CURRENT CRITERIA FOR HECHANICAL INTEGRITY
UIC TEXACO 6ND HTR PROD HTR
1976 DAHA6E TO FRESH HATER HELLS PRIOR TO UIC REGULATIONS
DAHAGE FROH OLD SALTHATER PITS AND NOT INJECTION HELL STILL IN SERVICE
THIS CASE ALLEGES THAT SALTHATER IS C0NTAHINATIN6 A USDH FROH AN INJECTION HELL. THE HELL HAS BEEN TESTED AND FOUND TO BE IN COHPLIANCE HITH NEH HEXICO UIC REGULATIONS. THE ASSERTION THAT THE HELL HOULD NOT PASS THE TEXAS MIT TEST IS NOT SUPPORTED BY FACTS AND IS
SPECULATIVE. SUBSEQUENT PRESSURE TESTS HAVE FURTHER DEHONSTRATED THAT THE HELL IS NOT CONTAMINATING GROUNDHATER AND IT IS STILL IN SERVICE. IT APPEARS SALTHATER PITS USED IN THE PAST AND NON CLOSED HERE THE PROBLEM. CURRENT REGULATIONS PROHIBIT USE OF UNLINED, UNPERMITTED SALT HATER PITS.
UIC NOT LIST GND HTR PROD HTR Y LEAKIN6 INJECTION HELL VIOLATING UIC REGULATIONS DAMAGED FH HELL
THIS INJECTION HELL PROBLEH OCCURRED I N 19B1. THE OPERATOR INJECTED HATER INTO A HELL HITH
HOLES IN THE CASING AND DAMA6ED GROUNDHATER. THIS VIOLATED THE PRESENT KANSAS REGULATION FOR HECHANICAL INTEGRITY IN UNDERGROUND INJECTION. KANSAS OBTAINED PRIMACY FROH EPA TO OPERATE ITS UIC PROGRAH IN 1984. T H E PRESENT PROGRAH HOULD HAVE UNCOVERED THIS PROBLEH AND REQUIRED THE OPERATOR TO CORRECT IT.
<**££ •-w.-i.j_uiij.ai -»j
im ri l_ I it, tzovaoG pauiijj. 6u;aq
;uauinoop aq; 40 /f;i|Bnb aq; 0; anp si ;j *aoj;ou s;q; UBq; JB9|o ssa| s;
aBBUii UUUJ. aq; j ; *30I10N

^.W^-i&M4«^
0K06 U I C NOT LIST SURF/6ND PROD HTR Y HTR S SOIL
I N THIS CASE SURFACE HATER HAS FOUND TO B E CONTAMINATED BY SALTHATER. A SALTHATER INJECTION HELL HAS HORKED OVER AND NOH MEETS UIC REQUIREMENTS HITH MIT TESTS AND TRACER LOGS INDICATING THE INJECTION HELL IS NOT A CURRENT SOURCE OF CONTAHINATION. CONTAHINATION OF SURFACE HATER HAS CONTINUED AND IS NON SUSPECTED BY THE OPERATOR TO BE A RESULT OF USE OF PAST SURFACE PITS AND DISCHARGES IN THIS OLD PR0DUCIN6 AREA. EVEN IF THE PROBLEH HAS SOLELY THE FAULT OF THE INJECTION HELL, CURRENT UIC REGULATIONS HOULD HAVE DISCOVERED IT AND REQUIRED HORKING OVER THE INJECTION HELL CURRENT REGULATIONS MOULD ALSO HAVE PROHIBITED USE OF SALT HATER DISPOSAL PITS.
INJECTION HELL THOUGHT TO ENDANGER FRESH HATER
HI06 U I C NOT LIST 6ND HTR PROD HTR Y FRESH HATER DAHAGE FROH HELL IN VIOLATION OF EPA UIC REGULATIONS
~ 1
-sf* "rt ?-£--4?'~.&?
^^jW^^xi'Sjhvm^^xj^j.
\U I I I I izo vaoo
pau-ljj. Buiaq ;uauinoop aq; jo A;;|Bnb
aq; o; anp SJ ;i '90i;ou siq; UBq; JB9JO ssa| si
aBBUij UJHJ. a q ; j j :30H0N

.g*jk$f!t
w»»jB&6^.ii
.g*jk$f!te^$gitift&t &*p^s!i
w»»jB&6^.ii&i^»*.«'*-'-gi'^^ mmn
~i
CONTAHINATION FROH IHPROPERLY PLU66ED HELLS
EPA E P A N O N N O N PEND- VIOLATES UNSUB- HAJOR CASE DAHAGE RCRA CURRNT I N G CURR STAN- FACTS NO. CATAGORY ISSUE PRACTICE CASE REGS TIATED DISPUTED
KS03
KS14
TX05
TX11
ADMIN/ CONTAIN CONTAIN ENFDRCE-
CO. RESOURCE HASTE HENT NAHE ACTION
EPA CASE DESCRIPTION
HISC Y HESTERN DRLG 6ND HTR PROD HTR DAHA6E FROH DRILLING RESERVE PIT
THE KANSAS DEPARTHENT OF HEALTH AND ENVIRONHENT HAD RESPONSIBILITY FOR DRILLING PITS NHEN THIS HELL HAS DRILLED. SINCE THEN, AUTHORITY HAS TRANSFERRED TO THE KCC ON JULY 1, 1987. KCC HAS ADOPTED REGULATIONS REQUIRING ALL PITS BE PERMITTED
HISC GULF SURF/END PROD HTR HTR t SOIL
DAMAGE NOT PROVEN TO BE FROH PtA'D OIL NELLS BUT IS PROBABLY FROH OLD INJECTION PRACTICES. CURRENT UIC REGULATIONS HOULD HAVE PREVENTED DAHAGE THROUGH THE 'AREA OF REVIEH' AND MECHANICAL INTEGRITY TESTING REGULATIONS REQUIRED UNDER THE SAFE DRINKING HATER ACT. THESE REGULATIONS REQUIRE TESTING INJECTION HELLS FOR LEAKS AND ADEQUATE PLUGGING OF ALL OLD HELLS BEFORE INITIATION OF INJECTION.
1941 DAMAGE CASE FROH PRIOR OPERATIONS
HISC NOT LIST 6ND HTR SALT HTR Y 1984 HELLS LEAKING FROH CDLEHAN FORMATION REPLUGGED BY TEXAS
THREE HELLS HERE IHPROPERLY PLUS6ED BECAUSE TOP CEMENT PLUGS HERE NOT SET BY THE OPERATOR. HHEN SALTHATER FROM FROM A NATURALLY PRESSURED SALT HATER AQUIFER HAS NOTICED BY THE LANDOHNER THE TEXAS RAILROAD COMMISSION REPLUGGED THE THREE HELLS. TEXAS RAILROAD COHHISSION RULES REQUIRE CEHENTING IN ABANDONED HELLS ACROSS ZONES BELOH FRESH HATER AND THEIR FIELD INSPECTORS ARE RESPONSIBLE FOR REQUIRING PROPER ABANDONMENT OR THE STATE CONDUCTINS PROPER ABANDONMENT.
HISC Y UNKNOHN 6ND HTR SALT HTR UNKNOHN SOURCE OF SALT SEEPS IN HEST TEXAS
NO IMPROPERLY ABANDONED HELLS HERE SITED AS A LIKELY SOURCE OF DAHAGE TO SOIL AND 6R0UN0HATER IN THIS AREA AND THE SOURCE OF DAHAGE IS NOT PROVEN. COHMENTS FROM THE TEXAS RAILROAD COHHISSION STATE THAT THE SOIL AND GROUNDHATER ARE PROBABLY CONTAHINATED AS A RESULT OF THE TERRACING AND FERTILIZING OF THE PROPERTY.
'^^-•JUS^rJ—
1.30 VdOO pauiljj. Su;aq
;uauinoop aq; ^o A;i|Bnb aq; o; anp si ;J *aoj;ou s i q ; UBq; JB9|O ssa| si
a6Biuj uijij. aq; }\ :3QI10N

s * ?*•,- • - . "-• spy**^ i x - * . . ^ ~ •*•
jag^eA*tee^^;^***^«^^ ,-*Si*>>P*KKM4j*^TJ"* i« ne-v Oa A.I_ J
- . I * * "
4 , -v w ~
j*^J" i^n-v^^a^ A.I_^^J
TX15
LA65
HISC Y KEETON EXPL 6ND HTR SALT HTR Y HATER HELL DAHAGED FROM ILLEGAL OPERATIONS
KEETON EXPLORATION OPERATED A LEASE HITH ILLEGAL SURFACE DISCHARGES THAT VIOLATED TEXAS RAILROAD COHHISSION RULES 8, 14 AND 20. THE FIELD HAS ORDERED CLOSED AND THE OPERATOR FINED. IN CLOSING THE FIELD THE RAILROAD COHHISSION PROPERLY PLU6GED 5 HELLS. TEXAS REGULATIONS REQUIRE PLACING CEHENT PLUGS ACROSS OLD PR0DUCIN6 FORHATIONS AND BELOH THE BASE OF GROUNDHATER TO PREVENT CONTAHINATION. IF AN OPERATOR DOES NOT COMPLY TEXAS HILL PLUG THE HELLS PROPERLY ITSELF.
HISC COOUINA HUGHES JUSTIS-MEARS BELL 6RUBB BASS
SURF/6ND
HTR SALT HTR ALLE6ED IRRIGATION HELL AND SURFACE SH DAHAGE FROH PAST OIL PROD
KS03
SOURCE OF DAHAGE IS NOT PROVEN AND THIS CASE IS UNDER INVESTIGATION BY THE LOUISIANA OFFICE PF CONSERVATION. DAHAGE IS PROBABLY FROH NON-CURRENT OIL FIELD PRACTICES ALTHOUGH THIS CAN NOT BE ESTABLISHED UNTIL THE INVESTIGATION IS COHPLETED. IF FROH PAST PRACTICES, CURRENT REGULATIONS HOULD HOHEVER PREVENT THESE TYPE DAHAGES (UIC, SDHA, DRILLING AND PLUGGING REQUIREMENTS)
HISC HESTERN DRLG NONE NONE
AFTER INVESTIGATION BY THE KCC, IT HAS FOUND NO DAHAGE HAD BEEN CAUSED BY THIS HELL. THE INVESTIGATION SHOHED THAT ALTHOUGH THE TOP CEHENT PLUS HAS LOH THAT IT HAS STILL EFFECTIVE IN PREVENTIN6 GROUND HATER CONTAHINATION. THE KCC FINDING HAS DOCUMENTED IN COURT CASE AHARDING DAMAGES NOT FOR THE ABANDONED HELL BUT FOR AN ABANDONED RESERVE PIT.
ALLE6ED DAMAGE FROH P&A'D HELL
mmmmmmm •*l*ji,r*n-il!ii*;jr fKjflTtWr.
\3 I L I vzovyaQo - 'y-..-. A.-*gyriiAA;-.7.--V
£•
pauijjj. 6uiaq ;U9iunoop aq; jo A;i|Bnb aq; o ; anp SJ ;i *aoj;ou s;q; UBq; JBap ss9| si
aBBuij ujjjj aq; JS :30liON

jff-ijjw-giifs^fr^**^^ JjO
-"/^ '
* > -a-^^—»a«jfaJ«a«»aifetii*£aa-feiP iP -j*&gii&£~&i^'Y**fift:8!?a^&'^^
DAHAGE RELATED TO POOR LEASE HAINTENANCE
EPA E P A N O N N O N PEND- VIOLATES UNSUB-CASE DAHA6E RCRA CURRNT I N G CURR STAN-NO. CATA60RY ISSUE PRACTICE CASE RE6S TIATED
MAJOR FACTS
DISPUTED CO. NAME
CONTAIN RESOURCE
ADHIN/ CONTAIN ENFORCE HASTE HENT
ACTION
CASE DESCRIPTION
KS01 PROD TEHPLE HTR/SOIL SALTHATER Y HABITUAL VIOLATOR OF REGULATIONS BANNED FROM OPERATIONS IN KANSAS
THIS CASE DOES NOT DEMONSTRATE A NEED FOR ADDITIONAL REGULATION
OPERATOR HAS A HABITUAL VIOLATOR (39 VIOLATIONS IN THO YEARS) OF REGULATIONS RESULTING IN NUMEROUS VIOLATIONS OF STATE RULES. THE KCC ASSESSED A PENALTY, REVOKED THE OPERATORS LICENSE AND PROHIBITED FURTHER OPERATIONS ON THE LEASE AND HITHIN KANSAS BY THE OPERATOR HITHOUT PUBLIC NOTICE AND HEARING.
THE ' LEASE MAINTENANCE' SECTION OF KANSAS REGULATIONS HERE ISSUED HAY 13, 1987 REQUIRING PERHITS FOR ALL PITS (DRILLING AND PRODUCING), EHPTYING OF EHERGENCY PITS HITHIN 48 HOURS, NOTIFICATION OF SPILLS HITHIN 24 HOURS AND SPECIFIC PENALTIES APPLICABLE FOR EACH VIOLATION. IN ADDITION KCC HAS AUTHORITY TO SHUTDOHN AN OPERATOR TO ENFORCE ITS REGULATIONS. FURTHER DOCUHENTATION IS INCLUDED IN K.A.R. 82-3-400 THROUGH 403.
KS08 PROD Y HARR SOIL SALT HATER Y THIS CASE DOES NOT DEHOHSTRATE A NEED FOR ADDITIONAL REGULATION. AN UNPERMITTED EMER6ENCY POND HAS FOUND TD BE LEAKING SALTHATER. THE OPERATOR HAS ORDERED TO CORRECT THE SITUATION BY LINING THE POND AND SECURIN6 A PERMIT. THE OPERATOR DID NOT COHPLY AND AN ORDER TO CLOSE THE POND HAS ISSUED BY KDHE. THE SITE HAS BEEN CLOSED
FOR ADDITIONAL DOCUHENTATION SEE COHHENTS ON KS01 PERTAINING TO KCC 'LEASE HAINTENANCE' REGULATIONS CONTAINED IN K.A.R. 82-3-400 THR0U6H 403.
ILLEGAL USE OF SALTHATER PITS, OPERATION ORDERED CLOSED BY KCC
izo vaoo pauiljj. 6u;aq
;u9mnoop a q ; 40 /C;j|Bnb aq; 0 ; anp si ;J 'aoj;ou Sjq; UBq; JB9|o ssa| si
a6Biuj UJIIJ. a q ; ^i -30HON
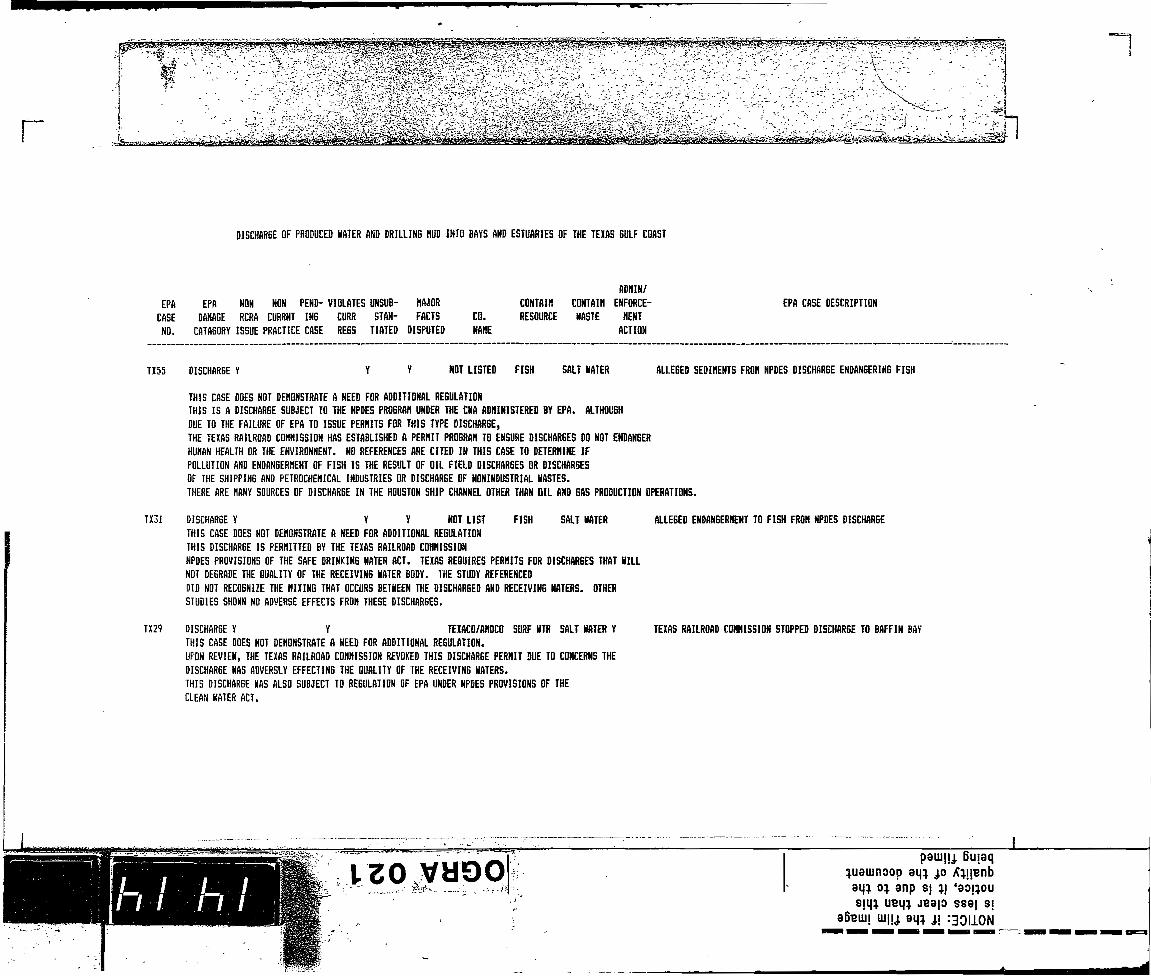
•*•*•*•—•*•*•*-—«-
S*l|ilt*-fe3§||lp|^^ •*^'&.y •*^'&.y-imi&??& isffi^s?
&fflJsliii&iS3%f§£^^ ' n
DISCHAR6E OF PRODUCED HATER AND DRILLING MUD INTO BAYS AND ESTUARIES OF THE TEXAS 6ULF COAST
EPA E P A N O N N O N PEND- VIOLATES UNSUB- HAJOR CONTAIN CASE DAHAGE RCRA CURRNT IN6 CURR STAN- FACTS C O . RESOURCE NO. CATAGORY ISSUE PRACTICE CASE RE6S TIATED DISPUTED NAME
ADMIN/ CONTAIN ENFORCE-HASTE HENT
ACTION
EPA CASE DESCRIPTION
TX55 DISCHARGE Y NOT LISTED FISH SALT HATER ALLE6ED SEDIMENTS FROH NPDES DI5CHAR6E ENDAN6ERING FISH
THIS CASE DOES NOT DEMONSTRATE A NEED FOR ADDITIONAL REGULATION THIS I S A D15CHAR6E SUBJECT T O THE NPDES PROGRAM UNDER THE CHA ADMINISTERED BY EPA. ALTHOUGH DUE T O THE FAILURE OF EPA TO ISSUE PERHITS FOR THIS TYPE DISCHAR6E,
THE TEXAS RAILROAD COHHISSION HAS ESTABLISHED A PERHIT PROGRAH TO ENSURE DISCHARGES DO NOT ENDAN6ER HUHAN HEALTH O R THE ENVIRONHENT. NO REFERENCES ARE CITED I N THIS CASE TO DETERHINE IF POLLUTION AND ENDANGERMENT OF FISH I S THE RESULT OF OIL FIELD DISCHARGES O R DISCHARGES OF THE SHIPPING AND PETROCHEMICAL INDUSTRIES O R DISCHARGE OF NONINDUSTRIAL HASTES. THERE ARE HANY SOURCES OF DISCHARGE I N THE HOUSTON SHIP CHANNEL OTHER THAN OIL AND GAS PRODUCTION OPERATIONS.
TX31 DISCHARGE Y Y Y NOT LIST FISH SALT HATER THIS CASE DOES NOT DEHONSTRATE A NEED FOR ADDITIONAL REGULATION THIS DISCHARGE IS PERHITTED BY THE TEXAS RAILROAD COMMISSION
NPDES PROVISIONS OF THE SAFE DRINKING HATER ACT. TEXAS REQUIRES PERHITS FOR DISCHARGES THAT HILL NOT DE6RADE THE QUALITY O F THE RECEIVING HATER BODY. THE STUDY REFERENCED DID NOT RECOGNIZE THE MIXING THAT OCCURS 8ETHEEN THE DISCHARGED AND RECEIVING HATERS. OTHER STUDIES SHOHN NO ADVERSE EFFECTS FROH THESE DISCHARGES.
ALLEGED ENDANGERMENT TD FISH FROH NPDES DISCHARGE
TX29 DISCHAR6E Y Y TEXACO/AHOCO SURF HTR SALT HATER Y THIS CASE DOES NOT DEHONSTRATE A NEED FOR ADDITIONAL REGULATION. UPON REVIEH, THE TEXAS RAILROAD COHHISSION REVOKED THIS DISCHARGE PERHIT DUE TO CONCERNS THE DISCHARGE HAS ADVERSLY EFFECTING THE QUALITY O F THE RECEIVING HATERS. THIS DISCHAR6E HAS ALSO SUBJECT TO REGULATION OF EPA UNDER NPDES PROVISIONS OF THE CLEAN HATER ACT.
TEXAS RAILROAD COHHISSION STOPPED DISCHAR6E TO BAFFIN BAY
i. 30 vaoo pauujjj. 6u;aq
;u9iunoop aq; jo /tyjBnb aq; o; anp si ;; 'aoi;ou sjq; UBq; JB9|0 ssaj si
36BUII uiuj. aq; }\ :30H0N

m. !'•
|cJ*-r..*rr.
v - V j,4*s,.z& '-r-'-sz
w,^l
DAHA6E RELATED TO ARTIC PRODUCTION OPERATIONS
EPA E P A N O N N O N PENB- VIOLATES UNSUB- HAJOR CASE DAHAGE RCRA CURRNT I N G CURR STAN- FACTS C O . NO. CATAGORY ISSUE PRACTICE CASE REGS TIATED DISPUTED NAHE
ADMIN/ CONTAIN CONTAIN ENFORCE-RESOURCE HASTE HENT
ACTION
EPA CASE DESCRIPTION
SURF HTR CHEHICALSY AKIO SALVAGE Y Y Y NSSI OPERATION THIS CASE REFERS TO THE IMPROPER AND ILLEGAL ST0RA6E AND HANDLING OF USED DRUHS BY A COMMERCIAL SALVAGE COMPANY. THE ADEC AND DNR ACTED TO QUICKLY DEVELOP AND IHPLEHENT A CLEAN UP PLAN HITH THE SALVAGE COHPANY AND HITH NORTH SLOPE OPERATORS. ISSUES OF THIS TYPE ARE SPECIFICALLY ADDRESSED IN ADEC SPILL CLEANUP AND NOTIFICATION REQUIREHENTS DOCUMENTED IN 18 AAC 75.080. NOTE THAT AFTER CLEANUP, A MONITORING PROGRAM OF ADJACENT TUNDRA AREAS AND PONDS HAS UNDERTAKEN. TEST SHOHED THAT HATER AND TUNDRA HERE FREE OF CONTAHINCATION.
ILLEGAL AND UNREPORTED CHEHICAL SPILLS
itwyiiy i,1'—-:>"^vr.ii<itiTtfiA- -*'~J" '• •
_ / / • • / • / • • / .
VZO VH90 paiu|jj Buiaq
;uaujnoop aq; jo A;j|Bnb aq; o; anp s; ;; '90i;ou sjq; UBq; JB9|0 ssa| SI
a6BUii ui|jj aq; } \ :30I10N

•f*p
gj»Si4*^**w*iSj£i**jg^ rawaj^^^wwa^^^fjijjM^u* . . v
->7A^J. -<>t^;-v,; J - . -„ . , " " > . ' " 1
r
DAMAGE TO HATER HELLS FOLLOHING FRACTURIN6 OPERATIONS ON PRODUCING HELLS
EPA E P A N O N N O N PEND- VIOLATES UNSUB- MAJOR CONTAIN CASE DAHAGE RCRA CURRNT I N G CURR STAN- FACTS C O . RESOURCE NO. CATA60RY ISSUE PRACTICE CASE REGS TIATED DISPUTED NAME
ADMIN/ CONTAIN ENFORCE-HASTE HENT
ACTION
EPA CASE DESCRIPTION
HV17 PROD KAI5ER 6AS 6NDHTR FRAC FLUID DURING HORKOVER OF 6AS HELL, FRACTURIN6 FLUID REACHED A HATER HELL
THIS CASE IS NOT A HASTE BUT PRODUCTION OPERATIONS ISSUE. THE DAMAGE HERE RESULTS FROH AN ACCIDENT OR HALFUNCTION OF THE FRACTURING PROCESS. IN THIS PROCESS, PRODUCING HELLS HAVE SAND LADEN FLUIDS PUHPED INTO THE PRODUCING FORHATIONS AT RATES THAT CREATE CRACKS THAT ARE PROPPED OPEN TO ALLOH FLOH OF OIL OR GAS TO THE HELLBORE. THE PROCESS REQUIRES THE FRACTURES TO BE CREATED TO BE LIHITED TO THE PRODUCING FORHATION. IF THEY ARE NOT AS IS THE APPARENT CASE HERE OIL AND GAS ARE LOST FROH THE RESERVOIR AND ARE UNRECOVERABLE.
PAOB DRLG & Y Y NORHESCO 6ND HTR PROD HTR Y
PROD THIS DAHAGE CASE IS NOT THE RESULT OF DAHA6E AFTER FRACTURINS OPERATIONS BUT RATHER ILLE6AL OPERATIONS BY A PRODUCTION OPERATOR. BOTH THE PA. DEPARTMENT OF ENVIRONMENTAL RESOURCES AND PA. FISH COHHISSION CITED NORHESCO FOR ILLEGAL OPERATIONS AND DISCHARGE OF PRODUCED HATERS AT LEAST 19 TIHES. THE OPERATOR SOUGHT BAHKRUPTCY PROTECTION BUT HAS STILL REQUIRED TO HAKE A CASH SETTLEMENT TO REPLACE THE 6R0UND HATER RESOURCES HE HAD DAHAGED.
DAHA6E FROH ILLEGAL OPERATIONS
1.20 VaOG patuijj. 6uiaq
;uamnoop aq; jo /ty|Bnb a q ; o; anp s ; ; ; '90J;OU
sjq; UBq; JB9|o ssaj si a6BUi! uijij. aq; JI *30JION

• ^ f f "
egsfet>«**'-«wM*^^
* • - A ~- - ^*
; . - ' - z4m*:
- * i **• --—j
DAHAGE RELATED TO PRODUCTION OPERATIONS SPILLS
EPA E P A N Q N N O N PEND- VIOLATES UNSUB-CASE DAHA6E RCRA CURRNT I N G CURR STAN-NO. CATAGORY ISSUE PRACTICE CASE RE6S TIATED
HAJOR FACTS ISPUTED
CO. NAHE
CONTAIN RESOURCE
ADHIN/ CONTAIN ENFORCE-HASTE HENT
ACTION
EPA CASE DESCRIPTION
AK09
HI05
OIL Y Y NOT LIST SURF HTR O I L SPILL THIS IS AN OIL SPILL INCIDENT. NO SAHPLIN6 HAS RECORDED IN CONNECTION HITH THE OIL SPILL INCIDENT, AND HUCH OF THE DAHAGE CASE TEXT IS ASSUHPTION AND SPECULATION. NUHEROUS FEDERAL AND STATE REGULATIONS RE6ARDIN6 PULLUTION CONTROL EXIST (SEC. 311 CLEAN HATER ACT), AND MOST HAVE BEEN IMPLEMENTED SINCE THE WRITING OF THE FHS REPORT OVER TEN YEARS AGO. ADEC REGULATION 18 AAC 75.080 REQUIRES DIL SPILL NOTIFICATION AND CLEANUP.
ALLEGED OIL SPILL FROH OIL HELL PLUBGED PRIOR TO 1973-75 STUDY
DAHA6E FROH SPILLS FROH PRODUCTION FACILITIES PROD Y TROPE GNO HTR PROD HTR THIS CASE IN INCORRECTLY REFERRED TO AS CAUSED BY IMPROPER RESERVE OR DISPOSAL PITS. THE CASE DESCRIPTION ACTUALLY INDICATES THAT THE SOURCE OF THE GROUNDHATER CONTAHINATION IS BRINE STORAGE TANKS AND CRUDE OIL SEPARATOR FACILITIES. AS IS THE NORHAL CASE IN MICHIGAN, THE GEOLOGICAL SURVEY INVESTIGATED THOROUGHLY AND USED STIFF DIAGRAHS TO CONFIRH THE SIHILARITY OF THE CONSTITUENTS OF THE FORHATION PRODUCED HATER AND THE CHLORIDE CONTAHINATION OF THE AFFECTED HATER HELLS. THIS INDICATES THE SDURCE TO BE LEAKS OR SPILLS OF PRODUCED HATER FROH THE PRODUCTION FACILITIES. MICHIGAN REGULATIONS COVER SUCH SPILLS. MICHIGAN COMPILED LANS, SECTION 323.1 AND 323.4, AS HELL DEPARTHENT OF NATURAL RESOURCES HATER RESOURCE COHHISSION GENERAL RULE 323.1144 COVER RELEASES OF OIL, SALT OR OTHER POLLUTING MATERIAL. IHHEDIATE NOTIFICATION AND A SUBSEQUENT REPORT DEALING HITH THE CAUSE, DISCOVERY, AND CLEANUP
•I ZO V U 9 pauuijj. 6u;aq
;uauinoop a q ; jo A;jjBnb a q ; o ; anp si ; ; '9oi;ou s ;q ; UBq; JB9JO ssa| si
aBBUii ui|ij. aq; j ; : 3 0 J I O N
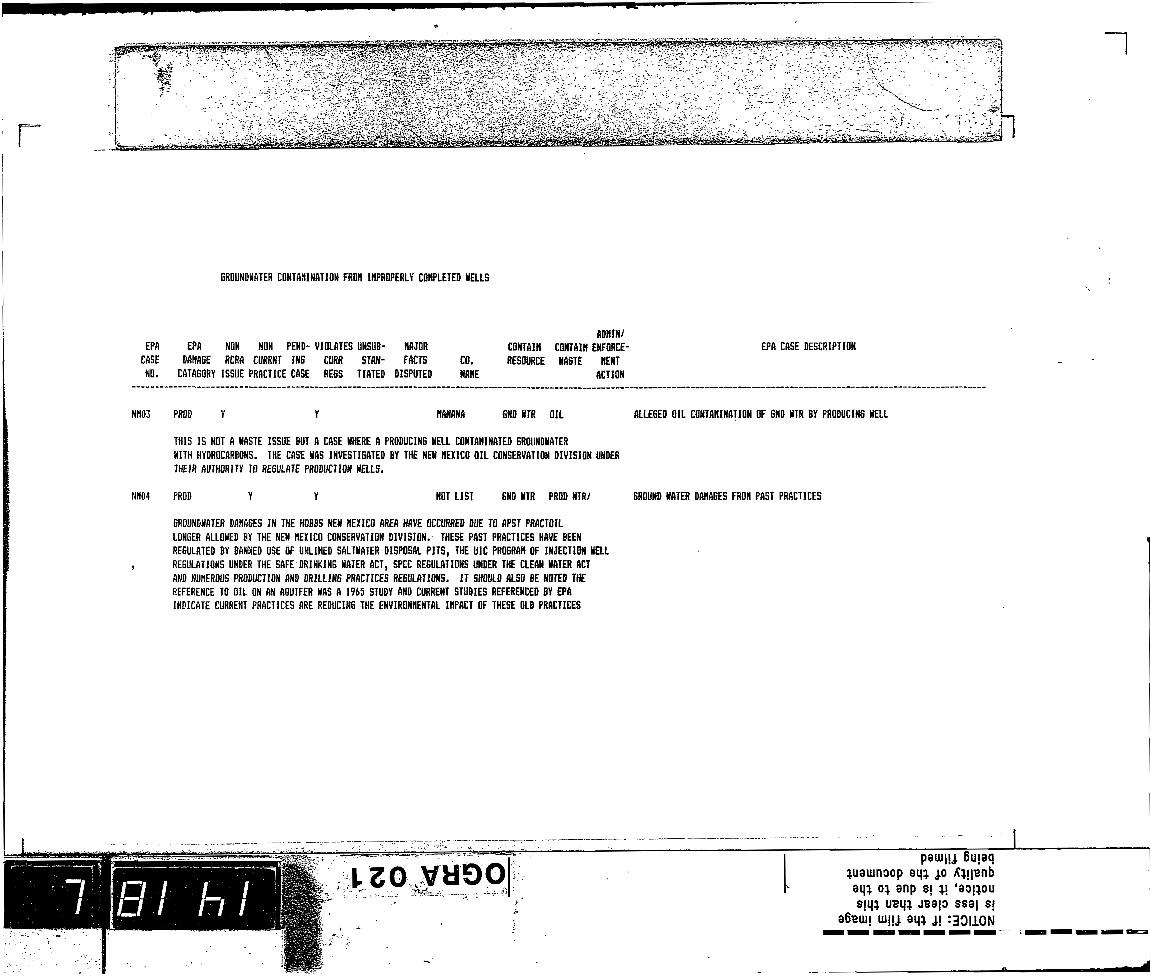
••***3*-*S;j-^t V B 1 ^ *,^-*-^^*iM*fe'^iJJ*££^ XJ,^
_ *-? < A V ^ . «• TL* A - - . V . 1
i*- A
N.V.
W r x?W~~Y.-.Si.»sR-: "V ""- W- kystkAS^ZA-iy ?iiww W r x?W~~Y.-.Si.»sR-: "V ""- W- kystkAS^ZA-iy ?iiww •W^-^g^ri^^M^tts^ rS*f**#>~ ^ 2 , ,
-w , .
GROUNDHATER CONTAMINATION FROH IHPROPERLY COHPLETED HELLS
EPA E P A N O N N O N PEND- VIOLATES UNSUB- HAJOR CASE DAHAGE RCRA CURRNT I N G CURR STAN- FACTS NO. CATAGORY ISSUE PRACTICE CASE REGS TIATED DISPUTED
NN04
CO. NAME
CONTAIN RESOURCE
ADMIN/ CONTAIN ENFORCE HASTE HENT
ACTION
EPA CASE DESCRIPTION
NH03 PROD HANANA GND HTR O I L ALLEGED OIL CONTAHINATION OF GND HTR BY PRODUCING NELL
THIS I S NOT A HASTE ISSUE BUT A CASE HHERE A PRODUCING HELL CONTAHINATED GROUNDHATER
HITH HYDROCARBONS. THE CASE HAS INVESTIGATED BY THE NEH HEXICO OIL CONSERVATION DIVISION UNDER THEIR AUTHORITY TO REGULATE PRODUCTION NELLS.
PROD NOT LIST GND HTR PROD HTR/
6R0UNDHATER DAHA6ES IN THE HOBBS NEH HEXICO AREA HAVE OCCURRED DUE TO APST PRACTOIL LONGER ALLOHED BY THE NEH HEXICO CONSERVATION DIVISION. THESE PAST PRACTICES HAVE BEEN REGULATED BY BANNED USE OF UNLINED SALTHATER DISPOSAL PITS, THE UIC PROGRAH OF INJECTION HELL REGULATIONS UNDER THE SAFE DRINKING HATER ACT, SPCC REGULATIONS UNDER THE CLEAN HATER ACT AND NUHEROUS PRODUCTION AND DRILLING PRACTICES REGULATIONS. IT SHOULD ALSO BE NOTED THE REFERENCE TO OIL ON AN AQUIFER HAS A 1945 STUDY AND CURRENT STUDIES REFERENCED BY EPA INDICATE CURRENT PRACTICES ARE REDUCING THE ENVIRONHENTAL IHPACT OF THESE OLD PRACTICES
GROUND HATER DAHA6ES FROH PAST PRACTICES
kzo vaoo •Xfe.A.7.,:
pgiuijj. Bujaq ;u9uinoop aq; 40 £;i|Bnb aq; 0 ; anp si ;i -aoi;ou sjq; UBq; JB9|o ssa| si
aBBuij uijji aq; j | -30IJ.ON

F-pi "•"»•»— » IU.
r~
^ c
/ - . I
*">
f i
' "^ i.
S *!
o
"->
o
% • « ' » »
L_
00013 COMMENTS REGARDING THE UNITED STATES ENVIRON-MENTAL PROTECTION AGENCY'S REPORT TO CONGRESS WITH RESPECT TO THE MANAGEMENT OF WASTES FROM THE EXPLORATION, DEVELOPMENT AND
PRODUCTION OF CRUDE OIL, NATURAL GAS AND GEOTHERMAL ENERGY
DOCKET NUMBER F-88-OGRA-FFFFF
ON BEHALF OF THE
INDEPENDENT OIL AND GAS ASSOCIATION OF NEW YORK INDEPENDENT OIL AND GAS ASSOCIATION OF WEST VIRGINIA
KENTUCKY OIL AND GAS ASSOCIATION OHIO OIL AND GAS ASSOCIATION
PENNSYLVANIA NATURAL GAS ASSOCIATES PENNSYLVANIA OIL AND GAS ASSOCIATION TENNESSEE OIL AND GAS ASSOCIATION VIRGINIA OIL AND GAS ASSOCIATION
and the WEST VIRGINIA OIL AND NATURAL GAS ASSOCIATION
SUBMITTED BY:
ROBINSON & McELWEE
David M. Flannery Robert E. Lannan
600 United Center Post Office Box 1791
Charleston, West Virginia 25326 (304) 344-5800
March 1 4 , 1988
crja a w (O c o " o 5" 2L £ 5T B _«,«< • » m W o a-" 2.1!.
CD « • * CO
° _«. 5 — 5 ° r+ = 3 rt- sr - • =» » P>
CD
to

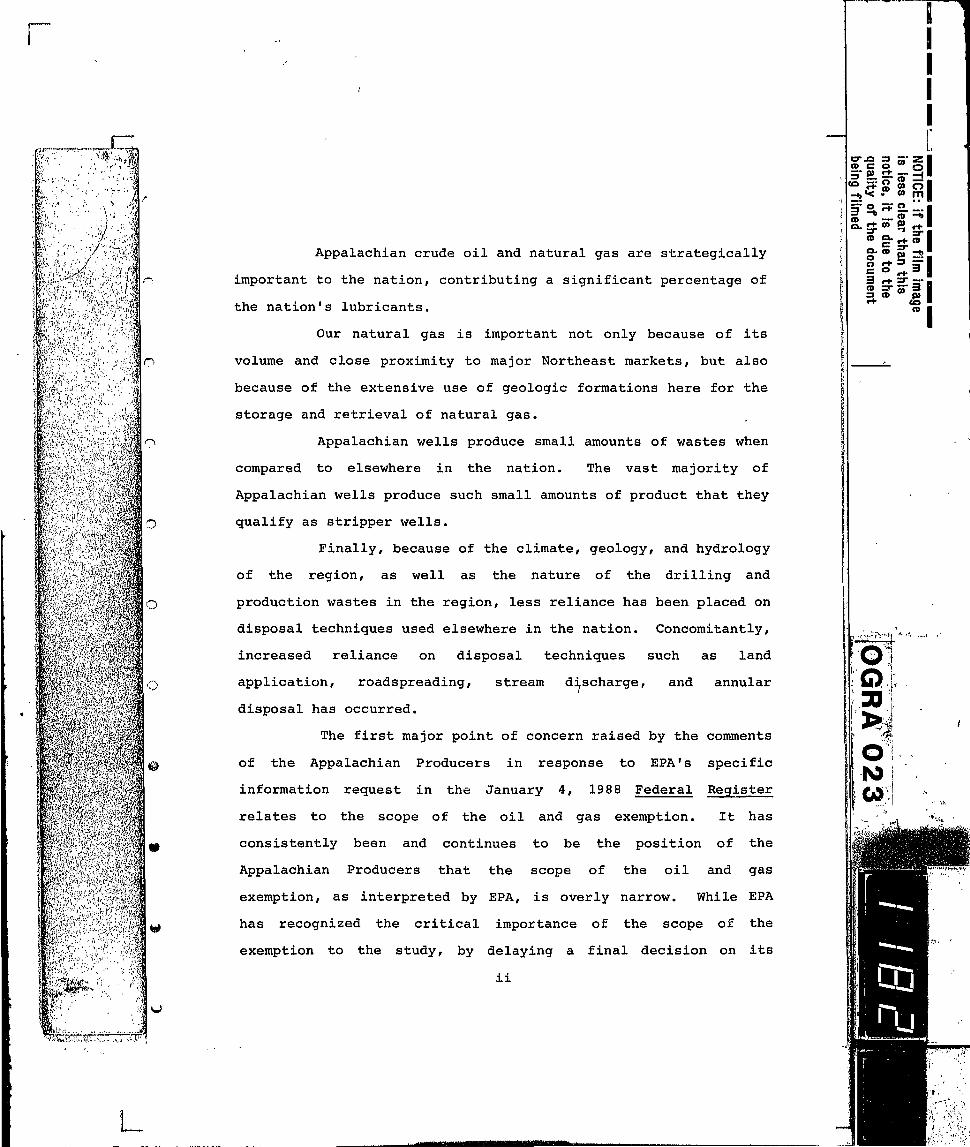


W—
a - -„ V -$
;M A v I f fix!
* &
«3
3
O
©
roadspreading, stream discharge, and annular disposal. While
these specific waste disposal alternatives are discussed more
completely in the body of these comments, suffice it to say that
in each instance, each disposal option where practiced is
comprehensively regulated under presently existing state
regulations of the Appalachian states in a manner which insures
the environmental acceptability of these techniques and that no
harm to human health or the environment occurs. This fact alone
should be enough to indicate to EPA that no further regulation of
oil and gas drilling or production wastes is necessary in view of
the presence of adequate state regulation of any potential
environmental problems. A condemnation of these practices
without a thorough examination of the various state prograias and
particularly in light of EPA's continued mischaracterization of
many damage cases occurring in the Appalachian states is
unsupportable.
In addition, the Appalachian Producers submit that EPA
has no basis whatsoever for concluding in the Report to Congress
that significant technical improvements in waste disposal
techniques in the oil and gas industry are foreseeable.
Particularly as it relates to operations in the Appalachian
states, this discussion is purely speculative and not supported
by any objective findings of the Report to Congress. This is a
matter of particular importance because in the Appalachian
states, unique waste management practices that have evolved as a
function of careful balancing between environmental protection
and economical realities indicate that there is no basis for
iv
e c q " o to —, 3 - o
_ «< P m m | o a-" 2. -. I
« — 2 "*
23 r* -r —• I to T „ 3 => w m to
CO I
i!o o 30
o GO
L


r
#*>
o
1 f-
ftvt1-' -^ L\ w ft
• ! * \ ' ,' <~%1 - '
.1 * -Wjj:.
O
J
L
industry. Correspondingly, EPA's economic analysis overstates
baseline costs while understating the cost of alternative
requirements. The end result is a masking of a true cost of
imposing alternative waste management practices on the industry.
Additionally, EPA has failed to properly assess the impact of
these increased costs on the industry in Appalachia. EPA's
analysis is simply not sensitive enough to determine the impacts
of very small increases on Appalachian producers. The cost
analysis does not recognize that objectionable cost impacts on
Appalachian producers will result not only from imposition of
hazardous waste regulations, but also from the imposition of any
new regulatory requirements under any program.
Finally, the Appalachian Producers note that there is
simply no justification for new hazardous or non-hazardous waste
regulations as a result of EPA's study of oil and gas drilling
and production wastes. EPA's Report to Congress has concluded
that existing state and federal regulatory programs are adequate.
The Report also has identified the severe economic impacts that
would be realized by the oil and gas industry in general should
hazardous wastes regulatory requirements be imposed. This impact
would be exponentially increased in the Appalachian region should
any new regulations be imposed. These factors, in combination
with EPA's failure to identify significant unregulated
environmental risks, compel the conclusion that no further
regulatory requirements are appropriate. We do not believe that
it is necessary or appropriate for any new regulatory
requirements to be imposed on any segment of the oil and gas
v i
C T J O Z3
CD c o " o l =" £. £ HT ^
CO
• - 2 "* CD r + CD OL CO o o " • - a = ° «+ 3
3 €+ = » " = • o 3 " S " 3 = «> P> r-h CO
CD

F"*"
-CI, Si
\
$ J ft
if*.
f i '> * Y A
Vn * f . hJFti
Y^
n
o
Y Atfa
Sfk,Y ^*tfg Ifei
o
tiJ%i
B-Y
r1
**£
O
o
industry. We do, however, support the recommendation by EPA that
efforts be taken to develop cooperative approaches with the
states that would explore non-regulatory support for current
programs in the form of funding, training, or technical support.
Alternatively, although the Appalachian Producers do
not feel that it is necessary or appropriate for any new
regulatory requirements to be imposed on the oil and gas
industry, should EPA nevertheless be inclined to pursue
regulations in response to this study, we feel that circumstances
surrounding operations in the Appalachian states justify
exempting these operations from any of the new regulatory
requirements finally promulgated. Because of the minimal nature
of the waste streams involved; the proven adequacy of the
existing regulatory programs; and the enormous cost impact of
imposing additional requirements, a conclusion is compelled that
current regulatory and waste management requirements in
Appalachia should not be altered as part of the establishment of
any national environmental regulatory program to control oil and
gas drilling and production wastes.
State regulatory programs have more than enough
authority to appropriately change their own programs if there is
a need. Expertise also exists at the state level to fashion an
appropriate regulatory program which addresses whatever
environmental concerns exist, while recognizing the economic
capabilities of these operations. A review of this document
leads us to believe the Agency has several options available to
it which will result in a different regulatory
v i i
CO c o - o
^ . S g S o l CD w '••'I
5" ° rt-' ** 3 2. £ s- e»
CD I
o © 30
o to CO
•Si

r
to' k/
JM'f i^W VV&J
.'"SUM
tif: lM
* 4
O
O
l_
process as it effects oil and gas drilling at production wastes.
In considering these approaches, it continues to be the position
of the Appalachian Producers that no regulations of any kind are
necessary and that adequate state and federal regulatory
authority already exists to handle any environmental problems
attributable to the industry. It is our belief that after
competent review of the existing state and federal regulatory
authorities and disposal practices employed in the Appalachian
region, the inalterable conclusion must be that neither Subtitle
C or any other regulations justify change.
V l l l
<o c o " o I
51 o a-" 2. '1. SL £ « 1 r*
CTJD => CO
CD
O
go CO
CO

!»"••-
F
t f )
) I
11 v f .
if11
v f »;*<$ % A* ,'$fA
n
n
ID
O
TABLE OF CONTENTS
Page
EXECUTIVE SUMMARY i
TABLE OF CONTENTS ix
I. INTRODUCTION 2
II. BACKGROUND OF APPALACHIAN PRODUCERS 3
A. Participating Trade Organizations 3
1. Independent Oil and Gas Association of New York 3
2. Independent Oil and Gas Association
of West Virginia 4
3. Kentucky Oil and Gas Association 4
4. Ohio Oil and Gas Association 5
5. Pennsylvania Natural Gas Associates . . . . 5
6. Pennsylvania Oil and Gas Association. . . . 6
7. Tennessee Oil and Gas Association 7
8. Virginia Oil and Gas Association 7 9. West Virginia Oil and Natural Gas
Association 8
B. Special Characteristics of Appalachia 8
1. Large Number of Wells 8
2. Strategic Importance of Region 9
3. Small Quantities of Waste 9
4. Nearly All Wells Are Stripper Wells . . . . 9
5. Specialized Waste Disposal Practices. . . . 10
C. Previous Involvement with EPA 10
ix
3 r+ 3r_.
L

F - » "
i?
U K < f *'>'>'
'" r i '\.
o
f t
,-ffi
#
III. COMMENTS ON THE REPORT TO CONGRESS 12
A. The Scope of the Exemption is Overly Narrow. . . 13
1. Separation Media 19
2. Recycled Materials 20
B. Produced Water Injected for Enhanced Recovery Should Not be Considered a Waste 20
C. EPA Has Correctly Included the Seven Appalachian States Within Zone Two of the Study 21
D. EPA's Damage Case Review is Flawed and Does Not Support the Agency's Assessment of Specific Disposal Techniques 22
1. General 22
2. Land Application 24
3. Stream Discharge 28
4. Annular Disposal 3 0
5. Well Fracturing 33
6. Roadspreading 33
7. Other Comments Relating to EPA's Flawed Damage Case Review 3 7
E. EPA Has No Basis for Its Conclusion that Significant Technical Improvements in Waste Disposal Techniques in the Oil and Gas Industry are Foreseeable 43
F. Existing State and Federal Regulatory Authori-ties Are Adequate to Prevent or Mitigate Adverse Impacts 45
G. EPA's Risk Assessment Modeling Shows Negligible Impacts on the Environment 46
H. EPA's Economic Impact Analysis Does Not Adequately Assess Cost Impact on Appalachian Operations 4 8
1. Overstated Baseline Costs 48
2. Understated Alternative Costs 49
cr-O =| CO fflCOBo| 5" £L 2: sr -3 • ~ F S Sol _„«< i" co m •
S 2 . - . I ' _ . CO S. r+ 5" K rt- •
• CO p> j^JJ § St I co =r 5* 3 I r* CO H
CD •

• • • i P •' m_
I il1 §*.
''A is .-ATA 1* ,*vrt ,„,,,, ,JB
?H * J C f». 4 »* f « • • • ) n 1
•3
IV.
V.
3. Understated Economic Impact 50
4. Appalachian Impacts 52
I. There is No Justification for New Hazardous or Non-hazardous Waste Regulations as a Result of EPA's Study 54
J. EPA Should Create a Special Subcategory to Address Characteristics of Appalachian Operations 57
REGULATORY ALTERNATIVES 59
CONCLUSION 61
XI

J*"PI
r
'«V-
si' / ,w»
-I'
L3^
:>
o
o
a x-"~
I. INTRODUCTION.
On Monday, January 4, 1988 (53 Fed. Reg. 81), the
United States Environmental Protection Agency ["EPA"] announced
the publication and availability for public comment of its
"Report to Congress: Management of Wastes from the Exploration,
Development, and Production of Crude Oil, Natural Gas and
Geothermal Energy" ["Report to Congress"]. The Report to
Congress was prepared pursuant to the statutory mandate of
Sections 3001(b)(2) and 8002(m) of the Resource Conservation and
Recovery Act, 42 U.S.C.S. §§6921(b)(2), 6982(m) (1982) ["RCRA"].
The Federal Register notice announced the availability of the
Report to Congress and requested submission of public comment by
March 15, 19 88. EPA also announced that it would hold five
public hearings on the Report to Congress, the first of which was
scheduled for Washington, D.C. on February 23, 1988.
These comments are being filed pursuant to the Federal
Register notice of January 4, 1988, on behalf of the nine trade
organizations representing oil and gas operators in seven
Appalachian states. These organization are as follows:
Independent Oil and Gas Association of New York
Independent Oil and Gas Association of West Virginia
Kentucky Oil and Gas Association
Ohio Oil and Gas Association
Pennsylvania Natural Gas Associates
Pennsylvania Oil and Gas Association
<o c o w o ^ " P «•*• — _ J
_,«< i 0 to m
3 S, i* — -•
* §• rf <0
! » ! * 3 r«- =r - • a> =r 5- 3 a m p «•#• <o
tn
o G) 3D
o ro
1 '
\i
L


o
• { % j
•n < > 1 v$m \\\^ "Mr h* iv1 <* /Y)J$$
2. Independent Oil and Gas Association of West
Virginia.
The Independent Oil and Gas Association of West
Virginia is a non-profit state trade association representing
more than 170 companies engaged in the extraction and production
of oil and natural gas in West Virginia. In addition, its
membership includes nearly 400 other drilling, contracting, or
supplier companies, professional firms, and royalty owners. The
organization is dedicated to promoting and protecting a strong,
competitive and capable independent oil and natural gas producing
industry in West Virginia, as well as on the national level. Its
Board of Directors and staff work to maintain close liaison with
state and federal agencies regulating the oil and natural gas
industry; to disseminate information relevant to member needs; to
promote the legislative goals of the Association; and to
establish media and community relations to inform and educate the
general public on the economic importance of the oil and natural
gas industry to the State of West Virginia.
3. Kentucky Oil and Gas Association.
The Kentucky Oil and Gas Association (KOGA) is a
non-profit statewide trade association with 589 members,
representing crude oil and natural gas producers, mineral royalty
owners, drilling companies, and persons in related businesses.
The purpose of KOGA is to promote the common interest of the oil
and gas industry and to represent the industry on energy,
environmental, economic, legislative, and regulatory issues.
<o c o m o l 5" fiL £". ST -H • " S g S o l .H, «< i ° co m J
CD — • "* I
3 rt- =r - - Z CD co 3 p>
CO CD
L

i
f< -A ' >
O
f*V
l_
4. Ohio Oil and Gas Association.
The Ohio Oil and Gas Association is a non-profit
state trade association representing more than 2,100 companies
and individuals which comprise independent producers,
contractors, professionals, royalty owners, and others in allied
fields, all of whom are engaged in, or have a direct interest in,
the production of oil and natural gas in the State of Ohio. The
purposes of the Association are to protect, promote, foster, and
advance the common interest of those engaged in the industry; to
act as an information clearinghouse in the collection and
dissemination of pertinent information; to promote better
operating practices and improved production methods; to conserve
oil and gas and to prevent its waste; and, generally, to do such
things as may be necessary to accomplish these purposes. The
Association also works to establish better relationships with the
Ohio General Assembly, the United States Congress, and both state
and federal agencies. It also maintains close relationships with
other oil and gas industry organizations who have similar
interests and goals.
5. Pennsylvania Natural Gas Associates.
The Pennsylvania Natural Gas Associates (PNGA) is
a non-profit trade association representing companies engaged in
the exploration, development, and production of natural gas along
with various industry-related service companies. PNGA is
headquartered in Harrisburg, Pennsylvania. Its membership
includes approximately 55 companies of various sizes responsible
for operating the vast majority of independently owned natural
1,
zr z CO ft-3
CX JO =) CD C O
«=> S g » O I _* «< .ro co m I I1 S, ^ — -. 1 IS-?-I
* g" c+ CD I s - a » - * •
2 » B» I c * CO •
CD I

w—~
* * ,
u
.1 \
o
lo
hi\> if ft
,1 1 * ' I A / 1
V*
o
<o
V'r, t.
I
gas wells located in the Commonwealth. PNGA was formed in 1981
to encourage and promote professionalism in the exploration,
development, and production of natural gas; to provide a forum
for members of the Association to exchange views and expand their
knowledge relative to natural gas exploration, development, and
production; to assist members in educating and encouraging the
public to consider and appreciate the importance of natural gas
issues and to urge members to achieve higher degrees of success
and to adhere to high industry standards; to effect liaison with
other associations, agents, companies, governmental bodies, and
regulatory agencies and to encourage compliance with lawful
regulation of ail segments of the natural gas industry.
6. Pennsylvania Oil and Gas Association.
The Pennsylvania Oil and Gas Association is a
non-profit state trade association representing the state's
independent oil and natural gas producers and the allied
industries that serve them. The Association's membership numbers
approximately 600 companies, 70 percent of which are directly
involved in oil and gas production. The aim of the Association
is to promote the general welfare of the oil and gas industry in
Pennsylvania, and to educate the industry and public on energy,
environmental, economic and governmental issues. To accomplish
these goals, the organization works within all levels and
branches of government, disseminates information through its own
publications and the media, sponsors research, and offers a
variety of educational programs.
CO 5 CD £= O S " 0> *•*• — —i i 2 §8 8 Si —•• • • l
3 S, »" — — I m — • -*
zr ~ ^f i * c ** <°
3 «* 51 5" i
CD I
o: o 30
o IN)
I
Is
UN

w~
IS %
r>
w., ^ »tl
o
o
*$$&$£
J
O
;J
7. Tennessee Oil and Gas Association.
The Tennessee Oil and Gas Association is a
non-profit state trade association with 160 members representing
companies and individuals engaged in all facets of the oil and
gas industry from exploration and development to transportation
and sales and others in allied fields such as professionals and
suppliers, all of whom are engaged in, or have a direct interest
in, the production of oil and gas in the State of Tennessee. The
purpose of the Association is the advancement of a common
interest of all those engaged in the industry by the collection
and distribution of pertinent information, education of the
industry and public on matters pertaining to the industry, and to
maintain a close liaison with governmental and regulatory
agencies of the industry.
8. Virginia Oil and Gas Association.
The Virginia Oil and Gas Association is a trade
association organized to promote the interest of the oil and gas
industry in the Commonwealth of Virginia. Its activities include
providing the general public and legislative and administrative
bodies information concerning oil and gas operations in Virginia
and representing the interests of its members before legislative
and administrative bodies whose actions may have an impact on the
industry in Virginia. The Association is open to any person or
entity with an interest in the oil and gas industry and its
current membership includes individual and corporate
representatives from interstate pipelines, local distribution
companies, exploration and production companies, including
(o tz o m ol
_ «< ? m m | i" S, *t — — I
a g* cf <D I
| S = i r | 3 «+ 21 5" •

w—~ p~
' %
o
ft "as v-:\ > '
% f V %' ' 1 <t*
• v
L
percent of all new wells drilled in the nation were drilled in
the Appalachian states.
2. Strategic Importance of Region.
Appalachian crude oil and natural gas are
strategically important to the nation. While our crude oil
accounts for only 1.2 percent of the nation's production, it
contributes more than 14 percent of the nation's lubricants and
more than 24 percent of the nation's automobile lubricants with
additives. Our natural gas production is also important beyond
its mere volume because of its close proximity to major Northeast
markets and because of the extensive use of geologic formations
in Appalachia for the storage and retrieval of natural gas.
3. Small Quantities of Waste.
Appalachian wells produce small amounts of waste.
Our survey of more than 5,000 primary production oil wells and
12,000 natural gas wells in Appalachia reveals that 97 percent of
the wells produce less than an average of one barrel of water per
day. Furthermore, our drilling pits are typically among the
smallest in the nation.
4. Nearly All Wells Are Stripper Wells.
The vast majority of Appalachian wells produce
such small amounts of crude oil and natural gas that they qualify
as stripper wells. Our survey reveals that 99 percent of all
crude oil wells and 97 percent of natural gas wells satisfy the
FERC test for stripper wells. This makes the entire Appalachian
region extremely sensitive to any increase in costs.
cr ja 3 5- z » <= 9. O —• pj «•*• — i i I 3 ZZ. — - CD Z2
5s S. S-" 2.111 _ . » * —f- I
c + CO
a> = - 5 - 3 3 CO ™ Q> rt- CO •
CD I
o o 3D,
o 10
.:
si \

w~ r
ix< -
BW
o
©
• * * f c »
T-7-JT
5. Specialized Waste Disposal Practices.
Finally, a unique combination of waste disposal
practices have evolved in Appalachia. The climate, geology, and
hydrology of the region as well as the nature of the region's
drilling and production wastes have resulted in less reliance on
such disposal techniques as evaporation and centralized
underground injection and in increased reliance on such disposal
techniques as land application, roadspreading, stream discharge,
and annular disposal.
These factors and others, taken individually or
collectively, create a very special set of circumstances that
must be specifically addressed in this study. Our comments on
the Report to Congress will focus on these special circumstances
and how they should be reflected in EPA's followup to the report.
C. Previous Involvement With EPA.
It should be recognized that these comments have been
preceded by a long series of meetings with EPA including ones
occurring:
April 30, 1986,
° July 23, 1986, 0 December 13, 1986,
° February 24, 1987,
° June 2, 19 87, 0 June 9, 1987, and
July 15, 1987.
Eight formal sets of comments have also been filed by the nine
trade associations with respect to various phases of the study
10
- ^ S s o j CTJO =J J;- z — P> £± £• -H I
» m
I ""_.»=* I
2. £ s e> ri-1
° _ . i c o _» - — — 3 I P> B <o •
<B •
5 ST»

p-wi | • N • i/m * i
r
•i
* ,&7\ V » »
R1 > "? 3»l#
O
fcV
process. The comments include those filed with EPA on the
following dates: 0 January 15, 1987 [Interim Report on
Methodology]; 0 February 10, 1987 [Economic Impact];
° February 23, 1987 [Damage Cases];
° June 11, 1987 [Damage Cases]; 0 June 13, 1987 [Interim Report of April 30,
1987] ; 0 August 18, 19 87 [Preliminary Draft Report of
July 31, 1987];
° October 13, 1987 [Draft Report of August 31,
1987]; and
° November 30, 1987 [Draft Report of October
22, 1987].
In addition, the Appalachian Producers have appeared at public
hearings held in Washington, D.C. on December 3, 1986, and
February 23, 1988.
We request that the eight sets of written comments
previously filed with EPA by the Appalachian Producers and the
testimony of the Appalachian Producers at the two public hearings
be incorporated into these comments by reference.
As will be evident from a review of these comments, the
potential impact of the imposition of any new regulatory
requirements on the Appalachian Producers would be devastating.
We urge EPA to carefully review the special circumstances
surrounding the Appalachian Producers in light of the
11
rococo 5 P» !?. =- -H I 2 S g S 5 | _<,«< P co m |
c f CO CO CD
| o " 3 | 3 *+ 2" =• •
to co
o o 30
o ro co
I

r~
;i i
o
t V<1
\ ,N
*¥?« fc$?V*
Congressional mandate of RCRA Sections 3001(b)(2) and 8002(m) and
to determine that no changes in any regulatory requirements are
necessary to prevent or mitigate adverse impact on human health
or the environment resulting from the management of oil and gas
wastes.
III. COMMENTS ON THE REPORT TO CONGRESS.
In many ways, the Report to Congress filed on December
31, 1987 is a vast improvement over earlier versions. This is
particularly true when comparing the Report to Congress with the
interim draft of that report issued on April 30, 1987, which was
repleat with emotion and bad information. Even though improved,
the final Report to Congress fails in many ways to satisfy the
Congressional mandate for a "detailed and comprehensive study
. . . on the adverse effects, if any, of drilling fluids,
produced waters, and other wastes associated ." 42
U.S.C.S. §6982(m)(i)(1982).
Beyond the factual and legal errors contained in the
Report to Congress, one of the most serious flaws with the report
is its overall negative tone. Even though EPA has identified no
significant concern over either the current waste management
practices of the industry or the adequacy of current regulatory
requirements, much of the report is written in unscientific and
emotional terms that undermine the objectivity of the report.
These comments will focus on several major issues
related to the report beginning with the two matters that were
12
n> c o 5' PL £2".
«< - « rn = o a-- o „ -
• £•«+» I
3 c+ =r — _ » =r « 3 I
<o • 09 •
=J 0>

• « ••» |l f iii|_
r~
* * ,.
^
** .
I* J l i i
5 V ^
i
O
1 »
L
the subject of EPA's specific information request in the January
4, 1988 Federal Register, i.e., the scope of the exemption and
produced water injected for enhanced recovery. Our comments will
also address the future direction of the study and the related
rulemaking considerations.
A. The Scope of the Exemption is Overly Narrow.
By identifying the scope of the exemption in the
January 4, 1988 Federal Register publication as a matter
requiring special comment, EPA has recognized the critical nature
of this issue. The Appalachian Producers first discussed the
scope of the exemption with EPA in a meeting held on April 30,
1986. At that time, we urged EPA to make an early determination
as to which wastes were properly included within the scope of the
exemption, and therefore, within the scope of the study.
Notwithstanding this early discussion of the issue, we
now find ourselves again commenting on the appropriate
interpretation of this term — after the final Report to Congress
has been completed. By delaying a final decision on the scope of
the exemption until a time subsequent to a completion of the
Report to Congress, EPA has created the very real possibility
that it may define a class of wastes that are properly included
within the exemption only to find that the Report to Congress has
not considered those wastes.
The biggest problem contributing to EPA's inability to
define the scope of the exemption is its apparent desire to
narrowly construe the exemption and, therefore, the nature of the
wastes which should be included within the study. Both RCRA
13
CO C T J O 3
«ffgSo| W 2, *+ — 1!. I
<° £ - r* CO
F"*" r
** *J
& -f. ftt
i ' f t
"i
t T « , <S" »- t-Bfc
Section 3001(b)(2) and Section 8002(m)(1) direct EPA to examine
"drilling fluids, produced waters, and other wastes associated
with the exploration, development, or production of crude oil or
natural gas . . . ." Neither the statute nor the legislative
history contain any amplification of the terms "drilling fluids"
and "produced waters"; however, the legislative history does
contain an elaboration of the meaning of the term "other wastes
associated." On page 11-17 of the Report to Congress, EPA
recognizes the limited nature of this legislative history, but
nevertheless, extends that legislative history not only to "other
wastes associated," but also to "drilling fluids" and "produced
waters."
We submit that any reasonable interpretation of the
scope of the exemption results in the conclusion that "drilling
fluids" and "produced waters" should be included without
limitation in the exemption, and, therefore, the study. Neither
the statute nor the legislative history suggest that Congress
contemplated any limitations whatsoever on the scope of the
exemption of these wastes. Instead, it appears that Congress
intended this exemption to apply to drilling fluids and produced
waters whether they are discarded at the wellhead or at any other
point downstream in the exploration, development, or production
of crude oil or natural gas. We believe that the exemption
terminates with respect to drilling fluids and produced waters
only at the point of completion of the process of exploration,
development, or production of crude oil or natural gas which
should generally occur at the point of delivery of crude oil for
refining or of natural gas for manufacturing or burning.
14
O-JO CD C = SL (a a: - b * < of th
Imed
CD ex.
c d CD =J c+
3 O n-
3" a. c CD e-fr O r * 3 " CD
o5"z O
m - H o» o » m if th
clear
n- co
^ =r - •
CO CD
L_

p—*i ? '" '• '"'V.
/ *—*
^^
I * ' «
/•K
"i »
1_
With respect to "other wastes associated," the
legislative history suggests that Congress intended that in
interpreting whether those wastes would be included within the
exemption or not, EPA should take account of such factors as:
° the relationship of such waste to primary field
operations; 0 the point of custody transfer; 0 the point of production separation, dehydration or
transportation; and
° manufacturing operations.
The difficulty with these criteria when applied to real world
situations is that tying the scope of the exemption to such
factors as custody transfer may cause the scope to vary even
within individual crude oil or natural gas systems. As a matter
of administrative convenience, therefore, we urge EPA to define
the scope of the exemption with respect to "other wastes
associated" to have the same bounds as the exemption applicable
to drilling fluids and produced waters, i.e., all wastes should
be exempt to the point of delivery of crude oil for refining or
of natural gas for manufacturing or burning.
Beyond administrative convenience, we believe that
Congress intended EPA to apply a broad interpretation to defining
the scope of the exemption. The rationale behind broadly
interpreting the exemption is obvious. A broad interpretation of
the exemption would mean that EPA would broadly study these
wastes leading to specific regulatory determinations as to
specific waste streams. This view was confirmed in the November
15
erx> => <o tz o —• o 5" e. £ 5- =j _j,«< ? co m a" S, «• — - • 5 ^ co - *
<•> g-r+CO O * » =?• = ° rt-3 3 r+ = r - -co =r „• 3 3 CD w CO r + CO
CD

r~
11
i
A
' .1
/ ^
y
1
1
y
'&
r
o
I {* i, .< f i f
W
• ^
i 1 fvi/^f 0
o
o
L
17, 1987 letter to EPA Administrator Thomas from the Honorable
Quentin N. Burdick, Chairman, U.S. Senate Committee on
Environment and Public Works. A copy of Senator Burdick's letter
is attached and identified as Exhibit A. In that letter, Senator
Burdick stated:
A review of §8002 (m) of RCRA and the legislative history associated with that section reveals the clear intent of Congress that the scope of the study be broadly interpreted to include all drilling fluids and produced waters wherever they occur as well as associated wastes intrinsically derived from primary field operations. Given this Congressional intent, I urge you to include within the study the broadest possible scope of wastes associated with this industry.
We also urge EPA to broadly interpret the scope of the
exemption and the wastes which are properly included within its
study of the oil and gas industry. A broad interpretation of the
exemption would be consistent with the Congressional mandate
related to the study and would not preclude EPA from regulating
any wastes included within the exemption. To the contrary,
including a waste within the exemption would allow that waste to
be carefully studied by EPA with a view towards making an
informed decision as to whether or not that waste should be
subject to regulation pursuant to RCRA Subtitle C or pursuant to
any other regulatory program. Thus, a broad interpretation of
the oil and gas exemption at this time would preserve EPA's right
to impose further regulation on the exempt waste streams at a
later date should that action become warranted.
16
0 " J O 3 <0 C O CO
-i £- £ <o" =* _<< ? co m
W S, ** — — ~ ST °» § • <-• CD a. CD o S ° r+ =* 3 n- =r— co =r 5" 3
CD
CD ^ J j
m m 30: 3>1 ISJ;

r*"
iT i
V
Before turning to several specific items of concern
about EPA's current interpretation of the scope of the exemption,
we will recognize several aspects of the current interpretation
that we can support. First, EPA has abandoned its earlier
proposal that the exemption should extend only to wastes that are
generated at the primary field site. Even with respect to "other
wastes associated," the legislative history expressly provides
that the exemption was meant to apply to wastes "intrinsically
derived from the primary field operations." This would obviously
extend to those wastes whether generated at the primary field
site or elsewhere as long as they were "intrinsically derived
from the primary field operations."
EPA has also given proper recognition to the fact that
even marginal field operations will result in some small volume
of non-exempt wastes necessarily becoming mixed with such exempt
wastes as reserve pit contents. See Report to Congress, p.11-17.
In such a situation, EPA is correct in extending the exemption to
include the mixture of the exempt and the non-exempt waste. Any
obligation therefore, to segregate materials should extend only
to the segregation of "unused" materials, such as pipe dope and
motor oil, and not to the portions of those non-exempt wastes
that become inherently mixed with exempt waste during normal
field operations.
EPA has also correctly included within the scope of the
exemption "waste from subsurface gas storage and retrieval." See
Report to Congress, p.11-20. This is an obvious reference to
wastes generated by wells associated with the storage and
17
O-JO a =• as I TO c o m o l 5" EL 2: a -H •
2 ^ TO - * | 2. 3 » E> rt I <° §• rf TO I
=3 TO w p> I TO •
» '" » ' •%.
f
y
& n
R K ' ^ ^ J: §f§PK'J vk5Ss
©
o
l_
retrieval of natural gas in geologic formations. Those wells are
drilled and completed using the same techniques that are utilized
in drilling primary production wells. The operation of gas
storage wells is also similar to production wells, except for the
injection of natural gas during the summer injection cycle. In
most cases, storage fields are developed from depleted, or nearly
depleted, natural gas production fields. During withdrawal of
the natural gas, waters may be produced that are very similar to
the waters that are produced by a typical Appalachian production
well. The inclusion within the exemption of wastes from
subsurface gas storage and retrieval is, therefore, entirely
appropriate.
We also support EPA's conclusion that the exemption
should extend not only to material extracted from or injected
into the ground, but also to material introduced at the surface
to prevent freezing or to remove paraffin or otherwise to enhance
the performance of surface facilities. See Report to Congress,
p.11-18.
We are also supportive of EPA's efforts in paragraph 3
on page 11-18 of the Report to Congress to clarify the breakpoint
between primary field operations on the one hand and
transportation or manufacturing on the other. While EPA's
language is not entirely clear on this point, we believe EPA
intends for this breakpoint to be defined, in the case of crude
oil, at the point where the oil is transported to a refinery or
to a refiner, and in the case of natural gas, at the point where
the gas is transferred to a carrier for transport to market. As
18
rococo
_ ve J0 m m •—• • • l
I" S. ^ - ~ I • — 8 "* a-ft" S £
CD Ou r+ CD
§ st i 3 r+ =^ — - _ CD 3 - J - 3 I r + CO H
CD •

w^
if' , v c ,
we advised EPA in our comments of October 13, 1987, a very large
percentage of crude oil in Appalachia is moved from stock tanks
located at or near the well site to intermediate storage
facilities prior to being transported to refineries. While
reasonable efforts are made at the well site stock tanks to
remove water from the crude oil prior to being loaded into trucks
for transportation to these intermediate storage facilities,
there is necessarily a quantity of water that is carried with the
oil to the intermediate storage areas where is it removed and
handled as nonhazardous waste. The volume of water generated at
the intermediate storage tanks is certainly much smaller in
quantity than the water that is generated at the stock tanks
located at or near the well site. However, it is important that
the exemption extend to all of this produced water since it is
all part of the integral process of accumulating the crude oil in
advance of its transportation for refining. While we believe
EPA's interpretation of the scope of the exemption as contained
on page 11-18 of the Report to Congress, contemplates this
activity being within the scope of the exemption, additional
clarification of this point would be useful.
Turning to areas of disagreement with EPA's current
interpretation of the scope of the exemption, we offer the
following comments:
1. Separation Media.
On page 11-20 of the Report to Congress, EPA
identified among non-exempt wastes "waste iron sponge, glycol,
and other separation media." We strongly disagree with EPA's
19
o c o ™ o l 5' t» A =r -H • " "™• H CD •—• _
" s g S o l | S , 5 » 1 |
..-I 2 =*• 55 3 I t+ to •
(D •
C a r I
C+- CO
L mmum

• • . " " •
p~
saw ft s?wU Sbi'i'vi
IM1
U,fJ
/.< iVTJ-
I?
O
U
determination that these materials should not be included within
the scope of the exemption and the study. These wastes
intrinsically are derived from primary field operations and, as
such, fall within the category of exempt waste known as "other
wastes associated." EPA itself concedes on page 11-18 of the
Report to Congress that exempt wastes include those wastes
associated with measures "to remove impurities" from crude oil or
natural gas. We urge that these materials be included within the
scope of the exemption.
2. Recycled Materials.
While EPA addresses produced water that is
used in enhanced recovery (see subsequent comment), its current
interpretation of the scope of the exemption does not address the
reuse or recycle of other materials. 40 CFR §261.6 identifies
the circumstances under which these materials would not be
treated as hazardous waste under the existing RCRA Subtitle C
regulatory program. EPA's interpretation of the scope of the
exemption should recognize this universe of waste as not being
subject to hazardous waste regulation.
B. Produced Water Injected for Enhanced Recovery
Should Not Be Considered a Waste.
The second of the specific issues identified in the
January 4, 1988 Federal Register relates to whether produced
water injected for enhanced oil recovery should be considered a
waste. We believe the answer to this question is clearly no. On
page 11-18 of the Report to Congress, EPA proposes to interpret
the scope of the exemption as including the injection of produced
20
TO £= O m O = fi- £ TO
• H i

r
M-«
Ifa g^>v*vy
l*'*'*
35*
water for the enhanced recovery of oil and gas. We have no doubt
but that produced water used in this application is not a waste
material and should not be considered for inclusion within any
RCRA Subtitle C or other regulatory program aimed at the
regulation of wastes. Absent the availability of produced water
for this purpose, operators of enhanced oil recovery facilities
would be required to acquire water for injection purposes.
Produced water is therefore an effective substitute for water
that would otherwise need to be acquired to facilitate enhanced
recovery operations and should not be considered a waste.
C. EPA Has Correctly Included the Seven Appalachian
States Within Zone Two of the Study.
We commend EPA for maintaining the geographical
integrity of the boundaries of Zone Two in its Report to Congress
as detailed on pages 1-6 and 1-7. Zone Two, comprising the
Appalachian region, consists of the states of Kentucky, New York,
Ohio, Pennsylvania, Tennessee, Virginia and West Virginia.
Six of the seven states represented by the trade
organizations filing these comments were considered by EPA to be
within Zone Two of its original Draft Sampling Strategy dated
May 5, 1986, which guided EPA's field testing during the summer
of 1986. See U.S. EPA, Office of Water Regulations and
Standards, Oil and Gas Exploration, Development and Production,
Sampling Strategy-Draft (May, 1986). At a meeting with EPA on
July 23, 19 86, the Appalachian Producers requested that Ohio be
added to Zone Two in order to give the zone a geographic scope
encompassing the Appalachian region. EPA had no objection to
21
<B c o m o 5' £- £f- 5T 3 _,«< - » m | g , r t ' 2 . 1 2. £ 5T S> H.
10 JJJ" rt- to § • » P =S
3 r+ =r - • <o =r j ; - 3 => » P>
CO
L

r
? i rm
,-*"'* (I I' t J]
4t
hS
m
i_
such grouping and this alignment has been reflected in EPA's
subsequent reports concerning this study.
4. EPA's Damage Case Review is Flawed and Does Not Support
the Agency's Assessment of Specific Disposal
Techinques.
1. General.
EPA properly describes its study of damage cases
as being limited in nature and without statistical significance.
The Agency notes on page 1-7 of the Report to Congress that the
case study approach called for by RCRA Section 8002(m) is
intended only to define the nature and range of known damages,
not to estimate the frequency or extent of damages associated
with typical operations. The numbers therefore do not have any
statistical significance and do not bear any statistically
significant relationship to the actual types and distribution of
damages that may or may not exist across the nation. EPA also
notes on page 1-8 of the Report to Congress that the total number
of cases bears no relationship, either implied or intended, to
the total extent of damage from oil or gas operations caused at
present or in the past.
Nonetheless, it is with great concern that we note that
EPA, despite these cautionary statements , relies solely on its
damage case analysis to support its conclusion criticizing
certain disposal techniques used by the industry. On pages
VIII-1 and VIII-2 of the Report to Congress, EPA criticizes the
use of several technologies as being less reliable and cites as
authority damage cases occurring in Appalachia. The use of these
22
cr JO a r z to c o w o 5" SL =? » d _^«< F W fTI
W 3, * — -•
§ • • P =S
3 rt- =r --<o =r 5- 3 => » P» €-•- C O
<D
o o 3D
& o 10
!""•»" 1 » ' • .•> i
[~
)S3 J, 1 5 s '•'Sis
R S F M S J r""!*.*•»las <-j
damage cases to support an overall conclusion that the
technologies or practices at issue (land application,
roadspreading, annular disposal and stream discharge), are less
reliable and, thereby, increase the potential for environmental
damage in certain locations is unsupportable. This is
particularly so given EPA statements in the Report to Congress
that its damage case study is limited in nature and without
statistical significance. For this reason, EPA's use of this
data in this manner is misleading and highly inconsistent. The
characterization of annular disposal, land application,
roadspreading, and stream discharge as environmentally unreliable
is even more distressing in light of the justifications set forth
later in these comments which indicate that these practices can
and are practiced in Appalachia in a way which protects
environmentally sensitive values.
Specifically, EPA emphasizes in the Report to Congress
that its damage case study is intended "to gain familiarity with
ranges of issues involved" and is not intended to be a
"statistically representative record of damages in each State."
See Report to Congress, p.IV-10. Again however, based solely on
these damage cases, EPA makes a determination that certain
disposal practices are "less reliable in locations vulnerable to
environmental damage." See Report to Congress, p.VIII-1. As
previously mentioned this is not only misleading but
inconsistent, particularly in light of the fact that the
environmental waste disposal technologies which EPA criticizes as
less reliable are in fact carried out under extensive state
regulatory control in an environmentally acceptable way.
23
CT-J3 CD C 5 S L
CO ^
-*«< of th
imed
CD
O L .
O C
3 CD ZD r*
=1 O
a"
5* a. CD
o r * =r co
5" = o 5T=J
09 O » m if th
clear
t+ CD
^ =»• =r
CO CD
o o 39
o
L


f~
4<??1
U •<m
&1* v v 5A- IP
5 •' J /•
©
•fB*
im*-
l_
to Congress, p.IV-24. This allegation is totally unsupported by
the study and contrary to the fact that several thousand such
land applications have occurred in West Virginia since July 1985
with no reported case of permanent vegetation damage. Finally,
in its assessment of waste disposal technologies, EPA completely
fails to address the land application of drilling fluids as a
currently employed waste management practice. In short, EPA's
conclusion that land application is an environmentally suspect
waste disposal technology is completely unfounded in light of
current practice in the industry of the Appalachian region.
Land application of drilling fluids is important to the
Appalachian operators because it provides an environmentally safe
and economical method for the disposal of drilling pit fluid.
Climatological and geological constraints in Appalachia make it
impractical to use disposal techniques that are used by other
operators in other regions of the country. For instance, because
the net precipitation exceeds the net evaporation rate in the
Appalachian states, evaporation of drilling fluids, as is
commonly practiced in the Southwest, is not possible. The low
permeability of geological formations which are available for
injection of drilling wastes severely reduces disposal well
injection rates and therefore makes underground injection of
wastes impractical in most cases. The remote locations and
rugged terrain in most of Appalachia increases transportation
costs significantly and thereby creates a disincentive to the use
of centralized treatment or injection facilities in the
Appalachian region. Newly developed disposal techniques, such as
25

r
' ', I'M I
'T I /
solidification, are cost prohibitive. The marginal profitability
of Appalachian wells is such that any additional costs may render
drilling uneconomical.
In West Virginia, a general permit for the land
application of drilling fluids was issued by the Department of
Natural Resources in July, 1985. Since that time, approximately
2,000 drilling pits have been sampled, treated, land applied, and
reported. Out of these 2,000 cases, there has been only one case
where any impact on the environment was detected — a case which
EPA has, as previously commented upon, badly mischaracterized.
Obviously, the disposal of 2,000 pits without a problem
demonstrates that, as conducted in accordance with permitting
requirements presently existing in West Virginia, land
application of drilling fluids has proven itself an
environmentally acceptable disposal technique. The fact that
land application has proven itself to be an effective and
environmentally safe mechanism for the disposal of these fluids
is supported by three facts.
(1) The average drilling pit capacity in Appalachia
is only about 2,000 barrels or less. A one-time land application
of this small volume of waste, conducted in accordance with the
carefully controlled requirements of the West Virginia general
permit, has been shown not to harm the environment.
(2) Most wells of Appalachia are drilled with rotary
drilling rigs using air as a circulating medium. Discharged pit
fluids are usually encountered in shallow formations and
therefore have low concentrations of pollutants. Unlike drilling
26
<o c o w oB 5" P» !± =r -H • _^«< J° CO m | f o f f 2 . l i 2 ^" _ co -*• £. £ 55" P> I
w £ *• CO I § • • p!"=s:
§ £ " => co p> I
<o •
L
I

r
,,i
t v* ' ?" c * -T US
ji'V ' ( •>
^
#fem
3
t>f P
fluids elsewhere, drilling fluids used in the Appalachian states
are water-based with few additives. Where these fluids are used
at all in drilling a well, they generally consist of water mixed
with low concentrations of potassium chloride, a material used in
agricultural fertilizer.
(3) The final factor contributing to the environmental
acceptability of land application of drilling fluids is the
current adequate regulation and enforcement of this practice.
Despite the success of the first land application general permit
issued in July of 1985, when the permit was reissued in January
of 1988, a number of changes which further insure protection of
the environment were made. Chloride concentrations were reduced
from 25,000 ppm to 12,500 ppm. Additional monitoring of total
organic compounds and other constituents is now required.
Additional restrictions concerning the discharge of pit fluids
were included as terms of the permit as well.
In conclusion, EPA's blanket condemnation of the
practice of land application of drilling fluids flies in the face
of a three year history of environmentally successful use of this
technique in West Virginia of over 2,000 reported discharges.
The single case upon which EPA relies has been badly misconstrued
to suit the "^Agency's self-serving conclusion that land
application is environmentally unsound and ignores the true facts
of that case. A proper and complete examination of this disposal
practice must lead to the inalterable conclusion that, as
practiced in Appalachia and particularly in West Virginia, land
application of drilling fluids is environmentally sound and
protective of the environment.
27
C T . O <D C
s-e. «° ~ -*>«< of the do Im
ed
d CD 3 r+
n o r£ O CD
3" CL c CD
O
«-<• r r CD
• o m~* » O <» m
if the f i clear tha
1* =r - • 5*=* to CO CD
o o 30
o CO
L

r
V- $ <%
Ik I
t< M i „ j
&..
/.a
if
V
1 5*
i*B
~ - J , , M >ki^
o
wiW
ft!?"** s *' " " 1 g& , /rt '5. , 3'3 FSWA / ? tg* .„ * & s , v i l l i
3. Stream Discharge.
As was the case with its condemnation of land
application, while properly describing its study of damage cases
as being limited in nature and without statistical significance
[See Report to Congress, pp. 1-7, 1-8], EPA nevertheless relies
solely on these damage cases and their analyses to support the
conclusion criticizing stream discharge as a disposal technique.
See Report to Congress, pp.VIII-1, VIII-2.
While the Appalachian Producers are sensitive to the
Agency's concern that stream dischargers assure that no harm will
result to receiving water bodies, we believe that stream
discharges, where properly carried out, are a viable disposal
option in the Appalachian Basin. Stream discharge is a viable
disposal option not only because of the availability of a surplus
water budget coupled with relatively low volume of waste being
produced by Appalachian operations and the concomitant
economically marginal nature of the region's stripper well
industry, but also because the practice is already subject to a
comprehensive framework of regulations under EPA's NPDES program.
The Agency's analysis has failed to take these facts into
account.
Operators who wish to use this disposal option are
required to obtain a permit for each stream discharge; to abide
by a set of nationally recognized effluent guidelines; and to
meet specific state water quality standards. The greatest
existing deficiency in the program is that EPA's effluent
guidelines allow stream discharges only with respect to produced
water from stripper oil wells. As the result of a federal court
28
cr.es 3 J5" Z
_j,«< ? w rn | W S.«+ — - -1 S.£«> fi . J
3 «+ sr —-. <o 3 - 5 - 3 =» <o ™ pi cfr (a '
to 1

w~
^{ ; |
«/
o
decision and a petition filed by the nine Appalachian trade
associations on July 14, 1987, EPA currently has its effluent
guidelines under review for purposes of determining whether the
guidelines are appropriate in all applications. The Appalachian
Producers requested the suspension of existing zero discharge
requirements for all oil and gas operations in seven Appalachian
states. EPA has been requested to consider whether the effluent
guideline is overly stringent, particularly in light of its
application to wells in the Appalachian states where evaporation
and underground injection are not generally available.
The concern which EPA expresses over stream discharges
in its Report to Congress is clearly limited to potential impact
on sensitive or fragile waterways. We are convinced that working
with EPA to address the petition for review of the effluent
guideline under the Clean Water Act is the appropriate mechanism
to regulate a viable and appropriate disposal practice as
presently engaged in the Appalachian region. Accordingly, we
also feel that because of the existence of comprehensive
regulation under the Clean Water Act, EPA's condemnation of this
practice as part of its Report to Congress is an attempt by the
Agency to achieve regulation of this practice under separate
authority. Because EPA has not studied the environmental impact
of stream discharges appropriately in this study and because such
discharges are presently comprehensively regulated and, indeed,
more appropriately regulated under the federal Clean Water Act,
the conclusion in the Report to Congress that stream discharge is
29
• s CTJ3 3 CD C O
Sis SS|
c+ CO I CD CL ,
3 e+ =^ — • . to =r s" 3 I r* to •
CD •
o G) 3D > ,
o GO
I
s i . Ill
;i;''c.iS£

F-""
J"™"
> A
w ,
rf V
o
h h,v
~\
-r-j-
environmentally unreliable is both inappropriate and factually
unfounded.
4. Annular Disposal.
Annular disposal, as presently engaged in Appalachia,
is an environmentally sound and commercially viable disposal
option for brine. Once again, as in its previous treatment of
the land application and stream discharge disposal options, what
EPA has given with one hand, it is taken away with the other in
an inconsistent manner. While EPA properly describes its study
of damage cases as being limited in nature and without
statistical significance [See Report to Congress, pp.1-7, 1-8] ,
it nevertheless relies solely on the damage case analysis to
support its conclusion criticizing annular disposal as
unreliable. See Report to Congress, pp.VIII-1, VIII-2. This
conclusion is inconsistent, misleading, and only exacerbated by
the fact that EPA relies on a case allegedly giving rise to
damages in which disposal practices used in that case are now no
longer employed by the industry in Ohio.
More specifically, while EPA emphasises that 58 out of
its 61 damage cases occurred in the last five years [See Report
to Congress, p.IV-1], the sole case upon which it relies to
condemn annular injection of produced water occurred in 1975. See
Report to Congress, p.IV-16. Reliance on this case by EPA is
clearly inconsistent with the Agency's goal in the study to
"emphasize development of recent cases that illustrate damages
created by current practices under current state regulations."
It is also contrary to EPA's reliance on a five year time frame
30
CO CD C O „ ,
^ SS Sol ,«< - » m o H-" 2- — I
•g-i+al
°!Hi'=i 3 •* 51 5* • CB =r J;- 3 I r-t- <£ •
CD •

"•"•^B-
•0 1J
3 P 1 <»i r e " , t * i "
o
o
for use of cases in its Report to Congress. See Report to
Congress, p.IV-1.
EPA's statement that "historical damages that occurred
under prior engineering practices or under previous regulatory
regimes has been excluded, unless such historical damages
illustrate health or environmental problems that the Agency
believes should be brought to the attention of Congress now" [See
Report to Congress, p.IV-1], offers a tenuous basis for the use
of the Donofrio case (OH 39), and is totally self-serving. This
justification affords EPA the opportunity to report to Congress
on any damage case despite the fact that the damage case is not
likely to occur in this day and time, because of adequate
existing regulatory programs.
Since the Donofrio case occurred in 19 75, applicable
regulatory requirements in Ohio regarding annular disposal have
been substantially modified. EPA's use of this case once again
allows the Agency to construe data in a light most favorable to
the Agency's conclusion that annular disposal is unreliable
environmentally and also allows EPA to ignore the merit of this
disposal technique as it is presently in practice under existing
state regulations in Ohio.
In Ohio, an operator desiring to conduct annular
disposal must seek permission of the State regulatory agency.
Any annular disposal well must be constructed with the surface
casing which uses cement or prepared clay to completely seal off
the casing to a depth of at least fifty feet below the deepest
underground source of drinking water. To avoid corrosion of
31
Li
CTJQ Z3 —" p> r r _-. _ j
CD
<D
= * * - * * m |
a St I 3 r+ ST — • . co =r 5J- 3 3 o w m
CD I
o o 30
o N> CO
<
i !
L

p~
ti->
Ti |M< -'si
if'' !{ ' ' '"* J<
> /<••
- , { ! •
I**-
l_
pipes and fittings, all produced water is transported to the
annular disposal well in an airtight system. Volume limitations
are placed on the amount of material that can be placed into the
well and no pressure can be used, except that as supplied by the
force of gravity. Every five years, mechanical integrity tests
are required on annular disposal wells to assure their ability to
prevent contamination of surface or subsurface soils or waters.
Once a well ceases production of oil or gas, all annular disposal
operations must cease and the well must be plugged.
It should also be pointed out that the geological
formations in Ohio allow the practice of annular disposal to be
carried out in an environmentally suitable fashion. There are
several reasons why this is the case.
° No open commercial oil and gas zones exist from the top of the surface casing to the top of the production casing cement.
° The injection zone is isolated and deep.
° The strata of Ohio are level, dipping approximately one degree to the southeast. This lessens the possibilities of up-dip migration of brine out of the injection zone.
° Cable tool drilling logs have provided the State of Ohio with accurate descriptions of where fluid producing and fluid taking zones are located.
° The geologic conditions are fairly uniform over the eastern half of the State of Ohio. This coincides with the area of production in the state.
In the twenty-one years that annular disposal has been
used in Ohio, there have been less than ten cases of known
ascertainable environmental damage. These cases have occurred
32
er-o 3 CD C O 5* P> £±
- b ^ -it is of th im
ed
at a. ex. co o ° 2" 3 r+ CD 3 " 3 CD c+
NOTIC is les
» m if th clear
r+ 0>
ia =r — to
CO CD

f~~
/ •>•
if f
^ .i-*»
'it ; « ' r
V" "I
L
under disposal practices and regulatory requirements that are no
longer applicable. As previously mentioned, the principle case
upon which EPA relies in condemning annular disposal is the
Donofrio case, which occurred in 1975. No other efforts have
been made by EPA to assess the environmental acceptability of
annular disposal. Reliance upon a single damage case that
occurred more than thirteen years ago under regulations and
disposal practices that are no longer in effect and the
concomitant wholesale failure by EPA to examine in any sense the
current practices of the industry as regards annular disposal and
how the industry is regulated in Ohio at the present time
constitutes a totally inadequate basis for reaching a conclusion
that annular disposal is environmentally unacceptable. We would
be willing to work with EPA to conduct the type of study that
would be necessary to prove that annular disposal is a
meritorious disposal option of suitable environmental
acceptability.
5. Well Fracturing.
EPA is incorrect in its statement that the fracturing
of a well can result in contamination of nearby water wells. See
Report to Congress, p.IV-22. Such a statement is completely
without support in the study. In fact, we know of no case where
this has occurred given proper casing. The zones which are
fractured are several thousand feet below the deepest fresh water
zones making contamination of the fresh water zones extremely
unlikely.
6. Roadspreading.
EPA, as one of its conclusions, condemns the practice
33
CO co e o ~ o l 5" P> ET. =r -H •
=• S, ?? 2.1!. I 2.r+<» e» - I «0 fi» r f l
=> «•+ = T =;• • I
co =r j;- _ CD w p> <o
CD
1,1
I


p~
5['
Kir? \ > ^ Si' A i'» ' 'A
iV,i ' J •>' 5 I f
i t ' J 1 ? * - '
I
! V '
w •Wif '•ft*.
L
such application. Public hearings on whether or not to adopt
such a resolution to permit surface application of brine must be
held. Input by State and federal regulatory authorities is
provided for in the statute. Performance guidelines are
additionally set forth in the statute which dictate where brine
may or may not be applied; when brine may be applied; the
technology by which brine may be applied; and the pressure at
which brine may be applied. Prior to the application of brine to
road surfaces, the applicant must submit a plan which identifies
the sources of brine to be used; identifies any transporters of
the brine; identifies the places to which the brine will be
applied; and describes the method, rate, and frequency of brine
application. Additionally, local governmental authorities may
attach whatever terms and conditions seem suitable to the plan
prior to any actual roadspreading. See generally ORC 1509.226.
In Pennsylvania, the Department of Environmental
Resources' Oil and Gas Operators' Manual prescribes, in Chapter
Four, applicable requirements for roadspreading of produced water
for dust control and road stabilization. Requirements have been
adopted under the authority given the Department pursuant to the
Pennsylvania Clean Streams Law. Appropriate rates of application
must be used in roadspreading. A plan which minimizes the
potential for pollution from the use of brine for dust control
must be submitted to the DER for its approval prior to
implementation. This plan must include the following: (1) the
name, address, and telephone number of the person seeking the
approval; (2) a statement from the municipality or other person
35
t. c r . o =i CD C O - O l -* — ~ CD _ EL " • ° s g » o . -*«< • « r n |
co a. _ •£ I «-«• CO
3 r* =f —• .
to • CD B
Z> CO
mm

b?;'' -
E H f"i ' :r ->> *'*' ' 5fv
authorizing the use of brine on their roads; (3) a map of the
municipality or area identifying the roads which are to receive
the brine; (4) a description of how the brine will be applied
including the equipment to be used and the method for controlling
the rate of application; (5) the proposed frequency of
application; (6) identification of the geologic formation from
which the brines are produced; (7) identification of any
materials which may be included with the brine, such as drill
cuttings, detergents, friction reducers, hydro-fracturing
materials and a chemical analysis of certain parameters. The DER
prescribes additional terms and conditions under which brine may
or may not be applied including brine application rate; locations
where brine may not be applied in terms of roadgrade; locations
where brine may not be spread on roads including what roads;
appropriate labelling of vehicles applying brine; and submission
of monthly reports indicating roads to which brines were applied,
quantities of brine applied, and dates of application. See
generally Department of Environmental Resources, Oil and Gas
Operator's Manual, pp.IV-72, IV-74. In addition, PNGA sponsored
an independent study entitled "The Feasibility of Utilizing
Production and Other Oil and Gas Well Fluids as Dust Palliatives
and Deicers" in 1984. This study reviewed Pennsylvania's
roadspreading program and concluded "since oil and gas well
fluids are not substantially different in composition from
commercial salt, similar environmental concerns are apparent.
However, with proper management techniques (application
procedures, and rates, etc.) to minimize environmental impact,
36
cr.a a tr to «r o w o
— CD rt• _ a —- X" CO
-j,«< i" to m
W 3, 3-" — -.
2. £ « S ^
» a-3 i" c ° rt-3 3 r+ =r - • CD =r £• 3 3 CD w to r+ to
CD

*%• * .
3 f
n
H I "
J
*h - I ^
l_
these fluids can be used effectively for dust and ice control."
Moody Study, December, 1984, p.ii.
Finally, in New York, a comprehensive system of
regulation of roadspreading of brine is in place under 6 NYCRR
Part 364. Under these regulations, permits are required for the
roadspreading of brine which must be renewed periodically.
Landowner approval is required before brine may be roadspread.
Analyses of the brine must be done for a variety of parameters.
There are volume restrictions as to the amount of brine which may
be roadspread, as well as restrictions regarding location of
application. No variances are allowed from these regulations.
The foregoing recitation clearly points out the
extensive level of regulation to which this activity is subject
in the Appalachian states to insure that the practice is carried
out in an environmentally safe, acceptable manner contrary to the
conclusion reached by EPA in its Report to Congress.
7. Other Comments Relating to EPA's Flawed
Damage Case Review.
We commend EPA for its recognition in the vast majority
of damage cases cited in Chapter IV of its Report to Congress
that current state regulatory programs are frequently violated by
the types of damage cases relied upon by EPA. This recognition
by EPA, we feel, clearly supports the contention of the
Appalachian Producers that adequate authority exists under state
and federal regulatory programs currently in effect to handle any
alleged environmental problems that result from improper waste
disposal practices in the industry. This assessment is a vital
37
cr ja CD ( = 5-SL to a: -**< of th
Imed
CD a. o o c d CD 3 c+
3 O
o"
«-f
35" Q . CO
O r h =r <D
co" 25
CD =3
J2 ° « m CD - «
c + CD
ST a ~* ar - . 5 ' ^
CO CD


*,, I
ft Hi
Xv »V, ^4
o
J
unclear why the Agency continues to rely on this damage case to
support its somewhat tenuous conclusion.
Regarding alleged illegal disposal of oil field wastes
in Pennsylvania, EPA acknowledges on page IV-20 of its Report to
Congress that spills or accidental releases of oil or gas wastes
in Pennsylvania are not routinely associated with extraction of
oil and gas. However, EPA continues to characterize the
Pennsylvania experience, in the context of discussing damage
cases PA 02 and PA 09, in an inflamatory manner by stating that
"spills in this area of Pennsylvania appear to represent
deliberate, routine, and continuing illegal disposal of waste
oil." There is no evidence to support this callous assertion by
EPA and, in fact, the Appalachian Producers have in the past and
continue to dispute this statement. EPA's reliance on this
statement is completely unfounded.
In its discussion and condemnation of damage to water
wells allegedly caused from oil and gas well drilling and
fracturing, EPA in its Report to Congress continues to make
erroneous statements. Of particular concern is footnote 17 on
page IV-21 of the Report to Congress, where EPA notes as follows:
According to members of the Legal Aid Society of Charleston, West Virginia, land owners have little control over where oil and gas wells are sited. Although a provision exists for hearings to be held on the question of siting of an oil and gas well, this process is rarely used by private landowners for economic and other reasons.
This subjective statement incorrectly characterizes the law and
ignores the basic principal that a provision does, in fact, exist
for a landowner to challenge the siting of a prospective oil or
40
CD C T J O 3 CO C O —• {D r * —
CD CX. c Ou CD
° !? = 5 = ° r+ = 3 <•+ =r— CD =r 5- 3 3 10 P ft* CQ
CD
8 <-f CD
P 3 !

r
t--i
, I J -
\o it y
MU
* ' Aim o
i,M r.« \^;-rm t H c/ "AS
•»^
4
Ǥ
TJf
L
The Agency's continued reliance on this case ignores comments
also found in the August 18, 1987 letter to Dan Derkics noting
that the case initially did not even involve waste disposal and,
in any event, subsequent regulatory changes rendered the case
irrelevant. Additionally, no statement has been added, as is
apparently the case in all other damage cases cited by the EPA
study, that current regulations adequately address this type of
alleged problem.
In discussing problems with enhanced oil recovery and
abandoned wells in Kentucky at page IV-24 through page IV-26 of
its Report to Congress, EPA relies on the Martha Oil Field case.
While we do not take issue with the characterization of this
case, we have previously noted in our comments dated November 30,
1987, that the case must be placed in proper perspective in light
of EPA's statutory mandate to assess the adequacy of existing
state and federal regulatory programs to prevent or mitigate
environmental damage. EPA has, on page IV-26 of its Report to
Congress, noted in a paragraph the Agency's response to the
Martha Oil Field problems. However, although we commend EPA for
noting that response which the Agency has taken there, it should
have added a concluding statement noting that the Agency's
response was an example of the adequacy of existing federal
regulatory programs to deal with environmental damages caused by
oil and gas operations.
42
a - 2 C T J O 3 CD C O 5* EL "* a-- S « o I «< - » m =r o =: o <+ Si.
a. \ re -% I
CD
2. r+ W P» g. g - c+ CD
a. CD ^ o
3 «-*• =r — CD =r = • 3 => » P»
CD
turn

F"*" mp*mr^ w ""v.
¥ -
*. r *
IhVrv
i < ; i l
Ji
-j
o
O
E. EPA Has No Basis for Its Conclusion that Significant
Technical Improvements in Waste Disposal Techniques
in the Oil and Gas Industry are Foreseeable.
While EPA's Report to Congress ultimately concludes
that any program to improve the management of oil and gas wastes
in the near term will be be based largely on technologies and
practices in current use [See Report to Congress, p.VII-2], we
are concerned about several statements appearing elsewhere in the
Report that seem to suggest that significant improvements in
waste disposal technologies are foreseeable. We strongly
disagree with this conclusion, particularly as it applies to
operations in the Appalachian states.
Our particular concern is focused on the conclusory
statement contained on page VTII-2 of the Report to Congress in
which EPA states that it foresees the possibility of significant
technical improvements in future technologies and practices,
citing such technologies as incineration, recycling, and wet air
oxidation. A careful review of the Report to Congress reveals
that the only discussion of that conclusion in the body of the
Report is contained on pages III-2 and III-3. That discussion
however, offers no support for EPA's statements on page VIII-2
and instead, contradicts that conclusion. On page III-2, EPA
states as follows:
At least for the major high-volume streams, there are not significant newly invented, field-proven technologies in the research or development stage that can be considered "innovative" or "emerging."
43
er x* CO c = £. aa a; - * « < of th
Imed
CD
o o 3 CD 3 c+
SJ o rt; CD
3" o. c CD
O r+ =r CD
5 " Z
o m~* to O w m . if th
clear
rt- CD
CD ""*
ia ar —-CO CD

•W "• • " • ( -
p~
V, $
ITS
s-m1",,, ("A t '-See
W At V *&fl
O
41 *
3
IP
»
t ,-i"
L
EPA's conclusion that significant technical
improvements in this area are foreseeable is purely speculative
and not supported by any objective findings of the Report to
Congress. This is a matter of particular concern in the
Appalachian states because of the unique waste management
practices that have evolved as a function of the careful balance
which exists between environmental protection and economic
realities of Appalachian wells. As the result, there is no basis
for believing that any significant change in waste disposal
practices is foreseeable in the Appalachian states.
Even something as relatively simple as the segregation
of wastes suggested on page VIII-3 of the conclusion to EPA's
Report to Congress, must be carefully examined for its
application to Appalachian operations. It is essential that EPA
continue to recognize that the complete segregation of exempt and
non-exempt wastes is not feasible during normal operations.
Small amounts of non-exempt material will necessarily become
mixed with exempt wastes during these normal operations. If
segregation of waste is appropriate at all, it should be limited
to only the segregation of unused materials, such as pipe dope,
motor oil, solvents, and similar materials and be directed
towards assuring that these materials are not deliberately and
unnecessarily disposed of in reserve pits. Even in those cases
where the segregation of these limited materials is appropriate,
we urge EPA to carefully review any regulatory requirements that
might be imposed to assure that they are protective of the
environment without being unnecessarily costly from either an
44
o "' o r f — Z J I a
3 -i> J"*" jj- =51
00 O -
a> 3 - 5 - 3 r + CO '
05 I
H Huaw

F-*" "P »••*_
r~
,f
fit
. /
' hi
% L
n^
^»r .^jM
•J
l_
environmental control or an administrative viewpoint.
F. Existing State and Federal Regulatory Authorities
Are Adequate to Prevent or Mitigate Adverse Impacts.
While the Appalachian Producers concur with EPA's
conclusion [See Report to Congress, p.VIII-11], that the
application of full, unmodified Subtitle C regulations to all
exempt wastes appears unnecessary at this time, we are extremely
concerned about EPA's recommendation that it is necessary to
conduct a further review of state and federal programs with a
view towards possible modification.
From our review of the Report to Congress and from our
own assessment of the state regulatory requirements, at least for
the seven Appalachian states involved, it is apparent that
existing regulatory requirements, both state and federal, are
more than adequate to prevent or mitigate any adverse impacts on
the environment caused by the management of oil and gas drilling
and production wastes. Nearly all of the damage cases cited by
EPA in its Report to Congress would violate present day
regulatory requirements should they occur today. In fact, most
of the damage cases cited by EPA violated regulatory requirements
at the time they occurred. In those cases where the damage case
did not violate requirements that were in effect at the time the
damage occurred, subsequent regulatory developments have
consistently been implemented to address those concerns. In
short, we have not identified any of the damage cases related to
the Appalachian states that would not violate current regulatory
requirements should they occur at the present time.
45
to c o m o —• Q) r* _ 3 3 — 5!" CD — <° s-- S » o _ ,«< - » rn W S, s-' — — S.g:cD P> H.
m g- rt- CD g-CD g*-J» " Pf = W f= ° r+* 3 rt- =r =• co =r 5 - 3 =J CO w p) «•+• to
CD

•• " • * • p " I—
•.' •.••'•••.!;:;.-» , I ; : , . M , : . > ^ V J | J
V5':'
llltiiiai
Sr«ilii3i *•»
i?, ^*;Kv>«ci5'-%;.ii:r«.a Pr^-.^':};ii/jl1>.'?\*.,, ;;;,'w'
vif * ?'^ll^?©?':^
o
msmk J- " V.'-!--'^v;-- '•!••-- *"-"• :' 'I'M
1;Sfifcs^sSs*;K;*o,;ia-;;i
The most significant shortcoming in EPA's analysis of
existing regulatory programs is it's apparent failure to
recognize that these programs have evolved significantly in the
last few years. In addition, major changes in state regulatory
programs are underway at the current time. For example, an
entirely new regulatory program has been proposed for adoption in
Pennsylvania. In West Virginia, a new general permit for
drilling fluids was issued in the last 60 days with efforts
underway to issue a general permit addressing the handling of
produced water. Moreover, each of the states has statutory
authority which allows them to address virtually every aspect of
the waste management practices of the oil and gas industry as the
need to do so is identified.
We believe there can be no dispute but that existing
state and federal regulatory requirements provide a full and
exhaustive set of regulations already in place, along with the
process to update and refine those regulations either now or in
the future as the need to do so is identified. As will be
discussed in greater detail later in these comments, this fact
provides the basis for a decision not to impose any further
regulatory requirements on Appalachian operators.
G. EPA's Risk Assessment Modeling Shows Negligible
Impacts on the Environment.
While the Appalachian Producers do not necessarily
agree with the appropriateness of conducting risk assessment
modeling in the context of this study, we do share the conclusion
46
<» e= o m o 13 — s* <o — «> S-- g w O
g-*0 P IS " J + 3 5" c ° n - 3 3 rt- =r --3 ffl " P r + CO
CD

F - ^
Kf,'
1 a* „%1
St. 'SP .V"1 '„iA W ( ...
u
1_
reached by EPA that if there were release of toxic chemicals, the
risks would be "very small to negligible." See Report to
Congress, p.V-64. We remind EPA, however, that the quantity of
waste produced by Appalachian operations is much smaller than is
produced in other regions of the country. We believe that the
necessary result of this fact is that the risks related to these
operations would be even smaller than EPA determined through its
own analysis.
As we have pointed out elsewhere in our comments, a
typical drilling pit capacity in the Appalachian states is less
than 2,000 barrels and frequently is as small as 500 barrels.
With respect to produced water, our survey of more than 17,000
primary production gas and oil wells indicates that nearly all of
them produce less than one barrel of water a day. This data,
submitted to EPA in our formal comments of February 10, 1987,
also revealed that for gas wells, 39 percent of the wells
produced no water at all and 90 percent of the wells produced 1/3
barrel of water per day or less. For oil wells, the survey
results revealed that approximately 23 percent of the primary oil
wells produced no water at all, while approximately 65 percent of
those wells produced less than 1/3 of a barrel of water per day
on average.
We urge EPA to recognize that these significantly lower
quantities of waste being produced by Appalachian operations
necessarily result in less environmental risk than was identified
by EPA in its modeling.
47
CTJO s r z l 5" P> «± =r -H • 03 S-- g » o I _ «< ,ro co m I If S, PK 2.111
3 r+ =r — _ co a r » 3 CO
CO CD

p ^
l~~
\ t
t 1
' li
I *
m\y\Aft
I f * i f I > -TO
4m
to*
o
O
l_
H. EPA's Economic Impact Analysis Does Not Adequately
Assess Cost Impact on Appalachian Operations.
While we share EPA's ultimate conclusion that the
imposition of RCRA Subtitle C would have "a substantial impact on
the U.S. economy" [See Report to Congress, p.VIII-9], we have
significant concerns over EPA's economic analysis. Our concerns
center around several areas in which EPA has understated the
impact of imposing alternative requirements on the industry. As
will be reviewed in this section, we believe EPA's economic
analysis overstates baseline costs while understating the cost of
alternative requirements. The end-result is a masking of the
true cost of imposing alternative waste management practices on
the industry. In addition, EPA has failed to properly assess the
impact of these increased costs on the industry, particularly in
the Appalachian states.
1. Overstated Baseline Costs.
At the heart of EPA's economic impact analysis is
its determination of the current costs borne by the industry for
the management of both drilling waste and produced water waste.
The "baseline" cost of drilling waste management for the
Appalachian zone, as reflected on page VI-26 of the Report to
Congress, is $9,465. These costs are significantly greater than
actual experience indicates to be the case in Appalachia. In
part, this can undoubtedly be explained by EPA's erroneous
assumption that 77 percent of all drilling pits in the
Appalachian Basin are currently lined [See Report to Congress,
p.VI-5] . Not only is this conclusion contrary to fact, it is
48
<o e © o " • 03 c-f Z3
_j,«< i ° to m ^ 2. *+ — — = ~ * to -*>
2. £ « «» ^ ro §•«+ to
S ° «+3 3 r+ =r--to =r =-3 3. » OT P»
<0

p-^ • "U
7*" -~
o
I.,
1 )VH
n
if * ?is •SrSt* *> v v >s
^ v rs
it'
O
#
T T
also refuted by the discussion on page VI-3 of the Report to
Congress which points out that for drilling operations, wastes
are typically stored in unlined surface impoundments during
drilling and by the discussion appearing on page 111-17 of the
Report to Congress indicating that drilling pits are generally
unlined. Because such a high percentage of drilling pits in
Appalachia are assumed already to be utilizing liners, EPA's
economic analysis assumes that those pits would not be affected
by the Intermediate Scenario discussed in the Report. We urge
EPA to revise it's analysis of the baseline drilling waste
disposal costs in Appalachia to take proper account of the number
of drilling pits that are currently lined and reflect the costs
which are actually incurred currently in managing drilling
wastes.
2. Understated Alternative Costs.
We are pleased to note on pages VT-11 and VT-13 of
the Report to Congress that EPA has recognized it must take the
cost of transportation and loading and unloading charges into
account in determining the cost of Class II injection. Our
detailed discussion of this factor was provided to EPA in our
comments filed on June 13, 1987. We also commend EPA for it's
recognition of the fact that injection wells in the Appalachian
region are not capable of receiving the higher volumes of waste
as are assumed with respect to the rest of the nation. Our
detailed comments on the rate of injection that could be expected
in the Appalachia were also included in our June 13, 1987
comments.
49
o-x» CD C 3'EL co — ->*< of th
Imed
<D
C =1 CD =3 <•+
Z3 O
o"
5" ex C CD O r+ I T CD
5 * z o J2 ° » m if th
clear
r + CD
P> IS " a =r - •
CO CD

p-*-
I '
f-~,
7 T
Nevertheless, we recognize, as does EPA on pages
VI-3 and VI-17 of the Report to Congress, that EPA's cost impact
analysis does not reflect all of the costs that would result from
the imposition of RCRA Subtitle C regulation. In particular, we
note that EPA has not taken account of the costs that would be
associated with satisfying the land ban and corrective action
requirements of the Hazardous and Solid Waste Amendments of 1984.
If these costs had been considered, the true economic impact of
alternative scenarios would have been astounding.
In addition, for reasons stated in the preceding
paragraph, EPA has failed to properly identify the true costs of
alternative requirements because they have overstated the
baseline costs associated with waste management in the industry.
3. Understated Economic Impact.
EPA's Final Report to Congress has done little to
address our earlier concerns about it's methodology to assess the
impact of the costs of alternative waste management techniques.
In particular, we note that on page VI-22 of the Report to
Congress, EPA assumes the wellhead price of oil to be $20.90 per
barrel in the Appalachian region. This is significantly above
the current wellhead price of oil in the region which is as low
as $14.50 per barrel. Using such an inflated oil price results
in a rate of return for new projects which is much higher than
actually occurs. EPA's analysis does, therefore, mask the true
impact of the resulting cost increases.
Beyond direct impacts on individual wells, EPA
must recognize the impact which any cost increases would have on
50
co c o m o
« 5 g S o |
o ° !? f» 3 ,
3 . - - _ co =r 5' 3 3 <D " pi
CD
pp-^i
Wl
:*'-.
S&& T4"' ,jf ?%£
&>/
»*
the entire Appalachian region and on the nation. The enormous
plugging liability and lost production caused by new regulatory
requirements will not only be felt by oil and gas companies, but
also by thousands of investors, land owners with royalty
interests, service companies, support industries, regulatory
agencies, tax revenues at all levels of government, and finally
by the consumers of oil and gas products. In addition,
regulatory requirements would also directly impact on the
nation's balance of trade because of additional oil imports. The
impact of such requirements on the nation's natural gas supply
would also be disastrous and would result in shortages of natural
gas available to heat homes, schools and businesses and a
dramatic increase in price for such natural gas that remained
available.
EPA's economic analysis is further defective
because it does not recognize that a waterflood or EOR project
does not begin production for at least 2 years after initial
investment is made. This significantly reduces the economic rate
of return of those projects. This is especially significant
since over 40% of the nations crude oil is produced by this
method.
We also find it incredible that EPA could have
conducted its cost impact analysis by examining only the closure
of oil wells. In Appalachia, 53% of the successful wells are gas
wells. The significance of these wells to the region is very
large and the failure by EPA to have modeled the closure of the
wells is a major defect of the study.
51
W 3, S-" — — I
ISM "I CD r+ CO I
3 r«- =r — - -
ft- CO B
CD •

w-~ w » • •»- '
¥ <
« /
I,', „ 4w<Sf
i££ ""'tf
\ V1 v
W f 1 „ ,'„ v
1s5STTr^~
Many additional concerns about EPA's economic
analysis are contained in our comments filed on June 13, 1988.
EPA is encouraged to examine these comments for discussion of
such issues as cost of capital, hurdle rate, and internal rate of
return.
4. Appalachian Impacts.
Perhaps the most serious criticism of EPA's
economic impact analysis is that it lacks the sensitivity that is
necessary to determine to the impacts of very small cost
increases on Appalachian Producers. EPA has examined three
alternative scenarios for purposes of assessing economic impact.
As flawed as they may be, the studies which EPA performed on each
of these analyses clearly indicates the devastating impact that
they would have on Appalachian operations.
EPA's analysis should not stop, however, with
examination of these three alternatives. If EPA is truly
interested in considering the possibility of development of
alternatives under RCRA Subtitle D, the Safe Drinking Water Act,
or the Clean Water Act, it must be prepared to assess the cost
impact of those alternative on the Appalachian region.
In performing this analysis, EPA must understand
that objectionable cost impacts on Appalachian Producers would
not only result from the imposition of hazardous waste
regulations, but also from the imposition of new regulatory
requirements under any program. Moreover, EPA must recognize
that any increase in capital or operating costs in the
Appalachian region would have a much greater impact on the
52
5" S. &• sr -31 _ « < .ro to m |
g-m P IS o rt- = 5" I 3 r+3": 5I» CO CD

r*
i-ih-v i
^ v 4 ^
L
economic viability of those operations than might be the case
elsewhere in the nation. From data we submitted to EPA in
February, 1987, it is apparent that nearly all producing wells in
the Appalachian region are stripper wells. Wells that were not
stripper wells initially, become stripper wells after only a year
or two of production. In other words, Appalachian wells are
extremely sensitive to any increase in capital or operating
costs. For example, a $200 increase in operating costs
experienced by the region's approximately 200,000 existing wells
would force nearly 20 percent of those wells to be plugged and
abandoned. A $2,000 per year increase would cause nearly half of
these wells to become uneconomical and to be plugged and
abandoned. These illustrations point out the marginal nature of
most of the production under current business conditions.
To take this thought process a step further, if
additional hazardous or non-hazardous regulations caused only a
$2,000 increase in operating costs each year, nearly 96,000 wells
would have to be plugged in the Appalachian Basin states at a
cost of approximately $960,000,000 for direct plugging costs
alone. Approximately 92 BCF of natural gas production and over
11,000,000 barrels of oil production would be lost each year from
existing wells alone. The expected returns on investment in
future wells to be drilled would drop several percentage points
as a result of the $2,000 increase in annual operating costs and
several points because of a corresponding increase in drilling
costs. This means that a large percentage of wells that might
have otherwise been economical to drill would not be drilled
53
rococo 03 .»2 » Ol
2. S-- 2. _. • 3
<D P> P i 3 ' 3 «"•• HI =5" • • *" • I I
CO • CD •
CD
f
life'"'' :':"V' 'T;'v*iffl
I
iflllll
| v u > Jit t
I •>
•J
because of these additional regulatory costs. Even the wells
that were still economical to be drilled would have a shortened
production life because of the additional costs. Of the 15,000
to 20,000 wells that would otherwise be drilled each year in
these seven Appalachian states, thousands would never be drilled.
Costs that might otherwise seem insignificant to wells
with a stronger economic basis become matters of major concern
for Appalachian wells. EPA's current economic impact analysis is
simply insensitive to these types of impacts and EPA should make
independent inquiry into the cost impacts of non-hazardous waste
regulatory programs prior to making them applicable to any
Appalachian wells.
I. There is No Justification for New Hazardous or
Non-hazardous Waste Regulations as a Result of
EPA's Study.
As discussed in previous comments, EPA's Report to
Congress has concluded that existing state and federal regulatory
programs are adequate to prevent or mitigate adverse impacts on
the environment. The Report to Congress also has identified the
severe economic impacts that would be realized by the oil and gas
industry in general should hazardous waste regulatory
requirements be imposed. These factors, in combination with
EPA's failure to identify significant unregulated environmental
risks, compel the conclusion that no further regulatory
requirements are appropriate.
The legislative history related to this study is
enlightening in explaining the thought process that EPA is
54
09 ft-2
cr.a 3 ID C O <° 5 S » o j «< ? » m g o rt-- 2. _. I
§ S I 3 *••• W =r • = a> w to I c+ ta •
CD •

p p - ^ ^ ^ W " » — ipmilU.
V"V ,
yv.
4 f-
1 i j * $
e>
expected to follow in conducting the study and the rulemaking
decisions that will necessarily follow it. In this regard, the
Senate Committee on Environment and Public Works stated:
The committee determined that the extensive regulatory program proposed by the Agency [RCRA Subtitle C] could have significant economic impact on domestic oil and gas exploration and production activities. Therefore, regulations on these materials should not be promulgated until further information is developed to determine whether a sufficient degree of hazard exists to warrant additional regulations and whether existing State and Federal programs adequately control such hazards.
S. Rep. No. 96-172, 96th Cong, (reprinted in 1980 U.S. Code
Cong. & Ad. News 5019, 5024-25).
Additionally, the Senate Committee offered the
following description of the intent of the study:
The thrust of the study is to determine the degree of hazard associated with these wastes, the adequacy of the existing State and Federal regulatory programs to control and mitigate any hazards, potential changes to regulatory programs to improve control and mitigation of hazards; and the cost impact of those changes on the exploration, development and production of crude oil and natural gas.
Id. at 5026.
These statements are particularly instructive in
understanding Congressional intent because it was the Senate bill
which was adopted in lieu of the House bill when Congress passed
the Solid Waste Disposal Act Amendments of 1980.
For the Appalachian Producers, the concerns expressed
by this legislative history are brought into even sharper focus.
In the Appalachian states, perhaps more so than anywhere else in
55
5* 2L £ 5- 3
fOrfO - .
—~ ST m §£• «•*• a> § • • P =S ° I? 3 5" «= ° c + 3
3 «-* =r - -50 =r 5" 3 *+ to
CD

p
'S Ji""
K1-to" 1
* V 'I
•%> o
the nation, it has been necessary for regulatory programs to be
developed in close concert with the hard economic realities of
oil and gas operations. These regulatory requirements have been
carefully crafted by each of the Appalachian states to take
account of the climatology, hydrology and geology of each area,
as well as the economic costs that would be imposed by those
requirements. Changing this balance by imposing minimum national
standards has the potential to create significant economic
dislocation in this region.
EPA's recommendation [See Report to Congress, p.IX-1],
that minimum requirements may be based on RCRA's Subtitle D, the
Clean Water Act's NPDES program, or the Safe Drinking Water Act's
Underground Injection Control Program offer little comfort to the
Appalachian Producers. Whether a new regulatory requirement is
based upon hazardous waste regulatory authority or any other
regulatory authority, the impact on the operator will be the
same. As discussed in our previous comments on economic impact,
even a few hundred dollars of increased costs each year will
cause a very significant number of Appalachian wells to be
plugged and abandoned.
Accordingly, we do not believe that it is necessary or
appropriate for any new regulatory requirements to be imposed on
any segment of the oil and gas industry. We do, however, support
the recommendation by EPA that efforts be undertaken to develop
cooperative approaches with the states that would explore
non-regulatory support for current programs in the form of
funding, training, or technical support.
56
rococo —• Q) r+ — zi
3 S, S-" — -. 2. £ 5- e; ,*
|ff=B 3 r+ =r --2. « m p>
CD

f"~
o
1 't'
if •1MV1 ^v * <W
ift ' H * * s /
Hv
8* •WS Y
"T
D
•J
O
J. EPA Should Create a Special Subcategory to Address
Characteristics of Appalachian Operations.
As stated above, the Appalachian Producers, do not
believe that it is necessary or appropriate for any new
regulatory requirements to be imposed on the oil and gas
industry. Should EPA, nevertheless, be inclined to pursue the
development of new regulatory requirements in response to this
study, we submit that the circumstances surrounding operations in
the Appalachian states justify exempting these operations from
any new regulatory requirements.
There are three principal bases upon which an exemption
for the Appalachian states should be considered:
(1) The nature of the waste streams involved;
(2) The adequacy of existing regulatory programs; and
(3) The cost impact of alternative requirements.
With respect to the nature of the waste streams
involved, we have pointed out in these and other comments that
very much smaller quantities of waste are produced by Appalachian
operations than are produced elsewhere in the nation. This is
true both with respect to produced water and with respect to
drilling fluids. Beyond distinctions based on quantity,
Appalachian wastes are different because most drilling is
conducted without using drilling muds. Air drilling, as it is
called, produces very small quantities of waste that have
properties reflecting very low toxicity. Where it is necessary
to use liquids in the drilling process, those liquids are
generally created by combining water with small amounts of
57
o c o m o • J — • t T CD •—Z
i1 S, ^ — -•
g-<° »=* ° 2" 3 5" f= ° rt- = 3 r+ = r - • co =r 5" 3 = <o P) e-r oa
CD
10

jr *i '<"-•> •>' v a t
o
U
O
o
Iw
H<«*
potassium chloride, a material frequently used in agricultural
fertilizers.
The regulatory programs applicable in the Appalachian
states have been custom made to deal with the particular
environmental objectives of the states involved. Since
evaporation and underground injection are not readily available,
alternative requirements, such as land application, stream
discharge, annular disposal, and roadspreading, have been
developed. These programs are working well and are serving to
adequately prevent or mitigate adverse effects on human health
and the environment.
Finally, EPA must recognize that if it were to require
alternative waste management practices to be imposed on
Appalachian operations, the impact of cost increases that might
otherwise seem insignificant to operations with stronger
economics would be devastating to Appalachian operations. This
impact would be greatly magnified throughout the Appalachian
states because 97 percent of all primary production oil and gas
wells in the region are stripper wells. It is also significant
that 57 percent of all primary production oil wells produce less
than 1 barrel of oil per day.
The combination of these three factors compel the
conclusion that the current regulatory and waste management
requirements in Appalachia should not be altered as part of the
establishment of any national environmental regulatory program.
Should there be the need to consider refinements in any of these
state programs, we submit that the state regulatory agencies
58
3 % CD
co C O •" o = SL £ 5" ^ <° S-- S » o «< .ro » m
£L ~. co -i
s. £ »" e; «+ w g- r+ CO o a | 5 5 ° r*- 3 3 c+ = r - -a> 3- 5 ' 3 P>
CO CD
=J CD
» ' "»"
p~
I" ^
K i l l » V '•VS
/ t
i n
i •
involved have adequate statutory authority to refine their
regulations, permits, and programs in a way appropriate to
address the need. We also submit that it is at the state level
that the expertise exists to fashion an appropriate regulatory
program addressing whatever environmental concerns may exist with
respect to waste management practices of the industry, along with
a recognition of the economic capabilities of those operations.
IV. Regulatory Alternatives.
Notwithstanding the inherent problems with EPA's Report
to Congress, our review of this document leads us to believe that
the Agency has three options available to it which will result in
a different regulatory process as it affects oil and gas drilling
and production wastes studied in the Report to Congress.
The only aspect of the court order remaining with which
EPA must comply is the June 30, 1988 date for the determination
by the EPA Administrator of whether or not, if at all, to impose
hazardous waste regulation on any of the oil and gas wastes
studied under Section 8002(m). Notwithstanding the fact that
this determination is inherently tied to the scope of the
exemption and the wastes studied, a concept previously discussed
in these comments, EPA may make the following decisions on June
30.
(1) On June 30, 1988, EPA may make a decision that no
regulation of any kind is necessary for certain oil and gas
drilling and production wastes. If so, the question is then
raised as to how this determination will be reflected in the
59
n> e o - o - * — — <D
°> - , « m
_ P
g 2, *•" 2. _. I 5 ^ " co - * 2. £ » S» *. I
<o g ^ c o § • • P =*
=> <o w p> r + CO *
CD I

p—*-r
V Is. I !
1 V
1
•J
\
ll >1
$
it X 1 <v • US
t$
»j
o
L
statute and regulations. EPA might consider the promulgation of
regulations stating that no regulation of oil and gas drilling
and production wastes is necessary. This has the effect of
maintaining the exemption from Subtitle C regulation in the
Agency's hazardous waste administrative regulations. EPA might
also choose to stand silent on the issue, which has the effect of
leaving the statutory exemption intact for oil and gas drilling
and production wastes. We strongly urge EPA to consider, under
this scenario, the latter course of action—that is, the
maintenance of a statutory exemption for oil and gas drilling and
production wastes from Subtitle C regulation.
(2) As part of its June 30, 1988 decision regarding
regulation, EPA may make a decision that certain wastes should be
regulated under one or more of its presently existing non-
hazardous wastes programs. Any such process would involve the
development of significant new regulations under those programs
and would require the requisite time for the development,
proposal, finalization, and implementation of these regulations.
As has been the case throughout the study process, the
Appalachian Producers will continue to be significantly involved
in the development of this program, if any, in the form of
commenting, as they have in the past, on various Agency
proposals.
(3) The possibility exists that pursuant to its June
30, 1988 determination, EPA might decide that Subtitle C
hazardous waste regulation of certain oil and gas drilling and
production waste is, in fact, necessary. The scenario regarding
60
I
_<,«< i" co rn | =? 2. '• — — I
o m 82 ° PT =r s ° ~ I 3 «•+ 2 ! 5" i 2 ^ 5 3 3 co p>
CD I
• I mum

• • •• J
p
••V
/
sti
t.
D
o
o
SB'A
i
o
O
iO
development of any Subtitle C regulations would be similar to
that as discussed above with the exception that such regulations
would have to be submitted to Congress pursuant to present
statutory authority for their ultimate approval.
Again, it is the position of the Appalachian Producers
that no such regulations are necessary and that adequate state
and federal regulatory authority already exists to handle any
environmental problems of the industry. It is our belief that
after competent review of existing state and federal regulatory
authorities and disposal practices employed in the Appalachian
region, the inalterable conclusion must be that neither Subtitle
C nor any other type of new regulation is necessary.
V. CONCLUSION.
That portion of EPA's study of oil and gas drilling and
production wastes under RCRA ordered to be done by a federal
district court has been completed with EPA's submission of its
Report to Congress on December 31, 1987. There are a myriad of
erroneous assumptions, facts, statements, and conclusions
contained in this Report. These errors have been addressed in
these comments, as well as the previous comments submitted by the
Appalachian Producers which have been incorporated by reference
into these comments. We urge EPA to address these errors and
deficiencies prior to making its regulatory determination in this
matter.
Respectfully submitted this 14th day of March 1988.
61
i,
8-8 ! - § to
3 3, Scares ^i
3 r+ =r ; CO =» CD CO 3
P C O CD
•an. "**!.
*#!•'. © IS)


r "L.
;.r> E x h i b i t A
OUfVtaa (VMaCx MMTHbucgij, r x u n u * "IMC* t*on>MMi Hlw vote
.rf t M>lC«tU • M l * MM »AUCUt MO«1Mi* I M W * IAUTIN9VMC. k | W J I « U t JO»1 « i U M I I . lOUttMIU I « I M » « uiuvtu tuwruuic l U M t U A , talvAO*
m i l l 1 %1Allt*C. M M O V I JOMH w CMA»M fMOOt f«L*«7
>IIVl | l » ) « « «
l<Hl MUtUill K>Ul»0»KOI«
l\
J
SMa* \ -
United States Senate WASHINGTON. DC IOS10-41M
November 17, 1987
The Honorable Lee M. Thomas Administrator U. S. Environmental Protection Agency 401 M Street, S. W. Washington, D. C. 20460 Dear Mr. Thomas:
As the deadline approaches for the submission of EPA's Report to Congress on oil and gas waste pursuant to B8O02(m) of the Resource Conservation and Recovery Act ("RCRA"), it becomes increasingly important for EPA to complete its identification of the wastes that are properly includable in the study. It is these wastes that EPA and Congress must address in determining whether to impose hazardous waste regulations pursuant to Subtitle C of RCRA.
I am sure you recognize that a decision at this time to include a waste within the study would not exempt that wa6te from hazardous waste regulation permanently. Instead, such a decision would simply continue the exemption in effect until such time as Congress determines it to be appropriate to impose hazardous waste regulation on that waste.
A review of §8002(m) of RCRA and the legislative history associated with that section reveals the clear intent of Congrese that the scope of the study be broadly interpreted to include all drilling fluids and produced waters wherever they occur as well as associated wastes intrinsically derived from primary field operations. Given this Congressional intent, I urge you to include within the study the broadest possible scope of wastes associated with this industry.
I look forward to receipt of your Report to Congress on this important issue'.
With kind regards, I am
Sincer
Quentin N. Burdick Chairman
QNB;pp ; j c
t. rococo
_j,«< P CO fvi I =f o ;=>•• 2.11. i eL«± co fi> ,+ 1
=r I r + CO I
P> IS CD a .
c Q- CD O
CD =r S 3 I ce> I CD I
CD CO

r~
sill :4
lilfllllS
L
& fr/e* - So - s-?y
§\N 2 9 jatyh
COMMENTS REGARDING THE APRIL 30, 1987, INTERIM REPORT
OP THE UNITED STATES ENVIRONMENTAL PROTECTION AGENCY
WITH RESPECT TO WASTES PROM THE EXPLORATION, DEVELOPMENT AND PRODUCTION OP CRUDE OIL,
NATURAL GAS AND GEOTHERMAL ENERGY
ON BEHALF OF THE
INDEPENDENT OIL AND GAS ASSOCIATION OP NEW YORK INDEPENDENT OIL AND GAS ASSOCIATION OP WEST VIRGINIA
KENTUCKY OIL AND GAS ASSOCIATION OHIO OIL AND GAS ASSOCIATION
PENNSYLVANIA NATURAL GAS ASSOCIATES PENNSYLVANIA OIL AND GAS ASSOCIATION TENNESSEE OIL AND GAS ASSOCIATION VIRGINIA OIL AND GAS ASSOCIATION
and the WEST VIRGINIA OIL AND NATURAL GAS ASSOCIATION
SUBMITTED BY:
ROBINSON & McELWEE
David M. Flannery
600 United Center Post Office Box 1791
Charleston, West Virginia 25326 (304) 344-5800
June 1 3 , 1987
crja
GO ^r
o
3
££ O
55" CL c c+
to CD~ CO
CO
CD
P -5 r* =r Z3
3!
-H O
r+ CD
-*> a
to =r m 3 I P I
CD

r
mm Z&X!
J'rf;s§m
Vjits'^iiH^
Jmrlttmf.tlBl mm
ill
t
COMMENTS REGARDING THE APRIL 30, 1987, INTERIM REPORT . OF.THE
UNITED STATES ENVIRONMENTAL PROTECTION AGENCY WITH RESPECT TO WASTES FROM THE
EXPLORATION, DEVELOPMENT AND PRODUCTION OF CRUDE OIL, NATURAL GAS AND GEOTHERMAL ENERGY
On April 30, 1987, the United States Environmental
Protection Agency ("EPA") issued an Interim Report in connection
with the preparation of the Report to Congress mandated by
§8002(m) of the Resource Conservation and Recovery Act ("RCRA").
These comments are being filed with respect to that
interim Report on behalf of the following trade organizations
representing oil and.gas operators in the Appalachian Basin:
Independent Oil and Gas Association of New York Independent Oil and Gas Association of West Virginia Kentucky Oil and Gas Association Ohio Oil and Gas Association Pennsylvania Natural Gas Associates Pennsylvania Oil and Gas Association Tennessee Oil and Gas Association Virginia Oil and Gas Association
and the West Virginia Oil and Natural Gas Association
CHAPTER 1 - OVERVIEW OF THE OIL AND GAS INDUSTRY.
1. The Nature of Drilling Pit Waste.
On page 1-12, and again on page 1-22, it is reported
that drilling pits receive sewage or sanitary waste. On
page 1-22, the statement is also made that the pits receive waste
lubricants, waste hydraulic fluids, waste solvents and waste
paints. These situations do not generally occur in the
Appalachian Basin. For example, under the terms of the drilling
<o c o m o|
( Q CD
40
W« m | a . CD
IS** 3 -*> 2. £ W P > ^ I
i ZZ-* za < o w p > fl
CD •
pp-»i
r~
tkzif&z
V0M0M
!'re.y.v*«ii\V-'-^Vi->:.;
ffglglil
O
»
:
' .' \ - • •" •> 'Jv^Vi ..i.'..*.'.\^-...•.•.".•;>.
waste general NPDES permit issued by West Virginia (WV0073343),
the discharge of such material to a drilling pit is expressly
prohibited.
2. Stripper Wells.
On page 1-49, the statement is made that 70% of the
total oil wells in the United States are "stripper oil wells" and
that marginal gas wells correspond to stripper oil wells. This
statement is not accurate for the Appalachian Basin where
stripper oil wells and stripper (or marginal) gas wells exists at
a much higher percentage. As reported in the document filed by
these commentors with EPA on February 10, 1987, entitled "An
Analysis of the Economic Impact of New Hazardous Waste
Regulations on the Appalachian Basin Oil and Gas Industry" a
survey of more than 17,000 gas and oil wells in the Appalachian
Basin reveals the following results:
Type of Well
Oil Gas
Percent Stripper
98.2 92.1
These results assume stripper oil wells defined at less than 10
barrels of oil per day and stripper gas wells defined at less
than 60 MCF per day.
3. The Quantity of Drilling Waste.
With respect to the seven states represented by these
commentors, EPA has made the assumption that 90% of all drilling
pits in those states would be small with a capacity of 1,984 bar^
rels. The other 10% of the pits are assumed to be of medium size
with a capacity of 22,700 barrels. With these basic assumptions,
(D
CO
-b
3 CD CL.
JD
p> r+
O -t>
zr CD
ex.
CD 3 c+
=1 O r+
3"
C CD
O
r+ CD
co o » m 2. _. C D ^»
3 - —
CO CD

r • . - . • . • • • • • ; . ; • / - • ; . •.•••:!
•:••.•'•'•. •^•.•'.•••r-^ .•.•":,••••• v / ; : i . .
piiliil ;J»-*f •Jif'vi} V-W:*>'"^!-V:V,i-A . - V a g i
o
^a'-^LK^^-iS^^teSi.!:'/;; ^ J V * i v'-i .!.»=: lit u!£i«/.i
EPA has then calculated the total estimated waste generated in
each state as a variable of the number o f wells drilled i n each
state f o r calendar years 1 9 8 1 through 1985. These assumptions
are erroneous as to these Appalachian Basin states where less
than 1% of wells drilled each year would utilize pits of the
capacity of 22,700 barrels. The remainder of the pits ( g r e a t e r
than 99%) would be of the smallest size with many of such pits
having a capacity of less than 1,000 barrels.
4. The Quantity of Produced Water.
EPA used three different methods to determine the
quantity of produced water generated each year in the Appalachian
Basin states. First, with respect to Kentucky and West Virginia,
the produced water was estimated from water/oil ratios from
surrounding states. Second, with respect to New York and Ohio,
produced water was estimated from water/oil ratios from years for
which there is actual data available from those states. And
third, for the states of Tennessee a n d Pennsylvania, estimates
were calculated by specific methodologies set forth in Table 1-8.
Our review of these estimates indicated that only the values for
New York and Ohio appear to be reasonably accurate.
The values for Kentucky appear to be reasonable for
primary oil production but not reasonable for enhanced oil
recovery which may be significantly greater. The values for
Pennsylvania, on the other hand, are much higher than are
actually experienced.
EPA should rely only on data derived from a state to
estimate that state's produced water. The results of a survey of
O CD C
S«<g - S »o lm

• • * - * - $ $
;:
.
y;;X'.-<'>'*''' ^'ii'"^'^''
nearly 20,000 wells in the Appalachian Basin to determine the
amount: of produced water from those wells was submitted to EPA by
as am February 10, 1987.
CHASTER 2 - CURRENT AND ALTERNATIVE PRACTICES.
rn this section, we note that EPA has limited its data
base to 13 of the oil and gas well-producing states in the belief
t&at am examination of these states will be representative of all
of the oil and gas-producing states in the nation. As it relates
to the: Appalachian states, EPA includes material with-respect to
O M o andi West Virginia. Our comments will, therefore, be limited
to the regnlatory requirements of these two states.
1. Trash Disposal in Drilling Pits.
On page 1 7 , EPA states that reserve pits are used to
d L £ s £ H u s £ : ol trash, waste lubricating oils, waste chemicals, diesel
fuel, audi pipe dope. EPA's attention is called to the West
Virginia drilling waste general permit (WV0073343) which
e x p c e s s i j r precludes this act.
2. Drilling Pit Siting and Construction.
On pages 19 and 2 0 , EPA describes environmental prob^
lems relating to the leaching of pollutants from drilling pits to
g p r o u m d t water and erroneously concludes that there is "currently
little emphasis at the State level on reserve pits siting and
monitoring requirements."
Cothi Ohio and West Virginia have expressed statutory
p a n n > " ' ii^ T . T - T ( t T n ' s against the leaking of drilling pits to either
smirfac3 or subsurface water. In addition, both states have
or . a =j -• z c o e o "* o —= • a> r+ — ZJ
— =• co Z!
. co - b =•
» g-r+cB g-m »=!> O «+ => =3" =3 r°t- r=fT - • co =p J ; * 3 => «> P>

• i~
f
•* v
h W * - * . ' '
specific regulatory requirements which not only prohibit the
leaking of drilling pits but which also establish specific
requirements for the construction and maintenance of drilling
pits. The West Virginia general permit for oil and gas well
drilling operations also contains specific requirements with
respect to the siting and construction of drilling pits. In Ohio
particular emphasis is given to drilling pits in the Lake Plains
Region where synthetic liners or steel tanks are required to
contain drilling wastes.
The correct conclusion is that regulatory programs and
industry practices in Ohio and West Virginia place great emphasis
on drilling pit siting, construction and monitoring.
3. Land Application of Drilling Waste.
Beginning on page 32 and continuing through page 36,
EPA offers a description of various regulatory issues associated
with the land application of drilling fluids. In that dis^
cussion, EPA places considerable emphasis on the regulatory
requirements which are applicable to land application of drilling
fluids in West Virginia. In addition to discussing generally the
regulatory requirements in West Virginia, EPA identifies two
matters of concern to it (1) the regulation of chloride, and
(2) the absence of specific discharge limits on heavy metals and
toxic materials.
The general NPDES permit for the disposal of drilling
fluids in West Virginia was issued on July 10, 1985. That
permit, the first of its kind in the nation, established a
mechanism by which an operator was obligated to construct
"£*•'•'••• CT.O =J CD C O 5" to rf. _j,«< <° CO m |
H 3 S. H — — I
CO
> CD p) ^*>
3 r+ =r — • • a n > m to I r+ CQ •

p
,•>•>.:. . ' ; <' ' .':.:.••.;•• ' A l e ' s
ilSii
l'%i!&?*?r>%
'\m:-:.<ft?rtf;'!.&t;-A' • r '
'.-^ii.i.t-£i'„!^.\^£';.;'i'U.£U..".;'^ '-..'..••i'^
drilling pits, treat the contents of those drilling pits, and
dispose of the contents either by l a n d application o r by off-site
disposal. While the permit contained specific discharge limits
only for chloride, pH and total iron, those limits' were developed
to serve as surrogates f o r limitations on a variety of other
parameters. I n addition, t h e fact sheet supporting that general
permit recognized that by specifying a particular type of treat^
ment required o n each pit (aeration, pH adjustment, mixing a n d
settling), it would not be necessary to regulate a number of
other parameters, particularly organics. In short, the West
Virginia general permit uses a combination of discharge effluent
limitations and specified treatment requirements to achieve
a p p r o p r i a t e objectives. With respect to chloride, the effluent
limitation was set at 25,000 mg/1 recognizing that drilling pits
i n West Virginia typically contain between 500 a n d 2 , 0 0 0 barrels
of f l u i d which would be applied t o l a n d on a one-time basis.
These permit conditions were presented to EPA for
review i n advance of permit issuance a n d b y letter dated July 9 ,
1985, from the Director of the Water Management Division of
U.S.EPA's Office, the West Virginia Department of Natural R e ^
sources was advised that EPA did not object to the land applica^
tion of these wastes "if accomplished in accordance with the
proposed permit conditions." I n addition to this endorsement by
both t h e state a n d EPA, the chloride discharge limitation has
proven to be effective in protecting the environment in the
nearly two years that the general permit has been in effect.
During that time period there have been more than 1 , 3 0 0 cases i n
CD
«=> £r7. ~S 5«- O •I «< -• » r n |
C O O- ^ a I a CD
P > a . ci>
° S- P3> 5 " I
CD 5 - 5 - 3 CO CD
CD
O'-i
(0

F"w"-
I'
p #*?•
: IS
& ' : • • ' -& ' : • • ' -
-3
111IS11
ISiiiif
5fj£.p,.iV-
<-m
O
y:^::ff,;iM
;':;;*5{?i«
ipj*
irfVAlV.JI.^:>i.VioU«!":i..4i'i">4liiuV*A'.ir^vli<<V..i
which drilling pit fluids have been discharged without problem.
As will be discussed later in connection with EPA's damage cases,
there was one situation in which vegetation was temporarily
stressed as the.result of a land application conducted under the
general permit (WV13), Investigation into that incident revealed
the potential for a number of factors contributing to that stress
with no definitive conclusion reached as to whether chloride at
the discharge level, of 18,000 ppm was the cause of that stress.
_ There have been a number of instances of land application of
drilling fluids under the general permit in which the chloride
concentration exceeded that amount.
•In the second round of the drilling fluids general
permit proposed for public comment on May 29, 1987, additional
restrictions on chloride discharge have been proposed. Pursuant
to the proposed permit the chloride discharge limitation would
become 12,500 ppm and the amount of drilling fluid that could be
land applied would be limited to 20,000 gallons per acre per day.
The chloride limit has been reduced largely because experience
has indicated that such a lower limit can be achieved in most
cases and to eliminate any question about the appropriateness of
the initial permit to address adverse chloride impacts on vege^
tation. The second round general permit would also establish
final effluent limitations for dissolved oxygen, total suspended
solids and total manganese and would establish a monitoring
program leading to the establishment of an effluent limitation
for total organic carbon in September, 1988.
O-JD
2. c ° g O S-- 2 . _m. I
3 «+ ^ =r •
MCII innrmiMi

r
-S •S
••-;*
•'•>.
mm mmmmm
ip
H E ? * a v i « - . ; ILK, ;S:fin!^a
L
In summary, it has been the experience of both
operators and regulatory agencies that the general permit for
drilling fluids in West Virginia has proven to be an extremely
effective regulatory vehicle by which to assure an
environmentally acceptable means of disposing of drilling fluids.
4. Annular Disposal of Produced Water.
On pages 55 and 59, EPA offers comment on the use of
annular disposal for produced water. EPA observes that annular
disposal is not a widespread practice and has a higher potential
to contaminate fresh ground water.
Annular disposal is a practice which is of great
significance and benefit to Ohio where the comprehensive regu^
latory program has been established to assure that annular
disposal is conducted in an environmentally acceptable manner.
Ohio's annular disposal regulations are set forth at
OAC §1501:9-3-11. Those regulations provide that the disposal of
saltwater into the annular space of any well is prohibited except
where approved by the Division in accordance with established
regulations. Those regulations require that any well authorized
to use annular disposal be constructed such that the surface
casing is sealed with cement, prepared clay or other material.
In addition, all systems must be air tight. As
reported by Elmer E. Templeton & Associates in a report to the
Ohio Water Development Authority dated January, 1980, entitled
"Environmentally Acceptable Disposal of Salt Brines Produced with
Oil and Gas" an air tight system is necessary to eliminate
dissolved oxygen which would contribute to pipe corrosion.
C T J O
3 3, <° -4.
CD
O
CD
r+
=J
«-••
CO
a. c CD
O
S5"o ID-=J
o_ C D "-*>
3 * r+ CD
CO CD

r~
SlilSlHi
liSSIfg *r.-.-?*.-.:-'!--:-"?.-
£••••<•;::••-.•''•'.'••'
Annular disposal in Ohio is not conducted with artificial
pressure and, instead, it relies on gravity.
It has been the experience of operators and regulatory
agencies in Ohio that when annular disposal is conducted in
accordance with the regulations of the Ohio Department of Natural
Resources, it is an environmentally acceptable means of disposing
of produced water.
5. Surface Stream Discharge of Produced Water.
On page 68, EPA identifies only two cases in which dis^
charges to surface water bodies are to be recognized:
(1) coastal or tidally influenced waters; and
(2) agricultural and wild life categories.
Conspicuously missing from this description is the
category recognized under EPA's effluent guidelines set forth at
40 C.F.R. Part 435 with respect to the discharge of produced
waters from stripper oil wells. West Virginia is now preparing a
general permit for the stream discharge of produced water from
stripper oil wells which is expected to be issued during the
second half of 1987.
6. Plugging Requirements.
In its discussion of plugging requirements on pages 75
and 76, EPA makes the statement that while most states seek to
protect upper fresh water zones in well plugging, West Virginia
protects only coal strata. To the contrary, W.Va. Code
§22B-l-24(a) sets forth specific plugging requirements that deal
with wells that do not penetrate workable coal beds.
CTJO
CD
a. o c to =3
3
o"
35* a. a CD
O r»-
CD
To
CD*
to CO
CD
P>
r+ ZT
3
CO
o
CO
-<>
3
L

r~
\mmfmmm
fpp#P§ll§i
»fe'?i§K^;S*;S-'i;^,?^-1^l
*B&V.V'.v.i.':•••• < ;*-* :v/ ?!j.vA/
WiS^'tSi
'•
G
CHAPTER 3 - OIL AND GAS DAMAGE CASES.
At the outset, we must express our concern (and sur^
prise) that EPA has a stated intention to examine damage cases
outside the scope of RCRA S8002(m)(C). This point is, however,
expressly made by EPA on pages 1 and 2 where the purposes of the
damage case review are identified to.be:
To respond to the requirements of §8002(m)(C);
To provide an overview of the nature of damages • associated with oil and gas exploration, develop^ ment, or production activities.
Although the report contains a statement indicating that damage
cases falling into the second category are excluded from the
report, it is apparent that such has not occurred. As will be
seen from a detailed review of the discussion particularly with
resp- ' ' • o Zones 2 and 5, the report contains extensive
discussion of such issues as erosion control practices, surface
owner rights, and the intentional use of pits by landowners for
the wat-pring of domestic animals, each of which are matters not
related to the mandate of RCRA §8002(m).
Before turning to specific comments contained in this
chapter with respect to the Appalachian Basin states, we will
first address EPA's general conclusions.
A. General Conclusions.
Beginning on page 5, EPA, very appropriately, iden^
tic---- - number of factors which limited its study and its
results. These limitations included!
10
cr-o 3 t5o" c£ . o
CD « m £2. H i
<D
a. (1D= rt- ID
—. Q> ""*»
O . 2 s
3 r* =f - -
» ="5'3 s o p
<D

r™
iiililii
!
the limited time period for the study;
the failure to examine some of the oil and gas producing states;
the sampling of damage cases was not necessarily representative (as with the State of Ohio, the number of cases involved may have been influenced by the ease with which the data was made available to EPA's contractor);
EPA's discussion of applicable laws was not complete; and
effects of recent oil price declines were not fully analyzed.
The Interim Report simply ignores these limitations,
however, in arriving at nine general conclusions.
An earlier effort was undertaken by another EPA
contractor; however, we have not been provided with an
opportunity to review the findings and conclusions of that
contractor on the damage cases identified by that contractor.
1. Health and Environmental Damages Caused by Oil and Gas Operations Appear to be Significant, Wide^ spread, and in Need of Correction.
This conclusion, stated on page 8, is offered without
support or justification. To the contrary, a review of the
damage cases identified by the agency reveal that the regulations
and industry practices which govern environmental protection in
the oil and gas industry have become increasingly effective.
Regulatory programs have evolved addressing each of the concerns
that EPA identified in its review of historical damage cases.
Where adjustments in regulatory programs were necessary, those
adjustments were made in the context of existing state or federal
programs.
11
Cr-Q 3 =• Z CD C O =CO•
C O O
_* «< -<0 w m
W 2 , ?+ — - . I
a St CD =J CD 00
ta CD
o o > ^
o
iii»iwiiM-MrM«miiiiiiiTiiiiniin in
r~
m ^:3l '-,•• va
^''nH'"^.^-'.-'''.^.'- v;">.', • / . ; •
iia/V.-i-:-.--'••:•: %i::'ws
J-.-Afcl^:-^*^--:,.^.^
2. There is Convincing Circumstantial Evidence that Serious Health Effects, Such as Cancer and other Fatal Diseases, Have Been Caused or are Potenti^ ally Caused by Oil and Gas Activities.
Of all of the statements in the report,, this .one is by
far the most inflammatory and least supported. Moreover, the
damage case analysis mandated by RCRA §8002(m)(C) calls for the
identification of cases "that prove or have caused" danger to
human health and the environment. There being no legal or
factual basis for this statement, it should be stricken from, the
report.
3. Damages Are Caused By Nonhazardous As Well As Hazardous Substances.
The discussion of this issue fails to disclose that the
250 ppm human health consumption standard for chloride in drink^
ing water is not set to protect public health but, rather, is set
as a taste threshold. In addition, there is no basis apparent in
any of the analytical data taken by EPA that drilling muds or
their constituents are hazardous by one or more RCRA definitions.
This is certainly not the case in connection with Appalachian
Basin operations where air drilling is predominantly used.
4. Past Practices Can Cause and Contribute to Current Damages.
This discussion misses the entire point of the regu^
latory process with respect to which this report is offered. The
cases cited in support of this conclusion are cases in which
wells were plugged or abandoned using techniques which would
violate current-day regulatory requirements. To the extent that
past regulations or industry practices resulted in damage cases,
that issue has been addressed by current-day regulations and
12
» g-rt- C D I
§ St I 3 «-*• 5? 5 " •
= » " p |

m
its ' . - v i . ' ,' / •
illilipi 3 g v Hv -''.y .'- - • : ',; .: :y j &'&ix"
Sllil !Q
JI!?MK 1
.T&
L
practices eliminating the need for consideration of those damage
cases in determining whether to adopt regulations pursuant to
Subtitle C of RCRA.
5. State Standards Vary Widely in Scope and Content.
EPA has based this conclusion on its review of damage
cases which have occurred over 2 0 years. The conclusion i s not
based on a review of current-day regulatory requirements of the
various states. As the Interim Report itself recognized, EPA's
review of current regulatory programs was not available when the
Interim Report was prepared. If EPA's desire is to assess
current state standards, it should do so by examining current day
regulations and not historical damage cases.
6. Implementation and Enforcement of States Require^ ments i s S e r i o u s Deficient.
On page 12 the Interim Report criticizes states for
failure to implement and aggressively enforce their regulations.
To understand the fallacy of this conclusion, one need only
examine the damage cases related to West Virginia where, of the
14 cases that are relevant to RCRA §8002(m), criminal charges
were brought against operators in 10 of those cases and, in two
other cases, casing programs or land application requirements
were modified to address the specific fact situation raised by
those cases. In Ohio a nearly identical situation exists in
which notices of violation were issued against operators for
nearly a l l of the cases relevant to this study.
7. State Regulatory Programs are, as a Rule, Ser^ iously Underfunded a n d Understaffed.
While state regulatory programs can always be improved
by greater funding and greater staffing, we believe that an
13
co c o c»a o l 5" £ 2 . £ " . a -H •
- * «< - o> m I 51 2 , 3 - " 2 . '-. •
CD O. c Ou CD o
r+ C D
3 « •* • 5 1 5" •
" » | I CO • CD •
2 3 C 3 D "
O o 33
o CD
Hir"""-

W-*
r
mS-MM
mum : r.*.-;:-; .-;•••-.? ••?.V'.'i?!
:
!&*-
$!*•
ii —
objective review of the damages cases identified by EPA indicates
that there is sufficient funding and staffing to assure an
adequate level of enforcement.
8. Many State Regulatory Agencies Face Conflicting Incentives and Responsibilities.
There is no documentation apparent from our review of
this chapter to support this statement. The level of enforcement
and regulation that is apparent from a review of the damage cases
growing out of the Appalachian states suggests that no such
conflicting incentives or responsibilities exist to an extent
that would undermine the credibility of enforcement.
9. In Some States Economic Reliance on Oil Industry Revenues Increases Public Tolerance of Environ^ mental Damages.
As with several of the preceding points, there is no
documentation in the Interim Report for this conclusion. Any
objective analysis of the damages cases identified in this report
indicates that the regulatory agencies have undertaken timely and
appropriate enforcement of regulatory requirements against
operators that violated them.
B. Zone 2 Conclusions
At the outset these comments it is appropriate to
inquire as to the basis for EPA's definition of the states which
should be included within Zone 2 . Based upon earlier discussions
with EPA we had what was believed to be a clear understanding
that it was appropriate to include the State of Ohio within Zone
2 in order to give Zone 2 a scope which more nearly matched the
Appalachian Basin. EPA considered Ohio to be within the scope of
Zone 2 in its January 3 1 , 1987 technical report of analytical
14
to CC DT-JCO O3 st"o r z O l
5 ' EL *•• s r -HI
^ s g S o l _j , c< <° (o rn I = r o s-' 2. -. I 22 . £^ 5— f.tio> ~«*•>1\
h <0 to a. a a. to o
3 c+ 3 CD
HI
(0

r
:•.-•: Y'--
illlf
III iO
:!::;'*sfe # * •
L
results and consider this to be the case in the economic section
of the April 30, 1987, Interim Report. We urge EPA to include
Ohio within Zone 2 for purposes of future reports.
We also note with interest the statement that most of
the states within Zone 2 (New York, Pennsylvania, Delaware,
Maryland, New Jersey, Virginia, West Virginia, Kentucky and
Tennessee) have minimal oil and gas production. While it is true
that some of these states produce almost no oil and gas and that
the total production of all of these states is small in compari^
son with the national production of oil and gas, such production
as does exist results in significant economic benefits in terms
of employment, investment capital, tax revenues and royalties.
Moreover, even though the Appalachian states (including Ohio)
have only 1.2% of the Nations oil production it contains 14.2% of
the oil wells. With respect to gas the Appalachian Basin has
3.1% of the gas production with 44.3% of the gas wells. Beyond
the mere quantity of oil and gas produced, EPA should recognize
that this region produces some of the highest quality lubricants
in the world. In addition; the natural gas produced in the
region is valuable beyond its volume because it is located near
the major consumers of natural gas and, therefore, is not subject
to transportation related restrictions.
1. Illegal Dumping of Brine, Drilling Mud, and Fracing Fluid. ^
In support of this conclusion EPA relies on three
damage cases (HV_1£, WV20 and EA&2 (sic)) and draws the general
conclusion that the regulations either are not enforced or that
co c o m o
5' £- ~ » =! *•• S » o
« •* • » £ < •+
« Pf 3 I "
co =r m 3
=P CD w pi
wmam IHkau

W l • 'I'lL
r
-?i-':s:i
* ' • • •
f
fe<-••••••••••
pi.
••^••'.'::''V--;it**a
s;«
fe-^''i5^r';V..a.«?.i«
•m
operators intentionally elect to pay fines rather than to comply
with regulatory requirements.
While i t i s true t h a t d a m a g e c a s e s WV20 a n d _PA02
(actually E&Qlj are cases in which operators were found to be in
violation of state regulations prohibiting the disposal of waste
in surface streams, these cases certainly cannot be cited in
support of the general proposition that operators would prefer to
violate rather than comply with the law. It is largely because
of cases such as this that efforts were initiated in 1983 to urge
EPA to revise its zero discharge effluent guideline to allow
states such as West Virginia and Pennsylvania to establish
requirements that would call for an operator to treat and dis^
charge . a pit to surface streams i n a matter that would satisfy
requirements of the Clean Water Act and assure compliance with
water quality standards. In the meantime both West Virginia and
Pennsylvania have demonstrated in the two cases involved that
they will vigorously enforce the existing zero discharge require^
ment until it is revised by EPA.
With respect to the damage case WV18 EPA has inappro-
pria - Ty relied on this case as an illustration of environmental
damage resulting from waste disposal practices associated with
the exploration, development or production of crude oil or
natural gas. In fact this case is one in which the operator was
requested by a land owner to leave a pit in place so that it
mignt ce used as a source of water for livestock. This case
c e i - L w i . l y does not reflect industry practice and it should not be
16
cr-O 3 a c o o l rr « B O
< » e-rt-o
3 r+ s: 3 " n •3 a
-H>-
(D

' • * • • . ' • • • '
,' '•! - ". l.: : .
i? • '
}•'•••
F- • • r-'-'.
* . • - .
%m ?•. '• •• ,•:
^•-..-* '"
:
• ' •
. <• •
}|S^
;£v "•*•.••:'•
;fe">::,:-v".-;
"f
-
if
"A
relied upon as indicative of the manner in which waste are
managed i n the oil a n d gas i n d u s t r y .
Any objective examination of the damage cases iden^
tified by EPA in Pennsylvania and West Virginia indicates the
strict level of enforcement that was adhered to by the state
regulatory agencies. In West Virginia, 10 out of the 14 cases
relevant to this study resulted in criminal actions being filed
against the operator. The Pennsylvania cases reveal a similarly
aggressive enforcement record.
2. Damage to Water Wells after Gas or Oil Well
Fracturing. ''• •'• . _'
In support of this conclusion the interim report relies
upon three cases (WV02, WV17 a n d PA08) a n d a general concern that
West Virginia has no regulation or statute that automatically
requires an operator to replace a water well that has been
damaged by oil a n d gas operations.
With respect to f i V t y B EPA has incorrectly determined
that the ws Lioninvolved related to oil and gas
operations. An investigation by a geologist of the West Virginia
Department of Natural Resources determined that the contamination
itnhvaotl vheadd rbeeleant eadg gtroavnaatteudr ably lseuvreflasc eo fc ocaolntmaimniinnagn t opienratthieona.quifTehre Wy \
details of this investigation are contained in our comments on \o>\ &\
EPA's summary of this case filed under separate cover. Moreover, rHJ* F$
the gas wells involved were more than 10,000 feet from the water A
wells that were alleged to have been contaminated.
With respect to WV17, our more detailed comments filed
with respect to this case on June 11, 1987, indicated that
17
p " l <o c po "™ o CO
« 5 o " S£-L- S tt CCsOOr O= _j,«< < ° c o r n |
? 2.5+ — ~ I
2. £ « e > r*
§•• » ^ O •+ = > = •
g ° T f 3
3 «+ 2T 3"
o o 3D >i
o CD

p~
mm
a f e s ' w •;;i.:»,;'i' ? .' V v 'V : :' S i f t - a
U
C-
L
neither the operator nor the regulatory agency were aware of the
existence of a water well at the depth involved and that subse^
quently the state agency revised its casing requirements to
require the installation of significantly more surface water
casing.
With respect t o _ P A J 1 B an. operator, no longer i n busi^
ness, apparently did contaminate certain water wells but was
required to provided temporary water and to construct a new water
system for those whose wells had been affected.
Finally, as to EPA's general concern that West Virginia
has no provision for automatically requiring drillers to replace
water wells, we suggest that the presence or absence of such a
provision is not relevant to this study. Even though not
relevant, it is a fact that surface owners are given considerable
opportunity to be involved in the siting of wells and drilling
pits. West Virginia's general permit for drilling fluids
(WVPp73343) requires that the surface owner be given notice of
the intent to drill and be given an opportunity to object to any
aspect of that operation that would give rise to water quality
concerns.
3. Inappropriate Land Spreading Requirements in West Virginia.
The chloride effluent limitation obtained in the
current drilling fluids general permit is a condition that was
originally approved by EPA as being appropriate at the time the
permit was issued. In the nearly two years that the general
permit has been in place there has been more than 1,300 land
applications which have been successfully accomplished. In only
18
» C O t"o o l 5" 0> Zf. =- -H • J • » ™* fl> mmi ,
_«,<< . ® » r n | W S, *+ — -
° ^ § = a !* I 3 «-•• Z 5 - 1
<S I
i
o o >
<0

f
mmWm
mv£$?;?
mm
G
(FW-.
one case was there evidence of even temporary vegetation stress.
This point is further mitigated in the second round general
permit for drilling fluids to be issued in July 1987 for a five
year period where the chloride limit will be reduced even further
to 12,500 ppm and a condition imposed which restricts the appli^
cation of drilling fluids to 20,000 gallons per day per acre.
With respect to the case relied upon by EPA in support
of this conclusion ( J 0 £ J 3 ) it should be noted that it was not
possible to determine whether it was the chloride concentration
alone which caused the Vegetation stress. . I n any case the vege^
tation did not die and instead recovered fully in about two
weeks. A number of land applications have taken place success^
fully with chloride concentrations in excess of that which
existed in case WV13.
•4. Illegal Discharge of Oil.
EPA relies on damage case PA09 in support of this
conclusion. That case involves the action of EPA and the U.S.
Coast Guard under Section 311 of Clean Water Act to engage in
certain remedial action in northwest Pennsylvania growing out of
some old operations in that area.
While our detail comments on this damage have been
filed with EPA under separate cover, suffice it to say that the
practices which gave rise to this action are not indicative of
current day practices and that the case demonstrates the scope
and diversity of the legal authority which EPA and the Coast
Guard believe they have under the Clean Water Act to address such
cases.
19
o-.rs
5 - p
CO
a. e> £ =
CD 3 r+
3 O
o" CD
i f
55" a. c CD
O
CD
CD O
«-h C D
o> zh
3- — 5=J
<a
warn

If m
pSSP/il
pilllgifi
Ji's&;,:Ji2&«^^
5. Abandoned Wells.
Without citing any particular damage cases, EPA has
concluded that there are many older wells in Pennsylvania which
were drilled prior to the time that a bond was required to assure
plugging, upon abandonment. As the discussion correctly notes
however bonds are now required. This conclusion identifies no
problem which could be addressed by new regulations under Subti^
tle C of RCRA that has not already been addressed under state
regulatory authority.
C. Zone 5 Conclusions.
Of the major issues identified for Zone 5 only three
are related to Ohio.
1. Illegal Dumping of Waste in Ohio.
In support of this conclusion EPA relies upon damage
cases^QH-04, OHO7 and QUI2. In addition even though EPA recogniz^
es that Ohio has been aggressive in insisting on compliance from
operators, EPA states its belief that illegal disposal practices
are expected to continue.
With respect to case OHOJL^. EPA is incorrect in de^
termining that this case relates to Ohio at all. The case grows
out of an operation in West Virginia where the company was cited
with criminal charges.
With respect to cases OH07 and 0H12 both statutes and
regulations were violated by discharges which entered a surface
stream. In addition to having violated a state regulations,
20
c o —' — — ~
• » m
to c o " o l
' O CD
- S f * * CD r * CD
o • § ^
3 r + =r — • CD T „ 3 3 It w ID

r
; > # • . fcff
/ • / :
? $/-•.•., • -.'•' •• • ' .,/ • • \ .• ..
310
: ,;
SSf
>• 01". JvVttv -rV.'^&
SKS/w
; i : ,
•.;':.>Vr**;i
tik
I©
0
.- '>.•..!- . • ..'.-.-.',-.. /_V>C^lv..^&ki!cJSkiaV*v)^:>iV^
discharges to surface streams without a permit would be in
violation of the federal Clean Water Act.
The conclusion reached by EPA in this context presents
a curious "damned i f you"do a n d damned i f you don't" dichotomy.
If a state does not have a vigorous enforcement program it i s
criticized by EPA f o r failure to properly enforce its own rules
On the other hand if a state like Ohio has been aggressive in
holding operators to the strict accountability for compliance
with environmental programs the criticism is that "illegal"
discharges are occurring. As with any. regulatory program
(including those directly administered by EPA) there will always
be situations involving noncompliance with regulatory require^
ments. T h e question i s n o t whether t h e r e have been o r will b e
violations of regulatory requirements. Rather, the question is
whether there is sufficient legal authority and resources to
pursue those violations when they occur. The cases with respect
to Ohio illustrate convincingly that there is adequate authority
and resources to pursue noncompliance.
2. Contamination of Ground Water from Injection and Annular Disposal.
In support of this conclusion EPA cites the damage case
J3H38 and its general understanding that annular disposal is no r
allowed in other states because of the potential for ground water
contamination due to t h e corrosion of casings resulting from high
chloride content.
First with respect to damage case OH38 we should point
out that the water well involved in that case showed contamina
tion levels which predated the commencement of annular disposal
21
C O =3 CO C E |U f t — Zj
_,,«< i° o > r n | I 2 . S 2 . I 1 CD — • - * I
g st

• ' " " IL.
lmmm:<m
;^>
O
y;;..<,:,-:v-'.
In addition there was also evidence of the fact that the casing
used in that situation may have been bad initially. More signif^
icantly however the state of Ohio has since adopted comprehensive
regulations related to annular disposal which, among other
things, provides that annular disposal systems must be maintained
air tight (to eliminate corrosion) and be gravity fed. Moreover
annular disposal is not permitted in Ohio unless conducted in
accordance with agency regulations and with the agency's ex^
pressed approval.
Secondly, in addition to Ohio, the states of Kansas and
Louisiana allow annular disposal. As was reported by Elmer E .
Templeton & Associates in a report dated January 1980 entitled
"Environmentally Acceptable Disposal of Salt Brines Produced with >
sf Oil and G a s , a report for the Ohio Water Development Authority".A ^ &
It was recommended that air tight systems be used to reduce "V
dissolved oxygen contributing to corrosion.
3. Contamination of Ground Water from Reserve Pits.
In support of this conclusion EPA relies on damage case
-QH.19 and the general observation that Ohio does not have a state^
wide niip that requires liners in reserve pits.
OH49 is a case arising in the Lake Plains region of
Ohio in 1983. At that time the discharge which contaminated a
water well was a specific violation of state statutory and
regulatory requirements for which enforcement action was taken.
Since m a t time drilling pits in the Lake Plains region have been
requl-wd by the state agency to use synthetic liners or steel
p i t s . In addition, with the passage of S.B. 5 0 1 , brine disposal
22
CTJO 3
5 " 2 . 3-" — -2. £ » S > r+ I
=r * =»••
• &sSWI
° £ fl § St • to =r £• 3 • r+ <S •
(D •
l_

r
„.,„•, I „ , , ,J._.AB
•'•' • ' ' •A. '"' . '*
/ • : • ' ' * • / «
Bti--',sA'.J«<'v;:v. ,•••.•.%.•••.•( ' . j :
t i•:•'•.yi'',- -••• ':'•: "• •; ••.'••v: &
;':'?
S ft! 1,',-KvV. -V.-J; "'(fit fel* * j-v;v.; v v •/..••• vi ••«is>»f
O
UK-:' t't,-
r
L
\--.r.-,-' ','':;r *••;• ' • • ' ^ • ^ ' ' ^ ^ ' • •L'', '.^*';^V',: V'.'; ,;^Vt,',^'''','(''';'
important deficiency in the Interim Report because the incre^
mental costs associated with additional regulations is likely to
be much greater than indicated in Chapter 5 and subsequent
studies. This issue and several others will be addressed on the
comments which follow.
1. Real vs. Nominal Cash Flow.
The Interim Report states that the cost impact of
potential regulations should be assessed using "real" (constant)
dollars rather than nominal (current) dollars. The use of "real"
cash flow is an attempt to remove the impact of inflation in
making decisions. However, management decisions are not based
upon a "real" hurdle rate of 8 percent, they are based upon a
nominal hurdle rate of 16 percent.
EPA's use of an 8 percent hurdle rate would distort the
actual return of a project by more than one percentage point.
The overstatement of the return infers that a new well could
absorb more regulatory costs ($l,200/year operating cost or
$6,000 of drilling cost) than the project really could before
becoming uneconomical to drill.
The reason for the distortion from using "real" cash
flows is that tax writeoffs (depreciation of project's investment
for tax purposes) are not inflation adjusted. In actuality,
investments made in today's dollars will be written off against
future inflated taxable income. Therefore, the "real" write offs
would not offset as much income. Taxes would be disproportion^
ately higher using "real" cash flows.
24
• § C = = O w» ft
« C= O w o ft — i
09
3 3 co . —• <D co . —• S . rj; ST fi> rt.
<° g- r+ C O
° - j . -a — f= ° r+ =-3 H-3- -< p a- S 3 =1 CD p> r+ <Q

^ »
; " . v * ; - : ; ' ' l
mm
Mi
-.,-// ;-;;-.;:V*.,>>&
!p£
13^-%
i/i.'uJ.'iltlll^'.^..:l'
2. Return on Capital v s . Return of Capital.
On page 4 , EPA defines the cost per barrel of disposed
waste as follows:
Cost per Barrel of = Annual Oper. Costs + A n n u a l i z e d Capital CQBt disposed waste Barrels of waste d i s p o s e d per year
All capital costs were annualized by EPA using an 8% discount
rate. This leaves some uncertainty as to how the annualization
was performed. There are at least two different ways that the
annualization could be calculated, the first of which distorts
any conclusions:
a) Annualized capital cost - (total capital cost) (0.08). This methodology incorporates an oppor^ tunity cost of capital into the Cost Per Barrel calculations and thus enables one to capture an 8% return on the capital invested in the project. In other words, this methodology recognizes the interest cost of borrowing the capital funds and adds it to the annual operating costs to be recovered. The problem with this methodology is that there is no provision made for the repayment of the borrowed capital or the replacement of the disposal facility at the end of its useful life. If EPA's contractors assume methodology A, then the implication would be that a project could absorb more waste disposal costs before it would become uneconomical to operate.
b) The second methodology would annualize the capital cost as that annual payment which over the life of the disposal site pays for both carrying cost on (return on) and replacement of (return of) the investments involved. In other words this would be analagous to a mortgage payment problem. For example, $500,000 capital spent in a site with a life of ten years, at 8% cost of capital, requires $74,515 per year in payments. This compares to only $40,000 (500,000 x .08) calculated under the previous method. Another factor complicating matters is that the interest portion of the $74,515 payment is deductible for tax purposes whereas the principal portion is not.
Incorporating the tax sheltering effects of depre^
ciation can further complicate matters. The answer to these
25
CT-.0 <D C O " o (
CD « 5 = " £ * ?S - SCCOD" = O d d S CO O
5 - £ < » B > rt.1
Zr - 4 .
P > IS
a to w p > I
(D B

•G
5 Ki'a^IsM
w?xm
Q
mmwrwm
jHli^i.
IMM,
complications is to iteratively solve for that dollar revenue per
barrel that yields 8% on discounted cash flow basis after all
operating costs, depreciation write offs, and income taxes. The
Interim Report does not make it apparent which, if any, of the
above methods were utilized.
3. Classification Based on Chloride.
A chloride limit of 500 ppm is shown on page 7 in
Table 3-1 for determining if a produced water should be included
in level 1, 2 or 3 of the intermediate scenario. Level 1 allows
current practices, while level 2 requires injection into a
Class II disposal well. This is not consistent with current EPA
effluent guidelines where brine discharges from stripper oil
wells are allowed regardless of chloride content, provided that
the brine is diluted sufficiently with the receiving stream to
insure that water quality standards are not exceeded. This
assumption is also not consistent with current land application
practices where it has been recognized that higher chloride
concentrations can be successfully land applied.
4. Pit Costs.
Cost components of pit construction and closing not
mentioned in Table 4-1 on page 12 include survey and design;
reclamation plan and permit; drafting and typing for permit
application; pit fluid analysis, treatment and discharge.
Despite the apparent neglect of these components, the average
cost of constructing and closing a .25 acre unlined pit was
$26,500, which is significantly higher than actual costs
currently experienced by the industry in the Appalachian Basin.
26
<0 C O " o CO
" 5 "
= 2, 3 - ' 2.11 2.*^:<» B J z,r+
< ° g- c + to
« ? =' = CD
0> CO CD
o o 30
(O

r
!
Silillliiii o
• ; * f c *
5. Lined Pit Disposal Costs.
The cost per barrel for disposing o f wastes i n l i n e d
pits i n the Appalachian Basin i s listed i n Table 4-7, pages 1 8
and 21, a s ranging from $0.98/Bbl. t o $6.78/Bbl. However, since
precipitation exceeds evaporation i n the Appalachian Basin,
disposal o f fluid wastes in evaporation pits i s n o t possible.
Therefore, the costs calculated for this alternative in th
Appalachian Basin should not be included in Table 4-7.
6 . Conversion of Class II Wells.
The a s s u m p t i o n was made o n p a g e 28 t h a t n o new wells
would b e drilled for Class II injection, instead, existing
producing wells would b e converted t o injection a s necessary.
There are a t least two reasons why this assumption is incorrect.
First, i n low permeability reservoirs, where initial
production was £10 barrels o f fluid per day, it i s unreasonable
to assume that injection into a well would b e sufficient t o
dispose of water from several producing wells. Therefore, either
several wells would have t o b e converted o r a new well drilled
and completed in a different formation, if one capable o f
sufficient injectivlty is available in the area.
Second, i n several regions o f the Appalachian Basin,
all o f the wells producing i n a field were drilled prior t o th
existence o f regulations for the oil a n d gas industry. There^
fore, these wells d o not have surface casing and extensive
(perhaps cost prohibitive) work would be required to enable these
wells to meet Class II injection regulations.
27
CD — * ~"\
3 « + =n 5* => » P>
CD I

•%o
$-:10J.?Z
Q
^.ivii?.;
ife*.
1_
7. Class II Well Costs.
The following factors should be considered in
Tables 6-1, 6-3, page 30, and Appendix B in determining the costs
of Class II injection well and facilities in the Appalachian
Basin:
1. If a well currently producing is converted to waste disposal, the revenues lost (i.e. projected production revenues from this well) should be considered as a cost for this conversion.
2. The costs listed in Appendix B for converting a . producing well to Class II injection appear generally high. More specifically, completion rig, stimulation, logging and tubing expense are excessively high based upon Appalachian Basin experience.
3. Many components of the capital costs for a Class II injection facility are too high, result^ ing in an estimated cost that could be three times greater than the actual costs experienced by industry, as shown in Exhibit 1. In particular, the valves, tankage, filters, fittings, etc. and profit and overhead appear excessively high.
The operating costs of a Class II injection facility
are dnrnmented in Appendix C of Chapter 5. Again, the operating
costs listed for the Appalachian Basin appear high. Electric
costs of $0.11/kwh are actually closer to $0.05/kwh. Also, the
replacement of 5,324 filter elements per year (about 15 per day)
would suggest the need for a change in the filter system design,
especially if the original installation cost of $40,000 as
indicated in Appendix B.
° Tnjection Capacity
The assumption appearing in Table 6-4, page 36, that a
disposal well in the Appalachian Basin will be capable of inject-
28
< o t= o - o
< ° a-- g S o
2 ^ t» -* 10 §•«+»!
° • Is £--so '
CD

P
''•">
'!'.
ing 5,000 BPD for 20 years is grossly in error. This resulted in
an estimated disposal cost of $0.38/Bbl. as listed in Table 6-4.
In reality, a good disposal well in the Appalachian Basin might
begin injecting 500 BPD, but the rate of injection normally
declines according to Darcy's Law (refer to one of many Petroleum
Engineering textbooks available) as the water injected into the
receiving formation is displaced further from the wellbore of the
disposal well. The injection rates actually achieved in the
Class II wells are recorded as a part of Underground Injection
Control Regulations and are available to EPA. Exhibit 2 is an
injection well history for a 2,100' Class II well injecting into
a typical Appalachian Basin formation. The per barrel costs of
the Class II disposal alternative is significantly increased if
the injection rate is reduced from 5,000 BPD to the actual
injection rate achieved in the Appalachian Basin.
Also, it should be noted that even if a disposal well
were available in the Appalachian Basin that could inject
5,000 BPD, the transportation costs associated with gathering
this volume of brine for disposal would probably be prohibitive.
This high transportation cost would be anticipated since the
average producing well in the Appalachian Basin makes a small
volume of water (as documented in "An Analysis of the Economic
Impact of New Hazardous Waste Regulations in the Oil and Gas
Industry in the Appalachian Basin") and therefore a significant
gathering radius would be required to accumulate 5,000 BPD of
produced fluids.
29
<2+. —" _~J
I.
< 2 + .
i°~s-=*l o ? 3 s i
3 c+ =r — • _ to =r J- 3 I = c o "" pi I r+ co •

p>
9. Factors Contributing to Disposal Costs.
Higher disposal costs in a given area may be a function
of low permeability and the resultant low injectivity of for^
mations available for disposal, not just the lack of competition
as suggested on page 34.
10. Drilling Fluid Analysis.
The typical drilling fluid analyses presented in
Table 9-3, page 51 and Table 10-1, page .55, are not an accurate
representation of Appalachian Basin drilling pit fluids, where
most of the wells are drilled using air rotary techniques and the
water accumulated in the pit is.actually produced from formations
encountered during the drilling process.
11. Transportation Costs.
The transportation costs calculated in this section and
s u m m a r i z e d i n Table 12-1, pages 6 5 a n d 66, a r e not accurate. The
time required for loading and unloading the fluids was not
included in the cost calculations. Time was only allowed for a
one-way trip for the hauling truck, where in reality the operator
would have to pay round-trip transit time. Even in good weather,
it would not be advisable to travel 30 MPH on the lease and
county roads where most production facilities in the Appalachian
Basin are located. A lower speed should be assumed. In wet
weather, costs for a bulldozer to assist the hauling truck on
lease roads and additional transit time for the hauling truck
should be included in transportation cost calculations.
The transportation cost of $0.01/Bbl./mile documented
in this section, is simply not realistic for the Appalachian
Basin.
30

w
If-
pi 1, 'ft'-.V-;1,'-'-•>.- •'.'1,-.-.-.\-'-'';,:'.""-i.S
CHAPTER VI - ECONOMIC IMPACT OP ALTERNATIVE WASTE MANAGEMENT PRACTICES FOR THE ONSHORE OIL AND GAS INDUSTRY.
According to the introduction of Chapter 6, "The
purpose of this report is to establish baseline, economic cases
that can be used to simulate the economic performance of rep^
resentative projects both with and without the cost of additional
waste management practices."
The following comments are offered to provide an
accurate evaluation of the baseline economics of investments
available to the Appalachian Basin oil and gas industry and to
avoid understating the impact of any future regulations.
1. Hurdle Rate.
We strongly disagree with the conclusion of the Interim
Report that the Cost of Capital is equivalent to the Hurdle Rate.
Common industry practice is that the Hurdle Rate is derived from
several factors, only one of which is Cost of Capital:
Cost of Capital
Overhead Coverage
Unusual Risk Exposure
Intangibles
Page G-18 (Table G-6) of Chapter 6 displays how EPA
derived their Cost of Capital. Historical data were used to
derive (a) risk-free rate, (b) corporate borrowing rate (debt),
and (c) inflation rate. We submit that exclusive use of the past
to derive a cost of capital to be used in the future is
inappropriate. The understanding of past relationships is impor^
tant but only current business conditions and projections of
future conditions should be used in the derivation of cost of
31
o c o " ol 5 P > «± =- -H • 2 a?S S ol
3 2,^^1
• = ?• I
= £ I 3 c+» — . c+ to *
'.tig
r
ilflSiSifft
capital for making decisions in regard to long-lived projects
such as oil and gas drilling.
Project economics are usually prepared on an "incre^
mental" basis. Incremental economics include only those expendi^
tures to be made in the future for the drilling and completion of
a well. However, all wells together must pay for fixed expenses
such as regional seismic lines, administrative costs, geology,
and engineering that are unrelated to specific prospects.
Therefore, the hurdle rate should compensate for the lower
expenditures used in incremental economics. On average, the
hurdle rate is raised two to three percentage points above the
cost of capital in the Appalachian Basin to compensate for
overhead.
The third component of the Hurdle Rate is "additional
risk exposure." This risk exposure is in addition to "average
risk" that is included in the calculation of cost of capital.
There are two types of additional risk to be considered:
(a) risk for those projects in which a large amount of capital is
at risk such as exploratory wells, and (b) liability risk where
there is a hugh loss exposure if something goes wrong. An
example of a liability risk would be risk of an environmental
problem from an unusual accident such as a blowout, oil spill, or
pipeline break. Additional risk exposure will add from one to
seven percentage points above the cost of capital.
Finally, intangibles should also be considered in the
derivation of the hurdle rate. Intangibles could be something as
discreet as whether or not a company has any taxable income. Tax
32
CO cr-o r> <o c o " o 5" p > S: =r -H
» 5 s S o | =F S. ? + — -. • | ^ _ . C D -b I
o
CO CD

f
&:/^^J~^K'y.':i:
:3v
t f c f W i l l i
pStllPlI
I P
Id:--?.---'
losses which are carried forward may never be used in the current
business environment as numerous companies go bankrupt.
A second intangible to be considered is other invest^
ment alternatives for the capital dollars being considered. Size
of a company has no impact on this consideration. For large
companies using internal funds, the decision as to how much
capital to spend in exploration and production is made after
consideration of the returns of other investment opportunities
(internal or external) for the company. Small companies, whose
dominant source of capital i s external, must consider how their
exploration and development projects will compare with other
investment opportunities for their outside sources of capital.
Management will set the hurdle rate high enough so that only
those projects which have competitive potential returns (with
other investment opportunities) will be drilled.
The final intangible to be considered is the management
strategy for long-term growth in assets value. In a public
company, t h e Board of Directors will s e t the hurdle rate above
the calculated cost of capital in order to enhance shareholder
return. Their intent is to set the rate high enough so that only
the better opportunities are chosen. In this way, profitability,
assets, and ultimately the company's stock price will increase to
meet long-term growth goals. The hurdle rate i s set high enough
in an attempt to make the company better than average.
Private companies set the hurdle rate for the same
reasons. Management in private companies are concerned with
increasing the value of their assets over time just like public
33
» « = 2. o
iff ? 1 m . <•> 2. £ 5- P> ^
| o ; 3 | = r+ =T =• a
=J <0 w (U I
CO •
o o 30 >
CD
J

f~~
' » .1
companies. In the case of private companies, market value is not
measured by stock price.
On average, the intangible considerations will add two
to three percentage points to the cost of capital in the current
business environment.
We recommend a 16 percent hurdle rate for the
Appalachian area for average projects instead of the 13 percent
developed by EPA. As illustrated, riskier projects will require
a higher hurdle of 20 percent. A 13 percent rate would create a
large distortion for assession the impact of potential hazardous
waste regulations. If a 13 percent hurdle rate were to be used,
then EPA could state that the average project could absorb a
greater amount of costs from new regulations before the return
for the average project would fall below the hurdle rate. Any
decision to invest in a project (e.g., enhanced recovery facil^
ities) would be grossly distorted in a similar manner. The
i m p p o - t - upon Appalachian operators from this potential under^
statement of the sensitivity of the average well to regulatory
costs would be devastating. Our comments filed on February 10,
1987, frr.cnstrated that even two hundred dollars per year of
increased operating expense would shut-in nearly 19% of all
Appalachian Basin wells. A lowering of the hurdle rate by three
percentage points (to 13 percent) would imply that the average
could absorb $3,000 per year in operating expense or $15,000 in
additional drilling cost. Obviously, this implication is
incoxrect..
34
C5D" cP > o£ + . w= r o - H «° H -- 8 » O _^«< P co rn
T S, *" — ISM-
t D £ • rf C O
£• « H " -t,
° J? = 1 f= ° r+ = 3 «+ =r -• co =r wJ;' 3
I:
O O 30
CO
L HUM

ft!'
2. Sequence Logic.
The sequence logic used in the baseline cases on
page 2-4 ignores waterflood and E.O.R. projects, where production
response may not be achieved for 2 or more years after the
initial investment is made. This fact significantly reduces the
economic rate of return generated by those projects. Over 40% of
the oil produced in the United States is from waterflood and
E.O.R. projects, so they should not be excluded from EPA's study.
Also, in many cases it is several months or even years
after initial geophysical work that an .exploratory well is
drilled. Then depending on company budget constraints and the
length of time required to properly evaluate a successful explor^
atory well, it may be several additional months (or even years)
before development drilling begins.
3. Cost Logic.
The operating costs documented in Appendix F, Page P-2,
of $4,100/year is not representative of major companies in the
Appalachian Basin, especially since overhead costs were not
included in this annual cost. Up to an additional 25% could be
added to this cost if overhead is Included.
4. Need For Gas Well Model.
Since 53% of the successful wells (according to Ta^
ble 3-4 of Chapter 6) drilled in the Appalachian Basin are gas
wells and a significant portion of the industry is involved
primarily in the production of natural gas, a study of the
economic impact of alternative regulations would not be complete
without considering gas wells.
35
5* E. S-- m -H
_H, «< S° © > m I
§ " ' 2 , S -" 2 . '1 S. =t » S > r j
CO a. c to
CD
= ° c+3 I
CD D
<0

p^^ I I I "L.
S v ••
ft-, IS
V ;'.-'.•••.?
>i::*'^k'.--?:':vv1
;-;..-'::.'^:'--'"-''f0
K'"i'-'.
;',v^s|>^;-^.^s
tllllRlitl
l l 11 II
• ' , ' • •.'•rV^-*-,".t^v.-A'i'HV,'.*;/.'A r ; - r ' . . / t •V^..^.iL.K^i;:.Si.^iii!ii.V<i'.*if:»»ii:: ^.^^H.^X'.iV./V.^.:
5. Well Costs
The cost listed in Table 3-2 for drilling a typical
Zone 2 well appears to be excessively below the drilling and
completion costs actually incurred by the oil and gas industry in
the Appalachian Basin. In order to calculate accurate baseline
economics, the drilling costs employed must be a close approxima^
tion of actual costs. Therefore, additional research should be
completed with regard to the references noted for Table 3-2 to
determine if the costs listed are dry hole costs, or do they
include costs for completion work and equipment. Dry hole cost
is a term commonly used in the industry to indicate the cost of
reaching total depth in a well and evaluating it's production
potential prior to spending the significant additional costs
required (such as production casing, formation stimulation and
production equipment) to prepare a well for production. Exhib^
it 3 is a cost estimate for a 2,000 feet oil producer drilled in
1986. The estimated cost was $98,000.
6. Wellhead Prices and Taxation.
The baseline economic study documented in Chapter 6 is
not accurate since inconsistent parameters were used on pages 3-9
and 3-12. For instance, a 1985 oil price (over $25.00/BO) was
used but windfall profit taxes were excluded from this study.
Also, while more favorable 1985 wellhead prices were applied, the
current corporate tax rate (34%) was used rather than actual 1985
tax rate (48%) . The combination of the parameters employed in
EPA's baseline study will result in more favorable economics than
actually generated by industry projects.
36
C T . C 1 CD C
5'SL
CD
OL
O
CD 3
<-»•
=J O
o" to
E3" CL. c CD
«-t>
CD
CD-=J
i-f CD
~*
to CO CD
: * ! ! • • • • - . . • . ' • : '• : : • . ; > / • : • • : • . ..<
|il§ISlfl§
:
il^^'*"
'1&V..
7. Internal Rate of Return.
Using the parameters outlined in Chapter 5, EPA per^
formed cash flow analyses on baseline projects. Table 3-2 lists
an internal rate of return of 10.3% for majors and 10.5% for
independents. For reasons previously discussed in these com^
ments, the validity of these cash flow analyses is questionable.
Also, when considering overhead costs, risk factors, other
investment opportunities, and additional intangible factors, an
IRR of 10.5% may not be sufficient to justify an investment in
the subject project.
CHAPTER VII - SUMMARY OF STATE AND FEDERAL REGULATIONS.
In our comments filed with EPA on January J . 5 , 1987, a
detailed review was provided of state regulatory programs in all
seven Appalachian states. Exhibit 4 to these comments focuses on
the Appalachian states which were emphasized by EPA in its
Interim Report - Ohio and West Virginia. The exhibit reviews the
regulatory requirements of these two states within specifically
identified categories.
CONCLUSION
The Interim Report issued on April 30, 1987, is
seriously flawed for the reasons described in these comments and
undoubtedly others. These issues should be addressed by EPA
prior to preparing its draft Report to Congress.
37
i. o--o 3 : - z i (D C O B O I
5' E L 2"- a -H • _j, « < 5° t o rn | g 2, a-' 2. - - •
ar -J - j - _
" §•»•«•» I O§ H ° - « 3 + ? 3 ! I 3 « -* • =T. 5 " 3 CD w p> I «-*• o a •
<o
L

ffAT&^&a;,?^ SL
©
IK
1 ^
Respectfully submitted this 13th day June, 1987.
INDEPENDENT OIL AND GAS ASSOCIATION OF NEW YORK
INDEPENDENT OIL AND . G A S ASSOCIATION OF WEST VIRGINIA
KENTUCKY OIL AND GAS ASSOCIATION OHIO OIL AND GAS ASSOCIATION
PENNSYLVANIA NATURAL GAS ASSOCIATES PENNSYLVANIA OIL AND GAS ASSOCIATION TENNESSEE OIL AND GAS ASSOCIATION VIRGINIA OIL AND GAS ASSOCIATION
WEST VIRGINIA OIL AND NATURAL GAS ASSOCIATION
By Counsel
ROBINSON & McELWEE
fVy David M. Flannery
600 United Center Post Office Box 1791
Charleston, West Virginia 25326 (304) 344-5800
38
i,
W E crxj =j CD C
10 S °> o I • » m
CD
*< 2. 3-" 2. 3
8. 3 « E » H-ZT ^ -3- m
<° ^ ^ » g-CD O r*
= ° ^
» 3-
mm

>Kfi
•::l^^^XiiJ^^'u^'^l':^i^~ •
Exhibit 1
ColDwil nntii"
3 , 1 ill.*.!'
AUTHORIZATION FOR EXPENDITURE PRODUCTION (OuifMtNT ANO/OH OTH1R COSTS
AP?No
lliLSxiS.S .OMPANY
'Je:»nin-xzo* lrlt~rEl xIp' alofri ation & Production iCLL NAMIANVNO" T i r l f f Water Plant * Lines •PIRATOR"
API Tnioor Location N o m o 12*1
rtan
—»^--.x^ ITiAtEtAJL; OIVIIION
RO*CTO«CRIPT.GN . ins ta l l *ater.mjeet1on . _
taim-ln .
Sin*. •Of!'.
< Und
OTick
QGull
0°!!. . . . ROD
GroM
..,,0.9.8,0,0
r a j ««»*» USTIFICATION .
IPI iPiLiniMiTiUiIiHiE, Parkersburg
Tariff 18000 couVfv on PARISH" "" " ~
Roane _ LIASINA'MI'ANONO.
Tariff Unit <10-D9917_
UNDIVILOPID LIASI NO,
STATS West Virginia
CI E.p< OATt TO COMPLETE
" " Cod. ' U/Auuc P > 0 » No.
.,8.7,5,0,0.Qhj.Q.ZiZ.Q.q.Q J.1,,1 «••>»•••<• RopnlloCoo.
D » » i » OjNm DAYS TO ORiLL
Aim. API No.
Cotllflf L o c a t i o n Mfct
I I I I I I
a vi PROPOSED OEPTH
JOMII Voniuro
P No D v « IfwifonmontptCml
Oaoreiw
C 7-Co, O iOund,
»A» J.IJQAM
ewsnr VUnd-OtMr
i i2iQiO
•Ml. Cod,
«S.f.iv M H W *
DETAIL O P PRODUCTION EQUIPMENT AND OTHER COSTS
146
lifi lifi 146
146 lifi lifi
06 lifi 146 156 146 lifi
OtiCRIPTION
456 Supply-«JExtend.existing.USU line to-new-plant-slte
125 452 453 46Q
i_.BJ_JS. —HxBfLeBu J J BfLeBuimnflt-lncludlng-set up _5QJlLjEaton_for JnJectlon. p u m p s _ —BucBhy-Pannels
Ifljectlfin p u r c p & i _ 3 2 3 .used
125 46fl 463
453 45Z 5D1 5Q5 545 59B
rl liter. Equipment. '.
QUANTITY
1.300'..
AMOUNT i o n
.34.500-J.60Q, -2.BQQ--9*fiQQ_
4:. &J2ZLX. 10! Buildin _BackHa5tu)iimn.WJiiotQn
_3:Phase£.£Quec^o..plant..site —Tanks,r_21fl Bblw/walkways .and stairs.. —CflBDanjLLflbDt .Benefits.
lifi 456
-Dozen S_lEueklafl_ —HiseelJaneous
-Hater Injection Unas.
, KHE: Sue to tine constraints, a survey of Class II injection facil i ty costs in the Appalachian Basin \mz not possible. 9 i i s
. exhibit therefore represents the 1982 costs • of one operator rather than an industry • average.
1 tnt
1 tnt 1 Lot 1 Int.
..34..10Q.
.16.000.
-73.Bnn.. JMQQ.
-15.000,
-1ZJ10DL
,79.000
oOMPANT NAME
••PHOYAL
o Q
O
(0
M m a

:
m-i^iijif'tp^rJf'iV-'!-^ ^^^^ww^^^^^^P^^^^f^ g^^^^^rg^r^.^'^^??-^
^y*.afeSe-r? A^g/'S^-wW^ g - ^ ^ ^ h ^ ^ ^ i ^ ^ - ^ ^
(... NO 3 4 0 L 3 t » Ol tT IQtM QRAWJ PAPER KfM«-LOCAI=irHMI^
3 CYCLES ». ;2 OIVISTIMS PFP I N C «
tuatMc oitTiacM ea. *»«f7 t ••>. U . 1 A. \
H U » B » M « * - . HI • * a > •>! « C « »i
_>—,. . -4-;—!-:+ -
z.4i--^r:_pi„^_
• , — . — . 1 1 — i t—•—I—t—~-i
•-p£r >--•*--»-+-:—r~*r~n—~"..i -1 >.— -i— JT-~Trr^Ti~"iry''~"L H1L.rL-i-!»: —l—lpi
" " 1
6L0...VH90 paiujij. Buiaq
luamnoop aqi io /typjnb gq; 0} anp si v, 'aoi^ou Siqi U3lJi JB910 SS3| si
36BIU1 lujij. am i\ •-30I10N
^BPJW

'tV.:.---
•Lj,:,.*5r"
ik_....-.._

^^T1
• * . '
•&
' o
fo
" m m * J 1 " ™r-g","JHTIinBWil
fare haaecH* A-Li
A N J E C T I O N DATA W«ll Ko.^2£_
Year
W
... Month
January
February
March
April
May
June
July
AURUSt
September
October
November
December
Total
Avg. Press .
w 41?
<w /cv(r
Avg. Rate
. . * " >
M II 3U>
Water
-/oof ^0}
H \ U
. IOS0
Cum. 1 Water
//57a*
/ifc,0i7
//tVfi
n«oaa
Month
January
February
March
April
May
June
July
August
September
October
November
December
Total
AVg. P r e s s .
•
Avg. Rate
•
Cum.
Water
Tear Tear
CO cr.o 3 CD C O
5" EL 2: jr- -H •
^ o ?••" 2. '1. i S.rt;CO P ^.1
3 «••• 21 5" • = <o P> I «+ <a •
<D •
o Q
O
<0

# • • • ll
"1 o-
• ; !
:o
o
CO
CTJ3 Z3 CD C O i-55 S - 3 1
co
•" - - sr -H — o co ~ «-»• co ro O
_j,<< i° co m
If S, rt-' H " rtos m
=r ~» =j-S - <o ST -»> " 5? 3" ! 3 r* =T — co 3- s;- 3 = co fa
CD
o o
o

>^»^*"r
_.c F l
'TO
•'ir. a
; - v ¥ l •
o
c r J O ct> cz B'SL
<c - --*•< of th
Im
ed
CD
O .
O e 3 CD =J r+
=1 O rt-
p +
CO
C L
CD
e-f-O
r+ ZT CD
5 " o sr-» co o » m o^ CD - *
* * f-H <0
p> "*»
^ 3 =r = •
P> CO CD
o o >
CD

f
k
1 mmmi
m^!':'
j li^ fe
:0
!&.:•}••i'')(?'iv, ,'•';.-''•V^v?.-17!^8
, ^ . W , ; = P | *;W#&;=$.
!
A.
Exhibit 4
I. OHIO
Reserve Pit Design, Construction and Operation
1. Performance Standard
ORC 1509.22 (C)(3): Brine and other wastes associated with drilling, fracturing, etc. may be contained in pits, but the pits must be designed "to prevent the escape of brine."
2. Liners
OAC 1501:9-1-07: Well operations must be conducted "in a manner which will not contaminate or pollute the surface of the land, or water on the surface of the land, or water on the surface or in the subsurface."
Overtoppings
OAC 1501:9-1-07: Well operations must be conducted "in a manner which will not contaminate or pollute the surface of the land, or water on the surface or in the subsurface."
Commingling Provision
No such provision was identified in the regulations.
Permitting/Oversight
ORC 1509.22(C) gives the chief of the division of oil and gas the authority to regulate the storage and disposal of brine and other waste substances.
L
•!

• • < % • • * . $ CD C O
5" SL -
CO
•':•%
~0_
Q.
*:. '.'••.••-• !>..'•• v .' - r . I . t • ? . !»'
A:?^
';•>!
Reserve Pit Closure/Waste Removal
Deadline/General Standard
ORC 1509.072(A): "Within five months after . . .. surface drilling of a well is commenced, the owner . . . shall, in accordance with his restoration plan filed [with the chief of the division of oil and gas], fill all the pits for containing brine, other waste substances resulting, ob^ tained, or produced in connection with [the drilling opera^ tion] . . . and remove all concrete bases, drilling sup^ plies, and drilling equipment. Within nine months after the date upon which the surface drilling of a well is commenced, the owner or his agent shall grade or terrace and plant, seed, or sod the area disturbed that is not required in production of the well."
Land Disposal/Application
OAC 1501:9-1-07: Well operations must be conducted "in a manner which will not contaminate or pollute the surface of the land.
Road Application
onr 1509.226(A) provides that if a local government chooses to permit the surface application of brine to' roads and similar surfaces within its jurisdiction, then such activity is permitted. Otherwise, it is prohibited. ORC 1509.226(B) establishes specific standards for road spreading.
Surface Water Discharge
ORC 6111.04: "No person shall cause pollution or place or cause to be placed any sewage, industrial waste, or other wastes in a location where they cause pollution of any waters of the state . . . except in such cases where the director of environmental protection has issued a . . . permit." This provision does not apply to wastes associated with oil and gas drilling that are disposed of in a well pursuant to a permit issued under Chapter 1509.
OAC 1501:9-1-07: Well operations must be conducted "in a manner which will not contaminate or pollute . . . water on unc surface or in the subsurface."
CD CO CO
O
CO CO
c+
o —1
3T CD CD O.
g© -OC mS-z
r -™*
« 2" 3 ? != ° r+ = 3 «+ =r =• CD zr w~ 3 SJ C D p>
O l CV 30 >i o CD
HflTitlilfB

for • , •«VfcA«
''"H
W <? 1 ,^
^H / - J f iSV
if " ; .,
« #
L
5. Annular Injection
ORC 1509.22(C)(1) provides that "(b)rine shall only be disposed of by injection into an underground formation, including annular disposal if approved by rule of the chief [ o f the division of oil and gas], which injection shall be subject to division (D) of this se'ctioh." Division D requires a permit for injection of brines or other waste substances unless a rule of the chief expressly authorizes permitlesB injections.
CO CT.O =1 (0 £= O „ ,
3" P > Et =r —11
rtd
'"• l~
..^•>».-.'.-,..;.fVf..r.--,.v.'iiytra-::'. •it*,'.V-|' > • , ' ' . ' / » : *
Produced Water Pit Design and Construction
Performance Standard
ORC 1509.22(C)(4): "Earthen impoundments constructed pursu^ ant to the division's specifications may be used for the temporary storage of brine and other waste substances in association with a saltwater injection well, an enhanced recovery project, or a solution mining project."
ORC 1509.22(C)(5) states that brine may not be temporarily stored in pits or impoundments except as provided in ORC 1509.22(C)(3) and (C)(4).
ORC 1509.22(C) (6) forbids the use of a pit for the ultimate disposal of brine.
Liners
There is no explicit provision, but liners may be required to satisfy ORC 1509.22(C)(3).
Permitting/Oversight
ORC 1509.22(C) gives the chief of the division of oil and gas the authority to regulate the storage and disposal of brine and other waste substances.
" f f S w o l -*<<
= T ° *+ - I 2Lg:« e» .J
« g - r f »
«• 1 = 3 •+ 5! 3" z> OB w (U
CD |

S ' Z
llP
p-m
G
Q
Iplillilill
ipi'S; Hi
• ^ f e
t e _
L
D. .Produced Water Surface Discharge LimitB
1. Onshore
ORC 6111.04: " N o person shall cause pollution o r . place o r cause to be placed any sewage, industrial waste, or other wastes i n a location where they cause pollution o f any waters of the state . . . except i n such cases where the director o f environmental protection has issued a . . permit." This provision does not apply to wastes associated with oil and gas production that are disposed of in a well pursuant to a permit issued under Chapter 1509.
OAC 1501:9-1-07: Well operations must be conducted "in a manner which will not contaminate or pollute . . . water on the surface or in the subsurface."
OAC 3745-33-02 requires a n NPDES permit f o r pollutant discharge.
2. Coastal/Tidal
Not applicable.
3. Beneficial Use
ORC 1509.226(A) - A local government can permit the surface application of brine to its roads, etc. for the control o f dust or ice. ORC 1509.226(B) establishes standards for such road spreading.
r~
i'%s$sV?:fii
ipW^O
}WM
i .
Produced Water Injection Well Construction
Casing
OAC 1501:9-3-05.(A)(1): "Surface casing shall be free of apparent defects and set at least fifty feet below the deepest underground source of water containing less than ten thousand mg/L total dissolved solids or less than five thousand mg/L chlorides, and sealed by circulating cement to the surface under the supervision of the division. In the event cement fails to circulate to the surface, the division may approve a remedial course of action."
MIT Pressure and Duration
OAC 1509s9-3-07(G): "Mechanical integrity shall be shown by one or more of the following methods:
(1) The casing, tubing, and packer shall be tested by pressurizing the annulus between the tubing and the casing outside the tubing to an amount equal to the maximum allowable injection pressure as determined in para^ graph (D) of [OAC 1509:9-3-07] or to a pressure of three hundred pounds per square inch (psi), whichever is greater, for a duration of fifteen minutes with no more than five per cent decline in pressure unless otherwise approved by the division;
(2) Tracer surveys;
(3) Noise logs;
(4) Temperature surveys; or
(5) Any other logs or tests considered effective by the chief."
MIT Frequency
OAC 1501:9-3-07(G): If the annulus cannot be monitored during injection of fluids, then the well owner must prove mechanical integrity once every five years.
C T J 3 CD C o 55 §
CD a o ? •• • S L _ . ~ * _ . CD - *
«$ » e cf I
°- to £ -b1
» § CO
CD
iminnniinniffll

ilii
tflflllte!
ltllfit
.'.'-,• •••: .'S''A'V«.**
?*»*.'
•Sz2-L ?$*Z'V2'^$^i£iM^&;:^&L£l
Area of Review
OAC 1501:9-3-06 (B) : The area of review for wells in which injection exceeds 200 barrels per day per year shall have a radius of one-half mile. The area of review for wells in which the maximum injection is 200 barrels per day per year shall have a radius of one-quarter mile.'
Annular Disposal
OAC 1501:9-3-11: Disposal of salt water into any annular space is prohibited, except where the practice has been approved by the division of oil and gas and is performed in accordance with the standards imposed by this rule.
OAC 1501:9-3-11(0 discusses volume limitations.
I. crjo 3 ^ - Z l » «= 2. 0 | 5" 2 L -• S" - H • -,<< ? « m I :? 2. 3 -" — -• 2. c + 5 • e > ,+1
<° &£» §•"» 5 > i S j o f f 3 a |
co =r j ; - 3 I 3 CP p> I
<o I
L

p
v-^n-^^^ffla&toijil:f£::::f ^'i^SSS'Vjfei'M^'tfvKMi'.i ijss&ii^
f ;
;;"^*-«
5
Produced Water Injection Well Abandonment
Plugging Deadline
OAC 1501:9-11-05(0: Abandoned production of injection well plugging operations must begin without delay after produc^ tion or injection operations have ended. The chief or his authorized representative may grant exceptions.
Plugging Specifications
Specifications are given in great detail in OAC 1501:9-11-07 to -09.
Plugging Oversight
OAC 1501:9-11-12(A): "Within thirty days after completion of the plugging operation, a plugging report on a form provided by the division and signed by the inspector present at the plugging operation, shall be filed with the division. A cementing report made by the party cementing the well or a copy of the prepared clay purchase record shall be attached to the plugging report. If plugging operations were not witnessed by an inspector a plugging report . . . signed by the owner or his agent shall be submitted to the division within thirty days after completion of the plugging opera^ tion."

r~
w;$
' * • • ; • • •
: • » £ : • • . • • •'
';{ &•'" • •o
«m
*te,ui+vJjL**Mi
II. WEST VIRGINIA
Reserve Pit Design, Construction and Operation
1. Performance Standard
Series 1, Section 16.4.1, Dept. of Energy, Div. of Oil and Gas Rules: Pits must be designed "and maintained so as to prevent seepage, leakage or overflows and to maintain [their] integrity."
Water Pollution Control Permit No. WV 0073343(G)(1): "The discharge of treated or untreated pit wastewater or sludge, caused by any reason such as . . .leaking or overflowing or an unstable or breached pit, into the water of the State is prohibited."
Water Pollution Control Permit No. WV 0073343(G)(10) pro^ vides specifications for pit construction.
2. Liners
Series 1 , Section 16.4.4, Dept. of Energy, D i v . . o f . Oil and Gas Rules: "If existing soil is not suitable to prevent seepage or leakage, other materials which are impervious shall be used as a liner for a pit. Any such liner shall be installed in such a manner as to protect the structural integrity of both pit and liner."
Water Pollution Control Permit No. WV 0073343(G)(10)(d) contains identical requirements to Series 1, Section 16.4.4, Department of Energy, Division of Oil and Gas Rules.
3. Overtopping
Series 1, Section 16.4.3, Dept. of Energy, Div. of Oil and Gas Rules: If an operator cannot maintain adequate freeboard to prevent pit overflow, another pit must be built conforming to the pit construction specifications in Sec^ tion 16.4.
Water Pollution Control Permit No. WV 0073343(G)(10)(c) contains requirements identical to Series 1, Section 16.4.3, Department of Energy, Division of Oil and Gas Rules.
i.
= m C mO STe 6 C™O o l
ST O
•C D "I

r
>fSi '• •" •••••: ••'• - ' ' 5 - ^ S B , 0
ite& ' . & • : ; * • . •:<•••<
§ llitil is
tell'
' / : • ':; •' •(' tV>*7^w
L_
^^MM^',u^Sii^&i&^^^!}i!^^;£^ii:r:^-X&
4. Commingling Provis ion
Water Pollution Control Permit N o . W V 0073343(G)(7): The following materials may not be dumped into a pit: production brine (produced water); unused frac fluid or acid; compressor oil, trash, rubbish and other refuse, diesel, kerosene, halogenated phenol a n d drilling'additives prepared in diesel or kerosene; and any waste fluids after initial treatment of the pit waste.
5. Permitting/Oversight
Series 1, Section 16.1.1, Dept. of Energy, Div. of Oil and Gas Rules: " A proposed reclamation method f o r construction of . . . pits . . . shall be submitted o n Form W W - 9 with t h e application f o r any permit required by W.Va. Code S22B-1-6. . . . Such proposed reclamation methods shall be approved by the Director or his designate, prior to the issuance of the permit, a l l reclamation shall be done under the super^ vision of the Director."
10
er -o =» CD c o
5 " fiL — - v C OD
2=
m
CD Ok
S - S . _ . w m P>
CD c <+ CD
o-C-D S33
IT? ! co 3 - 5 5 - 3 = CD m (O
——-nMMMIIHHIIIHir'

PT -.. ' ^ '." f
f ? : ' . " - ; ' ': ,'.• .• ' ;'/;'.Wv: '. '.'.V •.'•;«
O
;te.v
1 1 . , - , , , r,w^
Q
fe^j5$?*S ii-&ttsfi$
tfs'.<'-:-,. •''•.- ' ' . , '
$$**••*'
B. Reserve Pit Closure/Waste Removal
1. Deadline/General Standard
W.Va. Code S22B-l-30(a) - Pits not needed. for production purposes or not required by law or rule must be filled within six months after the drilling process has been completed. All concrete bases, drilling supplies, and drilling equipment must also be removed at this time.
W. Va. Code §22B-l~6(d): "An erosion and sediment control plan shall accompany each application for a well work permit except for a well work permit to plug or replug any well."
Land Disposal/Application
Water Pollution Control Permit No. WV various requirements for land application
0073343 contains
Surface Water Discharge
The Water Pollution Control Act, W.Va. Code S20-5A-5 prohib^ its point source discharges to State waters without a permit. State waters include both surface and groundwater.
Series 1, Section 7.2, Dept. of Energy, Div. of Oil and Gas Rules: "No discharge of salt water, brackish water, or other water unfit for domestic livestock or other general use shall be made into the waters of the State."
Va. Code S22B-1-7 requires water pollution control permits, grants the director of the division of oil and gas, department of energy enforcement authority, and provides penalties for violations of this section.
i .
CO
<0
0 - . 0 CD
-H, < < - t o rn |
" 2 . H -" 2- --" 3 CO
m fi> rt.
CD
c o 3 | 3 r+ =r ~- _ 3 « P i c+ CO m
f*l l o
o 30
CD
~Z

r~
|HI|il|K^
£5;<:y,-';,V. ' ' • • ' V : - ' • K , 1 : ' - : • ' " ' : - ; . ' > i ' / g i
]o
. \^iM^j)iy^r,''tS: £><Z^&;^
C. Produced Water Pit Design and Construction
1. Performance Standard
Series 1, Section 16.4.1, Dept. of Energy, Div. of Oil and Gas Rules: "Any pit shall be constructed and maintained so as to prevent seepage, leakage or overflows and to maintain its integrity.
Liners
Series 1, Section 16.4.4, Dept. of Energy, Div. of Oil and Gas Rules: Liners are needed if the existing soil does not prevent seepage or leakage.
Permitting/Oversight
Series 1, Section 16.1.1, Dept. of Energy, Div. of Oil and Gas Rules: "A proposed reclamation method for construction of . . . pits . . . shall be submitted on Form WW-9 with the application for any permit required by W.Va. Code S22B-1-6.
Such proposed reclamation methods shall be approved u* (.ixe Director or his designate, prior to the issuance of the permit, all reclamation shall be done under the super-tHqjon of the Director."
l. CT-JO CD C o CO - = •
—— « <0 —' ,
_*,«< - o > m |
8. * 5 * ! » ,J
CO
CD
r f => t= O 3 CD 3
=T 5 3 CD m (0
C O

' '' v-
t W"-'-•••>^Vi«ro./.:ri5'..-j:,jS-M
D. Produced Water Surface Discharge Limits
1. Onshore
The Water Pollution Control Act, W.Va. Code S20-5A-5 prohib^ its point source discharges to State waters without a permit.
Series 1, Section 7.2, Rules of Div. of Oil and Gas: "No discharge of salt water, brackish water, or other water unfit for domestic livestock or other general use shall be made into the waters of the State."
Series 4, Section 3.1, Rules of the Div. of Oil and Gas: "No person shall discharge pollutants . . . into surface waters of the State except as authorized pursuant to State NPDES permit, general permit or combined well work permit."
2. Coastal/Tidal
Not applicable.
3. Beneficial Use
Road spreading of brines is not prohibited and is currently being studied.
Permitting/Oversight
Series 4, Section 3.1, Dept. of Energy, Div. of Oil and Gas Rules: A State NPDES permit is required for discharge into State waters.
13
O-XJ
5" £ 2
3 %
CD
O .
O
CD 3 c+
ZJ O
. o"
r *
<0
O .
CD
O
CD
s
2. —
«•+ CD
P > rs
^ o5"3
CO CD

r
Q
i;lil :
i^a*"--1.
L
Produced Water Injection Well Construction
orja s y z l « c o ™ ol
51 S. «• 2- - •
°"f = 1
1. Casing
Series, Section 7.1.1, Department of Energy, Division of Oil and Gas Rules: "Injection of water, other liquids, or wastes shall be accomplished through a tubing and packer arrangement with the packer set immediately above the injection zone, and the annulus between the tubing and casing shall be monitored by pressure sensitive devices or through production casing adequately seated and cemented that will allow monitoring of the annulus between the injection casing and last intermediate casing string or coal-fresh water casing string, as the case may be.
MIT Pressure and Duration
Series 1, Section 7.3, Department of Energy, Division of Oil and Gas Rules discusses requirements for mechanical integri^ ty testing.
MIT Frequency
Series 1 , Section 7.7.2, Department of Energy, Division of Cii and Gas Rules: "The mechanical integrity of a liquid injection or waste disposal well must be demonstrated to the approval of the Director again within five years from the last test date order for injection to continue."
^oandoned Wells
W.Va. Code S22B-1-23 - "Prior to . . . the abandonment of any well, the well operator shall either ( a ) notify . . . the director and the coal operator operating coal seams, the ccai seam owner of record or lessee of record . . . and the coal operators . . . of its intention to plug and abandon any such well."
Series 1, Section 13, Department of Energy, Division of Oil and Gas Rules discusses requirements for the plugging, abandonment, and reclamation of wells.
=3 > r+ sr == • <cDo =r =3 > r+ =3 > r+ sr == • <cDo = r —S " 3 =1J C<Do w p) i
•
p) CO I•
o o DO
• x
CD
*&,

I fvv.7
m
.•V-.-./'v.^ ••••;..-.••;,•.--|j
.• '• ' \ •. - . 3
mm :
u.'.-j;;-..,- ; ; , '
Mi
pi • ;. i.\vj;gg
|v^;^^t:^^p^;
i|5J:::;';;g:;v;Vi:j;i: 5,15^1
lilllfllll
lilltiiilS
| ^ - „ , , ; , , ; ; , , , , , , , , , , V v V V
iilk ES&tfiS
L
Produced Water Injection Well Abandonment
Plugging Deadline
W.Va. Code S22B-1-19•- "Any well which is completed as a dry hole or which is not in use for a period of twelve consecu^ tive months shall be presumed t o have been abandoned and shall promptly be plugged by the operator . . . unless the operator furnishes satisfactory proof to the director that there is a bona fide future use for such a well."
Plugging Specifications
Very detailed specifications are spelled out in W.Va. Code S22B-1-24.
Series 1, Section 14, Department of Energy, Division of Oil and Gas Rules discusses materials used in well plugging and application for well plugging.
Plugging Oversight
W.Va. Code S22B-1-23: Before plugging operations a n d abandonment commence, the director must be given a bond.
i. CO
CD = !
co
c r j a ZJ CD C O ™ a i +
- j ; co 5? o |
£ S° w CSDi
3 3 . r+ Si — CD CD S . ££ C O P r t - I
C D O. C
a. CD o o
pi ^j»
E±3 I
co
o 33
o (0


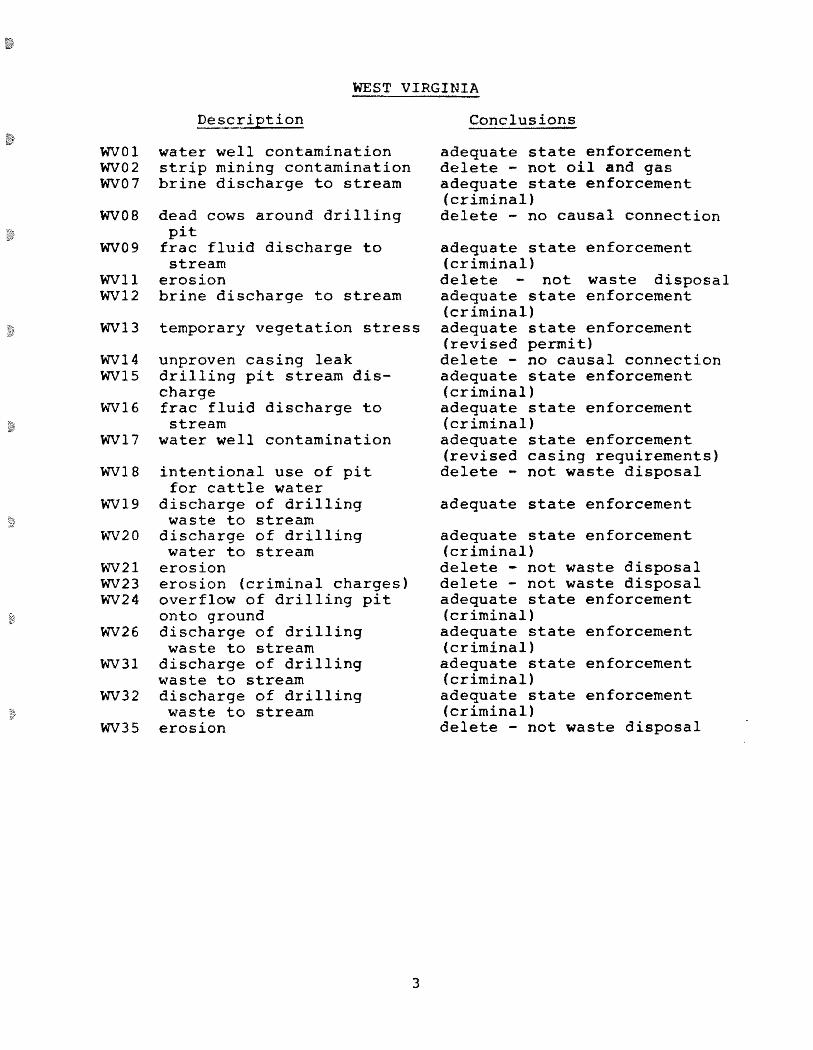
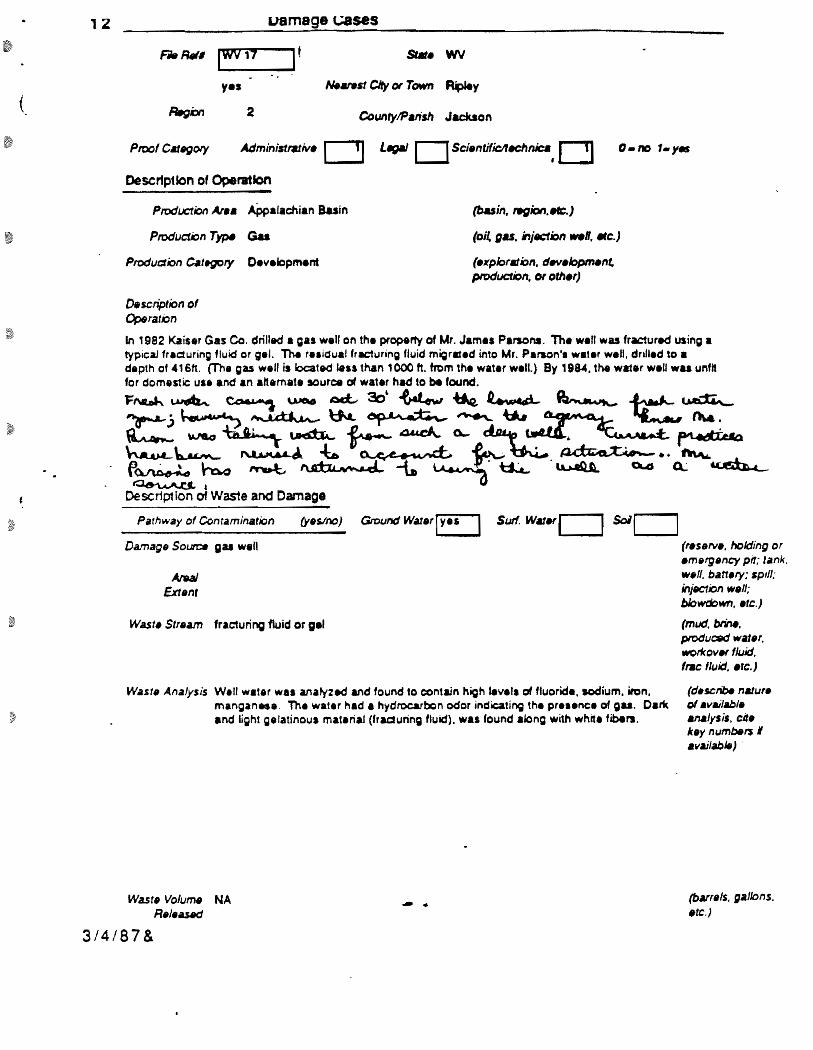


Integrating Fracture-MappingTechnologies To Improve Stimulations in
the Barnett ShaleM.K. Fisher, SPE, C.A. Wright, SPE. and B.M. Davidson, SPE. Pinnacle Technologies; A.K. Goodwin, SPE.
E.O. Fielder, SPE. W.S. Buckler, SPE. and N.P. Steinsberger, SPE. Devon Energy Corp.
SummaryA large hydraulic-fracture diagnostic project was undertaken in thesummer of 2001 that integrated fracture-diagnostic technologies,including tiltmeter (i.e .. surface and downhole) and microseisnticmapping. The extensive data gathered resulted in a much clearerunderstanding of the highly complex fracture behavior in the Bar-nCIl shale of north Texas. The detailed fracture-mapping resultsallowed construction of a calibrated 3D fracture simulator thatbeller reflects the observed mechanics of fracturing in this frac-tured-shale reservoir. More than just simple calibration wasrequired. Indeed. a whole new understanding of'fraclUre growthwas devcloped.
The Barnell shale has seen a rebirth of drilling and refracturingactivity in recent years because of the success of waterfracture, or·'light-sand." fracturing treatments. This extremely low-permeability reservoir benefits from fracture treatments that estab-lish long and wide fracture "fairways," which result in connectingvery large surface areas of the formation with an extremely com-plex fracture network.
Understanding the created-fracture geometry is key to the ef-fectiveness of any stimulation program or infill-drilling program,particularly in this area. with its nonclassical fracture networks.lntegrated-fracture diagnostics have led to the identification ofnew fracturing techniques. as well as additional refracturing andinfill-drilling candidates. A new method for evaluating large nti-croseismic data sets was developed. Combining the microseismicanalysis with surface- and downhole-tilt fracture mapping allowedcharacterization of the created-fracture networks. Correlations be-tween production response and various fracture parameters will bepresented along with a discussion of methods for calibrating afracture model to the observed fracture behavior.
Barnett BasicsThe Mississippian-age Barnell shale is a marine shelf deposit thatunconformably lies on the Ordovician-age Viola limestonelEllenburger group and is conformably overlain by the Pennsylva-nian-age Marble Falls limestone. The Barnell shale within the FortWorth basin ranges from 200 to 800 ft in thickness and is approxi-mately 500 ft thick in the core area of the field. The productiveformation is typically described as a black, organic-rich shale com-posed of fine-grained. nonsiliciclastic rock. with extremely lowpermeability, ranging from .00007 to .005 md. The formation isabnonnally pressured, and hydraulic-fracture treatments are nec-essary for commercial production because of the low permeability.
The first decade of Barnell shale stimulation treatments wasdominated by massive hydraulic-fracture treatments (more thanone million Ibm of proppant carried by highly viscous gel sys-tems). Production was variable. with wells producing up to I Bcfestimated ultimate recovery. [n 1997, Devon Energy (formerlyMitchell Energy) began experimenting with waterfractures. orlight-sand. fracturing treatments. which were at the time. being
Copynght 0 2005 Society ci Petroleum Engineers
This paper (SPE 77441) was first presented at the 2002 SPE Annual Technical Conferenceand Exhibition. San Antonio. Texas, 29 September-2 October, and revised for publication.Onginal manusc~ received for review 13 December 2003. Revised manuscript received24 January 2005. Paper peer approved 09 February 2005.
May 2005 SPE Production & Facilities
successfully applied in the COllon Valley sandstone-a tight gasreservoir approximately 100+ miles to the east of the Fort Worthbasin. I The waterfractures were successfully reintroduced into theCOllon Valley because of the then-<:urrent lack of commercialviability for large, expensive cross-linked fracture treatments inthat reservoir. Devon believed that similar success would beachieved in the Barnell shale with large-volume slickwater treat-metllS and subsequently experimented with several versions ofthese treatments before evolving to the current design. Today.depending on the location within the Barnell, viability of limestonebarriers sur·rounding the Barnell intervals. andnet-pay thickness. a·"typical" Bamet! treatment may consist of 750.000 gal of slick-water and 80.000 Ibm of proppant pumped at 60 bpm. with prop-pant concentrations averaging 0.1 to 0.5 ppg throughout the treat-ment. The lack of gel solids in the fracturing fluid is believed tocontribute to longer. more complex fractures and additionally.leave no gel residue or tilter cake behind that may damage thefracture conductivity in these treatments. Because of the low-permeability nature of the reservoir. it is imperative that extremelylarge fracture-surface areas are created by the fraClUre treatments.The use of light-sand, or waterfracture, treatments has consider-ably improved both the production performance and the economicsin this reservoir. Because of its extremely low permeability. thedrainage distance from the fracture face is very small.
IntroductionThe classical description of a hydraulic fracture is a single biwingplanar crack with the wellbore at the center of the two wings.However. almost all physical fracture verifications perforrned todate. from corethroughs 10 minebacks. have proved this descrip-tion to be oversimplified. Therefore. fracture-mapping technolo-gies can provide insight into reservoir-depletion dynamics andsignificantly help optintize reservoir management. Frdctures canbe categorized as simple (the classical description), complex. orvery complex. An illustration of how these fractures may look isfound in Fig. 1.
Because of several factors. including the presence of natur:llfractures. a fracture treatment in the Barnet! is more likely to looklike the "very complex" fracture description than the "simple"case. This allows a fracture fairway to be created during a treat-ment with many fractures in multiple orientations, resnlting inlarge surface areas potentially contributing to production. Numer-ous treatments have been mapped in the Barnet! to gain a bellernnderstanding of how these fractures propagate.
The primary (i.e., hydraulic) fracture orientation is northeast(NE) to southwest (SW) in this area. This has been verified fromboth surface tiltmeters and microseismic-fracture mapping. Addi-tionally. many secondary fractures identified from oriented coreand borehole-imaging surveys in this area arc oriented orthogonalto the primary fracturing [northwest (NW) to southeast (SE)],2 andthese natural fractures may he activated (i.e .. opened) during ahydraulic-fracture treatment. The length and width of the resultingfracture fairway is important in determining the area contacted bythe fracture so that well location and spacing can be optimized.Because of the aforementioned small drainage distance from afracture. the density of fractures within this fairway is very im-portant. There may be opportunities for additional wells to bedrilled in less-densely fractured areas within a fracture fairway or
85

Reservoir
xX (wellbore)
Mlcroseismic
- / Receivers
x (tip)X
X
Downhole Tilt
x
X
Surface Titt
AzimuthHeightLength
AsymmetryNWVolumeComponent
Barnett ExamplesSurface tiltmapping was used to detennine the primary and sec-ondary fracture orientation and the fraetional volume of fracruringslurry placed in each orientation. The wide. shaded rectangle inFig. 4 is the primary-fracture length (from downhole tiltmapping)and orientation (surface tiltmapping), while the "crossties" indicatethe volume of lluid placed into the secondary (i.e .. natural) -frac-ture orientation with each crosstie representing 5'ilc of the lOtalslurry volume (i.e .. -l5'ilc in the NW direction on this fracture).Microseismic events are represented by the orange points in thisplan view. and as can be seen on this treatment. this fracturefairway is very wide-approximately 900 ft across.
Microseismic Mapping. This has heen used for more than 20years to measure the location of microearthquakes. or mi-croscisms. which result from the placement of a hydraulic frac-ture6 These small slippages are detected by a vertical array of fiveto 12 sensitive listening devices, such as geophones or accelerom-eters. placed in an offsetting wellbore. After orienting each tool inthe array (normally, the perforating procedure in the treatment wellis used to orient the three-component sensors). the microseismscreated by the fracture treatment are detected. oriented. and locatedwithin the reservoir. As the treatment proceeds. a map of the eventlocations develops, which provides measurements of the fracnlfeazimuth and dimensions. An illustration of the general concept ofmicroseismic-fracture mapping is seen in l!'ig. 3.
TABLE 1-BARNETI FRACTURE-GEOMETRYMEASUREMENTS DETERMINED BY
VARIOUS TECHNOLOGIES
Fracture
Downhole Tiltmapping. This is a separate application of the sametechnology.·" By ruggedizing the surface tihmeter instrumentsand placing them in offsetting well bores to the treatment wells.hydraulic-fracture dimensions can be determined. Most of thetreatments were monitored with two downhole tiltmeter arraysnear the end of each wing of the fracrure fairway to detennine thelocation of fracture top and bottom and the total length of eachwing. To measure fracture length. the downhole tiltmeter arraysare placed in the general direction the fractures are expected topropagate. The tiltmeter cube illustrated in Fig. 2 shows the ex-pected deformation pattern resulting from a simple hydraulic frac-ture, as seen at the sUlface and from an offset well bore.
fracture treatments. the expected fracture complexity. and the largearea encompassing the number of wells stimulated in each field.
Complex Fracture
Fracture
I II/vI ~ Surrace
/ : TiltmetersFracture-InducedSurrace "Trough" \
,i~ \ Downhole\ Tiltmeters in1 Offset WelliIIII
11
Simple Fracture
Very-Complex Fracture
Fig. 1-Fracture complexity.
Surface Tiltmapping. This is a fracture-diagnostic tool usedaround the world on more than 1.000 treatments per year to mapthe deformation caused at the surface of the Earth by hydraulicfractures or dislocations in the subsurface. The tiltmeter is a verysensitive device-similar to ao electronic carpenter's level-thatcan sense changes in the gradient of displacement (or tilt) as smallas one pan per billion. Surface deformation. measured hy tihmeterarrays. is used to directly detennine the azimuth and dip of ahydraulic fracture and also the percent of treatment volume placedin each plane or orientation when fracture growth occurs in muJ-tiple planes'" Approximately 30 surface tiltmeter sites were re-quired in each of the mapping areas on the basis of depth of the
Fracture·Mapping Technologies
A combination of fracture-mapping technologies was used to de-velop an accurate image of fracture growth in the Barnett. Thesecomplementary technologies allowed for a better understanding ofthe different aspects of fracture growth. Production results stronglycorrelated to the orthogonal fracture growth. visible in the surfacetiltrneters as the NW component. and in the rrucroseismic data asa wide band of seismic activity. Using two independeLll mappingtechnologies allowed for a more-complete image of the fractllfefairway. Table J shows the components of fracture geometry de-termined from each of the mapping technologies.
for refractures to be performed that may extend the fairway ormore-densely populate it with new fractures.
Fig. 2-Deformation pattern resulting from hydraulic fracture. Fig. 3-Microseismic·event location.
86 May 2005 SPE Produclion & Facilities

YIIOOO
•_ )'9000
•
•
•
•
• I rcatlllt.'1lf "ell.Tiitmclcr ob~rvation \\ell~--"1i~r(l--S€!Smle nbSe-f\:ltlfHl- \\('11
• Wells affectedOther v..clb~1icroseis1111C events
•Dill ill
I ilkdl
•
•
•
Y5000>;5000
1'7000•
•IJIITill
>;7000
•1I,il1t-dl
X9000
Easting. fI
F'ntctUrl':),';1)°1_'()nh\\e~l
Ihlnzomal
XIIOOO 'mooo
Fig. 4-Plan view of one of the mapped fields showing the orientation of a Barnett fracture fairway and the tilt-measured fracturevolume in the various fracture planes.
Fig. 5-Plan view of fracture-structure plot from one treatmentshowing the size and complexity of fracture segments in thehydraulic (NElSW)- and natural (NW/SE)-fracture orientations.
by the ellipses in Fig. 7. These holes in the fairways may be causedby a number of different facLOrs: for example. lithologies that aremicroseismically aseismic or a lack of fracture network in theselocal areas, which makes them possible targets for refracturingtreatments or even new drilling locations, to more-completelydrain this field.
A new technique was developed to look at multiple fracturegrowth with time. Small sequential increments (in this case. 40events) of microseismic data are fitted into a linear-regressionmodel to determine the length and orientation of the many fracturesegments in the order that they are created. Using this approachenabled us to match the primary- and secondary-fracture azimuthsmeasured by surface tiltmeters. as well as give an estimate of thetotal fracture-segment length of all mapped fractures (more than25.000 ft in many treatments). A number of uearby wells werekilled or affected because of fracture-t(}-wellbore or fracture-to-fraclure intersections during this treatment. providing physical evi-dence of the geometry of these fracture networks (see Fig. 5).
The fracture treatment shown in Fig. 6 is in the lower Barnellshale and is mostly confined within the lower Barnell. The frac-ture-fairway half-length is very long. approximately 2.500 ft.Downhole tilt meters placed past the tip of each wing of the fairwaywere used to determine fairway half-length. The microseismic-monitor well was near the center of the fracture and unable to seeout to the very ends of the fairway because of attenuation of themicroseismic signals over these extremely long distanccs. Thisfracture treatment covered the entire targeted pay and created awide and complex fairway with fractures growing in multiple ori-emations. The smaller internal ovals show fracture geometry (i.e.,height and length) measured by downhole tiltmeters at the ends ofthe fairway. while the individual points are microseismic eventsmeasured by an array perpendicular to the center of the fracturefairway. The large. translucent-shaded area is the integrated-fracture geometry from combining the h.ighest-eonfidence mea-surement for each fracture parameter. This geometry was used tocreate a calibrated 3D fracture model for this area. Combiningfracture-diagnostic technologies from different location perspec-tives is often useful in ensuring that we use all of the fairway inmaximizing net present value.
The map view in Fig. 7 shows the microseismic results fromseven mapped fracture treatments in the lower Barnett. After tak-ing into account the observation well locations to remove any biascaused by the position of the observation-well relative to the frac-turc, several ·'holc..o;;" in the fracture fairway arc visible. as shown
1500
1000
500
o
-500
-1000
-1500
-2000
-2500
·3000·1500 ·1000 -SOD o
Killed 1 •
•
I 0\\ -Delhll \
rra\2tlll\~,
500 1000 1500 2000 2S00 3000
West·East, ft
:\!lay 2005 SPF. Production & F'lcililie~ 87
4SOO3500500 1500 2500Fracture HaH-Length, ft
J -4500 -3500 ·2500 ·1500 -500Fracture HaH·ungth, It
\
I~ ••
"'" o 1 2TIt (R)
"'"1lOO
• I.\o.lrOO
-ll-urU.d MF
"'" I
MFB -T.JJJ • UBl7411 • ., uas
~~~.~.LM• LRS
-;
"'" • 1
• FL
•
Fig. &-Side view of a lower Barnett fracture treatment viewed from the normal to the hydraulic-fracture fairway (as seen from theSE).
Summary of Mapped·Fracture GeometriesTwo different treatment designs were performed in these areas:two separate stages targeting the lower and upper Barnett inde-pendently, and "combo" treatments targeting both lower and upperBarnett pays with one treatment. As seen, the fracture-fairwaylengths, in general. are longer on the separate-sl<lge treatments thanon the combo fractures, and the fairway width is also greater on theindividual treatments than on the combo fractures.
Correlation of Fracture Parametersto ProductionAs seen in Fig. 8, the productivity of the wells was not greatlyinOuenced by the conventional-fracture half-length. This was per-ple"ing at first because it is the opposite of what one would e"peet
from a low-permeability reservoir. However, this led 10 evaluatingother fracture parameters and their inOuencc on productivity.
The growth of the fracture-fairway half-length was evaluated asa function of Ouid volume (Fig. 9). The fracture's half-length SlOpSgrowing on nearly all fractures after a significant fluid volume ispumped. The microseismic-measured half-length is shoner be-cause of the position of the observation well and attenuation ofacoustic signals over these very long fairway lengths. However.both mapping methods indicated an arresting of the fracture half-length before the end of the treatment.
The lack of fracture-length growth in the later ponions of thetreatment appeared to justify the reduction of the treatment vol-umes until the fracture network was evaluated in gre3ter detail.The width of the fracture oetwork was observed in both the surfacetiltmeters (NW component) and in the microseismic activity in
• •
Y050 .'
•c
Y8500:::h
~Z
Y6500- •
•
•
•Y4500
X3500 X5500 X7500 X9500 XI500Eastmg. Ii
Fig. 1-Plan view of seven fracture treatments in one field illustrating the holes or "sand traps" in several of the fracture fairways.
88 ~3Y 200S SPE Production & Facilitie,

•-
400
- 350uV>:;::;:Ii 300.gu""0 250eQ.
V>
'" 200<:lQ>>~ 150"E"u.r= 100c:0:;:6 50
00 500 1000
•
1500 2000
••
•
2500
•-•
3000 3500Fracture Length, ft
Fig. 8-Graph illustrating the lack of correlation of fracture-fairway half-lengths to early production results.
which growth was observed io a wide band of events. As seen inFig.tO, the wider the fracture network, the better the productivityfrom the well.
The total length of the fracture network was determined bysumming the microseisnuc-fracture structure segments over time.h was immediately apparent that significant individual fracturenetworks were developing as each treatment progressed. As seenin Fig. 11, the total fracture-network system continued to growwith additional pumped volume. Therefore. to improve well pro-ductivity. a larger fracture-network system is desirable. indepen-dent of the conventional-fracture half-length.
The summary table (Table 2) of fracture geometries. and thecorrelations shown in this section. illustrates that the half-length ofthe fracture fairway is not the most critical parameter influencingearly production. The mapping data show that individual fracture
stages in the Barnett typically produce longer and wider fracturenetworks, while correlations of treatment volumes to created frac-ture-fairway half-lengths are not strong. The correlations of treat-ment volume to fairway width, and of fairway width to earlyproduction. do indicate that larger fracture treatments tend to producelarger surface areas. This has a favorable effect on production.
Fracture-Model Calibration
The fracture-engineering portion of this project consisted of mini-fracture analysis with step-down tests, fracture modeling. and post-fracture analysis of treatmeot and product inn data. An investiga-tion of the mapping results indicates that initial well productivitywas independent of the fracture half-length; however. there ap-pears tn be a correlation to the size and complexity of the createdfracture network. Other production correlations that helped support
3000
- Downhole Tiltmeter
--- Microseismic
400003500030000
""2000
.<='C,c:
"~ 1500'"J:~Zu~ 1000u-
500
Fluid Volume, bbl
Fig. ~raph illustrating growth of fracture-fairway half-lengths as a function of treatment volume on one Barnett "combo-fracture" well.
~1ay 2005 SPE Production & Facilities 89

/,,/
~,,./
" .,,,11/,,,
./,,,,/,,,
" .,,,,
400
U 350 i
'":<:<c 300.gU:J"0 250eQ..
'"'" '"" jC>
".~~ 150:J
E:J()
100J.J;:.c:0:j'
5:10
0 200
•
400 600 800 1000~J
1200Fracture "Fairway" Width, ft
Fig. 1(}-Shows positive correlation of fracture-fairway width (degree of fracture complexity and total fracture surface area) to earlyproduction results.
this finding that fracture complexity was the primary driver forproductivity included the NW fracture-component volume fromsurface tiltmeters (i.e .. crosscutting natural fractures), fracture-network width (i.e .. microseismic event's width). and the degree ofnet pressure increase during the jnb.
One of the benefits of direct fracture-geometry measurementsis having the ability to calibrate a fracture model. This results in aneffective modeling tool for optimizing fnture designs of hydraulie-fracture treatments. While fracture diagLlostics are critical for un·derstanding how fractures grow. modeling is required to predictthe performauce of future desigLls and to evaluate design changes.The previously discussed measured· fracture geometries were usedto develop a calibrated model for the Barnett shale ill two differentareas. A variable-height fracture simulator was used to model themeasured· fracture geometry while incorporatinj> the treating pres-
sure, volume, aLld rates. To achieve a match. several of the iLlPUlcalibratioLl parameters. or settings. were adjusted from the defaultvalues. The final calibrated model settings were then capable ofpredicting growth in aJ] single-zone treatments and are reasonablefor application in the combo treatments.
Three main "modeling physics" parameters were adjusted tohistory match the observed net pressure and fracture geometry. asmeasured by the mapping technologies. These parameters were thecrack-opening coefficient. tip-effects coefficient, and tip-effectsscale volume. The same calibration settings were then used for alltreatments. and net-pressure matches honored fracture-treatmentparameters. as well as the new calibrated settings.
A lower value of the crack-opening coefficient was reqnired toreduce the pressure gradient along the fracture length, decreasingthe average Llet pressure ill the fracture for the same wellbore net
45000
40000
35000
~30000.s;:
C,<:
'" 25000.J
'"~0 20000;:OJz
15000
10000
5000
2000 4000 6000 8000 10000 12000 14000 16000 18000 20000
Fluid Volume, bbl
Fig. 11-Graph showing correlation of total fracture-network length to pumped fluid volume in lower Barnen-in most cases,network leng1h grows with incremental treatment volume.
90 May 2005 SPE Production & Facilities

TABLE 2-SUMMARY OF FRACTURE GEOMETRY FROM 16 FRACTURE TREATMENTS
Half- Fracture Height Half- Fracture
Length Tip Tip Length Azimuth NE, NetworkComposite
Well SW, It SW, It WeHbore, It NE, It NE, It Degrees Width, It Half-Length, It Height, It
Lower Barnett Average 2,875 248 311 211 2,600 46 802 2,775 386Upper Barnett Average 3,033 197 326 197 2,500 47 900 2,850 517Lower Combo Average 2,391
400 458 400 2,391 49 598 2,391 583Upper Combo Average 2,124 2,124Asymmetncal fractures based on downho~ tlltmeter
pressure, This allows for modeling both high net pressures andlong fracture half-lengths. The erack-opelling coefficient also con-trols shear decoupling. The lower value simulates fracture slippingat the fracture cleats. Typically, the pressure at the well bore acts asa force wedging open the entire length of the fracture. Ilowever. ina highly fractured system. the force is not transmitted efficientlyalong the length of the fracture because the force dissipates as itcrosses each fracture, In fracture modeling. this is referred toas "decoupung,"
The tip-effects coefficient was increased to reduce the esti-mated pressure at the tip of the fracture. which is plausible inhighly fractured reservoirs. The tip-effects scale volume was in-creased to delay when the tip effects reach the maximum. Thisallows for the tip effects to be gradually stepped with time.
The net pressure was history matched for each fracture treat-ment. An example of the net-pressure match for a single zone(lower Barnett shale fracture treatment) is shown in Fig. ] 2. Themodel matches the magnitude and character of the net pressurethrou~bout the treatment.
'The' ni6de1ccnraClure gco,netry'is snown 'in 'Frg:J3. As-seenfrom the mapping measurements, tiltrneter, and microseismic, thefracture is fairly well contained to the lower Barnett and does notgrow up to the upper Barnett shale.
Table 3 shows the caubrated-fracture-model results vs. thecomposite measured-fracture dimensions for the various treat-ments. The settings developed for the calibrated model do a verygood job of matching the single-zone upper Barnett and lowerBamett treatments. especially for the fracture half-lengths. It ismore difficult to model the combo fractures becau"", of the differ-ences in closure pressure and changing fluid sput rates; however,the model still works reasonably well for the combo fractures.
ConclusionsI. Fractures in the Barnell shale grow in a complex network.2. The cumulative fracture-network length. combining both hy-
draulic and natural fractures, resulting in maximum reservoirconnectivity-not conventional-fracture half-lengths--<:ontrofsgas recovery and drainage patterns.
3. Fracture growth in the Barnell shale can be approximately mod-eled by history matching recorded fracture data within a cali-brated fracture model.
4. Fractures can be propagated simultaneously in the upper andlower Barnett during the same fracture treatment.
5. Fracture geometry is relatively predictable; however. fracture-network development is highly variable.
AcknowledgmentThe authors would like to thank the management of Devon Energyfor allowing pubucation of this data.
ReferencesLW.a1k~r•. &.J'I .. Jr •..el.QL :'l'ropp~nlS.. We Still. D.on:t.Need.No I'rap-
pan ls-A Persepeclive of Several Operators," paper SPE 49106 pre-pared for presentation at Lhe 1998 SPE Annual Technical Conferenceand Exhibition. New Orleans. 27-30 September.
2. Hill. R.E.: "Analysis of 'al.ural and Induced Fractures in !.he BarneuShale. Mitchell Energy Corp ...• T.P. Sims NO.2. Gas Research lnst..GRJ-92/0094, Wise County. Texas (February) 992).
3. Wright. C,A. et al.: "Surface Tiltmeter Fracture Mapping Reaches NewDepths- )0,000 Feet. and Beyond?" paper SPE 39919 presented a'the1998 SPE Rocky Mounuin Regional/l ...ow-Pem1eability Reservoir'iSymposium and Exhibition. Denver. 5 8 April.
4. Wright. CA, et al.: ·'Downhole Tiluneter Fracture Mapping: A ~ewTool for DirecLJy Measuring Hydraulic Fracture Dimensions'" paper
600
o
200
800
400
lOon
J
1400 0
-+
32n 0
4
l2400
---- Observed Net, psi
..
dtm Pr",p (:OQC j..pgNet Pressure pSI
1600
Time. min
Fig. 12-Net'pressure match from lower Barnett treatment.
~ay 2005 SPE Production & Facilities 91

51 Metric Conversion Factorsbbl x 1.589873 E-OI mJ
ftx 3.048' E-OI mftJ x 2.831 685 E-02 IllJ
gal x 3.785412 E-03 mJ
Ibm x 4.535 924 E-Ol kg
TABLE 3-FINAL CALIBRATED SETTING WITH NET-PRESSURE HISTORY MATCHING OF FRACTURE-MODELRESULTS VS. MAPPED RESULTS FOR INDIVIDUAL- AND COMBO-FRACTURE TREATMENTS
Composite Mapped Model
Height Average Half-Length Height
Well Wellbore. It Half-Length. It It Difference, % It Difference, %
Lower Barnett
Well 1 415 2,600 2,585 0.58 320 23Well 2 440 3,000 3,015 -0.50 330 25Well 3 370 3,000 3,190 -6.33 320 14Well 4 Refracture 325 2,500 2,480 0.80 335 -3Well 5 380 2,090' 3,220 345 9Lower Barnett Average 386 2,775 2,898 -1.36 330 15
Upper Barnett'"
Well 1 (Upper) 480 3,300 3,260 1.21 700 -46Well 1 (Lower) 920" 2,450Well 2 (Upper)
5602,250 2,220 1.33
610 -9Well 2 (Lower) 1,800Well 3 (Upper) 610
3,000 2,770 7.67595 2
Well 3 (Lower) 1,850Well 4 (Upper) 460
650" 2,605695 -51
Well 4 (Lower) 975' 2,100Well 5 (Upper) 475
1,290" 2,355655 -38
Well 5 (Lower) 1,290" 1,575Upper Barnett Average 494 2,850 2,642 3.40
651 -32Lower Barnett Average 1,955
Combo Fracs
Well 6 (Upper) 7802,480 2,450 1.21 460 41
Well 6 (Lower) 2,440 2,450 -0.41Well 7 (Upper)
5601,335' 1,740
535 4Well 7 (Lower) 1,100Well 8 (Upper) 1,420 1,480 -4.23
-19570 678Well 8 (Lower) 1,520 1,520 0.00Well 9 (Upper)
5802,800 2,740 2.14
615 -6Well 9 (Lower) 2,000 1,990 .50Well 10 (Upper) 450 2,845 2,820 .88
620 -38Well 10 (Lower) 2,240 2,065 7.81Well 11 (Upper) 2,410 2,585 -7.26
-3560 575Well 11 (Lower) 2,420 2,420 0.00Lower Combo Average 2,391 2,303 -1.45
583 581 0Upper Combo Average 2,124 1,924 1.58
Asymmetncal fracture based on DHT data.·MicroselsmlC data used for half-length when no DHT available. Nol included In the average."Upper Barnett fractures generally broke into lower Barnet!.
SPE 49193 prepared for presenlation allhc 1998 SPE Annual Techni·cal Conference and Exhibition. New Orleans. 27-30 September.
5. Cipolla. C.L. and Wrighl. CA.: ·'S,ate-of·lhc-An in Hydraulic FraclureDiagnos(ic~:' paper SPE 64434 presented at Lhc 2000 SPE Asia PacificOil and Gas Conference and Exhibition. Brisbane, Australia. 16- 18October.
6. Alblight. LN. and Pearson. C.F.: "Acoustic Emissions as a Tool forHydraulic Fracture Location: Experience at lhe Fenton Hill HoL Dry ·Conversion factor is exac1.Rock Site:' SPEJ (AUguSl 1982) 523.
92 May 2005 SPE Production & Facilities

- 5500
6000 ""00
6500 - 5500-
7000
==----'
~.,:::::l_e.,
I8500
ooסס
9500
Fig. 13-3D-fracture-model output using measured fracture dimensions and treatment parameters and net-pressure matching todevelop calibrated (and proprietary to Devon) model settings.
Kevin Fisher (e-mail: [email protected]) jained Pin-nacle Technalagies. Hauston.as the Vice President of BusinessDevelopment in 2000.He arrived at Pinnacle after 15years atHalliburton Energy Services.serving in areas such as loggingengineer. log analyst. and salesand markeling manager: and8 years at ProTechnicsIntI.as Director of Salesand Markeling.Fisherholds a BSdegree in physicsfrom Cameron U.in Lawton.Oklahoma. ChrisWright (e-mail: [email protected]) isthe President of Pinnacle Technologies. San Francisco. Beforefounding Pinnacle in 1992.he worked from 1989to 1992in thedevelopment of the first real-lime pseudohydraulic fractureslimulator. and for Hunter Geophysics in construction and ap-plication of tiltmeters. Wright holds a BSdegree in mechanicalengineering from Massachusetts Inst.of Technolagy (MIT)andhasdone graduate work in electrical engineering at U.of Cali-fornia. Berkeley. and at MIT. He was an SPEDislinguishedLecturer during 2000-2001. Brian M. Davidson (e-mail:[email protected]) is the SeniorStaff Engineer forPinnacle Technologies. Houston. where he has worked since1999.Before coming to Pinnacle. he spent 11years with Halli-burton Energy services in different technical positions beforebecoming a senior petroleum engineer for Holditch & Assocs..specializing in all aspects of hydraulic fracturing. Davidson hasserved as project manager for major fracturing projects (do-meslically and internationally) and hasserved as technical ad-viser for the Advanced Stimulalion Technology Program. Heholds a BS degree in petroleum engineering from TexasA&M U.. College Station. Texas. Alan Goodwin (e-mail:[email protected]) is the senior Operations Engineer atSwiftEnergy.Houston.Beforejoining Swift in 2002.he worked as
May 2005 SPE Production & Facilitie~
a produclian engineer for Amoco Produclion from 1980to 1982and as a reservoir engineer for Mitchell Energy from 1982to 2002. He hoids a BSdegree in petroleum engineeringfrom TexasTech U. Eugene O. Fielder is the Operalions Engi-neering Superviserfor Devon Energy in Oklahoma City. Okla-homa (e-mail: [email protected]). Before coming toDevon in 2002. he worked as a produclion and drilling engi-neer tor Amoco from 1976to 1978and in production and res-ervoir engineering for Mitchell Energyfrom 1978to 2002.Fielderholdsa BSdegree in petroleum engineering from TexasA&M U.William S. Buckler has been the Engineering Manager forQuicksilver ResourcesInc. in FortWorth. Texas.since septem-ber 2003 (e-mail: [email protected]). Before coming toQuicksilver. he spent more than 19 years with Mrtchell EnergyCorp./Devon Energy Operating Co. LPas a produclion engi-neer. warkover/complelion superintendent. and region engi-neer (north Texas production engineering and operations).Buckler holds a BA degree in petroleum engineering fromTexasA&M U. Nick Steinsberger is the Vice President of Engi-neering for Republic Energy. Dallas. for which he oversees alldrilling and compleling operations in the Fort Worth basin(e-mail: [email protected]). Before joiningRepublic. he spent 15years with Mitchell EnergyCorp./DevonEnergy Opera ling Co. LP.where he oversaw all well comple-lions in Barnett shale from the fall of 1995 to the summer of2003. He was the first to introduce light-sand fractures in Bar-nett in 1997.and he led the horizontal team for Devon in theirfirst25 horizontal wells in the Barnett. He holds a BSdegree inpetroleum engineering from the U.of Texasat Austin.
93

SPE 110679
Improving Well Productivity and Profitability in the Bakken-A Summary of OurExperiences Drilling, Stimulating, and Operating Horizontal WellsMonte R. Besler, Hohn Engineering, PLLC; John W. Steele and Tanner Egan, Nance Petroleum Corporation; andJed Wagner, Pinnacle Technologies
Copyright 2007, Society of Petroleum Engineers
This paper was prepared for presentation at the 2007 SPE Annual Technical Conference andExhibition held in Anaheim, California, U.S.A .• 11 14 November 2007.
This paper was selected for presentatJon by an SPE Program Committee following rev;ew Ofinformation oontained in an abstrad. submitted by the authoris). Contents of the paper, aspresented. have not been reviewed by the Society of Petroleum Engineers and are subject tocorrectIOn by the author(s). The material, as presented, does not necessarily reftect anyposition of the Society of Petroleum Engineers. Its officers, or members. Papers presented atSPE meetings are subject to publication review by Editorial Committees cI the Society ofPetroleum Engineers. Electronic reproduction. distribution, or storage of any part of this paperfor commercial purposes without the written consent of the Society of Petroleum Engineers isprohibited. Permission to reproduce in print is restricted to an abstract of not more than300 words; iftustratJOns may not be copied. The abstract must contain conspicuousacknowledgment of where and by whom the paper was presented. WrAe librarian, SPE, P.O.Box 833836, Richardson, Texas 7508J.3836 U.S.A., fax 01-972-952-9435.
AbstractTltis case study will summarize the lessons learned during thestimulation and operation of horizontal laterals completed inthe Middle Bakken fonnation of North Dakota and Montana.Tltis paper will compare the production histories of these wellsto offset wells completed with other teclmiques to evaluatebest indust!)' practices. Insight will be shared as to the effectof lateral length, wellbore azimulll and stimulation design onwell production and oyerall well economics.
TIle Bakken fonnation of the Williston Basin is undergoingsignificant development in Manitoba, Saskatchewan.Montana. and North Dakota. Numerous operators are activein the area. willI a wide variety of development approaches.The industry has not yet reached consensus on optimal drillingand stimulation strategies.
Results indicate significant progress in improving wellproduclioIL wltile reducing llle drilled lateral length and thelreattnent size. Efforts to improve diversion and optimizeproppant type and size appear to provide more effectivefracture treatments, while eliminating production problemsrelated to the Oowback of frac sand.
Tltis paper will provide the following benefits to readers:• Operators in the Bakken have experienced significant
problems with flowback of frac sand, requiring frequentpump changes. conservative production strategies, andexpensive c1eanouts prior to restimulation. This paperwill describe the steps taken to eliminate proppantOowback into the wellbore and the estimated economicimpact.
• Tltis paper will provide a case study comparing theproduction from wells completed with a variety ofstrategies.
• TIle results suggest many current lateraIs dnlled ll1 theBakken are ineffectively stimulated and demonstrate thatsignificant increases in well profitability are possiblewith more optimized treatments.
• Optimizing fracture treatment designs for horizontalwells requires an estimation of llle fracture geometry -particularly a description of the intersection between thewellbore and the fracture. A fracture treaunent designedunder the assumption of a longitudinal frac will beentirely inadequate if the actual fracture propagates in atransverse orientation. Tltis paper will describe ourunderstanding of the fracture geometry and how that hasaffected treaUnent designs.
IntroductionThe Middle Bakken play of llle Williston Basin has generatedsignificant interest. with over 45 companies completing wellsin North Dakota and Montana and additional developmentactivity accelerating in Canada (Figure 1).
MB
MTWY
Figure 1 - Map of Williston Basin 1 (courtesy of Julie LeFever)
The Bakken fonnation comprises three members-- a lower andan upper shale. and a lilllOlogically variable ntiddle memberwltich is the target of the current development. In NorthDakota, lllis middle member typically consists of grayinterbedded siltstones and sandstones and can reach 85 [eetthick at depll1S of approximately 9,500 to 11,000 ft. Lesser

2
amounts of shale. dolostone. and limestone may also bepresent. In the Elm Coulee field of Montana, the MiddleBakken member thins to 6 to 15 feet thickness at a depth ofapproximately 10.000 feet and is generally categorized as asilty or sandy dolomite with significantly higher penneability.
The Bakken also extends beyond the Williston Basin intoSaskatchewan and Manitoba and has been formallyrecognized in Alberta and nortllern British Columbia. Thisstudy will focus solely on production from horizontal wellscompleted in tlle Middle Bakken within Montana and NorthDakota.
Horizontal Well CompletionsMost operators currently drill horizontal wells to develop tlleMiddle Bakken. using a variety of wellbore configurations(Figure 2). In the most mature development in the MiddleBakken (the Elm Coulee Field in Montana). wells have beendrilled on a density of approximately one well per section(640-acre spacing). While some operators favor singlelaterals, all wells in Figure 2 were completed witllmultilaterals in coplanar or broadly spread lateralconfigurations.
Altllough many multilateral wells have been stimulatedsimultaneously without any mcchanical isolation, severaltechniques have been used to isolate laterals for individualstimulation. In Montana. the original wellbore is typicallydrilled horizontally in the Middle Bakken, and a window is
---lrullea uphole In Ole vertIcal sectIon to kick 0 a 1110laterals. Subsequent laterals may not be cemented in place,simply placing an uncemented pre-drilled liner that istemporarily isolated with a tubing and packer assembly.However, tllis teclutique has posed some difficulties in NOrtllDakota. Several operators have reported difficulty keepingfractures contained witlun tlle target Bakken horizon, and haveobserved radioactive tracer indicating vertical height growthinto the shallower Lodgepole fonnation. [n some cases. lugh
SPE 110679
H2S or elevated watereut indicate fracs have propagated intoshallower fonnations. Therefore, it is beconung more popularin North Dakota to kickoff additional laterals from thehorizontal section to reduce tlle contact witll shallowerintervals.
Effectively isolating multiple laterals during the stimulationtreatment is expensive and occasionally problematic. Theauthors have found a dinlirtishing rate of return to drillingadditional laterals and have elected to drill single laterals formost of the current completions. AltllOUgh single, shorterlaterals sacrifice reservoir contact, this strategy has reducedwellbore complexity, improved stimulation efficiency, andyielded higher returns on total well investment.
As suggested by Figure 2. laterals have been drilled in almostevery conceivable azimuth across the Bakken development.However, wellbore azimuth can have a significant effect onthe intersection between the wellbore and fracture (Figure 3).Fractures irtitiated from laterals aligned with the maximumhorizontal stress would be expected to propagate along theaxis of tlle wellbore (longitudinal frac). On the other hand,wellbores not aligned with tlle maximum horizontal stress willresult in transversely intersecting fractures. These intersectingfractures have been described in the literature as orthogonal.perpendicular, oblique. imperfectly aligned. or transverse. Forthe purposes of this paper. '·transverse fractures" will be usedto describe fractures in which the lnajority of the fracture hasgrown away from tlle axis of tlle wellbore.
Perforatedinterval =
Figure3 - laterals oriented in the direction of MaximumPrincipleStress should provide longitudinal Fractures. All otherorientations are expected to have Transversely IntersectingFractures.'
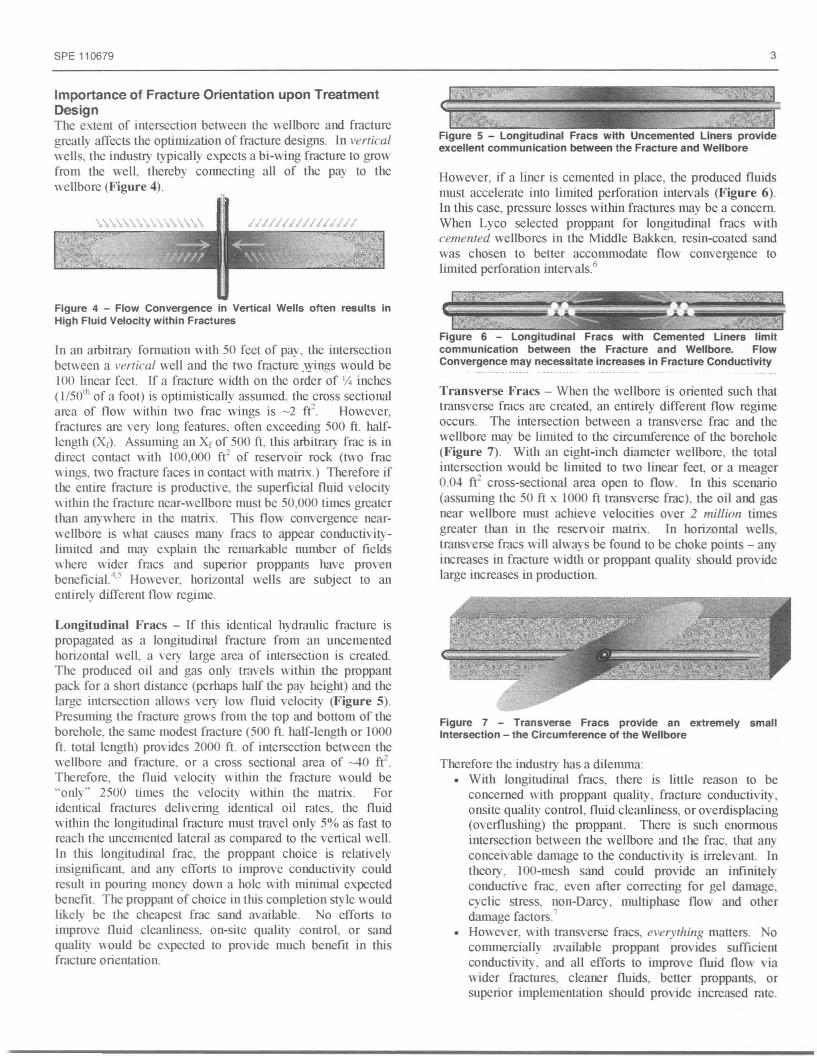
SPE 110679
Importance of Fracture Orientation upon TreatmentDesignThe extent of intersection between the wellbore and fracturegreatly affects llie optimization of fracture designs. In verticalwells. the indusuy typically expects a bi-wing fracture to growfrom llle well, thereby connecting all of the pay to lllewellbore (Figure 4).
Figure 4 - Flow Convergence in Vertical Wells often results inHigh Fluid Velocity within Fractures
In an arbitral)' fonnation with 50 feet of pay, ilie intersectionbetween a vertical well and llle two fracture _\vings would be100 linear feet. If a fracture widtll on ilie order of V. inches(1/50tl' of a foot) is optimistically assumed, the cross sectionalarea of How within two frac wings is -2 ft2 However,fractures are very long features, often exceeding 500 ft. half-length (Xr). Assuming an Xr of 500 ft, tllis arbitral)' frac is indirect contact willI 100.000 Fr of reservoir rock (two fracwings. two fracture faces in contact wiili matrix.) Therefore ifthe entire fracture is productive. the superficial Huid velocitywitllin ilie fracture near-wellbore must be 50.000 times greaterthan anywhere in the matrix. TIlis flow convergence near-wellbore is what causes many fracs to appear conductivity-limited and may explain llle remarkable number of fieldswhere wider fracs and superior proppants have provenbeneficial4,5 However, horizontal wells are subject to anentirely different flow regime.
Longitudinal Fracs - If tllis identical hydraulic frdcture ispropagated as a longitudinal fracture from an uncementedhorizontal well. a very large area of intersection is created.The produced oil and gas only travels witllin llle proppantpack for a short distance (perhaps half llle pay height) and lllelarge intersection allows very low fluid velocity (Figure 5).Presunling llle fracture grows from llie top and bottom of llleborehole, tlle same modest fracture (500 ft. half-length or 1000ft. total length) provides 2000 ft. of intersection between thewellbore and fracture. or a cross sectional area of --40 Fr.Therefore. the fluid velocity within llle fracture would be"only" 2500 times the velocity willlin the matrix. Foridentical fractures delivering identical oil rates, the fluidwitllin llle longitudinal fracture must travel only 5% as fast toreach the wlcemented lateral as compared to llle vertical well.In tllis longitudinal frac. tlle proppant choice is relativelyinsignificanL and any efforts to improve conductivity couldresult in pouring money down a hole wiili minimal expectedbenefit. The proppant of choice in this completion style wouldlikely be ilie chcapest frac sand available. No efforts toimprove fluid cleanliness. on-site quality control, or sandquality would be expected to provide much benefit in iliisfracture orientation.
3
Figure 5 - longitudinal Fracs with Uncemented liners provideexcellent communication betweenthe Fractureand Wellbore
However. if a liner is cemented in place, llle produced fluidsmust accelerate into limited perfordtion intervals (Figure 6).In tllis case, pressure losses wiiliin fractures may be a concern.When Lyco selected proppant for longitudinal fracs willIcemented wellbores in the Middle Bakken. resin-eoated sandwas chosen to better accommodate flow convergence tolimited perforation intervals6
Figure 6 - longitudinal Fracs with Cemented linerscommunication between the Fracture and Wellbore. FlowConvergencemay necessitateincreasesin FractureConductivity
Transverse Fracs - When the wellbore is oriented such thattransverse fracs are created, an entirely different flow regimeoccurs. The intersection between a transverse frac and thewell bore may be linlited to llle circumference of tlle borehole(Figure 7). WillI an eight-inch dianleter wellbore, llle totalintersection would be linlited to two linear feeL or a meager0.04 ft2 cross-sectional area open to flow. In iliis scenario(assuming the 50 ft x 1000 ft transverse frac), ilie oil and gasnear wellbore must acllieve velocities over 2 million tinlesgreater than in the reservoir matrix. In horizontal wells.transverse fracs will always be found to be choke points - anyincreases in fracture widili or proppant quality should providelarge increases in production.
Figure 7 - Transverse Fracs provide an extremely smallIntersection- the Circumferenceof the Wellbore
Therefore llle indusuy has a dilenmla:With longitudinal fracs, lllere is little reason to beconcerned willI proppant quality, fracture conductivity,onsite quality control, fluid cleanliness, or overdisplacing(overflushing) llle proppant. There is such enornlOUSintersection between the wellbore and the frac. tliat anyconceivable damage to ilie conductivity is irrelevant. Intheory, lOO-mesh sand could provide an infinitelyconductive frac, even after correcting for gel danlage,cyclic stress, non-Darcy, multiphase flow and oilierdamage factors7
However. willI transverse fracs, everything matters. Nocommercially available proppant provides suflicientconductivity, and all efforts to improve fluid flow viawider fractures, cleaner fluids, better proppants, orsuperior implementation should provide increased rate.

4
In transverse fracs. it would be risky to overdisplace tileproppant when using crosslinked fluids, as any loss offracture width near-wellbore would furt1ler damage analready limiting pinch-point.
Therefore it is clear that a fracture design optimized for atransverse frac is entirely different tIlan for a longitudinal frac.For tIlis reason, it is critical to understand tile fracturegeometry in tile Bakken.
Understanding Bakken Frac GeometryThe authors are aware tIlat fractures llave been Impped withdownhole microseismic and/or surface tiltmeter teclmologyfrom at least five wells in NOml Dakota and Montana.However, as of tItis date, very few of the results have beenpublicly disclosed by tile operators owIting the data.
Without the benefit of defiItitive fracture mapping, mostoperators are forced to assume orientations. Several operatorshave publicly stated that the difference between the horizontalprinciplc stresses in tile Middle Bakken is very low, andtherefore they assume that fracs iItitiate axially and propagatelongitudimlly along the wellbore. Other operators rely onnumerical models wltich describe the reservoir as a relativelysimple, homogeneous structure - and thereby Imy alsoforecast simple longitudinal fracs.
However. there is sigItificanl evidence suggesting ImnyBakken fracs propagate in a transverse orientation, including:
• During two frac treatments, cross-linked sand-ladenslurry was pwnped into offset wells 2200 feet away in atransverse direction6
.8 These events occurred after
changes were made to wellbore azimuth and completionstrategy designed to minimize trdnsverse frac growth.
• Two additional service compaIties confinned tIley llaveseen slurry pumped to surface in offset wells locatedover 1500 feet away in tile transverse direction, but hadnot obtained pennission to disclose the well name orspecific details.
• It is not unconunon to see a temporary increase inwatercut in offset wells following a stimulation treatment- suggesting sigItificant fracture growth in a transversedirection.
• Treating pressure records often suggest tmnsversefracture growtIl. High net pressures often exceed bothprinciple horizontal stresses, wltich is suggestive ofcomplex fracturing.
• Radioactive tracer often shows only a small portion ofthe lateral is treated. Interpretation requires the presenceof large trdIlSverse fractures in some wells. While it isalso true that tracer surveys in the Bakken frequentIyshow essentially fnll coverage of the lateral, thatobservation typically accompmties uncemented linersand could alternatively be attributed to entry of tmcerinto tlle liner-borehole mmulus and therefore doesn'tprovide defiItitive proof of longitudinal fracs.
SPE 110679
Fracture Orientation and Fracture Optimization inother Fields Developed With Horizontal Well boresA leading fmcture mapping company shared some compiledconclusions from an extensive database of fractures mappedfrom horizontal wells, both Witll nticroseismic and surface tiltmeter technology. As of April 2006, tltis company had usedmicroseismic technology to map fracs in 140 horizontal wellsin the UItited States and Canada. Those results showed:
• 5 to 10% of tllese treatments display predominantlylongitudinal fracturing
• 90 to 95% show sigItificaJlt transverse components
There is some recogItized bias in tltis dataset. Many operatorsin specific nlapped fields will intentionally orient wellbores tomaximize the likeliliood of transverse fmcs since field resultsllave generally shown superior reservoir contact and increasedproductivity and recovery with multiple transverse fracs.Therefore the 90-95% frequency of transverse fracs is likelygreater tllan would be achieved with random wellboreorientations.
A second dataset summarized the results from 175 treatmentsmapped from North American horizontal wells using tilt-meterteclmology. Again, tltis dataset does not include recentBakken mapping results due to confidentiality. However,through April 2006, this second dataset sUlnmmy showed:
• Approxinlately 15% of the treatments resulted inpredominantly longitudinal fracs
• 75% to 80% of tile fracs were predominantIy transverse• 5% to 10% of the treatments were mixed and difficult
to classify.
Therefore, it is evident t1lat trdnsverse fracs are veryfrequently propagated from horizontal wells in NorthAmerica.
Oil production tIrrough transverse fracs has been evaluatedand modeled extensively by 0Ison9.10.11 Haidar'2, Milton-Tayler, Norris13 and otIlers. Many local engineers disntiss tilerelevance of North Sea wells, as tIley are much moreproductive tIlan tile modest Bakken completions. However,the North Sea horizontal wells described in the references arctypically completed Witll 7 or 8 very aggressive transversefractures believed to acltieve on the order of 8 to 10 lb/sq ft,providing fractures a full inch in width. On the flankdevelopments, these treatments were iItitially producing on tlleorder of 200 BOPD per frac tIrrough these very wide fracs(and lower oil velocity t1lan in the much narrower Bakken
. fracs). When the operator began attempting increasinglyaggressive tip screen out designs and increasing proppantdiameter from 20/40 to 16/20 to 121J8 premium sieve LightWeight Cermnic (LWC), significant increases in productionwere observed just as predicted witll sopltisticated modeling(Figure 8).

SPE 110679
---__ F,-.on 'lI'I8111-"'1~1
Figure 8 - Production from Transverse Fracs was Improved byincreasing Conductivity with Wider Fracs and Increased ProppantConductivity"
It is recognized that the Bakken fom13tion is not nearly asprolific as the Yalhall fonll3tion - yet these field experiencesvalidate that pressure losses in transverse fracs will restrictwell production even at oil velocities lower than likely presentin transverse Bakken fracs.
Although frac maps proving the orientation of Bakkenfractures are not in hand. the 11l3jOrityof data available in tlleBakken and in other horizontal well developments in NorthAmerica indicate tl13tlll3llY fractures propagate in a transversedirection Therefore. emphasis was placed on improvingconductivity in the Bakken fracture designs.
Resulting Frac Design StrategyMany Bakken wells l13ve been treated with over I millionpounds of -lOnO or 20/40 frac sand in crosslinked fluid. Ifthose fractures propagate in a transverse direction, the vast11l3jority of that frac sand is likely wasted, since modelingsuggests that the fracture length is far greater than theconductivity can support. The pressure losses in the near-wellbore region of tlle fracture are so immense due to flowconvergence. that the created fracture lengtll cannot possiblybe eITective.
Since it is believed tl13t transverse fracs are frequently created.the authors' treaunellls have been designed to provide reducedfracture length, but with superior fracture conductivity. Inaddition. improved diversion techniques are believed to bebeneficial to induce multiple transverse fracs.
Appendix A shows tlle autllOr's current pumping schedule fora typical stimulation treatment. In sumn13ry, shorter laterdlsare drilled in a N W-SE orientation and stimulatea WIth lugllconcentrdtions of 16/20 LWC. Diversion is believed to becritical. and slugs of 16/20 LWC coated witll a surfacemodification agent have been used between stages of uncoatedproppalll to encourage bridging and diversion. This designwould need to be scaled up for operators alLempting longerlaterals or multiple lateral completions.
Refracs - Several papers have noted tI13t refracturestimulation treatments 113ve been successful in the Bakken,resulting in improved production and EUR.6,14.l5 A variety of
5
theories have been proposed as to why tlle refracs arenecessary:
• increased diversion, better lateral coverage• refracture reorientation• insufficient or inadequate initial fracture• replacing lost conductivity caused by inadequate
proppant strengthreplacing lost conductivity due to proppant flowback
AltllOugh the authors have successfully restimulated severalBakken laterals. not all attempts have been economicallysuccessful. If tile fracturing process or initial pressuredepletion from production allows superior placement ofrefracs. tllat is excellent justification to restimulate wells.However. it is more cost-effective to properly design andexecute an initial frac tl13n to plan on restimulating all wellsdue to any of the latter three reasons. Currently, radioactivetracers are incorporated in most of the autilOrs' fracturedesigns. If subsequent logging or perfonll3llce analysessuggest tllat only a small portion of tlle lateral has beenstimulated, then additional isolation efforts and restinlUlationefforts l13ve proven to be successful. However, in completionsusing ceramic proppant, the aulllors l13ve not found itnecessary to restimulate many wells as it appears there isminimal proppant degradation or flowbaek.
Continued OptimizationAfter seeing the positive results (presellled later in this paper)with 20/40 ELWC, the designs were upgraded to a 16/20premium sieve LWC for most treatments perfomled sinceMay. 2006. This product provides 11lemost uniform, sphericalgrains conunercially available in a ceramic proppant andprovides significantly higher conductivity under the expectedconditions. Tlus is llle same substrate selected for use in llletransverse fracs described in References 9-12, but does notrequire a resin coating in tlus application, since essentiallyzero proppant f10wback has been observed when utilizing theuncoated 16/20 LWC. 12/18 and 8112 mesh ceranucproppants that are commonly utilized with excellent results inRussian oil wellsl6 have been considered and theirperfonll3nce may be evaluated in future Bakken completions.
Field Results
Proppant F10wback - One of llle notable successes with llusdesign strategy has been the virtual elinunation of proppantflow back. Many operators in the Bakken report tremendousproblems with production of frac . sand., requiring frequentpwnp 'changes as the pwnps are damaged by crushed fraesand. Stuck pumps are a conunon problem, resulting in stripjobs to recover the pwnp, rods. and tubing from the well. Thecost to strip a well generally exceeds $35,000 plus 11lecost oflost/deferred production. A review of wells completed bythree operators using ceramic proppant indicates zero pwnpfailures due to crushed reservoir sand or proppanl. Recentwells treated WitiI uncoated ceranuc proppant (without anyadditives or surface modification agents), 113ve ell:periencedzero proppant production problems. WluIe the elimination ofproppant flowback willI spherical grains is surprising to some

6 SPE 110679
operators. laboratory and theoretical work have previouslydocumentedI7,18,19 this effect.
Radioactive tracer foUowed by a tracer log is typicallyincorporated into the authors' frac designs to evaluate theproppant distribution along the lateral. Prior to the tracersurvey, a c1eanout is performed to remove proppant left in thewellbore during the stimulation treatment. On threeoccasions, wells were re-entered several years later inpreparation for a refrae and only minor amounts of proppantwere found in the horizontal lateral. This is in contrast tosome operators who have been forced to c1eanout massivequantities of frac sand before attempting refractures,
180
160
W'40
~ 120~Q. HIO~~80~ 60
(3 40
20
o
IIWens Completed by Other Operators (128 welis-AllProppant Types avg 619.000 IbIwelln records '-Mthcomp'ete data)
.Fracs Designed by Authors (13 Ceramic Wells avg405,000 1bIwe')
12345678910111213141516171819202122232425262728Months from Inlial Production
Figure 10 - Oil production for laterals stimulated by the Authorscompared to Statewide Averages
Figure 11 - Oil production for laterals in North Dakota as afunction of Proppant Type.
Months from InitIal Producbon
.Wells Known 10 be Completed with Sand (91 wells)
~Wells with Unk.nown Proppant Type (37 wellS)
.Fracs Known 10 be Completed with CeramIc (23 wells)
12345678910111213141516171819202122232425262728
160
o20
~140!lj 120
~ 100&'i§. ao~ 60
<; 40
Figure 11 shows tile production from tilese categories. Of tilewells excluded because tile proppant type was not reported tothe State, it is believed the vast majority utilized frac sand,based on the operators' typical completion strategies, andreview of one ceranuc proppant supplier's delivery records.Inclusion of these wells in tile sand category would furtherdepress tile average production from sand completions,
180
Altilough these results appear to validate tile design strategy, itwas necessary to furtller examine tile results to understand tileinl1uence of engineering design and local variation in reservoirquality. Well files obtained from the Sk1te of NOrUl Dakotawebsite were reviewed for all wells. Although tile proppanttype is reported for many wells, the public database wasen!lanced by incorporating the proppant delivery records fromone ceramic proppant manufacturer. Tlus review identifiedten additional wells completed with ceranlic by sevenadditional operators, Although these ceramic completionswere not as productive as the initial thirteen, inclusion of thesewells increased the ceramic population to 23 wells. increasingthe statistical confidence. The sand category includes 91 wellscompleted by 20 operators. Thirty seven wells could not beincluded in the above categories for the following reasons:
• Proppant type not reported; incomplete records• Production not yet posted to website (new well)• Well not stimulated due to mechanical problems• Both ceramic and sand utilized in treatments
Figure 9 - Area of Development in North Dakota analyzed In thisStudy
Oil Production as a Function of Proppant TypeAlthough the elimination of sand production often savesenough money to offset the incremental cost of ceramicproppant. a primary justification is the incremental wellproductivity observed.
Data for wells that were recompletions or re-entries ofdepleted Bakken intervals were removed from the dataset.yielding 151 wells. Production from treatments designed bythe authors' companies were then compared to the statewideaverage (Figure 10). As the Bakken is an active play, therearc many wells that have not yet achieved 28 months ofproduction, Average production rates were calculated for eachwell by dividing the monthly cumulative production by thenumber of producing days. The averages at Montil 1 shown inFigure 10 are based on 128 "Other' weUs and 13 "Author"weUs. At Month 12. the averages are based on 109 "Other"weUs and 12 "Author' weUs. At Month 22. the averages arcbased on 102 "Otiler' weUs and only 3 "Author" weUs whichhave been on production for this duration. This change in wellpopulation is the cause of the jump at month 22, as severallower rate wells have only been on production for 21 months.
North Dakota - Production and completion data werecompiled for 157 Bakken weUs in 8 counties, generallybounded by Ranges 90-105 and Townships 140-163 (Figure9).
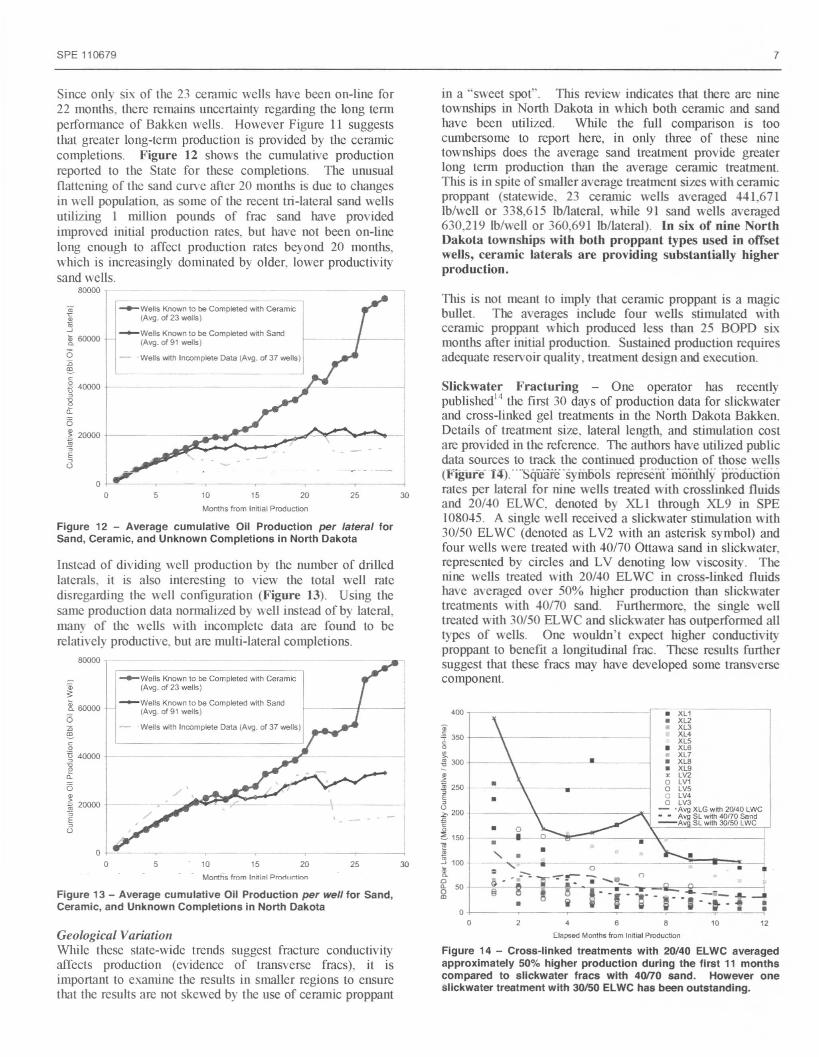
SPE 110679 7
Figure 12 - Average cumulaUve Oil Production per lateral forSand, Ceramic, and Unknown Completions in North Dakota
Figure 13 - Average cumulative Oil Production per well for Sand,Ceramic, and Unknown Completions in North Dakota
'2'0••
• XL'• Xl2• Xl3XL4XL5• XL.·XL7• XL.• XL9
x LV2
• 0 LV'0 LV5
• 0 LV40 LV3
- . Avg XlG with 2O{40 lWC•• •• Avg SL WIth 40(70 Send
• 0-A SLwith30150lWC
•" • •= _ a 0 !!-. - .. - -;---:.-~•........•
II ~ ~- I --."":{__::-_..i. -"_ .•.. -II
• i Will i ; - -t - of :
in a "sweet spot". This review indicates tl1at there are ninetownships in NOrtll Dakota in which both ceramic and sandhave been utilized. Willie the full comparison is toocwnbersome to report here, in only tlJree of these ninetownsillps does the average sand treatment provide greaterlong ternl production than the average cemnUc treatment.Tlus is in spite of smaller average treatment sizes witll ceramicproppant (statewide, 23 ceramic wells averaged 441.671lblwell or 338.615 Ibllateral, wMe 91 sand wells averaged630,219 Ib/well or 360.691 Ib/lateral). In six of nine NorthDakota townships with both proppant types used in offsetwells, ceramic laterals are providing substantially higherproduction.
oo
TIus is not meant to imply that cemmic proppant is a magicbullet. The averages include four wells stimulated withceramic proppant wltich produced less tl1an 25 BOPD si"montl15after initial production. Sustained production requiresadequate reservoir quality, treatment design and execution.
400
Elapsed Months from Initial Production
Figure 14 - Cross-linked treatments with 20/40 ELWC averagedapproximately 50% higher production during the first 11 monthscompared to slickwater fracs with 40170 sand. However oneslickwater treatment with 30/50 ELWC has been outstanding.
Slickwater Fracturing - One operator has recentlypublishedl
' tile first 30 days of production data for slickwaterand cross-linked gel treatmenlS in tile NOrtllDakota Bakken.Details of treatment size, lateral length, and stimulation costare provided in tile reFerence. TIle authors have utilized publicdata sources to track tile continued production of tllose wellstFigure' VI)...· qiiare· syii1Bo\s- represent" monthly produCtIcinmtes per lateral for nine wells treated with crosslinked fluidsand 20/40 ELWe. denoted by XL I tlrrough XL9 in SPE108045. A single well received a slickwater stimulation with30/50 ELWC (denoted as LV2 with an asterisk symbol) andfour wells were treated witll 40/70 Ottawa sand in slickwaterrepresented by cireles and LV denoting low viscosity. Th~nine wells treated witll 20/40 ELWC in cross-linked fluidshave averaged over 50% illgher production tlJan slickwatertreatments Witll 40/70 sand. Furtllennore. the single welltreated Witll30/50 ELWC and slickwater has Outperfoffiledalltypes of wells. One wouldn't expect ltigher conductivityproppant to benefit a longitudinal fmc. TIlese results furtllersuggest tl1atthese fracs may have developed some transversecomponent.
.~1250~,~200£
LsoJ5100
~og SO
30
3025
25
I--- --;-I
20
20
15
15
Months from Initial Production
Months fmm Initi~1PrMIIl":tinn
10
10
5
5
~ Wens Known to be Completed with Ceramic(Avg. of 23 wells)
-+-WeBs Known to be Completed with Sand(Avg. of 91 wells)
Wens with Incomplete Data (Avg. of 37 wells)
oo
oo
8. 60000
o:0~.g ooסס4u
~0:o~ ooסס2~E"u
~8. 60000o:0~con ooסס4~Q.
is.~ 20000.."gu
Instead of dividing well production by the number of drilledlaterals. it is also interesting to view the total well ratedisregarding tile well configuration (Figure 13). Using tilesanle production <k1tanorn1alizedby well instead of by lateral.many of tile wells Witll incomplete data are found to berelatively productive. but are multi-lateral completions.
80000
Geological VariationWhile these state-wide trends suggest fracture conductivityaffects production (evidence of transverse fracs), it isimportant to examine tile resullS in smaller regions to ensurethat tile results arc not skewed by the use of ceramic proppant
Since only si" of the 23 ceramic wells have been on-line for22 months. there remains uncertainty regarding the long tennperfonnance of Bakken wells. However Figure 11 suggeslSthat greater long-tenn production is provided by the ceramiccompletions. Figure 12 shows the cumulative productionreported to the State for these completions. The unusualOatlening of the sand curve after 20 months is due to changesin well population. as some of the recent tri-Iateral sand wellsutilizing I million pounds of frac sand have providedimproved initial production rates. but have not been on-linelong enough to affect production rates beyond 20 montl15,which is increasingly dominated by older, lower productivitysand wells.
80000

8 SPE 110679
The peIfonnance of the slickwatcr treatment with 30/50ELWC was obviously intriguing. Figure 15 shows a mappresentation of lIus and nearby wells in thc Capa Field. TIlewell denoted as LV2 in Figure I~ is lIle Ferguson Snuth 1-30H in Figure IS.
201510
~FERGUSON SMITH l·30H-+-RUSSELL E. SMITH 24-43H••• PAL PROPERTIES 44X·1•..•..• ANDERSON SMITH l·26H
~E. BURDICK20-17H-0- .E. BURDICK 29·32H- + SVEEN 14X·34
5
Elapsed Months SInce InItial ProductIOn
Figure 16 - Total Well Production for Wells shown in Figure 15.The two ceramic wells are Ferguson Smi1h 1-30H and Russell E.Smith 24-43H.
800
oo
Overall. t1Je analyses of North Dakota completions suggestthat higher production rates have been obtained wit1J wellsusing ceranuc proppant, despite smaller frac treatments.These results validate the aut1Jors' impression t1Jat transversefracs are created in some wells.
~ 700::JC°600~2l~50016~ 400~u"" 300~::;200oQ.
£ 100SW 321,5081bS 40f10 Ottawa
E. Burdlck 2D-17H
E Burdick 29-32H$W 321,250 lbs 40J70 Ottawa
CAPAF",ld
All datafrom NO
StateRecOf'ds
SWS296111bs4(Y70 S.nd
I ""'de"""Smil.h1-,26H _
~
I ~~~:'o~S~'50El~ I /I 5veen 14x.34 Y
SW S18.3631bs 40170 Sand
~:n=~:::~.
RussGIl E Smith 24-4JH
XlG 688 442 Ib~
20140 ElWC '-.,.
LFigure 15 - Orientation and Treatment Data for Horizontal Bakkenwells in the Capa Field. All data from public sources.
TI1Ctotal production from tJlese wells is shown in Figure 16.In tlus figure, tJle rate has not been nonnalized by t1Jenumberof laterals. From public sources. there are inadequate data tocorrect all production for fracture dates and pumpingconditions. For instance, tJle Ferguson SnJ..ith well wasstimulated prior to production, wlule tJle Russell Snut1J wellwas produced prior to stimulation. Regardless. it is apparenttJ13t wells in tlus area are providing exccllent production (byNorth Dakota Bakken standards), and that slickwater fracs area viable altenJative in tJus field. It also appears tJJat the twowells known to have bcen stimulated WitJl ccranJ..ic proppants(onc with slickwatcr. one WitJl crosslinked gel) appear toprovide superior sustained production compared to wellstreated with sand or unknown proppant type. Wlulecompletion decisions clearly should not be based on anisolated study of thesc seven wclls. tJus comparison largelycorroborates t1Je understanding tlJat conductivity is importantin the Bakken completions. Again this finding suggests thatfrac groWtJl is not solely limited to longitudinal orientation.
In MOl/talla, production results have been tabulated from tJleState records for 509 horizontal wells in t1JeElm Coulce Field.Tills field is located witlun Richland County (Figure 17) andis generally bounded by Townslups 21N to 27N and Ranges50E to 60E.
Figure 11 - Location of Elm Coulee Field in Richland County,Montana
The proppant type is not disclosed on t1JeMontana website,tJlerefore t1Je autJlor's 32 wells completed WitJl lugherconductivity ceral1uc proppal1t are compared to 477 wells ofunknown proppant type. As shown in Figure 18. comparingthe full results from Bakken wells across 34 townships, tJleauthor's completions do not appear to be as good as tJle fieldwide average. Figure 18 also distinguishes between wellscompleted wit1J a broadly sieved ceranuc and 16/20 and 20/40ceranucs.

SPE 110679 9
I,t..
1.
~-+
I 2 •
I •• ,I 0.Figure 20 - location of seven wells completed by the authors(denoted by stars) compared to 38 offset wells completed byseven different operators.
-+ ~•• I ",
/11\/ \
lDLalerals Completed by Other Operators (477 wells wIth unknown desgns)
.laterals Completed by Authors (26 wells wIth 20/40 or 16120 CeramIC )
• laterals Completed by Authors (6 wells with broadly sieved ceramIC)-- --- -- --'--~
2SO
-)c-o •
~ 5 7 9 11 13 15 17 19 21 23 25 27 29 31 33 35
_200~~~ 1SO
oa.o!£100
io 50 ~
Although Figure 18 does not show the same trend as the NorthDakota results, Ule Montana analysis may be skewed byreservoir quality variation across Ule 34 townships (over750,000 acres) Ulese results represent. It is well known thatreservoir quality varies throughout the Bakken. In Montana.the author's wells are concentrated in seven townships.Figure 19 indicates Utat five of Ule author's townships arebelow average and two townships are above average.
Months from Inl1ml ProdlJCllon
Figure 18 - Production Rate by Author's laterals do not comparefavorably to 477 wells In 34 Townships across the Elm CouleeField.
Figure 19 - Author's Wells are located in seven Townships- twoare above the MontanaAverage and five are below Average.
Dlaterals Completed by Other Operators (38 wells WIth unknown designs)
.Laterals Completed by Authors (5 wells wrth 20140 or 16120Ceramic)
• Laterals Completed by Authors (2 wells WIth broadly SIeved ceratT'llC)
! rlfmrmlllllllllmifil!!l13 5 7 9 11 13 15 17 19 21 23 25 27 29 31 33 35 37
Months from Initial Production
Figure 21 compares the production from wells in Township23N-57E. Although initial rates were over 85 bopd higher forlaterals stimulated with ceramic, when evaluated over threeyears, the incremental production is approxintately 10 bopdfor the proppants currently utilized by this operator.400
350
~300~-:250:!.~2000a>;'150~
30 0100
50
0
2015
--Best Townshipin ElmCoulee-25N-54E• <;, 23N·57E- - Average Township in Elm Coulee
22N·58E--23N·58E-24N-57E
~ 24N·58E-23N·59E
Months after Inlts! Prooudion
105o
600
= SOD~~0400a.oa>g 300 ~g1l0::: 200~~~ ~;c 100 1
o -----'"\;
Similar to Ute NOrtll Dakota analyses. the authors prefer toanalyze results on a smaller geographical basis to reduce theeffect of reservoir variation on outcome. Figure 20 shows thearea developed by wells drilled in Township 23N-57E. Thistownship contains 45 Bakken wells -- 38 wells completed byseven different operators using unknown proppants plus sevenwells completed by the authors denoted by a star.
Figure 21 - Incremental production averaged 10 bopd for eachlateral stimulated with 20/40or 16120 ceramic.
Only five of Ule seven townships ltave offset wells developedby other operators, and only I to 3 ceramic completions areavailable for comparison in two townships. However, basedon Ulese very sparse data, it appears ceramic completions areexceeding production from offset wells in Montana but not byas large a Iltalgin as observed in North Dakota. A moredetailed review of Montana results will require investigationof the proppant type and UlaSS utilized in each treatment(which is not currenUy available on Ule Montana website).

10
Although the North Dakota and Montana Iield results suggestthat high quality proppants are increasing Bakken production,a correct proppant selection cannot be made without aneconomic evaluation.
Value Comparison - Bakken wells in general are ex-pcnsiveto drill and complete. Depending on well complexity. thenumber of laterals and other factors. Bakken wells frequentlycost $-l million to $8 million eaclt Ceramic proppant is alsoexpensive. with the authors normally paying 35-40 cents/lbincremental cost for a premium sieved LWC over the whitesand typically utilized by other area operators. WitJl treatmentsizes ranging 250.000 to 350,000 Ibs. tJle cost to upgrade topremium LWC is $100.000 to $150.000. Additionally. manywaterfracs arc pumped at very high rates of 80 to 120 barrelsper minute. and require incremental charges for increasedhorsepower. water hauling and frac tanks.
While an increase in cost of $150.000 should not be takenlightly, the cost of a proppant upgrade increases the wellcostby 2% to 4%. Therefore, if superior proppant is expected toincrease the productivity and ultimate recovery of thesecompletions by more tJ13n 4%. it will improve overall welleconomics. As shown previously. field results indicate theinvestment in premium proppant has increased production bysubstantially more than -l%. thereby providing a higher rate ofretum than drilling tJle base well. This does not include theadded benelit associated with the savings in proppant110wback problems encountered with frac sand.
ote that some operators place much larger stimulationtreatments than the authors. While some have drilledenomlously long. complex multi-lateral completions,stimulated with over I million pounds of sand at highpumping rates. there is insufficient infomlation to evaluate thecost of tJlOse completions. If an operator chose to upgrade Imillion pounds of frac sand to ceramic. a well may need todemonstrate a 10% increase in productivity for tJle proppant to113\·ethe same incremental ROI (Retum on Investment) asdrilling additional wells. While the authors believe tJlis is anachievable hurdle. it is not clear whether extremely largevolumes of proppant are optimal if tJlere is a likelihood oftransverse frdcture development. Instead. the autJlors havefound it to be more economic to simplify tJle well design, drillshorter laterals. and place smaller fractllles containing highconductivity proppant.
Payout Comparison - Using $150,000 as the incrementalcost of ceramic proppant and $40/bbl effective wellhead oilprice corrected for royalties. taxes. etc .. it would requireapproximately 10 bopd incremental rate to payout theincremental cost in one year. The production data from NortllDakota suggests the upgrade is far exceeding that hurdle. andin Montana. the 10 bopd appears to be reached.
EUR Comparison - AltJlOUgh the dataset is small, it appearstJ13t ceramic completions l13ve a shallower decline rate andwill produce higher ultimate reserves tJ13nsand completions.
SPE 110679
Other Bakken Considerations
Slickwater Fracturing - The North Dakota discussionhigWights some of the recent success with slickwatertreatments in the Bakken. While tJle potential to reduce geldan13ge is intriguing. the authors have not adopted tJusstrategy at this tinle. In addition to conductivity and diversionconcems. it appears that slickwater fracturing has resulted inexcessive height growth in some wells due either to extremelylarge fluid volumes or lugh pumping rates. A number ofslickwater treatments appear to have frac'd into the Madisonfon1l3tion based on lugh levels of H2S and sometimes highwatereut post-frac. This has not been observed with smallercross-linked gel treaUllents contained within tile Bakken. Ifoperators continue to encounter high H2S levels followingwaterfrac stimulation, it may necessitate corrosion resistantalloys be selected in tubulars. which will significantly impactwell economics.
Overtlushing - Some operators significantJy overl1ush oroverdisplace their treatments to reduce tJIC flowback of fracsand. WitJl slickwater treatments, tJus may pose little concem,as small overl1ush volumes are not expected to significantJyerode near-wellbore settled banks. Even WitJl crosslinkedl1uids, if the fractures are longitudinal with the wellbore, therewould be little anticipated damage because sufficientintersection between the wellbore and fracture will remain.However. if fractures are transverse (as suspected by theauthors), overdisplacing proppant carried in a cross-linkedfluid may seriously compromise the wellbore to fractureconnectivity. With ceramic proppants. the operators haveobserved no proppant flowback and therefore find no need tooverl1ush treatments.
Aggressive Drawdown - Some operators are hesitant to "pulltheir wells hard" - as they experience significant sandproduction and/or loss of productivity. Some operatorscontend tl13t the natural fissures in the reservoir can bepennanentJy damaged by reducing the pressure too quickly.However, tJus phenomenon has not been observed when usingceramic proppant, and tJlerefore tJle authors believe tl13t asudden collapse of well productivity could be attributed to thesevere crush.ing of frdc sand when tile bottomllOle pressure isreduced, thus requiring tJle lower strengtJl proppants to supporttJICfull closure stress. There are insufficient data available tocalculate the bottomhole pressure of otJler opemtor's wells, soit ,vas not possible to normalize production data for dnn:vdownin this study.
Frac Fluids - Some operators are utilizing oil based fmcl1uids. This study has not made any attempt to deduct tlle110wback of oil based load fluids from tJle reported oilvolumes. However, one recent attempt to place 16120proppant prel1l3turely screened out using oil based gels, and attlus time it has not been detemlined whether it was due to tJledifficulties associated with maintaining desired fluid rheologyWitJl oil-based fluids. The autJlor's ceranuc wells in tJus studyare all treated using water based frac fluids.

SPE 110679 11
reducing total development cost. while yieldingimproved production and EUR even in areas willImarginal reservoir quality.
9) It is recognized that geological variations across theBakken will alter the completion strategy in specificlocations. As additional production data becomeavailable more detailed localized studies should beconducted to further optimize completion designs.
I Map courtesy of Julie LeFever, North Dakota Geological Survey2 Map courtesy Montana Online Oil and Gas Inlormation System,
hltp:llbogc.dnrc.ml.govIjdpintro.asp3 Brovchuk, A.V.; Liplyanin, A.V., Diyashev l.R.; Grant, D. el af.:
"Production Enhaneemelll in Russian Oil and Gas Fields utilizingHorizontal, Sidetrack, Extended Reach and Multilateral wells",2006 A1W 3-{5Feb, Moscow.
4 Vincent, M.C.:"Proving It - A Review of80 Published FieldStudies Demonstrawlg the Importance of Increased FractureConductivity", paper SPE 77675 presented at Ule2002 AnnualTeelmical Conference, San AntOitiO,Sep 29-0ct 2.
5 SUIlUllaryof 140 lield studies showing benelit to increasedconductivity available at www.carboceramics.com
6 Wiley, C., Barree, R., Eberhard, M., Lantz, T.: "ImprovedHorizontal Well Stimulations in the Bakken Fomlation, WillistonBasin, Montana," paper SPE 90697 preS<.'I1tedat the 2004 AnnualTeclmical Con.lerenceand Exhibition, Houston, Sept 26-29.
7 Palisch, T; Duenckel, R; Bazan, L; Heidt, 1-1,Turk, G: "DelennimngRealistic Fracture Conductivity and Understanding its Impact onWell Performance - Theory and Field Examples," paper SPE106301presented at the 2007 Hydraulic Fracturing TechnologyConference, College Station, TX Jan 29-31.
8 Eberhard, M. public COl1U11entsat SPE meeting, Bulle, MT April21-22,2005 and clarifying correspondence
9 Olson, K.E. el at.: "Valllall Field: Horizontal Well Stimulations'Acid vs. Proppant' and Best Practices tor Fracture Optinlization,"paper SPE 84392 presented at UlC 2003 Annual TeclmicalConference and Exhibition, Denver Oct 5-8.
10 Olson, K.E. el af.: "Valhall Field: Microfracture Acquisition UsingWireline-Formation-Tester Tools to Validate Fracl1lfCConfinement," paper SPE 96773 presented at the 2005 kumalTechnical Conference and Exhibition, Dallas, Oct. 9-12.
II Conversations with Karen Olson.12 Olson, K., Haidar, S, Milton-Tayler ''Multiphase Non-Darcy
Pressure Drop in HydrauliCFractunng," paper SPE 90406presented at ilie 2004 Almual Technical Conference, Houston, Sept26-29.
13 Norris, M.R. et af.: "Multiple Proppant Fracturing of a HorizontalWellbore: An Integration of Two Technologies," paper SPE 36899presented at the 1996 SPE European Petroleum Conference, Milan,
Long Laterals to Hold Acreage - While the aulllOr's strategyhas been to drill laterals IIlat can be effieienlly fractured withcurrenlly economic techniques explained in tltis paper, someoperators choose to drill longer laterals in an attempt to holdacreage. This is a separate consideration 1113twas notevaluated here.
Well bore Orientation - TIle aulllors have found superiorproduction from wellbores oriented NW -SE. The aulllOrsbelieve tltis azimuth allows creation of multiple transversefracs. WItile many of the wells analyzed in this paper havebeen multilateral completions, IIle aulllor's current strategy isto drill single laterals generally oriented in the NW-SEorientation. treated \\ ith ltigh conductivity transverse fracs. Ifan operator is IlOt designing IIle fractures to accommodatefiow convergence in transverse fraes. it is not certain U13tlitissame azimuth will be optimal.
ConclusionsI) Horizontal wells willi longitudinal fractures have
exceedingly low conductivity requirements - anyefforts to place better proppant. cleaner fiuids, on-siteQC, etc. has minimal effect on production.
2) Horizontal wells willI transverse fractures l13veexceedingly high conductivity requirements - anyefforts to increase near wellbore conductivity withsuperior proppants. increased fracture widlllS. cleanerfiuids should be rewarded willI significant increasesin well productivity.
3) Currently, no fracture l113ppingdata in the Bakken isavailable for public review. However. based ontreating records. offset well watercuts. radioactivetracer surveys and other modeling. many Bakkenfractures appear to propagate in a transverseorientation 10 the wellbore.
4) It appears IImt shorter laterals propped with smallerfracs containing high quality proppant are producingat superior sustained production rates compared toconventional treatments using larger quantities offrac sand.
5) Superior long-tenn production from high qualityceramic wells has been observed. suggestingincreased EUR with better proppant. and thusreinforeing IIle theory tlmt transverse fracs arepropagaled from some Bakken laterals.
6) Restimulation treatments have been very successfulfor offset opemtors on wells wltich originally utilizedfrae sand. However. wells treated with more durableproppant have less proppant fiow back and may havea reduced need for restimuJation.
7) The authors Imve e:-.-perienced zero pwnp failurescaused by proppant fiowback from wells stimulatedwillI uncoated ccranlic proppant. Tltis presents asignificant cost and downtime savings compared tosome operator's experience willI sand.
8) Based on the aullior's cost structure. it is more cost-effective to drill shorter horizontal wells with asimple arehitecture. and stimulate willi ltigh qualityproppant. The reduced drilling and isolationexpenses easily offset IIle incremental proppant cost,
Nomenclature
BOPDELWCEURISPLWCSandOma.\.
O'mm
X[
References
Barrels of Oil per DayEconomy Light Weight CemnlicEx-pected Ultimate RecoveryIntermediate Strength Proppant (cemnlic)Light Weight CemnlicFrac Sand. here premium Wltite sandMaximum Principle Horizontal StressMinimum Principle Horizontal StressFracture Half-Length

12
Italy, Ocl. 22-24." Phlihps, L.l). et aI, "A Case Study ill the Bakken FormatIon:
Changes to Hydrauhc Fracture Stimulation TreatInents Result inImproved Oil Production and Reduced Treatment Costs," paperSPE 108045 presented at the 2007 Rocky Mountain Oil and GasSymposium, Denver April 16-18.
15 Lantz, T, el ai, "Refracltrre Treatmenls Proving Successful in1J0nzontaJ Bakken Wells: Richland County, Montana," paper SPE108117 presented at the 2007 Rocky Mountain Oil 3Jld GasSymposium, Denver April 16-18.
1. Dedurin, A. V. et al, "Designing Hydraulic Fractures in Russi3JlOil and Gas Fields to Accommodate Non-Darcy and MulliphaseFlow - Theory and Field EX3Jllples," paper SPE 101821 presentedat the 2006 Russian Oil and Gas Technical Conference, Moscow,
SPE 110679
Oct 3-6."Meili,B:, Treriiblay;B, Doari,'Q. "VisualiiiltioIlofSand
Structures Surrounding a Horizontal Well Slot During ColdProduction", paper SPE 79025 presented at the 2002 SPEIntemational111emlal Operations 3Jld Heavy Oil Symposiunl,Calgary, Nov. 4-7.
18 Meza-Diaz, B, Tremblay, B., Doan, Q. "Mechanisms of SandProduction 'Dlfough Horizontal Well Slots in Primary Production",JCPTOct: 2003, p 36-46.
19 Vincent, M.C., Miller, H.B, et al. "Erosion by Proppant: AComparison of the Erosivity of Srn1dand Cer3Jllic ProppantsDuring Slurry Injection and Flowback of Proppant," paper SPE90604 presented at the 2004 Annual Technical Conference,Houston, Sep 26-29.

Appendix
Simplified Frac Design for a Single Short Lateral Designed for Transverse Fracs from a Horizontal Wellbore
Pumping rates vary based on laterallength/orientation/conditions/design. Typical rates 30 to 70 bpm
Water-based fluids, linear gel for flush, cross-linked gel for treatmentSMA denotes Surface Modification Agen!
Stage Fluid Volume (gal) Prop Cone (ppg) Prop Type Prop Total (Ibs)
1 Pad 16,000 0 0
2 Shut-In 0 0 0
3 Pad 10,000 0 0
4 Shut-In 0 0 0
5 Pad 10,000 0 0
6 Proppant Laden Fluid 1# 5,000 1 16/20 LWC 5,000
7 Pad 10,000 0 0
8 Proppant Laden Fluid 1# 5,000 1 16/20 LWC 5,000
9 Pad 16,000 0 0
10 Proppant Laden Fluid 1-4 # ramp 20,000 2.5 16/20 LWC 50,000
11 Diver!er 8# 16-20 +SMA + balls 2,000 8 16/20 LWC+SMA 16,000
12 Pad 8,000 0 0
13 Proppan! Laden Fluid 1-4 # ramp 20,000 2.5 16/20 LWC+SMA 50,000
14 Diverter 8# 16-20 +SMA + balls 2,000 8 16,000
15 Pad 8,000 0 0
16 Proppan! Laden Fluid 1-4 # ramp 20,000 2.5 16/20 LWC 50,000
17 Diverter 8# 16-20 +SMA + balls 2,000 8 16/20 LWC+SMA 16,000
18 Pad 18,000 0 0
19 Proppant Laden Fluid 1-4+ # ramp 20,000 3 16/20 LWC 60,000
20 Flush as needed 0 0
Totals 192,000 268,000

!"##$%&!'(&"%)*$+&%,)-+'!($+.)/(&#$0'(&"%
-12)134)567)859)36:37;6<9)567);=;28;6:3;9>)?4;59;):16<5:<)<@;)!1==399316)5<A)
BCDEECFFGCGHIF)JKH)@1L29MN
!"#$%&'"()*("+,-".$/"%'*'01#2"1$('0"30"$".'##"4')0&"53%)6301$##2"7%)##'7"83%"90*30:'01)30$#"&$/";%379*1)30")0"
15'"<3010'2"83%=$1)30>"?5'"()*(".$/"*$9/'7"42"$"8%$*19%)0&"3;'%$1)30"4')0&"*3079*1'7"30"$0"$7@$*'01"
53%)6301$#".'##>"A%$*19%'"/$07".$/"*)%*9#$1'7"8%3="15'"7%)##)0&".'##43%'B".5)*5".$/"CDE="8%3="15'".'##43%'"
907'%&3)0&"15'"8%$*19%)0&"3;'%$1)30>
?3"7$1'B"15'"FG"H)#"$07"I$/"G3==)//)30"+G3==)//)30-")/"$.$%'"38",J"8%$*19%'"*3==90)*$1)30")0*)7'01/")0"
F>G>"$07"30'")0"K'/1'%0"!#4'%1$"$/"83##3./L
?3"7$1'B"$##"()*(/"1$('0"79%)0&"7%)##)0&".'%'"/9**'//89##2"*301%3##'7"15%39&5"*30:'01)30$#"7%)##)0&"/$8'12"
='$/9%'/"+'>&>"*)%*9#$1)30".)15"()##"=97"$07M3%"%'79*1)30"38"15'")0:$7)0&"8%$*19%'"/1)=9#$1)30";%'//9%'"15%39&5"
*301%3##'7":'01)0&->"N$%&'"()*(/"%'/9#1'7")0":3#9='/"9;"13"JE=O!"#!$%&'(!)*"'%+,'!-"!(%*#.+,/!012.'&13!$%&'(!
4.2,!&1+5%','!6.-,*7!+.*8"1!'&"9&',7!1&-*"3,17!(.1'7!'*&55&13!:%'7!"-4,*!(-&:%5.-&"1!$%&'(!.1'!(:.55!.:"%1-(!
38"&$/>"
;*.+-%*,!$%&'(!&1-*"'%+,'!&1-"!)*"'%+&13!6,55(!*,(%5-!&1!(%(),1','!)*"'%+-&"17!(%8(-.1-&.5!*,:,'&.-&"1!+"(-(!
$07";3/'"$";31'01)$#"/$8'12"5$6$%7>
01+&',1-(!4.2,!"++%**,'!&1!4"*&<"1-.5!6,55(!6&-4!(,).*.-&"1!'&(-.1+,(!8,-6,,1!6,55!8"*,(!*.13&13!#*":!=>:!
-"!?@=:/!!
;*.+-%*,!)*").3.-&"1!2&.!5.*3,!(+.5,!4A'*.%5&+!#*.+-%*&13!"),*.-&"1(!4.(!)*"2,1!'&#B+%5-!-"!)*,'&+-/!C9&(-&13!
;#$0'/"38".'$(0'//")0"1$%&'1"83%=$1)30/"=$2"%'/9#1")0"8%$*19%'"#'0&15/"15$1"'P*''7")0)1)$#"7'/)&0"'P;'*1$1)30/>
D! A):'")0*)7'01/"38"8%$*19%'"/1)=9#$1)30"%'/9#1)0&")0"*3==90)*$1)30".)15"$0"$7@$*'01".'##"
79%)0&"7%)##)0&>
D! ?5%''")0*)7'01/"38"7%)##)0&")013"$"527%$9#)*"8%$*19%'"83%='7"79%)0&"$";%':)39/"/1)=9#$1)30"
"1!.1!.'E.+,1-!6,55!.1'!+"1-.&1&13!4&34!)*,((%*,!$%&'(/
D! ?'0")0*)7'01/"38"8%$*19%'"/1)=9#$1)30/"*3==90)*$1)0&")013"$7@$*'01";%379*)0&".'##/>
D! H0'")0*)7'01"38"8%$*19%'"/1)=9#$1)30"*3==90)*$1)30")013"$0"$7@$*'01"#'&"30"15'"/$='"
.'##"83%"$"=9#1)Q#$1'%$#".'##>"
/'-.(O)'*P&/"+O)KEBECEG
<$2"REB"RE,E

/@1L47)Q1L)@5R;)56Q)SL;9<3169)2;8527368)<@39)/5T;<Q)'7R3912Q>)?4;59;):16<5:<A)
I%$5$="G9%%)'
G3%;3%$1'"!88$)%/"S):)/)30
FG"H)#"$07"I$/"G3==)//)30
F=>/G@H/GGF>
I%$5$=>G9%%)'T&3:>4*>*$
+.!"##.%*'(&"%/"
0-!&(!*,+"::,1','!-4.-!"),*.-"*(!+""),*.-,!-4*"%34!1"-&B+.-&"1(!.1'!:"1&-"*&13!"#!.55!'*&55&13!.1'!+":)5,-&"1!
3;'%$1)30/".5'%'"8%$*19%)0&"1$('/";#$*'".)15)0",EEE="38".'##"43%'/"'P)/1)0&"3%"*9%%'01#2"4')0&"7%)##'7>
H;'%$13%/"$%'"%'=)07'7"38"G3==)//)30"01#"*:.-&"1!I,--,*!J!KLM!>NOF>".5)*5"$77%'//'/"*3==90)*$1)30"
$07"*33%7)0$1)30".)15"315'%"3;'%$13%/"79%)0&"7%)##)0&"$07".3%("3:'%"3;'%$1)30/>
A)0$##2B"15'"G3==)//)30"031'/"15$1"$02"*3==90)*$1)30"4'1.''0"8%$*19%'"3;'%$1)30/"$07"'P)/1)0&".'##"43%'/"
3%".'##"43%'/"4')0&"7%)##'7"=9/1"4'"%';3%1'7")=='7)$1'#2"13"15'"G3==)//)30":)$"15'")0*)7'01"%';3%1)0&"#)0'"$1"
@ON>>OPPQOQG=P/
+,-!R!S&+S!&(!.1!%1&1-,1','!,1-*A!"#!6.-,*7!3.(7!"&57!"*!"-4,*!#"*:.-&"1!$%&'!&1-"!6,558"*,!-4.-!&(!%1',*!+"1-*"5!.1'!
+.1!8,!+&*+%5.-,'!"%-/!0-!"++%*(!64,1!-4,!#"*:.-&"1!$%&'!&(!'*&2,1!8A!.!#"*:.-&"1!)*,((%*,!-4.-!&(!3*,.-,*!-4.1!-4,!
)*,((%*,!,9,*-,'!"1!&-!8A!-4,!+"5%:1!"#!'*&55&13!:%'!&1!-4,!6,558"*,/!0#!-4,!#"*:.-&"1!$%&'!&(!1"-!+"1-*"55,'!.!
4#3.391"=$2"%'/9#1>

J United States General Accounting Office
Report to the Chairman, Environment, - Energy, and Natural Resources Subcommittee, Committee on Government Operations, House of Representatives
July 1989 DRINKING WATER
Safeguards Are Not Preventing Contamination From Injected Oil and Gas Wastes
-- GAO/RCED-89-97 .;

Resources, Community, and Economic Development Division
B-227690
July 5, 1989
The Honorable Mike Synar Chairman, Environment, Energy,
and Natural Resources Subcommittee Committee on Government Operations House of Representatives
Dear Mr. Chairman:
As requested, we have reviewed how the Environmental Protection Agency (EPA) and states are regulating underground injection of wastes related to oil and gas production. Under the Safe Drinking Water Act, EPA established safeguards to protect underground sources of drinking water from improper injection of wastes.
As arranged with your office, unless you publicly announce its contents earlier, we will make this report available to other interested parties 30 days after the date of this letter. At that time, we will also send copies to other appropriate congressional committees; the Administrator, EPA; and the Director, Office of Management and Budget.
This work was performed under the direction of Richard L. Hembra, Director for Environmental Protection Issues. Other major contributors to this report are listed in appendix II.
Sincerely yours,
J. Dexter Peach Assistant Comptroller General
Executive Summary
Purpose About half the population of the United States depends on groundwater for its drinking water. To help protect these supplies from contamina- tion, the Safe Drinking Water Act of 1974 requires the Environmental Protection Agency (EPIC) and states to whom EPA has delegated authority to regulate the injection of industrial waste products into the ground below drinking water supplies.
At the request of the Chairman, Environment, Energy, and Natural Resources Subcommittee, House Committee on Government Operations, GAO has been examining EPA'S underground injection control program. This report addresses the regulation of injection wells used in oil and gas production, focusing specifically on (1) whether evidence exists of drinking water contamination from these wells, and if so, the causes and actions taken to prevent similar occurrences and (2) the degree to which states have implemented program safeguards to protect against drinking water contamination.
Background Through underground injection, wastes and other fluids are deposited in porous rock formations below drinking water sources. EPA'S program, created in 1980, established five classes of injection wells. Those used during oil and gas operations are Class II wells; the other classes are used for various types of hazardous and nonhazardous waste disposal.
Class II injection wells are used to dispose of strongly saline water (brines) produced when oil and gas are extracted or for reinjecting these fluids into oil fields to enhance oil recovery. These brines contain high levels of chloride-up to four times more than seawater-and total dis- solved solid levels up to 200 times greater than EPA'S drinking water taste standard. Brines from Class II wells can enter drinking water sup- plies directly, through cracks and leaks in the well casing, or indirectly, through nearby wells, such as those once used for oil and gas produc- tion, that have ceased operating. If these abandoned wells are not prop- erly plugged-that is, sealed off-and have cracked casings, they can serve as pathways for injected brines to enter drinking water. Because groundwater moves very slowly, any contaminants that enter it will remain concentrated for long periods of time, and cleanup, if it is techni- cally feasible, can be prohibitively costly.
The United States has about 160,000 Class II injection wells located in 31 states. Under provisions of the Safe Drinking Water Act, EPA has dele- gated primacy, or primary authority to regulate underground injection,
Page 2 GAO/RCEID-E&97 Underground Waste Disposal

Executive Summary
Results in Brief
to 21 of these states, with 84 percent of the Class II wells, while the remaining states have EPA-administered programs.
EPA did not issue regulations for primacy states to follow in developing their programs but issued less binding guidance documents, which speci- fied a number of basic safeguards to protect against drinking water con- tamination. The guidance includes: (1) operator-conducted pressure tests to check for cracks and leaks in the wells before they receive a permit to begin operations and (2) pressure tests and reviews of well files for wells that were already operating under state programs before the federal program went into effect to make sure the wells had been properly constructed and were being properly operated.
While GAO’S evaluation of contamination cases was nationwide, its eval- uation of how safeguards have been implemented focused only on state- administered programs, under which most Class II wells are regulated. GAO analyzed, in late 1987 and early 1988, a randomly selected sample of Class II wells in four of the primacy states-Kansas, New Mexico, Oklahoma, and Texas-to determine the extent to which states imple- mented program safeguards. About two-thirds of the state-regulated Class II wells are located in these four states.
Although the full extent is unknown, EPA is aware of 23 cases nation- wide in which drinking water was contaminated by Class II wells. In many of these cases, improperly plugged oil and gas wells in the vicinity of injection wells served as the pathway for brines to reach drinking water. Although operators of wells that began operating after the pro- gram went into effect are required to search for and plug any improp- erly plugged wells in the immediate vicinity of their injection wells, this requirement does not apply to those Class II wells that were operating before the program. Injection wells already operating before the pro- gram accounted for nearly all of the cases in which contamination has occurred through migration into improperly plugged wells. Moreover, GAO estimates that at least 70 percent of its universe of Class II wells were already operating before the program and therefore have not been subject to the requirement to search and plug nearby improperly plugged wells.
Although the four state programs we analyzed require the safeguards that are currently part of EPA'S program, some of these states are issuing permits to operate new Class II wells without evidence that pressure tests were conducted, and some have not finished reviewing files and pressure testing some of the existing wells. EPA and the states have
Page 3 GAO/RCED-%97 Underground Waste Disposal

Executive Summary
taken steps to address some of these problems, but the states still need better documentation before issuing permits.
Principal Findings
Drinking Water Contamination
The full extent to which Class II wells have caused drinking water con- tamination is unknown, largely because the method for detecting con- tamination-installing underground monitors-can itself create a conduit for contamination and is therefore not widely used. Among the 23 known contamination cases, most resulted from cracks in the injec-
I tion wells or from injection directly into drinking water; these cases were discovered, for the most part, as a result of required pressure test- ing and file reviews. However, in more than a third of the known cases, drinking water became contaminated when injected brines traveled up into improperly plugged abandoned wells in the vicinity of the injection wells and entered drinking water through cracks in these old wells. Since all but one of these injection wells were already operating at the time the program took effect, searches for and plugging of improperly plugged wells in the vicinity of the injection wells were not required. Contamination was not discovered, for the most part, until water sup- plies became too salty to drink or crops were ruined.
In 1976, before beginning the program, EPA proposed requiring all opera- tors to search for and plug any improperly plugged abandoned wells within a 1/4mile radius of their injection wells. However, commenters objected to making all wells subject to this rule because of the high costs involved. EPA decided to exempt those wells already operating, reason- ing that because of the proximity between new wells and existing wells, the searches undertaken in the l/4-mile radius of new wells would even- tually uncover and result in the plugging of all the old wells.
Since then, however, relatively few new injection wells have come into operation. As a result, less than a third of GAO'S universe of wells has been subject to area-of-review requirements. On the basis of a survey of old oil and gas production records, EPA has estimated that there are approximately 1.2 million abandoned oil and gas wells in the United States, of which about 200,000 may not be properly plugged. Moreover, among the four states that GAO examined, state officials in all but New Mexico believe that the numbers of improperly plugged wells are increasing-the result of the current economic decline in the oil
Page 4 GAO/RCED-89-97 Underground Waste Disposal

Executive Summary
industry. Although these four states have programs to plug these wells, Texas and Oklahoma officials said they now have more wells to be plugged than they can afford to pay for, and Kansas officials fear that with the increased numbers of wells reported each year, their plugging program may not be sufficient in the future.
Implementation of Program Safeguards
At the time of GAO'S review of well files in late 1987 and early 1988, implementation of program safeguards in the four states reviewed was mixed. GAO found that the files of 41 percent (with a sampling error of + 14 percent) of the wells with permits contained no evidence that pres- &e tests had ever been performed, even though these tests are required before start-up and every 5 years thereafter. In three of the four states GAO reviewed, internal controls were not in place to ensure that all necessary documentation was on file.
States have also had mixed results in their reviews and tests of wells that were operating before the program took effect. About 32(+18) per- cent of the file reviews and 69(+16) percent of the pressure tests had been performed. Having complt%ed an equivalent review prior to achiev- ing primacy, New Mexico was considered to have met its file review requirements. In the three other states, officials said their reviews had been hampered by the large number of wells to review, incomplete infor- mation in the files, and insufficient staff and resources. With additional funds provided by EPA, the states now expect to complete their reviews in 1989 or 1990.
Recommendations In order to better safeguard drinking water supplies from contamination from Class II wells, GAO recommends that the Administrator, EPA, take steps to help ensure that (1) EPA- and state-administered programs are revised to make existing as well as new wells subject to area-of-review requirements and because of the large number of reviews that would have to be conducted, areas with a high potential for contamination from improperly plugged wells should be reviewed first, and (2) state program agencies institute internal controls to ensure that all necessary documentation is obtained before they issue Class II permits.
Agency Comments GAO discussed its findings with EPA officials and has included their com- ments where appropriate. However, as agreed, GAO did not obtain offi- cial agency comments on a draft of this report.
Page 6 GAO/RCED-W-97 Underground Waste Disposal

Contents
Executive Sun-u-nary
Chapter 1
2
8 Intr6duction Nature of Groundwater 8
Use of Injection Wells 8 Regulation of Underground Injection 11 Objectives, Scope, and Methodology 15
Chapter 2 19 Injected Brines Can Drinking Water Contamination Caused by Class II Wells 19
Continue to Causes and Consequences of Contamination 24 Safeguards Do Not Prevent Contamination by Abandoned 27
Contaminate Drinking Wells
Water Conclusions 30 Recommendations 32
Chapter 3 33 Existing Safeguards Class II Program Safeguards 33
Against Requirements for Permits Are Not Fully Documented 34 35
Contamination Have Existing Wells Have Not Been Fully Reviewed and Tested Operators Are Not Consistently Monitored 38
Not Been Fully Financial Surety Requirements Are Not Working 39
Implemented EPA Oversight of State Programs 40 Conclusions 42 Recommendation 43
Appendixes Appendix I: Methodology 44 Appendix II: Major Contributors to This Report 47
Tables Table 1.1: Class II Regulatory Programs Table 2.1: Known and Suspected Cases of Contamination
From Class II Wells
13 20
Table 3.1: Comparison of Selected State-Reported and GAO Data for Existing Wells (Percent)
Table I. 1: Active and Temporarily Inactive Class II Wells in Primacy States (As of October 1987)
Table 1.2: Sample of State-Regulated Active and Temporarily Inactive Class II Wells
Table 1.3: Reasons for Not Filling Out DCIs on Sample Wells
42
44
45
45
Page 6 GAO/RCED439-97 Underground Waste Disposal

Contents
Figures Figure 1.1: Underground Injection 9 Figure 1.2: Modern Underground Injection Well 10
Abbreviations
DC1 EPA FURS GAO MIT UIC USDW
data collection instrument Environmental Protection Agency Federal Underground Injection Control Reporting System General Accounting Office mechanical integrity test underground injection control underground source of drinking water
Page 7 GAO/RCED-N-97 Underground Waste Disposal

Chapter 1
Introduction
About half the population of the United States depends on groundwater for its drinking water. To help protect these supplies from contamina- tion, the Congress passed Part C of the Safe Drinking Water Act in 1974. This law requires the Environmental Protection Agency (EPA) to estab- lish an underground injection control (LJIC) program. Through this pro- gram, EPA, directly or through delegation to states, regulates the design, construction, and operation of underground injection wells, which inject wastes and other fluids below underground drinking water sources.
At the request of the Chairman, Environment, Energy, and Natural Resources Subcommittee, House Committee on Government Operations, we have been examining how EPA is managing the UIC program. In this report, we look at EPA and state management of that part of the program that regulates two-thirds of the underground injection wells, or the Class II wells used in oil and gas production to inject salt water either for enhanced recovery or for disposal purposes.
Nature of Groundwater
Groundwater is a vast resource that underlies the earth’s surface. Within one-half mile of the surface of the United States, the volume of groundwater is estimated to be four times greater than that of the Great Lakes. Contained in layers of sand and rock called aquifers, ground- water can be located close to the surface or thousands of feet underneath.
For some parts of the country, groundwater is the sole or principal source of drinking water. Residents of 34 of the 100 largest cities in the United States rely on groundwater, as do about 95 percent of rural households. Because of this large dependency, groundwater contamina- tion is a particular concern. Although it was once thought that natural filtration processes would change contaminants into harmless sub- stances, groundwater contamination is being discovered with greater frequency and it is now recognized that the earth’s cleansing capacity is limited.
Use of Injection Wells Through underground injection, wastes and other fluids are deposited in porous rock formations, called injection zones, below drinking water sources. (See fig. 1.1.) Ideally, an injection zone is sealed above and below by unbroken, impermeable rock strata and is large enough to keep the injected fluids from reaching pressures great enough to fracture the confining rock layers.
Page 8 GAO/RCED-t39-97 Underground Wasrr Disposal

Chapter 1 Introduction
Figure 1.1: Underground injection
--- ---
Surface So11 and Rock Underground Drlnklng Water
Formatlons Containing Rock and Groundwater
lnjectlon Zone
Source GAO
A modern injection well, shown in fig. 1.2, consists of three concentric pipes inserted into a well bore. The outermost casing is called the sur- face casing. This encloses the long string casing, which, in turn, contains the injection tubing. Fluids are injected through the injection tubing and enter the ground through perforations in the long string casing. To keep the injected fluids from entering the annulus, or the space between the tubing and the long string casing, the bottom is closed off by a packer.
Injection Wells in Oil and Gas Prod .uction
Although injection wells are used by other industries, particularly the chemical industry, they were first developed by the oil and gas industry and have been used for more than 50 years to dispose of salt water as well as to reinject it for production purposes. As oil and gas are extracted, strongly saline water, or brine, that occurs in underground rock formations flows up through production wells. In the early stages of production, very little brine is produced, but as oil and gas are removed, they are replaced by increasingly larger volumes of brine.
Page 9 GAO/RCJSD-89-97 Underground Waste Diqwal

Chapter 1 Introduction
Figure 1.2: Modern Underground Injection Well
Surface casng
Cement
Long string casing
Cement
AnnUlUS
In)ectlon tubing
Packer
PertoratIons
Wellhead
Source: Based on B Klemt, et al ‘Industrial Waste Dtsposal Wells: Mechanical lntegrlty P-oceedlngs of the International Symposium on Subsurface Inlectlon of Llquld Wastes New Orleans Loutslana 1986
In the early part of this century, brines were disposed of in surface pits, but once the brines began to enter drinking water supplies, states banned this disposal practice. Oil producers then turned to underground injection for brine disposal. More recently, oil producers have used deep idection of brine for enhanced recovery of oil and gas, injecting it into oil-bearing formations to create the pressures necessary to force greater quantities of oil out of the ground. According to an American Petroleum Institute study, the domestic oil industry generated about 20.9 billion
Page 10 GAO/RCED-89-97 Underground Waste Disposal

Chapter 1 Introduction
barrels of brine in 1985, more than 5 barrels for each barrel of oil produced.
Brines associated with oil and gas production contain very high levels of chlorides and other dissolved solids. Chloride levels in brine can range from a few thousand parts per million (ppm) to over 150,000 ppm, as compared with seawater, which typically contains about 35,000 ppm of chlorides. Brines may also contain some amounts of petroleum hydro- carbons and additives, such as corrosion inhibitors, as well as radium and other radioactive materials. Altogether, brines generally contain about 30,000 to 100,000 milligrams of total dissolved solids per liter (mgl). By comparison, EPA’S secondary drinking water standard (related to drinking water taste) calls for no more than 500 mgl total dissolved solids and it defines an underground source of drinking water as a water bearing formation containing less than 10,000 mgl of total dissolved solids.
Regulation of Once contaminated, groundwater can be difficult and expensive to clean.
Underground Injection Unlike rivers and streams, groundwater moves very slowly; therefore, contaminants remain concentrated for long periods of time. Cleansing an aquifer contaminated by brines could entail either pumping fresh water into it, to accelerate its flow into the body of water into which the aqui- fer normally discharges, or pumping the water out of the aquifer. If con- tamination is extensive, however, and covers a large area, rehabilitation may be extremely costly. In these cases, if the aquifer is left to cleanse itself, the process can take as long as 250 years.
Recognizing that cleanup was not always possible, Part C of the Safe Drinking Water Act of 1974 stressed prevention of contamination in order to ensure safe drinking water supplies. The act established a sys- tem of state and federal regulation of underground injection wells. EP.4
was to set standards for the design, construction, and operation of underground injection wells and establish a regulatory program to enforce those standards. However, EPA could delegate to the states pri- mary regulatory authority, or primacy, if the states adopted federal minimum standards, or, in the case of oil and gas injection wells, if they could demonstrate to EPA that their existing programs prevented con- tamination of drinking water. In those states that chose not to assume primacy, or did not meet federal requirements, EPA assumed regulatory authority.
Page 11 GAO/RCED-8%97 Underground Waste Disposal

Chapter 1 Introduction
The UIC program created by EPA in 1980 established five classes of injec- tion wells. Class I wells are used to dispose of hazardous waste and non- hazardous industrial and municipal waste below the deepest underground sources of drinking water. Class II wells are those used during oil and gas operations. Class III wells are used for special processes, such as mineral production. Class IV wells, which inject haz- ardous waste into or above underground sources of drinking water, are illegal and were required to be plugged by May 1985. Class V wells are all injection wells that do not fit into the other four classifications.
Oil and Gas Injection Wells Of the approximately 253,000 active and temporarily inactive injection wells in the United States in 1987, the largest number-160,265-were Class II, oil and gas injection wells. These wells are located in 31 states, 21 of which have approved state programs, and on Indian lands. (See table 1.1.) These 2 1 states also contain 84 percent of the Class II injec- tion wells. The 10 remaining states and Indian lands have EPA-adminis- tered regulatory programs.
Page 12 GAO/RCED-B-97 Underground Waste Disposal

Chapter 1 Introduction
Table 1.1: Class II Regulatory Programs Number of wells
State programs ~____ Alabama 206
Alaska 266
Arkansas 1 1%
Calrfornia
Colorado
11,201
932 Illinois 14,147
Kansas 14nna
Lowiana 4,212
Missouri 275
Nebraska 624
Nevada 8
New Mexico 3,913
North Dakota 595
Ohio 3,952
Oklahoma 22,579
Oregon I
South Dakota 40
Texas 49,476
Utah fx4
West Virginia
Wyoming
Total
EPA programs
Arizona (including Indian lands)
Flonda
Indiana
Kentucky
Michigan
Missrsstppi
Montana New York Osage Mineral Reserve (Oklahoma)
Pennsylvanra
Tennessee Total
Total
-- 760
5,749
134,737
413 77
3,274
5,399
1,631
936
1,449 3.254
4.298
4.788
9 25,528
160,285
Under federal and state UK programs, owners and operators of wells that began operating after the programs were established must obtain
Page 13 GAO/RCED-&97 Underground Waste Disposal

Chapter 1 Introduction
permits in order to operate. The permits specify construction, operating, and reporting requirements, as well as procedures for monitoring the well and plugging it-that is, sealing it off-when it is no longer being used. Permit applications generally include information on the charac- teristics of both the well and the area in which it is to be located, includ- ing the location of nearby underground sources of drinking water and the composition of the injected fluid.
Although EP.4 initially expected that all Class II wells would have to obtain permits under the LX program, states argued against this plan as impractical because of the large numbers of wells already operating under state programs that predated the federal program. They also pointed out that they already had on file much of the information that would be required in a permit application, such as injection pressure, design and construction specifications, and so on. EPA agreed, noting that a file review would be sufficient and would spare both the well operator and the states much of the costs involved in completing and reviewing permit applications,
EPA consequently allowed states that had regulatory programs to estab- lish a combination of rule and permit procedures. Under this arrange- ment, those wells that were already operating when the states obtained primacy and already had permits issued by the state did not have to submit new permit applications but were authorized to continue to oper- ate by rule. However, to verify that the well is not endangering under- ground sources of drinking water, the state had to review the files of these existing wells within 5 years after the state received primacy.
Under section 1425 of the Safe Drinking Water Act, EPA was authorized to delegate to states primary authority to regulate Class II injection wells as long as the states could demonstrate that they had programs that protected drinking water sources; states also had to have some form of inspection, monitoring, recordkeeping, and reporting require- ments in their programs. Unlike the other UIC programs, EPA was not required by the act to establish specific regulatory standards that state Class II programs had to meet in order to obtain EPA'S approval. Instead, EPA believed it was appropriate to issue more broadly worded guidance that would leave considerable discretion to the states on how to apply for primacy and to EP.4 regions on the criteria to be used in reviewing state programs.
Regarding state implementation of the program, the guidance outlines a number of basic safeguards that are not required but that EP.4 regards as
Page 14 GAO/RCED-99-97 Underground Waste Disposal

Chapter 1 Introduction
demonstration of a state program’s ability to prevent drinking water contamination. In states with EPA-administered programs, these same safeguards are required by regulation with EPA regional offices acting as regulatory agencies.
l State programs are expected to require operators to conduct a mechani- cal integrity test before a well can begin operating, in the case of new wells, and at least every 5 years for all wells. These tests include pres- sure tests to check for cracks and leaks in the casing and reviews of construction records to establish the quality of the cement lining between the outer casing and the injection formation.
. The programs should also require well operators to submit reports at least annually that describe monthly average injection pressures and flow rates and volume. The reports are also to include the results of all mechanical integrity tests and an analysis of injected fluids if there have been major changes since the initial test.
l The authority issuing the permit must make periodic inspections of the wells to determine compliance and to verify the accuracy of information submitted.
l States are expected to require operators to properly plug their wells when they cease operating and maintain some form of financial respon- sibility for plugging.
l States must complete file reviews for wells that were permitted under a state program that predated the federal UIC program within 5 years after approval of their programs to make sure that these existing kvells are properly constructed and operated.
Once it approves a state program, EPA remains responsible for making sure that the states are effectively regulating underground injection and withdrawing primacy if they are not. EPA’S oversight activities consist of visiting the state agencies and evaluating their performance at least once a year and reviewing operator noncompliance reports prepared by the states quarterly. To assist the states in carrying out their Class II and other UIC programs, EPA provides grant funds according to a formula based on population, geographic area, and injection practices.
.~~~___
Objectives, Scope, and Following the issuance of our earlier report on the Class I UK progr;im,
Methodology in August 1987, the Chairman, Environment, Energy, and Natural Resources Subcommittee, House Committee on Government Opcritt II )ns,
‘Hazardous Waste: Controls Over Injection Well Disposal Operations, GAO/RCED-8’7 1711 \ ,L :\ 1987.
Page 15 GAO/RCED-W-97 Underground Hss~r I h*lx~sal

Chapter 1 Introduction
asked us to evaluate how EPA and the states are regulating underground injection related to oil and gas production. In subsequent discussions with his office, we agreed to examine
l whether evidence existed of contaminated drinking water as a result of underground injection of brines associated with oil and gas production, and if so, the causes of contamination and any actions taken to prevent similar cases from occurring in the future;
l how the states were regulating oil and gas underground injection wells; and
l the extent of states’ efforts to properly plug all types of abandoned wells such as oil and gas wells that might serve as a pathway for injec- tion fluids to reach drinking water.
To determine the extent of contamination across the country, we com- piled EPA reports and other information obtained from state and EPA regional and headquarters officials in charge of UIC programs. From these sources, we identified known and suspected cases of contamina- tion caused by Class II wells. We obtained additional information on each case and its disposition from officials of the responsible companies. For the contamination cases identified, we also obtained information on EPA and state officials’ determinations of the causes of contamination. We traced the causes identified to state and EPA UIC program controls to determine whether controls existed to prevent similar cases of contami- nation from occurring in the future.
In contrast to our review of contamination, which was nationwide in scope, our review of state regulation of oil and gas injection wells focused only on state-administered programs and on their control mech- anisms, including internal controls, for protecting drinking water. As agreed with the Chairman’s office, we did not examine EPA-administered programs, since only 16 percent of Class II wells are in states with such programs. Among the 21 primacy states, we excluded Illinois because EPA conducted an extensive review of Illinois’ program in 1986. Also. at the time of our review, Nevada had not yet been granted primacy.
From the 19 remaining states, we randomly selected four-Kansas. Sew Mexico, Oklahoma, and Texas-whose selection had a probability pro- portional to the total number of active and temporarily inactive wells in each state. Within these four states, we randomly selected a sample of active and temporarily inactive wells from EPA'S inventory, knoMn as the Federal Underground Injection Control Reporting System ( PI fts i. For
Page 16 GAO/RCED-9497 Underground Wa.9tc I)isposal

Chapter 1 Lntroduction
our sample of active and temporarily inactive wells, we collected infor- mation on the extent to which UIC program safeguards were imple- mented by the states for both permitted and rule authorized wells.
Because of differences between the FURS inventory and state records, we were unable to fill out data collection instruments for about 27 percent of our sample. Our sample estimates, therefore, represent approxi- mately 88,000 (-t 10,400) active and temporarily inactive Class II wells for which we expect we could have obtained the required information. In this report, we refer to this as the number of Class II wells in our universe.
Sampling errors for specific estimates discussed in this report are stated at the 95-percent confidence level and are included in parentheses fol- lowing the estimate. They may be presented in either of two ways, depending on the type of sampling error calculation used. With one type of calculation, for example, the sampling errors are presented as “23( + 7) percent,” which means that the chances are 19 out of 20 that the true value could be as low as 16 percent-23 minus 7-or as high as 30 percent-23 plus 7. For the other type of calculation, the range of values above and below the estimated values are different and the sam- pling errors are presented as “23 (15 to 32) percent.” (See app. I for a more detailed description of our methodology.)
The information we collected on wells in our sample reflects the status of those wells at the end of 1987 and early 1988. In Oklahoma, we con- ducted our review of well records during October, November, and December 1987; in Kansas, our review took place during January and February 1988; and in New Mexico and Texas, we looked at well records during February and March 1988. The information came from records kept at state offices, including well authorization documents, well com- pletion records, operators’ quarterly reports, mechanical integrity test results, inspection reports, financial surety records, and reports on file reviews conducted by state regulatory authorities. Information on state activities, as well as information on EPA oversight of state activities, came from state LX program staff and EPA officials in regions VI and VII, which oversee the four states we reviewed.
For our last objective, these same state officials, as well as field officials of state agencies, also gave us information on plugging programs and abandoned wells in their states.
Page 17 GAO/RCED-B-97 Underground Waste Disposal

Chapter 1 Introduction
We sought the views of EPA and state officials on the facts and findings discussed in this report and incorporated their comments where appro- priate. In general, they agreed with the facts presented. However, as requested, we did not obtain official agency comments on a draft of this report from EPA or the states included in our review. We conducted our review in accordance with generally accepted government auditing stan- dards between September 1987 and August 1988 and updated certain information through December 1988.
Page 18 GAO/RCED-89-97 Underground H a.*~ c Disposal

Chapter 2
Injected Brines Can Continue to Contaminate . DIlIklll l gWater
Because of possible underreporting by individuals whose drinking water was contaminated and difficulties in detection, the full extent to which injected brines have contaminated underground sources of drinking water is unknown. However, 23 cases of contamination have been con- firmed and 4 are suspected.
In many of these cases, abandoned improperly plugged oil and gas wells-that is, wells that had ceased operating without having been properly sealed off-near an active injection well provided the path through which brines reached the aquifer. Although injection well oper- ators seeking permits have to search for improperly plugged wells in the immediate vicinity of injection wells, this requirement does not apply to those injection wells already operating when states were delegated authority for the federal UIC program. Injection wells already operating comprise at least 70 percent of the estimated 88,000 Class II wells in our universe.
According to EPA, improperly plugged wells near operating injection wells present significant environmental problems. The agency has esti- mated that there may be about 1.2 million abandoned wells across the country, many of which may be improperly plugged, and, with one exception, the states we reviewed foresee the numbers growing as the oil industry remains in an economic slump. Each of the four states we visited use either special funds or general revenues to plug improperly plugged wells, but funding has not always been adequate, and many wells remain unplugged.
Drinking Water On the basis of EPA'S studies and information furnished by EPA and state
Contamination Caused agency officials, we identified 23 cases in which injected brines contami- nated underground sources of drinking water (USDWS). These cases,
by Class II Wells listed in table 2.1, occurred in seven states: Kansas, Kentucky, Michigan, Mississippi, New Mexico, Oklahoma, and Texas. In all 23 cases, a L:SDW was contaminated, although the contamination may not have spread to sections of an aquifer that are actually used.
Table 2.1 also lists three cases in Mississippi and Montana in which brines were suspected of migrating from the injection zone, but no tests were performed to determine whether drinking water had become con- taminated. In addition, table 2.1 lists one case in Oklahoma in which drinking water has been contaminated and Class II wells are suspected of causing the contamination.
Page 19 GAO/RCED-8497 Underground Waste Disposal

Chapter 2 Injected Brines Can Continue to Contaminate Drinking Water
Table 2.1: Known and Suspected Cases of Contamination From Class II Wells
Operator
Martha Oil Freld, Ashland Exploratton Inc., Lawrence &Johnson Counties, Ky
Number of injection wells
601
Aquifers contaminated
Alluvrum, Breathrtt, & Lee
Path for contamination
Improperly plugged and constructed wells
Taffy Oil Field, CNB Corporatron, Ohio County, Ky
102 Chapman Stray Sand Improperly plugged wells
Brg Sinking Field, Charmane 011 Corp., Lee County, Ky
124 Big Lame Improperly plugged wells
Big Sinking Field, Hydrocarbon Inc., Lee County, Ky
Big Sinking Field, L.P. Bretagne, Lee, Powell, Estill, and Wolfe Countres, Ky
Irvine-Furness Field, Western Crude Reserves Inc., Powell & Estill Counties, KY Burrton Oil, Hollow-Nikkel Oil Field, Harvey and Reno Counties, Kans
46 Breathitt Improperly plugged wells
29 Newman Improperly plugged wells
115 Newman, Alluvium, Breathrtt, & Lee Improperly plugged wells
50-100 Equus Beds Improperly plugged wells
East Gladys Unit, Gulf Oil Company, Sedgwick County, Kans.
Yankee-Canyon Field, Cactus Operating Company, Tom Green County, Tex.
57 An alluvral deposit
12-15 Leona and Bull Wagon
Improperly plugged wells
Improperly plugged wells
Moore-Devonian 011 Field, Texaco U.S.A., Lea County, N. Mex.
1 Ogallala Leaks in casing
J. J. Hobgood Lease, Sun Exploration and Production Company, Hockley County, Tex.
Madden-Davis Lease, Petro-Lewis Company, Graham County, Kans.
Laketon Oil Field, Harris Oil Co., Muskegon County, Mich.
Albnght Field, Kahn Operating Company, Noble County, Okla.
North LaGrange Field, R&H Oil Corp., Adams Countv. Miss.
1 Tnnrty Sands Leaks In casrng.
1 Alluvrum near the South Soloman River
Leaks in casing.
1 Surficial water table Leaks In casing.
1 Warren Leaks in casing.
1 Wilcox Infection into USDW ,. ~~
T. K. Stanley, Inc., Wayne County, Miss. ~~~__
2 Wilcox Injection into USDW
Page 20 GAO/RCED-%97 Underground Waste Disposal

Chapter 2 Injected Brines Can Continue to Contaminate Drinking Water
How and when detected Effects Discovered by U.S. Army Corps of Contaminated drinking water for 83 Engineers In 1985. to 88 households.
Citizen compliant in 1985 of Damaged household water undrinkable water. supplies.
Citrzen complaint in 1986 of undrinkable water.
Contamination of dnnking water and start-red clothes and porcelain
Remedial action
No cleanup; judged technrcally rnfeasrble. Ashland to plug 1.450 surrounding wells, monitor a uifer,
% and provrde alternative water
suppltes. Ashland also fined 125,000 for violating the Safe Drinking Water Act.
No cleanup; judged too costly. Origrnal owner filed for bankruptcy; EPA deciding whether or not to sue. EPA working with two new owners to identify wells needing to be plugged. EPA may have new owners Install monitoring wells to measure progress of aquifer self-cleaning.
No cleanup; judged too costly. EPA plans to fine company $125,000 and order it to provide alternative water supplies to citizens and plus or rework the wells in the field
Citizen complaint in 1986. Contamination of dnnking water No cleanup; judged too costly. EPA will not assess fine but WIII source. order wells to be plugged or reworked.
Discovered by EPA inspectors and monitonnq wells In 1987.
Contamination of drinking water No cleanup; judged too costly. EPA will not assess fine but WIII source. order wells to be DlUqqed or reworked.
Citizen complaint in 1985 of undrinkable water.
Contaminated resrdentral drinking Decision on cleanup pending. EPA will probably order company water source. to provide alternative water supplies and plug or rework wells so
as to prevent future contamination. Citizen complaints began in 1943; a state task force confirmed in 1982.
Damaged major supply of drinking State authorized $300 million to begin cleanup. All operatrng and irrigation water. People have to wells have passed mechanical integrity tests. All abandoned use bottled water and city has to wells have been plugged. relocate well.
Citizen drscovered In 1970. Farmer’s wells and peach orchard No cleanup; judged too costly. Gulf Oil plugged wells judged to were damaged. be the source of pollution. Farmer successfully sued Gulf for
damaaes to crops. Citizen complaint in early 1970s. Contaminated water well. No cleanup; judged too costly. Cactus Operating Company
drilled a new water well for the citizen and plugged 30 wells In the field.
Citizen complaint in 1977
Sun pressure test In 1984.
Crops damaged. Farmer’s property No cleanup; judged too costly. The well has been reworked and foreclosed. IS in compliance with UIC regulation. Farmer successfully sued
Texaco for damages. Contaminated public drinking Once Sun detected decline in pressure, it shut tn well Sun IS water and irriqation supplies. voluntarily pumpinq aquifer and has installed monitonnq wells to
Citizen complaint in 1981.
Citizen complaint in 1980 of undrinkable water.
Citizen complaint in 1984.
EPA reviews beginning In 1985.
EPA revtews begrnning In 1985.
track cleanup. -
lrriaatron well contaminated. A maioritv of the contamination was cleaned UD after Petro- Lewis pumped water into the aquifer. The well’has been plugged.
Contaminated drinking water Decision on cleanup pending. Michigan ordered Harry; to submit cleanup proposal, but Harris has not vet done so. Harris reworked wells.
Damaged soil and vegetatron and No cleanup; judged Impractical. State ordered Kahn to plug well. polluted freshwater stream used by Field has since shut down. residents for domestic uses.
None reported. No cleanup; judged too costly. R&H fined $5,000 and ordered to rework its well to extend into a deeper injection zone
None reported. No cleanup: judged too costly. T. K. Stanley told to rework aell to extend into a deeper injection zone.
(continued)
Page 2 1 GAO/RCED-&97 Underground Waste I)ispwal
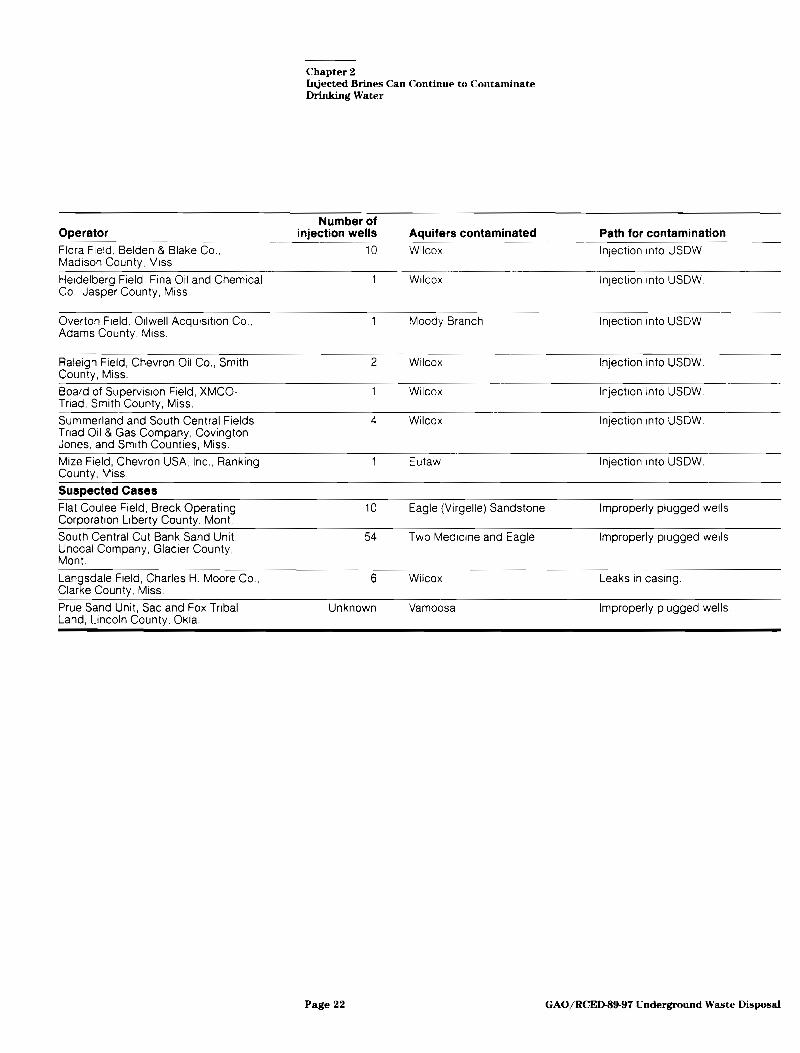
Chapter 2 Injected Brines Can Continue to Contaminate Drinking Water
Operator Flora Field, Belden & Blake Co., Madison County, MISS
Herdelberg Field, Frna Oil and Chemrcal Co., Jasper County, Miss.
Number of injection wells
10
1
Aquifers contaminated WIICOX
WIICOX
Path for contamination ~__ Injectron tnto USDW
Injection Into USDW
Overton Freld, Otlwell Acqutsrtron Co., Adams County, MISS
1 Moody Branch Injection into USDW.
Raleigh Field, Chevron Oil Co., Smith County, Miss.
Board of Supervrsron Field, XMCO- Triad, Smith County, Miss,
Summerland and South Central Fields, Triad 01l& Gas Company, Covington, Jones, and Smith Countres, Miss.
Mize Field, Chevron USA, Inc., Ranking County, Miss.
Suspected Cases
Flat Coulee Field, Breck Operating Corporation Liberty County, Mont.
South Central Cut Bank Sand Unit, Unocal Company, Glacier County, Mont.
Langsdale Field, Charles H. Moore Co., Clarke County, Miss.
Prue Sand Unit, Sac and Fox Tribal Land. Lincoln Countv. Okla.
2 Wilcox Injection into USDW.
1 Wilcox Injection Into USDW
4 Wilcox Injection Into USDW.
1 Eutaw Injection into USDW
10 Eagle (Vrrgelle) Sandstone Improperly plugged wells
54 Two Medicine and Eagle Improperly plugged wells
6 Wilcox Leaks in casrng.
Unknown Vamoosa Improperly plugged wells.
Page 22 GAO/RCED-99-97 Underground Waste Disposal

Chapter 2 Injected Brines Can Continue to Contaminate Drinking Water
How and when detected Effects Remedial action EPA reviews beginning in 1985.
EPA reviews beginning in 1985.
EPA revtews beginning in 1985.
EPA reviews beginning in 1985.
None reported
None reported.
None reported.
None reported.
No cleanup; judged too costly. Belden and Blake ordered to rework well to extend into a deeper injection zone.
No cleanup; judged too costly. Fina fined $75,000 for vlolatrng Safe Drinking Water Act and ordered to rework well to extend into a deeper Injection zone.
No cleanup; judged too costly. Oilwell fined $4,000 for violating Safe Drinking Water Act and ordered to rework well to extend into a deeper injectton zone.
No cleanup; judged too costly. Chevron ordered to rework well to extend into a deeDer iniection zone.
EPA reviews beginning in 1985. None reported.
EPA reviews beginning in 1985. None reported.
No cleanup; judged too costly. XMCO-Tnad ordered to rework well to extend into a deeper injection zone.
No cleanup; judged too costly. Triad ordered to rework well to extend into a deeper injection zone.
EPA reviews beginning in 1985. None reported. No cleanup; Judged too costly. Chevron ordered to rework well to extend into a deeDer iniection zone.
Ciiicn complaint in 1985 of purging None reported. Owner plugged the abandoned well.
Otifsyn complaint in 1986 of purging Residence’s backup water supply A production well that was flowing at the surface was plugged may be contaminated. by the state.
Routine inspection and pressure test None reported. in 1988.
State arranged for wells to be plugged.
Citizen complaint in 1977. Contaminated drinking water. The Department of the Interior is attempting to determine the oartv resoonsible for contamination.
There may be more instances of contamination because not all occur- rences are detected nor are all known cases necessarily reported. According to EPA officials and a state official, individuals whose drink- ing water is affected may choose to deal directly with the well operator and never inform the regulatory authority.
Contamination is difficult to detect. As shown in table 2.1, about half the known and suspected cases were discovered only after contamina- tion had become obvious to the people affected, for example, when their well water became too salty to drink, their crops were ruined, or when they could see water flowing at the surface of old wells. Neither EPA nor the states routinely require groundwater monitoring for Class II wells. Although monitoring wells can be used to measure the extent of contam- ination, they are of limited value for detecting contamination away from the well since they can only be used in a small area and are therefore not useful for assessing large aquifers. In addition, deep monitoring wells
Page 23 GAO/RCED-89-97 Underground Waste Disposal

Chapter 2 Injected Brines Can Continue to Contaminate Drinking Water
themselves create potential routes by which contaminants can reach drinking water.
For the most part, the remaining cases were discovered by the operator or EPA staff during LJIC program monitoring operations required to ensure that wells are being properly operated. Three were discovered during pressure tests, which revealed leaks in the casing or some other structural failure. The other nine cases, all in Mississippi, were discov- ered by EPA while reviewing injection records. From these records, EPA staff could determine that the wells, which were constructed before the UC program went into effect, were injecting directly into a USDW. In all 12 of these cases, EPA or the state directed operators to cease injection until the wells were repaired or reworked.
In addition to the 23 cases of contamination that have been confirmed, 4 cases are also suspected. Two were reported to the state of Montana by residents who saw water flowing out of abandoned oil and gas produc- tion wells located near enhanced recovery wells. The state suspected that the pressure from these enhanced recovery operations was forcing fluids up through the unplugged production wells. Because of the possi- bility that these fluids could be entering drinking water supplies through leaks in the casing of the old wells, both wells were plugged. In Mississippi, the state arranged for wells that failed mechanical integrity tests because of numerous cracks in the casing to be plugged. In addi- tion, on Indian lands in Oklahoma, the Department of the Interior is determining whether enhanced recovery wells or production wells are responsible for contaminated drinking water.
Causes and Consequences of Contamination
The 23 cases in which contamination was confirmed can be traced to three principal causes: five cases resulted from leaks in the casing of the injection wells, nine cases resulted from injection into the USDW, and nine resulted from migration of brines from operating injection wells into nearby oil and gas wells that had been left unplugged or improperly plugged.
Once contamination was discovered, regulatory authorities in either EPA regions or the states directed responsible companies to prevent further contamination by plugging their injection wells or the abandoned wells, reworking injection wells to repair cracked casings, or extending the wells below the USDW. Some companies were also directed to provide alternative drinking water supplies. In a few instances, property owners
Page 24 GAO/RCED-S9-97 Underground Waste Disposal

Chapter 2 Injected Brines Can Continue to Contaminate Drinking Water
sought and received court-awarded compensation for damages. Accord- ing to an EPA official, although the Safe Drinking Water Act and EPA reg- ulations do not require cleanups in every contamination case, EPA and the states can require cleanups. In three cases, cleanup efforts were undertaken and in two other cases, cleanup efforts are currently under consideration. In the other 18 cases, EPA or the state decided that cleanup was either technically not feasible, too expensive, or not practi- cal because the aquifer was already high in brine content and not usable for drinking water without treatment.
The following case examples depict the circumstances under which con- tamination has occurred and the efforts to remedy it.
Contamination Through Leaks in Casing
Lea County, New Mexico
Hockley County, Texas
During the 197Os, 20 million gallons of salt water leaked from a Texaco disposal well in Lea County, New Mexico, into portions of a drinking water source, the Ogallala aquifer. Some of the brine made its way into a rancher’s irrigation well, damaging his crop and, according to the rancher, ultimately causing the foreclosure of his farm property. On the basis of the results of a pressure test, the rancher successfully sued Tex- aco in 1977 for damages. Texaco subsequently made repairs to the well, and it is now operating in compliance with UK regulations. Texaco was not required to clean the aquifer, however, because, according to the Chief of New Mexico’s Environment Bureau, the cost could not be eco- nomically justified.
In 1984, the Sun Exploration and Production Company discovered that its disposal well in Hockley, Texas, was contaminating the Trinity Sands aquifer, which provides drinking water to parts of northern Texas and irrigation water to much of northern and central Texas. After Sun detected a decline in the pressure of its disposal well, it conducted a mechanical integrity test and found that the casing had ruptured. The company then notified state authorities and plugged the well. Sun also began taking water samples to determine the extent of the contamina- tion, flushing the salt water from the aquifer, and installing monitoring wells to determine whether chloride levels were returning to acceptable levels. As of November 1988, monitoring showed that the chloride level
Page 25 GAO/RCRD439-97 Underground Wasrr I)isposal

Chapter 2 Lnjected Brines Can Continue to Contaminate Drinking Water
has been reduced but has not yet returned to the original level. State officials said that there have been no complaints about drinking water quality as a result of this episode.
Contamination Through Direct Injection Into the A c...:cr.,.
L-lqUllCl
While reviewing the injection records of existing disposal wells in Mis- sissippi beginning in 1985, EP.4 discovered that 23 wells in 9 different fields were injecting directly into a drinking water source. Since direct injection is prohibited by UIC regulations, EPA ordered the operators to cease injecting into the aquifer and to rework their wells so that they extend into a deeper injection zone. EP.4 also assessed penalties against the operators ranging from $4,000 to $75,000 for violating the Safe Drinking Water Act and from $100 to $1,000 a day for continued non- compliance, depending on the operator’s history of compliance and other factors. EPA officials told us that the operators would not be required to perform any cleanup since there had been no complaints about the drinking water and the costs of cleanup could not be economically justified.
Contamination Through Abandoned Wells
Lawrence and Johnson Counties, In 1985, while constructing lakes in the area, the U.S. Army Corps of Kentucky Engineers discovered that brine was contaminating Blair-e Creek in Law-
rence and Johnson Counties, Kentucky. After the Corps reported it, EPA traced the contamination to an Ashland Exploration Company field of 601 enhanced recovery wells. After sampling 20 water wells, EPA found that the drinking water for 83 to 88 households had become contaminated.
The Ashland field contained 1,450 abandoned oil and gas wells that had not been plugged, and brines had entered drinking water supplies through cracks in the casing of these wells. EPA therefore required ,4sh- land to properly plug the abandoned wells, provide alternative water supplies to homeowners whose wells were contaminated, and install long-term monitoring devices to track the natural cleanup process. EPA also fined the company $125,000 for violating the Safe Drinking Water Act. Because of the extent of contamination, EPA officials decided it would not be technically feasible to clean up the aquifer. Drinking bvater supplies will consequently remain contaminated for perhaps anot her 20
Page 26 GAO/RCED439-97 Underground Waste Disposal

Chapter 2 Injected Brines Can Continue to Contaminate Drinking Water
Ohio county, Kentucky
years, according to the head of the UIC program in EPA region IV, until the affected aquifers can cleanse themselves.
Also in 1985, residents of Ohio County, Kentucky, complained to EPA that their drinking water had become contaminated. EPA traced the con- tamination to a CNB Corporation field of 102 enhanced recovery wells, known as the Taffy Oil Field. According to EPA'S staff geologist in region IV, there were over 100 unplugged abandoned wells in the field. EPA reported that 62 injection wells failed mechanical integrity tests and lacked adequate casing and cementing. As a result, brines had entered the Chapman Stray Sand aquifer, which is a source of drinking water.
EPA'S analysis of a sample of four water wells in the vicinity of the Taffy field revealed that one well had a total dissolved solid concentration above the maximum contaminant level-4.5 times the drinking water standard. EPA could not determine the concentration for one of the other wells because the resident’s well contained oil so thick it coated EPA'S measuring instrument. No contamination was found in the two remain- ing wells. Residents with contaminated drinking water wells had to obtain water from other sources, in some cases using pond water or installing cistern systems to collect rainwater.
An EPA official said CNB subsequently went bankrupt and lost its leases in the Taffy field. EPA and the new owners are now identifying wells that need to be plugged. Although EPA will not require cleanup because of its high costs, the agency is considering having the new owner install monitoring wells to track the natural cleanup process. EPA is also consid- ering suing the original owner.
Safeguards Do Not Prevent Contamination by Abandoned Wells
Of the three causes of contamination, two-cracked casings and improper injection-were detected during the course of required pres- sure tests and record reviews for the most part. However, in only one case did these activities detect contamination through unplugged wells. While some states have special programs to plug abandoned wells, the number of improperly plugged abandoned wells, already estimated to be large, is growing, and some states are even now unable to pay for all the wells that need to be plugged.
Page 27 GAO/RCED-89-97 Underground Waste Disposal
Chapter 2 Injected Brines Can Continue to Contanxiuate Drinking Water
Area-Of-Review Requirements
According to EPIC guidance and state regulations (in the four states we reviewed), applicants for Class II permits must undertake a search for abandoned wells within at least a l/4-mile radius of the injection well. The search is limited to wells of public record. Once these wells are iden- tified, permit applicants must ensure that the abandoned wells are plugged in a manner that prevents the movement of brines into I:SDWS.
When EPA first proposed this so-called “area-of-review” requirement in 1976, it applied to both new injection wells and those that were operat- ing when the UIC program went into effect. However, commenters objected to imposing this requirement because of the large costs involved. While noting that dangers to underground sources of drinking water would also be great if there were large numbers of wells that had to be plugged, EPA nevertheless decided to limit the area-of-review requirement to new wells only. The agency believed that since new wells would be constructed in or near old fields, the area reviews for these new wells would eventually identify most abandoned wells, albeit over a longer period of time than if existing wells also had to conduct area reviews. EPA stated, however, that its decision would be open to review and that after the first year of state program operation, EP-4 would examine information submitted by the states on the costs and benefits of conducting area reviews and consider whether to change its requirements.
After publishing these proposed regulations, an EPA consultant reported to the agency on the costs of complying with its proposal.’ On the basis of estimates of the number of abandoned and producing wells in the United States, the consultant calculated the rate at which these wells would be reviewed. Assuming that 5,000 new injection wells would be added each year, the consultant estimated that it would take roughly 10 years before at least half the wells to be reviewed had been covered and over 20 years before nearly all the wells were reviewed. The consultant also estimated that most wells reviewed would not require any work but that 7.5 percent of all abandoned wells would have to be replugged, at an average cost of $20,000 per well.
Since EPA delegated regulatory authority to the states, they have issued permits to relatively few new wells. According to our projections. only 23( +- 7) percent, or about 20,300 out of the estimated 88,000 wells in our universe at the end of 1987, began operating after the UIC programs
‘Cost of Compliance, Proposed I’nderground Injection Control Program, Oil and (;.I.\ IIt,ll\ I ~r-~yw~~d for Office of Drinking Water. EPA (June 1979).
Page 28 GAO/RCED-89-97 Underground H IL+ I r I)isposal
Chapter 2 Injected Brines Can Continue to Contaminate Drinking Water
were implemented. Consequently, the majority of Class II wells in our universe have not been subject to area-of-review requirements.
Although EPA did not conduct the anticipated first-year review, it began a Mid-Course Correction review in 1988 to examine area-of-review requirements, along with four other UIC program safeguards. As part of this effort, a panel of headquarters and regional staff, as well as state UIC program officials, plans to determine how effective the area-of- review requirement has been in identifying improperly plugged aban- doned wells and whether the requirements should apply to all wells rather than only new wells. As of October 1988, EPA had begun to survey the states as to how they have been implementing area-of-review requirements. EPA staff expect to complete their work and develop rec- ommendations for the Director of EPA’S Office of Drinking Water in 1989.
State Effort is to Plug Improperly Plugged Abandoned Wells
According to EPA, there are approximately 1.2 million abandoned oil and gas wells, including formerly producing wells, in the United States. Of these, about 193,000, or roughly 17 percent of the total, may not be properly plugged. However, because of differences in construction prac- tices and well depth, among other factors, the degree of risk from con- tamination from improperly plugged wells differs.
According to officials in Texas, Oklahoma, and Kansas, the number of improperly plugged wells may be growing. While New Mexico officials believe that they do not have a problem with abandoned wells, officials in the three other states told us that the number of improperly plugged wells in their states has been steadily rising in the last few years, as the decline in oil and gas activity has forced many operators into bank- ruptcy. Although these three states, as well as New Mexico, have plug- ging programs for abandoned wells, Texas and Oklahoma officials reported that they currently have more wells to be plugged than they can afford to pay for.
Texas, for example, has had a plugging program since 1965. Until 1983, the number of wells that were plugged with state funds ranged from 20 to 50 a year. By 1984, however, the total number of wells that were plugged rose to 177, and the state began to charge a $100 drilling permit fee that went into a plugging fund; the first year, $4.5 million was col- lected. However, because of the downturn in the oil industry, by 1987, drilling fee collections had dropped to $2 million, while the number of wells to be plugged went up to a total of 703. As of January 1988, the plugging fund contained $1.2 million, but the cost to plug the 489 wells
Page 29 GAO/RCED-&97 Underground Waste Disposal

Chapter 2 Lnjected Brines Can Continue to Contaminate Drinking Water
awaiting plugging was estimated to be $2.6 million, leaving a shortfall of $1.4 million. In addition, the state is now attempting to compel the own- ers of 6,350 abandoned and improperly plugged wells to properly plug them. Depending on the extent to which owners have the resources to pay for plugging, the state could have several thousand more wells to plug.
Oklahoma, which also has a plugging program, plugged 53 wells during fiscal year 1987 using about $122,000 in funds appropriated from gen- eral revenues, according to a state official. However, these were only purging wells-wells from which brine could be seen flowing at the sur- face. Although there were even more wells to be plugged the following year, fewer funds were available, according to the official, and only 19 wells were plugged-those that posed an immediate threat to water sup- plies and residents. In one field office in Oklahoma, the district manager told us that 149 unplugged abandoned wells had been reported to his office, but he did not have funds for plugging them. Noting that the number of unplugged abandoned wells has increased significantly in recent years, the district manager estimated that there were thousands of such wells in his district alone.
Kansas also maintains a plugging fund made up of permit fees and gen- eral revenues. A state law also allows abandoned wells to be plugged using proceeds from the sale of pipe and equipment left on-site. While these two means of paying for plugging have thus far been adequate, Kansas officials fear that with increases in the number of improperly abandoned wells being reported, their plugging programs may not be sufficient in the future. Although they did not know the precise number of unplugged abandoned wells, officials are aware that they have increased enormously in the last few years. In 1983, Kansas had to plug one well at a cost of $1,400, but by 1987, the state had 56 wells to plug, which cost $213,000.
Conclusions Given the difficulties in detecting contamination and obtaining reports on contamination from affected individuals, the full extent to which Class II wells have contaminated drinking water is unknown. Neverthe- less, for those cases that we know of, two points are striking. One is that UIC program safeguards have in some instances detected and prevented further contamination. Of the 27 known and suspected cases, close to half were discovered during routine pressure tests and record reviews. As a result, injection was halted until the wells could be reworked to correct the problem, or the wells were plugged.
Page 30 GAO/RCED-99-97 Underground Waste Disposal

Chapter 2 Injected Brines Can Continue to Contaminate Drinking Water
The other point that stands out is that although the UIC program pro- tects against continued contamination from structural deficiencies and improper injection, it does not always protect against contamination from a leading source: improperly plugged abandoned wells. Close to half of the known and suspected cases of contamination were the result of fluids flowing up through improperly plugged wells and entering USDWS. In these cases, contamination was allowed to spread until it had become extensive enough to incur noticeable damage, by making water undrinkable or ruining crops. EPA and the states have recognized that these types of wells are potential threats, and the four states in our review have programs to plug improperly plugged abandoned wells. However, these programs are not always adequate to plug all the wells that three of these states believe need or will need to be plugged.
While not all improperly plugged abandoned wells are immediate threats to drinking water supplies, those that are near operating injection wells can serve as conduits. For this reason, EPA and the states adopted the area-of-review concept, but they adopted it only for new wells, reason- ing that all improperly plugged abandoned wells would eventually be discovered, although at a slower rate than if existing wells were also subject to the requirements.
Events occurring since EPA adopted the area-of-review concept have demonstrated-as EPA has recognized in its Mid-Course Correction review-that it is time to reconsider the decision to exempt existing wells from area-of-review requirements. Since 1980, several cases of contamination have been detected as a result of migration of fluids from existing injection wells into surrounding unplugged wells. While no one can say whether contamination would have been entirely prevented if area-of-review requirements had been imposed, the spread of injected fluids would more likely have been discovered and halted sooner.
Also, in the past 2 years, states have faced increasing demands on their plugging funds as oil and gas activity has declined and the number of improperly plugged abandoned wells has grown. By relieving well oper- ators of the responsibility to identify and plug any improperly plugged abandoned wells in the vicinity of their injection operations, EPA has, in effect, transferred the costs to the states or, in those cases where states do not have sufficient funds, to the public whose drinking water sup- plies are in danger of becoming contaminated.
The importance of having sufficient safeguards is underscored by the fact that there are usually no practical remedies once contamination
Page 3 1 GAO/RCED-S97 Underground Wwre I)isposal

Chapter 2 Iqiected Brines Can Continue to Contaminate Drinking Water
occurs. For most of the 23 confirmed cases, the drinking water sources that were contaminated will remain so for years until natural processes restore water quality.
Extending the area-of-review requirement to existing as well as new Class II wells would affect a large number of wells-at least 70 percent of the estimated 88,000 wells in our universe-and thus could require states to devote additional resources to reviewing the information sub- mitted by operators and ensuring that abandoned wells are properly plugged. However, to the extent that these existing wells are in the same area-of-review as new wells already permitted, the reviews for existing wells should have already been completed. In addition, because the degree of risk from contamination differs among existing wells, depend- ing on well depth and construction practices, for example, not all area reviews conducted by operators would have to be reviewed at once by the state or EPA regulatory agency, but rather they could be reviewed over a period of time.
Recommendations In order to better safeguard drinking water supplies from contamination from Class II wells, we recommend that the Administrator, EPA, require that UIC program regulations and/or guidance be established for state- and EPA-administered programs to make existing wells subject to area- of-review requirements as are new wells. Because of the large number of such reviews that would have to be conducted, EPA should establish a priority system to ensure that the regulatory agencies review those area reviews containing improperly plugged wells that pose the greatest envi- ronmental risks first.
Page 32 GAO/RCED-89-97 Underground Waste Disposal

Chapter 3
Existing Safeguards Against Contamination Have Not Been Fully Implemented
On the basis of our review in late 1987 and early 1988, states’ perform- ance in implementing existing UC program safeguards was mixed. Although the four state programs we examined are meeting most requirements for issuing permits, a considerable portion of their well files did not contain sufficient documentation to support issuance of injection well permits. In addition, Kansas, Oklahoma, and Texas have not finished reviewing the files of rule-authorized, or existing wells, with Oklahoma and Texas taking longer than the 5-year period that EPA'S guidance allowed. Similarly, Oklahoma and Kansas have not fin- ished pressure testing about 44 percent of their existing wells. Kansas and Oklahoma are also not monitoring the activities of many of their wells. Finally, while all four states require proper plugging and aban- donment procedures, only two provide for financial responsibility on the part of the operator. The others rely instead on state plugging funds, which, as noted in chapter 2, have not always been sufficient to pay for all the wells that have to be plugged.
EPA regions are aware of delays in program implementation and prob- lems with financial surety, and EPA has increased state program funding and created a financial surety task force to address these problems. However, although EPA has been assessing the states’ programs, the agency has not been aware of the extent of gaps in documentation.
Class II Program Safeguards
As noted in chapter 1, the Safe Drinking Water Act gave states consider- able discretion in their programs to regulate Class II wells, requiring only that they demonstrate that they were protecting drinking water sources and included inspection, monitoring, recordkeeping, and report- ing practices. EPA guidance specified a number of basic safeguards to be included in state programs, including
l area-of-review, mechanical integrity tests, and construction require- ments for wells that have permits;
l file reviews and mechanical integrity tests for rule-authorized wells; and l inspections and operator reports (as monitoring devices) and proper
plugging and abandonment procedures, including some form of financial responsibility for plugging both types of wells.
We found that all four states-Kansas, Oklahoma, New Mexico, and Texas-had adopted these safeguards in some form. As discussed in the following sections however, the procedures followed and the extent to which they have been implemented differ.
Page 33 GAO/RCEDM-97 Underground Waste Disposal

Chapter 3 Existing Safeguards Against Contamination Have Not Been Fully Implemented
Requirements for In order to obtain a permit to operate a Class II well, states require oper-
Perrnits Are Not Fully ators to, among other things (1) meet certain construction standards including those for surface casing, (2) search for and plug any aban-
Documented doned unplugged wells in the area-of-review (as discussed in chapter 2), and (3) conduct a mechanical integrity test. While surface casing requirements vary among and even within states, state programs gener- ally require that new wells be constructed with surface casing that pro- tects the lowest USDW. Files on the new wells we examined showed that this standard was met.’ However, we found that many wells with per- mits contain no evidence in their files that area-of-review information was checked or that the pressure test portion of mechanical integrity tests was conducted.
To make sure that government programs are operating efficiently and accomplishing their objectives, program managers should have in place a system of internal controls. According to standards for internal con- trols developed by GAO in 1983,” significant agency transactions and events are supposed to be properly recorded.
We found, however, that the four states did not have internal controls in place to ensure that all necessary documentation was on file. For exam- ple, for all types of wells with permits we found that, in general, files had information on the status of wells, both active and abandoned, within the area-of-review: in Kansas, 100 (65 to 100) percent; in Oklahoma, 88 (68 to 97) percent; and in Texas, 100 (89 to 100) percent of the files met this requirement. (In New Mexico, 100 (37 to 100) per- cent of the files also had met this requirement, but this estimate is based on a very small number of wells; hence, the broad confidence interval.) In none of the states, however, did UIC program staff document their reviews of the information submitted to meet area-of-review require- ments.? Although staff in New Mexico, Kansas, and Oklahoma told us
‘Because all 14 of the new wells in our sample met this standard, we cannot compute a meaningful estimate for our universe. At the individual state level, the estimates are Oklahoma, 100 (47 to 100) percent; Texas, 100 (55 to 100) percent; Kansas, 100 (47 to 100) percent; and New Mexico. 100 (4 to 100) percent. These calculations are based on very small numbers of wells; hence, the broad confi- dence intervals.
‘Internal controls that federal agencies are required to follow are set forth in GAO’s Standards For Internal Controls in the Federal Government, published in 1983 pursuant to the Federal Managers Financial Integrity Act of 1982.
“Because none of the 59 permitted wells in our sample showed any evidence of such a check. we cannot compute a meaningful estimate for our universe. At the individual state level. the estimated percentages of wells without documentation are Oklahoma, 100 (88 to 100) percent; Texas. 100 (89 to 100) percent; Kansas. 100 (65 to 100) percent; and New Mexico 100 (37 to 100) percent. These calcu- lations are based on small numbers of wells and therefore have broad confidence internals
Page 34 GAO/RCED-99-97 Underground Waste Disposal

Chapter 3 Existing Safeguards Against Contamination Have Not Been Ny Implemented
that they checked the information that permit applicants submitted against state maps and plugging records, we found no evidence of such a check. Moreover, while examining the files, we could find no evidence that state program staff had ever found improperly plugged wells. In Texas, officials acknowledged that they rarely reviewed the accuracy of information submitted to satisfy area-of-review requirements because of the time and staff required. The state now has a pilot project underway, funded by EPA, to determine the costs of checking area-of-review information.
Documentation was also missing from program files on mechanical integrity tests (MITS). MITS are performed in two parts: the first part is a check of cementing and other records in order to verify that enough cement was used to ensure that fluids are not migrating from the injec- tion zone; the second part is a check for leaks in the well casing and tubing, either by annulus pressure tests, monitoring, or other means. For new wells, MITS are supposed to be conducted before injection can begin and every 5 years thereafter.
Overall, 41( + 14) percent of the files in our universe had no documenta- tion indicating that pressure tests had been conducted before the wells were allowed to begin operating. In Texas, the UIC program director explained that before 1986, the state did not require operators to submit this information. We found that those wells in Texas that had no record of pressure tests had all been issued permits before 1986 and were therefore not required to submit evidence. In Oklahoma and Kansas, program officials believed that the necessary tests had been conducted but that the reports documenting them had not been correctly filed or received from the states’ district offices. EPA regional officials told us they had known of problems with missing documentation but were not aware they were as extensive as our review found. In New Mexico, the files in our universe had documentation indicating that pressure tests had been conducted before the wells were allowed to begin operating.
Existing Wells Have According to EPA guidance, states were to review the files and test the
Not Been Fully mechanical integrity of all existing, or rule-authorized, wells within 5 years of achieving primacy to make sure that the wells are not endan-
Reviewed and Tested gering USDWs. As of the end of 1987 and early 1988, these reviews and tests were not complete, however.
Page 35 GAO/RCED439-97 Underground Was tc Disposal

Chapter 3 Existing Safeguards Against Contamination Have Not Been Fully Implemented
File Reviews File reviews are supposed to verify the following:
1. Each well extends below the lowermost USDW and has an adequate confining zone separating the injection zone from that USDW.
2. Each well is designed for the expected use and local geological conditions.
3. Each well is cased and cemented to prevent movement of fluids in or between USDWS.
4. Each well is operated at an appropriate pressure and with adequate controls to prevent fracturing of the confining zone.
5. Each well operator is monitoring and reporting as required.
6. Each well owner/operator is maintaining appropriate financial surety and plugging and abandonment plans.
In order to check on the first three items, state officials rely on opera- tors’ well completion reports, which contain information on the depth of the well, the length of the casing, and the extent of cementing. To check on well pressures, officials examine the operator’s permit and the pres- sure authorized at issuance. Those states that require financial surety on the part of the well operator check the currency of financial informa- tion, and to monitor well activities, officials check to see whether opera- tor reports, describing the current status of the well and monthly pressure readings, are on file.
Three of the four states in our review achieved primacy more than 5 years ago: New Mexico and Texas in 1982, and Oklahoma at the end of 1981. Since Kansas obtained program primacy in February 1984, its 5 year period just concluded. However, overall, at the time of our review only 32( f 18) percent of the necessary file reviews had been completed. New Mexico conducted an equivalent review before it received primacy and was therefore given credit for having met this requirement by EPA.
Oklahoma had completed 36( -+ 16) percent of its file reviews and Texas, 29(-t 10) percent. Kansas had completed reviews on 7( & 7) percent of its files.’
‘.4lthough Kansas officials claimed that 23. or 41 percent of our sample files, had been rcutswtad. 19 of these files were reviewed at the field level and state files did not contain documentatlrrn on these reviews. We were therefore able to verify only those 4 files reviewed by the state. whxh c ~m;msed 7 percent of our sample files.
Page 36 GAO/RCED439-97 Underground Waste Disposal

Chapter 3 Existing Safeguards Against Contamination Rave Not Been Ny Implemented
In these three states, file reviews have been hampered by the large number of wells to review, incomplete information in the files, and insufficient staff and resources. With over 43,000 existing wells, Texas was skeptical from the start that it could complete its file reviews within 5 years, and its original memorandum of agreement with EPA, under which the state was delegated primacy, contained no deadline for completing its file reviews. The state did relatively few file reviews until January 1987, when it received a 3-year, $750,000 grant from EPA, which it has used to hire 12 staff members. Texas officials said that as of December 1987, they had completed file reviews of 9,768 wells, find- ing numerous instances of missing well completion reports, along with wells that were being regulated but had never been authorized to inject by the state. In these cases, operators are required to apply for a permit according to procedures. The state expects to complete all its file reviews by January 1990.
With almost 13,000 Class II wells to review, Oklahoma also faced a major undertaking, which similarly was slow to start. According to the state’s UK program director, although Oklahoma achieved primacy in 1981, it did not begin its review of rule-authorized wells until 1985 because until that time Oklahoma focused on permitting. At that point, after EPA expressed its concern about the state’s lack of progress, the state hired a program director and instituted file reviews and other pro- cedures. However, once file reviews began, reviewers found that much of the information they needed-mostly well completion reports-was missing and had to be obtained from well operators. In 1986, EPA region VI granted Oklahoma another 2 years to complete its file reviews, until December 1988, and also gave the state additional funding for its pro- gram. Since then, EPA has granted Oklahoma an additional extension to September 30, 1989.
Kansas’ file reviews were also slowed by missing well completion infor- mation and a late program start. When Kansas was granted primacy, its program was jointly administered by two state agencies that disagreed over how the program should be run. Implementation was consequently delayed until 1986, when a single state agency assumed responsibility for the program. Once the file reviews got underway, program officials discovered that many files lacked well completion reports. As a result, the state began to require operators of existing wells to submit well com- pletion information along with the results of pressure tests. Kansas offi- cials expect to complete their file reviews sometime in 1989.
Page 37 GAO/RCED-8497 Underground Waste Disposal

Chapter 3 Existing Safeguards Against Contamination Have Not Been Fully Implemented
Mechanical Integrity Tests Along with file reviews, MITS are the principal means by which authori- ties can ensure that existing Class II wells are not contaminating drink- ing water. According to EPA guidance, operators were to conduct the pressure test portion of the MITS within the same 5-year period as the file reviews. At the time of our review, however, 69( + 16) percent of the required pressure tests overall had been conducted within the last 5 years.
In Texas, 93( * 6) percent of the wells either had pressure tests com- pleted or had been equipped with continuous monitoring devices. In New Mexico, 81( + 18) percent of the wells had annulus pressure tests.
However, in Oklahoma, only 44( f 16) percent of the wells and in Kan- sas, only 44( + 13) percent of the wells had been tested within the last 5 years, in both cases, because incomplete and incorrect inventories of wells delayed the states’ scheduling of pressure tests. As discussed fur- ther in the next section, it is the policy of both states to have inspectors witness as many pressure tests as possible. According to program offi- cials, inspectors were often unable to locate wells that were listed in their inventories. In other instances, inspectors were sent out to a well only to discover that the test had already been conducted.
As with the MITS for wells with permits, Kansas program officials believed that tests had been conducted on many more existing wells and were surprised to learn that our sample results were much lower. Oklahoma officials and EPA officials in region VI recognized that prog- ress had been slow, but they are hopeful that with the addition of funds and staff, the tests will be completed by September 30, 1989.
Operators Are Not Consistently Monitored
To help ensure that operators are meeting the terms of their permits, UC programs contain provisions for inspection and monitoring. According to EPA guidance, state programs are supposed to provide for qualified state inspectors to witness at least 25 percent of the MITS conducted each year. To monitor activities on an ongoing basis, program officials rely on operator reports, submitted at least once a year and containing informa- tion on the injection pressures and volume of fluids injected each month.
We found that each of the four states has inspectors to witness SIITS. Kansas, New Mexico, and Oklahoma require inspectors to witness as many MITS as possible, and we estimate that 72 percent or more of the MITS conducted in each of these three states had been witnessed. Texas’
Page 38 GAO/RCED-89-97 Underground Wnsrr Disposal

chapter 3 Existing Safegnards Against Contamination Have Not Been Fully Implemented
policy is for inspectors to witness at least 25 percent of the MITS, and we found that state inspectors had witnessed 29( + 12) percent of the MITS.
Monitoring of operator activities was less consistent. While New Mexico had operators’ annual reports on file for all or most of its wells (100 [88 to 1001 percent) and Texas for nearly all its wells (96[ + 41 percent), Kan- sas had only 48( + 13) percent of the required reports, and Oklahoma had only 25( + 11) percent. Both Kansas and Oklahoma attribute this sit- uation to incomplete inventories of Class II wells. Unlike New Mexico and Texas, which have computerized inventories, Kansas and Oklahoma are still in the process of compiling their inventories, with district offices gathering information as inspectors witness MITS. Once the inven- tories are complete, Kansas and Oklahoma officials said they will be able to check their files to ascertain whether they contain current opera- tor reports and to send out notices when reports are found to be missing, as is done in Texas and New Mexico.
Kansas officials expect to have their inventory completed in 1989, while Oklahoma program officials expect their inventory will be completed once all the Mm have been conducted, in 1989.
Financial Surety EPA guidance for state programs calls for Class II wells to be properly
Requirements Are Not plugged upon abandonment, in a manner that will not allow the move- ment of fluids into or between USDWS. The guidance also calls for opera-
Working tors to maintain financial responsibility for plugging their wells but does not specify the forms it must take.
While all four states in our review have adopted requirements for plug- ging and abandonment, only New Mexico and Oklahoma require opera- tors to provide some form of financial assurance, while Kansas and Texas use their state-administered plugging funds in lieu of requiring operators to maintain financial responsibility. New Mexico requires operators to provide a performance bond, either for a single well or an entire field, and we found that all or most wells (100 [88 to 1001 percent) had evidence of surety on file that was current.
Oklahoma requires either a bond, a letter of credit, or a financial state- ment showing a net worth of at least $50,000. However, state officials have encountered problems with financial statements, claiming that many operators who were allowed to furnish financial statements went bankrupt and left no assets for plugging. According to our data, 41( f. 12) percent of the wells in Oklahoma with evidence of financial
Page 39 GAO/RCRD-SQ-97 Underground Waste Disposal

Chapter 3 Existing Safeguards Against Contamination Have Not Been Fully Implemented
surety on file are covered by this form of assurance. In 1986, the state legislature tightened the requirements for financial statements by requiring operators of new wells to have bonds for at least 3 years before they can use financial statements as financial surety.
Even with this change, however, the state may still encounter problems. Twenty-four( 2 18) percent of the wells in Oklahoma with financial statements on file as evidence of financial ability showed a net worth of less than $50,000. We also found that 18( * 10) percent of all forms of financial surety on file in Oklahoma, including financial statements, had expired or were not current.
Although EPA allowed Texas and Kansas to use their plugging funds instead of requiring operator financial responsibility, as discussed in chapter 2, Texas’ fund is inadequate to pay for plugging all the known abandoned wells and Kansas’ fund may not be sufficient in the future to plug increasing numbers of abandoned wells. The director of Texas’ UK
program told us that the state has been looking into the possibility of requiring operator financial surety, although there is some concern about operators’ ability to pay for bonds or other forms of surety. While Kansas has no plans to require operator surety, the UIC program official in charge of compliance is concerned that if the number of abandoned wells that are improperly plugged continues to grow at current rates, the plugging fund may become inadequate.
According to an EPA official, along with its Mid-Course Correction review, EPA is looking at the need for changes in financial surety require- ments. While continuing to examine long-range issues, such as the viabil- ity of financial statements, an EPA work group has developed recommendations for immediate implementation that included require- ments for annual updates of financial statements as well as updates of plugging and abandonment costs.
EPA Oversight of State In addition to the Mid-Course Correction review of the Class II program,
Programs which is looking at program requirements, EPA regulations also call for the agency to evaluate how well states are implementing their programs. According to EPA regulations, states are supposed to report to EP,Z annu- ally on the implementation of their programs and quarterly on cases of noncompliance with permit requirements. On the basis of the states’ reports and visits to the states, the EPA regions prepare annual assess- ments of each state’s progress in implementing its program.
Page 40 GAO/RCED-W-97 Underground Wate Disposal

Chapter 3 Existing Safeguards Against Contamination Have Not Been Fully Implemented
While we found that regional officials were reasonably familiar with the status of the four state programs we examined, their knowledge of the programs was based on general observations rather than on an in-depth review of well records, such as ours. EPA'S annual evaluations have focused on more fundamental program implementation issues, such as staffing, funding, and adoption of regulations. As noted earlier, EPA offi- cials in regions VI and VII, which have oversight over the four states in our review, believe that while Texas, Kansas, and Oklahoma were slow to put their programs into place (particularly the latter two states), the states have made progress in the last few years.
However, EPA is concerned about the adequacy of the states’ data man- agement systems and the accuracy of their reporting. Our findings rein- force the agency’s concerns. In particular, we found that the information reported to EPA by Kansas and Oklahoma on completed file reviews and MITS differs from what we found in well records. For example, as shown in table 3.1, Oklahoma reported to EPA that by the end of 1987, about the same time we looked at well records in the state, it had completed 66 percent of its file reviews. Our review of records, however, found that a smaller portion of the file reviews had been completed-36( t 16) per- cent. Similarly, Oklahoma reported a higher completion rate for pres- sure tests than our record checks revealed. In Kansas, the difference between what we found and what the state reported is quite wide, the result, according to state officials of having some records kept in field offices, while others are kept in the central state office, where our review was conducted.
Page 41 GAO/RCED-%97 Underground Waste Disposal

Chapter 3 Existing Safeguards Against Contamination Have Not Been Fully Implemented
Table 3.1: Comparison of Selected State- Reported and GAO Data for Existing Pressure tests (MITs) Wells (Percent) File reviews completeda completeda
State datab GAO data State datab GAO data --..-____~~- Kansas 72 71*7)" 60 441+13) New Mexico 1 d 81( t 18)
Oklahoma 66 36(-+ 16) 73 44(5 16) Texas 38 29(& 10) 84 93( t6)
aOur estrmates are for active and temporarily Inactive wells II- EPA’s FURS Inventory as of October 1987 EPA’s data relate to slmllar wells lkted in FURS as of December 1987
“EPA offlclals said they consider these numbers to be estimates because the number of existing wells In the states Inventones IS dlfflcult to determine
‘State offlclals belleve the actual percentage of completed file reviews wlthln our sample was 41 per cent (See footnote 4 on p 36 )
dNew Mexico conducted an equivalent revtew before recelvlng primacy and was therefore consldered to have already met this requirement
‘Since New Mexico requires a pressure test annually, the number of tests it reported IS greater than the number of exlstlng wells
To address its concerns, EPA has begun a complete review of UK program data needs and management systems. After identifying EPA headquar- ters’ information needs, the agency plans this year to identify a mini- mum set of data elements to be collected and kept by the states and regions on a well-by-well basis. EPA expects that it will take about 5 years to have a satisfactory system in place for every program.
Conclusions Under the wide latitude allowed by federal law, states have adopted those safeguards that EPA has determined to be fundamental to protect- ing USDWS from contamination. Most of the states we visited, however, have taken a long time to review existing wells and after 4 to 5 years, many of these wells had still not been reviewed and tested. The states and EPA are aware of this situation, however, and believe that the prob- lems that caused these delays-lack of sufficient staff and resources to deal with the large number of wells-are being addressed. According to state officials, remaining file reviews and pressure tests should be com- pleted within the next year or two.
EPA also realizes that financial surety requirements have to be strength- ened. Although intended to ensure that operators would not abandon their wells without properly plugging them, financial surety has not always been effective in guaranteeing that funds will be available for plugging. In view of the large number of improperly plugged abandoned
Page 42 GAO/RCED&L97 Underground Waste Disposal

Chapter 3 Existing Safeguards Against Contamination Have Not Been Fully Implemented
wells in the United States and the potential for contamination they rep- resent, preventing any increase in their numbers should be a high prior- ity. EPA’S task force is an important effort toward this end.
On the basis of our findings, we also support EPA’S efforts to improve its internal controls over the UK program by developing better data man- agement systems. Specifying precisely what information should be kept in the records of each well is an important step in helping ensure that the data that are reported by the states are accurate and reliable.
By contrast, EPA was not aware of the extent of problems with new per- mits Although operators are supposed to pass a pressure test and search for and plug any improperly abandoned wells in their area-of- review before they can receive their permits, states issued a considera- ble number of permits, without any evidence on file that these require- ments had been met or checked. EPA needs to make sure that states are issuing permits only if sufficient evidence exists that pressure testing is performed and area-of-review information is checked.
Recommendation To help ensure that Class II wells are structurally sound and not inject- ing into areas of unplugged wells, we recommend that the Administra- tor, EPA, require state program regulatory agencies to institute the internal controls necessary to ensure that Class II permits are issued only if documentation exists that area-of-review information was checked and the pressure test portion of mechanical integrity tests was conducted.
Page 43 GAO/RCED-M-97 Underground Waste Disposal

Appendix I
Methodology
Our review focused on active and temporarily inactive (we are using the term temporarily inactive to refer to EPA’S category of temporarily aban- doned wells) Class II wells in the 20 states that had primary regulatory authority at the time of our analysis. As table I.1 shows these states contain a total of 134,729 active and temporarily inactive wells, which represent about 87 percent of all such wells in the United States.
Table 1.1: Active and Temporarily Inactive Class II Wells in Primacy States (As of October 1987)
State Number of wells
Texas 49,476
Oklahoma 22,579
Illinois
Kansas
California
14,147
14,009
11,201
Wyoming 5,749
Louislana 4,212
Ohio 3,952
New Mexico 3.913
Arkansas 1,128
Colorado 932
West Virginia 760
Utah 664
Nebraska 624
North Dakota 595
Missouri 275
Alaska 266
Alabama 206
South Dakota 40
Oregon 1
Total 134.729
Source. EPA, FURS
In choosing our sample from among these states, we excluded Illinois because EPA had conducted an extensive study of Illinois’ program in 1986. This exclusion left 120,582 active and temporarily inactive Class II wells in our universe of interest.
Our sampling then proceeded in two stages. In the first stage, we ran- domly selected four distinct states, with the probability of their selec- tion proportional to the total number of active and temporarily inactive
Page 44 GAO/RCED-99-97 Underground Waste Disposal

Appendix I Methodology
--
Class II wells in each state.’ The information on Class II active and tem- porarily inactive wells in the four states came from EPA'S FURS. Each time a state was selected meant that in the second stage of sampling! we would take a sample of 25 wells from that state. Thus, since Texas was selected five times, the total number of Texas wells that would be included in the sample was 125. In the second stage of sampling, we ran- domly selected a total of 350 wells from these four states. (See table 1.2.)
Table 1.2: Sample of State-Regulated Active and Temporarily Inactive Class II Wells
State
Number of times
selected
Proporation Number Number of wells of of wells of wells
!x%b’ interest sampled reviewed
Texas 5 49,476 .410310 125 108
Oklahoma 4 22,579 ,I87250 100 63
Kansas 4 14.009 .116178 100 61 New Mexico 1 3,913 .032451 25 24
Total 69,977 .746169 350 256
Of our 350 sample wells, we filled out data collection instruments (DCIS) for 256 wells, or 73.1 percent of the wells sampled. We did not fill out DCIS for the remaining 94 wells because of discrepancies between EP-A and state records. The specific reasons for not filling out DCIS are listed in table 1.3.
Table 1.3: Reasons for Not FIllingOut DCls on Sample Wells
Number of wells Reason Texas Oklahoma Kansas New Mexico Total FURS Inventory contalned more wells for a single permit than state files . 29 17 . 46 Not an active or temporarily inactive wella 11 6 14 1 32 Permit application withdrawn 6 . 3 . 9 No file found for well in state records . 2 5 l 7 Total 17 37 39 1 94
‘Files showed that the wells had been plugged, converted to a productlon well, had never oeen x:1 vated, or were not m)ectlon wells
Because we reviewed a statistical sample of wells, each estimate dta\-txl- oped from the sample has a measurable precision, or sampling error
‘We randomly selected the four distinct states with replacement. This means that each II~N’ N 1 selected a state from our 19-state universe of interest, its selection was noted and then II \I X. returned to the universe prior to the next selection. Thus, a particular state could be M~I~v I ( ‘C i 1111 II ( than once before we selected our four distinct states.
Page 46 GAO/RCED-W97 Underground H‘lrsrr lhqw4al

Appendix I Methodology
The sampling error is the maximum amount by which the estimate obtained from a statistical sample can be expected to differ from the true universe characteristic (value) we are estimating. Sampling errors are stated at a certain confidence level-in this case, 95 percent. This means that the chances are 19 out of 20 that, if we reviewed all of the Class II wells in our universe, the results of such a review would differ from the estimate obtained from our sample by less than the sampling errors of such estimates.
Our sample estimates represent approximately 88,000 (+ 10,400) active and temporarily inactive Class II wells in the universe of interest-19 primacy states. These estimates represent Class II active and temporar- ily inactive wells that we would expect (1) to have been listed in the FURS inventory as of October 1987 and (2) to have files at the state level that would enable us to fill out a DCI on each well.
Page 46 GAO/RCEDJS97 Underground Waste Disposal

andix II
Major Contributors to This Report
Resources, Community, and
Richard L. Hembra, Director, Environmental Protection Issues (202)275-5489 Peter F. Guerrero, Associate Director
Economic Robert S. Procaccini, Assistant Director
Development Division~ Robert P. Cavanaugh, Assignment Manager
Washington, D.C. Jaquelhe A. Hill Evaluator
Judy K. Pagano, ‘Operations Research Analyst Bernice Steinhardt, Consultant
Kansas City Regional Jerry B. Reeder, Evaluator-in-Charge
Office Gene W. Ahle, Evaluator Bonnie S. Thomas, Evaluator
(089391) Page 47 GAO/RCEDSk97 Underground Waste Disposal

Requests for copies of GAO reports should be sent to:
U.S. General Accounting Office Post Office Box 6015 Gaithersburg, Maryland 20877
Telephone 202-275-6241
The first five copies of each report are free. Additional copies are $2.00 each.
There is a 25% discount on orders for 100 or more copies mailed to a single address.
Orders must be prepaid by cash or by check or money order made out to the Superintendent of Documents.

Copyright 2000, Society of Petroleum Engineers Inc.
This paper was prepared for presentation at the SPE International Oil and Gas Conferenceand Exhibition in China held in Beijing, China, 7–10 November 2000.
This paper was selected for presentation by an SPE Program Committee following review ofinformation contained in an abstract submitted by the author(s). Contents of the paper, aspresented, have not been reviewed by the Society of Petroleum Engineers and are subject tocorrection by the author(s). The material, as presented, does not necessarily reflect any posi-tion of the Society of Petroleum Engineers, its officers, or members. Papers presented at SPEmeetings are subject to publication review by Editorial Committees of the Society of PetroleumEngineers. Electronic reproduction, distribution, or storage of any part of this paper for com-mercial purposes without the written consent of the Society of Petroleum Engineers is prohib-ited. Permission to reproduce in print is restricted to an abstract of not more than 300 words;illustrations may not be copied. The abstract must contain conspicuous acknowledgment ofwhere and by whom the paper was presented. Write Librarian, SPE, P.O. Box 833836,Richardson, TX 75083-3836, U.S.A., fax 01-972-952-9435.
AbstractOil and gas wells can develop gas leaks along the casing yearsafter production has ceased and the well has been plugged andabandoned (P&A). Explanatory mechanisms include chan-nelling, poor cake removal, shrinkage, and high cement per-meability. The reason is probably cement shrinkage that leadsto circumferential fractures that are propagated upward by theslow accumulation of gas under pressure behind the casing.Assuming this hypothesis is robust, it must lead to better prac-tice and better cement formulations
Introduction, Environmental IssuesThis discussion is necessarily superficial, given the complex-ity of the issue and attendant practical factors such as work-ability, density, set retardation, mud cake removal, entrain-ment of formation gas, shale sloughing, pumping rate, mixconsistency, and so on. A conceptual model will be developedin this article to explain slow gas migration behind casing, butwe deliberately leave aside for now the complex operationalissues associated with cement placement and behavior.
In 1997, there were ~35,000 inactive wells in Albertaalone, tens of thousands of abandoned and orphan wells1, plustens of thousands of active wells. Wells are cased for envi-ronmental security and zonal isolation. In the Canadian heavyoil belt, it is common to use a single production casing stringto surface (Figure 1); for deeper wells, additional casingstrings may be necessary, and surface casing to isolate shallowunconsolidated sediments is required. As we will see, surfacecasings have little effect on gas migration, though they un-doubtedly give more security against blowouts and protectshallow sediments from mud filtrate and pressurization.
To form hydraulic seals for conservation and to isolatedeep strata from the surface to protect the atmosphere andshallow groundwater sources, casings are cemented usingwater-cement slurries. These are pumped down the casing,displacing drilling fluids from the casing-rock annulus, leav-ing a sheath of cement to set and harden (Figure 1). Casingand rock are prepared by careful conditioning using centraliz-ers, mudcake scrapers, and so on. During placement, casing isrotated and moved to increase the sealing effectiveness of thecement grout. Recent techniques to enhance casing-rock-cement sealing may include vibrating the casing, partial ce-mentation and annular filling using a small diameter tube.
Additives may be incorporated to alter properties, butPortland Class G (API rating) oil well cement forms the baseof almost all oil well cements.2 Generally, slurries are placedat densities about 2.0 Mg/m3, but at such low densities willshrink and will be influenced by the elevated pressures (10-70MPa) and temperatures (35 to >140ºC) encountered at depth.
The consequences of cement shrinkage are non-trivial: inNorth America, there are literally tens of thousands of aban-doned, inactive, or active oil and gas wells, including gas stor-age wells, that currently leak gas to surface. Much of this en-ters the atmosphere directly, contributing slightly to green-house effects. Some of the gas enters shallow aquifers, wheretraces of sulfurous compounds can render the water non-potable, or where the methane itself can generate unpleasanteffects such as gas locking of household wells, or gas enteringhousehold systems to come out when taps are turned on.
Methane from leaking wells is widely known in aquifers inPeace River and Lloydminster areas (Alberta), where there areanecdotes of the gas in kitchen tap water being ignited. Be-cause of the nature of the mechanism, the problem is unlikelyto attenuate, and the concentration of the gases in the shallowaquifers will increase with time.
This implies that current standards for oilwell cementingand P&A are either not well founded, or the criteria are basedon a flawed view of the mechanism. This is not a condemna-tion of industry: all companies seek to comply with standards.3
Nevertheless, we believe that the AEUB Interim Directive 99-034 is flawed with respect to gas leakage around casings. Torectify this, the mechanisms must be identified correctly.Practise can then be based on correct physical mechanisms,giving a better chance of success (though we do not believe
SPE 64733
Why Oilwells Leak: Cement Behavior and Long-Term ConsequencesMaurice B. Dusseault, SPE, Porous Media Research Institute, University of Waterloo, Waterloo, Ontario; Malcolm N.Gray, Atomic Energy of Canada Limited, Mississauga, Ontario; and Pawel A. Nawrocki, CANMET, Sudbury, Ontario

2 DUSSEAULT, GRAY AND NAWROCKI SPE 64733
that the problem can be totally eliminated because of the vaga-ries of nature and human factors, despite our best efforts).
There is also need for better quality oil-well cement for-mulations that can resist thermal shocking. For example,leakage of fluids along thermal wells in cyclic steam opera-tions in Alberta has proven a challenging problem for ImperialOil.5 If poor quality or poorly constituted cement is used, highinjection pressures, thermal shocking, plus non-condensiblegas evolution lead to leakage behind the casing that couldbreak to surface under exceptional conditions.
Finally, in production management for conservation pur-poses, zonal isolation is multiple-zone wells.6
There are initiatives to identify old leaking wells and un-dertake mitigating action in Alberta and Saskatchewan, the“orphan well” program of the AEUB, initiatives by the Petro-leum Technology Alliance Centre in Calgary, and so on. Thisarticle is to try and clarify the mechanisms involved.
Cement Behavior
Cement Shrinkage: If cement is placed at too high a watercontent, it loses water to the porous strata under lower pres-sure (po) through direct filtration because the cement hydro-static head is greater than the pore water pressure head. Theannulus width between casing and rock is small (e.g. 175 mmcasing in a 225 mm hole = 25 mm), so even a small shearstrength development between rock and cement will supportthe weight of the cement. If this shear stress is only ~0.5 kPa,the entire “hydrostatic” head of the cement (γc⋅z) can be sup-ported by stress transfer to the rock mass. (Of course, becauseof temperature and pressure effects, this degree of set is notattained simultaneously along the entire cement sheath.)
Thus, while the cement is still in an almost liquid, early-setstate, massive shrinkage can occur by water expulsion, butannular cement settling to compensate for the loss of water isimpeded by the shear stress transfer to the rock mass. Theconsequence is shrinkage in the cement sheath.
Portland cements continue to shrink after setting and dur-ing hardening.7,8 This autogenous shrinkage occurs becausehydration reaction products occupy less volume than theoriginal paste. Judicious proportioning control of the cementslurry and the use of admixtures and additives can limit thephysico-chemical effects of the autogenous shrinkage proc-esses. Mostly, the careful control of water content by usingsuperplasticisers and the control of macro-shrinkage by usingappropriate aggregates benefit the properties of the set grouts.
Silica flour (SiO2, ground to –20 µm) is often used to make“thermal cement”. It is added in quantities approaching 75%of the dry constituents, the remainder being cement powder.Silica flour has also been added to cement in an attempt tocounteract shrinkage. Unfortunately, for physico-chemicalreasons, silica flour can enhance both drying and autogenousshrinkage.9
Silica flour is a ground product, usually made from purequartz sand. Physically, the silica flour, by virtue of its grainsize (D50 ≈ 10-20 µm) has a large surface area; this provides
not only enhanced reaction areas for kinetically controlledhydration processes, it provides a need for additional wettingfor slurry formulation. Physico-chemically, a freshly fracturedsilica surface possesses a high chemical reactivity because ofthe presence of unsatisfied bonds arising from the breaking ofthe silica chemical lattice. These fresh surfaces will elec-trostatically bind polar water molecules to satisfy these brokenbonds. Experiments on pure silica using magnetic resonanceand dielectric permittivity show that up to 9-11 layers of watercan be absorbed on the surface, and the closest layers are ofcourse the most tightly bound.
The surface area increases inversely as the square of themean particle diameter, therefore reducing the surface area bya factor of five (grinding 100 µm sand to 20 µm flour) in-creases the area by 25, and because the new surface area ischemically fresh, it is more reactive. Thus, the electrostaticbound water volume for silica flour is vastly larger than forgeochemically “old” sand. Furthermore, electrostaticallybound water thickness is reduced by temperature (Brownianmotion), so cool slurry will have a surfeit of water when itbecomes heated through contact with geothermal temperature.
Alternative fillers are required to control the macro-shrinkage properties of the materials. We recommend 60-100µm quartz sand be substituted for SiO2 flour when possible.
Other processes can lead to cement shrinkage. High saltcontent formation brines and salt beds lead to osmotic dewa-tering of typical cement slurries during setting and hardening,resulting in substantial shrinkage.10,11 Experiments with rec-ommended cement grout formulations placed against salt andpotash strata clearly show massive dewatering of the cementand the formation of free brine at the interface between thecement and the salt. The same effect must occur when fresh-water cement grouts are in contact with low permeabilityrocks with highly saline pore fluids. By ensuring that thegrouts are placed at high density, conducive to a stable groutmicrostructure, the effects of osmotic dewatering can likely beminimized, but this should be quantitatively assessed.
Recently marketed finely ground cements (Microfine™and Ultrafine™) are Portland cement-based materials. Theyare generally finer than normal Portland cements and includepozzolanic additives, such as finely ground pumice. Slurriesof these materials penetrate fine fissures and pores in rockmore readily than more conventional grouts but in bulk sufferfrom very high shrinkage and, hence, without further modifi-cation, are not suitable for grouting the annulus between oil-well casings and the borehole wall.12
Dissolved gas, high curing temperatures, and early (flash)set may also lead to shrinkage. It is not clear if non-shrinkageadditives have substantial positive effects at great depth andhigh temperature. These additives (e.g. Al powder) generallyproduce some gas, which in the laboratory provides volumeincrease. Additives may enhance some properties; however,they may induce negative impacts on other properties, or loseeffectiveness at elevated temperatures, pressures, or in thepresence of certain geochemical species. Also, autogeneousshrinkage continues long after these agents have acted.

SPE 64733 WHY OILWELLS LEAK 3
Cement Strength and Rigidity. API standards for oilwellcement specify certain strength criteria. Strength is not themajor issue in oil well cementing under any circumstances.Based on extensive modelling, cement clearly cannot resist theshear that is the most common reason for oilwell distortionand rupture during active production.13 If compaction orheave (from solids injection) is taking place, the cement itselfprovides minimal resistance to buckling (compression) orthread popping (tension). If the annulus could be filled withrelatively dense sand, the resistance to shear would be betterthan current ordinary oilwell cement formulations.
Based on over 50 triaxial tests at various confiningstresses, we have shown that 28-day cured oilwell cements arecontractile (volume reduction during shear) at all confiningstresses above 1 MPa (150 psi). This is also the case for 70%silica flour cements, and for the new products based on ex-tremely finely ground cement. (Specimens were cured underwater at 20°C or at 90°C.) However, dense concretes used inCivil Engineering are dilatant, and therefore resistant to shear,at all working stresses.
The stiffness modulus of typical oilwell cement is smallcompared to that of low porosity rocks, and vastly lower thanthat of steel.14 The stiffness moduli are roughly 2-4% that ofsteel, though there is a wide range depending on density, con-tent, and confining stress. Depending on depth (~stress) andinduration (~porosity), rock moduli may vary from 2% to 50%of steel, and a reasonable value is 5-15% in most intermediatecases of moderate porosity (10-20%).
Bond. Cement will not bond to salt, oil sand, high porosityshale, and perhaps other materials. Also, bond strength (i.e.the tensile resistance of the cement-rock interface) is quitesmall; in fact, the tensile strength of carefully mixed and curedoilwell cement at recommended formulations is generally lessthan 1-2 MPa. Given that fluid pressures of 10’s of MPa mayhave to be encountered, given that pressure cycling of a wellcan easily debond the rock and cement (there is strain incom-patibility because of the different stiffnesses), and given thatde-bonding is generally a fracturing process with a sharpleading edge rather than a conventional tensile pull-apart pro-cess, a large cement bond to rock cannot be assumed in anyreasonable case. Initiation and growth of a circumferentialfracture (“micro-annulus”) at the casing-rock interface will notbe substantially impeded by a cohesive strength at this inter-face.
The presence of “good bond” on a cement bond log is infact not an indicator of bond, but an indicator of intergranularcontact maintained by a sufficient radial effective stress. Thelack of bond on a bond log is actually evidence of the inabilityto transmit high frequency sonic impulses because of the pres-ence of an “open zone”, that is, a circumferential fracture thatis open by at least a few microns. Thus, maintaining “bond”actually means maintaining effective radial stress. Note that ifeffective radial stress cannot be maintained, then hydraulicfracturing conditions must exist at the interface.
The Gas Leakage ModelA good conceptual model must explain the following typicalaspects of oilwell behavior that are observed in practice.
Generally there are no open circumferential fracturesdetectable after a typical good quality cement job(“good bond” is observed on the log traces).
Such fractures develop over time and with service. Even in cases where bond appears reasonable over
substantial sections of the casing, gas leakage may beevidenced some years or decades later.
The process is invariably delayed; thus, there must bephysically reasonable rate-limiting processes.
The gas often appears at surface rather than beingpressure injected into another porous stratum en-countered in the stratigraphic column.
The presence of surface casing provides no assuranceagainst gas leakage.
Whereas we do not deny that mud channeling, poor mudcake removal, gas channeling, and so on can occur in isolatedcases, we believe that a better hypothesis exists to rationallyexplain the points listed above.
Figure 2 shows the effect of shrinkage on near-wellborestresses. (Plots are qualitative, but have been confirmed bynumerical modeling, to be published later.) Initially, cementpressure pc(z) = γc⋅z, almost always higher than po, but lowerthan σhmin (lateral minimum total stress). Set occurs and asmall amount of shear stress develops between the rock andthe cement; then, hydrostatic pressure in the cement is nolonger transmitted along the annulus. Thereafter, even minorshrinkage (~0.1-0.2%) will reduce the radial stress (σr = σ′r +po) between cement and rock because rock is stiff (4-20 GPafor softer rocks), and small radial strains (0.001-0.003) causerelaxation of σr and increase in σθ. A condition of po > σr (σ3)is reached; i.e. the hydraulic fracture criterion. A circumfer-ential fracture (i.e. ⊥ to σ3 = σr), typically no wider than 10-20µm, develops at the rock-cement interface.
A thin fracture aperture is sufficient to appear as “loss ofbond” in a geophysical bond log. Because in situ stresses arealways deviatoric (e.g. σhmin ≠ σHMAX), bond loss will usuallyappear first on one side of the trace, or on two opposite sides(direction of σhmin). Wells that have experienced several pres-sure or thermal cycles will almost always show loss of bond,sometimes for vertical distances in excess of 100 m.
A zone of po > σr (σ3) can extend for considerable heights.Nevertheless, this is still not a mechanism for vertical growth.To understand vertical growth, consider Figure 3, where ahypothetical case is presented. The static circumferentialfracture of length L is filled with formation water of densityγw, giving a gradient of about 10.5 kPa/m for typical oilfieldbrine, but the gradient of lateral stress (∂σh/∂z) is generally onthe order of 18-24 kPa/m. This means that if the fracturecontains a fluid pressure sufficient to just keep it open at thebottom, there is an excess pressure at the upper tip equal to~L⋅(21-10.5) ≈ about 10 kPa/m, in typical Alberta conditions,for example. Thus, because of the imbalance between thepressure gradient in the fracture and the stress gradient in the
4 DUSSEAULT, GRAY AND NAWROCKI SPE 64733
rock, an inherent fracture propagation force is generated thattends to drive the circumferential fracture upward. (In a per-fectly horizontal section, this cannot happen, but the processdevelops equally at higher elevations in the well where it be-comes inclined.)
Now, consider what happens when a circumferential frac-ture between the cement and the rock is exposed to a thinstratum that contains free gas (there are invariably severalsuch zones in any well). Cementing a casing leads not only tothe development of a cement sheath, but the cement paste alsoslightly penetrates the interstitial space in the surrounding rock(a few grain diameters deep for typical sandstone). This re-duces the permeability substantially, and because of capillaryexclusion effects associated with two-phase flow and the re-duced pore throat diameter arising from cement particle inva-sion, gas flow into the circumferential fractures is almost cer-tainly through diffusion. This means that when the fracture issmall, the rate of gas influx is modest. However, as the frac-ture grows in height, the contact area with surrounding sedi-ments increases, and eventually (and particularly when thepressures are being reduced by surface leakage or flow into ahigher stratum), the gas diffusion rate is large enough to leadto continuous but slow gas leakage.
In the fracture, once solution gas saturation is achieved,free gas at the top of the fracture develops. The gradient ingas is less than 1 kPa/m (rather than ~10.5 kPa/m for water) sothere is an even greater excess driving pressure at the uppertip. In addition, this gradient effect tends to favor driving theliquid in the fracture back into the formation, albeit slowly,and the fracture becomes more and more gas-filled. Thus,there is a self-reinforcing process: the greater the verticalheight of the fracture, the greater the excess driving force atthe tip. The fracture grows vertically upward, and eventuallyleads to gas leakage behind the casing at the surface. It willmigrate up around the outside of any casing strings at higherelevations because the excess pressure that can be developedat that stage is large enough to fracture even excellent bond(Figure 4). However, why does it take so long for the gas toget to surface (sometimes decades)?
Gas must migrate to surface through a circumferentialfracture perhaps only 10-20 µm thick extending over only alimited part of the circumference of the rock-cement interface.Note that fracture aperture develops between pf and σr (= σ3)when the pressure acts to maintain it open, but because therock and cement have elastic stiffness, they act to severelyrestrict the aperture. Thus, there are at least two rate-limitingaspects to gas evolution at the surface: diffusion rate of gasinto the fracture, and the low “hydraulic conductivity” of thecircumferential fracture arising because of its narrow aperture.
Why does the fracture grow so slowly? When the micro-annular circumferential fractures are not connected and areshort, the excess pressure at the tip is small. Also, if the cas-ing pressure is large because of production pressure, this leadsto a small outward flexure that may be enough to maintain thefissures closed. (Note that if a “better” bond log response isdesired, simply pressurize the casing as the bond log is run!)
As the production pressure declines with time, the fissure willtend to open more because the casing is less pressurized.Also, fracture growth in the vertical direction is undoubtedlyaided by pressure and thermal cycles.
Nevertheless, it is common for gas bubbling at the surfaceto be noticeable only years and sometimes decades after P&A.Over time, the effective fracture length increases, and thisleads to the driving pressure increase discussed above. Be-cause the velocity of a fracture is a very strongly non-linearprocess that is positively coupled to the driving pressure, itprobably takes years for diffusion processes to lead to a con-dition where growth starts to accelerate. However, once ac-celeration begins, the fracture length increases, and completeupward propagation is fast (days? months?), limited only bythe rate at which fluids can enter the fracture at depth and flowto the tip. Thus, before P&A, a cement bond log may showthat the well is in good condition, yet this is no guarantee that,years later, leakage will not occur.
As the fracture rises, the condition that the pressure in thefracture exceeds the pore pressure in the surrounding stratawill arise. This will lead to flow from the fracture out into thestrata. If this flow is unimpeded, it will occur and the fracturevertical growth will terminate. Now, a condition exists wheregas and liquids are entering the wellbore region behind thecasing and leaving it at a higher elevation. This is a loss ofzonal seal, and could have negative effects, such as pressuriz-ing higher strata, or leakage of brines and formation fluids intoshallower strata causing contamination. It can also have posi-tive environmental effects, properly executed.
Yet, despite the existence of permeable zones, gas is stillobserved at the surface, and also as deep-sourced gas in shal-low groundwater aquifers. The reason is probably that thecement paste in the pores of permeable strata acts to excludegas by capillarity effects along the entire length of the strati-graphic column (it takes a large ∆p to overcome surface ten-sion effects in small pores). This means that gas must leavethe fracture mainly by liquid-phase diffusion. So, it seemsthat in leakage cases the flow rate from depth simply exceedsthe diffusive bleed-off rate at higher elevations, leading to theexcess appearing at the surface. An interesting chroma-tographic effect probably occurs with mixed gases; because ofdiffering pressure solubility, more soluble gases will diffuseinto adjacent strata more rapidly, and the least soluble, CH4,will arrive at the surface almost pure.
Unfortunately, even if no gas appears at the surface, it isno guarantee that the well is not leaking. In fact, the commonoccurrence of household water sources being charged withdeep-sourced gas is clear evidence that there are many casesof leakage where the gas simply enters the water aquifer, andmay never bubble around the casing.
DiscussionThe hypothesis satisfactorily explains the phenomena associ-ated with well behavior. Thus, it leads to a number of ap-proaches to solve the problem. Eliminating cement shrinkageis one, but there are other practical solutions that are workable.

SPE 64733 WHY OILWELLS LEAK 5
Cement shrinkage study and the development of new ce-ment formulations that have no Portland phase15 is an ongoingpart of an industry-sponsored project, and new formulationswill be available soon. Better recommendations for P&A arealso being developed. These will be the subjects of other arti-cles. This section will present an approach to environmentalprotection that can be operationally implemented at present.
Given that gas leak-off by Darcy flow (rather than diffu-sion) is likely impeded by the cement paste in the pore spaceof adjacent strata, one approach to environmental protection isto complete a well in the manner sketched in Figure 5. Theopen, non-cemented section is deliberately chosen to be acrossbeds of sufficient permeability so that when excess pressuredevelops in the zone, the capillary exclusion effect can beovercome (less than 1 MPa typically, but depending on grainsize and clay content). Because the rate of gas entry andtransmission through the circumferential fracture is small, apermeable bed just a few 10’s of centimetres thick will sufficeto act as a drain. This bed will accept sufficient volumes ofgas, and providing that it is laterally continuous, will act as adrain for a very long time, perhaps indefinitely.
Is there a need to revisit API standards on cement formu-lation, placement and completion practices, and industry qual-ity control during placement?16,17,18 We believe so, but this isa substantial issue, and specific suggestions await more re-sults.
ClosureThe elements of the gas leakage mechanisms that we proposeare the following:
Various mechanisms, but mainly cement shrinkage,lead to a drop in radial stress.
When σr < po, a circumferential fracture will open. Differences between lateral stress gradients and pres-
sure gradients provide forces for vertical growth. The excess pressure that develops at the upper lead-
ing tip increases as the (vertical) height. The fracture will tend to become gas filled as gas
slowly diffuses into it, increasing the driving force. Fracture aperture is severely limited by the stiffness
and geometry, limiting the upward propagation rate. Pore blockage because of cement paste penetration
limits gas leak-off rates to those associated with dif-fusion because of capillarity effects.
Eventually the fracture will rise, and gas will entershallow strata or leak at the surface.
This working hypothesis has led to recommendations oncementing and casing strategies, and the pursuit of a cementformulation that can be easily placed yet not shrink is impor-tant, both for primary cementing, and for P&A.
References 1 Alberta Energy Utilities Board, 1997. Interim Directive 97-08.
LONG TERM INACTIVE WELL PROGRAM RE-QUIREMENTS. Available from EUB, Calgary Alberta.
2 Ghofrani R. and Marx C. 1990. Special requirements for oilwellcements. In Properties of Fresh Concrete, ed. H. J. Wierig, Chap-man and Hall, London, pp. 49-58.
3 Bonett A. and Pafitis D. 1996. Getting to the root of gas migration.Oilfield Review, Spring 1996, pp. 36-49.
4 Alberta Energy Utilities Board, 1999. Interim Directive 99-03. SURFACE CASING VENT FLOW/GAS MIGRA-TION (SCVF/GM) TESTING AND REPAIR REQUIRE-MENTS. Copy available from the EUB, Calgary Alberta.
5 Alberta Energy and Utilities Board, 1998. Application Number970163, In the matter of an application be Imperial Oil Limited foran expansion…, Available from AEUB, 10 volumes plus addenda,Calgary, AB.
6 Goodwin, K. J. 1997. Oilwell/gaswell cement-sheath evaluation. J.of Petroleum Tech., December, pp. 1339-1343.
7 Van Breugel 1991. Simulation of hydration and formation of struc-ture in hardening cement-based materials - Delft, NL, 1991 -IBSN90-9004618-6.
8 Aïtcin, Neville, Acker 1997. Integrated view of shrinkage deforma-tion - Concrete International, September 1997.
9 Gray, M.N. and Shenton, B.S 1998. Design and Development ofLow-Heat, High-Performance, Reactive Powder Concrete. Inter-national Symposium on High-Performance and Reactive PowderConcrete, Sherbrooke, PQ, Canada. 1998 August 16-20.
10 Van Kleef, R. P. 1989. Optimized slurry design for salt zone ce-mentations. SPE/IADC 18620, Drilling Conference, New Orleans,Louisiana, pp. 41-49.
11 Chenevert, M. E., Shrestha, B. K. 1991. Chemical shrinkage prop-erties of oilfield cements. SPE Drilling Engineering, Vol. 6, No. 1,pp. 37-43.
12 Gray, M.N. and Shenton, B.S, 1997. Unpublished results of devel-opment tests on advanced finely ground cement grout mixtures.Report to the US/DOE, Sandia National Laboratories, Albuquer-que, NM
13 Dusseault, M.B., Bruno, M.S., Barrera, J., 1998. Casing shear:causes, cases, cures. SPE#48864. Proc. 1988 SPE InternationalConf. and Exhibition, Beijing, China, Nov 1998.
14 Thiercelin, M. J., B. Dargaud, J. F. Baret, and W. J. Rodriguez,1997, Cement Design Based on Cement Mechanical Response,SPE #38598, Proc. Annual Technical Meeting, SanAntonio, TX.
15 Bensted, J. 1996. Slag cement for oil well construction. WorldCement, Vol. 27, No. 1, 6 pp.
16 API 1997a, Recommended Practice for Testing Well Cements.Recommended Practice 10B. 146 pages
17 API 1997b, Shrinkage and Expansion in Oil Well Cements;Technical report 10TR2, 57 pages
18 API 1999, Technical Report on Temperatures for API CementOperating Thickening Time Tests, API 10TR3, 1st Edition, 100pages

6 DUSSEAULT, GRAY AND NAWROCKI SPE 64733
liner
Deep Well
gas zone
surficial strata
aquifer
overlying strata~300-700 m
slow leakage
Shallow Heavy Oil Well
cement sheath
casing
reservoir
Figure 1: Cased,Cemented Wells
aquifer
Figure 2: Radial Stresses and Circumferential Fractures
casing
far-field stress
pore pressure
radial stresses
Region of low radial stress,leading to hydraulic fracture
cement
rocklittle to noshrinkage
high shrinkage case
circumferential fractures due to low σr
σr
radius
σhmin
direction
1000 -5000 m

7 WHY OILWELLS LEAK SPE 64733
gasenteringfracture
lateral stress,
σhmin
pressure inthe fracture
excess drivingpressure at top
σhmin gradienttypically 1.5-2.2
stress (pressure)
depth
gas gradient = 0.1
oil gradient = 0.85
H2O gradient = 1.03
Figure 3: Fracture Driving Pressure from Gradient Differences
gas-
fille
d
po
reservoir
gas zone
maximum gas pres-sure in microannulus
poσr
σh
σv
stress (p)
depth
fracturepropagates
upward
Figure 4: Fracture Approaching Surface
surfacecasing
ineffective
cased,cemented
oilwell

8 DUSSEAULT, GRAY AND NAWROCKI SPE 64733
gas zone
surficial strata
aquifer
slow leakage
thinpacker
zone withno cement
slow gas seepagealong fracture
Figure 5: Leaving a Leak Off Zone to Arrest Gas Seepage


WIS E A UBF
3 7600 0OO20 2047
Illinois Oil Field BrineDisposal Assessment
ILLINOIS ENVIRONMENTAL PROTECTION AGENCYWATER QUALITY MANAGEMENT PLANNING
StaffReport
LA* /.•:•<.<?.v 8EMVIRO ; ' iTALfRHTECTION AGENCY
STAlybr ILLINOISSPRfNj&FflELDJLLJNOiS

V
P ILLINOIS OIL FIELD BRINEDISPOSAL ASSESSMENT
STAFF REPORT
ILLINOIS ENVIRONMENTAL PROTECTION AGENCY208 WATER QUALITY MANAGEMENT PLANNING PROGRAM
^ - PLANNING AND STANDARDS SECTION->* DIVISION OF WATER POLLUTION CONTROL
m , 2200 CHURCHILL ROAD* " SPRINGFIELD, ILLINOIS 62706
NOVEMBER, 1978
P •; r-'^m^^YEI\Vll?ON(.r£hTALPROiECTiON.AGENCY
STATE Or ILLINOIS
-i SPRINGFIELDfILLlNOIS

TABLE OF CONTENTS
Page
LIST OF TABLES 111
LIST OF FIGURES iv
LIST OF PLATES . . v
LIST OF APPENDICES vi
Chapter
FOREWORD vii
INTRODUCTION 1
Initial Inquiries and Study Objectives 1
Origin of Oil Field Brine. .| 3
Oil Production ,. , 6
Fluid Injection 6
Brine Pollution 11
FIELD INVESTIGATIONS 21
Criteria 21
Location and Study of Sites 22
Investigative Procedures 23
Field Conditions 34
Evaporation/Seepage Pits 34
Injection Operations 40
Abandoned Wells 44
PRELIMINARY FINDINGS 46
PRELIMINARY RECOMMENDATIONS 48
GLOSSARY 49
REFERENCES 51
APPENDICES 53
n

LIST OF TABLES
Table Page
I. Comparison of Sea Water and Oil Field Brine 4
II. IPCB Water Quality Standards 11
III. Average Concentrations of the MajorChemical Constituents From Each Piezometerand Pit 31
m

LIST OF FIGURES
Figure Page
1. Geologic Structure of the Illinois Basin . . . 5
2. Oil Production in Illinois 7
3. Isocon Map of Ste. Genevieve Brines &
4. Generalized Movement of Water in the Vicinityof Holding Ponds 13
5. Location Map of Study Sites. 24
6. Generalized Location of Hagarstown Member ofthe Glasford Formation ... 25
7. Electrode Spacing for Measuring Electrical EarthResistivity Using a Wenner Configuration . 27
8. Relationship of Resistance and ConnateWater Salinity . 28
9. Relationship of Apparent Resistivity andFiltered Chloride Concentration 32
10. Relationship of Apparent Resistivity andUnfiltered Chloride Concentration 33
11. Map of Net Annual Evaporation in Inches 36
12. Common Injection Installations ^
13. Pollution of a Fresh Water Aquifer Througha Failed Injection Casing 43
14. Pollution of a Fresh Water Aquifer ThroughAbandoned Wells 45
IV

LIST OF PLATES
Plate page
1. Christian County Study Site 15
2. Bond County Study Site 16
3. Effingham-Fayette County Study Site 17
4. Clay County Study Site 18
5. Clay County Study Site (Oblique Aerial) 19
6. Brine Pit Overflow 37
7. Stream Pollution from Brine Runoff 38
8. Vegetation Kill from Brine Runoff .... 39

LIST OF APPENDICES
Appendix page
A. Problem Report Form 53
B. Selected Samples of PreviouslyCompleted E.E.R. Studies 58
C. Christian County E.E.R. and Water Table Maps-Lithologic and Gamma Ray Logs 76
D. Bpnd County E.E.R. and Water Table Maps-Lithologic and Gamma Ray Logs 86
E. Effingham-Fayette County E.E.R. and Water Table Maps-Lithologic and Gamma Ray Logs 96
F. Clay County E.E.R. and Water Table Maps-Lithologic and Gamma Ray Logs 106
vr

FOREWORD
The study described within was initiated January, 1978 as part of the
statewide 208 Water Quality Management Planning Program. Funding was
provided in part by the U.S. Environmental Protection Agency under
provisions of Section 208 of the Federal Water Pollution Control Act
Amendments of 1972 (PL 92-500), as amended.
Contractual assistance was provided by the Illinois State Geological
Survey (I.S.G.S.). Particular recognition should be given to Mr. George
Lane of the Department of Mines and Minerals for his substantial
cooperation and assistance in this effort, to Mr. Philip Reed of the
I.S.G.S. for assisting in the acquisition, compilation and interpretation
of field data, and also to Mr. Craig Murphy of Northern Illinois
University for technical assistance and his many hours of fieldwork
expended throughout the summer.
VI1

INTRODUCTION
This study of environmental problems related to oil field brine disposal
in Illinois began in January 1978, as part of the Illinois statewide 208
water quality management planning program, and is scheduled to be
completed by the end of 1979. The preliminary findings and
recommendations contained herein are based on information collected and
analyzed through August 1978. The format reflects the approach taken in
gaining an understanding of brine related problems and in developing
recommendations for their abatement. A glossary of terms appearing in
this report is provided at the end of the text.
Initial Inquiries and Study Objectives
The oil field brine disposal study was initiated by the Illinois
Environmental Protection Agency (Agency) after receiving several
complaints from affected landowners concerning contaminated water
supplies and damaged land. The majority of complaints initially received
were channeled through the public participation Regional Advisory
Committee serving the southeast central portion of the state. To obtain
further information on brine disposal, "Problem Report Forms" were made
available to interested citizens. These forms were designed to provide
preliminary estimates of the areal extent and nature of problems commonly
associated with brine disposal operations. Subsequent press releases
soliciting the help of concerned citizens generated considerable

interest, resulting in the submission to the Agency of 16 completed
forms. An example of the circulated form appears in Appendix A. The
information thus collected helped provide the basis for initial
investigations described in this report.
Major objectives outlined for the study included:
1. Providing an assessment of the nature and extent of environmental
problems emanating from oil field brine disposal practices in
Illinois.
2. Conducting a detailed field study of more specific problems related
to brine disposal, in particular the subsurface migration of chloride
bearing waters.
3. Providing an assessment of the efficacy of the rules and regulations
governing the disposal of oil field brines in Illinois.
Information on regional geology, soil types and hydrogeology of the
affected areas, as well as information on contaminant characteristics
were obtained by researching previous work. It was found that a great
amount of information on Illinois oil field brine and brine disposal had
been compiled by the Illinois State Geological Survey (ISGS).
To employ this expertise, the Agency entered Into a contract with the
ISGS for adetailed field investigation of four typical brine disposal
sites in south central and southeast central Illinois. The primary

purpose of the field study was to develop a reliable and convenient
methodology for identification of chloride concentrations in
water-bearing earth materials.
Twenty-three piezometers were installed during the months of June and
July 1978 to facilitate development of a relationship between ground
water quality (chloride concentration) and apparent resistivity.
Geologic descriptions of the sites, cross sections with gamma logs, and
water level maps from piezometer observations were also developed to aid
in the assessment of oil field brine disposal pollution problems.
Origin of Oil Field Brine
Identifying the origin of brine in the Illinois Basin is a complex
problem. Researchers have yet to agree upon a solution. Details of the
more widely accepted hypotheses are technically far beyond the scope of
this report. However, for descriptive purposes, the most simplistic
hypothesis will be presented here. It proposes a derivation from
original sea water with a minor contribution of fresh water (Graf et al.
1966). Even though the brines originated from sea water initially
incorporated in the sediment, subsequent compaction and chemical
alteration resulted in concentration of the constituents. For
comparative purposes, the surface water closest in composition to these
subsurface brines is that of the present day Dead Sea.
Table I provides a comparison of the common constituents and typical
concentrations of sea water and oil field brine (Reid et al., 1974).

Table I. Comparison of Sea Water and Oil Field Brine
Sea Water(mg/1)
10,600
Oil Field Brine(mq/1)
Na+1 12,000-150,000
K+l 400 30 - 4,000
Ca+2 400 1,000-120,000
Mg+2 1,300 500- 25,000
* Cl-1 19,000 20,000-250,000
Br-1 65 50 - 5,000
1-1 0.05 1 - 300
HCO3I— 0 - 1,200
* S0|2 2,700 0 - 3,600
As indicated in Table I, brine salinity is primarily a function of
the sulfates (SO42), bicarbonates (HCO31), and chlorides(Cl-1) 0f the cations sodium (Na+), calcium (Ca+2) and magnesium
(Mg+2) (Reid et al., 1974). As a point of reference, the maximum
allowable concentration for both chloride and sulfate in ground water, as
set by the Illinois Pollution Control Board (IPCB, 1977),.is 250
milligrams per liter (mg/1).
A feature of the underlying geology known as the Illinois Basin
covers approximately 135,000 square miles of the south central and
southeastern portions of the state and extends into southwestern Indiana
and western Kentucky (Figure 1). Most of Illinois oil and brine
production is concentrated along structural features within the basin

c*Contour, interval 500 ft.
... Pennsylvanian outcrop
^ Mississippi Embayment
Figure 1.—Geologic structure of Illinois basin drawn onbase of New Albany black shale (from Meentset al., 1952)

(Figure 2), although reef deposits also act as reservoirs for
hydrocarbons.
Studies on the concentrations of total solids present in Illinois
Basin brine reveal that the greatest concentrations are centrally located
within the Basin. As reported by Meents and others (1952),
concentrations diminish radially outward and seem to conform to the
contours of the Basin. Figure 3 displays the distribution of
concentrations found in samples retrieved from the Ste. Genevieve
formation. Total solids in other basin formations vary slightly but all
seem to exhibit similar structural dependencies.
Oil Production
The first oil fields of Illinois were discovered around 1903 in
Lawrence and Crawford Counties along the La Salle Anticlinal Belt. Since
the period of peak production from these oil fields in 1910, annual
production has fluctuated drastically with changes in economy and
technology. A peak in annual oil production of 146.8 million barrels
resulted from the post-1937 Mississippian discoveries (Mast, 1970).
Since then, rates have decreased to 26.3 million barrels according to
1976 statistics of Van Den Berg and Lawry (1976).
Fluid Injection
In an attempt to increase crude oil yield, numerous secondary
recovery operations have been employed in the Illinois fields with

Figure2.--OilProductioninIllinois
0—ContouronGalena(Trenton)
-i-MFault
|Anticline
tMonocline
OilField
4O00

MONTGOMERY'
Figure 3.—Isocon map of Ste. Genevieve brines(from Meents et al., 1952).
\rtOOO~' ,socon'arS'* Genevieve, brine ports' per million total solids
•123 Brine datum point to neorett
thousand ports per million
SCALE OF MILES
10
ILLINOIS STATE GEOLOGICAL SURVEY

varying degrees*of success. These installations facilitate the injection
of water into oil-bearing strata via input wells and are termed
waterfloods. In this method, surface and subsurface waters are utilized
to repressurize and flush-out oil-bearing formations. Little effect was
made on the annual oil production by the early waterfloods of the
1930's. However, in the early 1950's, the combined effects of modern
waterflood and hydrofracing techniques increased the total annual oil
production by approximately 35 percent over production yields obtained
prior to the use of these techniques.
Quite similar to waterflood installations are salt water disposal
(SWD) wells. In the field, it is difficult to distinguish between the
two operations. As both are injection operations, the difference lies in
the final destination of the injected fluid. Unlike the fluids of a
waterflood operation, the saline waters injected into an SWD well do not
stimulate oil production. Rather than being reinjected into the
producing formation, the brine is injected into a porous non-oi1-bearing
formation. To facilitate reinjectioni wells drilled specifically for SWD
or wells which have been converted from other functions are utilized.
Detailed information on waterflood and SWD operations may be obtained
from the Illinois State Geological Survey's annual publication (Van Den
Berg and Lawry, 1976).
It has been reported (Bell, 1957) that, with early oil field brine
disposal practices, brine was often siphoned from an earthen holding pond
directly into a cased well. Since gravity was the only injection force
utilized, this type of facility was usually abandoned as the permeability

of the receiving formation diminished to a point where free flow was
restricted. This posed no particular problem in that another well in the
proximate area could generally be found and readily converted to meet the
disposal needs. In subsequent years, technology progressed as did the
amount of brine produced. With the development of the more modern
secondary recovery techniques, injection pressures on the order of
several hundred pounds per square inch were commonly applied, thus
dramatically increasing the ultimate capacity of a typical injection well.
o Some of the more serious problems involved in these disposal
operations are due to the relatively high density and corrosiveness of
oil field brines and their damaging effects upon land and water quality.
These problems can be compounded by the fact that as an oil field matures
the ratio of brine to oil may increase substantially. In fact, it is not
uncommon for brine to oil production ratios to exceed 80:1. The effects
of this amount of brine production can be \/ery destructive unless oil
well operators are equipped to safely dispose of or reinject these large
quantities of caustic waste.
As calculated from 1976 statistics, Illinois oil fields subject to
waterflooding produce an approximate average of 19 barrels of brine per
!arrel of oil recovered. The annual disposal rate for waterflood
npn'-ritions in Illinois during 1976 was 355,059,000 barrels, a 3.5 percent
increase over the 1975 rate. This amounts to an average daily brine
injection rate of nearly one million barrels of brine. In addition to
reinjection for waterflooding, substantial quantities of brine are
injected into salt water disposal wells, which in 1976 accounted for
10

approximately 20 percent of the new injection wells. However, there are
no records available indicating the amount of brine disposed of by this
method.
Brine Pollution
The highly saline waters associated with oil production pose a threat
to water and land. The daily disposal of approximately 973,000 barrels
of brine in Illinois has been responsible for the sterilization of
thousands of acres of productive land, 3,000 recorded acres in White
County alone (Fasig, personal communication). Reports from individuals
indicate that oil field brine has also been responsible for the sickness
or loss of numerous animals.
The Illinois Pollution Control Board (IPCB) Regulations, Chapter 3,
Part II, Section 207, prescribe quality standards for underground waters
of the state. Table II lists these maximum allowable contaminant levels.
Table II. IPCB Water Quality Standards
General UseGround Water Surface Water
Chloride 250 mg/1 500 mg/1
Sulfate 250 mg/1 500 mg/1
Total Dissolved Solids 500 mg/1 1,000 mg/1
11

By comparing the constituent concentrations found in brine pits at
the four study sites with the maximum allowable chloride levels set by
the IPCB, it is apparent that one barrel of brine possessing a chloride
concentration of 40,000 mg/1 would be theoretically capable of elevating
the chloride concentration of over 160 barrels of fresh water above the
maximum allowable contaminant level.
Since the discovery of large commercial supplies of oil in southern
Illinois in the 1930's, brines from oil fields have been disposed of in
various ways. Initially, direct discharge into streams was the most
common method of disposal (Reed, 1978). Later, in the 1940's, the
development of injection wells allowed the oil field brine to be
reinjected into compatible underground reservoirs. Perhaps the most
common practice was to pump the brine into a holding pond, as this was
believed to allow the brine to evaporate into the atmosphere. However,
in Illinois where permeable materials are often near the surface, many
brine holding ponds actually became infiltration ponds (Roberts and
Stall, 1967). Consequently, although the surface water pollution problem
was greatly improved through the use of holding ponds, a problem of
ground water pollution is now present in many Illinois oil fields (Reed,
1978). However, this is not to imply that streams in the oil production
areas have been completely unaffected since the 1940's. Oil field brines
slightly diluted by precipitation, after entering the ground water system
(Figure 4), can eventually be discharged into nearby streams. Flemal
(1978) has reported that Illinois surface waters in areas of petroleum
production may be receiving significant amounts of ground water brines.
12

1'11'1
Figure4.--Generalizedmovementofwaterinthevicinityofholdingponds(fromReed,1978).
Holdingpond
U

In addition to raising the concentrations of many chemical
constituents of local ground water far above the maximum contaminant
levels set by the IPCB, many of the brine holding ponds in central and
southern Illinois are responsible for vegetation kills covering a limited
area generally of a few acres or less. These vegetative kills are
discernable from the ground and from aerial photographs, as can be seen
in Plates 1 through 5 of the four study sites, shown on the following
pages.
Brine-polluted ground water may eventually infiltrate public or
private water supplies, or percolate to the surface. Water supplies for
farms and dairy operations can become saline, leaving cattle and a family
without potable water. This was the case for a Clinton County dairy
farmer and his family in 1976, when highly mineralized waters infiltrated
his local ground water supply (Case I - Appendix B).
Productive farm land can be left completely unvegetated as can be
seen at a site in south central Bond County. In this case a field
adjacent to a brine pit was left void of vegetation after saline ground
water percolated to the surface (Case II, Appendix B).
Property values can drop as a result of threatened ground water
contamination. This occurred in 1977 at a housing development located
near a brine pit in Rochester, Illinois, after elevated chloride
concentrations were found in the surrounding ground water (Case III,
Appendix B). These are just a few examples of environmental degradation
through brine pollution that have occurred in Illinois over recent years.
14

'i
'*1
i
Plate
1.--Christian
County
Study
Site

Plate
2.--Bond
County
Study
Site

I1
Pla
te3
.--E
ffin
gh
am
-Fa
yett
eC
ount
yS
tud
yS
ite

0)•u•H
CO
>1
•u
co
>>4J
a9
to.-Io
I
0)•U
CD
Hp4

\'-»
*0
Plate
5.--Clay
County
StudySite
(indicated
byarrow)

However, even though these cases have occurred in close proximity to
active oil field brine disposal operations, lack of acceptable legal
evidence has left land owners without means to secure compensation for
damages incurred.
One of the important characteristics of brine pollution often
overlooked until the damage has been done, is that the pollution cannot
be readily reversed by merely eliminating the existing source. In ground
water, brine pollution may persist for decades and travel several miles
from its point of origin before it is appreciably diluted.
20
i
1%®
'9
r^&
i
•i

FIELD INVESTIGATIONS
During the course of this study, considerable time was spent in the
field by Agency and ISGS personnel. This section outlines the field
studies and observations completed to date.
Criteria
During initial reconnaissance trips completed in May of 1978, the
following criteria for selection of sites for studying environmental
problems associated with oil field brine disposal, particularly unliried
pits, were developed.
1. The sites should be geographically distributed across the oil
producing region of the state and be in "representative" geologic
environments.
2. The site should have relatively uniform geology which can be readily
determined.
3. The site should have simple hydrogeology, preferably with one main
water transmission zone.
4. The site should be sufficiently isolated from other sources of
chloride contamination, including other brine ponds.
21

5. Brine disposal facilities at the site should have been in operation
for a sufficient length of time (at least 10 years) so that salt
water has had a chance, to migrate away from the site.
6. The site and observation wells should be accessible for a period of
one year, if possible, to provide a sufficient number of samples on
which to base the final conclusions.
7. The layout of the site should be such that the observation wells can
be located with a minimum of interference with existing property uses.
8. The site should have as few pipes and other metallic objects as
possible, to preclude possible interference with resistivity
measurements.
9. The land owner, tenant, and lessee of the site should be cooperative
with project staff.
10. There should be no litigation or regulatory action ongoing or pending
at the sites proposed for study.
Location and Study of Sites
Based on the criteria above and on the field reconnaissance work,
four sites were selected for resistivity surveys, test drilling,
22

piezometer construction, and earth material and water sampling. The
sites are located at active oil fields in Bond, Christian, Clay, and
Effingham-Fayette Counties, as illustrated in Figure 5.
Lithologies encountered at the four study sites were quite similar.
Three of the sites, Christian, Bond, and Effingham-Fayette Counties,
possessed relatively thin deposits (1-6 ft.) of Wisconsinan loess
immediately underlain by deposits of Illinoisan till, primarily of the
Hagarstown member of the Glasford formation. The Hagarstown is basically
comprised of four types of compact to noncompact sediments — gravelly
till, poorly sorted gravel, well sorted gravel, and sand and silt often
intermixed with blocks of underlying till (Jacobs and Lineback, 1969).
In most cases, the holding ponds constructed over the Hagarstown till,
which covers a large portion of the oil producing area of the state
(Figure 6), are excavated within 5 to 20 feet of aquifer materials
consisting chiefly of sand and silt with minor amounts of gravel (Reed,
1978). Since the study sites are fairly uniform lithologically, the
principal control mechanisms for chloride migration appear to be dilution
from rainfall and ground water and the gradient and direction of ground
water flow (Reed, 1978), as well as the static pressure differential
between water table level and pit level.
Investigative Procedures
Investigative procedures at each site began with an electrical earth
resistivity (EER) survey of the entire study area. With the EER method,
23

MlOCK ISLAND
MERCER
^JO DAVIESS |sTEPHENSOn'jwiNNEBABO (BOONE I MC HENRY JLAKE
I ' I
.J.„1_1_M J_TOEKALB J KANE J COOK
I JouIagT)
fr"—! l i iI L——••-—i s\ J IKENDALL IWILL p.^
CARBOLL .Q6LE
'WHITESIDE
r./HENRY I BUREAU
LA SALLE
BRUNDY
i
I—, rJ"~| STARKl jPUTNAM !
[ 'MARSHALL | [Lm«
nJ KANKAKEE
KNOX
WARRENLIVINGSTON |
KENOERSON
HANCOCK
L._J j-,PEORIA J L_-|
WOODFORD |
MC LEAN
/Tazewell! _H
IROQUOIS
'ism. jfoiTON I /Tl«wELLirJ.rJ L_ I i; Imc oonoubh I \Js~"J I r0"0 I
• I / I ' TvERMlLlON~I s~~ ~"1 ' ' _ __ -1I / M*80Nj I [CHAMPAIGN i
(sThuyTeT-1 / "~p~^-j^-- y-\ j
I 1 7CASS j pMACON
Aim fAK8AM0N X1 7-L_ \ ^\ J„tu
11 'SCOTT I I ^ IcHRISTIANl | | .—j\ 1 \ r • ^feHETBYL W'S '
JMACOUP.N—j -J j -\^ jij
./
_PIATTKOULTRIE
rGREENE MACOUPIN
r-H\JERSEY
I I iMONTGOMERY
I —- j CUMtttniMnu •
HTyE-TTE ^"'Nl^-pTsPER- |CMW"0RT! • i i
rsriiia '-rrr°M° nl I I II'' ^-TCUY II , *—]BicHlANOTlAWRENCE' [MARION I ' I
*r-JLJ | ^ •IMTUlCV I i — j I
\ rWASHINGTONKONROE \
i—i—-L-r—--I RANDOLPH PERRY
I
JEFFERSON
WABASI
| HAMILTON WHj|E
Figure 5.--Location Map ofStudy Sites /JACKSON
yFRAlKUN s~|
L__ — -jsaune" jBAUATIN1(WILLIAMSON | ; J
i ! !
D Present study 1978
l|t Previous study 1975-77
Oil Field
^ ^"jOHiisnrTToPE IHARTlUNION {JOHNSON
I I
handebJ ^"ImassacS, (rpuusKi-C. s >
(ALEXANDEj\
I.

II '—1 , '—I '—1
Figure 6.—Generalized Location of the Hagarstown Member of the Glasford Formation

adirect, commutated or low frequency alternating current is introduced
into the ground by means of two source electrodes (metal stakes)
connected to a portable power source. By mapping the resulting potential
distribution created on the ground surface using two potential probes
(non-polarizable electrodes), the electrical resistivity below the
surface may be ascertained. By using the Wenner electrode configuration
(Figure 7), in which the four electrodes are spaced equally along a
straight line, the apparent resistivity can be calculated as 2ir (u =
3.14) times the electrodes spacing times the recorded resistance.
This method has been used primarily in searching for water-bearing
formations and in prospecting for conductive ore-bodies. EER studies
have also been used to monitor the deterioration of water quality and the
extent of leachate migration near landfills (Cartwright and Sherman,
1972). Success of the EER method in the applications mentioned above is
due to the fact that apparent resistivity is partially controlled by the
presence and quality of subsurface water. This same technique can be
applied to the migration of oil field brine. The presence of highly
conductive brine in the ground water is readily apparent as a depression
of the normal resistivity values. The decrease in resistivity with
increasing water salinity is shown in Figure 8, adopted from Guyod
(1952). The greatest change in resistance occurs at the lower salinity
end of the curve from 15,000 parts per million (ppm) downward. Although
previous electrical earth resistivity studies conducted by the Illinois
State Geological Survey have clearly related differences in subsurface
resistivity measurements to the migration of oil field brine, no detailed
26

current
electrode
1 '—I
potential i,electrode
^
/ I \ >•/
//
1 v <L-- \ *»v
T \ \/' \
\ \ /
A ^iV. :-A\\ \ '
\\ •s.
.'\/ \
/
-V
\\
\\
\\
Figure 7.—Electrode Spacing for Measuring Electrical EarthResistivity Using a Wenner Configuration.
1. . ' %
lines of current flow
equipotential lines
current
electrode

IOO'
t/>
LX
UJ*-°h-
lJ
2»
2I6O
6
4..
ZOo,oao
J*
SALINITY(PPM)
Figure8.—Relationshipofresistanceandconnatewatersalinity(fromGuyod,1952).
J*JI

fF^
investigation of subsurface water quality, lithology, and surface
electrical measurements had been made in the state prior to this study.
Case histories of four sites previously studied in Clinton, Sangamon and
White Counties are included in Appendix B. The exact locations of these
sites in relationship to the current study sites are illustrated in
Figure 5.
Apparent resistivity values obtained from the EER surveys were
plotted and contoured for various electrode spacings. This spatial
variation provides control over the depth of observation. In general, an
apparent resistivity value obtained from an electrode spacing of X feet
can be thought of as the apparent resistivity of the subsurface materials
to a depth of X feet. However, the actual apparent resistivities of
materials beneath a highly conductive layer may be masked. A comparison
of surface resistivities and resistivity measurements made on drill core
samples indicates this is clearly the case at the four study sites. At
these sites, surface resistivity surveys suggest the presence of enlarged
areas of reduced resistivity in a compact gracial till below a depth of
approximately 20 feet. Low resistivities in this zone was not expected
due to the impermeable nature of the material, and was discounted, after
looking at core resistivities, as being caused by a masking effect of the
overlying contaminated aquifer material. Contour maps for each site of
the apparent resistivities obtained from electrode spacings of 5, 10, 15,
and 20 feet are included in Appendices C through F.
The next step in the investigation was to locate and emplace a
piezometer network. This was done by using the EER contour maps.
Piezometers at each site were located so as to provide a spatial as well
as an electrical resistance dispersion across the study areas.
29

Once located, the bore holes were augered with a portable drill rig
provided by the ISGS, and split spoon samples of the earth materials were
taken generally every five feet. To provide additional information on
the permeability of the material and the degree of contamination of the
interstitial fluids, both the number of blows required to obtain the
sample and its apparent resistivity were recorded. After penetrating to
an impermeable zone, usually a cobbly till, a gamma ray probe was lowered
through the augers to verify the position of water-bearing earth
materials. After making this determination, a plastic casing slotted
opposite the most permeable zone was lowered into the bore hole. Upon
retraction of the augers, the bore hole was gravel-packed, bentonite
sealed and back-filled.
The measurement of static water levels and water sampling began after
emplacement of the 23 piezometers at the four sites. Initially two sets
of water samples were taken at semimonthly intervals to provide the data
for this report. Sampling is now scheduled to continue at monthly
intervals through July 1, 1979. From the laboratory analyses, average
concentrations of the major constituents of water samples from each
piezometer and study pit are reported in Table III.
30

Table III. Average Concentrations of the Major ChemicalConstituents From Each Piezometer and Pit.
Chloride Sodium Calcium Sulfate Potassium Magnesium
v^T
ppm ppm ppm ppm ppm ppm
-
R-Pit 14,500 11,000 370 103 25 310
^f R-lA 76.5 200 150 104 3.0 57
R-3B 19,750 1,250 1,000 91 7.4 585
R-16 3,900 1,900 645 65 6.6 280
R-26 95 190 50 1.5 .9 20"W\
R-28A 22,000 14,500 800 97 11.7 505
R-32 75 100 133 53 1.2 45• R-43 27 78 303 29 .6 134
sn R-US 290 170 50 43 7.0 17
R-DS 14,500 10,000 510 82 8.8 310
^j M-PIT 10,812 7,200 540 121 22 212
M-1B 30,500 15,000 3,500 355 45 760
M-22 83 40 50 56 .6 42
M-31 2,650 1,850 265 72 2.2 105pi
M-33 335 372 145 73 1.2 46
M-35 35 43 82 63 1.8 37
w\ H-PIT 24,000 16,000 1,400 725 52 470
H-3 10,000 350 550 67 2.3 250
H-ll 2,850 925 1,320 29 4.5 605
PIH-21 20 53 93 27 1.0 38
G5A 1,400 895 525 32 4.3 230G19A 188 162 186 54 2.6 71
PJ" G25A 126 230 94 29 13.3 45
G32 26,250 14,250 2,550 60 3.0 1,200
-
G32A 4,850 1,950 1,550 13 12.0 830
By applying a least squares line fit to the chloride concentration
and apparent resistivity data plotted on coordinate semi-log graph paper,
correlation coefficients (r) of -.76 (Figure 9) for filtered samples and
-.72 (Figure 10) for unfiltered samples were obtained (Reed, 1978). This
result is in general agreement with Cartwright and Sherman (1972), and
signifies that EER surveys can provide a reliable, convenient technique
31

c
o
£ £
Isv» JC
'5 o
aa.
3CO
100 1000
• Bond Co.
• Christian Co.
• Clay Co.
+ Effingham Co.-Fayette Co.
10.000
Chloride concentration, mg/1
Figure 9.--Relationship of apparent resistivity and filtered chloride concentration.(from Reed, 1978).
_J
28A
100.000

1—1
T3C
:l iin O
3CO
10.000
Chloride concentration, mg/l
Figure ia— Relationship of apparent resistivity and unfiltered chloride concentrations(from Reed, 1978).
100.000

for determining the extent of subsurface oil field brine migration.
Approximate chloride concentrations can also be estimated from the
graphed relationship (Figures 9 and 10), given EER readings at other
locations. However, since the sites in this study were confined to areas
covered by the Hagarstown or similar till, additional research should be
completed before making estimates of chloride concentrations in
dissimilar lithologies. It is expected that further refinement of this
relationship will allow chloride concentrations to be approximated with
an even greater degree of accuracy and confidence in all lithologies
across the state.
Field Conditions
Following is an assessment of the field conditions observed by
project staff during the course of the study and a description of the
three major sources of brine pollution in Illinois oil fields.
Evaporation/Seepage Pits
Evaporation pits were introduced in Illinois from the southwestern
oil producing states, and rely solely or in part on evaporation for the
removal of water vapor. These pits are used as ultimate disposal
facilities or storage facilities pending underground injection.
However, the relatively humid climate of Illinois allows little or no net
evaporation throughout the year. Evaporation rates for fresh water
34

illustrated in Figure 11 would be significantly lower for brines due to
the presence of dissolved solids and oil film (Reid et al., 1974). This
suggests that evaporation pits in Illinois are capable of disposing of
only small volumes of brine and are totally inadequate to handle the
brine disposal requirements of a producing well.
The Department of Mines and Minerals is currently in the process of
phasing out the old unlined evaporation.pits. Also, new evaporation pits
are currently required to be lined with impervious material (for example,
plastic, concrete or fiberglass) to guard against subsurface seepage of
brine, whereas clay was prescribed as the lining material prior to 1973.
The fact that these liners are not indestructable and do have a limited
life expectancy indicates that, although the possibility of seepage may
be reduced by the use of liners it is by no means eliminated.
During the initial field investigations, it was noted that the fluid
levels in at least 80 percent of the estimated 200 pits inspected were
being maintained above surrounding ground level. Pits displaying
breached walls were also noted. In a few instances, even though the pit
was perilously close to overflowing or was in fact flowing over its
banks, brine input continued at a substantial rate, i.e., 5-15 gallons
per minute (Plate 6).
Other brine related problems noted in the field included remnant
scars from pits which had drained into nearby streams or across open land
rendering it void of vegetation (Plates 7 and 8). A few of the pits
exhibit darkened halos around their peripheries indicating seepage from
within. These improperly constructed or maintained pits allow brines to
35

CO m
CMoin
moo
U i 1 1 IcH o in o m
CN in r-
00
o>
&Bon
CO
0>
c o
•H 4J
S *•H cj
CD wi
O aa. aCtJ 3> c
W -r4
X, E<u2:
do
g
ii
a)n

•-••'.
»«
•-.
«r
:.'
""%
?..'••
:"i
'•-'
;r:
.
'Kr
'*"•'
>^f
c
Pla
te6
.--B
rin
eP
it
Ov
erf
low

Plate
7.--Stream
Pollution
from
Brine
Runoff
IJ
JI
1—I
I1
^

Plate
8.--Vegetation
Kill
from
Brine
Runoff
(arrowindicates
locationof
pit)
I.

seep into underlying soils and eventually migrate into ground water
reservoirs. Once absorbed into the ground water system, the brines
(particularly chlorides) can travel several miles due to their resistance
against absorption into the aquifer material.
Injection Operations
Salt water disposal (SWD) and waterflood wells are used throughout
the oil producing portion of the state. These types of disposal and
secondary recovery operations are gaining greater acceptance from both
land owners and well operators. This growing acceptance is greatly due,
from the land owner's standpoint, to the elimination or reduction in the
need for surface pits. With a waterflood or SWD system, brines can be
stored in corrosion-resistant holding tanks or directly injected from the
brine/oil separating unit. Another advantage of the waterflood operation
is that the injected fluid acts to repressurize and flush through the
producing formation, hence increasing the rate of oil production.
However, both waterflood and SWD operations may pose a threat to ground
water supplies if meticulous maintenance practices are. not followed.
Many of the newer injection wells utilize a device referred to as a
"tubing and packer." This device consists of a small casing or tubing
which is inserted into the main casing and set or packed in place
immediately above the injection formation. Several types of injection
installations are illustrated in Figure 12. In addition to providing the
advantage of allowing replacement of the tubing in case of failure,
40

fii
IPl
sn
w\
Ff!ff|
M
open casing open tubing
Injection Zone
A. Injection down casing B. Injection down tubing,cement-filled annulus
C.
cementcement
•? -fluid-filled
open casing«
Injection Zone
Injection down casing,cemented casing
D. Injection down tubing,fluid-filled annulus
Figure 12.--Tubing and Packer Injection Installations

Injection through tubing also provides added protection to resources
outside the borehole (Warner, 1977). Although all of the tubing and
packer installations provide this protection initially, continued use
over long periods of time may result in corrosion and eventual casing
failure which can contaminate surrounding ground water. Only an
injection system.which allows annulus pressure monitoring, such as one
with a fluid-filled annulus (Figure 12-D) provides the capability of
detecting such a failure by indicating change in annulus fluid pressure.
With this type of system, continued weekly monitoring of the annulus
fluid pressure would reveal a failed system before a substantial volume
of ground water could be contaminated.
Many of the disposal wells presently in use may be inadequately
designed or constructed to facilitate the safe injection of saline
waters. In the past, abandoned production wells, subject to pressure
check, could be converted to SWD or waterflood wells without installing
tubing and packers. Often the casing in an old well has deteriorated
from years of exposure to corrosive formation fluids. Although such a
casing may withstand an initial pressure check, its subsequent life
expectancy could be substantially shortened. When failure does occur, •
chloride solutions can be expelled at injection pressure into the
ad.iacent strata, as illustrated in Figure 13. Due to the relatively slow
rate of migration and to the fact that salt water injection wells are not
frequently monitored for unexpected injection pressure changes, large
volumes of ground water can be polluted before casing breaks are
discovered.
42

'—1
BRINE-DISPOSALWELL
Land
WATER-SUPPLYWELL
Surface
Figure1a.--PollutionofaFreshWaterAquiferThroughaFailedInjectionCasing
WATER-SUPPlWELL

Abandoned Wells
In old production areas, abandoned wells may pose a serious threat to
ground water quality. Unplugged or improperly plugged wells provide
possible vertical communication between saline and fresh water aquifers.
An increase in formation pressure due to secondary recovery operations
can supply the hydraulic pressure required to transfer the saline fluids
from depth to an elevation adjacent to a fresh water aquifer, via an
abandoned casing (Figure 14). Once this situation is established, the
corrosion process and the failure of the casing are hastened.
During the relatively limited field reconnaissance, a few unplugged,
uncapped and improperly plugged wells were noted. In addition to these,
the records of the Illinois Department of Mines and Minerals indicate
that there are thousands of plugged wells within the state. Many of
these wells were plugged prior to the 1940's before plugging records and
specifications were developed, and may not have retained the integrity
necessary to restrict vertical migration of highly saline waters.
Ultimately, the migration of saline waters through these casings could
lead to the degradation of otherwise potable ground water resources.
44

BRINE-DISPOSALWELL
IA
~1 1, .r
ABANDONED WELLSI I
WITH CASING NO CASINGB C
WATER-SUPPLYWELL
ID
Casing rusted; failure orabsence of cement
Figure 14.—Pollution of a Fresh Water Aquifer Through Abandoned Welis(from Newport, 1977)
WATER-SUPPLYWELL
I
E

PRELIMINARY FINDINGS
1. During field investigations, ground water contamination at four study
sites was found to be more extensive than the damage visible at the
surface. This indicated substantial seepage from beneath the four
brine holding ponds.
2. Analysis of stream samples obtained at a study site in Bond County
exhibited high chloride concentrations. This was most likely due to
highly saline waters seeping from beneath a nearby brine holding
pond, into the aquifer which serves as a recharge source for the
stream. Chloride concentrations recorded 200 feet downstream from
the pond (i.e, 14,500 ppm, a value far greater than the maximum
contaminant level of 500 ppm set by the Illinois Pollution Control
Board) were equivalent to those recorded within the pond. This
situation indicates the impact of improperly handled brines on water
quality.
3. A correlation coefficient (r) of -.76 was found between ground water
quality data (chloride concentrations) and surface electrical earth
resistivity measurements obtained at each site. This degree of
correlation suggests that EER surveys can be used as a valid method
in studying subsurface migration of oil field brines.
46

4. From field observations, it was noted that a larger incidence of
brine related pollution appeared to emanate from older facilities.
This is probably due in part to advanced stages of corrosion of well
casings, and increased brine/oil ratios.
5. Taking into account the damaging effects of brine pollution and the
volume of salt water disposed of daily, it is evident that strict
enforcement of existing regulatory guidelines for the disposal of oil
field brines is essential for the protection of currently utilized
and potential ground water sources.
47

PRELIMINARY RECOMMENDATIONS
1. The Department of Mines and Minerals and the Illinois EPA should
investigate a means to accelerate the program, initiated in 1973, for
eliminating unlined brine pits. A target date with annual goals
should be established for phasing out the estimated 4,000 remaining
brine pits in Illinois.
2. All injection wells should be constructed with an annulus that can be
pressure-monitored. The pressure on such an annulus should be
monitored weekly to insure early detection of any failures in the
system. This construction and recording requirement should be
considered by the Illinois EPA in its review of the pending federal
underground injection control program developed under provisions of
the Safe Drinking Water Act.
3. Illinois EPA should continue geophysical and water quality testing to
better assess the surface and subsurface impacts of brine pollution
across the state. In addition to assessing the extent of pollution,
investigations into feasible means of rehabilitating chloride
contaminated aquifers and soils should be made through proposals for
federal funding from the USEPA.
4. A detailed professional legal assessment should be made by the
Illinois EPA of all current and proposed regulatory programs
pertaining to the disposal of oil field brine.
48

GLOSSARY
Annulus: The space between the tubing casing and the long string oroutside casing.
Anticlinal Belt: A series of folds in the underlying geology that areconvex upward or had such an attitude at some stage of development.
Apparent Resistivity: The resistance of rock or sediment to anelectrical current per unit volume as measured by a series of currentand voltage electrodes on the surface of the earth. It is equivalentto the actual resistivity if the material is truly uniform.
Aquifer: A porous, permeable, water-bearing geologic body of rock orsediment, generally restricted to materials capable of yielding anappreciable amount of water.
Back-filled: The refilling of an augered hole with earth material afteremplacement of the casing.
Bentonite Sealed: The sealing of the permeable reservoir from theback-fill material by covering the reservoir with a water absorbingclay material, bentonite.
Cations: An ion that bears a positive charge.
Correlation Coefficient: A dependency or association factor between twoparameters. Coefficients range from -1 to 1 with the mid-point 0indicating a total lack of correlation.
Corrositivity: The ability to deteriorate or destruct substance ormaterial by chemical action.
Formation: A uniform body of rock; it is most often tabular and ismappable on the earth's surface or traceable in the subsurface.
Gamma Log: A graph of the natural radioactivity of rocks obtained bylowering a gamma ray probe into a bore hole.
Gamma Ray Probe: (Geiger-Mueller) A probe or counter capable ofmeasuring the intensity of radioactivity in the surrounding rock.
Gradient: (Hydrological) Slope of the regional water table.
Gravel-Packed: Placement of gravel around the open portion of a casingto provide a permeable reservoir for inflowing waters.
Ground Water Pollution: (As defined for this report.) The elevation ofcnemicai constituent concentrations (primarily chlorides) above thoseexisting naturally in the regional ground water.
49

Hydrofracing: Process of increasing the permeability of rock near a wellby pumping in water and sand under high pressure.
Hydroqeology: The study of ground water movements in the underlyinggeology.
Illinois Basin: The structural basin in southeast central Illinois inwhich the rocks dip generally toward a central point.
Interstitial: That which exists within an opening of space in a rock orsoil that is not occupied by solid matter.
Leachate: A solution obtained by leaching, as in the extraction ofsoluble substances by the downward percolation of rain water throughsoil or solid waste.
Lithologies: The physical characteristics of rocks such as color,structures, mineralogic composition, and grain size.
Loess: A uniform, nonlayered deposit of silt, fine sand and/or clay.
Permeable: Having a texture that permits water to move through it.
Piezometer: A casing providing access to the static water level in anaquifer, and through which ground water samples may be extraced.
Potential Distribution: The resulting dispersion of an electricalcurrent artifically introduced into the ground.
Reef Deposits: A mound-like or layered rock structure initially built byorganisms such as corals and subsequently buried by sediment.
Till: Nonsorted, nonlayered sediment carried or deposited by a glacier.
Water Transmission Zone: A zone of material below the surface of theearth capable of transmitting water.
Waterfloods: The secondary recovery operation in which water isinjected into a petroleum reservoir for the purpose of increasing oilproduction.
50

IP)
REFERENCES
1. Bell, A. H., 1957, Brine Disposal in Illinois Oil Fields: IllinoisState Geological Survey, Circular 244.
2. Cartwright, K., Sherman, F. B., Jr., 1972, Electrical EarthResistivity Surveying in Landfill Investigations: Illinois StateGeological Survey Reprint Series 1972 U, Reprinted from Proceedingsof the 10th Annual Engineering and Soils Engineering Symposium,Moscow, Idaho, 16 p.
3. Department of Mines and Minerals, Division of Oil and Gas, 1977, AnAct in Relation to Oil, Gas, Coal and Other Suirface and UndergroundResources, Revised Edition.
4. Department of Mines and Minerals, 1976, Annual Coal, Oil, and GasReport.
5. Flemal, R. C., 1978, Preliminary Evaluation of the Impact of SalineGroundwater Brines on the Quality of Illinois Surface Waters,Illinois Water Information System Group.
6. Graf, D. L., Meents, W. F. Friedman, I., Shimp, N. F., 1966, TheOrigin of Saline Formation Waters, III: Calcium Chloride Waters:Illinois Geological Survey Circular 397.
7. Guyod, H., 1952, Electrical Well Logging Fundamentals: Houston,Texas, Reprinted from Oil Weekly and other magazines, 164 p.
8. Illinois Pollution Control Board Rules and Regulations, 1977, Chapter3: Water Pollution.
9. Jacobs, A. M., Linebach, J. A., 1969, Glacial Geology of the VandaliaRegion: Illinois Geological Survey, Circular 442, 23 p.
10. Mast, R. F., 1970, Size, Development, and Properties of Illinois OilFields: Illinois Petroleum 93, Illinois State Geological Survey,Urbana, Illinois 61801.
11. Meents, W. F., Bell, A. H., Rees, 0. W., Tilbury, W. G., 1952,Illinois Oil-Field Brines Their Geologic Occurrence and ChemicalComposition: Illinois Petroleum 66 Illinois State Geological Survey,Urbana, Illinois.
12. Newport, B. D., 1977, Salt Water Intrusion in the United States:Environmental Protection Agency Research Paper, EPA-600/8-77-011.
13. Parasnis, D. S., 1972, Principles of Applied Geophysics, Chapman andHall, London.
14. Reed, P. C., 1978, Results of Electrical Resistivity Surveys NearBrine Holding Ponds in Illinois: Unpublished.
51

15. Reid, G. W.t Streebin, L. E., Canter, L. W. Smith. J. R., 1974, BrineDisposal Treatment Practices Relating to the 011 ProductionIndustry: Environmental Protection Technology SeriesEPA-660/2-74-037, May, 1974.
16. Roberts, W. J., Stall, J. B., 1967, Lake Evaporation in Illinois:Illinois State Water Survey Report of Investigations 57, 44 p.
17. Van Den Berg, J., Lawry, T. F., 1977, Petroleum Industry in Illinois,1976: Illinois Petroleum 112, Illinois State Geological Survey,Urbana, Illinois 61801.
18. Warner, D. L., 1977, An Introduction to the Technology of Subsurface mWastewater Injection: Environmental Protection Technology SeriesEPA-600/2-77-240.
DP:sh/sp/5367/l-37
52
1
n.

IP"!
r
Problem Report Form
V
pi
ipi
!l:«
(pi
IP!
APPENDIX A

Illinois Environmental Protection Agency
"208" CLEAN WATER MANAGEMENT PLANNING PROGRAM
OIL FIELD BRINE DISPOSAL PROBLEM REPORT
PLEASE READ
Because of reports from concerned citizens like yourself, the IllinoisEnvironmental Protection Agency is conducting a detailed study of waterpollution problems associated with oil field brine disposal in your areaof the state.
The purposes of this study are to determine how existing brine disposalproblems can be solved most effectively, and how we can better ensurethat no additional problems are created in the future.
In order to help us, please take a minute or two and fill out theattached Problem Report. It asks only for basic information to assist usin becoming familiar with problems you may know about.
If you wish to be kept informed of the progress of this study or wouldlike to talk with us directly, please fill in your name and address.THIS PROBLEM REPORT IS NOT AN OFFICIAL COMPLAINT OR OTHER LEGAL DOCUMENTAND CANNOT BE USED IN ENFORCEMENT PROCEEDINGS.
The ILLINOIS DEPARTMENT OF MINES AND MINERALS, Oil and Gas Division, isresponsible for investigating public complaints concerning oil fieldbrine disposal. If you wish to file an official complaint, you shouldcontact: Mr. George Lane; Oil and Gas Division, Illinois Department ofMines and Minerals, 704 Stratton State Office Building, 400 South SpringStreet, Springfield, Illinois 62706, Phone (217) 782-7756.
Please return the completed form to the person named below. Feel free tocontact him if you have any questions about this study:
Donald R. OsbyIllinois Environmental Protection AgencyPlanning and Standards Section ^Division of Water Pollution Control2200 Churchill RoadSpringfield, Illinois 62706Phone (217)782-3362
You may tear off this sheet and keep if for reference.Thank you for your participation.
D0:bl/2111/8
2200 Churchill Road, Springfield, Illinois 62706
54
ra

Date:
"208" CLEAN WATER MANAGEMENT PLANNING PROGRAM
OIL FIELD BRINE DISPOSAL PROBLEM REPORT
Meeting Place (Town):
I. GENERAL INFORMATION
Citizen Name and Address:
Well Operator or Lessee Name and Address, if known
This individual is: well operator lessee (check one).
Well Location:
County: Township_
Range
Section
(If possible, locate well on the county map.)
55
(if known)
(if known)
(if known)

II. BRINE PROBLEM INFORMATION
Well Operation:
Is the well presently producing oil? Yes No
If not, how long has the well been out of production?
Disposal System:
What, type of brine disposal system if being used?
^Evaporation ponds Injection wells Other
(specify)
Pollution Affects:
What are the affects of the brine pollution?
Damage to vegetation Contamination of water supply
Other (specify)
Problem:
What is the nature of the problem:
Leaking pond Broken pipe Faulty firewall
Other (specify)
56

When was the problem first noted?
Has anyone been notified of the problem? Yes No
If so, whom and when?
Have any actions been taken? Yes No
If so, by whom and what actions?
57

ig&t
APPENDIX B
(^i Selected Samples ofPreviously Completed E.E.R. Studies
(IP!
r.
IP*!
(pi
ipi
L•
r-
r
r 58

STATE OF ILLINOIS
DEPARTMENT OFREGISTRATION ANDEDUCATION
JOAN 0. AKDMSON
DIRECTOR, tPRINaPieLO
BOARD OF NATURALRESOURCES ANDCONSERVATION
CHUtmm jam c mcersoxSeOLOCT 1AUR0CC L. SUBSOOttSTBY M. S. SUKWSKYociheerinc wear h. Andersonbiology now mncFORESTRY STANLEY K. SKNMROINIVERSITY OF IUINOIS
CON MILLIAN L. CVER1TTSOUTICRN ILLINOIS (MIVBtSITV
OWN JtWC. 6UTDN
ILLINOIS STATE GEOLOGICAL SigVEYNATURAL RESOURCES BUILDING, URBANA. ILLINOIS StSOf TELEPHONE SI7 944-1401
Jack A. Simon, chikf
September 2, 1977
A RECONNAISSANCE ELECIttlCAL EARTH RESISTIVITY SURVEY AT A BRINE DISPOSAL PIT INSECTION 31, r. 4 N., R. 2 W., BOND COUNIY, ILLINOIS
By
Keros Cartwrlght, Geologist and HeadPhilip c. Reed, Assistant GeologistHydrcpeology and Geophysics Section
Introduction
qf.h» nfftAt =h?,I?qUeS^ °f **.' Ce°rge R# Une' Pepartment of Mines and Minerals,•£rt w«Building. Springfield, Illinois, 62706, a reconnaissance electricalearth resistivity survey was made on August 16, 1977, within and adjoining theDwlght Follett lease. Beaver Creek Field, In the NWi Section 31, T. 4 N.. R. 2 WBond County. We were assisted In the fieldy by Mr. Leonard Strum from thebr^lTnL ^"C8 T Mln«als- *• purpose of the study is to determine if thei^w I S °? th\lcase ia leokln8 to the ground-water reservoir and, if it isleaking, to determine the distribution of the salt water wedge. .
Hydrogeolofllc Setting
HH„n«. ,m? ""i1?" llt l8 l0Cated ln a reslon of 8entXy doping terrain of theoJiuw.ll J P J" T6? Cr!fnvllle and Carlyle, Illinois. there are a numberof oil »ell logs from the Immediate area in the Geological Survey files, includingtwo on the Follett lease. Copies of the first page of these logs are attachedUnfortunately, the description of the surflclal material Is very poor and oftencon radlctory the logs do suggest the presence of a sandy or gravelly zone at 10s:ra1t5iSh^1^ort6i:»faCe- ™" <»—"°» Ucontent wither regional
soutb. m*:r^/sis^s: iXrix:" ^-^.v^ rhes ft.tm.hf"8andy;frenyttu£ormin8thep"mi-ntItath™ < 1 r ., . 8 1uarrled £or sand a"d gravel just south of the brine pitaroundM Hf"lc\»a6erstown sequence. On lower flat ground such as that foundaround the brine pit, the Hagerstown Is quite thin and found at depths of 10 to20eet th, clayey Vandalia till underlies the Hagerstown; overlying the Hagersto"
I. • sequence of gleys and silts (loesses). Generally, the Hagerstown and overlain*formation ^.Tl*'*"'* "^^ ^'^ °£ "o11 *m'ai»> ginning with the " ^formation of the Sangamon aoil. continuing through two or more periods of soil eenesl.durlns; the Wisconsinan and culminating with the modern soil formation! The ^Sly™ Sr^aMe!0,,,e "^ '^ a"ocl»te<, »ith <h« °™^»8 Besses are
S9

A generalised observation of the hydrogeology can be made from analysisof the topography of the area near the brine pit. Our observations of the topographyIndicate that if any brine is entering the ground water it would flow north or north-northwest to the small, unnamed stream (a tributary to Beaver Creek) which flowsacross the northwest corner of Section 31. Discharge of ground water would occuralong the creek and possibly in the small drainage swale which transversa, in anortheasterly direction, tho property just north of the pit.
Resistivity Survey
The electrical earth resistivity survey is based on the principle thatuncontaminated, compact glacial till, clay-alluvium and shale present more resistanceto the passage of an electrical cujrent than do sand and gravel, or 6and6tone andlimestone of the bedrock. However, resistance to the passage of electricity throughearth materials is a property of both the rock type and the water contained in itspores. Electrical current introduced in earth material containing water with highconcentration of soluble salts will have a greatly reduced electrical resistance.This relationship has been demonstrated in numerous published papers; it has alsobeen demonstrated that electrical earth resistivity surveying can be used to mapcontaminated ground water (see enqlosure).
Results
During the r.urve> of the pit area, wo made 23 electrical depth Boundingprofiles. Ihe accompanying map, modified from the one made by Clifford H. Simonsonfor Mr. Arnold R. Edwards, shows the approximate location of the resistivitysoundings. Also enclosed are copies of all the depth soundings; no profile could beobtained at station no. 14 because surface conductance prevented penetration of theelectrical field into the ground. In normal, uncontaminated, uniform materials the"a" spacing (taken from the geometry of the Wenner electrode configuration we used)Is approximately equal to the depth of penetration of the electrical field. However,a very conductive layer (very low resistivity) such as a salt water zone, willdisturbe the electrical field, reducing the depth of penetration.
We drew slice naps for all "a" spacing from 10 to 50 feet. All show ther ie relationship; a region of greatly depressed apparent resistivity extendingnorthwestward from the pit to the stream. This region of depressed resistivity isshowa on the accompanying map. Resistivity stations showing normal profiles arenumbers 1, 10, 11, 12, 13, 17, 19 and 23. Station numbers 3, 4, 5, 6, 14, 15, 20and ?1 are strongly effected by highly conductive material. Station numbers 2, 7,B, 9, 16, 18 and 22 are intermediate.
two characteristics of the depth sounding profile taken in the stronglyeffected area are apparent. The first type, best shown at station no. 15, shows adecline in resistivity values from the initial reading at a - 10 feet. This suggeststhat the surface soils do not have significant accumulations of electrolites.Stations showing this characteristic, numbers 3, 4, 5, 6, 9 and 15, are all in soilwith good crop vegetative cover (except number 15 which is a grassy part of thefallow field).
60

the second type of depth sounding profile is illustrated at station no. 14where no reading could be obtained because of the accumulation of electrolites atthe surface. Several attempts were made to obtain depth sounding in the unvegetatedarea between stations 14 and 16, but none could be obtained. Station no. 16 showsa similar low surface resistivity but the decrease is much less severe.
Discussion
The electrical earth resistivity data appears to verify the hydrogeologicevaluation based on topographic analysis and the regional geologic interpretations.flit9 data shows that an electrolite, almost certainly salt water brine from the pit,is entering the ground-water system and moving northwestward toward the small creek.The brine would move downward from the pit and then laterally in the permeableHagerstown beds. tfiis is consistent with our interpretation of the resistivitydata illustrated by the type of depth sounding profile at station no. 15, etc. inthe lower unvegetated areas along the drainage swale and at the creek there wouldbe an upward ground-water gradient bringing salts to the surface. This interpretation 1Is supported by the electrical earth resistivity data around stations 14 to 16. '
To travel from the pit to the creek, a distance of approximately 1500 feet,in 35 years,the water would have to be moving in a zone more permeable than normalclayey till. The sandy lingerstown beds could provide such a zone of ground-watermovement.
In summary, the electrical earth resistivity survey strongly suggeststhe presence of a wedge of salt water extending from the brine pit on the Follettlease northwest to the creek where the vegetation kill has occurred. This is ^consistent with the geology of the area and the generalized interpretation of thehydrogeology based on observations of the topographic relationships.
61
rs
i

r
r
AN ELECTRICAL EARTH RESISTIVITY SURVEY
AT THE BEAVER CREEK OIL FIELD
SECTION 31, T. 4 N., R. 2 W., BOND COUNTY, ILLINOIS
August 1977 Cartwright, Reed
Hydrogeology and Geophysics Section
Illinois State Geological Survey, Urbana, IL
62
Soil Sampling Sitewith Number
(After Simonson, 1977)
Resistivity Stationwith Number
Ji JO

"Alt wr ILLINOIS
DEPARTMENT OFREGISTRATION ANDEDUCATION . £§ f « * f ~ ~joan a. andiuon P £ <ann^Hic^wsBrfrssgaM^si P'U..«eT.pJ..pWIWIBlJ, /a rrn?iUSSS.^S&. iSi
BOARD OF NATURAL |^TTrr^^^^-»w«*"^^-r^iSwRESOURCES AND U'ktffl'nfariCLV^roXTCtgpYCTlTltE^rmfclTWconservation f*ri>i^-.^fcli1.h^teWt.»^.^iBfci.^TiTb»€g=ai>.yr>.i
~r*'£*N •»*< c. *coeo<savccr uuwa l, suss°€*,JTW H.S. CUIQACY^.'S*1* ROBOT K.*OKn*ICUCT 1KMS WWK'WESTKT 5TMUT K. SHA^IK)
xwxm iixiKMs uovotsmtWNJOn c oaim
ILLINOIS STATE GEOLOGICAL SURVEYIMIVOBITT or'imNOii " *"~ 3™"'° NATURAL. RESOURCES BUILDING. URBANA. ILLINOIS 61801 TELEPHONE 217 344.1401
OUH MU.U* U CVDUTT
Jock A. Simon, CHicr
December 14, 1977
A RECONNAISSANCE ELECTRICAL EARTH RESISTIVITY SURVEY ON THE CHARLES VONDER HAARFARM, SECTIONS 8 AND 17, T. 3 N., R. 2 W., CLINTON COUNTY, ILLINOIS
By
Philip C. Reed, Assistant GeologistKeros Cartwright, Geologist and HeadHydrogeology and Geophysics Section
At.the request of Mr. George R. Lane, Department of Mines and Minerals,State Office Building, Springfield, Illinois, 62706, a reconnaissance electricalearth.resistivity survey was made on November 3, 1977, on the Charles Vonder HaarDairy Farm situated .near the Keyesport Oil Field in the SWJ< Section 8 and the NF>*Section 17, T. 3 N., R. 2 W., Clinton County, Illinois. Assisting in the fieldwork were Mr. Leonard Sturm, 312 Wesf Commerce, Grayville, Illinois, 62844, fromthe Department of Mines and Minerals and Mr. Charles Vonder Haar, R. R. #1, Carlyle,Illinois, 62231. A separate request-by Mr. Charles E. Fisher, Jr., Oil Producer,Box 369, Mt. Carmel, Illinois, 62836, was received on November 14, 1977. Information on the location of abandoned oil wells and oil tests, producing and injectionwells, and cultural features at and near the'farm was furnished by" Mr. Fisher. Thepurpose of the study was to determine the distribution of the salt water withinthe ground-water reservoir or aquifer utilized at the farm for water supply andif possible, to determine the origin of the salty water so that the water qualityin the aquifer can be restored to the original condition. During the study, particular emphasis was made to resolve the question of whether the presence of saltywater in the Vonder Haar farm well is related to disposal of brines by reinjectioninto the oil producing horizon.
Hydrogeologic Setting
The Vonder Haar farm is located at the northernmost part of the KeyesportOil Field in a region of kame and esker-like hills on the Illinoian till plainwest of the Carlyle Reservoir. A hill immediately south of the farm residence hasabout 20 feet of relief, while one mile.to the north another hill rises'about 50feet above the till plain. Well logs from the' Geological Survey files in the study -area attached with this report give data on the earth materials in Sections 7,8,16, 17 and 18, T. 3 N., R. 2 W. The logs indicate that 20 to 60 feet of unconsolidated materials, primarily of glacial origin, overlie the Pennsylvanian-age bedrock.-"The bedrock consists of relatively impermeable shale and limestone with minor bedsof sandstone and coal.
At the Vonder Haar farm, drillerTs logs and natural gamma logs (enclosed)run by the Geological Survey indicate that the glacial drift thickness is about 28feet, consisting of about 6 to 18 feet of silty sandy clay which in turn is underlain ^
63

EST
by as much as 14 feet.of gravelly sand lying directly on the bedrock. Two largediameter water wells tapping the gravelly sand are utilized.for supply on the farm.Well no. 1, completed in 1969, is situated about 400 feet'north of the residenceand well no. 2,. completed in 1976, is located about 300 feet east of the residence.A large diameter .well reported to be 14 feet deep is immediately west of well no. 1.On the hill immediately south of the farm in the Keyesport Oil Field in Section 17,T. 3 N., R. 2 W., the drift section reportedly consists of about 55 feet of clay andgravel. Regional stratigraphic studies by the Survey in the Carlyle area'indicatethat these glacial materials •are associated with the Hagerstown Member of"theGlasford Formation'of Illinoian age.' Hills mined for sand and gravel two milesnorth of the Vonder Haar farm are part of the Hagerstown Member. '
The deposits of significance in this study are the permeable sand and gravelbeds above the bedrock which form.the' ground-water reservoir;at relatively shallowdepths. These beds are.subject to contamination while sources of pollution areavailable. Water entering the ground-water reservoir from rainfall, will move fromhigher to lower elevations and eventually discharge into Allen Branch to the eastor move westward toward the unnamed drainageway in Section 8. Similarly, oil fieldbrines entering the ground-water reservoir from holding ponds would move outwardfrom the upland areas into the lowland in the vicinity of the farm.
Resistivity Survey
The electrical earth resistivity survey is based on the principle thatuncontaminated, compact glacial till, alluvial clay and shale present more resistance to the passage of electrical current than do sand and gravel, or sandstoneand limestone of the bedrock. The passage of electrical current through earthmaterials is a property of the rock type and the'water contained in rocks. Electriccurrent introduced in earth materials containing water with a high concentration ofsoluble salts will have greatly reduced electrical resistance. This relationshiphas appeared in many published studies and has been used in electrical earth resistivity surveying to map contaminated ground water (see Illinois State GeologicalSurvey Reprint 1972-U entitled Electrical Earth Resistivity Surveying in LandfillInvestigations).
Collection of Field Data
During the study on the Vonder Haar farm, electrical depth sounding profiles were made.at 29 resistivity stations using the Wenner electrode configuration.The locations of the resistivity stations are shown on an enlarged section of theKeyesport Quadrangle Topographic Map 7.5-minute series modified in part to conformto information supplied by Mr. Charles E. Fisher, Jr. Profiles of the depthsoundings of each resistivity station are attached with this report.' In normaluncontaminated, uniform materials the' "a" spacing of the Wenner configuration isappro->dm:!tely equal to the depth of penetration of the electrical field. However,if a very conductive (low resistance) layer such as a salt water zone is present,-the electrical field will be somewhat distorted reducing the depth of penetration.
tso-resistivity contour maps showing apparent resistivity, were constructedfor "a" spacing depths of 5, 10, 20 and 30 feet. These maps indicate a region ofgreatly depressed apparent resistivity surrounding the north part of the KeyesportOil Field extending outward into the Vonder Haar farm. The contour map for the
64

20-foot "a" spacing is included with the modified quadrangle map of this report. *^Station nos. 1, 2, 3, 10, 14, 15, 16, 18, 19, 26 and 27 are affected by highly |conductive, materials, presumably saltier water. These stations are in contrast tostation ^nos. 7, 17, 21, 22. and .23 where readings are near normal due to little or mno accumulation of electrolites in the earth materials. The relationship betweenthe apparent resistance of the aquifer materials and their. contained water nearthe pumped wells on the Vonder Haar farm is given below using Illinois State Water "Survey water analyses (enclosed) '• from wells 1 and 2 and a well of similar depth jon the 01sen farm (obtained in 1970). about one mile north from the contaminatedarea.
Apparent Resistivity Chloride(ohm meters) Concentration
20-foot "a" spacing (CI)
Well.#l .15 1060Well n 20 15001sen Well 25 (estimated) 64
These data demonstrate the relationship between the apparent resistivity andchloride ion concentrations present in the drift aquifer. As the chloride concentration diminishes the apparent resistivity increases due to the lower concentrationof soluble salts.
Conclusion
The electrical earth resistivity ..survey data are in agreement with thehydrogeologic evaluation in the.study area'based -on the topographic analysis ofthe regional and on site geologic interpretation. Information collected during thestudy shows the presence of a circular wedge of salt water around the abandonedbrine holding ponds extending from the ponds along the north perimeter of theKeyesport Oil Field into the Charles Vonder Haar farm lot area. There are no datawhich show conclusively whether the reinjection of produced brine is or is notrelated to the water quality problem on the farm.
The presence of poor quality water on the Vonder Haar farm may haveresulted for one or more of several possible explanations. They are listed belowin the order from those we think most likely to those least likely:
(1) The data from the resistivity survey clearly show that the abandonedbrine holding ponds leaked salt water to the shallow aquifer and spread outward.The two wells on the Vonder Haar farm are within the region of depressed electricalearth resistivity values. There was sufficient time for the salt water to spreadfrom the ponds to the Vonder Haar farm during their long period of use. Abandon-,ment of the ponds will allow the quality of water in the aquifer to slowly recover;meanwhile, the salt water already in the aquifer will continue to spread and continue to be diluted by rainfall.
(2) The Vonder Haar wells are in or very near the animal lot. Thepresence of cattle is commonly associated with high chloride water which originatesin the animal waste. The large diameter dug or bored wells are particularly vul- mnerable to nearby surface sources of pollution. These wells, especially the olddug ones, are difficult to seal. In addition, the thin, surficial loess affordsonly moderate protection of the aquifer. The shape of the 15 one-meter line issimilar to the outline of the animal lot.
65
Hw&|

(3) Repressuring the production by reinjection of the produced brinemay force salt water up an unplugged abandoned well. According to Mr. Fisher,.three .wells were originally drilled -on.the Vonder Haar farm; two were dry and plugged,a third located in or .near.the farm.lot produced oil but was reported abandoned andplugged' in October 1953. According to Mr. Fisher, the' farmer on the propertyseveral years ago took'out or'broke off the surface-casing. The Survey has no.other records of deep'wells drilled on the property. However, if there are unknownwells with broken seals, water.could leak upward producing a low resistivity ringaround the'leaking well. No rings were observed with the station spacing that wasused. A small bulge in the coutour interval is present northeast of the farm logand the abandoned' well, but there is no indication that this bulge is the resultof leakage from an abandoned oil well: "
(4) The combination of leakage in one or more of the wells in the oilfield to the'south, and/or the'.pumpage of the farm wells may increase the rate ofsalt water migration, thus causing water quality in the farm wells .to-deterioratemore rapidly.
In summary, the most likely source of salt water in the well on the VonderHaar farm is water migrating from the'old brine holding ponds abandoned over twoyears ago. 'The'problem may also be. aggravated'by waste products"from, animals onthe property, possible leakage from' abandoned wells with broken seals or unknownand unplugged wells, or by. injection in and/or pumping of existing wells.
66

CA
J I J , J | j : i • i

ONoo
nitrate (noo
chloride (ci)
ALKALINITY (HCOO
TOTAL HARDNESS (CaC03)
TOTAL DISSOLVED SOLIDS
1.
WELL #1
SECTION 8, T. 3 N., R,1977
NOV. DEC.
2 w.
WELL #2
SECTION 8, T. 3 N., R.1977
NOV. DEC.
2 w. SECTION 9,1970
WELL
T. 3 N., R.
1977
2 w
0.4" 1.2 0.9 5.2 2.6 1.0
1060 750 150 2100 .64 40
318 400 9.5 390 568 600
920 725 358 1500 662 250
2105 1500 362 3700 906 610
VALUES REPORTED IN MILLIGRAMS PER LITER (MG/L)

STATE OF ILLINOISDEPARTMENT OFREGISTRATION ANDEDUCATION
JOAN «. tHDtUON
Dl.ICTOR, .PNIHO.IEL.O
BOARD OF NATURALRESOURCES ANDCONSERVATION
^m::::: *'^T? ^SSSE!^1* •0WXT * *•«« ILLINOIS STATE GEOLOGICAL SURVEY
NATURAL RESOURCE**: riiii i-iiki^ tion.u. •• • ...^.^ «.„_. ^-.v^n£r^0J«ji"^^^» NATURAL RESOURCES BUILDING. URBANA. ILLINOIS 61 BO! TELEPHONE *17 »«4.14S>.tKXAS PMK
0WN«Ot« C H/ITM
Jock A. Simon, chicf
August-22,. 1977
A RECONNAISSANCE ELECTRICAL EARTH RESISTIVITY.SURVEY AT THECOUNTRY TRAILS SUBDIVISION .'f1,:SECTION'34,': T. 15 N. , R. 4 tf.
SANGAMON"COUNTY, ILLINOIS
By.
Philip C. Reed, Assistant GeologistHydrogeology and Geophysics.Section
Introduction
Star •TiLth-;Je,',5,S,t."£'Hr; Murray Williams, Greene and Meador,.202 West ParkItltlL^^r1"6' Illin°", 62568, a brief electrical earth resistivity survey1977 ^ Country^Trails Subdivision owned by Mr. Bud Hunter on August 10,wedL'afthe"^- • • **urvey was t0determine the distribution of a salt wateredgfof the suwf^-a0n: ** aband°ned ^«e P" located adjacent to the easterndrflUd on lotl 7^s °?n1S ^^°n8er in ""•' Four larSe ^^eter water wellstltli T tL' *> l° ma U:we" reported, to.have chloride concentrationsranging from 250 to over 33,000 mg/1/(milligrams per liter).
Hydrogeologic-Setting
River ValWsIf^w'1! situated" in the upland and lowland areas of the Sangamon^L y, 85 feet above mean sea level, near an active oil field. ThePennsSv^f'materials (glacialdrift) of Illinoian age overlying-the bedrock ofdi™^ ^ CT1St °f 3 Pebbly Cl*y serial, called till, with some thin,^ITr ln"°usbeds of sand and gravel. Mosf.of the wells in the area'are large,~t\f , ^lls open" to the drift that produce only small and often seasonal"rkedw ,'- Thlcontact between the glacial drift and the underlying bedrock1^ n • ? I 3 f °f Slacial Moulders along the road near the western margin ofrock " 3n flevat:LOn of approximately 545 feefabove mean sea level. The bed-iocK.consists-:primarily of shale with.some thin, discontinuous beds of limestone«md sanostone, not generally considered an aquifer in this area. '.Below'azuu xeet water from the'bedrock may become too mineralized for most uses'
Resistivity Survey
,,nnn«- • Tbejelectrical earth resistivity survey.is based on the principal thatunconLaminated, compact glacial till, clay-alluvium and shale present less resistanceto the passage.of an electrical current than do sand and gravel or sandstone orlimestone of tne bedrock. Electrical current introduced in earth materials with•ign soaium chloride concentrations will have a greatly reduced resistance The
69

the0™"8 IS IS? the l0Catif °f the 21..stations occupied during the course ofIrLlT* y" statlons are marked with numbered wooden stakes driven i, theground.
Conclusion
survey in a^sLS tH ™ * ** usefulness °f ^electrical earth resistivitylT^rL 5 "8 fle" contamination due.to salty water.. The.outline of aaria of lo^ r«"^-S•'^^ T'' ±S sh°^>y the hachured pattern on the map. Thisfrom the Z^t *f ^ *' co"elfte^ "ell with the' reported chloride concentrationssaltv water fL^v T11,! ln the «udy area and depicts .the. movement of thesalty water above the bedrock toward the lowland.
. Information from drillers! logs supplied by Reynold Well Drilling, IncLrSt«„™isthe 8!°l08iJC Setti"8' SU^ests tha* ^ia- from.indi"iual 'subSvis^n ™„ ^ . ?Structed in the drift materials above the bedrock at thea Itnlr I y, " U3te8reatlv seasonally and that wells of this type are onlyaore desirl^fiT?n !° ^ Water SUpply P^hlem present at the subdivision. Amaterial t „1 , ^ 1**1™? ™«««' of" ground water may be present in the alluvialthe subdivision! ° S^3*0* WW Valley possibly within the limits of
.„fri„„ Driller's.logs of formation changes in color and texture and samples™ fn^f1," r^8 ^ five-foot intervals should be sent to the State GeologicalfrelIf «w~ 7 lnterpretation. Sample sacks and log books will be furnishediree ox charge upon request.
to th* <^tTrfl\tUre corJesP°ndence: referring to-this report should be addressedto the State Geological Survey, Urbana, Illinois, 61801.
70

•^r
4-
5
Jo J
•"SIkl V1
•9 20
lA
o
><Xr-
2
3
4
-I*
V)
u ra
a:0
CO" .
t/iQ l^ti
02 , i/l«• •** r~~i
j 0 "*J 2
1
3- 0 j
r* h *»
1 05 ID
3 • V <i2^
lA 47 0 0 J
I5 tf> ^ n-
< 10
4 0> mi
x 2
2lAli \P
(V .
\r
-r
i- T
V 1*«4ui
2n
J4o. p
V»n
r0G)J
lf>-
2<<
0 tf
I7-
0
0
0Ka
>•-t"
5
0j
0ui
r
r
r-
Mi
<
IP
I--
0
2
J
J

STATE OF ILLINOI8
DEPARTMENT OFREGISTRATION ANDEDUCATION
RONALD C STACKLCAOntBCTon. inimrim
BOARD OF NATURALRESOURCES ANDCONSERVATION
DtAIMm KMALD C. STMXLERaOLOCT UURUCC L SUBSOtOtlSTRT K. S. OHOtiKtbsikurins HBoa h. maoamBIOLOGY TMOMS PA*FORESTRrWIVOSITY Of ILLINOIS NATURAL RESOURCES BUILDING. URBAN A. ILLINOIS 610O1 TELEPHONE 217 344.UB1
CtMt «IUI«N U EVERirrS0U1XE* ILLINOIS (MIVERSITV
dun jon c ami
ILLINOIS STATE GEOLOGICAL SURVEY
Jack A. Simon, Chief
August 7, 1975
AN. ELECTRICAL EARTH RESISTIVITY SURVEY ON AN OIL LEASE OFBERNARD PODOLSKY, WHITE COUNTY, ILLINOIS
By
Philip C. Reed, Assistant GeologistHydrogeology and Geophysics Section
At the request of Mr. Bernard Podolsky, ?. 0. Box 278, Fairfield,Illinois, 62837, an electrical earth resistivity survey was conducted on an oillease located in the W% of Section 27, T. 3 SM R. 9 E., White* County9 on June 18and 26, 1975. Tiie purpose of the survey W3S to better define the source andoccurrence of the contamination of the earth materials by salt water at the leaseso that the land could be returned to its original 6tate.
The Problem
The problem that exists at the oil lease in Section 27, T. 3 S., R. 9 E.,is the contamination of the earth materials by oil field brines associated with oilproduction. Injection of the brines in the vicinity of the abandoned oil well andthe spilling of the brines in waterways near the abandoned oil well from preexisting storage pits have contaminated the erea around parts of the lease. Theprincipal storage pit, which was filled in last fall, was located southwest of theabandoned well shown on the enclosed sketch map. Vegetation will not grow in areasaround the pits and in drainageways where the salt concentration is too high.
Geological Situation
The oil lease is situated in the upland area tight siilas northwest fromthe confluence of the Skillet Fork and the Little Wabash 2iver within the Golden£ate Consolidated oil field. Wells in this part of the field generally producefrom llissiscippian sands and limestones in the depth range of 3000 to 3500 feet.The drift materials overlying bedrock of Penncylvanian age range in thickness fromabout 10-25 feet and consist primarily of Illinoiari-ege till. The best exposurespresent in the request area are at the salt spring and pond. Here, rubble of silt-stone and sandstone of Penncylvanian bedrock, litter the pebbly clay walls of thepond. Silt pockets appear to be present within the pebbly clay glacial materialshigher in the section, especially where a water line crosses the road and entersthe pond from the tank battery. The pebbly clay till is overlain by as much astwo feet of loessial silt in the upland of the study area.
72

The physical features, which are shown on the sketch map, of the studyarea are: 1) the abandoned McClosky oil veil, Mooes and Stewart #1 constructedwith 45 feet of surface casing in 1952; 2) a salt water injection veil completedto a depth of 950 feet; 3) a tank battery consisting of three 210 barrel tanksand an oil-water separation unit; 4) a house owned by George Lamont; and 5) 8brine-evaporation pit recently filled and leveled to conform with the originalland surface.
Hydrogeologlc Features
The hydrogeologlc features within the study area, which are shown onthe sketch map, are: 1) 8 pond and a salt spring northwest of the Lament house;2) a pond east of the house; 3) a cistern about 8.5 feet deep on the north sideof the house; 4) a network of ditches trending north, west and east, and generallyaway from the upland area where the abandoned oil well and injection well aresituated; and 5) an area without vegetation covered in part with what appears tobe white salt crystals.
Resistivity Survey
The electrical ecrth resistivity survey is based on the principle thatuncontaainated, compact glacial till, alluviua and shale preeent less resistanceto the passage of an electric current than do uncontaminated sand and gravel orBandstone or limestone of the bedrock. Electrical current introduced in earth mmaterials with high chloride ion concentrations in the water will greatly reducethe resistance so that the instrumentation of a resistivity survey frequently willnot detect any reading at all. As the chloride ion concentration are reduced inthe enrth materials, the instrumentation becomes core sensitive, measuring progressivelyhigher levels of resistance as the contamination or chloride' ion concentrationdecreases. The accompanying sketch map shows the approximate location of the 28stations occupied in the course of the survey. All stations are marked by numberedwooden stakes driven into the ground
Conclusion
The naps shoving isorcsistivity valuer o£ 15 and 20 oh^-meters at depths10, 20 and 30 feet below land curface, depict the affect of the oil field wastesand their moveaent and dilution due to rainfall outward frost the primary area ofcontamination near the covered disposal pit, the brine injection well, and abandonedoil well. The resistivity readings correlate with the enclosed water analyses madefrom water collected during the course of work at the request area.
This study denoa-trated the usefulness of an electrical earth resistivitysurvey in describing oil field contamination due to salty water. Z*> point sourcewaa found; however, the general outline of the contaminated area was established.
73
liTTlj
fS^J

T ( ™I i, . %,
600 feet3
Q Injection well
Mm Abandoned oil well
£} Salt spring
# I Resistivity station with number
_.——-* Field tile
*0mm/Q~S Resistivity contour at depthof 10 feet
**420"S Elevation contour
Outline of unvegetated area

1975
PONDSEEP
SURFACECISTERN
BOTTOM8.5«•RUPTUREDTANK
CHLORIDECC1)16,800:;'18/40020036013,800TOTALDISSOLVEDSOLIDS30,80034,20040078024,100pH7.557.3^8.477.217.51
1977
FIELDTILE
CHLORIDECC1)6,00016,400
TOTALDISSOLVEDSOLIDS10,60027,600
-4pH4.986.16
140
330
7.51
VALUESREPORTEDINMILLIGRAMSPERLITERCMG/L)SECTION27,T.3S.,R.9E,
MJl,..._'!'i'__-ilkiJli-MJl-

r
r
tAPPENDIX C
Christian CountyL E.E.R. and Water Table Maps
Lithologic and Gamma Ray Logs
IPS'!
r
HF1
76

Christian County Holding Pond Study SiteLand Owner: Mr. J. David MyersOperator: Mr. E. H. Kaufman
Pond Size: 30'xlOO'. Date Constructed: 1954? "1Present Salt Water Input: None (Reportedly as much as 100 bbls/day prior to 1977)
Geologic Setting j
The Christian County study site is located on an Illinoian till plain
in Section 20, T. 13 N., R. 11 E., within the Assumption Consolidated Oil Field.
The land elevation is estimated to be between 615-620 feet above mean sea level.
Drainage is locally toward a swale north of the pit but generally southeastward
toward a tributary of Oak Branch Creek. The unconsolidated Illinoian glacial drift
and the more recent deposits of loess consist of sand, silt and glacial till about m[
80 feet thick and form a broad, flat plain in this area. Beneath these deposits is
bedrock of Penn6ylvanian age.
Hydrogeology
The surficial material at the site consists of about 5 feet of loessial
silt and sand which forms part of the soil in this region. Bleached silt, sand
and clay till form part of the surface spoil materials around the unvegetated areas
of the pit. Beneath the loess is about 15 feet of silt and very fine to fine
grained sand of the Hagarstown Member of the Illinoian Glasford Formation. Below
the Hagarstown, in decending order, are the Radnor and Smithboro Members of the
Glasford Formation. The units consist of compacted sandy till and compacted clay
till and probably extend to the underlying Bond Formation of Pennsylvanian age.
The silt and sand of the Hagarstown Member are the principal source of
ground water in the area and are less compact than the underlying till of the
Radnor Member (see compressive strength measurements).
Hydrology
Water level contours around the hold pond indicate a ground-water mound
beneath the holding pond with the regional water level surface trending away from
77

the upland toward the lowland areas.
The isoresistivity contours also indicate the migration of chlorides to
be greatest northward and southeastward.
The extent of the unvegetated area is depicted clearly on the photo
graphs in the report. This area was often moist in many places, particularly after
a rainfall event, suggesting that holding pond water is migrating laterally.
Apparent resistivity values from split spoon samples were much higher
below the Hagarstown Member, probably indicating little downward movement of the
highly mineralized water.
78

CHRISTIAN COUNTY
Static Level Height Relative St a.tic Ground Water Levels
Relative Below Top Of Casing Ground Leyel Leyel Relative To
Well Slot Height Casing, July Above Level Below Relative Ground LevelNo. Interval Casing 20, 1978 Ground At Well Ground To Datum Datum
M-1A 9-19 - 1.83 .10 5,08 -1,73 0,0 +(-l,73)=-l,73
M-1B 4-9 - 2,65 ,35 5.15 -2,30 -0,07 +(-2,30)=-2,37
M-22 9-19 - 3,37 ,11 4,91 t-3,26 +0,17 +(-3,26)^-3,09
M-31 10-20 - 4,28 ,32 4,28 -3,96 +0,80 +(-3,96)=-3,16
M-33 9-19 - 3.89 ,60 6,18 -3,29 rl,10 +(-3,29)^-4,39
M-35 10-20 - 5.40 .70 1,49 -4,70 +3,59 +Cr4.70)—1,11
Fluid Level in Pit 5,18 •Q.10
1 * a __1 ' i

1«
OG-5A
—600—'-70-^
H- S2310'W2110'
from NE/c
Section 20
N
Resistivity station
Injection well
Producing well
Well
Elevation contour
Contours showing water level
Unvegetated area
200 feet
WATER LEVEL CONTOURS (DATUM GROUND LEVEL. M-1A)AT THE ASSUMPTION CONSOLIDATED OIL FIELD
Sectfon 20.T. 13 N.f R. 1 E., Christian County, IllinoisJuly 1978-Murphy, Osby (IEPA); Reed (ISGS)
80
ISGS 1978

*
OG-5A
—600-
70-
22
28
Lane
M-22
21
20
23
19
29
2725
Resistivity station
Injection well
Producing well
Well
Elevation contour
Contour showing apparent resistivity, interval 5 ohm-meters
Unvegetated area
• •
4 5
+ S2310'W2110"
from iME/c
Section 20
M-33
IM
200 feet3
AN ELECTRICAL EARTH RESISTIVITY SURVEY
AT THE ASSUMPTION CONSOLIDATED OIL FIELD
Section 20, T. 13 N., R. 1 E.. Christian County, IllinoisJuly 1978-Murphy. Osby (IEPA); Reed (ISGS)
81

^J»
pph
P^<?
1*
O G-SA
— 500-
70-
4" S2310'W2110'
from NE/c
Section 20
Resistivity station
Injection well
Producing well
Well
Elevation contour
Contour showing apparent resistivity; interval 5 ohm-meters
Unvegetated area
APPARENT RESISTIVITY (OHM-METERS) AT 5-FOOT DEPTHAT THE ASSUMPTION CONSOLIDATED OIL FIELD
Section 20, T. 13 N., R. 1 E.. Christian County. IllinoisJuly 1978-Murphy. Osby (IEPA); Reed (ISGS)
82
IM
200 feet
ISGj S378

OG-5A
—600-^70-^
/ZZZZ?
•+• S2310*W2110*
from NE/c
Section 20
Resistivity station
Injection well
Producing well
Well
Elevation contour
Contour showing apparentresistivity, interval 5 ohm-meters
Unvegetated area
APPARENT RESISTIVITY (OHM-METERS) AT 10-FOOT DEPTHAT THE ASSUMPTION CONSOLIDATED OIL FIELD
Section 20. T. 13 N.. R. 1 E.. Christian County, IllinoisJuly 1978-Murphy, Osby (IEPA); Reed (ISGS)
83
N
200 feet
fW|
(55

OG-5A
6-00 '-70-^
•+• S2310'W2110'
from NE/c
Section 20
Resistivity station
Injection well
Producing well
Well
Elevation contour
Contour showing apparent resistivity; interval 5 ohm-meters
Unvegetated area
APPARENT RESISTIVITY (OHM-METERS) AT 20-FOOT DEPTHAT THE ASSUMPTION CONSOLIDATED OIL FIELD
Section 20, T. 13 N., R. 1 E.. Christian County. IllinoisJuly 1978-Murphy. Osby (IEPA); Reed (ISGS)
84
N
200 feet

COen
A'
M-33
I.
M-31
M-1A
M-1B
pondfluidlevel
M-22
I
/\dikeatpitgroundsurface
T.D.21.5
10ft-i
i200ft
M-1B
M-1A
T.D.29
wSilt
.'•*.Sand
v.Till
[Staticwaterlevel
Slottedinterval
GEOLOGICSECTIONATTHEASSUMPTIONCONSOLIDATEDOILFIELDSection20,T.13N.,R.1E.,ChristianCounty,Illinois
June1978-Reed(ISGS)
J*1
ISGSIP/fl
J•,I'

r
APPENDIX D
«, Bond CountyE.E.R. (and Water Table Maps
L Lithologic and Gamma Ray Logs
r
r
r
r
r
r.
r86

Bond County Holding Pond Study SiteLand Administrator: Roger RiedemannOperator; Clyde BassettPond Size: 100'xlOO'. Date Constructed: 1940?Present Salt Water Input: 150 barrels per day four days a month
i
Geologic Setting
The Bond County holding pond study site is located in Section 10,
T. 6 N., R. 2 W., Bond County, Illinois, in the Woburn Consolidated Oil Field.
The land elevation is between 565-580 feet above mean sea level. Drainage is
generally westward toward a north flowing tributary to Gilham Creek. The study site
is a part of a relatively flat and featureless drift plain underlain by Illinoian
glacial deposits. The unconsolidated glacial drift and overlying deposits of loess
consist of about 80 feet of clayey silt, sand, and till. Beneath these deposits is
bedrock of Pennsylvanian age.
Hydrogeology
The surface materials exposed at the site consist of about 2 feet of
Wisconsinan loessial silt and sand which form part of the soil in the region. Below
the loess, exposed along the drainageways west and north of the pond, is the
Hagarstown Member of the Illinoian Glasford Formation, An abandoned pond directly
south of the active pond has been breached by an erosional waterway to a depth of
6-7 feet (see photographs). In the pond areas, the Hagarstown extends to about
20 feet below the land surface and consists primarily of sandy silt with minor
amounts of sandy ablation till. The silt is differentially weathered, having
undergone two periods of soil genesis. The Hagarstown Member is underlain by about
20 feet of the Vandalia Member of the Glasford Formation, a sandy till with a few
thin sand layers. Beneath the Vandalia Member is about 30 feet of silty, smooth
textured till assigned to the Smithboro Member of the Glasford Formation. The
87

lowermost 8 feet of glacial drift consists of dense Kansan till overlying the
Bond Formation of Pennsylvanian age.
The silt, sand, and sandy- till of the Hagarstown Member contain greater
amounts of coarse clastic material, are less compact (see unconfined compressive
strength measurements), and are relatively more permeable than the remaining tills
of the Glasford Formation. The best exposure of Hagarstown is on the west side
of the active holding pond. Here, about 8 feet of continually moist, unvegetated
silt extends from the diked part of the pond, ending abruptly at the waterway (see
photograph).
Hydrology
Water level contours at the hold pond reveal a ground-water mound super
imposed on a water level surface which increases in gradient toward the drainageway.
Water from the mound appears to seep regularly from the west side of the active pond
dike into the waterway.
The distribution of apparent resistivity contours indicate the greatest
migration of chlorides northward and westward toward drainageways. The extent of
unvegetated areas surrounding the holding pond in 1978 is very similar to the area
shown on the 1955 aerial photograph accompanying this report. The unvegetated area
stops dramatically at the waterway, suggesting change of the flow pattern in this
area (see Fig. 1).
The generally higher apparent resistivity values from split spoon samples
below the Hagarstown indicate that for the most part, the highly mineralized holding
pond water has not migrated downward into the underlying till.
88

BOND COUNTY
Well
No.
Slot
Interval
Relative
HeightCasing
Static Level
Below Top OfCasing, July
20, 1978
HeightCasing
Above
Ground
Relative
Ground
Level
At Well
Static
Level
Below
Ground
Ground
Level
Relative
To Datum
-5.92
Water Levels
Relative To
Ground Level
Datum
R-lA 9-19 - 2.47 0.27 13.12 2.20 +(-2.20)=-8.12
R-3 14-19 - 2.90 0.0 7.20 2.90 0.0 +(-2.90)=-2.90
R-3A 4-9 - 2.74 0.42 7.30 2.74 -0.10 +(-2.74)=-2;84-
R-16 9-24 - 4.52 0.46 9.86 4.52 -2.66 +(-4.52)=-8.I8
R-26 9-24 - 9.13 0.65 8.15 9.13 -0.95 +(-9.13)=-10.08
R-28A 14-19 - . 3.39 0.20 12.70 3.39 -5.50 +(-3.39)=-8.89
00to R-32 9.24 - 7.57 0.15 10.76 7.57 -3.56 +(-7.57)=-11.13
R-43 9-24 - 3.27 0.30 6.55 3.27 +0.65 +(-3.27)=-2.62
R oil test 7.58
(top casing) -0.38
R pit 6.25
(top fluid) +0.95
R stream 18.50
(base channel) -11.30
J ' JL_l • J J ' j'

r.*
rF&
^l
"co
nto
ur
sho
win
gw
aterlevel
5?
q—
^ele
vatio
nco
nto
ur
•17
resisJvity
station
OH
3w
ell
~^~abandoned
oilw
ell
i/////Y
\A
pp
rox
imate
limit
of
un
veg
etatedarea
"'1955'*
WA
TE
RL
EV
EL
CO
NT
OU
RS
(DA
TU
MG
RO
UN
DL
EV
EL
,W
EL
LR
-3)A
TT
HE
WO
BU
RN
CO
NS
OL
IDA
TE
DO
ILF
IEL
D
Sectio
n10,
T.
6N
.,R
.2
W.,
Bond
Co
un
ty,
IllinoisJu
ne
19
78
-Mu
rph
y,
Osby
(IEP
A);
Reed,
Franczyk
(ISGS)
90
'SG
31
9/g

• 34
center of north
linesection 10 /
S/q —— elevation contour
•17 resistivity station
O H3 well
-£- abandoned oil well
Approximate limit of unvegetated area
'1955*
AN ELECTRICAL EARTH RESISTIVITY SURVEY
AT THE WOBURN CONSOLIDATED OIL FIELD
Section 10. T. 6 N., R. 2 W., Bond County, IllinoisJune 1978-Wurphy, Osby (IEPA); Reed. Franczyk (ISGS)
91
1
+
fffl
vs.

r
P»l
IPI
contour snowing apparent resistivity; interval 5 ohm-meters
^o elevation contour
#17 resistivity station
OH3 well
-£- abandoned oil well
' x Approximate limit of unvegetated area
1955*
APPARENT RESISTIVITY (OHM-METERS) AT 5-FOOT DEPTHAT THE WOBURN CONSOLIDATED OIL FIELD
Section 10, T. 6 N.. R. 2 W.. Bond County. IllinoisJune 1978-Murphy. Osby (IEPA); Reed. Franczyk (ISGS)
92
•scs iq;s

center of northline section 10 / }
'7° contour showing apparent resistivity; interval 5 ohm-meterss~—5?q __-^ elevation contour
•17 resistivity station
O H3 well
-^- abandoned oil well
</// • //* Approximate limit of unvegetated area
' ' 1955 '*
APPARENT RESISTIVITY (OHM-METERS) AT 10-FOOT DEPTHAT THE WOBURN CONSOLIDATED OIL FIELD
Section 10, T. 6 N.. R. 2 W.. Bond County, IllinoisJune 1978-Murphy, Osby (IEPA); Reed, Franczyk (ISGS)
93
1
1

m-
(?S1
r
r
center
line sect
• 34 •:
•37
• 40
of north . jction 10 / /
" contour showing apparent resistivity; interval 5 ohm-meters
' S?0 —' elevation contour
•17 resistivity station
O H3 well
-^- abandoned oil well
''' ' - x Approximate limit of unvegetated area
APPARENT RESISTIVITY (OHM-METERS) AT 20-FOOT DEPTHAT THE WOBURN CONSOLIDATED OIL FIELD
Section 10, T. 6 N., R. 2 W.. Bond County, IllinoisJune 1978-Murphy, Osby (IEPA);Reed, Franczyk (ISGS)
94
+
300 feet
•scs i9/a

E3 SiltI •.•. Sand
O/. j T.ll
•»- Staiic water level
I Slotted interval
R-26 R-28A
fluid level
\
R-3
R-3A
BidrockT.D. 78 It
GEOLOGIC SECTION AT THE WOBURN CONSOLIDATED OIL FIELDSection 10. T. 6 N.. R. 2 W.. Bond County, Illinois
June 1978-Murphy. Osby (IEPA); ReedV Franczyk <ISGS>
95
A'

r
[^1
JiSI
APPENDIX E
pa Effingham-Fayette CountyE.E.R. and Water Table MapsLithologic and Gamma Ray Logs
r.
96

.Effingham-Fayette Counties Holding Pond Study SiteLand Administrator: Mr. Dorwin BarrOperator: Tri Star Oil CompanyPond Size: llO'xllO'xe1
Present salt water input: 150-200 barrels daily (reported)
Geologic Setting
The Effingham-Fayette County study site is located in Section 31,
T. 9 N., R. 4 W., within the Louden Oil Field. The land elevation ranges
between 595-630 feet above mean sea level. Drainage is eastward and southward
toward a tributary of Wolf Creek. The site is situated on the south flank of
southwestward-northeastward trending series of elongate mounds which are
elevated above the surrounding Illinoian till plain. The unconsolidated
Illinoian glacial drift consists of sand, silt and till. The glacial drift is
about 50 feet thick, and overlies the Mattoon Formation of Pennsylvanian age.
Hydrogeology
The surficial material consists of loessial silt which forms the soil
in this area. In places near the abandoned ponds north, northeast, west and
immediately south of the active pond a sandy, bleached spoil covering is present
to a depth of 3 to 4 feet. Underlying the spoil and the soil is 5 to 18 feet
of sand, silt and sandy till of the Hagarstown Member of the Glasford Formation.
The Hagarstown is deeply weathered and has a uniform lithology in all parts of
the study area except in the area of well no. G-49A where the sandy ablation
till phase of the Hagarstown becomes dominant.
Beneath the Hagarstown is a tough sandy till, the Vandalia Member
of the Glasford Formation. The Vandalia Member is greatly compacted in contrast
to the overlying Hagarstown (see engineering data in appendix) which has com
paratively greater permeability. The Vandalia appears fractured in some of the
split spoon samples studied and therefore may be hydraulically connected to the
overlying Hagarstown in places.
97

Hydrology
Water level contours around the holding pond indicate a ground-water
mound beneath the pit with a gradient southward toward the creek. The distri
bution of apparent resistivity reflects the coalescing and interaction of the
chloride migration from the active pond and the inactive holding ponds. The
greatest migration of brine is southward toward the creek and west, northeast
and east outward from the vicinity of the abandoned holding ponds. This relation
ship is shown on the apparent resistivity maps. The limit of the unvegetated
area has decreased considerably in the locale of the abandoned holding ponds
based on patterns shown on the 1966 aerial photograph.
98

(Oto
EFFINGHAM-FAYETTE COUNTIES
Well
No.
Slot
Interval
Relative
Height
Casing
Static LevelBelow Top OfCasing, July
20. 1978
HeightCasingAbove
Ground
Relative Static
Ground Level
Level Below
At Well Ground
Ground
LevelRelative
To Datum
waiter LevelsRelative ToGround Level
Datum
G-Huffman 8.15 0.0 3,3 8.15 +5.02 +(r8.15)=-3,13
G-5A 4-14 - 5.45 • 0,3 13,91 5.15 r-5,59 +(r5,15)^-10,74
G-19A 4-14 - 6.80 2.45 12.95 4.35 -4,63 +0-4,35)^8,89
G-25A 9-14 - 5.20 0.60 4.85 4.60 +3,47 +(-4,60)=-1.13
G-32 4-14 - 8.05 2.90 8.32 5,15 0.0 +(-5,15)=-5.15
G-32A 14-17 - 7.45 2.55 8.30 4.90 +0.02 +(-4,90)=-4,88
G-49A 4-9 - No Water 0.45 23.64 - -15.32
Creek 46.26 base channel -37.94
Pit MP 7.18 1.8 8.98 (top fluid) -0,66 -0.66
J ' . j

WATER LEVEL CONTOURS (DATUM GROUND LEVEL. G-32)AT THE LOUDEN POOL OIL FIELD
Section 31, T. 9 N., R.4 E., Effingham County. Illinois.and Section 36, T. 9 N.. R. 3 E., Fayette County. Illinois
July 1978-Murphy, Osby (IEPA); Reed (ISGS)
100

AN ELECTRICAL EARTH RESISTIVITY SURVEYAT THE LOUDEN POOL OIL FIELD
Section 31. T. 9 N.. R. 4 E., Effingham County. Illinoisand Section 36, T. 9 N.. R. 3 E., Fayette County. Illinois
July 1978-Murphy, Osby (lEPA); Reed (ISGS)
101

1»
+OG-5A
—600-
10-
Resistivity station
Injection well
Producing well
Inactive well
Well
Elevation contour
Contour showing apparent resistivity; interval 5 ohm-meters
VjV/V^?. Approximate limit of unvegetated area
APPARENT RESISTIVITY (OHM-METERS) AT 5-FOOT DEPTHAT THE LOUDEN POOL OIL FIELD
Section 31. T. 9 N.. R. 4 E.. Effingham County, Illinoisand Section 36. T. 9 N., R. 3 E., Fayette County, Illinois
July 1978-Murphy, Osby (IEPA); Reed ilSGS)
102
200 feet
!SGS 1378

O
+OG-5A
—600-
10-
Resistivity station
Injection well
Producing wel
Inactive wel
Well
Elevation contour
Contour showing apparent resistivity; interval 5 ohm-meters
//7///7<VV//^ Approximate limit of unvegetated area
200 feet
APPARENT RESISTIVITY (OHM-METERS) AT 10-FOOT DEPTHAT THE LOUDEN POOL OIL FIELD
Section 31, T. 9 N., R. 4 E.. Effingham County, Illinoisand Section 36, T. 9. N„ R.3 E.. Fayette County, Illinois
July 1978-Murphy. Osby (lEPA); Reed (ISGS)
103
I^WJ
f^v?
ra^
ftm\
1

OG-5A
—600-
•—10-
Resistivity station
Injection well
Producing well
Inactive well
Well
Elevation contour
Contour showing apparent resistivity; interval 5 ohm-meters
200 feet
^///jy* Approximate limit of unvegetated area
APPARENT RESISTIVITY (OHM-METERS) AT 20-FOOT DEPTHAT THE LOUDEN POOL OIL FIELD
Section 31, T. 9 N., R. 4 E., Effingham County. Illinoisand Secrion 36, T. 9 N.. R. 3 E.. Fayette County, Illinois
July 1978-Murphy, Osby (lEPA); Reed (ISGS)
104

G-49A
o
T.D. 11.5 ft
JV
G-5A
jondSii:
G-32
G-32A
holding fluid level
AK\ JC
gamma log configuration
dike at pit
T.D. 16.0 ft T.D. 21.0 ft
VjJl Si,t' -'.'.I Sand
O/T] Till•*- Static water level
Slotted interval
10ft-i
200 ft
J I
GEOLOGIC SECTION AT THE LOUDEN POOL OIL FIELDSection 31. T. 9 N., R. 4 E., Effingham County, Illinois,and Sect'w i 31. T. 9 N.. R. 3 E., Fayette County. Illinois
_J ' . H Jjulv J R<?: ICiS) I \ | *_
G-25A
T.D. 16.5 ft
ISGS 1978
J*

P*T
m
r
p
. APPENDIX F
Clay CountyE.E.R. and' Water Table Maps
Lithologic and Gamma Ray Logs
106

Clav County Holding Pond Study SiteLand Administrator: Mr. Albert HayesOperator: Shelby A. BrittonPond Size: lSO^O^e1. Date Constructed: 1950?Present salt water input: 4 barrels daily (reported)
Geologic Setting
The Clay County study site is located in Sections 21 and 28, T. 3 N.,
R. 7 E., within the Sailor Springs Consolidated Oil Field. The land elevation
ranges between 445-455 feet above mean sea level. Drainage is westward toward
a tributary of Elm River. The unconsolidated Illinoian glacial drift and loess
which consists of silt, sand and glacial till is about 25 feet thick and overlie
the Mattoon Formation of Pennsylvanian age.
Hydrogeology
The site is overlain to the west and north with 0-3 feet of loose,
often moist, fairly clean sand with granules, probably spoil derived from the
pond excavation. This surficial material is porous and permeable and appears
to transmit pond fluid readily. Beneath this spoil and in areas where the spoil
is not present is about 10-15 feet of loosely compacted soil, sand, silt and
deeply weathered till of the Hagarstown Member of the Glasford Formation.
Underlying the Hagarstown is ten or more feet of tough dry compacted (see
unconfined compressive strength measurements) relatively impermeable till which
is believed to lie on bedrock.
Hydrology
Water level contours around the holding pond indicate a ground-water
mound beneath the pond with a general gradient westward toward the creek.
The distribution of the isoresistivity contours indicate that the
greatest migration of chlorides is toward the southeast and northwest. The
construction of state route 50 in the early 1970fs appears to have interrupted
107

I-/
ispi
p
[pH
I'
PI,
a part of the southeastward migration of the unvegetative area around the pit.
To the northwest, since 1966, the unvegetated area has extended outward 200
feet to afield waterway coincident •with the chloride migration (note photographs)
108

CLAYCOUNTY
Well
No.
Slot
Interval
Relative
Height
Casing
StaticLevel
BelowTopOfCasing,July
20,1978
HeightCasing
Above
Ground
Relatiye
Ground
Level
AtWell
Static
Level
Below
Ground
Ground
Level
RelatiyeToDatum
WaterLeyelsRelativexo
.GroundLeyelDatum
o
H-34-145.003,65.0.34,703,35+0,15+(r3,35)=-2,20KD
H-ll4-144,853,900,04,853,900,0+G-3,90)^3,90
H-214-145.104,200.354,753,85r0,05+(-3.85)=-3.90H-2121-244.9021.350.154.6521.20+0.20+(-21.20)=-21.00
ITJJ*.J

holding pond ^
"** contour showing water level
"- <So elevation contour
•17 resistivity station
OH3 well
Approximate limit of unvegetated area
POTENTIOMETRIC SURFACE (DATUM GROUND LEVEL WELL H111SAILOR SPRINGS CONSOLIDATED OIL FIELD
Section 21.T. 3 N., R. 7 E., Clay County. IllinoisJuly 1978-Murphy, Osby (I EPA); Reed {ISGS)
110
300 feet
'sr.s to 7u

holdingpond
/
--4soelevationcontour
•17resistivitystation
OH3well
'//''?/0>Approximatelimitofunvegetatedarea
*1966'*
2122
l<sApproximateSEcornerof
N
ANELECTRICALEARTHRESISTIVITYSURVEYATTHESAILORSPRINGSCONSOLIDATEDOILFIELD
Sections21and28,T.3N..R.7E..ClayCounty.IllinoisJuly1978-Murphy.Osby(lEPA);Reed(ISGS)
111
-j-section21
300feet
\™&.

holding pond
• 3736
contour showing apparent resistivity; interval 5 ohm-meters
•- 45o —' elevation contour
•17 resistivity station
O H3 well
s77 197Rl///j(/yKt Approximate limit of unvegetated area
'•1966-*
APPARENT RESISTIVITY (OHM-METERS) AT 5-FOOT DEPTHAT THE SAILOR SPRINGS CONSOLIDATED OIL FIELD
Sections 21 and 28. T. 3 N., R. 7 E., Clay County. IllinoisJuly 1978-Murphy. Osby (IEPA); Reed (ISGS)
112
300 feet

L_
holding pond
37• 36
° * contour showing apparent resistivity; interval 5 ohm-meters*" 45Q —- elevation contour
• 17 resistivity station
O H3 well
Approximate limit of unvegetated area
•1966*
APPARENT RESISTIVITY (OHM-METERS) AT 10-FOOT DEPTH
AT THE SAILOR SPRINGS CONSOLIDATED OIL FIELDSections 21 and 28, T. 3 N., R. 7 E.. Clay County. Illinois
July 1978-Murphy, Osby (IEPA); Reed (ISGS)
113
300 feet

p^
!W
•*»•
SI
SH
si
p^l
<PH 1
holding pond ^
roximate SE corner of
-[•section 21
"—*0~ . . ....contour showing apparent resistivity; interval 5 ohm-meters
•"" 45o elevation contour
•17 resistivity station
OH3 well
' ' x Approximate limit of unvegetated area
'1966*
APPARENT RESISTIVITY (OHM-METERS) AT 20-FOOT DEPTHAT THE SAILOR SPRINGS CONSOLIDATED OIL FIELD
Sections 21 and 28, T. 3 N., R. 7 E.. Clay County. IllinoisJuly 1978-Murphy, Osby (IEPA); Reed (ISGS)
114
300 feet

Wellno.H-11
T.D.16.5
lOTlSilt
r^iSand
°/.Till
H-3
pondfluidlevel
H-21
dikeatpond
T.D.25.5
A'
.groundsurface
loessandsandypebbly
weatherrdtill
weatheredpebblytill
•#-Staticwaterlevel
ISlottedinterval
GEOLOGICCROSSSECTIONA-A'SAILORSPRINGSCONSOLIDATEDOILFIELD
Section21,T.3N..R.7E.,ClayCounty,IllinoisJuly1978-Murphy.Osby(IEPA);Reed(ISGS)
10ft-,
200ft
JI
<i*
ISGS<97R

New York State Oil, Gas
and Mineral Resources
2008
New York State Department of Environmental Conservation
Division of Mineral Resources 625 Broadway
Albany, New York 12233-6500
www.dec.ny.gov

New York State Oil, Gas and Mineral Resources, 2008
NYS DEC - Division of Mineral Resources 2 Twenty-Fifth Annual Report

New York State Oil, Gas and Mineral Resources, 2008
NYS DEC - Division of Mineral Resources 3 Twenty-Fifth Annual Report
Division Mission Statement
The Division of Mineral Resources is responsible for ensuring the environmentally sound, economic development of New York’s non-renewable energy and mineral resources for the benefit of
current and future generations.
This report was produced by the NYS Department of Environmental Conservation Division of Mineral Resources 625 Broadway Albany, NY 12233-6500 (518) 402-8076 Bradley J. Field, Director

New York State Oil, Gas and Mineral Resources, 2008
NYS DEC - Division of Mineral Resources 4 Twenty-Fifth Annual Report
Mining occurs in every region of the State except the New York City area. Oil and gas development has historically occurred in the western half of the State, but the Finger Lakes region has been experi-encing heavy activity for several years. Because of differences in legal reporting requirements, the types of statistics presented for the two programs are not identical.
Mined Land Reclamation Inspections - Staff traveled 89,964 miles to perform 2,417 mine inspections.
Permits Issued Annual
Total Permits 462 Fees
New Permits 37 $2.8 Million
Renewal & Mod. 585
Active Mines 2,166
Estimated Market Value $1.3 billion
US Production Rank by Quantity
Wollastonite 1st Salt, Peat 3rd
Garnet 1st Talc, Zinc 4th
NY Rank by Value
Crushed Stone 1st Sand & Gravel 4th
Cement 2nd Zinc 5th
Salt 3rd Wollastonite 6th
Common Mine Types
Sand & Gravel 1,734
Limestone 80
Bluestone 83
Owner Type
Industry 1,708
County 49
Town 395
Net Affected Acreage 49,076
Life-of-Mine Acreage 119,183
Reclaimed Acreage, 2008 1,842
Reclaimed Since 1975 28,520
Financial Security - In 2008 New York re-quired $167.5 million to guarantee mine site reclamation.
Oil, Gas and Solution Mining Inspections - Staff traveled 95,672 miles and performed 2,445 oil and gas inspections.
Permits and Completions
Gas: Permits 429 Completions 270
Oil: Permits 250 Completions 172
Other: Permits 58 Completions 58
Total: Permits 737 Completions 500
Wells Reported (All Types) 2008 - 14,513
Wells To Date (All Types) - 75,000; majority pre-regulation (most plugging status unknown).
Production and Market Value
Gas 50.320 bcf Value Down 7%
Oil 397,060 bbl Value Up 25%
Total O&G Mkt Value $488 million
State Leasing - 91 leases were in effect covering 63,591 acres; 266 producing wells.
Revenues from Oil and Gas
State Revenues $3.1 million
Local Govt. Taxes (est.) $14.6 million
Landowner Royalties (est.) $61.0 million
Underground Natural Gas Storage - 24 facilities were 79% full at year-end.
Total Storage Capacity 223 bcf
Working Gas Capacity 113 bcf
Max. Deliverability 2.127 bcf/day
Solution Mining - Five facilities produced 1.93 billion gallons of brine, equal to 2.25 million metric tons of salt.
Financial Security - In 2008 New York held $24.7 million to guarantee well plugging and site reclamation.
Executive Summary

New York State Oil, Gas and Mineral Resources, 2008
NYS DEC - Division of Mineral Resources 5 Twenty-Fifth Annual Report
New York State gas production in 2008 was 50.320 billion cubic feet (bcf), down 8.4% from the previous year. Trenton-Black River production declined, but still accounted for 69%(34.8 bcf) of 2008 production. Oil production rose 3% to 397,060 barrels in 2008. The total number of wells completed dropped 6% from 2008, but the number of gas wells completed (270) remained almost exactly the same as the previous year. Four new Trenton-Black River gas fields started production in 2008: Dry Run Creek and Lamoka in Steuben County, Skye-Top in Chemung County, and Halsey Valley in Tioga County. In 2008 drilling permits rose 28% to 737, which is close to permit levels in 1983-1984, another period of high activity. Total drilled depth of the wells for the year was over 1.37 million feet (more than the distance from Schenectady to Buffalo). Drilling rig availability continued to be a significant concern for New York’s oil and gas operators. By year-end 2008 a total of 19 deep wells had been drilled on or adjacent to State land. In 2008 New York collected $2.0 million in royalties from the wells draining State land. Steuben County had the most State acreage under lease. In 2008 the Division of Mineral Resources conducted 42 compulsory integration hearings, which resulted in 36 finalized orders. The remaining orders were referred to the Office of Hearings and Mediation Services for adjudication on issues including data and site access, assessment of risk penalties, and pipeline costs. Marcellus permit activity increased greatly in 2008. The Division received a total of 58 Mar-cellus permit applications (45 vertical, 13 hori-zontal). Six vertical Marcellus wells were spud in 2008 in Allegany, Chemung and Chenango counties. The 2008 activity brought the State’s total number of Marcellus producing wells to 15.
Division of Mineral Resources Program Highlights
In 2008 there were 2,166 active DEC-regulated mines in New York State, a drop of 27 mines from 2007 and the tenth straight year of decline. Increasingly, mine operators are choosing to replace production by expanding current mines, rather than opening new ones. This trend holds true for both sand and gravel mines and hardrock quarries. Only 37 of the 462 mining permits issued in 2008 were for new facilities. Nevertheless, production of the State’s major mined commodities remains relatively level from year to year. The U.S. Geological Survey estimates the annual value of New York’s mineral production at roughly $1.3 billion. Mining is spread fairly evenly across the State because of the need to keep trucking distances down and reduce the cost of transporting heavy materials. Sand and gravel mines account for over 80% of DEC-regulated mines and 29 of the new permits issued in 2008, or 78%, were for sand and gravel. Interest in bluestone mining remained steady in 2008. One new mine was permitted and seven Exploration Authorizations were issued to mine operators allowing them to evaluate potential bluestone sites for a limited period of time (one year with possible one-year renewal). A total of 49,076 acres were affected by mining in 2008 out of a total approved life-of-mine area of 119,183 acres. The Division continued to have success promoting concurrent reclamation with 1,205 acres reclaimed at 97 operating mines. Final reclamation of 637 acres occurred at 74 closed mines bringing the 2008 total to 1,842 acres. Roughly 28,520 acres of land affected by mining have been reclaimed since 1975. In 2008 the Division held over $167.5 million in financial security to guarantee mine reclamation. The increase of $28 million from the previous year was due, in part, to a new method for calculating financial security introduced in 2006. The improved method brings financial security requirements more in line with modern-day reclamation costs.

New York State Oil, Gas and Mineral Resources, 2008
NYS DEC - Division of Mineral Resources 6 Twenty-Fifth Annual Report
General Information
Executive Summary.............................................................................................................................4 Division of Mineral Resources Program Highlights ..........................................................................5 Map 1- Division of Mineral Resources Regional Service Areas ........................................................8 Oil and Gas Program Section
2008 New York Oil and Gas Industry At a Glance.................................................................. 9
Market Value and Economic Benefits ........................................................................................ 10 Production of Oil and Gas........................................................................................................... 11 Drilling Permits and Well Completions...................................................................................... 17 Marcellus and Other Shales ........................................................................................................ 18 Compliance and Enforcement..................................................................................................... 20 State Land Leasing...................................................................................................................... 21 Plugging Permits and Bonds....................................................................................................... 22 Abandoned and Orphaned Wells ................................................................................................ 22 Underground Gas Storage........................................................................................................... 25 Solution Salt, Geothermal and Stratigraphic Wells .................................................................... 26 Carbon Capture and Storage ....................................................................................................... 27
Maps
Map 2 - New York State Gas Production by Town, 2008 ................................................................13 Map 3 - Trenton-Black River Fields, Central New York, 2008........................................................15 Map 4 - Marcellus Wells (2008 Production) and Marcellus and Utica Shale Areas ........................19 Map 5 - Underground Gas Storage and Solution Salt Mining Fields, 2008 .....................................24
Charts
Chart 1 - New York State Oil and Gas Production, 1999 - 2008......................................................10 Chart 2 - Producing Formation for NY Natural Gas, 2003 - 2008 ...................................................11 Chart 3 - Drilling Permits and Completions, 1999 - 2008 ................................................................17
Tables
Table 1 - Top 10 Gas Counties, 2008................................................................................................11 Table 2 - Top 10 Gas Producing Companies, 2008 ..........................................................................12 Table 3 - Top 10 Oil Producing Companies, 2008............................................................................12 Table 4 - Production by Geologic Formation, 2008..........................................................................14 Table 5 - Top 10 Wells, Trenton-Black River Production, 2008......................................................16 Table 6 - Top 10 Fields, Trenton-Black River Production, 2008 .....................................................16 Table 7 - Total Leasing Revenues, 2003 - 2008................................................................................19 Table 8 - Plugged Wells, 2008 ..........................................................................................................20
Table of Contents

New York State Oil, Gas and Mineral Resources, 2008
NYS DEC - Division of Mineral Resources 7 Twenty-Fifth Annual Report
Technology - Making Our Information Easy to Use......................................... 28 Mined Land Program Section 2008 New York Mined Land Reclamation Program At a Glance........................................ 29
Mined Land Program Overview........................................................................................................31 Types of Mines in New York ......................................................................................................31 Permits Issued, 2008....................................................................................................................31 Geographic Distribution of Mines...............................................................................................31 Owner Type .................................................................................................................................32 Annual Regulatory Fees ..............................................................................................................32 Trends in Mine Size and Number................................................................................................35 Mine Acreage Statistics ...............................................................................................................35
Reclamation and Financial Security..................................................................................................36 Reclaimed Land Uses ..................................................................................................................36 Financial Security ........................................................................................................................36 Reclamation of Abandoned Mines ..............................................................................................36 2008 Reclamation Highlights ......................................................................................................37 Compliance and Enforcement ..........................................................................................................37 Inspections ...................................................................................................................................37 Violations and Fines ....................................................................................................................37 Other Significant Items................................................................................................................40
Maps
Map 6 - Mines in New York State, 2008 .................................................................................... 30
Tables
Table 9 - New Mines, 2008 ...............................................................................................................31 Table 10 - Permits, 2004 - 2008 ........................................................................................................31 Table 11 - Counties with Highest Percentage of Land Under Mining Permit, 2008........................32 Table 12 - Number of Permits and Acreage by County, 2008..........................................................33 Table 13 - Range of Existing Mine Sizes, 2003 - 2008 ....................................................................35 Table 14 - Reclamation Acreage Summary by County, 2008...........................................................38
2008 Fact Sheets: Products of New York State Mines
Details on the economic rank for major mine products and location of the largest mines Appendices
Appendix 1 - Oil and Gas Data Appendix 2 - Mined Land Data

hghg
hg
hghg
hg
hg
hghg
hg
hg
hg
hg
hg
hg
hg
hg
hg
hg
hg
hg
hg
98 7
65
4
3
12
Allegany Office(O&G Region 9)182 E Union St
Allegany, NY 14706-1328Ph: 716-372-0645Fax: 716-372-2113
Avon Office(O&G Regions 6, 7, 8)6274 E Avon-Lima Rd
Avon, NY 14414Ph: 585-226-5471Fax: 585-226-9034
CHAUTAUQUA CATTARAUGUS ALLEGANY
ERIE
NIAGARA ORLEANS
STEUBEN
LIVIN
GSTON
SCHUYLER
CHEMUNG
GENESEE
WYOMING
MONROE WAYNE
ONTARIO
YATES SEN
ECA
CAY
UG
ATOMPKINS
TIOGABROOME
CHENANGOCORTLAND
ONONDAGA
OSWEGO
JEFFERSON
LEWIS
ONEIDA
MADISON
ST LAWRENCEFRANKLIN
CLINTON
ESSEX
HAMILTON
HER
KIM
ER
OTSEGO
DELAWARE
MONTGOMERY
FULTON
WARREN
SARATOGA
WAS
HIN
GTO
NR
ENS
SELA
ER
ALBANYSCHENECTADY
GREENE
CO
LUM
BIA
ULSTER
DU
TCH
ESS
SULLIVAN
ORANGE PUTNAM
ROCK-LAND
WEST-CHESTER
NASSAU
SUFFOLK
Central Office(O&G Regions 1-5)
625 Broadway, Third FloorAlbany, NY 12233-6500
Ph: 518-402-8056Fax: 518-402-8060
Schenectady Office1150 N. Westcott Rd.
Schenectady, NY 12306Ph: 518-357-2162 Fax: 518-357-2460
New Paltz Office21 South Putt Corners Rd.
New Paltz, NY 12561-1696Ph: 845-256-3027Fax: 845-255-3414
Stony Brook OfficeSUNY - Bldg. 40
Stony Brook, NY 11790Ph: 631-444-0274Fax: 631-444-0272
Warrensburg Sub Office232 Hudson St.P.O. Box 220
Warrensburg, NY 12885Ph: 518-623-1271 Fax: 518-623-3603
Ray Brook OfficeRoute 86
P.O. Box 296Ray Brook, NY 12977-0296
Ph: 518-897-1305 Fax: 518-897-1370
Syracuse Office615 Erie Blvd. West
Syracuse, NY 13204-2400Ph: 315-426-7461Fax: 315-426-7459
Watertown OfficeState Office Building317 Washington St.
Watertown, NY 13601Ph: 315-785-2293 Fax: 315-785-2242
Utica Sub Office207 Genesee St.
Utica, NY 13501Ph: 315-793-2664Fax: 315-793-2748
hg Mined Land and Oil & Gas
hg Mined Land
hg Other DEC Offices
Map 1 - Division of Mineral Resources Regional Service Areas
NYS D
EC D
ivision of Mineral Resources
Twenty-Fifth Annual Report
8
New
York State Oil, G
as and Mineral Resources, 2008

New York State Oil, Gas and Mineral Resources, 2008
NYS DEC - Division of Mineral Resources 9 Twenty-Fifth Annual Report
2008 New York Oil & Gas Industry At a Glance
Natural Gas & Oil Abbreviations
Abbreviations for natural gas volume measurements:
mcf thousand cubic feet mmcf million cubic feet bcf billion cubic feet
Crude oil is also measured by vol- ume. One barrel equals 42 gallons.
bbl barrel * 2005 NYS Energy Fast Facts, NYSERDA
Roughly 4.2 million households in New York use natural gas for home heat, cooking and heating water. It takes just 69 mcf per year to heat the average New York home.* The State’s 2008 production of 50.3 bcf was enough to heat 729,269 homes.
What’s an MCF Do ?
Underground Gas Storage 24 facilities, 79% full at year-end Total Storage Capacity 223 bcf Working Gas Capacity 113 bcf Max. Deliverability 2.127 bcf/day
Solution Mining Five facilities produced 1.93 billion gallons of brine (2.25 million metric tons salt)
All Reported Wells 14,513
Active Wells
Natural Gas 6,675 Oil 3,617 Gas Storage 929 Solution Salt 131 Revenues In Millions
State Leasing $2.2 Million Local Govt. (est.) $14.6 Million Landowner Royalties (est.) $61.0 Million
Financial Security Plugging & Reclamation
$24,663,543
Production and Market Value Gas 50.320 bcf Value down 7% Oil 397,060 bbl Value up 25% Total Market Value $488 Million
State Leasing
91 leases covered 63,591 acres 226 productive wells

New York State Oil, Gas and Mineral Resources, 2008
NYS DEC - Division of Mineral Resources 10 Twenty-Fifth Annual Report
State Lease Oil and Gas Prices The average wellhead natural gas price of $8.94 per mcf in 2008 was up slightly from $8.85 in 2007. The average 2008 oil price of $99.29 per bbl was up 26% from $78.59 in 2007. These average prices were obtained from royalty payments made to New York for leases on State lands. Landowner Royalties and Landowner Wells The majority of landowners with producing oil and gas leases receive a royalty from the well operator. Based on an average royalty of one-eighth of the production value, the Division estimates that landowners in New York received roughly $61 million in royalties in 2008. In addition, roughly 500 of New York’s gas well operators (mostly landowners) own just one well. Typically, the wells are no longer considered commercially productive, but can provide enough gas to help reduce or eliminate the landowner’s home heating costs.
Market Value Estimated total market value for New York’s oil and gas decreased 6% to $488 million in 2008. Breaking down the figures in more detail, the value of natural gas decreased from $486 million in 2007 to $450 million in 2008. New York produces much less oil than gas, but oil’s market value rose by 25%, from $30.4 million in 2007 to $38.1 million in 2008. Tax Revenues to Local Governments Communities in oil and gas producing areas also benefit from the industry’s activity. The Division estimates that real property taxes on 2008 production totaled roughly $14.6 million, a 6% decrease from the previous year. To dampen the impact of fluctuating oil and gas prices, local governments assess their taxes on a unit of production value determined by the NY State Division of Equalization and Assessment using a five-year average.
Market Value and Economic Benefits
0
10,000
20,000
30,000
40,000
50,000
60,000
1999 2000 2001 2002 2003 2004 2005 2006 2007 20080
50
100
150
200
250
300
350
400
450
Gas
(mm
cf)
Chart 1 - New York State Oil and Gas Production, 1999 - 2008 O
il (1
,000
bbl
)
Crude Oil Natural Gas

New York State Oil, Gas and Mineral Resources, 2008
NYS DEC - Division of Mineral Resources 11 Twenty-Fifth Annual Report
Production of Oil and Gas
Natural Gas Production New York’s reported natural gas production for 2008 was 50.320 bcf, down from 54.619 bcf in 2007. Roughly 34.8 bcf of gas came from just 100 producing Trenton-Black River wells, with one (1) well alone producing 2.1 bcf. Production from other formations rose 14% as a group, with notable increases from the Queenston (49%) and Herkimer-Oneida-Oswego (135%). In 2008 Steuben County was the top gas-producing county. Steuben and Chemung coun-ties accounted for 65% of New York’s 2008 pro-duction. Chautauqua County continued to rank third (see Table 1). Oil Production In 2008 New York’s oil production rose 3% to 397,060 barrels, the highest since 1992. From 2005 to 2008 oil reserves more than doubled. Top Producers In 2008 the top gas producer was Fortuna Energy Inc., at 31.34 bcf of gas, and the top oil producer was East Resources, at 122,832 bbl of oil. Tables 2 and 3 on page 12 show the top 10 oil and gas producers. Tables 5 and 6 on page 16 show the top 10 Trenton-Black River wells and fields.
For Further Details Map 2 on page 13 gives production information by town. Table 4 on page 14 gives production by geologic formation. For further production de-tails, please visit our website at www.dec.ny.gov/energy/1601.html .
Trenton Black River
Other
Chart 2 - Producing Formation for NY Natural Gas, 2003 - 2008
Table 1 - Top 10 Gas Counties, 2008
County Gas (mcf) Active Gas Wells
Average mcf/Well
Steuben 17,146,368 69 248,498
Chemung 15,626,276 43 363,402
Chautauqua 6,758,069 3,438 1,966
Erie 1,961,665 961 2,041
Seneca 1,606,948 214 7,509
Cattaraugus 1,593,604 528 3,018
Schuyler 1,060,947 18 58,942
Tioga 1,038,093 1 1,038,093
Cayuga 838,287 291 2,881
Genesee 767,032 519 1,478
0102030405060
2003 2004 2005 2006 2007 2008
BC
F

New York State Oil, Gas and Mineral Resources, 2008
NYS DEC - Division of Mineral Resources 12 Twenty-Fifth Annual Report
Table 3 - Top 10 Oil Producing Companies, 2008
Company 2008 Oil (bbl)
1. East Resources, Inc. 122,832
2. McCracken, Carl A. III 35,081
3. Case Brothers Inc. 29,849
4. Dallas Energy, LLC 23,206
5. Copper Ridge Oil, Inc. 21,163
6. Nathan Petroleum Corp. 11,781
7. Johnson, Mark & Troy 10,806
8. Otis Eastern Service, Inc. 10,003
9. Pefley Oil & Gas, Inc. 8,757
10. Snyder Brothers, Inc. 7,647
2007 Rank
1
2
3
6
10
4
8
5
>10
>10
2008 Change
-34%
+42%
+102%
+143%
+183%
-9%
+44%
-14%
+497%
+35%
Table 2 - Top 10 Gas Producing Companies, 2008
Company 2008 Gas (mcf)
1. Fortuna Energy, Inc. 31,344,702
2. Chesapeake Appalachia, LLC 5,579,586
3. Range Resources-Appalachia, LLC 2,288,171
4. U. S. Energy Development Corp. 1,601,132
5. EnerVest Operating, LLC 1,142,917
6. Nornew, Inc. 1,068,956
7. United States Gypsum Co. 558,918
8. Stedman Energy, Inc. 530,507
9. Universal Resources Holdings, Inc. 468,164
10. Seneca Resources Corp. 428,129
2007 Rank
1
2
3*
5
New**
4**
6
>10
9
7
2008 Change
-20%
+63%
-9%
+66%
NA
-45%
-1%
+27%
+5%
-10%
* Transfer from Great Lakes Energy ** Well transfers from Nornew to EnerVest

Map 2 - New York State Gas Production by Town, 2008
NYS D
EC D
ivision of Mineral Resources
Twenty-Fifth Annual Report
13
New
York State Oil, G
as and Mineral Resources, 2008
Gas1 - 100,000
100,001 - 300,000
300,001 - 500,000
500,001 - 7,000,000

New York State Oil, Gas and Mineral Resources, 2008
NYS DEC - Division of Mineral Resources 14 Twenty-Fifth Annual Report
To see a stratigraphic column of New York’s geologic formations go to http://www.dec.ny.gov/energy/33893.html
Table 4 - Production by Geologic Formation, 2008
Formation Wells1 Gas (mcf) Oil (bbl)
Devonian Shale 28 24,523 0
Undifferentiated Canadaway Group
4,441 355,612 292,553
Perrysburg 1,069 297,751 68,140
Tully 11 16,958 1,058
Hamilton 3 0 0
Marcellus 28 64,063 0
Onondaga 76 48,537 1,528
Oriskany 40 190,854 0
Helderberg 1 0 0
Akron 29 13,708 0
Herkimer-Oneida-Oswego
79 935,557 0
Medina 6,551 10,302,222 1,412
Bass Island 82 136,516 13,614
Queenston 589 2,460,968 0
Trenton 13 41,872 0
Black River 138 34,768,042 0
Little Falls 1 10,674 0
Theresa 25 534,866 0
Other 478 117,160 5,500
1 Active, temporarily abandoned and shut-in wells
2 Undifferentiated Canadaway Group includes Glade, Richburg, Bradford, and other well-known oil producing formations
2

!(
!(
!(
!(
!(!(
!(!(!(
!(
!(
!(
!( !(
!(
Ballyhack Creek
Pine Hill
Guyanoga Valley
Glodes Corners Road
Muck Farm
Sugar Hill
Sexton HollowMcNutt Run
Zimmer Hill
Wilson Hollow
Cutler CreekRiverside
Whiskey Creek
Caton
Seeley Creek
Laurel Run
Quackenbush Hill
County LineTerry Hill South
Langdon Hill
Darling CreekVeteran Hill
Goundry Hill
Stony Ridge
Howland Hill
Meads Creek
South CorningCooper Hill
Cleveland HillRayner
Oak Hill
Beans Station
Forest Hill
John Hill
Lamoka
Dry Run Creek
Skye-TopBrickhouse
Latta BrookHalsey Valley
NYS D
EC D
ivision of Mineral Resources
Twenty-Fifth Annual Report
New
York State Oil, G
as and Mineral Resources, 2008
15
Map 3 - Trenton-Black River Fields, Central New York, 2008*
* Includes historic fields not currently producing

New York State Oil, Gas and Mineral Resources, 2008
NYS DEC - Division of Mineral Resources 16 Twenty-Fifth Annual Report
Table 6 - Top 10 Fields, Trenton-Black River Production, 2008
Field Name
2007 Production
(bcf)
2008 Production
(bcf)
Cumulative Production
Year-End 2008
Quackenbush Hill 9,555,996 7,801,356 95,729,531
Rayner 3,978,014 2,728,342 12,445,618
Langdon Hill 1,716,659 2,260,014 11,481,080
Wilson Hollow 3,291,519 2,111,885 44,163,535
Darling Creek 3,973,466 1,530,278 9,443,618
Whiskey Creek 952,809 860,383 5,668,875
Seeley Creek 860,920 398,253 5,864,319
Muck Farm 469,284 351,543 9,211,522
Terry Hill South 446,737 231,748 8,871,405
Glodes Corners Road 155,487 144,410 10,027,556
First Year of
Production
2000
2005
2001
1999
2006
2003
2004
1999
2001
1996
Table 5 - Top 10 Wells, Trenton-Black River Production, 2008
Well Name
API Identification
Number
2008 Production
(bcf)
County/ Field
Gross D1 31101239020000 2,115,603 Steuben/Quackenbush Hill
Dzybon 1 31101238670000 1,967,857 Steuben/Forest Hill
Hartman, BJ 1 31101232270000 1,622,600 Steuben/Rayner
Drumm J. 1A 31101239850100 1,618,175 Steuben/Green Hill
Stoscheck 1 31015238140000 1,530,278 Chemung/Darling Creek
Lovell 1323 31015228310000 1,470,724 Chemung/Quackenbush Hill
Cotton-Hanlon 2 31015239870000 1,208,513 Chemung/Cramer Hollow
Gillis 1 31101231100000 1,105,742 Steuben/Rayner
Michaloski 1 31101239210000 1,038,255 Steuben/Caton
Winter G 1A 31107238550100 1,038,093 Tioga/Halsey Valley

New York State Oil, Gas and Mineral Resources, 2008
NYS DEC - Division of Mineral Resources 17 Twenty-Fifth Annual Report
0
100
200
300
400
500
600
700
Drilling Permits and Well Completions
Drilling Permits DEC issued 737 drilling permits in 2008, up 28% from the previous year. This included 430 natural gas, 250 oil, 22 geothermal, 14 brine, 12 strati-graphic, and 9 underground gas storage permits. In 2008 DEC issued permits for wells in 25 coun-ties; the top 3 were Chautauqua County (142), Cattaraugus County (140), and Allegany County (134). Most of the oil drilling permits were issued for Allegany (125) and Cattaraugus (94) counties. Chautauqua (117) and Erie (72) counties had the highest number of gas permits. Well Spuds and Completions The number of wells spud (started) in 2008 was 562. The number of permits issued in 2008 was up 28% from the previous year. The total number of completions decreased 6% to 500. Gas well
completions remained almost exactly the same as in 2007. Oil well completions fell by 13% from 2007. Wildcats and Extensions Operators drilled 68 gas wildcat wells, 1 oil wild-cat well, and 18 gas extension wells in 2008. Formations Permitted Industry interest in the Black River and Trenton formations continued, with 33 permits issued in 2008. Other primary gas targets included the Me-dina and Queenston for a total of 331 permits. The Division issued 246 permits for the State’s main oil-producing formations (Perrysburg and Undifferentiated Canadaway Group). Nine per-mits were issued for the Marcellus in 2008, and 5 vertical Marcellus wells were drilled during the year.
Chart 3 - Drilling Permits and Completions, 1999 - 2008
Drilling Permits, 2008 Gas 429
Oil 250
Other 58
Total 737
Well Completions, 2008 Gas 270
Oil 172
Other 58
Total 500
Permits Completions
1999 2000 2001 2002 2003 2004 2005 2006 2007 2008

New York State Oil, Gas and Mineral Resources, 2008
NYS DEC - Division of Mineral Resources 18 Twenty-Fifth Annual Report
Marcellus and Other Shales
The Marcellus Shale is a black shale that forms the basal unit of the Hamilton Group in New York State. It is geographically extensive, cover-ring an area of approximately 54,000 square miles in the Appalachian Basin states of Kentucky, New York, Ohio, Pennsylvania, and West Virginia. A 2002 estimate by the U.S. Geological Survey put basin-wide Marcellus natural gas reserves in the range of 30 trillion cubic feet (tcf). However, by 2008 the estimate had climbed closer to 400 tcf based on continued evaluation of Marcellus drilling in Pennsylvania and West Virginia. In 2008 DEC received 58 permit applications for Marcellus wells and 13 of those were for hori-zontal wells. New York State’s 2008 Marcellus production totaled 64,063 mcf from 15 vertical wells. The Marcellus is one of several important low-permeability shale gas reservoirs in New York State; the Utica Shale in Otsego County and the Trenton Group shales in Madison County also continue to attract interest. Advances in horizontal drilling and hydraulic fracturing technologies, together with a sharp rise in natural gas commodity prices, spurred leasing activity. The Marcellus became the focus of a great deal of activity in the Appalachian Basin during 2008. Landmen were seeking to lease mineral rights in Delaware, Broome, Sullivan, and other counties. Press reports stated that signing bonuses up to $2,700/acre and royalty payments of up to 18% were being offered to landowners. Landowner coalitions formed all along the Southern Tier, with one 300-member group in the New York-Pennsylvania border region near Port Jervis, NY executing a lease for roughly $90 million. Some of the more active players in this “gas rush” were Chesapeake Appalachia, LLC; Fortuna Energy, Inc.; and East Resources, Inc. As a result of the heightened activity, Division staff spent considerable time with municipal and county leaders, as well as with members of the public, discussing the State’s Oil and Gas Regulatory Program.
On July 23, 2008, the Governor signed amend- ments to Article 23 of the Environmental Conservation Law designed to address well spacing for horizontal wells. Importantly, the Governor also directed DEC to prepare a Supplement to its 1992 Generic Environmental Impact Statement on the Oil, Gas and Solution Mining Program (GEIS) to address horizontal drilling and high volume hydraulic fracturing in the Marcellus Shale and other low permeability natural gas reservoirs. The document’s development began with six Scoping Meetings held in the Southern Tier from November to early December 2008, where the public could recommend topics to be covered in the Supplemental GEIS (SGEIS); DEC also accepted comments submitted directly to the agency until mid-December. Upon completion of the Scoping Process, the list of potential impacts to be covered included: visual; noise; air quality; water resources; significant habitats and endangered species; invasive species; floodplains; wetlands; road use; cumulative impacts; community character; and areas of historical, architectural, and archeological significance. Historically, shale wells in New York have been drilled vertically and then hydraulically fractured with 80,000 gallons or less of water. However, based on recent successes in shale plays in other states, the most efficient method for developing low-permeability shale reservoirs is now horizontal drilling combined with high-volume hydraulic fracturing. Horizontal drilling is not new to New York State; it was used to develop the Trenton-Black River play in the south-central Finger Lakes Region. However, high-volume hydraulic fracturing - using millions of gallons of water per well - was never contemplated during preparation of the GEIS and, is, therefore, being addressed in the SGEIS. Map 4 shows the approximate area of interest in the Marcellus (roughly where the formation is 2,000 or more feet deep) and the Marcellus and Utica fairways, as mapped by the NYS Geologic Survey. A fairway is the area considered likely to produce economic quantities of gas.

#
#
#
#
######
##
###
NYS D
EC D
ivision of Mineral Resources
Twenty-Fifth Annual Report
New
York State Oil, G
as and Mineral Resources, 2008
19
Map 4 - Marcellus Wells (2008 Production) and Marcellus and Utica Shale Areas
Legend# 2008 Marcellus Producing Gas Wells
Marcellus 2000' Depth
Marcellus and Utica fairways (after NYSGS)
Note: Tan area represents fairway overlap

New York State Oil, Gas and Mineral Resources, 2008
NYS DEC - Division of Mineral Resources 20 Twenty-Fifth Annual Report
Inspections In 2008 Oil and Gas staff traveled 95,672 miles to perform 2,445 well site inspections. Staff inspect well sites:
• during permit application review to check environmental and public safety issues;
• during drilling to check on well site construc-tion and drilling permit compliance;
• during the operating phase to check for leaks, spills, or other potential problems;
• to ensure that well plugging and site reclama-tion meet requirements; and
• upon receipt of a well transfer request.
DEC staff perform follow-up inspections to en-sure any violations are properly remediated. Compliance Enforcement Violations are handled with a mixture of enforce-ment tools, remediation requirements and penal-ties. In 2008 the Oil and Gas Program assessed $10,500 in fines and penalties. Permit Fees Total oil and gas permit fees collected by the Division equaled $908,090 in 2008, of which $73,700 was deposited in the Oil and Gas Ac-count; this fund is dedicated to plugging orphan and abandoned wells.
Compliance and Enforcement
DEC Oil and Gas staff perform over 2,000 well inspections per year. Here the inspector is checking to make sure the well is in compliance before DEC approves transfer of the well to a new company.

New York State Oil, Gas and Mineral Resources, 2008
NYS DEC - Division of Mineral Resources 21 Twenty-Fifth Annual Report
State Land Leasing
At the end of 2008 the Division managed 91 leases covering roughly 63,591 acres of State land, a decrease from the previous year’s 83,021 acres. The big drop was from expiration of 15 leases awarded at the 2003 lease sale. The roughly 20,000 acres of land involved could be offered for lease again in a future sale. At year-end 2008 the State was earning royalties from 108 productive oil and gas wells physically located on State lands and another 118 producing wells on adjacent or unitized lands. These wells are associated with 61 State leases. The 226 wells produced 17.8 bcf of natural gas and 4,819 bbl of oil. The average prices paid were $8.95 per mcf for gas and $89.13 per barrel of oil. In 2008 the State received total leasing revenues of $2.2 million, down 82% from $11.8 million in 2007. The steep drop was due to the fact that no
lease sale was held in 2008. • Delay Rentals - Operators submitted a total of $97,269 in delay rentals. This figure was down 42% from the $166,868 collected in 2007. • Royalties - The State received $1,866,519 in royalty revenue from oil and gas production on 61 leases in nine counties (32,452 acres), down 24% from $2,466,312 in 2007. • Storage Leases - Fourteen storage leases added $211,927, up 59% from 2007. The majority of New York’s storage lease acreage is in Cattaraugus County. • Bonus Bids - No bonus bids were received because there was no State land lease sale in 2008.
DEC Wildlife Mgmt. Areas
1,059 Acres
DEC State Forests
51,610 Acres
10,922 Acres
Other State Agencies
DEC Managed Oil and Gas Leases
Table 7 - Total Leasing Revenues, 2003 - 2008
2003 $5,326,927
2004 $765,782
2005 $3,439,670
2006 $3,296,932
2008 $2,175,715
2007 $11,767,813
For more information, see the 2008 Oil & Gas Leasing Report at http://www.dec.ny.gov/energy/1579.html

New York State Oil, Gas and Mineral Resources, 2008
NYS DEC - Division of Mineral Resources 22 Twenty-Fifth Annual Report
2008 Plugged Wells and Bonds At year-end DEC held $24.7 million in financial security to guarantee well plugging and well site reclamation. This represented an increase of 7% from $23.1 million in 2007. At the end of production a well must be plugged with cement at proper intervals, the equipment must be removed, and all disturbed land, including the access road, must be reclaimed. In 2008 operators plugged 221 wells in accordance with requirements set by DEC in plugging permits. Much of the plugging activity was in the old oilfields of western New York. Almost 78% of the plugging jobs were oil wells, 17% gas wells, and the remaining 4% a mix of other regulated well types. Plugging occurred in 16 counties, however, almost 50% of the plugging jobs were in Allegany County and another 30% were in Cattaraugus County. The vast majority of plugging jobs involved old oil wells, particularly in the Richburg Field.
Plugging Permits and Bonds
Table 8 Plugged Wells, 2008
Oil 172
Gas 37
Other 12
Total 221
Financial Security, 2008
$24.7 Million
Abandoned and Orphaned Wells
Old Historic Well Problems Abandoned wells can leak oil, gas and/or brine; underground leaks may go undiscovered for years. These fluids can contaminate ground and surface water, kill vegetation, and cause public safety and health problems. Historically, abandoned wells have been discovered in the woods, along roadsides, and in residential yards, playgrounds, and parking lots. They’ve even been discovered inside buildings, and underwater in wetlands, streams and ponds.
2008 Status Report Abandoned, unreported and inactive wells continued to be a problem despite high oil and gas prices. In 2008 a total of 284 operators reported 3,071 wells with zero production. Another 133 unreported wells are considered abandoned. This is in addition to over 4,717 orphan wells in the Department’s records. Enforcement actions have reduced the number of unreported wells, but their numbers remain significant.
Some of this plugging activity can be attributed to the recent high prices for oil. During the process of redeveloping an old oilfield, operators may need to plug old or inactive wells.

New York State Oil, Gas and Mineral Resources, 2008
NYS DEC - Division of Mineral Resources 23 Twenty-Fifth Annual Report
DEC has at least partial records on 39,000 wells, but estimates that over 75,000 oil and gas wells have been drilled in the State since the 1820s. Most of the wells date before New York established a regulatory program. Many of these old wells were never properly plugged or were plugged using older techniques that weren’t as reliable and long-lasting as modern methods. Every year while conducting scheduled inspec-tions or investigating complaints, DEC staff discover more abandoned wells. Extensive courthouse research is often required to identify a well’s previous owners. Many of these cases take several years to resolve as DEC pursues legal action against the responsible parties. Oil & Gas Account New York has an Oil and Gas Account which was created to plug problem abandoned wells. It is funded by a $100 per well permit fee; at the end of 2008 the balance was $377,824. DEC has over 600 wells on its priority plugging list. Since the funds are insufficient to plug all the priority wells, DEC continues to pursue other mechanisms to plug abandoned wells. DEC-Coordinated Plugging Efforts In 2008 Division staff worked on Oil and Gas Account contracts for two major plugging projects involving abandoned oil wells. One was a $190,000 contract to plug 45 wells on the Thornton-Bradley and Warfield leases in the Town of Alma, Allegany County. The wells were in an advanced state of disrepair. The plugging contract was formally approved in 2008, but field crews to perform the work could not be scheduled until the spring of 2009. The other project involved a $150,000 contract to plug 25 wells on the Knox Lease in Cattaraugus County. The wells were causing water supply contamination problems. Thirteen of the 25 wells on the Knox Lease were plugged in 2007 and the remaining 12 were plugged in early 2008. During the 2008 plugging activity, 4 other abandoned wells were discovered and subsequently plugged. For these 4 wells, the
Division used Environmental Benefit Project funds from an unrelated settlement with Bath Petroleum Storage, Inc. Division staff continued working with the U.S. Environmental Protection Agency (USEPA) and the U.S. Coast Guard (USCG) to plug wells with federal funds from the Oil Pollution Act of 1990. This money can be used for wells that leak oil or threaten to leak oil to the navigable waters of the United States. As a direct result of DEC staff efforts, USEPA has undertaken several plugging projects in New York State. In 2008 USEPA focused on the Moore Lease in the Town of Bolivar, Allegany County. DEC had previously plugged the 43 highest-priority wells on the lease with a $100,000 settlement from the estate, but lacked the funds to tackle the remaining 182 wells. In 2008 USEPA plugged 78 of the wells and agreed to continue the project in 2009. The abandoned and leaking wells on this lease had been the subject of DEC enforcement actions for decades.
Why Do We Keep Finding “New” Abandoned Wells ? Most abandoned wells were drilled many decades ago so:
• they were not registered with the State and there are often no maps available;
• surface equipment is often gone that would make them easier to spot; and
• they may be hidden by thick underbrush, standing water, or other subsequent uses of the land.

!!
!!!!!
!!!
!
!
!!!!!
!
!
!!!
!!!!!!!!!
!!!
!
!
!!!!
!!
!!
!
!!
!!!
!!
!
!
!!!!!!
!!!!
!!!!!!!
!! !!!!!!!!!
!!!!!!!!!!!!!!!!!!!!!
!!!!!!!
!!!!!!
!!!!!!!
!
!
!!!!!!
!!!!!!!!!! !!
!!!!!! !!
!
!
!
!!
!
!!!!!!!!!!!!!!
!!!!!!!
!
!!!!!!!!!!!!!!!
!!!!!!!!!!!!!
!!
!!
#*#*
!
! !!!
!
! !!!
!!!!!
!!!
!! !!!!!!!
!
!
!!!!!!!!!!
!!
!!! !!!!!!!!!!!!!!!!!!!!
!
!
!
!
!!!!!!!!!!!!!!!
!
!!!
!
!!!!!!
!!
!!
!!!!!!!
!!!!!!!!
!!!
!
!!!!!
!!!
!!!!!!!!! !!!!
! !!!!
!
!!!!!!!!!!!!!!!!!!
!
!!!!!!!!!!
!!!!
!!!!!
!!!
!!!!!!!!!!!!!!!!!!
!!!!!!!!!!!!
!
!!!!!!!!
!!!!!!!
!!
!!!!!!!!!!!!!
!!!!
!!!!!!
!
!
!!!!
!!!!!!!!!!!!!!!!!!!
!!!!!!!!!!!!!!!!!!!
!
!!!!!!!!!!!!
!
!!!!!!!!!!!!!!!!!
!!
!
!!!!!!!!!!!!!!!!! !!
!!!
!!!!! !!! !!!!
!!!!!!!!!!!!!! !!!!! !!! !!!!!!!!!!!!!!!! !!!!!!!!! !!!!!!!!!!!!!!!!!!!!!!!!!!!!!!! !!!!! !!!!
!!!!!!!!!
!!!!!
!!!!!!
!!!!!!!!!!! !!!!!!!!!!
!!!!
!!!!!!
!!! !! !!!
!!!! ! !
!!!!!!!!!!
!
!
#*
!!
#*#*#*#*!
!
!
!
!
!!!!!!
#*!!!
#*#*#*#*#*
!!
!!!
!
!
!! !
!
!!!
!!
!
!!
!!!!!
!
!!!
!!!
!!!!
!!!
!!
!!
!!!
!!!!!!
!
!!
!
!
!!
!!!!!!!!!!!!!!!! !!!!!!!!!!!! !!!!!!
!!
! !!
!!! !!!!!!!!
!!
!
!!
!!
!
!
!!
!!
!
!!!
!
!!!
!
!!!!!!
!!!!!!
!
!!
!!!!!!
!!!!
!!
!!!!!!
!!!!
!!!!!!
!
!!!!
!
!
!!
!!!!!!!
!!!!!
!
!!!!
!!
!!!!
!!
!!
!
!!!!!
!!!
!!!!!!!!
!!!
!
!!!!
!
!!
!
!!
!!!
!!
!
!
!!!!!
!!!!
!!!!
!! !!!!!!!!!
!!!!!!!!!!!!!!!!!!!
!!!!!!!
!!
!!!!!!!
!
!
!!!!!!
!!!!!!!!!! !!
!!!!!! !
!
!
!
!!!!
!
!!!!!!!!!!!!!!!!!!!
!!!!!!!
!
!!!!!!!!!!!!!!
!!!!!!!!!!!!!
!!
!!
!
! !!
!
! !!!
!!!!!
!!!
!! !!!!!!!
!
!
!!!!!!!!!!!!
!!
!!! !!!!!!!!!!!!!!!!!!!!
!
!
!!!!!!!!!!!!!!
!
!!!
!
!!!!!!
!!
!!
!!!!!!!
!!!!!!!
!!
!
!!!!!!!!!!!!!!! !!!!
!!!!
!
!!!!!!!!!!!!!!!!!!
!
!!!!!!!!!
!!!!
!!!!!
!!!
!!!!!!!!!!!!!!!!!!
!!!!!!!!!!
!
!!!!!!!!!
!!!!!!!
!!
!!!!!!!!!!!!!
!!!!
!
!!!
!
!
!!!!!!!!!!!!!!!!!!
!!!!!!!!!!!!!!!!!!
!
!!!!!!!!!!!!
!
!!!!!!!!!!!!!!!!
!!
!
!!!!!!!!!!!!
!!!! !!!!!!!!!!
!!!!!!!!!!!! !!!! !! !!!!!!!!!!!!! !!!!!!!!! !!!!!!!!!!!!!!!!!!!!!!!!!!!!!!!! !!!!! !!!!
!!!
!!!!!!!!!! !!!!!!!!!!!
!!!!
!!!!!
!!!! !!!
!!!! ! !
!!!!!
!!!
!!!
!
!
!
!
!
!!!!!!!!!
!!!!!
!!
!!!!
!!! !!!!!!!!!!!!!!!! !!!!!!!!!!!! !!!!!!
!!
! !!
!!!!!
!
!
!!
!!
!
!!!!!!
!!
!!!
!!!!!!!
!
!!
!
!
!
!!!!!!!!!!!!!
!!!#*
Map 5 - Underground Gas Storage andSolution Salt Mining Fields, 2008
Sheridan
NashvillePerrysburg
Lawtons
CollinsZoar
Derby
Colden
Holland
Bennington
Limestone
DaleWyoming Village
Honeoye
Wayne-Dundee
Well Type! Solution Mining
#* LPG Storage
! Natural Gas Storage
W IndependenceE Independence
N Greenwood
SavonaAdrian Reef
Tuscarora
Harford Mills
Reading
Salt Point Storage
Watkins Glen Village
Salt Point Brine
Stagecoach
Greenwood
NYS D
EC D
ivision of Mineral Resources
Twenty-Fifth Annual Report
24
New
York State Oil, G
as and Mineral Resources, 2008
Silver Springs
Beech Hill
Woodhull
WyckoffQuinlan Reef
Thomas Corners

New York State Oil, Gas and Mineral Resources, 2008
NYS DEC - Division of Mineral Resources 25 Twenty-Fifth Annual Report
Underground Gas Storage
In 2008 there were 24 natural gas and 3 liquefied petroleum gas underground storage facilities operating in 10 counties in the western and cen-tral parts of New York State. Natural Gas Storage At year-end 2008 the combined total capacity of all the underground natural gas storage fields in New York State was 223.3 bcf and the maximum deliverability per day was 2.13 bcf. Working gas capacity was 112.7 bcf. Operators reported that these storage fields were 79% full at the end of the year, with 176.0 bcf in storage. Seven different companies operate the 24 under-ground natural gas storage fields in New York State, with over half owned by National Fuel Gas Supply. Twenty-three of the facilities use depleted natural gas reservoirs in the Onondaga, Oriskany and Medina formations and the remain-ing one uses a solution-mined cavern in the Syra-cuse salt formation. These formations range in depth from 1,500 to 5,000 feet below the earth’s surface. In 2008 Division staff received an application for a permit modification for the Thomas Corners storage field in Steuben County. The facility was originally permitted by the Department in 1996, but was never placed in service. Ownership of the facility was transferred to Arlington Storage Company, LLC (ARS) in 2007. The Thomas Cor-ners storage field is projected to be in service in 2009 after additional state and federal review and site construction. Liquefied Petroleum Gas Storage New York’s three liquefied petroleum gas (LPG) underground storage facilities are located in Cort-land, Steuben and Schuyler counties. At year’s end Department records showed Inergy Mid-stream, LLC (Inergy) as the owner of the facility in Steuben County and TE Products Pipeline Company, LLC (TEPPCO) as the owner of the facilities in Cortland and Schuyler counties.
TEPPCO purchased the facility formerly owned by New York LP Gas Storage, Inc. (NYLPG) in Cortland County, and Division staff approved the transfer of the facility’s underground storage permit in February 2007. At year-end 2008 total LPG capacity of the three facilities was 150.90 million gallons, while product in storage was 33.25 million gallons. LPG is stored in underground caverns excavated in the shales of the Genesee Group at the TEP-PCO facility in Schuyler County, and solution-mined out of the Salina Group salt formations at the other two facilities. The Salina Group salt formations are the same rock units mined by New York’s five solution mining facilities. In 2005 the Department and Bath Petroleum Stor-age, Inc. (BPSI) executed an Order on Consent regarding the LPG facility in Steuben County. As the current owner, Inergy assumed responsibility for BPSI’s legal obligations, including the re-quirement to fund an Environmental Benefit Pro-ject to plug orphaned wells. By the end of 2008 Inergy had paid $275,000 into a dedicated ac-count. Permit Applications In 2008 Division staff were also engaged in re-viewing four other permit applications submitted during previous years. The applications included three from National Fuel Gas Supply Corp. (NFGSC) and one from Inergy (originally sub-mitted by BPSI). In addition to conducting its own review of the underground natural gas storage projects, the Department routinely participates as a cooperat-ing agency in the Federal Energy Regulatory Commission’s (FERC) permitting process. Division staff provide input to FERC for Environ-mental Assessments and accompany FERC reviewers on site visits. However, FERC’s juris- diction is limited to interstate natural gas facili-ties, so FERC was not involved in the above-mentioned permit for Inergy’s LPG project.

New York State Oil, Gas and Mineral Resources, 2008
NYS DEC - Division of Mineral Resources 26 Twenty-Fifth Annual Report
Solution Salt, Geothermal and Stratigraphic Wells
Solution Salt New York’s five solution salt mining facilities, operated by U.S. Salt, Cargill, Morton, Texas Brine, and Occidental Chemical, produced 1.93 billion gallons of brine in 2008, a decrease of 2% from 2007. Three of the solution mining facilities are located in Wyoming County and the other two are in Schuyler County. In 2008 solution mining operators submitted 12 drilling permit applications, compared to 13 ap-plications in 2007. Seven solution mining wells were plugged in 2008. The value of New York’s solution salt mining production is estimated at over $100 million. For years New York has ranked third nationally in total volume of salt production (combined brine and rock salt). Geothermal At year-end 2008 the State had 90 geothermal wells that required drilling permits from the Divi-sion of Mineral Resources because they were deeper than 500 feet. While a few deep geother-mal wells can be found scattered around the Capi-tal District, central New York and the Adiron-dacks, the majority are in the New York City area. In 2008 the Division received 24 geothermal well
drilling applications and issued 22 permits, all in New York City or Westchester County. Stratigraphic The Division received 13 drilling permit applica-tions for stratigraphic wells in 2008 and issued 12 permits before the end of the calendar year.
While oil and gas wells are the best known part of the Division’s regulatory program, several other types of wells drilled in a similar fashion are subject to permit requirements. Solution min-ing wells have been drilled into New York’s underground salt beds since the 1800s; the wells inject fresh water and bring up brine. Permits for solution mining wells include special drilling, operating and plugging requirements tailored to that industry. The Division also regulates geothermal and stratigraphic wells over 500 feet deep. Geothermal wells play an important role in energy conservation. Stratigraphic wells provide essential infor-mation on underground rock formations and subsurface conditions.
Geothermal/geo-exchange wells regulated by DEC (deeper than 500 feet) have been drilled to heat and cool a wide range of buildings:
● Residential and Commercial Projects
● Education Center
● Fashion Design Studio
● Historic Buildings
● Library
● Lion House at the Bronx Zoo
● Museum/ Research Facility
● Religious Seminary
Uses for Geothermal Wells

New York State Oil, Gas and Mineral Resources, 2008
NYS DEC - Division of Mineral Resources 27 Twenty-Fifth Annual Report
Carbon Capture and Storage
The Division of Mineral Resources did not receive any applications for carbon capture and storage or geologic sequestration projects in 2008. In fact no such projects currently exist in New York State. However, there is much industry, government and public interest in this concept as one possible means to reduce global warming from CO2 generation and release. Regional Partnership The diversity of carbon dioxide (CO2) sources and storage options throughout the country demands region-specific strategies. The U.S. Department of Energy has created a network of seven Regional Carbon Sequestration Partnerships to help develop the infrastructure and knowledge base needed to jump-start commercialization of CS technologies. New York State is a member of the Midwest Regional Carbon Sequestration Partnership (MRCSP) which is composed of state agencies, universities, private companies and non-governmental organizations. The region includes New York, Ohio, Indiana, Kentucky, West Virginia, Maryland, Pennsylvania and Michigan. MRCSP is assessing carbon sequestration technologies suited to the region, identifying and evaluating appropriate storage locations, and raising awareness of CSS issues. The group is also investigating the recovery efficiencies of various CO2 extraction and sequestration methods in an effort to reduce fuel use and lower project costs. Work done in 2008 by the Division of Mineral Resources supported the efforts of other New York State agency members, including the New York State Energy Research and Development Authority and the New York State Museum. New York’s Potential Once the CO2 has been captured at its source and transported by pipeline, it would then be injected and stored safely in deep underground geologic
formations located more than a half mile below the earth’s surface. In New York State saline (salt-water filled) formations show the greatest promise of providing suitable underground storage sites with the ability to adequately contain the CO2. Not all reservoirs would be suitable, however. A formation’s ability to accept the CO2 at a sufficient injection rate is one of the primary considerations when siting a potential CCS project. The wells needed to inject CO2 into such reservoirs would be very similar to wells the Division of Mineral Resources already regulates at underground natural gas storage facilities. Environmental protection and public safety are the Division’s focus in permitting the drilling, construction and operation of underground natural gas storage wells and facilities. The same in-depth review and oversight would be required for any proposed carbon sequestration project.
Carbon Capture and Storage
Important Terms CO2 is carbon dioxide.
Carbon Capture and Storage (CCS) means capturing CO2 from large point sources, such as fossil fuel power plants, and storing it, primarily in geo-logic formations, instead of releasing it into the atmosphere. Carbon Sequestration (CS) is the term for a broader class of techniques to capture and permanently sequester, or store, CO2 through biological, chemical, or physical processes. It includes CCS defined above.

New York State Oil, Gas and Mineral Resources, 2008
NYS DEC - Division of Mineral Resources 28 Twenty-Fifth Annual Report
Technology - Making Our Information Easy to Use
Detailed Data at Your Fingertips Visitors to our website can easily access data on both mines and wells through our searchable databases. The mining database, which went live in 2008, can be found at http://www.dec.ny.gov/cfmx/extapps/MinedLand/ . You can search on over 20 different parameters and find information on over 3,700 mines and 1,800 mining-related companies. For the commodities parameter, choose from 30 different products to search (bluestone, sand and gravel, granite, etc.) and then further refine the search by county or town, mine name, operator name, or several other choices. The searchable oil and gas database can be found at http://www.dec.ny.gov/cfmx/extapps/GasOil/ . Here you can search over 39,000 wells and 1,000 oil and gas producing companies. The wells data covers company, well type, permitting and drilling history, well completion, objective and producing formations, field designations, spacing status and more. Search by geologic formation, find out how much oil or gas a well has produced, and even check the transfer history of the well. You can also see all these wells and mines on a map using Minerals Mapper at http://www.dec.ny.gov/imsmaps/minerals/viewer.htm . This interactive site allows visitors to produce maps of regulated mines and wells, along with other major geographic features such as town boundaries, roads, railways, stream and lakes, etc. The two searchable databases and the mapping system are updated nightly, so they always provide current information. The Division of Mineral Resources has been a strong user of technology for years. In the early 1980s the Division began computerized tracking of the wells and mines we regulate. The system initially included information just on new permits, but has expanded over the years to include more than 39,000 wells dating back to the
1800s and close to 5,700 mines in operation since the Mined Land Reclamation Law’s effective date of 1975. Early data management systems for both programs were developed in-house. Since 1998 the Division has worked with the Ground Water Protection Council (GWPC), which is a nationwide organization that includes many oil and gas producing states. The GWPC works to promote groundwater protection and also provides technical assistance to member states. One project, developed with funds from the U.S. Department of Energy, is a common database platform called a Risk Based Data Management System (RBDMS). In 2001 the Division developed a similar RBDMS-type database for the Mined Land Reclamation Program. This way both of our regulatory databases are similar in their operation and features. These databases greatly assist our oversight of the respective industries. Increased efficiency provides Division staff with faster access to and more effective use of information for permit reviews and inspections. Other Resources on our Website Both the Mined Land site at http://www.dec.ny.gov/lands/5020.html and Oil and Gas at http://www.dec.ny.gov/energy/205.html have extensive information for regulated parties, local governments, and the public. Both industries can find guidance and resources related to the regulatory process. The public and local governments can also use the website to learn about the Division’s environmental protection requirements. Kids and teachers can find fun educational information. The Convenience of Electronic Reporting Since 1990 the Division has accepted electronic submission of operators’ annual well reports of gas and oil production. This is a time-saving convenience both for operators and Division staff. The Division is now working toward accepting electronically submitted permit applications.

New York State Oil, Gas and Mineral Resources, 2008
NYS DEC - Division of Mineral Resources 29 Twenty-Fifth Annual Report
2008 New York Mined Land Reclamation Program At a Glance
Common Mine Types
Sand & Gravel 1,734 Limestone 80 Bluestone 83 Sandstone 26
Annual Regulatory Fees $2,837,900
Financial Security For Reclamation $167,506,136
U.S. Quantity Rank
Wollastonite 1st Garnet 1st Salt, Peat 3rd Talc, Zinc 4th
Affected & Reclaimed Land Net Affected Acreage 49,076
Life-of-Mine Acreage 119,183
Reclaimed, 2008 1,842 Reclaimed Since 1975 28,520
Active Mines 2,166
Approx. Value $1.3 Billion
Owner Type
Industry 1,708 Government 458 - Local Govt. 444 - State Govt. 14
Regulated Vs. Unregulated Mines
DEC’s statistics in this Annual Report cover only mines regulated under the Mined Land Reclamation Law. New York also has many unregulated mines (active & abandoned) that are not under the law’s jurisdiction. Most of these are small mines and/or mines that predate the 1975 law.
A permit is required under the Mined Land Reclamation Law if the following is removed:
More than 1,000 tons or 750 cubic yards of minerals in any 12 successive months
More than 100 cubic yards of minerals in or adjacent to any waterbody not classi- fied as “protected” by ECL Article 15.
Lands affected by mining before 1975 and not re-affected by later mining are exempt.

Commodities MinedLimestone
Sandstones
Other Crushed Rock
Metallic Ore
Nonmetallic
Sand and Gravel
Map 6 - Mines in New York State
NYS D
EC D
ivision of Mineral Resources
Twenty-Fifth Annual Report
30
New
York State Oil, G
as and Mineral Resources, 2008

New York State Oil, Gas and Mineral Resources, 2008
NYS DEC - Division of Mineral Resources 31 Twenty-Fifth Annual Report
Mined Land Reclamation Program Overview
Types of Mines in New York In 2008 New York had 2,166 active mines. The vast majority of these mines produced sand and gravel or other surficial deposits such as glacial till, clay or topsoil. There were 286 hardrock mines producing material ranging from bluestone, limestone, shale and salt, to less common prod-ucts such as wollastonite and talc. Most of New York’s hardrock mines are surface quarries, but there are a few permitted underground mines. Permits Issued in 2008 Sand and gravel mines were the most common type of mine permitted in 2008 (see Table 9). The Division issued 37 permits for new mines and 585 renewals or modifications, for a total of 622 permits (see Table 10). The high number of per-mit modifications in 2008 was due to DEC’s de-cision to standardize blasting requirements state-wide by modifying permits for 158 mines. Mining permits are issued for terms of five years or less and may be renewed. A renewal permit allows continued operation of the mine within approved limits. A modification permit authorizes changes, such as addition of processing equip-ment or expansion of the mine’s surface area or depth beyond the original approved limits. Table 12 starting on page 33 gives a more detailed breakdown of permits by county.
Geographic Distribution of Mines Map 5 on page 30 shows that mines can be found statewide; in 2008 there were active mines in 57 of New York’s 62 counties. However, the map does not convey the relatively small percentage of the State’s land surface devoted to mining. The wide variation in county size means compari-sons of the acreage under permit in each county can be misleading. For example, St. Lawrence, the State’s largest county with an area of 1,718,848 acres, has an area 15 times larger than Rockland County. While St. Lawrence County had a relatively high total of 2,112 net affected acres under mining permit in 2008, that repre-sented just 0.12% of the county’s land. Table 11 ranks counties by the percent of their land surface under permit. It shows that mining activity is con-centrated near heavily populated areas since they require larger quantities of mineral resources for roads and buildings. In 2008 just 7 counties had more than 0.30% of their land surface under a mining permit (Albany, Dutchess, Genesee, Onondaga, Ontario, Rensse-laer, Rockland) with a range of 0.30 to 0.41%. For most of the counties with active mines, less than 0.25% of their land was affected.
Table 10 - Permits, 2004 - 2008
2004
2005
2006
2007
New Permits 55 66 47 46
Renewals & Modifications 420 345 327 326
Total Permits 475 411 374 372
2008
37
585*
622
Table 9 - New Mines, 2008
Sand & Gravel 29
Clay 2
Dolostone, Lime-stone, Shale, Peat, Topsoil, Bluestone
1 each
Bluestone Explora-tion Authorization
7
New Exploration Authorizations in 2008 for temporary bluestone sites that may become full-fledged permitted mines in the future.
*158 permit modifications were initiated by DEC to standardize blasting requirements.

New York State Oil, Gas and Mineral Resources, 2008
NYS DEC - Division of Mineral Resources 32 Twenty-Fifth Annual Report
Owner Type In 2008 industry operated 1,708 mines or slightly over three-fourths of the mines in New York State. In 2008 there were 49 county-owned mines and 395 belonging to towns, villages and other small local government entities. New York State agen-cies also operate 14 mines. Most of the govern-ment mines belong to highway departments which use the material for road maintenance. In addition to owning roughly one-fifth of the mines in New York State, government agencies at
all levels purchase significant quantities of sand, gravel and other aggregates from commercial mines. Annual Regulatory Fees In 2008 the Division collected $2,837,900 in an-nual regulatory fees. Acreage-based fees are col-lected for individual, industry and state-owned mines. County, town, village and other local gov-ernment mines are exempt. The fees support the mined land regulatory program. Database en-hancements now allow staff to more closely monitor payment histories, review compliance, and conduct fee enforcement.
Mine Ownership Industry
1,708
Govt. 458
Table 11 - Counties with Highest Percentage of Land Under Mining Permit, 2008
County Population Ctr. Nearby
Active Mines
Net Affected Acreage
Land Percent
Genesee Buffalo 24 1,319 0.41%
Rensselaer Capital/Tri-City 60 1,706 0.40%
Onondaga Syracuse 41 1,991 0.39%
Ontario Rochester 43 1,550 0.37%
Albany Capital/Tri-City 18 1,210 0.35%
Dutchess New York City 58 1,643 0.31%
Saratoga Capital/Tri-City 62 1,591 0.29%
Rockland New York City 4 433 0.34%

New York State Oil, Gas and Mineral Resources, 2008
NYS DEC - Division of Mineral Resources 33 Twenty-Fifth Annual Report
20
08 N
ew P
erm
its1
Cou
nty
Num
ber
Acr
es2
Num
ber
Acr
es2
Ess
ex
0 0
41
726
Fran
klin
3
20
73
686
Fulto
n 0
0 24
37
5
Gen
esee
1
5 24
1,
319
Gre
ene
0 0
23
1,02
2
Ham
ilton
0
0 21
14
2
Her
kim
er
0 0
49
1,29
8
Jeff
erso
n 0
0 78
1,
857
Lew
is
4 32
45
69
2
Liv
ings
ton
0 0
23
9923
Mad
ison
1
5 25
54
2
Mon
roe
0 0
12
570
Mon
tgom
ery
0 0
8 56
4
Nas
sau
1 4
1 4
Tot
al P
erm
its1
Tab
le 1
2 - N
umbe
r of
Per
mits
and
Acr
eage
by
Cou
nty,
200
8
20
08 N
ew P
erm
its1
Cou
nty
Num
ber
Acr
es2
Num
ber
Acr
es2
Alb
any
0 0
18
1,21
1
Alle
gany
2
13
39
377
Bro
ome
1 24
45
74
7
Cat
tara
ugus
0
0 70
1,
636
Cay
uga
1 5
22
363
Cha
utau
qua
1 2
55
448
Che
mun
g 1
5 26
41
4
Che
nang
o 1
4 38
69
3
Clin
ton
1 5
67
1,24
3
Col
umbi
a 0
0 37
1,
001
Cor
tland
0
0 18
32
6
Del
awar
e 1
7 69
80
9
Dut
ches
s 1
7 58
1,
643
Eri
e 3
18
52
1,98
1
Tot
al P
erm
its1
1
Reg
ulat
ed m
ines
, but
not
blu
esto
ne e
xplo
ratio
n au
thor
izat
ions
2
Net
aff
ecte
d ac
reag
e 3
Doe
s not
incl
ude
unde
rgro
und
acre
age
for s
alt m
ines
L
ivin
gsto
n 60
3 ac
res,
Tom
pkin
s and
Sen
eca
9,00
0 ac
res

New York State Oil, Gas and Mineral Resources, 2008
NYS DEC - Division of Mineral Resources 34 Twenty-Fifth Annual Report
20
08 N
ew P
erm
its1
Cou
nty
Num
ber
Acr
es2
Num
ber
Acr
es2
Sene
ca
0 0
5 35
83
St. L
awre
nce
1 5
105
2,11
2
Steu
ben
1 31
84
1,
940
Suff
olk
1 7
36
1,12
3
Sulli
van
1 5
31
1,02
1
Tio
ga
1 16
32
82
5
Tom
pkin
s 0
0 15
50
83
Uls
ter
0 0
49
832
War
ren
0 0
36
570
Was
hing
ton
0 0
57
873
Way
ne
2 18
42
1,
013
Wes
tche
ster
0
0 1
4
Wyo
min
g 2
10
27
208
Yat
es
0 0
13
161
Tot
al P
erm
its1
Tab
le 1
2 - N
umbe
r of
Per
mits
and
Acr
eage
by
Cou
nty,
200
8 (c
ontin
ued)
20
08 N
ew P
erm
its1
Cou
nty
Num
ber
Acr
es2
Num
ber
Acr
es2
One
ida
0 0
64
1,14
9
Ono
ndag
a 1
10
41
1,99
1
Ont
ario
0
0 43
1,
551
Ora
nge
0 0
44
789
Orl
eans
0
0 20
54
7
Osw
ego
1 10
10
6 1,
638
Ots
ego
0 0
36
545
Putn
am
0 0
3 68
Ren
ssel
aer
3 9
60
1706
Roc
klan
d 0
0 4
433
Sara
toga
1
3 62
1,
591
Sche
nect
ady
0 0
9 23
8
Scho
hari
e 0
0 17
52
0
Schu
yler
0
0 12
27
4
Tot
al P
erm
its1
Nia
gara
0
0 16
70
3
1
Reg
ulat
ed m
ines
, but
not
blu
esto
ne e
xplo
ratio
n au
thor
izat
ions
2 N
et a
ffec
ted
acre
age
3 D
oes n
ot in
clud
e un
derg
roun
d ac
reag
e fo
r sal
t min
es
Liv
ings
ton
603
acre
s, To
mpk
ins a
nd S
enec
a 9,
000
acre
s

New York State Oil, Gas and Mineral Resources, 2008
NYS DEC - Division of Mineral Resources 35 Twenty-Fifth Annual Report
Trends in Mine Size and Number Mine renewal and modification permits issued in 2008 ranged in size from 1 to 839 acres. How-ever, new mines tend to be smaller; 85 percent of new mines permitted in 2008 were 10 acres or less in size. The largest new mine was the 68-acre Presho Sand & Gravel Mine in Steuben County. Table 13 gives 2003-2008 size range information for all active mines. The number of large mines has been increasing over time, while the number of small mines has been decreasing. This is be-cause many operators are expanding or combin-ing existing mines rather than seeking permits for new ones. The minor projects in the first row of the table are always less than 5 acres in size. They are subject to a simpler review process, but must comply with very strict criteria to be considered minor: minimum setbacks from homes and sur-face waters; a maximum 20-foot mine depth; no mining below water table; no hardrock (consolidated material) mining; and no on-site processing equipment, such as washing or crush-ing machines.
Mine Acreage Types and Statistics Net Affected Acreage - Net affected acreage is the total affected acreage covered under succes-sive mined land permits for the site minus the acreage reclaimed over the years. In 2008 the to-tal affected land authorized for mineral extraction under current mined land reclamation permits was 49,076 acres. Life-of-Mine Acreage - This is the total area that has been subject to DEC’s environmental review. It covers acreage mined under past permits, the current permit, and acreage that the operator in-tends to mine under future permits. It also in-cludes all reclaimed acreage at the site. In 2008 the statewide total for life-of-mine area was 119,183 acres. Reclaimed Acres - In 2008 the Division approved final reclamation of 637 acres at 74 closed mines and concurrent reclamation of 1,205 acres at 97 operating mines. Table 14 on page 38 summarizes 2008 reclamation by county. Since 1975 a total of 28,520 acres of mined land have been reclaimed, including 1,842 acres reclaimed in 2008.
Table 13 - Range of Existing Mine Sizes, 2003 - 2008*
2003
2004
2005
2006
2007
2008
Minor Projects 80 78 81 80 88 69
0 to 5 Acres 751 712 683 652 651 636
>5 to 10 Acres 549 532 531 531 509 493
>10 to 20 Acres 446 442 439 439 431 437
>20 to 30 Acres 172 179 179 169 166 171
>30 Acres 319 329 336 344 358 360
Total Mines
2,317
2,272
2,249
2,215
2,203
2,166
* Net Affected Acres

New York State Oil, Gas and Mineral Resources, 2008
NYS DEC - Division of Mineral Resources 36 Twenty-Fifth Annual Report
Reclaimed Land Uses Final uses of mined land can vary considerably depending on location, size and depth of the site; surrounding land uses; and local zoning. Farm-land and pasture are two of the most common reclamation objectives in New York State, but mined land is also reclaimed to residential, for-estry, wildlife, recreational, commercial and in-dustrial uses. Once the Division permits a pro-posed reclamation objective in a mined land rec-lamation plan, the mine operator needs a permit modification to change it. Reclamation takes two forms based on timing of the work - concurrent or final. Concurrent recla-mation is reclamation of an affected or mined-out area while resources are still being extracted from other parts of the mine site. The Division strongly promotes concurrent recla-mation, particularly for mines over 10 acres in size. Concurrent reclamation has a number of ad-vantages. Chief among these are the reduced po-tential for negative environmental impacts (dust, erosion, sedimentation) and the improved percep-tion of the mine by the surrounding community. See Table 14 on page 38 for a breakdown of rec-lamation type by county. Financial Security Municipal and other government operations are exempt from financial security requirements. However, mine operators from the private sector are required to post financial security to guarantee reclamation of their mines. At the end of 2008 the Division held roughly $167.5 million in financial security, an increase of $28 million from 2007. In the rare case where a mine operator fails to reclaim a mine, the Division calls the financial security and reclaims the land. However, staff noted that bonding levels were not keeping pace with rising reclamation costs. In 2006 the Divi-sion studied the issue and adopted a more detailed system of assessing reclamation costs. Since 2006
the Division has used the new methodology to calculate the required bonds for all new permits, permit renewals, modifications and transfers. Rec-lamation estimates completed in 2008 averaged $4,638 per acre. As more permits come up for renewal, the statewide average is expected to rise to $5,000-$6,000 per acre over the next few years. DEC Reclamation of Abandoned Mines In 2008 DEC Region 7 Division of Operations staff completed reclamation of the PA Stone Store Sanford Quarry in the Town of Sanford, Broome County. The mine was reclaimed using $10,000 in financial security seized by the Division of Min-eral Resources. The poor condition of the haul road made the site practically inaccessible to mo-torized vehicles and required significant work be-fore reclamation could proceed. Operations staff started the reclamation project in 2007 and re-turned to the site to hydroseed and mulch the af-fected areas in 2008.
Reclamation and Financial Security
Region 7 DEC Operations staff reclaiming a mine with financial security funds seized
by the Mined Land Program.
In 2008 Region 7 Operations staff also completed reclamation of the abandoned James Kolba-Kline Mine in the Town of Barker, Broome County. DEC seized the mine operator’s $20,000 in

New York State Oil, Gas and Mineral Resources, 2008
NYS DEC - Division of Mineral Resources 37 Twenty-Fifth Annual Report
a New York Times article that was published in November 2008. Work began on constructing the wavefield in 2007. It consists of 12- to 18-foot high “earthen swells” in seven rows, each over 300 feet long. The undulating hills give the appearance of ocean waves that visitors can walk into. The hills were planted with native grasses and scheduled to open to the public in 2009, once the vegetation is suffi-ciently established.
R.T. Vanderbilt Talc Mine No.2 in the Town of Fowler, St. Lawrence County
financial security in 1994. In 2001 Central Office Mined Land staff surveyed the site and prepared a reclamation work plan and cost estimate. How-ever, for various legal reasons the site remained unreclaimed. In 2008 Mined Land staff were fi-nally able to bring the problem to a successful conclusion. A site meeting was held to discuss the project among Central Office and Region 7 Mined Land Staff, Region 7 Division of Opera-tions staff and the landowner. Inspection of the site revealed that a significant portion of the land had revegetated naturally and was stable. While this is a rare occurrence, it reduced the size of the area that needed reclamation to only 3.5 acres. Central Office staff developed a revised work plan and determined that the $20,000 available would be adequate to cover costs. The work was completed in October 2008. 2008 Reclamation Highlights The R.T. Vanderbilt Company decided to close its talc/tremolite mines in St. Lawrence County in 2008. The closure requires reclamation of the Vanderbilt open pit mines located in the Towns of Fowler and Edwards. Region 6 Mined Land Staff conducted inspections throughout 2008 and found progress satisfactory. The company esti-mated that it will take a total of 6,000 hours of work to complete the necessary reclamation ac-tivities. For many years New York State ranked fourth in the nation in talc production. Talc/tremolite is used primarily in making paint and ceramics. The first talc mine in the United States opened in 1878 on a farm near Talcville, which is in the same area as the mines that are now being reclaimed.
In 2008 work continued on Maya Lin’s Wave-field Landform at the Storm King Art Center (SKAC) in Orange County. DEC approved this site-specific earthwork as an acceptable reclama-tion use of a former gravel pit on the grounds of the outdoor sculpture park. SKAC is home to more than 100 works by world-renowned artists. In October Region 3 staff met with the contractor and landscape architect to review minor work that needed to be completed prior to a photo shoot for
The Wavefield near completion October 2008; the “waves” are 12 to 18 feet high.

New York State Oil, Gas and Mineral Resources, 2008
NYS DEC - Division of Mineral Resources 38 Twenty-Fifth Annual Report
Table 14 - Reclamation Acreage Summary by County1, 2008
County Concurrent Final Total
Albany 5.2 0 5.2
Allegany 15.2 52.1 67.3
Broome 23.2 107 130.2
Cattaraugus 373.2 13 386.2
Cayuga 0 26 26
Chautauqua 2.7 3 5.7
Chemung 10 0 10
Chenango 0 5 5
Clinton 9.8 3.3 13.1
Columbia 14.2 13 27.2
Cortland 40.2 8 48.2
Delaware 0 27 27
Dutchess 92 4 96
Erie 45.8 2 47.8
Essex 0 0 0
Franklin 8 3 11
Fulton 7.2 0 7.2
Genesee 4 0 4
Greene 8.7 0 8.7
Hamilton 0 4.3 4.3
Herkimer 10 2 12
Jefferson 17.3 10.7 28
Lewis 0 7 7
Livingston 0 23.1 23.1
Madison 0 0 0
Monroe 125 65 190
Montgomery 0 0 0
Niagara 66.5 0 66.5
Nassau 0 0 0
County Concurrent Final Total
Onondaga 29 6.3 35.3
Ontario 18.3 22 40.3
Orange 4.5 47.5 52
Orleans 3 0 3
Oswego 4 0 4
Otsego 9.6 22.6 32.2
Putnam 0 2 2
Rensselaer 15.4 23 38.4
Rockland 0 0 0
Saratoga 60.8 5 65.8
Schenectady 0 0 0
Schoharie 0 0 0
Schuyler 0 0 0
Seneca 0 0 0
St. Lawrence 41.3 11.4 52.7
Steuben 75.8 19.1 94.9
Suffolk 2 2.1 4.1
Sullivan 10 0 10
Tioga 0 17 17
Tompkins 0 0 0
Ulster 13.5 54 67.5
Warren 0 0 0
Washington 18 9.1 27.1
Wayne 0 6 6
Westchester 0 0 0
Wyoming 0 0 0
Yates 0 0 0
Oneida 21.8 12 33.8
1 Five counties that do not have DEC–regulated mines are not included in this table.

New York State Oil, Gas and Mineral Resources, 2008
NYS DEC - Division of Mineral Resources 39 Twenty-Fifth Annual Report
Compliance and Enforcement
Inspections In 2008 Mined Land staff performed 2,417 mine inspections and traveled 89,964 miles. Staff in-spect mine sites:
• during permit application review;
• during operation for general compliance;
• to ensure that violations are remediated;
• to ensure that reclamation meets require-ments; and
• to investigate complaints. Violations and Fines Violations are handled with a mixture of enforce-ment tools, remediation requirements and penal-ties. In 2008 the Mined Land Program collected $815,600 in fines and penalties for 44 cases. Significant Legal Cases
In October 2007 Region 1 Mined Land staff dis-covered that 60,000 cubic yards of material had been illegally removed from the buffer area of a mine in the community of Kings Park, Town of Smithstown, Suffolk County. In 2008 a penalty of $275,000 was assessed against the permittee. In addition, the operator must reclaim the affected area. Region 1 Mined Land staff discovered that a mine in the Town of Brookhaven, Suffolk County, had been extended outside of the ap-proved life-of-mine limits. The permittee agreed to a $400,000 penalty, with $100,000 payable and $300,000 suspended if no further violations occur at the mine. The mineral resources at the site are exhausted and reclamation is required. Region 1 staff aided an Assistant Attorney Gen-eral in preparing an affidavit opposing a request from the Town of Riverhead for a Temporary Restraining Order in the Island Water Park case. The company requested a permit modification to create two lakes for water skiing when the mine is
reclaimed. This would be a significant change from the original plan approved in the permit. The Town of Riverhead requested lead agency status, but the Commissioner granted it to DEC, so the Town tried other legal measures to stop the review process. At year-end 2008 Region 3 staff were negotiating a settlement with an operator over violations at mines in Dutchess and Rockland counties. At the Dutchess County site, broken slurry lines released sediment-laden water into the Hudson River. At the Rockland County mine there were also sev-eral violations associated with relocation of the settling ponds and primary crusher. The company overexcavated 26,000 cubic yards of material from the new crusher location. Numerous SPDES violations resulted in turbidity in the Hackensack River and disruption of the Village of Nyack wa-ter supply. For over 20 years Region 6 has been involved with a landowner in the Town of Lawrence, St. Lawrence County for various violations includ-ding illegal mining and operating a solid waste facility without a permit. Several times in the past, cases brought against the landowner were either dismissed by local courts or very minor penalties were imposed. The most recent trial was finally convened in 2008, three and a half years after a search warrant was executed to gather evi-dence to confirm aerial surveillance. In the in-terim there were several adjournments, two failed attempts to seat a jury, and a change in venue. Since several previous administrative actions had failed to resolve the violations at the site, this time Region 6 sought criminal charges. The land-owner was charged with mining without a permit, operating a solid waste facility without a permit, and three additional solid waste violations. Unfor-tunately, during the trial the Assistant District Attorney was unable to have some important ae-rial photography entered into evidence. Subse-quently, the landowner was found guilty of the solid waste violations, but not of mining without a permit.

New York State Oil, Gas and Mineral Resources, 2008
NYS DEC - Division of Mineral Resources 40 Twenty-Fifth Annual Report
Economic Assessment of NY Mining Industry At the Fall 2008 New York Construction Materials Association meeting, Dr. Rochelle Ruffert of the Center for Governmental Research and Dr. William Kelly of the New York State Geological Survey presented the preliminary results of a study on the economic impacts of mining in New York State. The latest U.S. Geological Survey estimate of the value of minerals produced in New York is $1.3 billion. However, in this more detailed study, responses from just 91 survey participants showed an estimated economic impact from the mining industry of $1.5 billion. Extrapolating this figure to include all permitted mines in the State, including indirect and multiplier effects, would yield an economic impact of several billion dollars. After the meeting Division staff provided Dr. Ruffert with additional information on active mines in the State. Annual Underground Salt Mine Inspections Department staff and a Geomechanics Specialist from John T. Boyd Company conducted the annual underground mine inspections of the American Rock Salt (ARS) Hampton Corners salt mine and the Cargill (Cargill) Cayuga salt mine. The State Geologist was also present at the inspections. Permit conditions require these detailed annual inspections to ensure DEC is aware of any potential problems. During the site visits staff inspected the entries, crosscuts, faces, data collection points, and process galleries. At ARS all openings were stable and there was no sign of water flowing into the mine. At the Cargill site, a mine “panel” that had previously shown increased convergence rates was checked again, but no further deterioration was noted and the area was being backfilled. For years New York has ranked third in the nation in salt production, based on the combined total of mined and solution-mined salt.
Adirondack Rock Fest Central Office staff represented the Division at the first annual Rock Fest: A Celebration of Adirondack Geology. The event was held at the Adirondack Park Agency’s Newcomb Visitor Interpretive Center (VIC) on August 9. It was sponsored by VIC and the SUNY College of Environmental Science and Forestry Adirondack Ecological Center. The event consisted of a series of presentations both at the VIC and at nearby rock outcrops, followed by a field trip to the old titanium mine at Tahawus. Division staff made a presentation on the everyday uses of minerals and gave an overview of the Mined Land Reclamation Program. Division members also staffed a display and answered many questions. The program was quite successful for a first-time event. Over 100 people attended and at least 65 people went to each of the presentations. NYCO Examines Wollastonite Options A meeting was held on October 29, 2008, at the NYCO Minerals Willsboro office in Essex County. NYCO gave a presentation on depletion of wollastonite reserves at its two active quarries in the Town of Lewis; one mine is expected to be depleted in 5 years and the other in 20 years. New York State is home to the only commercial wollastonite production in the country. When its New York reserves are exhausted, NYCO could rely solely on its large wollastonite mine in Mexico. However to avoid terminating its New York operations, NYCO is attempting to locate additional reserves. The possible acquisition of State Forest Preserve Lot #8, which adjoins the Lewis Quarry, is one option. Since Article 14 of the New York State Constitution prohibits the mining or exploration of State Forest Preserve lands, a constitutional amendment would be required to pursue this option.
2008 Mined Land Reclamation Program Highlights

New York State Oil, Gas and Mineral Resources, 2008
NYS DEC - Division of Mineral Resources 41 Twenty-Fifth Annual Report
Zinc Mine Closes Again St. Lawrence Zinc, a subsidiary of HudBay Minerals, announced the closure of the Balmat underground zinc mine in the Town of Fowler, St. Lawrence County. Rising fuel costs and a steep drop in the price for zinc concentrate led to the decision. For many years New York State ranked third or fourth in the country in zinc production. However, the mine has periodically closed and reopened over the last few years with fluctuating zinc prices. In April 2001 the Zinc Corporation of America closed the mine after zinc prices fell to 32 cents per pound. In April 2006 HudBay Minerals reopened the mine after zinc prices soared to a record of over $2.00 per pound. However, in 2008 fuel prices rose significantly and zinc prices fell to around 70 cents per pound, necessitating closure of the mine. Human Remains Identified at Mine In February 2008 human remains were discovered during mining operations at the Full Cycle Soils mine in the Town of Phelps, Ontario County. Initially, the Ontario County Sheriff’s Department and Ontario County Medical Examiner thought the bones were of recent origin. However, the skeletal remains were sent to a forensics anthropologist who determined that they were probably from two people, not one, and may have been from a Native American woman and her infant. The mine suspended operations until the NY State Office of Parks, Recreation, and Historic Preservation could make a determination whether additional investigation was necessary. TCE-Contaminated Water at Mine Dolomite Products submitted an application for the discharge of trichloroethylene (TCE)-contaminated water from the Leroy Quarry in Genesee County. The mine is not the cause of the contamination; TCE was spilled during an accident on the Lehigh Vallley Railroad in 1970 and has slowly migrated underneath the mine. Fortunately, the level of contamination has
continued to drop over the decades. Regional and Central Office staff met with the company to discuss the application for a State Pollutant Discharge Elimination System (SPDES) permit and DEC’s concerns about the treatment and discharge plans. Staff review continues and a Draft Environmental Impact Statement is anticipated. R.T. Vanderbilt Closing Three of Four Mines R.T. Vanderbilt Company announced the closure of its two talc/tremolite mines in Balmat and one in Talcville, all in St. Lawrence County. A drop in market demand from over 200,000 tons per year in 1988 to around 80,000 tons in recent years led to the decision. The company plans to continue a small wollastonite mine in the Town of Diana, Lewis County. In 2008 roughly 105 people were employed at the company’s Balmat mines and mills. See the reclamation section on page 37 for further information. Bluestone Expo 2008 Central Office and Region 7 Mined Land staff attended the Bluestone Expo 2008 held March 29-30 in Binghamton, Broome County. The event was a joint effort of the New York and Pennsylvania bluestone industry organizations. Regulators, vendors, consultants, and financial institutions were present to answer questions and receive feedback from participants. Division members staffed a display and interacted with the bluestone community. Attendance was down from the first Bluestone Expo in 2006, probably due to the economic conditions. Mine Replaces Diesel Equipment At the 154-acre Troy Sand and Gravel Mine in the Town of West Sand Lake, Rensselaer County, the company converted several major pieces of equipment from diesel power to natural gas and electricity. The company produces stone, sand and gravel at this site and also manufactures asphalt. The 1,000-watt diesel generator used for stone processing was changed to natural gas.

New York State Oil, Gas and Mineral Resources, 2008
NYS DEC - Division of Mineral Resources 42 Twenty-Fifth Annual Report
Diesel fuel used in drying and heating stone was also replaced by natural gas. In addition to making the operations at the site more energy efficient, the conversions were expected to reduce noise, odor, and air pollution. Three Mine Fatalities in May 2008 The Division of Mineral Resources continues to support the work of the U.S. Mine Safety and Health Administration (MSHA) in their “Stay Out – Stay Alive” campaign. The program is aimed at educating children and adults about the dangers of trespassing on mine property for recreational purposes. Division staff distribute
Former Mine Site Reclaimed to Farm Pond,
Town of Redhook, Dutchess County
MSHA’s educational materials at outreach events. There continues to be a need for this type of in-formation. In 2008 an 18-year old man died when he was camping out with friends in the inactive part of a limestone mine in Greene County. Also during 2008 workers at two differ-ent mines in northern New York were killed. One was a dozer operator constructing a new ramp at a mine in Jefferson County who was crushed under his equipment. The other fatality was in Saint Lawrence County when a man working in an underground mine was killed by a falling slab of rock. MSHA investigated all three deaths.

DEPARTMENT OF ENVIRONMENTAL PROTECTIONBUREAU OF OIL AND GAS MANAGEMENT
DOCUMENT NUMBER: 550-0800-001
TITLE: Pennsylvania’s Plan for Addressing Problem Abandoned Wells and Orphaned Wells
EFFECTIVE DATE: April 10, 2000
AUTHORITY:
The Oil and Gas Act (P.L. 1140, No. 223) (58 P.S. Section 601.101 et seq.)Coal and Gas Resource Coordination Act (P.L. 1069, No. 214) (58 P.S. Section 501.1 et seq.)Oil and Gas Conservation Law (P.L. 825, No. 359) (58 P.S. Section 401.1 et seq.)The Clean Streams Law (P.L. 1987, No. 394) (35 P.S. Section 691.1 et seq.)Solid Waste Management Act (P.L. 380, No. 97) (35 P.S. Section 6018.101 et seq.)The Administrative Code (P.L. 177, No. 175) (71 P.S. Section 510-1 et seq.)25 Pa. Code Chapters: 78, 79, 91, 95, 97, 101, 102, 105, 106, 260, 261, 287, 288, 289, 291, 293, and 299
POLICY:
DEP will follow the strategy explained in this document when deciding which abandoned oil and gas wellsto plug under contract.
PURPOSE:
This guidance document provides the Department’s rationale in determining the optimal use of funds,including Growing Greener funding, available for plugging abandoned wells under contract. The strategy isto be incorporated into the state’s Reclaim PA initiative.
APPLICABILITY:
These policies apply as guidance for decisions by DEP’s oil and gas management program whendetermining which abandoned wells to plug, and when.
DISCLAIMER:
The policies and procedures outlined in this guidance document are intended to supplement existingrequirements. Nothing in the policies or procedures shall affect regulatory requirements.
The policies and procedures herein are not an adjudication or regulation. There is no intent on the part ofthe Department to give these rules that weight or deference. This document establishes the frameworkwithin which DEP will exercise its administrative discretion in the future. DEP reserves the discretion todeviate from this policy statement if circumstances warrant.
LENGTH: 7 pages
LOCATION: Volume 11, Tab (05)

FINAL/550-0800-001/April 10, 2000/Page 1
Department of Environmental ProtectionBureau of Oil and Gas Management
2000
Pennsylvania’sPlan For
Addressing ProblemAbandoned Wells and
Orphaned Wells

FINAL/550-0800-001/April 10, 2000/Page 3
Table of Contents
I. Introduction . . . . . . . . . . . . . . . . . . . . . . . . . . . . . . . . . . . . . . . . . . . . . . . . . . . . . . . 3
II. Purpose for This Plan . . . . . . . . . . . . . . . . . . . . . . . . . . . . . . . . . . . . . . . . . . . . . . . 4
III. Guiding Principles . . . . . . . . . . . . . . . . . . . . . . . . . . . . . . . . . . . . . . . . . . . . . . . . . . 4
IV. Goals . . . . . . . . . . . . . . . . . . . . . . . . . . . . . . . . . . . . . . . . . . . . . . . . . . . . . . . . . . . 5
V. Plan Elements . . . . . . . . . . . . . . . . . . . . . . . . . . . . . . . . . . . . . . . . . . . . . . . . . . . . . 6
A. Focusing of Expenditures . . . . . . . . . . . . . . . . . . . . . . . . . . . . . . . . . . . . . . . . 6
B. Developing Partnerships . . . . . . . . . . . . . . . . . . . . . . . . . . . . . . . . . . . . . . . . . 6
C. An Areal Approach to Well Plugging . . . . . . . . . . . . . . . . . . . . . . . . . . . . . . . 7
D. Encouraging Adoption . . . . . . . . . . . . . . . . . . . . . . . . . . . . . . . . . . . . . . . . . . 7

FINAL/550-0800-001/April 10, 2000/Page 4
I. Introduction
The first commercial oil well was drilled near Titusville in 1859. However, plugging requirementsdesigned to protect oil producing formations from flooding by fresh water were not enacted by theLegislature until the 1890s. Legislation passed in 1921 specified methods for pulling casing and pluggingwells. It was not until 1956 that legislation required gas wells to be permitted so their locations could becoordinated with underground coal mining to assure the safety of coal miners. The same legislation wasamended in the early 1960s to require all oil and gas wells to be permitted. These initial permits wereregistrations of locations where well drilling was being considered.
In the early 1980s more comprehensive oil and gas legislation was enacted. In December 1984 the Oiland Gas Act was signed into law. The Act defined an abandoned well as any well that had not beenproduced by its operator in the last year or any well that was not completed for production within 60days of having been drilled. Excluded from this category were any wells that had been granted inactivestatus by the Department. This statute provided for, among other things, an Abandoned Well RestrictedRevenue Account and the registration of wells drilled prior to the permitting requirements. TheAbandoned Well Restricted Revenue Account was to be used by the Department of EnvironmentalProtection (DEP) to plug abandoned wells causing health, safety, or environmental problems, and forcarrying out other purposes of the Act. This fund received revenues from fines, fees, penalties, andfrom a $50.00 surcharge on all oil and gas well drilling permits.
In the 140 years since the first oil well was drilled, an unknown number of oil and gas wells have beendrilled in Pennsylvania. An estimate by the Independent Petroleum Association of America places thatnumber at approximately 325,000. DEP has records of 88,300 operating wells which it regulates,44,700 plugged wells, and approximately 8,000 orphaned and abandoned wells. The status of theremaining 184,000 wells is unknown. Many wells were drilled, operated, and plugged at the end oftheir useful life while others were drilled, operated and abandoned without proper plugging. Some wellswere “temporarily abandoned” while the operators waited for the price of oil to rise to a level whichwould make producing the wells profitable; this sometimes never occurred.
With the passage of the well registration requirements of the Oil and Gas Act, questions aroseconcerning plugging liability for wells that were abandoned years ago by prior, often unidentified,operators. Consequently, in 1992 the Legislature amended the Act to establish an Orphan WellPlugging Program. Orphaned wells are a subclass of abandoned wells. Orphaned wells are wells thatwere abandoned prior to April 18, 1985. They have not been affected or operated by the presentowner or operator and the present owner, operator or lessee has received no economic benefit. If DEPdetermines that a prior owner or operator received economic benefit, other than economic benefitderived as a landowner or from a royalty interest subsequent to April 18, 1979 from an orphaned wellor from a well which has not been registered, that owner or operator is responsible for plugging the well.The Orphan Well Plugging Program receives revenues from industry through a $100.00 surcharge onnew oil well permit fees and a $200.00 surcharge on new gas well permit fees. The Orphan Well

FINAL/550-0800-001/April 10, 2000/Page 5
Plugging Fund is separate from, and in addition to, the Abandoned Well Plugging Fund which wasestablished with the $50 surcharge from the Abandoned Well Restricted Revenue Account of 1984.
The Oil and Gas Act authorizes DEP to plug abandoned oil and gas wells. The main focus to date hasbeen the plugging of wells which were clearly showing hazards to public health and safety and/orenvironmental degradation particularly to water supplies. A ranking system for abandoned wells, basedon threats to health and safety or pollution of the waters of the Commonwealth, is currently in use. Asimilar ranking system for orphaned wells is based on whether the well is on public or private land; itsdistance from public or private water supplies, accessible areas or buildings; its distance from streams,bodies of water, or wetlands; and whether or not it is in a special protection watershed. Revenues fromsurcharges into the Abandoned Well Plugging Fund and the Orphan Well Plugging Fund totalapproximately $300,000 a year.
Since the well plugging program began, 108 wells have been plugged at a cost of over $2.4 million usingfunds from the Abandoned Well Plugging Fund, the Orphaned Well Plugging Fund, and a Federal CleanWater Act, Section 319 Non-Point Source (319 NPS) grant. The wells plugged under the 319 NPSgrant were plugged to halt discharges of acid mine drainage and improve stream quality in the MillCreek Watershed and stop oil migration in the Oil Creek Watershed.
On December 15, 1999, Governor Thomas Ridge signed the Growing Greener legislation. Thisrepresents the largest single investment of state funds in Pennsylvania history to address criticalenvironmental concerns such as abandoned and orphan wells. Approximately $3 million dollars a yearof Growing Greener funding will go towards plugging wells from 2000 to 2004. Initial Growing Greenergrant dedications include $280,000 funded the plugging of 79 wells in McKean County, $20,000towards one well in Allegheny County, and $213,180 for 50 wells in Warren County. These examplesdemonstrate how Growing Greener is helping Pennsylvania’s plan to plug abandoned and orphanedwells.
The Environmental Protection Agency (EPA) has also plugged over 190 abandoned wells inPennsylvania that were leaking oil, or threatening to leak oil, to the navigable waters of the UnitedStates. The well plugging was made possible using funds from the Federal Oil Spill Liability Trust Fund(OSLTF) that was established under the Oil Pollution Act of 1990 (OPA 90).
II. Purpose for This Plan
The purpose of this plan is to establish the direction of DEP well plugging activities.
III. Guiding Principles
In developing and implementing a comprehensive plan for addressing problem abandoned wells andorphaned wells, state and federal resources should be coordinated to ensure cost-effective results. Thefollowing set of principles is intended to guide decision-making.

FINAL/550-0800-001/April 10, 2000/Page 6
• Priority will be given to problem wells that threaten the health and safety of people or property orpollution of the waters of the Commonwealth.
• Partnerships between DEP, the Department of Conservation and Natural Resources (DCNR),
other state and federal agencies, and watershed associations will be established, when appropriate, to achieve cleanup of a defined geographical area in an efficient and effective manner.
• Where practical, plugging activities will be coordinated with other projects that involve a watershedor geographic area where environmental cleanup and restoration efforts are planned or in progress.This coordination would occur as part of the Reclaim PA initiative.
• Consideration will be given to plugging projects where arrangements for utilization of money from
federal and other sources, such as the OSLTF, or 319 NPS grants, exist or can be developed. • Adoption of problem abandoned wells or orphaned wells that have production potential will be
encouraged so that the oil and gas resources are conserved. • Problem abandoned wells and orphaned wells will continue to be documented and added to the
inventories as they are identified.
IV. Goals
Specific goals to be achieved are set forth below. These goals are to be reviewed, modified, expanded,or changed when necessary to ensure the goals meet the needs of the time.
A. Focus expenditures for plugging problem abandoned wells on those which threaten the health and safety of persons or property or pollution of the waters of the Commonwealth.
Of the approximately 8,000 unplugged orphaned wells, 550 are considered problemwells. Of the 550 problem wells, approximately 129 are prioritized at 30 points ormore. Our goal is to give these 129 wells high priority for plugging.
B. Develop partnerships with the federal government, DCNR, watershedassociations, local governments, and other groups that promote locatingand plugging problem abandoned and orphaned wells.
DEP completed a 319 NPS three well plugging contract in Mill Creek Watershed toimprove stream quality. These wells were brought to the attention of DEP by the MillCreek Coalition as being the source of acid mine drainage into Mill Creek. Seven otherwells discharging oil, or threatening to discharge oil, into Oil Creek were plugged underthe same 319 NPS grant. DEP will continue to foster additional cooperativepartnerships with governmental or other watershed groups.

FINAL/550-0800-001/April 10, 2000/Page 7
C. Develop an areal approach to planning plugging operations that willresult in reclamation and rehabilitation of an entire geographical area or watershed.
DEP’s goal during the next five years is to contract for plugging clusters of wells indefined geographic areas. The key well in each well cluster contract will be a problemabandoned well with high priority points. When the key well or wells are identified, theabandoned and orphaned well lists will be examined to determine what other wells arelocated in the same geographic area. Once these wells are identified, they will beincluded in a cluster well plugging contract.
D. Encourage adoption of problem abandoned wells and orphaned wells.
DEP is providing oil and gas operators lists of abandoned wells in the database. The oiland gas operators can determine whether it is economically beneficial to them to adoptthe well and return it to production, rather than have DEP plug the well and loose apotential resource. Our goal is to continue to make oil and gas operators aware of theopportunities to adopt orphaned oil and gas wells and to return them to production.
V. Plan Elements
A. Focusing of Expenditures
DEP maintains an inventory of problem abandoned and orphaned wells. This inventoryis also in a database format. Prioritized lists of problem abandoned and orphaned wellsare generated from this database. These prioritized lists aid in selecting wells forplugging.
These prioritization lists are being used to focus plugging expenditures on the 129 highpriority wells.
B. Developing Partnerships
Currently DEP uses funds from the Abandoned Well Plugging Fund to plug problemabandoned wells, and funds from the Orphan Well Plugging Fund to plug orphanedwells. Abandoned wells that are an immediate threat to the health and safety of peopleor property or pollution of the waters of the Commonwealth are plugged by DEPthrough emergency response action. Abandoned wells that discharge or threaten todischarge oil into navigable waters of the United States are eligible to be plugged byDEP or EPA using funds from the Oil Spill Liability Trust Fund (OSLTF) establishedunder the Oil Pollution Act 90. EPA is currently plugging these types of wells usingfunds from this source.

FINAL/550-0800-001/April 10, 2000/Page 8
Contacts between DEP and EPA have been established to coordinate activities forplugging problem abandoned wells. This will ensure that the respective agencies will notduplicate efforts by both trying to plug the same wells at the same time.
Problem abandoned wells that had been leaking oil and were previously plugged byDEP will be examined to determine their eligibility for reimbursement of plugging costsunder the OSLTF. Claims for reimbursement will be submitted to the OSLTF.
Contacts have been made with DCNR to enter into a cost sharing partnership to plugorphaned wells on property owned by DCNR. Approximately 100 orphaned wells fallwithin this category.
Contacts have been made with the Mill Creek Coalition, the Pine Creek HeadwaterProtection Group, and The Scott Conservancy to determine if abandoned wells arecontributing to the pollution of watershed areas the associations are trying to clean up.
Contacts have been made with the United States Forest Service to access orphanedwells located in the Allegheny National Forest.
C. An Areal Approach to Well Plugging
DEP will group problem abandoned and orphaned wells by municipalities, watersheds,geographic boundaries, or surface landowners to more efficiently address the pluggingof these wells. This will facilitate a cluster well plugging program that will result in therestoration of an entire area rather than scattered sites, and decrease per well pluggingcosts.
The key well in the cluster will be a well that has a high priority. When these problemwells are plugged, they will be grouped into clusters with other orphanedwells in the area. When possible, 50 to 100 wells or more will be grouped together intosingle contracts. It is expected that clustering wells into contracts will increase programefficiency.
D. Encouraging Adoption
DEP will periodically remind the oil and gas industry of the availability foradoption of orphaned and abandoned wells on our plugging lists. DEP will do this byplacing articles in the Update and by positing information on the web site.
Upon request, DEP will provide a list of orphaned and abandoned wells toanyone who requests such information for the purpose of adoption.

Oversight Hearing before the Subcommittee on Energy and Mineral Resources of the On Natural Resources US House of Representatives, One Hundred Eleventh Congress, First Session (Serial No. 111-22)June 4, 2009Representative Doug Lamborn of Colorado“Hydraulic fracturing has been used by the oil and gas industry since the late 1940s. More than one million fracturing jobs have been completed in the U.S. since the technique was first developed, and there have been no demonstrated adverse impacts to drinking water wells from the fracking process or by the fluids used in the process.”Source: http://www.gpo.gov/fdsys/pkg/CHRG-111hhrg50120/pdf/CHRG-111hhrg50120.pdf Oversight Hearing before the Subcommittee on Energy and Mineral Resources of the On Natural Resources US House of Representatives, One Hundred Eleventh Congress, First Session (Serial No. 111-22)June 4, 2009Lynn Helms, speaking as Director, Department of Mineral Resources, Industrial Commission, State of North Dakota “Studies and surveys by GWPC, EPA and IOGCC over the last 11 years have found no real credible threat to underground drinking water from hydraulic fracturing. It is a common operation used in North Dakota and all the member states of the IOGCC, and it is my firmly held view and also that of IOGCC that the subject of hydraulic fracturing is adequately regulated by the states, and it needs no further study.”“In a 1998 survey of state oil and gas regulatory agencies, conducted by the GWPC, twenty four state programs said they had not recorded any complaints of contamination to a USDW that the agency could attribute to hydraulic fracturing of coalbed methane zones. In 2004 the Environmental Protection Agency published a final report summarizing a study to evaluate the potential threat to underground sources of drinking water from hydraulic fracturing of coal bed methane production wells and the Environmental Protection Agency concluded that ‘additional or further study is not warranted at this time...’ and that ‘the injection of hydraulic fracturing fluids into coal bed methane wells poses minimal threat to the underground sources of drinking water’. Subsequently, the IOGCC conducted a survey of North Dakota and other oil and gas-producing states that found that there were no known cases of ground water contamination associated with hydraulic fracturing. Hydraulic fracturing is a common operation used in exploration and production by the oil and gas industry in North Dakota and all the member states of the IOGCC. Approximately 35,000 wells are hydraulically fractured annually in the United States, and close to one million wells have been hydraulically fractured in the United States since the technique’s inception, with no known harm to ground water. It is my firmly held view and that of the IOGCC that the subject of hydraulic fracturing is adequately regulated by the states and needs no further study. In my opinion too frequent nationwide or federal study and review of critical operations like hydraulic fracturing, underground injection, and RCRA class II waste exemptions create an environment of uncertainty and litigation that inhibits real progress in sustainable resources development. Complaints of ground water contamination attributed to hydraulic fracturing or any other oil and gas operation should continue to be investigated by the appropriate state agency or agencies to determine whether or not ground water has been affected and whether a cause and effect relationship can be established between any impacts to ground water and petroleum exploration and production activities.Source: http://www.gpo.gov/fdsys/pkg/CHRG-111hhrg50120/pdf/CHRG-111hhrg50120.pdf

Oversight Hearing before the Subcommittee on Energy and Mineral Resources of the On Natural Resources US House of Representatives, One Hundred Eleventh Congress, First Session (Serial No. 111-22)June 4, 2009Representative Martin T. Heinrich of New MexicoYou mentioned, Mr. Kell, the letter from New Mexico regarding the fact that we really don’t have a big issue with this in terms of contaminating usable water underground, but we still are grappling with contamination, basically, of surface water—some of it histrical and some more recent based on this whole idea of good housekeeping and the best way to do that. My concern is what do we do with these fluids when they are back on the surface? What level of uniformity and consistency is there of making sure that we are doing a good job disposing of these fluids and other waste products that are inherent to the oil and gas business once they are on the surface, and how do we continue to improve that process? In addition, I would mention that while we had zero cases of usable groundwater contamination, we have a number of cases of surface water contamination from products at the surface.Source: http://www.gpo.gov/fdsys/pkg/CHRG-111hhrg50120/pdf/CHRG-111hhrg50120.pdf
Senate Committee on Environment and Public Works hearingDecember 8, 2009Sen. James Inhofe of OklahomaThe following information was released by the U.S. Senate Committee on Environment and Public Works.During today's Senate Committee on Environment and Public Works hearing on "Federal Drinking Water Programs," Senator Inhofe asked officials from the Environmental Protection Agency (EPA) and the United States Geological Survey (USGS) if they were aware of any documented cases of hydraulic fracturing contamination. None of the three witnesses could provide a single example. Testifying before the EPW Committee today was Peter Silva, Assistant Administrator for Water, Environmental Protection Agency, Cynthia Giles, Assistant Administrator for Enforcement and Compliance Assurance, Environmental Protection Agency, and Matthew Larsen, Associate Director for Water, U.S. Geological Survey.Full Transcript of Exchange:Senator Inhofe: I'm anxious to get to this second panel, Madame Chairman. I can't remain silent after Senator Lautenberg's statement about hydraulic fracturing. I have something to say about that, but first, I want to ask all three of you and response: Do any one of you know of one case of ground water contamination that has resulted from hydraulic fracturing? Start with you, Mr. Silva.Peter Silva: Not that I'm aware of, no.Senator Inhofe: Ms. Giles?Cynthia Giles: I understand there's some anecdotal evidence, but I don't know that it's been firmly established.Senator Inhofe: So the answer is no, you don't know of it.Cynthia Giles nods.Senator Inhofe: Alright, Mr. Larsen?Matthew Larsen: I'll have to respond in writing, I don't, I'm not aware of all of our studies on that topic.Senator Inhofe: Well, but you've already answered. You're not aware. That's the question I asked you. Here's the problem we have. Senator Lautenberg referred to this as something that's new. This isn't new. It's been around over fifty years. And, we do approximately thirty-five thousand wells a year - nearly a million wells, without one documented case of groundwater contamination. I'm concerned about this, because I know for a fact that if you took away the ability, as all other countries do, of

hydraulic fracturing, we're going to become much more dependent upon other countries for our ability to produce oil. Now, I want to repeat that one more time that there has never been a documented case in almost a million uses of that technology. The EPA did an extensive study of this back, prior to, it lasted a long period of time, they concluded in 2004 that it does not warrant any further study.”Source: http://www.ocapl.org/en/articles/printview.asp?15
Senator InhofeMarch 7, 2002 “How does hydraulic fracturing fit into this equation? This system has been used—I remember using it myself—since the 1940s. In the 1940s, we had a system of injection in order to get maximum production in both oil and gas wells. Not one time in that period of time—after over a million wells have used this process—has there been any kind of damage to the environment. In the last 15 years, there have been over 100,000 wells using this, with no damage to the environment.As the Senator from New Mexico points out, this is not a partisan thing. The Clinton administration supported this, the Bush administration supports this, and Carol Browner supported this when I served as chairman of one of the subcommittees of the Environment and Public Works Committee. This is necessary to have, and it does no harm to the environment.”Source: http://frwebgate.access.gpo.gov/cgi-bin/getdoc.cgi?dbname=2002_record&docid=DOCID:cr07mr02-119.pdf
Carol Browner, then Administrator of the U.S. Environmental Protection Agency May 5, 1995 “There is no evidence that the hydraulic fracturing at issue has resulted in any contamination or endangerment of underground sources of drinking water (USDW). Repeated testing, conducted between May of 1989 and March of 1993, of the drinking water well which was the subject of this petition failed to show any chemicals that would indicate the presence of fracturing fluids. The well was also sampled for drinking water quality and no constituents exceeding drinking water standards were detected. Moreover, given the horizontal and vertical distance between the drinking water well and the closest methane gas production wells, the possibility of contamination or endangerment of USDWs in the area is extremely remote.”Source: http://www.gpo.gov/fdsys/pkg/CREC-2002-03-07/pdf/CREC-2002-03-07-pt1-PgS1621-8.pdf
Senator Jeff Bingaman of New MexicoMarch 7, 2002“And although there have been over a million hydraulic fracturing jobs conducted in the last 5 years, there have been zero confirmed instances of hydraulic fracturing contaminating drinking water. There is not one time that contamination has been established.” Source: http :// frwebgate . access . gpo . gov / cgi - bin / getdoc . cgi ? dbname =2002_ record & docid = DOCID : cr 07 mr 02- 119. pdf
Senator Jeff Sessions of AlabamaMarch 7, 2002: “Most States in which hydraulic fracturing is used -- including my State of Alabama -- have implemented regulations to ensure that hydraulic fracturing continues to be used in a safe manner. The technique has been used safely by coalbed methane oil and gas producers for over 15 years, and there has never been a single event of contamination to underground drinking sources.”

Source: http :// frwebgate . access . gpo . gov / cgi - bin / getdoc . cgi ? dbname =2002_ record & docid = DOCID : cr 07 mr 02- 119. pdf
Western Energy Alliance: “There are no documented cases of contamination to drinking water from fracing.”Source: http :// westernenergyalliance . org / wp - content / uploads / docs / legislative / IPAMS %20 Position %20 Paper %20-%20 Hydraulic %20 Fracturing . pdf Context: Position paper
Elizabeth Ames Jones, Texas Railroad CommissionJuly 9, 2010 “Based on the facts, one can be confident that the geology in Texas, combined with safeguards that we require in the drilling of a well, simply do not support the notion that water used in hydraulic fracturing will migrate to a water table. With many thousands of fracs taking place in Texas, Commission records do not indicate a single documented water contamination case associated with hydraulic fracturing in our state.”Source: http :// www . texasinsider . org /? p =29927
New York State Department of Environmental Conservation: “As a result of New York's rigorous regulatory process, the types of problems reported to have occurred in states without such strong environmental laws and rigorous regulations haven't happened here. No known instances of groundwater contamination have occurred from previous horizontal drilling or hydraulic fracturing projects in New York State.”Source: http :// www . dec . ny . gov / energy /46288. html
Energy Tomorrow, an American Petroleum Institute blog by Jane Van RyanNov. 12, 2010 “U.S. government studies have found no evidence of drinking water contamination from hydraulic fracturing. In 2004, the Environmental Protection Agency (EPA) conducted a study to assess the contamination potential of underground drinking water sources (UDWS) from the injection of hydraulic fracturing fluid into coalbed methane (CBM) wells. EPA found ‘the injection of hydraulic fracturing fluids into CBM wells poses little or no threat to USDWs and does not justify additional study at this time.’ EPA also reviewed incidents of drinking water well contamination believed to be associated with hydraulic fracturing operations. It found ‘no confirmed cases linked to fracturing fluid injection of CBM wells or subsequent underground movement of fracturing fluid.’In 1998, the Ground Water Protection Council (GWPC) and a team of state agency representatives conducted a survey of state oil and natural gas agencies to establish an accurate assessment of the number of active CBM wells associated with hydraulic fracturing. Based on the survey of 25 oil and natural gas producing states, the GWPC concluded, ‘there was no evidence to support claims that public health is at risk as a result of the hydraulic fracturing of coalbeds used for the production of methane gas.’EPA is developing a study plan now for a congressionally-mandated review of the relationship between hydraulic fracturing and drinking water. The study is expected to be finished in 2012.A recent documentary about hydraulic fracturing implies that fracturing has contaminated water wells in Pennsylvania. However, John Hanger, secretary of the Department of Environmental Protection (DEP) recently told Reuters, ‘It's our experience in Pennsylvania that we have not had one case in

which the fluids used to break off the gas from 5,000 to 8,000 feet underground have returned to contaminate ground water.’”Source: http :// blog . energytomorrow . org /2010/11/ addressing - hydraulic - fracturing - issues - one - by - one . html
Kathryn Klaber, President of the Marcellus Shale Coalition July 23, 2010 “My name is Kathryn Klaber, and I have the tremendous privilege of serving as the Marcellus Shale Coalition’s first president. And on behalf of the MSC – the organizational body that represents the vast majority of shale gas producers and midstream companies operating in the Commonwealth – I appreciate the opportunity to discuss the significant role hydraulic fracturing continues to play in the responsible development of clean-burning, job-creating natural gas.As the MSC said at the outset of this study in March, our industry is confident that an objective, science-driven, and peer-reviewed evaluation of fracturing will reach the same conclusions produced by a host of other studies, including most notably one issued by your agency in 2004.In that report — the product of an intensive, four-year course of study first initiated under the Clinton administration — EPA found ‘no evidence’ suggesting the fracturing of shallow coalbed methane reserves posed a threat to underground drinking water supplies. Certainly you’re aware that coalbed methane strata reside thousands of feet closer to the water table than shale formations, and that the technology used today to access clean-burning natural gas from these formations is much more advanced and sophisticated than what was available in the past.Here in Pennsylvania, fracturing has been in use for more than 50 years, and has been tightly regulated by the state almost before we had a name for it. Today, as you know, fracturing is considered a safe and essential part of the responsible development of natural gas, which studies have shown has the potential to create nearly 212,000 new jobs throughout Pennsylvania over the next decade.Because of tight regulations and laws in place, coupled with the commitment from industry to protect the environment, there’s never been a single case of groundwater contamination associated with fracturing, as noted by PA DEP, top EPA officials, other state regulators, and the Groundwater Protection Council.As EPA’s study moves forward, it’s critical to consider what the top officials responsible for regulating fracturing in the Commonwealth have said. Scott Perry, director of DEP’s bureau of oil and gas management – with whom my members work closely with – said this in May:‘We’ve never seen an impact to fresh groundwater directly from fracking.’‘No one’s ever documented drinking water wells that have actually been shown to be impacted by fracking.’”Source: http :// marcelluscoalition . org /2010/07/ msc - to - epa - hydraulic - fracturing - is -% E 2%80%9 Ca - safe - essential - part - of - the - responsible - development - of - natural - gas % E 2%80%9 D /
Representative John Sullivan of Oklahoman and Representative Mike Ross of ArkansasApril 27, 2010 letter to colleagues “Hydraulic fracturing plays a major role in the development of virtually all unconventional oil and natural gas resources – as you mentioned in your memo to members of the Energy and Environment Subcommittee on February 18th of this year – and thus should not be limited in the absence of any evidence that fracturing has damaged the environment. In fact, according to the Interstate Oil and Gas Compact Commission, (IOGCC) approximately 35,000 wells are hydraulically fractured annually in the United States and close to one million wells have been hydraulically fractured in the United States since the technique’s inception more than 60 years ago, with no known harm to groundwater.

It is our view that U.S. Environmental Protection Agency (EPA) regulation of hydraulic fracturing under the SDWA would add burdensome and unnecessary regulatory requirements to the drilling and completion of oil and gas wells which could result in increasing costs of producing domestic natural gas resources without any additional benefit to public health, safety or the environment. This is especially concerning in light of little to no evidence that the use of hydraulic fracturing has contaminated drinking water supplies.”Source: http://sullivan.house.gov/News/DocumentSingle.aspx?DocumentID=182833 Lisa Jackson, Administrator, U.S. Environmental Protection AgencyMay 24, 2011Ms. Jackson was asked during a Committee on Oversight and Government Reform hearing held by the U.S. House of Representatives: “Is there any evidence, however, that hydraulic fracturing can affect aquifers and water supplies?”
Lisa Jackson: “There is evidence that it can certainly affect them. I am not aware of any proven case where the fracking process itself has affected water although there are investigations ongoing.”
Source: http://www.youtube.com/watch?v=2Z-lE5p1fZk