Embed Size (px)
Citation preview

White Paper No. 26LEGISLATIVE ELECTIONS 2013: BIG SPENDING, LITTLE CHANGE PLUS A HISTORY OF SELF-FINANCING BY LEGISLATORS AND OTHERS
www.elec.state.nj.usSeptember, 2015
Election
Law
Enforcement
Commission
L E EC
1973

Located at: 28 W. State Street, 13th Floor, Trenton, New Jersey
ACKNOWLEDGEMENT
The Commissioners would like to thank the various staff members involved in this report, which is the 26th white paper released by the New Jersey Election Law Enforcement Commission (ELEC) since 1988.
This series has received national and even international recognition, and its contents often have been cited in media reports, the political science literatures, studies prepared by sister agencies and advocacy groups.
Besides serving as reference works, the reports also provide valuable background and guidance for the Governor’s Office, legislators and other policymakers.
Deputy Director Joseph W. Donohue is the author of White Paper 26, “Legislative Elections 2013- Big Spending, Little Change Plus a History of Self-Financing by Legislators and Others.”
General editors and proofreaders included Executive Director Jeffrey M. Brindle, Director of Information Technology Carol Neiman, and Research Associate Steven Kimmelman. Kim Roman, Associate Director of Information Technology, helped compile data used in the report. Steve also coded the expense data for analysis.
Administrative Assistant Elbia L. Zeppetelli also helped with proofreading, and applied her usual polish to the final version.
A special thanks to Clerk Igor Milewski. Igor retrieved dozens of boxes of older paper reports in an off-site storage facility to help research legislative self-financing in past elections. Todd J. Wojcik, Associate Director of Compliance, also helped track down historical reports.
All 26 white papers are available on ELEC’s website at www.elec.state.nj.us. Revised 2/6/2018 Pages 1, 2, 3, 20, 21, 22, 23, 24, 25, 26, and 34. Revisions in bold italics.
State of New Jersey
ELECTION LAW ENFORCEMENT COMMISSION
Respond to: P.O. Box 185
Trenton, New Jersey 08625-0185
(609) 292-8700 or Toll Free Within NJ 1-888-313-ELEC (3532)
Website: http://www.elec.state.nj.us/
RONALD DEFILIPPIS Chairman
WALTER F. TIMPONE
Vice Chairman
JEFFREY M. BRINDLE Executive Director
JOSEPH W. DONOHUE
Deputy Director
DEMERY J. ROBERTS Legal Director
STEPHANIE A. OLIVO Compliance Director
EDWIN R. MATTHEWS
Legal Counsel

TABLE OF CONTENTS
NJ Election Law Enforcement Commission Page i White Paper No. 26
PAGE NO. INTRODUCTION AND SUMMARY ..................................................................................................1 KEY FUNDRAISING TRENDS ...........................................................................................................3 LEGISLATIVE SELF-FINANCING TRENDS....................................................................................9 SOURCES OF CONTRIBUTIONS TO LEGISLATIVE CANDIDATES.........................................16 BATTLEGROUND DISTRICTS REMAIN TOP MAGNETS FOR CAMPAIGN CASH.............................................................................................................................19 MASS MEDIA SPENDING ................................................................................................................25 NON-MEDIA SPENDING ..................................................................................................................34 RECOMMENDATIONS .....................................................................................................................37 PREVIOUS WHITE PAPERS ............................................................................................................43

TABLE OF CONTENTS
NJ Election Law Enforcement Commission Page ii White Paper No. 26
TABLES PAGE NO. 1 Total Fundraising and Spending in Legislative Elections .........................................................3 2 Average Spent Per Legislative Seat ...........................................................................................3 3 Legislative Fundraising and Spending by Party ........................................................................4 4 Spending by Legislative House .................................................................................................4 5 Spending Advantage of Incumbent Legislators over Challengers .............................................5 6 Number of Assembly Candidates Who Won Reelection ...........................................................5 7 Number of Senate Candidates Who Won Reelection ................................................................5 8 Average Contributions to Legislative Candidates .....................................................................6 9 Range of Contributions Received by Legislative Candidates ....................................................7 10 Year to Year Comparison of Range of Contributions Received by
Legislative Candidates ...............................................................................................................8 11 Top 10 Elections Involving Self-Funding by New Jersey Candidates ......................................9 12 Top Five Self-Financing Candidates in 2013 Legislative Elections ........................................10 13 Legislative Self-Funding by Party ...........................................................................................10 14 Legislative Self-Funding by Winners and Losers ....................................................................10 15 Self-Funding Totals by Legislative District .............................................................................11 16 Five Top Years for Legislative Self-Funding ..........................................................................11 17 Legislative Self-Funding by Office .........................................................................................12 18 Top 10 Self-Funding Legislative Candidates ..........................................................................12 19 Top 25 Largest Self-Funded Legislative Elections ..................................................................14 20 Top 50 Self-Funding New Jersey Candidates ..........................................................................15 21 Contributions by Contributor Type to Legislative Candidates ................................................16 22 Contributions by PAC Type to Legislative Candidates in 2013 ..............................................17 23 Top 10 Legislative Districts by Spending in 2013...................................................................19 24 Top 10 Legislative Districts by Spending – 2003-2013 ..........................................................20 25 Top 10 All Time Legislative Districts by Spending ................................................................20 26 Estimated Special Interest Independent Spending in 2013 New Jersey Legislative Election ..............................................................................................21 27 Spending by Independent Groups in Targeted Legislative Districts .......................................22 28 Additional Spending by Independent Groups in Legislative Districts ....................................23 29 Independent Spending in NJ Legislative Campaigns since 2001 ............................................24 30 Spending by Category in 2013 Legislative Elections ..............................................................25

TABLE OF CONTENTS
NJ Election Law Enforcement Commission Page iii White Paper No. 26
31 Mass Media Spending by Legislative Candidates as a Percent of Total Campaign Spending........................................................................................................25 32 Major Spending Categories- Legislative Candidates and Independent Groups ......................26 33 Mass Media Spending by Legislative Candidates and Independent Groups ...........................27 34 Estimated Television Spending by Legislative Candidates and Independent Groups .................................................................................................................28 35 Mass Media Spending- Candidates and Independent Groups Combined ................................28 36 Amount of Uncategorized Media Spending as a Percent of Total Media Spending ..............................................................................................................31 37 Estimated Television Spending as a Percent of Total Media Spending ..................................31 38 Radio Advertisements as a Percent of Total Communications Spending................................31 39 Direct Mail as a Percent of Total Media Spending ..................................................................32 40 Newspaper and Outdoor Advertising as a Percent of Total Media Spending .........................32 41 Internet Advertising as a Percent of Total Media Spending ....................................................33 42 Contributions to other Candidates and Committees and Transfers to Future Campaign by Legislative Candidates ...........................................................................34 43 Fundraising Expenses ..............................................................................................................34 44 Consulting Expenses ................................................................................................................34 45 Polling and Research Expenses ...............................................................................................35 46 Election Day Expenses ............................................................................................................36 47 Charitable Donations ...............................................................................................................36 48 Administrative Expenses .........................................................................................................36 49 Refunds by Legislative Candidates ..........................................................................................36

INTRODUCTION AND SUMMARY
NJ Election Law Enforcement Commission Page 1 White Paper No. 26
Early in 2013, Republicans hoped that Democrats might lose their long-time strangle-hold on both legislative houses.
Democrats seized control of the Legislature in 2001 after nearly a decade of Republican rule. Their majority has remained intact ever since.
Republican expectations were high because Governor Chris Christie was riding a wave of post-Hurricane Sandy popularity. He was running for reelection along with both houses.
The last time a governor ran with both houses was 2001. That was the last time there was a two-house shift in party control in the Legislature.
Most pundits believed Christie would win big in the gubernatorial race and that such a victory might help Republicans whittle down the Democratic majority by several seats. The biggest Republican optimists spoke openly about the GOP retaking the state Senate.
But Democrats had a secret weapon to preserve their majority- an unprecedented gusher of independent special interest spending.
The charge was led by the Fund for Jobs, Growth and Security, a Washington, DC-run political committee started by a former chief of staff to Senator Harry Reid (D-NV). The group funneled millions of dollars into the handful of legislative districts most vulnerable to party-switching.
The result: essentially status quo despite a 22-percentage point win by Christie over Democrat Barbara Buono.
Republicans did oust one Democratic incumbent in the legislative District 1. And two Assembly races- one in Atlantic County, one in Bergen County- were so close they had to be decided by recounts.
In the end, Democrats maintained their 24-16 margin in the state Senate and their 48-32 edge in the state Assembly. Democrats made up for the lost incumbent by upsetting a Republican incumbent in legislative District 2.
Combined with spending by individual legislators, the infusion of funds from independent groups drove total spending to $58.8 million- the most ever without adjusting for inflation (Table 1).
INTRODUCTION AND SUMMARY
NJ Election Law Enforcement Commission Page 2 White Paper No. 26
The election undoubtedly was a high water mark for independent spending in legislative races. The $16 million (Table 26) spent on legislative races, including primary spending, was more than the combined independent spending on seven previous legislative campaigns dating back to 2001. Independent spending was 26.1 percent of total general election spending (Table 29).
The influx drove spending in legislative District 38, a key swing district, to $5.9 million. It was the fifth most expensive legislative election in history adjusting for inflation (Table 25). The $4.7 million spent in District 1 (Table 23) made it the 11th all-time most expensive legislative campaign.
Driven by record union PAC spending, total PAC spending reached a new high in dollars spent. (Table 22).
SPECIAL ANALYSIS- HISTORY OF SELF-FINANCING IN NJ CAMPAIGNS While legislative candidates traditionally have not been major self-funders and self-financing
was not a big trend in 2013, a new ELEC study found that 101 legislative candidates since 1983 have spent $9.8 million (inflation adjusted) (Page 10).
Among the top 50 self-funding candidates in all New Jersey elections, 18 were legislative candidates (a few also ran for other offices) (Table 20). Former state Senator Gordon MacInnes spent the most on his legislative campaigns (Table 18). The 25th legislative District, which he represented, is the site of the most self-financing by legislative candidates (Table 15). Among all candidates, no one spent more on New Jersey elections than former Governor Jon Corzine, who sank nearly $167 million (2015 dollars) of personal wealth into three campaigns (Table 11 and Table 20).
In the Assembly, 72 of 74 incumbents won- 97 percent (Table 6). For the second election in a row, 100 percent of Senate incumbents- 39 of 39- won reelection (Table 7). It was the second election in a row that all Senate incumbents recaptured their seats
Mass media spending was $21.6 million, nearly 37 percent of all spending (Table 31). It was the most since 2007. While candidates spend more in dollars, nearly 70 percent of independent group spending went to mass media versus 35 percent for candidates (Table 32).
Independent groups outspent candidates in two key areas: research and polling, and get-out-the-vote (Table 32). The spending drove totals for record highs for both categories of spending (Tables 45 and 46).
Candidates and independent groups combined spent an estimated $11 million on television advertising- about 51 percent of all media spending (Table 34). While the data is incomplete, online advertising is rising fast (Table 41) and could be higher than $1.1 million (Page 33).

KEY FUNDRAISING TRENDS
NJ Election Law Enforcement Commission Page 3 White Paper No. 26
With both houses facing reelection in 2013, total spending by individual legislators and independent groups reached nearly $58.8 million- the largest total ever even adjusting for inflation.
Table 1 Total Fundraising and Spending
in Legislative Elections*
YEAR RAISED BY LEGISLATORS
SPENT BY LEGISLATORS
BOTH HOUSES?
INDEPENDENT SPENDING
TOTAL SPENDING
TOTAL SPENDING ADJUSTED FOR
INFLATION 2003 $47,911,008 $44,990,255 Yes $ 4,857 $44,995,112 $58,152,514 2005 $25,081,696 $23,713,193 No $ 3,476 $23,716,669 $28,878,354 2007 $50,797,317 $47,231,847 Yes $ 165,000 $47,396,847 $54,360,463 2009 $20,457,342 $18,584,098 No $ 15,999 $18,600,097 $20,617,404 2011 $45,656,674 $44,024,272 Yes $ 1,835,000 $45,859,772 $48,482,847 2013 $46,691,108 $43,446,977 Yes $ 15,375,071** $58,822,048 $59,847,205 *Includes first quarterly reports filed by candidates after the election. **Excludes $650,623 in primary spending
Average Spending Per Legislative Seat is High
Average spending per legislative seat in 2013 was $498,727, the most ever.
Table 2 Average Spent
Per Legislative Seat
YEAR TOTAL SPENDING
ADJUSTED FOR INFLATION
CONTESTED SEATS
AVERAGE PER SEAT
2003 $58,152,514 120 $484,604 2005 $28,878,354 80 $360,979 2007 $54,360,463 120 $453,004 2009 $20,617,404 80 $257,718 2011 $48,482,847 120 $404,024 2013 $59,847,205 120 $498,727
Democrats Maintain Dominance in Fundraising
The onslaught of independent spending, which mostly benefited Democrats, did more than help them hang on to their majority. It also enabled them to hang onto more of their cash for the current election.
Democrats actually spent $2.3 million less than they did in 2011. Republicans, on the other hand, spent $1.7 million more than they did two years earlier. It still was only about half of the Democratic total.

KEY FUNDRAISING TRENDS
NJ Election Law Enforcement Commission Page 4 White Paper No. 26
Table 3 Legislative Fundraising and Spending by Party
YEAR DEMOCRATS RAISED DEMOCRATS SPENT REPUBLICANS RAISED REPUBLICANS SPENT 2003 $29,159,958 $28,528,080 $18,649,276 $16,366,548 2005 $17,560,153 $16,522,626 $ 7,514,067 $ 7,176,582 2007 $35,617,962 $33,394,029 $14,844,892 $13,532,754 2009 $14,674,311 $13,188,346 $ 5,682,968 $ 5,267,534 2011 $31,838,968 $31,055,091 $13,740,008 $12,909,239 2013 $31,023,841 $28,724,119 $15,579,153 $14,635,432
Senate Members Raised More than Assembly Members
Senate members, who usually run just once every four years, tend to raise more money than Assembly members, who always run every two years. The trend held true in 2013.
Table 4 Spending by Legislative House
YEAR SENATE PERCENT ASSEMBLY PERCENT 2003 $24,249,066 54% $20,741,190 46% 2007 $23,028,754 49% $24,203,093 51% 2011 $22,577,034 51% $21,447,238 49% 2013 $23,103,919 53% $20,343,058 47%
Incumbents Maintain Advantage
On a percentage basis, incumbents, nearly all of whom were winners, reported the second largest advantage over challengers since 2003- 77 percent to 23 percent.
The numbers do not factor in the heavy spending by independent groups, nearly all of which was intended to protect Democratic incumbents. No incumbent/challenger breakdown is available for the independent spenders.

KEY FUNDRAISING TRENDS
NJ Election Law Enforcement Commission Page 5 White Paper No. 26
Table 5
Spending Advantage of Incumbent Legislators over Challengers
YEAR INCUMBENTS SPENT CHALLENGERS SPENT INCUMBENT PERCENT CHALLENGER PERCENT 2003 $25,376,630 $15,069,233 63% 37% 2005 $14,279,965 $ 8,219,657 63% 37% 2007 $22,242,726 $21,160,907 51% 49% 2009 $12,761,309 $ 3,230,602 80% 20% 2011 $32,174,797 $11,849,475 73% 27% 2013 $33,525,856 $ 9,921,121 77% 23%
Most Incumbents Reelected- Again
The big spending edge enjoyed by incumbents paid off in both legislative houses. Only two Assembly incumbents- one a Democrat, one a Republican- suffered losses. The vast majority won reelection.
Table 6 Number of Assembly Candidates
Who Won Reelection YEAR TOTAL WON LOST PERCENT WON 2003 72 68 4 94.4% 2005 73 70 3 95.9% 2007 54 53 1 98.1% 2009 71 71 0 100% 2011 66 65 1 98.5% 2013 74 72 2 97.3%
Senate incumbents fared even better since all 39 won reelection. It was the second election in a
row in which voters returned every Senate incumbent to their seats.
Table 7 Number of Senate Candidates
Who Won Reelection YEAR TOTAL WON LOST PERCENT WON 2003 37 35 2 94.6% 2007 27 24 3 88.9% 2011 37 37 0 100% 2013 39 39 0 100%

KEY FUNDRAISING TRENDS
NJ Election Law Enforcement Commission Page 6 White Paper No. 26
Research indicates that reelection rates in state legislative races are near historically high levels.
“…the 2014 elections saw among the lowest levels of competitiveness in the last 40 years…95.1 percent of people lived in a district where the winner won by more than 5 percent.”1 Average Contribution is Second Highest Ever
The average contribution was $2,668 in 2013. It was the second highest average ever behind the $2,803 benchmark set in 2003.
The average also rose for the third straight election since the end of the so-called “Clean Elections” pilot program in 2007, which provided public funds for candidates running in a few districts.
During 2005 and 2007, candidates eligible for “Clean Elections” grants were required to gather small contributions from thousands of contributors to obtain public funds. For instance, there were 12,989 contributions of $10 during the 2007 race.
Once the publicly funded program ended, the number of small contributions also dropped sharply. The overall average also shot up.
Table 8 Average Contributions to
Legislative Candidates
YEAR AVERAGE CONTRIBUTION
CLEAN ELECTIONS PROGRAM IN EFFECT?
2003 $2,803 No 2005 $1,800 Yes 2007 $1,472 Yes 2009 $2,147 No 2011 $2,501 No 2013 $2,668 No
1 Carl Klarner, “Democracy in Decline- The Collapse of the ‘Close Race’ in State Legislatures,” Ballotpedia.com, May 6, 2015.

KEY FUNDRAISING TRENDS
NJ Election Law Enforcement Commission Page 7 White Paper No. 26
Contributions by Size
In recent years, large contributions by candidates in safe legislative districts to those in so-called battleground districts have become common. As a result, candidates now get most of their money from large checks.
Among checks $5,000 or less, candidates received $10.5 million from 10,215 checks for an average of $1,032. On the other hand, looking at checks above $5,000, they got $20.2 million through 1,298 checks worth an average of $15,543.
Table 9 Range of Contributions Received by
Legislative Candidates RANGE COUNT AMOUNT
> $100,000 19 $ 3,300,964 $25,001 to $100,000 168 $ 6,947,077 $5,001 to $25,000 1,111 $ 9,926,350 $4,001 to $5,000 119 $ 515,182 $3,001 to $4,000 247 $ 821,805 $2,001 to $3,000 1,559 $ 3,753,304 $1,001 to $2,000 715 $ 1,024,606 $301 to $1,000 6,510 $ 4,386,381 $300 or less 1,065 $ 40,060 TOTAL 11,513 $30,715,729

KEY FUNDRAISING TRENDS
NJ Election Law Enforcement Commission Page 8 White Paper No. 26
Table 10 Year to Year Comparison of Range of Contributions
Received by Legislative Candidates RANGE 2003 % 2005 % 2007 %
>$100,000 45 0.4% 15 0.2% 44 0.2% $25,001-$100,000 132 1% 57 0.6% 122 0.5% $5,001-$25,000 672 6% 449 5% 793 3% $4,001-$5000 290 2% 152 2% 276 1% $3,001-$4,000 141 1% 66 1% 140 1% $2,001-$3,000 967 8% 647 7% 1,074 4% $1,001-$2,000 1,287 11% 647 7% 1,419 6% $301-$1,000 7,927 65% 4,153 42% 7,355 29% $300 or less 691 6% 3,667 37% 14,228 56% TOTAL 12,152 9,853 25,451 RANGE 2009 % 2011 % 2013 % >$100,000 7 0.1% 15 0.1% 19 0.2% $25,001-$100,000 45 0.6% 110 1% 168 1% $5,001-$25,000 509 7% 872 7% 1,111 10% $4,001-$5000 162 2% 321 3% 119 1% $3,001-$4,000 115 2% 217 2% 247 2% $2,001-$3,000 721 10% 1,376 11% 1,559 14% $1,001-$2,000 702 10% 1,203 10% 715 6% $301-$1,000 4,118 58% 6,800 57% 6,510 57% $300 or less 672 10% 1,060 9% 1,065 9% TOTAL 7,051 11,974 11,513
Self-Financing by Legislative Candidates- A Three-Decade Analysis Personal financing of political campaigns is a long tradition not only in the United States but in New Jersey.
An unsuccessful 1981 gubernatorial primary campaign by Joseph “Bo” Sullivan cost his wallet $4.8 million in current dollars.2
When Democrat Frank Lautenberg first won election to the U.S. Senate in 1982, he spent the equivalent of $12.6 million on his campaign.3
2 Page 7.2, “New Jersey Public Financing- 1981 Gubernatorial Elections,” June 1982. 3 Page 27, Herbert E. Alexander, “Financing Politics- Money, Elections and Political Reform,” 1984.
LEGISLATIVE SELF-FINANCING TRENDS
NJ Election Law Enforcement Commission Page 9 White Paper No. 26
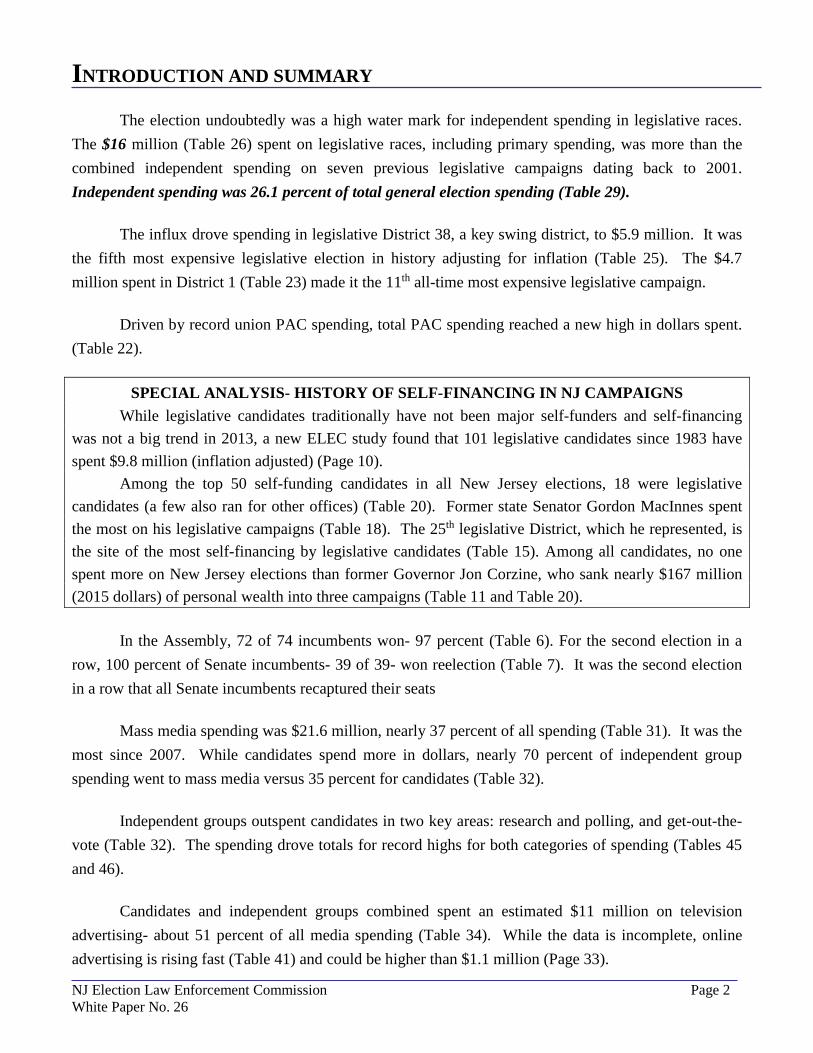
More than a decade later, Republican Malcolm “Steve” Forbes sank $37.4 million into his 1996 presidential primary and $38.7 million into his 2000 presidential primary.4 He lost both at a combined cost of $110 million in current dollars. No New Jersey candidate has ever spent more on a single campaign or on multiple campaigns than Democrat Jon Corzine. His victorious 2000 U.S. Senate bid cost the former Goldman Sachs executive $60.2 million from his own funds.5 In 2015 dollars, the total was more than $83 million. Corzine later invested $71 million, or $83 million in 2015 dollars, into gubernatorial runs in 2005 and 2009.6 He won the first but lost the second. In the earlier contest, he defeated Republican Doug Forrester, who put $30 million, or nearly $37 million in today’s dollars, into his 2005 gubernatorial campaign against Corzine.7
Table 11 Top 10 Elections Involving
Self-Funding by New Jersey Candidates
CANDIDATE YEAR OFFICE AMOUNT INFLATION ADJUSTED
1 Corzine, Jon 2000 US Senate $60,198,967 $83,311,920 2 Forbes, Steve 1996 President $37,394,000 $56,878,443 3 Forbes, Steve 2000 President $38,675,038 $53,596,595 4 Corzine, Jon 2005 Governor $43,135,570 $52,711,092 5 Forrester, Doug 2005 Governor $29,927,189 $36,570,627 6 Corzine, Jon 2009 Governor $27,460,000 $30,546,893 7 Lautenberg, Frank 1982 US Senate $ 5,100,000 $12,611,956 8 Forrester, Doug 2002 US Senate $ 7,485,000 $ 9,929,545 9 MacArthur, Tom 2014 House $ 5,000,000 $ 5,115,021
10 Sullivan, Joseph “Bo” 1981 Governor $ 1,842,000 $ 4,836,091
Compared to the vast sums spent by some of the above candidates, the amounts of personal wealth used by legislative candidates have been modest. For instance, candidates in 2013 tapped their personal funds for an estimated total of $311,048 not counting repayments. The largest reported loan was by Assembly candidate Niki Trunk in District 3, who sank almost $72,000 into her loss. 4 Dave Levinthal, “Meg Whitman Blows Away Self-Funded Federal Candidates with Cash Comparison,” Center for
Responsive Politics, September 16, 2010. 5 Jon Stevens Corzine, 1999-2000 Election Cycle, www.politicalmoneyline.com. 6 R-1 Forms filed with ELEC June 27, 2005 (primary) and April 17, 2006 (general), and 2009 contribution search performed
on 9/14/15, respectively. 7 R-1 Form filed with ELEC October 12, 2012.

LEGISLATIVE SELF-FINANCING TRENDS
NJ Election Law Enforcement Commission Page 10 White Paper No. 26
Table 12 Top Five Self-Financing Candidates
in 2013 Legislative Elections CANDIDATE AMOUNT* DISTRICT W/L? PARTY OFFICE Trunk, Niki $71,707 3 L R Senate Zipprich, Ed $43,430 11 L D Assembly Cook, Steve $42,158 14 L R Assembly Bidwell, Jane $35,854 39 L D Senate Auth, Bob $26,327 39 W R Assembly *Inflation adjusted
However, looking back over more than three decades, the amount spent by self-financing
legislative candidates is not insignificant. A new analysis identified 101 candidates who contributed at least $15,000 to their campaigns
during that period. They spent a total of $9.8 million in inflation adjusted dollars.
Of the major legislative self-funders, Democratic candidates outspent Republicans and independents.
Table 13 Legislative Self-Funding
by Party PARTY AMOUNT*
Democrat $5,409,243 Independent $ 41,141 Republican $4,398,319 GRAND TOTAL $9,848,703
*Inflation adjusted.
Interestingly, self-financing candidates spent far more on losing elections than winners. This is evidence that the power of the incumbency is not easily overcome.
Table 14 Legislative Self-Funding by Winners and Losers
PARTY AMOUNT* Losers $6,984,663 Winners $2,864,040 GRAND TOTAL $9,848,703
*Inflation adjusted.

LEGISLATIVE SELF-FINANCING TRENDS
NJ Election Law Enforcement Commission Page 11 White Paper No. 26
Legislative District 25, which currently comprises parts of Morris and Somerset Counties, by far
was the focus of the most self-financing historically.
Table 15 Self-Funding Totals by
Legislative District DISTRICT TOTAL*
25 $2,180,051 21 $ 838,655 31 $ 813,277 39 $ 612,960 37 $ 577,242 27 $ 456,379 24 $ 410,298 34 $ 321,308 11 $ 313,955 15 $ 293,919
*Inflation adjusted.
Legislative Districts 8, 9, and 10 were the only ones where no candidate spent at least $15,000 on
their campaign. All three traditionally have tended to elect Republican candidates. While many legislative candidates financed their own campaigns for the past 30 years, self-
financing does not appear on a major upswing. It has peaked in years when both legislative houses are up for reelection, and several seats are open. The most legislative self-financing took place in 2007.
Table 16
Five Top Years for Legislative Self-Funding
YEAR AMOUNT* UP FOR REELECTION 2007 $1,916,378 Senate, Assembly 2003 $1,893,081 Senate, Assembly 1987 $1,181,046 Senate, Assembly 1997 $1,155,777 Governor, Senate, Assembly 1993 $ 740,355 Governor, Senate, Assembly
*Inflation adjusted.

LEGISLATIVE SELF-FINANCING TRENDS
NJ Election Law Enforcement Commission Page 12 White Paper No. 26
The trend suggests self-financing peaks during years when Senate candidates are running. More Senate contenders have tapped their personal savings than Assembly candidates.
Table 17 Legislative Self-Funding
by Office OFFICE TOTAL*
Senate $5,941,645 Assembly $3,907,058 TOTAL $9,848,703 *Inflation adjusted.
Several candidates personally bankrolled multiple Legislative campaigns.
Table 18
Top 10 Self-Funding Legislative Candidates
CANDIDATE AMOUNT* OFFICES HELD CAMPAIGNS WITH SELF-FUNDING
MacInnes, Gordon $ 846,009 Assemblyman, Senator 4 Manzo, Louis $ 694,659 Assemblyman 3 Mancuso, Peter $ 520,838 Not elected 2 Shain, Joel $ 398,832 Not elected 1 MacInnes, Blair $ 364,462 Not elected 1 Munoz, Eric $ 336,434 Assemblyman 4 Genovese, Gina $ 269,527 Not elected 1 Oroho, Steven $ 244,868 Senator 1 Honig, Barry $ 233,282 Not elected 1 Casha, Lawrence $ 231,106 Not elected 1
*Inflation adjusted; does not include repayments.
Gordon MacInnes is the most prolific legislative self-financer. He is a former business executive who represented Morris County between 1994 and 1998 as a state Senator, and from 1974 to 1976 as a state Assemblyman.
MacInnes was an assistant state education commissioner from 2002 to 2007 and currently serves as president of New Jersey Policy Perspective, a progressive think tank located in Trenton. His wife, Blair, ran unsuccessfully for a Senate seat in 2003. She also largely self-financed.
Records still exist for legislative elections that occurred during the past three decades. But they are gone for one campaign that some observers believe may have been the most expensive legislative election of all-time- the 1955 showdown between Republican state Senator Malcolm Forbes and Democratic challenger Charles Englehard. Both were future billionaires.

LEGISLATIVE SELF-FINANCING TRENDS
NJ Election Law Enforcement Commission Page 13 White Paper No. 26
Expense reports filed with the Somerset County Clerk’s office at the time showed that they spent a combined total of only $1,963- $858 for Forbes, $1,105 for Englehard.8 The total is about $17,481 in current dollars.
However, disclosure laws at the time failed to capture the heavy personal spending by the two
future billionaires. “Englehard, an industrialist new to politics,…poured money unstintingly into his drive to unseat the financial magazine publisher.”9
Englehard was a mining magnate who was the inspiration for James Bond villain Auric
Goldfinger.10 At one point, he reportedly campaigned on his yacht up the Raritan River wearing a white naval uniform.
Raymond Bateman, who later succeeded Forbes in the state Senate and was a close colleague,
said he believes Englehard spent more personal funds than Forbes. “He’s the only candidate I ever remember who paid for everything out of his own pocket,” he said.
At one point, he said, Englehard bought an entire weekly newspaper, the Somerville Star, and
turned it into a daily during the campaign to compete with Forbes’s own newspaper, the Messenger Gazette.
Whatever the full cost of the race, Forbes won by 370 votes and survived a recount. In more recent decades, research indicates the election involving the most self-funding by
legislative candidates occurred in the 25th legislative district in 1987. Three candidates spent $638,654 in 2015 dollars. Senator John Dorsey fended off a Republican
primary challenge by Peter Mancuso. Dorsey defeated Gordon MacInnes in the general election. In inflation adjusted dollars, Dorsey spent $65,103, Mancuso spent $291,995, and MacInnes invested $281,556.
The largest amount expended by one candidate on a single legislative campaign was by former
Orange Mayor Joel Shain.
8 New York Herald Tribune, November 11, 1955. 9 Everett C. Landers, Newark Evening News, November 9, 1955. 10 Robert Walker, “A Tough Act to Follow,” New York Times, April 11, 1971.

LEGISLATIVE SELF-FINANCING TRENDS
NJ Election Law Enforcement Commission Page 14 White Paper No. 26
He spent $167,043 of his own money in an unsuccessful 27th District primary against Richard Codey, who still serves in the Legislature as a state Senator. In current dollars, Shain spent $398,832.
Table 19 Top 25 Largest Self-Funded
Legislative Elections
CANDIDATE AMOUNT WITHOUT
INFLATION* DISTRICT W/L? PARTY OFFICE YEAR
AMOUNT INFLATION ADJUSTED
Shain, Joel $167,043 27 L D S 1983 $398,832 MacInnes, Blair $282,000 25 L D S 2003 $364,462 Manzo, Louis $256,593 31 L D A 2007 $297,733 Mancuso, Peter $139,000 25 L R S 1987 $291,995 MacInnes, Gordon $175,000 25 W D S 1993 $289,008 MacInnes, Gordon $134,500 25 L D S 1987 $281,556 MacInnes, Gordon $181,829 25 L D S 1997 $270,351 Genovese, Gina $235,000 21 L D S 2007 $269,527 Oroho, Steven $213,500 24 W R S 2007 $244,868 Honig, Barry $180,500 37 L R S 2003 $233,282 Casha, Lawrence $201,501 26 L R A 2007 $231,106 Napolitani, John $200,000 11 L D A 2007 $229,384 Mancuso, Peter $153,912 25 L R S 1997 $228,843 Martin, Bob $194,384 15 L R S 2007 $223,724 Manzo, Louis $182,540 31 W D A 2005 $223,047 Samuel, Geri $128,984 22 L D A 1995 $201,972 Hetchka, Donald $ 96,000 34 L D S 1987 $200,962 Lonegan, Steve $121,168 37 L R S 1997 $180,158 Muti, Richard $136,936 39 L D S 2003 $177,358 Kurtz, Kenneth $108,900 30 L D S 1997 $175,507 Manzo, Louis $134,068 31 W D A 2003 $173,879 Viall, Paul $128,000 24 L R S 2003 $165,430 Sandoval, Jose $129,000 36 L R A 2005 $157,413 Schainholz, Jay $111,550 38 L R S 2003 $144,169 Munoz, Eric $ 89,999 21 W R A 2001 $120,916 *Does not include repayments
Note on Methodology Used in Self-Funding Analysis Includes self-funders who spent at least $15,000. Totals do not adjust for repayments by candidates. In a
few cases, candidate totals include checks from family members. Legislative R-1 Reports dating back to 1985 were included in the analysis. Joel Shain’s campaign totals also were checked because the author was aware of his self-financed candidacy. Except where noted, totals for congressional candidates dating back to 1980 were taken from www.politicalmoneyline.com.

LEGISLATIVE SELF-FINANCING TRENDS
NJ Election Law Enforcement Commission Page 15 White Paper No. 26
In compiling a list of the top 50 top self-funders, 18 legislative candidates made the list (see boldfaced).
Table 20 Top 50 Self-Funding New Jersey Candidates
RANK CANDIDATE AMOUNT INFLATION ADJUSTED AMOUNT*
OFFICES SOUGHT AREA
1 Corzine, Jon $130,794,537 $166,569,905 US Senate, Gubernatorial Statewide 2 Forbes, Steve $ 76,069,038 $110,475,038 Presidential National 3 Forrester, Doug $ 37,412,189 $ 46,500,172 US Senate, Gubernatorial Statewide 4 Lautenberg, Frank $ 9,444,600 $ 18,183,086 US Senate Statewide 5 MacArthur, Tom $ 5,000,000 $ 5,115,021 US House Third Congressional District 6 Sullivan, Joseph “Bo” $ 1,842,000 $ 4,836,091 Gubernatorial Statewide 7 Fenwick, Millicent $ 877,000 $ 2,168,907 US Senate Statewide 8 Chandler, Marguerite $ 1,028,803 $ 1,875,901 US House Twelfth Congressional District 9 Manzo, Louis $ 1,261,487 $ 1,577,778 Legislative, Mayor District 31, Jersey City
10 Mason, Beth $ 1,395,852 $ 1,546,972 Mayor, Council Hoboken 11 Dawkins, Pete $ 736,290 $ 1,483,260 US Senate Statewide 12 Schundler, Bret $ 840,855 $ 1,275,672 Gubernatorial, Mayor,
Legislative Statewide, Jersey City, 31st District
13 Kean, Tom Sr. $ 308,000 $ 1,180,142 Gubernatorial Statewide 14 Klein, Herbert $ 661,000 $ 1,120,794 US House Eighth Congressional District 15 Lonegan, Steve $ 855,874 $ 1,035,209 US House/Legislative Ninth and Third Congressional
Districts; 37th Legislative District 16 Mochary, Mary $ 385,317 $ 883,804 US Senate Statewide 17 MacInnes, Gordon $ 492,479 $ 846,009 Legislative District 25 and 23 18 Estabrook, Anne Evans $ 691,584 $ 765,505 US Senate Statewide 19 Lernert, Lawrence Irwin $ 490,000 $ 744,263 US House Seventh Congressional District 20 Frelinghuysen, Rodney $ 360,500 $ 655,176 US House Eleventh and Twelfth Congressional
Districts 21 Florio, Jim $ 415,000 $ 612,653 US Senate, Governor Statewide 22 Ferguson, Mike $ 420,000 $ 569,048 US House Sixth and Seventh Congressional
Districts 23 Mancuso, Peter $ 292,912 $ 520,838 Legislative District 25 24 Sumers, Anne Ricks $ 388,000 $ 513,989 US House Fifth Congressional District 25 McCann, Gerald $ 211,000 $ 423,097 Mayor Jersey City 26 Katz, Ruth $ 269,500 $ 409,345 US House Second Congressional District 27 Shain, Joel $ 167,043 $ 398,832 Legislative District 27 28 Kean, Tom Jr. $ 287,760 $ 398,245 US House Seventh Congressional District 29 MacInnes, Blair $ 282,000 $ 364,462 Legislative District 25 30 Raia, Frank $ 325,000 $ 361,023 Mayor Hoboken 31 Munoz, Eric $ 266,199 $ 336,434 Legislative District 21 32 Runyan, Jon $ 300,000 $ 328,340 US House Third Congressional District 33 Gooch, Diane $ 288,728 $ 316,003 US House Sixth Congressional District 34 Zimmer, Dawn $ 274,000 $ 307,383 Mayor, Council Hoboken 35 Fusco, Anthony $ 215,698 $ 298,515 House Eighth Congressional District 36 Genovese, Gina $ 235,000 $ 269,527 Legislative District 21 37 Byrne, Tom $ 190,000 $ 262,950 US Senate Statewide 38 Oroho, Steve $ 213,500 $ 244,868 Legislative District 24 39 Ryan, Tim $ 238,000 $ 239,588 Freeholder Ocean County 40 Honig, Barry $ 180,500 $ 233,282 Legislative District 37 41 Casha, Lawrence $ 201,501 $ 231,106 Legislative District 26 42 Napolitani, John $ 200,000 $ 229,384 Legislative District 11 43 Martin, Bob $ 194,384 $ 223,724 Legislative District 15 44 Adler, John $ 140,000 $ 209,198 Legislative District 6 45 Schroeder, Robert $ 192,100 $ 207,499 Legislative District 39 46 Samuel, Geri $ 128,984 $ 201,972 Legislative District 22 47 Hetchka, Donald $ 96,000 $ 200,962 Legislative District 34 48 McConkey, Phillip $ 107,700 $ 196,378 US House Twelfth Congressional District 49 Zimmer, Richard $ 100,000 $ 182,338 US House Twelfth Congressional District 50 Bradley, Bill $ 83,417 $ 181,685 US Senate Statewide
*May include multiple campaigns and contributions from family members.

SOURCES OF CONTRIBUTIONS TO LEGISLATIVE CANDIDATES
NJ Election Law Enforcement Commission Page 16 White Paper No. 26
Sources of Contributions to Legislative Candidates
Legislators tend to get their funds from many of the same sources and in roughly the same proportions as in previous campaigns.
For the fourth straight election since 2007, legislative candidates received the large chunk of
their money from other campaign funds, mostly other legislators.
In 2013, they received $8.7 million from campaign funds- 28 percent of their total haul. That
was only slightly under the record high 31 percent that legislative candidates got from campaign funds in the 2011 election.
As previous white papers have indicated, legislative candidates can accept larger checks from
public contractors- $2,600 versus $300- than either the two state parties or the four legislative leadership committees.
As a result, checks from contractors that in the past would have flowed through parties and
leadership PACs to individual legislators now go straight to the legislators.
Legislators in relatively safe districts, in turn, transfer funds to the parties or leaders, or to lawmakers in so-called “battleground” districts where skirmishing is most intense.
Table 21 Contributions by Contributor Type to Legislative Candidates
TYPE TOTAL % TOP YEAR BY PERCENT %
Campaign Fund $ 8,691,931 28% 2011 31% Political Party Committee $ 4,452,027 14% 2001 26% Union PAC $ 3,935,864 13% 2013 13% Legislative Leadership Committee $ 3,823,192 12% 2005 32% Individual $ 3,574,105 12% 2011 13% Businesses- Direct $ 2,918,096 10% 2003 and 2013 10% Professional/Trade Association PAC $ 1,894,355 6% 2009 9% Ideological PAC $ 614,578 2% 2007 3% Regulated Industries PAC $ 386,300 1% NA NA Business PAC $ 310,650 1% 2011 3% Union $ 101,360 0.3% 2011 2% Political Committee $ 7,149 0.02% 2001 4% Misc./Other $ 4,738 0.02% 2007 1% Interest $ 1,384 0.005% 2007 0.10% $30,715,729* 100%
*Excludes in-kind contributions and contributions under $300

SOURCES OF CONTRIBUTIONS TO LEGISLATIVE CANDIDATES
NJ Election Law Enforcement Commission Page 17 White Paper No. 26
Legislative leadership committees contributed 12 percent of the 2013 contributions- the same percentage as they did in 2011. But that is well below the 32 percent they contributed to legislators in 2005.
As a percentage of total contributions, political parties gave 14 percent in 2013- about $4.4 million. That is more than the 11 percent they gave two years earlier but well below the 26 percent peak in 2001. It is another sign that the clout of party committees is being diminished by tight curbs on public contractor contributions to parties and growing independent spending by special interest groups.
Unions- both directly and through political actions committees (PACs)- gave just over $4
million, the most ever for a legislative election. However, as a percentage of total contributions, they were 13 percent-one percentage point lower than in 2009.
Businesses- also both directly and through PACs- gave $3.2 million- slightly less than the $3.5
million they gave in 2011. As a share of all sources of contributions, the amount was 11 percent- just under the 12 percent in 2011. Neither the union or business totals include contributions to independent groups.
PACs as a group contributed the most ever to legislative campaigns in 2013- $7.1 million. At 23
percent of all sources, they represented the second largest source except for 2009, when PAC contributions made up 24 percent of all contributions.
Table 22 Contributions by PAC Type
to Legislative Candidates in 2013 TYPE TOTAL % OF PACS Business PAC $ 310,650 4% Ideological PAC $ 614,578 9% Professional/Trade Association PAC $1,894,355 27% Union PAC $3,935,864 55% Regulated Industries PAC $ 386,300 5%
% of All Sources
All PACs $7,141,747 23%
Contributions from union PACs, which have risen steadily since 2001, reached $3.9 million- 55
percent of all PAC contributions, the largest percentage ever. The figures were $3.1 million and 47 percent, respectively, in 2011- both previous highs.

SOURCES OF CONTRIBUTIONS TO LEGISLATIVE CANDIDATES
NJ Election Law Enforcement Commission Page 18 White Paper No. 26
Beginning with this white paper, contributions from PACs operated by regulated industries- power and water utilities and cable and telecommunications companies that cannot give directly from their corporate treasuries because they are regulated by the state- were totaled separately from other business PACs.
In 2013, regulated industries gave $386,300. Other business PACs gave $310,650 for a total of $696,950- about 2 percent of all contributions received by legislative candidates.
As a share of PAC dollars, business PACs made up about 9 percent- down from 12 percent in 2011.

BATTLEGROUND DISTRICTS REMAIN TOP MAGNETS FOR CAMPAIGN CASH
NJ Election Law Enforcement Commission Page 19 White Paper No. 26
Keeping with tradition in New Jersey legislative elections, a small group of districts in 2013 attracted the heaviest spending.
Combined, the 10 districts with the most spending totaled $34 million- about 64 percent of the
$53 million spent in all 40 legislative districts- one percentage point higher than in 2011. The top five districts alone drew 43 percent of the spending versus 44 percent two years earlier.
Table 23
Top 10 Legislative Districts by Spending in 2013
The $5.9 million spent in District 38 was the third most costly legislative election not adjusting for inflation. Factoring in inflation, it was fifth all-time. The most expensive race ever- the District 4 clash in 2003- cost $7.9 million on an inflation-adjusted basis (see Table 25 below).
The District 38 race also had the distinction of attracting the largest amount of funds ever from independent special interest groups- $2.2 million.
How large is that sum? It was more than all independent groups spent statewide in 2011.
Since 2003, District 38, which includes parts of Bergen and Passaic Counties, has been the site of several major skirmishes. More than $16.5 million has been spent there, making it the third most expensive district in the state since 2003. District 2 was number one at nearly $20 million.
DISTRICT CANDIDATES INDEPENDENT TOTAL 38 $ 3,689,182 $2,221,136 $ 5,910,318 1 $ 2,668,896 $1,998,704 $ 4,667,600 3 $ 3,999,665 $ 186,911 $ 4,186,576 2 $ 3,344,674 $ 838,560 $ 4,183,234
14 $ 3,204,759 $ 665,304 $ 3,870,063 18 $ 2,564,370 $ 3,901 $ 2,568,271 21 $ 2,332,515 $ 32,000 $ 2,335,715 7 $ 1,901,440 $ 394,481 $ 2,295,921
16 $ 987,927 $1,117,615 $ 2,105,542 27 $ 1,912,294 $ 1,912,294
$26,605,722 $7,458,612 $34,035,534

BATTLEGROUND DISTRICTS REMAIN TOP MAGNETS FOR CAMPAIGN CASH
NJ Election Law Enforcement Commission Page 20 White Paper No. 26
Table 24
Top 10 Legislative Districts by Spending- 2003-2013
DISTRICT TOTAL- 2003-2013 YEARS IN TOP FIVE 2 $19,984,840 2005,2007,2011,2013 14 $17,599,024 2005,2007,2009,2010,2013 38 $16,536,474 2003,2011,2013 1 $16,452,029 2007,2009,2013 3 $14,798,606 2003,2011,2013 12 $11,815,081 2005,2007 36 $11,364,436 2003,2005,2009 7 $10,247,197 2011 4 $10,098,207 2003 27 $ 8,113,722 2011
Despite unprecedented spending by independent special interest groups in the 2013 legislative
elections, the spending record set in the District 4 campaign in 2003 remains intact. One 2013 race joined the all-time top ten list- the District 38 campaign in fifth place.
Table 25 Top 10 All Time Legislative
Districts by Spending
DISTRICT TOTAL SPENDING* DEMOCRATS REPUBLICANS INDEPENDENT
GROUPS TOTAL WITH INFLATION YEAR WINNERS
4 $6,142,441 $4,570,686 $1,571,755 $7,905,329 2003 Democrats 12 $5,963,939 $5,057,798 $ 906,141 $6,808,150 2007 Republicans 1 $4,975,772 $3,605,195 $1,370,577 $6,403,825 2007 Democrats 2 $5,806,467 $3,519,935 $2,069,512 $ 209,762 $6,112,071 2011 Split
38 $5,910,318 $2,713,003 $ 976,179 $2,221,136 $6,006,421 2013 Democrats 3 $4,548,302 $3,943,220 $ 605,083 $5,853,671 2003 Democrats
38 $5,183,499 $3,214,496 $1,483,318 $ 485,685 $5,456,315 2011 Democrats 2 $4,458,631 $2,832,527 $1,626,104 $5,404,401 2005 Split 3 $3,940,278 $2,828,825 $1,111,453 $5,267,751 2001 Democrats 2 $4,314,225 $3,281,467 $1,032,758 $4,924,914 2007 Split
*May also include some spending by independent candidates.
Influence of Independent Groups Grows Independent special interest groups drew much attention in the 2011 legislative elections when
they spent an estimated $1.8 million, mostly in battleground districts.
BATTLEGROUND DISTRICTS REMAIN TOP MAGNETS FOR CAMPAIGN CASH
NJ Election Law Enforcement Commission Page 21 White Paper No. 26
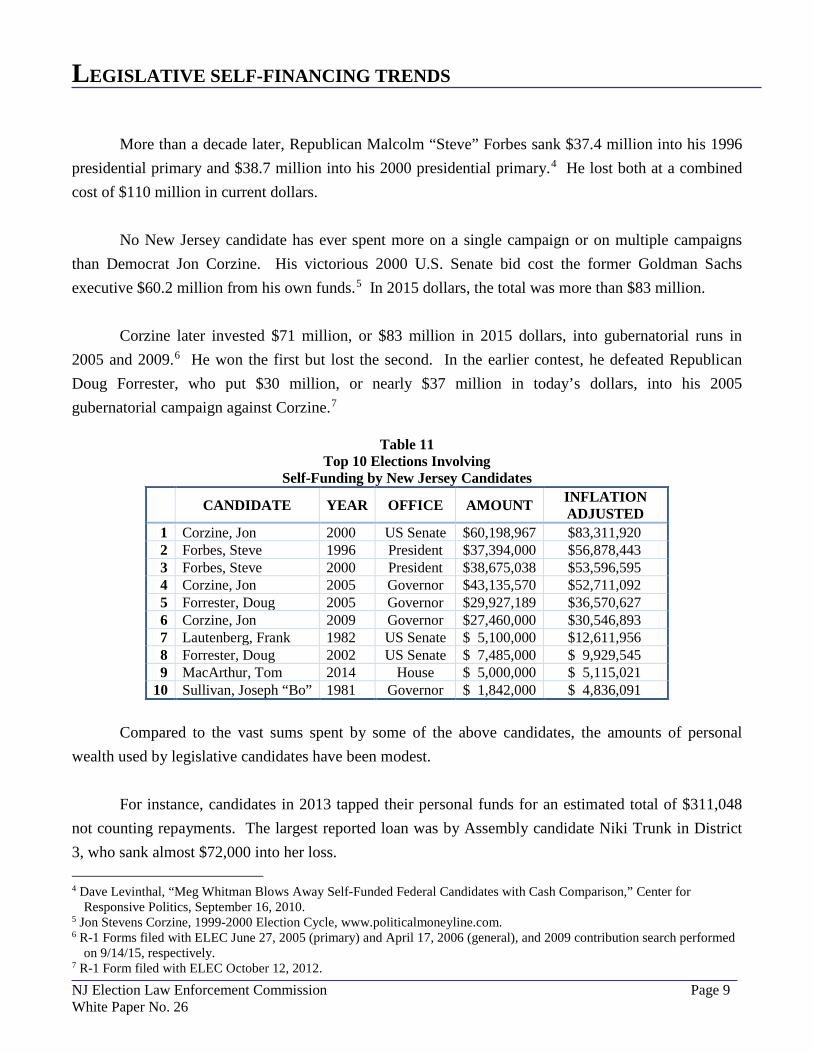
In 2013, they spent more than nine times that sum- an estimated $16 million. This includes $650,623 spent during the primary.
Sometimes called “outside” spenders because they are supposed to operate separately from candidate and party committees, independent fundraising committees have a major advantage- they are exempt from contribution limits that apply to candidates and parties.
Many independent special interest groups also exploit another edge- depending on how they spend their money, they can avoid disclosing to the public a detailed list of contributors, expenses or both.
In a bipartisan recommendation first made in 2010, ELEC has urged the Legislature to extend the same disclosure rules to independent groups as those followed by candidates and parties (see recommendation one, Page 36).
Interestingly, Fund for Jobs Growth and Security, the biggest independent spender in the 2013 legislative elections, voluntarily and fully disclosed its campaign finance activity.
It spent $8.7 million on New Jersey elections, including $8 million on legislative elections and the rest on a ballot question to raise the state minimum wage.
Table 26 Estimated Special Interest Independent Spending in 2013
New Jersey Legislative Election GROUP TOTAL
Fund for Jobs Growth and Security $ 8,017,190 Garden State Forward $ 5,552,500 Realtors PAC $ 754,056 NJ Workers Voices $ 739,839 Republican State Leadership Committee $ 446,166 Americans for Prosperity $ 400,000 Planned Parenthood Action Fund of NJ $ 64,616 NJ League of Conservation Voters PAC $ 44,603 NJ Family First $ 6,724 TOTAL* $16,025,694
*Total includes $650,623 spent during primary.

BATTLEGROUND DISTRICTS REMAIN TOP MAGNETS FOR CAMPAIGN CASH
NJ Election Law Enforcement Commission Page 22 White Paper No. 26
Fund for Jobs Growth and Security was run by Susan McCue, a New Jersey native and chief of staff to U.S. Senator Harry Reid (D-NV) when he was Majority Leader. It has since participated in legislative elections in other states, including Pennsylvania.
On June 9, 2015, the group filed with ELEC to participate in the 2015 general elections under its
new name, the General Majority PAC. Fund for Jobs Growth and Security spent heavily in the two key battleground districts in 2013-
Districts 1 and 38. The result was no net change in Democratic seats. After the election, Jonathan Levy, executive director of Fund for Jobs Growth and Security, said
its whole intention was to provide protection for the Democratic majority. “We made sure that the governor had no coattails,” he said.11
Table 27
Spending by Independent Groups in Targeted Legislative Districts GROUP 1 2 3 7 14 16 18 38
Fund for Jobs, Growth and Security $1,782,776 $822,377 $171,742 $151,546 $520,459 $ 920,729 $1,841,076
Garden State Forward Realtors PAC $ 164,000 $241,000 $ 174,969 NJ Workers Voices $ 52,125 $ 9,656 $ 6,581 $ 1,274 $ 30,203 Republican State Leadership Committee $ 15,169 $ 7,500 $141,055 $ 279,442
Americans for Prosperity Planned Parenthood Action Fund of NJ $ 1,250 $ 2,175
NJ League of Conservation Voters PAC $ 1,463 $ 21,917 $3,901
NJ Family First $ 6,724 TOTAL $1,998,901 $838,757 $186,911 $406,627 $665,501 $1,117,615 $3,901 $2,152,896
11 Byron Tau, “Democrats, Unions Celebrate New Jersey Statehouse Wins,” Politico, November 6, 2013.

BATTLEGROUND DISTRICTS REMAIN TOP MAGNETS FOR CAMPAIGN CASH
NJ Election Law Enforcement Commission Page 23 White Paper No. 26
Table 28 Additional Spending by Independent Groups in Legislative Districts
GROUP TOTAL
TARGETED DISTRICTS
DISTRICT EITHER NOT SPECIFIED
OR COMBINED
13 20 21 34 TOTAL
SPENDING IN LEGISLATIVE
RACES
Fund for Jobs, Growth and Security $6,210,705 $1,771,025 $35,460 $ 8,017,190
Garden State Forward $5,552,500 $ 5,552,500 Realtors PAC $ 579,969 $73,650 $32,000 $68,437 $ 754,056 NJ Workers Voices $ 99,839 $ 640,000 $ 739,839 Republican State Leadership Committee $ 443,166 $ 3,000 $ 446,166
Americans for Prosperity $ 400,000 $ 400,000
Planned Parenthood Action Fund of NJ $ 3,425 $ 61,191 $ 64,616
NJ League of Conservation Voters PAC
$ 27,281 $ 17,322
$ 44,603
NJ Family First $ 6,724 $ 6,724 TOTAL $7,371,109 $8,442,038 $ 3,000 $109,110 $32,000 $68,437 $16,025,694
Susan McCue, who oversaw the PAC, further elaborated. “Tuesday’s legislative victory was the
result of an unparalleled effort in New Jersey to build a firewall to protect our Democratic majorities. Together, we applied a model used to win national races to achieve the same success in these state elections.”12
The group’s efforts included a get-out-the-vote operation that contacted 255,000 voters and
extensive TV, radio and direct mail campaigns.13 The extra Democratic spending probably made a difference in Assembly races that featured two
of the closest margins in state history. In one race, Democrat Vince Mazzeo ousted Republican incumbent John Amodeo by 51 votes in District 2.
In District 38, Democratic Assemblyman Timothy Eustace won reelection by 56 votes over
Republican challenger Joseph Scarpa.
12 Id. 13 Id.

BATTLEGROUND DISTRICTS REMAIN TOP MAGNETS FOR CAMPAIGN CASH
NJ Election Law Enforcement Commission Page 24 White Paper No. 26
According to the Office of Legislative Services library, the closest recent legislative election occurred in 1971, when Democrat Peter Stewart defeated Republican John Trezza by 13 votes to seize an Assembly seat in Essex County.14
Going back further, in 1886, Democrat Frederick Walter led Republican Josiah Jones for a
legislative seat in Mercer County by only 2 votes. The race was called a tie after a recount, and the Democratic majority at the time gave the seat to Walter.15
At least $7.5 million of the $16 million spent on legislative races went to the top ten most
expensive districts- about 71 percent. The exact number probably is higher because much independent spending is not broken out by district.
The $15.4 million spent just on the 2013 general elections easily set a new record. It represented
26.1 percent of total general election spending- one of every four dollars. As a percentage of total spending, it was the high water mark except for 2012, when there were just three special Assembly elections.
Table 29 Independent Spending in NJ
Legislative Campaigns Since 2001
YEAR SPENDING BY LEGISLATORS
ESTIMATED INDEPENDENT SPENDING TOTAL SPENDING INDEPENDENT SPENDING
AS % OF TOTAL 2001 $32,550,394 $ 3,166,463 $35,716,857 8.87% 2003 $44,990,255 $ 4,857 $44,995,112 0.01% 2005 $23,713,193 $ 3,476 $23,716,669 0.01% 2007 $47,231,847 $ 165,000 $47,396,847 0.35% 2009 $18,584,098 $ 15,999 $18,600,097 0.09% 2011 $44,024,272 $ 1,835,500 $45,859,772 4.00% 2012* $ 758,612 $ 299,049 $ 1,057,661 28.27% 2013 $43,446,977 $ 15,375,071** $58,822,048 26.14% * Special election. Only three Assembly seats in contention. **Excludes $650,623 in primary spending.
14 Darryl Isherwood, “Two Undecided Assembly Races Remain Close, but Are They the Closest Ever?” Politickernj.com,
November 18, 2013. 15 Id.

MASS MEDIA SPENDING
NJ Election Law Enforcement Commission Page 25 White Paper No. 26
Mass media expenses rose to $21.6 million in 2013, a 50 percent increase versus $14.4 million in 2011. It was the biggest media spending since the 2007 election, when the total reached $22.3 million.
Table 30
Spending by Category in 2013 Legislative Elections*
CATEGORY AMOUNT PERCENT Mass Media $21,607,970 37% Contributions- Political $20,243,491 35% Transfer to Next Campaign $ 4,933,748 8% Administration $ 2,494,023 4% Research and Polling $ 2,243,067 4% GOTV $ 2,229,452 4% Consulting $ 1,967,233 3% Fundraising $ 1,575,244 3% Misc./Multiple Purposes $ 565,791 1% Contributions- Charitable $ 509,670 1% Refunds $ (251,556) -0.4% TOTAL $58,118,132 100%
*Some spending not disclosed.
Mass media as a percentage of total spending also rose compared to the two previous elections.
It reached 37 percent after topping out at 35 percent in 2009 and 33 percent in 2011. The peak figure since 2003 was 55 percent in 2005.
Table 31 Mass Media Spending by
Legislative Candidates as a Percent of Total Campaign Spending
2003 2005 2007 2009 2011 2013 Mass Media Spending $22,763,046 $11,641,252 $22,284,576 $6,054,152 $14,426,075 $21,607,970
PERCENT OF ALL SPENDING 54% 55% 53% 35% 33% 37%
The mass media total includes network and cable television, radio, internet advertising,
billboards and signs, direct mail, newspaper advertising, robocalls and unidentified media. This is the first ELEC analysis of spending in legislative elections that includes a breakdown of
how independent groups allotted their funds. A comparison with spending by candidates shows several differences:

MASS MEDIA SPENDING
NJ Election Law Enforcement Commission Page 26 White Paper No. 26
• Candidates spent more than twice as much money on media as independent groups- $15 million versus $6.6 million. However, as a percentage of each group’s total spending, independent groups spent twice as much on a percentage basis as candidates on media- 67 percent versus 35 percent.
• Independent groups appeared to have outspent candidates in two key areas that traditionally have been the province of candidates and parties- research and polling and get-out-the-vote (GOTV).
• Candidates spent nearly as much money as their media outlays on contributions to other candidates and state parties- $15 million. Independent groups cannot contribute to candidates.
• Legislative incumbents, many of whom won by big margins and didn’t need to empty their warchests, transferred nearly $5 million to their next elections.
• Independent groups spent considerably less on administrative overhead than candidates- $323,728 versus $2.2 million for candidates. As a percent of total spending, their total represented 3 percent versus 5 percent.
• Candidates reported spending far more money on consultants than independent groups.
Table 32 Major Spending Categories-
Legislative Candidates and Independent Groups
CATEGORY CANDIDATES % OF TOTAL
GROUP SPENDING
INDEPENDENTS % OF TOTAL GROUP SPENDING
Mass Media $14,988,871 35% $6,619,099 67% Contributions- Political $14,690,991 34% $5,552,500 36% Transfer to Next Campaign $ 4,933,748 12% Administration $ 2,170,294 5% $ 323,728 3% Consulting $ 1,788,044 4% $ 179,189 2% Fundraising $ 1,575,244 4% Research and Polling $ 1,093,096 3% $1,149,971 12% GOTV $ 983,288 2% $1,246,164 13% Contributions- Charitable $ 509,670 1% Misc./Multiple Purposes $ 255,355 1% $ 310,436 3% Refunds $ (251,556) -1% TOTAL $42,737,044 100% $15,381,087* 100%
*Not all spending could be categorized
Looking solely at mass media spending, candidates spent nearly $15 million while independent
special interest groups topped $6.6 million.
MASS MEDIA SPENDING
NJ Election Law Enforcement Commission Page 27 White Paper No. 26
Table 33 Mass Media Spending by
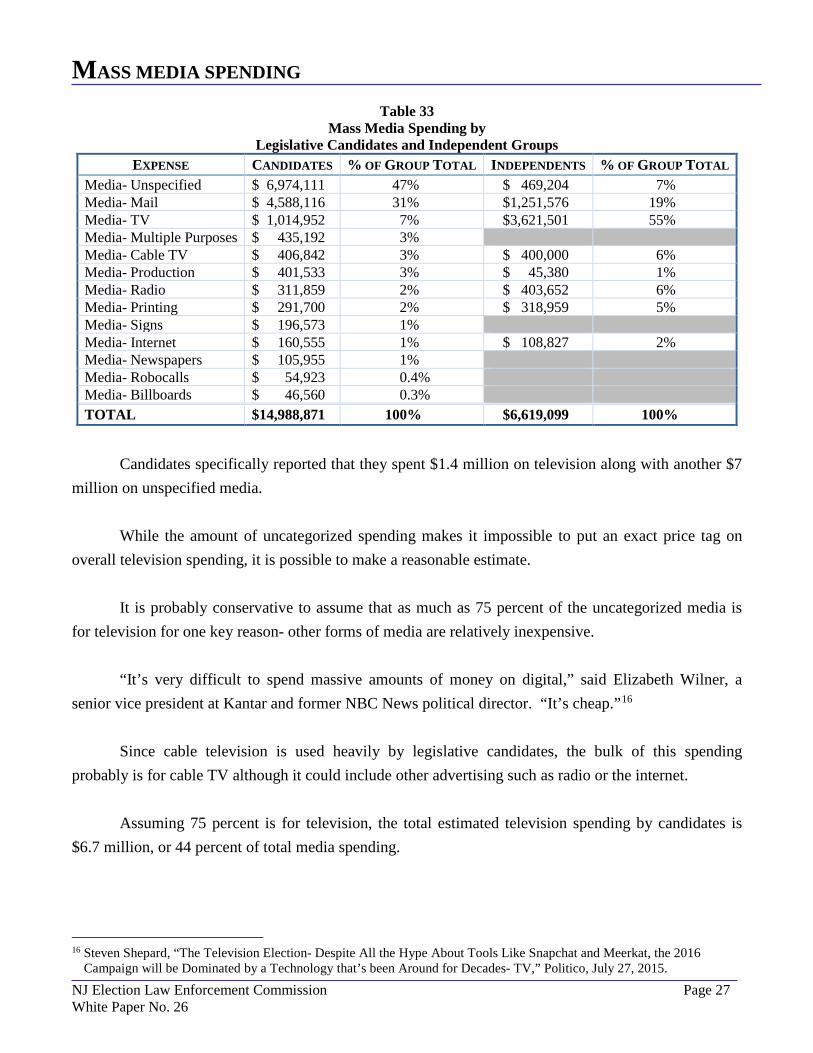
Legislative Candidates and Independent Groups EXPENSE CANDIDATES % OF GROUP TOTAL INDEPENDENTS % OF GROUP TOTAL
Media- Unspecified $ 6,974,111 47% $ 469,204 7% Media- Mail $ 4,588,116 31% $1,251,576 19% Media- TV $ 1,014,952 7% $3,621,501 55% Media- Multiple Purposes $ 435,192 3% Media- Cable TV $ 406,842 3% $ 400,000 6% Media- Production $ 401,533 3% $ 45,380 1% Media- Radio $ 311,859 2% $ 403,652 6% Media- Printing $ 291,700 2% $ 318,959 5% Media- Signs $ 196,573 1% Media- Internet $ 160,555 1% $ 108,827 2% Media- Newspapers $ 105,955 1% Media- Robocalls $ 54,923 0.4% Media- Billboards $ 46,560 0.3% TOTAL $14,988,871 100% $6,619,099 100%
Candidates specifically reported that they spent $1.4 million on television along with another $7
million on unspecified media. While the amount of uncategorized spending makes it impossible to put an exact price tag on
overall television spending, it is possible to make a reasonable estimate. It is probably conservative to assume that as much as 75 percent of the uncategorized media is
for television for one key reason- other forms of media are relatively inexpensive. “It’s very difficult to spend massive amounts of money on digital,” said Elizabeth Wilner, a
senior vice president at Kantar and former NBC News political director. “It’s cheap.”16 Since cable television is used heavily by legislative candidates, the bulk of this spending
probably is for cable TV although it could include other advertising such as radio or the internet. Assuming 75 percent is for television, the total estimated television spending by candidates is
$6.7 million, or 44 percent of total media spending.
16 Steven Shepard, “The Television Election- Despite All the Hype About Tools Like Snapchat and Meerkat, the 2016
Campaign will be Dominated by a Technology that’s been Around for Decades- TV,” Politico, July 27, 2015.

MASS MEDIA SPENDING
NJ Election Law Enforcement Commission Page 28 White Paper No. 26
Independent special interest groups spent an estimated $4.4 million on television- about 63 percent of their total media budgets.
Table 34 Estimated Television Spending by
Legislative Candidates and Independent Groups CATEGORY CANDIDATES INDEPENDENT GROUPS COMBINED
75 % of Uncategorized Media $5,230,584 $ 351,903 $ 5,582,487 Media- TV $1,014,952 $3,621,501 $ 4,636,453 Media- Cable TV $ 406,842 $ 400,000 $ 806,842 Total $6,652,378 $4,373,404 $11,025,782 % OF TOTAL MEDIA SPENDING 44% 63% 51%
The following chart combines all media expenses for candidates and independent groups.
Table 35 Mass Media Spending- Candidates
and Independent Groups Combined EXPENSE TOTAL PERCENT
Media- Unspecified $ 7,443,315 34% Media- Mail $ 5,839,692 27% Media- TV $ 4,636,453 21% Media- Cable TV $ 806,842 4% Media- Radio $ 715,511 3% Media- Printing $ 610,659 3% Media- Production $ 446,913 2% Media- Multiple Purposes $ 435,192 2% Media- Internet $ 269,382 1% Media- Signs/Billboards $ 243,133 1% Media- Newspapers $ 105,955 0.5% Media- Robocalls $ 54,923 0.3% TOTAL $21,607,970 100%
There is little doubt that technological advances are having a big impact on campaigns.
Facebook is a growing part of the candidate arsenal. It provides not only another avenue of
exposure for candidates, but offers feedback that helps in fundraising and further media targeting.17
Candidates also are rushing to harness the power of texting via smartphones to reach their supporters, particularly younger ones.18
17 Ashley Parker, “Facebook Expands in Politics With New Digital Tools, and Campaigns Find Much to Like,” New York
Times, July 30, 2015.

MASS MEDIA SPENDING
NJ Election Law Enforcement Commission Page 29 White Paper No. 26
“If you dread the deluge of political ads flooding the airwaves during election season, you’re not going to like what’s in store for you in 2016. Every device you own, from your smartphone to your Kindle to your iWatch, will be a delivery vehicle for attack ads and other campaign spots.”19
There is even talk of eventually using aerial drones to record the activities of opposing
candidates and perhaps gather information for attack ads.20 Presidential candidates may even start using holograms to campaign in several states at once.21
Despite the growing influence of high-tech tools on modern politics and some predictions that it
would eventually supplant traditional forms of media, television advertising, particularly cable television, remains the mainstay.
In a recent Politico story, Brent McColdrick, director of advertising for Mitt Romney’s 2012
presidential campaign, said, “The bulk of advertising is still going to be on TV. It is a proven medium. It is a medium that most campaigns and most consultants are used to.”22
The same article cited projections that federal candidates and independent groups would spend
about $4.4 billion on television ads during the 2016 election, about four times what they are likely to spend on online advertising.23
A recent analysis found that adults on average spend 36 hours weekly watching television
compared to 16 hours focused on desktops, smartphones and tablets.24 According to political consultants, targeted cable television advertising in the 2013 legislative
elections was one of the main reasons Democrats maintained their majorities in both houses. Democratic media strategist J.J. Balaban said party officials knew going into the race that they would face a difficult challenge keeping all their seats.25
18 Nick Corasaniti, “Texting Comes of Age as a Political Messenger,” New York Times, August 19, 2015. 19 Russ Choma, “You’re Going to See an Explosion of Online Political Ads in 2016,” Mother Jones, June 25, 2015. 20 Donald Scarinci, “Using Drones for Opposition Research,” www.politickernj.com, August 5, 2015. 21 David Howard, “Holograms are People Too!” Popular Mechanics, July/August 2015. 22 Steven Shepard, “The Television Election- Despite All the Hype About Tools Like Snapchat and Meerkat, the 2016
Campaign will be Dominated by a Technology that’s been Around for Decades- TV,’’ Politico, July 27, 2015. 23 Id. 24 Page 6, “The Total Audience Report- Quarter 1-2015,” Nielsen Company. 25 J.J. Balaban, “The Coming Revolution in Cable Television- How We Used Cable Addressability Technology to Block
Chris Christie’s Coattails in New Jersey, and Why It Will Change the Way You Advertise on TV,” Campaigns and Elections, January/February 2014.

MASS MEDIA SPENDING
NJ Election Law Enforcement Commission Page 30 White Paper No. 26
Governor Chris Christie was expected to win by a huge margin and he did. So an effort was needed to prevent him from pulling in Republican challengers.
Balaban said Democrats used new Cablevision technology that enabled them to display different
ads in different households. That let them target solid Democrats with messages deliberately intended to try to get them to show up at the polls. Others saw ads attacking the Republican candidates.
The result: Senator Bob Gordon and his two running mates won by narrow margins. “We had always expected the results in LD 38 to be close, but it turned out that every ounce of
effort mattered,” said Balaban.26 He predicted a big future for the new micro-targeting cable television technology, which still is
in its fledgling stages. “…as it spreads, it’s certain to have a major impact on how campaigns communicate with voters.”27
The last two white papers on legislative campaigns made the point that too much media spending
goes uncategorized. The presumption, which some political consultants privately confirm, is that most of this spending is television and radio advertising.
Absent more detailed reporting, nobody knows for sure. That defeats one of the main purposes
of filing campaign finance reports- to fully apprise voters of where candidates get their money and how they spend it.
While the percentage of uncategorized media spent fell in 2013 from 47 percent to 34 percent
compared to 2011, the overall dollar amount was higher. Ironically, the reason disclosure was better in 2013 was primarily because the Washington DC
based PAC that spent heavily in the 2013 election- Fund for Jobs Growth and Security- voluntarily disclosed its fundraising and spending. It was not only the biggest independent spender but it was more specific than New Jersey candidates about the media it bought. Only 7 percent of independent media spending was unspecified versus 47 percent for candidates (Table 33).
26 Id. 27 Id.

MASS MEDIA SPENDING
NJ Election Law Enforcement Commission Page 31 White Paper No. 26
Part of the explanation may be that Washington-based groups are more accustomed to the more precise reporting requirements of the Federal Election Commission.
Table 36 Amount of Uncategorized
Media Spending as a Percent of Total Media Spending
2003 2005 2007 2009 2011 2013 Uncategorized Media $11,181,893 $5,309,891 $12,920,770 $1,932,212 $6,814,855 $7,443,315
PERCENT 49% 46% 58% 32% 47% 34%
Combined with media expenditures that have been reported, the numbers show that as much as
$11 million was spent on television in the 2013 election- half of all media expenditures. That would be the largest collective TV buy- both in dollars and as a percentage- since 2007.
Table 37 Estimated Television Spending as a Percent of Total Media Spending
2003 2005 2007 2009 2011 2013 75 Percent of Uncategorized Media Spending
$ 8,386,420 $ 3,982,418 $ 9,690,578 $1,449,159 $ 5,111,141 $ 5,582,487
Identified as TV $ 3,746,983 $ 1,597,313 $ 2,356,953 $ 619,558 $ 1,577,335 $ 4,636,453 Identified as Cable TV $ 3,708,009 $ 43,113 NA $ 66,637 NA $ 806,842 Estimated TV $15,841,412 $ 5,622,844 $12,047,531 $2,135,354 $ 6,688,476 $11,025,782 TV as Percent of Total Media Spending 70% 48% 54% 35% 46% 51%
Expenditures on radio advertisements continue to be a relatively small but continuing part of
legislative campaigns. Because millions of dollars in media expenditures are not broken out by category, actual spending for radio most likely is higher.
Table 38 Radio Advertisements as a Percent of
Total Communications Spending 2003 2005 2007 2009 2011 2013
Radio $671,060 $277,106 $658,997 $179,586 $224,409 $715,511 PERCENT 3% 2% 3% 3% 2% 3%
Next to television and radio, the other major media expense, particularly for state legislators, is
direct mail. Sending brochures and other literature directly to the homes of potential voters is a traditional and potent tool for luring voters to the polls.

MASS MEDIA SPENDING
NJ Election Law Enforcement Commission Page 32 White Paper No. 26
Except for 2009, when only the Assembly was running, direct mail as a percentage of total media
spending has held steady at roughly a quarter of media budgets.
The $5.8 million outlay in 2013 was the largest since 2007.
Table 39
Direct Mail as a Percent of Total Media Spending
2003 2005 2007 2009 2011 2013 Direct Mail $5,962,443 $3,507,614 $5,893,596 $2,905,523 $3,986,659 $5,839,692 PERCENT 26% 30% 26% 48% 28% 27%
Two other traditional forms of advertising- newspapers and outdoor advertising such as
billboards- continued to play a marginal role in today’s legislative campaigns.
Table 40 Newspaper and Outdoor Advertising as a Percent of Total Media Spending
2003 2005 2007 2009 2011 2013 Newspapers $648,988 $309,548 $143,298 $101,581 $132,487 $105,955 Percent 3% 3% 1% 2% 1% 0.5% Outdoor Advertising $491,143 $639,779 $235,307 $187,174 $324,226 $243,133
PERCENT 2% 5% 1% 3% 2% 1%
Online advertising is a tricky category. There is little doubt it is a fast-growing area of political spending. But the true numbers in New Jersey are likely buried within the pile of uncategorized media.
Even though precise numbers are not available, the incomplete numbers that legislative
candidates have reported were more than three times higher in 2013 than in 2007.
MASS MEDIA SPENDING
NJ Election Law Enforcement Commission Page 33 White Paper No. 26
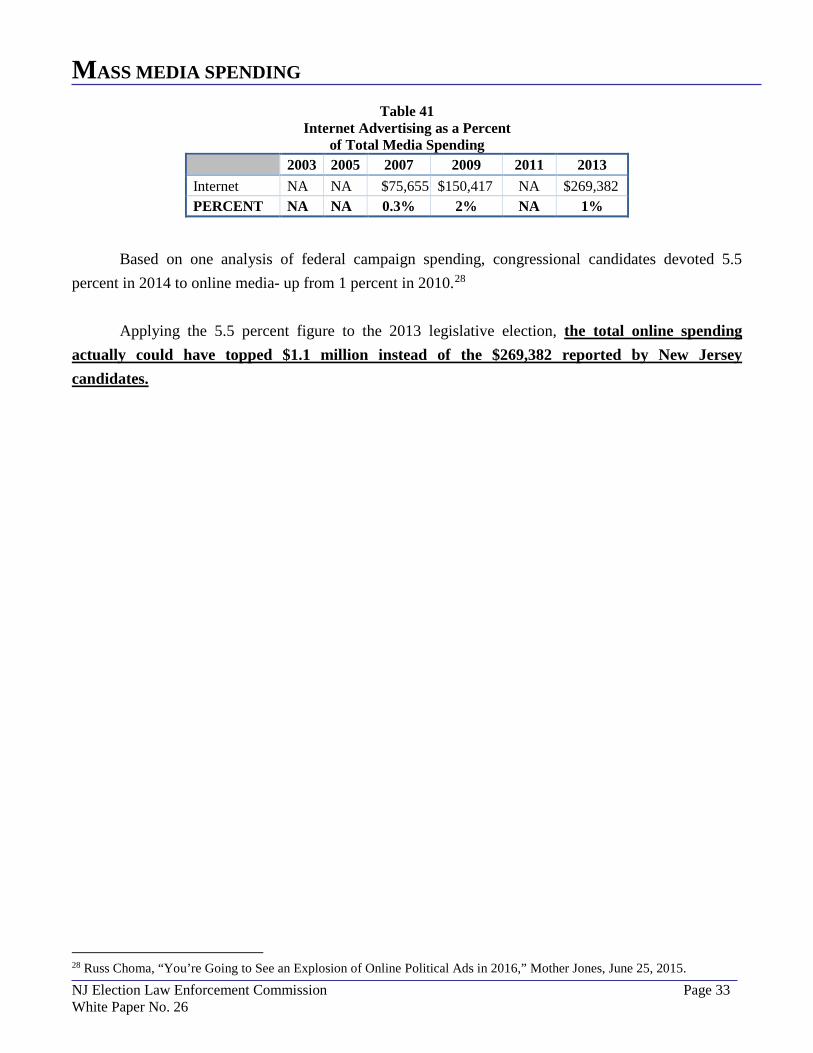
Table 41 Internet Advertising as a Percent
of Total Media Spending 2003 2005 2007 2009 2011 2013 Internet NA NA $75,655 $150,417 NA $269,382 PERCENT NA NA 0.3% 2% NA 1%
Based on one analysis of federal campaign spending, congressional candidates devoted 5.5 percent in 2014 to online media- up from 1 percent in 2010.28
Applying the 5.5 percent figure to the 2013 legislative election, the total online spending actually could have topped $1.1 million instead of the $269,382 reported by New Jersey candidates.
28 Russ Choma, “You’re Going to See an Explosion of Online Political Ads in 2016,” Mother Jones, June 25, 2015.

NON-MEDIA SPENDING
NJ Election Law Enforcement Commission Page 34 White Paper No. 26
The large majority of state legislators represent districts where they feel relatively safe because redistricting has given their party an edge among voters.
As a result, many incumbent legislators don’t hesitate to share their campaign funds with other
legislators, particularly those in the most vulnerable districts. Another sign that most lawmakers feel secure in their own districts is the fact that they transfer a
large portion of their funds over to the next campaign. In 2013, $25.2 million, or 43 percent of all campaign funds, either were contributed to other
candidates or earmarked for future campaigns. That was the highest ever in dollars and ranks second to 2011 on a percentage basis.
Table 42
Contributions to other Candidates and Committees and Transfers to Future Campaign by Legislative Candidates
2003 2005 2007 2009 2011 2013 Political Contributions $7,392,713 $5,001,171 $9,485,909 $4,958,467 $13,906,135 $20,243,491
Transfers to Next Campaign $1,175,233 NA $2,105,018 $2,272,267 $ 6,431,152 $ 4,933,748
TOTAL $8,567,946 $5,001,171 $11,590,927 $7,230,734 $20,337,287 $25,177,239 PERCENT 20% 24% 28% 42% 46% 43%
It takes money to raise money. So legislative candidates in 2013 had to dole out $1.6 million to
build up their campaign kitties in 2013- 3 percent of their total spending.
Table 43 Fundraising Expenses
2003 2005 2007 2009 2011 2013 Fundraising $767,468 $541,807 $1,119,352 $1,106,917 $1,738,756 $1,575,244 PERCENT 2% 3% 3% 6% 4% 3%
Candidates and independent committees spent just under $2 million hiring consultants in 2013,
which was less than 2011.
Table 44 Consulting Expenses
2003 2005 2007 2009 2011 2013 Consulting $3,309,063 $1,732,673 $1,388,125 $871,210 $2,370,730 $1,967,233 PERCENT 8% 8% 3% 5% 5% 4%

NON-MEDIA SPENDING
NJ Election Law Enforcement Commission Page 35 White Paper No. 26
The 2013 election was marked by two dramatic increases in non-media expenses- polling and expenses related to Election Day.
Democrats were intent on trying to avoid losing seats in an election year when a popular
incumbent governor was expected to win by a huge margin. Candidates and independent groups each spent about the same on polling- about $1.1 million each.
The total amount spent for this purpose was more than double the 2011 total, and much higher
than other legislative elections dating back to 2003. One explanation is that polling has become more unreliable due to recent trends and therefore
more expensive. “Election polling is in a near crisis, and we pollsters know. Two trends are driving the
increasing unreliability of election and other polling in the United States: the growth of cellphones and the decline in people willing to answer surveys. Coupled, they have made high-quality research much more expensive to do...”29
Table 45
Polling and Research Expenses 2003 2005 2007 2009 2011 2013 Polling $882,162 $541,359 $854,971 $295,951 $1,041,827 $2,243,067 PERCENT 2% 3% 2% 2% 2% 4% The 2013 legislative campaigns saw a drastic increase in election day-related expenses compared
to other recent campaigns. Candidates and independent committees spent $2.2 million on get-out-the-vote, pollworkers and
other activities- about the same amount candidates spent in the previous five legislative campaigns combined.
Generally, candidates have been spending about 1 percent on expenditures related to Election
Day. In 2013, that percentage rose to 4 percent.
29 Cliff Zukin, “What’s the Matter with Polling?- It’s Gotten Much Harder to Predict Who Will Win an Election, and 2016
Will Be Harder Still,” New York Times, June 21, 2015.

NON-MEDIA SPENDING
NJ Election Law Enforcement Commission Page 36 White Paper No. 26
The heavy election day spending may have been driven by concerns among Democrats that light turnout could result in losses in key districts.
It could explain why independent committees, which mostly supported Democratic candidates, actually spent more than legislative candidates themselves on these efforts- $1.2 million versus $1 million.
Table 46
Election Day Expenses 2003 2005 2007 2009 2011 2013 Election Day $622,507 $201,101 $658,715 $245,885 $564,394 $2,229,452
PERCENT 1% 1% 2% 1% 1% 4%
Charitable donations by legislative candidates remained at 1 percent even though the total dollars
were the highest since 2003.
Table 47 Charitable Donations
2003 2005 2007 2009 2011 2013 Charitable Donations $433,778 $324,368 $267,030 $166,184 $427,461 $509,670 PERCENT 1% 2% 1% 1% 1% 1%
The cost of administering campaigns has hovered around 5 percent during the decade.
Table 48 Administrative Expenses
2003 2005 2007 2009 2011 2013 Administrative Expenses $2,910,023 $819,081 $2,633,627 $843,671 $2,410,481 $2,494,023 PERCENT 7% 4% 6% 5% 5% 5%
Refunds of excessive and unwanted contributions remained a fraction of overall campaign costs.
Table 49
Refunds by Legislative Candidates 2003 2005 2007 2009 2011 2013 Refunds $637,288 NA $859,046 $178,803 $164,356 $251,556 PERCENT 2% NA 2% 1% 0.4% 0.5%

RECOMMENDATIONS
NJ Election Law Enforcement Commission Page 37 White Paper No. 26
RECOMMENDATION ONE – FULL DISCLOSURE BY INDEPENDENT CAMPAIGN SPENDERS
It has been more than five years since Citizens United v. FEC in 2010 set the stage for
corporations and unions to spend unlimited sums on federal elections as long as they operate separately from parties and candidates.
Eight of the nine U.S. Supreme Court justices involved in that landmark ruling also gave one of
the strongest judicial endorsements ever to the concept of disclosure. The majority said it is fully constitutional to require independent groups actively involved in
political campaigns to give the public details about where they received their money and how they spent it. In essence, they said independent groups should follow the same disclosure rules as parties and candidates.
Only a few months after the Citizens United v. FEC ruling, the New Jersey Election Law
Enforcement Commission, in April 2010, adopted a unanimous, bi-partisan recommendation for the state Legislature to adopt just such a requirement.
While legislation is pending that would enable New Jersey to make fundraising and spending in
future elections more transparent to voters, it has yet to face even a legislative committee hearing. Currently, state law requires that groups unaffiliated with candidates or parties that spend more
than $1,400 on an election must report only their expenditures if they explicitly urge voters to elect or defeat a candidate. Such direct appeals are called “express advocacy.”
Virtually all those who track developments in campaign finance law would agree that there is no
constitutional issue in requiring these groups to also list their contributors. That question was clearly settled in the landmark Buckley v. Valeo case of 1976, which said any groups that engage in express advocacy, including independent committees, can be required to disclose their donors.
But in nearly 40 years, New Jersey’s law has never been updated to reflect this precedent.
RECOMMENDATIONS
NJ Election Law Enforcement Commission Page 38 White Paper No. 26
Where the biggest legal disagreement occurs is over whether government can require disclosure by independent groups that avoid using the so-called “magic words” of Buckley v. Valeo such as “vote for” and “vote against” but still work to defeat or elect a candidate.
So-called “issue ads,” also called electioneering ads by the federal government and states that
regulate them, tend to be more subtle than regular campaign ads. They promote or disparage a candidate by tying them to certain issues rather than involving the magic words.
They are more difficult to regulate because the First Amendment clearly protects “legitimate”
issue ads- those that are intended only to influence legislation or executive policy and are not connected to an election.
A growing number of election-related issue ads are being bankrolled by groups that are not
required to publicly disclose their contributors, such as “social welfare” non-profit groups organized under IRS law section 501(c) 4.
That has led to more political advertisements in federal, state and even local elections where
voters have little or no clue who is behind them. This runs counter to the strong pro-disclosure sentiment expressed in Buckley v. Valeo and
subsequent Supreme Court cases. “A public armed with information about a candidate’s most generous supporters is better able to
detect any post-election special favors that may be given in return.”30 The court further said disclosure was necessary to “deter actual corruption and avoid the
appearance of corruption by exposing large contributions and expenditures to the light of publicity”31
and because it is an “essential means of gathering data necessary to detect violations” of campaign finance laws.32
The difficulty for legislators and regulators is trying to decide when issue-oriented ads cross the line to become campaign expenditures.
30 Buckley v. Valeo, 424 U.S. (1976) at 67. 31 Id. 32 Id. at 67 and 68.

RECOMMENDATIONS
NJ Election Law Enforcement Commission Page 39 White Paper No. 26
Jeff Brindle, ELEC’s Executive Director, has suggested that the state require disclosure by groups that engage in electioneering after January 1 of an election year. Disclosure requirements would apply to any communication that is:
The functional equivalent of express advocacy because it can be interpreted by a reasonable person only as advocating the election or defeat of a candidate, taking into account whether the communication involved mentions a candidacy, a political party or a challenger to a candidate, or takes a position on a candidate’s character, qualifications or fitness for office.
This language was based on Supreme Court guidance in Wisconsin Right to Life v. FEC (2007).
In that ruling, the court decided the group had the right to air issue ads without reporting its activities to the Federal Election Commission under federal electioneering disclosure rules.
The majority drew an important new distinction between “sham issue ads,” which were subject
to detailed disclosure requirements, and legitimate issue-only ads, which were not. “A court should find that an ad is the functional equivalent of express advocacy only if the ad is
susceptible of no reasonable interpretation other than as an appeal to vote for or against a specific candidate.”33
Real issue ads, the justices said, focus on a legislative issue, take a position, urge the public to
support that position and urge them to contact public officials. They do not mention elections, candidates, political parties or challengers. Legitimate issue ads, they continued, also take no position on a candidate’s character, qualifications or fitness for office.34
In light of Citizens United v. FEC, this interpretation now may be conservative since the
Supreme Court declared: “We reject Citizens United’s contention that the disclosure requirements must be limited to speech that is the functional equivalent of express advocacy.”35
The more recent McCutcheon v. FEC ruling in April 2014 reaffirmed the court’s strong
endorsement of disclosure. The majority said “disclosure of contributions minimizes the potential for abuse of the campaign finance system.”36
33 Wisconsin Right to Life v. FEC, 551 U.S. (2007) at 469-470. 34 Id. 35 Citizens United v. FEC, 558 U.S. (2010) at 369. 36 McCutcheon v. FEC, 134 S. Ct. 1434, 1459 (2014).

RECOMMENDATIONS
NJ Election Law Enforcement Commission Page 40 White Paper No. 26
Former FEC Chairman Trevor Potter, a Republican, says the Supreme Court’s commitment to the
principle of disclosure has been unwavering. “The Supreme Court has been unusually clear in saying that the sources of funding of political
advertising and other spending can constitutionally be required to be disclosed. This applies not only to the Super PACs but to c4s, c6s and other groups running campaign ads.”37
Another key point about disclosure: it is not a ban on independent spending. Groups can spend as much as they want on independent election-related activities as long as they keep voters informed.
In the post-Citizens United era, several states have moved to expand their disclosure laws,
usually to require disclosure for groups that run electioneering ads. Those facing legal challenges have consistently been upheld in court.
• The U.S. Court of Appeals for the Third Circuit on July 16, 2015, upheld a new
electioneering ad disclosure law enacted in 2012 by the state of Delaware.38 • The Colorado Supreme Court on December 9, 2014 upheld the state’s electioneering law
after the Secretary of State tried to scale back disclosure requirements. Judge R. Brooke Jackson noted: “…every court to have analyzed this issue since Citizens United has come to the same conclusion, that the distinction between issue speech and express advocacy has no place in the context of disclosure requirements.”39
• On April 21, 2015, the Arizona Supreme Court ruled that the state acted properly by
demanding that a group reveal its donors even though its television ads didn’t explicitly call for the defeat of candidate Tom Horne in the 2010 Attorney General race.40
37 Trevor Potter, “Super PACs: How We Got Here, Where We Need to Go,” December 2, 2011. 38 Delaware Strong Families v. Attorney General of Delaware et al, 3rd U.S. Circuit Court of Appeals, No. 14-1887. 39 Independence Institute v. Gessler, F. Supp.3d, 2014 WL5431367,*6(D. Colo. October 22, 2014). 40 Committee for Justice and Fairness v. Arizona Secretary of State’s Office et al, 235 Ariz. 347.

RECOMMENDATIONS
NJ Election Law Enforcement Commission Page 41 White Paper No. 26
• After Maine’s Supreme Court upheld disclosure requirements, the National Organization for Marriage on August 24, 2015 released the names of seven donors who gave $2 million to a campaign that overturned Maine’s same-sex marriage law.41
• In Florida three years earlier, a National Organization of Marriage challenge to Florida’s
electioneering disclosure requirements was rebuffed by the U.S. Circuit Court of Appeals for the 11th District on May 17, 2012.42
• The U.S. Court of Appeals for the Fifth Circuit on November 14, 2014 reversed a trial court
ruling that had struck down several Mississippi disclosure rules.43 These and other recent rulings show that most courts across the nation have upheld strong
disclosure laws, including those related to electioneering. Yet, a 2014 survey of state laws found that 19 states still had no laws requiring disclosure of
electioneering contributions and expenditures. One was New Jersey.44 Adoption of ELEC’s disclosure recommendation for independent groups finally would fix this
loophole.
RECOMMENDATION TWO – ELEC SHOULD CONSIDER ADOPTING A REGULATION THAT ASSUMES REFERENCES TO “MEDIA” EXPENSES REFER TO TELEVISION
White papers 22 and 23 both gave rationales for why candidates should be more specific in identifying their media expenses. Since the vagueness has persisted, particularly among legislative candidates, ELEC should consider adopting a regulation similar to one used by the Federal Election Commission. FEC assumes “media” refers to either television or radio spending. ELEC should limit the definition of media to just television spending since it is the major expense of most campaigns. 41 Steve Mistler, “Ending Long Legal Fight, Group Names Donors Who Helped Overturn Maine’s Same-sex Marriage Law
in 2009,” Portland Press Herald, August 24, 2015. 42 National Organization for Marriage Inc. v. Cruz-Bustillo, 477 Fed. Appx. 584. 43 Justice v. Hosemann, 771 F.3d 285. 44 Peter Quist, “Scorecard: Essential Disclosure Requirements for Independent Spending, 2014,” National Institute on Money
in State Politics, December 3, 2014.

RECOMMENDATIONS
NJ Election Law Enforcement Commission Page 42 White Paper No. 26
RECOMMENDATION THREE – WHEN CANDIDATES SPEND CAMPAIGN FUNDS ON DINNERS OR OTHER MEETINGS, THEY SHOULD KEEP DETAILED RECORDS ABOUT WHO ATTENDED THE EVENT, WHAT WAS PURCHASED AND WHY THEY CONSIDERED THE EXPENSE “ORDINARY AND NECESSARY.”
Legislation requiring this change will provide more disclosure to the public and make it less likely that a candidate will misuse campaign funds for personal use. RECOMMENDATION FOUR – CHANGE THE FILING DATE FOR PERSONAL FINANCIAL DISCLOSURE STATEMENTS TO IMPROVE EFFICIENCY.
Personal financial disclosure forms of candidates discourage conflicts of interest by revealing information about the wealth and assets of those who seek elected office. Legislation that provides candidates with more time in which to carefully complete these forms, along with a less confusing due date, will enhance compliance and disclosure with the law.

PREVIOUS WHITE PAPERS
NJ Election Law Enforcement Commission Page 43 White Paper No. 26
Number One: Contribution Limits and Prohibited Contributions (1988)
Number Two: Trends in Legislative Campaign Financing: 1977-1987 (1989)
Number Three: Legislative Public Financing (1989)
Number Four: Ideas for an Alternate Funding Source (1989)
Number Five: Lobbying Reform (1990)
Number Six: Autonomy and Jurisdiction (1991)
Number Seven: Is There a PAC Plague in New Jersey? (1991)
Number Eight: Technology in The Future: Strengthening Disclosure (1992)
Number Nine: Legislative Candidates: How They Spend their Money (1994)
Number Ten: Nonconnected, Ideological PACs in the Garden State (1995)
Number Eleven: State Parties And Legislative Leadership Committees: An Analysis
1994-1995 (1996)
Number Twelve: Repartyization: The Rebirth of County Organizations (1997)
Number Thirteen: Trends in Legislative Campaign Financing: 1987-1997 2ndVolume (1999)
Number Fourteen: Local Campaign Financing (2000)
Number Fifteen: School Board Campaign Financing (2002)
Number Sixteen: A Resurgent Party System: Repartyization Takes Hold (2003)
Number Seventeen: Legislative Election 2003: The Rise of Party-Oriented Campaigning (2004)
Number Eighteen: Local Campaign Financing: An Analysis of Trends in Communities Large and
Small (2005)
Number Nineteen: The 2005 Assembly Election: New Trends on the Horizon? (2006
Number Twenty: Legislative General Elections 2007: An Analysis of Trends in State Senate and
Assembly Elections (2009)
Number Twenty-One: School Elections Campaign Financing: An Update (2010)
Number Twenty-Two: Trends in Legislative Campaign Financing: Fundraising in the Era of Pay-to-Play
Reform, Self-Funders and Recession • 1999-2009 3rd Volume (2011)
Number Twenty-Three: Legislative General Elections 2011- Rise of the Independents (2013)
Number Twenty-Four: Independents’ Day: Seeking Disclosure in a New Era of Unlimited Special Interest
Spending (2014)
Number Twenty-Five: Top Local Elections in NJ- A Tale of Two Cities and More (2015)


![ELECTION LAW AND WHITE IDENTITY POLITICSfordhamlawreview.org/wp-content/uploads/2019/02/04_Sellers-1515-1576.pdf2019] ELECTION LAW AND WHITE IDENTITY POLITICS 1517 tendencies of white](https://img.dokumen.tips/doc/110x75/5e807a5a6db0b55b46780835/election-law-and-white-identity-poli-2019-election-law-and-white-identity-politics.jpg)