Embed Size (px)
Citation preview

SCALES CORPORATION LIMITEDGROWING YOUR DIVERSIFIED AGRIBUSINESS
Annual Results PresentationFor the twelve months ended 31 December 2017
28 February 2018

February 2018Scales – 2017 Full Year Results
AGENDA
1. 2017 Highlights
2. Financial Performance
3. Divisional Performance & Outlook
4. Capital Management
5. Outlook
6. Strategy
7. Appendices
2

2017 HIGHLIGHTS

SCALES BY THE NUMBERS
4
Underlying EBITDA
$62.0m9% decrease
Dividends declared
19.0 centsper share
(2016: 14.5 cents per share)
Underlying Net Profit
$32.7m15% decrease
Revenue
$399.1m7% increase
ROCE
16%(2016: 21%)
EPS
22.6 cents per share
(2016: 27.4 cents per share)

February 2018Scales – 2017 Full Year Results
STRATEGIC AND OPERATING HIGHLIGHTS
5
Mr Apple export volumes of 3.5m TCEs consistent with 2016 record volumes, like-for-like production only 5% less than 2016.1
OceanAir acquired in August 2017, adding new locations and expertise in the freight forwarding and logistics business.
2
Continued development in our markets, brands and new varieties: working alongside customers to identify and satisfy their needs, particularly in the Asia markets.
3
TEUs shipped and airfreight tonnes handled by Storage & Logistics up 19% and 88% respectively compared to 2016: being 29,481 TEUs and 6.2M tonnes.
4
Petfood Ingredients sales volumes up 20% on 2016, being 27,663M tonnes.
5
Further development in Sustainability and Health & Safety, including the appointment of a dedicated Group role.6
FINANCIALS

February 2018Scales – 2017 Full Year Results
GROUP FINANCIAL PERFORMANCE• Revenue $399.1m, up 7% on 2016:
Solid revenue growth from Storage & Logistics and Food Ingredients divisions.
Horticulture revenue in line with 2016 following successful integration of Longview.
• Underlying* EBITDA $62.0m, at the top end of previously provided guidance:
Increased on-orchard costs (e.g. spraying, storage) as a result of inclement weather impacted Horticulture gross margins.
• Underlying NPAT $32.7m.
• Reported NPAT of $31.8m after deducting non-cash IFRS adjustments.
7
* Underlying Results exclude all International Financial reporting Standards (IFRS) non-cash adjustments (most notably fair value or revaluation gains and mark-to-market gains or losses on FX contracts not exercised during the period). Management and the Board believe that Underlying results more accurately demonstrate the change in operational performance of the Group.
** Underlying gross margin excludes fair value gains relating to Mr Apple’s unharvested crop.*** Capital Employed and Return on Capital Employed in 2016 excludes capital employed and net losses from the Longview acquisition which, due to the timing of the acquisition, did not contribute to 2016
profits. Longview has been included in the 2017 calculation.
Income Statement
2017
$ Millions Actual Growth % Actual Growth %
Revenue 399.1 7% 373.9 24%Cost of Sales (287.1) (262.5)Underlying Gross Margin ** 112.0 1% 111.5 4%
Underlying Gross Margin % 28% 30%
Underlying EBITDA 62.0 -9% 67.9 11%
Underlying EBIT 47.8 -14% 55.8 11%
Underlying Net Profit 32.7 -15% 38.6 11%After tax impact of:
Non-cash IFRS adjustments (1.0) (0.5)
Net Profit 31.8 -17% 38.2 6%
Capital employed*** 307.5 271.1Return on capital employed *** 16% 21%
2016

February 2018Scales – 2017 Full Year Results
HISTORIC AND DIVISIONAL TRENDS• Underlying EBITDA and NPAT have increased at CAGRs of 10% and 13% respectively.
• Underlying divisional EBITDAs have also increased at CAGRs of between 8% and 14%.
8
Underlying EBITDA Underlying NPAT
$42.8m $39.8m
$61.4m $67.9m
$62.0m
2013 2014 2015 2016 2017
CAGR 10%
$20.0m $19.8m
$34.8m $38.6m
$32.7m
2013 2014 2015 2016 2017
CAGR 13%
Horticulture Storage & Logistics Food Ingredients
$25.5m $23.9m
$40.0m $45.3m
$38.9m
2013 2014 2015 2016 2017
CAGR 11%
$13.9m $12.3m
$16.3m $16.2m
$19.1m
2013 2014 2015 2016 2017
CAGR 8%
$4.7m $5.7m
$7.6m
$9.2m
$8.0m
2013 2014 2015 2016 2017
CAGR 14%
EBITDA by Division

February 2018Scales – 2017 Full Year Results
BALANCE SHEET
• Scales’ balance sheet continues to reflect its investment in land, buildings, equipment and trees:
731 ha. orchards owned by the Group (further 417 ha. leased).
322,000 m3 of owned coldstorage space (further 453,000 m3 leased).
• During 2017, Capital Employed increased slightly by $14m. The movements are principally due to:
An increase in trade debtors and inventory reflecting the increased revenues in Storage & Logistics and Meateor.
The acquisition of OceanAir and increase in associated goodwill.
9
Maintaining a strong balance sheet
Balance Sheet2017 2016
$ Millions Actual Actual
Current Assets (excluding Cash)
Trade Debtors 23.4 17.6Inventory 22.2 16.4Unharvested Agricultural Produce 20.2 18.4Other 9.8 12.1
75.7 64.5Current Liabilities (excluding Overdraft and Dividends Declared)
Trade Creditors & Other Payables (22.2) (22.0)Other (7.1) (8.4)
(29.3) (30.4)
Net Working Capital 46.4 34.1
Non-Current AssetsApple Trees 30.7 31.0Land & Buildings 142.6 140.7Other PP&E 55.5 55.0Investments & Intangibles 24.5 21.1Other 7.8 11.6
261.1 259.3
Capital Employed 307.5 293.4

February 2018Scales – 2017 Full Year Results
BALANCE SHEET (CONTINUED)
• At 31 December 2017, Net Debt was $40.8m. The increase in Net Debt on 2016 was due to movements in working capital.
• Average net debt for the year was $54.8m, or 0.9xEBITDA.
• Our strong financial position enables us to react quickly and confidently to potential strategic acquisitions and other opportunities.
• Significant headroom on covenants.
10
Maintaining a strong balance sheet
Balance Sheet (continued)2017 2016
$ Millions Actual Actual
Non-Current or Other LiabilitiesDeferred tax liabilities (28.2) (28.2)Other financial liabilities (4.0) (4.9)Dividends declared (12.6) (11.0)
(44.8) (44.1)Net Debt
Cash less Overdraft 5.7 6.4Borrowings (46.5) (41.0)Net Debt (40.8) (34.6)
Total Equity 221.9 214.6
Covenants
Interest CoverRatio 18.3x 24.1xCovenant 3.0x 3.0xHeadroom 511% 703%
Senior Debt CoverageRatio 0.7x 0.5xCovenant 2.5x 2.5xHeadroom 257% 432%

DIVISIONAL PERFORMANCE & OUTLOOK

February 2018Scales – 2017 Full Year Results
HORTICULTURE – FINANCIAL PERFORMANCE
• Revenue of $228m (1% below 2016 revenue).
• Gross profit down 8% on 2016, impacted by additional on-orchard expenses and additional labour.
• Underlying divisional EBITDA of $38.9m (14% below 2016 results), representing a resilient performance in a challenging growing season.
12
A strong performance despite a challenging growing season
• Packout of 80% (in line with 2016 packout of 81%). Mr Apple is constantly achieving incremental gains in orcharding that lead to superior export packout.
• Longview fully integrated with existing Mr Apple infrastructure, improving capacity and unlocking potential for future efficiencies.
• Continued robust performance from Fern Ridge (EBITDA of $2.3m).
Financial Performance - Horticulture2017 2016
$ Millions Actual Growth % Actual Growth %
Revenue 228.0 -1% 230.1 29%
Underlying Gross Profit 58.0 -8% 63.0 -3%Underlying Gross Profit Margin 25% 27%
Other income, admin and operating expenses (19.1) 8% (17.7) -31%
Mr Apple Underlying EBITDA 36.6 -16% 43.6 11%
Fern Ridge Underlying EBITDA 2.3 N/A 2.1 N/A
Longview Underlying EBITDA - N/A (0.4) N/A
Underlying Horticulture EBITDA 38.9 -14% 45.3 13%
Depreciation and amortisation (7.8) (6.2)
Underlying Horticulture EBIT 31.1 -21% 39.1 14%

February 2018Scales – 2017 Full Year Results
HORTICULTURE – OWN-GROWN VOLUMES
• Total own grown export volumes of 3.5m TCEs in line with 2016 (supported by approximately 200,000 TCEs from Longview orchards).
• Growth in premium volumes affected by the inclement weather conditions: Strong growth in volumes of the Asia-targeted NZ Queen variety (an increase of 18% to over 400,000 TCEs).
13
Premium and traditional volumes at a similar level to 2016
Mr Apple Grown Export Volumes (TCE 000s) Growth in Premium Volumes (TCE 000s)
Volumes may have changed slightly from previous announcements as final sales data on unsold fruit is received.
536 741 1,059 1,036
1,454 1,656 1,616
1,465 1,404
1,773 1,716
1,701 1,890 1,929
2,001 2,144
2,833 2,752
3,155
3,546 3,545
2011 2012 2013 2014 2015 2016 2017
Traditional Varieties
Premium Varieties
214 343 406
119 185 245 245 282
301 253
273
393
585 574
831
866 809
536
741
1,059 1,036
1,454
1,656 1,616
2011 2012 2013 2014 2015 2016 2017
Other
High Colour Fuji and Royal Gala
Pink Lady
NZ Queen
CAGR 20%

February 2018Scales – 2017 Full Year Results
HORTICULTURE – PRICES
• Compared to the record 2016 prices achieved, our 2017 apple prices were affected by an overall softening of prices in the market.
14
Recognition by customers and consumers of the superior quality of the Mr Apple brand
Apple Prices by Variety2017 2016
NZD / TCE, FOB Actual Growth % Actual Growth %
Premium Varieties 36.3 -3% 37.4 -1%Traditional Varieties 28.6 -2% 29.3 5%
Total Mr Apple Orchards 32.1 -3% 33.1 2%
Price uplift - Premium vs Traditional 27% 28%
February 2018Scales – 2017 Full Year Results
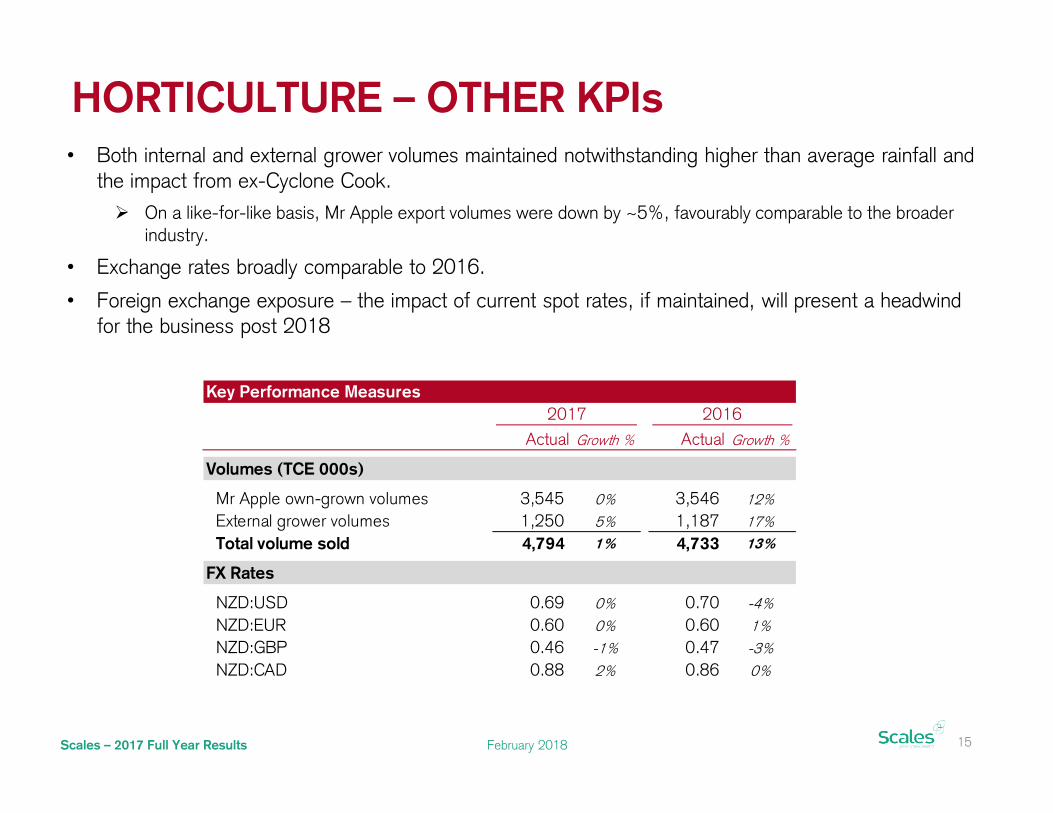
HORTICULTURE – OTHER KPIs• Both internal and external grower volumes maintained notwithstanding higher than average rainfall and
the impact from ex-Cyclone Cook. On a like-for-like basis, Mr Apple export volumes were down by ~5%, favourably comparable to the broader
industry.
• Exchange rates broadly comparable to 2016.
• Foreign exchange exposure – the impact of current spot rates, if maintained, will present a headwind for the business post 2018
15
Key Performance Measures2017 2016
Actual Growth % Actual Growth %
Volumes (TCE 000s)
Mr Apple own-grown volumes 3,545 0% 3,546 12%External grower volumes 1,250 5% 1,187 17%
Total volume sold 4,794 1% 4,733 13%
FX Rates
NZD:USD 0.69 0% 0.70 -4%NZD:EUR 0.60 0% 0.60 1%NZD:GBP 0.46 -1% 0.47 -3%NZD:CAD 0.88 2% 0.86 0%

February 2018Scales – 2017 Full Year Results
Europe29%
UK13%
North America
5%
Asia & Middle East
53%
Europe30%
UK10%
North America
7%
Asia & Middle East
53%
Europe31%
UK10%
North America
5%
Asia & Middle East
54%
HORTICULTURE – STRATEGY
• During 2017 Mr Apple picked over half a billion apples. The Horticulture division sold apples to more than 160 customers in over 40 countries.
• Asia & Middle East are the key focus for the Horticulture division, accounting for more than half of our sales, and are expected to become increasingly relevant for the division:
We scrutinise per hectare orchard returns and will continue to redevelop lower-performing orchards and varieties into higher value apples. As historical redevelopment matures, volumes of premium varieties will continue to increase.
We continue to invest in our marketing, packaging, products and brands that are targeted to these markets.
Affiliation with our key strategic shareholder, China Resources Ng Fung, provides improved access to the large China market.
• Ongoing focus on brand development and acquiring Plant Variety Rights to meet emerging needs:
Dazzle® successfully launched in December 2016 and gaining market recognition as a promising new variety.
16
Asia & the Middle East remain the key focus for Mr Apple
FY16A FY17AFY15A
Mr Apple – Sales by Region (TCEs)

February 2018Scales – 2017 Full Year Results
S&L – FINANCIAL PERFORMANCE
17
Strong uplift from Storage & Logistics with EBITDA up 18% on 2016• Revenues of $126.0m, 16% ahead of 2016 reflecting strong growth from the Coldstorage and Logistics
businesses.
• EBITDA of $19.1m, 18% ahead of 2016.
• Strong growth from the Coldstore division:
Industry conditions and storage times returning to normal trends – reaping the rewards from previous extensions to the network.
Coldstore merger completed effective 1 January 2018. The Whakatu Coldstores and Polarcold Stores businesses have been combined under the “Polarcold” brand.
As a part of this process, the Polarcold logowas modernised. New signage will be graduallybe rolled out across the network.
Financial Performance - Storage & Logistics2017 2016
$ Millions Actual Growth % Actual Growth %
Revenue 126.0 16% 108.4 13%
Cost of Sales (81.4) 16% (70.2) 14%
Gross Profit 44.6 17% 38.2 12%Gross Profit Margin 35% 35%
Other income, admin and operating expenses (25.5) 16% (22.0) 23%
EBITDAAll Coldstores 14.5 24% 11.7 -7%Liqueo 1.3 -42% 2.3 30%Scales Logistics 3.3 46% 2.3 17%
Total Storage & Logistics EBITDA 19.1 18% 16.2 0%
EBITDA Margin 15% 15%
Total Storage & Logistics EBIT 13.3 22% 10.9 -4%

February 2018Scales – 2017 Full Year Results
S&L – FINANCIAL PERFORMANCE (CONT’D)
18
Ongoing improvements from Scales Logistics
• Excellent performance from Scales Logistics, EBITDA up 46% on 2016 results, reflecting:
Strong increases in underlying activity: TEUs shipped and airfreight tonnes handled both significantly ahead of 2016 with growth of 19% and 88% respectively.
We continue to evolve our expertise in perishable logistics. The OceanAir acquisition furthered this objective.
• Bulk liquid storage business, Liqueo, impacted by the loss of a large customer, lower volumes and closure costs.
Liqueo has progressively moved its liquid handling activities at the Whakatu Industrial Park to a better suited facility closer to the Napier Port (this facility was acquired in 2015). The 2017 result was impacted by one-off costs in finally exiting this facility.
Near term future outlook is positive with large anticipated volume increases from one key client in particular.
February 2018Scales – 2017 Full Year Results
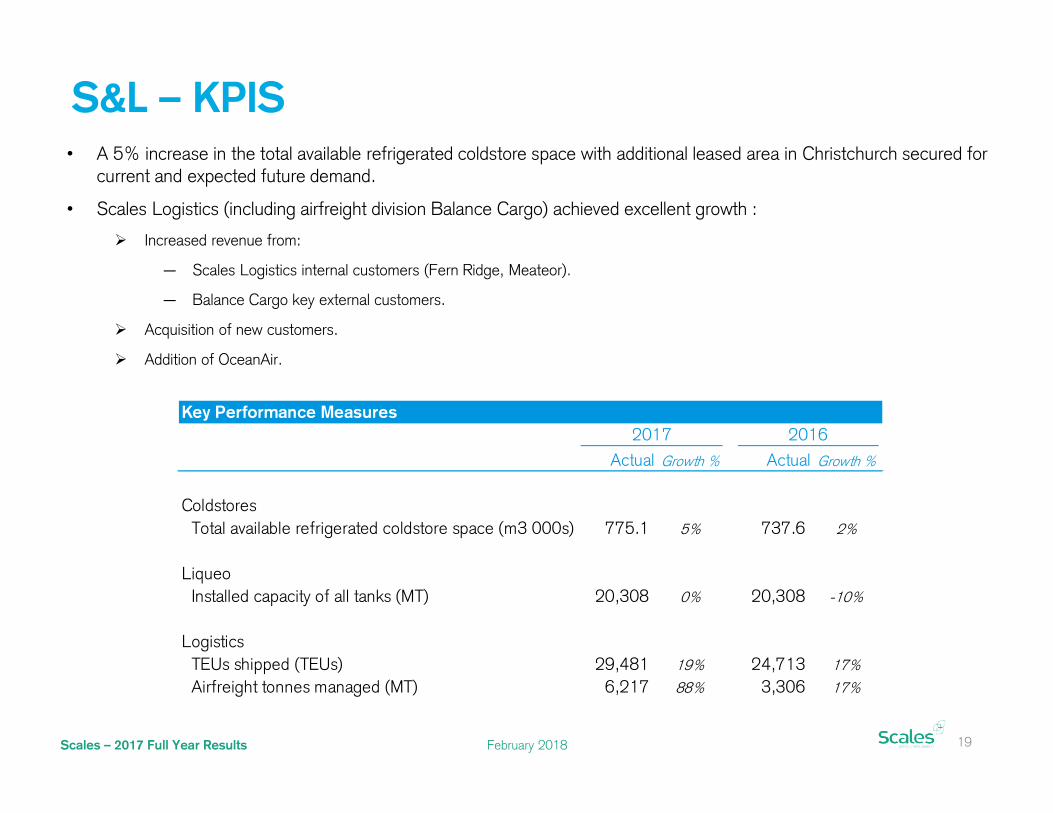
S&L – KPIS
19
• A 5% increase in the total available refrigerated coldstore space with additional leased area in Christchurch secured for current and expected future demand.
• Scales Logistics (including airfreight division Balance Cargo) achieved excellent growth :
Increased revenue from:
— Scales Logistics internal customers (Fern Ridge, Meateor).
— Balance Cargo key external customers.
Acquisition of new customers.
Addition of OceanAir.
Key Performance Measures2017 2016
Actual Growth % Actual Growth %
ColdstoresTotal available refrigerated coldstore space (m3 000s) 775.1 5% 737.6 2%
LiqueoInstalled capacity of all tanks (MT) 20,308 0% 20,308 -10%
LogisticsTEUs shipped (TEUs) 29,481 19% 24,713 17%Airfreight tonnes managed (MT) 6,217 88% 3,306 17%

February 2018Scales – 2017 Full Year Results
S&L – STRATEGY AND OUTLOOK
20
Storage & Logistics benefits from a long-term view and appropriate levels of investment• The outlook for 2018 is positive:
The Coldstore business expects to consolidate returns from new and existing customers requiring additional storage. The year commenced with higher levels of goods in store relative to this time last year.
New racking to be installed in existing stores will improve the utilisable space and earnings potential of those sites whilst also improving safety and handling efficiency.
Scales Logistics anticipates further increases in activity (TEUs shipped and airfreight tonnes managed).
Liqueo expected to benefit from additional forecast storage volumes.

February 2018Scales – 2017 Full Year Results
FOOD INGREDIENTS – FINANCIAL PERFORMANCE
• Meateor continues its steady growth in securing and selling petfood ingredient volumes. During 2017, 27,663 MT of petfood ingredients were sold by Meateor up 20% on 2016, delivering a corresponding increase in divisional revenues.
• Profruit sales volumes remained relatively steady at 5.6mL of juice concentrate:
A robust result given the difficult growing conditions and continued improvements in industry orcharding practices (thus provision of a reduced amount of fruit suitable for processing).
• Divisional EBITDA reduced by 13% from 2016 level reflecting increasing margin pressures within the division.
• The Group is focused on strategic initiatives to enhance our relationships with suppliers and customers as well as to build further scale within the division.
21
Record sales volumes from Meateor
Financial Performance - Food Ingredients2017 2016
$ Millions Actual Growth % Actual Growth %
Divisional Revenue 68.9 19% 58.0 19%
Underlying Food Ingredients EBITDA 8.0 -12% 9.2 22%
Depreciation & Amortisation (0.5) 6% (0.5) 1%
Underlying Food Ingredients EBIT 7.5 -13% 8.7 23%
KPIs
Meateor Volume Sold (MT) 27,663 20% 22,971 14%Juice Concentrate Sold (million Litres) 5.6 5.7

CAPITAL MANAGEMENT

February 2018Scales – 2017 Full Year Results
PERFORMANCE AGAINST BENCHMARKS
• We monitor Return on Capital Employed (ROCE) and EBITDA Margins for each division and the group, targeting a long-run combined ROCE of 15% and EBITDA Margin of 13%.
• Group capital employed increased by $14m (5%) between 2016 and 2017, mainly due to an increase in working capital.
23
Return on Capital Employed and EBITDA Margins targets exceeded
• ROCE from all divisions were in excess of their individual divisional targets.
• Overall EBITDA margin remain positive and above target levels.
Capital Management2017 2016
Actual Actual
Return on Capital EmployedHorticulture1 19% 28%Storage & Logistics 13% 11%Food Ingredients 30% 53%Group 16% 21%Target 15% 15%
EBITDA Margins2
Horticulture 17% 20%Storage & Logistics 15% 15%Food Ingredients 10% 13%Group 16% 18%Target 13% 13%
2. Excluding share of profit from joint venture
1. Due to the timing of the acquisition (November 2016), Longview was excluded from the calculation of Horticulture and Group 2016 ROCE. It has been included in 2017.

February 2018Scales – 2017 Full Year Results
CAPITAL EXPENDITURE
• Operational capital expenditure of $7.4m was slightly higher than 2016 whilst $6.0m was invested in growth projects, positioning us strategically for future earnings growth.
• Investments during 2017 included:
24
Strategic investment
Horticulture:
— Redevelopment of orchards to premium varieties such as Dazzle®.
— Installation of an apple washer at Longview.
— Upgraded vehicles and accommodation for RSE workers.
— Various IT upgrades.
Storage & Logistics:
— Racking upgrades at Whakatu for improved FMCG storage.
— Finalisation of the warehouse management system upgrade at Polarcold.
— Racking at Scales Logistics.
Capital Expenditure2017 2016
Actual Actual
Operational capital expenditureHorticulture 3.8 3.3Storage & Logistics 3.3 3.4Food Ingredients 0.2 0.4Other 0.1 0.0Total operational capital expenditure 7.4 7.0
Growth capital expenditureHorticulture 5.2 5.0Storage & Logistics 0.8 3.7Food Ingredients - - Total growth capital expenditure 6.0 8.7
Total capital expenditure 13.5 15.7

OUTLOOK

February 2018Scales – 2017 Full Year Results
WHAT WE KNOW ABOUT 2018
• Market dynamics remain supportive:
Horticulture:
— Apple harvesting is underway, having commenced 7-10 days ahead of last year, notwithstanding the wet weather experienced by the region. Early crop indications are positive.
— Gross production is expected to be consistent with 5-year average volumes.
— Export volumes will be influenced by packout, it is hoped this will be slightly ahead of 2017.
— Costs are expected to be more in line with a less challenging growing season
— Focused marketing and branding efforts will continue throughout Asia.
Storage & Logistics:
— We anticipate that the 2018 result will build upon 2017.
— Additional volume and revenue is expected from new and existing FMCG customers within the storage division.
— Increased fruit volumes are projected for the logistics businesses.
Food Ingredients:
— An anticipated increase in volumes with potential changes in product mix.
— Continued consideration of opportunities to grow and develop this division.
• Based on factors known to us at the time of writing, the Directors support previously provided guidance for 2018 (EBITDA of $58 million to $65 million).
26
A positive outlook

STRATEGY

February 2018Scales – 2017 Full Year Results
REFRESHING OUR STRATEGY
• We have refreshed our group investment / growth strategy, adopting a greater focus on pure agri-businesses.
• We will focus on opportunities that play well to our strengths:
Fully-vertically integrated.
Export-led.
Add value from our Chinese relationships.
• This is an extremely exciting time to be a diversified investor in, and grower of, New Zealand agribusinesses.
New Zealand stakeholders expect the agriculture sector to embrace environmentally friendly, sustainable and high value production - making best use of current natural resources and creating long lasting environmental benefits.
This is reflected in recent government announcements covering areas such as climate change and expectations of foreign investment.
• Successful implementation of the strategy will ultimately result in a meaningful rebalance of our current portfolio of businesses:
We will look to acquire businesses that play well to our strengths.
We will seek to divest operations that are not well-aligned with our strengths.
28
A greater focus on pure Agri-Business

February 2018Scales – 2017 Full Year Results
REFRESHING OUR STRATEGY (CONT’D)
29
Agri-Business encompasses the following primary industries
Agriculture
Fisheries / Aquaculture
Forestry
Viticulture
Horticulture
Apiculture
Innovative Processed
FoodDairy, Meat & Wool, Animal products, Arable products, Poultry and eggs
79.2%of New Zealand’s
merchandise exports
The Primary Sector accounts for:
15%of employment
10.5%of GDP

APPENDICES

February 2018Scales – 2017 Full Year Results
RECONCILIATION TO STATUTORY ACCOUNTS
• This table reconciles Underlying EBITDA and Underlying Net Profit to Net Profit as Reported in our Financial Statements.
31
Reconciliation of Underlying EBITDA to Net Profit
2017 2016
$'000 Actual Actual
Underlying EBITDA 62,007 67,856RECONCILIATION TO GAAP INFORMATION
- Depreciation (13,661) (11,438) - Amortisation (588) (661) - Finance revenue 175 167 - Finance charges (3,039) (2,533) - Taxation (12,164) (14,753)
Underlying Net Profit 32,730 38,638
- Foreign exchange contract revaluations / hedge ineffectiveness 214 (1,258) - Change in fair value gain on apple inventory (40) 993 - Cash settled share-based payments (92) - - Change in gross liability for Non Controlling Interests (629) - - Equity settled employee benefits (389) (270) - Taxation (23) 75
(959) (460)
Net Profit as reported in Financial Statements 31,771 38,178

February 2018Scales – 2017 Full Year Results
DISCLAIMERThe information in this presentation has been prepared by Scales Corporation Limited with due care and attention. However, neither Scales Corporation Limited nor any of its directors, employees, shareholders nor any other person shall have any liability whatsoever to any person for any loss (including, without limitation, arising from any fault or negligence) arising from this presentation or any information supplied in connection with it.
This presentation may contain projections or forward-looking statements regarding a variety of items. Such projections or forward-looking statements are based on current expectations, estimates and assumptions and are subject to a number of risks, uncertainties and assumptions. There is no assurance that results contemplated in any projections and forward-looking statements in this presentation will be realised. Actual results may differ materially from those projected in this presentation. No person is under any obligation to update this presentation at any time after its release to you or to provide you with further information about Scales Corporation Limited.
Our results are reported under NZ IFRS. This presentation includes non-GAAP financial measures which are not prepared in accordance with NZ IFRS. The non-GAAP financial measures used in this presentation include:
• EBITDA. We calculate EBITDA by adding back (or deducting) depreciation, amortisation, finance charges / (revenue), and taxation expense to net earnings / (loss) from continuing operations.
• EBIT. We calculate EBIT by adding back (or deducting) finance charges / (revenue), and taxation expense to net earnings / (loss) from continuing operations.
• Underlying EBITDA and EBIT are calculated by adding back (or deducting) any non-cash IFRS adjustments.
• Underlying Net Profit is calculated by adding back or (or deducting) the after-tax effect of any non-cash IFRS adjustments.
We believe that these non-GAAP financial measures provide useful information to readers to assist in the understanding of our financial performance, financial position or returns, but that they should not be viewed in isolation, nor considered as a substitute for measures reported in accordance with NZ IFRS. Non-GAAP financial measures may not be comparable to similarly titled amounts reported by other companies.
Forward-looking statements are subject to any material adverse events, significant one-off expenses or other unforeseeable circumstances.
The information in this presentation is of a general nature and does not constitute financial product advice, investment advice or any recommendation. Nothing in this presentation constitutes legal, financial, tax or other advice.
32