Embed Size (px)
Citation preview

A TEST OF TRANSFERABILITY:THE SE FLORIDA ACTIVITY-BASED MODEL
14th TRB National Planning Applications ConferenceMay 5-9, 2013, Columbus, Ohio
Rosella PicadoParsons Brinckerhoff

Background
Southeast Florida is home to 5.5 million people, spanning Miami-Dade, Broward and Palm Beach counties
Relatively disperse travel patterns with significant congestion on Turnpike and north-south freeways
Growing interest in improving transit, expand toll and managed lane infrastructure, mitigate adverse EJ impacts
Trip-based model reaching its limits, especially regarding variably-priced tolling, fare policies, spatial detail, EJ analysis
SE Florida ABM
Coordinated Travel – Regional Activity-based Modeling Platform Family of ABMs
Main features: Explicit intra-household interactions Continuous temporal dimension (half-hour time periods) Fine spatial dimension (12,000 MAZs) Faithful transit access coding Distributed values of time Integration of location, time-of-day, and mode choice
models

Model Development Strategy
Transfer the San Diego ABM Adopt CT-RAMP structure and sub-models Adopt model parameters estimated with San Diego
household survey data Update certain models to reflect SE Florida conditions:
input data availability (employment, population controls) modal supply trip assignment methods ancillary models
Calibrate models to SE Florida travel patterns Re-specify models that fail to perform well

Why Model Transfer?
Schedule: To use the ABM in the development of the 2013 Long
Range Transportation Plan Approximately 18 months available for model
development was insufficient time to estimate & validate all models
Data: Quantity and quality of NHTS SE Florida sample may
preclude statistically significant estimation of some models and/or population effects
Largely sufficient for calibration, with caveats

Data Limitations
Small sample size – 2,000 households Some subareas within model region under-
represented Retired households over-sampled College students and children under-
represented Missing data, ‘ungeocodable’ activity
locations, etc. Incomplete transit on-board survey

Assessing the Model Transfer Outcome Evaluate initial estimated travel patterns against
model calibration targets Regional targets for important person markets Sub-regional where data allow
Assess the magnitude of constant or parameter adjustments to match targets
Importance of model calibration targets Based on NHTS and supplemented with other sources Evaluated for reasonableness Compared to targets from other regions

Work Location Model - initial results
0 5 10 15 20 25 30 35 40 45 500%
1%
2%
3%
4%
5%
6%
7%
8%
9%
10%
Observed Estimated
Distance (miles)
Person Type
Avg. Length (mi.)
Obs. Est.Full-time 10.6 9.4Part-time 7.5 5.3All 9.9 8.7
Tour Frequency (%)

Work Location Model - calibrated
Person Type
Avg. Length (mi.)
Obs. Est.Full-time 10.6 10.2Part-time 7.5 7.0All 9.9 9.7
0 5 10 15 20 25 30 35 40 45 500%
1%
2%
3%
4%
5%
6%
7%
8%
9%
10%
Observed Estimated
Distance (miles)
Tour Frequency (%)

School Location Model - initial
0 1 2 3 4 5 6 7 8 9 10 11 12 13 14 15 16 17 18 19 200%
5%
10%
15%
20%
25%
30%
35%
Observed Estimated
Distance (miles)
Tour Frequency (%)

School Location Model - calibrated
0 1 2 3 4 5 6 7 8 9 10 11 12 13 14 15 16 17 18 19 200%
5%
10%
15%
20%
25%
30%
35%
Observed Estimated
Distance (miles)
Tour Frequency (%)
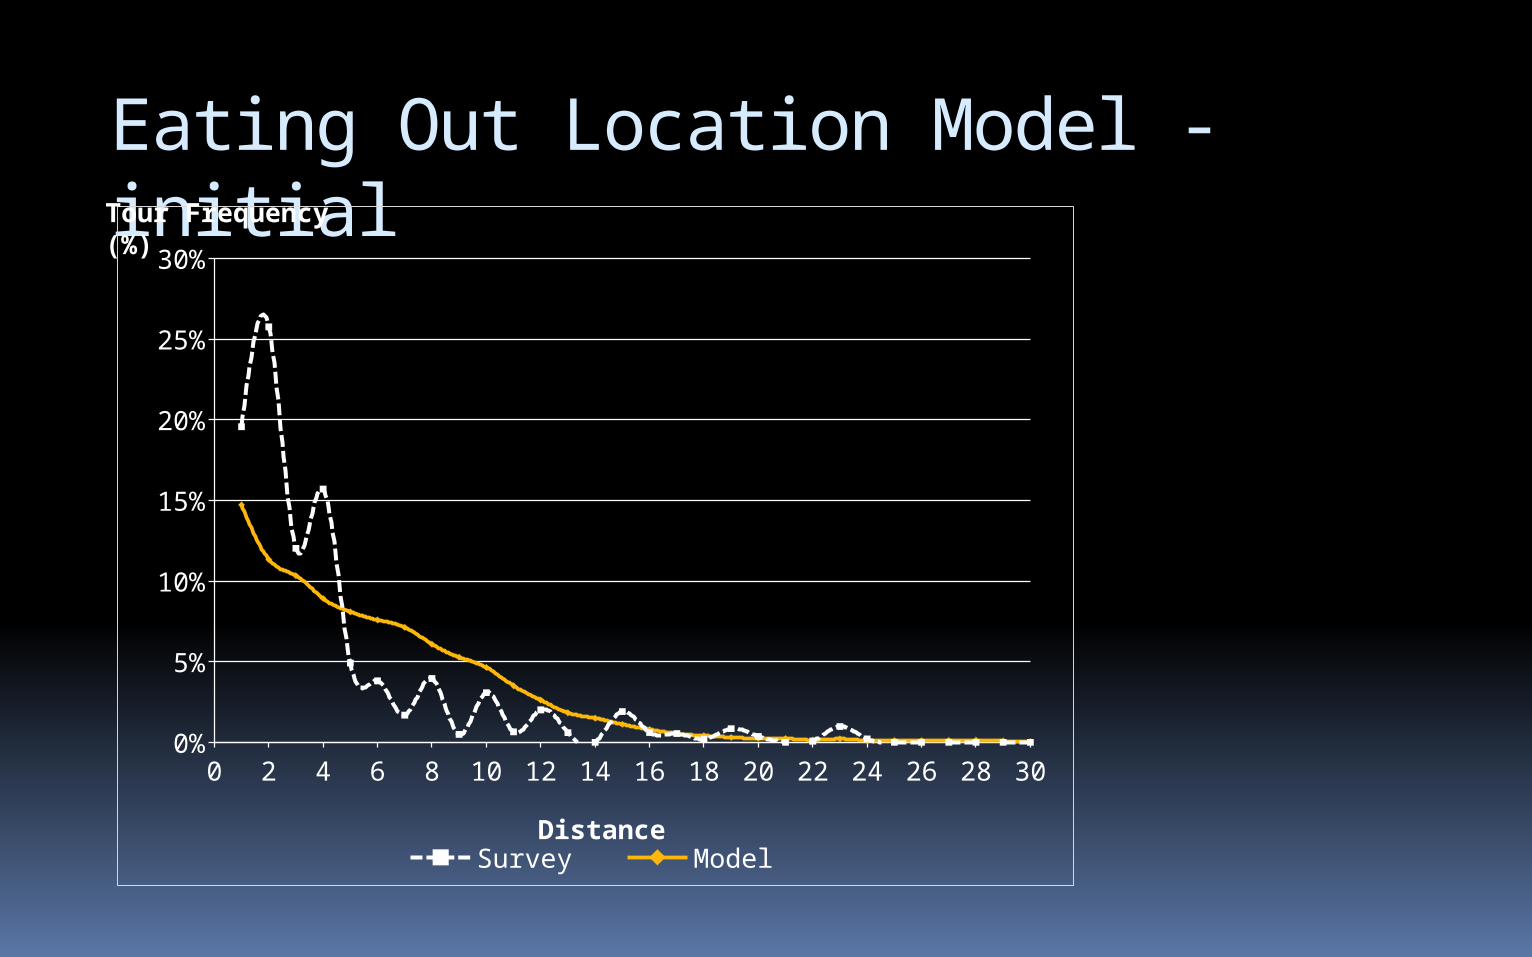
Eating Out Location Model - initial
0 2 4 6 8 10 12 14 16 18 20 22 24 26 28 300%
5%
10%
15%
20%
25%
30%
Survey ModelDistance
Tour Frequency (%)
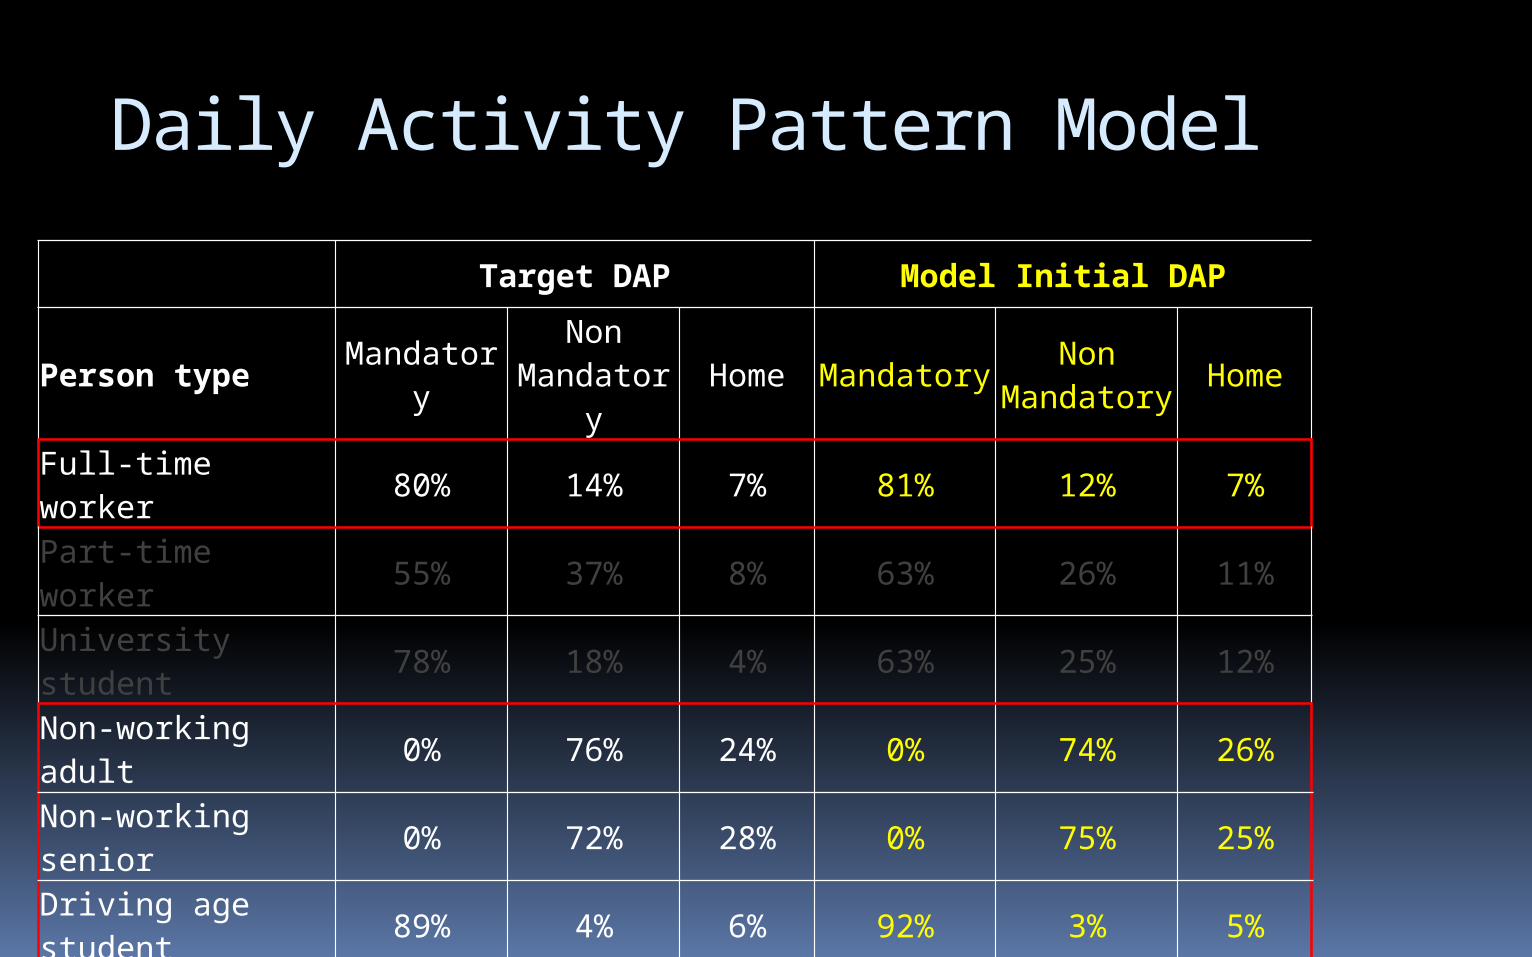
Daily Activity Pattern Model
Target DAP Model Initial DAP
Person typeMandator
y
Non Mandator
yHome Mandatory
Non Mandatory
Home
Full-time worker 80% 14% 7% 81% 12% 7%
Part-time worker 55% 37% 8% 63% 26% 11%
University student 78% 18% 4% 63% 25% 12%
Non-working adult 0% 76% 24% 0% 74% 26%
Non-working senior
0% 72% 28% 0% 75% 25%
Driving age student
89% 4% 6% 92% 3% 5%
Pre-driving student
94% 3% 2% 96% 2% 2%
Pre-school 35% 43% 22% 43% 41% 15%

Non-Mandatory Tour Frequency
-5% 0% 5% 10% 15% 20% 25% 30%
-5%
0%
5%
10%
15%
20%
25%
30%
Full-time WorkersPart-time workers
Observed Tour Frequency
Estimated Tour Frequency (%) Initial Calibrat
ed
-5% 0% 5% 10% 15% 20% 25% 30%
-5%
0%
5%
10%
15%
20%
25%
30%
Full-time WorkersPart-time workersUniversity students
Observed Tour Frequency

Non-Mandatory Tour Frequency
-5% 0% 5% 10% 15% 20% 25% 30%
-5%
0%
5%
10%
15%
20%
25%
30%
Driving studentsPre-driving studentsPre-school children
Observed Tour Frequency
Estimated Tour Frequency (%) Initial
-5% 0% 5% 10% 15% 20% 25% 30%
-5%
0%
5%
10%
15%
20%
25%
30%
Driving studentsPre-driving studentsPre-school children
Observed Tour Frequency
Calibrated

Work Departure and Arrival Times
Befor
e 5
am
5:0
0 am
to 5
:30
am
5:3
0 am
to 6
:00
am
6:0
0 am
to 6
:30
am
6:3
0 am
to 7
:00
am
7:0
0 am
to 7
:30
am
7:3
0 am
to 8
:00
am
8:0
0 am
to 8
:30
am
8:3
0 am
to 9
:00
am
9:0
0 am
to 9
:30
am
9:3
0 am
to 1
0:00
am
10:
00 a
m to
10:
30 a
m
10:
30 a
m to
11:
00 a
m
11:
00 a
m to
11:
30 a
m
11:
30 a
m to
12:
00 p
m
12:
00 p
m to
12:
30 p
m
12:
30 p
m to
1:0
0 pm
1:0
0 pm
to 1
:30
pm
1:3
0 pm
to 2
:00
pm
2:0
0 pm
to 2
:30
pm
2:3
0 pm
to 3
:00
pm
3:0
0 pm
to 3
:30
pm
3:3
0 pm
to 4
:00
pm
4:0
0 pm
to 4
:30
pm
4:3
0 pm
to 5
:00
pm
5:0
0 pm
to 5
:30
pm
5:3
0 pm
to 6
:00
pm
6:0
0 pm
to 6
:30
pm
6:3
0 pm
to 7
:00
pm
7:0
0 pm
to 7
:30
pm
7:3
0 pm
to 8
:00
pm
8:0
0 pm
to 8
:30
pm
8:3
0 pm
to 9
:00
pm
9:0
0 pm
to 9
:30
pm
9:3
0 pm
to 1
0:00
pm
10:
00 p
m to
10:
30 p
m
10:
30 p
m to
11:
00 p
m
11:
00 p
m to
11:
30 p
m
11:
30 p
m to
12:
00 a
m
Afte
r 12:
00 a
m0%
2%
4%
6%
8%
10%
12%
14%
16%
18%
Work Departure Observed Work Departure EstimatedWork Arrival Observed Work Arrival Estimated
Initial
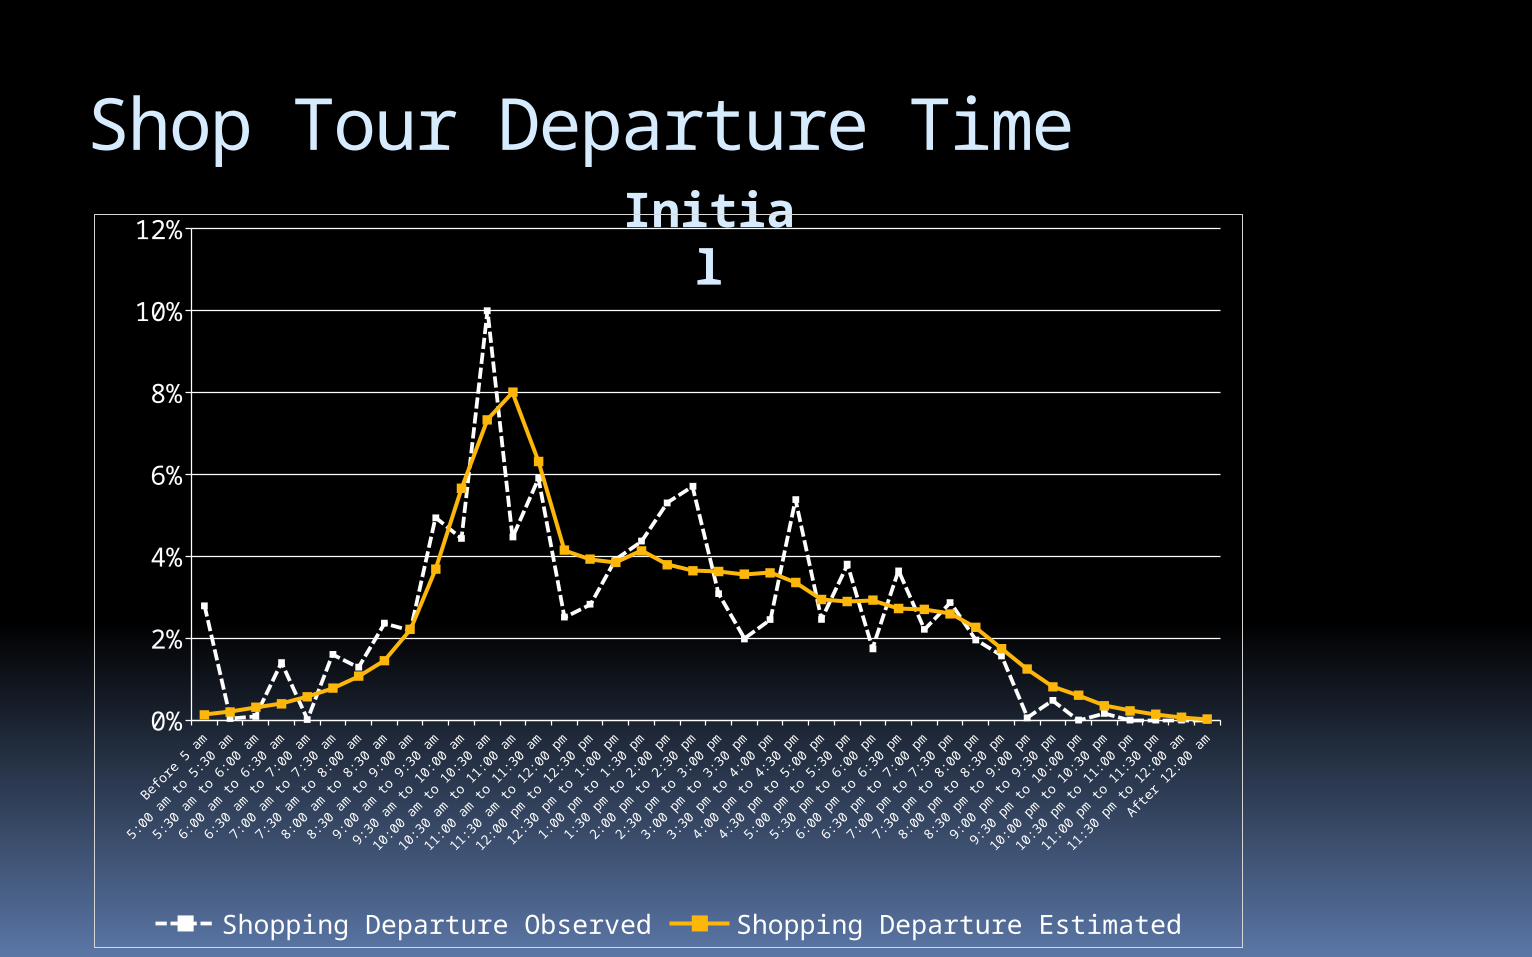
Shop Tour Departure TimeInitial
Befor
e 5
am
5:0
0 am
to 5
:30
am
5:3
0 am
to 6
:00
am
6:0
0 am
to 6
:30
am
6:3
0 am
to 7
:00
am
7:0
0 am
to 7
:30
am
7:3
0 am
to 8
:00
am
8:0
0 am
to 8
:30
am
8:3
0 am
to 9
:00
am
9:0
0 am
to 9
:30
am
9:3
0 am
to 1
0:00
am
10:
00 a
m to
10:
30 a
m
10:
30 a
m to
11:
00 a
m
11:
00 a
m to
11:
30 a
m
11:
30 a
m to
12:
00 p
m
12:
00 p
m to
12:
30 p
m
12:
30 p
m to
1:0
0 pm
1:0
0 pm
to 1
:30
pm
1:3
0 pm
to 2
:00
pm
2:0
0 pm
to 2
:30
pm
2:3
0 pm
to 3
:00
pm
3:0
0 pm
to 3
:30
pm
3:3
0 pm
to 4
:00
pm
4:0
0 pm
to 4
:30
pm
4:3
0 pm
to 5
:00
pm
5:0
0 pm
to 5
:30
pm
5:3
0 pm
to 6
:00
pm
6:0
0 pm
to 6
:30
pm
6:3
0 pm
to 7
:00
pm
7:0
0 pm
to 7
:30
pm
7:3
0 pm
to 8
:00
pm
8:0
0 pm
to 8
:30
pm
8:3
0 pm
to 9
:00
pm
9:0
0 pm
to 9
:30
pm
9:3
0 pm
to 1
0:00
pm
10:
00 p
m to
10:
30 p
m
10:
30 p
m to
11:
00 p
m
11:
00 p
m to
11:
30 p
m
11:
30 p
m to
12:
00 a
m
Afte
r 12:
00 a
m0%
2%
4%
6%
8%
10%
12%
Shopping Departure Observed Shopping Departure Estimated

Shop Tour Departure Time
Befor
e 5
am
5:0
0 am
to 5
:30
am
5:3
0 am
to 6
:00
am
6:0
0 am
to 6
:30
am
6:3
0 am
to 7
:00
am
7:0
0 am
to 7
:30
am
7:3
0 am
to 8
:00
am
8:0
0 am
to 8
:30
am
8:3
0 am
to 9
:00
am
9:0
0 am
to 9
:30
am
9:3
0 am
to 1
0:00
am
10:
00 a
m to
10:
30 a
m
10:
30 a
m to
11:
00 a
m
11:
00 a
m to
11:
30 a
m
11:
30 a
m to
12:
00 p
m
12:
00 p
m to
12:
30 p
m
12:
30 p
m to
1:0
0 pm
1:0
0 pm
to 1
:30
pm
1:3
0 pm
to 2
:00
pm
2:0
0 pm
to 2
:30
pm
2:3
0 pm
to 3
:00
pm
3:0
0 pm
to 3
:30
pm
3:3
0 pm
to 4
:00
pm
4:0
0 pm
to 4
:30
pm
4:3
0 pm
to 5
:00
pm
5:0
0 pm
to 5
:30
pm
5:3
0 pm
to 6
:00
pm
6:0
0 pm
to 6
:30
pm
6:3
0 pm
to 7
:00
pm
7:0
0 pm
to 7
:30
pm
7:3
0 pm
to 8
:00
pm
8:0
0 pm
to 8
:30
pm
8:3
0 pm
to 9
:00
pm
9:0
0 pm
to 9
:30
pm
9:3
0 pm
to 1
0:00
pm
10:
00 p
m to
10:
30 p
m
10:
30 p
m to
11:
00 p
m
11:
00 p
m to
11:
30 p
m
11:
30 p
m to
12:
00 a
m
Afte
r 12:
00 a
m0%
2%
4%
6%
8%
10%
12%
14%
Shopping Departure Observed Shopping Departure Estimated
Calibrated

Work Tour Mode ChoiceTarget Initial Estimate
auto sufficiency auto sufficiency
Tour Modeno
veh.insuf. suf. total
no veh.
insuf. suf. total
Drive-Alone 0% 49% 78% 67% 0% 51% 67% 60%Shared 2 13% 30% 13% 18% 24% 25% 17% 20%Shared 3+ 8% 11% 6% 8% 12% 13% 13% 13%Walk 11% 3% 0% 1% 31% 6% 1% 4%Bike 5% 1% 0% 0% 18% 2% 0% 1%Walk-Transit 62% 5% 1% 4% 15% 3% 1% 2%PNR-Transit 0% 1% 1% 1% 0% 0% 0% 0%KNR-Transit 2% 1% 0% 0% 0% 0% 0% 0%
Toll 13% 14%Local Bus 68% 51%Express Bus 5% 9%BRT 1% 13%Urban Rail 21% 23%Com Rail 5% 3%

Work Ahead
Finalize model calibration Validation to traffic counts and transit
boardings Future year forecast and sensitivity tests

Conclusions / Lessons Learned
SANDAG CT-RAMP ABM is able to reproduce most regional travel patterns in SE Florida
Largest differences between observed and initial model forecasts: non-mandatory tour location CDAP and tour frequency for college students,
part-time workers, pre-school children Modest constant adjustments sufficient to
calibrate the model

Conclusions / Lessons Learned
Supplemental data sources important to validate calibration targets and selected model outputs
Unable to observe transferability at high levels of disaggregation

Acknowledgments
Shi-Chiang Li, Florida DOT Paul Larsen, Palm Beach MPO Paul Flavien, Broward MPO Larry Foutz, HNTB (formerly Miami-Dade
MPO) Ken Kaltenbach, The Corradino Group Sung-Ryong Han, BCC Engineering Bill Davidson, Ben Stabler, Jinghua Xu