Embed Size (px)
Citation preview
arX
iv:1
102.
5123
v1 [
astr
o-ph
.IM
] 2
4 Fe
b 20
11
Scientific Visualization in Astronomy: Towards the PetascaleAstronomy Era∗
Amr HassanA,B and Christopher J. FlukeA
A Centre for Astrophysics and Supercomputing, Swinburne University of Technology, PO Box 218,
Hawthorn, Australia, 3122B Email: [email protected]
Abstract: Astronomy is entering a new era of discovery, coincident with the establishment of newfacilities for observation and simulation that will routinely generate petabytes of data. While anincreasing reliance on automated data analysis is anticipated, a critical role will remain for visualization-based knowledge discovery. We have investigated scientific visualization applications in astronomythrough an examination of the literature published during the last two decades. We identify thetwo most active fields for progress – visualization of large-N particle data and spectral data cubes –discuss open areas of research, and introduce a mapping between astronomical sources of data anddata representations used in general purpose visualization tools. We discuss contributions using highperformance computing architectures (e.g: distributed processing and GPUs), collaborative astronomyvisualization, the use of workflow systems to store metadata about visualization parameters, and theuse of advanced interaction devices. We examine a number of issues that may be limiting the spread ofscientific visualization research in astronomy and identify six grand challenges for scientific visualizationresearch in the Petascale Astronomy Era.
Keywords: methods: data analysis — techniques: miscellaneous
1 Introduction
Astronomy is a data-intensive science. Petabytes1 ofobservational data is already in stored archives (Brunner et al.2002; Szalay and Gray 2001), even before facilities suchas the Atacama Large Millimeter Array [ALMA; Brown et al.(2004)], the Large Synoptic Survey Telescope [LSST;Ivezic et al. (2008)], LOFAR (Rottgering 2003), SkyMap-per (Keller et al. 2007), the Australian Square Kilome-tre Array Pathfinder [ASKAP; Johnston et al. (2008)],theKaroo Array Telescope [MeerKAT; (Booth et al. 2009)],and ultimately the Square Kilometre Array itself, reachfull operational status. Cosmological simulations with1010 particles [e.g. Springel (2005); Klypin et al. (2010)]are also producing many-terabyte datasets, and thehighest resolution simulations codes executed on thenext generation of petaflop/s supercomputers will re-sult in further petabytes of data. The Petascale As-tronomy Era is a natural outcome of current and futuremajor observatories and supercomputer facilities.
Astronomy sits alongside fields such as high-energyphysics and bioinformatics in terms of the data vol-umes that are available to its practitioners. Such datavolumes pose significant challenges for data analysis,data storage and access, leading to the development ofa fourth data-intensive (or eScience) paradigm for sci-ence (Szalay and Gray 2006; Bell et al. 2009). Muchwork will be required to find effective solutions forknowledge discovery in the Petascale Astronomy Era,with a likely emphasis on automated analysis and datamining processes (Ball and Brunner 2009; Borne 2009;Pesenson et al. 2010). However, a critical step in un-
11 petabyte = 1015 bytes
derstanding, interpreting, and verifying the outcomeof automated approaches requires human intervention.This is most easily achieved by simply looking at thedata: the human visual system has powerful patternrecognition capabilities that computers are far frombeing able to replicate.
Astronomy has a long history in the use of dia-grams, maps and graphs2 to explain concepts, aid un-derstanding, present results, and to engage the public.However, there is more to visualization than just mak-ing pretty pictures. Data visualization is a fundamen-tal, enabling technology for knowledge discovery, andan important research field in its own right.
The broader field of astronomy visualization en-compasses topics such as optical and radio imaging,presentation of simulation results, multi-dimensionalexploration of catalogues, and public outreach visu-als. Aspects of visualization are utilized in the var-ious stages of astronomical research - from the plan-ning stage, through the observing process or runningof a simulation, quality control, qualitative knowledgediscovery and quantitative analysis.3 Indeed, muchof astronomy deals with the process of making anddisplaying two-dimensional (2D) images (e.g. fromCCDs) or graphs which are suitable for publicationin books, journals, conference presentations and in ed-ucation [see Fluke et al. (2009) for alternatives].
An important sub-field of visualization is scientificvisualization: the process of turning (numerical) datawith dimensionality N ≥ 3, usually with an inher-
2See Funkhouser (1936) for an account of the earliestextant astronomical graph.
3These are distinct phases - see Djorgovski (2005).
1
2 Publications of the Astronomical Society of Australia
ent geometrical structure, into images that can be in-spected by eye. At its conception in the 1980s (McCormick et al.1987; Frenkel 1988; DeFanti et al. 1989), scientific vi-sualization was envisaged as an interactive process,with an emphasis on understanding and analysis ofdata (including qualitative, comparative and quanti-tative stages), not just presentation (Wright 2005).Research in this field includes techniques for display-ing data (e.g. through the use of surface rendering,volume rendering, streamlines, etc.), efficient imple-mentations of display algorithms for increasingly com-plex data and data structures (including both data di-mensionality and dataset size) while retaining inter-activity, and effective use of high-performance com-puting for tasks such as parallel rendering and com-putational steering (where interaction with a simula-tion occurs during processing, and helps to drive thedirection of the next stage of processing). We re-fer the interested reader to the general introductionsby Gallagher (1995), Johnson and Hansen (2004), andSchroeder et al. (2006).
There is a very subtle distinction between scientificvisualization and the closely-related field of informa-tion visualization (Spence 2001). The latter deals withpresentation and understanding of multi-dimensionaldata, where the search for relationships between datapoints is the motivation for investigation. The fol-lowing example attempts to highlight the difference:a map of the locations of normal elliptical galaxieswith a colour scheme or symbols relating to mean sur-face brightness, effective surface brightness and cen-tral velocity disperson (so that the emphasis is onthe spatial arrangment) is a scientific visualization;a three-dimensional plot of these last three quanti-tites demonstrating how they form the fundamentalplane (Djorgovski and Davis 1987) is an informationvisualization. Similarly a three-dimensional (3D) plotof the (x, y, z) locations of particles from an N-bodysimulation, where no colour coding is used to presentadditional numerical properties is information visual-ization (essentially a 3D scatter plot), but colouringparticles by local density or temperature, or the useof a surface or volume rendering technique to identifylarge-scale structures, is scientific visualization. Wemake use of this distinction in order to help identifyresearch work that is relevant for our overview, andfor brevity use “visualization” hereafter to mean three-dimensional scientific visualization.
As a multidisciplinary field, scientific visualizationhas been used with great success in medical imaging,molecular modelling, engineering (e.g. computationalfluid dynamics), architecture, and astronomy. Scien-tific visualization of astronomical data includes bothobservational data generated over a variety of wave-lengths (optical, radio, X-ray, etc.) or from computersimulations. Visualization of observational data posessome specific challenges in terms of the data volume,dynamic range, (often low) signal-to-noise ratio, in-complete or sparse sampling, and astronomy-specificcoordinate systems. For simulations, challenges in-clude the number of particles, mesh resolution, andrange of length and time scales. While any one ofthese issues is not unique to astronomy, taken as a
whole, effective astrophysical visualization requires itsown unique solutions.
One of the first systematic astronomy visualiza-tion trials was undertaken by Gitta Domik, KristinaMickus-Miceli, and collaborators at the University ofColorado [Mickus et al. (1990a,b); Domik (1992); Domik and Mickus-Miceli(1992); Brugel et al. (1993)]. They developed a proto-type application named the Scientific Toolkit for As-trophysical Research (STAR) using IDL on top of X-Windows. Their main goals were to offer visualizationtools that were driven by the needs of astronomers,and that would integrate with existing data analysistools. STAR’s main functionality included display ofone and two-dimensional datasets, perspective projec-tion, pseudo-colouring, interactive colour coding tech-niques, volumetric data displays, and data slicing. STARwas introduced as a prototype to prove the feasibilityof the user interface, and visualization techniques pro-posed in their report.
Norris (1994) presented a blueprint for visualiza-tion research in astronomy, highlighting the suitabilityof 3D visualization for providing an intuitive under-standing that was missing when using 2D approaches(e.g. data slicing, where individual channels are ex-amined separately or played back as movie, requiringthe viewer to remember what was seen in earlier chan-nels). Visualization techniques could enable featuresof the data to be seen that would otherwise have re-mained unnoticed, such as low signal-to-noise struc-tures extending over multiple channels. Norris (1994)noted the importance of visualization in communicat-ing results qualitatively, but identified quantitative vi-sualization as the missing ingredient that would allowtrue interactive hypothesis testing - an essential partof the scientific process. While still relevant today,several key aspects – most notably a wider uptake of3D visualization by astronomers – have yet to be fullyrealised.
1.1 Scope and Purpose
We consider the development, advancement and ap-plication of scientific visualization techniques in as-tronomy over the last two decades - coincident withthe lifetime of scientific visualization as a field of in-quiry in its own right. To our knowledge, there havebeen no previous attempts to examine the status ofscientific visualization in astronomy. The Masters the-sis by Palomino (2003) discusses visualization strate-gies for several numerical datasets from astronomi-cal simulations; Leech and Jenness (2005) surveyed vi-sualization software available for radio and sub-mmdata; Dubinski (2008) provided an introduction to par-ticle visualization as a companion to a brief history ofN-body methods; Kapferer and Riser (2008) consid-ered software and hardware visualization requirementsfor numerical simulations; Li et al. (2008) describedstrategies for dealing with multiwavelength data; andFluke et al. (2009) summarised some basic elements ofcosmological visualization for observational and simu-lation data.
It is not our intent to provide a comprehensive ac-count of all research outcomes that have made use of

www.publish.csiro.au/journals/pasa 3
scientific visualization tools or approaches [see Brodbeck et al.(1998), Hultquist et al. (2003), or the growing scien-tific output from the AstroMed project, Borkin et al.(2008), Goodman et al. (2009), and Arce et al. (2010)for representative examples], but to investigate howscientific visualization in astronomy has advanced overthe last two decades. In particular, we do not con-sider geographical-style 3D visualization from plane-tary missions, or data from solar physics [see Ireland and Young(2009), and articles therein, or Aschwanden (2010) fora complementary review of the latter field]. We aimto provide an overview for researchers who wish tounderstand the state of scientific visualization in as-tronomy, with an emphasis on simulation and spectralcube data, aiming to motivate future work in this field.We assert that many current astronomy visualizationapproaches and applications are incompatible with thePetascale Astronomy Era, and much work is requiredto ensure that astronomers have the tools they need forknowledge discovery over the next decade and beyond.
The remainder of this paper is set out as follows.In section 2 we present an overview of progress in sci-entific visualization in astronomy, from projects in theearly 1990s until the present. We pay special atten-tion to two important classes of data: large-N particlesystems (section 2.3), and spectral data cubes (sec-tion 2.4). We consider other research areas includingdistributed (section 2.5) and collaborative visualiza-tion (section 2.6), image display (section 2.7), work-flow (section 2.8), and public outreach visuals (section2.9). In section 3, we demonstrate how the nature ofastronomical data impacts on the choice of visualiza-tion software, highlighting some of the advantages anddisadvantages of using general visualization packagesinstead of custom astronomy code. In section 4, wediscuss some of the challenges that astrophysical vi-sualization must overcome in order to be useful andusable, and identify six grand challenges for scientificvisualization research in the Petascale Astronomy Era.Finally, we present our concluding remarks in section5.
For a article on visualization, it may seem surpris-ing that so few images have been included. Our pref-erence is for the reader to view the original, publishedversions, appearing as their author(s) intended, ratherthan attempting to replicate them here. Any omissionof significant work or software related to scientific vi-sualization in astronomy is wholly the responsibility ofthe authors.
2 Scientific Visualization in As-tronomy
2.1 Visualization Techniques
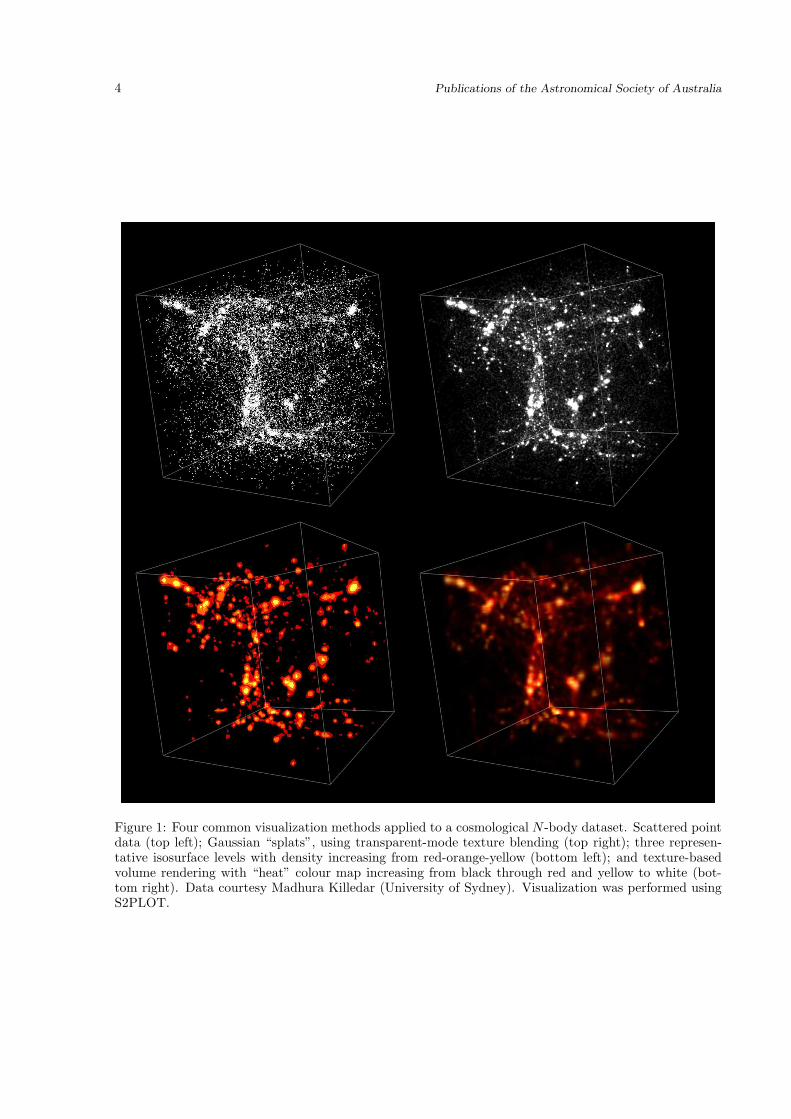
As a starting point to exploring advancements in scien-tific visualization in astronomy, we introduce the mostcommon techniques for presenting three-dimensionalscalar data in astronomy: points, splats, isosurfaces
and volume rendering.4 Figure 1 shows how the samedataset, in this case a single snapshot from a cosmolog-ical simulation, appears when rendered using the fourtechniques.
Plotting points (top left) as fixed width pixels is of-ten the most straightforward representation, however,this approach is limited by the available resolution (orpixel density) of the display. Splatting (top right) usessmall textures, often with a Gaussian intensity profile,to replace point-like objects. Splats are billboards, i.e.they always point towards the virtual camera regard-less of the orientation of the scene, and scale betterwith distance than pixels. Combining splats on thegraphics card gives an effect like volume-rendering, butwithout the calculation overhead of ray-tracing.
An isosurface (bottom left) or isodensity surfaceis a three-dimensional equivalent of contouring. Com-mon methods for calculating an isosurface from a datasetinclude marching cubes (Lorensen and Cline 1987; Montani et al.1994), marching tetrahedra (Bloomenthal 1994), mul-tiresolution isosurface extraction (Gerstner and Pajarola2000), and surface wavefront propagation (Wood et al.2000). Isosurfaces are usually used to search for cor-relation between different scalar variables, but are lessuseful to give a global picture of the dataset. Volumerendering (bottom right) attempts to provide a globalview of the dataset, particularly useful to render boththe external surfaces and the interior 3D structureswith the ability to display weak or fuzzy surfaces. Vol-ume rendering can be performed using ray-tracing orusing the graphics card to combine a series of (semi-)transparent texture maps [e.g. Cabral et al. (1994),this approach was used for Figure 1].
2.2 The Nature of Astronomical Data
The nature of data has an impact on the choice ofvisualization technique, and hence software. One wayto look at astronomical data (Brunner et al. 2002) isto consider the origin or physical source:
• Imaging data: two-dimensional within a narrowwavelength range at a particular epoch.
• Catalogues: secondary parameters determinedfrom processing of image data (coordinates, fluxes,sizes, etc).
• Spectroscopic data and associated products: thisincludes one-dimensional spectra and 3D spec-tral data cubes, data on distances obtained fromredshifts, chemical composition of sources, etc.
• Studies in the time domain: including observa-tions of moving objects, variable and transientsources which require multiple observations atdifferent epochs, or synoptic surveys.
• Numerical simulations from theory: which caninclude properties such as spatial position, ve-locity, mass, density, temperature, and particle
4We found few papers that explicitly discussed the useof streamlines as a visualization technique. Outside of solarastronomy, these are more commonly used to understandflows in, e.g. computational fluid design or geophysics vi-sualizations.
4 Publications of the Astronomical Society of Australia
Figure 1: Four common visualization methods applied to a cosmological N -body dataset. Scattered pointdata (top left); Gaussian “splats”, using transparent-mode texture blending (top right); three represen-tative isosurface levels with density increasing from red-orange-yellow (bottom left); and texture-basedvolume rendering with “heat” colour map increasing from black through red and yellow to white (bot-tom right). Data courtesy Madhura Killedar (University of Sydney). Visualization was performed usingS2PLOT.

www.publish.csiro.au/journals/pasa 5
Figure 2: The four standard data representations used in scientific visualization. Scattered point data(top left); structured grid (top right); unstructured grid (bottom left); and adaptive/multi-resolution grid(bottom right). Visualization was performed using S2PLOT. Note that the bounding box surroundingthe unstructured grid is for reference only.
6 Publications of the Astronomical Society of Australia
type. These properties may also be presentedwith an explicit time dependence through theuse of “snapshot” outputs.
An alternative classification [see Gallagher (1995)] isbased on how the data is representated programmati-cally, i.e. how it is stored and organized in memory oron disk:
• Scattered points: data is comprised of a set ofpoint locations (x, y, z) and associated data at-tributes (e.g. density, pressure, and tempera-ture).
• Structured grid: data values are specified on aregular three-dimensional grid, with grid cellsaligned with the Cartesian axes.
• Unstructured grid: data values are specified oncorners of a 2D/3D shape element with an ex-plicitly defined connectivity.
• Adaptive grid: data values are specified on amulti-resolution structured grid. A coarse grid isused to cover the entire computational domaincombined with superimposed sub-grids to pro-vide higher resolution for regions of interest (e.g.where particle density is highest).
Figure 2 demonstrates each of these representations.This second classification is more familiar to praction-ers of scientific data visualization, and is one that helpsguide the choice of visualization techniques in a waythat is somewhat independent of a particular scientificdomain. Figure 3 demonstrates, in broad terms, howthe astronomically-motivated data categories can bemapped into the data representation schema. Unstructured-grids are rarely used in astronomy because they areusually generated from finite element analysis or do-main decomposition methods, which are not widelyused in astronomy [see Springel (2010) for an exampleof unstructured grid usage].
With regard to 3D scientific visualization, we areprimarily interested in spectroscopic, time domain-data,and numerical simulations, but there may be a need tooverlay images (e.g. image slicing), or secondary cat-alogue data (e.g. for comparisons between multiwave-length data). Based on the astronomical data category,the majority of visualization papers that we identifiedrelated to either N-body and other large-scale particlesimulations or spectral data cubes. We now summa-rize the main developments in each of these two areas.In particular, we focus on the implementation trends,as this provides a useful starting point for future workin this field, and occurences of the visualization tech-niques outlined in Section 2.1. We do not attempt toprovide specific technical details of each visualizationsolution, as some approaches are now out-dated dueto improvements in graphics hardware – most notablythrough the appearance of low-cost, massively parallelgraphics procesing units (GPUs).
2.3 Large-N Particle Simulations
For a science where direct experimentation is challeng-ing, numerical simulations provide astronomers witha link between observations and theory. Continued
growth in processing power, new architectures and im-proved algorithms, have all enabled simulations to in-crease in resolution and accuracy. Most astronomysimulations use of one of three main data representa-tions (see Figure 3):
1. Multi-dimensional scattered data: such as theGADGET-2 (Springel 2005) file format. Here,each data point is characterised by a set of spa-tial coordinates, with additional scalar and vec-tor properties. This can be mapped to a regularscattered data visualization problem.
2. 3D/2D structured grid: where the point-data isdistributed over a regularly-spaced mesh witha predefined resolution using smoothing tech-niques such as cloud-in-cell (Hockney and Eastwood1988). This data representation may cause aloss in fine details on scales below the mesh-size(Hopf et al. 2004).
3. Adaptive/multi-resolution grid: where the point-data is distributed over an adaptive mesh witha variable resolution. This is often the best datarepresentation to cover a wide range of spatialand temporal domain with a minimal data size(Kahler et al. 2002). However, implementationand handling of boundary conditions betweenscales can be challenging.
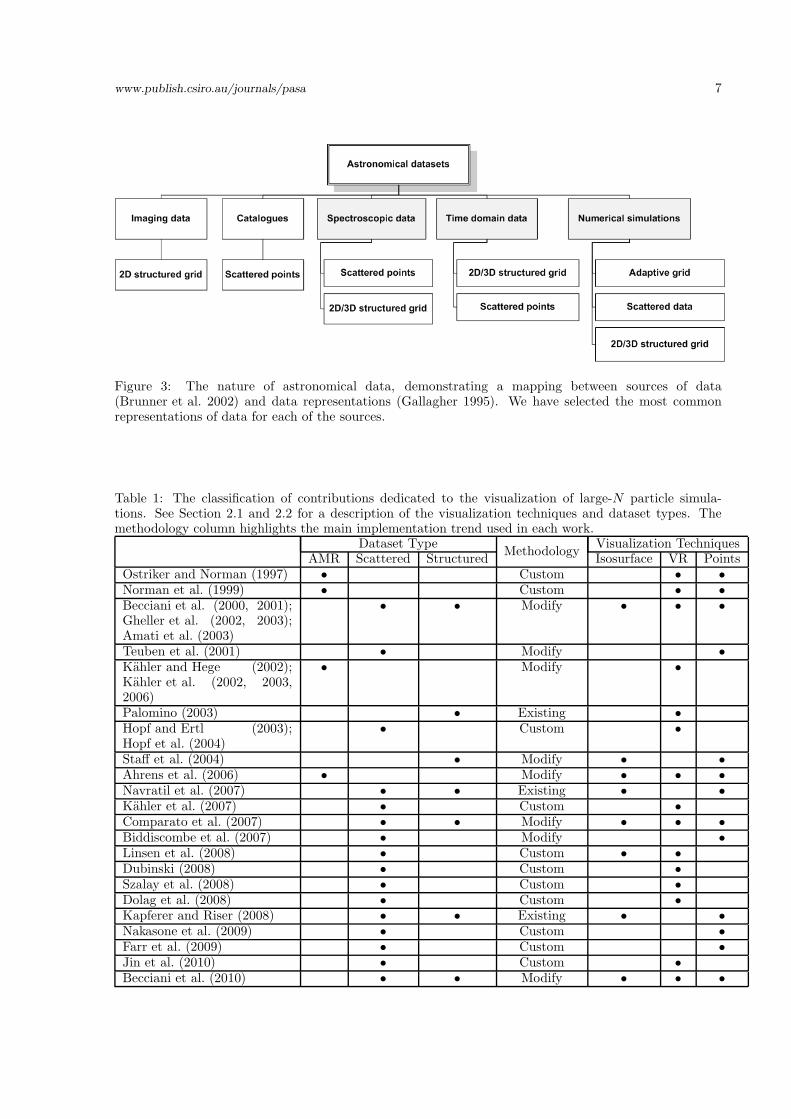
Table 1 summarizes contributions dedicated to theN-particle visualization problem with a classificationbased on the dataset representation type, the imple-mentation trend, and the main visualization techniquesused. It is noteworthy here that Palomino (2003),Staff et al. (2004), Biddiscombe et al. (2007), and Kapferer and Riser(2008) presented the usage of vector plots as one ofthe visualization techniques. Although it is not com-monly used to represent vector quantities from sim-ulations in astronomy, vector visualization is a veryuseful technique as has been demonstrated in otherfields, especially computational fluid dynamics. How-ever, interpreting the physical meaning of vector fieldsis a higher-level cognitive task compared to identify-ing structures through the use of surface or volumerendering.
Visualizing N-particle data is a problem commonto many scientific fields (e.g. point-based surface rep-resentations for 3D geometry processing 5), and thishas been an area for active research over the last twodecades. Such datasets are most ammenable to the useof general purpose scientific visualization tools/libraries,although there is still a tendency for astronomers todevelop their own solutions. In the astronomical lit-erature, we identify three main approaches to imple-mentation.
The first approach is to use an existing general pur-pose tool as-is (Palomino 2003; Navratil et al. 2007;Kapferer and Riser 2008), however a data preprocess-ing step is usually required to convert the data into asuitable representation before the visualization is per-formed. Palomino (2003) used IDL to visualize 2D/3Dnumerical simulations of magneto-hydrodynamic clouds
5see Kobbelt and Botsch (2004) for a discussion aboutdifferent available point-based rendering techniques
www.publish.csiro.au/journals/pasa 7
Figure 3: The nature of astronomical data, demonstrating a mapping between sources of data(Brunner et al. 2002) and data representations (Gallagher 1995). We have selected the most commonrepresentations of data for each of the sources.
Table 1: The classification of contributions dedicated to the visualization of large-N particle simula-tions. See Section 2.1 and 2.2 for a description of the visualization techniques and dataset types. Themethodology column highlights the main implementation trend used in each work.
Dataset TypeMethodology
Visualization TechniquesAMR Scattered Structured Isosurface VR Points
Ostriker and Norman (1997) • Custom • •
Norman et al. (1999) • Custom • •
Becciani et al. (2000, 2001);Gheller et al. (2002, 2003);Amati et al. (2003)
• • Modify • • •
Teuben et al. (2001) • Modify •
Kahler and Hege (2002);Kahler et al. (2002, 2003,2006)
• Modify •
Palomino (2003) • Existing •
Hopf and Ertl (2003);Hopf et al. (2004)
• Custom •
Staff et al. (2004) • Modify • •
Ahrens et al. (2006) • Modify • • •
Navratil et al. (2007) • • Existing • •
Kahler et al. (2007) • Custom •
Comparato et al. (2007) • • Modify • • •
Biddiscombe et al. (2007) • Modify •
Linsen et al. (2008) • Custom • •
Dubinski (2008) • Custom •
Szalay et al. (2008) • Custom •
Dolag et al. (2008) • Custom •
Kapferer and Riser (2008) • • Existing • •
Nakasone et al. (2009) • Custom •
Farr et al. (2009) • Custom •
Jin et al. (2010) • Custom •
Becciani et al. (2010) • • Modify • • •

8 Publications of the Astronomical Society of Australia
in the interstellar medium, stellar jets from variablesources, neutron star - black hole coalescence, andaccretion disks around a black hole. Navratil et al.(2007) used Paraview and Partiview to render a timedepended dataset of the first stars and their impact oncosmic history. Kapferer and Riser (2008) presentedthe usage of IFrIT, MayaVi data visualize, Paraview,and VisIT with a discussion of the visual quality as-pects, generating interactive 3D movies, real-time vec-tor field visualization, and high-resolution display tech-niques. They also showed the usage of VisTrials work-flow system for saving visualization meta-data.
The second approach was to modify or extend ex-isting general purpose tools (Becciani et al. 2000, 2001;Gheller et al. 2002; Kahler et al. 2002; Gheller et al.2003; Amati et al. 2003; Ahrens et al. 2006; Becciani et al.2010). Becciani et al. (2000, 2001), Gheller et al. (2002,2003), and Amati et al. (2003) described the develop-ment of the AstroMD tool (a tool developed withinthe European Cosmo.Lab project6). Its user interfacewas built based on TCL/TK while its visualizationfunctionality uses VTK. It includes visualization capa-bilities such as: isosurfaces, volume rendering, pointpicker, and sphere sampler.This work was continuedby Comparato et al. (2007), and Becciani et al. (2010)through the VisIVO project. VisIVO was developedbased on the Multimod application framework (MAF).Kahler and Hege (2002), Kahler et al. (2002), and Kahler et al.(2003, 2006) introduced an AMIRA7 extension to ren-der adaptive mesh refinement datasets. Their workwas initiated within the framework of a television pro-duction for the Discovery Channel for rendering for thefirst stars in the universe.
The final approach is to develop a custom systemor library from scratch. From Table 1, we can say itis quite a popular choice (Ostriker and Norman 1997;Norman et al. 1999; Kahler et al. 2007; Linsen et al.2008; Dubinski 2008; Szalay et al. 2008; Nakasone et al.2009; Jin et al. 2010). Ostriker and Norman (1997),and Norman et al. (1999) described the work done withinthe Computational Cosmology Observatory (CCO) whichact as an environment analogous to an astronomicalobservatory. Its implementation included: a special-ized I/O library to handle HDF files, a desktop visual-ization tool, virtual-reality navigation and animationtechniques, and Web-based workbenches for handlingand exploring AMR data.
Kahler et al. (2006) and Kahler et al. (2007) useda GPU-assisted ray casting algorithm to provide a highquality volume rendering of AMR datasets. They avoidedre-sampling the point’s data onto a structured gridby directly encoding the point data in a GPU-octreedata structure. Linsen et al. (2008) adopted a visual-ization approach based on isosurface extraction frommulti-field particle volume data. They projected theN-dimensional data into 3D star coordinates to helpthe user to select a cluster of features. Based on thesegmentation property induced by the cluster mem-bership, a surface is extracted from the volume data.Dubinski (2008) presented the MYRIAD library . MYR-
6http://cosmolab.cineca.it/7http://www.amira.com/
IAD has been integrated with two different parallel N-Body codes (PARTREE8 and GOTPM9).
Szalay et al. (2008) implemented a system that useshierarchical level-of-details (LOD) for particle-like cos-mological simulations, in order to display accurate re-sults without loading in the full dataset. They wereable to achieve a framerate of 10 frame per secondwith a desktop workstation and NVidia GeForce 8800graphics card.
The last noteworthy work in this direction is thatdone by Dolag et al. (2008) and Jin et al. (2010). Theyintroduced a tool to render directly point-like data inthe GADGET-2 format. They used ray tracing to ren-der in a fast and effective way the different families ofpoint-like data. The same algorithm was enhanced touse GPUs with CUDA and distributed clusters usingMPI.
There is no clear choice as to which approach shouldbe favoured, as there is a strong dependence on the vi-sualization objectives and target. Most of the usersof the first and the second trends aim to minimize thedevelopment cost and to use existing, tested, and opensource packages with minimal or no modification. Onthe other hand, the researchers using the third ap-proach aimed to enable the use of available advanced orspecialized hardware infrastructure [e.g. the Grid envi-ronment (Becciani et al. 2010), or GPUs (Kahler et al.2006) and (Jin et al. 2010)]; produce better or fastervisualization results through customizing an existingvisualization technique [Hopf et al. (2004); Dolag et al.(2008); Szalay et al. (2008)]; or utilizing new platforms,such as the web-platform or virtual environments, andprovide the users with better user interfaces or sup-port collaborative interaction [Nakasone et al. (2009)and Becciani et al. (2010)].
Visualization approaches and software have neededto keep pace with improvements in simulation tech-niques and resolution (which can include an increasein N or the number of grid cells). Indeed, visual-izing “large-N” datasets, relative to the era of im-plementation, was addressed by most of the works[Ostriker and Norman (1997); Norman et al. (1999); Welling and Derthic(2000); Kahler et al. (2006, 2007); Szalay et al. (2008);Jin et al. (2010); Becciani et al. (2010)]. Attempts tosolve this problem included the use of Grid-computingor a distributed cluster as the computing infrastruc-ture (Ostriker and Norman 1997; Norman et al. 1999;Jin et al. 2010; Becciani et al. 2010); using GPUs asthe computing infrastructure (Ahrens et al. 2006; Kahler et al.2006; Biddiscombe et al. 2007; Kahler et al. 2007; Szalay et al.2008; Jin et al. 2010), and see Hassan et al. (2010) fora solution using a distributed cluster with GPUs; andusing the dataset characteristics or optimized data struc-ture to provide a multi-resolution visualization solu-tion (Hopf and Ertl 2003; Hopf et al. 2004).
Of all the applications of scientific visualization inastronomy that we have examined, N-particle dataprovides the closest match to, and hence may be thegreatest beneficiary of, advances in the wider field ofscientific visualization. Their particular use of scat-tered and grid data formats means that general pur-
8http://www.sdsc.edu/pub/envision/v15.2/hernquist.html9http://www.cita.utoronto.ca/ dubinski/gotpm/
www.publish.csiro.au/journals/pasa 9
pose visualization packages (see Section 3) are moresuitable for handling simulation data, notwithstand-ing the need to convert from custom astronomy dataformats to required input formats. There may be somebenefit in providing simple file conversion tools, oth-erwise astronomers using simulation data may care toinvestigate alternative standard data representations(e.g. HDF510, VTK file format). While sharing somesimilarities with gridded simulation data, visualizationof spectral data cubes presents some unique problems,which we now explore.
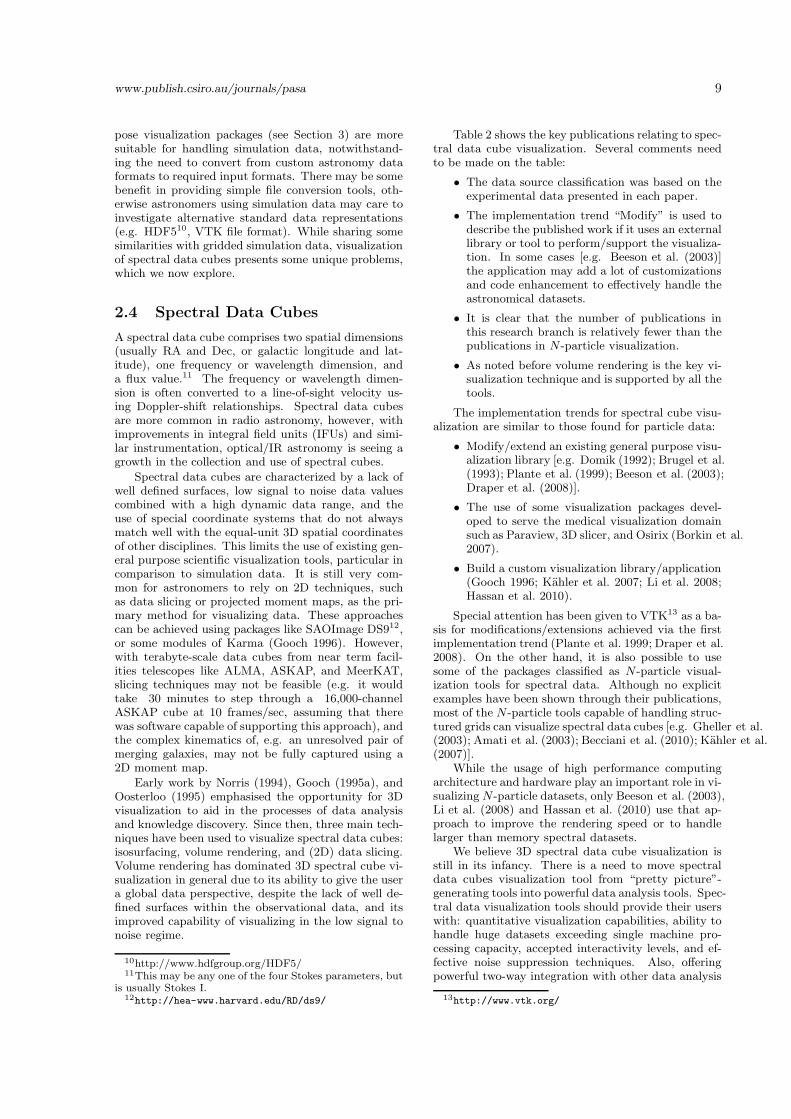
2.4 Spectral Data Cubes
A spectral data cube comprises two spatial dimensions(usually RA and Dec, or galactic longitude and lat-itude), one frequency or wavelength dimension, anda flux value.11 The frequency or wavelength dimen-sion is often converted to a line-of-sight velocity us-ing Doppler-shift relationships. Spectral data cubesare more common in radio astronomy, however, withimprovements in integral field units (IFUs) and simi-lar instrumentation, optical/IR astronomy is seeing agrowth in the collection and use of spectral cubes.
Spectral data cubes are characterized by a lack ofwell defined surfaces, low signal to noise data valuescombined with a high dynamic data range, and theuse of special coordinate systems that do not alwaysmatch well with the equal-unit 3D spatial coordinatesof other disciplines. This limits the use of existing gen-eral purpose scientific visualization tools, particular incomparison to simulation data. It is still very com-mon for astronomers to rely on 2D techniques, suchas data slicing or projected moment maps, as the pri-mary method for visualizing data. These approachescan be achieved using packages like SAOImage DS912,or some modules of Karma (Gooch 1996). However,with terabyte-scale data cubes from near term facil-ities telescopes like ALMA, ASKAP, and MeerKAT,slicing techniques may not be feasible (e.g. it wouldtake 30 minutes to step through a 16,000-channelASKAP cube at 10 frames/sec, assuming that therewas software capable of supporting this approach), andthe complex kinematics of, e.g. an unresolved pair ofmerging galaxies, may not be fully captured using a2D moment map.
Early work by Norris (1994), Gooch (1995a), andOosterloo (1995) emphasised the opportunity for 3Dvisualization to aid in the processes of data analysisand knowledge discovery. Since then, three main tech-niques have been used to visualize spectral data cubes:isosurfacing, volume rendering, and (2D) data slicing.Volume rendering has dominated 3D spectral cube vi-sualization in general due to its ability to give the usera global data perspective, despite the lack of well de-fined surfaces within the observational data, and itsimproved capability of visualizing in the low signal tonoise regime.
10http://www.hdfgroup.org/HDF5/11This may be any one of the four Stokes parameters, but
is usually Stokes I.12http://hea-www.harvard.edu/RD/ds9/
Table 2 shows the key publications relating to spec-tral data cube visualization. Several comments needto be made on the table:
• The data source classification was based on theexperimental data presented in each paper.
• The implementation trend “Modify” is used todescribe the published work if it uses an externallibrary or tool to perform/support the visualiza-tion. In some cases [e.g. Beeson et al. (2003)]the application may add a lot of customizationsand code enhancement to effectively handle theastronomical datasets.
• It is clear that the number of publications inthis research branch is relatively fewer than thepublications in N-particle visualization.
• As noted before volume rendering is the key vi-sualization technique and is supported by all thetools.
The implementation trends for spectral cube visu-alization are similar to those found for particle data:
• Modify/extend an existing general purpose visu-alization library [e.g. Domik (1992); Brugel et al.(1993); Plante et al. (1999); Beeson et al. (2003);Draper et al. (2008)].
• The use of some visualization packages devel-oped to serve the medical visualization domainsuch as Paraview, 3D slicer, and Osirix (Borkin et al.2007).
• Build a custom visualization library/application(Gooch 1996; Kahler et al. 2007; Li et al. 2008;Hassan et al. 2010).
Special attention has been given to VTK13 as a ba-sis for modifications/extensions achieved via the firstimplementation trend (Plante et al. 1999; Draper et al.2008). On the other hand, it is also possible to usesome of the packages classified as N-particle visual-ization tools for spectral data. Although no explicitexamples have been shown through their publications,most of the N-particle tools capable of handling struc-tured grids can visualize spectral data cubes [e.g. Gheller et al.(2003); Amati et al. (2003); Becciani et al. (2010); Kahler et al.(2007)].
While the usage of high performance computingarchitecture and hardware play an important role in vi-sualizing N-particle datasets, only Beeson et al. (2003),Li et al. (2008) and Hassan et al. (2010) use that ap-proach to improve the rendering speed or to handlelarger than memory spectral datasets.
We believe 3D spectral data cube visualization isstill in its infancy. There is a need to move spectraldata cubes visualization tool from “pretty picture”-generating tools into powerful data analysis tools. Spec-tral data visualization tools should provide their userswith: quantitative visualization capabilities, ability tohandle huge datasets exceeding single machine pro-cessing capacity, accepted interactivity levels, and ef-fective noise suppression techniques. Also, offeringpowerful two-way integration with other data analysis
13http://www.vtk.org/
10 Publications of the Astronomical Society of Australia
Table 2: The classification of contributions dedicated to the visualization of spectral data cubes. SeeSection 2.1 and 2.2 for a description of the visualization techniques and dataset types. The methodologycolumn highlights the main implementation trend used in each work.
Dataset TypeMethodology
Visualization TechniquesRadio IFU Isosurface VR Slicing
Domik (1992); Brugel et al. (1993) • Modify • • •
Gooch (1995a, 1996); Oosterloo(1995, 1996)
• Custom •
Plante et al. (1999) • Modify •
Beeson et al. (2003) • Modify •
Miller et al. (2006) • Existing •
Borkin et al. (2005, 2007) • Existing • • •
Li et al. (2008) • • Custom •
Draper et al. (2008) • Modify • •
Hassan et al. (2010) • Custom •
and reduction tools will be key to facilitate the widerusage of such tools. We will further discuss these issueswithin Section 4.
We now turn our attention to other developmentsin scientific visualization that are not based on thedata representation: distributed and remote visualiza-tion services, collaborative visualization, visualizationworkflows, and public outreach outcomes. With theexception of public outreach visualization, there hasbeen much less research effort expended in these areasfor astronomy, and consequently, their level of commu-nity up-take is somewhat lower than for the particleand spectral cube approaches we have examined.
2.5 Distributed/Remote Visualization
Desktop computers have a finite memory size, typicallya few gigabytes, yet many datasets from observationand simulation are much larger than this (e.g. pro-cessed ASKAP data cubes will be over 1 terabyte). Asolution to this problem lies in the use of distributedvisualization, where a networked computing clustershares the processing tasks.
A typical astronomer does not always have im-mediate access to sufficient computational power ordata storage capacity to deal effectively with such largedatasets. Moreover, effective and efficient implemen-tation of software to deal with large datasets requires ahigher-level of computing knowledge relating to choiceand use of appropriate data structures, techniques forscheduling, etc. Remote visualization therefore presentsan opportunity to provide the wider astronomy com-munity with a visualization service with potentiallylower cost, administrative effort, and a reduced needto transfer data. At the same time it presents a cost ef-fective way to further utilize existing expensive compu-tational infrastructure. This philosophy was the mainmotivation for the Virtual Observatory (VO) conceptof sharing datasets, and providing astronomers withdata analysis and visualization software as a service[see Quinn et al. (2004), and Williams and De Young(2009) for details]. Rather than requiring local hard-ware, a user requests a visualization of a dataset from aremote host - the outcome of the visualization, usually
an image, is returned to the user. Along with the timetaken to produce images, such a system has an over-head in terms of the interaction speed and the networkspeed.
The issue of providing 3D visualization and com-putational infrastructure as a service was addressed byPlante et al. (1999), Murphy et al. (2006), and Becciani et al.(2010). All of them agreed on using the Web as themain service platform. Plante et al. (1999) built a cus-tom VRML viewer using Java3D to render the outputof a VTK-based server. The custom VRML viewerenable them to provide additional interactivity ser-vices such as a 3D cursor, the ability to select sub-regions, and produce 2D JPEG snapshots of the vi-sualization output. The same methodology was usedby Beeson et al. (2004) to visualize data from cata-logue streamed in XML format, but with a ready madebrowser plugin to render VRML output. Murphy et al.(2006) describe an image display remote visualizationservice (RVS)14 through a set of VO tools for the stor-age, processing and visualization of Australia Tele-scope Compact Array data. The RVS server acceptsFITS images and provides a 2D visualization using anAIPS++ back end.
The last and probably one of the most completesystems is VisIVO web15 (Becciani et al. 2010). Thesystem uses Web 2.0 technology for user interaction,while the output is generated as static images, witha semi-interactive control of dataset orientation andmovie generation. It is a simple way to implementsuch functionality, but is perhaps not as intuitive asthe interaction provided through custom web controlsor environments such as Java3D.
The usage of distributed processing to enable as-tronomers to handle larger than memory datasets wasaddressed by Beeson et al. (2003), Jin et al. (2010),and Hassan et al. (2010). Beeson et al. (2003) extendedthe shear warp volume-rendering algorithm (Lacroute and Levoy1994) with a distributed implementation. Demonstratedusing both spectral line data cubes andN-body datasets,their technique relies on distributing the volume data
14http://www.atnf.csiro.au/vo/rvs/15http://visivoweb.oact.inaf.it/visivoweb/index.php

www.publish.csiro.au/journals/pasa 11
among the participating computing nodes and then us-ing the associative “over” operator to yield a final im-age. Their code was based on Virtual Reality VolumeRendering (VIRVO) code16.
Jin et al. (2010) developed a custom ray tracingcode to render, in a fast and effective way, point likedata. They exploit the use of multi-core architec-ture using OpenMP (Dolag et al. 2008), distributedmemory architecture using MPI, and GPUs using theCUDA development toolkit. Their technique was demon-strated usingN-body datasets only. Hassan et al. (2010)used a distributed GPU cluster to enable ray-castingvolume rendering of datasets up to 26 Gbytes at framerates better than 5 frames/sec. Combining shared anddistributed memory high performance computing ca-pabilities enabled them to handle large than memorydatasets at an accepted frame rate with a lower num-ber of nodes than Beeson et al. (2003).
2.6 Collaborative Visualization
Collaborative visualization enables multiple users toshare a visualization experience. For this to be suc-cessul, the main requirements are high-speed networksand effective communication protocols. Early work inthis field was by Van Buren et al. (1995), who imple-mented the AstroVR Collaboratory environment fordistributed users to share in the analysis of FITS im-ages. Communication between users was via audio,video, or typed text. The AstroVR approach wasmotivated by early client-server, multi-user networkedgames17. Plante et al. (1999) described collaborativesupport in the NCSA Horizon Image Data Browser(Version 2.0) via NCSA Habanero18. Collaboratorswere able to join a hablet session following an e-mailinvitation, with interaction via the GUI visible to allparticipants.
Both Djorgovski et al. (2009) and Nakasone et al.(2009) consider the use of virtual environments basedon the Second Life19 framework developed by Lin-den Labs. Launched in 2003, Second Life is an on-line, multi-user, virtual world application with sup-port for real-time interaction, creation and explorationof three-dimensional environments, and synchronouscommunication (including both text and voice). Asof early 2010, Second Life had more than 16 millionregistered accounts, although ∼ 40, 000 “residents” aretypically online at any one time. It is the collaborativeexperience that is of most interest to astronomers - ge-ographically distributed users can interact simultane-ously with a data visualization, with feedback on whatthe other participants are doing/seeing. The maindrawback at present is the limited support for largeastronomical datasets: the Second Life application im-poses a limit of 15,000 objects, leaving Nakasone et al.(2009) to experiment with visualizing only 1024 parti-cles from a stellar cluster simulation. Djorgovski et al.(2009) propose adapting OpenSim20, an open source
16http://www.calit2.net/~jschulze/projects/vox/release/deskvox2_00b.txt17Also known as Multi-User Dungeons or MUDs.18http://www.isrl.illinois.edu/isaac/Habanero/19http://secondlife.com20http://opensimulator.org
implementation of Second Life, which may partly re-move that restriction.
2.7 Image Display and Interaction
While not unique to scientific visualization, the useof advanced displays for presentation of, and inter-action with, three-dimensional datasets is worthy ofconsideration. Advanced displays may include tiledor multi-display walls, stereoscopic environments rang-ing from flat-screens to immersive CAVE-like environ-ments, and domes (upright and tilted).
Early descriptions of the limitations of 2D displaysfor 3D astronomical data are in Fomalont (1982) andRots (1986). Rots (1986) described the use of a mosaicof 2D slices, time-sequence animations, the creation of3D solid surfaces (ie. an isosurface at a given thresh-old level), and the possibilities offered by stereoscopicimages and holograms! Fluke et al. (2006) considereda suite of advanced displays including multi-panel ortiled displays, digital domes, and stereoscopic projec-tion, with descriptions of low-cost implementations ofeach display. Comprehensive overviews of stereoscopicand 3D display systems and technologies may be foundin McAllister (2006) or Holliman et al. (2006).
One of the main challenges is the lack of native sup-port for advanced displays from visualization software(Fluke et al. 2006). Most advanced displays requireimages in a different format to conventional displays(i.e. on a monitor or data projector). This includesfish-eye or other spherical projection for domes, andimage pairs for stereoscopic displays. There is an over-head in producing such frames, which can have a neg-ative impact on frame rates and hence usability. Onthe other hand, viewing data with an advanced dis-play may yield additional insight. Apart from a fewprojects using CAVE-like environments, stereoscopicand dome display has mostly been reserved for publicoutreach visualization (see Section 2.9).
A related issue, which has yet to achieve a sat-isfactory resolution, is the choice of appropriate 3Dinteraction device. Intuitive and easy real-time inter-action with visualization output, including changingvisualization parameters, camera position, and inter-active dynamic data filtering (Shneiderman 1994), isvital to achieve the required visualization outcomes.This may also be one of the reasons why quantitativetechniques in 3D have not advanced (Gooch 1995b,a),as they rely on a device (e.g. for selection of objectsor regions) that is as simple to use in 3D as the mouseis for interacting with 2D data.
Few astronomy publications have explictly addressedpractical alternatives for interacting with astronomicaldata. Gooch (1995b) considered the 6-degree of free-dom Spaceball (Spatial Systems, Inc.) as an alterna-tive to manipulate a 3D cursor within a 3D volume.The Spaceball was a low-cost version of the devicesused in immersive environments, controlling additionalfunctionality such as interactive slicing. Kahler and Hege(2002), and Kahler et al. (2002) used a voice and ges-ture controlled CAVE application to define a camerapath following the interesting features.

12 Publications of the Astronomical Society of Australia
2.8 Workflow
When dealing with a large amount of datasets, addi-tional benefits may be achieved using workflow drivenapplications. Selecting a certain visualization parame-ter is not usually a straight forward process: knowledgeabout the visualization algorithms, and the datasetcharacteristics are essential to achieve sensible visual-ization outcomes. Indeed, reproducing specific visual-ization results is challenging, particular when an inter-active process has been used to control properties suchas data limits, transparency, colour maps and orienta-tion. Keeping metadata about the visualization pro-cess itself through an integrated workflow managementsystem was addressed by Kapferer and Riser (2008).They discussed the usage of VisTrials21 as a scientificworkflow management system that provides supportfor data exploration and visualization.
On the other hand, providing the user with visu-alization software that tightly integrates with simula-tion, data analysis, or data generation tools may facil-itate the use of new visualization tools/techniques, re-move the data conversion barrier, and provide a betterinteroperability. Some published work [e.g. Dubinski(2008); Comparato et al. (2007)] discusses this con-cept, and different real time data sharing and inte-gration protocols were introduced as a part of the VOinitiative [e.g Taylor et al. (2006)].
Li et al. (2008) presents a visualization workflowfor multi-wavelength astronomical data. The impor-tance of their work comes from the completeness oftheir proposed framework that included GPU-baseddata processing and new ways to visualize multi-wavelengthastronomical data with volume visualizations (such asthe “horseshore” model). They offer a collection of in-teractive exploration tools tailored for multi-wavelengthdatasets.
2.9 Public Outreach
Astronomy has a demonstrated history of engagingpublic interest in science - this has been achieved inlarge part by the appealing visuals that are routinelygenerated from telescopes and simulations. As a pro-fessional astronomer, there is something special aboutbeing able to share the results of our research workwith the public. It is easy for our passion to inspire au-diences of all ages, from the youngest school studentsto adults. However, the techniques that we often usein collecting, understanding and exploring our datasets(histograms, scatter plots, error-bars, etc.) do not al-ways make for visually appealing, or necessarily un-derstandable, presentations. Public outreach visualsare qualitative or occasionally comparative, but rarelyquantitative.
In some sense, public outreach use of scientific vi-sualization techniques has exceeded that for scienceoutcomes, with a number of advancements in astron-omy visualization motivated by outreach or presen-tation goals. At times, the divide between an out-reach visualization, and one that is intended to help as-tronomers to gain deeper understanding of their mod-
21http://www.vistrails.org/index.php/MainPage
els and observerations, is very narrow. Cases in pointare the highly realistic renderings of the Orion nebu-lae (Emmart et al. 2000), emission nebulae, and plan-etary nebulae (Magnor et al. 2004), which we describebelow, and the previous discussion of AMR visualiza-tions starting with Kahler et al. (2002) (section 2.3).
In 2000, within the SIGGRAPH 2000 electronictheatre, a team from the San Diego SupercomputingCenter (SDSC) presented a volume rendering videoanimation for the Orion nebula (Emmart et al. 2000).Nadeau et al. (2001) and Genetti (2002) described thiswork in more detail, including their use of a volumescene graph (Nadeau 2000). They reported a set oflimitation in the available volume rendering applica-tions/libraries, including a lack of efficient parallel per-spective volume rendering, forcing them to build a cus-tomized parallel perspective viewing model, and theneed for high voxel resolution to capture all details overa wide range of length scales (from proplyds withinthe central region of the nebula, with a scale of 0.007light years, to the outskirts of the nebula at 14.3 lightyears). Additionally, to achieve a sufficient level ofphotorealism with regards to the glowing gas in thenebula, existing treatment of transparency as the in-verse of the opacity did not work - it was necessaryto modify the modelling and rendering tools to allowindependent values for transparency and opacity.
Realistic planetary nebula models were created us-ing constrained inverse volume rendering by Magnor et al.(2004). As a purely emissive model (i.e. glowing gas),the fast, texture-based volume rendering technqiue ofCabral et al. (1994) was found to be an appropriate vi-sualization solution. The goal of this work was to cre-ate realistic looking planetary nebula, enabling mod-els to be fitted to three observed systems with bipolarsymmetry. Magnor et al. (2005) implemented a solu-tion to the more complex case of generating interactivevolume renderings of 3D models with dust (e.g. reflec-tion nebulae) by using GPU-based ray-casting. A scat-tering depth is assigned to each voxel of the nebulae,and these are accumulated along the view-dependentline-of-sight. The code was able to handle multiple il-luminating stars along with multiple scattering events.
Computer techniques have greatly simplified theprocess of creating custom animations. Starting withsegments like Where the Galaxies Are (Geller et al.1992) using data from the CfA redshift surveys, the“galaxy distribution fly-through” has become a stan-dard way to visualize galaxy redshift survey data.
Public outreach visualization often requires the com-bination of disparate data sets and data types – andvisualization packages. For example, the stereoscopicmovie Cosmic Cookery (Holliman et al. 2006), useddata from the 2dF Galaxy Redshift Survey (Colless et al.2001), large-scale structure from the Millennium sim-ulation (Springel et al. 2005), higher-resolution galaxyformation simulations, and conceptual animations tolink between sequences. Packages used for this movieincluded Celestia,22 PartiView, 3dsMax, VolView byKitWare,23 and custom rendering software.
22http://www.shatters.net/celestia23http://www.kitware.com/products/volview.html

www.publish.csiro.au/journals/pasa 13
“Solar Journey”, implemented in VRML and OpenGL,demonstrates components of the solar envirnoment asboth an interactive environment and a short animatedfilm (Hanson et al. 2002). Problems that needed to besolved included registration of multispectral datasets,texture-mapping of objects from Earth-based images,and difficulities with providing a completely accuratespatial model when true spatial information on somefeatures was limited.
While opportunities for further public outreach us-ing 3D visualization exist, the reality is that produc-tions of this nature come at a cost. They are time-consuming to produce, which is not necessarily an in-centive for researchers who are already time poor. Theyusually require access to (sometimes expensive) com-mercial animation packages (e.g. Maya, Lightwave,3DSMax) and experienced animators, both of whichrarely can be justified within research-only budgets.These same animation packages are not designed forthe types of data that astronomers use, so there a needfor significant conversions of datasets to animation-friendly format (e.g. FITS Liberator). Creating flight-paths can be a non-trivial process. Rendering, the pro-cess of creating individual frames that are then broughttogether to form a movie sequence, can take from min-utes to hours per frame, and can require access to asupercomputer or dedicated render farm.
The challenge is to simplify the process of creatingengaging visualisations that can also enhance researchproductivity. That is, visualisation tools that are notjust designed for public presentation, but can also beused in the academic context for conference presenta-tions, research publications, or department/personalweb pages. Astronomers usually do not need (or want)pre-rendered computer animations to analyze their data- real-time, interactive solutions are much more valu-able.
3 Visualization Software
While astronomers have written about their own vi-sualization software, there is no summary of the vari-ety of packages that are available. Leech and Jenness(2005) surveyed visualization software suitable for sub-mm spectral line data, considering user requirementssuch as FITS format, compatability with astronom-ical coordinates, support for mosaicking, display of2D slices and moment maps, and quantitative capa-bilities. 3D rendering functionality was considered “aplus”. They weighed up the pros and cons of AIPS++(McMullin et al. 2004), the Starlink (Draper et al. 2005)Software Collection (specifically the kappa and datacube
packages, which mostly offer visualization tasks via thecommand line), Karma [Gooch (1996) - kviz offers 2Dslicing, while xray is a volume rendering packages],OpenDX24 (a general purpose visualization packagebased on IBM’s Visual Data Explorer), although dataconversion to the OpenDX .dx file format was required,the PDL25 Perl module which supports FITS and NDFformats, and Python using the PyFITS module (Barrett and Bridgman
24http://www.opendx.org25http://pdl.perl.org
2000). The main conclusion of the comparison wasthat “no single software package met all of the userrequirements”, many tools lacked a GUI, there wereopportunities for comparing 3D software across wave-lengths to avoid re-developement, and open-source li-censing was desirable. See Perez (1997) for a relatedcomparison of the issues facing astronomers when choos-ing between custom astronomical software and com-mercial packages for data analysis.
3.1 Custom code
While there has been much effort to date in creat-ing general purpose visualization tools (such as Par-aview26, VisIT27 and AMIRA28), many of these exist-ing software packages are not suitable for astronomydue to:
• limitations with handling specific astronomy dataformats [e.g. FITS or the GADGET-2 file for-mat] which require a data format conversion pro-cess before using these tools [e.g fits2itk29]. Thisdata format conversion disables the direct real-time integration and may imply increase in thedataset size;
• the need for conversion from astronomically mean-ingful units (RA, Dec, redshift) to general units(cm or mm in three-dimensions), which oftenlimits the user to exploring data in a qualitativeform only [see http://am.iic.harvard.edu/UsingSlicerfor an example];
• the high-dynamic range low signal-to-noise do-main in which many observational projects work;and
• the data volumes (billion particle data generatedfor high-resolution cosmological simulations ormany giga-voxels for high resolution spectral cubes).
These issues necessitate the creation of domain-specificapplications, and solving visualization problems thatare unique to astronomy. However, utilizing existingvisualization general purpose libraries is a good start-ing point.
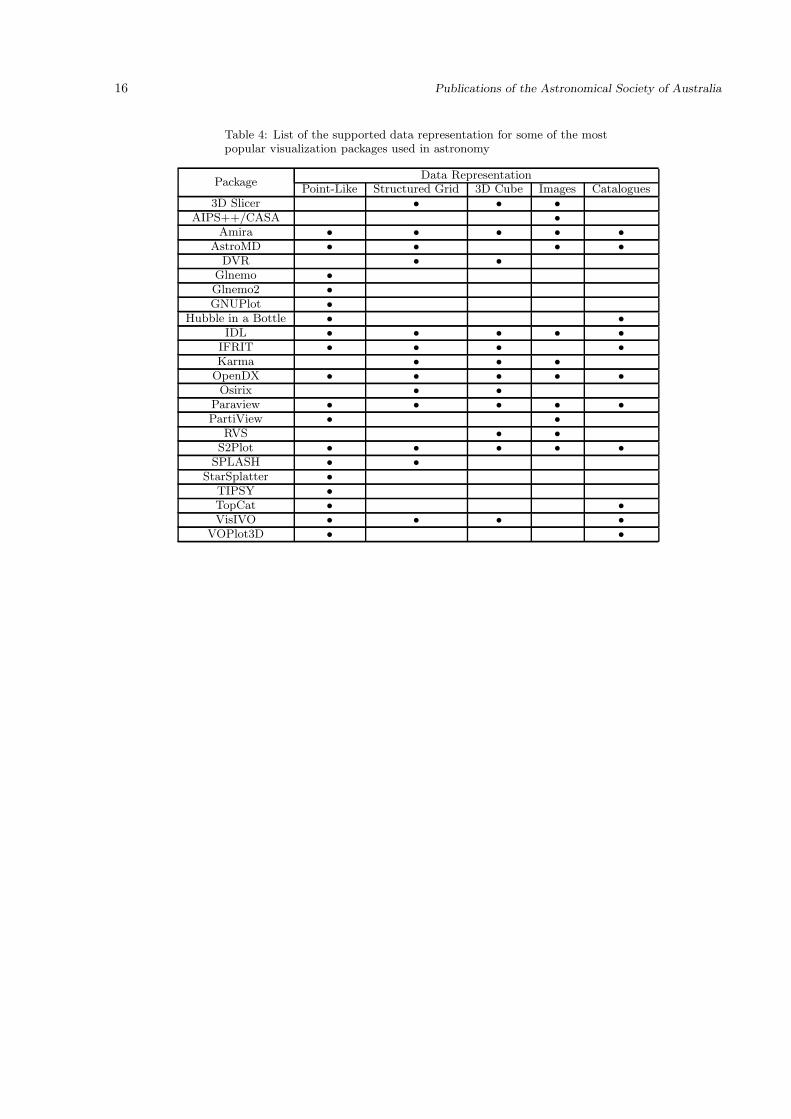
In Table 3 and 4, we provide a list of libraries andpackages aimed at supporting scientific visualization ofastronomical data. This list does not make any claimson completeness or suitability of apackage for a par-ticular dataset. Web links were correct (and live) atthe time of writing. VTK and OpenGL are the mainworkhorses for scientific visualization, providing thebasis for many of the listed tools, however, as pro-gramming and development environments, they havea reasonably steep learning curve, and what may seemlike simple tasks can take some time to code. Theadvantage of a pre-existing visualization package or li-brary (either general purpose or astronomy-focused)is that someone else has dealt with implementation is-sues, which should mean that you can get to a scienceoutcome faster. The down-side is that any pre-existing
26http://www.paraview.org/27https://wci.llnl.gov/codes/visit/28http://www.amira.com/29http://am.iic.harvard.edu/FITS-reader

14 Publications of the Astronomical Society of Australia
package may not be able to do exactly what you requireit to do.

www.publish.csiro.au/journals/pasa 15
Table 3: List of the supported visualization techniques for some of themost popular visualization packages used in astronomy
PackageRendering
Techniques Last Update Website2D 3D
3D Slicer •
Volume Rendering2010 http://www.slicer.org/Isosurface
Label Map
AIPS++/CASA •
Raster2010
http://casa.nrao.edu/2D Contouring
http://www.astron.nl/aips++Vector
Amira • • Most Volume, Surface,Scatter visualization
2010 http://www.amira.com/
AstroMD • •
Scatter Plot2004 http://cosmolab.cineca.it/Isosurface
Volume RenderingDVR • Volume Rendering 2004 Not Available Online
Glnemo • •3D scatter Plot
2009 http://www.oamp.fr/dynamique/jcl/glnemo2D contouring
Glnemo2 • • 3D Scatter Plot 2010 http://bima.astro.umd.edu/nemo/man_html/glne
GNUPlot • • Scatter Plot 2010 http://www.gnuplot.info/
Hubble in a Bottle • Volume Rendering 2007 http://hubble.sourceforge.net/
IDL • • Most Volume, Surface,Scatter visualization
2009 http://www.ittvis.com/ProductServices/IDL.as
IFRIT • •
Volume Rendering
2010 http://sites.google.com/site/ifrithome/Stream TubeIsosurface2D Contouring
Karma • •
Raster2006 http://www.atnf.csiro.au/computing/software/Volume Rendering
2D ContouringOpenDX • • Most Volume, Surface,
Scatter visualization2007 http://www.opendx.org/index2.php
Osirix •Volume Rendering
2010 http://www.osirix-viewer.com/IsoSurface
Paraview • • Most Volume, Surface,Scatter visualization
2010 http://www.paraview.org/
PartiView • • Scatter Plot 2007 http://www.haydenplanetarium.org/universe/pa
RVS •Raster
2005 http://www.atnf.csiro.au/vo/rvs2D Contouring
S2Plot ••
Volume Rendering
2009 http://astronomy.swin.edu.au/s2plot/index.phIsosurfaceVector Map2D Contouring
SPLASH •
Volume Rendering2010 http://users.monash.edu.au/~dprice/splash/Vector Plot
2D contouringStarSplatter • Scatter Plot 2007 http://www.psc.edu/Packages/StarSplatter_Hom
TIPSY •Scatter Plot
2009 http://hpcc.astro.washington.edu/tools/tipsy2D contouring
TopCat • •Scatter Plot
2010 http://www.star.bris.ac.uk/~mbt/topcat/Line/Spherical Plot
VisIVO •
Scatter Plot
2010 http://visivo.oact.inaf.it/index.phpIsosurfaceVolume Rendering2D Contouring
VOPlot3D • •
Scatter Plot2009
http://vo.iucaa.ernet.in/~voi/VOPlot3D_UserGuide_1_0.htm
Surface PlotHistogram
16 Publications of the Astronomical Society of Australia
Table 4: List of the supported data representation for some of the mostpopular visualization packages used in astronomy
PackageData Representation
Point-Like Structured Grid 3D Cube Images Catalogues3D Slicer • • •
AIPS++/CASA •
Amira • • • • •
AstroMD • • • •
DVR • •
Glnemo •
Glnemo2 •
GNUPlot •
Hubble in a Bottle • •
IDL • • • • •
IFRIT • • • •
Karma • • •
OpenDX • • • • •
Osirix • •
Paraview • • • • •
PartiView • •
RVS • •
S2Plot • • • • •
SPLASH • •
StarSplatter •
TIPSY •
TopCat • •
VisIVO • • • •
VOPlot3D • •

www.publish.csiro.au/journals/pasa 17
4 Discussion
In this review of scientific visualization in astronomy,we have attempted to provide an overview of the workthat has been undertaken over the last two decades. Afew key techniques from the broader discipline of scien-tific visualization have been adopted by astronomers,most notably the use of volume rendering and scat-tered point representations, while others are rarely used(in particular, streamlines and vector visualization).Based on our assessment of the literature, we nowconsider some of the key challenges for wider adop-tion and research into relevant scientific visualizationtechniques for astronomy from the viewpoints of visu-alization researchers and astronomers.
4.1 Challenges for Visualization Re-searchers
Although the format of astronomy datasets may befamiliar to people working in scientific visualization,astrophysical datasets have a set of special character-istics that may limit the usability of some more generalvisualization techniques despite them having a muchwider user-base and higher level of technical support.These features can be summarized into the followingpoints:
1. Lack of dominant efficient data representation.Within some astronomy sub-fields, there is nosingle dominant data representation. For exam-ple, N-body simulation data can exists in differ-ent data formats such as the Gadget-2 file for-mat, and custom ASCII or binary formats. Also,there is a lack of standard data representationfor catalogues. Although the introduction of theVOTable format (proposed by the InternationalVirtual Observatory Alliance) represents an at-tempt to unify data in Internet-accessible for-mat, it is not yet widely used. Not only does thisraise interoperability issues but also makes thedevelopment of a generic astronomy visualiza-tion packages either complex or incomplete. Onthe other hand, some current commonly-used as-tronomy data representations (especially FITS)are more oriented toward data archiving ratherthan efficient data accessibility. This limits theapplication’s ability (not only visualization ap-plications) to provide users with fast data load-ing, disables the usage of out-of-core algorithms,and disables the usage of distributed data stor-age. An exception to this is the usage of NCSAhierarchical data form (HDF)30 which permitsparallel I/O and enables distributed data stor-age (Ostriker and Norman 1997).
Different packages solve this problem by using asingle data format for its internal implementa-tion and provide users with an importing func-tionality that converts existing commonly-useddata formats into the internal file format [e.gSanchez (2004); Sanchez et al. (2004); Kissler-Patig et al.(2004); Becciani et al. (2010)]. This may not be
30http://www.hdfgroup.org
an efficient solution for large datasets due to itsstorage and processing requirements.
2. Low signal to noise ratio and high dynamic range.
Data generated from radio/optical telescopes of-ten combines a low signal to noise ratio with alarge dynamic range. This requires special datamanipulation and interpolation schemas, whichmay reduce its effect on the final resultant visualoutput.
3. Use dimensions in a different way. Most of thecurrent visualization algorithms and applicationsare designed to visualize data assigned to 2D/3Dspatial grids (e.g. CFD and medical grids). Grids(if they exist) in astrophysical datasets may con-tain different dimension types (i.e: redshift) incombination with the regular spatial domains.In some cases the dimensional information ismentioned as a type of metadata, so the visual-ization algorithm must first make a correct map-ping between the data axes and the data valuesto be capable to use current known visualizationalgorithms. This also limits the usage of generalpurpose visualization packages in a quantitativemanner.
4. Huge datasets: As noted in the previous sec-tion, data volumes from large-N particle simu-lations and high-resolution spectral data cubesroutinely exceed millions (and often billions) ofdata points. These present problems relatingto the memory and computational demands tohandle such data sizes; the need to support highlevels of interactivity, such as shifting quicklythrough different spatial scales (Brunner et al.2002); or streaming of such data volumes.
4.2 Challenges for Astronomers
Scientific data visualization can, and does, provide op-portunities to support a wide range of existing andplanned astronomy research projects. Through our in-vestigation of the literature, we have determined thefollowing reasons why scientific visualization techniquesmay not have achieved a more widespread usage in as-tronomy:
1. The lack of quantitative tools that integrate seam-
lessly with visualization. This issue was iden-tified by Norris (1994), but little progress hasbeen made to address it. Using annotations andproviding the user with quantitative informationabout their data, combined with the qualita-tive visualization output, is an essential add-onto facilitate the data analysis and explorationtask. Only a few of the published astronomy vi-sualization works show the need for interactiveand quantitative visualization and provide a pro-posed solution for that [e.g. Amati et al. (2003),Ahrens et al. (2006), and Li et al. (2008)].
2. Visualization is not science for the astronomers.The success of an astronomical project is judgedby the science result it produces. The time in-vested by an astronomer in becoming an ex-
18 Publications of the Astronomical Society of Australia
pert in using or developing visualization soft-ware must be balanced against the expected sci-entific gain. It is difficult to justify and ob-tain funding based purely on methodological ap-proaches such as visualization and data min-ing, even if such an approach will demonstrablyimprove the scientific return (Ball and Brunner2009) . We think that this may be the main rea-son why most of the astronomy visualization tri-als neither lasted for a long period nor resultedin a widely used application.
3. Visualization does not do the science. The suc-cessful interpretation of visualization result is upto the scientist. The output may not representa straightforward relationship or pattern. Visu-alization researchers aim to simplify this inter-pretation step, but adding a meaning to the fi-nal visualization output is still the astronomer’stask.
4. Adjustable parameters and technique configura-tion. Selecting a suitable iso-value, a colourmap, or a transfer function is not always directlyrelated to the dataset type or format. Some-times this may require a deep understanding ofboth the data and the visualization technique.The focus of many projects was to visualize acertain object or was with a limited objective.Only a small number of projects were target-ing general datasets or community usage of thesoftware produced [e.g. Becciani et al. (2000),Barnes et al. (2006), and Becciani et al. (2010)].
5. Usability and interoperability. Only the appli-cations with focused visualization functionality,easy to use user interfaces, easy to deploy in-structions, and dedication to a certain data typewere widely used by the astronomical society.Also being a cross platform application is an im-portant consideration for usability.
6. There is a problem in citing the astronomy vi-
sualization effort or application. In preparingthis review, we found it very difficult to deter-mine an approximate number of users for eachpackage. Quite often, astronomy-focused visu-alization software is not supported by an obvi-ous, citable research paper, so there is a missedopportunity for developers to receive tangiblecredit for software that is being used to helpsupport research. In some cases, we suspect thatthe lack of on-going development or support forsome applications may be tied to what is slowlybeing recognized as a wider issue for softwaredevelopers in astronomy (Weiner et al. 2009).
7. Where do scientific visualization papers get pub-
lished? The papers contributing to our reviewcome from a range of astronomy journals, confer-ence proceedings, and non-astronomy journals.The full selection of papers does not appear inADS searching, meaning that astronomers maynot be aware of their existence - particularly ifthe trend of not citing visualization papers con-tinues. Our work serves a purpose in highlight-
ing some of the more important and relevant pa-pers in the field.
4.3 Six Grand Challenges for the Petas-cale Astronomy Era
We assert that visualization has a critical role to playin maximizing the scientific return of astronomical datain the Petascale Astronomy Era. However, to achievethis goal, work is required to overcome the followingchallenges:
1. Support Quantitative Visualization.
To advance astronomy visualization tools from“pretty picture” generating tools into effectiveknowledge discovery tools, astronomers need in-tegrated quantitative support in addition to thecurrently provided qualitative output. Althoughthe current qualitative data views are vital togive astronomers global pictures of their data,and have the potential to play an increased rolein quality control of data (see below), there isa need to extend astronomy visualization toolsto better support “doing” science. The abil-ity to apply different data filters, inspect datapoints/objects for certain properties, overlay ex-ternal catalogues/maps, apply mathematical op-erations, and select different sub-regions for fur-ther study are examples of missing tools. Mostof these tools exist in current two-dimensionaldata analysis and processing packages (such asKarma) but these offer limited support for three-dimensional data.
Although providing such tools may seem easy,large data sizes and low signal-to-noise proper-ties will be a limitation for any effective imple-mentation. Also, interaction with three-dimensionaldata will need a major change to enable effec-tive implementation of such functionality (seebelow).
2. Effective Handling of Large Data Sizes.
Handling petabyte datasets will be a big chal-lenge for most astronomical data analysis pack-ages. Real-time (or near real-time) interactionrequirements worsen the situation for astronomyvisualization. Additionally, storage requirements,networking costs, and transfer speeds will forcemany astronomers to change their way of doingscience.
While most of the development effort now isgoing towards automated data analysis and in-formation extraction systems, it is noteworthythat:
• There is no automated system that reachesa 100% recognition rate. Specifically withthe low signal-to-noise data that is regu-larly used for knowledge discovery, it iscomputationally challenging to achieve ahigh rate of automated pattern recogni-tion.
• Scientific visualization is expected to playan important role as a quality control tool

www.publish.csiro.au/journals/pasa 19
for the output from different automatedtools and data reduction processes. Keep-ing all the raw data for some new astron-omy instruments (e.g ASKAP and MWA)will not be feasible, so the trend will be tooverwrite this data after the data reductionprocess is done. In such cases, the usageof scientific data visualization will be vitalto detect and overcome any defect in thedata gathering and early analysis process.
Hassan et al. (2010) addressed some of these is-sues and provided a solution for visualizing larger-than-memory datasets with the aid of distributedprocessing and GPUs. However, improving dataformats to support distributed storage and par-allel file accessing, extending current data anal-ysis tools to deal effectively with larger-than-memory datasets, and extending/enhancing cur-rent data analysis tools with techniques moresuitable to 3D datasets are still missing steps inthe astronomical data processing pipeline.
3. Discovery in Low Signal-to-noise data.
Effectively dealing with noise is an important as-pect when dealing with astronomy data. Withlarge data sizes, the low signal to noise prop-erties of astronomy datasets limit the usage ofmulti-resolution techniques and out of core method-ologies. On the other hand, new discoveries usu-ally happen near the noise level. Here, visualiza-tion plays a vital role in the absence of effectiveautomated tools. Although noise suppressionand removal is a signal processing problem andmay fall outside the scope of scientific visualiza-tion, advanced usage of colors to enhance com-prehension and the development of customizedtransfer functions and shaders should be a pri-ority for the next generation of astronomy visu-alization tools.
The use of colors in order to enhance compre-hension has received little attention in astron-omy. With the notable exception of Rector et al.(2005, 2007) there has been little work in in-vestigating whether an application of colour sci-ence and visual grammar (such as composition,orientation, etc.) can improve cognition. Thisshould include a detailed investigation of thebenefits and limitations of using different colourmaps and colour contrasts [such as harmoniccolourmaps - Wang and Mueller (2008)]. Someeffort has been made in the use of colour in-formation to produce photorealistic rendering ofsimulation data, such as in the AMR work onfirst stars by Kahler et al. (2006), however, thisis mostly with a public outreach product in mind.In the case of spectral data from a radio tele-scope, there is no such property as “photoreal-ism”, and a pseudo colour map must be used forintensity or fractional polarization.
Also, the use of transfer functions (or color map-ping schemas) to provide astronomers with bet-ter insight into their data and suppressing noisewill boost the effectiveness of visualization us-
age as a qualitative data analyses technique [see(Gooch 1995b,a) for customized transfer func-tions developed for radio astronomy]. There doesnot seem to have been any systematic investi-gation of the use of shaders in astronomy vi-sualization, yet in other application domains,this is one of the main areas of research inter-est [see Sato et al. (1998, 2000), Li et al. (2003),and Correa and Ma (2008) for example].
4. Better Human-Computer Interaction and Ubiq-uitous computing.
The standard computer mouse is well-suited forinteraction with two-dimensional data, but islimited when moving to multi-dimensional data.Immersive VR environments provide alternativeinteraction, often through a “wand”, which givesthe user better control of navigation in a three-dimensional world, but this can require an ex-pensive infrastructure or increased computationalresources to drive. We believe that using rel-atively cheaper game controllers (e.g the Nin-tendo Wii controller), or programmable hand-held interaction devices (specifically the AppleiPad) as tool for exploration and navigation withinadvanced visualization environments, will be abetter and affordable alternative. Such low costand easy-to-use solutions may help to bring ad-vanced interaction to the astronomer’s desktop.Also, using ubiquitous computing methodologiesto make interaction with visualization outputmore accessible and easier for astronomers mayincrease the adoption of 3D visualization [seeGreensky et al. (2008) for example of using suchtechniques in other scientific domains].
5. Better Workflow Integration.
Improved integration between different data anal-ysis and visualization tools will encourage theusage of scientific visualization. A typical ex-ample is providing two-way interaction betweensource finders and 3D visualization tools, wherethe output of the source finder is overlaid onthe visualization output. synthesis between dataanalysis/processing and visualization applicationswill provide the user with better control over,and give more insight into, the data analysis pro-cesses, and potentially speed up the knowledgediscovery process.
Seamless astronomy31, a concept advocated byAlyssa Goodman and colleagues, is an exam-ple which takes workflow issues one step fur-ther [see Goodman (2009) for a discussion on therole of ‘modular craftmanship’ in data visualiza-tion]. Here, complete integration between differ-ent areas of the typical astronomer’s workflow,such as linking searches for astronomical objectswith related research papers, are all wrapped upwithin an interactive desktop environment. Thisis an extension of a service-oriented computingparadigm for astronomers, where the connectiv-ity between applications is more natural. While
31http://research.microsoft.com/en-us/events/ersymposium2009/se
20 Publications of the Astronomical Society of Australia
early experimentation has centred on the World-Wide Telescope32 application, such an approachcould incorporate 3D visualization either throughsupport of remote visualization services, or cross-platform browser-based applications.
6. Encourage adoption of 3D scientific visualiza-
tion techniques.
As we discussed in section 4.2, there has beena somewhat limited effort by the astronomicalcommunity to develop widely-used, general pur-pose, visualization tools targeted at astronomi-cal data. The lack of financial investment, com-pared to other disciplines which are motivatedby both financial and social outcomes, limits theeffort towards a complete astronomy visualiza-tion product with a suitable high level of docu-mentation and support.
Furthermore, there appears to be a social is-sue limiting the usage of current available tools.This may be due to the learning curve requiredto master a particular application, or the per-ceived low level of scientific return from the amountof time invested in using an alternative visual-ization technique. The lack of technical support,easy-to-use tools, and complete documentationcontribute to limiting the amount of users ben-efits from existing tools.
We expect that this may change during the nextdecade with the increasing demand for betterknowledge discovery and data analysis pipelines,capable of dealing with the upcoming data avalanche.Building national/community facilities will pro-vide a solution for that on the short-term. Ex-tending the use of remote-visualization and dataanalysis tools through the web-platform will min-imize the time and effort required to adopt vi-sualization and offers a cost effective solution byminimizing the total cost of ownership and re-duces the need to transfer upcoming huge datasets.
5 Conclusion
We have investigated the state of scientific visualiza-tion research as applied to the domain of astronomy.As with the overall discipline, the use of computer-based scientific visualization in astronomy is still ayoung field. Over the last two decades, the astron-omy community has invested substantially in domain-specific 2D and 3D visualization tools and techniques.For example, “Astronomical Data Analysis Software& Systems” (ADASS) the major international annualastronomy software conference, has hosted more than30 presentations on astronomy data visualization dur-ing this period. However, few research groups haveconcentrated for extended periods of time on improv-ing visualization techniques for astronomy, and conse-quently, the potential for new visualization approachesto improve scientific output in the discipline has notbeen thoroughly explored.
32http://www.worldwidetelescope.org
Scientific visualization is a genuine research tech-nique in its own right and is a fundamental, enablingtechnology for knowledge discovery. Great discover-ies in astronomy are not always related to the pat-terns we already know – it is related to the identi-fication of strange phenomena, unexpected relations,or unknown patterns. These cannot be achieved withan automated tool. There is still much that can belearnt about the process of scientific visualization andits domain specific application in astronomy. With thePetascale Astronomy Era on the horizon, there hasnever been a more pressing need.
Acknowledgments
This research was supported under Australian ResearchCouncil’s Discovery Projects funding scheme (projectnumber DP0665574). We have benefited at variousstages from disussions with David Barnes (Swinburne),and Alyssa Goodman and members of the IIC (Har-vard). We thank Madhura Killedar (University of Syd-ney) for allowing us to visualize her cosmological dataset.Thisresearch has made extensive use of NASA’s Astrophys-ical Data System Bibliographic services.
References
Ahrens, J., Heitmann, K., Habib, S., Ankeny, L., Mc-Cormick, P., Inman, J., Armstrong, R., Ma, K.,2006. Quantitative and comparative visualizationapplied to cosmological simulations. In: Journalof Physics: Conference Series. Vol. 46. Institute ofPhysics Publishing, pp. 526–534.
Amati, G., Di Rico, G., Melotti, M., Ferro, D., Paioro,L., 2003. AstroMD: a 3D visualization and analysistool for astrophysical data. IEEE Transactions onVisualization and Computer Graphics 11 (1).
Arce, H. G., Borkin, M. A., Goodman, A. A., Pineda,J. E., Halle, M. W., Jun. 2010. The COMPLETESurvey of Outflows in Perseus. Astrophysical Jour-nal 715, 1170–1190.
Aschwanden, M., 2010. Image Processing Techniquesand Feature Recognition in Solar Physics. SolarPhysics, 1–41.
Ball, N., Brunner, R., 2009. Data mining and ma-chine learning in astronomy. International Journalof Modern Physics, D 18 (17), 1–53.
Barnes, D., Fluke, C., Bourke, P., Parry, O., 2006. AnAdvanced, Three-Dimensional Plotting Library forAstronomy. Publications of the Astronomical Soci-ety of Australia 23 (2), 82–93.
Barrett, P., Bridgman, W., 2000. PyFITS. a PythonFITS Module. In: Astronomical Data Analysis Soft-ware and Systems IX. Vol. 216. p. 67.
Becciani, U., Antonuccio-Delogu, V., Buonomo, F.,Gheller, C., 2001. An Integrated Procedure for Tree

www.publish.csiro.au/journals/pasa 21
N-body Simulations: FLY and AstroMD. In: As-tronomical Data Analysis Software and Systems X.Vol. 238. p. 503.
Becciani, U., Antonuccio-Delogu, V., Gheller, C.,Calori, L., Buonomo, F., Imboden, S., 2000. As-troMD. A multi-dimensional data analysis toolfor astrophysical simulations. Arxiv preprint astro-ph/0006402.
Becciani, U., Costa, A., Antonuccio-Delogu, V.,Caniglia, G., Comparato, M., Gheller, C., Jin,Z., Krokos, M., Massimino, P., 2010. VisIVO–Integrated Tools and Services for Large-Scale As-trophysical Visualization. Publications of the Astro-nomical Society of the Pacific 122, 119–130.
Beeson, B., Barnes, D., Bourke, P., 2003. Adistributed-data implementation of the perspectiveshear-warp volume rendering algorithm for visuali-sation of large astronomical cubes. Publications ofthe Astronomical Society of Australia 20, 300–313.
Beeson, B., Lancaster, M., Barnes, D., Bourke, P.,Rixon, G., 2004. Visualizing astronomy data usingVRML. In: Proceedings of SPIE. Vol. 5493. pp. 242–253.
Bell, G., Hey, T., Szalay, A., 2009. Beyond the datadeluge. Science 323 (5919), 1297–1298.
Biddiscombe, J., Graham, D., Maruzewski, P., 2007.Interactive visualization and exploration of SPHdata. In: Proceedings of 2nd SPHERIC interna-tional workshop, Madrid (Spain).
Bloomenthal, J., 1994. An implicit surface polygonizer.Graphics gems IV 1, 324–349.
Booth, R., De Blok, W., Jonas, J., Fanaroff, B., 2009.MeerKAT Key Project Science, Specifications, andProposals. Arxiv preprint arXiv:0910.2935.
Borkin, M., Arce, H., Goodman, A., Halle, M., Aug.2008. 3D Visualization and Detection of OutflowsFrom Young Stars. In: R. W. Argyle, P. S. Bunclark,& J. R. Lewis (Ed.), Astronomical Data AnalysisSoftware and Systems XVII. Vol. 394 of Astronom-ical Society of the Pacific Conference Series. p. 145.
Borkin, M., Goodman, A., Halle, M., Alan, D., 2007.Application of Medical Imaging Software to 3DVisualization of Astronomical Data. In: ASTRO-NOMICAL SOCIETY OF THE PACIFIC CON-FERENCE SERIES. Vol. 376. p. 621.
Borkin, M., Ridge, N., Goodman, A., Halle, M., 2005.Demonstration of the applicability of 3D Slicer toAstronomical Data Using 13CO and C18O Obser-vations of IC348. Arxiv preprint astro-ph/0506604.
Borne, K., 2009. Scientific data mining in astronomy.In: Next Generation of Data Mining. CRC Press,Ch. 5, pp. 91–114.
Brodbeck, D., Hellinger, D., Nolthenius, R., Primack,J., Klypin, A., 1998. Visualization of Cold+ Hot andCold Dark Matter Cosmologies versus CfA1 Data.Astrophysical Journal 495, 1.
Brown, R., Wild, W., Cunningham, C., 2004. ALMA-the Atacama large millimeter array. Advances inSpace Research 34 (3), 555–559.
Brugel, E., Domik, G., Ayres, T., 1993. Visualizationtechniques to aid in the analysis of multispectralastrophysical data sets. Colorado University Report.
Brunner, R. J., Djorgovski, S. G., Prince, T. A., Sza-lay, A. S., 2002. Massive datasets in astronomy. In:The Handbook of Massive Datasets. Kluwer Aca-demic Publishers, Ch. 27, pp. 931–979.
Cabral, B., Cam, N., Foran, J., 1994. Accelerated vol-ume rendering and tomographic reconstruction us-ing texture mapping hardware. In: Proceedings ofthe 1994 symposium on Volume visualization. ACM,pp. 91–98.
Colless, M., Dalton, G., Maddox, S., Sutherland, W.,Norberg, P., Cole, S., Bland-Hawthorn, J., Bridges,T., Cannon, R., Collins, C., et al., 2001. The2df galaxy redshift survey: spectra and redshifts.Monthly Notices of the Royal Astronomical Society328 (4), 1039–1063.
Comparato, M., Becciani, U., Costa, A., Larsson, B.,Garilli, B., Gheller, C., Taylor, J., 2007. Visualiza-tion, exploration, and data analysis of complex as-trophysical data. Publications of the AstronomicalSociety of the Pacific 119, 898–913.
Correa, C., Ma, K., 2008. Size-based transfer func-tions: A new volume exploration technique. IEEEtransactions on visualization and computer graph-ics, 1380–1387.
DeFanti, T., Brown, M., McCormick, B., 1989. Vi-sualization: Expanding Scientific and EngineeringResearch Opportunities. COMPUTER,, 12–25.
Djorgovski, S., 2005. Virtual astronomy, informationtechnology, and the new scientific methodology.In: Computer Architecture for Machine Perception,2005. CAMP 2005. Proceedings. Seventh Interna-tional Workshop on. pp. 125–132.
Djorgovski, S., Davis, M., 1987. Fundamental prop-erties of elliptical galaxies. Astrophysical Journal313 (Part 1).
Djorgovski, S., Hut, P., McMillan, S., Vesperini,E., Knop, R., Farr, W., Graham, M., 2009. Ex-ploring the Use of Virtual Worlds as a ScientificResearch Platform: The Meta-Institute for Com-putational Astrophysics (MICA). Arxiv preprintarXiv:0907.3520.
Dolag, K., Reinecke, M., Gheller, C., Imboden, S.,2008. Splotch: visualizing cosmological simulations.New Journal of Physics 10, 125006.

22 Publications of the Astronomical Society of Australia
Domik, G., 1992. Visualization of Multi-dimensionalArrays in Astronomy. In: European Southern Ob-servatory Astrophysics Symposia. Vol. 43. p. 249.
Domik, G., Mickus-Miceli, K., 1992. Software De-sign and Development In a Scientific Environment:Lessons Learned During the Development of STAR,an Astrophysical Analysis and Visualization Pack-age. In: Astronomical Data Analysis Software andSystems I. Vol. 25. p. 95.
Draper, P., Allan, A., Berry, D., Currie, M., Giaretta,D., Rankin, S., Gray, N., Taylor, M., 2005. Star-link Software Developments. In: Astronomical DataAnalysis Software and Systems XIV. Vol. 347. p. 22.
Draper, P., Berry, D., Jenness, T., Economou, F., Cur-rie, M., 2008. GAIA-3D: Volume Visualization ofData-Cubes. In: Astronomical Data Analysis Soft-ware and Systems XVII. Vol. 394. p. 339.
Dubinski, J., 2008. Visualizing astrophysical N-bodysystems. New Journal of Physics 10, 125002.
Emmart, C., Nadeau, D., Genetti, J., Wesselak, E.,2000. Volume Visualization of the Orion Nebula.In: SIGGRAPH 2000 Electronic Theatre, Issue 134.SIGGRAPH.
Farr, W., Hut, P., Ames, J., Johnson, A., 2009. AnExperiment in Using Virtual Worlds for ScientificVisualization of Self-Gravitating Systems. Journalof Virtual Worlds Research 2 (3).
Fluke, C., Barnes, D., Jones, N., 2009. Interchang-ing Interactive 3D Graphics for Astronomy. Publi-cations of the Astronomical Society of Australia 26,37–47.
Fluke, C., Bourke, P., ODonovan, D., 2006. FutureDirections in Astronomy Visualization. Publicationsof the Astronomical Society of Australia 23 (1), 12–24.
Fomalont, E., 1982. Image Display, Processing andAnalysis. In: NRAO/VLA WORKSHOP: SYN-THESIS MAPPING: 1982JUNE21 P. 11, 1982.
Frenkel, K., 1988. The art and science of visualizingdata. Communications of the ACM 31 (2), 121.
Funkhouser, H., 1936. A note on a tenth century graph.Osiris 1, 260–262.
Gallagher, R., 1995. Computer Visualization: graph-ics techniques for scientific and engineering analysis.CRC.
Geller, M., Falco, E., Fabricant, D., Estus, B., 1992.Visualizing the universe. In: Proceedings of the 3rdconference on Visualization’92. IEEE Computer So-ciety Press, pp. 390–397.
Genetti, J., 2002. Volume-rendered galactic anima-tions. Communications of the ACM 45 (11), 66.
Gerstner, T., Pajarola, R., 2000. Topology preservingand controlled topology simplifying multiresolutionisosurface extraction. In: Visualization 2000. Pro-ceedings. pp. 259–266.
Gheller, C., Buonomo, F., Calori, L., Becciani,U., 2002. AstroMD and Cosmo. Lab, visualiz-ing astrophysical data. In: Proceedings of JointEurographics–IEEE TCVG Symposium on Visual-ization. pp. 1–6.
Gheller, C., Melotti, M., Calori, L., Becciani, U.,Ferro, D., 2003. The Cosmo. Lab Project: Develop-ing AstroMD, an Object Oriented, Open Source Vi-sualization and Pre-analysis Tool for AstrophysicalData. In: ASTRONOMICAL SOCIETY OF THEPACIFIC CONFERENCE SERIES. Vol. 295. ASP,pp. 449–452.
Gooch, R., 1995a. Astronomers and their shady algo-rithms. In: IEEE Conference on Visualization, 1995.Visualization’95. Proceedings. pp. 374–377.
Gooch, R., 1995b. Space and the Spaceball. In: Astro-nomical Data Analysis Software and Systems IV.Vol. 77. p. 144.
Gooch, R., 1996. Karma: a Visualization Test-Bed. In:Astronomical Data Analysis Software and SystemsV. Vol. 101. p. 80.
Goodman, A., 2009. Seeing Science. Arxiv preprintarXiv:0911.3349.
Goodman, A. A., Rosolowsky, E. W., Borkin, M. A.,Foster, J. B., Halle, M., Kauffmann, J., Pineda,J. E., Jan. 2009. A role for self-gravity at multi-ple length scales in the process of star formation.Nature 457, 63–66.
Greensky, J., Czech, W., Yuen, D., Knox, M., Damon,M., Chen, S., Kameyama, M., 2008. Ubiquitous in-teractive visualization of 3D mantle convection us-ing a web-portal with Java and Ajax framework.Visual Geosciences 13 (1), 105–115.
Hanson, A., Fu, C., Wernert, E., Frisch, P., 2002. CaseStudy: Constructing the Solar Journey. Preprint.
Hassan, A., Fluke, C., Barnes, D., 2010. InteractiveVisualization of the Largest Radioastronomy Cubes.Arxiv preprint arXiv:1008.0135.
Hockney, R., Eastwood, J., 1988. Computer simulationusing particles. Taylor & Francis.
Holliman, N., Baugh, C., Frenk, C., Jenkins, A.,Froner, B., Hassaine, D., Helly, J., Metcalfe, N.,Okamoto, T., 2006. Cosmic cookery: making astereoscopic 3D animated movie. In: Proceedingsof SPIE. Vol. 6055. p. 605505.
Hopf, M., Ertl, T., 2003. Hierarchical splatting of scat-tered data. In: Proceedings of the 14th IEEE Vi-sualization 2003 (VIS’03). IEEE Computer Society,p. 57.

www.publish.csiro.au/journals/pasa 23
Hopf, M., Luttenberger, M., Ertl, T., 2004. Hierarchi-cal Splatting of Scattered 4D Data (HTML). IEEEComputer Graphics and Applications 24 (4).
Hultquist, C., Perumal, S., Marais, P., Fairall, T.,2003. Large-scale structure in the universe. Tech.Rep. CS03-16-00, Department of Computer Science,University of Cape Town.
Ireland, J., Young, C. A., 2009. Solar Image Analysisand Visualization. Springer.
Ivezic, Z., Tyson, J., Allsman, R., Andrew, J., An-gel, R., Axelrod, T., Barr, J., Becker, A., Becla, J.,Beldica, C., et al., 2008. Lsst: from science driversto reference design and anticipated data products.Arxiv preprint arXiv:0805.2366.
Jin, Z., Krokos, M., Rivi, M., Gheller, C., Dolag, K.,Reinecke, M., april 2010. High-performance astro-physical visualization using Splotch. ArXiv e-prints.
Johnson, C., Hansen, C., 2004. The VisualizationHandbook. Academic Press, Inc. Orlando, FL, USA.
Johnston, S., Taylor, R., Bailes, M., Bartel, N., Baugh,C., Bietenholz, M., Blake, C., Braun, R., Brown, J.,Chatterjee, S., et al., 2008. Science with ASKAP.Experimental Astronomy 22 (3), 151–273.
Kahler, R., Abel, T., Hege, H., 2007. Simultane-ous GPU-assisted raycasting of unstructured pointsets and volumetric grid data. In: Proceedingsof IEEE/EG International Symposium on VolumeGraphics. pp. 49–56.
Kahler, R., Cox, D., Patterson, R., Levy, S., Hege,H. C., Abel, T., 2002. Rendering the first star in theuniverse: a case study. In: VIS ’02: Proceedings ofthe conference on Visualization ’02. IEEE ComputerSociety, Washington, DC, USA, pp. 537–540.
Kahler, R., Hege, H., 2002. Interactive volume render-ing of adaptive mesh refinement data. The VisualComputer 18 (8), 481–492.
Kahler, R., Simon, M., Hege, H., 2003. Interactive vol-ume rendering of large sparse data sets using adap-tive mesh refinement hierarchies. IEEE Transactionson Visualization and Computer Graphics 9 (3), 341–351.
Kahler, R., Wise, J., Abel, T., Hege, H., 2006. GPU-assisted raycasting for cosmological adaptive meshrefinement simulations. In: Eurographics/IEEEVGTC Workshop on Volume Graphics (Boston,Massachusetts, USA, 2006), Eurographics Associa-tion. Citeseer, pp. 103–110.
Kapferer, W., Riser, T., 2008. Visualization needs andtechniques for astrophysical simulations. New Jour-nal of Physics 10, 125008.
Keller, S., Schmidt, B., Bessell, M., Conroy, P.,Francis, P., Granlund, A., Kowald, E., Oates, A.,Martin-Jones, T., Preston, T., et al., 2007. The
SkyMapper telescope and the southern sky survey.Publications of the Astronomical Society of Aus-tralia 24 (1), 1–12.
Kissler-Patig, M., Copin, Y., Ferruit, P., Pecontal-Rousset, A., Roth, M., 2004. The Euro3D data for-mat: A common FITS data format for integral fieldspectrographs. Astronomische Nachrichten 325 (2),159–162.
Klypin, A., Trujillo-Gomez, S., Primack, J., 2010.Halos and galaxies in the standard cosmologicalmodel:results from the bolshoi simulation.
Kobbelt, L., Botsch, M., 2004. A survey of point-based techniques in computer graphics. Computers& Graphics 28 (6), 801–814.
Lacroute, P., Levoy, M., 1994. Fast volume render-ing using a shear-warp factorization of the viewingtransformation. In: Proceedings of the 21st annualconference on Computer graphics and interactivetechniques. ACM, p. 458.
Leech, J., Jenness, T., 2005. A Survey of Softwarefor the Manipulation and Visualization of 3-D Sub-mm Spectral Line Datasets. In: Astronomical DataAnalysis Software and Systems XIV. Vol. 347. p.143.
Li, H., Fu, C., Hanson, A., 2008. Visualizing Multi-wavelength Astrophysical Data. IEEE Transactionson Visualization and Computer Graphics 14 (6),1555–1562.
Li, Q., Sone, S., Doi, K., 2003. Selective enhancementfilters for nodules, vessels, and airway walls in two-and three-dimensional CT scans. Medical Physics30, 2040.
Linsen, L., Long, T., Rosenthal, P., Rosswog, S., 2008.Surface extraction from multi-field particle volumedata using multi-dimensional cluster visualization.IEEE Transactions on Visualization and ComputerGraphics 14 (6), 1483–1490.
Lorensen, W., Cline, H., 1987. Marching cubes: A highresolution 3D surface construction algorithm. In:Proceedings of the 14th annual conference on Com-puter graphics and interactive techniques. ACM, p.169.
Magnor, M., Hildebrand, K., Lintu, A., Hanson, A.,2005. Reflection nebula visualization. IEEE Visual-ization, 2005. VIS 05, 255–262.
Magnor, M., Kindlmann, G., Duric, N., Hansen,C., 2004. Constrained inverse volume rendering forplanetary nebulae. In: IEEE Visualization, 2004.pp. 83–90.
McAllister, D., 2006. Display Technology: Stereo &3D Display Technologies. Encyclopaedia on ImagingScience and Technology, 1327–1344.
24 Publications of the Astronomical Society of Australia
McCormick, B., DeFanti, T., Brown, M., 1987. Visual-ization in Scientific Computing. Computer Graphics21 (6).
McMullin, J., Golap, K., Myers, S., 2004. TheAIPS++ Project. In: Astronomical Data AnalysisSoftware and Systems (ADASS) XIII. Vol. 314. p.468.
Mickus, K., Brugel, E., Domik, G., Ayres, T., 1990a.A Case Study: Multi-Sensor Data Analysis of HHObjects Via STAR: A Scientific Toolkit for Astro-physical Research. In: Bulletin of the American As-tronomical Society. Vol. 22. p. 1259.
Mickus, K., Domik, G., Brugel, E., Ayres, T., 1990b.STAR-A Scientific Toolkit for Astrophysical Re-search. In: Bulletin of the American AstronomicalSociety. Vol. 22. p. 828.
Miller, J., Quammen, C., Fleenor, M., 2006. Interac-tive visualization of intercluster galaxy structures inthe horologium-reticulum supercluster. IEEE Trans-actions on Visualization and Computer Graphics12 (5), 1149–1156.
Montani, C., Scateni, R., Scopigno, R., 1994. A mod-ified look-up table for implicit disambiguation ofmarching cubes. The Visual Computer 10 (6), 353–355.
Murphy, T., Lamb, P., Owen, C., Marquarding, M.,2006. Data Storage, Processing, and Visualizationfor the Australia Telescope Compact Array. Publi-cations of the Astronomical Society of Australia 23,25–32.
Nadeau, D., 2000. Volume scene graphs. In: Proceed-ings of the 2000 IEEE symposium on Volume visu-alization. ACM, pp. 49–56.
Nadeau, D., Genetti, J., Napear, S., Pailthorpe, B.,Emmart, C., Wesselak, E., Davidson, D., 2001. Vi-sualizing stars and emission nebulae. In: ComputerGraphics Forum. Vol. 20. pp. 27–33.
Nakasone, A., Prendinger, H., Holland, S., Miura, K.,Hut, P., Makino, J., 2009. AstroSim: collaborativevisualization of an astrophysics simulation in sec-ond life. IEEE Computer Graphics and Applications29 (5), 69–81.
Navratil, P., Johnson, J., Bromm, V., 2007. Visualiza-tion of cosmological particle-based datasets. IEEEtransactions on visualization and computer graph-ics 13 (6), 1712–1718.
Norman, M., Shalf, J., Levy, S., Daues, G., 1999.Diving deep: data-management and visualizationstrategies foradaptive mesh refinement simulations.Computing in Science & Engineering 1 (4), 36–47.
Norris, R., 1994. The Challenge of Astronomical Visu-alisation. In: Astronomical Data Analysis Softwareand Systems III. Vol. 61. p. 51.
Oosterloo, T., 1995. Visualisation of Radio Data. In:Astronomical socity of Australia PROCEEDINGS.Vol. 12. p. 215.
Oosterloo, T., 1996. Adaptive filtering and masking ofHI data cubes. Vistas in Astronomy 40 (4), 571–577.
Ostriker, J., Norman, M., 1997. Cosmology of theearly universe viewed through the new infrastruc-ture. Communications of the ACM 40 (11), 94.
Palomino, H., 2003. Visualization of 3d numerical sim-ulations in astrophysics using the vr-cube. Master’sthesis, Department of Numerical Analysis and Com-puter Science, Royal Institute of Technology, Stock-holm, Sweden.
Perez, M., 1997. Alternative Astronomical SoftwarePackages. Astrophysics and Space Science 258 (1),271–284.
Pesenson, M., Pesenson, I., McCollum, B., 2010. TheData Big Bang and the Expanding Digital Universe:High-Dimensional, Complex and Massive Data Setsin an Inflationary Epoch. Advances in Astronomy2010, 58.
Plante, R., Rajlich, P., Pietrowitz, S., Xie, W., Qamar,A., 1999. Converging Horizons: Collaborative 2/3DVisualization Tools for Astronomy. In: ASTRO-NOMICAL SOCIETY OF THE PACIFIC CON-FERENCE SERIES. Vol. 172. Astronomical Societyof the pacific, pp. 433–436.
Quinn, P. J., Barnes, D. G., Csabai, I., Cui, C., Gen-ova, F., Hanisch, B., Kembhavi, A., Kim, S. C.,Lawrence, A., Malkov, O., Ohishi, M., Pasian, F.,Schade, D., Voges, W., Sep. 2004. The InternationalVirtual Observatory Alliance: recent technical de-velopments and the road ahead. In: P. J. Quinn &A. Bridger (Ed.), Society of Photo-Optical Instru-mentation Engineers (SPIE) Conference Series. Vol.5493 of Society of Photo-Optical InstrumentationEngineers (SPIE) Conference Series. pp. 137–145.
Rector, T., Levay, Z., Frattare, L., English, J.,Puuohau-Pummill, K., 2005. Philosophy for theCreation of Astronomical Images. In: In IAU Com-mission 55: Communicating Astronomy with thePublic 2005. pp. 194–204.
Rector, T., Levay, Z., Frattare, L., English, J.,Puuohau-Pummill, K., 2007. Image-ProcessingTechniques for the Creation of Presentation-QualityAstronomical Images. The Astronomical Journal133, 598–611.
Rots, A., 1986. Data display: searching for new av-enues in image analysis. In: Synthesis Imaging. pp.231–252.
Rottgering, H., Sep. 2003. LOFAR, a new low fre-quency radio telescope. New Astronomy Review 47,405–409.

www.publish.csiro.au/journals/pasa 25
Sanchez, S., 2004. E3D, the Euro3D visualization toolI: Description of the program and its capabilities.Astronomische Nachrichten 325 (2).
Sanchez, S., Becker, T., Kelz, A., 2004. E3D, theEuro3D visualization tool II: Mosaics, VIMOSdata and large IFUs of the future. AstronomischeNachrichten 325 (2).
Sato, Y., Nakajima, S., Shiraga, N., Atsumi, H.,Yoshida, S., Koller, T., Gerig, G., Kikinis, R., 1998.Three-dimensional multi-scale line filter for segmen-tation and visualization of curvilinear structures inmedical images. Medical Image Analysis 2 (2), 143–168.
Sato, Y., Westin, C., Bhalerao, A., Nakajima, S., Shi-raga, N., Tamura, S., Kikinis, R., 2000. Tissue clas-sification based on 3D local intensity structures forvolume rendering. IEEE Transactions on Visualiza-tion and Computer Graphics 6 (2).
Schroeder, W., Martin, K., Lorensen, B., 2006. AnObject-Oriented Approach To 3D Graphics. Kit-ware.
Shneiderman, B., November 1994. Dynamic queries forvisual information seeking. IEEE Softw. 11, 70–77.
Spence, R., 2001. Information visualization. Addison-Wesley Reading, MA.
Springel, V., 2005. The cosmological simulation codeGADGET-2. Mon. Not. R. Astron. Soc 364, 1105–1134.
Springel, V., 2010. E pur si muove: Galilean-invariantcosmological hydrodynamical simulations on a mov-ing mesh. mnras 401, 791–851.
Springel, V., White, S., Jenkins, A., Frenk, C.,Yoshida, N., Gao, L., Navarro, J., Thacker, R., Cro-ton, D., Helly, J., et al., 2005. Simulations of theformation, evolution and clustering of galaxies andquasars. Nature 435 (7042), 629–636.
Staff, J., Jorgensen, M., Ouyed, R., 2004. JETGET-An analysis and visualization tool for (magneto-)hydrodynamic jet simulations. Arxiv preprint astro-ph/0402121.
Szalay, A., Gray, J., 2001. The world-wide telescope.Science 293 (5537), 2037.
Szalay, A., Gray, J., 2006. 2020 Computing: Science inan exponential world. Nature 440 (7083), 413–414.
Szalay, T., Springel, V., Lemson, G., Nov. 2008. GPU-Based Interactive Visualization of Billion Point Cos-mological Simulations. ArXiv e-prints.
Taylor, J., Boch, T., Comparato, M., Tay-lor, M., Winstanley, N., 2006. PLAS-TICa protocol for desktop application in-teroperability. IVOA Note http://ivoa.net/Documents/latest/PlasticDesktopInterop.html.
Teuben, P., Hut, P., Levy, S., Makino, J., McMillan,S., Zwart, S., Shara, M., Emmart, C., 2001. Im-mersive 4-d interactive visualization of large-scalesimulation. volume 238. Astronomical Society of thePacific, 499.
Van Buren, D., Curtis, P., Nichols, D., Brundage,M., 1995. The AstroVR Collaboratory, An On-line Multi-User Environment for Research in Astro-physics. In: Astronomical Data Analysis Softwareand Systems IV, ASP Conference Series: Astronom-ical Society of the Pacific. Vol. 77. p. 99.
Wang, L., Mueller, K., 2008. Harmonic colormaps forvolume visualization. In: IEEE/EG Symposium onVolume and Point-Based Graphics, 2008.
Weiner, B., Blanton, M., Coil, A., Cooper, M., Dave,R., Hogg, D., Holden, B., Jonsson, P., Kassin,S., Lotz, J., et al., 2009. Astronomical SoftwareWants To Be Free: A Manifesto. Arxiv preprintarXiv:0903.3971.
Welling, J., Derthick, M., 2000. Visualization of largemulti-dimensional datasets. Arxiv preprint astro-ph/0008186.
Williams, R., De Young, D., 2009. The Role of the Vir-tual Observatory in the Next Decade. In: astro2010:The Astronomy and Astrophysics Decadal Survey.Vol. 2010 of ArXiv Astrophysics e-prints.
Wood, Z., Schroder, P., Breen, D., Desbrun, M.,2000. Semi-regular mesh extraction from volumes.In: Proceedings of the conference on Visualiza-tion’00. IEEE Computer Society Press, pp. 275–282.


![H20youryou[2] · 2020. 9. 1. · 65 pdf pdf xml xsd jpgis pdf ( ) pdf ( ) txt pdf jmp2.0 pdf xml xsd jpgis pdf ( ) pdf pdf ( ) pdf ( ) txt pdf pdf jmp2.0 jmp2.0 pdf xml xsd](https://img.dokumen.tips/doc/110x75/60af39aebf2201127e590ef7/h20youryou2-2020-9-1-65-pdf-pdf-xml-xsd-jpgis-pdf-pdf-txt-pdf-jmp20.jpg)