Embed Size (px)
Citation preview

Raine M. D., 2005 1
SECTION A

Section A
Raine M. D., 2005 2
Section A has been submitted to and received by the Australian Journal of Earth
Sciences
Section A
Raine M. D., 2005 3
A REVISED DEFORMATION CHRONOLOGY FOR THE BENDIGO
GOLDFIELD, CENTRAL VICTORIA, AUSTRALIA: THE IMPORTANCE OF
POST D2 DEFORMATION EVENTS
Abstract
The structural evolution of the Bendigo Goldfield, Victoria, Australia, involves four stages of
deformation (D1-D4). D1 is defined by a penetrative foliation (S1) that is parallel to sub-parallel with
bedding (S0), folded around F2 folds and crenulated by an axial planar fabric (S2). D3, as defined in this
study, was previously unrecognised and is characterised by four sets of conjugate kink bands that
overprint and deform F2 and S2. The D3 kink bands possess extensional geometry and are arranged in
orthorhombic symmetry about a sub-vertical axis. It is suggested that the geometry of kilometric-scale D3
kinks could, in part, explain the outcrop pattern observed at Bendigo and more significantly, the domal
culminations that are associated with the localisation of gold. D4 is defined by a non-penetrative, west-
striking foliation (S4) characterised by contractional kink bands. D1 and D2 clearly indicate distinct, yet
progressive phases of ENE-WSW shortening within the one orogeny (Benambran?). D3 could represent
the later stages of the Benambran Orogeny or part of the younger Tabberabberan Orogeny. N-S
shortening during D4 indicates that a rotation of the principal shortening axis has occurred and as such, D4
may correspond to the later stages of the Tabberabberan Orogeny.
Key words: Bendigo Goldfield, central Victorian goldfields, deformation history, kink bands.
INTRODUCTION
The Bendigo Goldfield is the largest goldfield within the Lachlan Fold Belt of eastern
Australia (Figure 1a) and is a classic example of a structurally controlled, turbidite-
hosted gold deposit. Globally, similar deposits occur within the Meguma terrane, Nova
Scotia (Ryan & Smith, 1998), the Otago Schist, New Zealand (Smith et al. 1996) and
the Juneau terrane, Alaska (Goldfarb et al. 1986). This style of deposit is characterised
by multiple phases of deformation and structural overprinting, which can make it
difficult to evaluate in-situ mineralisation.
The structural chronology preserved in the host rock at Bendigo is a contentious issue,
with as many as three stages of deformation being proposed (Forde, 1989; Schaubs &
Wilson, 2002). Early workers (e.g. Stone, 1937; Chace, 1949) make reference to the
possibility that gold deposition may have occurred after the main phase of quartz vein
emplacement. Despite such interpretations, the concept of polyphase deformation at
Bendigo has largely been ignored and may be one of the fundamental reasons why the
Section A
Raine M. D., 2005 4
distribution of gold, particular in three-dimensions, is poorly understood and frequently
reported as being erratic (e.g. Dominy & Johansen, 2004).
Since 1993, Bendigo Mining Ltd. has been re-evaluating and re-developing part of the
goldfield. The new development accesses eight auriferous reefs to a depth of ~800 m
and offers a unique opportunity to re-examine the structurally controlled auriferous
reefs, which characterise the central Victorian goldfields (c.f. Cox et al., 1991a). This
study identifies several tectonic foliations, visible both proximal and distal to the
mineralisation. The presence of multiple foliations, which post-date D2, suggests that
the deformation history is more complex than previously thought. The aim of this paper
is to document post-D2 foliations and produce a revised structural chronology for the
Bendigo Goldfield.
GEOLOGICAL SETTING
The Bendigo Goldfield is located within the state of Victoria, Australia, approximately
130 km northwest of Melbourne (Figure 1a, b). The geology of Victoria is dominated
by the Lachlan Fold Belt (LFB; Figure 1a; Glen, 1992; Gray & Foster, 1998), which
forms part of the Palaeozoic Tasman Fold Belt of eastern Australia (Figure 1a; Ramsay
& VandenBerg, 1986; VandenBerg et al., 2000). Geologically the LFB can be
subdivided into western, central and eastern sub-provinces (Figure 1a; Gray et al.,
1997). The Western Sub-province (WSP; Figure 1a) consists of three fault-defined
structural zones (Stawell, Bendigo and Melbourne; Gray, 2003) and is dominated by a
monotonous succession of deformed and metamorphosed Cambro-Ordovician to
Silurian turbidites. The metasediments are typical of medium-P/T (Barrovian type)
conditions and predominantly exhibit prehnite-pumpellyite facies metamorphism
(Offler et al., 1998). The interzone faults that separate the Stawell, Bendigo and
Melbourne Zones are major strike parallel, west-dipping thrust faults (Gray & Foster,
1998), which have a listric geometry (Gray & Willman, 1991a, b; Gray et al., 1991).
These thrusts probably feed into a detachment at depth, situated either at the Ordovician
Cambrian boundary or deeper within the Cambrian basement (Cox et al., 1991a, b;
Gray et al., 1991; Gray & Willman, 1991a).
The principal style of deformation observed across the WSP has been attributed to a
thin-skinned style of crustal shortening, with the formation of a predominantly east-
vergent, N-S to NW-SE striking, fold and thrust belt (Gray & Willman, 1991a, b, c; Cox

Section A
Raine M. D., 2005 5
et al., 1991b). The total amount of ~E-W shortening attributed to folding, reverse
faulting and cleavage development has been estimated to be in the order of 50 to 70%
for the Stawell Zone and Bendigo Zone (Cox et al., 1991a; Gray & Willman, 1991a, c),
and 30 to 50% for the Melbourne Zone (Gray & Willman, 1991a).
Geochronological research by Foster et al. (1998) demonstrates that metamorphism and
deformation was diachronous from west to east across the WSP, beginning in the Late
Ordovician-Early Silurian (Stawell and Bendigo Zones) through to Late Silurian-Early
Devonian (Melbourne Zone). Foster et al. (1998) conclude that the fold and thrust belt
of the WSP formed as a result of an eastward-migrating deformation front during the
Silurian to Early Devonian, and therefore most orogenic activity actually took place
before the Tabberabberan Orogeny. These findings, which are in general agreement
with others (e.g. Collins & Vernon, 1992; Arne et al., 1998; Ramsay et al., 1998) rule
out a synchronous, province-wide mineralising event and instead suggest that
mineralisation was episodic and associated with both regional metamorphism and the
later stages of deformation.
Structural research carried out within the Western Sub-province, the Eastern Sub-
province and north-eastern Tasmania suggests episodic and progressive deformation
involving substantial ~E-W shortening (e.g. Powell & Rickard, 1985; Wilson & de
Hedouville, 1985; Watchorn & Wilson, 1989; Forde, 1989; Wilson et al., 1992; Powell
& Baillie, 1992; Miller & Gray, 1996; Miller et al., 2001; Schaubs & Wilson, 2002). A
later period of ~N-S shortening is observed across the LFB and overprints the
prominent N-S to NW-SE structural grain (e.g. Powell et al., 1985; Stubley, 1990;
Forde, 1989; Glen, 1992; Wilson et al., 1992; Forde & Bell, 1994; Goscombe, et al.,
1994, Gao et al., 1995; Morand et al., 1997; Miller et al., 2001; Miller & Wilson, 2002,
2004).
Dyke swarms and felsic to intermediate intrusions with S- and I-type affinities were
emplaced during two broad intervals. The first, between 410-390 Ma (Early Devonian)
occurred primarily across the Stawell Zone and western part of the Bendigo Zone,
whilst the second, between 380-360 Ma (Mid to Late Devonian) occurred across the
Bendigo and Melbourne Zones (Foster et al., 1998). A younger period of lamprophyre
dyke emplacement has been dated at 155 Ma (Jurassic) by McDougall & Wellman
(1976).
Section A
Raine M. D., 2005 6
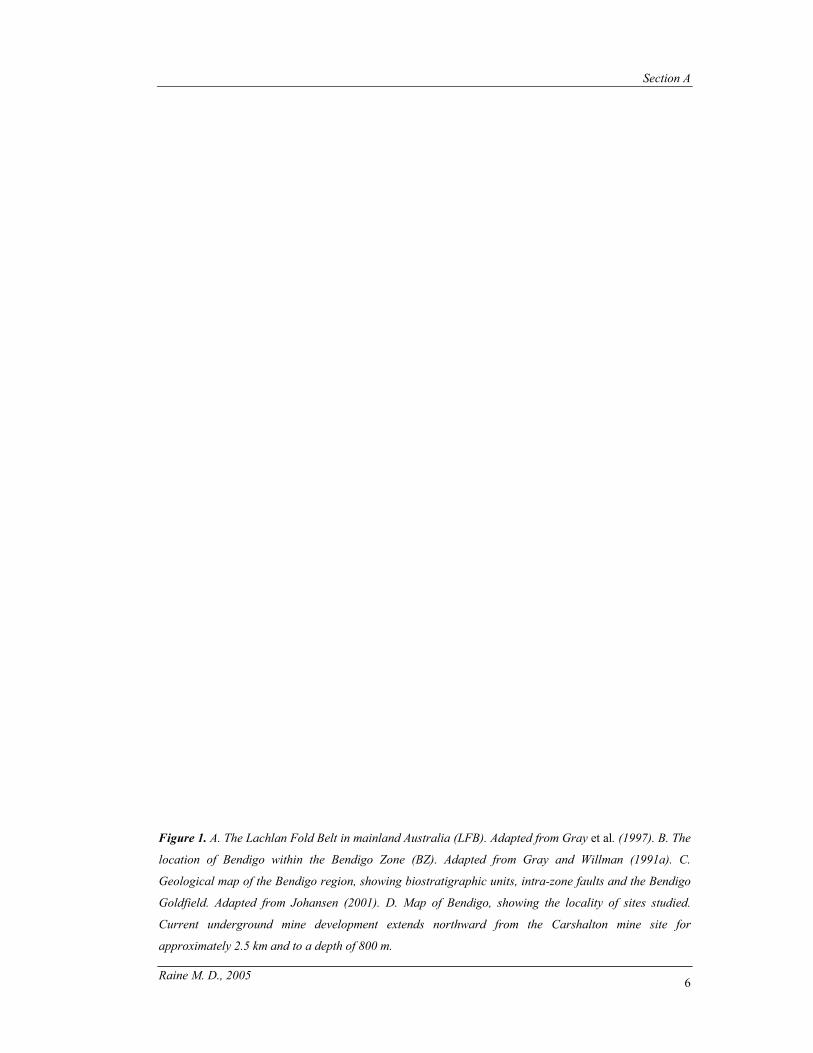
Figure 1. A. The Lachlan Fold Belt in mainland Australia (LFB). Adapted from Gray et al. (1997). B. The
location of Bendigo within the Bendigo Zone (BZ). Adapted from Gray and Willman (1991a). C.
Geological map of the Bendigo region, showing biostratigraphic units, intra-zone faults and the Bendigo
Goldfield. Adapted from Johansen (2001). D. Map of Bendigo, showing the locality of sites studied.
Current underground mine development extends northward from the Carshalton mine site for
approximately 2.5 km and to a depth of 800 m.

Section A
Raine M. D., 2005 7
The Bendigo Goldfield is situated within the Bendigo Zone (BZ; Figure 1b) and lies
within a 9 km wide NNW trending zone of deformed, Lower to Middle Ordovician
turbiditic metasediments bound by the intrazone, west-dipping Whitelaw and Sebastian
thrust faults to the east and west respectively (Figure 1c). The Ordovician
metasediments, which typify the Bendigo region, exhibit rapid and distinct facies
changes and belong to a succession of sandstones, siltstones, shales, thin polymict
conglomerates and minor cone-in-cone limestones known as the Castlemaine
Supergroup (Cas & VandenBerg, 1988). Based on graptolite assemblages found
principally within the shale units, the Castlemaine Supergroup has been subdivided into
six biostratigraphic units (Figure 1c).
The mineralisation at Bendigo (Dunn, 1896; Whitelaw, 1914; Stone, 1937; Chace,
1949; Mckinstry & Ohle, 1949; Thomas, 1953b; Sharpe & MacGeehan, 1990; Cox et
al., 1991a; Willman & Wilkinson, 1992; Jessell et al., 1994; Turnbull & McDermott,
1998; Jia et al., 2000) is intimately related to the structural evolution of the goldfield
(e.g. Forde, 1989; Forde & Bell, 1994; Schaubs and Wilson, 2002; Schaubs & Zhao,
2002). However, the structural chronology preserved within the host rock is contentious
and therefore unclear.
ANALYTICAL PROCEDURES
Samples and thin sections
Approximately 80 orientated, pelitic to semi-pelitic samples were collected from both
on-reef and remote development underground. On surface additional orientated samples
were collected from Victoria Hill; the Carshalton mine site; Diamond Hill and Central
Drive at La Trobe University (Figure 1d). To ascertain the microstructural history
horizontal sections and vertical sections orientated parallel (P section) and normal (N
section) to the S2 foliation (see second deformation stage below) were cut for twelve
samples. Analysis of the thin section suites revealed that similar microstructural
histories were preserved within each of the samples. The correlation of foliations
between different samples was in part ambiguous, due to differences in the relative
intensity of the conjugate S3 foliations (see third deformation stage below). It was
therefore not possible to fully resolve the deformation history using only horizontal, P
and N sections. To overcome this five orientated samples were selected from different

Section A
Raine M. D., 2005 8
locations and suites of up to 15 sections cut for each. The thin section suites included a
horizontal, N and P section and intermediate sections with dips of 20°, 40° and 60° in
the four directions defined by horizontal to N section and horizontal to P section. This
number and orientation of thin sections allowed each sample to be analysed in great
detail from a three-dimensional perspective.
Orientation measurements and estimated errors
The orientation of a foliation (e.g. S1) was measured for each thin section in a suite and
then plotted on a stereonet as a pitch within the plane of that section, unless the section
was horizontal, in which case the orientation was plotted as a bearing. A great circle
was constructed as a best fit through the resultant points in order to define the true
orientation of that foliation.
The total accumulated error in determining the orientation of the kink bands observed in
thin section is estimated as ± 9°. This value consists of errors (± 8°) incurred during the
orientation and preparation of hand specimens and thin sections (Bell et al., 1997), and
a precision error of ± 1° for measurements made from the thin sections.
To ascertain the precision of the orientation measurements 3 thin sections were chosen
and 50 orientation measurements taken for each foliation (S1 to S4). A vector mean
(Mardia, 1972; Fisher, 1993) was calculated for each foliation and then plotted as a
running mean against the number of readings (n = 50). This demonstrated that for a
single foliation within a section it was necessary to take a minimum of 21
measurements in order to achieve a vector mean with a precision of ±1°. The resultant
vector means for a foliation were plotted (as above) and a best-fit great circle
constructed to represent the true orientation of that foliation (e.g. Figure 4b & Figure
6b). This process was carried out for each suite of thin sections.
Vector analysis of F2 axial traces
As part of the third deformation stage (see below) F3 folds are proposed on the basis of
a reinterpretation of the 1:10000 geological maps for the Bendigo Goldfield
(Eaglehawk, Golden Square & Spring Gully sheets; Willman & Wilkinson, 1992). In
order to quantify the presence of these folds vector analysis has been carried out on the
F2 axial traces (see second deformation stage below), which lie within the goldfield.

Section A
Raine M. D., 2005 9
Centre points between the digitised nodes of F2 axial traces (Appendix B, Part 1 & 2)
were generated. The orientation of the line which joined the original nodes was assigned
to the respective centre point. The vector mean (Mardia, 1972; Fisher, 1993) for the F2
axial traces (165°) was calculated from the strike of the centre points.
The precise location and extent of F3 was determined by plotting the data with a dextral
or sinistral rotation of F2 equal to or greater than 9° from 165 ° (Figure 5a, b). The value
of 9° was determined from the analysis of extensional kink bands observed in horizontal
thin sections (Appendix B, Part 3).
STRUCTURAL CHRONOLOGY
Four overprinting tectonic foliations (S1-S4) have been recognised within the Bendigo
Goldfield and a four-stage deformation history (D1-D4) is proposed. The individual
stages of deformation are presented in chronological order, with emphasis placed on D3
and D4.
First deformation stage (D1)
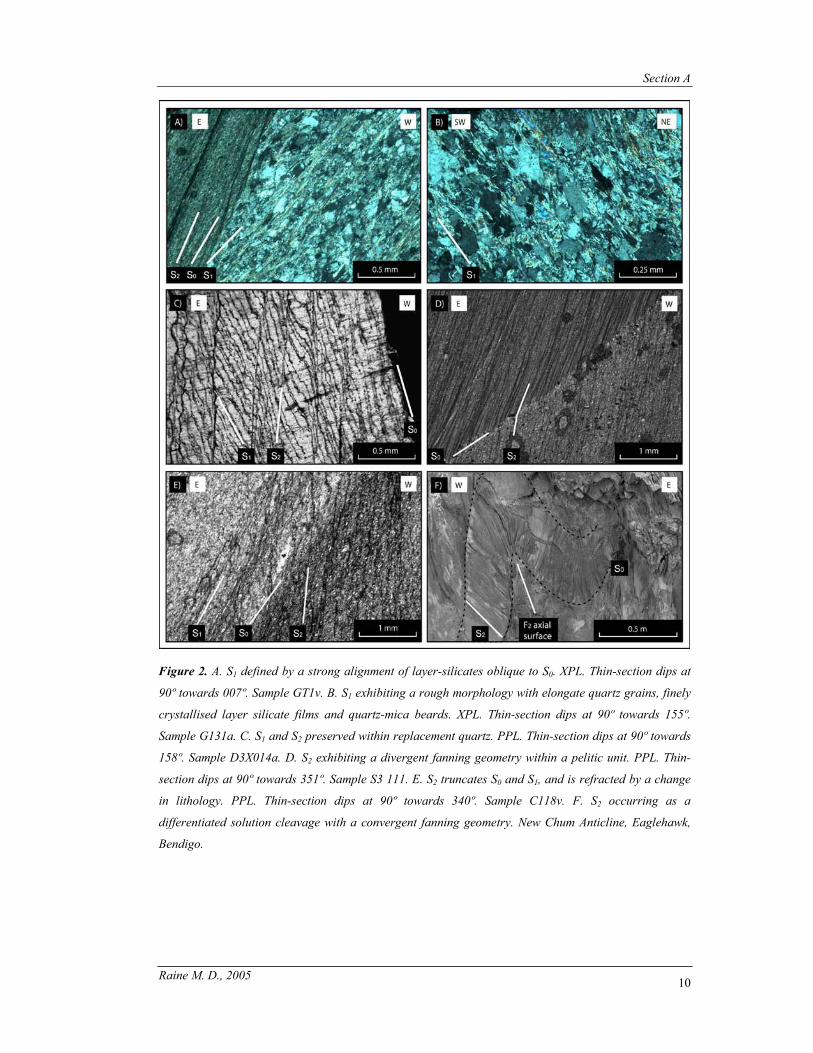
The earliest tectonic foliation recognised by this study (S1) is a penetrative,
mesoscopically visible planar fabric, which is most evident in pelitic and semi-pelitic
rocks. In pelites, S1 is predominantly defined by a strong bedding-parallel to sub-
parallel alignment of layer silicates and opaque minerals, whereas in arenaceous units S1
has a rough morphology, occurring as an elongation of quartz grains with finely
crystallised layer silicate films and fibrous quartz-mica beards (Figure 2a, b). In several
sections S1 is oblique to bedding, the best examples of which can be seen when S1
refracts slightly as it passes from a pelitic to an arenaceous unit (Figure 2a). A relic
foliation corresponding to S1 can be observed within a number of quartz veins (Figure
2c).
Section A
Raine M. D., 2005 10
Figure 2. A. S1 defined by a strong alignment of layer-silicates oblique to S0. XPL. Thin-section dips at
90º towards 007º. Sample GT1v. B. S1 exhibiting a rough morphology with elongate quartz grains, finely
crystallised layer silicate films and quartz-mica beards. XPL. Thin-section dips at 90º towards 155º.
Sample G131a. C. S1 and S2 preserved within replacement quartz. PPL. Thin-section dips at 90º towards
158º. Sample D3X014a. D. S2 exhibiting a divergent fanning geometry within a pelitic unit. PPL. Thin-
section dips at 90º towards 351º. Sample S3 111. E. S2 truncates S0 and S1, and is refracted by a change
in lithology. PPL. Thin-section dips at 90º towards 340º. Sample C118v. F. S2 occurring as a
differentiated solution cleavage with a convergent fanning geometry. New Chum Anticline, Eaglehawk,
Bendigo.

Section A
Raine M. D., 2005 11
The first phase of deformation resulted in the initiation of the regionally extensive ~N-S
striking thrust belt, with the development of first and second order faults. Interzone
faults such as the Avoca and Heathcote faults (Figure 1b) are examples of first order
faults, whereas intrazone faults such as the Whitelaw and Sebastian faults (Figure 1c)
are examples of second order faults. At Bendigo ~1500 m of vertical displacement has
been associated with the intrazone Whitelaw fault as indicated by biostratigraphic
zonation, which showed the juxtaposition of Lancefieldian and Darriwilian rocks
(Harris, 1934).
Bedding-parallel, laminated quartz veins (LQVs; Dunn, 1896; Chace, 1949; McKinstry
& Ohle, 1949; Forde, 1989; Jessell et al., 1994; Fowler, 1996) observed at Bendigo also
formed early in the deformation history. The LQVs predate D2 because they are
deformed by S2 and folded around F2, with parasitic folding present within a number of
F2 hinges (see Plate 14 in Willman & Wilkinson, 1992; Gray & Willman, 1991c). The
laminated veins formed predominantly by replacement (McKinstry & Ohle, 1949;
Chace, 1949; Forde, 1989) during a period of layer-parallel shearing (D1).
Second Deformation Stage (D2)
The most intense foliation recognised by this study (S2) is a well-developed, axial
planar crenulation cleavage (Figure 2d, e, f). In pelitic units S2 is a closely spaced,
penetrative cleavage that occurs as a slaty cleavage with a divergent fanning geometry
in higher strain zones (Figure 2d). S2 in pelites is characterised by a differentiated
layering of layer silicate rich domains and quartz rich domains. In arenaceous units S2 is
best developed within F2 hinge zones, where it occurs as a spaced, differentiated
solution cleavage with a convergent fanning geometry (Figure 2f).
First order D2 folds consist of regional anticlinoria and synclinoria with wavelengths of
3-15 km and amplitudes in the order of 1-2 km (Thomas, 1939; Gray & Willman,
1991a, c). At Bendigo, second order folds (here referred to as F2) are tight, essentially
upright chevron folds characterised by their regular frequency and persistence along
strike. F2 exhibit average wavelengths of between 300 to 400 m, amplitudes of between
150 to 300 m and interlimb angles of between 20° and 50° (Willman & Wilkinson,
1992; Johansen, 2001). Localised changes in F2 fold plunge, with plunges of up to 60°
observed (Dunn, 1896; Whitelaw, 1914), occur across the Bendigo Goldfield and give
rise to smaller scale dome and basin structures (e.g. Stone, 1937).

Section A
Raine M. D., 2005 12
At least three orders of faults were active across the WSP during D2. First and second
order faults include the Heathcote fault and Whitelaw fault respectively (Gray &
Willman, 1991c), whereas deposit scale reverse faults represent the third order of faults.
At Bendigo third order D2 faults display geometries that are influenced by folding
(Figure 3). In places the faults truncate F2 and S2, which implies that they formed during
the later stages of fold amplification and tightening. The third order faults were active
during D2 quartz veining with subsequent reactivation occurring during D3 and D4.
The majority of the quartz veining observed at Bendigo was emplaced during the latter
part of D2. Quartz bodies occur in the simplified form of: (1) saddle, trough and leg
reefs; (2) neck reefs; (3) fault reefs; (4) spur reefs; (5) laminated veins; (6) breccia
veins; and (7) cross-course reefs (see Forde, 1989; Sharpe & MacGeehan, 1990; Cox et
al., 1991a, 1995; Johansen, 2001; Schaubs & Wilson, 2002; and references therein).
The D2 reefs and veins have been reactivated by later phase(s) of deformation and
crosscut by later vein generations.
Figure 3. A simplified geometry for third order D2 faults. The D2 faults become discordant once they pass
through the fold axial surface. At this point the faults commonly flatten slightly and bifurcate, before
rejoining and returning to a bedding-parallel orientation on the limb of an adjacent F2 fold.
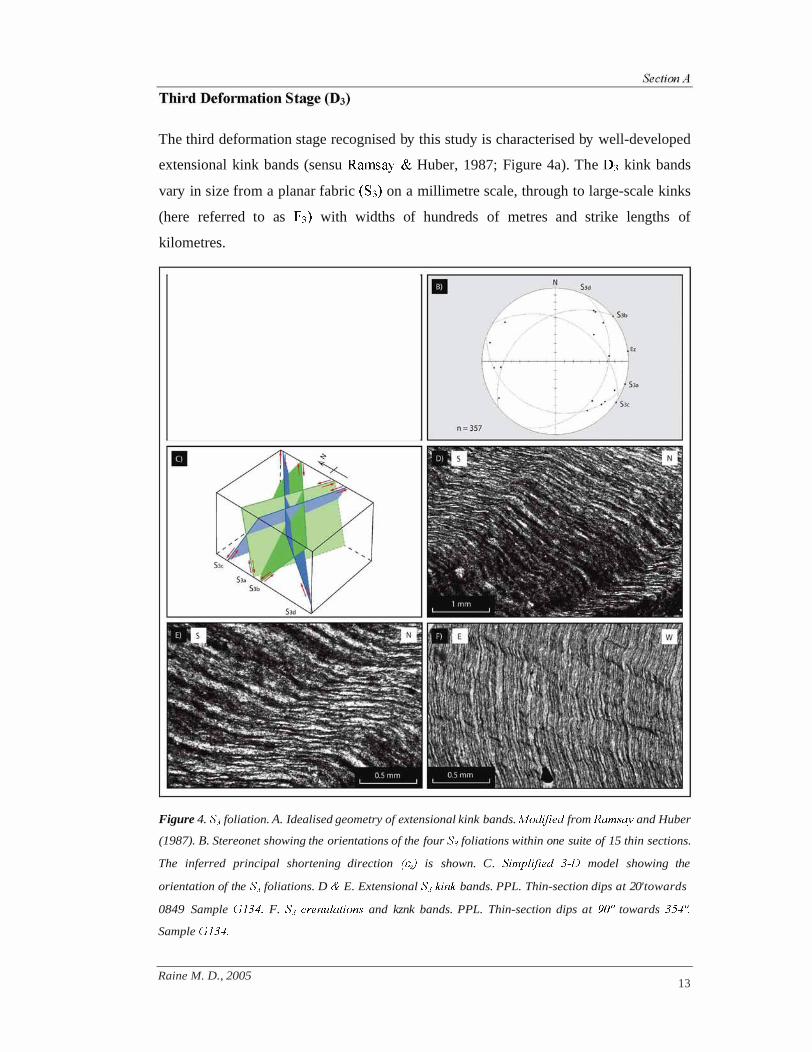
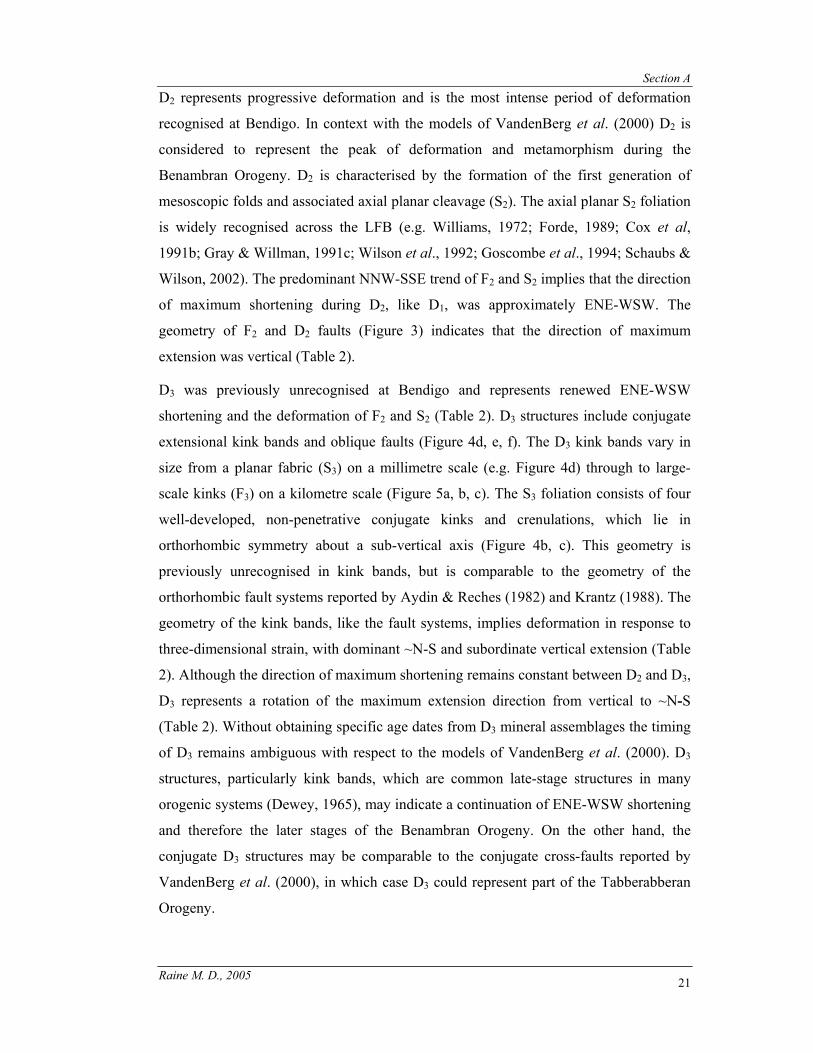
The third deformation stage recognised by this study is characterised by well-developed
extensional kink bands (sensu Ramsay & Huber, 1987; Figure 4a). The D3 kink bands
vary in size from a planar fabric (S3) on a millimetre scale, through to large-scale kinks
(here referred to as F3) with widths of hundreds of metres and strike lengths of
kilometres.
Figure 4. S3 foliation. A. Idealised geometry of extensional kink bands. ModzJied from Ramsay and Huber
(1987). B. Stereonet showing the orientations of the four S3 foliations within one suite of 15 thin sections.
The inferred principal shortening direction (EJ is shown. C. SimplzJied 3-0 model showing the
orientation of the S3 foliations. D & E. Extensional S3 kznk bands. PPL. Thin-section dips at 20 'towards
0849 Sample G134. F. S3 crenulations and kznk bands. PPL. Thin-section dips at 90' towards 3549
Sample G134.
Raine M. D., 2005 13

Section A
Raine M. D., 2005 14
S3 consists of four coeval sets of well-developed, non-penetrative kinks and
crenulations that deform S2 and lie in orthorhombic symmetry about a sub-vertical axis
(Figure 4b, c). In thin section the conjugate kink bands are generally characterised by
slightly rounded hinges, planar to curved limbs and planar axial surfaces (Figure 4d, e,
f). The mean orientations of the kink band axial surfaces and their respective shear
senses are presented in Table 1. The D3 principal shortening direction for the kink bands
trends ~081° (Figure 4b) and was determined using the conjugate bisector method of
Ramsay (1962).
Table 1. Mean orientations for D3 kink band axial surfaces and respective shear senses.
Foliation Strike Dip Shear sense
S3a WNW 50-55° Sinistral
S3b NE 60-65° Dextral
S3c ESE 50-55° Sinistral
S3d SW 55-60° Dextral
Thin section analysis and the identification of L23 intersection lineations has shown that
S3 is present throughout the goldfield and current mine development, occurring not only
in close proximity to mineralisation but also on F2 limbs, well away from the influence
of structures such as faults.
Distinct changes in F2 plunge and the strike of S0, S1 and S2 define the F3 kink band
axial surfaces (Figure 5a, b, c). The plunge of F2 within F3 is variable, with plunges in
excess of 30° observed in a number of localities. Perpendicular to the strike of F3,
changes in S3 intensity are often rapid, defining zones of high strain within F3. External
to F3, S3 is weak and rarely observed. High strain zones vary in width from a few metres
up to tens of metres, however, their full extent along strike and down dip remains
unclear due to a lack of continuous exposure.

Section A
Raine M. D
., 2005 15
Figure 5. A. Plot of centre points where each point represents a dextral rotation in the strike of F2 equal to or greater than 9° from the vector mean (165°). B. Plot
of centre points where each point represents a sinistral rotation in the strike of F2 equal to or greater than 9° from the vector mean (165°). C. F2 axial traces within
the Bendigo Goldfield. Large-scale uniform rotations (F3) in the strike of F2 are highlighted in grey and were deduced form the reinterpretation of geological maps
and vector analysis. The general plunge direction of F2 within F3 is shown (see Figure 7). The subtle nature of the kinks is due primarily to the oblique intersection
of F3 with the current topography. Stereonets show the plunge and plunge direction of L23 intersections from three localities within the goldfield. These localities
are up to ~5km apart and highlight the goldfield extent of S3.

Section A
Raine M. D., 2005 16
D3 faults
Progressive E-W shortening during D3 produced oblique faults, which crosscut the
prominent NNW-SSE structural trend. Within the goldfield such faults have been
termed “crosscourses” (Stone, 1937; Chace, 1949). Gray & Willman (1991c) and
Willman & Wilkinson (1992) identify two sets of conjugate oblique faults, the first
trends WNW (110°-125°) and has a sinistral horizontal separation, whilst the second set
trends NNE (010°-035°) and has a dextral horizontal separation. A principal shortening
direction trending 4°/250° is proposed for the conjugate faults by Gray & Willman
(1991c) and Willman & Wilkinson (1992). The orientation of the oblique faults is
comparable to the D3 kink bands. Figure 9 in Willman & Wilkinson (1992) shows two
strike parallel oblique faults with opposing dip directions, the same geometry displayed
by S3b and S3d (Figure 4b, c). Ruptured kink band axial surfaces are commonly observed
in thin section, which may suggest that on a larger scale D3 faults developed along F3
axial surfaces.
Fourth Deformation Stage (D4)
The fourth deformation stage recognised by this study is characterised by well-
developed contractional kink bands (sensu Ramsay & Huber, 1987; Figure 6a, b). D4
kinks vary in size from a planar fabric (S4; Figure 6c, d, e) through to larger scale kinks
(here referred to as F4) with widths of up to a metre and strike lengths of tens of metres
(Figure 6f). The S4 foliation consists of non-penetrative crenulations and kink bands,
which deform S3 (Figure 6c). D4 kink bands are best developed in pelitic to semi-pelitic
sequences and generally display rounded hinges, curved limbs and planar axial surfaces
(Figure 6c, d, e). Kinks are not observed within arenite-dominated sequences, which
suggests that the more competent units prevented the nucleation and propagation of
kink bands. The D4 kinks have a dextral shear sense and axial surfaces that dip at ~52°
towards ~180° (e.g. Figure 6b). Based on the geometry of the kink bands the principal
shortening direction during D4 was ~N-S and the principal extension direction ~E-W.

Section A
Figure 6. S4 foliation. A. Idealised geometry of contractional hnk bands. ModzJied from Ramsay and
Huber (1987). B. Stereonet showing the orientation of the S4 foliation within one suite of thin sections. C.
Small-scale contractional hnk bands (S4) deforming S2 (sub-vertical) and S3 (sub-horizontal). PPL. Thin-
section dips at 90' towards 174'. Sample G134. D. Small-scale contractional hnk band that deforms S2
(sub-vertical) and exhibits a complex internal structure. PPL. Thin-section dips at 90' towards 174'.
Sample G134. E. A well-developed small-scale contractional hnk band that deforms S2 (sub-vertical) and
exhibits slightly rounded hinge zones. PPL. Thin-section dips at 90' towards 354'. Sample G134. F.
THIS IMAGE HAS BEEN REMOVED DUE TO COPYRIGHT RESTRICTIONS
Metre-scale contractional kink band p4). Upper axial surface has ruptured with quartz veining present in
zones of dilation.
rn N
/
i I S4
n = 84
Raine M. D., 2005 17
Section A
Raine M. D., 2005 18
D4 faults?
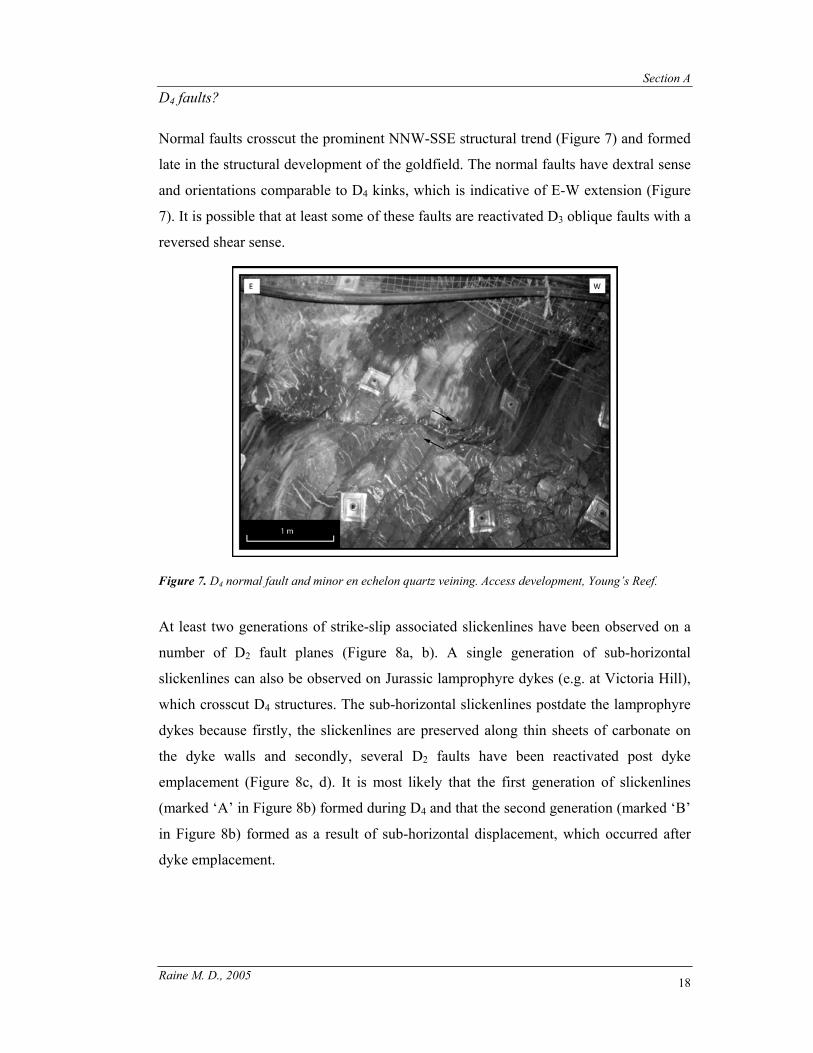
Normal faults crosscut the prominent NNW-SSE structural trend (Figure 7) and formed
late in the structural development of the goldfield. The normal faults have dextral sense
and orientations comparable to D4 kinks, which is indicative of E-W extension (Figure
7). It is possible that at least some of these faults are reactivated D3 oblique faults with a
reversed shear sense.
Figure 7. D4 normal fault and minor en echelon quartz veining. Access development, Young’s Reef.
At least two generations of strike-slip associated slickenlines have been observed on a
number of D2 fault planes (Figure 8a, b). A single generation of sub-horizontal
slickenlines can also be observed on Jurassic lamprophyre dykes (e.g. at Victoria Hill),
which crosscut D4 structures. The sub-horizontal slickenlines postdate the lamprophyre
dykes because firstly, the slickenlines are preserved along thin sheets of carbonate on
the dyke walls and secondly, several D2 faults have been reactivated post dyke
emplacement (Figure 8c, d). It is most likely that the first generation of slickenlines
(marked ‘A’ in Figure 8b) formed during D4 and that the second generation (marked ‘B’
in Figure 8b) formed as a result of sub-horizontal displacement, which occurred after
dyke emplacement.

Section A
THIS IMAGE HAS BEEN REMOVED DUE TO COPYRIGHT RESTRICTIONS
Figure 8. A. View to the north of a fault controlled aurzferous reeJ Visible gold indicated by pink dots.
Late stage strike-slip reactivation of the hangingwall fault plane has truncated gold bearing structures
(e.g. stylolites). Photograph courtesy of Bendigo Mining Ltd. B. Stereonet showing the orientation of
slickenlines associated with late-stage strike-slip reactivation of the fault. The sub-horizontal slickenlines
(marked 'B ') are the younger. The sense on both sets of slickenlines is east side up and sinistral. C & D.
View to the south of a Dz fault reactivatedpost dyke emplacement, sense of movement is hangingwall to
the south-southwest. Upper S3 ReeJ; Sheepshead anticline.
DISCUSSION
Dl signifies the onset of -E-W shortening (Table 2) and possibly the beginning of the
Benambran Orogeny (VandenBerg et al., 2000). At Bendigo Dl involved the initial
formation of the Sebastian and Whitelaw thrust faults and the development of a bedding
parallel to sub-parallel tectonic foliation (Sl). The S1 foliation recognised by this study
is considered to be equivalent to the bedding-parallel fabrics of Williams, (1972) and
Cox et al., (1991b), the S1/2 cleavage of Powell, (1983), the S* cleavages of Powell &
Rickard, (1985) and Wilson & de Hedouville, (1985), the S1 cleavages of Forde, (1989),
Wilson et al., (1992) and Forde & Bell, (1994) and the So cleavage of Schaubs &
Wilson, (2002). Although numerous authors have recognised the presence of an early
Raine M. D., 2005 19

Section A
Raine M. D., 2005 20
fabric within the LFB, the origin of this fabric is subject to debate. The S1 foliation
observed within the Bendigo Goldfield clearly truncates bedding in a number of thin
sections. In agreement with Wilson & de Hedouville, (1985), Wilson et al., (1992),
Forde & Bell (1994), S1 is considered to have formed in response to an early phase of
layer-parallel shearing, thrust faulting and low grade metamorphism, which occurred
prior to the development of the first mesoscopic folds (F2).
Table 2. Summary of the four-stage deformation chronology proposed for the Bendigo Goldfield.
Deformation stage
Principal extension directions (ε1>ε2>ε3)
Primary structures
D4
Contractional kink bands
Normal faults & shear zones
D3
Conjugate extensional kink bands
Oblique faults
D2
Mesoscopic chevron folds
Axial planar crenulation cleavage
Deposit scale reverse faults
Major quartz reefs
D1
Inter- & intra-zone thrust faults
Sub-horizontal tectonic foliation
Laminated quartz veins (LQVs)
ε3
ε2
ε1
ε3
ε2
ε1
ε3
ε1
ε2
ε1
ε3
ε2
E N Vertical
E N Vertical
E N Vertical
E N Vertical
Section A
Raine M. D., 2005 21
D2 represents progressive deformation and is the most intense period of deformation
recognised at Bendigo. In context with the models of VandenBerg et al. (2000) D2 is
considered to represent the peak of deformation and metamorphism during the
Benambran Orogeny. D2 is characterised by the formation of the first generation of
mesoscopic folds and associated axial planar cleavage (S2). The axial planar S2 foliation
is widely recognised across the LFB (e.g. Williams, 1972; Forde, 1989; Cox et al,
1991b; Gray & Willman, 1991c; Wilson et al., 1992; Goscombe et al., 1994; Schaubs &
Wilson, 2002). The predominant NNW-SSE trend of F2 and S2 implies that the direction
of maximum shortening during D2, like D1, was approximately ENE-WSW. The
geometry of F2 and D2 faults (Figure 3) indicates that the direction of maximum
extension was vertical (Table 2).
D3 was previously unrecognised at Bendigo and represents renewed ENE-WSW
shortening and the deformation of F2 and S2 (Table 2). D3 structures include conjugate
extensional kink bands and oblique faults (Figure 4d, e, f). The D3 kink bands vary in
size from a planar fabric (S3) on a millimetre scale (e.g. Figure 4d) through to large-
scale kinks (F3) on a kilometre scale (Figure 5a, b, c). The S3 foliation consists of four
well-developed, non-penetrative conjugate kinks and crenulations, which lie in
orthorhombic symmetry about a sub-vertical axis (Figure 4b, c). This geometry is
previously unrecognised in kink bands, but is comparable to the geometry of the
orthorhombic fault systems reported by Aydin & Reches (1982) and Krantz (1988). The
geometry of the kink bands, like the fault systems, implies deformation in response to
three-dimensional strain, with dominant ~N-S and subordinate vertical extension (Table
2). Although the direction of maximum shortening remains constant between D2 and D3,
D3 represents a rotation of the maximum extension direction from vertical to ~N-S
(Table 2). Without obtaining specific age dates from D3 mineral assemblages the timing
of D3 remains ambiguous with respect to the models of VandenBerg et al. (2000). D3
structures, particularly kink bands, which are common late-stage structures in many
orogenic systems (Dewey, 1965), may indicate a continuation of ENE-WSW shortening
and therefore the later stages of the Benambran Orogeny. On the other hand, the
conjugate D3 structures may be comparable to the conjugate cross-faults reported by
VandenBerg et al. (2000), in which case D3 could represent part of the Tabberabberan
Orogeny.

Section A
Raine M. D., 2005 22
Distinct changes in F2 plunge and strike are due to the presence of F3 (Figure 5c).
Previous explanations for changes in F2 plunge included heterogeneous strain during D2
(Stone, 1937) and transpressional shortening during a later phase of deformation (Forde,
1989). Because of the persistence of F2 along strike and the anisotropic nature of the
sedimentary succession, it is likely that some subtle changes in F2 plunge are related to
heterogeneous strain during D2. However, the more significant changes in F2 plunge
coincide with a significant change in strike. Simultaneous changes in the strike and
plunge of F2 form well defined zones, which delineate F3 (Figure 5a, b, c).
Transpressional shortening as proposed by Forde (1989) could not have caused these
changes in F2 plunge because the zones defined by a change in plunge and strike (F3)
imply N-S extension not shortening.
It is reported that domal culminations on individual anticlines align obliquely to the
strike of F2 (e.g. Figure 2 in Stone, 1937) and that the most economically significant
mineralisation was usually encountered on the north-plunging side of the culminations
(Whitelaw, 1914; Stone, 1937; Chace, 1949; Thomas, 1953b). The orientation and
geometry of F3 corresponds to the alignment of domal culminations across the goldfield.
This is an important observation for two reasons. Firstly the recognition of F3 gives a
new explanation for the observed outcrop pattern at Bendigo, and secondly, the
presence of F3 may explain why historically the most economically significant
mineralisation was encountered on the north plunging side of the culminations. The
largest recognised F3 fold (Figure 5b, c) is situated at the centre of the goldfield and has
axial surfaces that dip towards the north. If the historical literature is correct, it is
feasible that the D3 kinks have had an influence on the localisation of gold at Bendigo.
Deformation associated with D4 implies ~N-S shortening and that a rotation of the
principal shortening axis has occurred (Table 2). The S4 foliation is a non-penetrative,
west striking foliation characterised by crenulations and well-developed contractional
kink bands (e.g. Figure 6e). D4 kinks vary in size from a planar fabric (S4) on a
millimetre scale, through to metre scale kinks (F4; Figure 6f).
A comparable period of ~N-S shortening has been recognised at Bendigo, Ballarat, St.
Arnaud and Inglewood by Forde, (1989) and at Stawell by Wilson et al., (1992); Miller
et al., (2001); Miller & Wilson, (2002, 2004). At the Nagambie gold deposit (Gao et al.,
1995), which is located in the north-eastern part of the Melbourne Zone, auriferous
mineralisation is associated with east-west orientated folds and faults. It is suggested by

Section A
Raine M. D., 2005 23
Gao et al. (1995) that these structures are related to a north-south shortening event,
thought to have occurred during the Late Devonian. Morand et al., (1997) suggest that a
weak northwest trending cleavage exists throughout much of the Melbourne Zone and is
related to a northeast-southwest compressional event that may represent the latest stages
of the Tabberabberan Orogeny (c.f. Gray and Mortimer, 1996). Gray & Willman
(1991c) relate two overprinting crenulation cleavages to the strike-slip reactivation of
the Heathcote Fault Zone, with initial dextral movement followed by a weaker sinistral
movement. It is suggested that the dextral movement is associated with the
Tabberabberan Orogeny and that the later sinistral movement might possibly relate to
the Middle Carboniferous Kanimblan Orogeny (Gray & Willman, 1991c). VandenBerg
et al. (2000) recognise that the eastern part of the Bendigo Zone has been affected by a
period of north-south shortening late in the Tabberabberan Orogeny. Dextral movement
along the Heathcote Fault Zone and other smaller faults, the formation of east- and
northeast-trending megakinks (e.g. the Tooborac Megakink) and the existence of a
second-generation northwest trending cleavage are related to this north-south shortening
event (VandenBerg et al., 2000).
It is evident that widespread north-south shortening affected the Melbourne Zone and
eastern part of the Bendigo Zone during the later stages of the Tabberabberan Orogeny.
The northwest trending foliations recognised by Gray & Willman (1991c), Morand et
al., (1997) and VandenBerg et al. (2000) may be comparable to the S4 foliation
recognised by this study.
Work carried out along the east coast of Victoria and NSW, and across northeast
Tasmania has also recognised contractional kink bands, which postdate D2 and have
geometries comparable to the D4 kinks observed at Bendigo (e.g. Powell et al., 1985;
Stubley, 1990; Goscombe, et al., 1994). Powell et al. (1985) hypothesises that kinking
involved a continent-wide stress field and that the shortening experienced in the eastern
LFB was related to the N-S shortening in central Australia during the Carboniferous
Alice Springs Orogeny. If this is the case, then despite their similarities it is likely that
the kink bands observed in the Eastern Sub-province post-date those observed at
Bendigo.
A second episode of ~N-S shortening, that postdates both D4 and Jurassic dyke
emplacement has been recognised at Bendigo for the first time (Figure 8c, d). Because
the extent of the deformation remains unclear and no associated tectonic foliation has

Section A
Raine M. D., 2005 24
been recognised, this phase of deformation is not interpreted as a period of regional
deformation. However, this period of N-S shortening is of great economic significance
to the goldfield because the late-stage reactivation of faults has in places, resulted in the
truncation of potentially economic mineralisation (Figure 8a, b).
The similarities between this study and Forde (1989) suggest that the S1-S4 foliations
recognised at Bendigo may also be present at Inglewood, St. Arnaud and Ballarat
(Figure 1b), and that the structural development of the Bendigo Goldfield is similar to
other Victorian goldfields. The structural setting of the Bendigo Goldfield may also be
comparable to other turbidite-hosted gold deposits outside of the WSP. For example, at
the Caribou deposit, Nova Scotia, a significant amount of gold is associated with ‘late-
stage secondary flexures’, which have kink band geometry (Ryan & Smith, 1998).
CONCLUSIONS
1. This work, which builds on that of others, documents four overprinting tectonic
foliations (S1-S4) and proposes a revised four-stage deformation chronology (D1-
D4) for the Bendigo Goldfield. The third phase of deformation (D3) was
previously unrecognised and may have significant implications for the
localisation of gold at Bendigo.
2. The principal shortening direction during D1, D2 and D3 was sub-horizontal and
orientated along an ENE-WSW axis. The S1 and S2 foliations indicate separate,
yet progressive phases of deformation within the one orogeny (Benambran?).
Without specific age dating the timing of S3 remains ambiguous because the
foliation could represent the later stages of the Benambran Orogeny or part of
the younger Tabberabberan Orogeny. The fourth foliation (S4) indicates that a
significant re-orientation of the principal shortening axis has occurred and as
such, D4 may correspond to the later stages of the Tabberabberan Orogeny.
3. The kink bands have an extensional geometry and are arranged in orthorhombic
symmetry about a sub-vertical axis. The D3 kinks are interpreted as having
formed in response to three-dimensional strain, with dominant N-S and
subordinate vertical extension.

Raine M. D., 2005 25
SECTION B

Section B
Raine M. D., 2005 26
THE THREE-DIMENSIONAL GEOMETRY AND KINEMATICS OF KINK
BANDS WITHIN THE BENDIGO GOLDFIELD, VICTORIA, AUSTRALIA
Abstract
Analysis of the deformation chronology preserved within the host rock at Bendigo, Victoria, Australia has
revealed that both extensional and contractional kink bands occur throughout the goldfield. The oldest
generation of kink bands, which formed during D3, consist of four sets of conjugate extensional kink
bands, of which two sets have sinistral sense and two sets dextral sense. The four sets have an
approximately orthorhombic symmetry about a sub-vertical axis. The sinistral kink bands are typically
larger and more numerous than the dextral kink bands, and also exhibit slightly larger α and ψ angles,
which implies that the principal shortening direction was not normal to the anisotropy exploited during
kinking (φ = ~88°). It is suggested that the extensional kink bands formed within a triaxial strain field and
that the principal shortening direction was sub-horizontal and orientated ENE.
On a goldfield-scale vector analysis of F2 axial traces has identified kilometre-scale dextral and sinistral
kinks, which exhibit extensional geometry. The orientation and simplified geometric parameters of the
kilometre-scale kinks are comparable to the millimetre-scale extensional kink bands observed in thin
section. The kilometre-scale kinks are therefore interpreted as having formed within the same strain field
as the mm-scale extensional kink bands, with an inferred principal shortening direction of 072°. It is
proposed that kilometre-scale kinks are significant to the outcrop pattern observed at Bendigo and the
three-dimensional architecture of the goldfield.
Small-scale (mm-scale) contractional kink bands post-date the D3 extensional kink bands. Both sinistral
and dextral contractional kink bands have been observed. However these sets are not conjugate.
Contractional kink bands have a strong spatial affiliation with extensional kink bands, which appear to
have acted as loci for the nucleation of the younger contractional kinks. The geometric parameters of the
contractional kink bands agree with the relationships derived from bulk pure shear experiments performed
on anisotropic media. The geometry of sinistral contractional kink bands indicates a principal shortening
direction of 010°, whilst the geometry of the dextral contractional kink bands indicates a principal
shortening direction of 335°. Geometrical differences between sinistral and dextral contractional kinks
suggest that they may have formed in response to two separate periods of deformation (D4 & D5?).
Key words: Bendigo Goldfield, orthorhombic kink bands, contractional and extensional kink bands.
Section B
Raine M. D., 2005 27
INTRODUCTION
Kink bands are common structures in foliated rocks and typically occur late in the
structural evolution of an orogenic system (e.g. Anderson, 1968; Dewey, 1965; Fyson,
1968; Ramsay, 1962; Powell et al., 1985; Stubley, 1990; Goscombe et al., 1994). In
addition to the studies of naturally occurring kink bands, experiments involving the
deformation of various anisotropic mediums have been undertaken in order to
investigate the nucleation and growth of contractional kink bands (e.g. Paterson &
Weiss, 1966; Donath, 1968; Weiss, 1968; Cobbold et al., 1971; Anderson, 1974; Gay &
Weiss, 1974; Weiss, 1980). Although the analysis of experimental data has advanced
understanding of kinking mechanisms, comparisons between the geometric properties
of naturally occurring and experimentally derived kink bands frequently reveal
inconsistencies (e.g. Anderson, 1968; Cudahy, 1986; Stubley, 1990; Kirschner &
Teixell, 1996). There are two main discrepancies reported in the literature; the first is
between the stress-strain relationships derived experimentally (e.g. Gay & Weiss, 1974)
and those inferred from natural kink band systems (e.g. Anderson, 1968; Cudahy, 1986;
Stubley, 1990), whilst the second relates to kink band geometry. Several studies of
naturally occurring kink bands report geometries that differ significantly from those
derived experimentally (e.g. Stubley, 1990; Kirschner & Teixell, 1996). In such cases
no single experimental/theoretical model can explain the development of the naturally
occurring kink band system.
This contribution investigates the three-dimensional geometry of mm-scale extensional
and contractional kink bands observed at Bendigo, Victoria, Australia. The geometric
properties of the contractional kink bands are compared to those derived
experimentally. Two-dimensional geometric parameters are presented for D3 kilometre-
scale kinks and a comparison is made with the mm-scale D3 kink bands observed in thin
section.
GEOLOGICAL SETTING
Regional geology
The Bendigo Goldfield is situated within the Western Subprovince (WSP; Gray et al.,
1997) of the Lachlan Fold Belt (LFB; Glen, 1992; Gray & Foster, 1998, 2004; Foster &
Gray, 2000; VandenBerg et al., 2000; Gray et al., 2002), approximately 130 km

Section B
Raine M. D., 2005 28
northwest of Melbourne, Victoria, Australia (Figure 1a, b, c). The geology of the WSP
is dominated by a monotonous succession of deformed and metamorphosed Cambro-
Ordovician to Silurian turbidites (Cas & VandenBerg, 1988; Gray & Foster, 2000;
VandenBerg et al., 2000; Fergusson, 2003). The metasediments are characteristic of
medium-P/T (Barrovian type) conditions and predominantly exhibit prehnite-
pumpellyite facies metamorphism (Offler et al., 1998). The principal style of
deformation observed across the WSP has been attributed to a thin-skinned style of
crustal shortening, with the formation of a predominantly east-vergent, N-S to NW-SE
striking, fold and thrust belt (Gray & Willman, 1991a, b, c; Gray et al., 1991; Cox et al.,
1991b; Foster & Gray, 2000; Gray & Foster, 2000, 2004). The major thrust faults within
the WSP define three structural zones, the Melbourne Zone, Bendigo Zone and Stawell
Zone (Figure 1b; Gray, 2003).
Geochronological research (Arne et al., 1998; Foster et al., 1998; Bierlein et al., 2001b,
c) demonstrates that metamorphism and deformation was diachronous from west to east
across the WSP, beginning in the Late Ordovician-Early Silurian (Stawell and Bendigo
Zones) through to the Middle Devonian (Melbourne Zone). Foster et al. (1998) Bierlein
et al. (2001b, c) conclude that the fold and thrust belt of the WSP formed as a result of
an eastward-migrating deformation front during the Late Ordovician to Middle
Devonian. These findings, which are in general agreement with others (e.g. Collins &
Vernon, 1992; Arne et al., 1998; Ramsay et al., 1998) rule out a synchronous, province-
wide mineralising event and instead suggest that gold mineralisation was episodic and
associated with both regional metamorphism and the later stages of deformation
(Bierlein et al., 2002).
Dyke swarms and felsic to intermediate intrusions with S- and I-type affinities were
emplaced during two broad intervals. The first, during the Late Silurian to Early
Devonian (~415-395 Ma), occurred primarily across the Stawell Zone and south-
western, western and north-central parts of the Bendigo Zone, whereas the second
affected the entire Melbourne Zone, most of the Bendigo Zone and the eastern part of
the Stawell Zone during the Middle to Late Devonian (~385-365 Ma; Richards &
Singleton, 1981; Foster et al., 1998; Bierlein et al., 2001b, c, d). A younger generation
of lamprophyre dykes has been dated at 155 Ma (Jurassic) by McDougall & Wellman
(1976).

Section B
Raine M. D., 2005 29
Figure 1. A. The Lachlan Fold Belt in mainland Australia (LFB). Adapted from Gray et al. (1997). B.
Subprovinces within the LFB and the location of the Stawell, Bendigo and Melbourne structural zones.
Adapted from Gray et al. (1997). C. The location of Bendigo within the Bendigo Zone (BZ). Adapted from
Gray and Willman (1991a).

Section B
Raine M. D., 2005 30
Bendigo geology
The Bendigo Goldfield is located within the Bendigo Zone (BZ; Gray, 2003; Figure 1b,
c) where it lies within a 9 km wide NNW trending zone of deformed, Lower to Middle
Ordovician turbiditic metasediments bound by the intrazone, west-dipping Whitelaw
and Sebastian thrust faults to the east and west respectively (Figure 2). The Ordovician
metasediments, which typify the Bendigo region, exhibit rapid and distinct facies
changes and belong to a succession of sandstones, siltstones, shales, thin polymict
conglomerates and minor cone-in-cone limestones known as the Castlemaine
Supergroup (Cas & VandenBerg, 1988; Willman &Wilkinson, 1992).
Figure 2. Geological map of the Bendigo region, showing biostratigraphic units, intra-zone faults and
the Bendigo Goldfield. Adapted from Johansen (2001).
The structural evolution of the Bendigo Goldfield has been a contentious issue, with as
many as three periods of deformation proposed (c.f. Forde, 1991; Schaubs & Wilson,
2002). Section A reinvestigated the structural development of the goldfield and
proposed a four-stage deformation chronology (D1-D4), based primarily on the
recognition of four overprinting tectonic foliations (S1-S4).

Section B
Raine M. D., 2005 31
The first deformation stage (D1) represents the on set of ~ENE-WSW shortening
(Benambran Orogeny, ca. 439-435 Ma; VandenBerg et al., 2000) and the development
of a regionally extensive, N-S to NW-SE trending thrust belt. The morphology,
orientation and relative timing of S1 implies that it formed in response to an early period
of layer-parallel shearing, thrust faulting and low grade metamorphism, which occurred
prior to the development of F2 (Forde, 1989, 1991; Wilson et al., 1992; Schaubs &
Wilson, 2002; Section A).
The second deformation stage (D2) represents progressive ~ENE-WSW shortening and
peak deformation and metamorphism during the Benambran Orogeny. D2 is
characterised by the first generation of mesoscopic folds (F2) and a well-developed axial
planar, differentiated crenulation cleavage (S2; Forde, 1989, 1991; Cox et al, 1991b;
Schaubs & Wilson, 2002; Section A), which bestows a strong mechanical anisotropy on
the meta-sedimentary succession. A significant episode of quartz veining occurred
during the latter part of D2 with mineralising fluids exploiting the active folds and faults
(e.g. Cox et al., 1991a; Schaubs & Wilson, 2002).
The third deformation stage (D3) was first recognised in Section A and represents a
period of renewed ENE-WSW shortening and the deformation of F2 and S2. The
principal structures associated with D3 are conjugate extensional kink bands and
crenulations. The size of D3 kink bands varies greatly, with small-scale kinks observed
on a millimetre scale (S3) and large-scale kinks at a kilometre scale (F3). The timing of
D3 is ambiguous and may represent the later stages of the Benambran Orogeny or part
of the younger Tabberabberan Orogeny (ca. 381-377 Ma; see VandenBerg et al., 2000).
The fourth deformation stage (D4) represents a period of ~N-S shortening (Forde, 1989;
Forde & Bell, 1994; Section A), which may correspond to the later stages of the
Tabberabberan Orogeny. S4 is a non-penetrative, west-striking foliation characterised by
well-developed contractional kink bands. D4 kink bands vary in size from a planar
fabric (S4) on a millimetre scale, through to metre scale kinks (F4).

Section B
Raine M. D., 2005 32
ANALYTICAL PROCEDURE
In order to investigate the microstructures and microstructural history preserved within
the host rocks at Bendigo, approximately 80 orientated pelitic to semi-pelitic samples
were collected from exposure both at surface and underground. Suites consisting of
fifteen thin sections were cut for 4 samples (C102, G131, G134 & S3109) and included
horizontal, N and P sections, and intermediate sections with dips of 20°, 40° and 60°
(see Figure 3a, b). The suites of thin sections made it possible to investigate the three
dimensional geometry of mm-scale D3 and D4 kink bands.
During this investigation only thin sections containing three or more clearly defined
kink bands of the same set (e.g. S3a) were utilised. The geometric properties of the
small-scale kink bands (Figure 4a, b) were determined by measuring the bearing or
pitch of the kink band axial planes and the internal and external foliations for each thin
section within a suite (Appendix C, Part 2). The resultant cumulative data was plotted
on lower-hemisphere, equal-area stereonets and great circles constructed to define the
orientation of the kink band axial planes, internal foliation and external foliation for
each set of kink bands (S3a, b, c, d & S4) within that sample (Figure 5a, b, c). These
parameters subsequently allowed the orientation of the fold hinge and the geometric
parameters shown in Figure 4a, b to be measured as shown in Figure 5d.
The total error in determining α, β and ψ angles from thin section is estimated to be ±
9°. This value consists of errors (± 8°) incurred during the orientation and preparation of
hand specimens and thin sections (Bell et al., 1997), and a precision error of ± 1° for
measurements made from the thin sections. All two-dimensional directional data
presented in this contribution has been analysed in the circular scheme (Mardia, 1972;
Fisher, 1993) and vector means calculated where necessary.

Section B
Raine M. D., 2005 33
Figure 3. A. Schematic showing the orientation of 14 thin sections from the suite produced for sample
G134. Kink band geometries and relationships have been simplified for clarity. B. Three-dimensional
representation of a number of thin sections from the suite produced for sample G134.

Section B
Raine M. D., 2005 34
Figure 4. A. Idealised geometry and
geometric parameters for conjugate
‘contractional’ kink bands. B.
Idealised geometry and geometric
parameters for conjugate ‘extensional’
kink bands. Adapted from Ramsay &
Huber (1987).
Symbol definitions: The orientation of
the kink band axial surface (Kas) with
respect to the external foliation (Ke) is
defined by the angle α. The orientation
of the internal foliation (Ki) with
respect to the kink band axial surface
is defined by β. For contractional kink
bands α + β < 180°, whereas for
extensional kink bands α + β > 180°.
The angle through which the internal
foliation has been rotated by the kink
band is defined by ψ. The orientation
of the principal shortening direction
(εZ) with respect to the external
foliation is defined by φ.
A
B

Section B
Raine M. D., 2005 35
Figure 5. Determination of kink band
geometry (sample G134). A dashed great circle
represents the orientation of a thin section,
whereas a black square represents the vector
mean orientation of a set of kink bands within
that section. The circles which encompass a
black square defines the ±9° error associated
with the vector mean.
A. The solid great circle represents the vector
mean orientation of S3b axial surfaces (Kas). B.
The solid great circle represents the vector
mean orientation of the internal foliation (Ki).
C. The solid great circle represents the vector
mean orientation of the external foliation (Ke).
D. Lower-hemisphere equal-area stereonet
showing the orientation of Ki, Ke and Kas.
From this stereonet the fold hinge and
geometric properties (α, β, ψ) can be
measured for S3b.
α
β
ψ
Kas
Ki
Ke
Ki Ke
Kas

Section B
Raine M. D., 2005 36
SMALL-SCALE D3 KINK BANDS
General features
In thin section D3 kink bands possess monoclinic extensional geometry (sensu Ramsay
& Huber, 1987; Figure 4b) and record local layer-parallel extension primarily along S2.
Although S2 is generally the most intense foliation at Bendigo, local-scale variability in
the relative intensity and morphology of S1 and S2 means that S1 may be locally
important. The foliation exploited during kinking has therefore been termed the
‘dominant anisotropy’. Extensional kink bands (Figure 6a, b, c) are characterised by
angular to slightly rounded hinges, planar limbs and planar to curviplanar axial surfaces,
which bifurcate in a few instances.
Figure 6. A. Extensional kink bands that deform S2/S1. PPL. Thin-section dips at 20° towards 084°.
Sample G134. B. Compound kink (Donath, 1968) that deforms S2/S1. PPL. Thin-section dips at 20°
towards 084°. Sample G134. C. Lenticular morphology of a small extensional kink band (outlined by
white dashed line). Below the lenticular kink band, another kink appears to bifurcate. The foliation
deformed by kinking is S2. PPL. Thin-section dips at 90° towards 354°. Sample G134. D. Deformation of
an extensional kink band (labelled ‘A’) due to the development of flanking structures. PPL. Thin-section
dips at 90° towards 354°. Sample G134.
A

Section B
Raine M. D., 2005 37
The internal structure of the kink bands is relatively simple in the majority of cases,
with only subtle variations in the parallelism and planarity of the internal foliation.
Complex internal structures are uncommon but when observed, result from either the
presence of parasitic kinks and crenulations or the occurrence of two or more kink
bands in close proximity. In the case of the latter these complex structures may be a
form of compound kink (Donath, 1968; Figure 6b). Parasitic kink bands and
crenulations are entirely contained within the host kink band. They are orientated
parallel to sub-parallel with the host kink band and always exhibit the same sense.
Extensional kink bands are best developed in pelitic units and in a few instances exhibit
a near “ideal” geometry (Weiss, 1980).
Small-scale extensional kink bands predominantly exhibit a lenticular morphology and
terminations defined by a low angle convergence of the axial surfaces (Figure 6c). It is
not uncommon for the small-scale kink bands to terminate abruptly against a horizon
defined by a marked increase in competency. For example, small-scale kink bands are
not observed crossing into or within arenaceous units, suggesting that the more
competent units have prevented the propagation and nucleation of small-scale kink
bands. Abrupt terminations are also observed where kink bands have intersected quartz
veins, carbonate veins or large sulphide grains. Due to the development of flanking
structure (Passchier, 2001; Grasemann & Stüwe, 2001) the geometry of small-scale kink
bands can become distorted proximal to some veinlets (Figure 6d).
Associated with the extensional kink bands are four distinct types of veinlet:
1. Quartz veinlets with a rectangular or rhombic geometry (Figure 7a). The
formation of conjugate extensional kink bands and associated N-S extension has
in places resulted in foliation boudinage (e.g. Cobbold et al., 1971; Platt &
Vissers, 1980). The resultant dilation associated with boudin necks has been
exploited by this type of quartz veining.
2. Quartz veinlets that constitute the entire internal portion of a kink band (Figure
7b). These veinlets overprint and preserve the rotated internal foliation, which
implies that they formed sometime after the initial development of the kink
band. Sharp vein margins define the kink band axial planes and it is suggested
that the veinlets formed within permeable kink bands syn-propagation. This type
of veinlet is rare indicating that most kink bands either had low permeability or

Section B
Raine M. D., 2005 38
that there was poor connectivity between kink bands and fluid pathways.
3. En echelon sets of discontinuous lenticular veinlets composed of white mica
(Figure 7c). The en echelon veinlets have irregular margins and are consistently
inclined at a low angle to the kink axial surfaces. The characteristics and
geometry of the veinlets indicates dilation along an axis at a low angle to S2 and
the brittle failure of the layer silicates.
4. Thin planar veinlets composed of white mica orientated perpendicular to the
internal foliation and contained solely within a kink band (Figure 7d). These
veinlets exhibit irregular margins indicating a, which define the internal
foliation. The axis of dilation associated with these veinlets is consistent with
the layer parallel extension attributed with the host kink band.
Figure 7. Four types of veinlet associated with extensional kink bands. A. Foliation boudinage associated
with kink band development. PPL. Horizontal thin section. Sample G131. B. Quartz has replaced the
internal portion of a kink band and partially preserved the internal foliation. The ψ angle is small due to
the obliquity of the thin section to the kink band axial surfaces. XPL. Thin-section dips at 20° towards
245°. Sample G131. C. Millimetre scale en echelon veinlets of white mica. PPL. Horizontal thin section.
Sample G134. D. Veinlet comprised of white mica contained within an extensional kink band. The veinlet
is orientated perpendicular to the extension direction exhibited by the internal foliation. PPL. Horizontal
thin section. Sample G134.

Section B
Raine M. D., 2005 39
Geometric features
Conjugate pairs of extensional kink bands are most frequently observed in horizontal
and sub-horizontal thin sections. The sinistral and dextral kink bands exhibit ‘neutral
intersections’ where neither kink visibly offsets the other. Although the sinistral and
dextral kink bands demonstrate a coeval relationship, the sinistral kink bands are
typically larger and more numerous.
For samples C102, G131 and G134 the small-scale extensional kinks observed in thin
section consist of four sets of conjugate kink bands (S3a, b, c, d), which exhibit an
approximate orthorhombic symmetry about a sub-vertical axis (Figure 8a, b, c). The
four sets of kink bands consist of two ~WNW-ESE striking sinistral kinks with
opposing dip directions (S3a, c) and two ~NE-SW striking dextral kinks, also with
opposing dip directions (S3b, d). For sample S3109 only two sets of conjugate
extensional kink bands were recognised (Figure 8d). The two sets of kink bands have
the orientation of S3a (sinistral) and S3b (dextral).
Although the strike and dip of the kink band axial planes is tightly constrained within
each sample, there is noticeable inter-sample variability (Figure 8). This variability is
most likely the result of post D3 deformation, in particular, transpressional shortening
during D4 (see Section A).
The apparent α angles have been plotted against apparent β angles for every pair of
measurements made (Appendix C, Part 2). The four sets of kink bands all demonstrate
substantial variability in apparent α, β and ψ angles (Appendix C, Part 2), even between
consecutive thin sections (e.g. sections orientated at 20/084 & 40/084).

Section B
Raine M. D., 2005 40
Figure 8. Lower-hemisphere equal-area stereonets showing the orientation of D3 extensional kink bands
observed within: A. Sample C102. B. Sample G131. C. Sample G134. D. Sample S3109. The black
squares are vector means and represent the apparent orientation of a set of kink bands within a thin
section (see Figure 5a). The circles which encompass the black squares define the ±9° error associated
with each vector mean.
S3a S3d
S3c S3b
S3a S3d
S3c
S3b S3a
S3d S3b
S3c
S3a
S3b

Section B
Raine M. D., 2005 41
Discussion pertinent to the three-dimensional geometric features of D3 kink bands has
been simplified by treating the kinks in two categories: sinistral and dextral. The
simplification is proposed on the basis that the four sets of kinks display conjugate
relations and that the two sets of sinistral kink bands (S3a, c) exhibit similar geometric
properties, as do the two sets of dextral kink bands (S3b, d; Figure 9 & 10). The
definition of sinistral and dextral kink bands is base on the sense of rotation when
viewed down plunge of the intersection axis between the kink axial surface, the internal
foliation and the external foliation (e.g. Figure 10). Lower-hemisphere equal-area
stereonets showing kink hinge orientations for each sample are presented in Figure 10,
whilst summary statistics for α, β and ψ are presented in Table 1. Subtle geometrical
differences between sinistral and dextral kink bands (Table 1 & Figure 11) indicate that
the development of sinistral and dextral kink bands was slightly disproportionate.
Alpha Angle vs Beta Angle
0
10
20
30
40
50
60
70
80
90
90 100 110 120 130 140 150 160 170 180
Beta Angle
Alp
ha A
ngle S3a
S3b
S3c
S3d
Alpha Angle vs Psi Angle
0
10
20
30
40
50
60
70
80
90
0 10 20 30 40 50 60 70 80 90
Psi Angle
Alp
ha A
ngle S3a
S3b
S3c
S3d
Psi Angle vs Beta Angle
0
10
20
30
40
50
60
70
80
90
90 100 110 120 130 140 150 160 170 180
Beta Angle
Psi A
ngle
S3a
S3b
S3c
S3d
Figure 9. Plots of geometric parameters of
D3 extensional kink bands. S3a and S3c are
sinistral, whereas S3b and S3d are dextral.
Linear regression lines shown.
Section B
Raine M. D., 2005 42
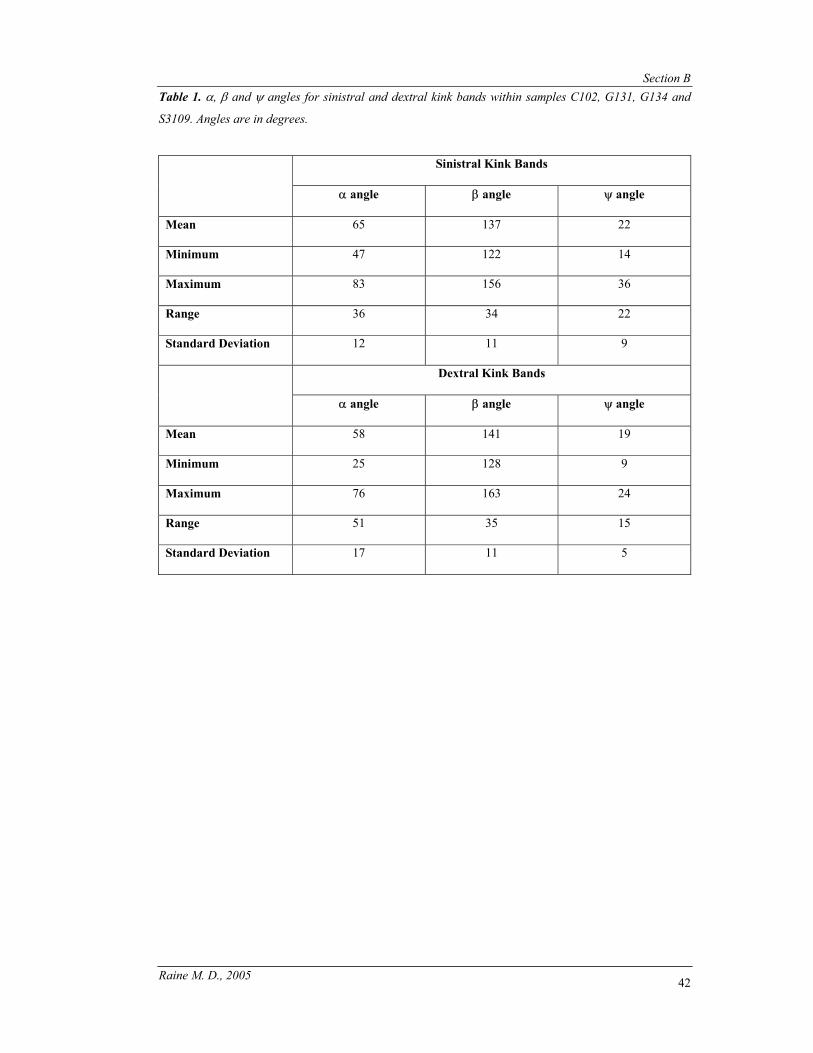
Table 1. α, β and ψ angles for sinistral and dextral kink bands within samples C102, G131, G134 and
S3109. Angles are in degrees.
Sinistral Kink Bands
α angle β angle ψ angle
Mean 65 137 22
Minimum 47 122 14
Maximum 83 156 36
Range 36 34 22
Standard Deviation 12 11 9
Dextral Kink Bands
α angle β angle ψ angle
Mean 58 141 19
Minimum 25 128 9
Maximum 76 163 24
Range 51 35 15
Standard Deviation 17 11 5

Section B
Raine M. D., 2005 43
Figure 10. Summary lower-hemisphere equal-area stereonets for D3 extensional kink bands (S3) and D4
contractional kink bands (S4). Sample numbers are given. Kas represents the axial surface, Ki the internal
foliation and Ke the external foliation. The geometric relationship between Kas, Ke and Ki is shown in
Figures 4a, b & 5d. The squares plotted on Kas represent the kink band hinges.
Ki Ke
Kas
Kas Kas
Ke Ki Ke Ki
Kas Kas Kas
Kas Kas Kas
Kas
Kas Kas Kas Kas
Kas Kas
Kas
Ki Ke Ki Ke Ki Ke
Ke Ke Ki
Ke
Ki Ki
Ki Ke
Ki Ki Ki Ke Ke Ke
Ki Ki Ki
Ke Ki Ke Ke Ke

Section B
Raine M. D., 2005 44
-20
0
20
40
60
80
100
120
140
160
180
-20 0 20 40 60 80 100 120 140 160 180
Sinistral Kink Bands
Dex
tral
Kin
k B
ands
Alpha AngleBeta AnglePsi Angle
Figure 11. Plot of geometric parameters with S3a and S3c plotted against S3b and S3d respectively. The
geometric relationships of S3a to S3b and S3c to S3d are shown in Figure 8. The data plotted are
resultant values as determined for each set of kink bands within each of the four samples. Error bars set
at ±9°.
Principal shortening direction from small-scale kink bands
The D3 principal shortening direction has been estimated using the ‘conjugate bisector’
method of Ramsay (1962). It has only been possible to apply the conjugate bisector
method to kink bands within samples S3109. This is because the presence of four sets of
conjugate kink bands within samples C102, G131 and G134 (Figure 8a, b, c) does not
permit the application of the conjugate bisector method.
The geometry of the conjugate kink bands in sample S3109 implies a shortening
direction of 076° (Figure 12). The vector mean orientation of the external foliation
Section B
Raine M. D., 2005 45
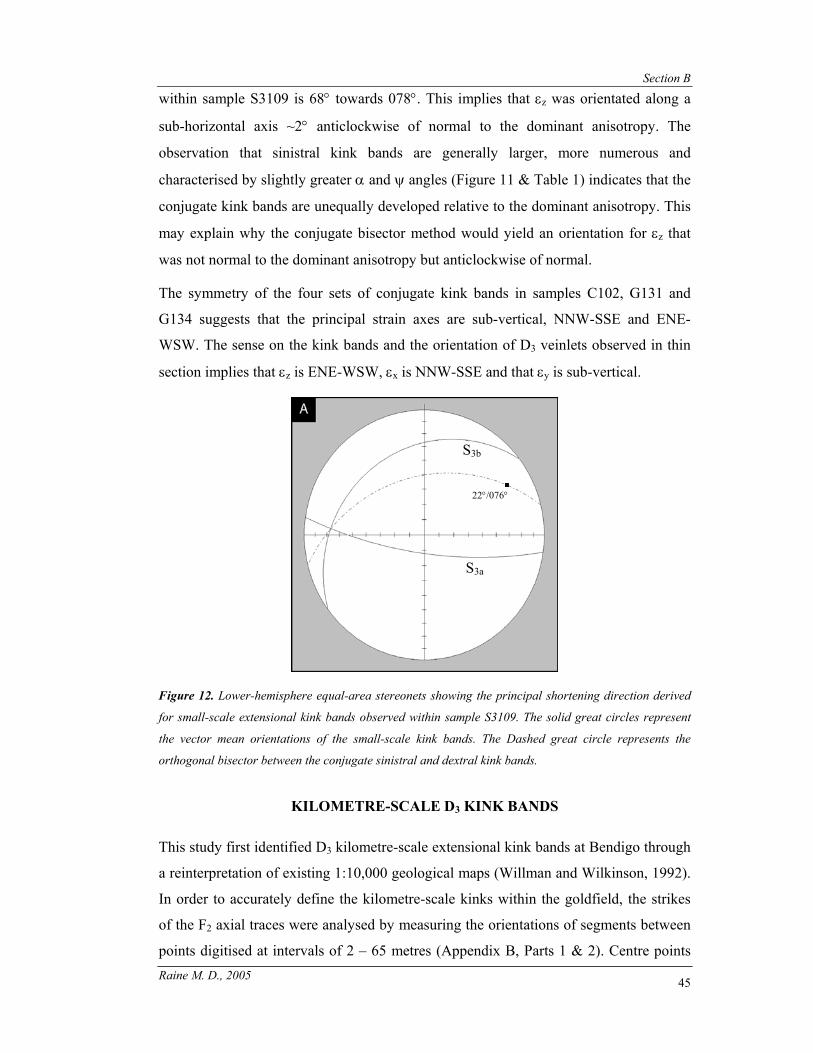
within sample S3109 is 68° towards 078°. This implies that εz was orientated along a
sub-horizontal axis ~2° anticlockwise of normal to the dominant anisotropy. The
observation that sinistral kink bands are generally larger, more numerous and
characterised by slightly greater α and ψ angles (Figure 11 & Table 1) indicates that the
conjugate kink bands are unequally developed relative to the dominant anisotropy. This
may explain why the conjugate bisector method would yield an orientation for εz that
was not normal to the dominant anisotropy but anticlockwise of normal.
The symmetry of the four sets of conjugate kink bands in samples C102, G131 and
G134 suggests that the principal strain axes are sub-vertical, NNW-SSE and ENE-
WSW. The sense on the kink bands and the orientation of D3 veinlets observed in thin
section implies that εz is ENE-WSW, εx is NNW-SSE and that εy is sub-vertical.
Figure 12. Lower-hemisphere equal-area stereonets showing the principal shortening direction derived
for small-scale extensional kink bands observed within sample S3109. The solid great circles represent
the vector mean orientations of the small-scale kink bands. The Dashed great circle represents the
orthogonal bisector between the conjugate sinistral and dextral kink bands.
KILOMETRE-SCALE D3 KINK BANDS
This study first identified D3 kilometre-scale extensional kink bands at Bendigo through
a reinterpretation of existing 1:10,000 geological maps (Willman and Wilkinson, 1992).
In order to accurately define the kilometre-scale kinks within the goldfield, the strikes
of the F2 axial traces were analysed by measuring the orientations of segments between
points digitised at intervals of 2 – 65 metres (Appendix B, Parts 1 & 2). Centre points
22°/076°
S3a
S3b

Section B
Raine M. D., 2005 46
between the digitised nodes of F2 axial traces were generated and the orientation of the
line that joined the adjacent nodes was assigned to the respective centre point. The
analysis of the F2 axial traces utilises in excess of 10,000 centre points constructed from
10 adjacent F2 anticlines (Appendix B, Part 1 & 2). Despite the high density of data
points, three potential problems have been recognised. The first relates directly to the
original mapping, where the inevitable extrapolation of axial traces across unmapable
areas may have smoothed any change in strike. The second potential problem is that
further smoothing may have occurred when the axial traces were digitised from the
1:10,000 geological maps. The third potential problem is that there is no definitive way
of distinguishing kink-related deformation from deformation caused by, for example,
oblique faults.
In an attempt to address the latter, dextral and sinistral rotations (ψ) in the strike of F2
equal to or greater than 9° from the vector mean (345°) have been plotted (Figure 13a,
b). The value of 9° was determined from the analysis of extensional kink bands
observed in horizontal thin sections (Appendix B, Part 3). A top cut has also been
applied to the ψ data to remove extreme values thought unrealistic of kink band
development (Appendix B, Part 3). The impact of any smoothing is considered to be
minimal because firstly, breaks in the continuity of outcrop are minimal, particularly
along strike of F2 anticlines and secondly, the orientation of F2 axial traces on current
geological maps resembles closely the axial traces depicted on early maps made prior to
significant urbanisation (e.g. Herman 1923; Figure 2 in Stone, 1937; Figure 2 in
Thomas, 1953b). Also, the apparent width of the kilometre-scale kinks is far greater
than any natural/artificial cover.
General Features
Axial traces have been constructed for the kinked domains (Figure 13a, b) identified
through this method (Figure 14). Four kilometre-scale kinks were defined (Figure 13a, b
& 14), two with dextral sense and two with sinistral sense. The individual kink bands
possess monoclinic extensional geometry and appear to have complex internal
structures. The largest kink (marked S2 in Figure 13b) has the appearance of a
compound structure (Donath, 1968).

Section B
Raine M. D., 2005 47
Figure 13. A. Plot of centre points defined by a dextral rotation in the strike of F2 equal to or greater than
9° relative to a vector mean of 345°. Modified from Section A. B. Plot of centre points (see text above)
defined by a sinistral rotation in the strike of F2 equal to or greater than 9° relative to a vector mean of
345°. Modified from Section A. Four rotated domains (kinks) are clearly evident; two have a dextral
sense (D1 & D2) and the other two a sinistral sense (S1 & S2). The areas between the four kinks are
characterised by numerous, less persistent rotated domains, which may indicate a ‘mesh’ of smaller kink
bands.
In the exposed topographic plane rotations in the strike of F2 associated with kinking
appear quite subtle (Figure 14), which may indicate one or a combination of the
following:
1. The intersection of F3 axial surfaces with the topographic surface is oblique;
2. The original geological mapping and/or subsequent digitisation of the F2 axial
traces has incurred a significant amount of smoothing;
3. The kilometre-scale kink bands exhibit relatively small ψ angles; and
D1
D2
S1
S2
Extent of goldfield
Extent of goldfield

Section B
Raine M. D., 2005 48
4. The kilometre-scale kink bands exhibit rounded hinges (c.f. Figure 1a, b in Gay
and Weiss, 1974).
Figure 14. Kink bands delineated from a reinterpretation of the Bendigo Goldfield 1:10,000 geological
maps and vector analysis of the F2 axial traces. Modified from Section A. Large-scale uniform rotations
(F3) in the strike of F2 are highlighted in grey (S1, S2, D1 & D2) and represent the rotated domains
shown in Figure 13a, b. The general plunge direction of F2 within F3 is shown and was determined from
the 1:10,000 geological maps for the Bendigo Goldfield. The approximate extent of the goldfield is
represented by the thick dashed line, which is also shown in Figure 2. The solid black line represents the
vector mean for the F2 axial traces (345°) as determined from vector analysis. The solid green arrows
represent the principal shortening direction (072°) estimated using the conjugate bisector method of
Ramsay (1962).
D1
D2
S1
S2
072°

Section B
Raine M. D., 2005 49
Sinistral and dextral rotations in the strike of the F2 axial traces on a smaller scale than
those associated with the four major kinks (Figure 14) can be observed across the entire
goldfield (Figure 13a, b). These rotations of the F2 axial traces form more discrete
zones, which are considerably more abundant in the southern portion of the goldfield
(Figure 13a, b). It is suggested that the existence of these less persistent zones may
relate to the following:
1. A network of smaller (<1 km true width) kilometre-scale kink bands; and
2. Other significant structures such as oblique faults (e.g. Willman & Wilkinson,
1992)
The geometric properties of kilometre-scale sinistral and dextral kink bands are
summarised in Tables 2 & 3. As well as the potential problems mentioned previously,
the geometric data for kilometre-scale kink bands presented in Table 2 are also subject
to the assumption that the kink band axial traces remain parallel and planar over the area
investigated (Figure 13a, b). The mean α and β angles determined for the sinistral and
dextral indicate that they exhibit extensional geometry (α + β = ≥180°; sensu Ramsay &
Huber, 1987; Figure 4b). The geometric parameters of the kilometre-scale kinks and
small-scale kink bands observed in horizontal thin sections show comparable
geometries (Table 2). Summary statistics for values of ψ are presented in Table 3. For
kilometre-scale kinks ψ angles have been determined using vector analysis and are
therefore relative to the vector mean strike of F2. Consequently, it was to be expected
that the mean values of ψ for sinistral and dextral kinks would be similar (Table 2). A
comparison of ψ values with those determined for extensional kink bands present in
horizontal thin sections reveals strong similarities, the only notable difference is
between the maximum values of ψ for dextral kinks (Table 3). In thin section it was
observed that the sinistral kink bands were more dominant, which is also apparent on a
goldfield scale (compare Figures 13a & 13b). On the basis that the kilometre-scale kink
bands have comparable geometries to the small-scale kink bands observed in thin
sections (Table 2), it is proposed that the three-dimensional geometries are also similar
(e.g. Figure 8 & 10).

Section B
Raine M. D., 2005 50
Table 2. Comparison between kilometre-scale kinks, extensional kink bands observed in horizontal thin
sections and the resultant three-dimensional geometry of small-scale extensional kink bands. Values
quoted for geometric parameters are mean values and in degrees. Dex – Dextral, Sin - Sinistral.
Axial Surfaces
External Foliation
Internal Foliation α β ψ
Sin Dex Sin Dex Sin Dex Sin Dex Sin Dex Sin Dex
Kilometre-scale Kinks
095 232 345† 345† 328 001 70 67 126 129 17 16
Small-Scale Kinks*
102 229 348 352 325 009 66 58 137 139 23 17
Small-Scale Kinks**
See Figure 10 65 58 137 141 22 19
† Vector mean orientation of F2 axial traces as determined from vector analysis
* Mean geometric parameters of small-scale kink bands observed in horizontal thin sections
** Resultant three-dimensional geometric parameters for small-scale extensional kink bands
Table 3. Comparison of ψ values for kilometre-scale kinks and extensional kink bands observed in
horizontal thin section. Values of ψ are in degrees.
Map Scale Kink Bands Small-Scale Kink Bands
(Horizontal Thin Sections)
Sinistral Dextral Sinistral Dextral
Mean 17 16 23 17
Minimum 9‡ 9‡ 6 11
Maximum 48† 43† 41 27
Range 39 34 35 16
Standard Deviation 7 6 9 3
Count 2787 850 180 120
‡ Minimum ψ value determined from horizontal thin sections. Appendix B, Part 3.
† Top-cuts have been applied to remove extreme values of ψ. Appendix B, Part 3.

Section B
Raine M. D., 2005 51
Principal shortening direction from kilometre-scale kink bands
The approximated geometric parameters of the kilometre-scale kink bands are
comparable to the small-scale extensional kink bands observed in horizontal thin
sections (Table 2). The slight difference between the mean α angles for sinistral and
dextral kink bands implies that the shortening direction was not normal to the
anisotropy, but a little anticlockwise of normal (c.f. Gay & Weiss, 1974). The
orthogonal bisector (Ramsay, 1962) of the conjugate sinistral and dextral kilometre-
scale kink bands (Figure 14) implies an approximate shortening direction of 072°.
Although the kilometre-scale kink bands were investigated in two-dimensions their
geometric properties and derived shortening direction are comparable to the small-scale
kink bands. On this basis the kilometre-scale kinks are interpreted as having formed
within the same strain field as the small-scale kink bands.
SMALL-SCALE D4 KINK BANDS
General features
In thin section D4 kink bands exhibit monoclinic contractional geometry (sensu Ramsay
and Huber, 1987; Figure 4a) and record local layer-parallel shortening. Generally the
anisotropy exploited during kinking is the well-developed axial planar foliation S2,
however, local-scale variability in the relative intensity and morphology of S1 and S2
means that S1 may be locally important. The foliation exploited during kinking has
therefore been termed the ‘dominant anisotropy’. Small-scale contractional kink bands
are best developed in pelitic to semi-pelitic units and typically display angular to
slightly rounded hinges, planar limbs and planar to curviplanar axial surfaces (Figure
15). Unlike D3 extensional kink bands there are no new mineral phases associated with
the development of D4 contractional kink bands.
Despite the small size of these kinks their internal structure can be complex in the
following aspects:
1. Remnants of small-scale D3 kink bands have been overprinted by and preserved
within larger D4 kinks (Figure 15b). The D3 kink bands have an opposite sense
of asymmetry to the overprinting D4 kinks.

Section B
Raine M. D., 2005 52
2. Minor kinks and crenulations, which are entirely contained within the host kink
band (Figure15b, d). The minor kinks and crenulations predominantly exhibit
the same sense as the host kink. The minor kink bands are orientated sub-
parallel with the host kink band and typically at a lower angle to the unrotated
external foliation. These minor kinks may be juvenile kinks that nucleated some
time after the host kink band. The sub-parallel relationship between a host and
juvenile kink may signify that the central portion of the host kink band rotated
during growth (see Figure 6 in Weiss, 1980), prior to the nucleation of the
juvenile kink. It is important to note that the direction of longitudinal
propagation is the same for both the host and minor kink bands.
3. The internal foliation is ‘severely wrinkled’ (c.f. Paterson & Weiss, 1966; Figure
15b, d).
Figure 15. A. Well-developed contractional kink band that deforms S2. PPL. Thin-section dips at 90°
towards 354°. Sample G134. B. Contraction kink band that deforms S2 (sub-vertical) and sub-horizontal
D3 extensional kink bands. The kink band contains parasitic kinks and crenulations and remnants of D3
kink bands. Note the proximity and similar orientation of extensional and contractional kink bands. PPL.
Thin-section dips at 90° towards 174°. Sample G134. C. Small contractional kink band, which deforms S2
and has a sigmoidal geometry. PPL. Thin-section dips at 90° towards 174°. Sample G134. D. Well-
developed contractional kink band that deforms S2. The internal foliation is wrinkled and also deformed
by minor kinks and crenulations. PPL. Thin-section dips at 90° towards 174°. Sample G134.

Section B
Raine M. D., 2005 53
Small-scale contractional kink bands mostly exhibit a lenticular to subtle sigmoidal
morphology and terminations defined by a low angle convergence of the axial surfaces
(Figure 15c). Abrupt terminations are observed where small-scale contractional kink
bands intersect a horizon defined by a marked increase in competency. For example,
abrupt terminations are observed where the longitudinal propagation of a kink band has
intersected a quartz vein, carbonate vein or large sulphide grain (Figure 16a, b, c). Due
to the formation of flanking structures (Passchier, 2001; Grasemann & Stüwe, 2001) it
is not uncommon for the geometry of kink bands to become distorted proximal to some
veinlets (Figure 16a, b).
Figure 16. A. Photomicrograph showing a contractional kink band that distorts where it terminates
against the carbonate vein. Axial planes marked by dashed white line. PPL. Thin-section dips at 90°
towards 174°. Sample G134. B. Photomicrograph showing the intersection of a mm-scale contractional
kink band with a carbonate vein. The formation of flanking structures distorts the internal foliation.
Smaller kinks contained within the larger kink terminate against the carbonate vein. PPL. Thin-section
dips at 20° towards 084°. Sample G134. C. Contractional kink band with converging axial surfaces that
appears to terminate against grains of arsenopyrite. PPL. Thin-section dips at 90° towards 354°. Sample
G134.
As well as terminating against sulphide grains, numerous contractional kink bands can
be observed propagating from their margins. This is particularly the case within pelitic

Section B
Raine M. D., 2005 54
units where sulphide grains form continuous bands parallel to S1 or S2. Small-scale
contractional kink bands also have a strong spatial affiliation with D3 kink bands and
either overprint the D3 kinks or occur in close proximity to them (e.g. Figure 15b).
Geometric features
Sinistral and dextral contractional kink bands were observed in three out of the four
samples analysed in detail. Sinistral kinks observed in thin sections from sample C102
have a vector mean strike of 062° and a dip of 54° (Figure 17a). The vector mean
orientations for dextral kink bands observed in samples G131 and G134 showed some
variability, with strikes of 261° and 299° and dips of 38° and 53° respectively (Figure
17b, c).
The dextral contractional kink band axial surfaces have a similar orientation within each
sample. However an amount of inter-sample variability is evident (Figure 10 & 17a, b,
c). The variation between sample G131 and G134 reflects the important role that
extensional kink bands played in the nucleation of the younger contractional kinks. This
relationship is further emphasised when the orientation of S3a for samples G131 and
G134 (Figure 10) is compared with the orientation of dextral contractional kink bands
from the respective samples (Figure 10). Likewise, sample C102 displays the same
relationship between S3b and sinistral contractional kink bands (Figure 10).
The apparent α angles have been plotted against apparent β angles for every set of
measurements made (Appendix C, Part 2). As with the extensional kink bands, the
contractional kink bands demonstrate significant variability in apparent α, β and ψ
angles, even between consecutive thin sections (e.g. sections cut at 20/084 & 40/084).
Lower-hemisphere equal-area stereonets showing fold hinge orientations and resultant
α, β and ψ angles for each sample are presented in Figure 10 and Table 4 respectively.

Section B
Raine M. D., 2005 55
Table 4. True α, β and ψ angles for sinistral and dextral contractional kink bands determined from
sample C102, G131 and G134 (see Figure 10). Angles are in degrees.
Sample No.
C102
(Sinistral)
G131
(Dextral)
G134
(Dextral)
α 73 81 54
β 83 72 80
ψ 24 27 26
Figure 17. Lower-hemisphere equal-area
stereonets showing the orientation of D4
contractional kink bands (great circles)
observed within: A. Sample C102 (sinistral).
B. Sample G131 (dextral). C. Sample G134
(dextral). Each black square is a vector mean
and represents the apparent orientation of a
set of kink bands within a thin section. The
circles which encompass the black squares
define the ±9° error associated with each
vector mean (see Section A).

Section B
Raine M. D., 2005 56
D4 principal shortening direction
The D4 principal shortening direction has been estimated using the experimental data of
Gay and Weiss (1974). The coaxial experiments performed by Gay and Weiss (1974)
on card decks and slate led to the derivation of relationships between φ and α, φ and β
and φ and ψ. The true α, β and ψ values determined in this study for sinistral kink bands
in sample C102 (Table 4) have been compared with the experimental data of Gay and
Weiss (1974) (Figure 18). For dextral kink bands within samples G131 and G134 mean
values have been calculated from the true α, β and ψ angles presented in Table 4. These
mean values have also been compared with the experimental data (Figure 18).
For a single set of contractional kink bands εz lies within the acute angle between the
external foliation and the axial plane (Gay & Weiss, 1974). Mean values for φ have
been calculated (Table 5) and the orientation of εz determined accordingly (Table 6).
Figure 18. Plot relating φ to α, β and ψ. Solid lines represent best-fit lines through experimental data as
defined by Gay and Weiss (1974). Dashed lines are 95% confidence limits. Arrowed lines represent
estimates of φ from α, β and ψ values. The data plotted is presented in Table 4, arithmetic means were
calculated for the dextral kink band data.
α ψβ
φ φφ

Section B
Raine M. D., 2005 57
Table 5. φ values derived using the experimental data of Gay and Weiss (1974). Values of φ are quoted in
degrees.
φ values for small-scale D4 kink bands Geometric parameters Sinistral Dextral
α 22 14
β 20.5 7
ψ 20 17
Average φ 21 13
Table 6. Derivation of the D4 principal shortening direction (εz). Values presented are in degrees.
Small-scale D4 kink bands
Sinistral Dextral
Average φ 21 13
Strike of Ke 349 348†
Bearing of εz 010 335
Ke External foliation
† Mean strike of Ke for samples G131 and G134.
DISCUSSION
Small-scale extensional kink bands
Despite a significant amount of research in to the nucleation, growth and geometric
properties of experimentally derived and naturally occurring contractional kink bands,
very little is known about extensional kink bands. Cobbold et al. (1971) deformed a
stack of lubricated plasticine layers with compression-applied normal to the layering.
The deformation of the plasticine model, which culminated in the development of
conjugate extensional kink bands, was reported as being “remarkably similar to the

Section B
Raine M. D., 2005 58
development of reverse (contractional) kink bands”. In this study it is also apparent that
extensional kink bands display a number of similarities to contractional kink bands,
particularly regarding kinking mechanisms and the relationships between principal
shortening directions and kink band geometries.
The geometric properties of the extensional kink bands can be thought of in terms of
existing models for the formation and growth of contractional kink bands. The majority
of extensional kink bands observed at Bendigo display relatively simple geometries,
with only subtle variations in the parallelism and planarity of the internal foliation. This
suggests that the extensional kink bands are more likely to have resulted from a kinking
mechanism similar to that of the constant-segment-length model (Anderson, 1964;
Dewey, 1965; Donath, 1968) than the hinge-migration model (Paterson & Weiss, 1966;
Gay & Weiss, 1974; Weiss, 1980). The presence of compound kinks (Donath, 1968;
Figure 6b) may also be explained through the constant-segment-length model.
The small-scale (mm-scale) extensional kink bands consist of four sets of conjugate
kink bands arranged in orthorhombic symmetry (Figure 8a, b, c). This geometry could
not be resolved using horizontal, N- and P-sections and required additional intermediate
thin sections to be produced (Figure 3a, b). A similar geometry has been proposed by
Kirschner & Teixell (1996) for contractional kink bands located within the Somport
formation, central Pyrenees. However, the contractional kinks are highly curved and
form an anastomosing network of kink bands, which appears to be incompatible with
the geometry of the extensional kink bands presented in this contribution (Figure 8a, b,
c) and the models developed for orthorhombic fault systems (e.g. Krantz, 1988). The
geometry of the small-scale extensional kink bands observed at Bendigo, which is
comparable to the geometry of the fault systems reported by Aydin & Reches (1982)
and Krantz (1988), was previously unrecognised in any type of kink band. The
geometry of the kink bands, like the fault systems, implies deformation in response to
tri-axial strain.
Conjugate kink bands have been considered by numerous authors to be geometrically
and kinematically similar to conjugate fault systems (e.g. Kirschner & Teixell, 1996). In
light of the geometrical similarities and in an attempt to determine the orientation of the
principal strain axes, the ‘odd axis’ model of Krantz (1988) was applied to kink bands
observed in sample G134 (Figure 8c). In applying the odd axis model it was assumed
that a kink band was geometrically analogous to a fault, with the slip vector orthogonal

Section B
Raine M. D., 2005 59
to the kink band hinge (Figure 10). It was found that the principal strain axes could not
be resolved using the odd axis model despite the orthorhombic symmetry of the kink
bands. It is suggested that the assumption of orthogonal slip vectors may be flawed
and/or that a kink band may not be geometrically analogous to a fault in some other
way(s). This inevitably raises questions regarding kinking mechanisms that need to be
investigated. As a result the principal shortening direction could only be approximated
using the ‘conjugate bisector’ method of Ramsay (1962) (Figure 12).
Principal shortening directions derived using the conjugate bisector method (Figure 12)
indicate that εz was sub-horizontal and directed along an ENE axis. It has also been
shown that εz was not normal to the dominant anisotropy during kinking. Instead εz was
orientated along a sub-horizontal axis ~2° anticlockwise of normal. Gay and Weiss
(1974) demonstrate that the angle between the external foliation and the direction of
maximum shortening (φ) has a direct influence on the number of sets, orientation and
geometry of resulting contractional kink bands. It may be possible to consider this
relationship in terms of extensional kink bands, where the presence of well-developed
conjugate kink bands would imply that εz was within 5° of normal, relative to the
dominant anisotropy (φ = 85-90°; c.f. Figure 4a & 4b).
Kilometre-scale extensional kink bands
On a goldfield-scale (Figure 2) vector analysis of F2 axial traces has identified
kilometre-scale dextral and sinistral kinks, which exhibit extensional geometry.
Although vector analysis successfully confirms the existence and location of kilometre-
scale kinks at Bendigo, the data are restrictive and only allows the kinks to be
investigated in two-dimensions and in a plane that is most likely not orthogonal to the
kink band axial surfaces.
The orientation and geometric parameters of the kilometre-scale kinks are comparable
to the small-scale extensional kink bands observed in horizontal thin section (Table 2 &
3). Therefore the kilometre-scale kinks are interpreted as having formed within the same
strain field as the small-scale extensional kink bands, with an inferred principal
shortening direction of 072° (Figure 14). It is proposed that kilometre-scale kinks
contribute significantly to the outcrop pattern observed at Bendigo and the three-
dimensional architecture of the goldfield.

Section B
Raine M. D., 2005 60
Small-scale contractional kink bands
Kink bands with contractional geometry have been the focus of numerous studies
concerned with the nucleation, growth and geometric properties of experimentally
derived kink bands (e.g. Paterson & Weiss, 1966; Donath, 1968; Anderson, 1974;
Cobbold et al., 1971; Gay & Weiss, 1974; Weiss, 1980) and naturally occurring kink
bands (e.g. Anderson, 1964, 1968; Fyson, 1968; Powell et al., 1985; Stubley, 1990;
Goscombe et al., 1994; Kirschner & Teixell, 1996). The geometric properties of the
contractional kink bands observed at Bendigo can be thought of in terms of existing
models for the formation and growth of kink bands (c.f. Stubley, 1990). The majority of
contractional kink bands are characterised by subtle sigmoidal geometry, ‘severe
wrinkling’ (Weiss, 1968) of the internal foliation and the presence of small kinks and
crenulations within larger kink bands of the same sense (Figure 15b, d). Similar
characteristics are reported in Paterson & Weiss (1966), Gay & Weiss (1974) and Weiss
(1968, 1980), which suggests that the contractional kink bands are more likely to have
resulted from a kinking mechanism similar to that of the hinge-migration model and not
the constant-segment-length model (Anderson, 1964; Dewey, 1965; Donath, 1968).
A striking aspect of the sinistral and dextral contractional kink bands is their strong
spatial affiliation with extensional kink bands. Figure 10 shows that the orientation of
the dextral contractional kink bands for samples G131 and G134 is comparable to the
orientation of S3a from the respective sample. Likewise, sample C102 displays a similar
relationship between sinistral contractional kink bands and S3b. This appears to indicate
that the older extensional kink bands acted as loci for the nucleation of the contractional
kinks. Although the concept of kink bands nucleating and developing along pre-existing
structures is not new (e.g. Powell et al., 1985; Cudahy, 1986), the nucleation and
growth of contractional kink bands along extensional kink bands has not previously
been reported. This relationship may explain why there is a notable degree of inter-
sample variability in the orientation of the contractional kink bands, particularly given
that the kink bands formed late in the structural evolution of the goldfield (see Section
A).
Comparisons made between principal shortening directions inferred from naturally
occurring kink bands and experimentally derived relationships frequently reveal
inconsistencies (e.g. Dewey, 1965; Anderson, 1968; Stubley, 1990; Goscombe et al.,
Section B
Raine M. D., 2005 61
1994). Although no contractional kink bands were observed in conjugate relations the
experimentally derived relationships between φ and α, φ and β, and φ and ψ (Gay and
Weiss, 1974; Figure 18 & Table 5) have been used to estimate values of φ and therefore
εz. The angles of φ determined for sinistral and dextral kink bands (Table 5) display a
level of consistency rarely reported in natural systems (c.f. Figure 11 in Goscombe et
al., 1994). The geometry of sinistral kink bands indicates a shortening direction of 010°,
whilst the geometry of the dextral kink bands indicates a shortening direction of 335°.
Because no contractional kink bands were observed in conjugate relations and no cross
cutting relationships observed, the differences in the principal shortening directions
determined from sinistral and dextral kink bands may have several implications:
1. The sinistral and dextral kink bands formed in response to two separate periods
of deformation (D4 & D5? See Section A).
2. Localised variations in the strain field existed during kink band nucleation and
growth.
3. The geometry and relative intensity of the four sets of D3 extensional kink
bands, at any given location, was a fundamental control on the geometry and
orientation of contractional kink bands.
A late period of ~N-S shortening characterised by an E-W striking foliation at Ballarat
and a NE-SW foliation at Bendigo, St. Arnaud and Inglewood has been recognised by
Forde (1989). Within the Stawell Zone (Wilson et al., 1992; Miller et al., 2001; Miller
& Wilson 2002; Miller & Wilson, 2004) the formation of major sets of oblique faults
has been attributed to a NW-SE shortening event (‘early South Fault’ structures) and
subsequent NE-SW shortening event (‘South Fault-age’ structures). NE and ENE
trending cleavages are thought to be related to the NW-SE shortening event (Miller &
Wilson, 2004). Gray & Willman (1991c) concluded that the fault zones in the eastern
BZ are characterised by a weak to intense NW trending crenulation cleavage that is
locally overprinted by a weakly developed NE trending crenulation cleavage. Gray &
Willman (1991c) relate the two overprinting crenulation cleavages to strike-slip
reactivation of fault zones, with initial dextral movement followed by a weaker sinistral
movement. It is suggested that the dextral movement is associated with the
Tabberabberan Orogeny (ca. 381-377 Ma) and that the later sinistral movement might
possibly relate to the Middle Carboniferous Kanimblan Orogeny (ca. 360-340 Ma; Gray

Section B
Raine M. D., 2005 62
& Willman, 1991c). Morand et al. (1997) suggest that a weak NW trending cleavage
exists throughout much of the Melbourne Zone and is related to a NE-SW
compressional event that may represent the latest stages of the Tabberabberan Orogeny.
VandenBerg et al. (2000) propose that the eastern part of the BZ (Figure 1b, c) was
affected by a period of N-S shortening late in the Tabberabberan Orogeny. Dextral
movement along the Heathcote Fault Zone (Figure 1c) and other smaller faults, the
formation of E to NE trending megakinks (e.g. the Tooborac Megakink) and a NW
trending cleavage are associated with this shortening event (VandenBerg et al., 2000).
A period of N-S to NNE-SSW shortening is proposed from the study of contractional
kink bands and mega-kinks located within the Eastern Sub-province of the LFB (Figure
1b; Powell et al., 1985; Stubley, 1990). Powell et al. (1985) hypothesise that the
formation of the kink bands involved a continent-wide stress field and that the N-S
shortening experienced in the eastern LFB was related to the Carboniferous Alice
Springs Orogeny. Goscombe et al. (1994) propose a principal shortening direction of
166º based on the geometry of cm- to kilometre-scale contractional kink bands located
within the Mathinna Group, northeast Tasmania. Goscombe et al. (1994) suggest that
these kink bands are comparable to the kink bands observed by Powell et al. (1985).
For a single set of contractional kink bands εz normally lies within the acute angle
defined by the external foliation and the axial plane (e.g. Gay & Weiss, 1974, p. 290-
292). On this basis it is suggested that the dextral and sinistral contractional kink bands
recognised in this study formed in response to two separate periods of deformation. In
context with the work of others it is proposed that the NE striking sinistral kink bands
formed first and in response to a N-S to NNE-SSW shortening event. The sinistral kink
bands may be comparable to the NE-SW trending foliation of Forde (1991), the E to NE
trending megakinks and NW trending cleavage of VandenBerg et al. (2000), the weak
NW trending cleavage of Morand et al. (1997), the NW trending crenulation cleavage
of Gray & Willman (1991c) and the ‘South Fault-age’ structures of Miller & Wilson
(2004). The timing of the sinistral contractional kink bands is thought to correspond to
the later stages of the Tabberabberan Orogeny. The W to WNW striking dextral kink
bands recognised by this study formed in response to NNW directed shortening. It is
suggested that the dextral kink bands are comparable to the NE trending crenulation
cleavage of Gray & Willman (1991c) and the contractional kink bands of Powell et al.
(1985), Stubley (1990) and Goscombe et al. (1994). The timing of deformation and kink

Section B
Raine M. D., 2005 63
band growth may be Carboniferous in age (c.f. Gray & Willman, 1991c; Powell et al.,
1985).
CONCLUSIONS
1. Four sets of synchronous extensional kink bands arranged in approximately
orthorhombic symmetry about a sub-vertical axis have been recognised in kink
bands for the first time.
2. The orthorhombic symmetry displayed by the four sets of kink bands appears to
be similar to the fault systems reported by Aydin & Reches (1982) and Krantz
(1988). However, it was not possible to define the principal strain axes using the
‘odd axis’ model of Krantz (1988).
3. The extensional kink bands appear to have formed from a kinking mechanism
similar to that of the constant-segment-length model (Anderson, 1964; Dewey,
1965; Donath, 1968), with extension and further rotation of the internal foliation
occurring only after the internal foliation had been rotated to some limiting
angle.
4. The simplified geometric properties of the kilometre-scale kink bands imply that
they possess extensional geometry and are comparable to the mm-scale
extensional kink bands observed in thin section. This supports the relative
timing of kink band formation as suggested in Section A. It is also proposed that
the kilometre-scale extensional kink bands contribute significantly to the
architecture of the goldfield.
5. The angles of φ (Figure 4a) determined for sinistral and dextral contractional
kink bands (Table 5) display a level of consistency rarely reported of natural
systems. It is suggested that the consistency reflects the systematic manor in
which the kink bands were investigated, in particular, the use of true angles as a
posed to apparent angle (e.g. Figures 3a, b & 10). The angles of φ also suggest
that the sinistral and dextral contractional kink bands formed in response to two
separate deformation events (D4 & D5).
6. Extensional and contractional kink bands demonstrate substantial variability in
apparent α, β and ψ angles, even between consecutive thin sections from a suite
(e.g. sections orientated at 20/084 & 40/084). This is an important observation

Section B
Raine M. D., 2005 64
because it may have significant ramifications for studies that investigate kink
bands exposed in outcrop. It is suggested that some of the variability associated
with naturally occurring kink band systems, as documented by previous authors,
is related to the plane in which the kink bands are studied.
7. Comparisons made between principal shortening directions inferred from
naturally occurring kink bands and experimentally derived relationships
frequently reveal inconsistencies (e.g. Dewey, 1965; Anderson, 1968; Stubley,
1990; Goscombe et al., 1994). It can be assumed that the experimental data were
obtained from a plane orthogonal to the kink band axial surfaces. Therefore it is
highly likely that discrepancies will exist if naturally occurring kink bands are
studied in a plane that is not orthogonal to the kink band axial surfaces (see point
5 above). The ‘conjugate bisector’ method of Ramsay (1962) could be affected
in a similar way. An asymmetry of conjugate kink bands could be in part, related
to the plane in which they are viewed. This study has highlighted that caution
needs to be taken to differentiate between apparent and true angles when
investigating the geometry of kink bands.

Raine M. D., 2005 65
SECTION C