Embed Size (px)
Citation preview

1
The Structure of Interest RatesThe Structure of Interest Rates
Risk StructureRisk Structure

2
Risk Structure in Interest Rates
• The risk structure of interest rates refers to difference in the yields on instruments that have the same term to maturity.
• Why do securities with the same term to maturity have different interest rates?– Default risk– Liquidity– Tax considerations

3
Interest Rate Differences• Yields differ because of differences in default risk,
liquidity, and tax treatment– Default risk
• You lose your asset.
– Liquidity• Your ability to convert your asset into cash is less than that of
another asset.
– Tax treatment• Favorable tax treatment for your security results in lower interest
rates.

4
Default Risk• Default occurs when there is a failure to fully
meet the terms of a contractual agreement.– Failure to pay the full interest specified.– Failure to redeem the bond at face value at
maturity.– Delay in the receipt on interest.
• A premium for default risk is embedded in a security’s yield.

5
Default Risk
Corporate Bond Market
U.S. Treasury Bond Market
Price Price0
0
0
0
Yield YieldS S
P1c
P2c
P2t
P1ti1
c
i2c
i2t
i1t
RiskPremium
D1cD2
cD1
t
D2t
Quantity of Corporate Bonds Quantity of Treasury Bonds

6
Default Risk Premium• Let the default risk on corporate bonds rise.
– The demand for corporate bonds falls from D1c to D2
c.
• The price of corporate bonds falls from P1c to P2
c, and the yield on corporate bonds rises from i1
c to i2c.
– Simultaneously, the demand for Treasury bonds increases from D1
t to D2t.
• The price of Treasury bonds rises from P1t to P2
t, and the yield on Treasury bonds falls from i1
t to i2t.
– The risk premium is i2c - i2
t.
7
Liquidity• Liquidity is defined as the ability of an asset
to be quickly and cheaply converted into cash.– Other things remaining the same, the more liquid
an asset is the more attractive it is.• U.S. Treasury bonds are the most liquid of all long
term bonds because they are the easiest and least costly of all bonds to sell.
– They are widely traded.
• Corporate bonds are less liquid.
8
Liquidity
Corporate Bond Market
U.S. Treasury Bond Market
Price Price0
0
0
0
Yield YieldS S
P1c
P2c
P2t
P1ti1
c
i2c
i2t
i1t
RiskPremium
D1cD2
cD1
t
D2t
Quantity of Corporate Bonds Quantity of Treasury Bonds

9
Liquidity
• Assume that corporate bonds and Treasury bonds are equally liquid and that all their other attributes are the same.– Equilibrium prices and yields are identical.
• Let the liquidity of the corporate bond decrease because it is less widely traded.
10
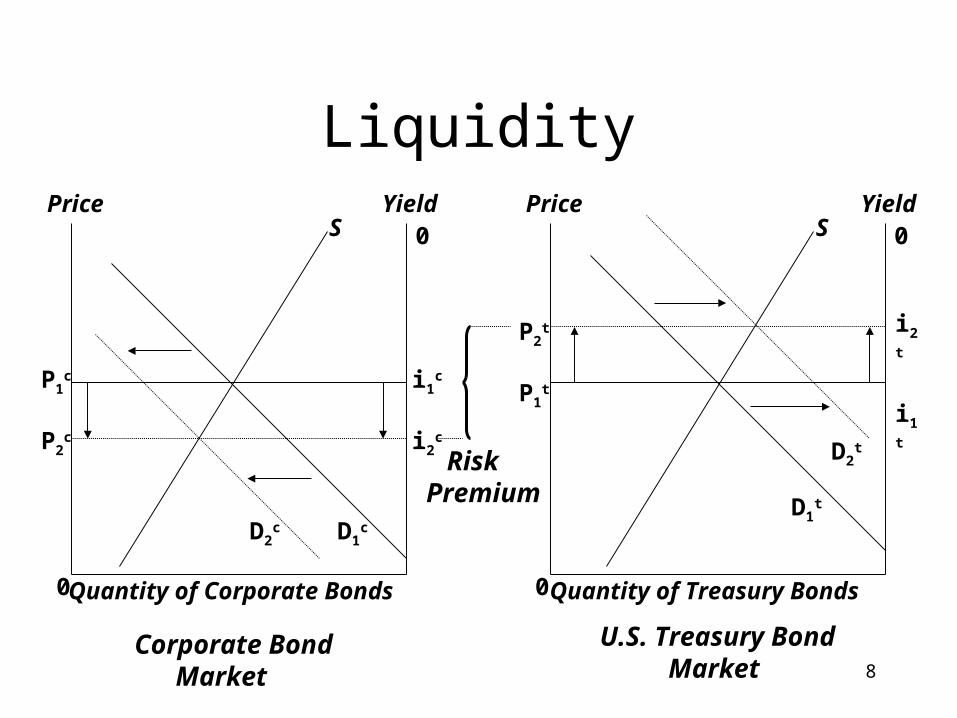
Liquidity• Let the liquidity on corporate bonds fall.
– The demand for corporate bonds falls from D1c to D2
c.
• The price of corporate bonds falls from P1c to P2
c, and the yield on corporate bonds rises from i1
c to i2c.
– Simultaneously, the demand for Treasury bonds increases from D1
t to D2t.
• The price of Treasury bonds rises from P1t to P2
t, and the yield on Treasury bonds falls from i1
t to i2t.
– The risk premium is i2c - i2
t.

11
Income Tax Considerations
Municipal Bond Market
U.S. Treasury Bond Market
Price Price0
0
0
0
Yield YieldS S
P1m
P2m P1
t
P2t
i2m
i1m
i1t
i2t
D1m
D2m
D1t
D2t
Quantity of Municipal Bonds Quantity of Treasury Bonds
12
Income Tax Considerations
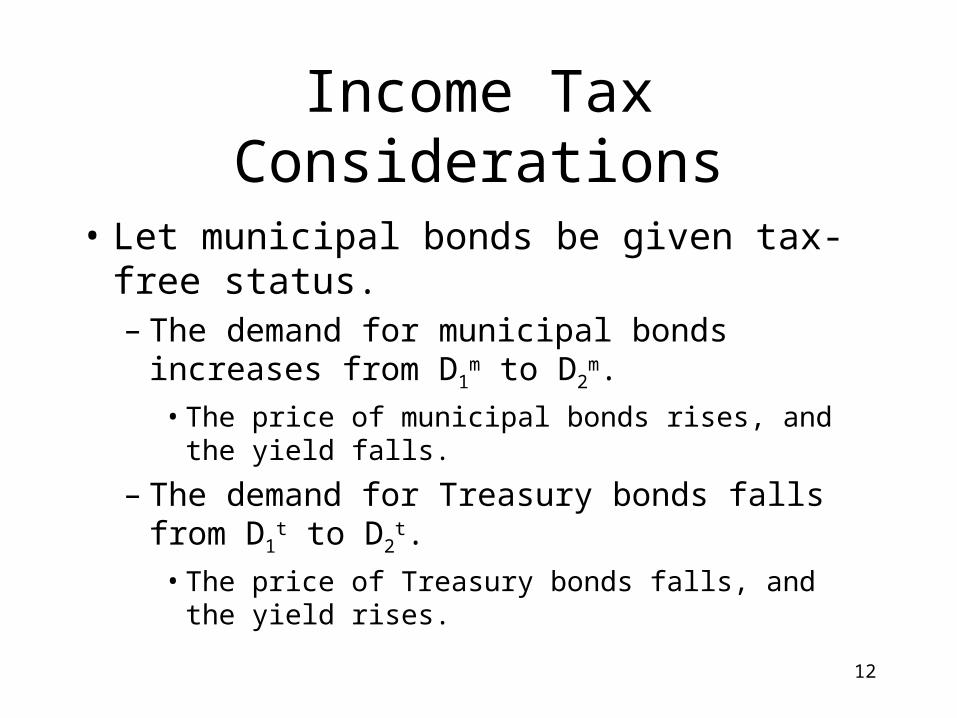
• Let municipal bonds be given tax-free status.– The demand for municipal bonds increases from
D1m to D2
m.• The price of municipal bonds rises, and the yield falls.
– The demand for Treasury bonds falls from D1t to
D2t.
• The price of Treasury bonds falls, and the yield rises.
13
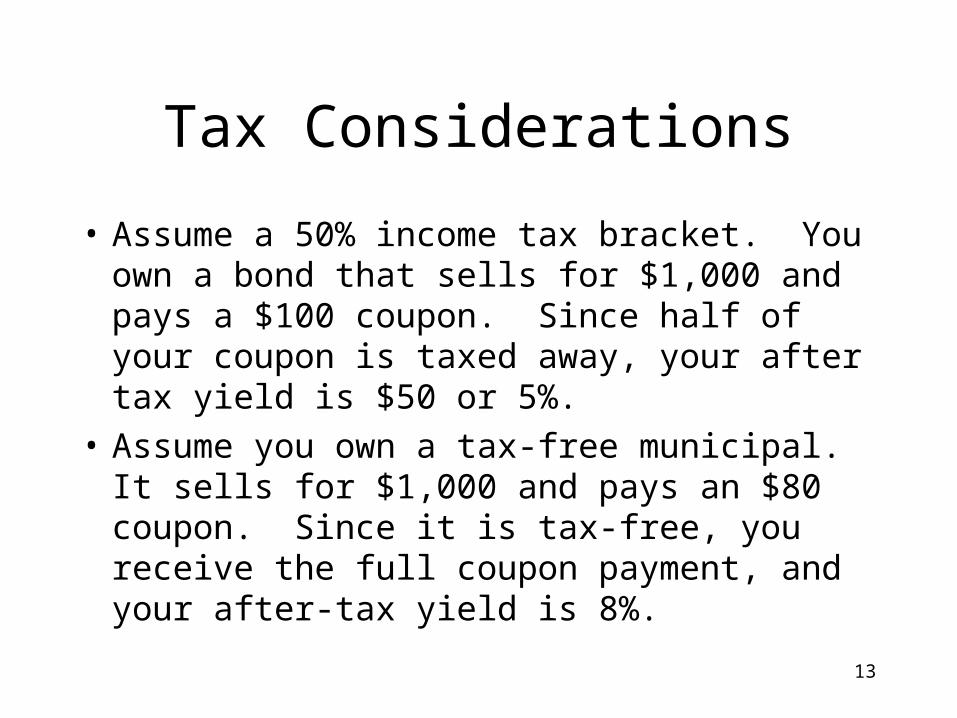
Tax Considerations
• Assume a 50% income tax bracket. You own a bond that sells for $1,000 and pays a $100 coupon. Since half of your coupon is taxed away, your after tax yield is $50 or 5%.
• Assume you own a tax-free municipal. It sells for $1,000 and pays an $80 coupon. Since it is tax-free, you receive the full coupon payment, and your after-tax yield is 8%.
14
Summary: Risk Structure of Interest Rates
• The risk structure of interest is explained by:– Default risk, liquidity, and tax treatment.
• As a bond’s default risk increases and/or its liquidity decreases, its price falls and its interest rate rises.
• If a bond receives favorable tax treatment, its price rises, and its interest rate falls.
15
Interest Rate Determination Becomes...
Nominal Rate = Real Rate + Expected Inflation + Risk Premium

16
The Structure of Interest RatesThe Structure of Interest Rates
Term StructureTerm Structure

17
The Term Structure of Interest Rates
• The term structure of interest rates refers to difference in the yields on instruments that are identical except for term to maturity.
• Term structure is represented graphically by a yield curve.– Yield curves consider only the relationship
between maturity or term of a security and its yield at a moment in time, otrs.
18
Term Structure• Time to maturity affects interest rates
because– Time increases exposure to risk, causing
investors to demand higher yields on securities with longer maturities.

19
Yield Curves• Shapes:
– Upward sloping• Interest rates on securities with longer maturities exceed
interest rates on shorter term securities.
– Downward sloping• Interest rates on securities with longer maturities are less
than interest rates on shorter term securities.
– Horizontal• Interest rates on long and short term securities have
approximately the same interest rates.

20
Treasury Yield Curve
February 4, 2005

21
Treasury Yield Curve
3.00
3.00
4.50
3mo 6mo 2yr 5yr 10yr 30yr
Dec 6, 2001
Feb 7, 2002Jan 30, 2002
1.50
Yields as of 4:30 p.m. on Wednesday
Maturities

22
Treasury Yield Curve
5.00
5.50
6.00
3mo 6mo 1yr 2yr 5yr 10yr 30yr
Dec 9, 1999
Jan 17, 2000Jan 10, 2000
4.50
Yields as of 4:30 p.m. on Wednesday
Maturities
23
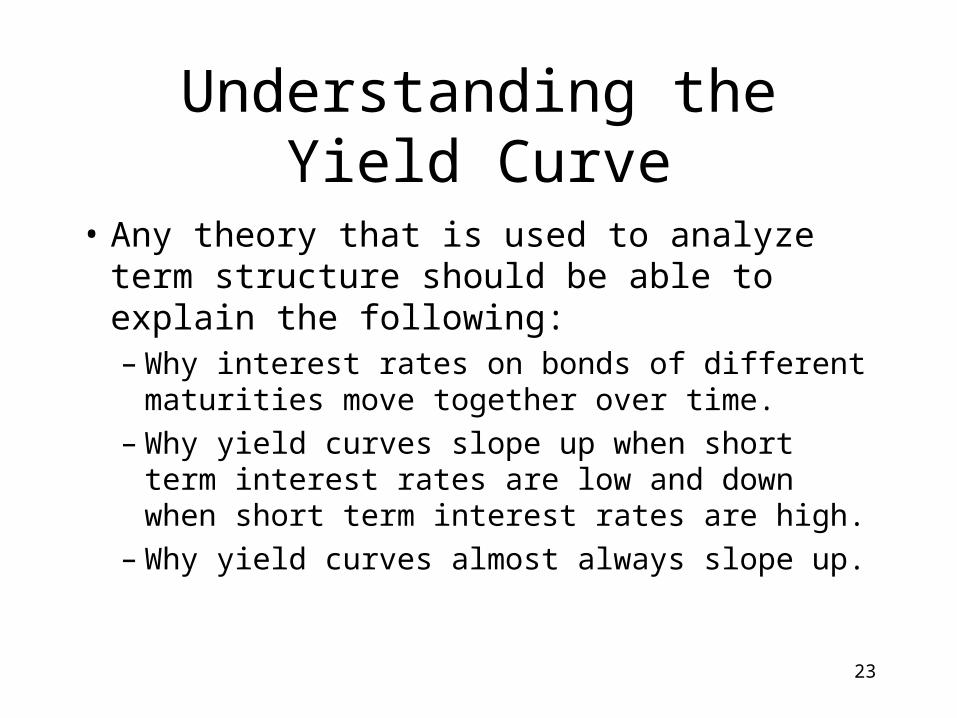
Understanding the Yield Curve
• Any theory that is used to analyze term structure should be able to explain the following:– Why interest rates on bonds of different
maturities move together over time.– Why yield curves slope up when short term
interest rates are low and down when short term interest rates are high.
– Why yield curves almost always slope up.

24
Yield Curve Theories
• Expectations hypothesis– Explains facts 1 and 2, but not 3.
• Segmented markets hypothesis– Explains facts 3, but not 1 and 2.
• Preferred habitat and liquidity hypotheses– Explains facts 1, 2, and 3.

25
Expectations Hypothesis
• Assumptions:– All investors are wealth maximizers.– No investor has a specific preference about the
maturity or term of a security.• Bonds of different maturities are perfect substitutes.
– Investors try to achieve the highest possible rate of return from holding one or more securities and are willing to move freely from one maturity to another.

26
Expectations Hypothesis: Example
• Assume investors have only two options for investing over a three year period.– Option 1 is to buy a bond that matures in one
year, reinvest the proceeds from the bond at the end of the year in another one year bond, and follow the same procedure at the end of the second year.
– Option 2 is to purchase a security that matures in three years and hold it to maturity.
27
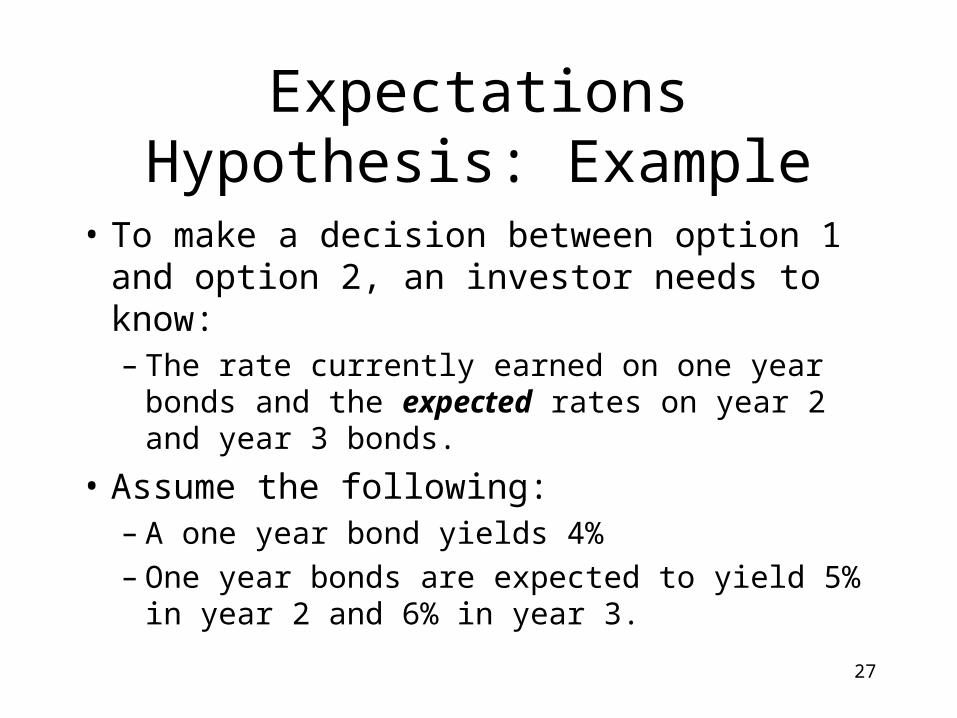
Expectations Hypothesis: Example
• To make a decision between option 1 and option 2, an investor needs to know:– The rate currently earned on one year bonds and
the expected rates on year 2 and year 3 bonds.
• Assume the following:– A one year bond yields 4%
– One year bonds are expected to yield 5% in year 2 and 6% in year 3.

28
Expectations Hypothesis: Example
• What is the minimum accepted yield on a three year security?
29
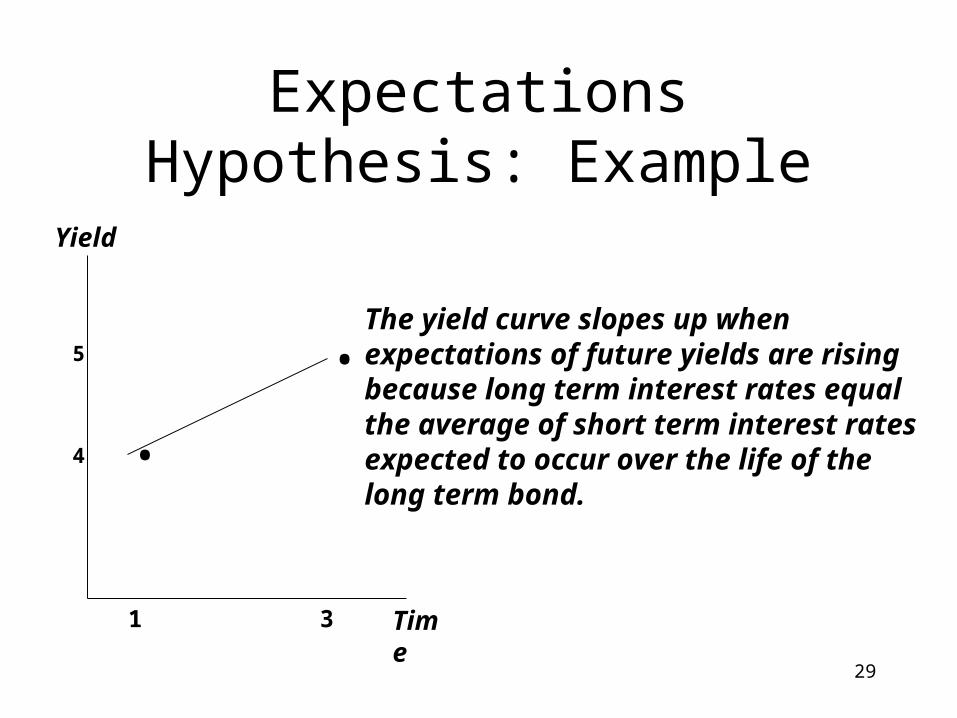
Expectations Hypothesis: Example
Time
Yield
5
4
1 3
.. The yield curve slopes up when
expectations of future yields are risingbecause long term interest rates equal the average of short term interest ratesexpected to occur over the life of thelong term bond.

30
The Shape of the Yield Curve
• The expectations hypothesis can explain why the yield curve changes shape.– Expectations of rising yields mean that investors expect
bond prices to fall.
– Since long-term bond prices fall by more than short- term bond prices, wealth maximizing investors sell long-term bonds and move into cash equivalents or short-term bonds.
– The decrease in demand causes long-term bond prices to fall and long term yields to rise.
– The yield curve slopes up and/or becomes steeper.

31
Expectations of Rising RatesPrice Price
0
0
0
0
Yield YieldS S
P1
P2
P2
P1
i1
i2
i2
i1
D1D2
D1
D2
Quantity of Long Term Bonds Quantity of Short Term Bonds
Upward Sloping Yield Curve

32
The Shape of the Yield Curve
• The expectations hypothesis can explain why the yield curve changes shape.– Expectations of falling yields mean that investors expect
bond prices to rise.– Since long-term bond prices rise by more than short-term
bond prices, wealth maximizing investors buy long-term bonds and move out of cash equivalents and short-term bonds.
– The increase in demand causes long-term bond prices to rise and long-term yields to fall.
– The yield curve slope flattens or inverts

33
Expectations of Falling RatesPrice Price
0
0
0
0
Yield YieldS S
P1 P1i1 i1
D1
D1
Quantity of Long Term Bonds Quantity of Short Term Bonds
Your turnDownward Sloping Yield Curve

34
Expectations Hypothesis: Summary
• The expectations hypothesis can explain why….– Interest rates on bonds with different maturities
move together over time.• A rise in short-term rates raises people’s
expectations of future short term rates.
• Long-term rates are an average of expected short rates so they rise when short-term rates rise.

35
Expectations Hypothesis: Summary
• The expectations hypothesis can explain why…– Yield curves tend to have an upward slope
when short term rates are low.• When short term rates are low, people expect them
to rise in the future. This causes the average of future expected short rates to be high relative to current short term rates. Consequently, long rates will rise, and the the yield curve will slope up.

36
Expectations Hypothesis: Summary
• The expectations hypothesis cannot explain why…– Yield curves usually slope upward.
• In reality, interest rates are just as likely to fall as to rise, so the yield curve if determined by expectations should be flat.

37
Segmented Markets Hypothesis• Assumptions:
– All investors are wealth maximizers.– Investors have specific preferences about the
maturity or term of a security.– Investors do not stray from their preferred maturity.
• Investors try to achieve the highest possible rate of return from holding one or more securities, but they do not move from one maturity to another.

38
Segmented Markets Hypothesis
• The slope of the yield curve is explained by different demand and supply conditions for bonds of different maturities.– If the yield curve slopes up, it does so because the
demand for short term bonds is relatively greater than the demand for long term bonds.
• Short term bonds have a higher price and a lower yield as a result of the relatively greater demand. So the yield curve slopes upward.

39
Segmented Markets HypothesisPrice Price
0
0
0
0
Yield YieldS S
P2s
P1s P1
l
P2l
i2s
i1s
i1l
i2l
D1s
D2s
D1l
D2l
Quantity of Short-term Bonds Quantity of Long-term Bonds
Upward Sloping Yield Curve
40
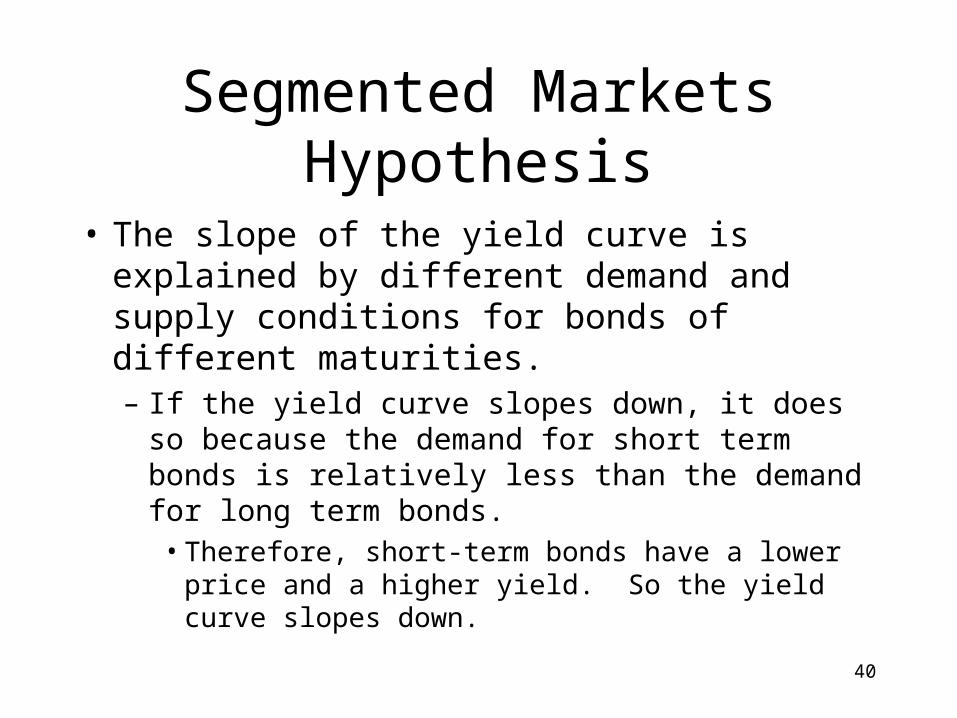
Segmented Markets Hypothesis
• The slope of the yield curve is explained by different demand and supply conditions for bonds of different maturities.– If the yield curve slopes down, it does so because
the demand for short term bonds is relatively less than the demand for long term bonds.
• Therefore, short-term bonds have a lower price and a higher yield. So the yield curve slopes down.

41
Segmented Markets HypothesisPrice Price
0
0
0
0
Yield YieldS S
P1s P1
li1s i1
l
D1s D1
l
Quantity of Short-term Bonds Quantity of Long-term Bonds
Downward Sloping Yield Curve Your turn!
42
Segmented Markets Hypothesis
• The segmented markets hypothesis explains why….– Yield curves typically slope upward.
• On average investors prefer bonds with shorter maturities that have less interest rate risk.
• Therefore, the demand for short term bonds is relatively greater than the demand for long-term bonds

43
Segmented Markets Hypothesis
• The segmented markets hypothesis cannot explain why…– Interest rates on different maturities move together.
• The segmented markets hypothesis assumes that short and long markets are completely segmented.
– Yield curves slope up when interest rates are low and down when interest rates are high.
• It is not clear how demand and supply for short versus long term bonds changes with the level of short term interest rates.
44
Preferred Habitat Hypothesis
• Assumptions:– All investors are wealth maximizers.– Bonds of different maturities are treated as
substitutes, but not perfect substitutes.– Investors prefer one maturity over another
• Short-term bonds are preferred to long-term bonds because investors are risk averse.
45
Preferred Habitat Hypothesis
• Investors try to achieve the highest possible rate of return from holding one or more securities.
• Investors are willing to move from one maturity to another, but they have a preferred habitat.

46
Preferred Habitat/Liquidity Premium Hypothesis
• Preferred Habitat Hypothesis– Interest rates on long-term bonds equal an average of
short-term rates that are expected to occur over the life of the bond plus a term premium that responds to supply and demand conditions for that bond.
• Liquidity Premium Hypothesis– A positive term (liquidity) premium must be offered
to buyers of longer term bonds to compensate them for their increased risk.
47
Preferred Habitat/Liquidity Premium
• The preferred habitat and liquidity premium theories can explain why…– Interest rates on different maturity bonds move
together over time.• A rise in short-term interest rates indicates that
short-term rates will, on average, be higher in the future.
• The liquidity premium on long-term bonds ensures an upward sloping yield curve.

48
Preferred Habitat/Liquidity Premium
• The preferred habitat and liquidity premium theories can explain why…– Yield curves tend to have a steep upward slope when
short term interest rates are low.• When short-term interest rates are low, investors
expect them to rise to some normal level.• Therefore, the average of future expected short-term
rates will be high relative to the current short rates.• Given the existence of a liquidity premium, long rates
must be substantially above current short rates.
49
Preferred Habitat/Liquidity Premium
• The preferred habitat and liquidity premium theories can explain why….– Yield curves tend to slope down when short term interest
rates are high.• When short-term interest rates are high, investors expect
them to fall to some normal level.• Therefore, the average of future expected short-term rates
will be low relative to the current short rates.• Given the existence of a liquidity premium, long rates will
be below current short rates, if rates are expected to fall by more than the liquidity premium.

50
Preferred Habitat/Liquidity Premium
• The preferred habitat and liquidity premium theories can explain why…– Yield curves typically slope upward.
• The term premium rises with a bond’s maturity because of investors’ preferences for short term bonds.
51
Yield Curves
• Conclusions:– A steeply rising yield curve indicates that short-term
interest rates are expected to rise in the future.
– A moderately rising yield curve indicates that short-term interest rates are not expected to rise or fall much in the future.
– A flat yield curve indicates that short-term rates are expected to fall moderately in the future.
– An inverted yield curve indicates that short-term interest rates are expected to fall sharply in the future.

52
Interest Rate Determination Becomes...
Nominal Rate = Real Rate + Expected Inflation + Risk Premium
+ Maturity Premium+ Liquidity Premium