Embed Size (px)
Citation preview

1
Spectroscopic ANALYSISPart 5 – Spectroscopic Analysis
using UV-Visible Absorption
Chulalongkorn University, Bangkok, Thailand January 2012
Dr Ron Beckett
Water Studies Centre & School of ChemistryMonash University, Melbourne, Australia
Email: [email protected]

2
UV-Visible Absorption Spectroscopy
1020 1018 1016 1014 1012 108
Cosm
ic
rays
-rays X-rays UV Vis
ible
Infrared Microwave
Electronic excitation
Bond breaking and ionization Vibration Rotation
Visible Spectrum
400 500 600 700
Absorption of UV and visible light by a molecule causes electronic excitation

3
UV-Visible spectral peaks result from electronic-vibrational transitions
Case (b) in the diagram is most common which gives the typical symmetric peak shape
4
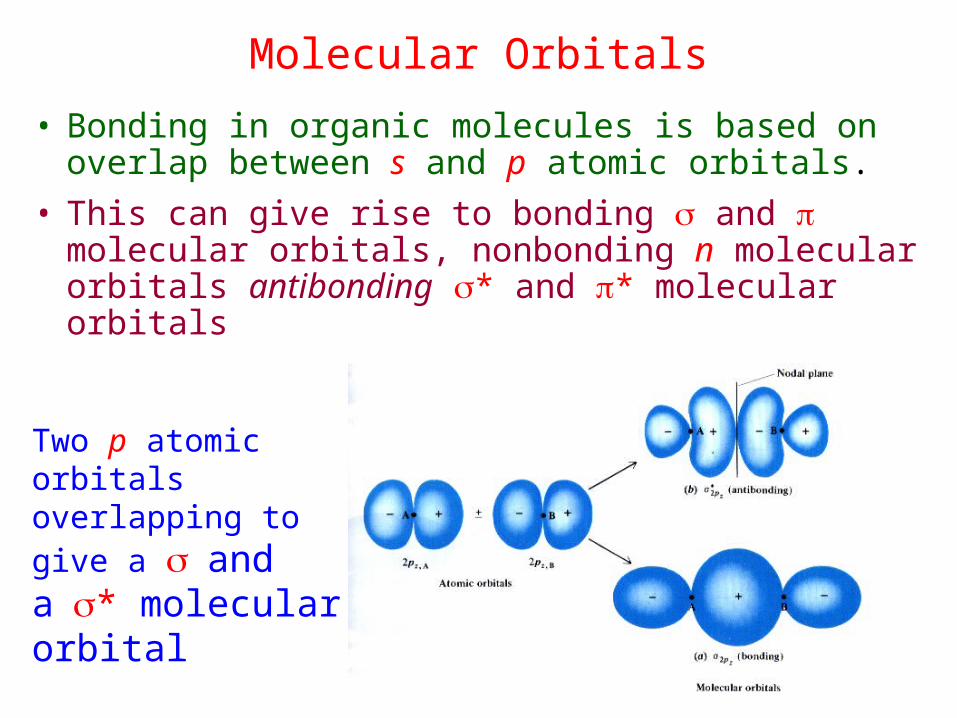
Molecular Orbitals
• Bonding in organic molecules is based on overlap between s and p atomic orbitals.
• This can give rise to bonding and molecular orbitals, nonbonding n molecular orbitals antibonding * and * molecular orbitals
Two p atomic orbitals overlapping to give a and a* molecular orbital

5
Molecular Orbitals
+
px px
*
Two p atomic orbitals overlapping to give a bonding molecular orbital and anonbonding*molecular orbital
A
A B
A
B
B
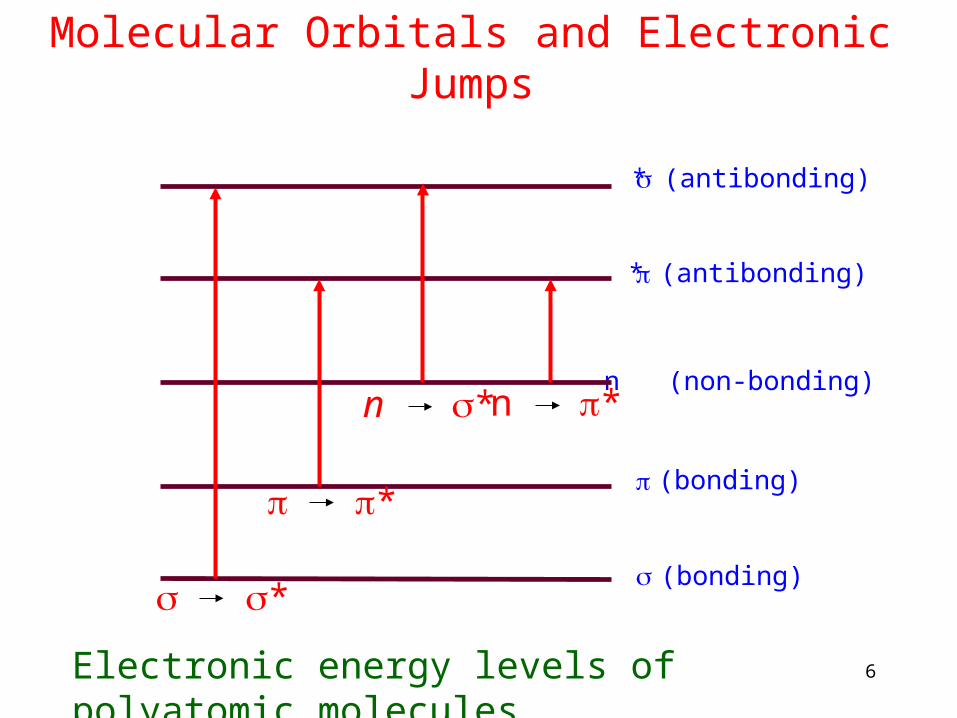
6Electronic energy levels of polyatomic molecules
* (antibonding)
* (antibonding)
n (non-bonding)
(bonding)
(bonding)
Molecular Orbitals and Electronic Jumps
*
*
n * n *
7
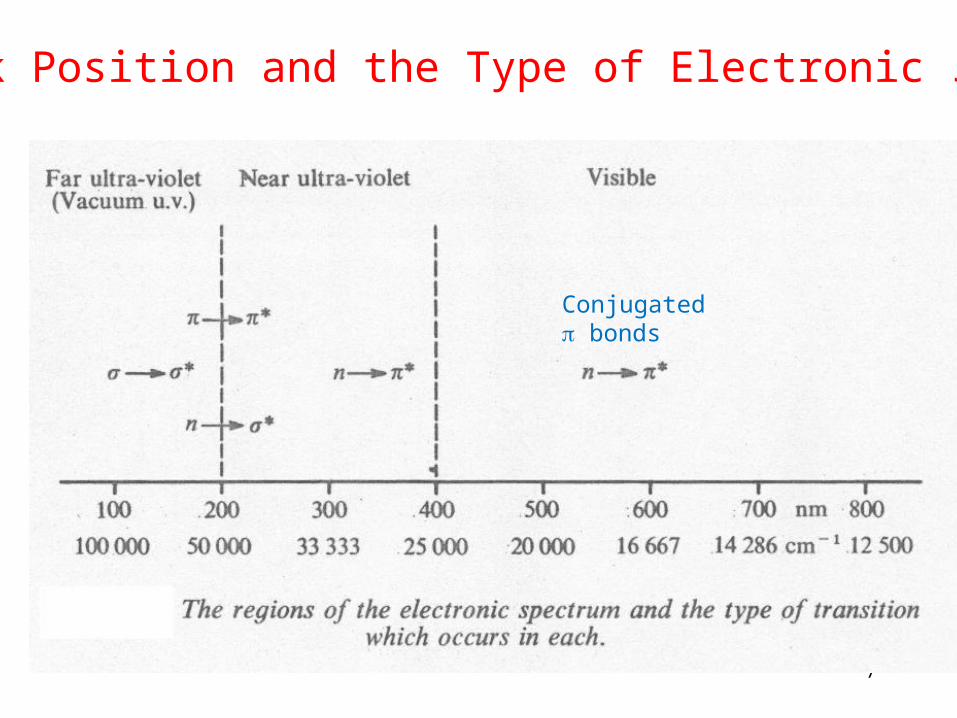
Peak Position and the Type of Electronic Jump
Conjugated bonds
8
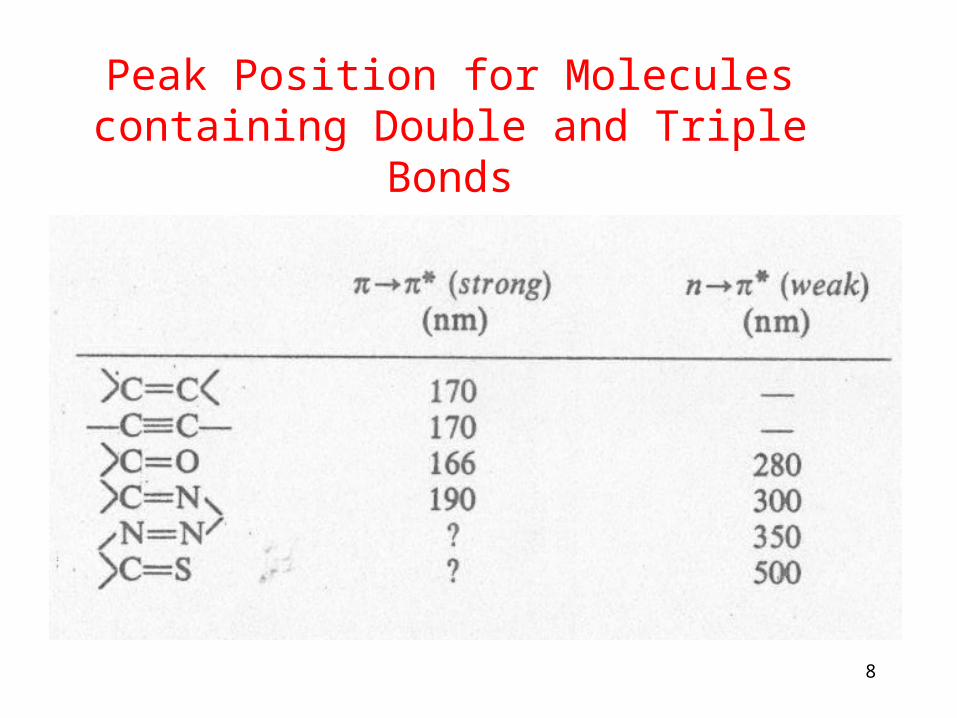
Peak Position for Molecules containing Double and Triple Bonds

9
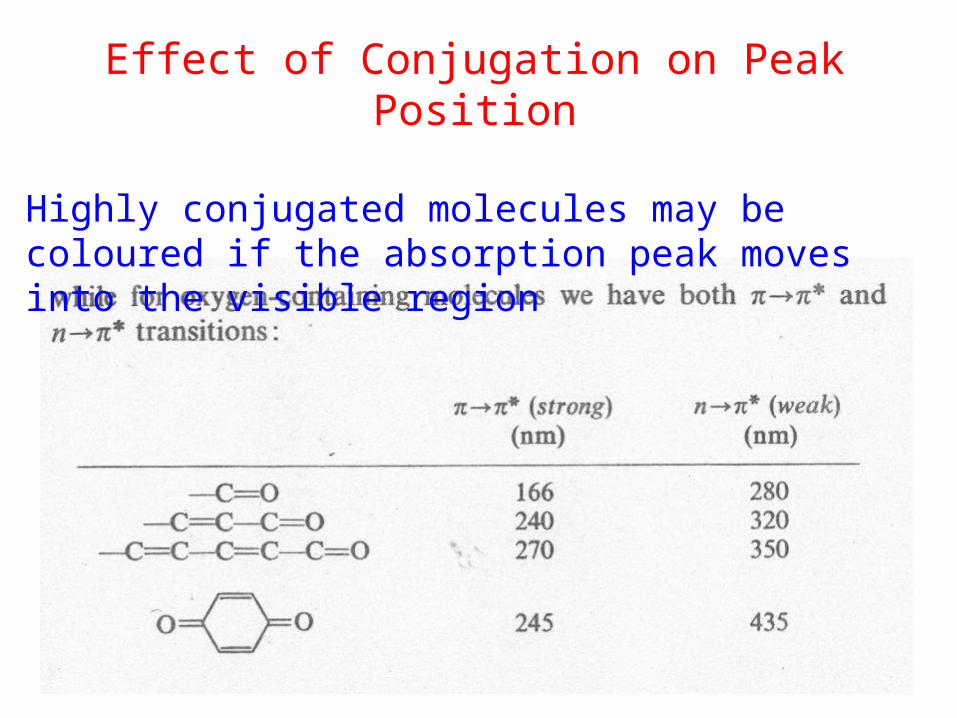
Effect of Conjugation on Peak Position
The greater the number of conjugated double bonds the lower the energy jump and higher the wavelength of the UV-visible peak
*
10
Effect of Conjugation on Peak Position
Highly conjugated molecules may be coloured if the absorption peak moves into the visible region

11
Question Time !
Fanta has red and green colours !
Will red light pass through each of these solutions or will it be absorbed ?
(a) (b) (c) (d)
12
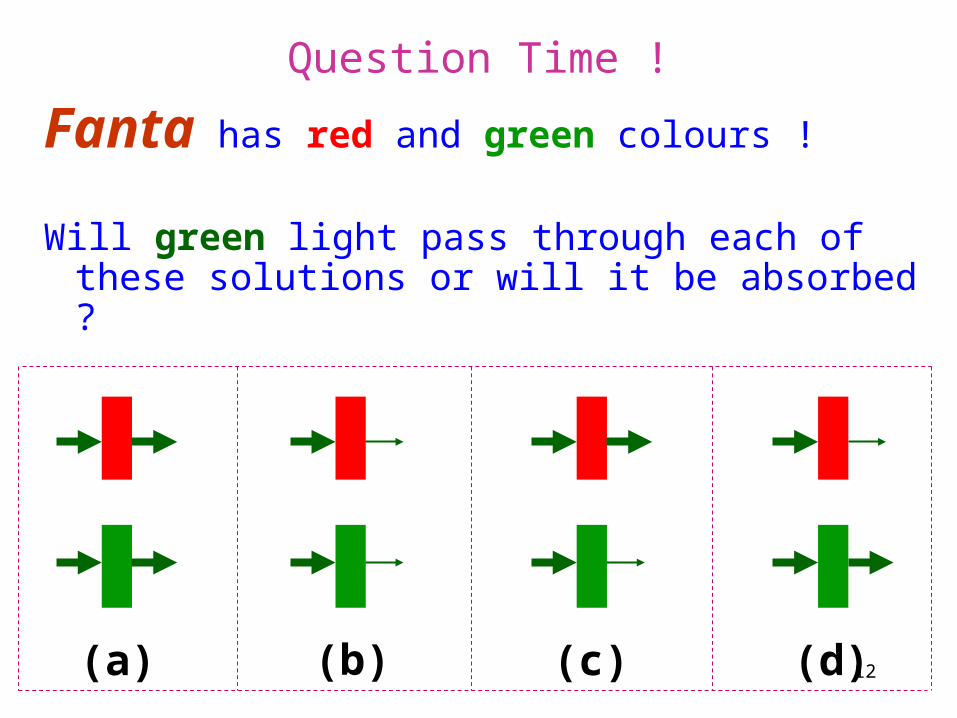
Question Time !
Fanta has red and green colours !
Will green light pass through each of these solutions or will it be absorbed ?
(a) (b) (c) (d)

13
Complementary Colours
ofmaximumabsorption
Colour Absorbed Colour Observed
380-440 violet-blue green-yellow
440-500 blue-green orange-red
500-580 green-yellow violet-blue
580-680 orange-red blue-green
680-780 purple green
When white light is absorbed by a chromophore, the eye detects the colours that are notnot absorbed. This is called the complementary colour to the colour absorbed.
V I B G Y O R

14
Colorimetric Analysis
Used for determination of the concentration of analytes in solution when:
1. The analyte is a coloured compound
2. The analyte produces a coloured species when a suitable reagent is added

15
Colorimetric Analysis
Photometric measurement
(a) visual comparison using colour standards
P Po
Determination of concentration depends on detection of change in colour intensity (absorption) at a particular wavelength.
Eye

16
Colorimetric Analysis(b) Colorimeter/Photometer
• Filters used to select a wavelength range
• Detection with photosensing device
PPo
Filter
wheel
Photodetector

17
Spectrophotometric Analysis(c) Spectrophotometer
– Spectral bandwidth ≤ 1 nm, i.e very monochromatic light.
– can operate in both the visible and UV ranges
– Colorimetry and spectrophotometry provide sensitivesensitive methods of analysis, i.e. ppm to ppb ranges.
PPo
PhotodetectorMonochromator
Prism or Grating Phototube, photomultiplier or photodiode
18
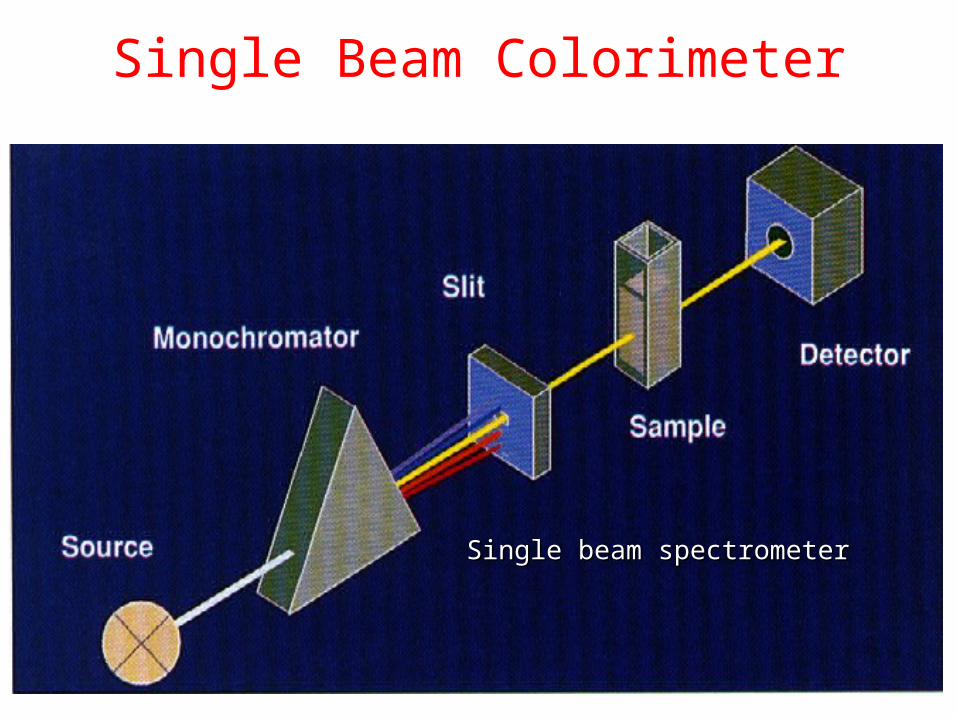
Single Beam Colorimeter•
Single beam spectrometerSingle beam spectrometer

19
Quantifying Light Absorption
Incident Light Intensity (PI) (sometimes Ii is used)
PI = Pr + Pa(solvent) + Pa(solute) + P
Pa(solvent) & Pa(solute) are absorbed light intensities
Pr ≈ 4% for air-glass interface
PPI
b
Absorbing solution of concentration,c.
Reflected beam
PrPa(solvent)
Pa(solute)Incident beam Transmitted beam

20
Quantifying Light Absorption
Transmitted Light (P0)
PI = Pr + Pa(solvent) + P0
P0 = PI - Pr - Pa(solvent)
P0PI
b
Absorbing solvent
Reflected beam
Pr
Pa(solvent)
Incident beam Transmitted beam
Intensity lost due to reflection and solvent absorption are removed by measuring the transmitted intensity of a blank containing only solvent
21
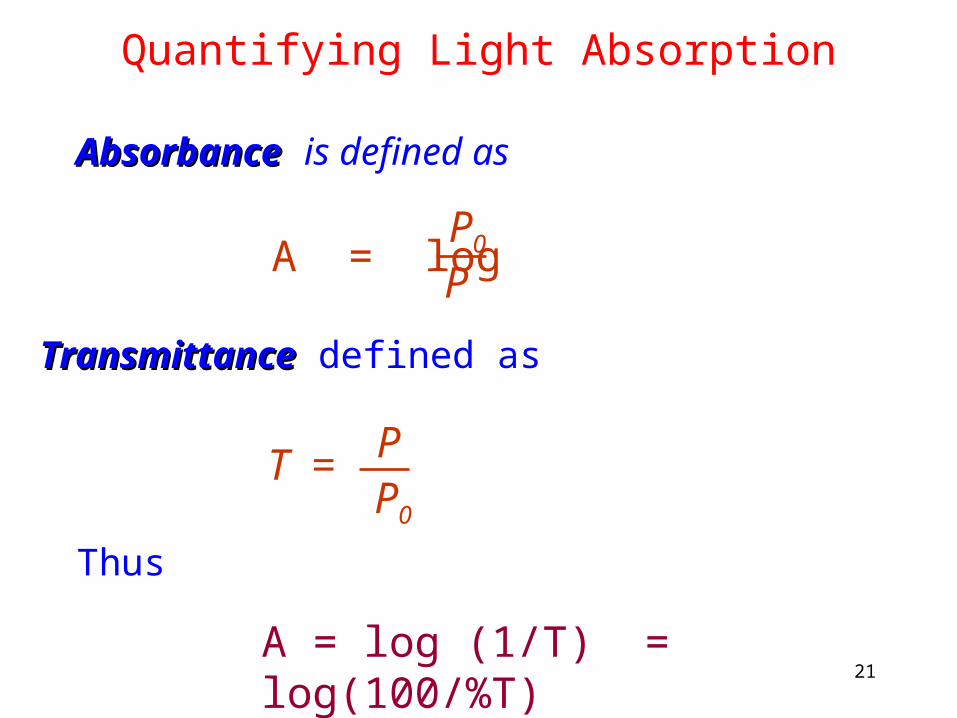
Quantifying Light Absorption
A = log P0
P
AbsorbanceAbsorbance is defined as
A = log (1/T) = log(100/%T)
TransmittanceTransmittance defined as
T = PP0
Thus

22
Relationship between Absorbance and Concentration
Beer-Lambert Law
A = l c
Where:• l is the path length in cmpath length in cm• c is the concentration concentration in mol/L • is the molarmolar absorptivityabsorptivity

23
Applications of the Beer-Lambert Law
Analysis of a single analyte1. Measure absorbance of a series of standard solutions
2. Plot a standard curve (should be a straight line ?)
3. Measure absorbance of unknown samples
4. Use standard curve to measure concentrations
Assumptions
– At fixed and l, is constant for a given solute
– the chemical matrix of the standards is the same as the sample.
Ax
Cx
4
3
2
1
0 2 3
A
A
A
A
A0
C C 1 C C C 4
Concentration
A = l c
24
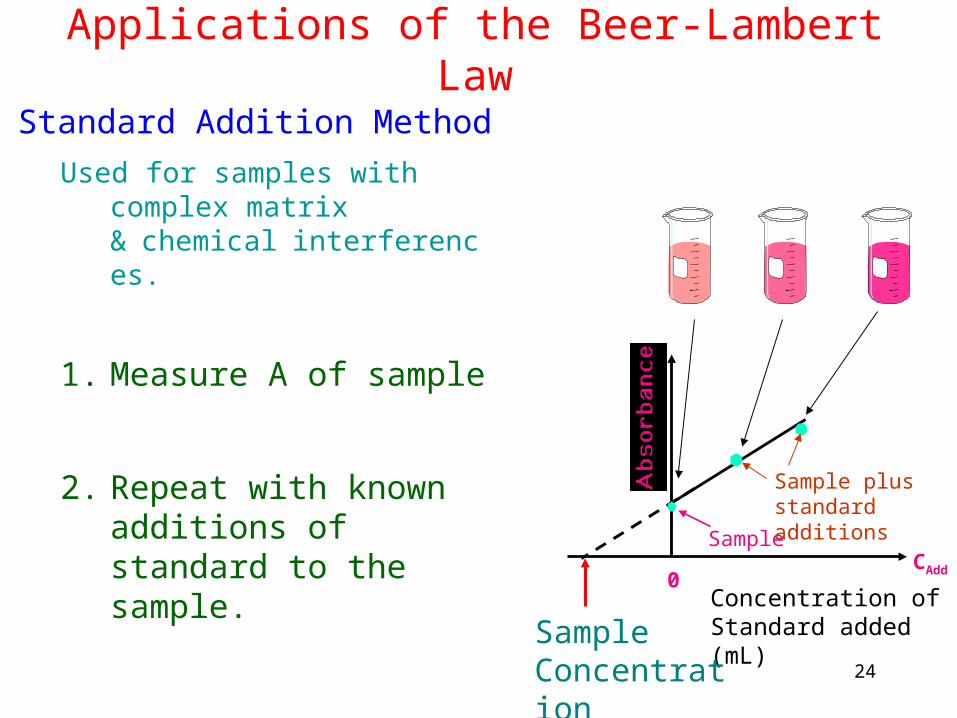
Standard Addition Method
Used for samples with complex matrix &chemicalinterferences.
1. Measure A of sample
2. Repeat with known additions of standard to the sample.
Applications of the Beer-Lambert Law
Concentration of Standard added (mL)
0CAdd
Sample
Sample plus standard additions
Sample Concentration

25
Limitations of the Beer-Lambert Law
Concentration effects– B-L law applies to dilute solutions (negligible interaction
between solute ions).
– Higher concentrations of analyte (i.e. > 10-2 M) or high electrolyte concentrations, may produce molecular/ionic interactions which result inreduced light absorption at somewavelengths.
Concentration
Deviation from B-L law (loss of sensitivity)
Adherence to B-L law
26
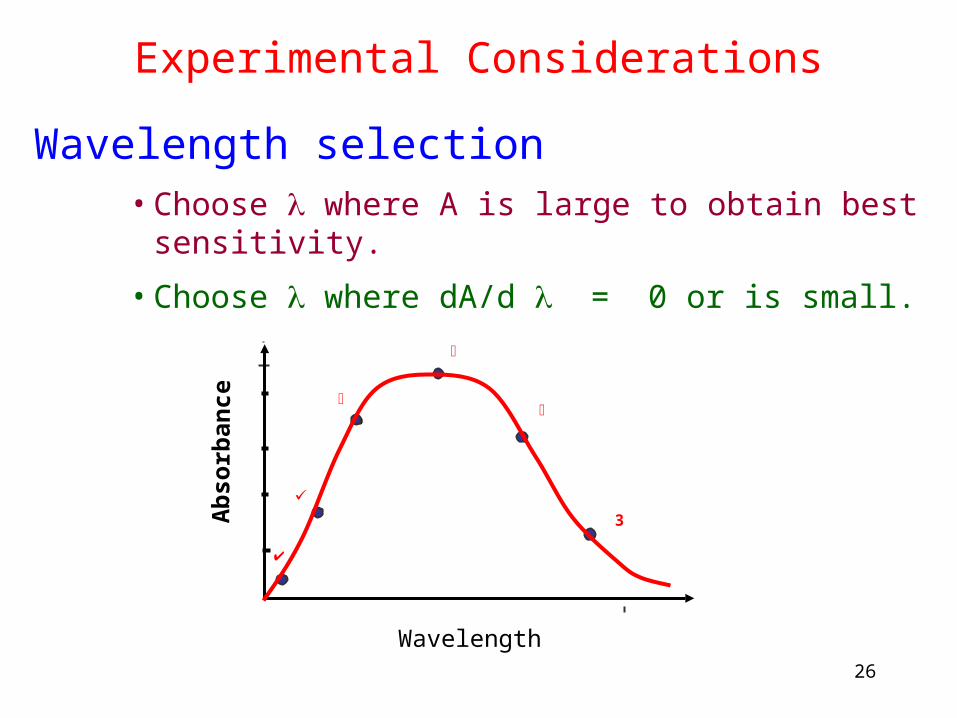
Experimental Considerations
Wavelength selection• Choose where A is large to obtain best sensitivity.
• Choose where dA/d = 0 or is small.A
bso
rban
ce
3
Wavelength
27
Experimental Considerations
Choice of reagents for colorimetric analysis
– Should be stable and pure
– Should not absorb at of measurement
– Should react rapidly with analyte to give a stable
coloured compound (chromophore).
– Absorptivity, should not be sensitive to minor
changes in pH, Temp., electrolyte changes, etc.
– Should be selective for the analyte of interest.