Embed Size (px)
Citation preview
1Hong Kong Toys & Games Fair 2006
Prepared for Hong Kong Trade Development Council
January 2006
Hong Kong Toys & Games Fair 2006
2Hong Kong Toys & Games Fair 2006
METHODOLOGY
Timing of Fieldwork : January 9 - 10, 2006
Target group : 410 exhibitors; 705 buyers
Fieldwork : Face-to-face interview at the
Exhibition Venue

3Hong Kong Toys & Games Fair 2006
EXHIBITORS’ AND BUYERS’ BACKGROUND INFORMATION
4Hong Kong Toys & Games Fair 2006
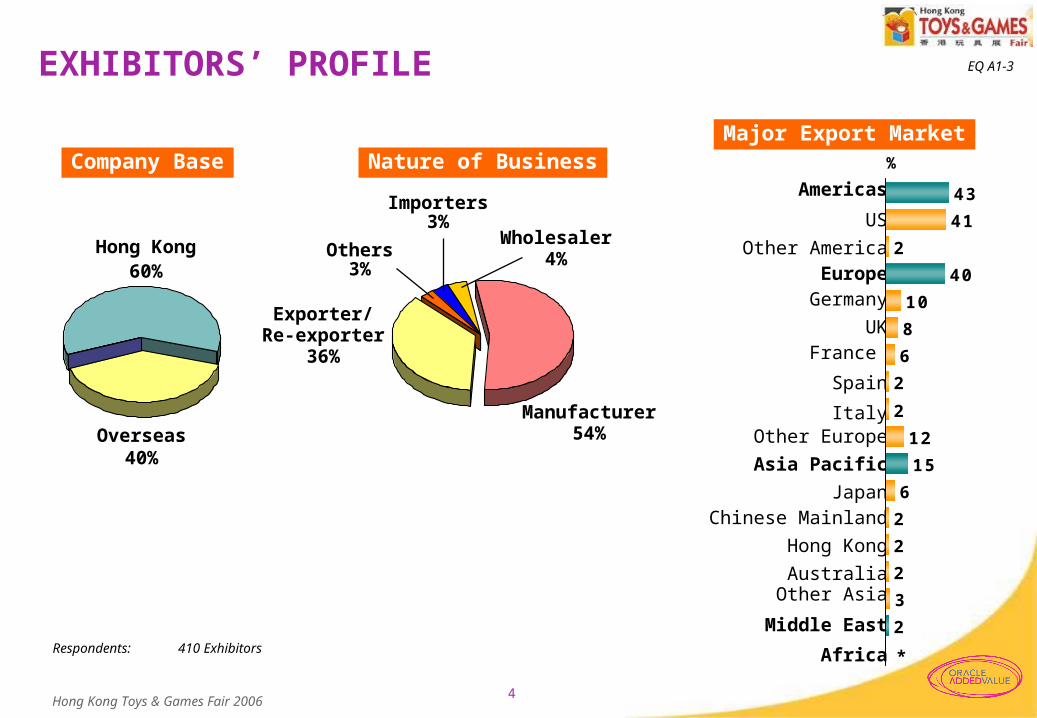
Respondents: 410 Exhibitors
Hong Kong60%
Overseas40%
Exporter/ Re-exporter
36%
Others3%
Manufacturer54%
Americas
US
Other AmericaEurope
Germany
UKFrance
Spain
ItalyOther Europe
Asia Pacific
JapanChinese Mainland
Hong Kong
AustraliaOther Asia
Middle East
Africa
%
EXHIBITORS’ PROFILE EQ A1-A3
Company BaseMajor Export Market
Nature of Business
EQ A1-3
43
40
15
41
2
10
8
6
2
2
12
6
2
2
2
3
2
Wholesaler4%
Importers3%
*
5Hong Kong Toys & Games Fair 2006
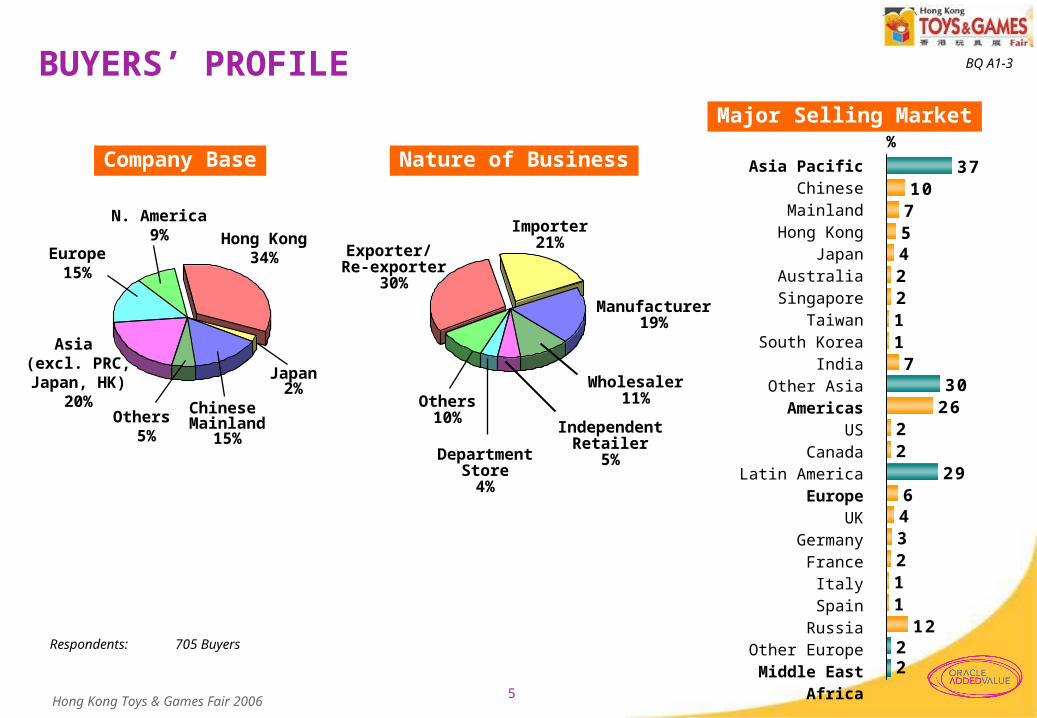
Respondents: 705 Buyers
Hong Kong34%
Chinese Mainland
15%Others
5%
Europe15%
Asia (excl. PRC,Japan, HK)
20%
Exporter/ Re-exporter
30%
Importer21%
Others10%
Wholesaler11%
Manufacturer19%
N. America9%
Japan2%
Asia PacificChinese Mainland
Hong KongJapan
AustraliaSingapore
TaiwanSouth Korea
IndiaOther AsiaAmericas
USCanada
Latin AmericaEurope
UKGermany
FranceItaly
SpainRussia
Other EuropeMiddle East
Africa
BUYERS’ PROFILE BQ A1-A3
Company Base
Major Selling Market
Nature of Business
BQ A1-3
37
30
29
2
107
422117
2622
643
122
112
5
%
IndependentRetailer
5%DepartmentStore4%

6Hong Kong Toys & Games Fair 2006
TOYS & GAMES MARKET OVERVIEW AND FORECAST
7Hong Kong Toys & Games Fair 2006
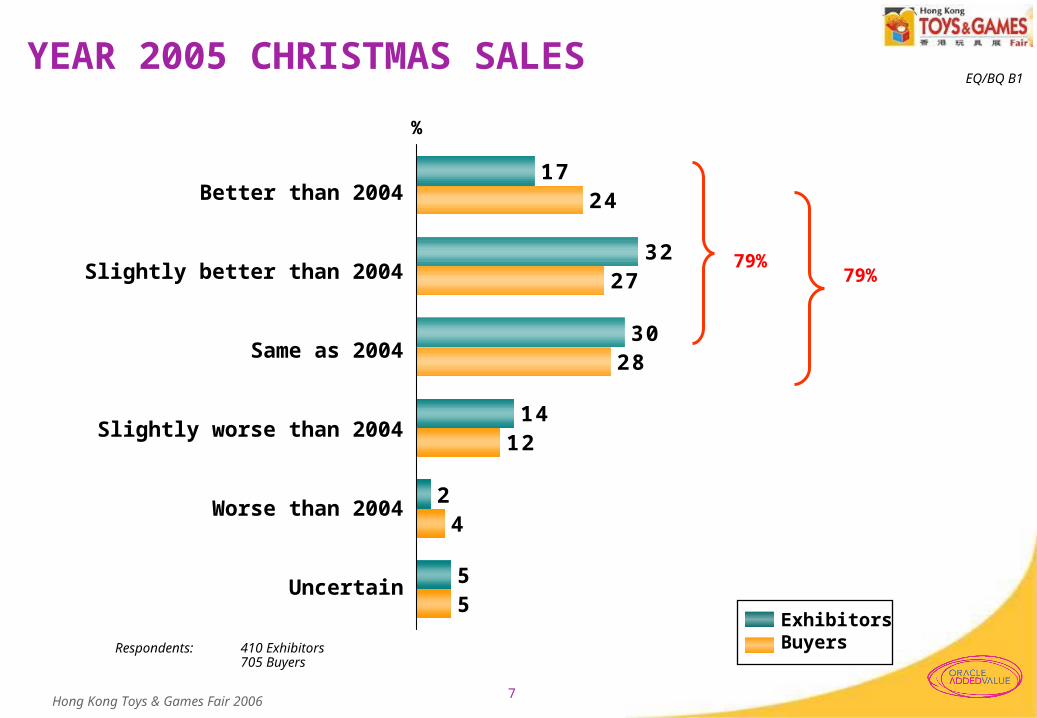
17
32
30
14
2
5
24
27
28
12
4
5
Better than 2004
Slightly better than 2004
Same as 2004
Slightly worse than 2004
Worse than 2004
Uncertain
%
YEAR 2005 CHRISTMAS SALESEQ/BQ B2EQ/BQ B1
ExhibitorsBuyers
79% 79%
Respondents: 410 Exhibitors705 Buyers
8Hong Kong Toys & Games Fair 2006
19
42
28
6
2
4
21
39
31
5
1
4
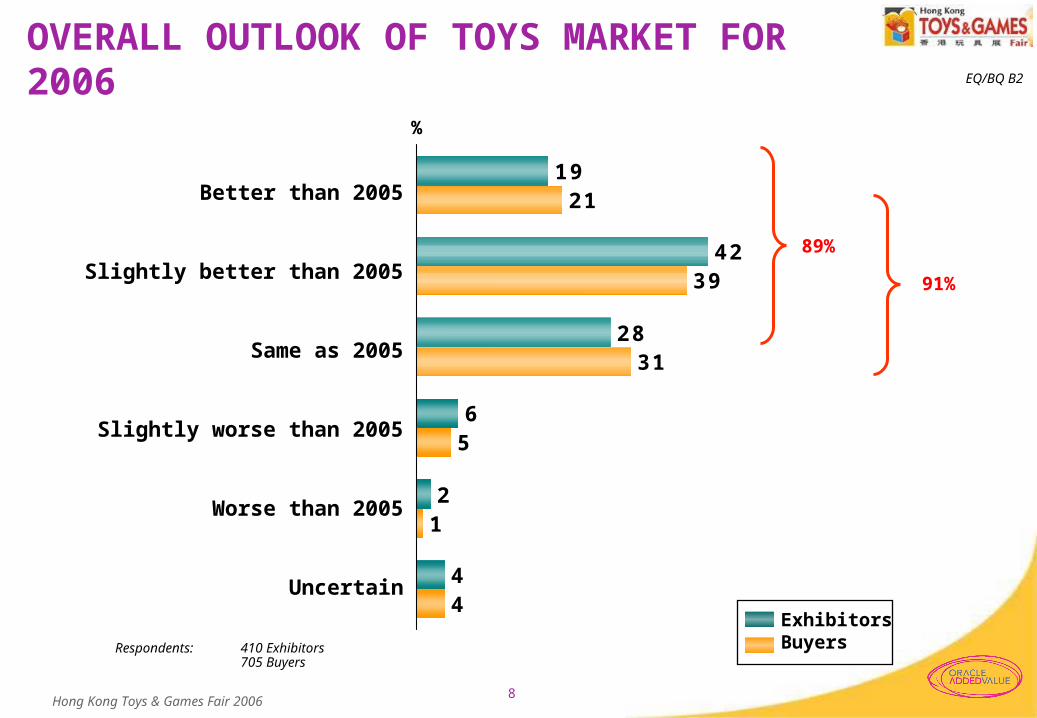
Better than 2005
Slightly better than 2005
Same as 2005
Slightly worse than 2005
Worse than 2005
Uncertain
%
OVERALL OUTLOOK OF TOYS MARKET FOR 2006 EQ/BQ B2EQ/BQ B2
ExhibitorsBuyers
89%
91%
Respondents: 410 Exhibitors705 Buyers
9Hong Kong Toys & Games Fair 2006
45
10
41
20
18
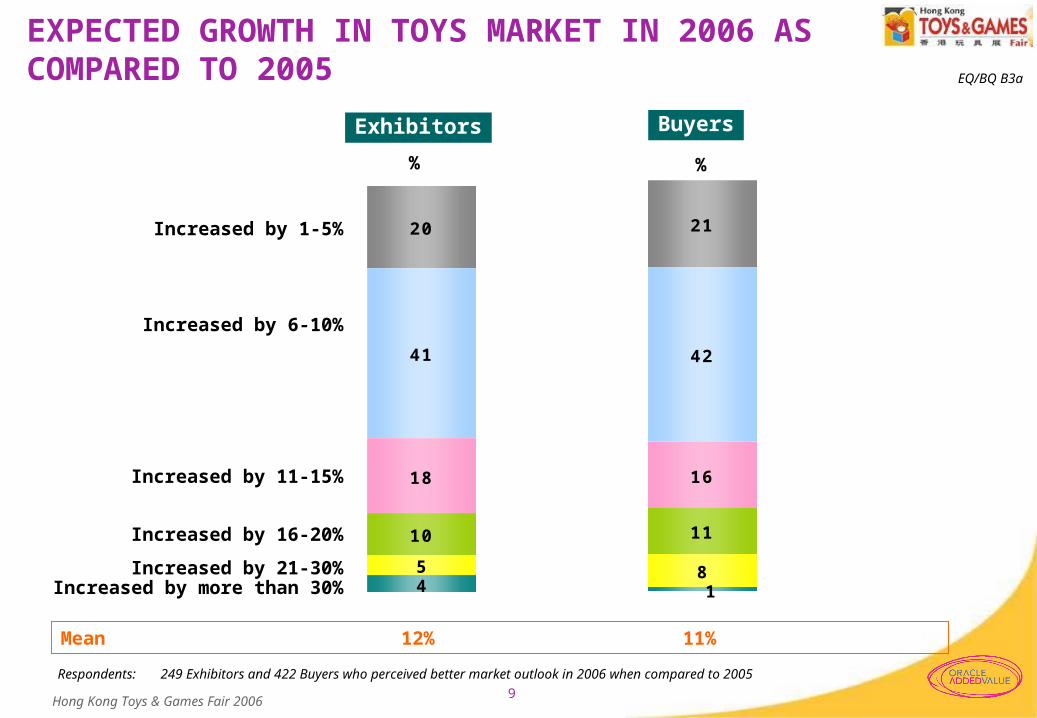
Increased by 1-5%
Increased by 6-10%
Increased by 11-15%
Increased by 16-20%
Increased by 21-30%Increased by more than 30%
%
EXPECTED GROWTH IN TOYS MARKET IN 2006 AS COMPARED TO 2005 EQ/BQ B2EQ/BQ B3a
Respondents: 249 Exhibitors and 422 Buyers who perceived better market outlook in 2006 when compared to 2005
%
Exhibitors Buyers
Mean 12% 11%
8
11
42
21
1
16
10Hong Kong Toys & Games Fair 2006
BQ E1
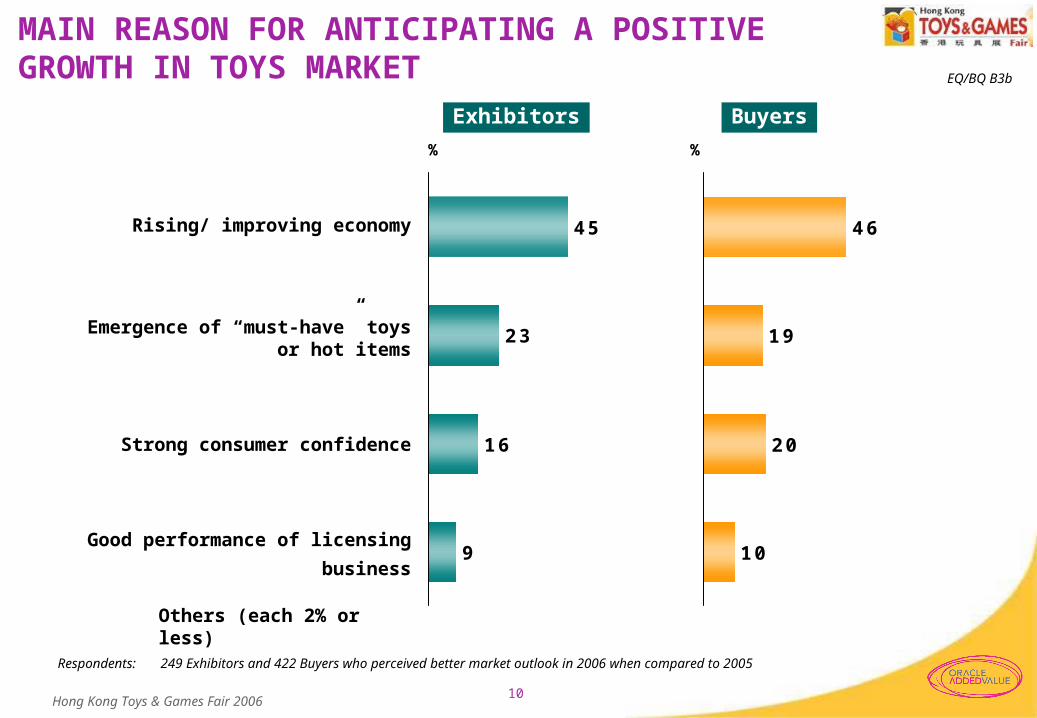
MAIN REASON FOR ANTICIPATING A POSITIVE GROWTH IN TOYS MARKET EQ/BQ B3b
45
23
16
9
Rising/ improving economy
Emergence of “must-have” toys or hot items
Strong consumer confidence
Good performance of licensing
business
% %
Exhibitors Buyers
46
19
20
10
Respondents: 249 Exhibitors and 422 Buyers who perceived better market outlook in 2006 when compared to 2005
Others (each 2% or less)

11Hong Kong Toys & Games Fair 2006
BUYERS’ SOURCING PRACTICES
12Hong Kong Toys & Games Fair 2006
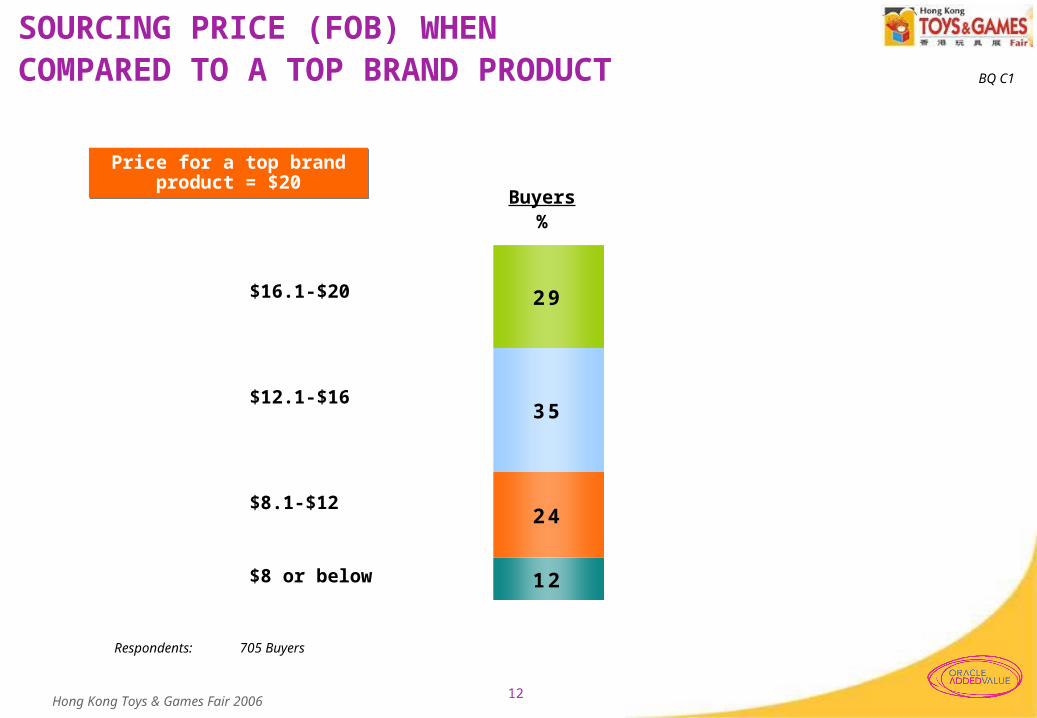
SOURCING PRICE (FOB) WHEN COMPARED TO A TOP BRAND PRODUCT EQ E1
Price for a top brand product = $20
Price for a top brand product = $20
BQ C1
Buyers%
$8 or below
$16.1-$20
$8.1-$12
$12.1-$16
12
24
35
29
Respondents: 705 Buyers
13Hong Kong Toys & Games Fair 2006
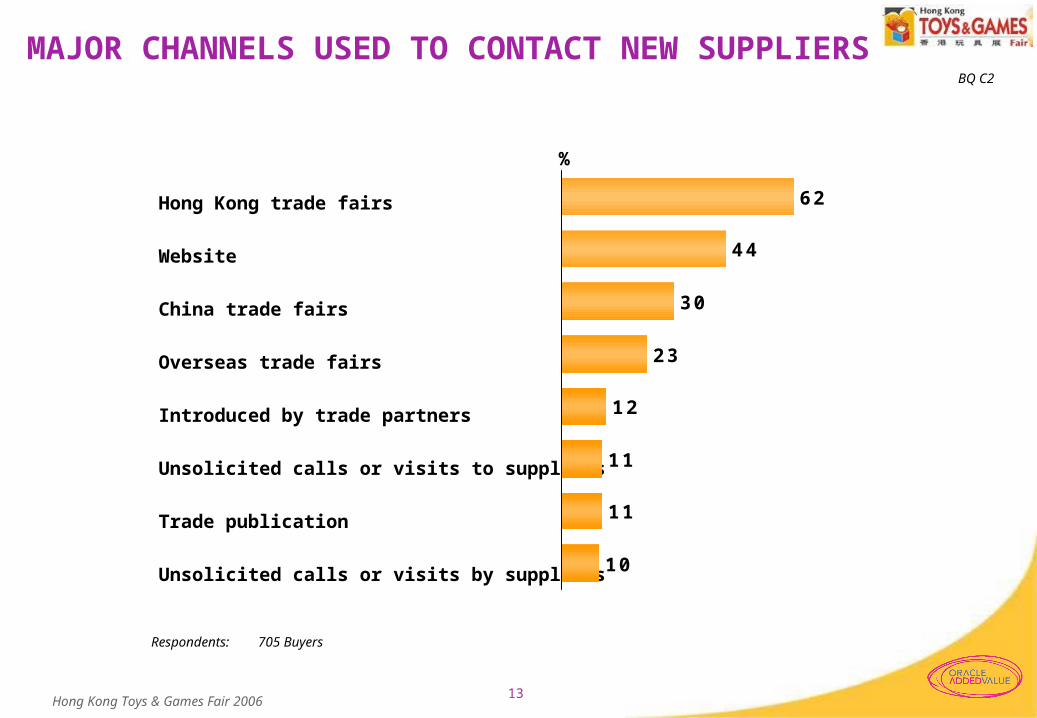
MAJOR CHANNELS USED TO CONTACT NEW SUPPLIERS EQ D1-D4
Respondents: 705 Buyers
BQ C2
Hong Kong trade fairs
Website
China trade fairs
Overseas trade fairs
Introduced by trade partners
Unsolicited calls or visits to suppliers
Trade publication
Unsolicited calls or visits by suppliers
%
62
44
30
23
12
11
11
10

14Hong Kong Toys & Games Fair 2006
PRODUCT AND MARKET TRENDS
15Hong Kong Toys & Games Fair 2006
33
21
19
6
8
3
2
2
1
1
25
22
15
12
3
3
8
2
4
5
16
18
18
13
12
2
7
3
3
13
19
19
17
5
4
5
3
4
4
21
17
21
8
4
13
8
4
32
17
11
6
4
2
2
11
2
4
25
21
20
15
1
3
6
4
1
1
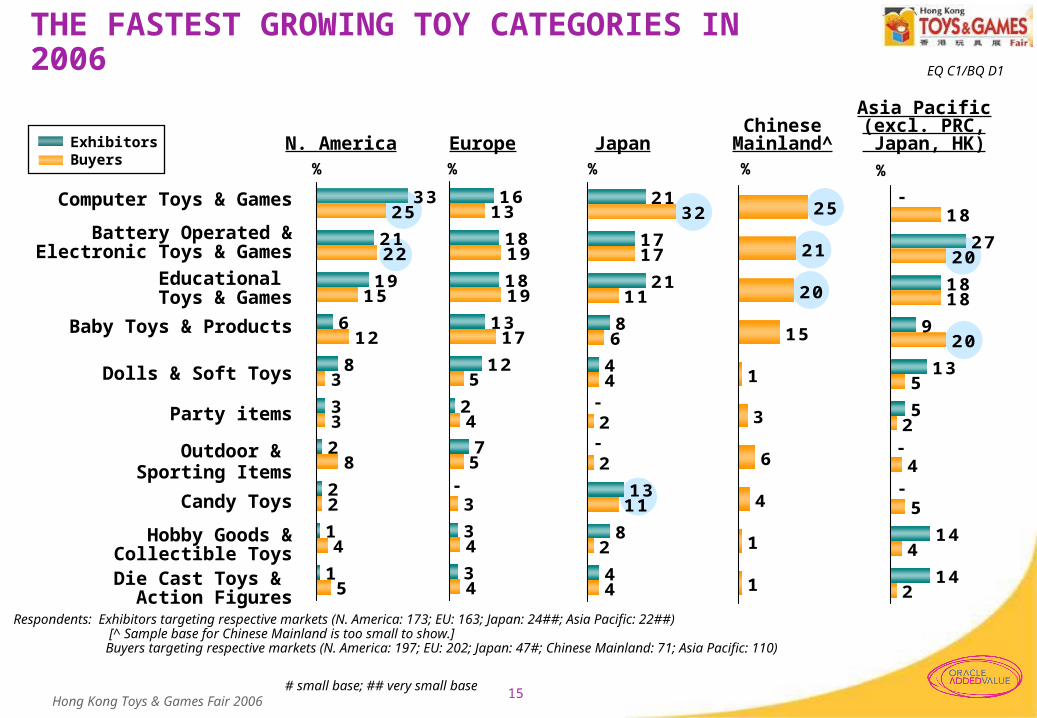
Respondents: Exhibitors targeting respective markets (N. America: 173; EU: 163; Japan: 24##; Asia Pacific: 22##) [^ Sample base for Chinese Mainland is too small to show.]
Buyers targeting respective markets (N. America: 197; EU: 202; Japan: 47#; Chinese Mainland: 71; Asia Pacific: 110)
Computer Toys & Games
Battery Operated & Electronic Toys & Games
Educational Toys & Games
Baby Toys & Products
Dolls & Soft Toys
Party items
Outdoor & Sporting Items
Candy Toys
Hobby Goods & Collectible ToysDie Cast Toys &
Action Figures
THE FASTEST GROWING TOY CATEGORIES IN 2006
EQ/BQ C1
Asia PacificChinese (excl. PRC,
N. America Europe Japan Mainland^ Japan, HK)% % % % %
# small base; ## very small base
27
18
9
13
5
14
14
18
20
18
20
5
2
4
5
4
2
ExhibitorsBuyers
EQ C1/BQ D1
-
-
-
-
-
-
16Hong Kong Toys & Games Fair 2006
5% or less
6 – 10%
11 – 15%
16 – 30%
More than 30%
EQ C4/BQ C8
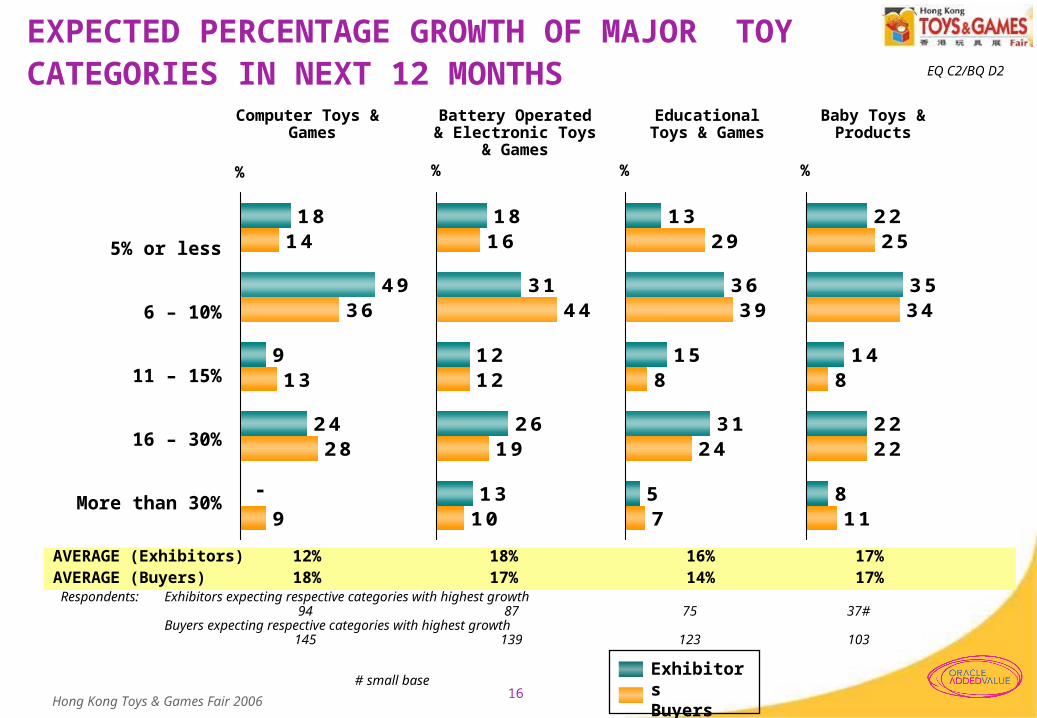
Respondents: Exhibitors expecting respective categories with highest growth94 87 75 37#
Buyers expecting respective categories with highest growth145 139 123 103
AVERAGE (Exhibitors) 12% 18% 16% 17%AVERAGE (Buyers) 18% 17% 14% 17%
Battery Operated & Electronic Toys
& Games% % %
EXPECTED PERCENTAGE GROWTH OF MAJOR TOY CATEGORIES IN NEXT 12 MONTHS EQ C2/BQ D2
ExhibitorsBuyers
Educational Toys & Games
Computer Toys & Games
Baby Toys & Products
18
49
9
24
14
36
13
28
9
18
31
12
26
13
16
44
12
19
10
13
36
15
31
5
29
39
8
24
7
22
35
14
22
8
25
34
8
22
11
%
-
# small base

17Hong Kong Toys & Games Fair 2006
CARE PROCESS
18Hong Kong Toys & Games Fair 2006
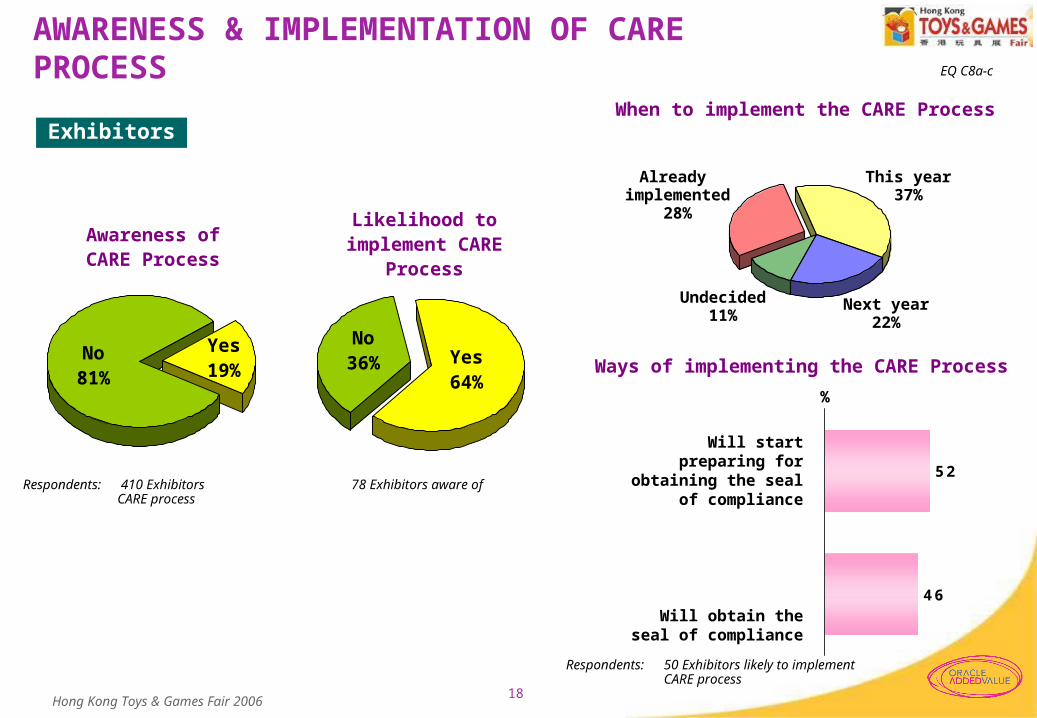
AWARENESS & IMPLEMENTATION OF CARE PROCESS BQ E1
Exhibitors
Respondents: 50 Exhibitors likely to implement CARE process
EQ C8a-c
No81%
Yes19%
Will start preparing for obtaining the
seal of compliance
Will obtain the seal of compliance
Ways of implementing the CARE Process
52
46
%
Awareness of CARE Process
No36% Yes
64%
Likelihood to implement CARE
Process
Respondents: 410 Exhibitors 78 Exhibitors aware of CARE process
When to implement the CARE Process
This year37%
Already implemented
28%
Next year22%
Undecided11%
19Hong Kong Toys & Games Fair 2006
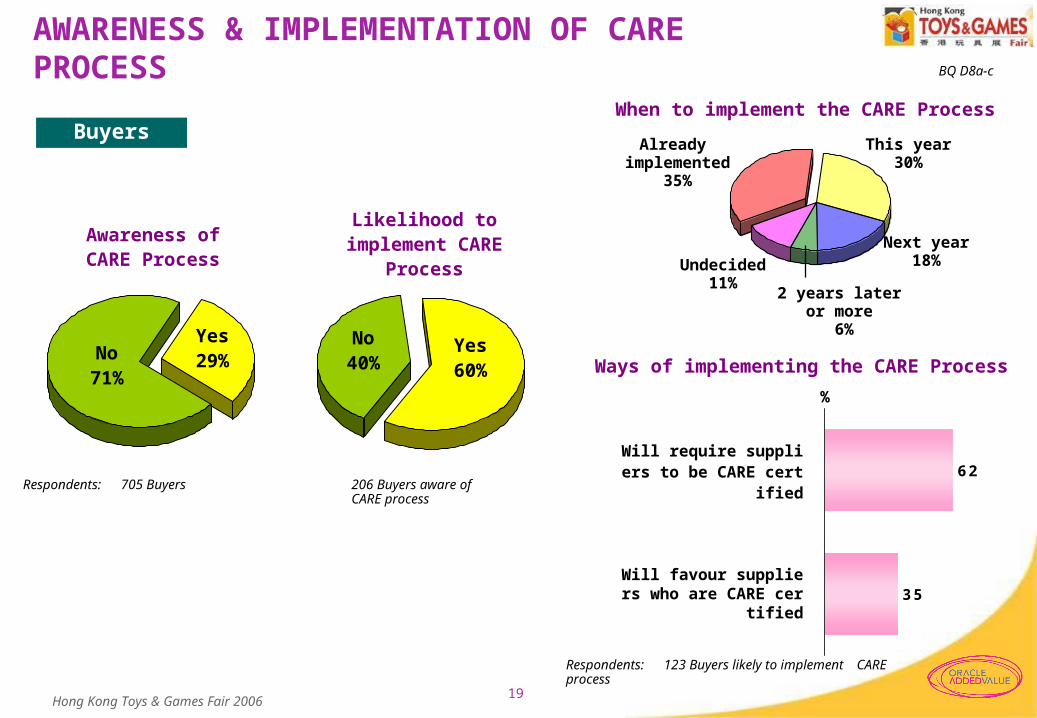
AWARENESS & IMPLEMENTATION OF CARE PROCESS BQ E1
Buyers
Respondents: 123 Buyers likely to implement CARE process
BQ D8a-c
No71%
Yes29%
Will require suppliers to be CARE certified
Will favour suppliers who are CARE certified
Ways of implementing the CARE Process
62
35
%
Awareness of CARE Process
No40%
Yes60%
Likelihood to implement CARE
Process
Respondents: 705 Buyers 206 Buyers aware of CARE process
When to implement the CARE Process
This year30%
Already implemented
35%
Next year18%Undecided
11%2 years later
or more 6%

20Hong Kong Toys & Games Fair 2006
EXECUTIVE SUMMARY
21Hong Kong Toys & Games Fair 2006
SUMMARY - I
MARKET OUTLOOK
Sales during the Christmas period in 2005 was satisfactory. Around half of the respondent found it better than the previous year.
Both exhibitors and buyers continue to be confident with the market prospect. Around 90% of them believe the overall toy market will stay positive or become even better in 2006.
Among those who anticipate a positive market growth in 2006, majority expects an increase of at least 6%.
Both exhibitors and buyers envisage the improving economy will be the main contributor to the growth.Exhibitors also expect “must-have” toys or hot toy items will
turn up as a stimulator of the market.Buyers believe the stronger consumer confidence is another
reason for their anticipation.
22Hong Kong Toys & Games Fair 2006
SUMMARY - II
PRODUCT & MARKET TRENDS
Both exhibitors and buyers foresee “Computer Toy & Games” to be the fastest-growing toy category in 2006, followed by “Battery Operated & Electronic Toys & Games” and “Educational Toys & Games”. Participants believe the average growth rate of the top-3 toy categories will be ranging from 12 – 18%.
BUYERS’ SOURCING PRACTICES
A renowned brand name is certainly a powerful driver of the profit margin. When buyers are sourcing a toy with comparable features and quality to those produced by top brands, more than one-third of them expect it to be 20 – 40% cheaper. However, nearly 40% expect it to be further cheaper.
23Hong Kong Toys & Games Fair 2006
SUMMARY - III
CARE Process
CARE Process is more widely known among buyers than exhibitors. 29% of the buyers is aware of this international toy industry's ethical manufacturing programme, compared to 19% for the exhibitors.
Among those who are aware of the programme, over 60% have already implemented or will implement it in the near future. Participants are planning to achieve the programme by obtaining the seal of compliance or require/ favour suppliers who are CARE certified.
24Hong Kong Toys & Games Fair 2006