Embed Size (px)
Citation preview

1
FINANCIAL ANALYSIS
2
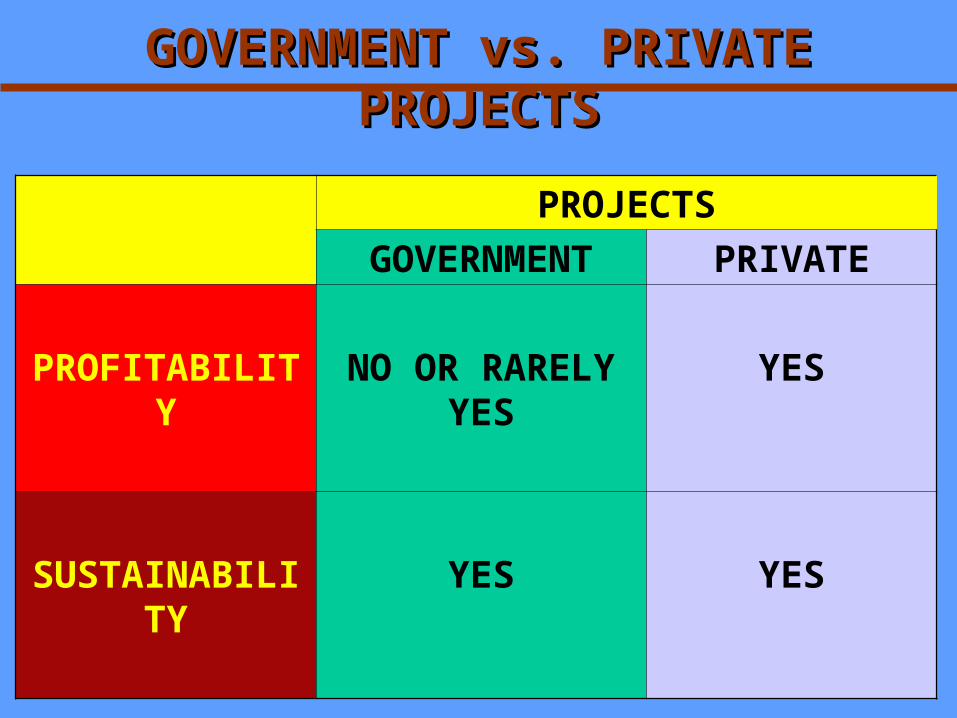
GOVERNMENT vs. PRIVATE GOVERNMENT vs. PRIVATE PROJECTSPROJECTS
PROJECTS
GOVERNMENT PRIVATE
PROFITABILITY
NO OR RARELY YES
YES
SUSTAINABILITY
YES YES

3
GOVERNMENT vs. PRIVATE GOVERNMENT vs. PRIVATE PROJECTSPROJECTS
GOVERNMENT PROJECTS
IS MORE FOCUS ON SERVICE
PRIVATE PROJECTS IS
MORE FOCUS ON PROFIT
4
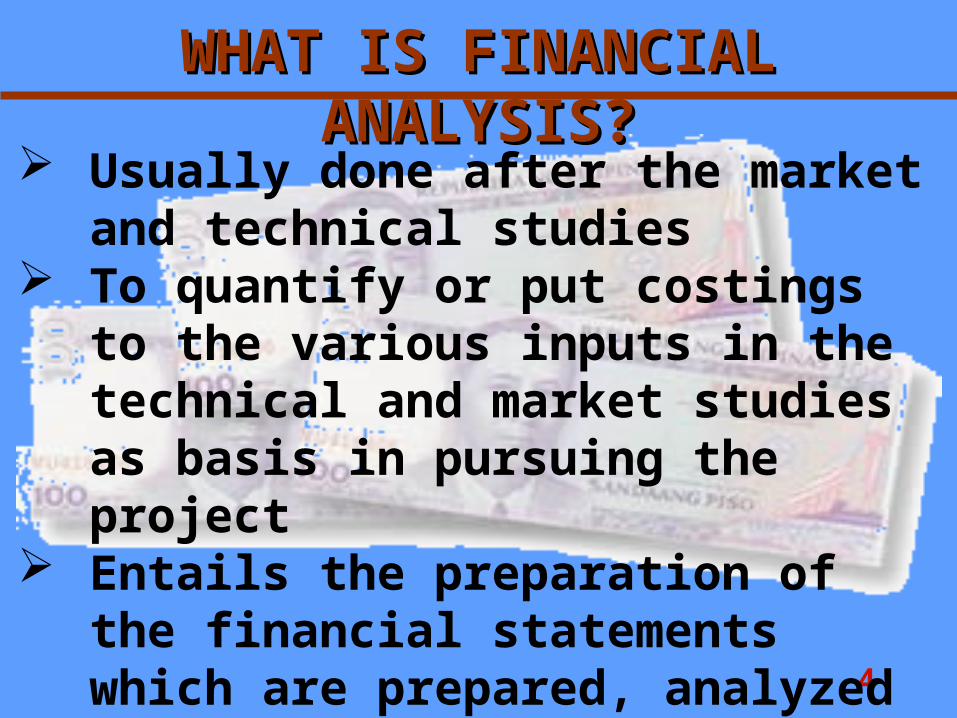
WHAT IS FINANCIAL WHAT IS FINANCIAL ANALYSIS?ANALYSIS?
Usually done after the market and technical studies
To quantify or put costings to the various inputs in the technical and market studies as basis in pursuing the project
Entails the preparation of the financial statements which are prepared, analyzed and forecasted

5
•It is concerned with determining the income that the project would generate for the project-operating entity; e.g. water supply
•If there is no income, how to finance and sustain its operation e.g. FMR
WHAT IS FINANCIAL WHAT IS FINANCIAL ANALYSIS?ANALYSIS?

6
•Government does not have enough money to pursue all projects.•Government can only afford only the best project proposals.•For private projects, there is a need to recover investments.
WHY THE NEED FOR FINANCIAL WHY THE NEED FOR FINANCIAL STUDY?STUDY?

7
•To ensure financial sustainability
– Availability of funds to finance investment up to operation stage
– Projects with high economic returns may still fail when funds to finance its operation is not enough (water supply, irrigation and public transport)
WHY FINANCIAL STUDY FOR WHY FINANCIAL STUDY FOR GOVERNMENT PROJECT?GOVERNMENT PROJECT?

8
•To determine project’s financial profitability
– Government approaches a project like a private sector does, especially when privatization is considered.
– To estimate true value of the project– To know if project is profitable or
not
WHY FINANCIAL STUDY FOR WHY FINANCIAL STUDY FOR GOVERNMENT PROJECT?GOVERNMENT PROJECT?

9
• Sustainability- a project can continue to pay its bills throughout its entire life, whether these funds come from user charges or from regular budget sources.
• Profitability- a project can generate more than enough revenues to cover annual expenditures and service obligations and still post profit
PROFITABILITY AND PROFITABILITY AND SUSTAINABILITYSUSTAINABILITY

10
•Revenues and cost items
•Sources of financing
•Financial viability
IMPORTANT VARIABLES IN IMPORTANT VARIABLES IN FINANCIAL ANALYSISFINANCIAL ANALYSIS

11
1. Cash Flow Statement;
2. Income or Profit and Loss Statement;
3. Balance Sheet Statement.
FINANCIAL STATEMENTSFINANCIAL STATEMENTS

12
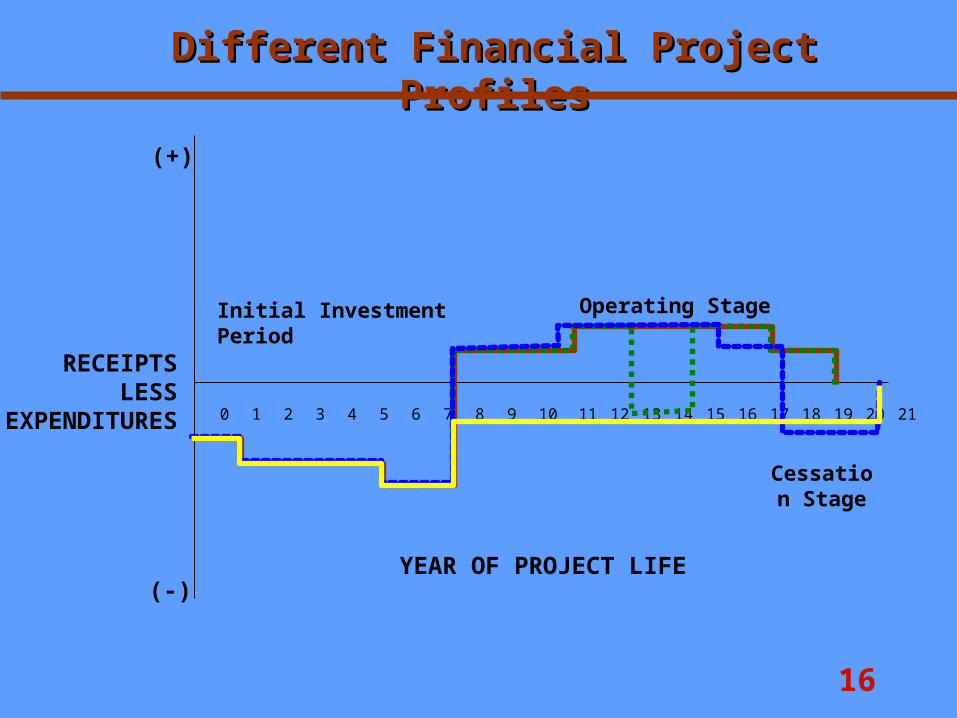
Profile of project’s receipts and expenditures overtime
Shows the expected annual movement of cash into (receipts) or out (expenditures) of the project
1. CASH FLOW 1. CASH FLOW STATEMENTSTATEMENT

13
1.Cash inflows- detail the expected financial receipts generated by the projects
TWO MAJOR SECTIONSTWO MAJOR SECTIONS
2.Cash outflows- shows the expected financial expenditures to be incurred to generate the cash inflows of the project.

14
NET CASHFLOW
= Cash inflows
Cash outflows-

15
16
0 21 3 54 6 87 9 10 11 1312 14 1615 17 1918 20 21
(+)
(-)
RECEIPTSLESS
EXPENDITURES
Initial Investment Period
Operating Stage
YEAR OF PROJECT LIFE
Different Financial Project Different Financial Project ProfilesProfiles
Cessation Stage

17
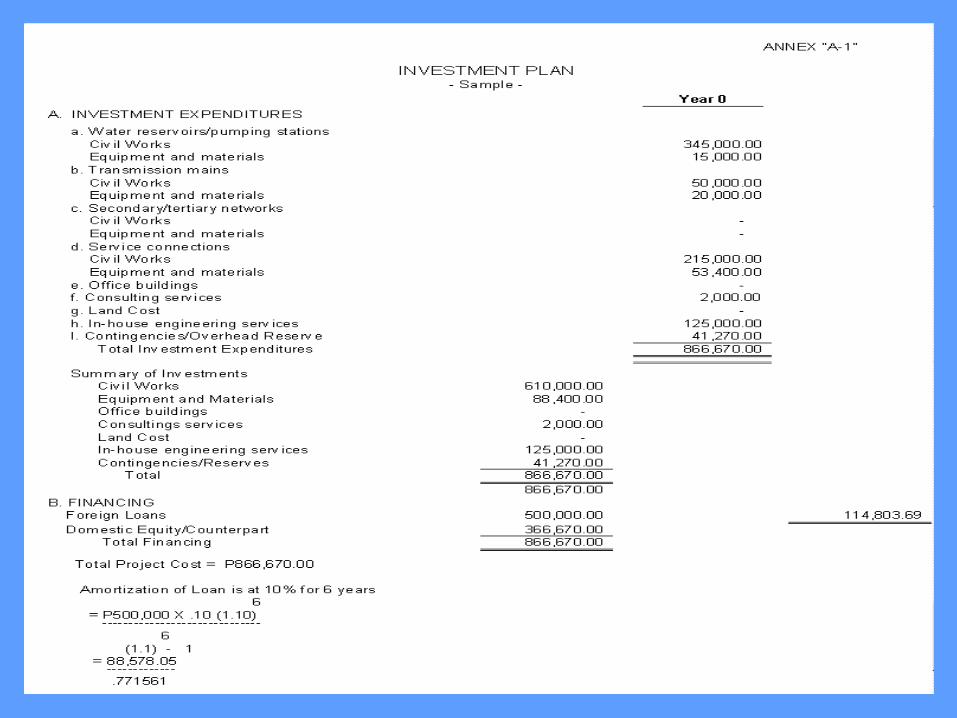
A. Formulation of an Investment Plan
B. Formulation of an Operating Plan
C. Formulation of End of Project Operations Plan
STEPS IN CASH FLOW STEPS IN CASH FLOW STATEMENTSTATEMENT

18
Combines information from the market and technical analysis to establish a detailed plan for annual incremental expected capital expenditures during project’s investment phase:
LandBuildingsMachineryEquipmentBuilding materials and constructionManagement labor
A. FORMULATION OF AN A. FORMULATION OF AN INVESTMENT PLANINVESTMENT PLAN

19
2 sections of the Investment Plan
a.Expenditure on new acquisition of assets (e.g. equipment)
b.Financing aspect of Proposed Investment
A. FORMULATION OF AN A. FORMULATION OF AN INVESTMENT PLANINVESTMENT PLAN

20

21
AMORTIZATIONAMORTIZATION

22
AMORTIZATIONAMORTIZATION
Loan Balance – Rate (R)
Amortization-Interest
Previous Loan Balance- Principal

23
AMORTIZATIONAMORTIZATION

24
B. DEVELOPMENT OF AN B. DEVELOPMENT OF AN OPERATING PLANOPERATING PLAN
Combines information from the market and technical analysis to establish a detailed plan for the project’s operating phase
Provides projection of expected sales revenues and expected operating costs (i.e. operating material inputs and operating labor) for each year during the operations phase;

25
To determine the flow of cash in the operation of the project.
The plans include all cash receipts generated from the operations of the business/project and all operating expenditures.
B. DEVELOPMENT OF AN B. DEVELOPMENT OF AN OPERATING PLANOPERATING PLAN

26

27
It shows the financial operation of a project for a given period. Various items of expected revenues/income and expenses are determined thereby permitting calculation of the project’s or firm’s net profit on a periodic basis
2. INCOME OR PROFIT 2. INCOME OR PROFIT AND LOSS STATEMENTAND LOSS STATEMENT

28
1. Income/Revenue
total sales/receipts (cash and credit basis) earned in a given period For sales of goods (e.g. commodity products), the cost of the goods should be deducted from the gross sales to get the net sales.
2. INCOME OR PROFIT 2. INCOME OR PROFIT AND LOSS STATEMENTAND LOSS STATEMENT

29
2. Expenses
total expenses (cash and credit) incurred during the year
Profit - the excess of revenues over expenses Loss - the excess of expenses over revenues
2. INCOME OR PROFIT 2. INCOME OR PROFIT AND LOSS STATEMENTAND LOSS STATEMENT

30

38
It is not correct to simply add the total annual net revenues from year 1 to year 20 to get the total returns from project.
Money that is worth a peso today is less than a peso in the future
A. DISCOUNTING AND A. DISCOUNTING AND ALTERNATIVE INVESTMENT ALTERNATIVE INVESTMENT
CRITERIACRITERIA

39
The essence of this concept is that money received or consumed at a particular time has greater value than the same money received or consumed at some future time.
Time Value of MoneyTime Value of Money

40
•Normal preference for present versus future consumption
•Resources on hand may be invested during the intervening period to generate income or earn interest
•Risk of uncertainty factor of the future
Explanations / ReasonsExplanations / Reasons

41
•Allows comparison of revenues/costs occurring in different time periods in the future, at the initial year of the project.
•It is a process of translating future values into their present worth
What is discounting?What is discounting?
42
•The nature of a project is such that benefits and costs occur at different points in time
•A given sum of money now is considered more valuable than the same amount received in a future period.
Why discounting is done?Why discounting is done?

43
Ao = An x 1/(1+r)n
where: Ao = present value of An
An = expected amount at year n r = discount rate n = no. of years between year 0 and year n, i.e., discounting period
Concept of DiscountingConcept of Discounting

44
The discount rate could be the weighted
average cost of capital (WACC) or the prevailing
market interest rate
THE DISCOUNT RATETHE DISCOUNT RATE

45
• Usually used for most public sector projects since these projects have multiple sources of financing, which have varying interest rates.
• Cost of borrowing, for borrowed capital (i.e., interest rate of loan)
• The yield of alternative opportunities, for equity capital (i.e., interest rate of savings, other investments)
Weighted average Weighted average cost of capital (WACC)cost of capital (WACC)

46
Example:Total project cost P100,000Fund 1: (Loan-60%) 60,000Cost of capital (10%)Fund 2: (Equity-40%) 40,000Cost of capital (5%)
WACC = (60%x10%)+(40%x5%) = (0.06)+(0.02) = 8%
Weighted average Weighted average cost of capital (WACC)cost of capital (WACC)

47
Example:Total project cost P500,000Fund 1: (Loan-50%) 250,000Cost of capital (15%)Fund 2: (loan-40%) 200,000Cost of capital (18%)Fund 3: (Equity-10%) 50,000Cost of capital (10%)
WACC = (50%x15%)+(40%x18%)+(10%x10%)
= (0.075)+(0.072)+(0.01) = 15.7%
Weighted average Weighted average cost of capital (WACC)cost of capital (WACC)

48
A revenue of P85 is expected 2 years from now. Assuming a discount rate (WACC) of 10 percent, the present value is:
Ao = 85 x 1/(1+0.10)2
= 85 x 1/(1.21) = 85 (0.826) = 70.2
EXAMPLE OF EXAMPLE OF DISCOUNTINGDISCOUNTING

49
• Net Present Value (NPV)
• Benefit-Cost Ratio (BCR)
• Internal rate of return (FIRR)
B. MEASURES OF PROJECT B. MEASURES OF PROJECT WORTHWORTH

50
The difference between the present values of project benefits and projectcosts
n n
NPV = ∑ bi /(1+r)i - ∑ ci /(1+r)i
i = 0
i=0
where bi= benefits in period i
ci= costs in period i r = discount rate n= discounting period
Net Present Value (NPV)Net Present Value (NPV)
NPV=B-C

51
In case of competing projects, select the project with the highest NPV.
NPV Decision RuleNPV Decision Rule
If NPV > 0
If NPV < 0
ACCEPT PROJECT
REJECT PROJECT

52
- the ratio of the present value of gross
benefits to the present value of gross costs:
n n
BCR = ∑ bi /(1+r)i / ∑ ci /(1+r)i
i=0 i=0
Benefit Cost Ratio (BCR)Benefit Cost Ratio (BCR)
BCR=B/C

53
- In case of competing projects, select project with the highest BCR.
BCR Decision RuleBCR Decision Rule
If BCR > 1
If BCR < 1
ACCEPT PROJECT
REJECT PROJECT
59
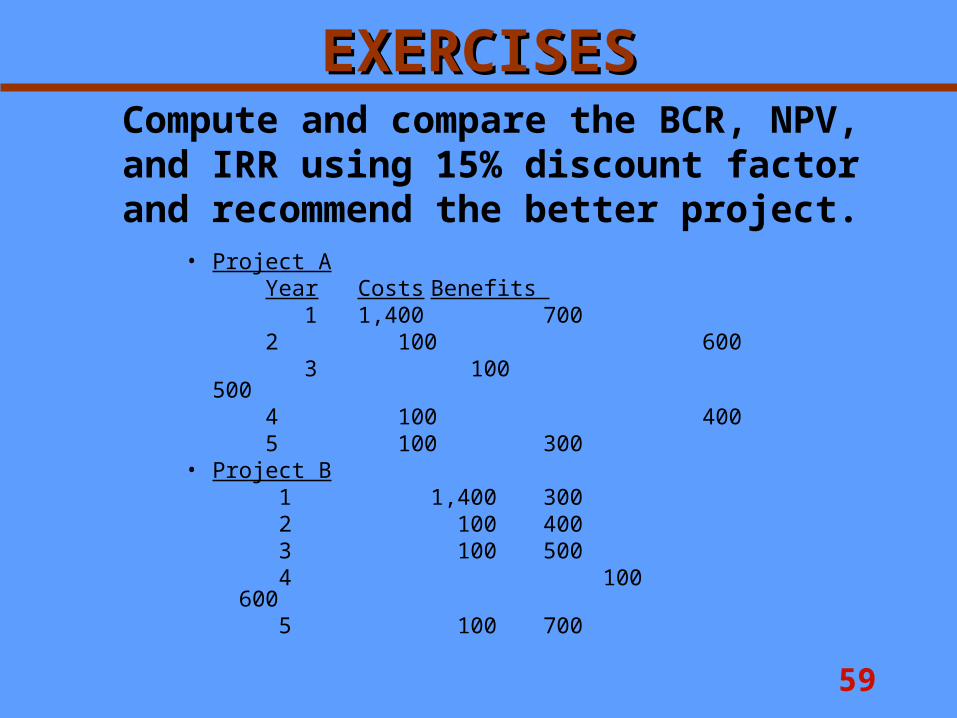
Compute and compare the BCR, NPV, and IRR using 15% discount factor and recommend the better
project.• Project A
Year Costs Benefits 1 1,400 700
2 100 600 3 100 500
4 100 400 5 100 300
• Project B 1 1,400 300 2 100 400 3 100 500 4 100 600 5 100 700
EXERCISESEXERCISES

60
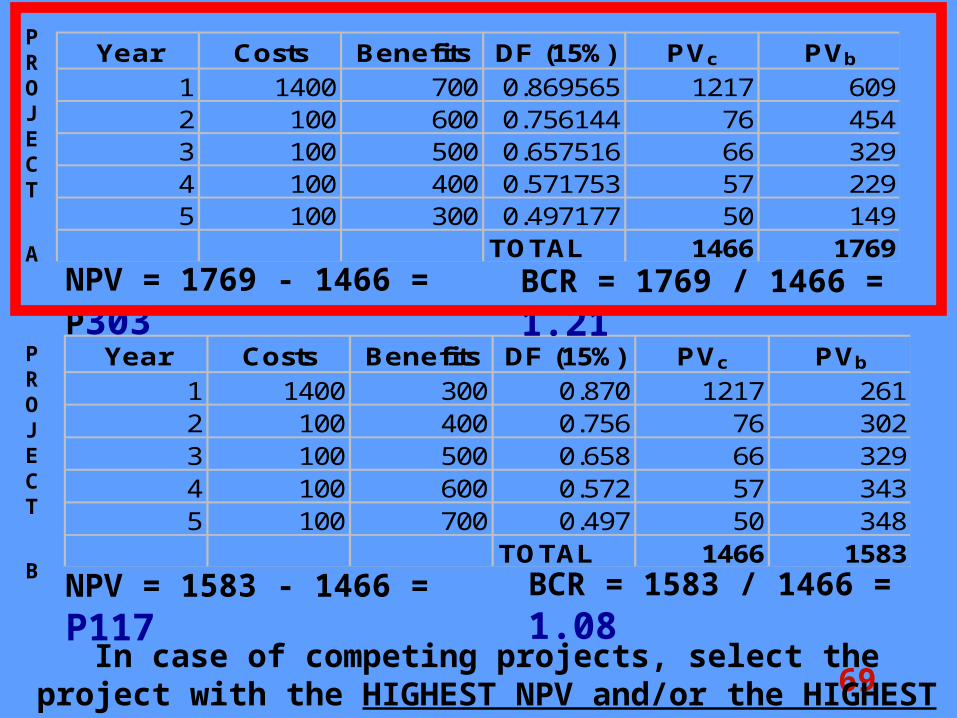
Computations: (Project A)
Year Costs Benefits DF (15%) PVc PVb
1 1400 700 0.869565 1217 6092 100 600 0.756144 76 4543 100 500 0.657516 66 3294 100 400 0.571753 57 2295 100 300 0.497177 50 149
TOTAL 1466 1769
NPV = 1769 - 1466 = P303 BCR = 1769 / 1466 = 1.21

61
Year Costs Benefits DF (15%) PVc PVb
1 1400 3002 100 4003 100 5004 100 6005 100 700
TOTAL
NPV = PVb - PVc = P_____ BCR = PVb/ PVc = ____
Computations: (Project B)
69
Year Costs Benefits DF (15%) PVc PVb
1 1400 300 0.870 1217 2612 100 400 0.756 76 3023 100 500 0.658 66 3294 100 600 0.572 57 3435 100 700 0.497 50 348
TOTAL 1466 1583
NPV = 1583 - 1466 = P117 BCR = 1583 / 1466 = 1.08
Year Costs Benefits DF (15%) PVc PVb
1 1400 700 0.869565 1217 6092 100 600 0.756144 76 4543 100 500 0.657516 66 3294 100 400 0.571753 57 2295 100 300 0.497177 50 149
TOTAL 1466 1769
NPV = 1769 - 1466 = P303 BCR = 1769 / 1466 = 1.21
PROJECT
A
PROJECT
B
In case of competing projects, select the project with the HIGHEST NPV and/or the HIGHEST BCR

70
THEREFORE:WE RECOMMEND
PROJECT A THAN PROJECT B

73
•It means testing how sensitive a project’s outcomes (cash flows, NPV, IRR) are to changes in key variable at a time.
•“What if” analysis
D. SENSITIVITY ANALYSISD. SENSITIVITY ANALYSIS

74
D. SENSITIVITY ANALYSISD. SENSITIVITY ANALYSIS
GIVEN: GIVEN: WACC=5.6%WACC=5.6%

75
D. SENSITIVITY ANALYSISD. SENSITIVITY ANALYSIS
GIVEN: GIVEN: WACC=5.6%WACC=5.6%
IRR

77
ECONOMIC ANALYSIS

78
• It is closely related to other phases of project development:
•Much of the data required in the identification and valuation of economic costs and benefits are derived from the market, technical and financial aspects of the project study.
WHAT IS ECONOMIC WHAT IS ECONOMIC ANALYSIS?ANALYSIS?

79
•It is directed towards establishing the net returns that the project would generate for the economy/society as a whole.
•Determines a project’s viability in terms of its net contribution to the economic and social welfare of the country
WHAT IS ECONOMIC WHAT IS ECONOMIC ANALYSIS?ANALYSIS?
80
•A method by which the net effect (whether favorable or unfavorable) of a project maybe determined.
• It can also be undertaken to rank projects in their order of importance with respect to the development goals. Its outcome is a solid basis for accepting, rejecting or modifying projects.
WHAT IS ECONOMIC WHAT IS ECONOMIC ANALYSIS?ANALYSIS?

81
• Deals with the Costs and benefits from the viewpoint of the economy or the country as a whole in constant or real terms.
ECONOMIC ANALYSIS
FINANCIAL/BUDGETARY ANALYSIS • Deals with the costs and benefits
measured from the viewpoint of the person/proponent, expressed in current or nominal terms.
FINANCIAL vs. ECONOMIC FINANCIAL vs. ECONOMIC ANALYSIS?ANALYSIS?

82
FINANCIAL vs. ECONOMIC FINANCIAL vs. ECONOMIC ANALYSIS?ANALYSIS?
• Financial and Economic prices of outputs and inputs are the same in an economy where there are no distortions. Distortions or market imperfections include taxes, tariffs, subsidies, market power and externalities.• These distortions and imperfections, however, exist in the real market. Economic externalities exist when economic values of inputs or outputs differ from the financial prices of inputs or outputs.

83
FINANCIAL vs. ECONOMIC FINANCIAL vs. ECONOMIC ANALYSIS?ANALYSIS?
Results of the financial analysis are major inputs to economic analysis

84
• Forms of Economic Evaluation– Cost-benefit analysis – it sums all costs
and benefits in monetary terms and compares them. The project with the largest net benefit yields the most benefit to society.
• Measures of Project worth– BCR– NPV– IRR
ECONOMIC EVALUATION ECONOMIC EVALUATION TECHNIQUESTECHNIQUES

85
•Definition of the set of development objectives against which project feasibility is to be assessed
•Translation of development. variables into a common denominator (e.g., money indices) by which project benefits maybe measured
STEPS IN ECONOMIC STEPS IN ECONOMIC ANALYSISANALYSIS

86
• Identification and (where possible) valuation of project costs and benefits
•Comparison of costs and benefits•Recommendation on the selection
of projects, i.e., accept, reject, defer, or modify the project
STEPS IN ECONOMIC STEPS IN ECONOMIC ANALYSISANALYSIS

87
•Cost– anything that affects the project’s objectives negatively
•Benefit– anything that promotes a project’s objectives
DEFINITION OF DEFINITION OF COSTS AND BENEFITSCOSTS AND BENEFITS
88
•“WITH-WITHOUT” APPROACH– Identifying and evaluating cost and benefits that would arise with the proposed investment and comparing these with a situation that would have existed without the project
IDENTIFICATION OF IDENTIFICATION OF COST AND BENEFITSCOST AND BENEFITS
89
• Identification of direct costs• Identification of direct benefits• Identification of externalities,
secondary benefits and intangibles
• Adjustments to inputs from financial statements
• Comparing the “with” from the “without” the project situation
IDENTIFICATION OF IDENTIFICATION OF COST AND BENEFITSCOST AND BENEFITS

90
•These are activities that involve use of real resources
•The components are identified in the technical study
•TWO TYPES–Capital Costs–Operating and maintenance costs
IDENTIFYING DIRECT COSTIDENTIFYING DIRECT COST

91
• Land;• Detailed engineering and design
• Equipment, raw materials and supplies for construction;
• Building and auxiliary installation;
• Organization costs• Contingencies
CAPITAL COSTSCAPITAL COSTS

92
•Raw materials and other supplies,
•Energy and fuel;•Labor,•Rent
OPERATING AND OPERATING AND MAINTENANCE COSTSMAINTENANCE COSTS
93
Benefits directly attributed to the project• Examples:
– Irrigation Project: Increase in agricultural production
– Flood Control: Reduction in flood damage; improved health
– Health Projects: Decrease in mortality rate; better preventive healthcare
– Farm-to-Market Road: Reduction in vehicle operating costs; increased economic activities
DIRECT BENEFITSDIRECT BENEFITS

94
Effects of the project that do not impose costs or confer benefits within the confines of the project itself.
•Examples:– Airport Construction: noise pollution– Reforestation in upstream land area:
Less flooding for people living downstream
EXTERNALITIESEXTERNALITIES

95
•Secondary benefits – beneficial effects which are linked to project users either forward or backward linkages
• Intangibles – increased comfort and convenience
SECONDARY BENEFITS SECONDARY BENEFITS AND INTANGIBLESAND INTANGIBLES

96
• Environmental externality (pollution, congestion)
• Monopoly externality• Tax and subsidy (excluded)• Foreign exchange externality
(demand-and-supply of forex)
• Labor externality (divergence betweenmarket wage rate (minimum wage) and cost of employment)
ECONOMIC SITUATIONS WHERE ECONOMIC SITUATIONS WHERE AN ECONOMIC EXTERNALITY MAY AN ECONOMIC EXTERNALITY MAY
ARISEARISE

97
•Foreign exchange – 1.20•Labor – 0.60•Tax and subsidy – excluded from economic costs
SHADOW PRICESSHADOW PRICES

98
•Also known as social discount rate (SDR) which is 15 % (used in the computation of NPV, BCR, IRR)
OPPORTUNITY COST OF OPPORTUNITY COST OF CAPITALCAPITAL

99
Year Total Cost
Economic Water
Revenue1
Reduction in
Mortality2
Reduction in
Morbidity3
Savings in
Medical Expenses
4
Time Saving
s5
Total Benefit
s
Incre-menta
l Bene-
fits
1
2
3
4
5
Notes:1/ (Served popn/average hh size) X Water fee per hh x 12 months2/ (Served popn X mortality rate X LFPR X Annual Wage x 60%) 3/ (Served popn X morbidity rate X LFPR X Daily Wage Rate X days inactive X 60%)4/ (Served popn X morbidity rate x LFPR X Medical Expense x 60%)5/ (Served popn/average hh size) X LFPR X (Hours fetching water w/o proj – Hours fetching water with proj) X Wage rate per hour
Water Supply System
ECONOMIC COST AND BENEFIT ECONOMIC COST AND BENEFIT FLOWSFLOWS

100
Year
(1)
Invest-ment Cost(2)
O&M Cost WIP(3)
Total Outflow (4)=2+3
Vehicle Operating Costs O&M Cost WOP(9)
Total Inflo
w(10)
Net Inflo
w(11)
WOP Volume Savings
Generated Benefits
Freight
(5)
Passengers
(6)
Freight
(7)
Passengers(8)
1
2
3
4
5
2/ Inv cost = ave eco road cost X road length X % of Total Project Cost disbursed3/ O&M WIP=annual eco maint cost WIP X road length 5/ VOC WOP Vol Savings Frt = total Frt WOP X VOC savings for Frt X ave journey length X 365 days6/ VOC WOP Vol Savings Pax = Total Pax X VOC savings for Pax X ave journey length X 365 days 7/ VOC Gen Benefits Frt = (Total Frt WIP-Total Frt WOP) X VOC savings for Frt X ave journey length X 365 days X 50%8/ VOC Gen Benefits Pax = (Total Pax WIP-Total Pax WOP) X VOC savings for Pax X ave journey length X 365 days X 50%9/ O&M Cost WOP = annual econ maint cost WOP X road length 10/ Total Inflow = 5 + 6 + 7 + 8 + 911/ Net Inflow = 10 - 4
Rural Road Project
ECONOMIC COST AND BENEFIT ECONOMIC COST AND BENEFIT FLOWSFLOWS

101
WATER WATER SUPPLY SUPPLY PROJECTPROJECT

102
SAMPLE PARAMETERSSAMPLE PARAMETERS

103
SAMPLE PARAMETERSSAMPLE PARAMETERS

104
SAMPLE PARAMETERSSAMPLE PARAMETERS

105
FINANCIAL ANALYSISFINANCIAL ANALYSIS
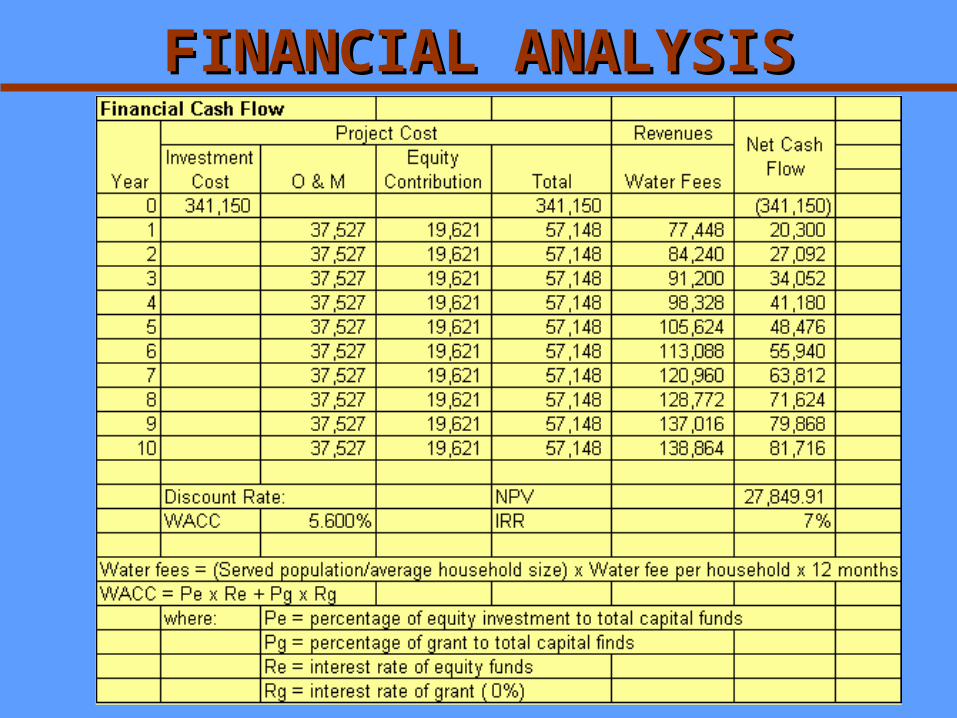
106
FINANCIAL ANALYSISFINANCIAL ANALYSIS

107
ECONOMIC ANALYSISECONOMIC ANALYSIS

108

109

110
111

112

113

114

115