Embed Size (px)
Citation preview
1
ELECTRIC POWER GRID INTERDICTION
Javier Salmeron and Kevin Wood, Naval Postgraduate School
Ross Baldick, University of Texas at Austin
Sponsored in part by Department of Homeland Security, Office of Domestic Preparedness

2
What is VEGA?
• VEGA determines the worst possible disruption that could be caused by a terrorist attack,
• Compares multiple attack plans terrorists might undertake under different resource-constrained assumptions,
• Assesses security enhancement through preemptive measures, and
• VEGA is based on powerful optimization techniques.
VEGA is a tool for analyzing the vulnerability and defense of electric power systems under threats posed by terrorist attacks.

3
“One can hardly imagine a target more ideal than the U.S. domestic
energy” (A.B. and L.H. Lovins, 1983)
“Any U.S. region could suffer lasting and widespread blackouts if
three or more substations were targeted.” (OTA, 1990)
“The U.S. is at, or is fast approaching, a crisis stage with respect to
reliability of transmission grids.” (NERC, 2001)
“The U.S. electric power systems must clearly be made more
resilient to terrorist attack.” (Committee on Science and Technology
for Countering Terrorism, NRC, 2002)
Vulnerability of Electric Power Grids: A Long-Recognized Issue

4
“And the threat isn't simply academic. U.S. occupation forces in
Afghanistan discovered Al Qaeda documentation about the facility that
controls power distribution for the eastern U.S., fueling fears that an
attack on the power grid may one day become a reality.” (Energy Pulse,
2003)
(On Ahmed Ressam) “They were specifically trained to attack critical
infrastructure, including electric power plants.” (CNN, 2002)
(On Colombian FARC) “They are leaving entire regions without service.
We can’t post a soldier at every tower” (ISA spokesman, 2002)
Terrorist Threat?

5
Potential targets:
Generating plants
Transmission and distribution lines
Substations
Easy disruption + Widespread damage + Difficult recovery
Terrorist Threat? (cont.)

6
• U.S. systems are operated so that a single failure does not disrupt the system (N–1 security)
• We investigate vulnerability to multiple, coordinated failures (N–m).
• Our approach uses optimization theory to:
- Mathematically represent a power grid and power flows
- Identify worst-case attacks to the grid (most “disruptive”)
- Provide insight into physical vulnerabilities, and help guide protective plans that will mitigate disruptions should attacks occur
(We maintain the assumption of information transparency)
Modeling Assumptions
7
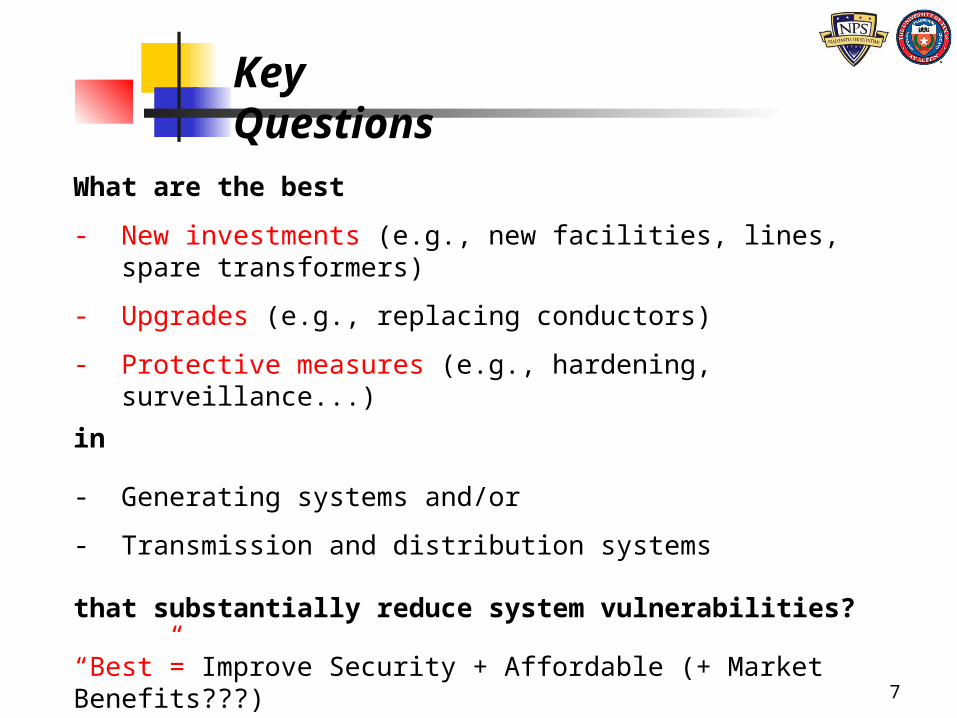
What are the best
- New investments (e.g., new facilities, lines, spare transformers)
- Upgrades (e.g., replacing conductors)
- Protective measures (e.g., hardening, surveillance...)
in
- Generating systems and/or
- Transmission and distribution systems
that substantially reduce system vulnerabilities?
“Best”= Improve Security + Affordable (+ Market Benefits???)
Key Questions

8
To defend an electric grid, first learn how to attack it!
- Optimal power flow model (minimize load shedding)
- Interdiction model (maximize disruption, i.e., load shedding)
Additional features of the problem are:
- Time scale: Very short-, short-, medium- and long-term
- Customer types; ability to “share the pain”
- Uncertainty about terrorist resources
- (Protective measures???)
Mathematical Analysis

9
- Level 1: Optimal power flow model to minimize “disruption”:
(disruption = load shedding + increased costs)
Data: Power grid data
Integrating Three Levels of Optimization
- Level 2: Interdiction model to maximize “Level-1 disruption”
Data: Power grid data and terrorist resources
- Level 3: Protective model to minimize “Level-2 interdiction”
Data: Power grid data, terrorist resource and counter-terrorist resources (budget for expansion, spares, upgrades, hardening)
(See mathematical details at the end of this presentation)

10
t(Attack)
MW shedding
Other Factors: System Restoration, Demand Curves...
(months)
Slow repair
Grid Component Interdictable Resources (number of terrorists)
Outage Duration (h)
Lines (AC/DC) (overhead)
YES 1 72 (or 48)
Lines (underground) NO N/A N/A
Transformers YES 2 768 (or 168)
Buses YES 3 (or 2) 360 (or 168)
Generators NO N/A N/A
Substations YES 3 768 (or 360)
One to several days
No Repair
Days to one week
Lines
Weeks
Trafos with Spares
$$ MW
MWh t
dt

11Salmeron, Wood and Baldick (2004), IEEE Transactions on Power Systems
Total Load: 2,850 MW
IEEE Reliability Test System 96-99
BUS 24
BUS 15
BUS 14
230 kV
138 kV
BUS 22
BUS 23
BUS 18
BUS 21
BUS 16BUS 19 BUS 20
BUS 13
BUS 12
BUS 3
BUS 11
BUS 4
BUS 5
BUS 9
BUS 1 BUS 2BUS 7
BUS 8
BUS 6BUS 10
Synch.Cond.
cable
BUS 17
C
G A
E
F
D
B
cable
Time Power Energy
Period Shed (MW) Shed (MWh)
0-72 h 1,373 98,856
Plan
Total: 98,856 MWh
A
t
MW
+72hAttack
A A
A A
A
A
A0-72 h 902 64,944
72-768 h 708 492,768
Total: 557,712 MWh
B B+768h
B
B
B B0-360 h 756 272,160
Total: 272,160 MWh
C+360h
C
C
C

12
VEGA
VEGA: Vulnerability of Electric
Power Grids Analyzer
Potential Users:
Utilities, ISOs...
Government analysts

13
VEGA: Main Menu
• File mgmt.
• Grid data
• Optimization
• Results
• One-Line GUI
• Help

14
Power Grid Data

15
One-Line GUI: Power Flow After Optimal Interdiction
16
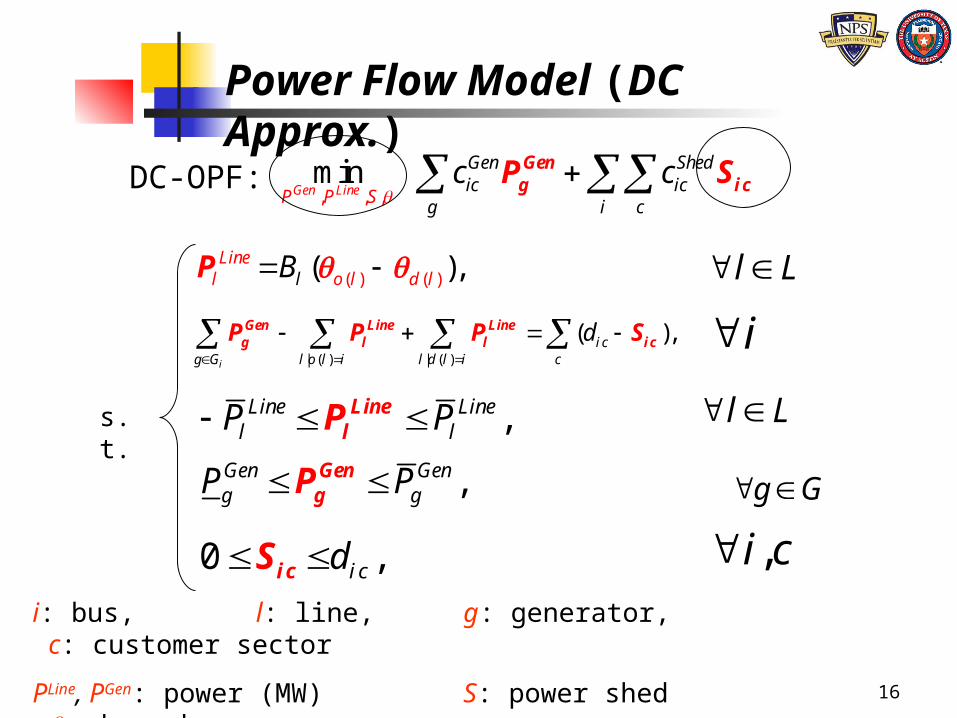
, , ,min
Gen Line
Gen Shedic ic
g i cP P S
c c
Geng i cP SDC-OPF:
i: bus, l: line, g: generator, c: customer sector
PLine, PGen: power (MW) S: power shed : bus phase
Power Flow Model (DC Approx.)
( ) ( )( ),Linel o dl l lB P l L
| ( ) | ( )
( ),i
i cg G l o l i l d l i c
d
Gen Line Lineg l l i cP P P S i
,Line Linel lP P Line
lP l L
,Gen Geng gP P Gen
gP g G
0 ,i cd i cS ,i c
s.t.
17
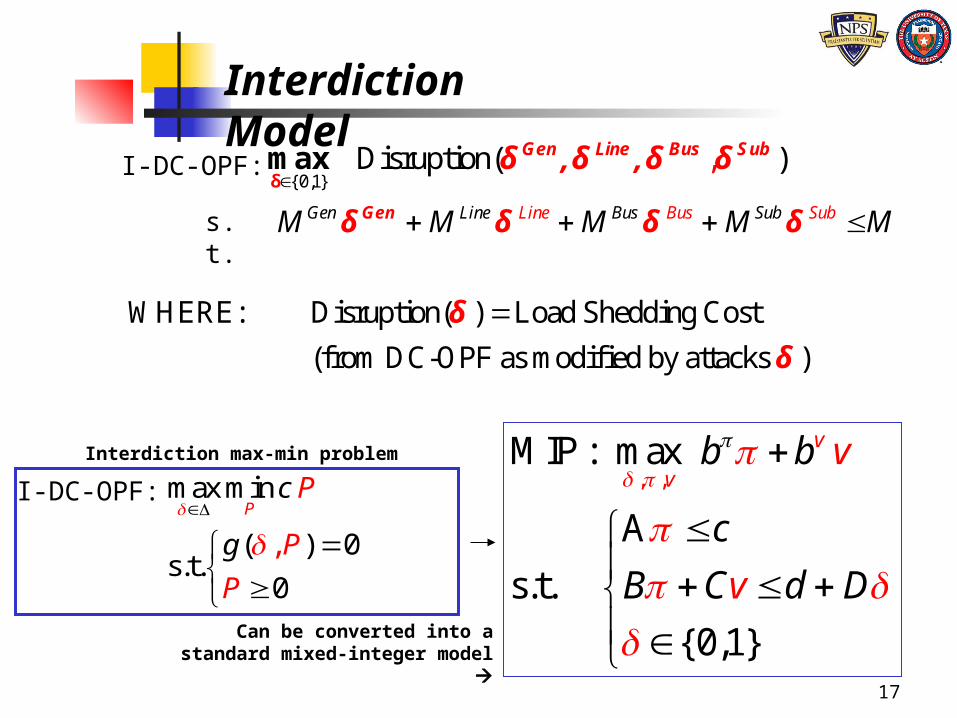
Interdiction Model
WHERE: Disruption( ) Load Shedding Cost
(from DC-OPF as modified by attacks )
δ
δ
{0,1}Disrupt n ,io ( )
Gen Line Bus Subδ ,δ ,δ δδmaxI-DC-OPF:
Gen Line Bus SubLine Bus SubM M M M M Genδ δ δ δs.t.
max min
( ) 0s.t.
0
,P
c
g
P
P
P
I-DC-OPF:
Interdiction max-min problem
, ,MIP : max
A
s.t.
{0,1}
v
vb b
c
B v d
v
C D
Can be converted into a standard mixed-integer model

18
Solve the DC-OPF Power Flow Model given the
current grid configuration ()Based on present and
previous flow patterns, assign a “Value” (V) to each interdictable asset
Interdiction Model Heuristic
Interdict the assets that maximize “Total Value”
* * * *L I S, ,,
maxGen Line
Bus Sub
Gen Line Bus Subg
Gen Line Gen Sl i s
g
ubg l
l i si sV V V V
δ δδ δ
, ' , 'ˆ ˆ| 1 | 1
1, 1, ....s.t. (1 ) (1 ) ...... 1,
Line t Bus till i
Line Bus Bus Subl i i s
Line Busl i t t

19
Exact (Mixed-Integer) Linearization of I-DC-OPF
max min
( ) 0s.t.
0
,P
c
g
P
P
P
12 1 2( )(1 )(1 )a bP B 12 1 2
12 1 2
( ) ( ) ( )
( ) ( ) ( )
a b
a b
B
B
P
P
MM
(1 )
0
0
v
v
v v
v
max max
s.t. A ( )
b
P
b
c
, ,MIP : max
A
s.t.
{0,1}
v
vb b
c
B v d
v
C D

20
Results for the Linearized MIP
Case/Algorithm Directly Interdicted Components TimePeriod
PowerShed (MW)
EnergyShed (MWh)
RTS-Two-Areas (M=24)HEURISTIC
Buses: 116, 118, 215, 218Substations: Sub-A1, Sub-A2, Sub-B1, Sub-
B2
0-360 h 2,693 969,480
360-768 h 1,416 577,728
Total: 1,547,208
RTS-Two-Areas (M=24)
MIP
Lines: A30, A33-2Transformers: A7, B7
Buses: 115, 118, 215, 218Substations: Sub-A2, Sub-B2
0-72 h 3,164 227,808
72-360 h 2,716 782,208
360-720 h 1,416 577,728
Total: 1,587,744
Case/Algorithm Directly Interdicted Components TimePeriod
PowerShed (MW)
EnergyShed
(MWh)
RTS-Two-Areas (M=12)HEURISTIC
Substations: Sub-A1, Sub-A2, Sub-B1, Sub-B2
0-768 1,416 1,087,488
Total: 1,087,488
RTS-Two-Areas (M=12)
MIP
Lines: A23, B23Transformers: A7, B7
Substations: Sub-A2, Sub-B2
0-72 h 1,804 129,888
72-768 h 1,416 985,536
Total: 1,115,424

21
The VEGA Team
Javier Salmeron, [email protected]
Ross Baldick, UT [email protected]
Kevin Wood, [email protected]
http://www.nps.navy.mil/orfacpag/resumePages/projects/VEGA.htm