Embed Size (px)
Citation preview

1
Economic Diversification for Sustainable and Inclusive Growth
Vandana Chandra (PRMED)Inclusive Growth Course
March 24, 2009
2
Rationale
• By the mid-1990s, most developing countries had implemented the macroeconomic reforms that are a necessary condition for economic growth. Various other reforms also followed. BUT
• Economic diversification that was expected to follow ex post reform and is essential for sustained prosperity and inclusive growth did not ensue in many of the Bank’s client countries.
• Absence of economic diversification – has become the source of social and political pressures.
• Impatient to diversify, some client governments have announced industrial policies targeted at industries they believe can deliver faster and more inclusive growth.
• Government’s choice of industries is often ad hoc and uninformed, and targets non-traditional industries in which the country has no comparative advantage. Most choices are also driven by pro-poor or inclusive growth considerations.
• This recent shift in public policy from an industry-neutral to an industry-specific approach in our client countries has created among their development partners a demand for analytical tools to study the economic growth implications of active development policies.
3
Course Objective
• Introduce questions and concepts that can be useful in exploring the nexus between economic diversification and income-enhancing, sustainable, and inclusive growth.
• Provide a measure of the income potential of a country’s total exports based on Hausmann, Hwang and Rodrik (2007).
• Offer an EXCEL-based toolkit (A) to study these approaches and measures.
• The country economist (CE) may not be able to dissuade an impatient client (government) from implementing its industrial policy but may find the concepts useful in informing policy decisions.

4
Warning
• Industrial policy discussions warrant industry-level analysis. BUT• The toolkits are not intended to produce a menu of industries that
should be recommended to clients as candidates that deserve government’s special attention.
• Wanting a hi Tech industry does not imply that the country will be able to develop an efficient and competitive hi Tech industry .
• The application of the toolkit is a desk exercise that uses disaggregated product-level statistical evidence from the trading patterns of all countries, developed and developing over a long time series.
• Strength: Statistically robust. Objective. Transparent.• Weakness: Cannot substitute for in-depth country-knowledge. • Needs to be complemented with a proper field assessment of the
state of existing industries, what works and why.

Why does economic diversification matter for sustainable growth in developing countries? -Outline
1. How can we measure economic diversification? 2. What is the relationship between economic diversification and sustained
growth ?3. Openness, diversification and growth – some stylized facts 4. Are some patterns of diversification more income-enhancing than
others? Examine the traditional approaches to diversification.5. Explain PRODY - a concept that measures a product or industry’s export
sophistication by linking it with a notional level of income. 6. Explain EXPY - a concept that measures the sophistication of a country’s
export basket by linking it with a notional level of per capita income. 7. The framework we use is useful for cross-country and country-specific
analysis over a long period. Example: an application to Burkina Faso.
5
6
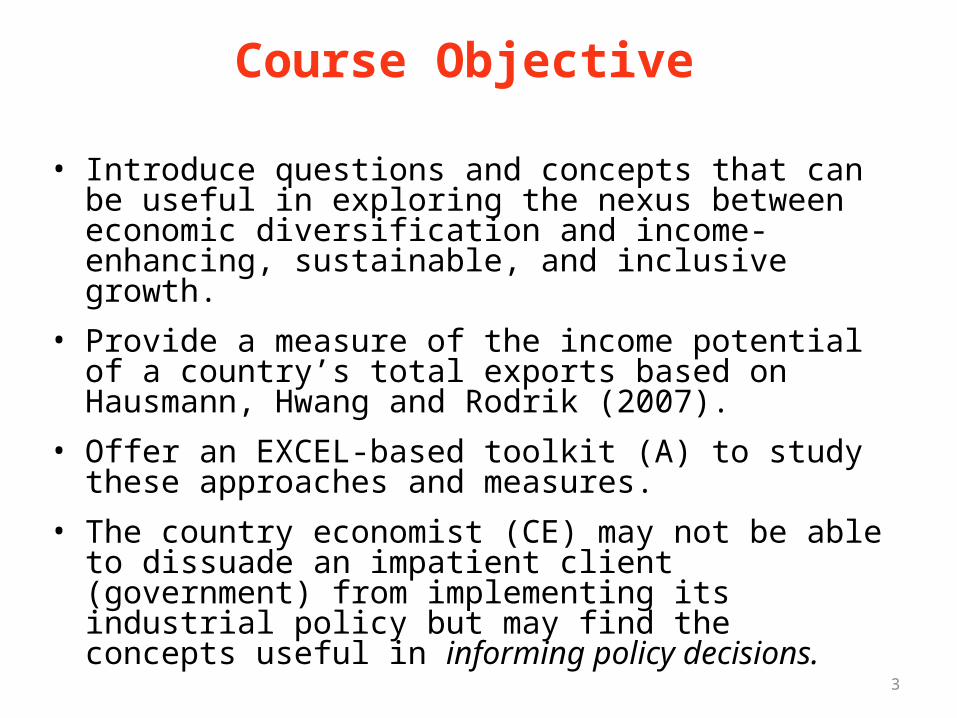
Two simple measures of economic diversification
•Production data series for developing countries is not easily available. • Proxy: export data
• Herfindahl Index of export concentration (HI). Sum of the square of the shares of each product exported.
•HI lies between 0 and 1 where 1 implies complete concentration•Common observations:
•Nigeria and other oil exporters: between 0.9 and 1 (oil and minerals exporters)•Primary product and minerals exporters – often between 0.8 – 0.2•China/Brazil, India and countries with large domestic markets: closer to 0.02 – 03 •Most of East Asia and most large countries were already very diversified in the 1980s
•Strength: HI is useful for understanding general direction of export diversification •Weakness: HI is uninformative about the composition of exports or their income potential
6
N
iisHERFINDAHL
1
2
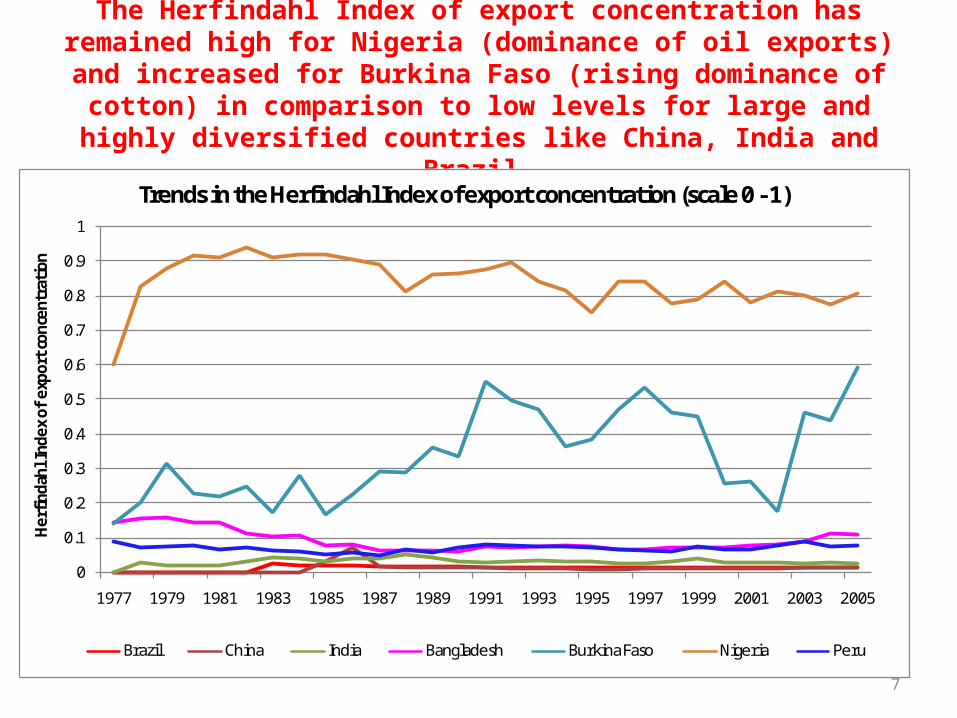
The Herfindahl Index of export concentration has remained high for Nigeria (dominance of oil exports) and increased for Burkina Faso (rising
dominance of cotton) in comparison to low levels for large and highly diversified countries like China, India and Brazil.
7
0
0.1
0.2
0.3
0.4
0.5
0.6
0.7
0.8
0.9
1
1977 1979 1981 1983 1985 1987 1989 1991 1993 1995 1997 1999 2001 2003 2005
Her
finda
hl I
ndex
of
expo
rt co
ncen
trati
on
Trends in the Herfindahl Index of export concentration (scale 0 - 1)
Brazil China India Bangladesh Burkina Faso Nigeria Peru

Another measure of diversification: trends in the export share of the top 5, 10 or 20 products is consistent with the Herfindahl Index
8
0
10
20
30
40
50
60
1976 1978 1980 1982 1984 1986 1988 1990 1992 1994 1996 1998 2000 2002 2004
Shar
e of
tot
al e
xpor
ts (%
)
Share of the top 5 products in total exports in large economies
Brazil China South Africa India
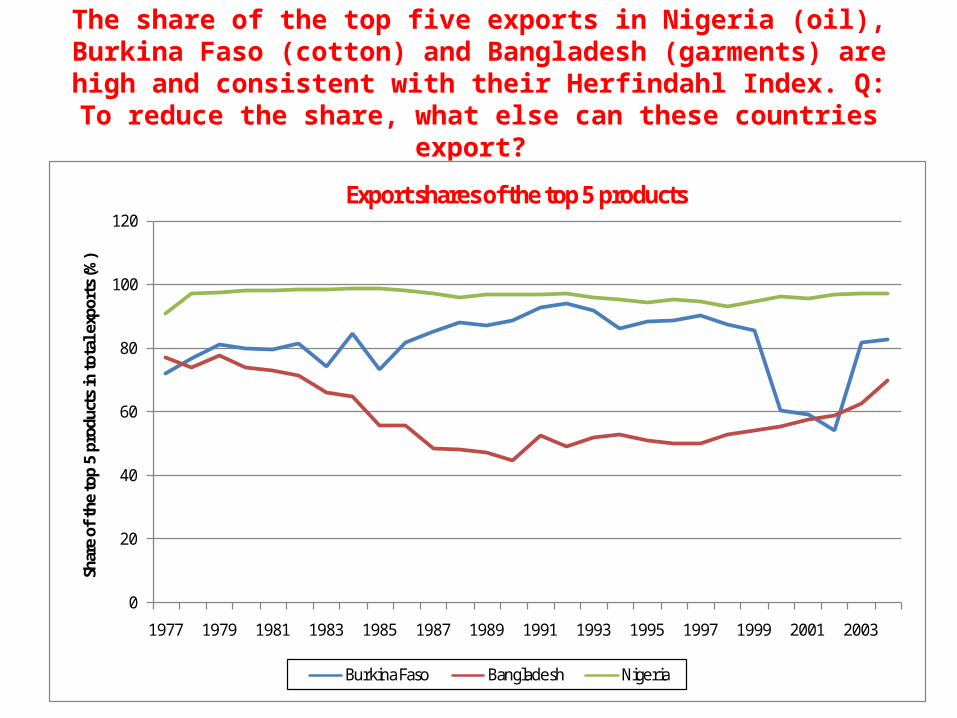
The share of the top five exports in Nigeria (oil), Burkina Faso (cotton) and Bangladesh (garments) are high and consistent with their Herfindahl Index.
Q: To reduce the share, what else can these countries export?
9
0
20
40
60
80
100
120
1977 1979 1981 1983 1985 1987 1989 1991 1993 1995 1997 1999 2001 2003
Shar
e of
the
top
5 pr
oduc
ts in
tota
l exp
orts
(%)
Export shares of the top 5 products
Burkina Faso Bangladesh Nigeria

10
The relationship between sustained growth and openness/exports
Conventional theory - as economies diversify, their income grows (positive relationship). Hesse (2009) confirms that diversification and per capita income are positively correlated.
Imbs and Wacziarg (2003) – empirical evidence indicates that there is a U-shaped relationship between sectoral diversification and income. Initially, negative, i.e., as diversification increases, per capita income increases. After reaching $10,000 (2000 constant USD), sectoral diversification decreases and the relationship becomes positive (based on employment and production data for developed and developing countries).
In natural resource-based economies, diversification helps to dissipate the negative effects of terms of trade shocks. In more developed ones, agglomeration effects reinforce economic concentration.
We find that for most of the Bank’s client countries, the relationship is L-shaped. Along the vertical axis are low income countries in Sub-Saharan Africa, South Asia and even China. The range of the HI is very large. Close to 0.9 for Nigeria and 0.02 for India!
Hesse (2009) confirms that diversification and per capita income are positively correlated.
We need a better measure of diversification that links exports to a country’s per capita GDP. Q: What type of products should China export to catch up with Brazil? Cannot answer with the HI.
10

11
In low income countries, the relationship between HI and income is L-shaped. The HI for China and Korea is similar but it does not tell us what China must
export to catch up with Korea.
ETH
KEN
BDI
NGA
TZA
BFA
ZWE
UGA
ZAF
AGO
BWA
TGO
GAB
SYC
RWA
COG
ZAR
LBRMOZ
MLI
ZMB
GHA
TCD
GNQ
ZAR
ETH
TZA
BDI
GHA
LBR
ZMB
ZAF
MLI
SYC
MOZ
RWA
GNQ
GAB
COG
ZWE
AGO
UGA
NGA
BWA
BFA
TGO
TCD
KEN
ZMB
ZAR
MLI
AGO
GNQ
MOZ
TGO
BFA
LBRSYC
COG
BDI
BWA
NGA
GHA
TZA
RWA
ZAF
ZWE
GAB
ETH
UGA
KEN
TCD
KEN
MLI
TGO
TCD
AGO
ETH
COG
RWA
ZAF
ZAR
LBR
UGA
BWA
BDI
BFA
GNQ
GHA
NGA
GAB
ZWE
SYC
TZA
MOZ
ZMB
NGA
ZAF
TCD
RWA
GNQ
ETH
BDI
UGA
LBR
TZA
ZAR
ZWE
ZMB
GHA
GABBWA
AGO
MOZ
KEN
MLI
BFA
COG
SYC
TGO
VENVENVENVENVEN
MEX
CHL
ARGIDN HKGCHN BRATHACHNMEX HKGTHAIDN
CHL
ARGBRA MEXTHAIDN
CHNARG
BRA HKG
CHL
HKGTHA
CHL
BRAIDNCHN
ARGMEXIDN THA MEX HKGBRAARG
CHL
CHN
SGP
BHR
HKG
BRB MAC
MLT
KOR
MLT
MAC
HKG
BRB
BHR
SGP
KORKORMACBRB
MLTBHR
SGP
HKGHKG
MLT
MACKOR
BHR
SGPBRB MAC
BHR
SGP
HKG
MLT
KOR
BRB
0.2
.4.6
.8H
erf
inda
hl In
dex o
f E
xp
ort
s
0 5000 10000 15000 20000 25000GDP per capita constant US$(2000)
Author's calculations
Data Source: UN Comtrade (SITC Rev. 2 - 4 digit) and the World Bank (World Development Indicators)
GDP per capita and Export Diversification, 2000-2004
11
China
Korea
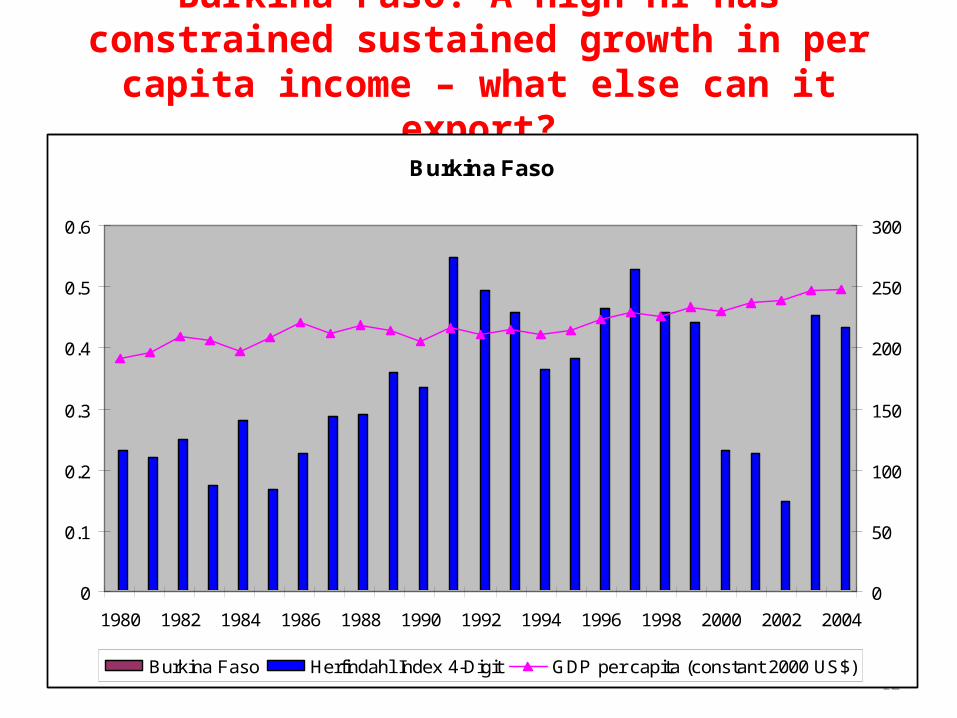
Burkina Faso: A high HI has constrained sustained growth in per capita income – what else can it export?
12
Burkina Faso
0
0.1
0.2
0.3
0.4
0.5
0.6
1980 1982 1984 1986 1988 1990 1992 1994 1996 1998 2000 2002 2004
0
50
100
150
200
250
300
Burkina Faso Herfindahl Index 4-Digit GDP per capita (constant 2000 US$)

A drop in HI drove growth in per capita GDP but the level of the HI is still very high and of income too low. What else can
Bangladesh export?
13
Bangladesh
0
0.02
0.04
0.06
0.08
0.1
0.12
0.14
0.16
1980 1982 1984 1986 1988 1990 1992 1994 1996 1998 2000 2002 2004
0
50
100
150
200
250
300
350
400
450
Bangladesh Herfindahl Index 4-Digit GDP per capita (constant 2000 US$)

A low HI has helped but what China exports explains why it has grown so fast
14
China
0
0.01
0.02
0.03
0.04
0.05
0.06
0.07
0.08
1980 1982 1984 1986 1988 1990 1992 1994 1996 1998 2000 2002 2004
0
200
400
600
800
1000
1200
1400
China Herfindahl Index 4-Digit GDP per capita (constant 2000 US$)

Openness fosters diversification and sustained growth
• Export led-growth played an important role in fostering fast and sustained growth.
• In small or poor countries, the purchasing power of the domestic market is low and exports are often the only source of growth.
• Between 1980 – 2007: in most low and middle income countries, the export/GDP ratio was small – less than 20 percent. In these economies, per capita GDP (constant USD) increased little.
• Examples: Brazil, India, Burkina Faso, Ghana. • In fast growing countries, growth was export-led and compensated
for small domestic markets. A high share of exports in GDP was matched by a faster increase in per capita income. Many countries graduated from a low to a middle income status. Examples: South Korea, Malaysia. More recently, China.
15

Openness and its nexus with per capita income. Note, SSA is more open than even China. What explains the differences in income within a region,
and between regions?
• Macro Stability?
• Openness?
Or
• Is it the Export Mix?
0.2.4.6.8Total exports/GDP, (%)
First_EA
Second_EA
SSAnoZAF
CHN
LAC
SA
Data: WDI and COMTRADE
Regional average Total exports/GDP
1990-95 2000-04

17
Sustained growth was led by exports in East Asia
Growth was export-led in fast growing East Asia
-10
10
30
50
70
90
110
130
1980 1982 1984 1986 1988 1990 1992 1994 1996 1998 2000 2002 2004
Exp
orts
of g
oods
& s
ervi
ces
/GD
P (%
)
0
500
1000
1500
2000
2500
3000
3500
4000
4500
5000
GD
P p
er c
apita
(200
0 co
nsta
nt U
SD
)
China Exports of goods and services (% of GDP) Malaysia Exports of goods and services (% of GDP)
Thailand Exports of goods and services (% of GDP) China GDP per capita (constant 2000 US$)
Malaysia GDP per capita (constant 2000 US$) Thailand GDP per capita (constant 2000 US$)17

18
Herfindahl Index of export concentration (0 – 1) and share of exports in GDP (%) – no clear relationship!
China - HI (0-1) and exports as a share of GDP (%)
0
0.01
0.02
0.03
0.04
0.05
0.06
0.07
0.08
1980 1982 1984 1986 1988 1990 1992 1994 1996 1998 2000 2002 2004
0
5
10
15
20
25
30
35
40
China Herfindahl Index 4-Digit Exports of goods and services (% of GDP)
Burkina Faso - HI (0-1) and exports as a share of GDP (%)
0
0.1
0.2
0.3
0.4
0.5
0.6
1 3 5 7 9 11 13 15 17 19 21 23 25
0
2
4
6
8
10
12
14
Burkina Faso Herfindahl Index 4-Digit Exports of goods and services (% of GDP)
Bangladesh - HI (0-1) and exports as a share of GDP (%)
0
0.02
0.04
0.06
0.08
0.1
0.12
0.14
0.16
1 3 5 7 9 11 13 15 17 19 21 23 25
0
2
4
6
8
10
12
14
16
18
Bangladesh Herfindahl Index 4-Digit Exports of goods and services (% of GDP)
Ghana - HI (0-1) and exports as a share of GDP (%)
0
0.05
0.1
0.15
0.2
0.25
0.3
0.35
0.4
0.45
1 3 5 7 9 11 13 15 17 19 21 23 25
0
10
20
30
40
50
60
Ghana Herfindahl Index 4-Digit Exports of goods and services (% of GDP)
18

When can diversification be income-enhancing and inclusive?
1. Is there empirical evidence to suggest that certain patterns of diversification can be more income-enhancing than others?
2. East Asia relied on export diversification in manufactured products to achieve faster and sustained growth. Is the East Asian diversification pattern optimal and feasible for all developing countries that are eager to catch up?
3. Are natural resources a curse for a low income country?” 4. Country-specific level examination:
1. Can Burkina Faso’s (BF) current exports transform it into a MIC even in the next several decades?
2. Do the trends in BF’s exports reflect the level of its technological capabilities and indicate how it compares with comparators, ie., other landlocked, cotton or primary product exporters over the longer term?
19
20
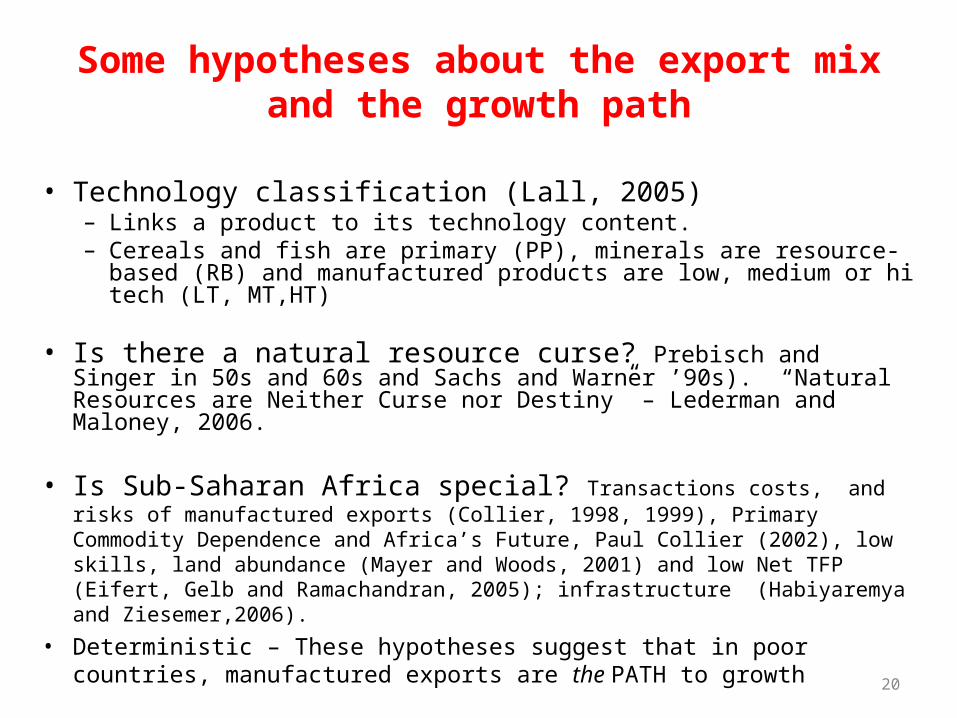
Some hypotheses about the export mix and the growth path
• Technology classification (Lall, 2005)– Links a product to its technology content. – Cereals and fish are primary (PP), minerals are resource-based (RB) and
manufactured products are low, medium or hi tech (LT, MT,HT)
• Is there a natural resource curse? Prebisch and Singer in 50s and 60s and Sachs and Warner ’90s). “Natural Resources are Neither Curse nor Destiny” – Lederman and Maloney, 2006.
• Is Sub-Saharan Africa special? Transactions costs, and risks of manufactured exports (Collier, 1998, 1999), Primary Commodity Dependence and Africa’s Future, Paul Collier (2002), low skills, land abundance (Mayer and Woods, 2001) and low Net TFP (Eifert, Gelb and Ramachandran, 2005); infrastructure (Habiyaremya and Ziesemer,2006).
• Deterministic – These hypotheses suggest that in poor countries, manufactured exports are the PATH to growth

Why natural resources and primary products appear to be a curse?
Ex: the relationship between the export share of cotton and per capita income is negative. Burkina Faso, Benin and Mali did not diversify away
from it.
0.00
0.10
0.20
0.30
0.40
0.50
0.60
0.70
0.80
5 5.5 6 6.5 7 7.5
Log of GDP pc (constant US$)
Co
tton
(%
To
tal E
xpo
rts)
TCD
MLI
BFA BEN
SDNTGO
TZACAF KGZ PAK
NICAZE
EGY
TKM
PRY
21
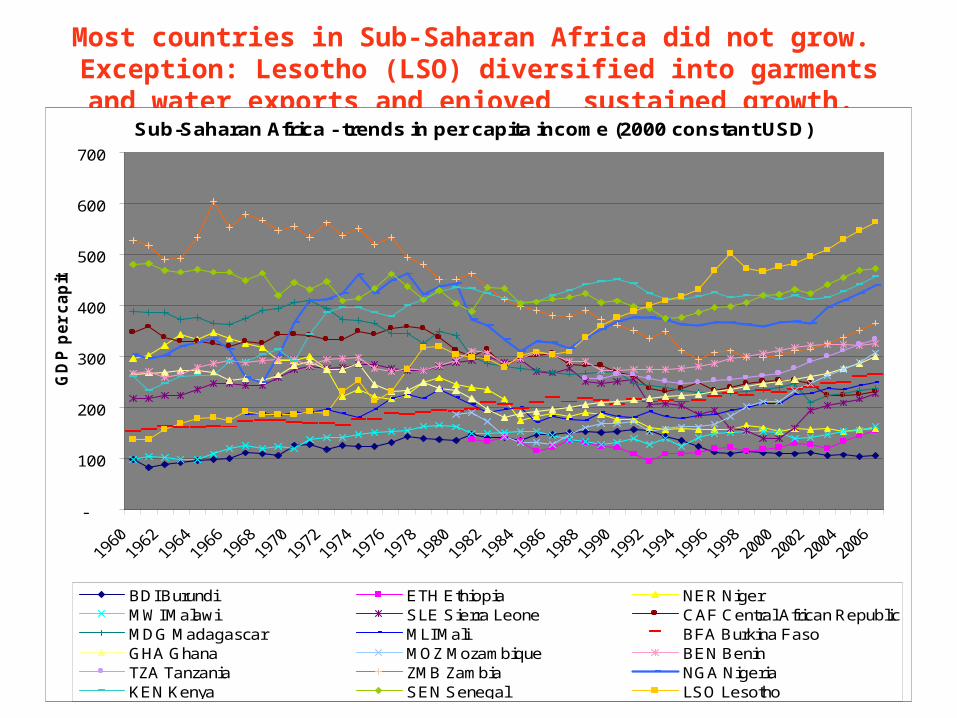
Most countries in Sub-Saharan Africa did not grow. Exception: Lesotho (LSO) diversified into garments and water exports and
enjoyed sustained growth. Sub-Saharan Africa - trends in per capita income (2000 constant USD)
-
100
200
300
400
500
600
700
GD
P p
er
ca
pit
a
BDI Burundi ETH Ethiopia NER NigerMWI Malawi SLE Sierra Leone CAF Central African RepublicMDG Madagascar MLI Mali BFA Burkina FasoGHA Ghana MOZ Mozambique BEN BeninTZA Tanzania ZMB Zambia NGA NigeriaKEN Kenya SEN Senegal LSO Lesotho

Technology hypothesis: High and sustained growth has occurred in countries that export mostly LT, MT and HT products
Cereals and fish are primary (PP), minerals are resource-based (RB) and manufactured products are low, medium or hi tech (LT, MT,HT)
• Problem: Too deterministic and ad hoc. Implies manufactured exports are the only path to growth. Can PP and RB exporters leapfrog into LT, MT and HT exports?
0.2
.4.6
.81
SA LAC SSAnoZAF OECD First_EA
First EA: HKG, TWN, KOR and SGP
1990-95
HT MT
LT RB
HV PP
0.2
.4.6
.81
SA SSAnoZAF LAC OECD First_EA
First EA: HKG, TWN, KOR and SGP
2000-04
HT MT
LT RB
HV PP
Regional export composition, Tech categories

Must all countries export manufactured products to grow?
Trade patterns have changed and are indeterminate in this era of globalization. Production networks are fragmented globally. For example:
1. East Asia – exports mostly Hi-tech products now. China is replicating the East Asian model. Imports parts and exports hi Tech products. They have acquired a competitive advantage in these products.
2. Some other countries have successfully reversed export patterns and discovered new products. Chile has diversified from copper to fish and wine; Columbia from coffee to cut flowers ; Kenya and Uganda from coffee, tea and cotton to fish and flowers. India has reversed the historical flow of services exports. Where the share of new exports is large, income growth has been fast and sustained.
These approaches to diversification do not offer a metric that objectively indicates whether the new products are good or bad for a sustained increase in per capita income.
25
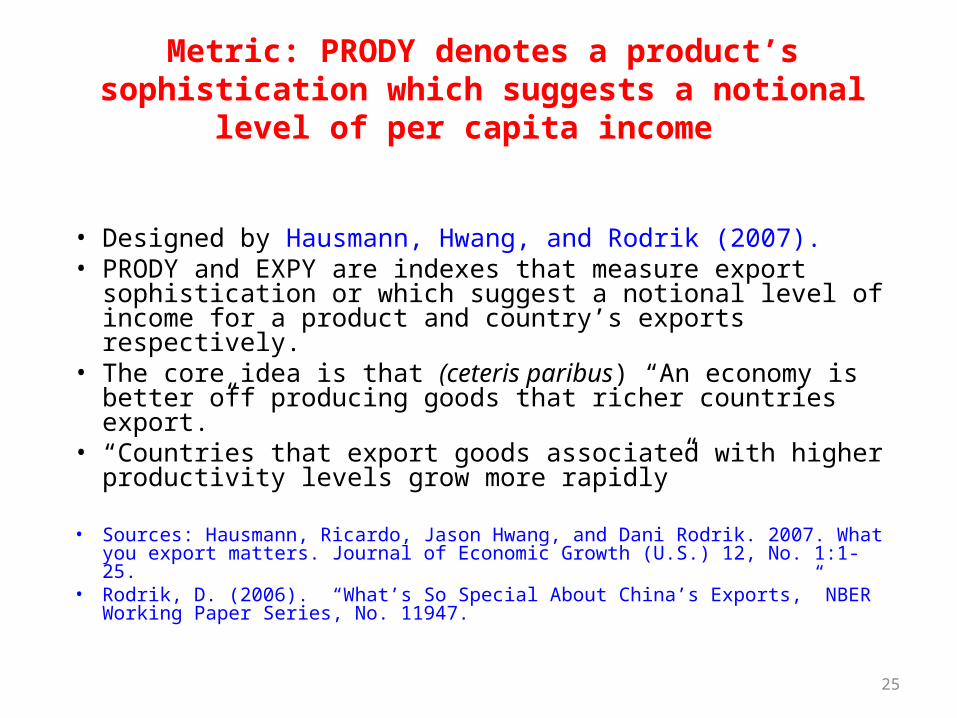
Metric: PRODY denotes a product’s sophistication which suggests a notional level of per capita income
• Designed by Hausmann, Hwang, and Rodrik (2007).• PRODY and EXPY are indexes that measure export
sophistication or which suggest a notional level of income for a product and country’s exports respectively.
• The core idea is that (ceteris paribus) “An economy is better off producing goods that richer countries export.”
• “Countries that export goods associated with higher productivity levels grow more rapidly”
• Sources: Hausmann, Ricardo, Jason Hwang, and Dani Rodrik. 2007. What you export matters. Journal of Economic Growth (U.S.) 12, No. 1:1-25.
• Rodrik, D. (2006). “What’s So Special About China’s Exports,” NBER Working Paper Series, No. 11947.
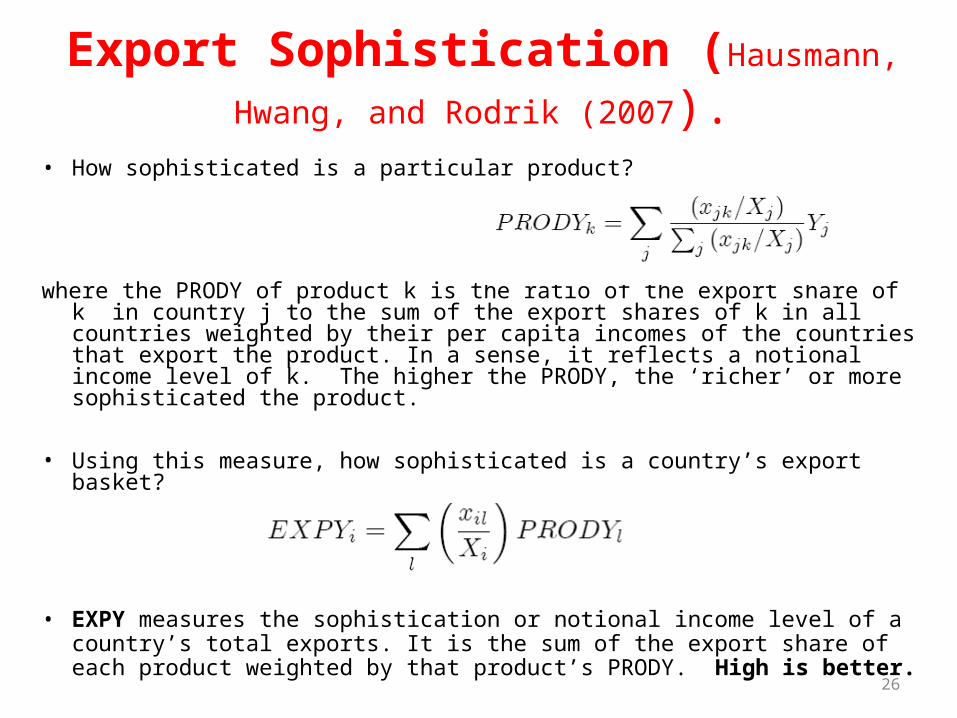
Export Sophistication (Hausmann, Hwang, and Rodrik
(2007).• How sophisticated is a particular product?
where the PRODY of product k is the ratio of the export share of k in country j to the sum of the export shares of k in all countries weighted by their per capita incomes of the countries that export the product. In a sense, it reflects a notional income level of k. The higher the PRODY, the ‘richer’ or more sophisticated the product.
• Using this measure, how sophisticated is a country’s export basket?
• EXPY measures the sophistication or notional income level of a country’s total exports. It is the sum of the export share of each product weighted by that product’s PRODY. High is better. 26

27
PRODY for Selected Products – natural resources are neither curse nor destiny – it all depends on what you do with them
0
5
10
15
20
25E
lect
ron
icm
icro
circ
uits
Inte
rna
lco
mb
ust
ion
Wo
od
an
dre
sin
ba
sed
Te
levi
sio
nre
ceiv
ers
,A
rtic
les
of
lea
the
rK
nitt
ed
/cro
ch.
Fa
bri
cF
ish
, pre
pa
red
or
pre
serv
ed
Pri
ntin
g a
nd
wri
ttin
g p
ap
er
Ba
con
, ha
m &
oth
er
dri
ed
Po
tato
es,
fre
sho
r ch
ille
dC
offe
e, w
he
the
ro
r n
ot r
oa
ste
d
Co
coa
, be
an
s
Fru
it, fr
esh
or
dri
ed
Milk
an
d c
rea
m
Oliv
e O
il
Pa
lm O
il
Ma
ize
(co
rn),
un
mill
ed
PR
OD
Y (
'00
0)
High and Medium TechLow Tech
Resource Based
Primary Products
Source: Authors’ calculations using UN Comtrade Database

28
Certain products have been good for Catch-up in East Asia, (see Rodrik (2006))
• Leapfrogging does not require all exported products to be transformed immediately into high PRODY ones.
• China’s catch up with Hong Kong and Korea occurred when it started exporting some High Prody products.
Country Product Description Prody share (%) Product Description Prody share (%)
Petrol.oils & crude oils from bitum. Minerals 5127 8 Peripheral units,incl.control & ada 13315 4
Cotton(other than linters) not carded 1531 3Parts of and accessories suitable for Office mach and elect. Appliances 13526 4
Other parts & accessories of motor vehicles 13511 3 Footwear 14349 3Fabrics woven of silk or noil or other 8685 3 Children's toys, indoor games, etc 13962 3Cotton yarn 4183 2 Parts of apparatus of radios, TVs, etc. 12278 3
Children's toys, indoor games, etc 13962 8 Electronic microcircuits 15002 9
Watches, watch movements and cases 21281 6Parts of and accessories suitable for Office mach and elect. Appliances 13526 5
Other outer garment of textile fabrics 5155 5 Electronic appliances 13924 5Jersey, pullovers, twinsets, cradigans. 4591 5 Jersey, pullovers, twinsets, cradigans. 4591 4Trousers, breeches, etc of textile fabric. 5022 3 Other outer garment of textile fabrics 5155 3
Footwear 14349 7 Electronic microcircuits 15002 12Fabrics woven of continuous synth. 10361 3 Passenger motos cars, for transport 18851 8Electronic microcircuits 15002 3 Radiotelegraphic and radiotelephonic 18331 8Art. of apparel & colthing accessories 6379 3 Peripheral units,incl.control & ada 13315 4
Jersey, pullovers, twinsets, cradigans. 4591 3Parts of and accessories suitable for Office mach and elect. Appliances 13526 4
1980
-84
2000
-04
Five main exports (2000-04) Five main exports (1980-84)
China
Hong Kong, China
Korea Rep.

29
Manufactured Exports are not the only path to faster and sustainable growthOther developing countries’ success stories are natural resource-based
CountryMain exports, 1980 Shares Prody Country
Main exports, 2004 Shares Prody
Copper alloys 37.4% 6825 Copper alloys 31.2% 6825Flours & meals,of meat/fish 8.1% 10625 Copper ores 16.7% 1825Grapes 4.7% 5492 Fish,frozen 2.5% 5932
Coffee,whether or 60.7% 638 Petrol.oils & crude 19.3% 5261
Sugars,beet and cane 4.2% 1515
Other coal,whether/not pulverized 11.4% 7534
Cotton (other than linters),not car 2.1% 530
Coffee,whether or not roasted 6.2% 638
Cut flowers and foliage 2.5% 2286
Cut flowers and foliage 4.5% 2286
Coffee,whether or not roasted 40.0% 638
Cut flowers and foliage 17.5% 2286
Tea 17.7% 517 Tea 16.2% 517Coffee,whether or not roasted or fr 5.8% 638
Coffee,whether or not roasted 33.0% 638Fish fillets,fresh or chilled 21.0% 6034Cut flowers 6.4% 2286U
gand
a
Keny
aCo
lom
bia
Chile
Uga
nda
Coffee,whether or not roasted 95.3% 638
Chile
Colo
mbi
aKe
nya
USA and Canada: Fish fillet and Frozen Fish
Netherlands: Cut flowers

30
EXPY is a good measure of the export sophistication of a country’s exports. EXPY & GDP per capita are highly correlated
Source: Hausmann, Hwang and Rodrik (2005)
Summing up (1)
1. Openness and diversification matter for sustainable growth. But not any type of diversification. The L-shaped curve for the Herfindahl Index and per capita income in low income countries shows this.
2. There are alternative growth paths for primary and natural resource-based product exporters. They are not cursed.
• To leapfrog and grow faster – a country needs to diversify into and scale up at least some sophisticated (higher PRODY) products.
2. Country and product/industry specificity are key.
• The diversity of country experiences indicates that there is more than one way to do it.
3. Comparative advantage can be created/developed. Technological capabilities can be acquired and can change what you export. There is no need to rely only on your natural endowments to guide export patterns.
4. As usual, there are trade-offs.

Summing up (2)Should we make policy recommendations based on these new
concepts that link a product to its sophistication level – NO.1. EXPY indicates that higher PRODY products can lead to a higher level of per
capita income. BUT it does not tell us which high PRODY products.
2. A higher PRODY suggests that one product is more sophisticated than another.
BUT it does not indicate whether the country has a comparative advantage in
exporting that product.
3. Judging whether a high PRODY product is optimal for a country depends on
whether the country has the technological capabilities and other
complementary inputs required to produce that product profitably.
4. This requires a lot more homework, analysis and in-depth knowledge of what
constrains the emergence and scaling up of high PRODY products that seems
suitable for a country.

An analysis of diversification and growth in Burkina Faso
Brief background: In 1977, BF had a per capita income of US$ 186 (constant 200 dollars). In 2004, after 27 years, it had increased to only $248. Annual growth rate was only 1.1%. Central question: If Burkina Faso wants to become a middle income country,
can it continue to pursue the same growth path that it has tread in the past 30 or more years?
Outline: International comparisons are useful Sources of growth Why exports matter Why diversification matters Into what can it diversify? Whatever it is, it must be income-enhancing diversification. For more details, refer to the diversification and growth chapter in CEM 2009
(draft)

Table 2.1: Trends in per capita Gross National Income in Burkina Faso and Comparators (current PPP US $)
Burkina Faso 86 148 270 269 250 340 400 420 430 Landlocked (LL), cotton
Nepal 65 99 165 205 232.5 270 300 320 340 LL, leather, beans
Lao PDR 378 302 320 420 450 500 580 LL, coffee, wood
Kyrgyz Republic 388 298 400 450 500 590 LL, cotton, gold, tobacco
Uzbekistan 605 515 460 530 610 730 Landlocked
Turkmenistan 850 686 650 LL, nuts, tobacco, cotton
Mongolia 1474 579 475 690 810 1000 1290 LL, wool, wood,minerals
Bolivia 490 851 867 953 960 1020 1110 1260 LL, petroleum, tin
Paraguay 1569 1185 1080 1230 1410 1670 LL,cotton, soya beans, wood
Cambodia 286 305 380 440 490 540 Sya beans, wood, rubber
Senegal 250 366 548 591 485 640 740 760 820 Groundnuts, seafood,min.
Nicaragua 224 484 670 467 738 820 890 930 980 Coffee, cotton, bananas
Sri Lanka 154 234 371 664 875 1070 1200 1350 1540 Tea, rubber
Guatemala 294 611 1101 1328 1700 1930 2080 2250 2440 Cotton, coffee, sugar
Burkina Faso 86 148 270 269 250 340 400 420 430 Landlocked, cotton
Burundi 63 109 231 165 100 90 90 100 110 Landlocked, coffee
Malawi 58 116 168 186 155 220 220 230 250 Landlocked, tobacco
Rwanda 44 112 284 274 218 210 250 280 320 Landlocked, coffee
Uganda 283 243 240 250 270 300 340 Landlocked, cotton, coffee
Mali 70 144 241 293 270 390 450 460 500 Cotton
Benin 114 193 319 328 340 450 510 530 570 Cotton
Zambia 270 483 443 356 323 410 500 640 800 Landlocked, copper Source: WDI
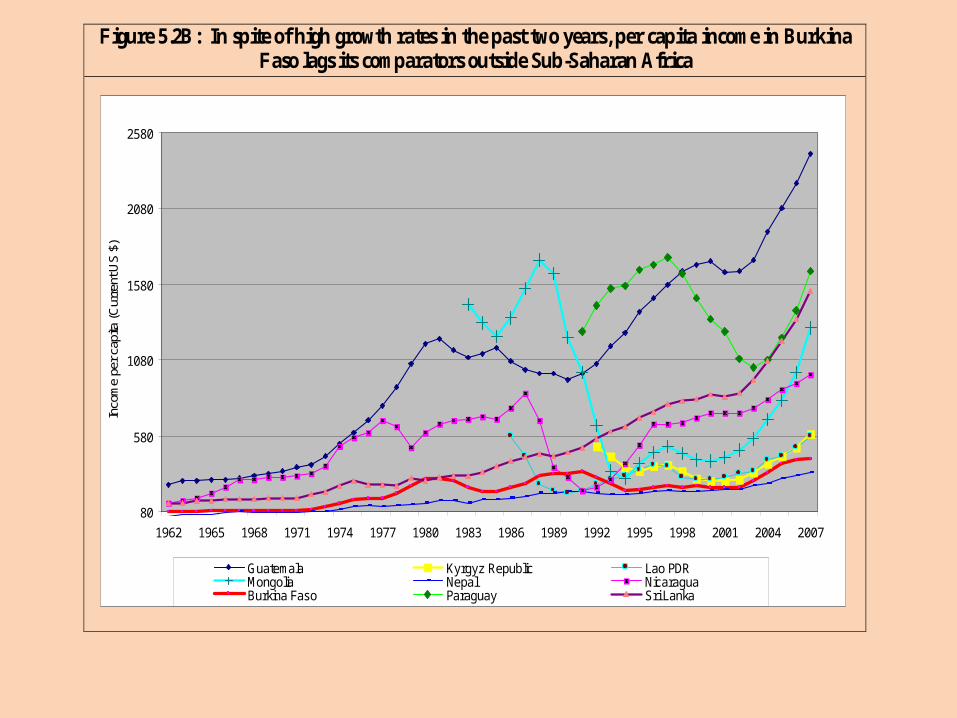
Figure 5.2B: In spite of high growth rates in the past two years, per capita income in Burkina Faso lags its comparators outside Sub-Saharan Africa
80
580
1080
1580
2080
2580
1962 1965 1968 1971 1974 1977 1980 1983 1986 1989 1992 1995 1998 2001 2004 2007
Inco
me
per
capi
ta (
Cur
rent
US
$)
Guatemala Kyrgyz Republic Lao PDRMongolia Nepal NicaraguaBurkina Faso Paraguay Sri Lanka

Figure 5.2: Income Potential (EXPY) of Burkina Faso’s exports (EXPY) has remained low relative to landlocked and cotton exporters outside Sub-Saharan Africa
EXPY (cosntant 2000 $)
500
1000
1500
2000
2500
3000
3500
4000
4500
5000E
XP
Y
Benin Burkina Faso Bangladesh Guatemala
Lao PDR Paraguay Nicaragua Mali

Our framework: A classification of Burkina Faso’s exports by Revealed Comparative Advantage (table 1)
CLASSICS – prodcuts in which BF’s RCA in the earlier period was high and in recent period continues to remain high. Implication – its strong, maintain it
1980-84: RCA = 1 2001-05: RCA = 1
DISAPPEARANCES – prodcuts in which BF’s RCA in the earlier period was high but in recent period is low. Implication – declining competitiveness, leave them alone.
1980-84: RCA = 1 2001-05: RCA = 0
MARGINALS – products in which BF did not and does not have a RCA Implication – observe and let them grow
1980-84: RCA = 0 2001-05: RCA = 0
EMERGING CHAMPIONS – products in which BF’s RCA was low in the earlier period but high in recent period. Implication – build on these new discoveries and nascent products.
1980-84: RCA = 0 2001-05: RCA = 1

RCA 80-84 = 1 SHARE SHARE RCA 80-84 = 1 SHARE SHARE
RCA 00-04 = 1 80-84 00-06 RCA 00-04 = 0 80-84 00-06
Cotton uncarded 32.1 62.3 1,500 Gold 2.3 1.2 5,716
Sesame seeds 4.0 3.9 1,179 Oil cake & residues 2.6 0.3 5,718
Leather 0.9 1.5 2,159 Sheep and lamb skins 2.1 - 4,956
Other Vegetables 4.0 1.3 5,477 Basketwork, wickerwork 0.2 - 7,789
RCA 80-84 = 0 SHARE SHARE PRODY RCA 80-84 = 0 SHARE SHARE PRODY
RCA 00-04 = 1 80-84 00-06 RCA 00-04 = 0 80-84 00-06
Sugar - 3.4 4,516 Cotton seeds - 0.9 2,473
Cigarretes - 3.2 12,204 Cotton yarn - 0.8 4,262
Sheep/lamb skin leather 0.1 1.7 2,526 Bovine animals 3.4 0.1 4,391
Cotton seed oil - 0.8 3,173 Work of Art 0.2 0.2 8,542
(a) The Classics (b) Disappearances
(c) Emerging Champions (d) Marginals
PRODY PRODY
A classification of Burkina Faso’s exports by Revealed Comparative Advantage and PRODY (table 2)

A classification of Burkina Faso’s exports – thinking at the industry or more aggregated level (table 3 )
• Classics: These are Burkina Faso’s traditional exports and the group is formed by 6 product categories. It includes some
• fresh or chilled vegetables; • fresh fruits, • sesame seeds, • oil seeds and oleaginous fruits; • not carded cotton; and • leather of other hides or skins. They tend to have low PRODYs but the highest densities for
Burkina Faso.
• Disappearances: It includes 4 categories of bovine, goat, sheep, and lamb skins; basketwork; and notably gold. Hides and skins exports to Europe have declined systematically. Gold was one major product exported by Burkina Faso whose production decline. Now gold mining has a promising recovery.
• Emerging champions, High PRODY products but small in number (only 15) and export values. Some reversals in exports during 2005-06 suggest the existence of constraints in the economic environment that prevents them from scaling up. Cotton seed oil, soap, horticultural products, some low tech manufactures, and two leather and skin products.
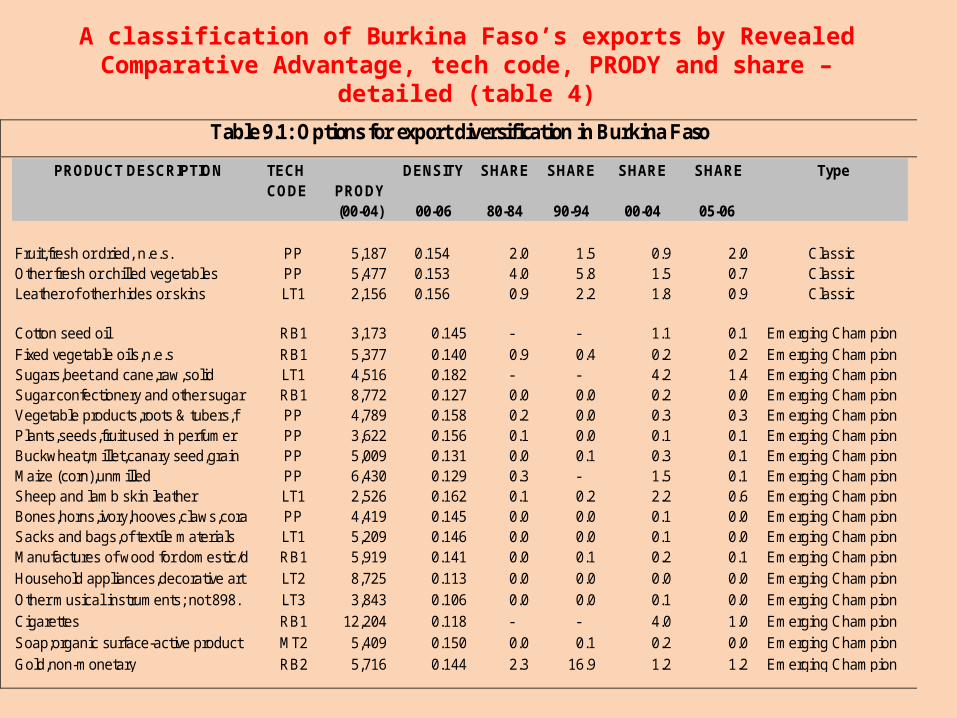
Table 9.1: Options for export diversification in Burkina Faso
PRODUCT DESCRIPTION TECH CODE PRODY
DENSITY SHARE SHARE SHARE SHARE Type
(00-04) 00-06 80-84 90-94 00-04 05-06
Fruit,fresh or dried, n.e.s. PP 5,187 0.154 2.0 1.5 0.9 2.0 ClassicOther fresh or chilled vegetables PP 5,477 0.153 4.0 5.8 1.5 0.7 ClassicLeather of other hides or skins LT1 2,156 0.156 0.9 2.2 1.8 0.9 Classic
Cotton seed oil RB1 3,173 0.145 - - 1.1 0.1 Emerging Champion
Fixed vegetable oils,n.e.s RB1 5,377 0.140 0.9 0.4 0.2 0.2 Emerging ChampionSugars,beet and cane,raw,solid LT1 4,516 0.182 - - 4.2 1.4 Emerging ChampionSugar confectionery and other sugar RB1 8,772 0.127 0.0 0.0 0.2 0.0 Emerging ChampionVegetable products,roots & tubers,f PP 4,789 0.158 0.2 0.0 0.3 0.3 Emerging ChampionPlants,seeds,fruit used in perfumer PP 3,622 0.156 0.1 0.0 0.1 0.1 Emerging ChampionBuckwheat,millet,canary seed,grain PP 5,009 0.131 0.0 0.1 0.3 0.1 Emerging ChampionMaize (corn),unmilled PP 6,430 0.129 0.3 - 1.5 0.1 Emerging ChampionSheep and lamb skin leather LT1 2,526 0.162 0.1 0.2 2.2 0.6 Emerging ChampionBones,horns,ivory,hooves,claws,cora PP 4,419 0.145 0.0 0.0 0.1 0.0 Emerging ChampionSacks and bags,of textile materials LT1 5,209 0.146 0.0 0.0 0.1 0.0 Emerging ChampionManufactures of wood for domestic/d RB1 5,919 0.141 0.0 0.1 0.2 0.1 Emerging Champion
Household appliances,decorative art LT2 8,725 0.113 0.0 0.0 0.0 0.0 Emerging Champion
Other musical instruments; not 898. LT3 3,843 0.106 0.0 0.0 0.1 0.0 Emerging Champion
Cigarettes RB1 12,204 0.118 - - 4.0 1.0 Emerging Champion
Soap;organic surface-active product MT2 5,409 0.150 0.0 0.1 0.2 0.0 Emerging Champion
Gold,non-monetary RB2 5,716 0.144 2.3 16.9 1.2 1.2 Emerging Champion
A classification of Burkina Faso’s exports by Revealed Comparative Advantage, tech code, PRODY and share – detailed (table 4)

Policy Implications - What can this framework tell us of income-enhancing export possibilities in Burkina Faso? Part 1
1. GOOD NEWS: there are alternative growth paths for Burkina Faso which is a primary commodity exporter.
2. What our framework shows:– That Burkina Faso’s traditional or “Classic” export products are mostly
low PRODY.– That there are some “Disappearing” exports. Some are high PRODY.
We don’t know why they are disappearing but we need to get more information.
– There is a long list of “Marginal “ products. We should be reluctant to suggest they might be good products. We need more information.
– There is a set of high PRODY “Emerging Champions” which seems attractive. We don’t know why they have not scaled up and what is holding them back. We need more information.
– MOST importantly, we do not know whether Burkina Faso has the technological capabilities and inputs to produce the “Emerging Champions.” We need more information.
Are we ready to comment on Burkina Faso’s industrial policy yet? NO
We should feel comfortable sharing information and comment on the sophistication of the Classics, Disappearances, Marginals and Emerging Champions as identified by our framework.
BUT
We are not ready to endorse any product or industrial policy. We need to do more homework. How much more?
Some answers can be found in a companion course.How do we prepare a report that helps us how to replicate the
concepts in this course for other countries or products? We recommend that you play with our toolkit, and cut and paste charts and tables into your reports.
42