Embed Size (px)
Citation preview

1
Dong Lu, Peter A. Dinda
Prescience Laboratory
Computer Science Department
Northwestern University
http://www.cs.northwestern.edu/~donglu
Virtualized Audio: A Highly Adaptive Interactive High Performance
Computing Application
http://www.cs.northwestern.edu/~pdinda

2
Overview
• Virtualized Audio: Immersive, listener-centric audio system based on high performance computing
• User-driven HPC exposes new challenges• How to exploit many adaptation mechanisms to achieve
responsiveness
• Concepts and initial results introduced here

3
Outline
• Limitations of traditional audio
• Virtualized audio• Interactive source separation and auralization
• Structure of interactive auralization
• Adaptation mechanisms
• Initial performance evaluation
• Conclusions

4
Performer
Microphones
Performance Room
Mixer
Amp
Listening Room
Listener
Sound Field 1Sound Field 2
Loudspeakers
Headphones
Traditional Audio

5
Performer
Microphones
Performance Room
Mixer
Amp
Listening Room
Listener
Sound Field 1Sound Field 2
Loudspeakers
Headphones
Limitations of Traditional Audio
•Microphones capture performance room as well as performer•Mixing process destroys recorded information

6
Virtualized Audio: Source Separation
Performer
Microphones
Performance Room
Separation
Sound Field 1
Performer
•Recording process results in only the performer
•Not currently implemented, not the subject of this talk
7
Performer
Microphones
Performance Room
Mixer
Amp
Listening Room
Listener
Sound Field 1Sound Field 2
Loudspeakers
Headphones
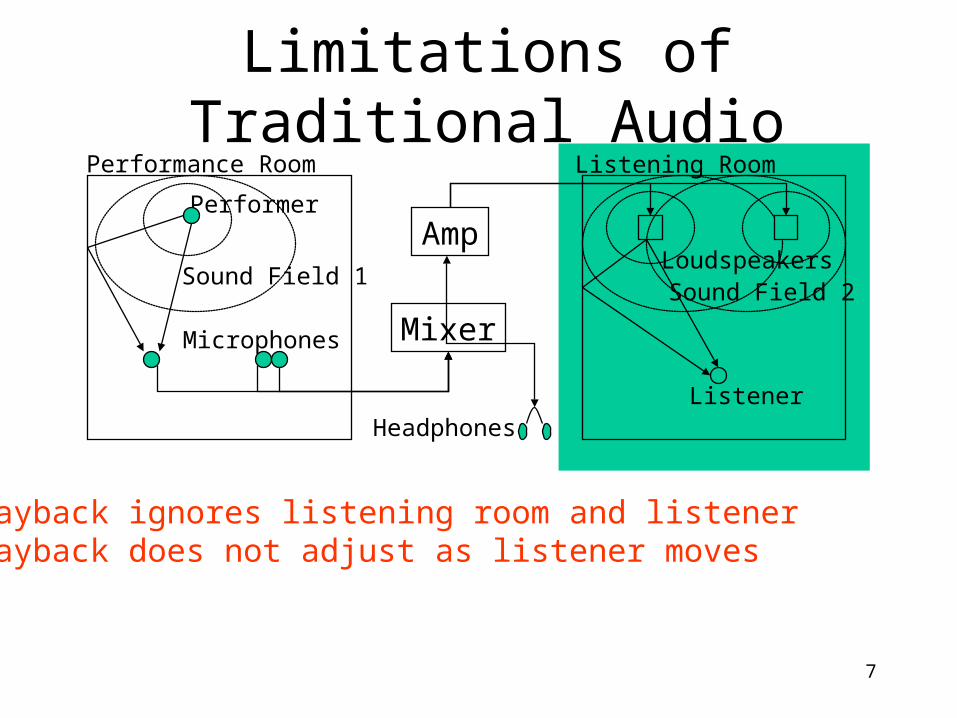
Limitations of Traditional Audio
•Playback ignores listening room and listener•Playback does not adjust as listener moves

8
Virtualized Audio: Interactive Auralization
Listener atVirtual LocationHeadphones
AuralizationSound Field 2
Virtual Performer
HRTF
Listener Performer Room Virtual Listening Room
•Auralization injects performer into listener’s space•Auralization adapts as listener moves or room changes
•Subject of this talk

9
Architecture of Interactive Auralization
Client
Scalable Real-time Simulation Server
Master filtering server
Mixing server
Mixing server
Filtering server
Filtering server
Filtering server
Filtering server
Streaming AudioService
Source 1
Source 2
Source 3
Source 4
Filtering server
Filtering server
Source n
Filter configuration
Left Channel
Right Channel
Scalable Audio Filtering Service
Parallel FD Simulation
Parallel FD Simulation
Parallel FD Simulation
Parallel FD Simulation
Parallel FD Simulation
Parallel FD Simulation
Filter generation
Binaural AudioOutput
Current Spatial Modeland source/sink positions
User-driven Immersive Audio Client
Impulse response filters characterize listening room

10
Architecture of Interactive Auralization
Client
Scalable Real-time Simulation Server
Master filtering server
Mixing server
Mixing server
Filtering server
Filtering server
Filtering server
Filtering server
Streaming AudioService
Source 1
Source 2
Source 3
Source 4
Filtering server
Filtering server
Source n
Filter configuration
Left Channel
Right Channel
Scalable Audio Filtering Service
Parallel FD Simulation
Parallel FD Simulation
Parallel FD Simulation
Parallel FD Simulation
Parallel FD Simulation
Parallel FD Simulation
Filter generation
Binaural AudioOutput
Current Spatial Modeland source/sink positions
User-driven Immersive Audio Client
11
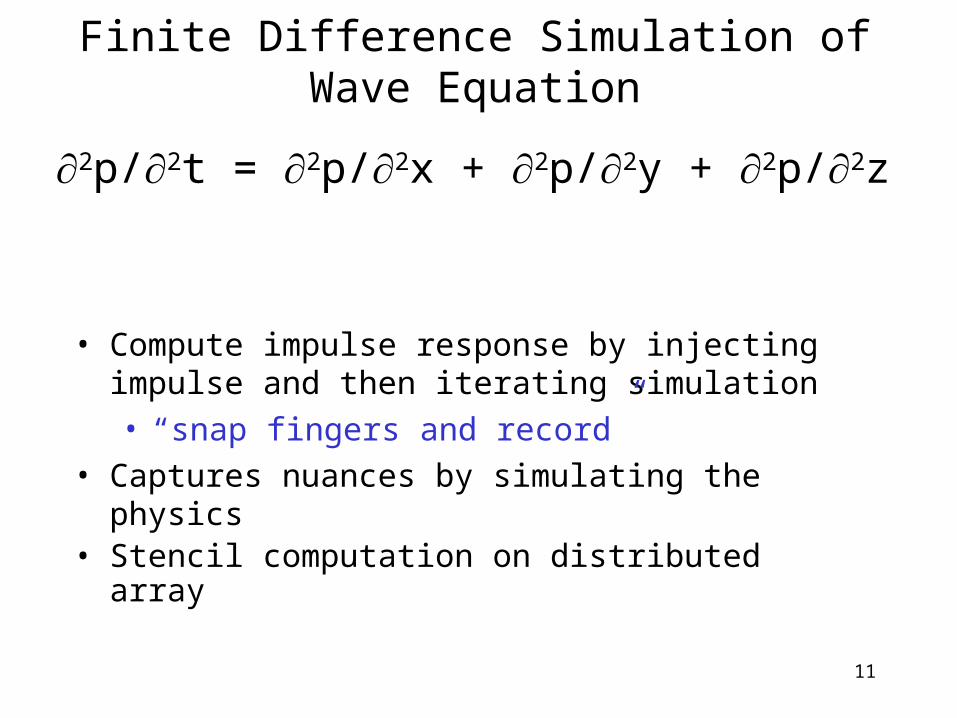
Finite Difference Simulation of Wave Equation
• Compute impulse response by injecting impulse and then iterating simulation• “snap fingers and record”
• Captures nuances by simulating the physics• Stencil computation on distributed array
2p/2t = 2p/2x + 2p/2y + 2p/2z

12
Simulation Server
• Simple stateless request/response protocol• Block-distributed simulation arrays• Extensible/Modifiable• Built with C++ and PVM

13
Computation requirements
0
500
1000
1500
2000
2500
3000
3500
4000
0 500 1000 1500 2000 2500 3000 3500 4000Peak Frequency (Hz)
8x6x3 meter room2 second impulse response
O(xyz(kf)4t/c3)
Current Resource Limit
14
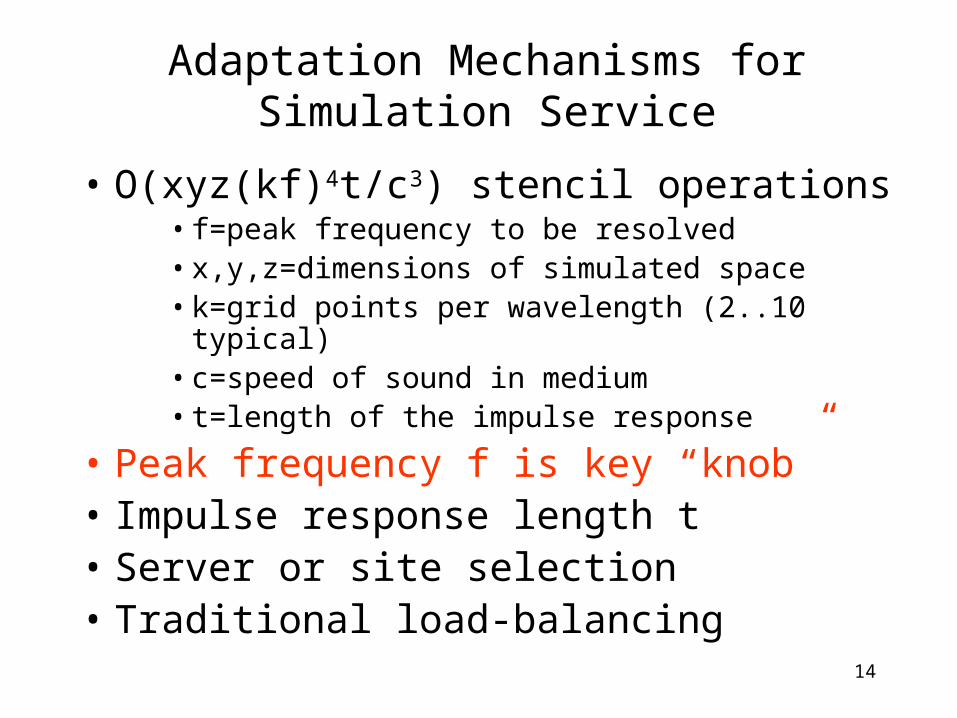
Adaptation Mechanisms for Simulation Service
• O(xyz(kf)4t/c3) stencil operations • f=peak frequency to be resolved• x,y,z=dimensions of simulated space• k=grid points per wavelength (2..10 typical)• c=speed of sound in medium• t=length of the impulse response
• Peak frequency f is key “knob” • Impulse response length t• Server or site selection• Traditional load-balancing

15
Adaptation Mechanisms for Filtering Service
• O((kf)2t) ops/second per stream• Using impulse response as FIR filter
• Peak frequency f is key “knob”
• Impulse response length t
• IIR approximations for impulse response filter
• Server or site selection

16
Simulation Server Evaluation
• Scalability
• Appropriateness of SMP
• Initial results on server selection
17
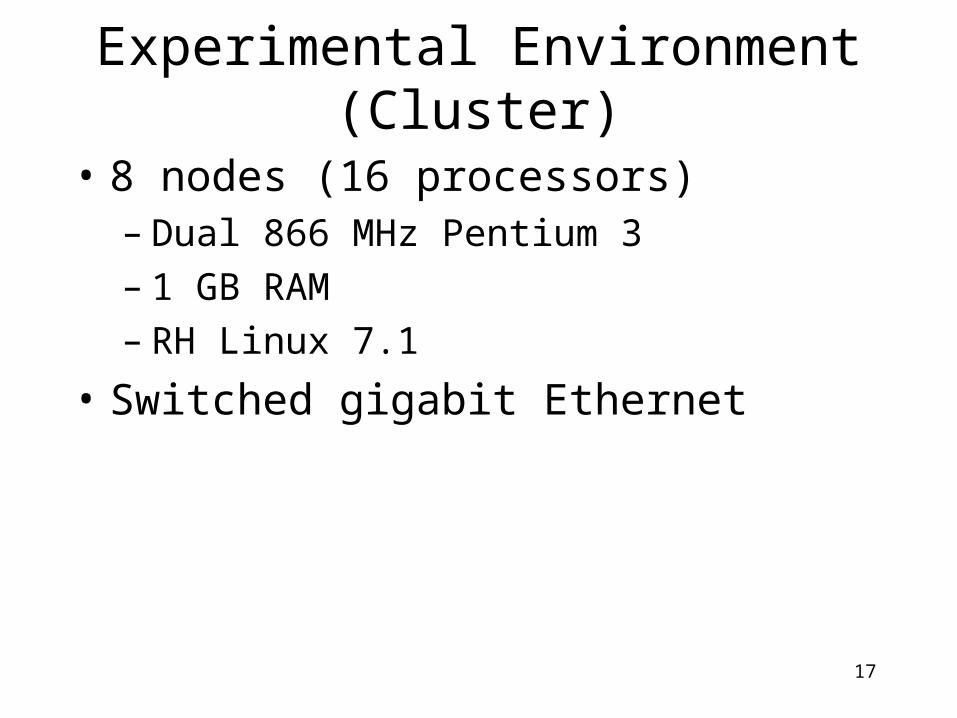
Experimental Environment (Cluster)
• 8 nodes (16 processors)– Dual 866 MHz Pentium 3– 1 GB RAM– RH Linux 7.1
• Switched gigabit Ethernet

18
Simulation Server Scales Well to 16 Processors
0
1
2
3
4
5
6
7
8
1 2 3 4 5 6 7 8 9 10 11 12 13 14 15 16Number of Processors
19
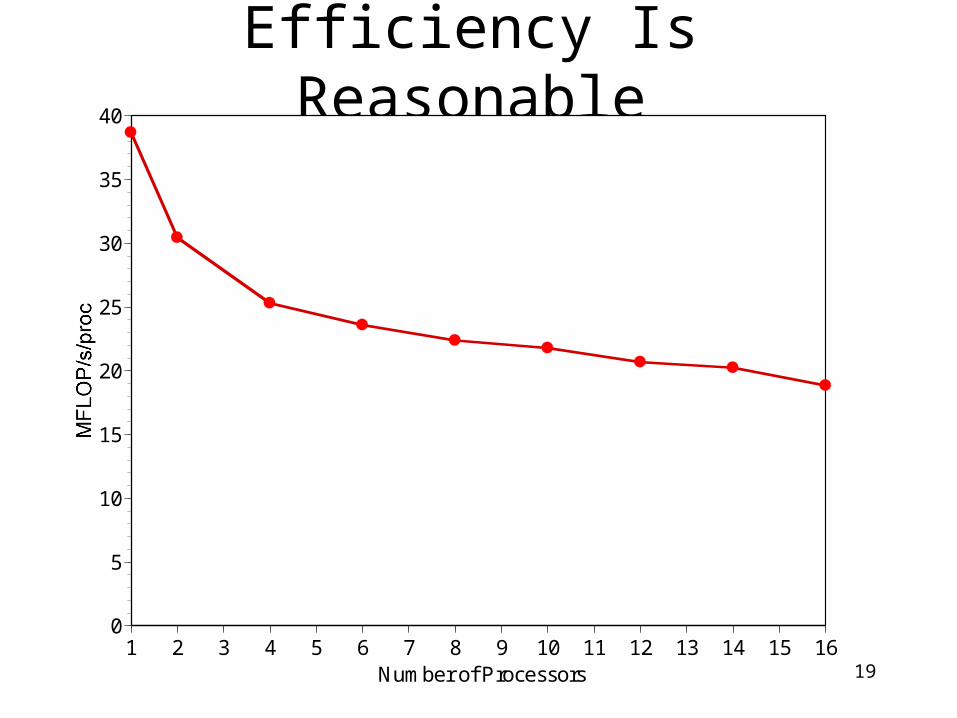
Efficiency Is Reasonable
0
5
10
15
20
25
30
35
40
1 2 3 4 5 6 7 8 9 10 11 12 13 14 15 16Number of Processors

20
SMP Is Useful (Not Memory-limited)
0
1
2
3
4
5
6
1 2 3 4 5 6 7 8Number of Processors
Distributed
2-way SMP

21
Server Selection Experiments
• Choose from several sequential servers• Small problem size
– 500 Hz, 8x6x3, 2 seconds– ~15 second task
• Four server selection algorithms– Random– Load measurement– Load prediction– Real-time Scheduling Advisor (RTSA)
RPS
http://www.cs.northwestern.edu/~RPS

22
Evaluation Methodology
• 100 repetitions, random arrivals
• Host load trace playback for dynamic load– Traces from production PSC cluster
• Metrics: mean and variance of task slowdown– Seek to minimize both

23
Experiment 0: No ChallengeChoose from 4 hosts with no load
Scheduler Mean Slowdown
StdDev Slowdown
Random 1.00 0.0010
Load Measure 1.01 0.013
Load Predict 1.01 0.015
RTSA 1.01 0.015
All algorithms have low overhead

24
Experiment 1: Static Challenge2 hosts with no load, 2 with high static load
Scheduler Mean Slowdown
StdDev Slowdown
Random 1.64 0.49
Load Measure 1.01 0.011
Load Predict 1.01 0.014
RTSA 1.01 0.012
All algorithms respond well with to static load challenge
25
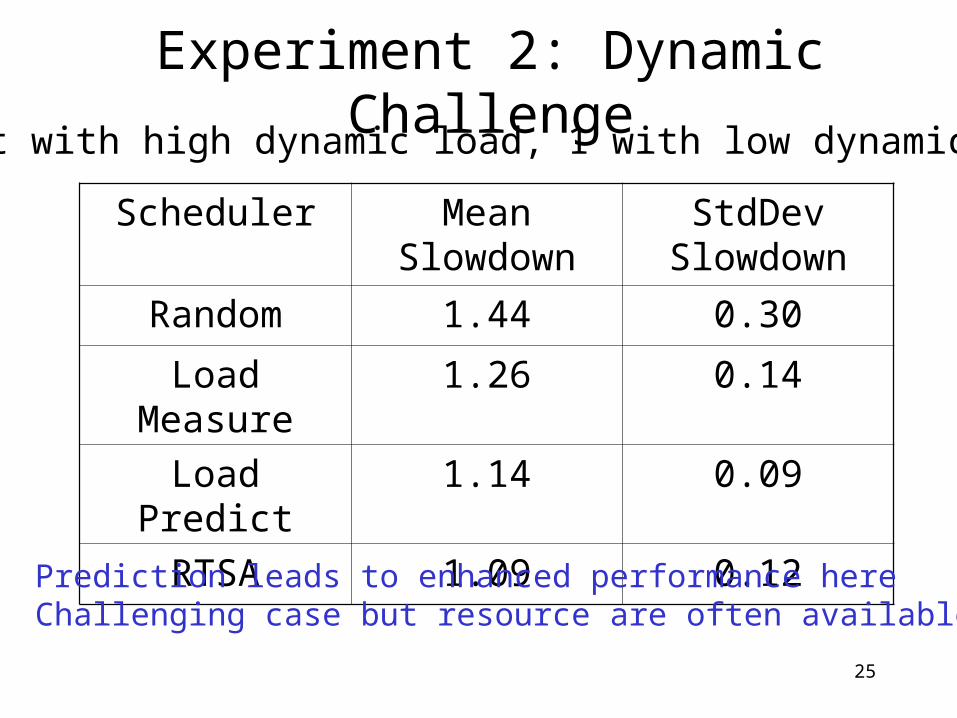
Experiment 2: Dynamic Challenge
Scheduler Mean Slowdown
StdDev Slowdown
Random 1.44 0.30
Load Measure 1.26 0.14
Load Predict 1.14 0.09
RTSA 1.09 0.12
1 host with high dynamic load, 1 with low dynamic load
Prediction leads to enhanced performance hereChallenging case but resource are often available
26
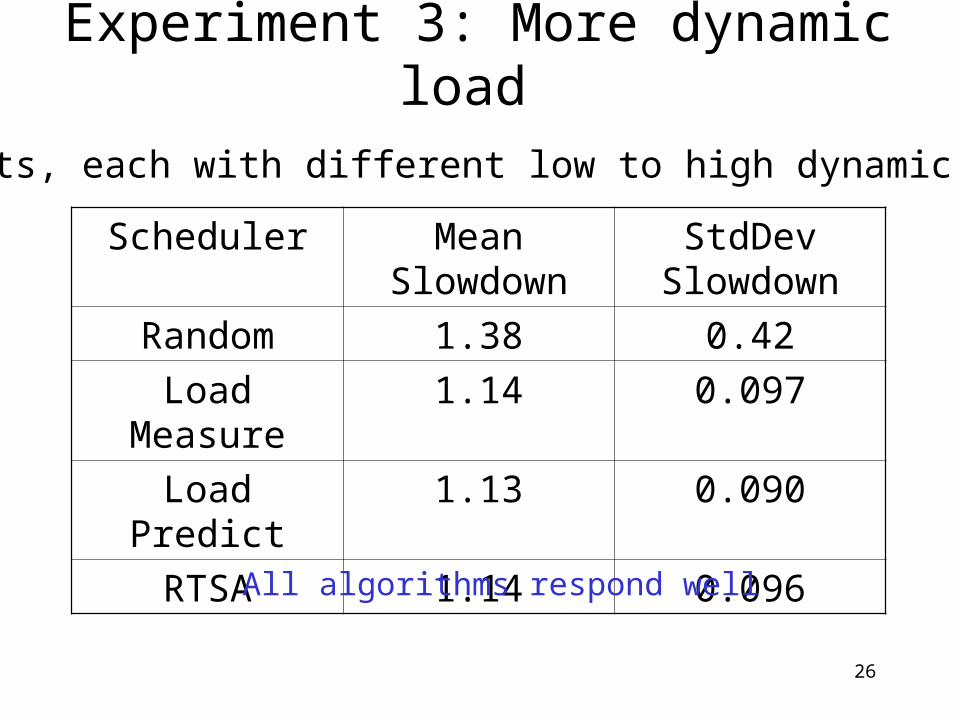
Experiment 3: More dynamic load
Scheduler Mean Slowdown
StdDev Slowdown
Random 1.38 0.42
Load Measure 1.14 0.097
Load Predict 1.13 0.090
RTSA 1.14 0.096
4 hosts, each with different low to high dynamic load
All algorithms respond well

27
Experiment 4: All Dynamic High Load
Scheduler Mean Slowdown
StdDev Slowdown
Random 1.72 0.25
Load Measure 1.60 0.27
Load Predict 1.62 0.23
RTSA 1.64 0.29
4 hosts, each with high dynamic load
Algorithms behave similarlyMost challenging scenario – few resource available
28
Conclusion & Future Work• Introduced Virtualized Audio as an HPC application• Described application structure• Identified adaptation mechanisms• Evaluated scalability of one component• Showed early server selection results
• Future Work– Dynamic load balancing of simulation service in non-
dedicated environments and Grids– Dynamic load balancing with real-time constraints– Continue development of application

29
For MoreInformation
• http://www.cs.northwestern.edu/~donglu• http://www.cs.northwestern.edu/~pdinda• Resource Prediction System (RPS) Toolkit
• http://www.cs.northwestern.edu/~RPS
• PlayLoad• http://www.cs.northwestern.edu/~pdinda/LoadTraces/playload
• Prescience Lab• http://www.cs.northwestern.edu/~plab