Embed Size (px)
Citation preview
1
Cost of CapitalCost of Capital Chapter 12Chapter 12
3Required Rates on ProjectsRequired Rates on ProjectsAn important part of capital budgeting is setting the An important part of capital budgeting is setting the
required rate for the individual projectrequired rate for the individual project
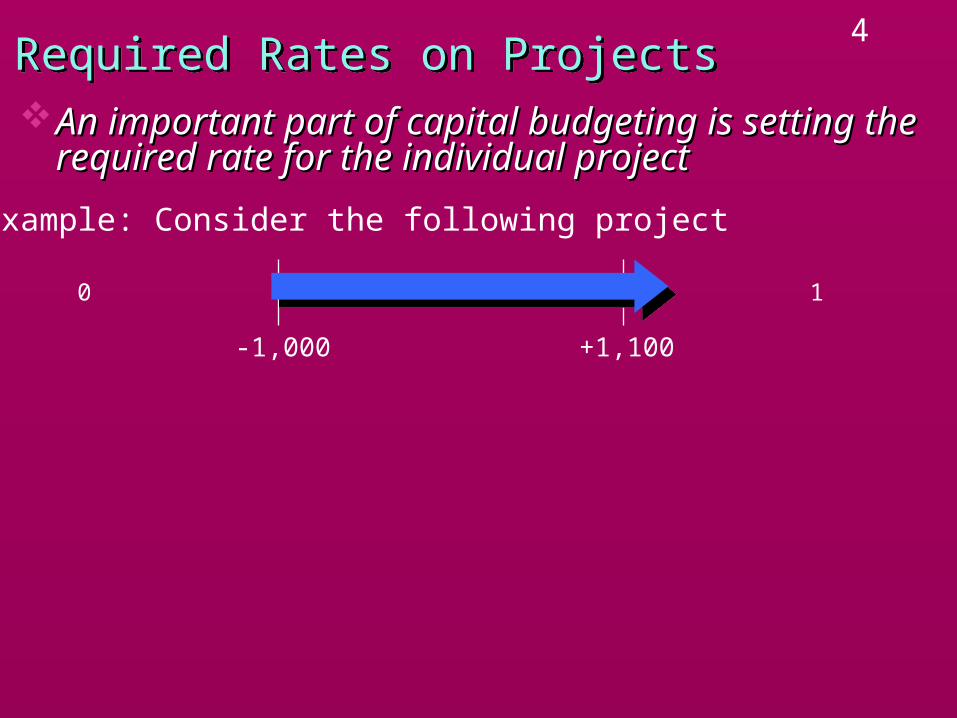
4Required Rates on ProjectsRequired Rates on ProjectsAn important part of capital budgeting is setting the An important part of capital budgeting is setting the
required rate for the individual projectrequired rate for the individual project
0 1
Example: Consider the following project
+1,100-1,000
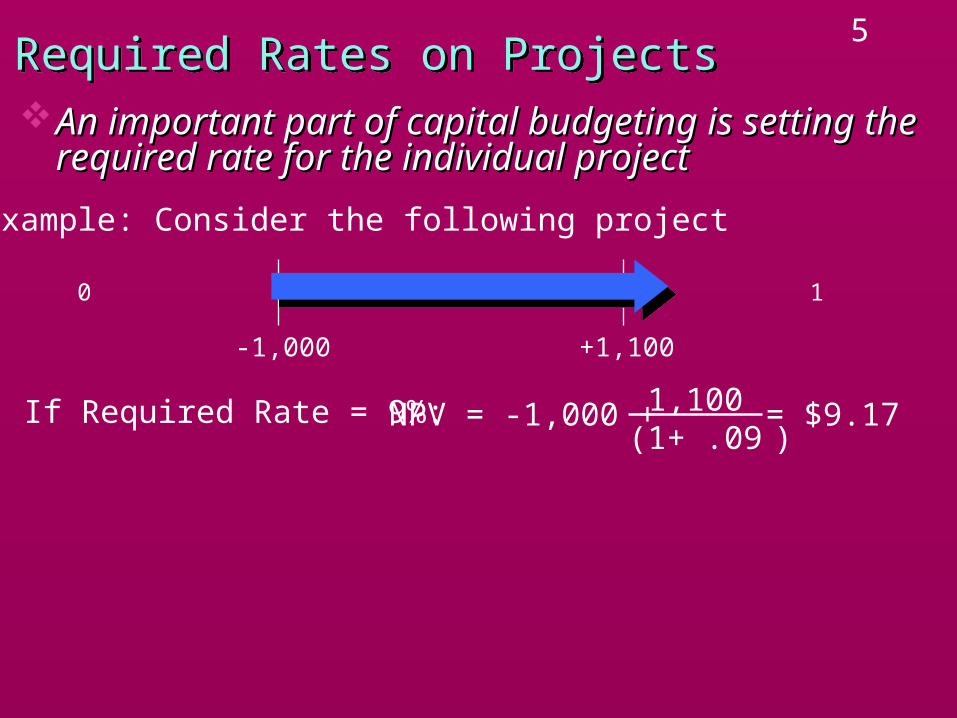
5Required Rates on ProjectsRequired Rates on ProjectsAn important part of capital budgeting is setting the An important part of capital budgeting is setting the
required rate for the individual projectrequired rate for the individual project
0 1
Example: Consider the following project
+1,100-1,000
If Required Rate = 9%: NPV = -1,000 + 1,100 (1+ .09 )
= $9.17
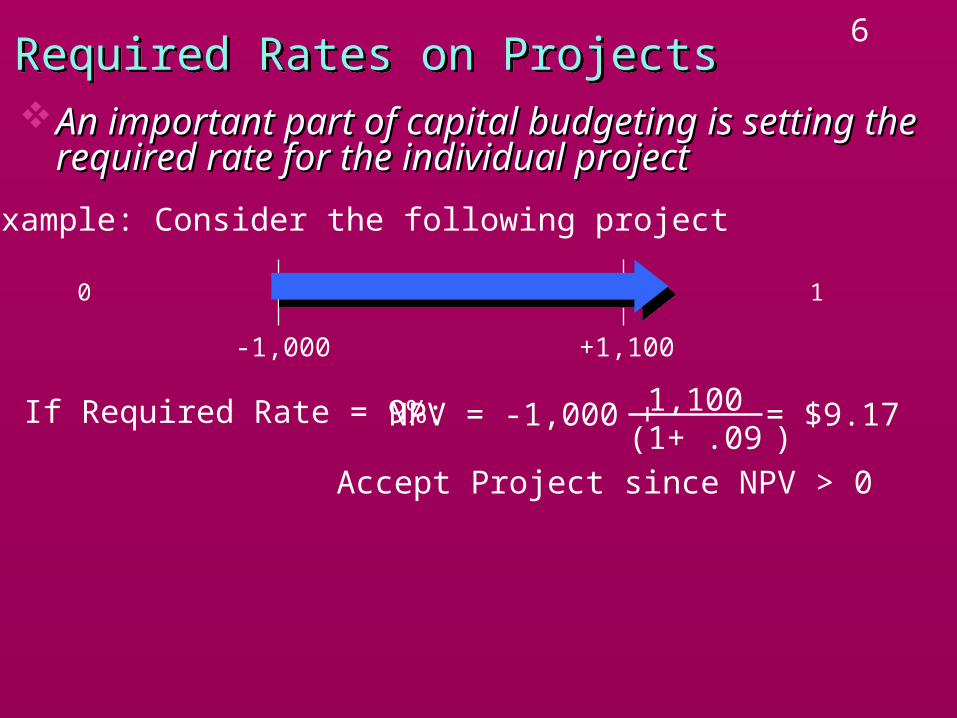
6Required Rates on ProjectsRequired Rates on ProjectsAn important part of capital budgeting is setting the An important part of capital budgeting is setting the
required rate for the individual projectrequired rate for the individual project
0 1
Example: Consider the following project
+1,100-1,000
If Required Rate = 9%: NPV = -1,000 + 1,100 (1+ .09 )
= $9.17
Accept Project since NPV > 0
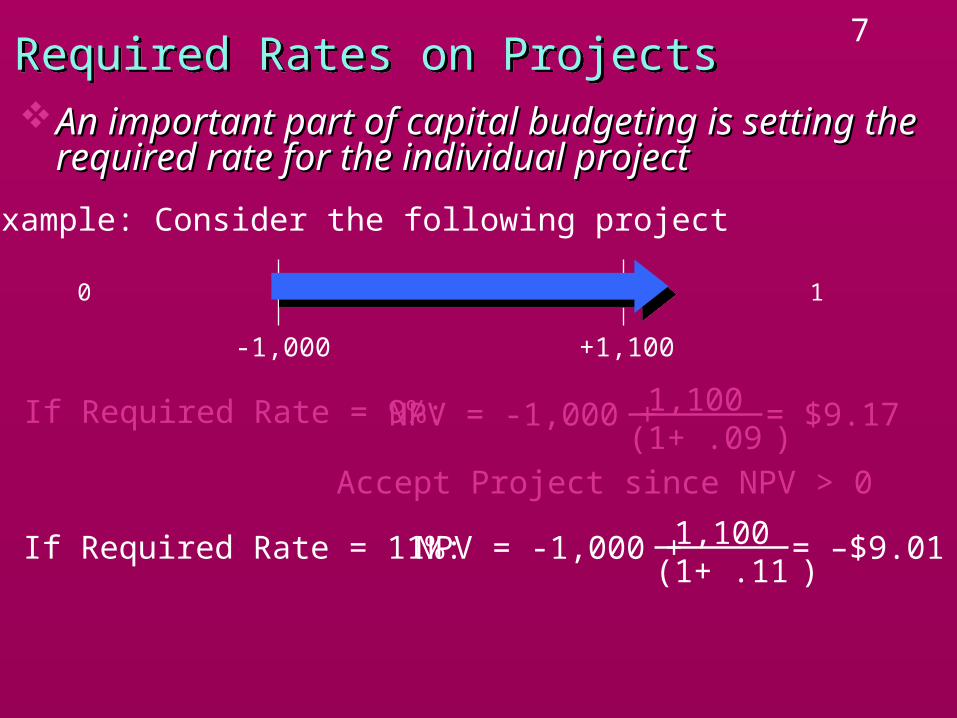
7Required Rates on ProjectsRequired Rates on ProjectsAn important part of capital budgeting is setting the An important part of capital budgeting is setting the
required rate for the individual projectrequired rate for the individual project
0 1
Example: Consider the following project
+1,100-1,000
If Required Rate = 9%: NPV = -1,000 + 1,100 (1+ .09 )
= $9.17
Accept Project since NPV > 0
If Required Rate = 11%: NPV = -1,000 + 1,100 (1+ .11 )
= –$9.01
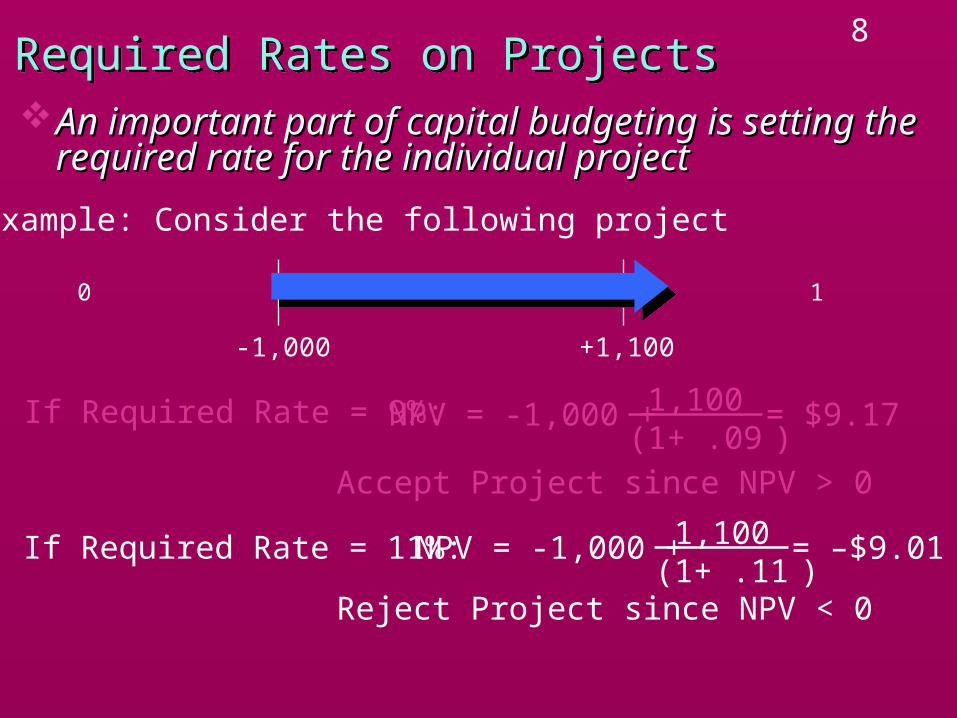
8Required Rates on ProjectsRequired Rates on ProjectsAn important part of capital budgeting is setting the An important part of capital budgeting is setting the
required rate for the individual projectrequired rate for the individual project
0 1
Example: Consider the following project
+1,100-1,000
If Required Rate = 9%: NPV = -1,000 + 1,100 (1+ .09 )
= $9.17
Accept Project since NPV > 0
If Required Rate = 11%: NPV = -1,000 + 1,100 (1+ .11 )
= –$9.01
Reject Project since NPV < 0
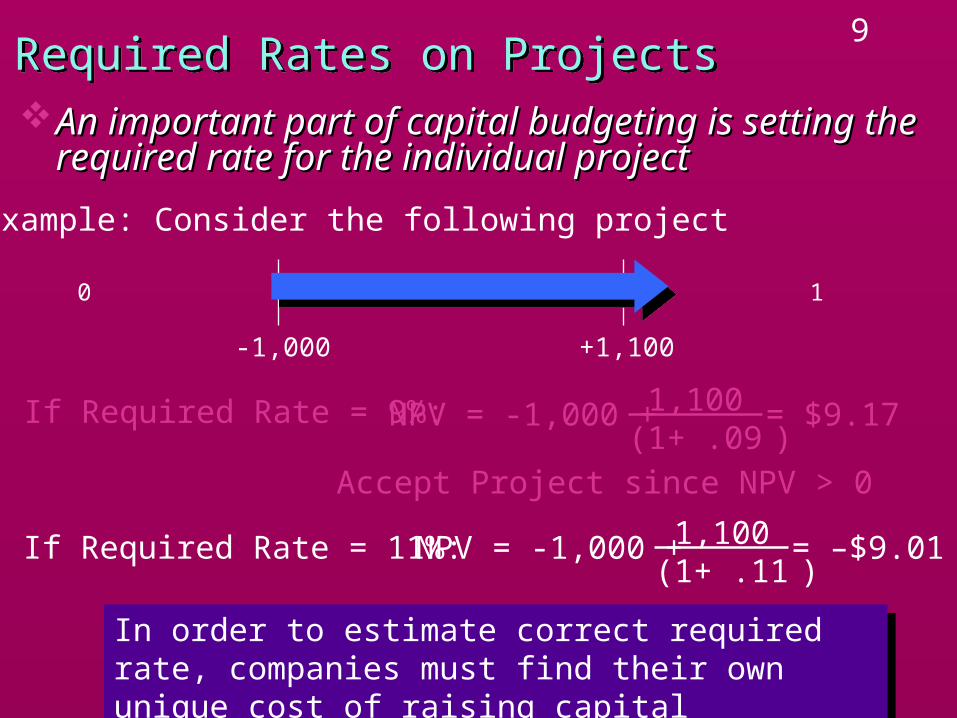
9Required Rates on ProjectsRequired Rates on ProjectsAn important part of capital budgeting is setting the An important part of capital budgeting is setting the
required rate for the individual projectrequired rate for the individual project
0 1
Example: Consider the following project
+1,100-1,000
If Required Rate = 9%: NPV = -1,000 + 1,100 (1+ .09 )
= $9.17
Accept Project since NPV > 0
If Required Rate = 11%: NPV = -1,000 + 1,100 (1+ .11 )
= –$9.01
In order to estimate correct required rate, companies must find their own unique cost of raising capital
In order to estimate correct required rate, companies must find their own unique cost of raising capital
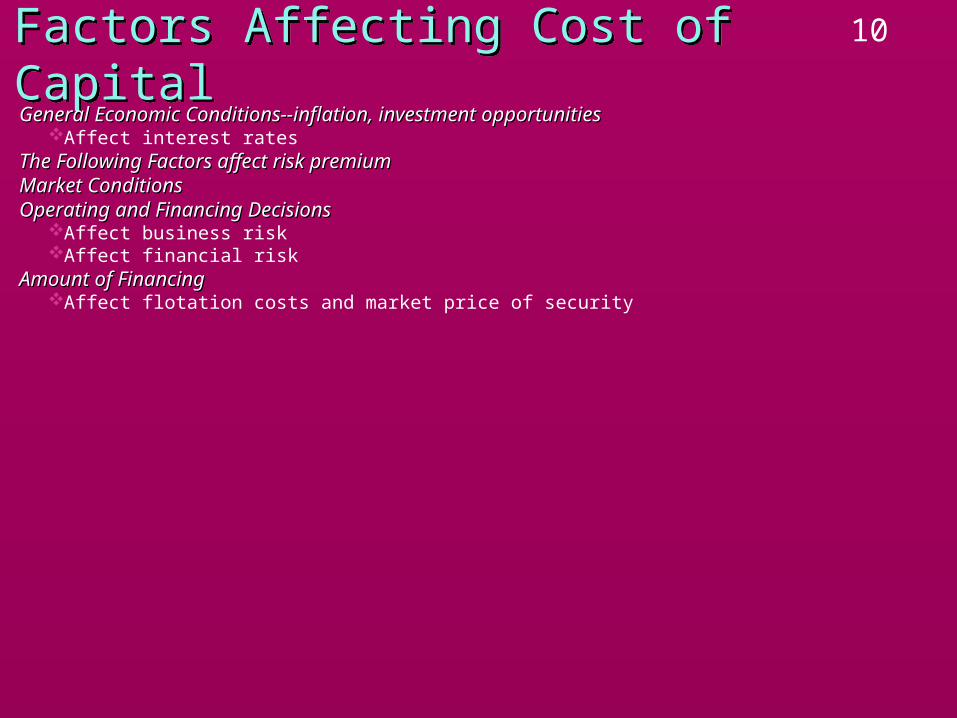
10Factors Affecting Cost of CapitalFactors Affecting Cost of CapitalGeneral Economic Conditions--inflation, investment opportunitiesGeneral Economic Conditions--inflation, investment opportunities
Affect interest ratesThe Following Factors affect risk premiumThe Following Factors affect risk premiumMarket ConditionsMarket ConditionsOperating and Financing DecisionsOperating and Financing Decisions
Affect business riskAffect financial risk
Amount of FinancingAmount of FinancingAffect flotation costs and market price of security
11Model AssumptionsModel Assumptions
Here, we determine the average cost of capital of a Here, we determine the average cost of capital of a firm by assuming that the firm continues with its firm by assuming that the firm continues with its business, financing and dividend policies.business, financing and dividend policies.
Weighted Average Cost of Capital ModelWeighted Average Cost of Capital Model
12Computing Weighted Cost of CapitalComputing Weighted Cost of Capital
Average cost of capital of the firm.Average cost of capital of the firm.
To find WACCTo find WACC
1. Compute the cost of each source of capital1. Compute the cost of each source of capital2. Determine percentage of each source of capital2. Determine percentage of each source of capital3. Calculate Weighted Average Cost of Capital3. Calculate Weighted Average Cost of Capital
Weighted Average Cost of Capital (WACC)Weighted Average Cost of Capital (WACC)

13Computing Cost of Each SourceComputing Cost of Each Source
Required rate of return for creditorsRequired rate of return for creditorsSame cost found in Chapter 7 as “required rate for Same cost found in Chapter 7 as “required rate for
debtholders (kdebtholders (kdd) = YTM”) = YTM”
1. Compute Cost of Debt1. Compute Cost of Debt
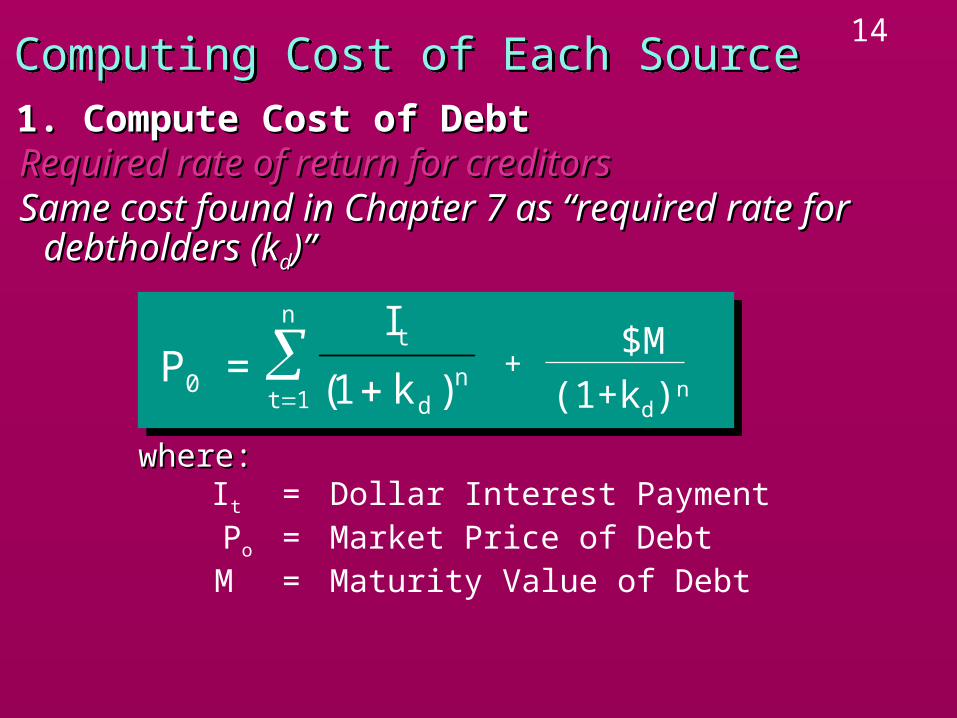
14Computing Cost of Each SourceComputing Cost of Each Source
Required rate of return for creditorsRequired rate of return for creditorsSame cost found in Chapter 7 as “required rate for Same cost found in Chapter 7 as “required rate for
debtholders (kdebtholders (kdd)”)”
1. Compute Cost of Debt1. Compute Cost of Debt
P0 = +I
k
t
dn
t
n
( )11 $M
(1+kd)n
where:where:It = Dollar Interest Payment
Po = Market Price of DebtM = Maturity Value of Debt
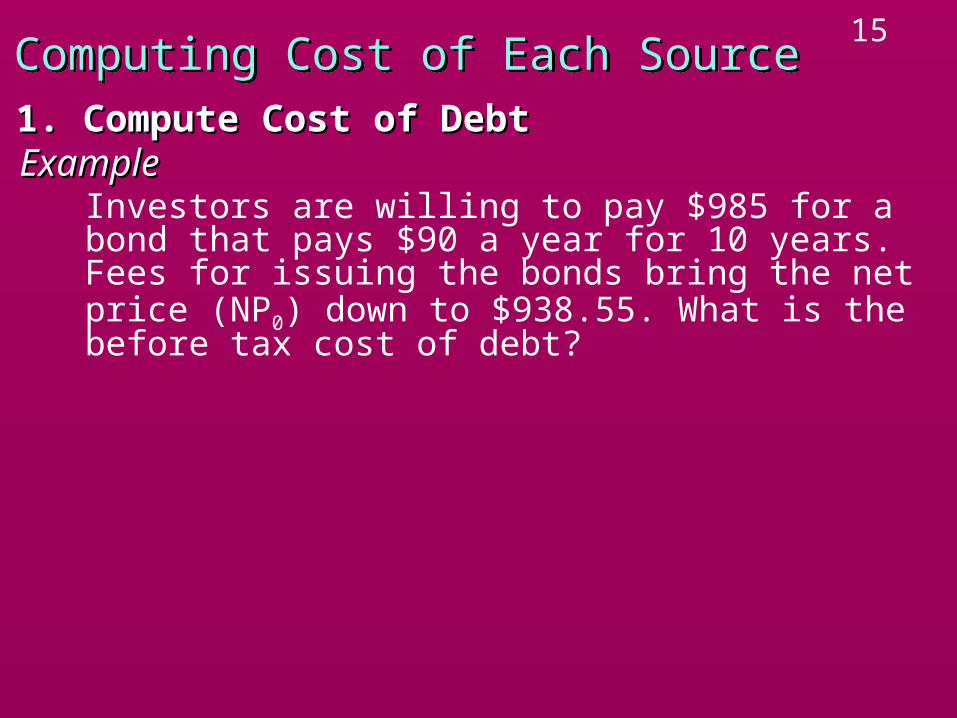
15Computing Cost of Each SourceComputing Cost of Each Source
ExampleExampleInvestors are willing to pay $985 for a bond that pays $90 a year for 10 years. Fees for issuing the bonds bring the net price (NP0) down to $938.55. What is the before tax cost of debt?
1. Compute Cost of Debt1. Compute Cost of Debt
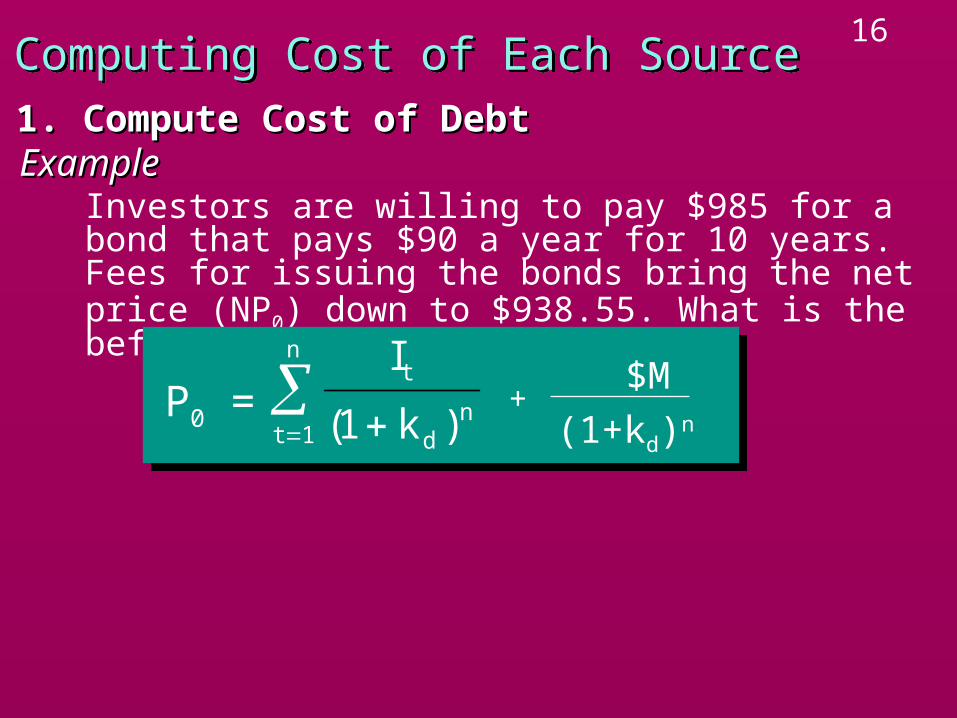
16Computing Cost of Each SourceComputing Cost of Each Source
ExampleExampleInvestors are willing to pay $985 for a bond that pays $90 a year for 10 years. Fees for issuing the bonds bring the net price (NP0) down to $938.55. What is the before tax cost of debt?
1. Compute Cost of Debt1. Compute Cost of Debt
P0 = +I
k
t
dn
t
n
( )11 $M
(1+kd)n
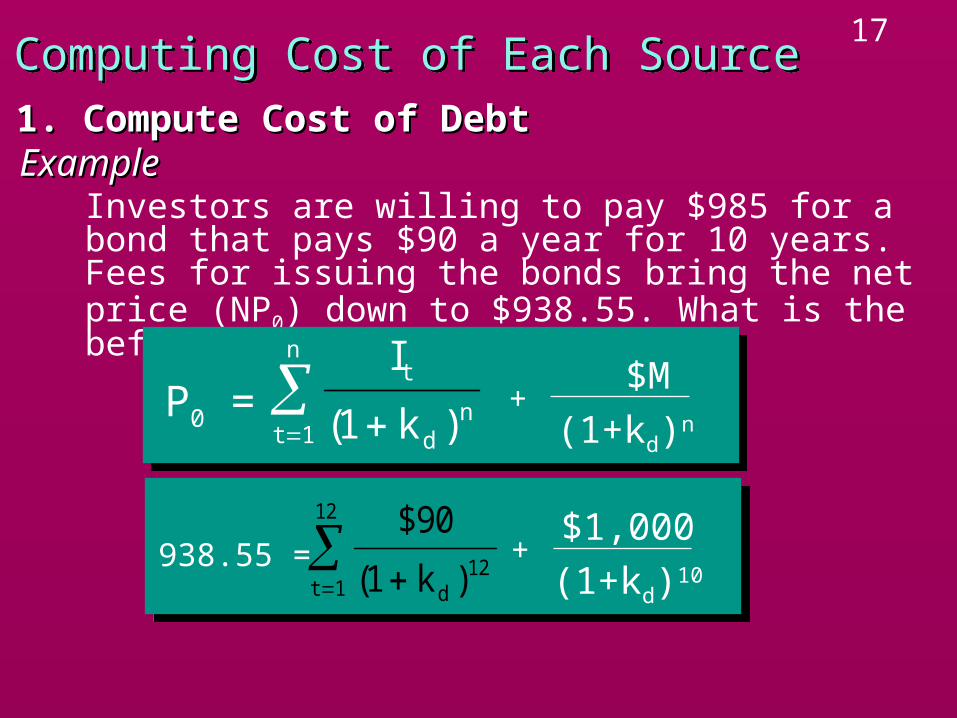
17Computing Cost of Each SourceComputing Cost of Each Source
ExampleExampleInvestors are willing to pay $985 for a bond that pays $90 a year for 10 years. Fees for issuing the bonds bring the net price (NP0) down to $938.55. What is the before tax cost of debt?
1. Compute Cost of Debt1. Compute Cost of Debt
938.55 = +$90
( )1 121
12
k dt
$1,000
(1+kd)10
P0 = +I
k
t
dn
t
n
( )11 $M
(1+kd)n
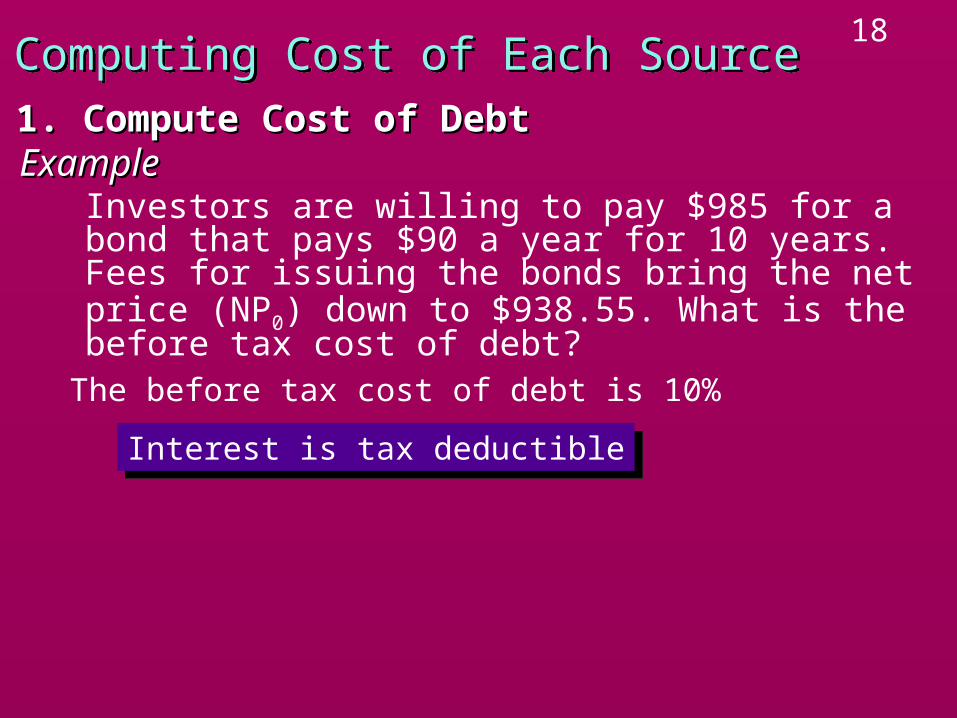
18Computing Cost of Each SourceComputing Cost of Each Source
ExampleExampleInvestors are willing to pay $985 for a bond that pays $90 a year for 10 years. Fees for issuing the bonds bring the net price (NP0) down to $938.55. What is the before tax cost of debt?
1. Compute Cost of Debt1. Compute Cost of Debt
The before tax cost of debt is 10%
Interest is tax deductibleInterest is tax deductible
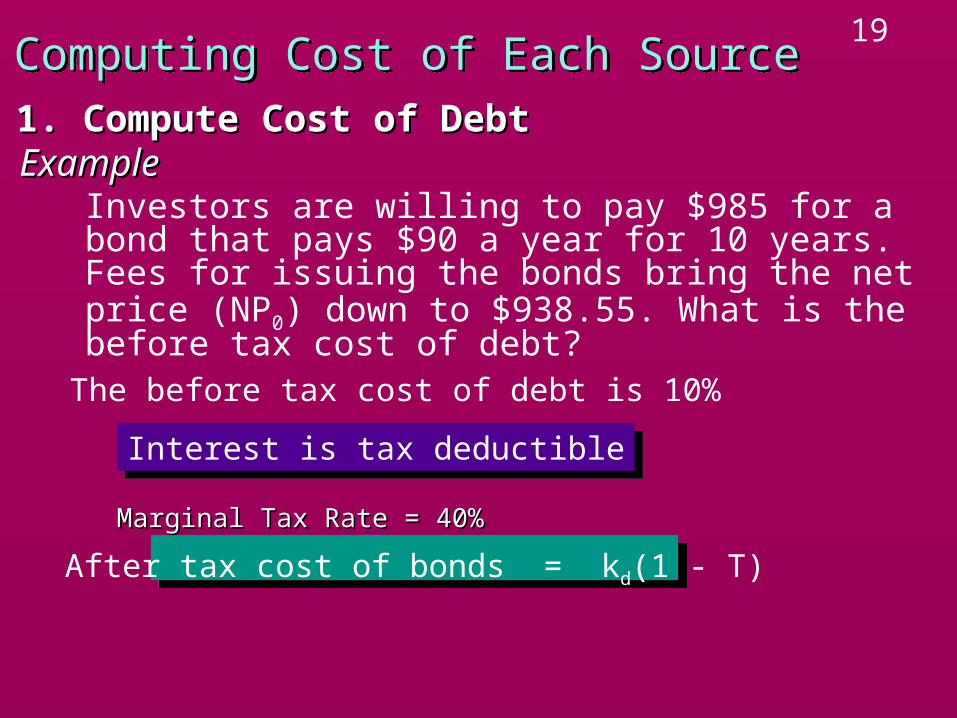
19Computing Cost of Each SourceComputing Cost of Each Source
ExampleExampleInvestors are willing to pay $985 for a bond that pays $90 a year for 10 years. Fees for issuing the bonds bring the net price (NP0) down to $938.55. What is the before tax cost of debt?
1. Compute Cost of Debt1. Compute Cost of Debt
The before tax cost of debt is 10%
Interest is tax deductibleInterest is tax deductible
After tax cost of bonds = kd(1 - T)
Marginal Tax Rate = 40%Marginal Tax Rate = 40%
20Computing Cost of Each SourceComputing Cost of Each Source
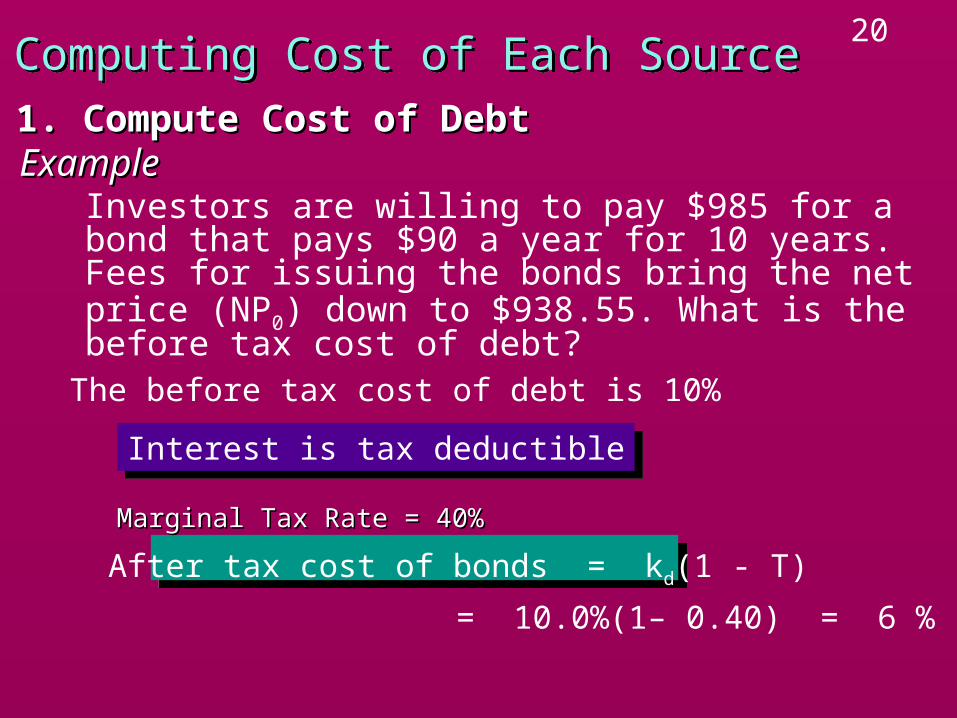
ExampleExampleInvestors are willing to pay $985 for a bond that pays $90 a year for 10 years. Fees for issuing the bonds bring the net price (NP0) down to $938.55. What is the before tax cost of debt?
1. Compute Cost of Debt1. Compute Cost of Debt
The before tax cost of debt is 10%
Interest is tax deductibleInterest is tax deductible
After tax cost of bonds = kd(1 - T)
= 10.0%(1– 0.40) = 6 %
Marginal Tax Rate = 40%Marginal Tax Rate = 40%
21Computing Cost of Each SourceComputing Cost of Each Source
Cost to raise a dollar of preferred stock.2. Compute Cost Preferred Stock2. Compute Cost Preferred Stock
22Computing Cost of Each SourceComputing Cost of Each Source
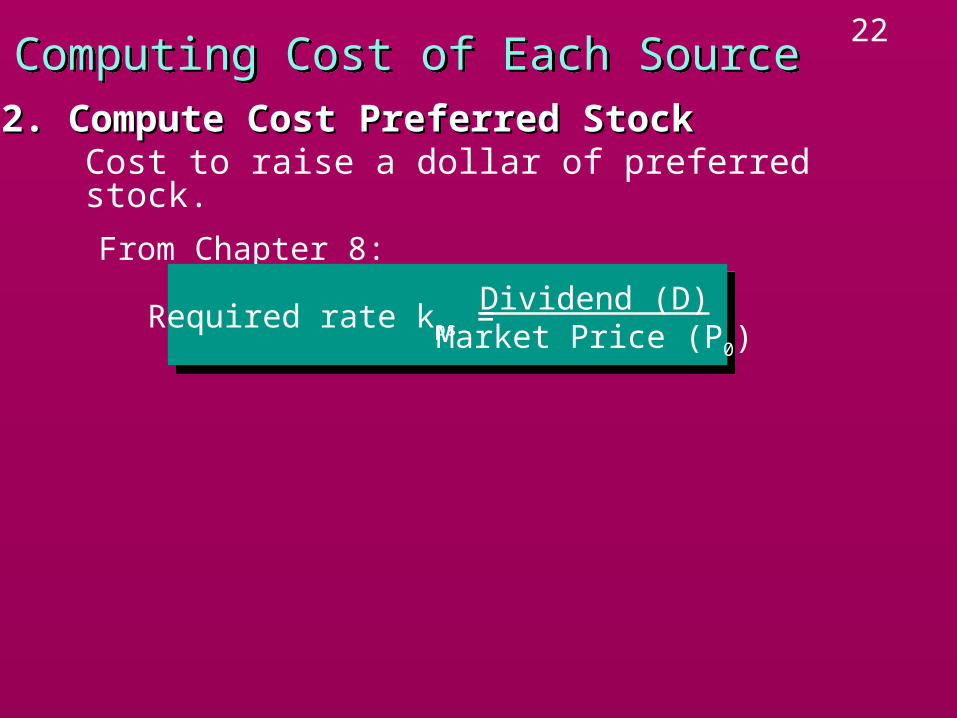
Cost to raise a dollar of preferred stock.2. Compute Cost Preferred Stock2. Compute Cost Preferred Stock
From Chapter 8:
Dividend (D)Market Price (P0)
Required rate kps =
23Computing Cost of Each SourceComputing Cost of Each Source
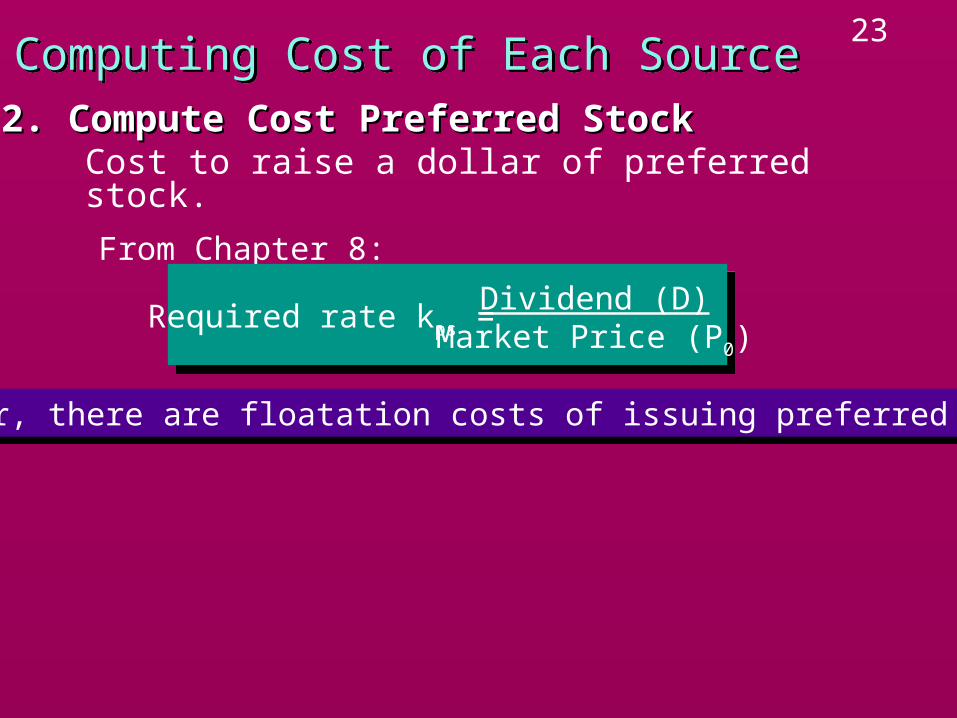
Cost to raise a dollar of preferred stock.2. Compute Cost Preferred Stock2. Compute Cost Preferred Stock
From Chapter 8:
Dividend (D)Market Price (P0)
Required rate kps =
However, there are floatation costs of issuing preferred stock:However, there are floatation costs of issuing preferred stock:
24Computing Cost of Each SourceComputing Cost of Each Source
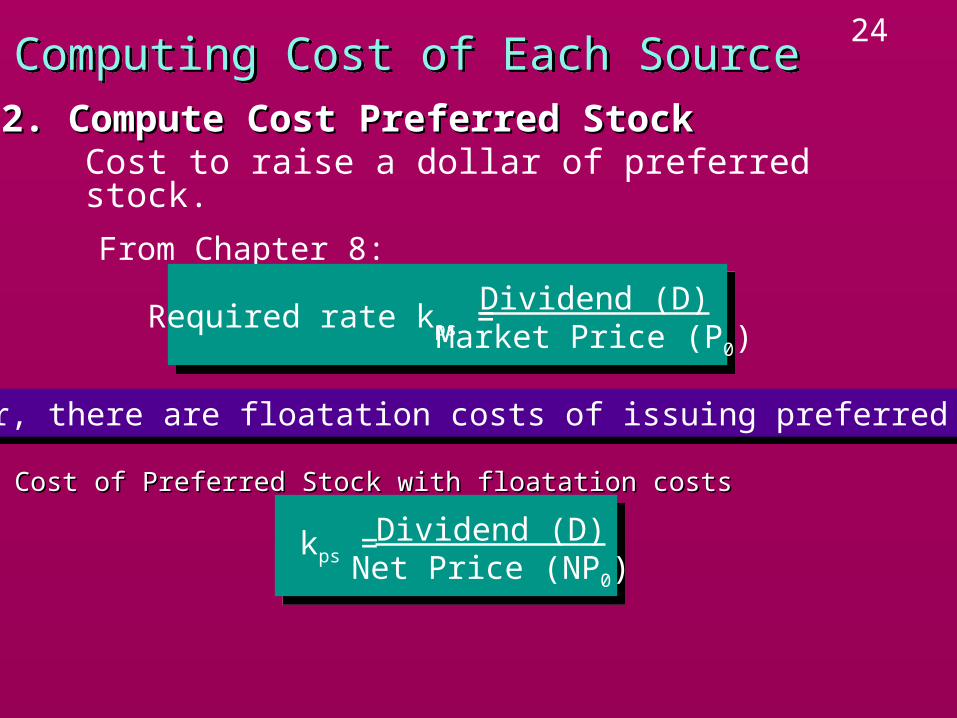
Cost to raise a dollar of preferred stock.2. Compute Cost Preferred Stock2. Compute Cost Preferred Stock
Cost of Preferred Stock with floatation costsCost of Preferred Stock with floatation costs
Dividend (D)Net Price (NP0)
From Chapter 8:
Dividend (D)Market Price (P0)
Required rate kps =
However, there are floatation costs of issuing preferred stock:However, there are floatation costs of issuing preferred stock:
kps =
25Computing Cost of Each SourceComputing Cost of Each Source
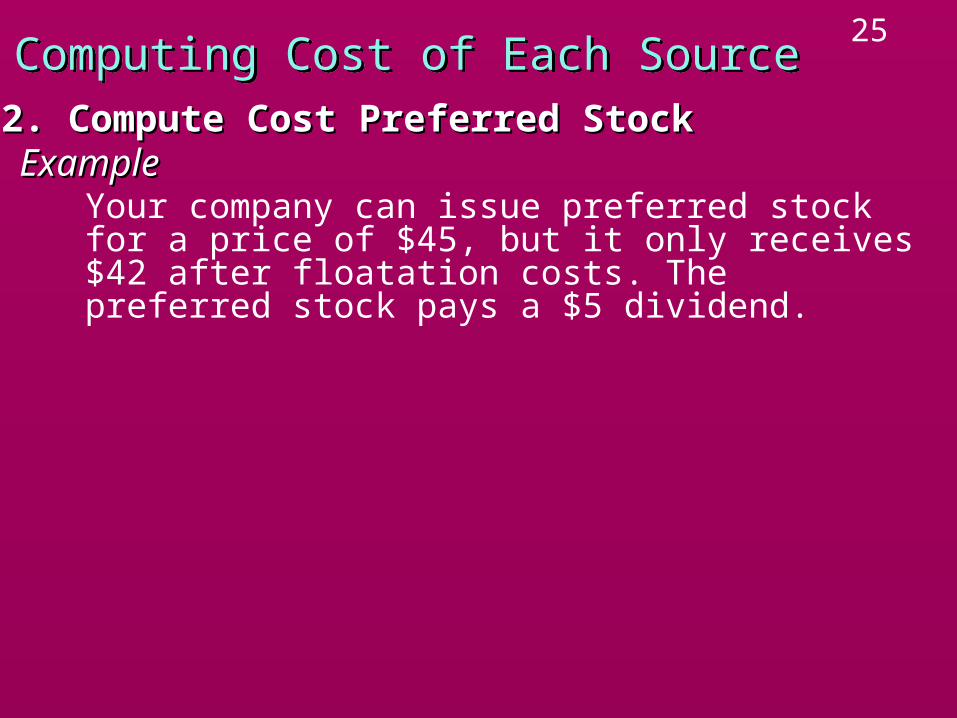
ExampleExampleYour company can issue preferred stock for a price of $45, but it only receives $42 after floatation costs. The preferred stock pays a $5 dividend.
2. Compute Cost Preferred Stock2. Compute Cost Preferred Stock
26Computing Cost of Each SourceComputing Cost of Each Source
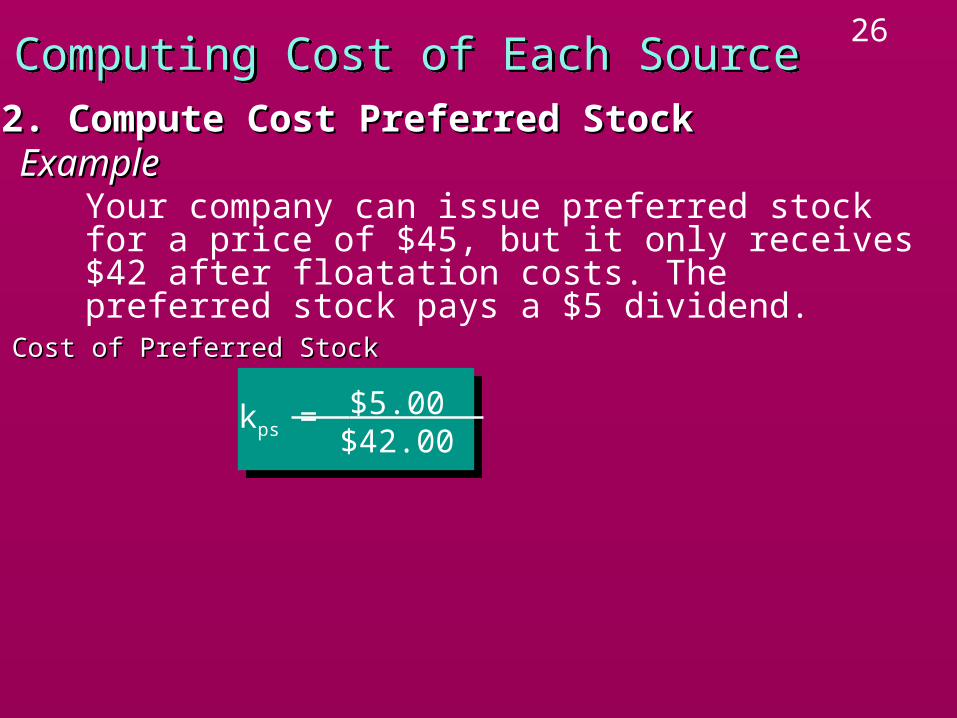
ExampleExampleYour company can issue preferred stock for a price of $45, but it only receives $42 after floatation costs. The preferred stock pays a $5 dividend.
2. Compute Cost Preferred Stock2. Compute Cost Preferred Stock
Cost of Preferred StockCost of Preferred Stock
$5.00 $42.00
kps =
27Computing Cost of Each SourceComputing Cost of Each Source
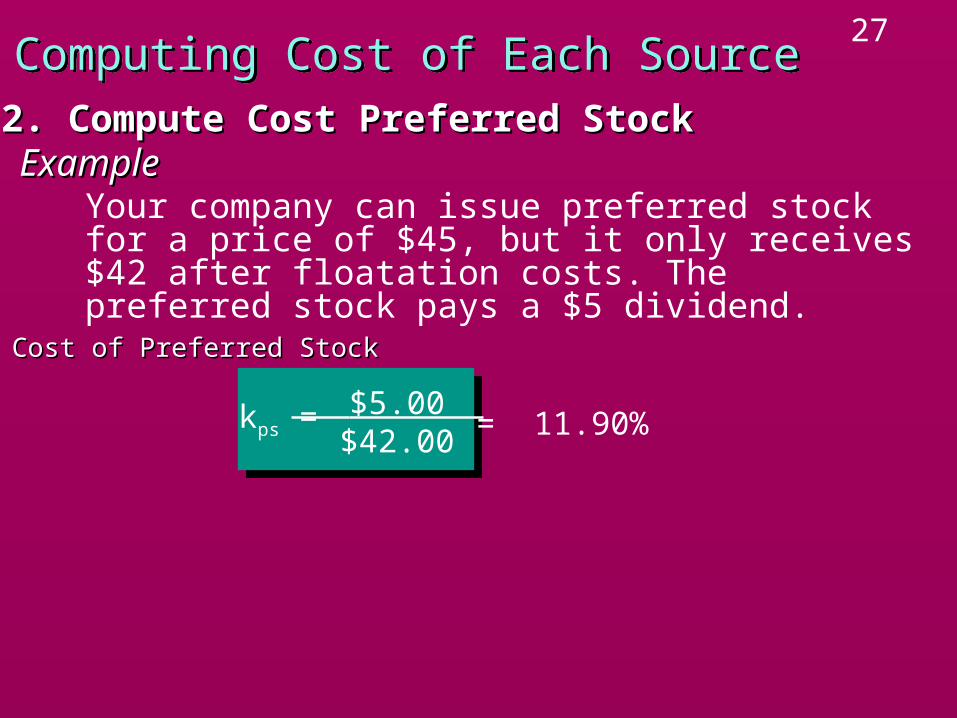
ExampleExampleYour company can issue preferred stock for a price of $45, but it only receives $42 after floatation costs. The preferred stock pays a $5 dividend.
2. Compute Cost Preferred Stock2. Compute Cost Preferred Stock
Cost of Preferred StockCost of Preferred Stock
$5.00 $42.00
= 11.90%kps =
28Computing Cost of Each SourceComputing Cost of Each Source
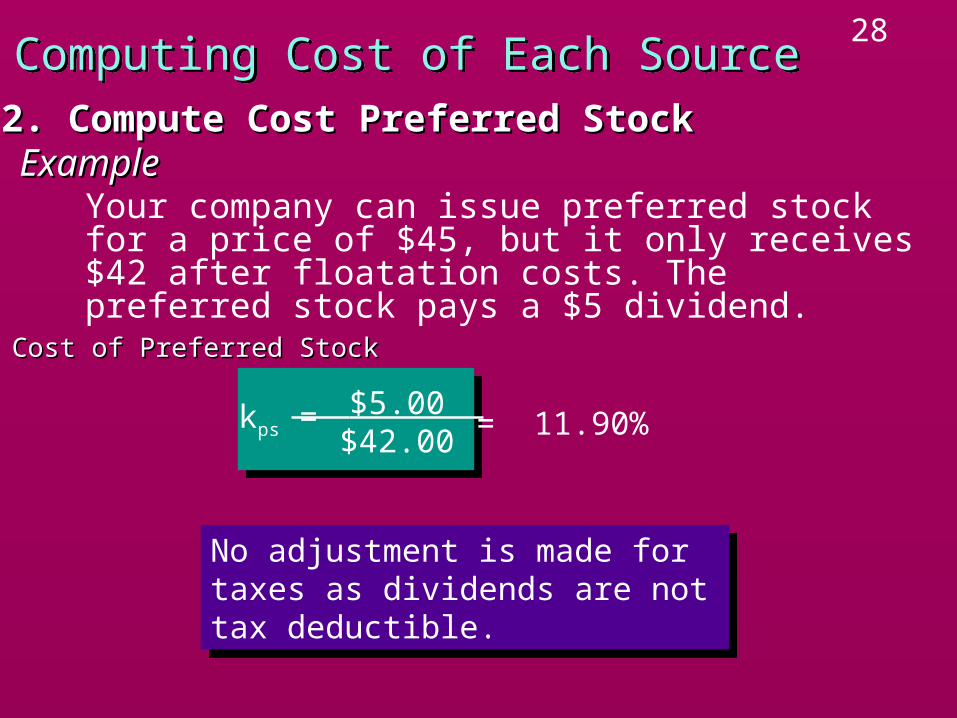
ExampleExampleYour company can issue preferred stock for a price of $45, but it only receives $42 after floatation costs. The preferred stock pays a $5 dividend.
2. Compute Cost Preferred Stock2. Compute Cost Preferred Stock
Cost of Preferred StockCost of Preferred Stock
$5.00 $42.00
= 11.90%kps =
No adjustment is made for taxes as dividends are not tax deductible.
No adjustment is made for taxes as dividends are not tax deductible.
29Computing Cost of Each SourceComputing Cost of Each Source
Two kinds of Common EquityTwo kinds of Common EquityRetained Earnings (internal common equity)Issuing new shares of common stock
3. Compute Cost of Common Equity3. Compute Cost of Common Equity
30Computing Cost of Each SourceComputing Cost of Each Source
Cost of Internal Common EquityCost of Internal Common EquityManagement should retain earnings only if they earn
as much as stockholder’s next best investment opportunity.
3. Compute Cost of Common Equity3. Compute Cost of Common Equity
31Computing Cost of Each SourceComputing Cost of Each Source
Cost of Internal Common EquityCost of Internal Common EquityManagement should retain earnings only if they earn
as much as stockholder’s next best investment opportunity.
Cost of Internal Equity = opportunity cost of common stockholders’ funds.
3. Compute Cost of Common Equity3. Compute Cost of Common Equity
32Computing Cost of Each SourceComputing Cost of Each Source
Cost of Internal Common EquityCost of Internal Common EquityManagement should retain earnings only if they earn
as much as stockholder’s next best investment opportunity.
Cost of Internal Equity = opportunity cost of common stockholders’ funds.
Cost of internal equity must equal common stockholders’ required rate of return.
3. Compute Cost of Common Equity3. Compute Cost of Common Equity
33Computing Cost of Each SourceComputing Cost of Each Source
Cost of Internal Common EquityCost of Internal Common EquityManagement should retain earnings only if they earn as much as
stockholder’s next best investment opportunity.Cost of Internal Equity = opportunity cost of common stockholders’
funds.Cost of internal equity must equal common stockholders’ required
rate of return.Three methods to determine
Dividend Growth ModelCapital Asset Pricing ModelRisk Premium Model
3. Compute Cost of Common Equity3. Compute Cost of Common Equity

34Computing Cost of Each SourceComputing Cost of Each Source
Cost of Internal Common EquityCost of Internal Common EquityDividend Growth Model
Assume constant growth in dividends (Chap. 8)
3. Compute Cost of Common Equity3. Compute Cost of Common Equity
35Computing Cost of Each SourceComputing Cost of Each Source
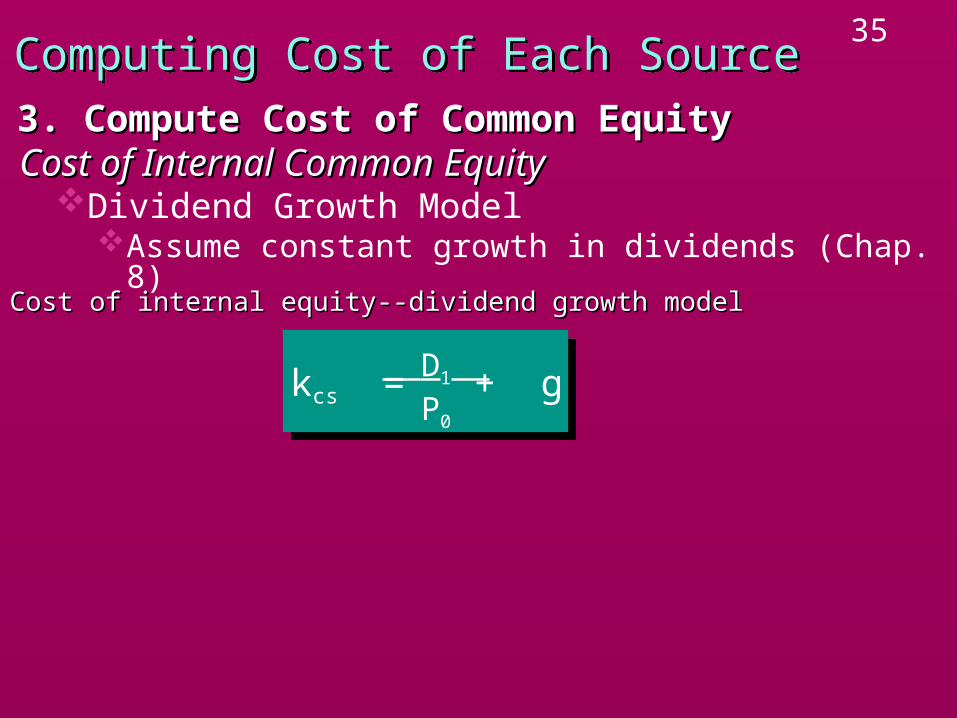
Cost of Internal Common EquityCost of Internal Common EquityDividend Growth Model
Assume constant growth in dividends (Chap. 8)
3. Compute Cost of Common Equity3. Compute Cost of Common Equity
Cost of internal equity--dividend growth modelCost of internal equity--dividend growth model
D1 P0
kcs = + g

36Computing Cost of Each SourceComputing Cost of Each Source
Cost of Internal Common EquityCost of Internal Common EquityDividend Growth Model
Assume constant growth in dividends (Chap. 8)
3. Compute Cost of Common Equity3. Compute Cost of Common Equity
Cost of internal equity--dividend growth modelCost of internal equity--dividend growth model
D1 P0
kcs = + gExampleExample
The market price of a share of common stock is $60. The dividend just paid is $3, and the expected growth rate is 10%.
37Computing Cost of Each SourceComputing Cost of Each Source
Cost of Internal Common EquityCost of Internal Common EquityDividend Growth Model
Assume constant growth in dividends (Chap. 8)
3. Compute Cost of Common Equity3. Compute Cost of Common Equity
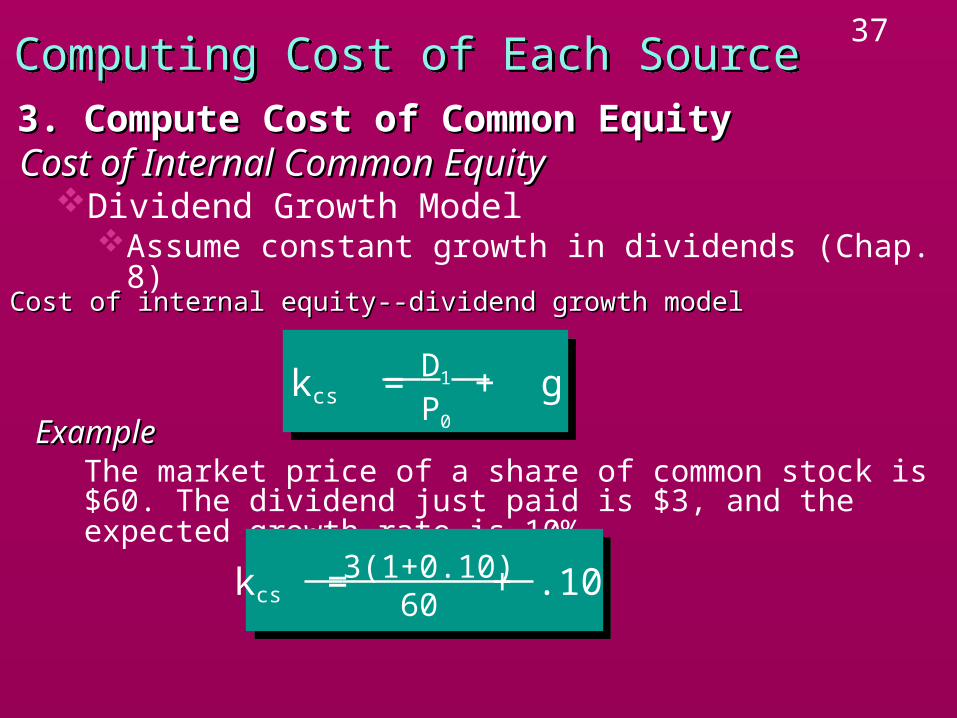
Cost of internal equity--dividend growth modelCost of internal equity--dividend growth model
D1 P0
kcs = + gExampleExample
The market price of a share of common stock is $60. The dividend just paid is $3, and the expected growth rate is 10%.
3(1+0.10) 60
kcs = + .10
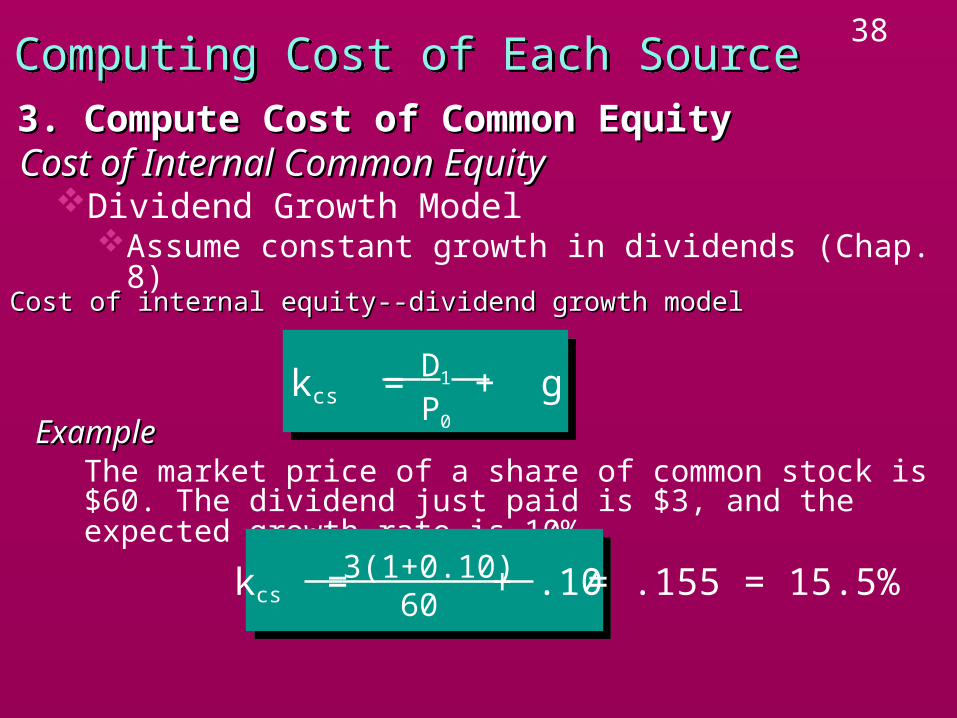
38Computing Cost of Each SourceComputing Cost of Each Source
Cost of Internal Common EquityCost of Internal Common EquityDividend Growth Model
Assume constant growth in dividends (Chap. 8)
3. Compute Cost of Common Equity3. Compute Cost of Common Equity
Cost of internal equity--dividend growth modelCost of internal equity--dividend growth model
D1 P0
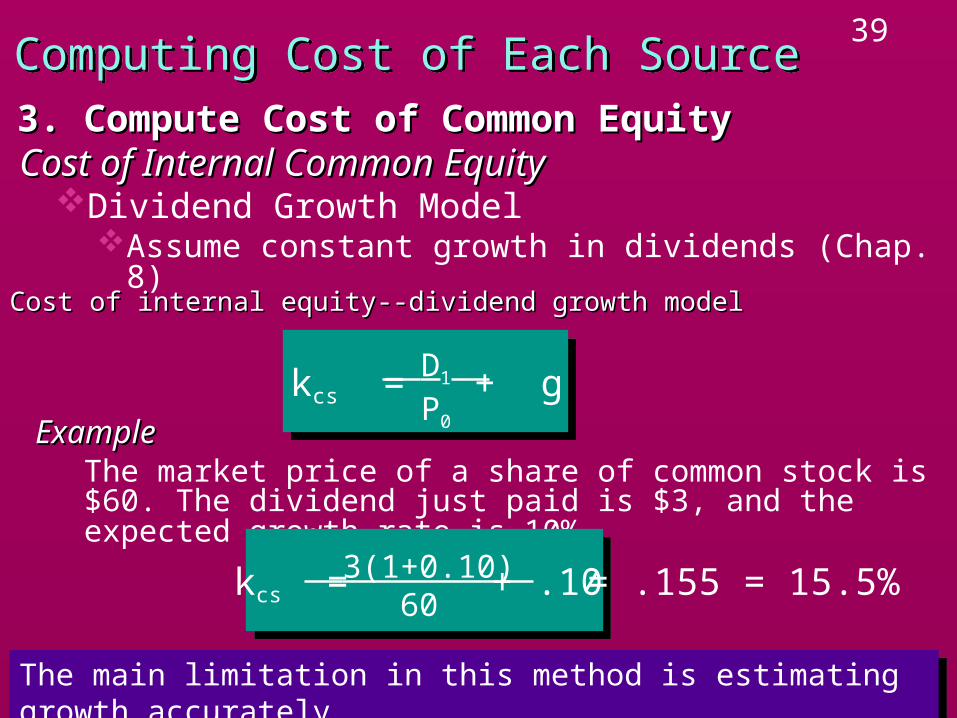
kcs = + gExampleExample
The market price of a share of common stock is $60. The dividend just paid is $3, and the expected growth rate is 10%.
3(1+0.10) 60
kcs = + .10 = .155 = 15.5%
39Computing Cost of Each SourceComputing Cost of Each Source
Cost of Internal Common EquityCost of Internal Common EquityDividend Growth Model
Assume constant growth in dividends (Chap. 8)
3. Compute Cost of Common Equity3. Compute Cost of Common Equity
Cost of internal equity--dividend growth modelCost of internal equity--dividend growth model
D1 P0
kcs = + gExampleExample
The market price of a share of common stock is $60. The dividend just paid is $3, and the expected growth rate is 10%.
3(1+0.10) 60
kcs = + .10 = .155 = 15.5%
The main limitation in this method is estimating growth accurately.The main limitation in this method is estimating growth accurately.
40Computing Cost of Each SourceComputing Cost of Each Source
Cost of Internal Common EquityCost of Internal Common EquityCapital Asset Pricing Model
Estimate the cost of equity from the CAPM (Chap. 6)
3. Compute Cost of Common Equity3. Compute Cost of Common Equity
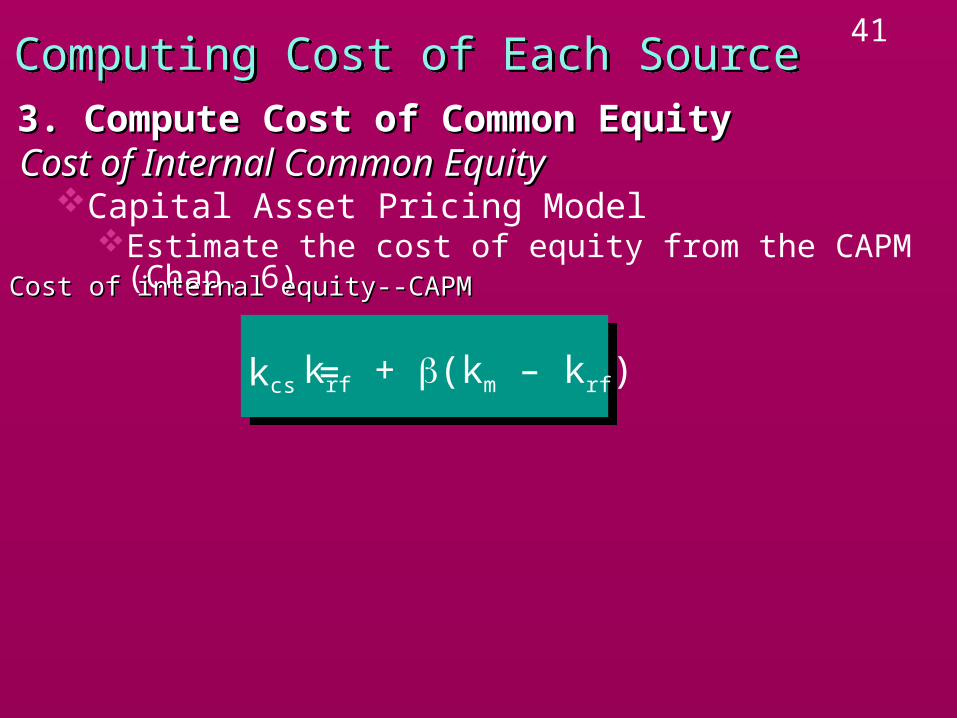
41Computing Cost of Each SourceComputing Cost of Each Source
Cost of Internal Common EquityCost of Internal Common EquityCapital Asset Pricing Model
Estimate the cost of equity from the CAPM (Chap. 6)
3. Compute Cost of Common Equity3. Compute Cost of Common Equity
kcs = krf + (km – krf)
Cost of internal equity--CAPMCost of internal equity--CAPM
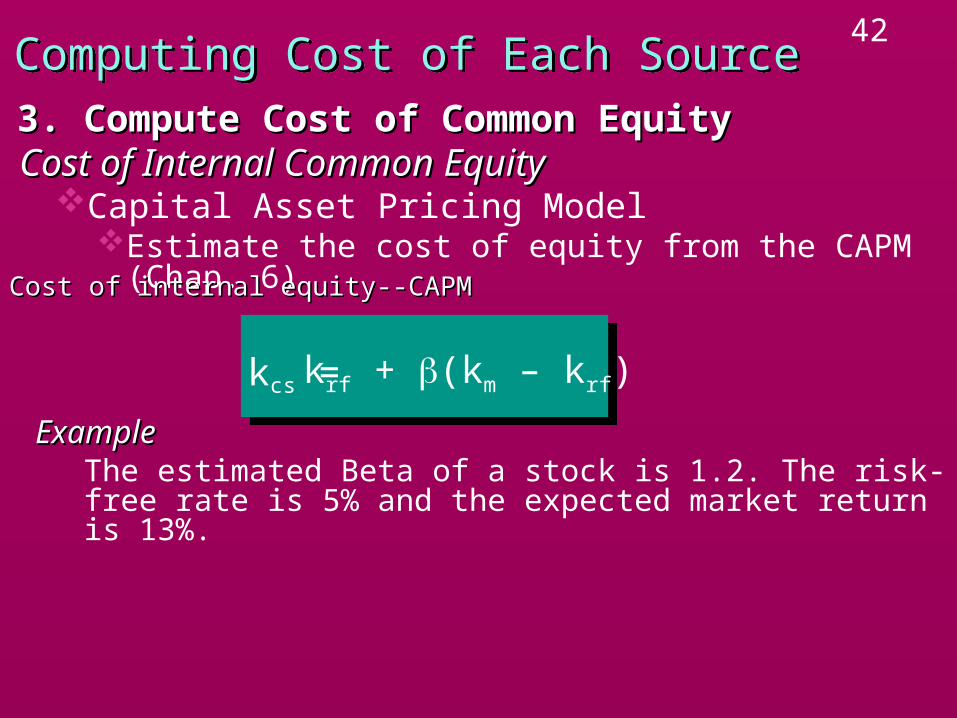
42Computing Cost of Each SourceComputing Cost of Each Source
Cost of Internal Common EquityCost of Internal Common EquityCapital Asset Pricing Model
Estimate the cost of equity from the CAPM (Chap. 6)
3. Compute Cost of Common Equity3. Compute Cost of Common Equity
ExampleExampleThe estimated Beta of a stock is 1.2. The risk-free rate is 5% and the expected market return is 13%.
kcs = krf + (km – krf)
Cost of internal equity--CAPMCost of internal equity--CAPM
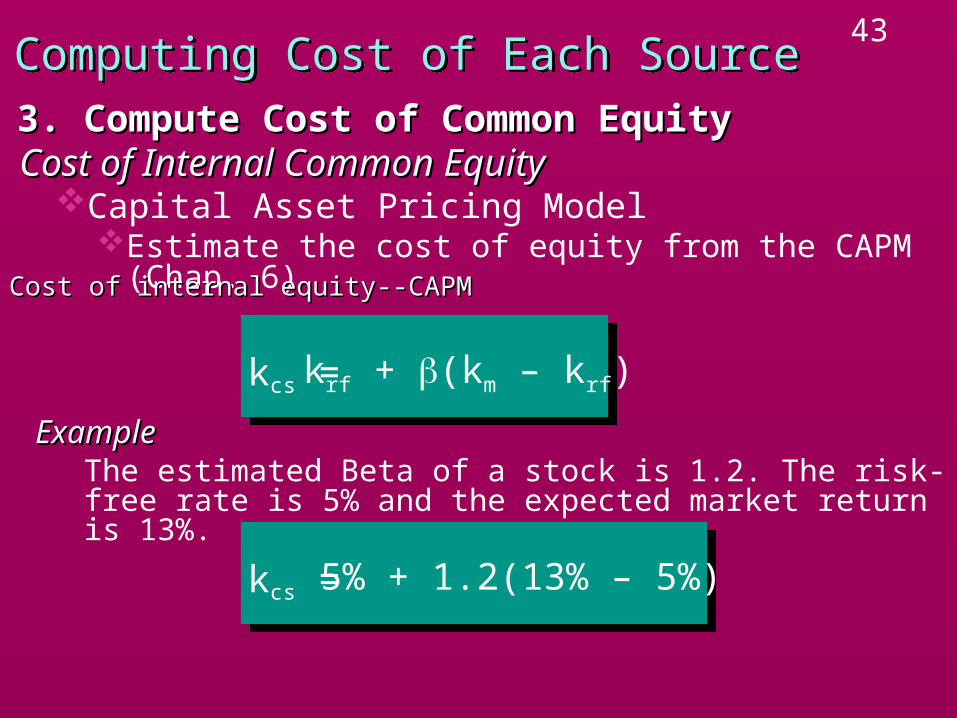
43Computing Cost of Each SourceComputing Cost of Each Source
Cost of Internal Common EquityCost of Internal Common EquityCapital Asset Pricing Model
Estimate the cost of equity from the CAPM (Chap. 6)
3. Compute Cost of Common Equity3. Compute Cost of Common Equity
ExampleExampleThe estimated Beta of a stock is 1.2. The risk-free rate is 5% and the expected market return is 13%.
kcs = krf + (km – krf)
Cost of internal equity--CAPMCost of internal equity--CAPM
kcs = 5% + 1.2(13% – 5%)
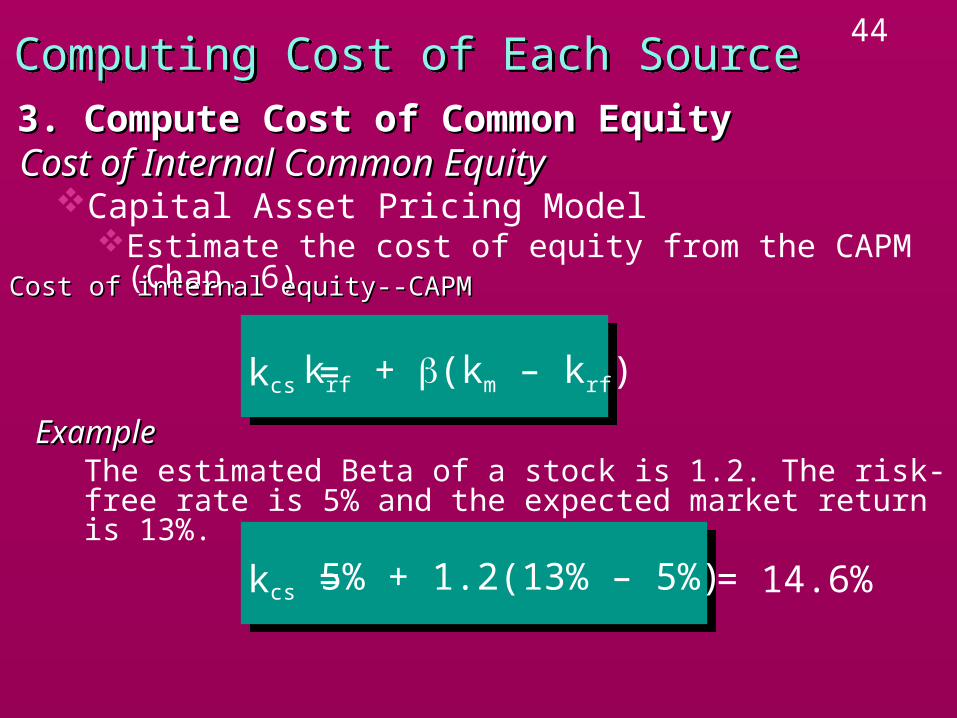
44Computing Cost of Each SourceComputing Cost of Each Source
Cost of Internal Common EquityCost of Internal Common EquityCapital Asset Pricing Model
Estimate the cost of equity from the CAPM (Chap. 6)
3. Compute Cost of Common Equity3. Compute Cost of Common Equity
ExampleExampleThe estimated Beta of a stock is 1.2. The risk-free rate is 5% and the expected market return is 13%.
kcs = krf + (km – krf)
Cost of internal equity--CAPMCost of internal equity--CAPM
kcs = 5% + 1.2(13% – 5%) = 14.6%
45Computing Cost of Each SourceComputing Cost of Each Source
Cost of Internal Common EquityCost of Internal Common EquityRisk Premium Approach
Adds a risk premium to the bondholder’s required rate of return.
3. Compute Cost of Common Equity3. Compute Cost of Common Equity
46Computing Cost of Each SourceComputing Cost of Each Source
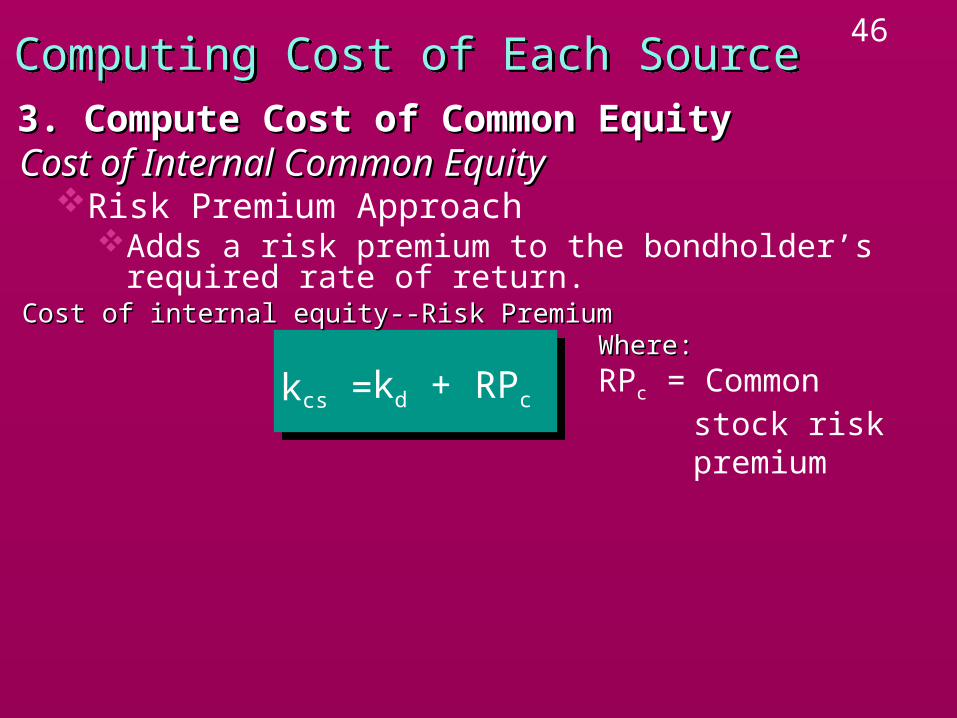
Cost of Internal Common EquityCost of Internal Common EquityRisk Premium Approach
Adds a risk premium to the bondholder’s required rate of return.
3. Compute Cost of Common Equity3. Compute Cost of Common Equity
kcs = kd + RPc
Cost of internal equity--Risk PremiumCost of internal equity--Risk PremiumWhere:Where:
RPc = Common stock risk premium
47Computing Cost of Each SourceComputing Cost of Each Source
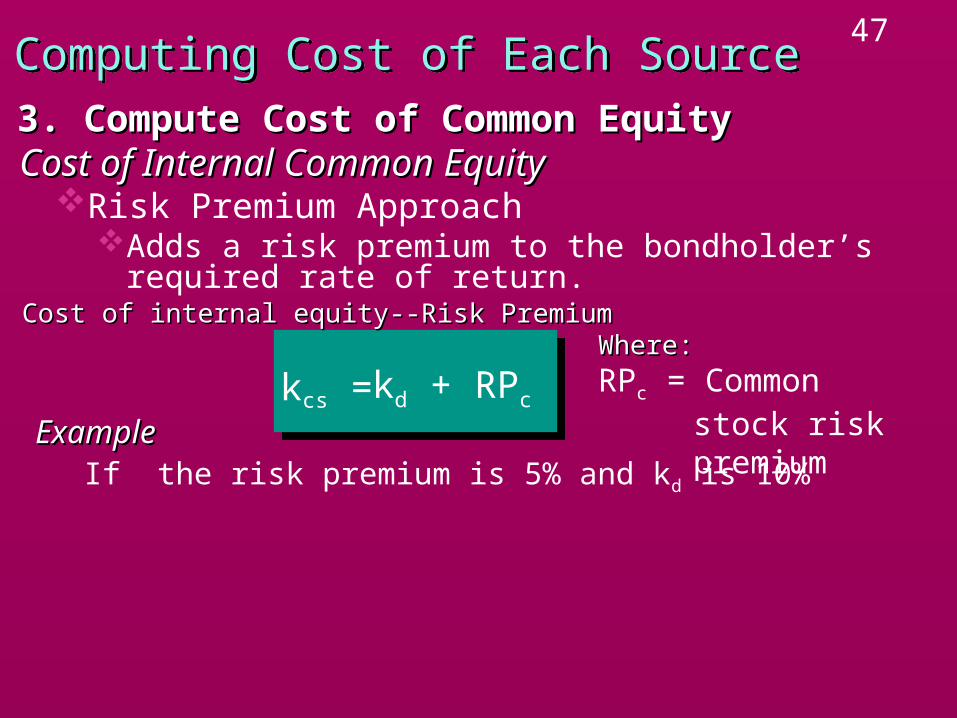
Cost of Internal Common EquityCost of Internal Common EquityRisk Premium Approach
Adds a risk premium to the bondholder’s required rate of return.
3. Compute Cost of Common Equity3. Compute Cost of Common Equity
ExampleExampleIf the risk premium is 5% and kd is 10%
kcs = kd + RPc
Cost of internal equity--Risk PremiumCost of internal equity--Risk PremiumWhere:Where:
RPc = Common stock risk premium
48Computing Cost of Each SourceComputing Cost of Each Source
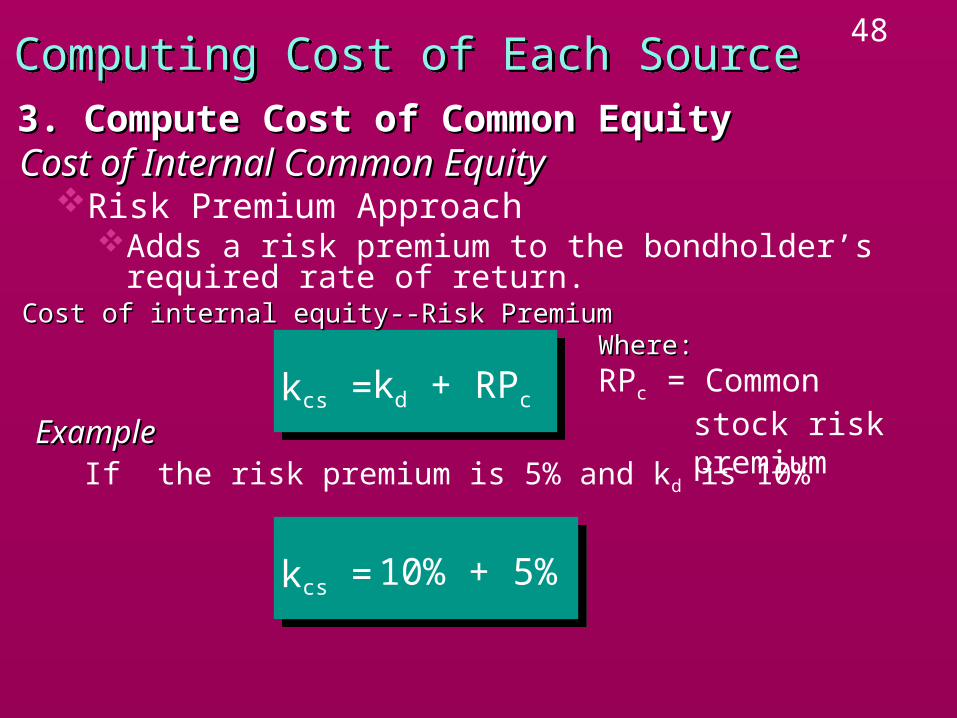
Cost of Internal Common EquityCost of Internal Common EquityRisk Premium Approach
Adds a risk premium to the bondholder’s required rate of return.
3. Compute Cost of Common Equity3. Compute Cost of Common Equity
ExampleExampleIf the risk premium is 5% and kd is 10%
kcs = kd + RPc
Cost of internal equity--Risk PremiumCost of internal equity--Risk Premium
kcs = 10% + 5%
Where:Where:
RPc = Common stock risk premium
49Computing Cost of Each SourceComputing Cost of Each Source
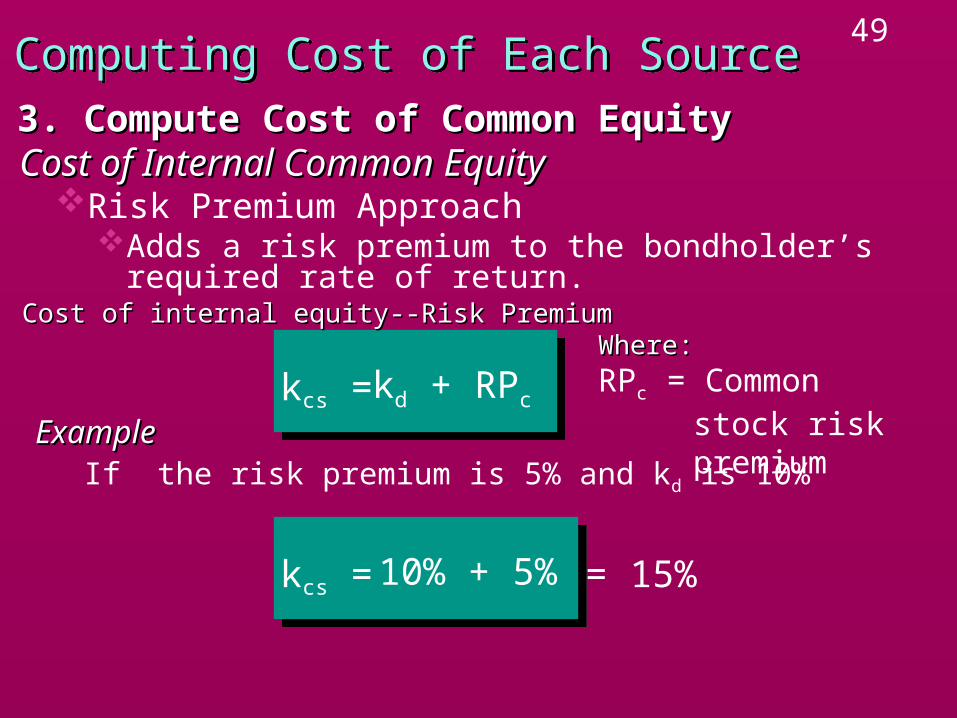
Cost of Internal Common EquityCost of Internal Common EquityRisk Premium Approach
Adds a risk premium to the bondholder’s required rate of return.
3. Compute Cost of Common Equity3. Compute Cost of Common Equity
ExampleExampleIf the risk premium is 5% and kd is 10%
kcs = kd + RPc
Cost of internal equity--Risk PremiumCost of internal equity--Risk Premium
kcs = 10% + 5% = 15%
Where:Where:
RPc = Common stock risk premium
50Computing Cost of Each SourceComputing Cost of Each Source
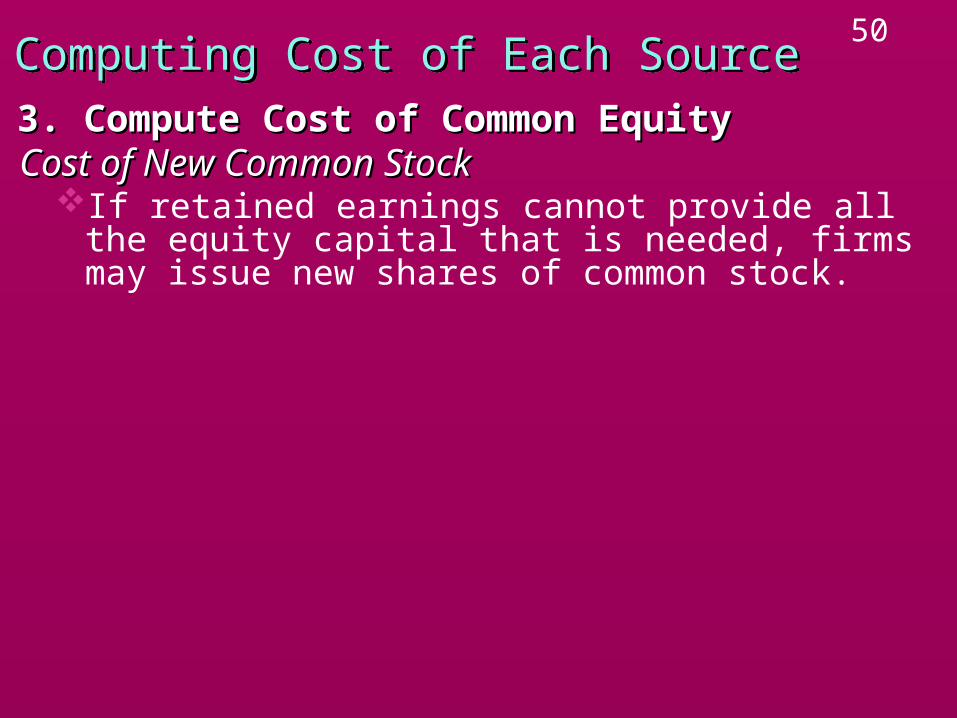
Cost of New Common StockCost of New Common StockIf retained earnings cannot provide all the equity
capital that is needed, firms may issue new shares of common stock.
3. Compute Cost of Common Equity3. Compute Cost of Common Equity
51Computing Cost of Each SourceComputing Cost of Each Source
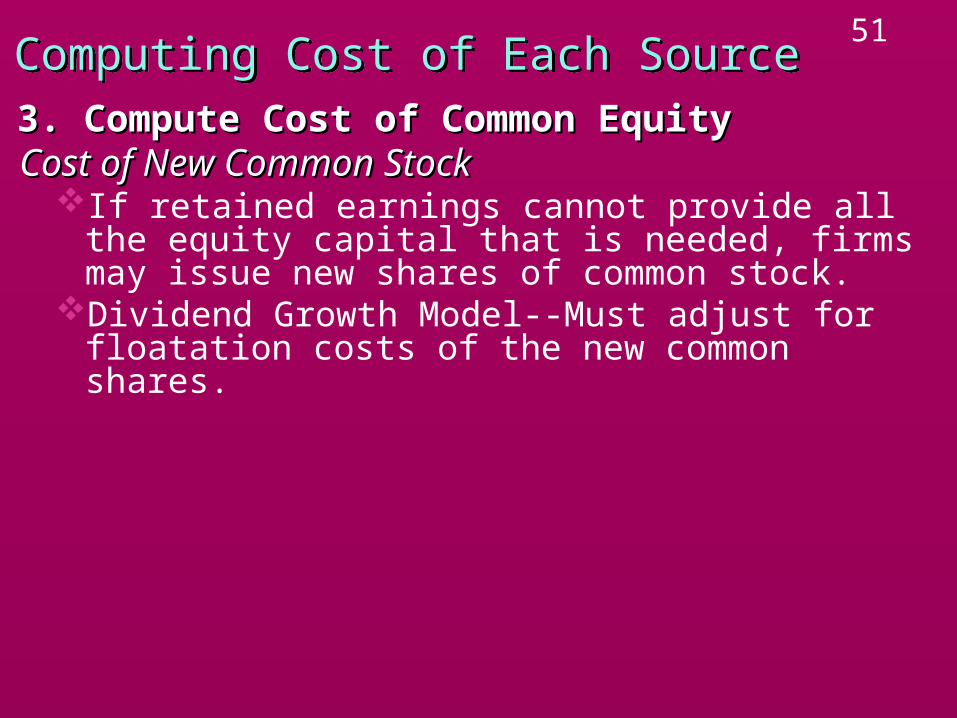
Cost of New Common StockCost of New Common StockIf retained earnings cannot provide all the equity
capital that is needed, firms may issue new shares of common stock.
Dividend Growth Model--Must adjust for floatation costs of the new common shares.
3. Compute Cost of Common Equity3. Compute Cost of Common Equity
52Computing Cost of Each SourceComputing Cost of Each Source
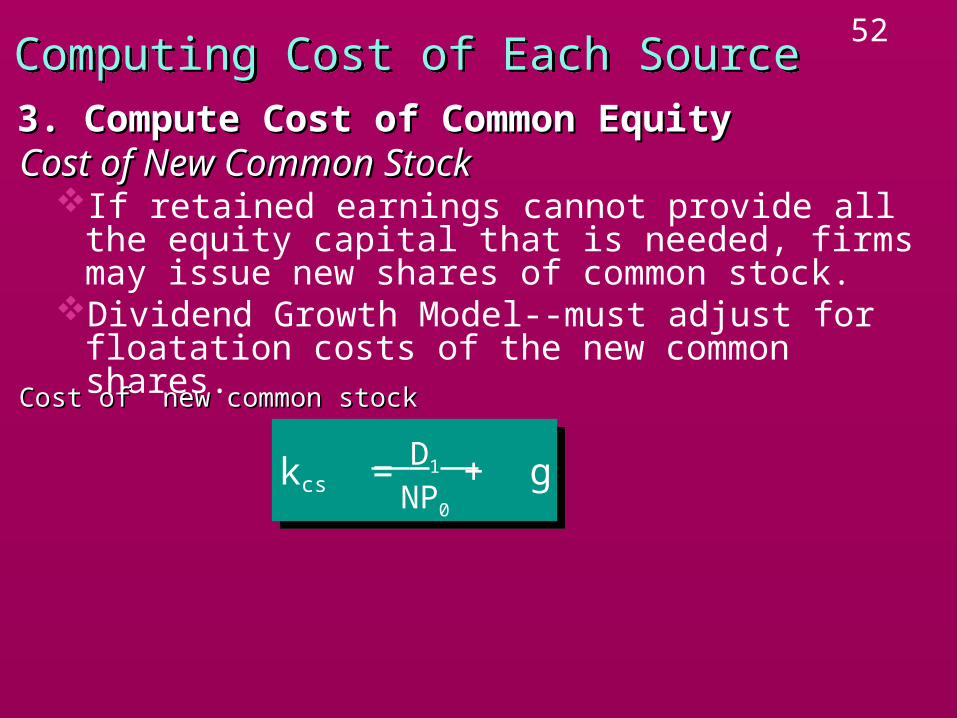
Cost of New Common StockCost of New Common StockIf retained earnings cannot provide all the equity
capital that is needed, firms may issue new shares of common stock.
Dividend Growth Model--must adjust for floatation costs of the new common shares.
3. Compute Cost of Common Equity3. Compute Cost of Common Equity
Cost of new common stockCost of new common stock
D1 NP0
kcs = + g
53Computing Cost of Each SourceComputing Cost of Each Source
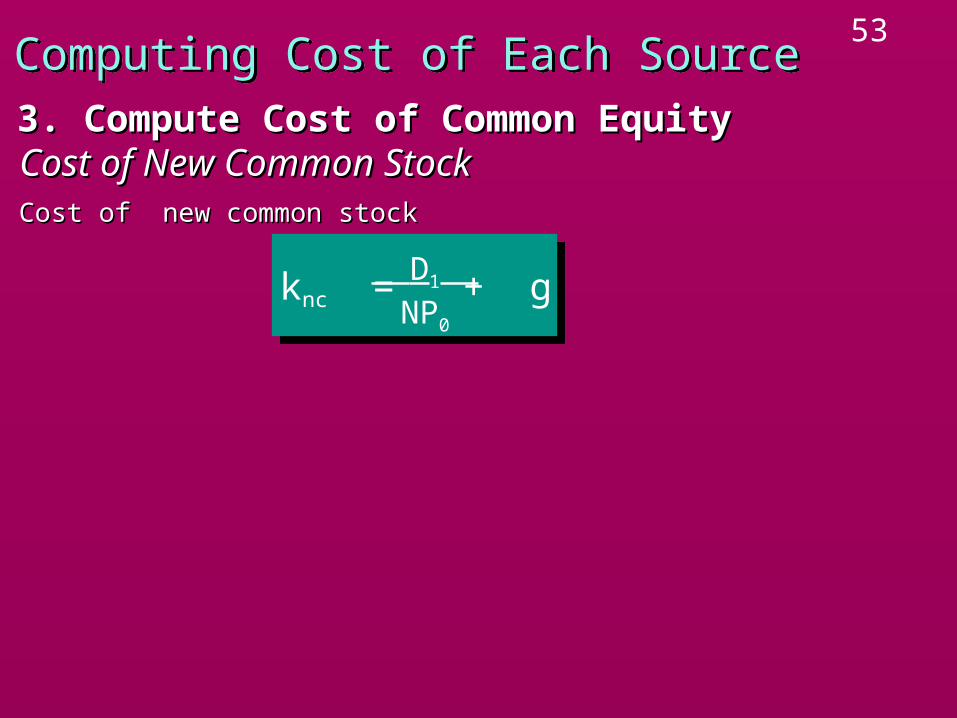
Cost of New Common StockCost of New Common Stock3. Compute Cost of Common Equity3. Compute Cost of Common Equity
Cost of new common stockCost of new common stock
D1 NP0
knc = + g
54Computing Cost of Each SourceComputing Cost of Each Source
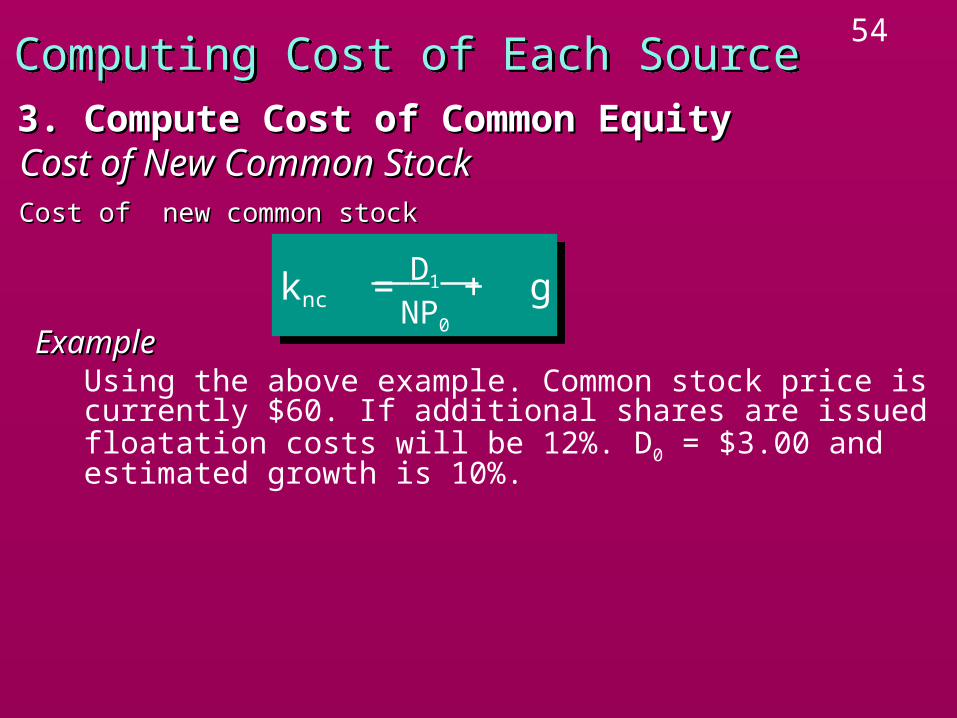
Cost of New Common StockCost of New Common Stock3. Compute Cost of Common Equity3. Compute Cost of Common Equity
Cost of new common stockCost of new common stock
D1 NP0
knc = + g
ExampleExampleUsing the above example. Common stock price is currently $60. If additional shares are issued floatation costs will be 12%. D0 = $3.00 and estimated growth is 10%.

55Computing Cost of Each SourceComputing Cost of Each Source
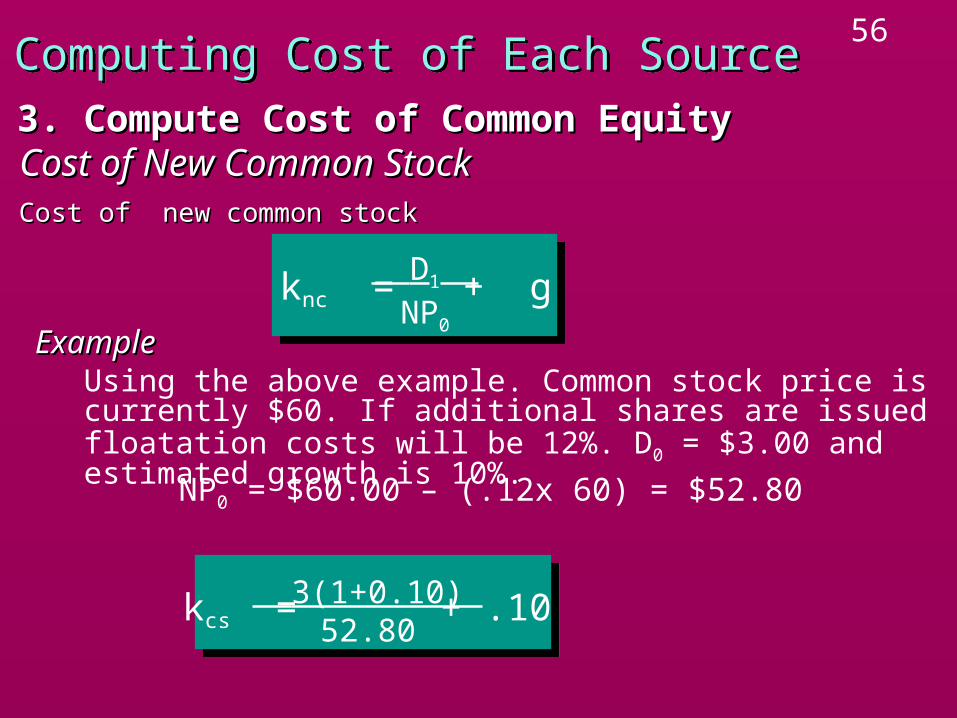
Cost of New Common StockCost of New Common Stock3. Compute Cost of Common Equity3. Compute Cost of Common Equity
Cost of new common stockCost of new common stock
D1 NP0
knc = + g
ExampleExampleUsing the above example. Common stock price is currently $60. If additional shares are issued floatation costs will be 12%. D0 = $3.00 and estimated growth is 10%.
NP0 = $60.00 – (.12x 60) = $52.80
FloatationCosts
FloatationCosts
56Computing Cost of Each SourceComputing Cost of Each Source
Cost of New Common StockCost of New Common Stock3. Compute Cost of Common Equity3. Compute Cost of Common Equity
Cost of new common stockCost of new common stock
D1 NP0
knc = + g
ExampleExampleUsing the above example. Common stock price is currently $60. If additional shares are issued floatation costs will be 12%. D0 = $3.00 and estimated growth is 10%.
NP0 = $60.00 – (.12x 60) = $52.80
3(1+0.10) 52.80
kcs = + .10
57Computing Cost of Each SourceComputing Cost of Each Source
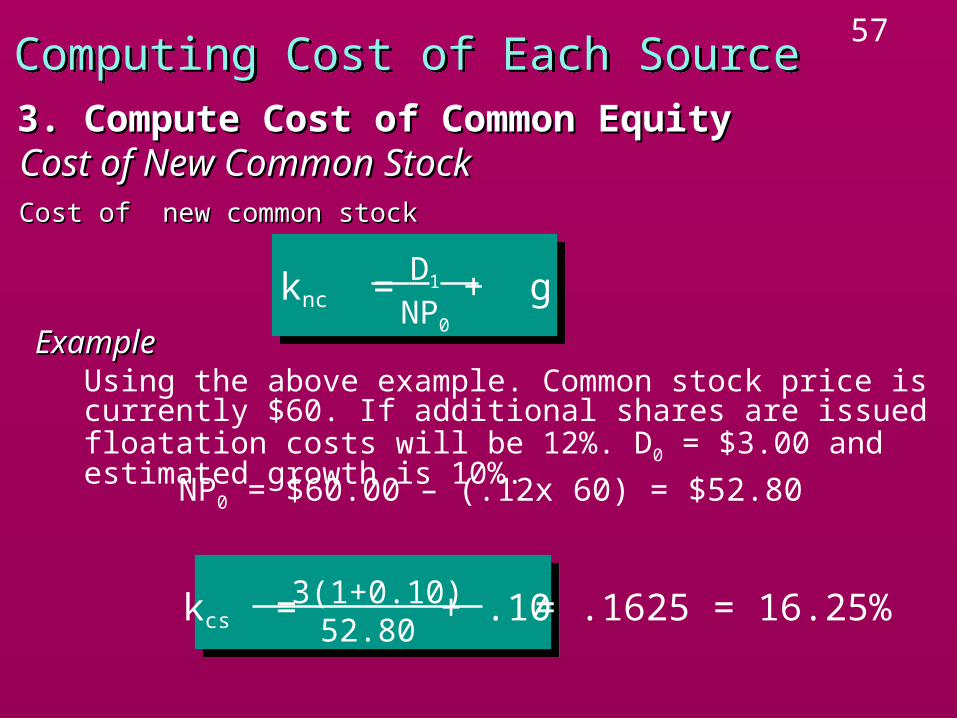
Cost of New Common StockCost of New Common Stock3. Compute Cost of Common Equity3. Compute Cost of Common Equity
Cost of new common stockCost of new common stock
D1 NP0
knc = + g
ExampleExampleUsing the above example. Common stock price is currently $60. If additional shares are issued floatation costs will be 12%. D0 = $3.00 and estimated growth is 10%.
NP0 = $60.00 – (.12x 60) = $52.80
3(1+0.10) 52.80
kcs = + .10 = .1625 = 16.25%

58Capital Structure WeightsCapital Structure WeightsLong Term Liabilities and EquityLong Term Liabilities and Equity
Weights of each source should reflect expected Weights of each source should reflect expected financing mixfinancing mix
Assume a stable financial mix–so use Balance Sheet Assume a stable financial mix–so use Balance Sheet percentages to calculate the weighted average cost percentages to calculate the weighted average cost of capital.of capital.
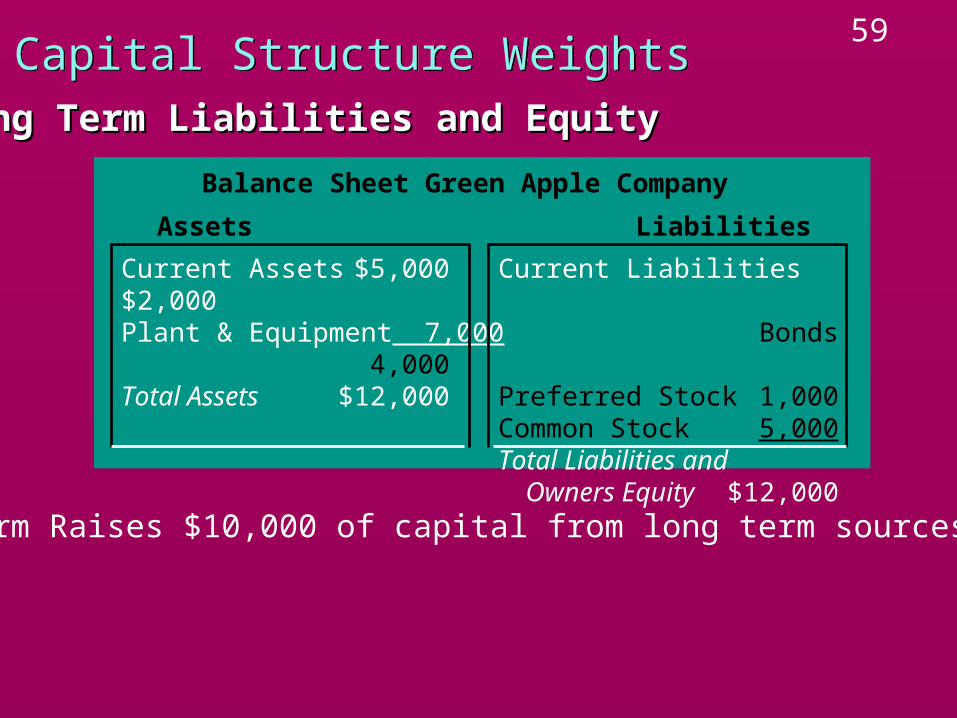
59Capital Structure WeightsCapital Structure WeightsLong Term Liabilities and EquityLong Term Liabilities and Equity
Balance Sheet Green Apple Company
Current Assets $5,000 Current Liabilities $2,000Plant & Equipment 7,000 Bonds 4,000Total Assets $12,000 Preferred Stock 1,000
Common Stock 5,000 Total Liabilities and
Owners Equity $12,000
Assets Liabilities
Firm Raises $10,000 of capital from long term sources
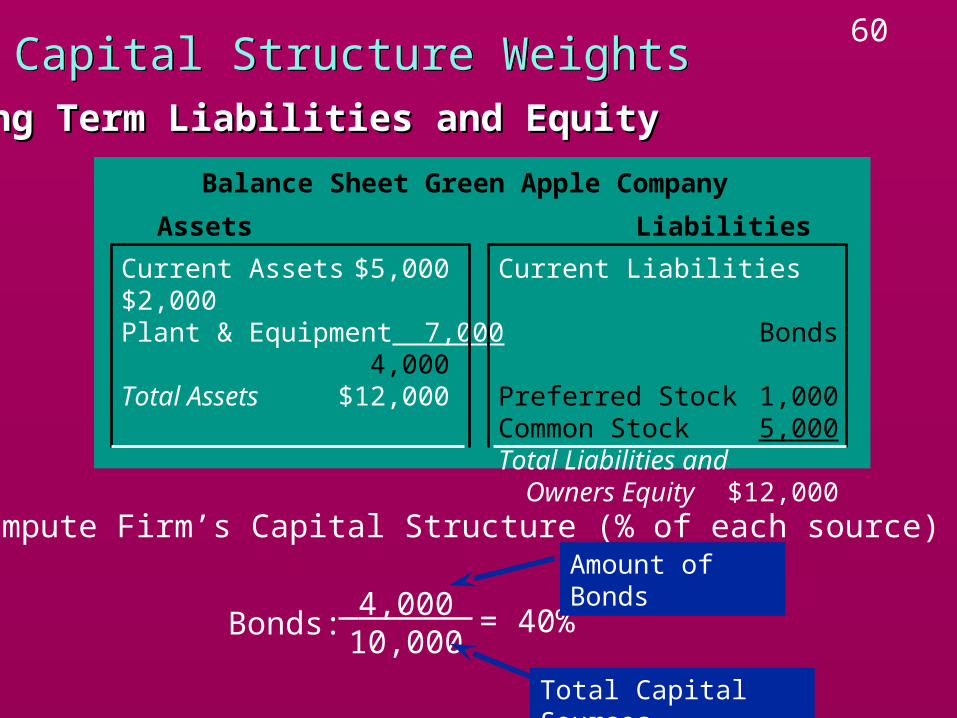
60Capital Structure WeightsCapital Structure WeightsLong Term Liabilities and EquityLong Term Liabilities and Equity
Current Assets $5,000 Current Liabilities $2,000Plant & Equipment 7,000 Bonds 4,000Total Assets $12,000 Preferred Stock 1,000
Common Stock 5,000 Total Liabilities and
Owners Equity $12,000
Assets Liabilities
Compute Firm’s Capital Structure (% of each source)
Bonds: 4,000 10,000
= 40%
Amount of Bonds
Total Capital Sources
Balance Sheet Green Apple Company
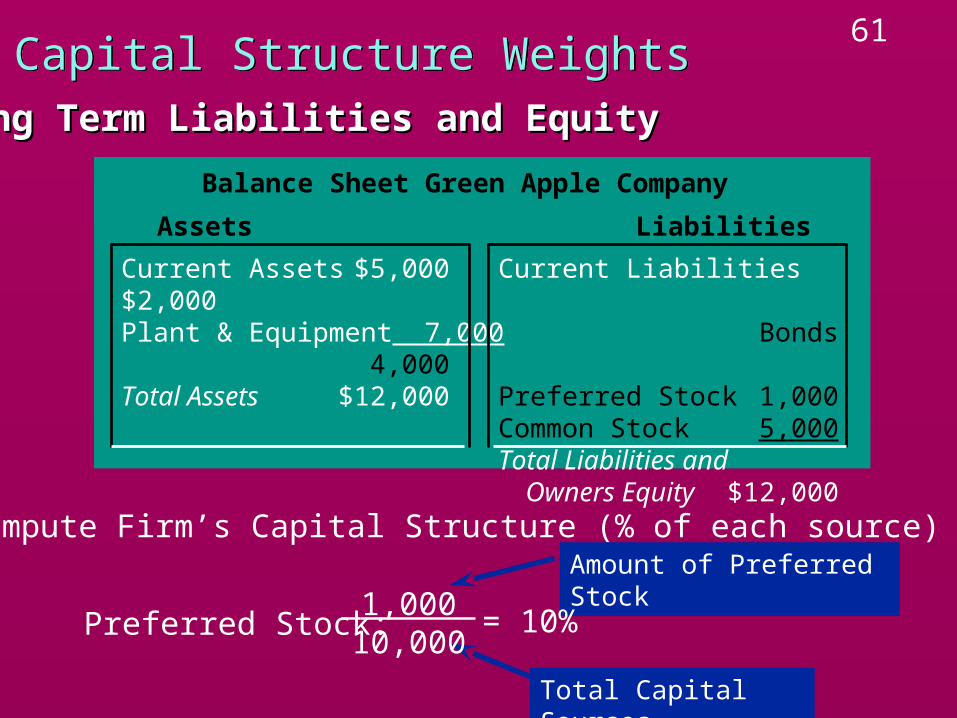
61Capital Structure WeightsCapital Structure WeightsLong Term Liabilities and EquityLong Term Liabilities and Equity
Current Assets $5,000 Current Liabilities $2,000Plant & Equipment 7,000 Bonds 4,000Total Assets $12,000 Preferred Stock 1,000
Common Stock 5,000 Total Liabilities and
Owners Equity $12,000
Assets Liabilities
Compute Firm’s Capital Structure (% of each source)Amount of Preferred Stock
Total Capital Sources
Preferred Stock: 1,000 10,000
= 10%
Balance Sheet Green Apple Company
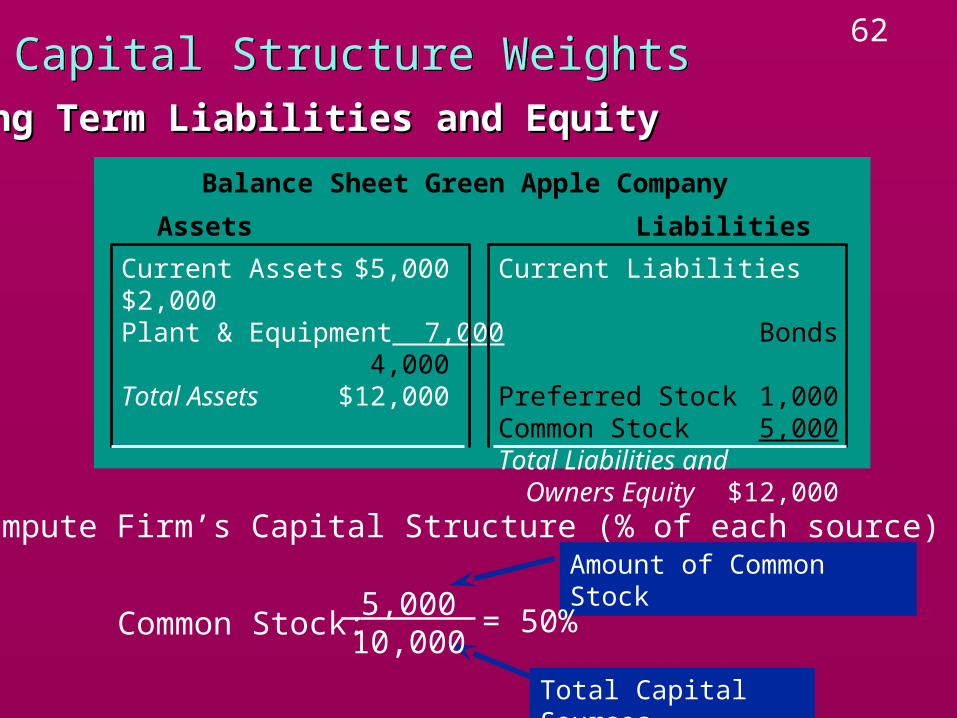
62Capital Structure WeightsCapital Structure WeightsLong Term Liabilities and EquityLong Term Liabilities and Equity
Current Assets $5,000 Current Liabilities $2,000Plant & Equipment 7,000 Bonds 4,000Total Assets $12,000 Preferred Stock 1,000
Common Stock 5,000 Total Liabilities and
Owners Equity $12,000
Assets Liabilities
Compute Firm’s Capital Structure (% of each source)Amount of Common Stock
Total Capital Sources
Common Stock: 5,000 10,000
= 50%
Balance Sheet Green Apple Company
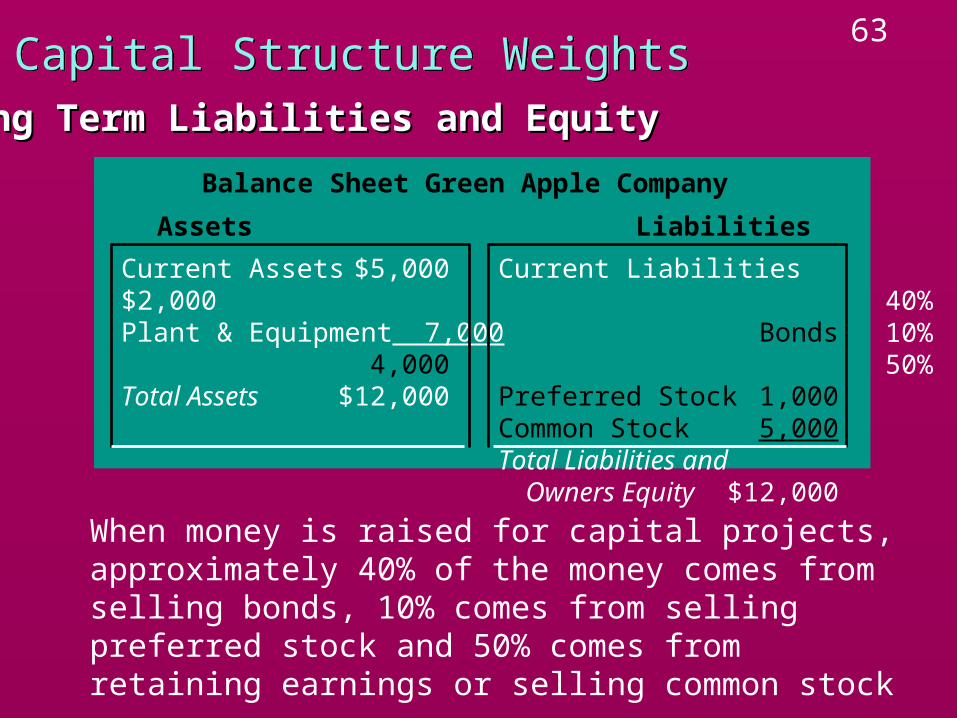
63Capital Structure WeightsCapital Structure WeightsLong Term Liabilities and EquityLong Term Liabilities and Equity
Current Assets $5,000 Current Liabilities $2,000Plant & Equipment 7,000 Bonds 4,000Total Assets $12,000 Preferred Stock 1,000
Common Stock 5,000 Total Liabilities and
Owners Equity $12,000
Assets Liabilities
40%10%50%
When money is raised for capital projects, approximately 40% of the money comes from selling bonds, 10% comes from selling preferred stock and 50% comes from retaining earnings or selling common stock
Balance Sheet Green Apple Company
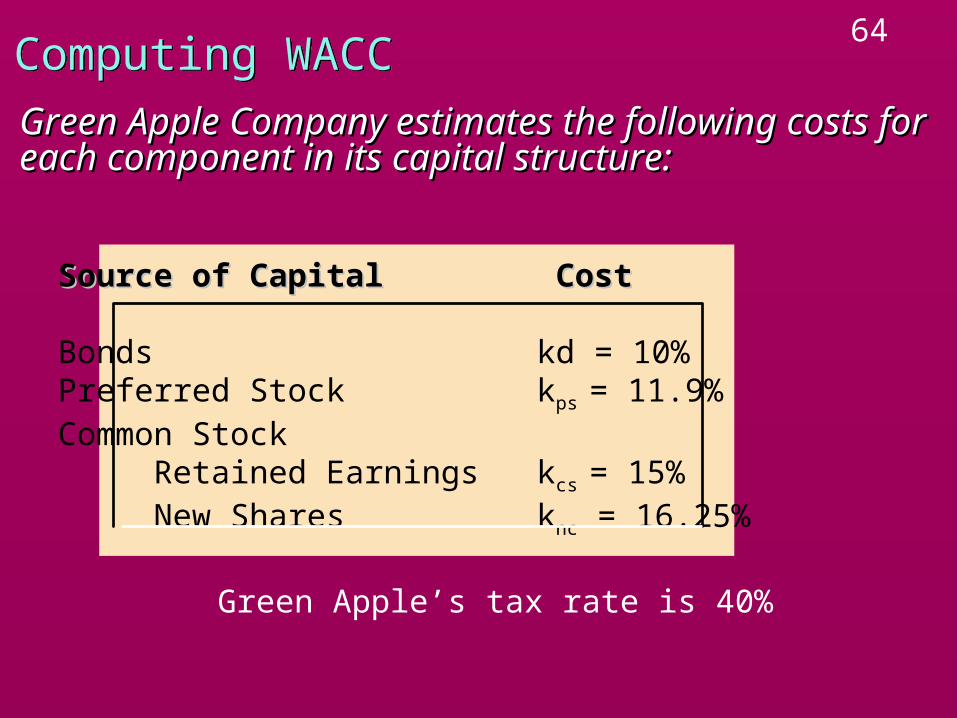
64Computing WACCComputing WACC
Green Apple Company estimates the following costs Green Apple Company estimates the following costs for each component in its capital structure:for each component in its capital structure:
Source of CapitalSource of Capital Cost Cost
Bonds kd = 10%Preferred Stock kps = 11.9%Common Stock
Retained Earnings kcs = 15%New Shares knc = 16.25%
Green Apple’s tax rate is 40%
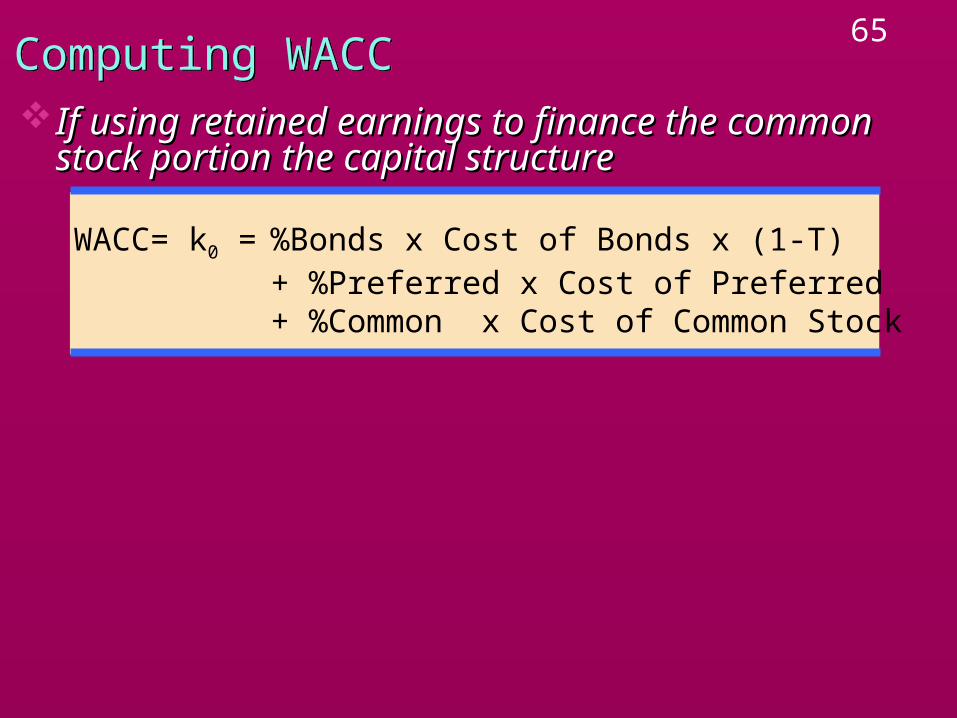
65Computing WACCComputing WACC If using retained earnings to finance the common If using retained earnings to finance the common
stock portion the capital structurestock portion the capital structure
WACC= k0 = %Bonds x Cost of Bonds x (1-T)+ %Preferred x Cost of Preferred+ %Common x Cost of Common Stock
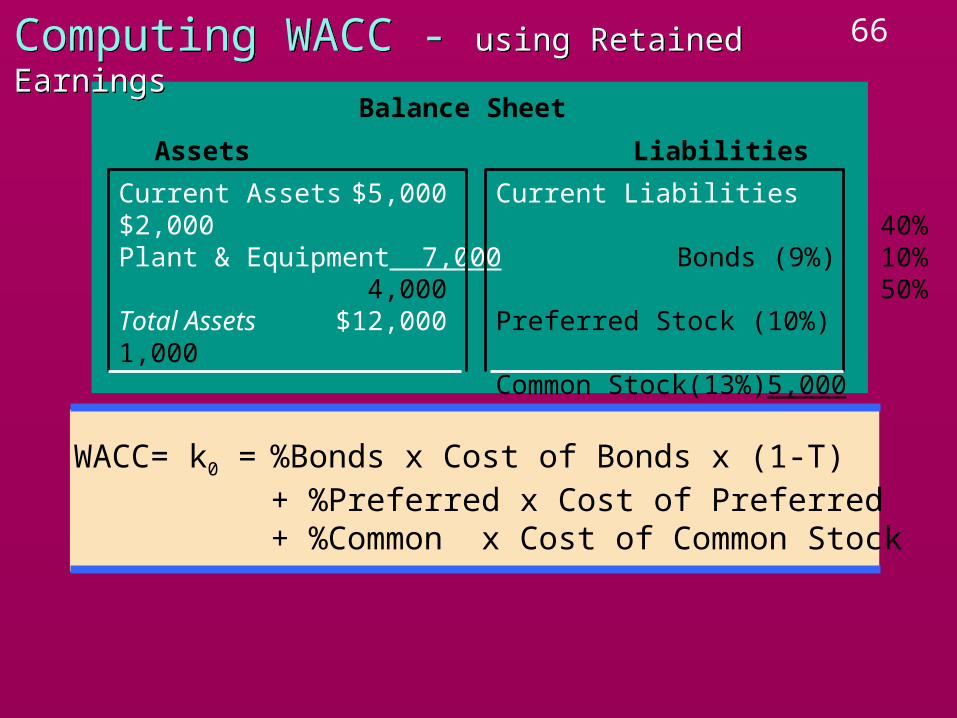
66
Balance Sheet
Current Assets $5,000 Current Liabilities $2,000Plant & Equipment 7,000 Bonds (9%) 4,000Total Assets $12,000 Preferred Stock (10%) 1,000
Common Stock(13%) 5,000Tax Rate = 40% Total Liabilities and
Owners Equity $12,000
Assets Liabilities
40%10%50%
WACC= k0 = %Bonds x Cost of Bonds x (1-T)+ %Preferred x Cost of Preferred+ %Common x Cost of Common Stock
Computing WACC - using Retained EarningsComputing WACC - using Retained Earnings

67
Balance Sheet
Current Assets $5,000 Current Liabilities $2,000Plant & Equipment 7,000 Bonds (10%) 4,000Total Assets $12,000 Preferred Stock (11.9%)1,000
Common Stock(15%) 5,000Tax Rate = 40% Total Liabilities and
Owners Equity $12,000
Assets Liabilities
40%10%50%
WACC= k0 = %Bonds x Cost of Bonds x (1-T)+ %Preferred x Cost of Preferred+ %Common x Cost of Common Stock
Computing WACC - using Retained EarningsComputing WACC - using Retained Earnings
WACC = .40 x 10% (1-.4)
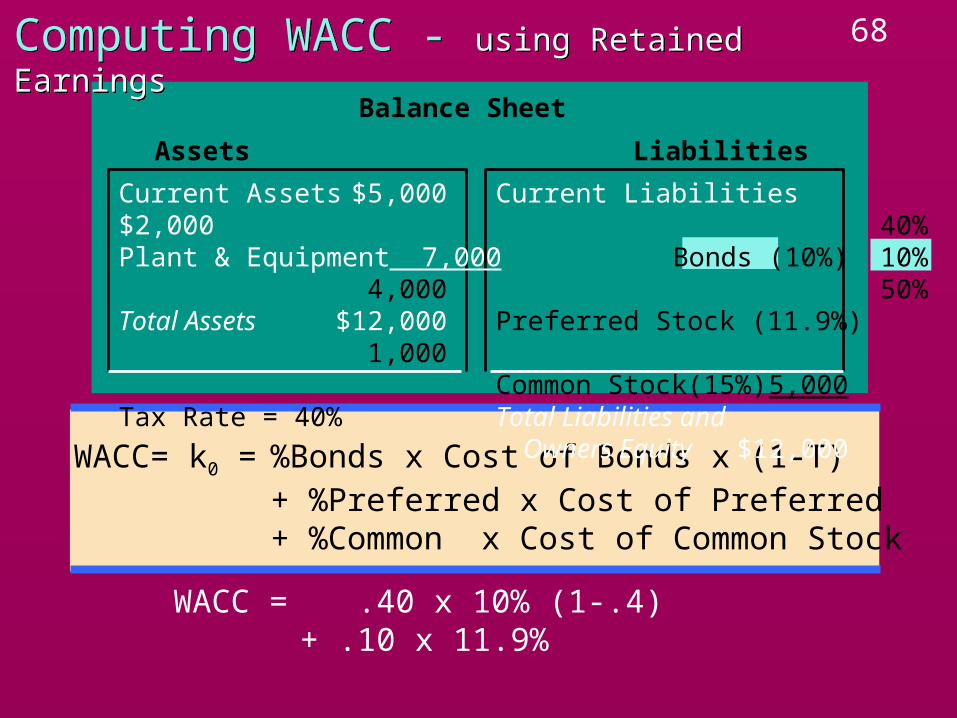
68
Balance Sheet
Assets Liabilities
40%10%50%
WACC= k0 = %Bonds x Cost of Bonds x (1-T)+ %Preferred x Cost of Preferred+ %Common x Cost of Common Stock
Computing WACC - using Retained EarningsComputing WACC - using Retained Earnings
WACC = .40 x 10% (1-.4)+ .10 x 11.9%
Current Assets $5,000 Current Liabilities $2,000Plant & Equipment 7,000 Bonds (10%) 4,000Total Assets $12,000 Preferred Stock (11.9%)1,000
Common Stock(15%) 5,000Tax Rate = 40% Total Liabilities and
Owners Equity $12,000
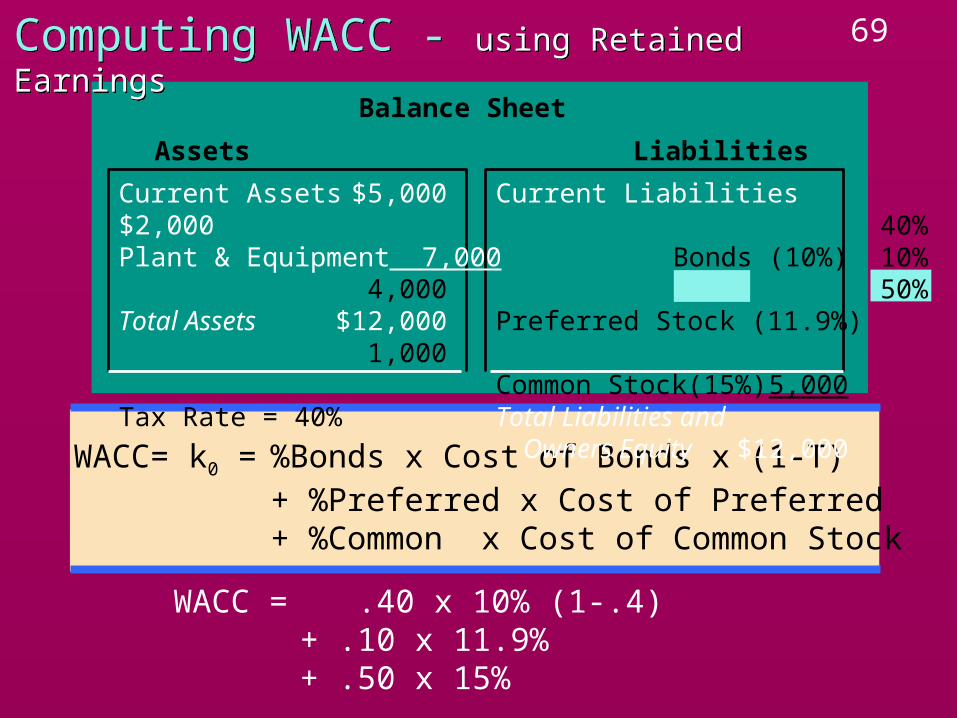
69
Balance Sheet
Assets Liabilities
40%10%50%
WACC= k0 = %Bonds x Cost of Bonds x (1-T)+ %Preferred x Cost of Preferred+ %Common x Cost of Common Stock
Computing WACC - using Retained EarningsComputing WACC - using Retained Earnings
WACC = .40 x 10% (1-.4)+ .10 x 11.9%+ .50 x 15%
Current Assets $5,000 Current Liabilities $2,000Plant & Equipment 7,000 Bonds (10%) 4,000Total Assets $12,000 Preferred Stock (11.9%)1,000
Common Stock(15%) 5,000Tax Rate = 40% Total Liabilities and
Owners Equity $12,000
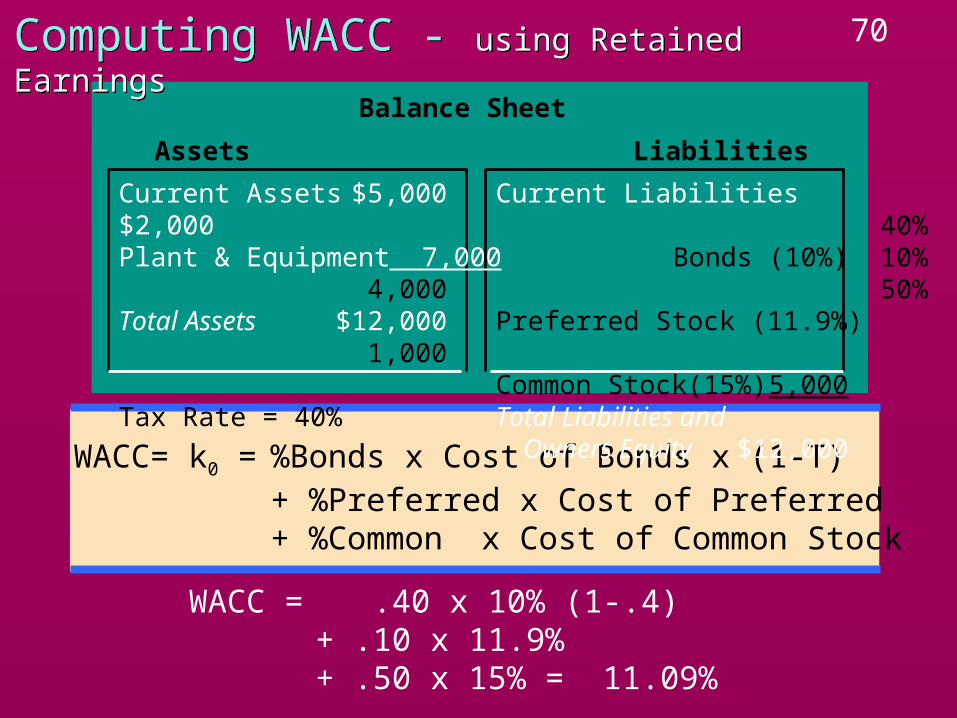
70
Balance Sheet
Assets Liabilities
40%10%50%
WACC = .40 x 10% (1-.4)+ .10 x 11.9%+ .50 x 15% = 11.09%
WACC= k0 = %Bonds x Cost of Bonds x (1-T)+ %Preferred x Cost of Preferred+ %Common x Cost of Common Stock
Computing WACC - using Retained EarningsComputing WACC - using Retained Earnings
Current Assets $5,000 Current Liabilities $2,000Plant & Equipment 7,000 Bonds (10%) 4,000Total Assets $12,000 Preferred Stock (11.9%)1,000
Common Stock(15%) 5,000Tax Rate = 40% Total Liabilities and
Owners Equity $12,000
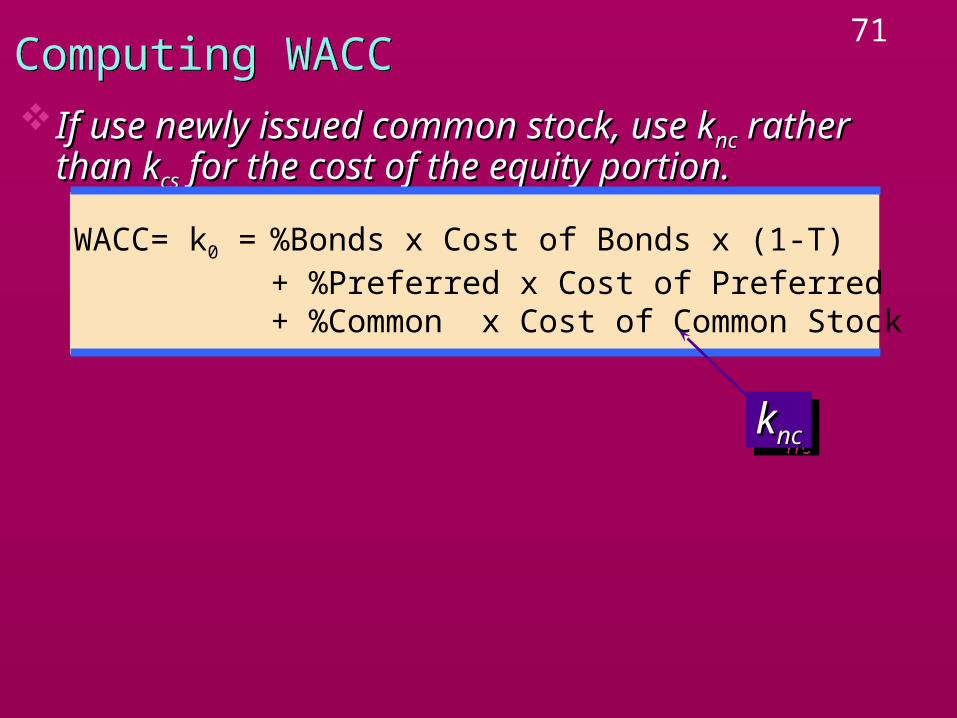
71Computing WACCComputing WACC If use newly issued common stock, use kIf use newly issued common stock, use kncnc rather rather
than kthan kcscs for the cost of the equity portion. for the cost of the equity portion.
WACC= k0 = %Bonds x Cost of Bonds x (1-T)+ %Preferred x Cost of Preferred+ %Common x Cost of Common Stock
kkncnckkncnc
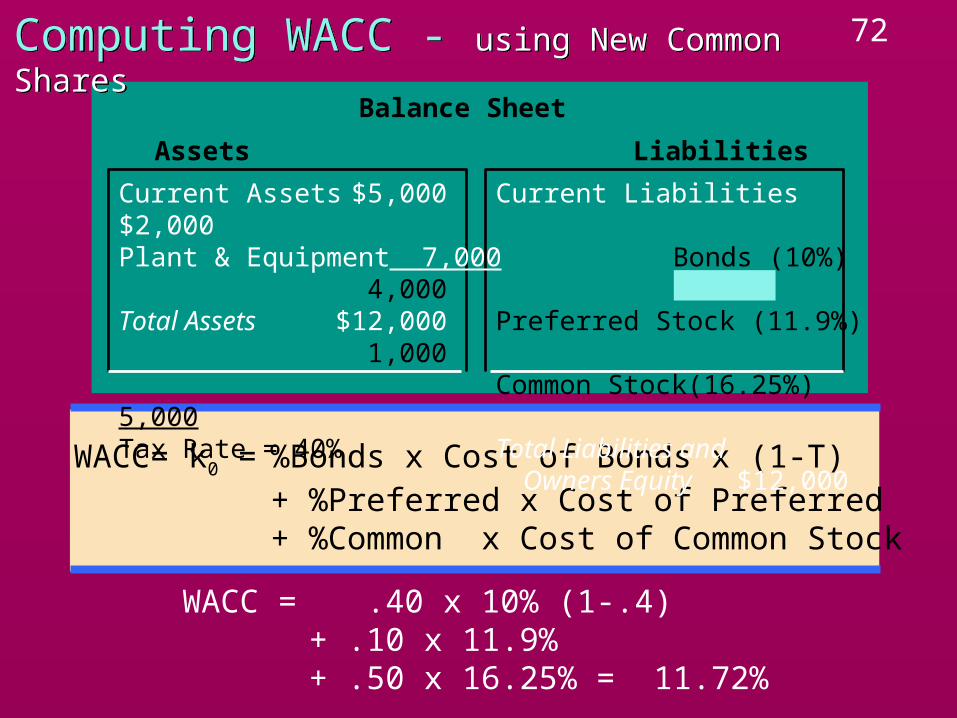
72
Balance Sheet
Assets Liabilities
WACC = .40 x 10% (1-.4)+ .10 x 11.9%+ .50 x 16.25% = 11.72%
WACC= k0 = %Bonds x Cost of Bonds x (1-T)+ %Preferred x Cost of Preferred+ %Common x Cost of Common Stock
Computing WACC - using New Common SharesComputing WACC - using New Common Shares
Current Assets $5,000 Current Liabilities $2,000Plant & Equipment 7,000 Bonds (10%) 4,000Total Assets $12,000 Preferred Stock (11.9%)1,000
Common Stock(16.25%)5,000Tax Rate = 40% Total Liabilities and
Owners Equity $12,000
73Weighted Marginal Cost of CapitalWeighted Marginal Cost of Capital
A firm’s cost of capital will change as it is raises more A firm’s cost of capital will change as it is raises more and more capitaland more capitalRetained earnings will be used up at some levelThe cost of other sources may rise beyond a certain
amount of money has been raised
74Weighted Marginal Cost of CapitalWeighted Marginal Cost of Capital
A firm’s cost of capital will changes as it is raising more A firm’s cost of capital will changes as it is raising more and more capitaland more capitalRetained earnings will be used up at some levelThe cost of other sources may rise beyond a certain
amount of money raisedTherefore, beyond a point, the WACC will rise.
Calculate the point at which the cost of capital Calculate the point at which the cost of capital increasesincreases
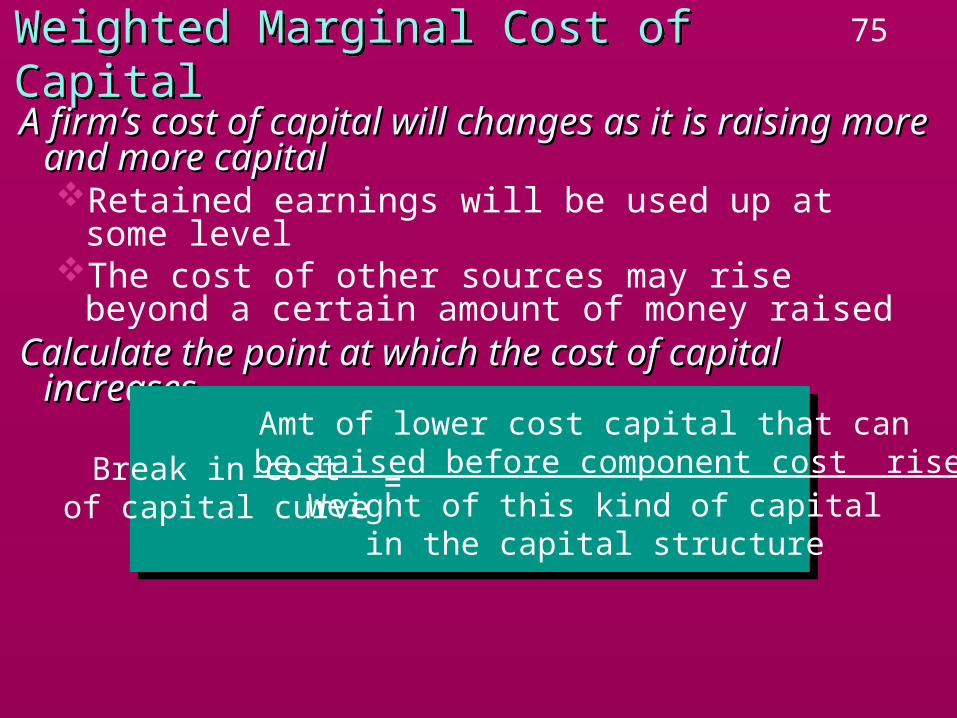
75Weighted Marginal Cost of CapitalWeighted Marginal Cost of Capital
A firm’s cost of capital will changes as it is raising more A firm’s cost of capital will changes as it is raising more and more capitaland more capitalRetained earnings will be used up at some levelThe cost of other sources may rise beyond a certain
amount of money raisedCalculate the point at which the cost of capital Calculate the point at which the cost of capital
increasesincreases
Break in costof capital curve
Amt of lower cost capital that can be raised before component cost rises
Weight of this kind of capitalin the capital structure
=
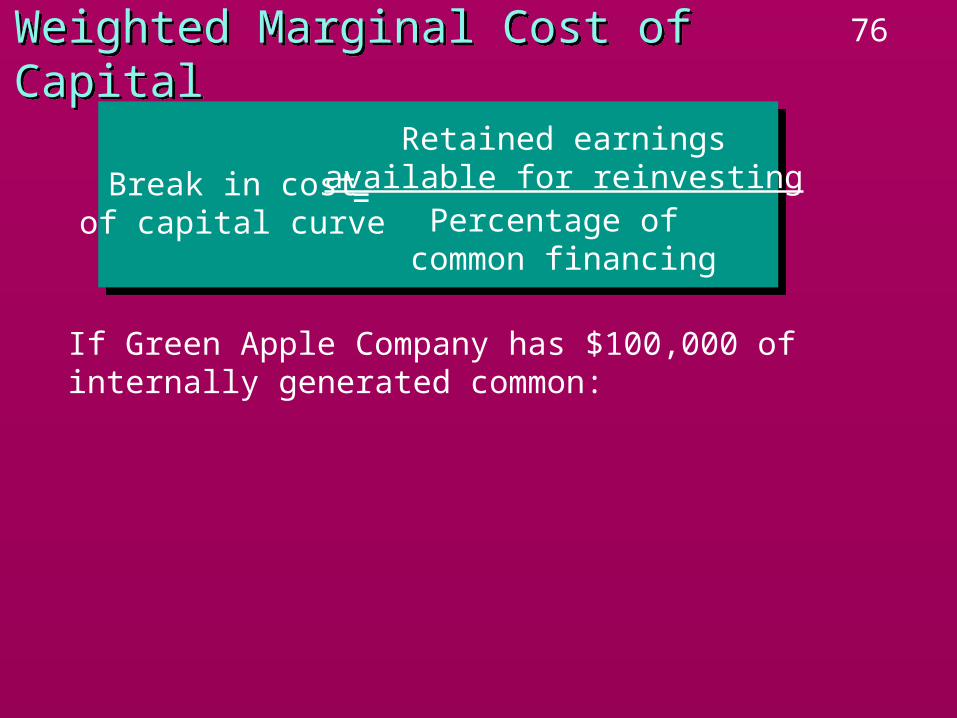
76Weighted Marginal Cost of CapitalWeighted Marginal Cost of Capital
Break in costof capital curve
Retained earningsavailable for reinvesting
Percentage of common financing
=
If Green Apple Company has $100,000 of internally generated common:
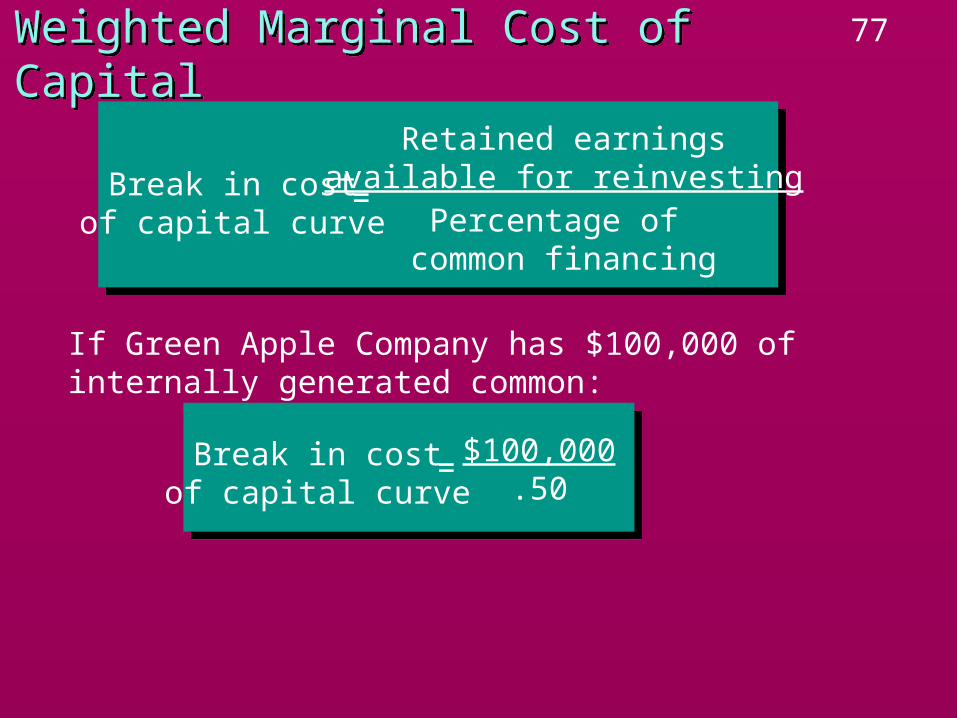
77Weighted Marginal Cost of CapitalWeighted Marginal Cost of Capital
Break in costof capital curve
Retained earningsavailable for reinvesting
Percentage of common financing
=
If Green Apple Company has $100,000 of internally generated common:
Break in costof capital curve
$100,000.50
=
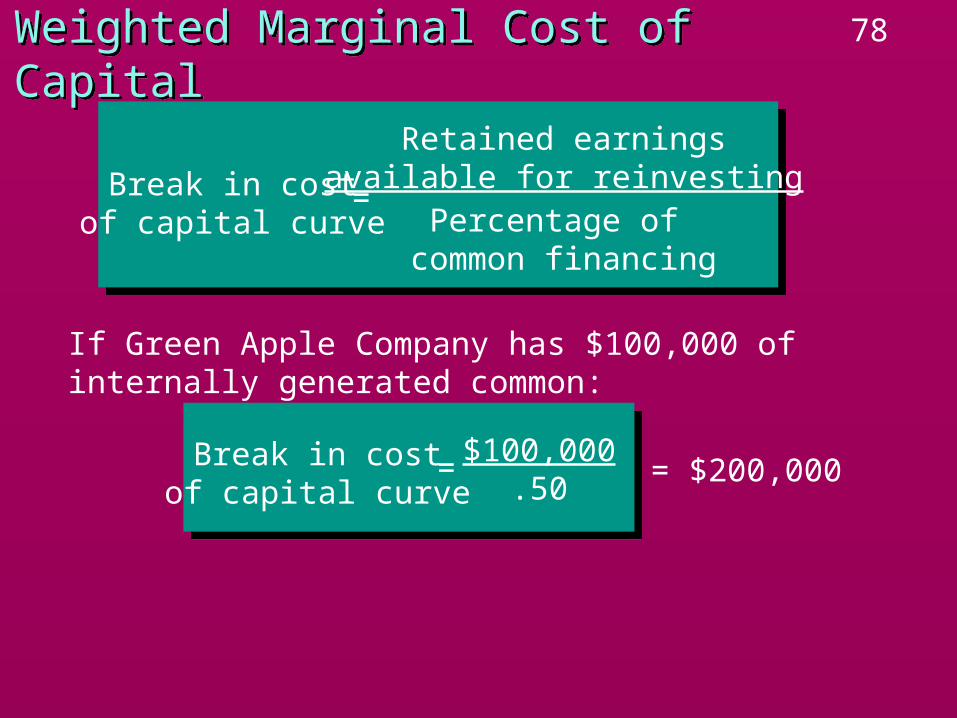
78Weighted Marginal Cost of CapitalWeighted Marginal Cost of Capital
Break in costof capital curve
Retained earningsavailable for reinvesting
Percentage of common financing
=
If Green Apple Company has $100,000 of internally generated common:
Break in costof capital curve
$100,000.50
= = $200,000
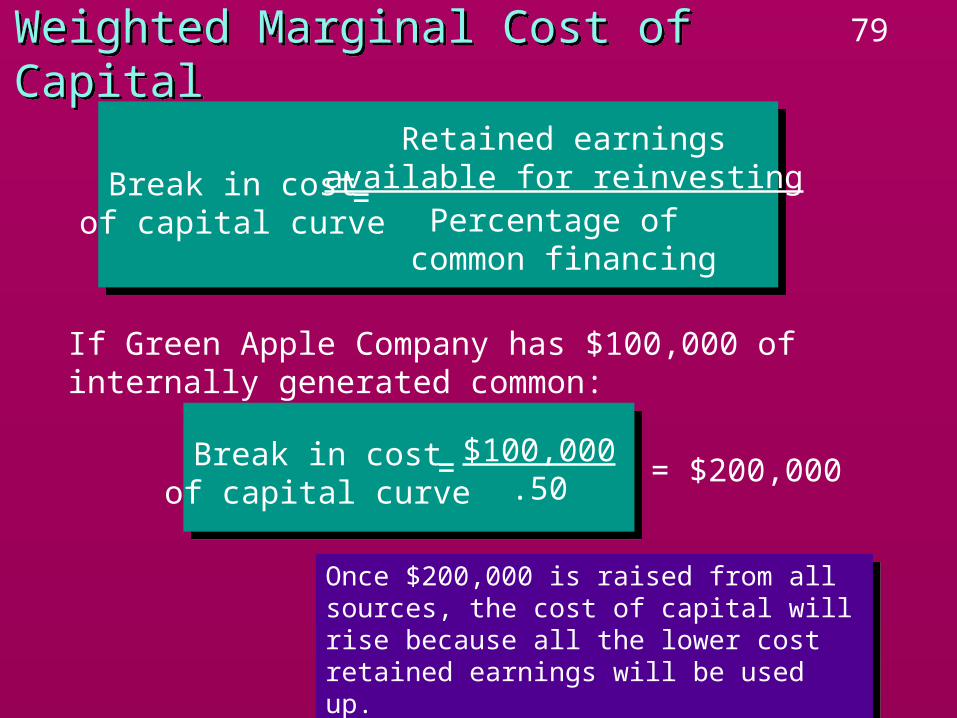
79Weighted Marginal Cost of CapitalWeighted Marginal Cost of Capital
Break in costof capital curve
Retained earningsavailable for reinvesting
Percentage of common financing
=
If Green Apple Company has $100,000 of internally generated common:
Break in costof capital curve
$100,000.50
= = $200,000
Once $200,000 is raised from all sources, the cost of capital will rise because all the lower cost retained earnings will be used up.
Once $200,000 is raised from all sources, the cost of capital will rise because all the lower cost retained earnings will be used up.
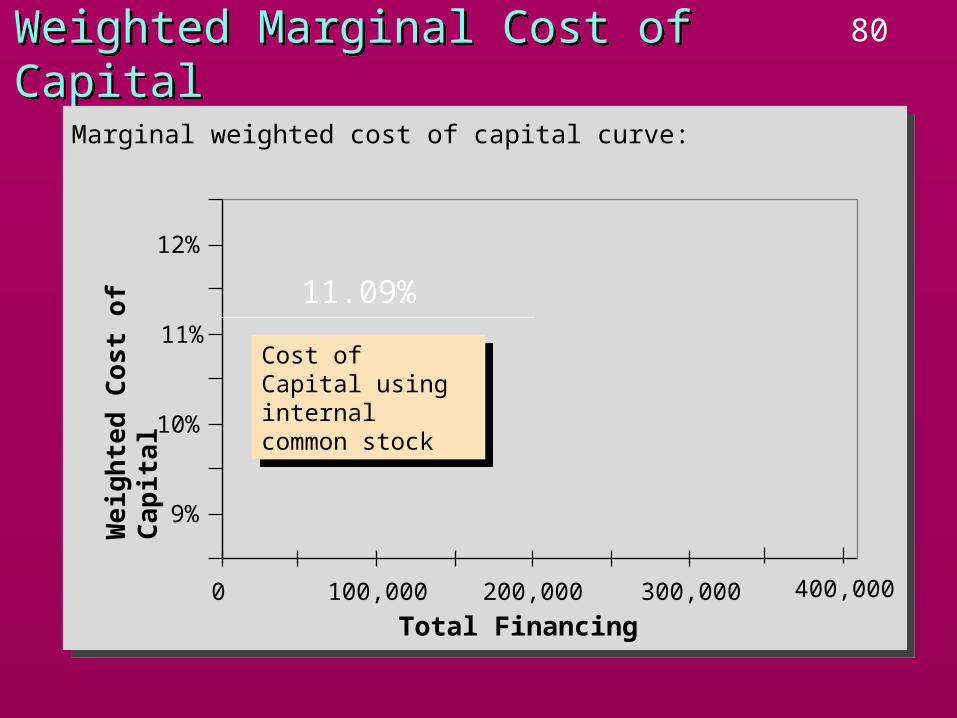
80Weighted Marginal Cost of CapitalWeighted Marginal Cost of Capital
We
igh
ted
Co
st
of
Cap
ita
l
Total Financing
9%
10%
11%
12%
0 100,000 200,000 300,000 400,000
Marginal weighted cost of capital curve:
11.09%
Cost of Capital using internal common stock
Cost of Capital using internal common stock
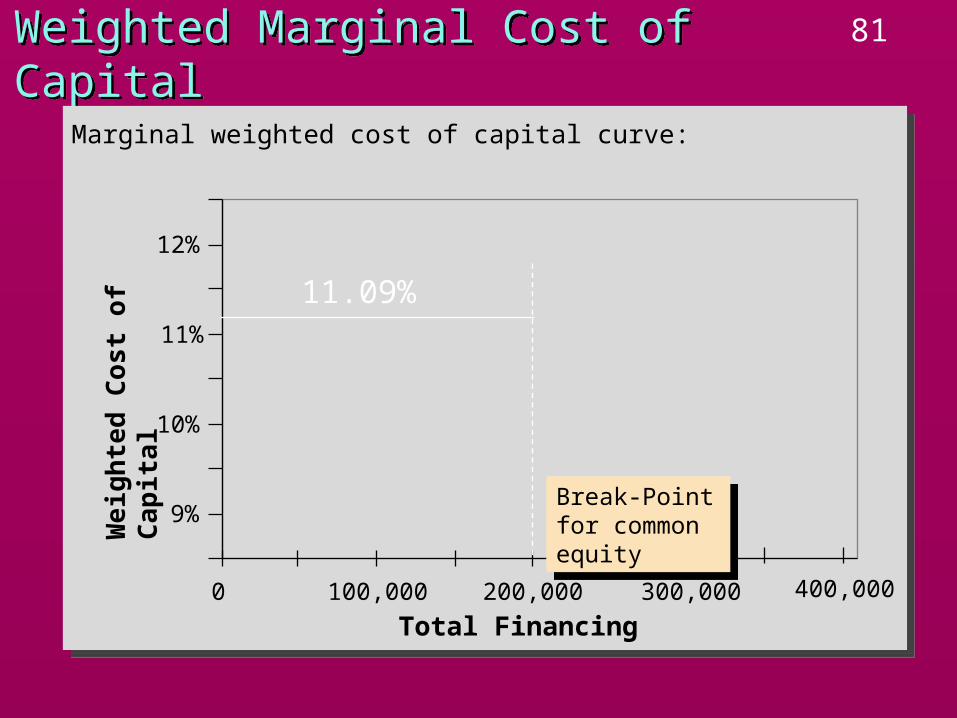
81Weighted Marginal Cost of CapitalWeighted Marginal Cost of Capital
We
igh
ted
Co
st
of
Cap
ita
l
Total Financing
9%
10%
11%
12%
0 100,000 200,000 300,000 400,000
Marginal weighted cost of capital curve:
11.09%
Break-Point for common equity
Break-Point for common equity
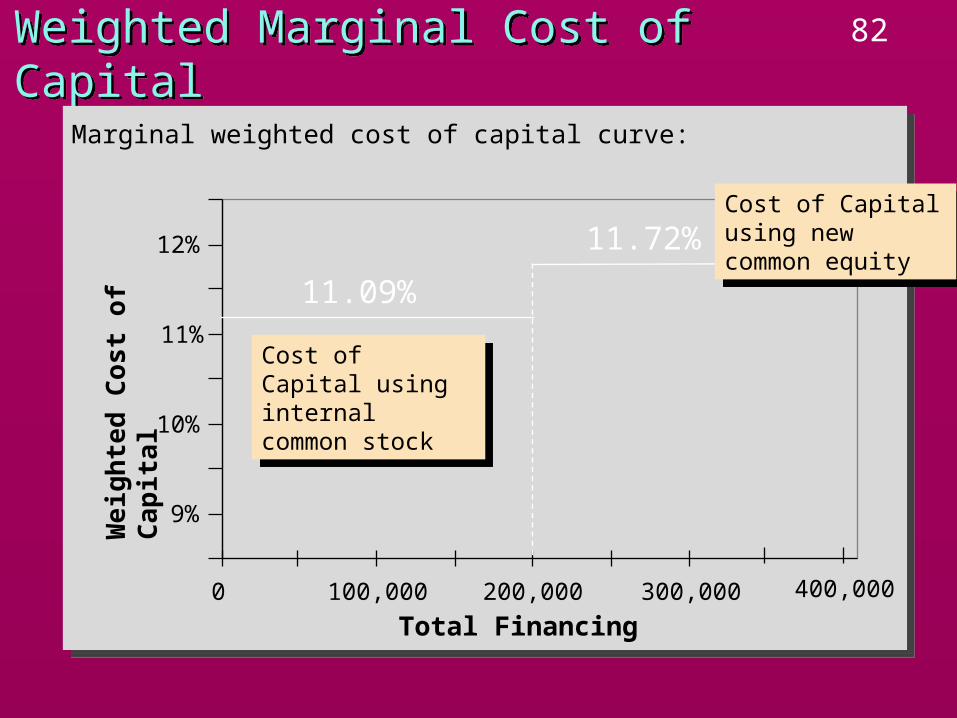
82Weighted Marginal Cost of CapitalWeighted Marginal Cost of Capital
We
igh
ted
Co
st
of
Cap
ita
l
Total Financing
9%
10%
11%
12%
0 100,000 200,000 300,000 400,000
Marginal weighted cost of capital curve:
11.09%
Cost of Capital using internal common stock
Cost of Capital using internal common stock
11.72%Cost of Capital using new common equity
Cost of Capital using new common equity
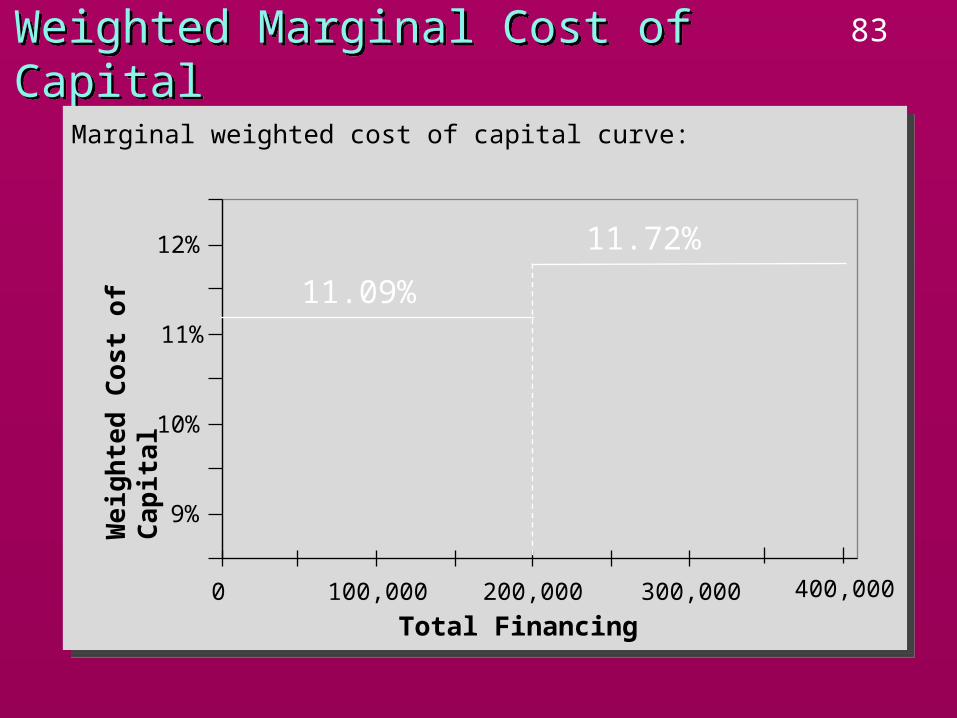
83Weighted Marginal Cost of CapitalWeighted Marginal Cost of Capital
We
igh
ted
Co
st
of
Cap
ita
l
Total Financing
9%
10%
11%
12%
0 100,000 200,000 300,000 400,000
Marginal weighted cost of capital curve:
11.09%
11.72%
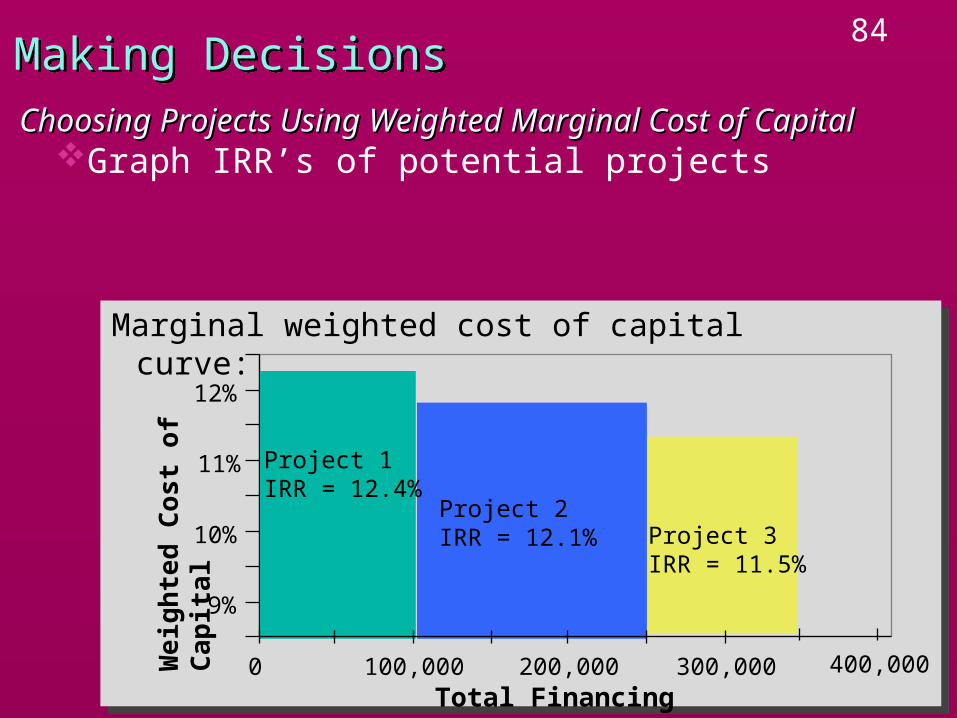
84Making DecisionsMaking Decisions
Choosing Projects Using Weighted Marginal Cost of CapitalChoosing Projects Using Weighted Marginal Cost of CapitalGraph IRR’s of potential projects
We
igh
ted
Co
st
of
Ca
pit
al
Total Financing
9%
10%
11%
12%
0 100,000 200,000 300,000 400,000
Marginal weighted cost of capital curve:
Project 1IRR = 12.4%
Project 2IRR = 12.1% Project 3
IRR = 11.5%
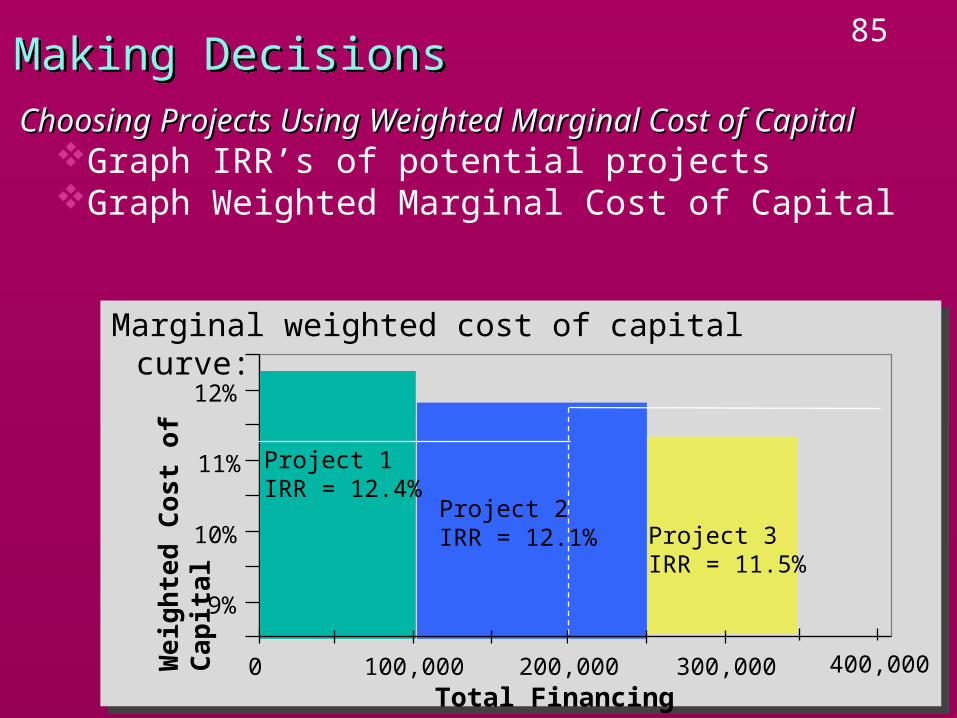
85Making DecisionsMaking Decisions
Choosing Projects Using Weighted Marginal Cost of CapitalChoosing Projects Using Weighted Marginal Cost of CapitalGraph IRR’s of potential projectsGraph Weighted Marginal Cost of Capital
We
igh
ted
Co
st
of
Ca
pit
al
Total Financing
9%
10%
11%
12%
0 100,000 200,000 300,000 400,000
Marginal weighted cost of capital curve:
Project 1IRR = 12.4%
Project 2IRR = 12.1% Project 3
IRR = 11.5%
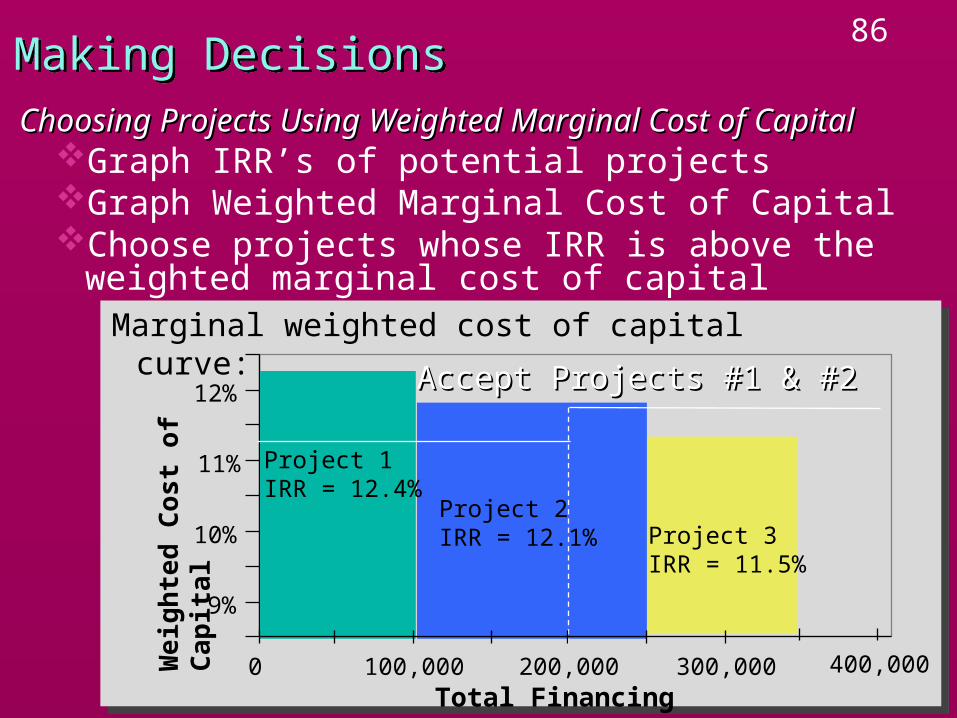
86Making DecisionsMaking Decisions
Choosing Projects Using Weighted Marginal Cost of CapitalChoosing Projects Using Weighted Marginal Cost of CapitalGraph IRR’s of potential projectsGraph Weighted Marginal Cost of CapitalChoose projects whose IRR is above the weighted
marginal cost of capital
We
igh
ted
Co
st
of
Ca
pit
al
Total Financing
9%
10%
11%
12%
0 100,000 200,000 300,000 400,000
Marginal weighted cost of capital curve:
Project 1IRR = 12.4%
Project 2IRR = 12.1% Project 3
IRR = 11.5%
Accept Projects #1 & #2Accept Projects #1 & #2

87