Embed Size (px)
Citation preview

R o b e r t B r ü c k m a n n , e c l a r e o n
D I A C O R E - C E P S P o l i c y Wo r k s h o p
B r u s s e l s 2 1 . 5 . 2 0 1 5
F inanc ing Renewab les : compar i son o f cos t o f cap i ta l in 28 EU MS

Background & methodology of research
Results: comparison of costs of capital
Conclusions
O v e rv ie w

Background & methodology

Main objectives:
Examine the role of risk and its influence on investments in the RES sector;
Compare the cost of capital and show why it matters;
Provide solutions in order to enhance investments in the RES sector;
Scope of research:
What is the range between cost of capital in the 28 EU MS for wind onshore projects and why is there such a range?
Which risks to wind onshore projects have which impact on RES investments?
How do changes in policy design affect costs of capital?
W o rk p a c k a g e : E n h a n c in g RE S in v e s tme n t

Our methodology for comparing costs of capita l and r isks
Model
• Estimation of costs of capital & ranking of wind onshore-investments risks
• Comprehensive literature study
• Application of RE-frame barriers database (more than 900 listed barriers)
• Draft of 28 EU MS country profiles
Evaluation
• Interviews with financial experts (more than 80 interviews in 26 MS)
• Evaluation of underlying assumptions of model & estimated parameters
• Adaptation of model based on input from interviews
Results
• Aggregation of EU-wide data
• Presentation of results and feedback from more than 40 national experts
• Preparation of deliverables: Country profiles, policy toolbox & final report

There are several methods for wind project financing: corporate financing or project financing
Ongoing changing (often falling) interest rates
Constant changes of RES market conditions
Lack of current, significant projects in some EU markets
Trade secrets
B e f o re w e s ta r t : s o me c a v e a ts

Comparison of costs of capital

W ACC e s t ima t io n s o n s h o re w in d – a p p ro x ima t io n b a s e d o n in te rv ie w s

I mp a c t o f c o s ts o f c a p i ta l o n RE S c o s ts in a s y s te m d y n a m ic a p p ro a c h
-
Little supportneeded
Low risk of systemchange
Low deployment
costs +
Much supportneeded
High deployment
costs
High risk of systemchange
Capital costs +
Much supportneeded
High deployment
costs
High risk of systemchange
Cost of capital
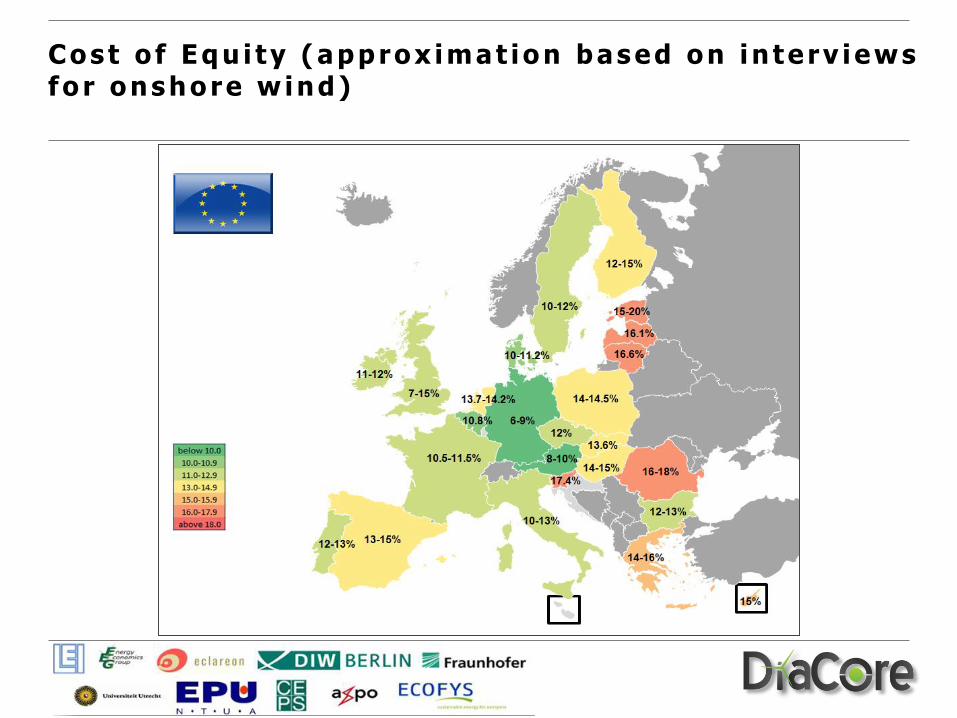
Co s t o f E q u i ty ( a p p ro x ima t io n b a s e d o n in te rv ie w s f o r o n s h o re w in d )

Co s t o f De b t ( a p p ro x ima t io n b a s e d o n in te rv ie w s f o r o n s h o re w in d )

De b t/ E q u i ty R a t i o s ( a p p ro x ima t io n b a s e d o n i n te rv ie w s f o r o n s h o re w in d )

Conclusions

Huge variation in costs of capital for wind onshore projects in EU Member States
High cost of capital lead to increasing wind onshore deployment costs
Difference is in particular due to difference in cost of debt and cost/equity ratio
Factors for differing costs of capital are
RES specific risk premium
Country specific risks
Competition between investors
Co n c lu s io n s

W ACC e s t ima t io n s a n d s u p p o r t s c h e me s f o r o n s h o re w in d
P a u l N o o t h o u t , E c o f y s
D I A C O R E - C E P S P o l i c y Wo r k s h o p
B r u s s e l s 2 1 . 5 . 2 0 1 5
F inanc ing Renewab les : M i t iga t ing r i sks to enhance RES inves tments
What risks are influencing RES investments?
What investment risks are most important?
How can policies mitigate investment risks?
O v e rv ie w
What risks are influencing RES
investments?

0%
2%
4%
6%
8%
10%
12%
Baseline rate Cost of equity RES investment risks
RE S in v e s tme n t r i s k s –H o w r i s k s in f lu e n c e c o s t o f e q u i ty
Ris
ks re
late
d to
RE
S in
vestm
ents

RE S in v e s tme n t r i s k s – Ris k c a te g o r ie s
Planning Construction Operation
Baseline rate (country risks)
Public acceptance risks
Administrative risks
Financing risks
Technical & management risks
Grid access risks
Policy design risks
Market & regulatory risks
Sudden policy change risks

What investment risks are most
important?

Av e ra g e ra n k in g o f r i s k c a te g o r ie s a c ro s s 24 E U M S
Average Ranking of Risks – 24 EU member states

Co mp a r in g r i s k s in N o r th - W e s te rn , E a s te rn a n d S o u th e rn M e m b e r S ta te s

Co mp a r in g r i s k s in M e mb e r S ta te s b y s ta tu s o f w in d p o w e r d e p lo y m e n t

How can policies mitigate
investment risks?
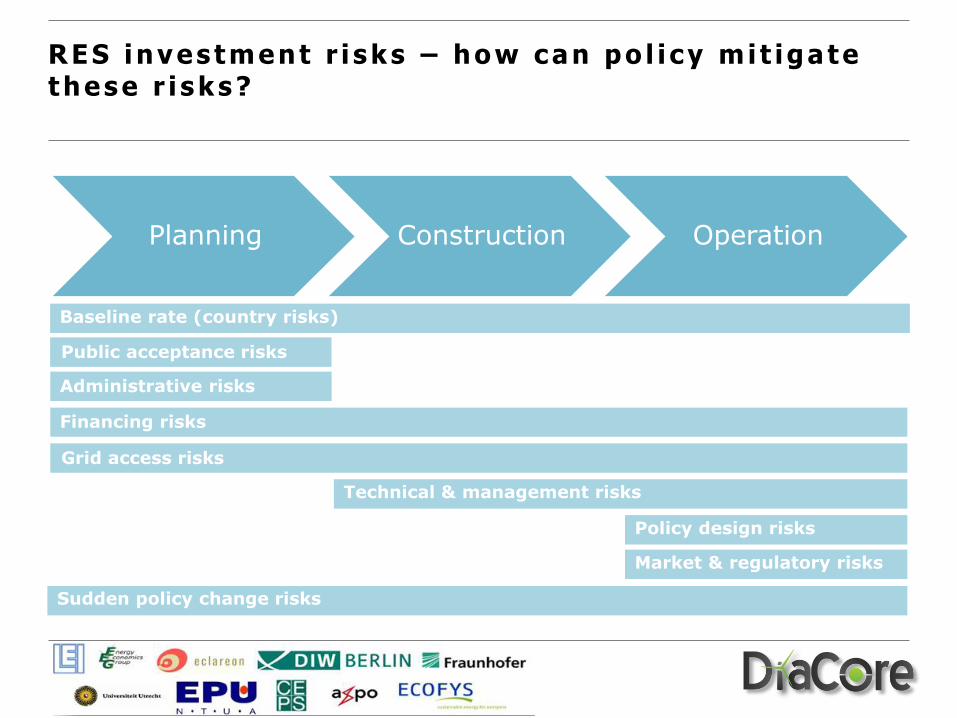
RE S in v e s tme n t r i s k s – h o w c a n p o l i c y mi t ig a te th e s e r i s k s ?
Planning Construction Operation
Baseline rate (country risks)
Public acceptance risks
Administrative risks
Financing risks
Technical & management risks
Grid access risks
Policy design risks
Market & regulatory risks
Sudden policy change risks

Huge variation in capital costs for RES projects in different EU Member States
Significant differences between regions and market development
Across all EU-MS Policy design risks perceived as most pressing;
Not only choice of support scheme essential for reduction of policy risks –specific design of support scheme also very important
Not all risk categories can be mitigated by policy alone, as other factors and stakeholders are also exerting influencing;
Co n c lu s io n s
B a r b a r a B r e i t s c h o p f , F r a u n h o f e r I S I
D I A C O R E - C E P S P o l i c y Wo r k s h o p
B r u s s e l s 2 1 . 5 . 2 0 1 5
F i nanc i ng Renewab l e s : The impac t o f c hanged s uppo r t s c hemes on t he c o s t o f c ap i t a l

Policy Impact Analysis

P o l i c y I mp a c t An a ly s i s : O b j e c t i v e
Objective:
show what the impact of policy design elements ison cost of capital
cost of capital comprises cost of equity and cost ofdebt:
its calculation is based on
interest rate
return on equity
equity share
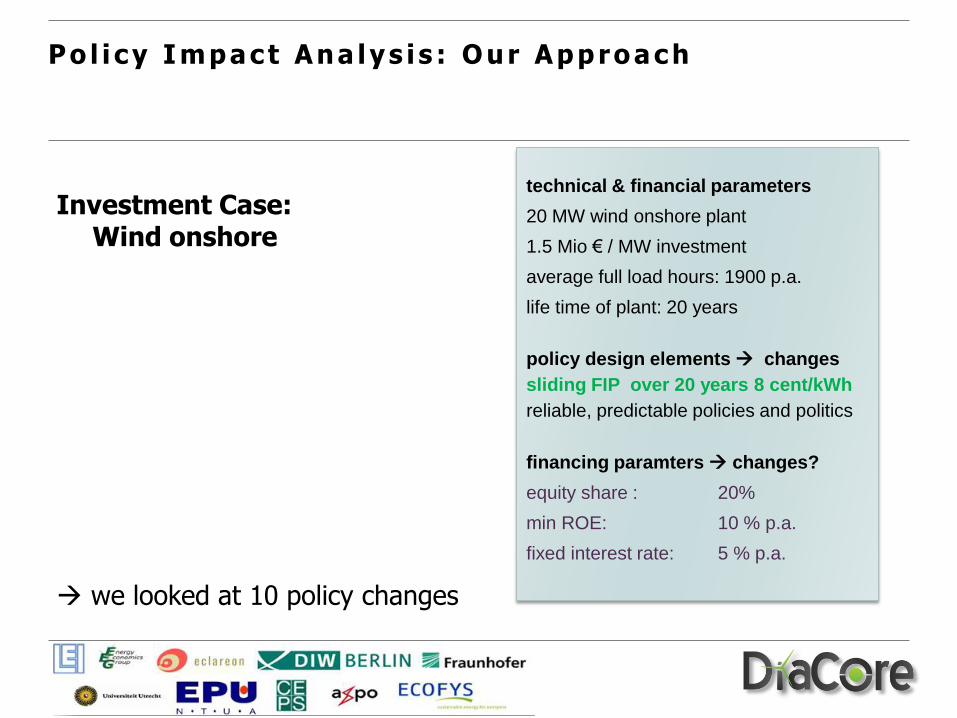
P o l i c y I mp a c t An a ly s i s : O u r Ap p ro a c h
Investment Case: Wind onshore
we looked at 10 policy changes
technical & financial parameters
20 MW wind onshore plant
1.5 Mio € / MW investment
average full load hours: 1900 p.a.
life time of plant: 20 years
policy design elements changes
sliding FIP over 20 years 8 cent/kWh
reliable, predictable policies and politics
financing paramters changes?
equity share : 20%
min ROE: 10 % p.a.
fixed interest rate: 5 % p.a.
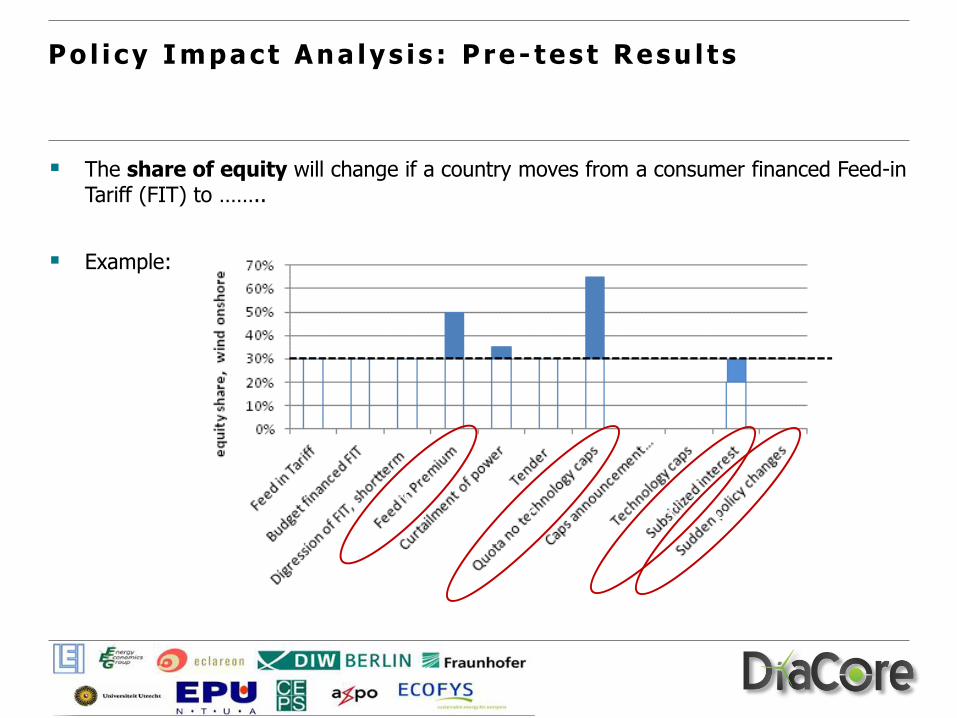
P o l i c y I mp a c t An a ly s i s : P re - te s t Re s u l t s
The share of equity will change if a country moves from a consumer financed Feed-in Tariff (FIT) to ……..
Example:

P o l i c y I mp a c t An a ly s i s : P re - te s t Re s u l t s
The interest rate will change if a country moves from a consumer financed Feed-in Tarif (FIT) to …..
Example:

Changes in policydesign – five„policy cases“:
changes of designfeatures lead touncertainties in
revenues
expenditures
risks
P o l i c y I mp a c t An a ly s i s : Re f in d e d Ap p ro a c h
FIT
risk
policy designs
uncertainty in revenues (price risk)
uncertainty in
expendituresFIT
sliding
FIP
FIP neg penalty due to delayed
/ no operation
expected start of operation
fixed
FIP

policy changeswill be translatedinto risks
risks will betranslated into :
interest rate, return on equity, equity share
or
no financing
P o l i c y I mp a c t An a ly s i s : E x p e c te d O u tc o me
minimum required equity share in %
FIT
sliding
FIP
no sliding
FIP if
negative
prices
fixed FIP
Tender
with
penalties
policy designs
25
20
15
10
30

P o l i c y I mp a c t An a ly s i s : N e x t S te p
our questionnaire
… will be electronically available (DiaCoreWebpage, email)
... and can be filled out by those with a background in financing and project development

Any questions or comments ?
if not, then:
Is there a relevant policy design element/feature that is missing in our approach and that might have a high impact on the (un)certainty of revenues or expenditures ?
Do you agree that the penalty in an auction with sliding feed in premium disposes the highest uncertainty/risk to investors ?
Which other risks do you consider as relevant and are not addressed by our approach ?
P o l i c y I mp a c t An a ly s i s : D i s c u s s io n

http://www.diacore.eu/
More information: Contact Details:Coordinator WP 3:
Lucie Tesnière & Paul Noothout
Ecofys
E-mail: [email protected]
Robert Brückmann & Filip Jirouš
eclareon
E-mail: [email protected]
Barbara Breitschopf & Mario Ragwitz
Fraunhofer ISI
E-mail: [email protected]
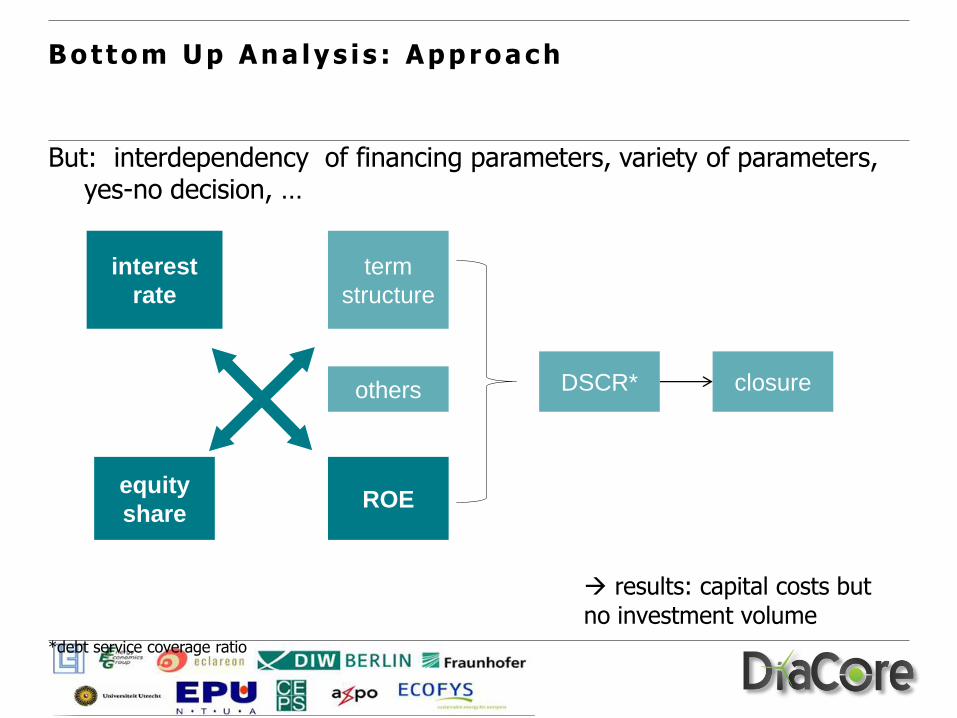
But: interdependency of financing parameters, variety of parameters, yes-no decision, …
results: capital costs but
no investment volume*debt service coverage ratio
B o t to m U p An a ly s i s : Ap p ro a c h
DSCR*
equity
share
term
structure
ROE
interest
rate
closureothers

theoretical model cost of equity and
debt, and risk margins (severity + frequency) under current policy, marketand country situations
top down analysis leads to adjustmentsof theoretical model results country
specific risk ranking and costs but nodirect relation between policy design and risk margins or rankings
bottom-up analysis links policies to risksand financing parameters
Wrap up: Approaches & Resu l t s
country riskprofiles
triple A policy
theoreticaldecomposition of costof equity and debt
significance ofbarriers/risk reflectsrisk margins
most relevant risksare „in“ policy design and changes
policy design changescan be transferredinto changes offinancial parameters
Approach Output Assumption
9