Embed Size (px)
Citation preview

1
Cost of Capitalby Binam Ghimire

Learning Objectives
Concept of cost of capital Significance of cost of capital Concept debt, preferred and common stock Understand stock market Dividend Growth Model and Capital Asset Pricing
Model Compute component costs of different types of
capital Determine weighted average cost of capital
2

Cost of CapitalConcept:
Funds from long-term sources of financing Compensation Different Names:
Required rate of return, hurdle rate, opportunity cost, discount rate
3

Concept:
4
Overall cost of capital (Excel File) – pronounced similar to Quack – W_ _ _

Cost of Capital Basic Assumptions:
Constant Business Risk Constant Financial Risk Constant Dividend Policy Constant Tax Rate
5

Cost of Capital Financing decision:
Investment Decision Capital Structure Decision Dividend Policy Decision
6

Capital Components:
Debt+ Preferred+ Common Stock______________Total Capital
The order of capital components (based on their cost)
7

Capital Components:
8
Source: Airplane-Pictures.net The cost of capital components (is based on degree of risk)

9
Debt

Debt Capital:Concept
10
Debt: Bank Loan, Bond, Notes, Debenture

Debt Capital:Concept
11
Source: historycooperative.org
A Bond

Debt Capital Terminologies:
12
Bondholders: Lenders/ Investors Bond Issuers: Company raising the money Coupon: The fixed interest payment (as a % of
face value – “C”) Bond’s face value: principal or par value (“F” or
“P”). Par/ Nominal value of £ 100. The market value is relative to the nominal value. Say 110% when traded at £110
Maturity/ Redemption Call Provision Sinking Fund Provision

Bond:Types
Treasury Bond: Government Corporate Bond: Companies Municipal Bond: State or local government Foreign Bond: Foreign government/ companies
13

14
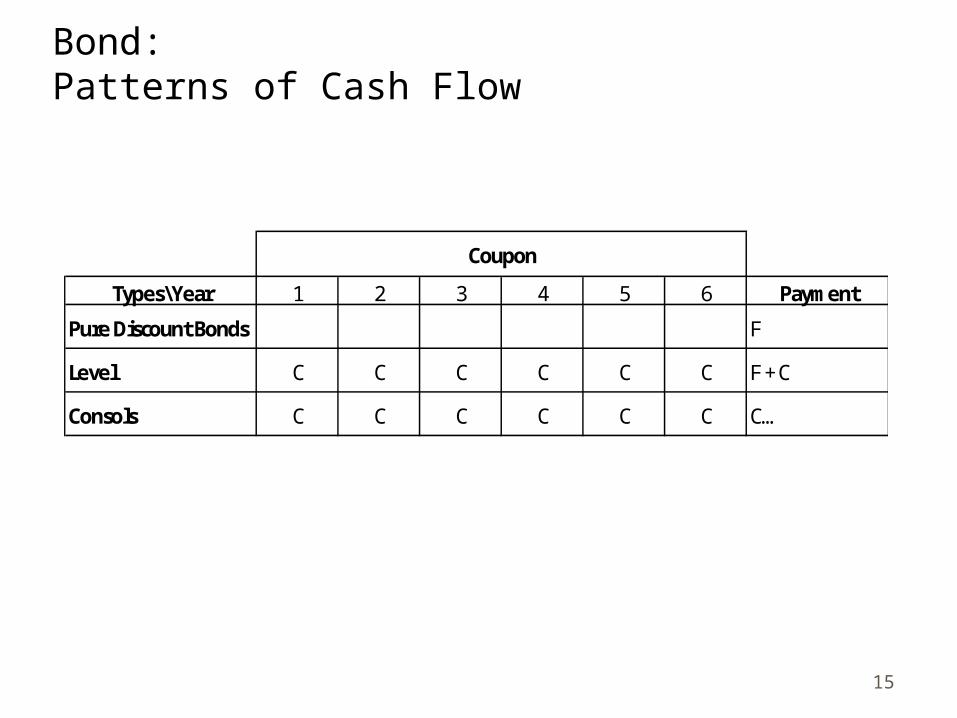
Pure Discount Bonds Level Coupon Bonds Consols
Bond:Types
15
Bond:Patterns of Cash Flow
Types\Year 1 2 3 4 5 6 Payment
Pure Discount Bonds F
Level C C C C C C F + C
Consols C C C C C C C…
Coupon

BondsTypes:
16
Redeemable Irredeemable Convertible Non-convertible Extendable/ Retractable Zero coupon/ Strip Junk/ high yield/ non investment grade Eurobonds Inflation linked

17
Bond Ratings
Bond Ratings evaluate the debt issuer to determine the risk of default
The leading rating agencies, Standard & Poor's and Moody's Investors Services
Moody's ratings, from highest to lowest. Investment grade: Aaa, Aa1, Aa2, Aa3, A1, A2, A3, Baa1, Baa2, Baa3. Speculative grade: Ba1, Ba2, Ba3, B1, B2, B3, Caa1, Caa2, Caa3, Ca, C1
S&P's ratings. Investment grade: AAA, AA+, AA, AA-, A+, A, A-, BBB+, BBB, BBB-. Speculative grade: BB+, BB, BB-, B+, B, B-, CCC+, CCC, CCC-, CC, D

18
Preference Share

Preference Shares:Concept/ Characteristics
Hybrid Higher risk than ……………… Capital but Lower than
……………… Capital Provided that there are sufficient profits, available,
preference shares will normally be given a fixed rate of dividend each year and preference dividends will be paid before ordinary dividends are paid.
If a business is wound up, preference shareholders may be given priority over the claims of ordinary shareholders.
Preference shareholders are not usually given voting rights, although these may be granted when the preference dividend is in arrears.
Similar to Debt as both offer a fixed rate of return. But less popular why? 19

20
Preference Shares: Types (colour the right hand side column)
Cumulative Allows the business to buy back the shares from shareholders at some agreed future date.
Non-Cumulative The right to receive arrears of dividends (not given in the past as a result of there being insufficient profits)
Participating No right to receive arrears of dividends (not given in the past as a result of there being insufficient profits)
Redeemable The right to a further share in profits available for dividend (after they have been paid their fixed rate and after ordinary shareholders have been awarded a dividend).

21
Ordinary Share

Backbone There is no fixed rate of dividend and ordinary
shareholders will receive a dividend only if profits available for distribution still remain after other investors (preference shareholders and lenders) have received their returns in the form of dividend payments or interests.
If the business is “wound-up” the ordinary shareholders will receive any proceeds from asset disposal only after lenders and creditors, and after preference shareholders, have received their entitlements.
On the other hand the potential returns facing ordinary shareholders are …………………...
22
Ordinary Shares:Concept/ Characteristics

Ordinary shareholders exercise control over the business through their voting rights. This gives them the power to elect the directors and to remove them from office.
23
Ordinary Shares:Concept/ Characteristics

Stocks and the Stock Market: An IPO
Initial Public Offering (IPO), also referred to simply as a "public offering", is when a company issues common stock or shares to the public for the first time.
24

Stocks and the Stock Market: An IPO
In addition, once a company is listed, it will be able to issue further shares via a rights issue, thereby again providing itself with capital for expansion without incurring any debt.
This regular ability to raise large amounts of capital from the general market, rather than having to seek and negotiate with individual investors, is a key incentive for many companies seeking to list
25

Stocks and the Stock Market: An IPO
There is competition amongst stock exchanges for IPO’s. In April 2008 Fresnillo, the world's largest producer of silver, listed
on the London Stock Exchange (LSE). The company, the first Mexican one to be listed in London, raised
some $2 billion, but its initial public offering had broader ramifications. You might have expected a Mexican company to head straight for Wall Street. That it did not both shows the success of the LSE's efforts in Latin America and also highlights the extent to which London now dominates mining finance.
Four of the five largest mining companies in the world are listed in London. A decade ago, Toronto might have been their favoured destination, if it was not New York.
But compared with Toronto, London has more liquidity, as well as more analysts, bankers and lawyers specialising in natural resources.
Fresnillo's boss, Jaime Lomelín, said in the Economist that London's appeal has grown over New York because of the way it treats taxes, and because he prefers the LSE's approach to corporate governance.
26

Stocks and the Stock Market: The FTSE 100
The FTSE 100 Index is a share index of the 100 most highly capitalised companies listed on the London Stock Exchange.
The index began on 3 January 1984 with a base level of 1000; the highest value reached to date is 6930.2, on 30 December 1999.
FTSE 100 companies represent about 80% of the market capitalisation of the whole London Stock Exchange.
Even though the FTSE All-Share Index is more comprehensive, the FTSE 100 is by far the most widely used UK stock market indicator.
The constituents of the index are determined quarterly; the largest companies in the FTSE 250 Index are promoted if their market capitalisation would place them in the top 90 firms of the FTSE 100 Index
As of July 2009 that threshold would be £1.97bn. 27

Stocks and the Stock Market: The FTSE 100
As of 23/7/2009 the largest companies in the FTSE100 are:
• The FTSE100 is dominated by a small number of sectors:• Oil Industry = 18.86%• Banks = 16.23%• Mining = 11.55%
NAME INDUSTRY MV( £m)HSBC HDG. (ORD $0.50) BANKS 96338.06
BP OILIN 94737.19VODAFONE GROUP TELMB 60351.02GLAXOSMITHKLINE PHRMC 59848.1
28

Stocks and the Stock Market: NASDAQ
The NASDAQ-100 is a stock market index of 100 of the largest domestic and international non-financial companies listed on the NASDAQ stock exchange.
It is a modified market value-weighted index; the companies weights in the index are based on their market capitalization, with certain rules capping the influence of the largest components.
It does not contain financial companies, and includes companies incorporated outside the United States; both of these factors differentiate this index from the S&P 500 and the Dow Jones Industrial Average.
29

Stocks and the Stock Market: NASDAQ
The NASDAQ 100 is also dominated by a small number of sectors: Software = 21.24% Telecommunications Equipment = 13.7 5% Semiconductors = 10.02
As of 23/7/2009 the largest companies in the NASDAQ 100 are:
NAME INUSTRY MV ($ m)MICROSOFT SOFTW 220712.9
APPLE COMPH 139829.3CISCO SYSTEMS TELEQ 123720.9
ORACLE SOFTW 108907.2INTEL SEMIC 106896.8
GOOGLE 'A' INTNT 103110.4
30

Stocks and the Stock Market: S&P 500
Compare this to the S&P 500:
EXXON MOBIL OILIN 341530.7MICROSOFT SOFTW 220712.9WAL MART STORES BDRET 191596.6JOHNSON & JOHNSON PHRMC 163101.7PROCTER & GAMBLE NDRHP 159929.6INTERNATIONAL BUS.MCHS. CMPSV 152713.8AT&T TELFL 146555.9
31

Stocks and the Stock Market: Shanghai 180 Index
MV (Yuan) MV( USD)PETROCHINA 'A' OILIN 2501695 366248.2INDUSTRIAL & COML.BK.OF CHINA 'A' BANKS 1307513 191419.9CHINA PTL.& CHM.'A' OILIN 935554.6 136965.2BANK OF CHINA 'A' BANKS 789515.4 115585.1CHINA LIFE INSURANCE 'A' LFINS 690507.6 101090.3CHINA MERCHANTS BANK 'A' BANKS 298298.9 43670.97PING AN INSURANCE (GP.) CO. OF CHINA 'A' LFINS 297044.5 43487.32BANK OF COMMS.'A' BANKS 261373.4 38265.07CITIC SECURITIES 'A' INVSV 230541.2 33751.24
32

Stocks Valuation :Book Value
Book value is an accounting concept The firm’s book value of equity includes common
stock + share premium (paid in capital) + retained earning
Book value per share is simply the amount per share of common stock to be received if all of the firm’s assets are sold for their exact book value and all liabilities (including preference stock) are paid
Book value per share is computed by dividing total book value by number of shares outstanding
33

Stocks Valuation :
Balance sheet of ABC Company on 31st December, 2009 is shown in table
What is the book value of the company and book value per share?
Liquidation value
34
Liabilities and capital Amount (£ ) Assets Amount (£ )
Current liabilities 100,000 Current assets 400,000 Long term debt 400,000 Fixed assets 600,000 Common stock (10,000 shares) 100,000 Paid in capital (share premium) 200,000 Retained earning 200,000 Total 1,000,000 Total 1,000,000

Stocks Valuation :
Market Value Market value of a stock is the current (actual)
price at which the stock is being traded in the market
Company’s future growth, earnings, earning power, level of risk etc. are reflected in market price of the security
Therefore, common stock’s price fluctuates widely
35
Stocks Valuation :Intrinsic Value
Intrinsic value: Present value of expected future cash flows discounted at appropriate required rate of return
Intrinsic value of a security is theoretical value or fair value. It is based on future cash flows, future prospects, future state of the economy and other factors that affect the valuation of the security or asset
Intrinsic value of a security is its economic value. In an efficient market there is no significant difference between market value and intrinsic value of the security
36

Stocks Valuation Concept:Book, Liquidation, and Market Value
Which value will be higher for a profitable, and growing firm? (among book, liquidation and market)
37

Cost of Equity
38

Cost of Equity:Methods
Dividend Growth Model (DGM) Capital Asset Pricing Model (CAPM)
39

DGM
40
DGM
The most common is the constant growth model Assumes that dividend will grow forever at a
constant rate, g, and it is less than required return, ks
Also known as Gordon Model If a firm’s future dividend payments per share are
expected to grow at a constant rate, g, per period forever then the dividend at any future time period t can be forecasted as follows:
Dt = D0 (1+g)t
Example – ABC Co. stock paid a dividend £ 10 per-share last year, which is expected to grow at a constant rate of 5 percent forever. What will be the Dividend for next year and the year after next?
41

DGM
Formula for Price of stock (applies the TVM concept)
Rearranging the above, the formula for Gordon’s model:
Where D1 = D0(1+g)
42
P0= D0 (1 + g)1
(1 + ks)1 +
D0 (1+ g)2
(1 + ks)2 + . . . +
D0 (1+ g)
(1 + ks)
gK
DP
s
10
gP
DK
0
1s

DGM
Or, Gordon Model =
43
gP
g)(1 Dk
0
0s

DGM:Example (No Growth)
ABC Company's common stock is currently trading at £80 a share.
The stock paid a dividend of £ 5 a share recently. The dividend is not expected to grow. What is the cost of ABC stock ?
44

DGM:Example (With Growth)
ABC Company's common stock is currently trading at £80 a share.
The stock paid a dividend of £ 5 a share recently. The dividend is expected to grow by 6%. What is the cost of ABC stock ?
45

DGM:More Examples
But first two terminologiesEx DividendCum Dividend
A security which no longer carries the right to the most recently declared dividend
The payment of a dividend is due in the near future and investors who buy the share now will receive the dividend
46

DGM:Example 1
The ordinary shares of Kewell Ltd are quoted at £5 per share ex div. A dividend of 40p per share has just been paid and there is expected to be no growth in dividends. What is the cost of equity?
47

DGM:Example 2
The ordinary shares of Gerrard Ltd are quoted at £2 per share. A dividend of 15p is about to be paid and there is expected to be no growth in dividends. What is the cost of equity?
48

DGM:Example 3
Alonso Ltd. has a share price of £4 ex div and has recently paid out a dividend of 20p. Dividends are expected to grow at an annual rate of 5%. What is the cost of equity?
49

DGM:Example 4
X Ltd. Is planning to pay a dividend of 30p per share. The share price is £3.50 cum div. Dividends are expected to grow by 5% per annum. What is the cost of equity?
50

Estimating Growth
Two methods, First Method
Where D0 = Current Dividend (say 2010), Dn = Dividend n years ago (say 2005)
The above formula is exactly same to PV in TVM
51
1D
Dg
n
1
n
0
Estimating growth:Example 5
Sissoko Ltd paid a dividend of 20p per share 4 years ago, and the current dividend is 33p. The current share price is £6 ex div. a) Estimate the rate of growth in dividends. b) Calculate the cost of equity.
52
Estimating growth:Example 6
Mascherano Ltd paid a dividend of 6p per share 8 years ago, and the current dividend is 11p. The current share price is £2.58 ex div. Calculate the cost of equity.
53

Estimating growth:Example 7
Z Ltd paid a dividend of 10p five year’s ago and the current dividend is 22p. The current share price is £8 cum div. Calculate the cost of equity.
54

Estimating growth:Second Method (GGM)
Gordon’s Growth Model Formula g = Retention Ratio x Return on retained
earnings/ reinvestment Or, g = r x b This is also written as g = b x re Where “re” is return on equity
55

Estimating Growth:Example 8
The ordinary shares of Torres Ltd are quoted at £5.00 cum div. A dividend of 40p is just about to be paid.
The company has an annual accounting rate of return of 12% and each year pays out 30% of its profits after tax as dividends. Estimate the cost of equity.
56

CAPM
57

58
CAPM Assumptions
The CAPM assumes that:- Investors rely on two factors in making their
decisions: expected return and variance. Investors are rational and risk averse and
subscribe to Markovitz (1958) methods of portfolio diversification.
Investors all invest for the same period of time.
There is a risk free investment, and investors can borrow and lend any amount at the risk-free rate.
Capital markets are completely competitive

59
CAPM Terminologies:Systematic and Unsystematic risk
In the development of portfolio theory Markowitz (1958) defined the variance of the rate of return as the appropriate measure of risk.
However this can be sub-divided into two general types of risk: systematic and unsystematic risk.
William Sharpe (1963) defined systematic risk as the portion of an assets variability than can be attributed to a common factor.
Systematic (or market risk) is the minimum level of risk

60
Sharpe (1963) defined the portion of an assets variability that can be diversified away as unsystematic (or unique) risk.
CAPM Terminologies:Systematic and Unsystematic risk

Total Risk: Systematic + Unsystematic
Systematic Risk: Portfolio Risk or Market Risk
Unsystematic Risk: Diversifiable Risk or Unique Risk (AKA idiosyncratic risk)
61
CAPM Terminologies:Systematic and Unsystematic risk

Select from the following as cause for Systematic and Unsystematic Risks :InflationAnnouncement of a small oil strike by a
companyGovernment Tax Policy RecessionDecision of management of the company to
expand/ contractControllableUncontrollable
62
CAPM Terminologies:Systematic and Unsystematic risk

63
Even a little diversification can substantially reduce variability. Unsystematic Risk can be reduced by diversification
Unique risk
Market risk
CAPM Terminologies:Systematic and Unsystematic risk

64
Given the historical record (higher return), why would any investor buy anything other than common stocks? Answer – Risk
CAPM Terminologies:Risk Free Rate and Risk Premium

65
Historical record
See how predictably the Treasury bills behaved compared to the S&P 500 index of large-cap stocks.

66
Historical record

67
Historical record

68
Historical record

69
One way of condensing this information is to calculate the historical average return.
Annual Returns Statistics (1926-1997)
Asset category Average Maximum Minimum
Large-Cap Stocks
12.83% 53.12% -43.76%
U.S. Treasury Bonds
5.41% 44.44% -7.55%
U.S. Treasury Bills
4.10% 15.23% 0.01%
Inflation 3.20% 18.13% -10.27%
Historical record – Average Returns

70
The risk free rate and risk premium
Over this 72-year period the average inflation rate was 3.20% per year, while the average return on treasury bills was 4.10% per year.
The treasury bill rate exceeded inflation on average by 0.90% per year whilst the return on the large cap shares exceed the rate of inflation by 12.83% - 3.20% = 9.63%.
The government borrows money by issuing debt securities, which come in different forms. One such form is a treasury bill.

71
The risk free rate and risk premium
Because these have such a short investment life and also because the government can always raise taxes or print money to pay its bills (at least in the short run), there is essentially no risk associated with buying them.
Thus we call the rate of return on such debt as the risk-free rate.
The difference between the return on risky assets, such as common stocks, and the risk free rate is interpreted as the risk premium.
That’s is the additional return we earn for bearing risk. Over the period the average risk premium was 8.73% (for
large cap stocks) and 1.31% for US treasury bonds. Risky assets therefore, on average, earn a risk premium.

Expected Return on Market:
From the above we can say that
Or it is the Risk free rate + the compensation for the risk inherent in the market portfolio
Hence for the above illustration, over the period the average risk premium was 8.73%. So the expected return from the market was
4.10% + 8.73% = 12.83%
72
PremiumRiskR)E(RfM

Expected Return on Individual security (using CAPM):
Need to understand the b (beta)
73
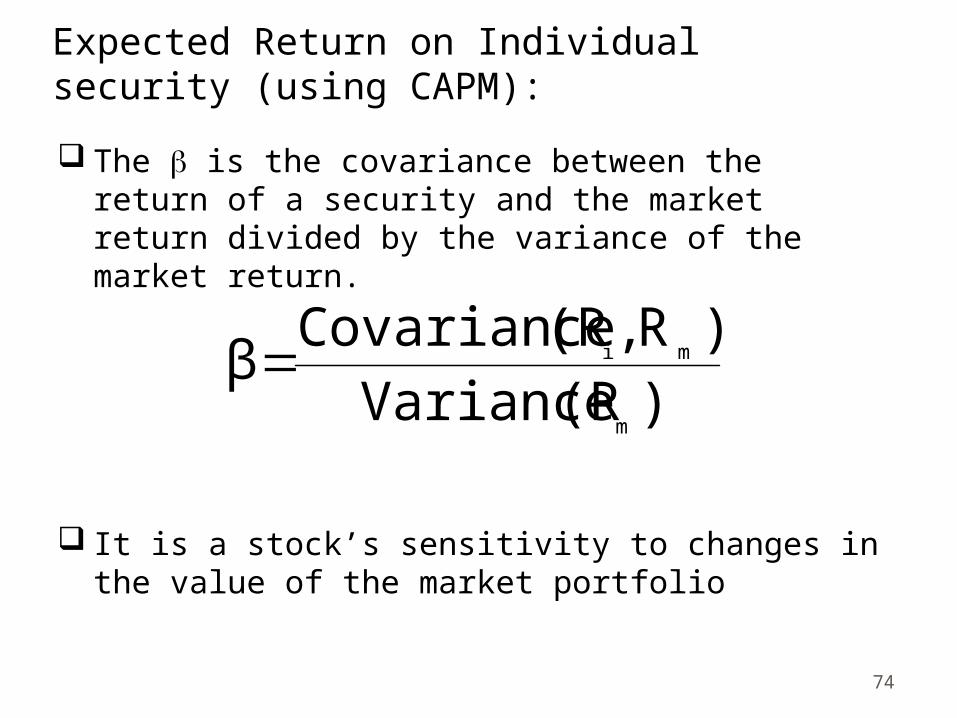
Expected Return on Individual security (using CAPM):
The b is the covariance between the return of a security and the market return divided by the variance of the market return.
It is a stock’s sensitivity to changes in the value of the market portfolio
74
)(RVariance
)R ,(RCovarianceβ
m
mi

Expected Return on Individual security (using CAPM):
There is a relationship between risk and return Quantify the risk and return to find out the value
of the stock Thus, in CAPM, cost of equity is the function of
risk-free rate, market rate of return and beta coefficient. The equation or model can be expressed as
This is also same as Cost of Equity = Risk Free Rate + Beta x Risk Premium
75
)R(RβRK fmfs

Expected Return on Individual security (using CAPM): If an investor wants to avoid risk altogether, he
must invest in a portfolio consisting entirely of ………………………. such as ……………………..
76

Expected Return on Individual security (using CAPM): If an investor wants to avoid risk altogether, he
must invest in a portfolio consisting entirely of risk free securities such as Government Debt
If the investor holds only an undiversified portfolio of shares he will suffer unsystematic risk as well as systematic risk.
If an investor holds a ‘balanced portfolio’ of all the stocks and shares on the stock market, he will suffer risk which is the same as the average systematic risk in the market.
Individual shares will have risk characteristics which are different to this market average.
Their risk will be determined by the industry sector and gearing. Some shares will be more risky and some less. 77

Expected Return on Individual security (using CAPM): The market portfolio (remember, this is the
portfolio of all the shares in the market weighted by capitalization) is taken to be the benchmark and is given a β factor of 1.
All other shares or portfolios will have a β factor greater or smaller than 1 depending on their systematic risk which is measured by considering their required returns. If a share or portfolio has a β factor of 0.5 it will move in line with the market movements but only half as much. If the share or portfolio has a β factor of 2, it will again move in line with the market but twice as much.
78

Expected Return on Individual security (using CAPM): If a stock has the same risk as the whole market
portfolio then, B = …….. If asset is less risky than the whole market
portfolio then Beta = ……… If asset is more risky than the whole market
portfolio then Beta = ……..
79

CAPM:The Security Market Line (SML)
Shows the relationship between the return of a equity and the β of the equity
Higher b means higher risk premium80
Rf
= 1b
Rm
SML
Expect
ed R
etu
rn

CAPM:The Security Market Line (SML)
Suppose Rf is 6 %, Rm is 10% and if b = 1 then Return on equity (also, Cost of equity) =
= 6% + 1 x (10% - 6%)= 10%Now suppose the b is 0.5 then= 6% + 0.5 x (10% - 6%)= 8%Again if b = 2= 14%
81
)R(RβRK fmfs
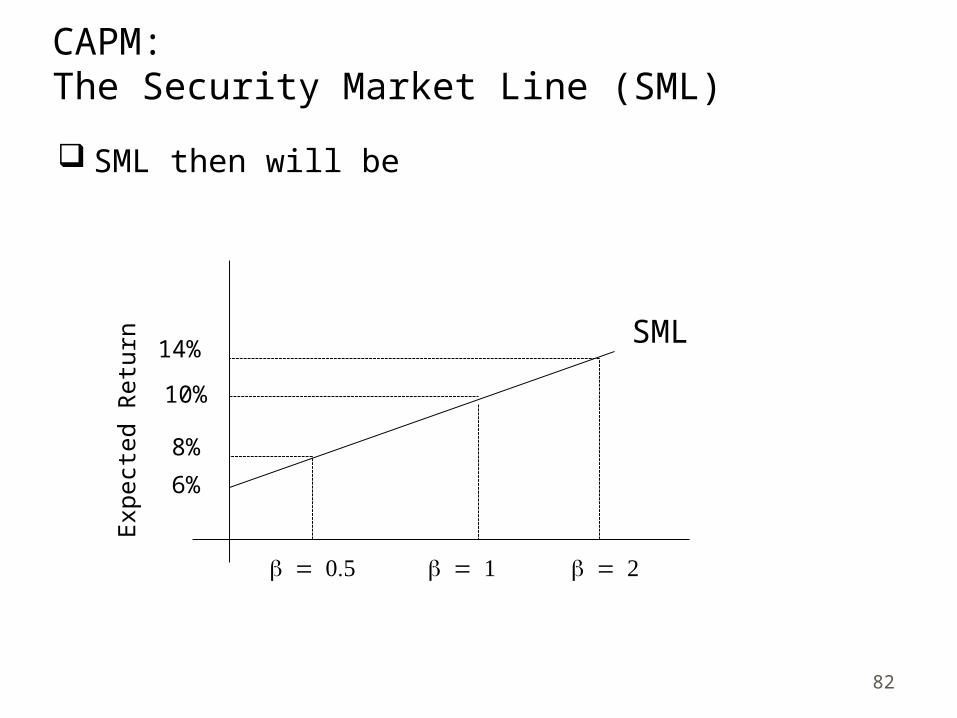
CAPM:The Security Market Line (SML)
SML then will be
82
6%
= 1b
10%
SML
Expect
ed R
etu
rn
= 0.5b = 2b
8%
14%

CAPM:Example 9
The market return is 15%. Kuyt Ltd has a beta of 1.2 and the risk free return is 8%.
Required: What is the cost of capital?
83

CAPM:Example 10
Crouch plcThe risk-free rate of return is 8%The market risk premium is 6%The beta factor for Crouch plc is 0.8Required: What would be the expected
annual return?
84

CAPM:Example 11
The return required by the shareholders of Y ltd is 15%. The return on the market portfolio is 12% and the
Risk free rate is 9%. Required: a) Calculate the equity risk premium of Y’s
shares. b) Calculate the ß of Y Ltd.
85

Cost of Debt
86

87
Concept Cost of debt should be lower than the cost of
equity. In addition tax on interest is deductable The market value of debt is assumed to be the
present value of its future cash flows Debt can be
IrredeemableRedeemable at Par (Face value)Redeemable at Discount (lower than Par value)Redeemable at Premium (higher than Par
value)Interest may be fixed or floating

88
Cost of Irredeemable Debt Formula
Interest)(ExP
t)(1I(ID)Kd
0

89
Cost of Irredeemable DebtExample 12 Rafa Ltd.- The 10% irredeemable loan notes of
Rafa Ltd. are quoted at £120 ex int. Corporation tax is payable at 30%. What is the net of tax cost of debt?

90
Cost of Redeemable Debt Bond valuation model (trial-and-error or IRR
method) can be used to determine cost of redeemable debt
Formula for the value of the debt is
Here NP is net proceed We need to find Kd which means cost of
redeemable debt
nd
n
1tt
d k1
M
k1
INP
91
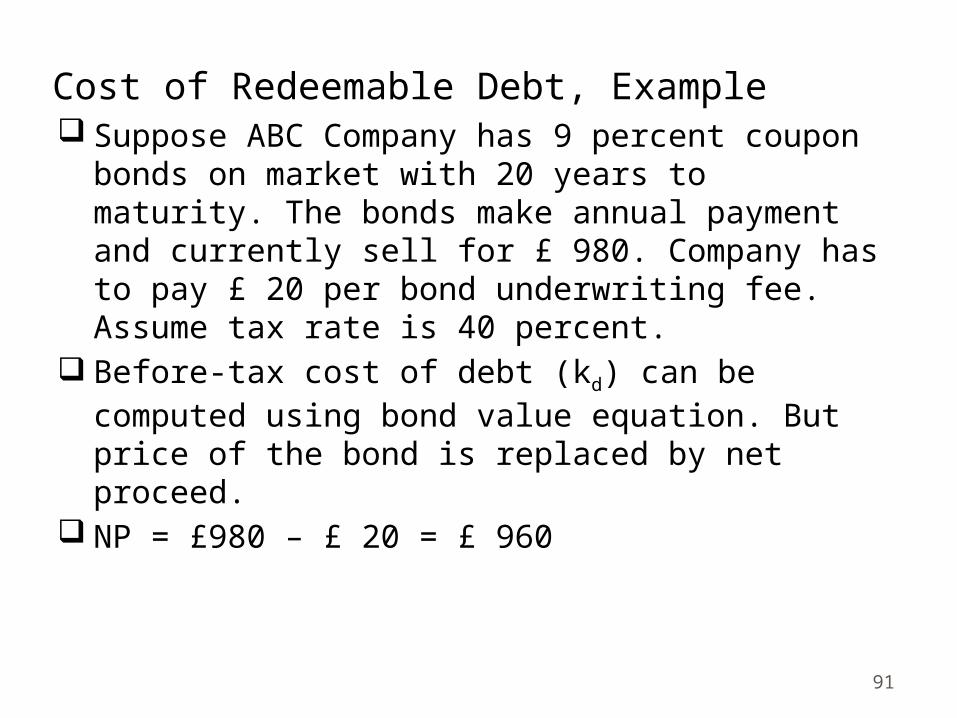
Cost of Redeemable Debt, Example Suppose ABC Company has 9 percent coupon
bonds on market with 20 years to maturity. The bonds make annual payment and currently sell for £ 980. Company has to pay £ 20 per bond underwriting fee. Assume tax rate is 40 percent.
Before-tax cost of debt (kd) can be computed using bond value equation. But price of the bond is replaced by net proceed.
NP = £980 – £ 20 = £ 960

92
Cost of Redeemable Debt, Example
NP = I × PVIFA kd,n + M × PVIFkd,n
WhereI = Interest, M = Value at Maturity, PVIFA = Present
value Interest Factor Annuity and PVIF = Present value Interest Factor
NP = I × PVIFA kd,n + M × PVIFkd,n
£960 = £90 × PVIFAkd,20 + £1000 × PVIFkd,20

93
Cost of Redeemable Debt, Example
Let us try 9%PV = £ 90 × PVIFA9%,20 + £1000 × PVIF9%,20
= £ 90 × 9.1285 + £ 1000 × 0.1784 = £ 999.97 = £ 999.97 > £ 960, So let us try at 10%
PV = £ 90 × PVIFA10%,20 + £1000 × PVIF10%,20
= £ 90 × 8.5136 + £ 1000 × 0.1486 = £ 914.82

94
Cost of Redeemable Debt, Example
By Interpolation
= 9.47% Is this our answer? (Nearly there)Note: If you are working out the interpolation using
NPV (not PV as above) then the interpolation formula changes to:
LR)(HRxHRatPVLRatPV
TRat PV -LRatPVLR(RD) Kd
)%9(10%x)14.829(999.97
960 -999.97%9
LR)(HRxHRatNPVLRatNPV
LRatNPVLR(RD) Kd
95
Cost of Redeemable Debt, Example
Before-tax cost of debt is 9.47 percent. Hence, after-tax cost of debt is computed as 9.47 percent (1 - 0.4) = 5.68 percent.
Let us practice the above in excel – See Excel File

Bond Calculation in Excel:An Example
In October 2007 Tesco raised $2bn (£990m) of debt in its first dollar-denominated bond issue.
The bond issue includes 10-year notes paying 5.5 per cent interest (US$ 850m) and 30-year notes paying 6.15 per cent interest (US 1150m).
The proceeds of the debt raising, which was jointly arranged by Citigroup and JP Morgan Cazenove, would be used for "general corporate purposes“.
What does this bond offer? the first one pays 5.5/2 = 2.75% every six months until
November 2017 then it pays the coupon and the par value of $100.
The observed price of the first bond in Datastream was $ 96.28. Find the YTM for the first bond
96

Bond Calculation in Excel:An Example
97
YTM: 6.28%24/07/2008 Year (24/07/08) CF PV15/11/2008 0.31 2.75 2.7015/05/2009 0.81 2.75 2.6215/11/2009 1.31 2.75 2.5415/05/2010 1.81 2.75 2.4615/11/2010 2.31 2.75 2.3915/05/2011 2.81 2.75 2.3215/11/2011 3.31 2.75 2.2515/05/2012 3.81 2.75 2.1815/11/2012 4.31 2.75 2.1215/05/2013 4.81 2.75 2.0515/11/2013 5.31 2.75 1.9915/05/2014 5.81 2.75 1.9315/11/2014 6.31 2.75 1.8715/05/2015 6.81 2.75 1.8215/11/2015 7.31 2.75 1.7615/05/2016 7.81 2.75 1.7115/11/2016 8.31 2.75 1.6615/05/2017 8.81 2.75 1.6115/11/2017 9.31 102.75 58.30
Sum= 96.28

98
Cost of a Bank Loan Formula Kd BL = I(1-t)
Example - Traore has a loan from the bank at 12% per annum. Corporation tax is charged at 30%. What is the cost of debt?
= 8.4%

99
WACC:Formula Two methods 1. Total cost ÷ Total capital
2. Sum of weight x cost
epdkx
V
Ekx
V
Pt)(1kx
V
DWACC
eeppdd kwkwtkwWACC )1(

100
WACC:Example See Excel File

101
Thank You