Embed Size (px)
Citation preview

1
China’s Low-carbon DevelopmentChina’s Low-carbon Development
Xue Jinjun,
Professor at School of Economics, Nagoya University
Chairman of Academic Committee,
Institute of Global Low-carbon Economy (http://iglce.org/)
UNFCCC Conference China Corner: Green Development in China

2
Contents
I. China’s High Carbon EconomyII. A Theory for the Low-carbon
EconomicsIII.China Towards a Low-carbon
EconomyIV.Conclusion

3
1, China’s High Carbon Economy (1) China’s High Growth
Table 1 An International Comparison of High Growth Periods
Countries and Regions Period Years Annual Growth Rate
Japan 1958-73 15 9.71973-88 15 3.61988-93 5 3.0
South Korea 1962-77 15 9.61977-87 10 8.01987-95 8 8.1
Taiwan 1962-77 15 10.11977-87 10 8.71987-95 8 6.6
China 1978-96 18 10.61981-90 10 9.4
1991-2000 10 10.12001-2005 5 9.51978-2008 30 9.0
Source: Economic planning agency of Japan, Asian economy 1996; China Statistics Yearbook 2008.
4
$0
$1,000
$2,000
$3,000
$4,000
$5,000
$6,000
$7,000
$8,000
US$
PPP
Figure 2 GDP Per Capita
2, China’s High Carbon Economy (1) China’s High Growth
Source: IMF , World Economic Outlook 2011. CIA, 2011. World Bank , World Development Indicators 2011.

5
1, China’s High Carbon Economy (2) Export-led growth
Figure 4 Trade Ratio in China [(Export + Import) / GDP]
Source: China Statistics Yearbook 2011.

6
Source: World Bank, Data Base, China.
1, China’s High Carbon Economy (2) Export-led Growth Export and CO2 Emission in China

7
1, China’s High Carbon Economy (3) China’s environment Kuznets Curve – SO2
Source: China Statistics Yearbook 2011.
8
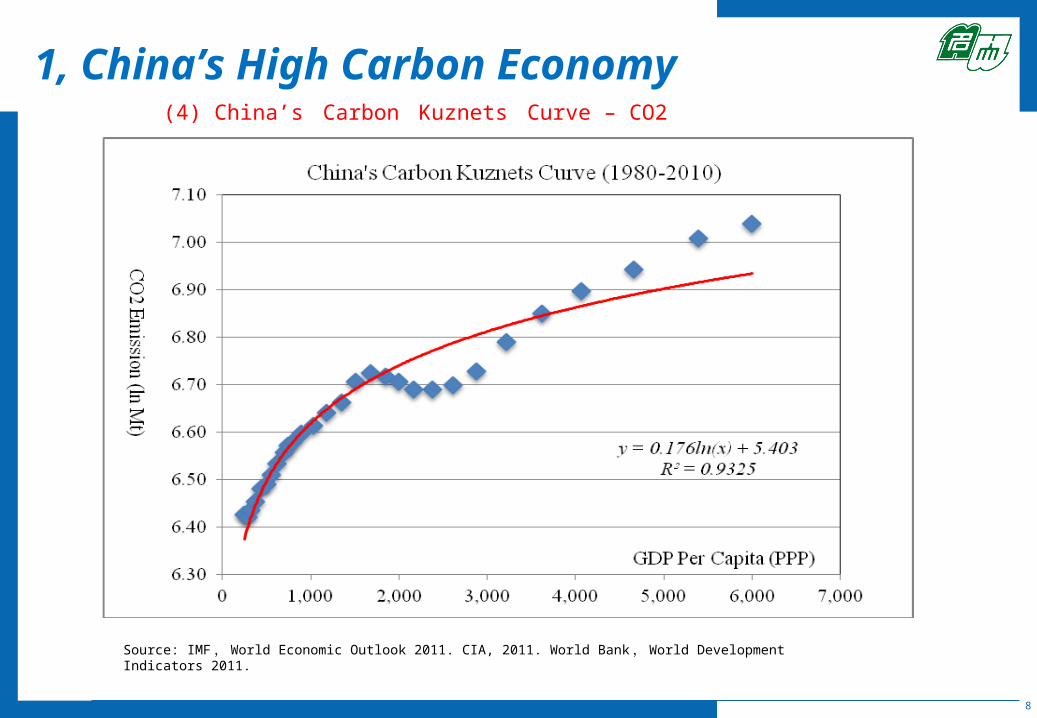
1, China’s High Carbon Economy (4) China’s Carbon Kuznets Curve – CO2
Source: IMF , World Economic Outlook 2011. CIA, 2011. World Bank , World Development Indicators 2011.

9
Ⅰ. China’s High Carbon Economy (6) The world largest carbon emitter
中国, 21.9%
美国, 18.7%
前苏联地区, 8.1%印度,
4.8%
日本, 3.8%
德国, 2.7%
加拿大, 1.8%
世界其他地区, 38.2%
The Shares of China in the worldPopulation: Manufacturing Production
Source: IMF , World Economic Outlook 2011. CIA, 2011. World Bank , World Development Indicators 2011.

10
10
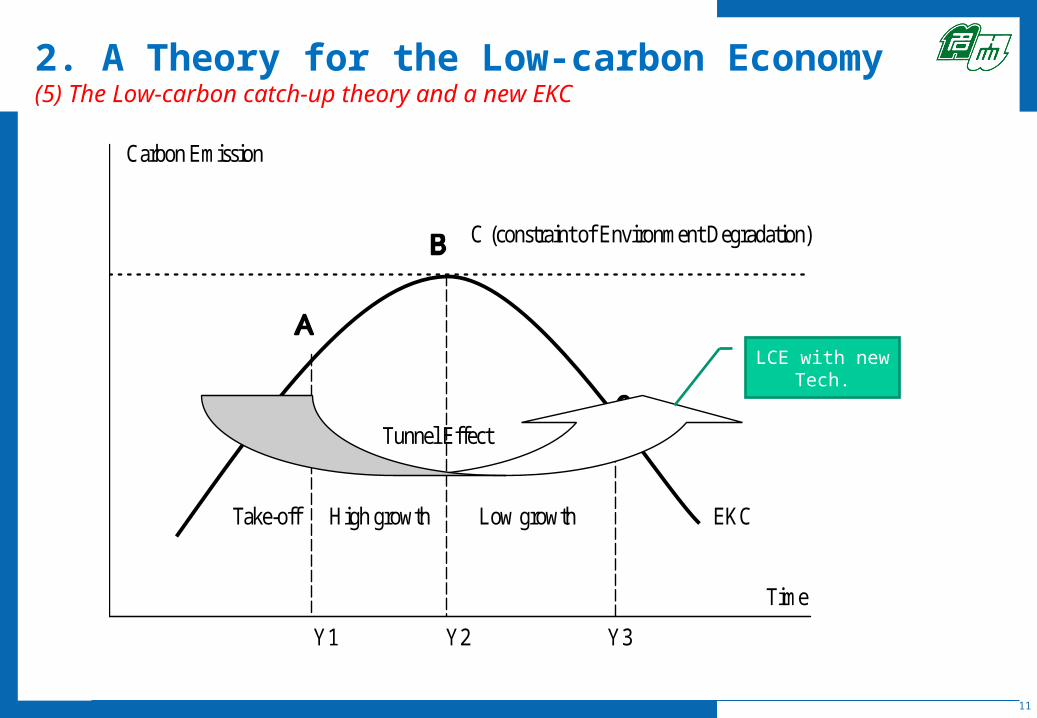
2. A Theory for the Low-carbon Economy (3) Carbon and environment constrained EKC
11
Carbon Emission
C (constraint of Environment Degradation)
Tunnel Effect
Take-off High growth Low growth EKC
Time
Y1 Y2 Y3
2. A Theory for the Low-carbon Economy (5) The Low-carbon catch-up theory and a new EKC
LCE with new Tech.
12
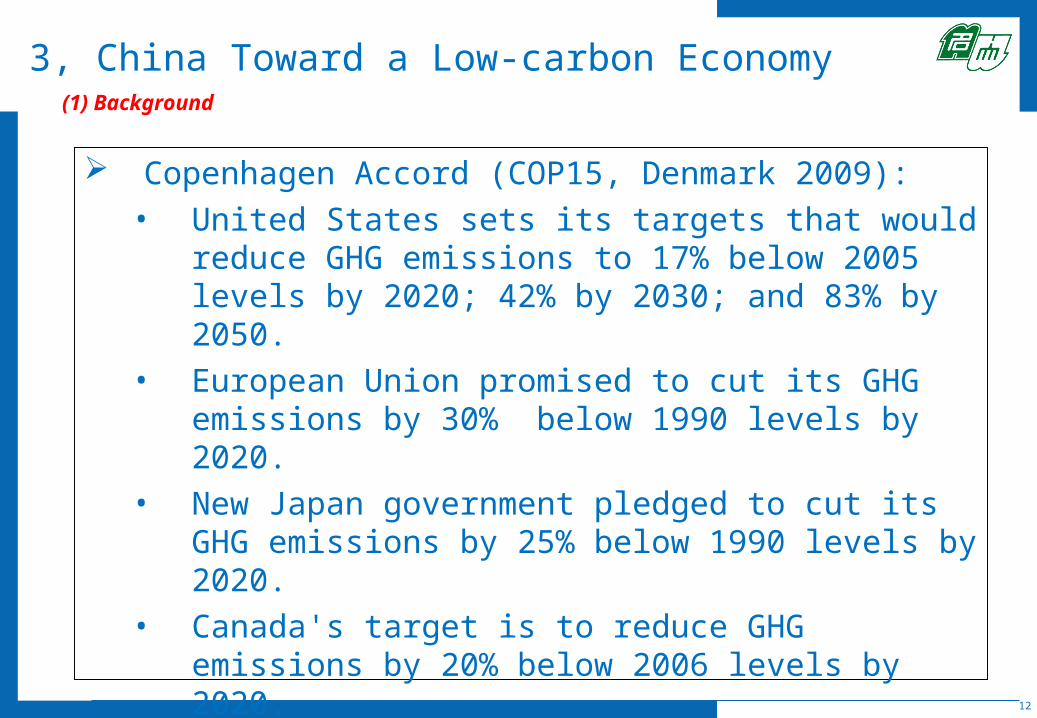
3, China Toward a Low-carbon Economy (1) Background
Copenhagen Accord (COP15, Denmark 2009):
• United States sets its targets that would reduce GHG emissions to 17% below 2005 levels by 2020; 42% by 2030; and 83% by 2050.
• European Union promised to cut its GHG emissions by 30% below 1990 levels by 2020.
• New Japan government pledged to cut its GHG emissions by 25% below 1990 levels by 2020.
• Canada's target is to reduce GHG emissions by 20% below 2006 levels by 2020.
• China announced its intention to reduce the CO2 emissions
intensity within its economy by 40-45% by 2020.

13
13
3. China’ Toward a Low-carbon Economy (2) Decreasing of CO2 Emission Per GDP

14
3, China Toward a Low-carbon Economy (3) Energy Structure in China
Source: China’s Statistical Yearbook, 2011Source: China’s Statistical Yearbook, 2011
15
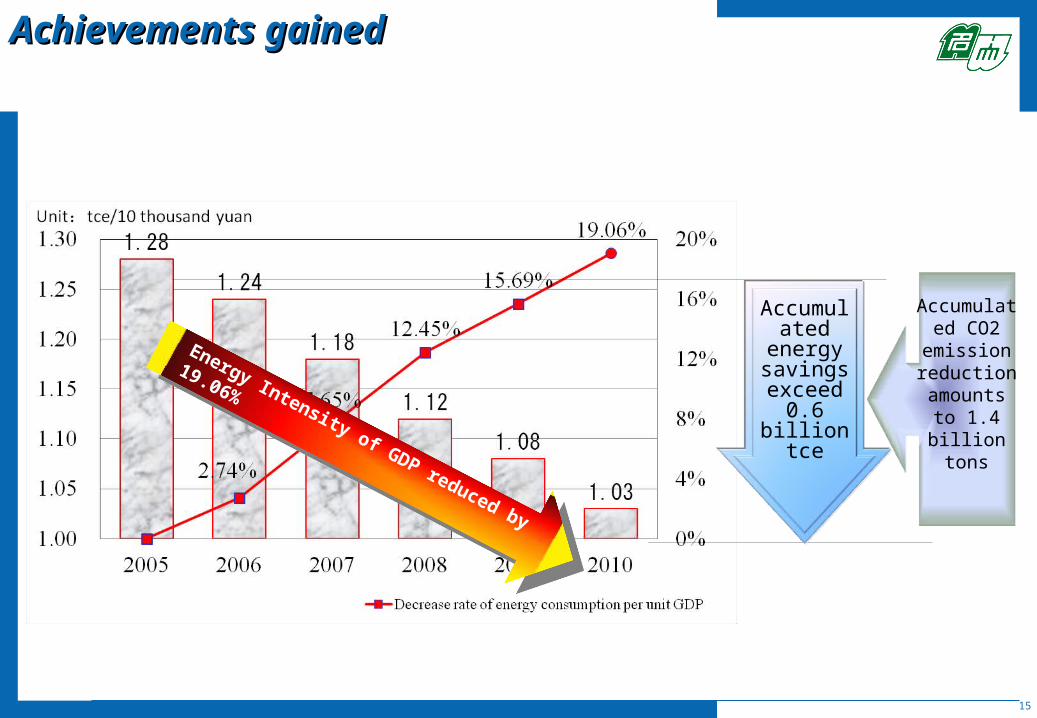
Achievements gainedAchievements gained
Energy Intensity of GDP reduced by 19.06%
Energy Intensity of GDP reduced by 19.06%
Accumulated energy savings
exceed 0.6 billion tce
Accumulated CO2
emission reduction
amounts to 1.4 billion
tons
16
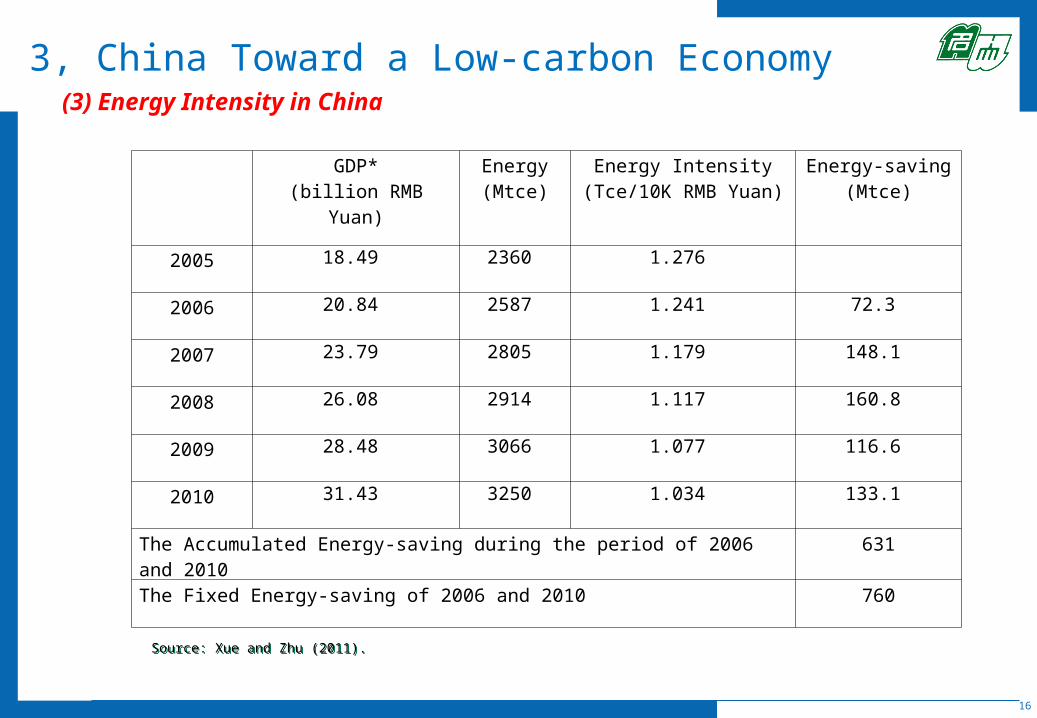
3, China Toward a Low-carbon Economy (3) Energy Intensity in China
Source: Xue and Zhu (2011).Source: Xue and Zhu (2011).
GDP*(billion RMB Yuan)
Energy(Mtce)
Energy Intensity(Tce/10K RMB Yuan)
Energy-saving(Mtce)
2005 18.49 2360 1.276
2006 20.84 2587 1.241 72.3
2007 23.79 2805 1.179 148.1
2008 26.08 2914 1.117 160.8
2009 28.48 3066 1.077 116.6
2010 31.43 3250 1.034 133.1
The Accumulated Energy-saving during the period of 2006 and 2010 631
The Fixed Energy-saving of 2006 and 2010 760

17
3, China Toward a Low-carbon Economy (4) Energy Saving Achievement in the period of the 11th 5-year Plan
Source: Xue and Zhu (2011).Source: Xue and Zhu (2011).
11th FYP Reality status
Annual growth rate of GDP (%) 7.5% 11.2%
GDP in 2005(trillion RMB Yuan) 18.49 18.49
Energy Intensity in 2005(tce/10k RMB Yuan)
1.276 1.276
Improvement Rate of Energy Intensity(%)
20 18.96
GDP in 2010 (based on 2005 constant price, trillion RMB Yuan)
26.55 31.43
Energy Intensity in 2010(tce/10k RMB Yuan)
1.021 1.034
Total fixed energy-savings (Mtce) 678 760
18
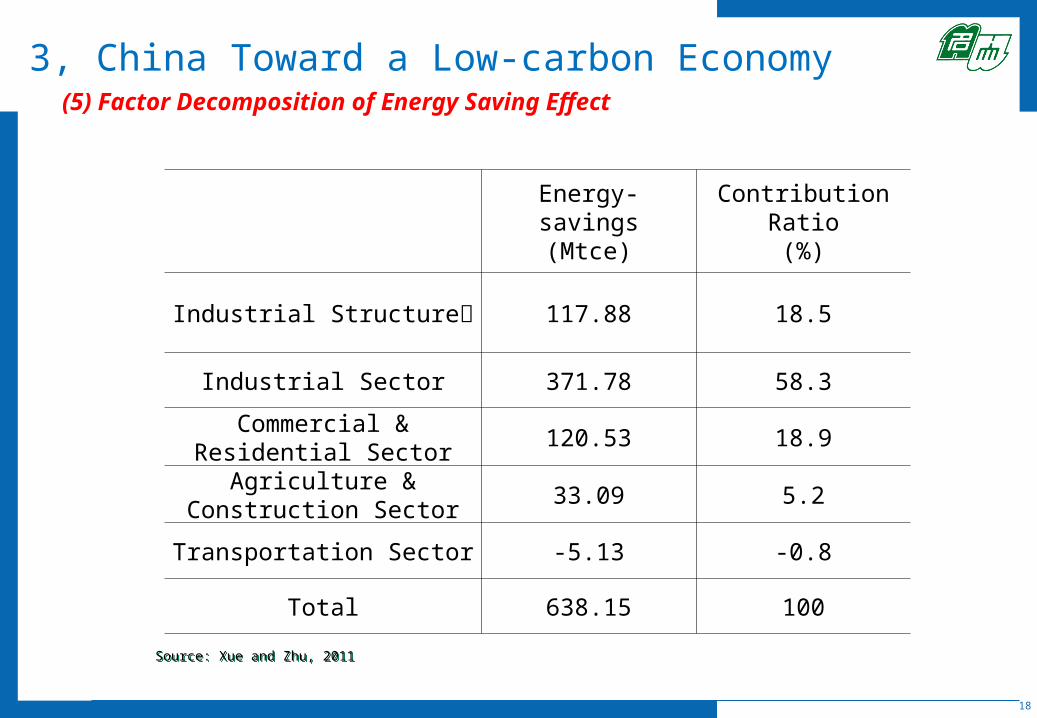
3, China Toward a Low-carbon Economy (5) Factor Decomposition of Energy Saving Effect
Source: Xue and Zhu, 2011Source: Xue and Zhu, 2011
Energy-savings(Mtce)
Contribution Ratio(%)
Industrial Structure﹡ 117.88 18.5
Industrial Sector 371.78 58.3
Commercial & Residential Sector
120.53 18.9
Agriculture & Construction Sector
33.09 5.2
Transportation Sector -5.13 -0.8
Total 638.15 100

19
3, China Toward a Low-carbon Economy (6) Contribution of key policies to carbon intensity improvement of GDP (2005-2009)
Source: Xue and Zhu, 2011Source: Xue and Zhu, 2011

20
Conclusions on decomposition of energy intensity of GDP
• Energy saving due to structural effect mostly comes from structural
adjustment within the secondary sector and tertiary sector
– Structural adjustment among the primary sector, the secondary sector
and the tertiary sector only contribute about 7.9%
Energy-savings
(Mtce)Contribution Rate
(%)
Industrial Structure 1,451 7.9
Internal Secondary Industrial Structure 4,896 26.6
Internal Tertiary Industrial Structure 5,441 29.6
Internal Industry Sector Structure 2,065 11.2
Internal Industry Subsector Structure 4,538 24.7
Total 18,392 100
Energy-saving and its Contributions from Structure Change for 11th FYP
21
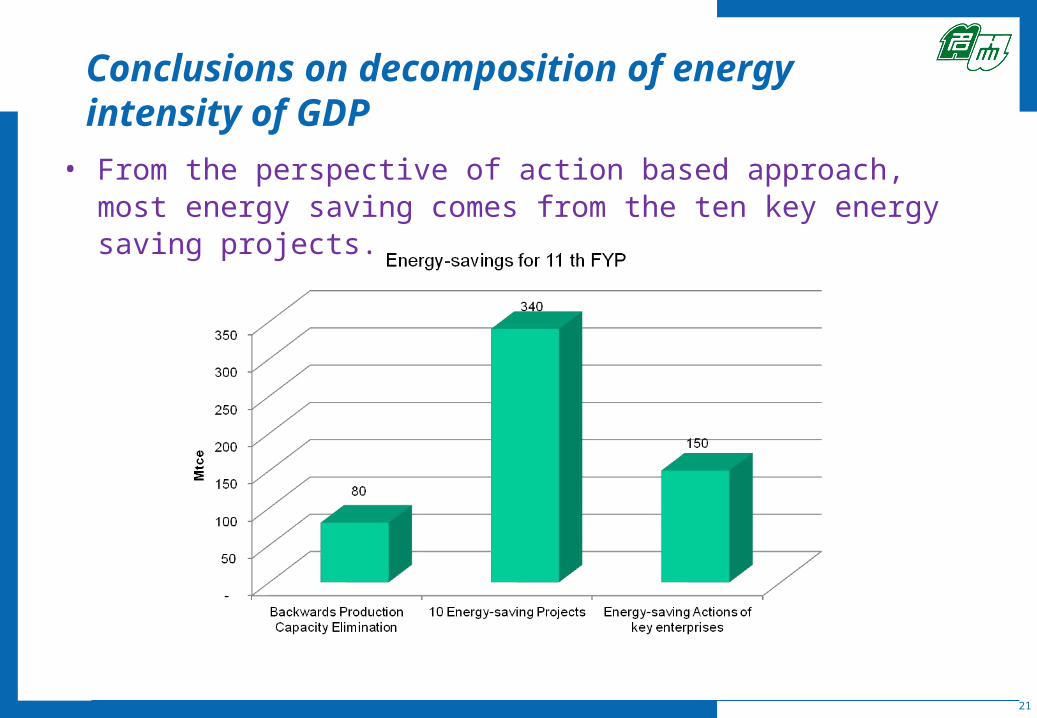
Conclusions on decomposition of energy intensity of GDP
• From the perspective of action based approach, most energy saving comes from the ten key energy saving projects.
22
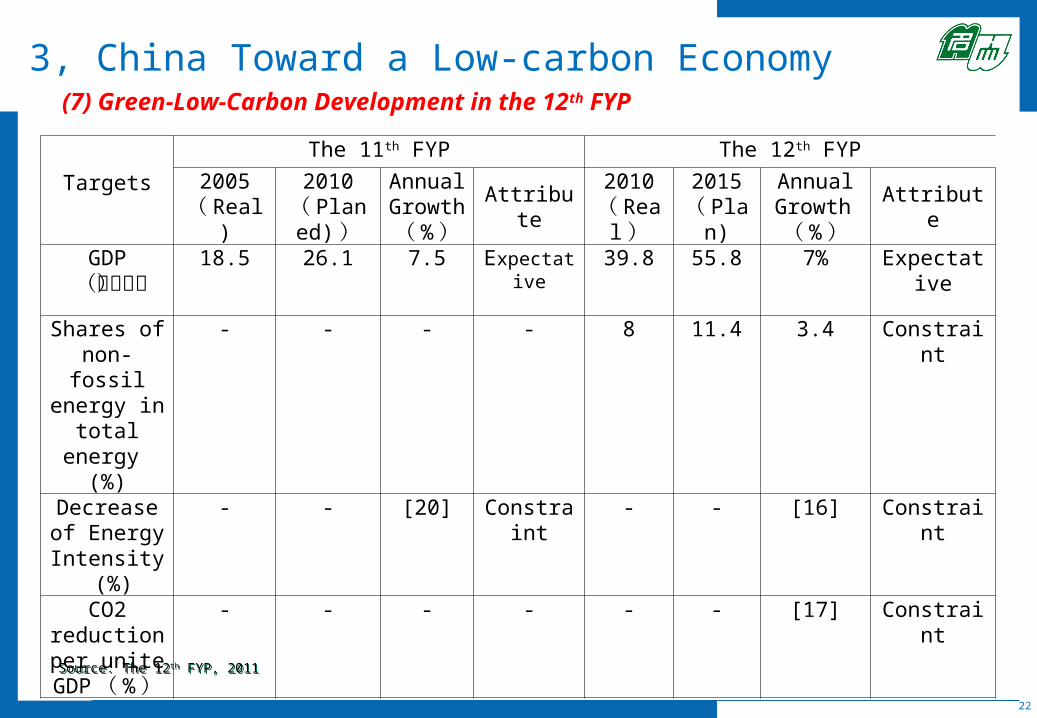
3, China Toward a Low-carbon Economy (7) Green-Low-Carbon Development in the 12th FYP
Source: The 12th FYP, 2011Source: The 12th FYP, 2011
Targets
The 11th FYP The 12th FYP
2005( Real)
2010( Planed
))
Annual Growth ( %)
Attribute2010
( Real)
2015( Plan)
Annual Growth (
%)Attribute
GDP(万亿元)
18.5 26.1 7.5 Expectative 39.8 55.8 7% Expectative
Shares of non-fossil energy in
total energy (%)
- - - - 8 11.4 3.4 Constraint
Decrease of Energy
Intensity (%)
- - [20] Constraint - - [16] Constraint
CO2 reduction per
unite GDP ( %)
- - - - - - [17] Constraint

23
3, China Toward a Low-carbon Economy (8) Non-fossil Energy Development Plan in the 12th FYP
Source: Xuan Xiaowei, 2011Source: Xuan Xiaowei, 2011
Year Share Changes of Non-fossil Energy in total energy consumption (%)
1990 5.1
2000 6.4
2005 6.8
2009 7.8
2015( the 12th FYP) 11.4
2020 ( Planned Targets) 15
Average Annual Changes
1990~2009 0.14
2000~2005 ( 10th FYP) 0.08
2005~2009 ( 11th FYP) 0.25
2009 ~ 2015 ( 12th FYP) 0.60
2015 ~ 2020 ( 13th FYP) 0.72
2005 ~ 2020 0.55
24
China became the second super economic power as well as the largest carbon emitter in the world.
China, as an emerging economy and responsible super power, should take bigger responsibility and act as a leader in carbon emission reduction.
China has been making the biggest contribution to the global worming world issue by actively dealing reducing energy intensity and carbon emissions.
The 12th FYP will lead China to a Green-low-carbon Economy.
4, Conclusion