Embed Size (px)
Citation preview
PBF EnergyNorth East Association of Rail Shippers Fall ConferenceState College, PAOctober 1, 2014
PBF EnergyNorth East Association of Rail Shippers Fall ConferenceState College, PAOctober 1, 2014

2
Safe Harbor StatementsThis presentation contains forward-looking statements made by PBF Energy Inc. and/or PBF Logistics (the “Company” or “Companies”, “PBF” or “PBFX”) and its management. Such statements are based on current expectations, forecasts and projections, including, but not limited to, anticipated financial and operating results, plans, objectives, expectations and intentions that are not historical in nature. Forward-looking statements should not be read as a guarantee of future performance or results, and may not necessarily be accurate indications of the times at, or by which, such performance or results will be achieved. Forward-looking statements are based on information available at the time, and are subject to various risks and uncertainties that could cause the Company’s actual performance or results to differ materially from those expressed in such statements. Factors that could impact such differences include, but are not limited to, changes in general economic conditions; volatility of crude oil and other feedstock prices; fluctuations in the prices of refined products; the impact of disruptions to crude or feedstock supply to any of our refineries, including disruptions due to problems with third party logistics infrastructure; effects of litigation and government investigations; the timing and announcement of any potential acquisitions and subsequent impact of any future acquisitions on our capital structure, financial condition or results of operations; changes or proposed changes in laws or regulations or differing interpretations or enforcement thereof affecting our business or industry, including any lifting by the federal government of the restrictions on exporting U.S. crude oil; actions taken or non-performance by third parties, including suppliers, contractors, operators, transporters and customers; adequacy, availability and cost of capital; work stoppages or other labor interruptions; operating hazards, natural disasters, weather-related delays, casualty losses and other matters beyond our control; inability to complete capital expenditures, or construction projects that exceed anticipated or budgeted amounts; inability to successfully integrate acquired refineries or other acquired businesses or operations; effects of existing and future laws and governmental regulations, including environmental, health and safety regulations; and, various other factors.
Forward-looking statements reflect information, facts and circumstances only as of the date they are made. The Company assumes no responsibility or obligation to update forward-looking statements to reflect actual results, changes in assumptions or changes in other factors affecting forward-looking information after such date.

3
PBF Energy Company Profile
Market capitalization of $2.7 billion and enterprise value of $3.5 billion (1)
Ba3 / BB- credit ratings
Owns three oil refineries in Ohio, Delaware and New Jersey
Aggregate throughput capacity of ~540,000 bpd
Weighted-average Nelson Complexity of 11.3
Access to East Coast rail infrastructure results in the entire system having access to WTI-based, cost advantaged crude supply
PBF's core strategy is to grow and diversify through acquisitions
RegionThroughput Capacity
(bpd) Date AcquiredNelson
Complexity
Mid-continent 170,000 Early 2011 9.2
East Coast 370,000 2010 12.2
Total 540,000 11.3 (2)
___________________________1. As of 8/25/20142. Represents weighted average Nelson Complexity for PBF’s three refineries
Paulsboro
Delaware City
Toledo
PBF is the 5th largest independent refiner

4
PBF Logistics launched its initial public offering on April 30, 2014 and commenced trading on the NYSE on May 9, 2014
Market Cap of ~$800 million as of 9/2/14
PBF Energy owns 50.2% of PBFX, 100% of the GP and IDRs
PBFX’s assets consist of a light crude oil rail unloading terminal at the Delaware City refinery and a crude oil truck unloading terminal at the Toledo refinery
Rail terminal current capacity of 130,000 bpdTruck terminal current capacity of 15,000 bpd
$275 million undrawn revolving credit facility provides flexibility to fund potential acquisitions and organic growth projects
Significant portfolio of logistics assets retained at PBF that support refinery operations
Further information can be found in PBF Logistic’sSEC filings located at www.pbflogistics.com or on the SEC website
PBF Logistics LP Company Profile

5
PBF Logistics – Delaware City Rail Terminal
Light crude oil rail unloading terminal
Supports Delaware City and Paulsboro refineries
Combined refining capacity: 370,000 bpd
Supplies cost-advantaged, WTI-based light crude from Western Canada and U.S. Mid-continent
Current discharge capacity: 130,000 bpd
Double-loop track accommodates up to two 100-car unit trains
Original construction completed: February 2013
Expansion completed: August 2014
100% of NTM forecast revenue secured through MVCs
MVC will increase from 75,000 bpd to 85,000 bpd beginning Q4 2014
Minimal ongoing maintenance capital expenditures
Less than $1.3 million per year
Enhances flexibility and profitability of PBF’s East Coast refining operations
4

6
PBF Logistics – Toledo Truck Terminal
15,000 bpd truck crude unloading facility
Services PBF’s 170,000 bpd Toledo refinery
Primarily receives locally-gathered, cost-advantaged crude
Potential for growth through increased production in nearby shale basins, including Utica Shale in Ohio and New Albany Shale in Illinois
Newly constructed assets
Assets placed into service: Dec. 2012 – June 2014
100% of NTM forecast revenue secured through MVCs
MVC increased from 4,000 to 5,500 barrels per day as of August 1, 2014 due to the addition of two new LACT units
Increase of 1,500 barrels not included in S-1 NTMforecast
Minimal ongoing capital expenditures:
Less than $1 million per year
Critical infrastructure to PBF’s Toledo refinery
IllinoisBasin
AppalachianBasin
NewAlbany
Devonian (Ohio)MarcellusUtica
MichiganBasin
Antrim
ForestCity Basin
Fayetteville
Cherokee Platform
Chattanooga
Source: EIA
Toledo
Current Plays
Prospective Plays
Basins
Shale Plays
Stacked Plays
Intermediate Depth / AgeDeepest / Oldest
Shallowest / Youngest
5

7
Delaware City Heavy Crude Unloading Rack (“West Rack”)
Heavy crude oil rail unloading terminal
Current discharge capacity: 40,000 bpdUnit-train capable, steam and nitrogen equipped to unload heavy crude oil and bitumenConstruction completed and in-service in August 2014
Supplies cost-advantaged, heavy crude and bitumen from Western Canada
In-service date coincides with completion of unit-train capable loading facilities in Canada
100% of NTM forecast revenue secured through MVCsMVC of 40,000 bpd
$2.20 per barrel unloading fee (MVC)
Annual maintenance capex of approximately $1.25 million
No direct commodity price exposure
7
8
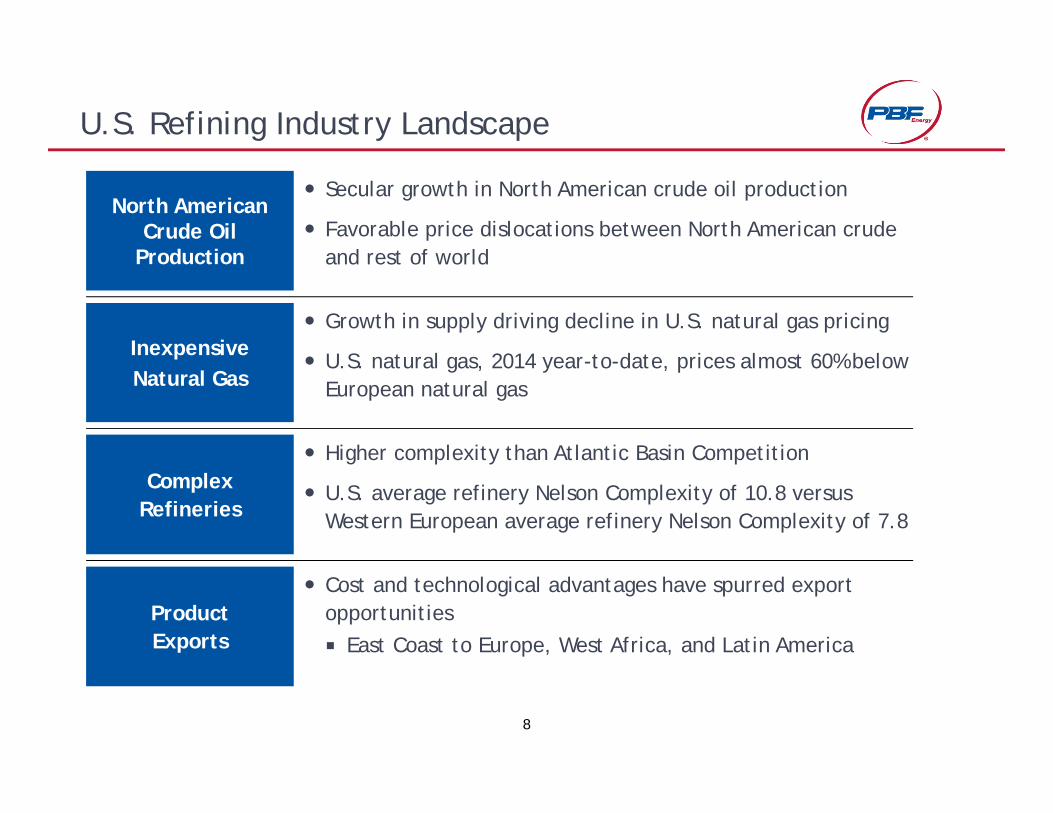
U.S. Refining Industry Landscape
Inexpensive Natural Gas
Growth in supply driving decline in U.S. natural gas pricing
U.S. natural gas, 2014 year-to-date, prices almost 60% below European natural gas
North American Crude Oil
Production
Secular growth in North American crude oil production
Favorable price dislocations between North American crude and rest of world
Complex Refineries
Higher complexity than Atlantic Basin Competition
U.S. average refinery Nelson Complexity of 10.8 versus Western European average refinery Nelson Complexity of 7.8
Product Exports
Cost and technological advantages have spurred export opportunities
East Coast to Europe, West Africa, and Latin America

9
Strong Fundamentals for Industry and PBF
Reached inflection point with growth of domestic crude oil and natural gas in 2010-2011
Bakken crude production has grown over 400% (910 mbpd) from 2010 through 2014
Pushes barrels South (via pipeline and rail), East and West (primarily by rail)
Ultimately displaces USGC imports
Canadian crude production has grown by over 30% (850 mbpd) from 2010 to 2014
Bitumen by rail advantaged versus pipeline transportation of diluted crudes
Low-cost natural gas versus Europe
Proximity to increasing domestic supply such as the Marcellus Shale development
5.2 5.5 8.5 9.0 9.6
2.5 2.8
3.7 3.9 4.9
7.7 8.3
12.2 12.9 14.4
‐2.04.06.08.0
10.012.014.016.0
2005 2010 2014 2015 2020
MMbp
d
US CanadaSource: EIA, CAPP
0
2
4
6
8
10
12
14
16
Jan-08 Jan-09 Jan-10 Jan-11 Jan-12 Jan-13 Jan-14Henry Hub ICE Natural Gas
($/MMBtu)
Source: Bloomberg

10
PBF’s Crude-by-Rail Program
Planned Leased or Owned Railcars
Note: Schedule is subject to change based on current company plans and on current third party railcar manufacturer delivery schedules
East Coast access to cost-advantaged North American crude oil provides optionality
130,000 bpd PBFX-owned light crude oil unloading facility40,000 bpd PBFX-owned heavy crude oil unit-train unloading capacity (“West Rack”)40,000 bpd PBF-owned heavy crude oil unloading capacity
Longer-term focus on logistics Rail services agreements with Norfolk Southern, BNSF, SavageSupply agreement with Continental Resources for BakkenPotential opportunities for participation in logistics projects
2,120 2,347 3,600
1,359 2,221
2,300
-
1,000
2,000
3,000
4,000
5,000
6,000
7,000
2Q14 4Q14 4Q15
Coiled & Insulated General Purpose
5,900
4,658
3,479
PBF will lead the way on rail safety
All crude oil delivered to our Delaware City refinery is transported in the new-style DOT-111A rail cars
PBF supports increased efforts to enhance the safety of rail operations through the use of a modernized rail fleet, improved operating standards, increased rail inspection and maintenance activities to ensure the safe transport of all crude oil and products

11
Major Tankcar User’s Perspective
Buying and leasing – deciding factorsFull service vs. net leaseUnder the tank repairs / wheel life / TaxesCash flow and Fleet diversification for risk managementConsiderations for tankcar repairsFleet utilization and cost including freight implications. Out of service timeTypes of repairs and car suppliers
Commodity shippers know their products. Car suppliers do not accept responsibility for certain components like valves and in some cases tank linings etc.
Advantages and disadvantages of end user of commodities shipped by tank car with no fleet of its own:
Advantage: if the lease market is weak the “delivered” buyer will have a cost advantageDisadvantage: no control = risk. Risk management is key in all facets of commodity trade
Best practices – tank car acquisition and managementReputable suppliers / Zero incidents / cars directly in service / limited warranty claimsCar management – a hybrid of mixed cost management, TVM and best in class personnel and systems

Appendix

1


![g]kfn ;/sf/ pBf]u, jfl)fHo tyf cfklt{ dGqfno pBf]u ljefu](https://img.dokumen.tips/doc/110x75/61ea09ab521d0b376b1d19f2/gkfn-sf-pbfu-jflfho-tyf-cfklt-dgqfno-pbfu-ljefu-.jpg)


![g]kfn ;/sf/ pBf]u dGqfno pBf]u ljefu](https://img.dokumen.tips/doc/110x75/61b4af4c99949b10312c9ada/gkfn-sf-pbfu-dgqfno-pbfu-ljefu.jpg)