Embed Size (px)
Citation preview


HUNTINGTON BANCSHARES INCORPORATEDQuarterly Financial Supplement
December 31, 2018
Table of Contents
Quarterly Key Statistics
Annual Key Statistics
Consolidated Balance Sheets
Loans and Leases Composition
Deposits Composition
Consolidated Quarterly Average Balance Sheets
Consolidated Quarterly Net Interest Margin - Interest Income / Expense
Consolidated Quarterly Net Interest Margin - Yield
Selected Quarterly Income Statement Data
Quarterly Mortgage Banking Income
Quarterly Credit Reserves Analysis
Quarterly Net Charge-Off Analysis
Quarterly Nonaccrual Loans and Leases (NALs) and Nonperforming Assets (NPAs)
Quarterly Accruing Past Due Loans and Leases and Accruing and Nonaccruing Troubled Debt Restructured Loans
Quarterly Capital Under Current Regulatory Standards (Basel III) and Other Capital Data
Quarterly Common Stock Summary, Non-Regulatory Capital, and Other Data
Consolidated Annual Average Balance Sheets
Consolidated Annual Net Interest Margin - Interest Income / Expense
Consolidated Annual Net Interest Margin - Yield
Selected Annual Income Statement Data
Annual Mortgage Banking Income
Annual Credit Reserves Analysis
Annual Net Charge-Off Analysis
Annual Nonaccrual Loans and Leases (NALs) and Nonperforming Assets (NPAs)
Annual Accruing Past Due Loans and Leases and Accruing and Nonaccruing Troubled Debt Restructured Loans
1
2
4
5
6
7
8
9
10
11
12
13
14
15
16
17
18
19
20
21
22
23
24
25
26

Notes:
The preparation of financial statement data in conformity with accounting principles generally accepted in the United States (GAAP) requires management to make estimates and assumptions that affect amounts reported. Actual results could differ from those estimates. Certain prior period amounts have been reclassified to conform to the current period’s presentation.
Fully-Taxable Equivalent Basis
Interest income, yields, and ratios on a FTE basis are considered non-GAAP financial measures. Management believes net interest income on a FTE basis provides a more accurate picture of the interest margin for comparison purposes. The FTE basis also allows management to assess the comparability of revenue arising from both taxable and tax-exempt sources. The FTE basis assumes a federal statutory tax rate of 21 percent and 35 percent for periods prior to January 1, 2018.
Non-Regulatory Capital Ratios
In addition to capital ratios defined by banking regulators, the Company considers various other measures when evaluating capital utilization and adequacy, including:
• Tangible common equity to tangible assets, and
• Tangible common equity to risk-weighted assets using Basel III definition.
These non-regulatory capital ratios are viewed by management as useful additional methods of reflecting the level of capital available to withstand unexpected market conditions. Additionally, presentation of these ratios allows readers to compare the Company’s capitalization to other financial services companies. These ratios differ from capital ratios defined by banking regulators principally in that the numerator excludes preferred securities, the nature and extent of which varies among different financial services companies. These ratios are not defined in GAAP or federal banking regulations. As a result, these non-regulatory capital ratios disclosed by the Company may be considered non-GAAP financial measures.
Because there are no standardized definitions for these non-regulatory capital ratios, the Company’s calculation methods may differ from those used by other financial services companies. Also, there may be limits in the usefulness of these measures to investors. As a result, the Company encourages readers to consider the consolidated financial statements and other financial information contained in the related press release in their entirety, and not to rely on any single financial measure.

1
Huntington Bancshares IncorporatedQuarterly Key Statistics(1)(Unaudited)
Three Months Ended(dollar amounts in millions, except per data, share count inthousands)
December 31, September December 31, Percent Changes vs.2018 2018 2017 3Q18 4Q17
Net interest income(3) $ 841 $ 810 $ 782 4 % 8 %FTE adjustment (8) (8) (12) — 33Net interest income 833 802 770 4 8Provision for credit losses 60 53 65 13 (8)Noninterest income 329 342 340 (4) (3)Noninterest expense 711 651 633 9 12Income before income taxes 391 440 412 (11) (5)Provision for income taxes 57 62 (20) (8) 385Net income 334 378 432 (12) (23)Dividends on preferred shares 19 18 19 6 —Net income applicable to common shares $ 315 $ 360 $ 413 (13)% (24)%
Net income per common share - diluted $ 0.29 $ 0.33 $ 0.37 (12)% (22)%Cash dividends declared per common share 0.14 0.14 0.11 — 27Tangible book value per common share at end of period 7.34 7.06 6.97 4 5Number of common shares repurchased 14,967 43,670 9,785 (66) 53Average common shares - basic 1,054,460 1,084,536 1,077,397 (3) (2)Average common shares - diluted 1,073,055 1,103,740 1,130,117 (3) (5)Ending common shares outstanding 1,046,767 1,061,529 1,072,027 (1) (2)Return on average assets 1.25% 1.42% 1.67%Return on average common shareholders’ equity 12.9 14.3 17.0Return on average tangible common shareholders’ equity(2) 17.3 19.0 22.7Net interest margin(3) 3.41 3.32 3.30Efficiency ratio(4) 58.7 55.3 54.9Effective tax rate 14.6 14.1 (4.8)Average total assets $ 105,877 $ 105,355 $ 102,302 — 3Average earning assets 97,752 96,753 93,937 1 4Average loans and leases 73,822 72,751 68,940 1 7Average loans and leases - linked quarter annualized growthrate 5.9% 4.8% 3.9%Average total deposits $ 82,931 $ 81,498 $ 77,737 2 7Average core deposits(5) 79,078 77,680 73,946 2 7Average core deposits - linked quarter annualized growthrate 7.2% 12.2% 2.2%Average shareholders’ equity 10,889 11,156 10,677 (2) 2Average common total shareholders' equity 9,686 9,953 9,606 (3) 1Average tangible common shareholders' equity 7,460 7,713 7,383 (3) 1Total assets at end of period 108,781 105,652 104,185 3 4Total shareholders’ equity at end of period 11,102 10,934 10,814 2 3
NCOs as a % of average loans and leases 0.27% 0.16% 0.24%NAL ratio 0.45 0.50 0.50NPA ratio(6) 0.52 0.55 0.55Allowance for loan and lease losses (ALLL) as a % of totalloans and leases at the end of period 1.03 1.04 0.99Common equity tier 1 risk-based capital ratio(7) 9.65 9.89 10.01Tangible common equity / tangible asset ratio(8) 7.21 7.25 7.34
See Notes to the Year to Date and Quarterly Key Statistics.

2
Huntington Bancshares IncorporatedAnnual Key Statistics(1)(Unaudited)
Year Ended December 31, Change(dollar amounts in millions, except per data, share count in thousands) 2018 2017 Amount PercentNet interest income(3) $ 3,219 $ 3,052 $ 167 5%FTE adjustment (30) (50) 20 40Net interest income 3,189 3,002 187 6Provision for credit losses 235 201 34 17Noninterest income 1,321 1,307 14 1Noninterest expense 2,647 2,714 (67) (2)Income before income taxes 1,628 1,394 234 17Provision for income taxes 235 208 27 13Net Income 1,393 1,186 207 17Dividends on preferred shares 70 76 (6) (8)Net income applicable to common shares $ 1,323 $ 1,110 $ 213 19%
Net income per common share - diluted $ 1.20 $ 1.00 $ 0.20 20%Cash dividends declared per common share 0.50 0.35 0.15 43
Average common shares - basic 1,081,542 1,084,686 (3,144) —Average common shares - diluted 1,105,985 1,136,186 (30,201) (3)
Return on average assets 1.33% 1.17%Return on average common shareholders’ equity 13.4 11.6Return on average tangible common shareholders’ equity(2) 17.9 15.7Net interest margin(3) 3.33 3.30Efficiency ratio(4) 56.9 60.9Effective tax rate 14.5 14.9
Average total assets $ 104,982 $ 101,021 $ 3,961 4Average earning assets 96,577 92,423 4,154 4Average loans and leases 72,246 67,891 4,355 6Average total deposits 80,186 76,950 3,236 4Average core deposits(5) 76,403 72,830 3,573 5Average shareholders’ equity 11,059 10,611 448 4Average common total shareholders' equity 9,891 9,539 352 4Average tangible common shareholders' equity 7,647 7,304 343 5
NCOs as a % of average loans and leases 0.20% 0.23%NAL ratio 0.45 0.50NPA ratio(6) 0.52 0.55
See Notes to the Annual and Quarterly Key Statistics.

3
Key Statistics Footnotes
(1) Comparisons for certain presented periods are impacted by a number of factors. Refer to Significant Items.
(2) Net income applicable to common shares excluding expense for amortization of intangibles for the period divided by average tangible common shareholders’ equity. Average tangible common shareholders’ equity equals average total common shareholders’ equity less average intangible assets and goodwill. Expense for amortization of intangibles and average intangible assets are net of deferred tax liability, and calculated assuming a 21% tax rate and a 35% tax rate for periods prior to December 31, 2017.
(3) On a fully-taxable equivalent (FTE) basis assuming a 21% tax rate and a 35% tax rate for periods prior to January 1, 2018.
(4) Noninterest expense less amortization of intangibles divided by the sum of FTE net interest income and noninterest income excluding securities gains (losses).
(5) Includes noninterest-bearing and interest-bearing demand deposits, money market deposits, savings and other domestic deposits, and core certificates of deposit.
(6) NPAs include other real estate owned.
(7) December 31, 2018, figures are estimated.
(8) Tangible common equity (total common equity less goodwill and other intangible assets) divided by tangible assets (total assets less goodwill and other intangible assets). Other intangible assets are net of deferred tax liability, calculated at a 21% tax rate.

4
Huntington Bancshares IncorporatedConsolidated Balance Sheets
December 31, December 31,
(dollar amounts in millions) 2018 2017 Percent Changes
(Unaudited)Assets
Cash and due from banks $ 1,108 $ 1,212 (9)%Interest-bearing deposits in Federal Reserve Bank 1,564 308 408Interest-bearing deposits in banks 53 47 13Trading account securities 105 86 22Available-for-sale securities 13,780 14,869 (7)Held-to-maturity securities 8,565 9,091 (6)Other securities 565 600 (6)Loans held for sale 804 488 65
Loans and leases(1) 74,900 70,117 7Allowance for loan and lease losses (772) (691) (12)
Net loans and leases 74,128 69,426 7Bank owned life insurance 2,507 2,466 2Premises and equipment 790 864 (9)Goodwill 1,989 1,993 —Service rights and other intangible assets 535 584 (8)Other assets 2,288 2,151 6
Total assets $ 108,781 $ 104,185 4 %
Liabilities and shareholders’ equityLiabilities
Deposits(2) $ 84,774 $ 77,041 10 %Short-term borrowings 2,017 5,056 (60)Long-term debt 8,625 9,206 (6)Other liabilities 2,263 2,068 9
Total liabilities 97,679 93,371 5
Shareholders' equityPreferred stock 1,203 1,071 12Common stock 11 11 —Capital surplus 9,181 9,707 (5)Less treasury shares, at cost (45) (35) (29)Accumulated other comprehensive loss (609) (528) (15)Retained earnings (deficit) 1,361 588 131
Total shareholders’ equity 11,102 10,814 3Total liabilities and shareholders’ equity $ 108,781 $ 104,185 4 %
Common shares authorized (par value of $0.01) 1,500,000,000 1,500,000,000Common shares issued 1,050,584,637 1,075,294,946Common shares outstanding 1,046,767,252 1,072,026,681Treasury shares outstanding 3,817,385 3,268,265Preferred stock, authorized shares 6,617,808 6,617,808Preferred shares issued 2,707,571 2,702,571Preferred shares outstanding 740,500 1,098,006
(1) See page 5 for detail of loans and leases.(2) See page 6 for detail of deposits.

5
Huntington Bancshares IncorporatedLoans and Leases Composition(Unaudited)
December 31, September 30, June 30, March 31, December 31,(dollar amounts in millions) 2018 2018 2018 2018 2017Ending Balances by Type:Total loans
Commercial:Commercial and industrial $ 30,605 41% $ 29,196 40% $ 28,850 40% $ 28,622 40% $ 28,107 40%Commercial real estate:
Construction 1,185 2 1,111 2 1,083 1 1,167 2 1,217 2Commercial 5,657 8 5,962 8 6,118 8 6,245 9 6,008 9
Commercial real estate 6,842 10 7,073 10 7,201 9 7,412 11 7,225 11Total commercial 37,447 51 36,269 50 36,051 49 36,034 51 35,332 51Consumer:
Automobile 12,429 16 12,375 17 12,390 17 12,146 17 12,100 17Home equity 9,722 13 9,850 13 9,907 14 9,987 14 10,099 14Residential mortgage 10,728 14 10,459 14 10,006 14 9,357 13 9,026 13RV and marine finance 3,254 4 3,152 4 2,846 4 2,549 3 2,438 3Other consumer 1,320 2 1,265 2 1,206 2 1,090 2 1,122 2
Total consumer 37,453 49 37,101 50 36,355 51 35,129 49 34,785 49Total loans and leases $ 74,900 100% $ 73,370 100% $ 72,406 100% $ 71,163 100% $ 70,117 100%
December 31, September 30, June 30, March 31, December 31,(dollar amounts in millions) 2018 2018 2018 2018 2017Ending Balances by Business Segment:Consumer and Business Banking $ 22,333 30% $ 22,271 30% $ 21,888 30% $ 21,471 31% $ 21,379 31%Commercial Banking 27,191 36 26,465 36 26,373 36 26,311 37 25,767 37Vehicle Finance 19,434 26 18,880 26 18,569 26 18,090 25 17,818 25RBHPCG 5,886 8 5,734 8 5,527 8 5,227 7 5,145 7Treasury / Other 56 — 20 — 49 — 64 — 8 —Total loans and leases $ 74,900 100% $ 73,370 100% $ 72,406 100% $ 71,163 100% $ 70,117 100%
Average Balances by Business Segment:Consumer and Business Banking $ 22,321 30% $ 22,049 30% $ 21,653 31% $ 21,429 31% $ 21,096 31%Commercial Banking 26,405 36 26,322 36 26,505 37 25,969 37 25,208 37Vehicle Finance 19,177 26 18,640 26 18,280 25 17,814 25 17,497 25RBHPCG 5,793 8 5,641 8 5,355 7 5,181 7 5,071 7Treasury / Other 126 — 99 — 94 — 91 — 68 —Total loans and leases $ 73,822 100% $ 72,751 100% $ 71,887 100% $ 70,484 100% $ 68,940 100%

6
Huntington Bancshares IncorporatedDeposits Composition(Unaudited)
December 31, September 30, June 30, March 31, December 31,(dollar amounts in millions) 2018 2018 2018 2018 2017Ending Balances by Type:
Demand deposits - noninterest-bearing $ 21,783 26% $ 19,863 24% $ 20,353 26% $ 20,807 26% $ 21,546 28%Demand deposits - interest-bearing 20,042 24 19,615 24 19,026 24 19,337 25 18,001 23Money market deposits 22,721 27 21,411 26 20,990 26 20,849 26 20,690 27Savings and other domesticdeposits 10,451 12 11,604 14 10,987 14 11,291 14 11,270 15Core certificates of deposit 5,924 7 5,358 7 4,402 6 3,157 4 1,934 3
Total core deposits 80,921 96 77,851 95 75,758 96 75,441 95 73,441 96Other domestic deposits of $250,000 ormore 337 — 318 1 265 — 228 — 239 —Brokered deposits and negotiable CDs 3,516 4 3,520 4 3,564 4 3,802 5 3,361 4
Total deposits $ 84,774 100% $ 81,689 100% $ 79,587 100% $ 79,471 100% $ 77,041 100%Total core deposits:
Commercial $ 37,268 46% $ 35,455 46% $ 34,094 45% $ 34,615 46% $ 34,273 47%Consumer 43,653 54 42,396 54 41,664 55 40,826 54 39,168 53
Total core deposits $ 80,921 100% $ 77,851 100% $ 75,758 100% $ 75,441 100% $ 73,441 100%Ending Balances by Business Segment:Consumer and Business Banking $ 50,300 59% $ 49,434 61% $ 48,186 60% $ 47,124 59% $ 45,643 59%Commercial Banking 23,184 28 22,288 27 21,142 27 21,838 28 21,235 28Vehicle Finance 346 — 348 — 340 — 345 — 358 —RBHPCG 6,809 8 5,783 7 5,985 8 6,053 8 6,057 8Treasury / Other(1) 4,135 5 3,836 5 3,934 5 4,111 5 3,748 5Total deposits $ 84,774 100% $ 81,689 100% $ 79,587 100% $ 79,471 100% $ 77,041 100%
December 31, September 30, June 30, March 31, December 31,(dollar amounts in millions) 2018 2018 2018 2018 2017Average Balances by Business Segment:Consumer and Business Banking $ 50,037 61% $ 48,659 60% $ 47,242 60% $ 45,310 59% $ 45,625 59%Commercial Banking 22,673 27 22,823 28 21,671 27 21,679 28 22,118 28Vehicle Finance 335 — 337 — 328 — 349 — 323 —RBHPCG 5,936 7 5,694 7 5,947 8 5,873 8 5,851 8Treasury / Other(1) 3,950 5 3,985 5 4,102 5 3,735 5 3,820 5Total deposits $ 82,931 100% $ 81,498 100% $ 79,290 100% $ 76,946 100% $ 77,737 100%
(1) Comprised primarily of national market deposits.

7
Huntington Bancshares IncorporatedConsolidated Quarterly Average Balance Sheets(Unaudited)
Quarterly Average Balances (1)December 31, September 30, June 30, March 31, December 31, Percent Changes vs.
(dollar amounts in millions) 2018 2018 2018 2018 2017 3Q18 4Q17
AssetsInterest-bearing deposits in Federal Reserve Bank (2) $ 483 $ — $ — $ — $ — 100% 100 %Interest-bearing deposits in banks 97 83 84 90 90 17 8Securities:
Trading account securities 131 82 82 87 87 60 51Available-for-sale securities:
Taxable 10,351 10,469 10,832 11,158 11,154 (1) (7)Tax-exempt 3,176 3,496 3,554 3,633 3,404 (9) (7)
Total available-for-sale securities 13,527 13,965 14,386 14,791 14,558 (3) (7)Held-to-maturity securities - taxable 8,433 8,560 8,706 8,877 9,066 (1) (7)Other securities 565 567 599 605 598 — (6)
Total securities 22,656 23,174 23,773 24,360 24,309 (2) (7)Loans held for sale 694 745 619 478 598 (7) 16Loans and leases:(3)
Commercial:Commercial and industrial 29,557 28,870 28,863 28,243 27,445 2 8Commercial real estate:
Construction 1,138 1,132 1,126 1,189 1,199 1 (5)Commercial 5,806 6,019 6,233 6,142 5,997 (4) (3)
Commercial real estate 6,944 7,151 7,359 7,331 7,196 (3) (4)Total commercial 36,501 36,021 36,222 35,574 34,641 1 5Consumer:
Automobile 12,423 12,368 12,271 12,100 11,963 — 4Home equity 9,817 9,873 9,941 10,040 10,027 (1) (2)Residential mortgage 10,574 10,236 9,624 9,174 8,809 3 20RV and marine finance 3,216 3,016 2,667 2,481 2,405 7 34Other consumer 1,291 1,237 1,162 1,115 1,095 4 18
Total consumer 37,321 36,730 35,665 34,910 34,299 2 9Total loans and leases 73,822 72,751 71,887 70,484 68,940 1 7Allowance for loan and lease losses (777) (759) (742) (709) (688) (2) (13)Net loans and leases 73,045 71,992 71,145 69,775 68,252 1 7Total earning assets 97,752 96,753 96,363 95,412 93,937 1 4Cash and due from banks 909 1,330 1,283 1,217 1,226 (32) (26)Intangible assets 2,288 2,305 2,318 2,332 2,346 (1) (2)All other assets 5,705 5,726 5,599 5,596 5,481 — 4
Total assets $ 105,877 $ 105,355 $ 104,821 $ 103,848 $ 102,302 —% 3 %Liabilities and shareholders’ equity
Deposits:Demand deposits - noninterest-bearing 20,384 20,230 20,382 20,572 21,745 1% (6)%Demand deposits - interest-bearing 19,860 19,553 19,121 18,630 18,175 2 9Total demand deposits 40,244 39,783 39,503 39,202 39,920 1 1Money market deposits 22,595 21,547 20,943 20,678 20,731 5 9Savings and other domestic deposits 10,534 11,434 11,146 11,219 11,348 (8) (7)Core certificates of deposit 5,705 4,916 3,794 2,293 1,947 16 193
Total core deposits 79,078 77,680 75,386 73,392 73,946 2 7Other domestic deposits of $250,000 or more 346 285 243 247 400 21 (14)Brokered deposits and negotiable CDs 3,507 3,533 3,661 3,307 3,391 (1) 3Total deposits 82,931 81,498 79,290 76,946 77,737 2 7Short-term borrowings 1,006 1,732 3,082 5,228 2,837 (42) (65)Long-term debt 8,871 8,915 9,225 8,958 9,232 — (4)Total interest-bearing liabilities 72,424 71,915 71,215 70,560 68,061 1 6All other liabilities 2,180 2,054 1,891 1,861 1,819 6 20Shareholders’ equity 10,889 11,156 11,333 10,855 10,677 (2) 2
Total liabilities and shareholders’ equity $ 105,877 $ 105,355 $ 104,821 $ 103,848 $ 102,302 —% 3 %(1) Amounts include the effects of hedge and risk management activities associated with the respective asset and liability categories.(2) Deposits in Federal Reserve Bank were treated as nonearning assets prior to 4Q 2018. (3) Amounts include the effects of hedge and risk management activities associated with the respective asset and liability categories.
8
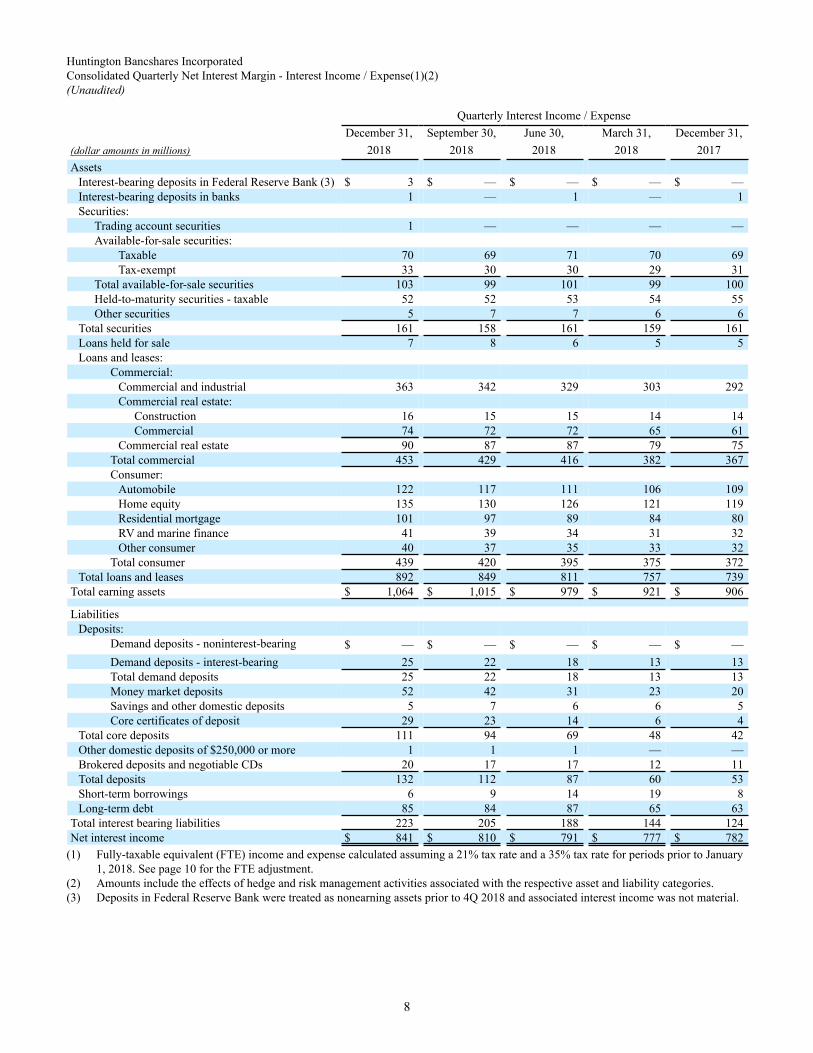
Huntington Bancshares IncorporatedConsolidated Quarterly Net Interest Margin - Interest Income / Expense(1)(2)(Unaudited)
Quarterly Interest Income / ExpenseDecember 31, September 30, June 30, March 31, December 31,
(dollar amounts in millions) 2018 2018 2018 2018 2017Assets
Interest-bearing deposits in Federal Reserve Bank (3) $ 3 $ — $ — $ — $ —Interest-bearing deposits in banks 1 — 1 — 1Securities:
Trading account securities 1 — — — —Available-for-sale securities:
Taxable 70 69 71 70 69Tax-exempt 33 30 30 29 31
Total available-for-sale securities 103 99 101 99 100Held-to-maturity securities - taxable 52 52 53 54 55Other securities 5 7 7 6 6
Total securities 161 158 161 159 161Loans held for sale 7 8 6 5 5Loans and leases:
Commercial:Commercial and industrial 363 342 329 303 292Commercial real estate:
Construction 16 15 15 14 14Commercial 74 72 72 65 61
Commercial real estate 90 87 87 79 75Total commercial 453 429 416 382 367Consumer:
Automobile 122 117 111 106 109Home equity 135 130 126 121 119Residential mortgage 101 97 89 84 80RV and marine finance 41 39 34 31 32Other consumer 40 37 35 33 32
Total consumer 439 420 395 375 372Total loans and leases 892 849 811 757 739
Total earning assets $ 1,064 $ 1,015 $ 979 $ 921 $ 906
LiabilitiesDeposits:
Demand deposits - noninterest-bearing $ — $ — $ — $ — $ —Demand deposits - interest-bearing 25 22 18 13 13Total demand deposits 25 22 18 13 13Money market deposits 52 42 31 23 20Savings and other domestic deposits 5 7 6 6 5Core certificates of deposit 29 23 14 6 4
Total core deposits 111 94 69 48 42Other domestic deposits of $250,000 or more 1 1 1 — —Brokered deposits and negotiable CDs 20 17 17 12 11Total deposits 132 112 87 60 53Short-term borrowings 6 9 14 19 8Long-term debt 85 84 87 65 63
Total interest bearing liabilities 223 205 188 144 124Net interest income $ 841 $ 810 $ 791 $ 777 $ 782
(1) Fully-taxable equivalent (FTE) income and expense calculated assuming a 21% tax rate and a 35% tax rate for periods prior to January 1, 2018. See page 10 for the FTE adjustment.
(2) Amounts include the effects of hedge and risk management activities associated with the respective asset and liability categories. (3) Deposits in Federal Reserve Bank were treated as nonearning assets prior to 4Q 2018 and associated interest income was not material.

9
Huntington Bancshares IncorporatedConsolidated Quarterly Net Interest Margin - Yield(Unaudited)
Quarterly Average Rates(2)December 31, September 30, June 30, March 31, December 31,
Fully-taxable equivalent basis(1) 2018 2018 2018 2018 2017Assets
Interest-bearing deposits in Federal Reserve Bank (2) 2.33% —% —% —% —%Interest-bearing deposits in banks 1.97 1.95 1.95 1.97 1.92Securities:
Trading account securities 1.94 0.26 0.23 0.15 0.21Available-for-sale securities:
Taxable 2.71 2.61 2.63 2.51 2.45Tax-exempt 4.12 3.53 3.35 3.18 3.76
Total available-for-sale securities 3.04 2.84 2.81 2.67 2.75Held-to-maturity securities - taxable 2.45 2.43 2.42 2.45 2.41Other securities 4.24 4.58 4.58 3.98 3.86
Total securities 2.84 2.73 2.71 2.62 2.64Loans held for sale 4.04 4.45 4.17 3.82 3.68Loans and leases:(4)
Commercial:Commercial and industrial 4.81 4.64 4.52 4.28 4.17Commercial real estate:
Construction 5.47 5.31 5.26 4.73 4.47Commercial 4.99 4.63 4.58 4.24 4.03
Commercial real estate 5.07 4.74 4.68 4.32 4.10Total commercial 4.86 4.66 4.55 4.29 4.15Consumer:
Automobile 3.88 3.75 3.63 3.56 3.61Home equity 5.45 5.21 5.09 4.90 4.71Residential mortgage 3.82 3.78 3.69 3.66 3.66RV and marine finance 5.10 5.06 5.11 5.11 5.25Other consumer 12.35 12.16 11.90 11.78 11.53
Total consumer 4.67 4.54 4.43 4.34 4.31Total loans and leases 4.76 4.60 4.49 4.32 4.23
Total earning assets 4.34 4.16 4.07 3.91 3.83Liabilities
Deposits:Demand deposits - noninterest-bearing — — — — —Demand deposits - interest-bearing 0.48 0.45 0.38 0.29 0.26Total demand deposits 0.24 0.22 0.18 0.14 0.12Money market deposits 0.91 0.77 0.60 0.45 0.40Savings and other domestic deposits 0.23 0.24 0.21 0.20 0.20Core certificates of deposit 2.00 1.82 1.56 1.01 0.75
Total interest-bearing core deposits 0.75 0.65 0.51 0.36 0.32Other domestic deposits of $250,000 or more 1.67 1.40 1.01 0.69 0.54Brokered deposits and negotiable CDs 2.22 1.98 1.81 1.47 1.21Total interest-bearing deposits 0.84 0.73 0.59 0.43 0.37Short-term borrowings 2.49 1.98 1.82 1.47 1.15Long-term debt 3.82 3.78 3.75 2.92 2.73
Total interest-bearing liabilities 1.23 1.13 1.05 0.82 0.73Net interest rate spread 3.11 3.03 3.02 3.09 3.10Impact of noninterest-bearing funds on margin 0.30 0.29 0.27 0.21 0.20Net interest margin 3.41% 3.32% 3.29% 3.30% 3.30%
Commercial Loan Derivative Impact(Unaudited)
Average Rates2018 2018 2018 2018 2017
Fully-taxable equivalent basis(1) Fourth Third Second First FourthCommercial loans(3)(4) 4.86% 4.66% 4.55% 4.29% 4.16%Impact of commercial loan derivatives — — — — (0.01)Total commercial - as reported 4.86% 4.66% 4.55% 4.29% 4.15%
Average 30 day LIBOR 2.35% 2.11% 1.97% 1.65% 1.33%(1) Fully-taxable equivalent (FTE) yields are calculated assuming a 21% tax rate and a 35% tax rate for periods prior to January 1, 2018. See page 10 for
the FTE adjustment.(2) Deposits in Federal Reserve Bank were treated as nonearning assets prior to 4Q 2018.(3) Yield/rates include the effects of hedge and risk management activities associated with the respective asset and liability categories. (4) Includes nonaccrual loans.

10
Huntington Bancshares IncorporatedSelected Quarterly Income Statement Data(1)(Unaudited)
Three Months Ended
(dollar amounts in millions, except per data, share count inthousands)
December 31, September 30, June 30, March 31, December 31,2018 2018 2018 2018 2017
Interest income $ 1,056 $ 1,007 $ 972 $ 914 $ 894Interest expense 223 205 188 144 124Net interest income 833 802 784 770 770Provision for credit losses 60 53 56 66 65
Net interest income after provision for credit losses 773 749 728 704 705Service charges on deposit accounts 94 93 91 86 91Card and payment processing income 58 57 56 53 53Trust and investment management services 42 43 42 44 41Mortgage banking income 23 31 28 26 33Capital markets fees 29 22 21 19 23Insurance income 21 19 21 21 21Bank owned life insurance income 16 19 17 15 18Gain on sale of loans and leases 16 16 15 8 17Securities gains (losses) (19) (2) — — (4)Other income 49 44 45 42 47
Total noninterest income 329 342 336 314 340Personnel costs 399 388 396 376 373Outside data processing and other services 83 69 69 73 71Net occupancy 70 38 35 41 36Equipment 48 38 38 40 36Deposit and other insurance expense 9 18 18 18 19Professional services 17 17 15 11 18Marketing 15 12 18 8 10Amortization of intangibles 13 13 13 14 14Other expense 57 58 50 52 56
Total noninterest expense 711 651 652 633 633Income before income taxes 391 440 412 385 412Provision for income taxes 57 62 57 59 (20)Net income 334 378 355 326 432Dividends on preferred shares 19 18 21 12 19Net income applicable to common shares $ 315 $ 360 $ 334 $ 314 $ 413
Average common shares - basic 1,054,460 1,084,536 1,103,337 1,083,836 1,077,397Average common shares - diluted 1,073,055 1,103,740 1,122,612 1,124,778 1,130,117
Per common shareNet income - basic $ 0.30 $ 0.33 $ 0.30 $ 0.29 $ 0.38Net income - diluted 0.29 0.33 0.30 0.28 0.37Cash dividends declared 0.14 0.14 0.11 0.11 0.11
Revenue - fully-taxable equivalent (FTE)Net interest income $ 833 $ 802 $ 784 $ 770 $ 770FTE adjustment 8 8 7 7 12Net interest income(2) 841 810 791 777 782Noninterest income 329 342 336 314 340Total revenue(2) $ 1,170 $ 1,152 $ 1,127 $ 1,091 $ 1,122
(1) Comparisons for presented periods are impacted by a number of factors. Refer to Significant Items.(2) On a fully-taxable equivalent (FTE) basis assuming a 21% tax rate and a 35% tax rate for periods prior to January 1, 2018.
11
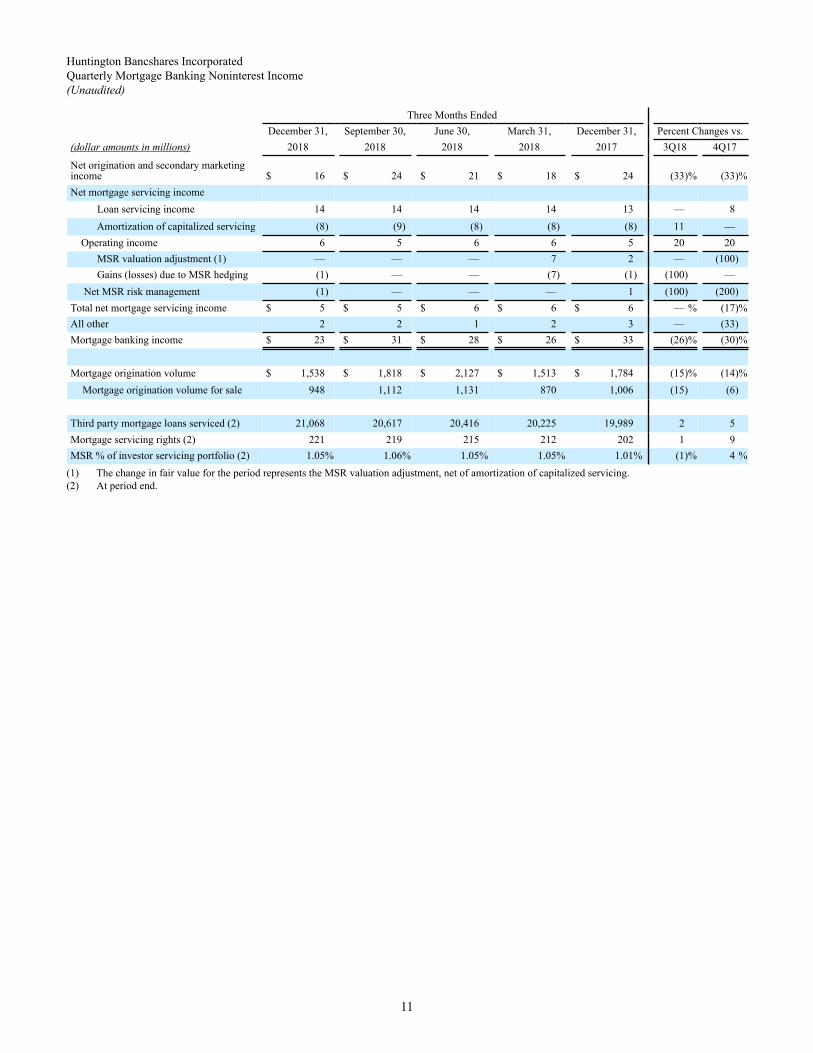
Huntington Bancshares IncorporatedQuarterly Mortgage Banking Noninterest Income(Unaudited)
Three Months EndedDecember 31, September 30, June 30, March 31, December 31, Percent Changes vs.
(dollar amounts in millions) 2018 2018 2018 2018 2017 3Q18 4Q17
Net origination and secondary marketingincome $ 16 $ 24 $ 21 $ 18 $ 24 (33)% (33)%Net mortgage servicing income Loan servicing income 14 14 14 14 13 — 8 Amortization of capitalized servicing (8) (9) (8) (8) (8) 11 — Operating income 6 5 6 6 5 20 20 MSR valuation adjustment (1) — — — 7 2 — (100) Gains (losses) due to MSR hedging (1) — — (7) (1) (100) — Net MSR risk management (1) — — — 1 (100) (200)Total net mortgage servicing income $ 5 $ 5 $ 6 $ 6 $ 6 — % (17)%All other 2 2 1 2 3 — (33)Mortgage banking income $ 23 $ 31 $ 28 $ 26 $ 33 (26)% (30)%
Mortgage origination volume $ 1,538 $ 1,818 $ 2,127 $ 1,513 $ 1,784 (15)% (14)%Mortgage origination volume for sale 948 1,112 1,131 870 1,006 (15) (6)
Third party mortgage loans serviced (2) 21,068 20,617 20,416 20,225 19,989 2 5Mortgage servicing rights (2) 221 219 215 212 202 1 9MSR % of investor servicing portfolio (2) 1.05% 1.06% 1.05% 1.05% 1.01% (1)% 4 %
(1) The change in fair value for the period represents the MSR valuation adjustment, net of amortization of capitalized servicing.(2) At period end.

12
Huntington Bancshares IncorporatedQuarterly Credit Reserves Analysis(Unaudited)
Three Months Ended
December 31, September 30, June 30, March 31, December 31,
(dollar amounts in millions) 2018 2018 2018 2018 2017Allowance for loan and lease losses, beginning of period $ 761 $ 741 $ 721 $ 691 $ 675
Loan and lease losses (84) (58) (53) (73) (60)Recoveries of loans previously charged off 34 29 25 35 19
Net loan and lease losses (50) (29) (28) (38) (41)Provision for loan and lease losses 61 49 48 68 57
Allowance for loan and lease losses, end of period 772 761 741 721 691Allowance for unfunded loan commitments and letters of credit,beginning of period 97 93 85 87 79
Provision for (reduction in) unfunded loan commitments andletters of credit losses (1) 4 8 (2) 8
Allowance for unfunded loan commitments and letters of credit,end of period 96 97 93 85 87Total allowance for credit losses, end of period $ 868 $ 858 $ 834 $ 806 $ 778Allowance for loan and lease losses (ALLL) as % of:
Total loans and leases 1.03% 1.04% 1.02% 1.01% 0.99%Nonaccrual loans and leases (NALs) 228 206 197 188 198Nonperforming assets (NPAs) 200 189 180 172 178

13
Huntington Bancshares IncorporatedQuarterly Net Charge-Off Analysis(Unaudited)
Three Months EndedDecember 31, September 30, June 30, March 31, December 31,
(dollar amounts in millions) 2018 2018 2018 2018 2017Net charge-offs by loan and lease type:
Commercial:Commercial and industrial $ 13 $ (1) $ 3 $ 17 $ 8Commercial real estate:
Construction — — — (1) (1)Commercial — (3) (1) (13) —
Commercial real estate — (3) (1) (14) (1)Total commercial 13 (4) 2 3 7Consumer:
Automobile 9 8 7 10 12Home equity 2 1 — 3 1Residential mortgage 2 2 1 1 —RV and marine finance 2 2 2 3 2Other consumer 22 20 16 18 19
Total consumer 37 33 26 35 34Total net charge-offs $ 50 $ 29 $ 28 $ 38 $ 41
Three Months EndedDecember 31, September 30, June 30, March 31, December 31,
2018 2018 2018 2018 2017Net charge-offs - annualized percentages:
Commercial:Commercial and industrial 0.17% (0.01)% 0.04% 0.24% 0.10%Commercial real estate:
Construction (0.09) (0.01) (0.22) (0.18) (0.14)Commercial — (0.18) (0.06) (0.80) (0.02)
Commercial real estate (0.01) (0.15) (0.08) (0.70) (0.04)Total commercial 0.14 (0.04) 0.02 0.04 0.07Consumer:
Automobile 0.30 0.26 0.22 0.32 0.39Home equity 0.05 0.06 0.01 0.11 0.01Residential mortgage 0.10 0.07 0.04 0.04 0.04RV and marine finance 0.31 0.25 0.34 0.42 0.46Other consumer 6.66 6.32 5.60 6.51 6.99
Total consumer 0.40 0.36 0.30 0.39 0.40Net charge-offs as a % of average loans 0.27% 0.16 % 0.16% 0.21% 0.24%

14
Huntington Bancshares IncorporatedQuarterly Nonaccrual Loans and Leases (NALs) and Nonperforming Assets (NPAs)(Unaudited)
December 31, September 30, June 30, March 31, December 31,(dollar amounts in millions) 2018 2018 2018 2018 2017Nonaccrual loans and leases (NALs):
Commercial and industrial $ 188 $ 211 $ 207 $ 190 $ 161Commercial real estate 15 19 25 30 29Automobile 5 5 4 5 6Residential mortgage 69 67 73 82 84RV and marine finance 1 1 1 1 1Home equity 62 67 68 75 68Other consumer — — — — —
Total nonaccrual loans and leases 340 370 378 383 349Other real estate, net:
Residential 19 22 23 23 24Commercial 4 5 5 7 9
Total other real estate, net 23 27 28 30 33Other NPAs (1) 24 6 6 7 7
Total nonperforming assets $ 387 $ 403 $ 412 $ 420 $ 389
Nonaccrual loans and leases as a % of total loansand leases 0.45% 0.50% 0.52% 0.54% 0.50%NPA ratio (2) 0.52 0.55 0.57 0.59 0.55(NPA+90days)/(Loan+OREO) (3) 0.74 0.76 0.75 0.74 0.72
Three Months EndedDecember 31, September 30, June 30, March 31, December 31,
(dollar amounts in millions) 2018 2018 2018 2018 2017Nonperforming assets, beginning of period $ 403 $ 412 $ 420 $ 389 $ 387
New nonperforming assets 109 114 96 158 116Returns to accruing status (21) (24) (25) (23) (25)Loan and lease losses (32) (29) (21) (32) (21)Payments (66) (62) (53) (64) (54)Sales (6) (8) (5) (8) (14)
Nonperforming assets, end of period $ 387 $ 403 $ 412 $ 420 $ 389(1) Other nonperforming assets at December 31, 2018 includes certain nonaccrual loans held-for-sale. Amounts prior to December 31,
2018 includes certain impaired investment securities.(2) Nonperforming assets divided by the sum of loans and leases, net other real estate owned, and other NPAs.(3) The sum of nonperforming assets and total accruing loans and leases past due 90 days or more divided by the sum of loans and leases
and other real estate.

15
Huntington Bancshares IncorporatedQuarterly Accruing Past Due Loans and Leases and Accruing and Nonaccruing Troubled Debt Restructured Loans(Unaudited)
December 31, September 30, June 30, March 31, December 31,(dollar amounts in millions) 2018 2018 2018 2018 2017Accruing loans and leases past due 90 days or more:
Commercial and industrial $ 7 $ 9 $ 9 $ 9 $ 9Commercial real estate — — — 1 3Automobile 8 7 6 6 7Residential mortgage (excluding loansguaranteed by the U.S. Government) 32 28 18 19 21RV and marine finance 1 1 1 2 1Home equity 17 15 16 15 18Other consumer 6 6 4 4 5
Total, excl. loans guaranteed by the U.S.Government 71 66 54 56 64Add: loans guaranteed by U.S. Government 99 88 78 50 51
Total accruing loans and leases past due 90 days ormore, including loans guaranteed by the U.S.Government $ 170 $ 154 $ 132 $ 106 $ 115
Ratios:Excluding loans guaranteed by the U.S.Government, as a percent of total loans and leases 0.09% 0.09% 0.07% 0.08% 0.09%Guaranteed by U.S. Government, as a percent oftotal loans and leases 0.13 0.12 0.11 0.07 0.07Including loans guaranteed by the U.S. Government,as a percent of total loans and leases 0.23 0.21 0.18 0.15 0.16
Accruing troubled debt restructured loans:Commercial and industrial $ 269 $ 308 $ 314 $ 316 $ 300Commercial real estate 54 60 65 76 78Automobile 35 34 32 32 30Home equity 252 257 258 261 265Residential mortgage 218 219 221 224 224RV and marine finance 2 2 1 1 1Other consumer 9 10 9 6 8
Total accruing troubled debt restructured loans $ 839 $ 890 $ 900 $ 916 $ 906
Nonaccruing troubled debt restructured loans:Commercial and industrial $ 97 $ 100 $ 87 $ 83 $ 82Commercial real estate 6 8 14 16 15Automobile 3 3 3 3 4Home equity 28 28 28 31 28Residential mortgage 44 46 46 52 55RV and marine finance — 1 1 — —Other consumer — — — — —
Total nonaccruing troubled debt restructured loans $ 178 $ 186 $ 179 $ 185 $ 184
16
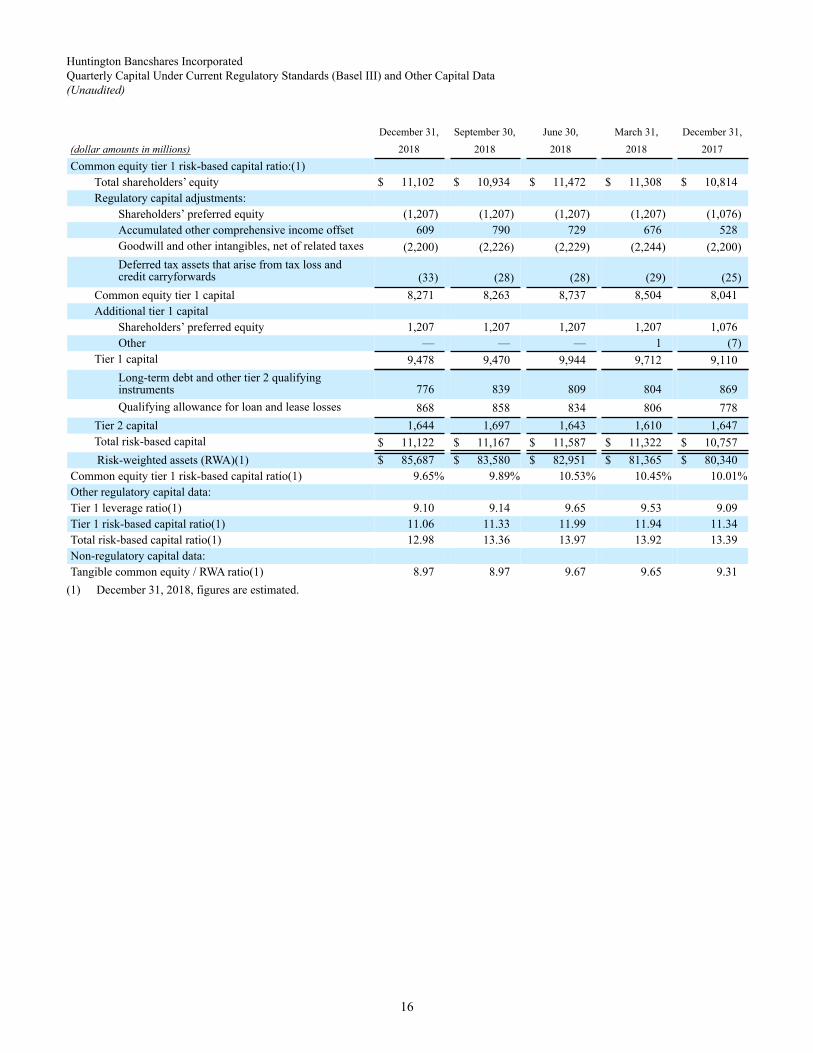
Huntington Bancshares IncorporatedQuarterly Capital Under Current Regulatory Standards (Basel III) and Other Capital Data(Unaudited)
December 31, September 30, June 30, March 31, December 31,(dollar amounts in millions) 2018 2018 2018 2018 2017Common equity tier 1 risk-based capital ratio:(1)
Total shareholders’ equity $ 11,102 $ 10,934 $ 11,472 $ 11,308 $ 10,814Regulatory capital adjustments:
Shareholders’ preferred equity (1,207) (1,207) (1,207) (1,207) (1,076)Accumulated other comprehensive income offset 609 790 729 676 528Goodwill and other intangibles, net of related taxes (2,200) (2,226) (2,229) (2,244) (2,200)Deferred tax assets that arise from tax loss andcredit carryforwards (33) (28) (28) (29) (25)
Common equity tier 1 capital 8,271 8,263 8,737 8,504 8,041Additional tier 1 capital
Shareholders’ preferred equity 1,207 1,207 1,207 1,207 1,076Other — — — 1 (7)
Tier 1 capital 9,478 9,470 9,944 9,712 9,110Long-term debt and other tier 2 qualifyinginstruments 776 839 809 804 869Qualifying allowance for loan and lease losses 868 858 834 806 778
Tier 2 capital 1,644 1,697 1,643 1,610 1,647Total risk-based capital $ 11,122 $ 11,167 $ 11,587 $ 11,322 $ 10,757Risk-weighted assets (RWA)(1) $ 85,687 $ 83,580 $ 82,951 $ 81,365 $ 80,340
Common equity tier 1 risk-based capital ratio(1) 9.65% 9.89% 10.53% 10.45% 10.01%Other regulatory capital data:Tier 1 leverage ratio(1) 9.10 9.14 9.65 9.53 9.09Tier 1 risk-based capital ratio(1) 11.06 11.33 11.99 11.94 11.34Total risk-based capital ratio(1) 12.98 13.36 13.97 13.92 13.39Non-regulatory capital data:Tangible common equity / RWA ratio(1) 8.97 8.97 9.67 9.65 9.31
(1) December 31, 2018, figures are estimated.

17
Huntington Bancshares IncorporatedQuarterly Common Stock Summary, Non-Regulatory Capital, and Other Data(Unaudited)
Quarterly common stock summary
December 31, September 30, June 30, March 31, December 31,2018 2018 2018 2018 2017
Dividends, per shareCash dividends declared per common share $ 0.14 $ 0.14 $ 0.11 $ 0.11 $ 0.11
Common shares outstanding (000)Average - basic 1,054,460 1,084,536 1,103,337 1,083,836 1,077,397Average - diluted 1,073,055 1,103,740 1,122,612 1,124,778 1,130,117Ending 1,046,767 1,061,529 1,104,227 1,101,796 1,072,027Tangible book value per common share(1) $ 7.34 $ 7.06 $ 7.27 $ 7.12 $ 6.97
Common share repurchases (000)Number of shares repurchased 14,967 43,670 — 3,007 9,785
Non-regulatory capital
December 31, September 30, June 30, March 31, December 31,(dollar amounts in millions) 2018 2018 2018 2018 2017Calculation of tangible equity / asset ratio:
Total shareholders’ equity $ 11,102 $ 10,934 $ 11,472 $ 11,308 $ 10,814Less: goodwill (1,989) (1,993) (1,993) (1,993) (1,993)Less: other intangible assets (281) (306) (319) (333) (346)Add: related deferred tax liability(1) 59 64 67 70 73
Total tangible equity 8,891 8,699 9,227 9,052 8,548Less: preferred equity (1,203) (1,203) (1,203) (1,203) (1,071)
Total tangible common equity $ 7,688 $ 7,496 $ 8,024 $ 7,849 $ 7,477Total assets $ 108,781 $ 105,652 $ 105,358 $ 104,246 $ 104,185
Less: goodwill (1,989) (1,993) (1,993) (1,993) (1,993)Less: other intangible assets (281) (306) (319) (333) (346)Add: related deferred tax liability(1) 59 64 67 70 73
Total tangible assets $ 106,570 $ 103,417 $ 103,113 $ 101,990 $ 101,919Tangible equity / tangible asset ratio 8.34% 8.41% 8.95% 8.88% 8.39%Tangible common equity / tangible asset ratio 7.21 7.25 7.78 7.70 7.34Other data:Number of employees (Average full-timeequivalent) 15,657 15,772 15,732 15,599 15,375Number of domestic full-service branches(2) 954 970 968 966 966ATM Count 1,774 1,860 1,831 1,866 1,848(1) Other intangible assets are net of deferred tax liability, calculated at a 21% tax rate.(2) Includes Regional Banking and The Huntington Private Client Group offices.

18
Huntington Bancshares IncorporatedConsolidated Annual Average Balance Sheets(Unaudited)
Annual Average Balances (1)Change from 2017 Change from 2016
(dollar amounts in millions) 2018 Amount Percent 2017 Amount Percent 2016Assets
Interest-bearing deposits in Federal Reserve Bank $ 122 $ 122 100 % $ — $ — —% $ —Interest-bearing deposits in banks 88 (11) (11) 99 (1) (1) 100Securities:
Trading account securities 96 (6) (6) 102 35 52 67Available-for-sale and other securities:
Taxable 10,700 (1,203) (10) 11,903 3,042 34 8,861Tax-exempt 3,463 282 9 3,181 465 17 2,716
Total available-for-sale securities 14,163 (921) (6) 15,084 3,507 30 11,577Held-to-maturity securities - taxable 8,643 535 7 8,108 2,415 42 5,693Other securities 584 — — 584 167 40 417
Total securities 23,486 (392) (2) 23,878 6,124 34 17,754Loans held for sale 635 80 14 555 (499) (47) 1,054Loans and leases:(3)
Commercial:Commercial and industrial 28,887 1,138 4 27,749 4,065 17 23,684Commercial real estate:
Construction 1,146 (52) (4) 1,198 110 10 1,088Commercial 6,049 39 1 6,010 1,091 22 4,919
Commercial real estate 7,195 (13) — 7,208 1,201 20 6,007Total commercial 36,082 1,125 3 34,957 5,266 18 29,691Consumer:
Automobile 12,292 773 7 11,519 979 9 10,540Home equity 9,915 (79) (1) 9,994 936 10 9,058Residential mortgage 9,907 1,662 20 8,245 1,515 23 6,730RV and marine finance 2,847 692 32 2,155 1,462 211 693Other consumer 1,203 182 18 1,021 279 38 742
Total consumer 36,164 3,230 10 32,934 5,171 19 27,763Total loans and leases 72,246 4,355 6 67,891 10,437 18 57,454Allowance for loan and lease losses (747) (80) (12) (667) (53) (9) (614)Net loans and leases 71,499 4,275 6 67,224 10,384 18 56,840Total earning assets 96,577 4,154 4 92,423 16,061 21 76,362Cash and due from banks 1,184 (269) (19) 1,453 233 19 1,220Intangible assets 2,311 (55) (2) 2,366 1,007 74 1,359All other assets 5,657 211 4 5,446 719 15 4,727
Total assets $ 104,982 $ 3,961 4 % $ 101,021 $ 17,967 22% $ 83,054Liabilities and shareholders’ equity
Deposits:Demand deposits - noninterest-bearing $ 20,391 $ (1,308) (6)% $ 21,699 $ 2,654 14% $ 19,045Demand deposits - interest-bearing 19,295 1,715 10 17,580 6,595 60 10,985Total demand deposits 39,686 407 1 39,279 9,249 31 30,030Money market deposits 21,446 1,711 9 19,735 666 3 19,069Savings and other domestic deposits 11,083 (614) (5) 11,697 3,716 47 7,981Core certificates of deposit 4,188 2,069 98 2,119 (181) (8) 2,300
Total core deposits 76,403 3,573 5 72,830 13,450 23 59,380Other domestic deposits of $250,000 or more 280 (165) (37) 445 37 9 408Brokered deposits and negotiable CDs 3,503 (172) (5) 3,675 176 5 3,499Deposits in foreign offices — — — — (204) (100) 204Total deposits 80,186 3,236 4 76,950 13,459 21 63,491Short-term borrowings 2,748 (175) (6) 2,923 1,393 91 1,530Long-term debt 8,992 130 1 8,862 814 10 8,048Total interest-bearing liabilities 71,535 4,499 7 67,036 13,012 24 54,024All other liabilities 1,997 322 19 1,675 81 5 1,594Shareholders’ equity 11,059 448 4 10,611 2,220 26 8,391
Total liabilities and shareholders’ equity $ 104,982 $ 3,961 4 % $ 101,021 $ 17,967 22% $ 83,054(1) Amounts include the effects of hedge and risk management activities associated with the respective asset and liability categories.(2) Deposits in Federal Reserve Bank were treated as nonearning assets prior to 4Q 2018.(3) Includes nonaccrual loans.

19
Huntington Bancshares IncorporatedConsolidated Annual Net Interest Margin - Interest Income / Expense(1)(2)(Unaudited)
Annual Interest Income / Expense(dollar amounts in millions) 2018 2017 2016Assets
Interest-bearing deposits in Federal Reserve Bank (3) $ 3 $ — $ —Interest-bearing deposits in banks 2 2 —Securities:
Trading account securities 1 — —Available-for-sale and other securities:
Taxable 280 283 210Tax-exempt 122 118 91
Total available-for-sale securities 402 401 301Held-to-maturity securities - taxable 211 193 138Other securities 25 20 12
Total securities 639 614 451Loans held for sale 26 21 35Loans and leases:
Commercial:Commercial and industrial 1,337 1,142 879Commercial real estate:
Construction 60 52 40Commercial 283 240 176
Commercial real estate 343 292 216Total commercial 1,680 1,434 1,095Consumer:
Automobile 456 412 351Home equity 512 463 381Residential mortgage 371 301 244RV and marine finance 145 118 39Other consumer 145 118 79
Total consumer 1,629 1,412 1,094Total loans and leases 3,309 2,846 2,189
Total earning assets $ 3,979 $ 3,483 $ 2,675Liabilities
Deposits:Demand deposits - noninterest-bearing $ — $ — $ —Demand deposits - interest-bearing 78 38 11Total demand deposits 78 38 11Money market deposits 148 66 46Savings and other domestic deposits 24 24 15Core certificates of deposit 72 13 13
Total core deposits 322 141 85Other domestic deposits of $250,000 or more 3 2 2Brokered deposits and negotiable CDs 66 37 15Deposits in foreign offices — — —Total deposits 391 180 102Short-term borrowings 48 25 5Long-term debt 321 226 156
Total interest-bearing liabilities 760 431 263Net interest income $ 3,219 $ 3,052 $ 2,412
(1) Fully-taxable equivalent (FTE) income and expense calculated assuming a 21% tax rate and a 35% tax rate for periods prior to January 1, 2018. See page 24 for the FTE adjustment.
(2) Amounts include the effects of hedge and risk management activities associated with the respective asset and liability categories.(3) Deposits in Federal Reserve Bank were treated as nonearning assets prior to 4Q 2018 and associated interest income was not material.
20
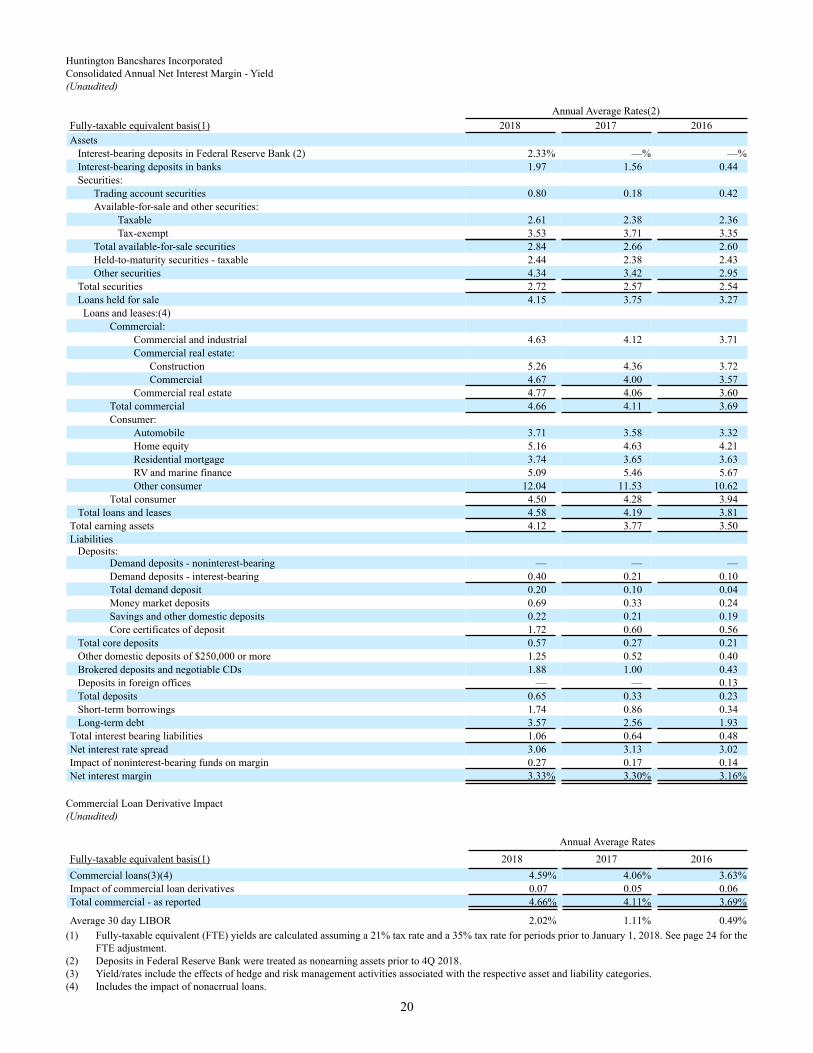
Huntington Bancshares IncorporatedConsolidated Annual Net Interest Margin - Yield(Unaudited)
Annual Average Rates(2)Fully-taxable equivalent basis(1) 2018 2017 2016Assets
Interest-bearing deposits in Federal Reserve Bank (2) 2.33% —% —%Interest-bearing deposits in banks 1.97 1.56 0.44Securities:
Trading account securities 0.80 0.18 0.42Available-for-sale and other securities:
Taxable 2.61 2.38 2.36Tax-exempt 3.53 3.71 3.35
Total available-for-sale securities 2.84 2.66 2.60Held-to-maturity securities - taxable 2.44 2.38 2.43Other securities 4.34 3.42 2.95
Total securities 2.72 2.57 2.54Loans held for sale 4.15 3.75 3.27Loans and leases:(4)
Commercial:Commercial and industrial 4.63 4.12 3.71Commercial real estate:
Construction 5.26 4.36 3.72Commercial 4.67 4.00 3.57
Commercial real estate 4.77 4.06 3.60Total commercial 4.66 4.11 3.69Consumer:
Automobile 3.71 3.58 3.32Home equity 5.16 4.63 4.21Residential mortgage 3.74 3.65 3.63RV and marine finance 5.09 5.46 5.67Other consumer 12.04 11.53 10.62
Total consumer 4.50 4.28 3.94Total loans and leases 4.58 4.19 3.81
Total earning assets 4.12 3.77 3.50Liabilities
Deposits:Demand deposits - noninterest-bearing — — —Demand deposits - interest-bearing 0.40 0.21 0.10Total demand deposit 0.20 0.10 0.04Money market deposits 0.69 0.33 0.24Savings and other domestic deposits 0.22 0.21 0.19Core certificates of deposit 1.72 0.60 0.56
Total core deposits 0.57 0.27 0.21Other domestic deposits of $250,000 or more 1.25 0.52 0.40Brokered deposits and negotiable CDs 1.88 1.00 0.43Deposits in foreign offices — — 0.13Total deposits 0.65 0.33 0.23Short-term borrowings 1.74 0.86 0.34Long-term debt 3.57 2.56 1.93
Total interest bearing liabilities 1.06 0.64 0.48Net interest rate spread 3.06 3.13 3.02Impact of noninterest-bearing funds on margin 0.27 0.17 0.14Net interest margin 3.33% 3.30% 3.16%
Commercial Loan Derivative Impact(Unaudited)
Annual Average RatesFully-taxable equivalent basis(1) 2018 2017 2016Commercial loans(3)(4) 4.59% 4.06% 3.63%Impact of commercial loan derivatives 0.07 0.05 0.06Total commercial - as reported 4.66% 4.11% 3.69%
Average 30 day LIBOR 2.02% 1.11% 0.49%(1) Fully-taxable equivalent (FTE) yields are calculated assuming a 21% tax rate and a 35% tax rate for periods prior to January 1, 2018. See page 24 for the
FTE adjustment.(2) Deposits in Federal Reserve Bank were treated as nonearning assets prior to 4Q 2018.(3) Yield/rates include the effects of hedge and risk management activities associated with the respective asset and liability categories. (4) Includes the impact of nonacrrual loans.

21
Huntington Bancshares IncorporatedSelected Annual Income Statement Data(1)(Unaudited)
Year Ended December 31,
(dollar amounts in millions, except per data, share countin thousands)
Change Change2018 Amount Percent 2017 Amount Percent 2016
Interest income $ 3,949 $ 516 15 % $ 3,433 $ 801 30% $ 2,632Interest expense 760 329 76 431 168 64 263Net interest income 3,189 187 6 3,002 633 27 2,369Provision for credit losses 235 34 17 201 10 5 191
Net interest income after provision for credit losses 2,954 153 5 2,801 623 29 2,178Service charges on deposit accounts 364 11 3 353 29 9 324Card and payment processing income 224 18 9 206 37 22 169Trust and investment management services 171 15 10 156 33 27 123Mortgage banking income 108 (23) (18) 131 3 2 128Capital markets fees 91 15 20 76 16 27 60Insurance income 82 1 1 81 (3) (4) 84Bank owned life insurance income 67 — — 67 9 16 58Gain on sale of loans 55 (1) (2) 56 9 19 47Securities gains (losses) (21) (17) (425) (4) (4) (100) —Other income 180 (5) (3) 185 28 18 157
Total noninterest income 1,321 14 1 1,307 157 14 1,150Personnel costs 1,559 35 2 1,524 175 13 1,349Outside data processing and other services 294 (19) (6) 313 8 3 305Net occupancy 184 (28) (13) 212 59 39 153Equipment 164 (7) (4) 171 6 4 165Deposit and other insurance expense 63 (15) (19) 78 24 44 54Professional services 60 (9) (13) 69 (36) (34) 105Marketing 53 (7) (12) 60 (3) (5) 63Amortization of intangibles 53 (3) (5) 56 26 87 30Other expense 217 (14) (6) 231 47 26 184
Total noninterest expense 2,647 (67) (2) 2,714 306 13 2,408Income before income taxes 1,628 234 17 1,394 474 52 920Provision for income taxes 235 27 13 208 — — 208Net income 1,393 207 17 1,186 474 67 712Dividends on preferred shares 70 (6) (8) 76 11 17 65Net income applicable to common shares $ 1,323 $ 213 19 % $ 1,110 $ 463 72% $ 647Average common shares - basic 1,081,542 (3,144) — % 1,084,686 180,248 20% 904,438Average common shares - diluted 1,105,985 (30,201) (3) 1,136,186 217,396 24 918,790Per common share
Net income - basic $ 1.22 $ 0.20 20 $ 1.02 $ 0.30 42 $ 0.72Net income - diluted 1.20 0.20 20 1.00 0.30 43 0.70Cash dividends declared 0.50 0.15 43 0.35 0.06 21 0.29
Revenue - fully taxable equivalent (FTE)Net interest income $ 3,189 $ 187 6 $ 3,002 $ 633 27 $ 2,369FTE adjustment 30 (20) (40) 50 7 16 43Net interest income (2) 3,219 167 5 3,052 640 27 2,412Noninterest income 1,321 14 1 1,307 157 14 1,150Total revenue (2) $ 4,540 $ 181 4 % $ 4,359 $ 797 22% $ 3,562(1) Comparisons for presented periods are impacted by a number of factors. Refer to Significant Items.(2) On a fully-taxable equivalent (FTE) basis assuming a 21% tax rate and a 35% tax rate for periods prior to January 1, 2018.

22
Huntington Bancshares IncorporatedAnnual Mortgage Banking Income(Unaudited)
Year Ended December 31,(dollar amounts in millions) 2018 2017 2016 2015 2014Net origination and secondary marketing income $ 79 $ 95 $ 100 $ 91 $ 57Net mortgage servicing income Loan servicing income 56 52 46 43 41 Amortization of capitalized servicing (33) (29) (28) (27) (24) Operating income 23 23 18 16 17 MSR valuation adjustment (1) 7 1 1 (4) (11) Gains (losses) due to MSR hedging (8) — (1) (2) 7 Net MSR risk management (1) 1 — (6) (4)Total net mortgage servicing income $ 22 $ 24 $ 18 $ 10 $ 13All other 7 12 10 11 15Mortgage banking income $ 108 $ 131 $ 128 $ 112 $ 85
Mortgage origination volume $ 6,996 $ 6,634 $ 5,822 $ 4,705 $ 3,558Mortgage origination volume for sale 4,061 3,912 3,822 3,237 2,366
Third party mortgage loans serviced (2) 21,068 19,989 18,852 16,168 15,637Mortgage servicing rights (2) 221 202 186 161 156MSR % of investor servicing portfolio 1.05% 1.01% 0.99% 0.99% 1.00%
(1) The change in fair value for the period represents the MSR valuation adjustment, net of amortization of capitalized servicing.(2) At period end.

23
Huntington Bancshares IncorporatedAnnual Credit Reserves Analysis(Unaudited)
Year Ended December 31,(dollar amounts in millions) 2018 2017 2016 2015 2014Allowance for loan and lease losses, beginning of period $ 691 $ 638 $ 598 $ 605 $ 648
Loan and lease losses (268) (252) (227) (218) (247)Recoveries of loans previously charged off 123 93 118 130 122
Net loan and lease losses (145) (159) (109) (88) (125)Provision for loan and lease losses 226 212 169 89 83Allowance of assets sold or transferred to loansheld for sale — — (20) (8) (1)
Allowance for loan and lease losses, end of period 772 691 638 598 605Allowance for unfunded loan commitments and lettersof credit, beginning of period 87 98 72 61 63
Provision for (reduction in) unfunded loancommitments and letters of credit losses 9 (11) 22 11 (2)Fair value of acquired AULC — — 4 — —
Allowance for unfunded loan commitments and lettersof credit, end of period 96 87 98 72 61Total allowance for credit losses $ 868 $ 778 $ 736 $ 670 $ 666Allowance for loan and lease losses (ALLL) as % of:
Total loans and leases 1.03% 0.99% 0.95% 1.19% 1.27%Nonaccrual loans and leases (NALs) 228 198 151 161 202Nonperforming assets (NPAs) 200 178 133 150 179

24
Huntington Bancshares IncorporatedAnnual Net Charge-Off Analysis(Unaudited)
Year Ended December 31,(dollar amounts in millions) 2018 2017 2016 2015 2014
Total LoansCommercial:
Commercial and industrial $ 32 $ 42 $ 45 $ 28 $ 32Commercial real estate:
Construction (1) (5) (2) (1) 2Commercial (17) (6) (24) (15) (11)
Commercial real estate (18) (11) (26) (16) (9)Total commercial 14 31 19 12 23Consumer:
Automobile 34 42 32 20 17Home equity 6 5 9 20 37Residential mortgage 6 6 6 10 20RV and marine finance 9 10 2 — —Other consumer 76 65 41 26 28
Total consumer 131 128 90 76 102Total net charge-offs $ 145 $ 159 $ 109 $ 88 $ 125
Net charge-offs - annualized percentages:Commercial:
Commercial and industrial 0.11% 0.15% 0.19% 0.14% 0.18%Commercial real estate:
Construction (0.13) (0.36) (0.19) (0.08) 0.16Commercial (0.26) (0.10) (0.49) (0.37) (0.25)
Commercial real estate (0.24) (0.15) (0.44) (0.32) (0.19)Total commercial 0.04 0.09 0.06 0.05 0.10Consumer:
Automobile 0.27 0.36 0.30 0.23 0.23Home equity 0.06 0.05 0.10 0.23 0.44Residential mortgage 0.06 0.08 0.09 0.17 0.35RV and marine finance 0.32 0.48 0.33 — —Other consumer 6.27 6.36 5.53 5.44 6.99
Total consumer 0.36 0.39 0.32 0.32 0.46Net charge-offs as a % of average loans 0.20% 0.23% 0.19% 0.18% 0.27%

25
Huntington Bancshares IncorporatedAnnual Nonaccrual Loans and Leases (NALs) and Nonperforming Assets (NPAs)(Unaudited)
December 31,(dollar amounts in millions) 2018 2017 2016 2015 2014Nonaccrual loans and leases (NALs):
Commercial and industrial $ 188 $ 161 $ 234 $ 175 $ 72Commercial real estate 15 29 20 29 48Automobile 5 6 6 7 5Residential mortgage 69 84 91 95 96RV and marine finance 1 1 — — —Home equity 62 68 72 66 79Other consumer — — — — —
Total nonaccrual loans and leases 340 349 423 372 300Other real estate, net:
Residential 19 24 31 24 29Commercial 4 9 20 3 6
Total other real estate, net 23 33 51 27 35Other NPAs (1) 24 7 7 — 3
Total nonperforming assets $ 387 $ 389 $ 481 $ 399 $ 338
Nonaccrual loans and leases as a % of total loans and leases 0.45% 0.50% 0.63% 0.74% 0.63%NPA ratio (2) 0.52 0.55 0.72 0.79 0.71
December 31,(dollar amounts in millions) 2018 2017 2016 2015 2014Nonperforming assets, beginning of period $ 389 $ 481 $ 399 $ 338 $ 352
New nonperforming assets 477 415 633 569 431Returns to accruing status (93) (118) (127) (101) (77)Loan and lease losses (114) (95) (135) (150) (175)Payments (245) (252) (211) (212) (159)Sales (27) (42) (79) (45) (34)
Nonperforming assets, end of period $ 387 $ 389 $ 481 $ 399 $ 338
(1) Other nonperforming assets at December 31, 2018 includes certain nonaccrual loans held-for-sale. Amounts prior to December 31, 2018 includes certain impaired investment securities.
(2) Nonperforming assets divided by the sum of loans and leases, net other real estate owned, and other NPAs.

26
Huntington Bancshares IncorporatedAnnual Accruing Past Due Loans and Leases and Accruing and Nonaccruing Troubled Debt Restructured Loans(Unaudited)
December 31,(dollar amounts in millions) 2018 2017 2016 2015 2014Accruing loans and leases past due 90 days or more:
Commercial and industrial $ 7 $ 9 $ 18 $ 9 $ 5Commercial real estate — 3 17 10 19Automobile 8 7 10 7 5Residential mortgage (excluding loans guaranteed bythe U.S. Government) 32 21 15 14 33RV and marine finance 1 1 1 — —Home equity 17 18 12 9 12Other consumer 6 5 4 1 1
Total, excl. loans guaranteed by the U.S. Government 71 64 77 50 75Add: loans guaranteed by U.S. Government 99 51 52 56 55
Total accruing loans and leases past due 90 days or more,including loans guaranteed by the U.S. Government $ 170 $ 115 $ 129 $ 106 $ 130Ratios:Excluding loans guaranteed by the U.S. Government, as apercent of total loans and leases 0.09% 0.09% 0.12% 0.10% 0.16%Guaranteed by U.S. Government, as a percent of total loans andleases 0.13 0.07 0.08 0.11 0.12Including loans guaranteed by the U.S. Government, as apercent of total loans and leases 0.23 0.16 0.19 0.21 0.27Accruing troubled debt restructured loans:
Commercial and industrial $ 269 $ 300 $ 210 $ 236 $ 117Commercial real estate 54 78 77 115 177Automobile 35 30 26 25 26Home equity 252 265 270 199 252Residential mortgage 218 224 243 265 265RV and marine finance 2 1 — — —Other consumer 9 8 4 4 4
Total accruing troubled debt restructured loans $ 839 $ 906 $ 830 $ 844 $ 841Nonaccruing troubled debt restructured loans:
Commercial and industrial $ 97 $ 82 $ 107 $ 57 $ 21Commercial real estate 6 15 5 17 25Automobile 3 4 5 6 5Home equity 28 28 28 21 27Residential mortgage 44 55 59 72 69RV and marine finance — — — — —Other consumer — — — — —
Total nonaccruing troubled debt restructured loans $ 178 $ 184 $ 204 $ 173 $ 147