Embed Size (px)
Citation preview

1
<no narration for this slide>
2

The standard narration text is :
“After completing this lesson, you will be able to:
<Outline …>
<Define …>
<List …>
<Explain…>
<…>

SAP Visual Intelligence is our latest innovation in the SAP BusinessObjects
Explorer solution family.
It is a desktop-based visualization and data manipulation solution that allows
business users to acquire data from a variety of corporate and personal data
sources and manipulate data without any scripting. Users can then analyze this
data, with beautiful visualizations, quickly discovering unique insight that can be
easily shared, shaping and driving the business faster than ever before.
With SAP Visual Intelligence:
• Consume data the way you process thoughts: fast, interactive, and visual
• Connect, access and visualize data without a single line of code
• Get real-time answers on any volume of data
• View the big picture and drill down to details
• Share your findings instantly with others

SAP Visual Intelligence allows business users to acquire, manipulate, analyze,
and visualize data from corporate and personal data sources to discover and
share insights.
The solution inspires your business by providing the fastest, most engaging
way of discovering answers from any data, through an interactive and visual
experience
SAP Visual Intelligence is used by Analysts and Business Users to:
Acquire, combine, and manipulate a variety of corporate and personal data
sources without reliance on IT
Enhance data by merging, cleansing, calculating, and easily adding
geospatial and time hierarchies

Analyze and visualize data on the fly and creating compelling, engaging,
intuitive visualizations and share insights with others
5

SAP Visual Intelligence allows you to:
Acquire data from a variety of corporate and
personal data sources
Access real time on massive volumes of detailed data with native access to
our in memory solution
Merge, correct, manipulate, and perform calculations without scripting
– Duplicate, rename, split, and remove columns
– Find and replace, trim data, change case, and group data
– Quickly create complex formulas and running calculations
Easily enhance data with time and geographic hierarchies
Intuitive data exploration and visualization tools to automatically design a
variety of powerful charts
Add overlay charts to display geographical
visualizations, such as pie charts on a map
Save and share visualizations with others
6
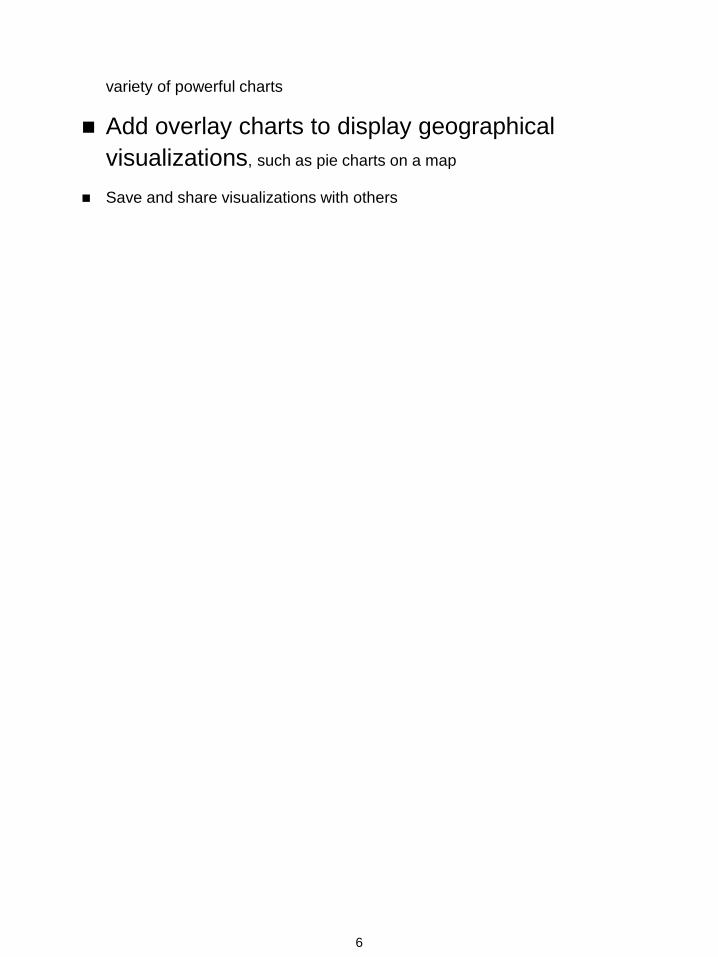
SAP Visual Intelligence can import data from a variety of sources including
CSV, SQL, HANA, and Microsoft Excel.
7

Users can import data from multiple data sources and put them into a single
view. Users can merge data from the different data sets based on values
common to both data sets.
<click>
In this example both data sets include the common Customer_ID column. This
allows the analyst to add the Customer Name column to Fact table data set.
8

When you import and work with a data set, SAP Visual Intelligence identifies
potential semantic enrichments. Semantic elements for the data set are
displayed in the bottom left corner.
<click>
Users can click the show button to view a dialog box which displays
recommended enhancements. In this example Net_Sales and Gross_Sales
should be converted into measures. The Date column can be converted into a
Time Hierarchy. If a Geo field is detected, Visual Intelligence can also add a
geographic hierarchy.
9

SAP Visual Intelligence allows business users to easily manipulate data with
built in tools.
Users can quickly and easily convert data to lower or upper case, <click>
Find and replace values, <click>
Fill column data with leading or trailing characters to make values a consistent
length,
Or remove leading & trailing characters.
10

SAP Visual Intelligence allows users to find and replace values in a column.
In this example Sporttek is selected in the Customer Name column. The find
and replace manipulation, highlighted on the right, will change the company
name.
11

SAP Visual Intelligence also allows users to treat two or more unique values as
a group, where each record in the group is assigned the same value for
analysis.
This can be useful in a variety of situations.
In the example shown in the image on the right both Tektabuy and ThinkSmart
are selected in the Customer Name column. Using the group values feature, all
data from both of these customer names can be treated as a single customer
with the name “ThinkSmart”. This would be useful after ThinkSmart acquired
Tektabuy, and allows an analyst to combine data from both companies for
analysis.
Another use case would be to deal with data entry or spelling variations. Data
entry errors can be corrected using find and replace in some situations, but in
other cases such as legitimate spelling variations, the Group Values feature can
be used to treat the values the same.
12
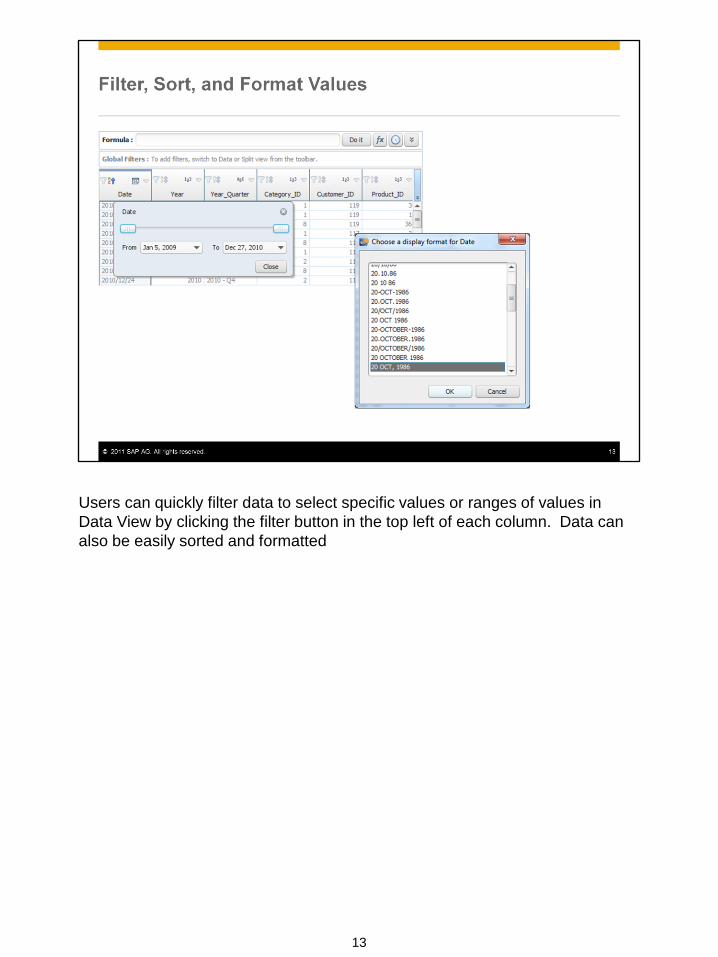
Users can quickly filter data to select specific values or ranges of values in
Data View by clicking the filter button in the top left of each column. Data can
also be easily sorted and formatted
13

Users can easily duplicate, rename, or delete columns. They can also create
new columns using formulas or functions. This functionality allows analysts to
combine data from two or more columns into a single column value, extract part
of a column value, and perform calculations on values such as calculating a
discount or tax.
14

This slide shows a simple example of a calculated column in which the
LastWord function is used to extract the quarter from the Year_Quarter column.
Formulas can be typed in the formula textbox or users can click the function
button to view a list of available functions.
15

The button on the right of the formula bar is used to expand or collapse the
Help Box, which provides in context help about how to use the selected
function.
16
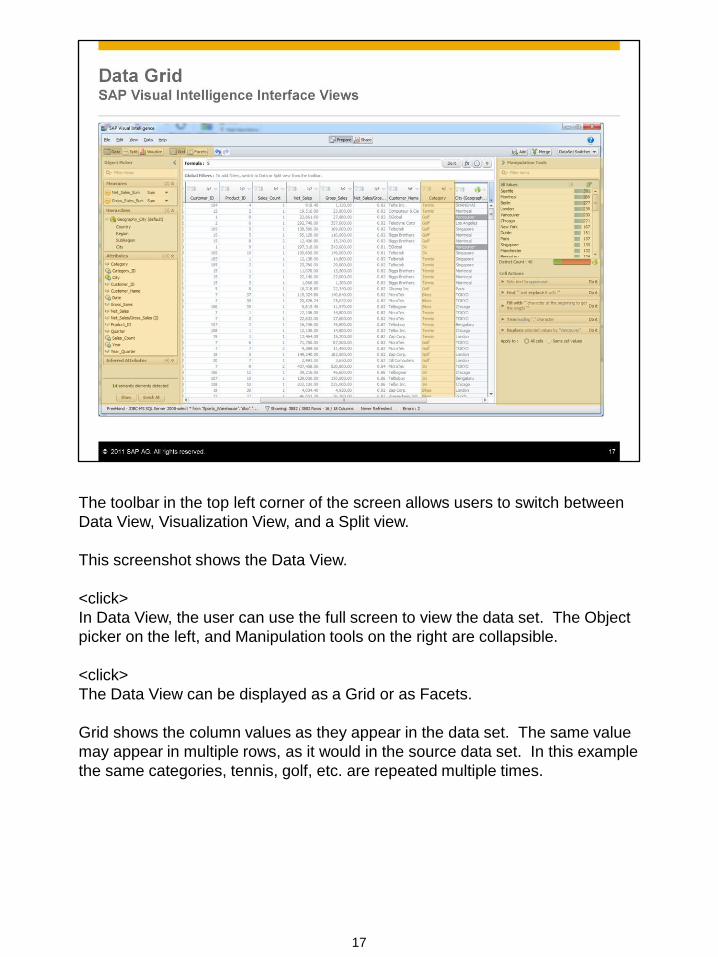
The toolbar in the top left corner of the screen allows users to switch between
Data View, Visualization View, and a Split view.
This screenshot shows the Data View.
<click>
In Data View, the user can use the full screen to view the data set. The Object
picker on the left, and Manipulation tools on the right are collapsible.
<click>
The Data View can be displayed as a Grid or as Facets.
Grid shows the column values as they appear in the data set. The same value
may appear in multiple rows, as it would in the source data set. In this example
the same categories, tennis, golf, etc. are repeated multiple times.
17

In Facet mode, users can see the unique data values on the left and
aggregates on the right for each column of data.
For example, there are four unique values in the Category facet. The category
names are listed on the left. The value on the right is an aggregate. In this
case it shows that the number of records in each category.
18

The Visualize View allows users to use the full workspace to design visual representations of the data. In this example a Stacked Column Chart displays sales by category for each year and quarter. <click> SAP Visual Intelligence includes a variety of charts to effectively visualize any kind of data including column and bar charts, line and area charts, pie charts, scatter and bubble charts, tree maps, heat maps, radar, box plot, waterfall charts, and tag clouds. Click the link on the bottom of the slide to learn more about the different types of charts and their uses.
19

Analysts can also create trellis charts in SAP Visual Intelligence.
To set up a trellis chart, users simply drag dimensions into the Column By and
Row By fields highlighted in the screen shot.
This slide show a pie chart for each year and quarter, with the quarters
displayed By Column and the years displayed By Row.
20

Split View allows the user to split the screen between a Data View and a
Visualization View, including both on the screen at the same time.
Users can click and drag to adjust the view devoting as much or as little screen
real estate to the visualization as they need.
21

SAP Visual Intelligence is an IT approved solution.
With SAP Visual Intelligence, business users and analysts
can self-service their own data discovery, exploration and
visualization needs, with no need for IT to create predefined
queries, reports, or dashboards. With very minimal end user training required,
IT can address their reporting backlog, by allowing business users to answer
their own questions with an easy to use solution.
With SAP Visual Intelligence users can connect to enterprise BI and
leverage existing data, security, and administration services, including a single
metadata umbrella for trusted information.
The SAP BusinessObjects BI platform is very secure, with an IT-sanctioned
22

security model and single sign-on, and content management – version control,
promotion and rollback. It’s also simple to manage and scale with 1 unified
platform to deploy and administer, and proven scalability without operational
disruptions
22
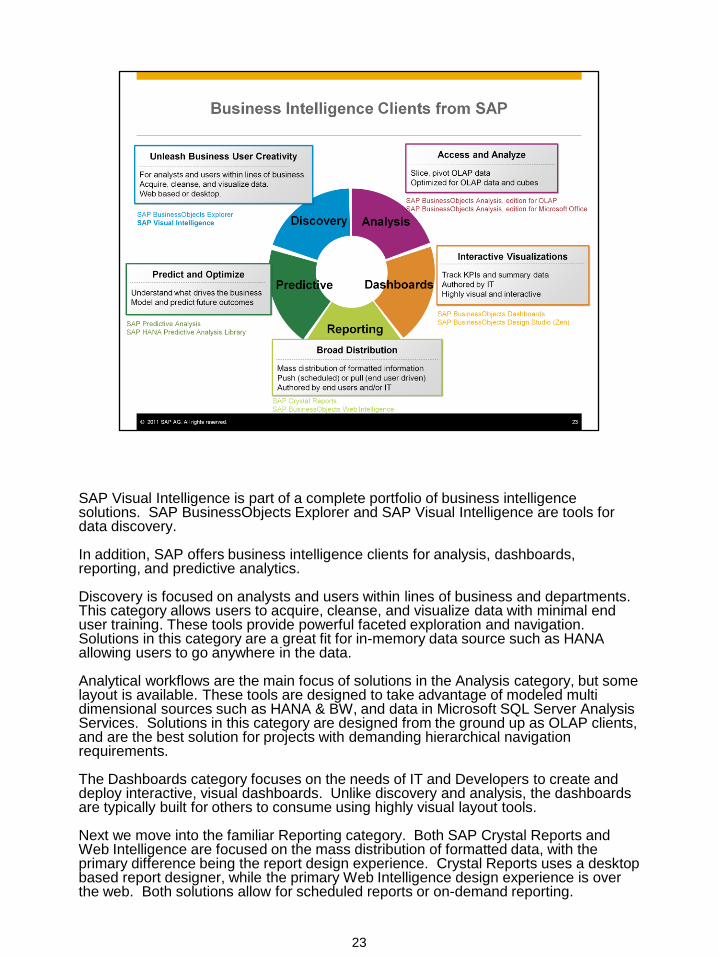
SAP Visual Intelligence is part of a complete portfolio of business intelligence solutions. SAP BusinessObjects Explorer and SAP Visual Intelligence are tools for data discovery. In addition, SAP offers business intelligence clients for analysis, dashboards, reporting, and predictive analytics. Discovery is focused on analysts and users within lines of business and departments. This category allows users to acquire, cleanse, and visualize data with minimal end user training. These tools provide powerful faceted exploration and navigation. Solutions in this category are a great fit for in-memory data source such as HANA allowing users to go anywhere in the data. Analytical workflows are the main focus of solutions in the Analysis category, but some layout is available. These tools are designed to take advantage of modeled multi dimensional sources such as HANA & BW, and data in Microsoft SQL Server Analysis Services. Solutions in this category are designed from the ground up as OLAP clients, and are the best solution for projects with demanding hierarchical navigation requirements. The Dashboards category focuses on the needs of IT and Developers to create and deploy interactive, visual dashboards. Unlike discovery and analysis, the dashboards are typically built for others to consume using highly visual layout tools. Next we move into the familiar Reporting category. Both SAP Crystal Reports and Web Intelligence are focused on the mass distribution of formatted data, with the primary difference being the report design experience. Crystal Reports uses a desktop based report designer, while the primary Web Intelligence design experience is over the web. Both solutions allow for scheduled reports or on-demand reporting.
23

Finally we have the Predictive category. The solutions in this category include
SAP Predictive Analysis.
Our Analytics portfolio also includes solutions for Enterprise Performance
Management, Governance Risk and Compliance, Analytic Applications and
Rapid Deployment Solutions. Our business intelligence and Analytics
solutions are integrated with our line of Application, Cloud, Mobile, and
Database & Technology offerings.
23

Top differentiators for SAP Visual Intelligence include:
• Data acquisition without reliance on IT – Users can acquire and combine data from
enterprise and personal sources in a repeatable, self-service way without the help of IT.
• Data manipulation without reliance on IT – Users can enhance data using semantic
enrichment (such as adding geo-location and time dimensions) and automated
transformation workflows in a repeatable, self-service way without IT’s help, and
• Instant visualization on any volume of data – Visualize any amount of data in real-time with
SAP HANA; no data acquisition required!
With Visual Intelligence organizations can:
Eliminate bottlenecks by providing analysts with
the tools they need to examine and investigate
departmental data
Visualize the big picture, drill into the details, and
present data in intuitive charts, and get
Faster time-to-value with a reduced learning

curve
24

<skip slide>
25
26

SAP Visual Intelligence offers the ability to identify and categorize data into
measures and apply semantic enrichments to create hierarchies. Adding
hierarchies to your dataset enables you to easily group and drill down through
your visualizations.
In this tutorial, you will categorize and add time and geographic hierarchies to
your dataset.
http://www.sdn.sap.com/irj/scn/index?rid=/library/uuid/50193875-94a7-2f10-
05bd-e9c87b44ab87&overridelayout=true
SAP Visual Intelligence’s manipulation tools offer a quick and intuitive way to
edit and cleanse local datasets such as Excel and CSV files.
In this tutorial, you will use the manipulation tools to split and rename columns,
replace misspelled values, trim leading and trailing spaces, and group related
records.
http://www.sdn.sap.com/irj/scn/index?rid=/library/uuid/d0768c51-90a7-2f10-
27af-ae5742b7f321&overridelayout=true

SAP Visual Intelligence offers the ability to identify and categorize data into
measures and apply semantic enrichments to create hierarchies. Adding
hierarchies to your dataset enables you to easily group and drill down through
your visualizations.
In this tutorial, you will categorize and add time and geographic hierarchies to
your dataset.
http://www.sdn.sap.com/irj/scn/index?rid=/library/uuid/50193875-94a7-2f10-
05bd-e9c87b44ab87&overridelayout=true

You can merge the contents of two local datasets, provided they share a
column that contains the same data.
In this tutorial, you will merge the eFashion and Branch datasets.
http://www.sdn.sap.com/irj/scn/index?rid=/library/uuid/e04da127-91a7-2f10-
cf8e-ad811c442e70&overridelayout=true

SAP Visual Intelligence provides a broad selection of chart families and types
that you can use to create visual representations of your dataset.
In this tutorial, you will create visualizations using different chart types, and then
apply sorts, add calculations, and save the visualizations.
http://www.sdn.sap.com/irj/scn/index?rid=/library/uuid/900050d6-8fa7-2f10-
0fa5-a9404a2c28f4&overridelayout=true

SAP Visual Intelligence offers the ability to identify and categorize data into
measures and apply semantic enrichments to create hierarchies. Adding
hierarchies to your dataset enables you to easily group and drill down through
your visualizations.
In this tutorial, you will categorize and add time and geographic hierarchies to
your dataset.
http://www.sdn.sap.com/irj/scn/index?rid=/library/uuid/50193875-94a7-2f10-
05bd-e9c87b44ab87&overridelayout=true


For more information on topics discussed in this training, see the references
listed here.

Thank you for attending this lesson.
35