Embed Size (px)
Citation preview
����
����
���
���
���
���
��
�
��
�
��
���
��
����
����
���
������������������� ���������������T
he W
orld
Ban
k

��������������
��������� ������������
���������
������������������� ���������������
�������������������
������������������� !��
��"�����#������$�
%�������� �#�����$�
�����#���&'�#����&�
����� �(�#)��*�#���
�������
��!#��&���!�������#���+����
����%�+'������,
Human Development Unit
South Asia Region
June 2004
The World Bank

Currency and EquivalentCurrency Unit = Indian RupeeUS$ 1 = INR 45.50
FISCAL YEAR: April 1 - March 31
Abbreviations and AcronymsAP - Andhra PradeshGOI - Government of IndiaGSDP - Gross State Domestic ProductHD - Human DevelopmentIMR - Infant Mortality RateMD - Millennium DevelopmentMDG - Millennium Development GoalMMR - Maternal Mortality RateMP - Madhya PradeshNFHS - National Family and Health SurveyNSS - National Sample SurveyNSSO - National Sample Survey OrganizationSRS - Sample Registration SurveysU5MR - Under-Five Mortality RateUP - Uttar Pradesh
This report was prepared by Anil B. Deolalikar, who was Lead Economist(SASHD), until September 2003 and currently Consultant (SASHD), underthe overall guidance of Charles Griffin, who was Sector Director (SASHD) atthe time of the report preparation, and Michael Carter, Country Directorfor India (SACIN). Assistance from Peeyush Bajpai, Laveesh Bhandari,Amaresh Dubey, and Mehtab ul-Azam (consultants) and from V. Selvaraju and V. Sundararaman (SASHD) is gratefully acknowledged. The peer reviewers areJere Behrman, Raghav Gaiha, Robert M. Hecht, Raghbendra Jha, andMaureen Lewis. Sudesh Ponnappa and Karthika Nair (SASHD) provided veryhelpful team assistance. Comments on an earlier draft from a technical reviewcommittee headed by Shanta Devarajan, Chief Economist (SAR), were helpfulin preparing the current version of the report. This report has been shared withthe Government of India, but does not necessarily bear their approval for all itscontents, especially where the Bank has stated its judgments, opinions, andconclusions.

List of Tables iii
List of Maps v
List of Figures vii
List of Text Boxes xiii
PREFACE xv
EXECUTIVE SUMMARY 1
INTRODUCTION 19
INFANT AND CHILD MORTALITY 21
Overall Trends 21Inter-State Variations 22Intra-State Variations 23Economic Growth, Public Spending on Health, and Infant Mortality Reduction 26Government Health Expenditure 28Proximate Causes of Infant Mortality 31Socioeconomic and Policy Correlates of Infant Mortality 35Multivariate Analysis of Infant Mortality 40Simulations to 2015 42
CHILD MALNUTRITION 51Patterns and Trends 51Public Spending on Nutrition 53Intra-State Variations 55Concentration of Child Malnutrition 56Proximate Causes of Child Malnutrition 57Socioeconomic Correlates of Child Malnutrition 60Multivariate Analysis of Child Malnutrition 62Simulations to 2015 63ICDS and Child Malnutrition 66
PRIMARY SCHOOLING 69Overall Trends 69Economic Growth, Public Spending, and School Enrollments 71Household Survey-Based Enrollment Estimates 74Concentration of Out-of-School Children 77Primary Completion Rate 77Socio-economic Differences in Primary School Attendance and Completion 79Infrastructure and Schooling 80
��������������

ii
Attaining the Millennium Development Goals in India
Teachers and Primary Completion Rates 81Multivariate Analysis of Primary Attendance and Completion 84Simulations to 2015 86
GENDER DISPARITY IN SCHOOLING 97
Trends and Patterns 97Economic Growth, Public Spending, and Gender Disparity 98Household Survey-Based Estimates of Gender Disparity 99Socio-economic Differences in Gender Disparity 101Infrastructure and Gender Disparity 102Multivariate Analysis of Gender Disparity 103Simulations 105
HUNGER POVERTY 109
Trends and Patterns 109Socio-economic Variations in Calorie Deficiency 111Role of Infrastructure 112Multivariate Analysis of Calorie Deficiency 114Simulations 115
CONCLUSION 117
ANNEX TABLES 123
REFERENCES 141

LIST OF TABLES
TableNumber Table Title
II.1 Infant mortality rates by child birth order, sex and by state groups, 1994-98 36
II.2 Infant mortality rate, by various individual household, child and community 38characteristics and by poor and non-poor states, 1994-98
II.3 Infant mortality rate, by village availability of government anti-poverty 39programs and health infrastructure and by poor and non-poor states, 1994-98
II.4 Projected decline in infant mortality rate with various interventions in the 43poor and non-poor states
II.5 Assumptions about various interventions to reduce the infant mortality rate 44in the poor states, 1998-99 to 2015
Annex II.1 Fixed-effects, log-linear regression of infant mortality rate, pooled data for 481980-1999 across Indian states
III.1 Projected decline in child underweight rates (percentage points) with various 64interventions in the poor and non-poor states
III.2 Assumptions about various interventions to reduce the child underweight 64rate in the poor states, 1998-99 to 2015
IV.1 Projected increase in school attendance and primary completion rates 87(percentage points) with various interventions in the poor states
IV.2 Assumptions about various interventions to increase the school attendance 87and the net primary school attendance rate in the poor states, 1999-2000 to 2015
Annex IV.1 Fixed-effects, log-linear regression of the gross primary enrollment rate, 96pooled data for 1980-1999 across Indian states
V.1 Assumptions about various interventions to reduce the gender disparity in 105primary and secondary school enrollment rate in the poor states, 1999-2000 to 2015
VI.1 Assumptions about various interventions to reduce the headcount ratio 116of calorie deficiency in the poor states, 1999-2000 to 2015
Annex 1 Maximum likelihood probit estimates of the probability of an infant death 123in the four years preceding the survey, 1994-98
Annex 2 Maximum likelihood probit estimates of the probability of a child aged 1240-35 months being underweight, 1998-99
Annex 3 Maximum likelihood probit estimates of the probability of a child aged 1250-35 months being underweight, 1992-93
Annex 4 Maximum likelihood probit estimates of school and primary school 126attendance among 6-11 year old children, 1999-2000
Annex 5 Maximum likelihood probit estimates of primary school completion among 12812 year old children, 1999-2000
iii
List of Tables

iv
Attaining the Millennium Development Goals in India
Annex 6 Maximum likelihood probit estimates of school attendance among 1296-18 year olds, by sex, 1999-2000
Annex 7 Maximum likelihood probit estimates of the probability of a household 131being calorie deficient, 1999-2000
Annex 8 Data on various MD indicators in the early and late 1990s, by region 132
Annex 9 Data on various MD indicators in the early and late 1990s, by region 136
Annex 10 List of regions ranking among the lowest quartile of all regions in India on 140three or more of the five millennium development indicators considered inthis report, 1998-2000

LIST OF MAPS
MapNumber Map Title
II.1 Regional Estimates of Infant Mortality Rate (per 1,000 live births), 1997-99 24
II.2 Regional estimates of the change in the infant mortality rate, 241988-92 to 1994-98
II.3 Regional estimates of measles vaccination coverage 1998-99 35
III.1 Regional estimates of underweight children aged 0-35 months, 1998-99 56
III.2 Regional estimates of the change in proportion of underweight children 57aged 0-35 months, 1992-93 to 1998-99
IV.1 Regional estimates of net primary enrollment rates, 1999-2000 76
IV.2 Regional estimates of the % change in the net primary enrollment rates, 771993-94 to 1999-2000
IV.3 Regional estimates of the primary completion rate among 12-year olds, 791999-2000
IV.4 Regional estimates of the % change in the primary completion rate among 7912-year olds, 1993-94 to 1999-2000
V.1 Regional estimates of the ratio of girls to boys aged 6-18 years enrolled in 101school, 1999-2000
V.2 Regional estimates of the change in the ratio of girls to boys aged 6-18 years 102enrolled in school, 1993-94 to 1999-2000
VI.1 Regional estimates of the percentage of population that is calorie deficient, 1111999-2000
VI.2 Regional estimates of the change in the proportion of the population that 111is calorie deficient, 1993-94 to 1999-2000
VII.1 Regions ranking among the lowest quartile of all regions in India on three 118or more of the five millennium development indicators considered in this report, 1998-2000
v
List of Maps


vii
List of Figures
LIST OF FIGURES
FigureNumber Figure Title
II.1 Infant mortality rate, by residence, 1971-2000 21
II.2 Infant mortality rate, 1970-2000, selected countries in Asia 22
II.3 Relationship across states between infant mortality and under-5 mortality 22 rates, 1998-99
II.4 Infant mortality rate across Indian states, 1981 and 2000 23
II.5 State-specific MDGs for Infant Mortality, 2015 23
II.6 Contribution of the 21 larger states to national infant deaths, 2000 25
II.7 Cumulative distribution of infant deaths in India across districts and 25villages, 1994-98
II.8 Infant mortality rates and real public spending on health and family 26planning per capita, across 13 major states, 1980-99
II.9 States ranked by "innate infant mortality" (i.e., infant mortality after 27control for public spending on health and per capita GSDP, averaged over 1980-99) and by observed IMR averaged over 1980-1999-2000
II.10 Per capita government revenue expenditure (state plus central) on health 28and family welfare (nominal prices), by state, 1999-2000
II.11 Average annual increase (%) in real government health expenditure 28per capita, by state, 1981-99
II.12 Public spending on health as % of gross state domestic product per capita, 291981-82 and 1999-2000
II.13 Public expenditure on health as % of GDP, selected countries in Asia, 2000 29
II.14 Functional composition of state government health expenditures, 1981 29
II.15 Functional composition of state government health expenditures, 1999 30
II.16 Share of central grants in total government (revenue) expenditure on 30health, by function, selected states, 1991-92 and 1999-2000
II.17 Ranking of states in the performance of government health service, 2002 31
II.18 Cumulative number of children surviving out of 1,000 born, by age 32(in months), in poor and other states, 1994-98
II.19 Proximate causes of infant mortality in poor and nonpoor states, 1996-98 32
II.20 Low birth weight children, infant mortality, and maternal weight, 1998-99 33
II.21 Infant mortality rates, by predicted probability of a child being severely 34underweight
II.22 Relationship across regions between under-five child mortality rate and 34child underweight rate, 1998-99
II.23 Relationship across regions between one-year olds immunized against 35measles and difference between infant and under-5 mortality rate, 1998
viii
viii
Attaining the Millennium Development Goals in India
II.24 Measles vaccination rate (%) among 12-23 month olds, by state, 361992-93 and 1998-99
II.25 Mortality rate (per 1,000 live births), by age (months) and sex, 1994-98 37
II.26 Infant mortality rates of various social groups in poor and 37other states, 1994-98
II.27 Infant mortality by sex and by mother's schooling, 1994-98 38
II.28 Under-five child mortality rate, by presence of ICDS anganwadi center 39in village, 1988-92
II.29 Projected decline in infant mortality rate in the poor states, 1998-2015, 42under different intervention scenarios
Annex Fig. II.1 Estimated elasticity of infant mortality with respect to real government 49health expenditure across states, 1980-99, by level of state GDP per capita(nonparametric kernel estimates with control for state fixed effects and annual year dummies
III.1 Percent of children aged 0-35 months who are underweight, 1998-99, 52and annual % decline in this rate between 1992-93 and 1998-99, by state
III.2 Child underweight rate MDGs by state, 2015 (% of children 0-35 months 52underweight)
III.3 Change in absolute number of underweight children 0-35 months of 53age between 1992-93 and 1998-99, by state ('000 children
III.4 Child underweight rate (%) in 1992-93 and percent annual decline in 53 underweight rate, 1992-98, by state
III.5 Child underweight rate (%) and gross state domestic product per capita 54across states, 1998-99
III.6 Government expenditure on ICDS (child nutrition) program 54(excluding training) per child aged 0-6 years, 1999-2000 (nominal prices)
III.7 Underweight rate among 0-3 year olds (%) and real expenditure on 55ICDS program per child 0-6 years, across states, 1992-93 and 1998-99
III.8 Changes in child (0-3) underweight rates (%) and in real government 55expenditure on the ICDS program per child 0-6 across states, 1992-93 to 1998-99
III.9 Changes in child underweight rates and in real per capita gross state 56domestic product across states, 1992-93 to 1998-99
III.10 Contribution of 20 states to the national number of underweight 570-35 month olds, 1998-99
III.11 Cumulative distribution of all underweight 0-35 month old children 58in India across villages and districts, 1998-99
III.12 Initiation of breast-feeding after birth, by groups of states, 1998-99 58
III.13 Cumulative number of diarrheal infections experienced by infants, 59by age (months), 1998-99
ix
List of Figures
III.14 Percent of children under 3 who are underweight, by mother's weight 59and birth weight of child, 1998-99
III.15 Child underweight rates (%) by per capita expenditure quintile, 1998-99 60
III.16 Child underweight rates (%) of various social groups in poor and 60other states, 1998-99
III.17 Child (0-3 years) underweight rates (%) by sex and by 61mother's schooling, 1998-99
III.18 Child underweight rates (%), by birth order and sex, 1998-99 61
III.19 Child underweight rates (%), by infrastructure access, 1998-99 62
III.20 Projected decline in percent of children 0-3 who are underweight in 65the poor states, 1998-2015, under different intervention scenarios
III.21 Percent of children under 4 years who are underweight, by sex and 66presence of ICDS anganwadi center in village, 1992-93
IV.1 Gross primary enrollment rates, India, 1950-51 to 1999-2000 69
IV.2 Gross primary enrollment rate, by state, 1999-2000 70
IV.3 Public spending on elementary education per child aged 6-14 years and 70per student enrolled in elementary school, 1998-99
IV.4 Annual % growth in elementary enrollments, population aged 6-14, 71and real government expenditure on elementary education per child aged 6-14, by state, 1980-99
IV.5 Distribution of enrolled students and of public spending on education in 71two states, by level, 1998-1999-2000
IV.6 Gross lower primary enrollment rates and real public spending on 72elementary schooling per child 6-14 across states, 1980-99
IV.7 Inter-state increase in elementary school (grades 1-8) enrollment and 73in real government expenditure on elementary education, 1980-99
IV.8 Additional number of primary school (grades 1-5) students enrolled 73per (1993-94) Rupee increase in gross state domestic product per capita, 1980-99
IV.9 School and primary school attendance rates, by age, 1999-2000 74
IV.10 Percent change in age-specific school attendance and net primary 75attendance rates, 1993-94 to 1999-2000
IV.11 Age-specific and net primary school attendance rates for 6-11 year olds, 75by state, 1999-2000
IV.12 Percentage of children 6-11 years attending school, by state, 1993-94 76and 1999-2000
IV.13 Contribution of 17 states to the national number of 6-11 year olds out of 77school, 1999-2000
IV.14 Cumulative distribution of all out-of-school 6-11 year olds in India across 78villages and districts, 1999-2000
ix

x
Attaining the Millennium Development Goals in India
IV.15 Primary completion rate (%), by state, 1999-2000 78
IV.16 School attendance rates (ages 6-11) and primary completion rate for 12-year 80olds, by per capita consumption expenditure quintile, 1999-2000
IV.17 School attendance rates (ages 6-11) and primary completion rate for 8012-year olds, by social group, 1999-2000
IV.18 School attendance rates (ages 6-11) and primary completion rate for 8112-year olds, by female education, 1999-2000
IV.19 School attendance rates (ages 6-11) and primary completion rate for 8112-year olds, by access to electricity, 1999-2000
IV.20 School attendance rates (ages 6-11) and primary completion rate for 8212-year olds, by access to pucca roads, 1999-2000
IV.21 Ranking of states in the performance of government school 83education services, 2002
IV.22 Increase in projected % of children aged 6-11 attending school in the 86poor states, 1999-2015, under different intervention scenarios
IV.23 Increase in projected % of children aged 6-11 attending primary school 88in the poor states, 1999-2015, under different intervention scenarios
IV.24 Increase in projected primary completion rate (%) in the poor states, 881999-2015, under different intervention scenarios
V.1 Ratio of female to male gross primary enrollment rate, 1950-51 to 1999-2000 97
V.2 Ratio of female to male gross primary enrollment rate, by state, 1999-2000 98
V.3 Ratio of females to males enrolled in primary (grades 1-5) schools, 981980-81 and 1999-2000, by state
V.4 Percent change in the ratio of females to males enrolled in primary schools, 991980-81 to 1999-2000
V.5 Relationship between the ratio of females to males in primary school and 99real public spending on elementary education per child 6-14, 14 states in 1980-81 to 1999-2000
V.6 Relationship between the ratio of females to males in primary school 99and real gross state domestic product per capita, 14 states in 1980-81 to 1999-2000
V.7 Age-specific and primary school attendance, by gender, 1999-2000 100
V.8 Ratio of female to male students attending primary and secondary school, 100 by age, 1999-2000
V.9 Ratio of girls to boys in primary and secondary schools (%), 100by state, 1999-2000
V.10 % change in age- & gender-specific school attendance rates, 1011993-94 to 1999-2000
V.11 Ratio of girls to boys in primary and secondary schools (%), 102by social group and consumption quintile, 1999-2000
x

xi
List of Figures
V.12 Ratio of girls to boys in primary and secondary schools (%), 103by adult male and female schooling in household, 1999-2000
V.13 Ratio of girls to boys in primary and secondary schools (%), 103by infrastructure availability, 1999-2000
V.14 Ratio of girls to boys in primary and secondary schools (%), by school 104availability and by government expenditure on education, 1999-2000
V.15 Projected changes in male-female difference (in percentage points) in 106school attendance rate of children aged 6-18 in the poor states, 1999-2015, under different intervention scenarios
VI.1 Percent of population that is calorie-deficient, by state, 1999-2000 109
VI.2 Percent change in the proportion of population that was calorie-deficient, 1101993-94 to 1999-2000, by state
VI.3 Socio-economic differences in calorie deficiency, 1999-2000 112
VI.4 Predicted calorie intake and requirements per capita per day, 1999-2000 112
VI.5 Percentage of population that is calorie deficient, by adult male and 113female schooling in household, 1999-2000
VI.6 Percentage of population that is calorie deficient, by infrastructure access, 113 1999-2000
VI.7 Percentage of population that is calorie deficient, by various agricultural 113indicators, 1999-2000
VI.8 Projected changes in the incidence of calorie deficiency (%) in the 115poor states, 1999-2015, under different intervention scenarios
xii


LIST OF TEXT BOXES
BoxNumber Box Title
II.1 Home-Based Neonatal Care: Results from a Field Trial in 45Rural Maharashtra
II.2 Is Decentralization of Health Services Associated with Child Mortality? 46
III.1 The Tamil Nadu Integrated Nutrition Project 67
IV.1 The Education Guarantee Scheme of Madhya Pradesh 90
IV.2 The Learning Guarantee Program in Karnataka 91
IV.3 The Sarva Shiksha Abhiyan: A Program for Universal Elementary 92Education in India
V.1 The Bangladesh Female Secondary School Stipend Program 107
xiii
List of Text Boxes

The Millennium Development Goals commit the international community to a comprehensivevision of development - one that places human development as the centerpiece of social and economicprogress and puts great value on global partnerships for development. Since 2000, when the MDGs wereratified at the United Nations Millennium Summit, the goals have been widely accepted as a yardstick formeasuring development progress across countries.
However, discussion of many of the issues relating to the MDGs - namely, the likelihood and costsof attaining them - has remained at a global level. There have been relatively few country studies that eitherhave examined sub-national variations in the likelihood of attaining the MDGs or have analyzed, in anydetail, the different factors that are likely to speed the attainment of the MDGs.
This is one of the first detailed country reports on the MDGs done by the World Bank. A majorcontribution of the report is its focus on inter-state and inter-regional variations in India'sdevelopment progress. The report argues forcefully that India's performance on the MDGs will hingecritically on the MDG performance of its poor states, which not only have the worst humandevelopment outcomes in the country but which also account for a large and increasing proportion ofIndia's population. The report goes beyond mere description; it examines the association between theMD indicators and various policy and behavioral variables. Using these associations, it undertakessimulations of the likely trajectory of the MD indicators in the poor states through 2015 underpossible scenarios.
Naturally, quantitative analysis of the type presented in this report is subject to many limitations.There are issues of data quality, statistical inference, and omission of important 'qualitative' variables,such as governance and accountability. It is therefore important to view this report not as the final andcomplete word of India's prospects at attaining the MDGs, but instead as one of many contributionsto a broader debate on what it will take for India, and its many states and regions, to attain the MDGs.In going forward, it will be important to complement the findings of this report with othermethodological approaches. Indeed, the World Bank has commissioned a number of case studies ofinnovative, on-the-ground interventions throughout India that have attempted to influence MDoutcomes. Our plan is to discuss these case studies as well as this report at an MDG conference to beheld in New Delhi in June 2004.
We would like to express our gratitude to the many experts from government and non-governmentagencies, other international organizations, and civil society who provided their time and insightsgenerously during the preparation of this report.
Michael F. CarterCountry Director, India
World Bank
xv
������

1
IntroductionSince the launch of the
Millennium Development Goals(MDGs) at the MillenniumSummit in New York inSeptember 2000, the MDGshave become the most widely-accepted yardstick ofdevelopment efforts bygovernments, donors andNGOs. The MDGs are a set ofnumerical and time-boundtargets related to keyachievements in humandevelopment. They includehalving income-poverty andhunger, achieving universalprimary education and genderequality, reducing infant andchild mortality by two-thirdsand maternal mortality by three-quarters, reversing the spread of HIV/AIDS and othercommunicable diseases, andhalving the proportion of peoplewithout access to safe water.These targets are to be achievedby 2015, from their levels in1990 (United Nations 2000).
Almost all the countries inthe world, including India, have committed themselves toattaining the targets embodied inthe Millennium Declaration by2015. Unfortunately, there is littleunderstanding of whether Indiawill be able to attain all of theMDGs, and whether there aresome MDGs that India will be
able to attain. There is even lessunderstanding of what it will take- by way of economic growth,infrastructural investments, andsectoral interventions - to attainthe different MDGs. Further, thisreport argues the importance ofdisaggregating the MDGs forIndia, given the very largegeographical and socioeconomicvariations in millenniumdevelopment (MD) indicatorsacross the country.
This report focuses on theattainment of five major humandevelopment-related MDGs bysub-national units in India -child and infant mortality, child malnutrition, schoolingenrollment and completion,gender disparities in schooling,and hunger-poverty (as reflectedby inadequate calorie intake).The selection of these MDGs fordetailed analysis was based inlarge part on the availability ofreliable sub-national data.
The basic premise of thisreport is that there are largedisparities in the pastperformance as well as futureprospects of different sub-national units in terms of theMD indicators. India cannothope to attain the MDGswithout significant progress inthe MD indicators in its pooreststates - Bihar, Orissa, Uttar
Pradesh, Madhya Pradesh andRajasthan. These states not onlycurrently account for a largeproportion of the country'spopulation, but, because of morerapid population growth, willaccount for an even larger shareof the country's population in2015. The report attempts toidentify the specific interventionsthat will improve substantiallythe likelihood of the poor statesattaining the MDGs.
While one of the mainobjectives of this report is topresent a disaggregated analysisof MDGs, availability of datalimits the extent to which theanalysis can be fullydisaggregated. In addition, thesimulations undertaken in thisreport are based on empiricalanalysis of survey data, whichtypically relies on manyassumptions about data qualityand measurement, inferences ofcausality between variables, andpotential biases of statistical andeconometric estimates. It istherefore important to note atthe outset that, while the resultsand simulations presented in thisreport may give an impression ofprecision, they are not that. Theyshould be treated as beingindicative of possible broadtrends, and could usefully be complemented with other analyses using different
������������� �
2
Attaining the Millennium Development Goals in India
methodological approaches. Aslong as the results are used withthis understanding, they can behelpful in 'rough-order' planningfor MDG attainment.
The conclusion of thisreport is that attainment of theMDGs (at least the five specificgoals considered in this report)will remain challenging in thepoor states of India. Despite thegrim situation, however, thepoor states should be able tomeet the MDGs relating toinfant mortality, childmalnutrition, and hunger-poverty with a combination ofinterventions, including sector-specific interventions (such asnutrition supplementation and immunization), economicgrowth, improved coverage ofinfrastructure, and wide-rangingreforms in the institutions ofservice delivery. However,attaining the education goals willrequire considerably more effort.This report concludes that whilesubstantial progress could bemade by the poor states onincreasing the rates of netprimary enrollment and primarycompletion, it will bechallenging for them to attainthe education-related MDGs of100% net primary enrollmentand 100% primary completion,in large part because of theenormous gap between theircurrent rates of net primaryenrollment and completion(only 50% and 54%,respectively) and the MD targets. The simulation analysisalso suggests that completeelimination of the gender gap
in primary and secondaryenrollment, called for by theMDGs, will be a verychallenging goal to attain.
Infant and ChildMortality
The millennium developmentgoal is to reduce infant and childmortality by two-thirds between1990 and 2015. For India, thiswould imply a reduction of theinfant mortality rate (IMR) to 27and of the under-five mortality rate(U5MR) to 32 by 2015.
Despite infant mortalityhaving declined impressively inIndia - from 130-140 infantdeaths per 1,000 live births inthe early 1970s to 68 in 2000 -
the absolute levels of infant andchild mortality are still toohigh (about 68 infant and 95child deaths per 1,000 livebirths in 1998-99). Nearly 1¾million children die each yearin the country before reachingthe age of one. In addition,India compares poorly on thepace of IMR reduction toseveral other countries in Southand Southeast Asia, includingBangladesh.
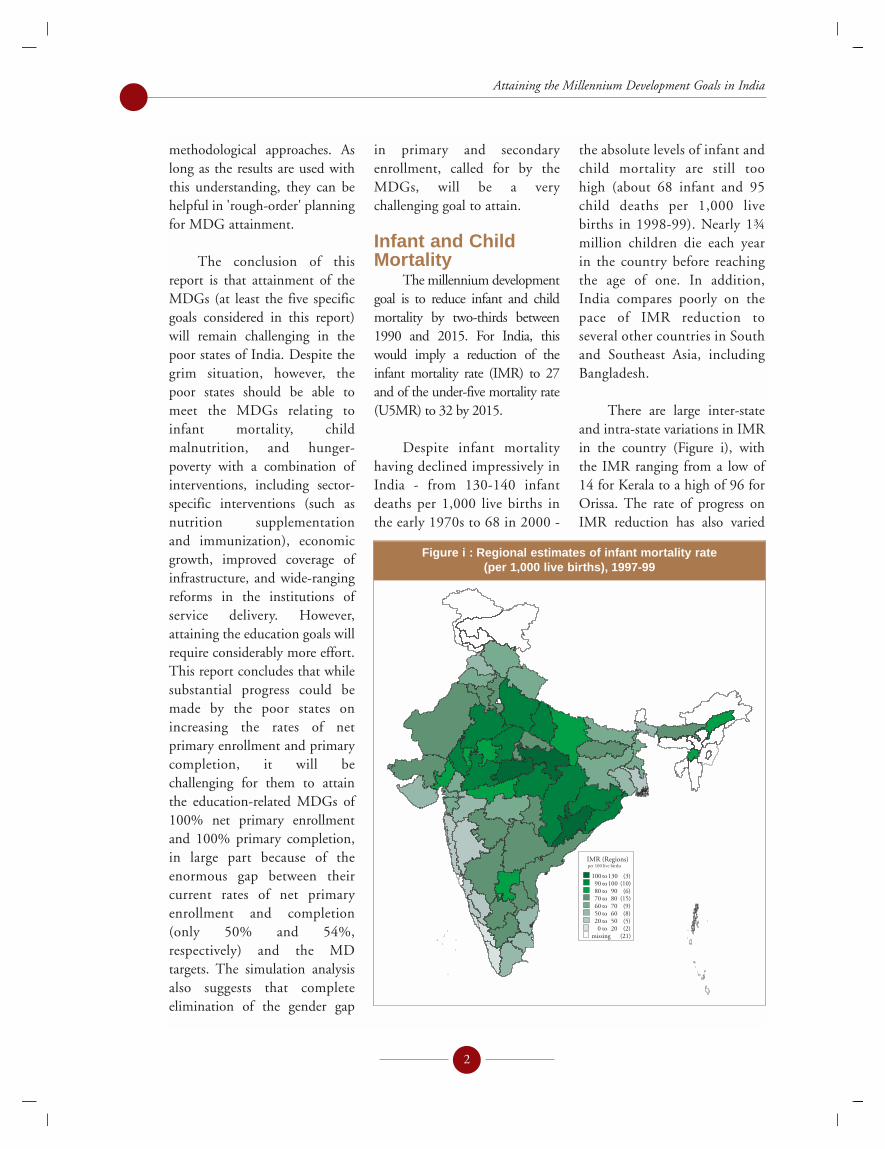
There are large inter-stateand intra-state variations in IMRin the country (Figure i), withthe IMR ranging from a low of14 for Kerala to a high of 96 forOrissa. The rate of progress onIMR reduction has also varied
IMR (Regions)per 100 live births
100 to 130 (3)90 to 100 (10)80 to 90 (6)70 to 80 (15)60 to 70 (9)50 to 60 (8)20 to 50 (5)0 to 20 (2)
missing (21)
Figure i : Regional estimates of infant mortality rate (per 1,000 live births), 1997-99

significantly across sub-nationalunits. States such as Bihar andU.P., which had among thehighest IMRs in the country in1981, were among the topperformers in IMR reductionover the period 1980-99. On theother hand, Andhra Pradesh andKarnataka had the slowest rate ofIMR decline over the twodecades. In general, there wassome convergence in IMRs, sothat inter-state disparity in infantmortality decreased between1981 and 2000.
An interesting feature ofinfant deaths in India is that theyare concentrated in just a fewstates. The NFHS-2 data are alsosuggestive of infant deaths beingheavily concentrated in arelatively small number ofdistricts and villages in thecountry. For instance, during1994-99, a fifth of the country'sdistricts and villages accountedfor one-half of all infant deaths inthe country (Figure ii). Whilethese numbers are not precise(owing to the difficulty ofmeasuring infant mortality forsmall samples), they suggest thatinfant mortality could be broughtdown considerably by firstidentifying and then targetingmortality-reducing interventionsto those districts and villages withthe largest number of infantdeaths in the country.
Econometric analysis ofstate-level data on IMRs over the
last two decades shows someevidence, although not persistent,of a significant inverse associationbetween infant mortality andgovernment health expenditureacross states. In addition, some ofthe more general econometricspecifications suggest a strongerinverse association for the verypoor states than for the non-poorstates. This may simply reflect thefact that states with high infantmortality rates tend to have alarger proportion of infant deathsoccurring during the post-neonatal (as opposed to the neo-natal) period, and these deaths aremore easily averted by the typical(and relatively inexpensive) childsurvival interventions, such aschild immunizations and oralrehydration therapy. On the other hand, reduction of neo-natal deaths, which arerelatively more common in the better-off, low-mortalitystates, typically requires more
expensive interventions, such as professionally-attendeddeliveries or deliveries ininstitutions as well as post-delivery and emergency hospital-based care.1
The results also indicatesignificant associations betweeninfant mortality on the onehand and female literacy andper capita GSDP on the otherhand. Per capita income andfemale literacy have a significantinteractive association withinfant mortality such that theinverse association betweeninfant mortality and femaleliteracy is stronger at higherincome levels than at lowerincome levels. This suggests thatfemale literacy and the level of development in a statecomplement (rather thansubstitute for) each other interms of their association withinfant mortality.
3
Executive Summary
0
10
20
30
40
50
60
70
80
90
100
0 10 20 30 40 50 60 70 80 90 100
Cumulative % of districts or villages (ranked by infant deaths)
Cu
mu
lati
ve
%o
fn
atio
nal
infa
nt
dea
ths
Village
District
Figure ii : Cumulative distribution of infant deaths in India acrossdistricts and villages, 1994-98
1 Although neo-natal mortality reduction typically requires hospital-based care, it is possible to provide a relatively inexpensivepackage of home-based neonatal services, as shown by a highly-successful field trial in Maharashtra in 1995-98 (see Box II.1 fora detailed description of the intervention).
There is significant genderdisparity in the likelihood ofchildren dying in India. While theprobability of death is greater formales than for females until ageone, the reverse is true from agesone to five. Parental neglect towardgirls - symptomatic of the generallylow social status of women -appears to be an important cause ofthe gender disparity in childmortality. Girls are less likely toreceive adequate food allocationsand medical treatment for theirillnesses than boys.
In addition, this reportfinds strong inverse asso-ciations between infantmortality and maternal edu-cation, access to roads, regularsupply of electricity andsanitation, and coverage oftetanus immunization andantenatal care among women.The empirical results suggestthat if the poor states weresimply brought up to thenational averages in terms ofcoverage of sanitation, roadaccess, electricity, antenatalcare, tetanus immunization,female schooling, and publicspending on health and familywelfare per capita, thecumulative reduction in theinfant mortality rate in thepoor states would be of theorder of 12 infant deaths per1,000 live births (or 16%). Ifthe magnitude of the proposedinterventions were scaled up soas to bring the poor states tothe mean level of the non-poorstates, the reduction in infantmortality rate in the poorstates would be greater - about
36.5 infant deaths per 1,000live births (or 48%). It thusappears that infant mortality in the poor states could decline substantially with acombination of interventions.
Finally, we undertakesimulations of the reduction inthe infant mortality rate in thepoor states to 2015 under theassumption that the fore-mentioned interventions arepursued gradually between nowand 2015. The simulation results suggest that the twointerventions most stronglyassociated with infant mortalityreduction in the poor states areincreased schooling of mothersand additional public spendingon health and family welfare.With all of the interventions, theinfant mortality rate in the poorstates is projected to decline from75 infant deaths per 1,000 livebirths to a level of 29 by 2015 -just slightly below the MD goal.This suggests that the infantmortality MDG will bechallenging but attainable in thepoor states of the country with a combination of mortality-reducing interventions pursuedsimultaneously.
The finding about theassociation between increasedgovernment health expenditureand infant mortality needs twoqualifications. First, merelyincreasing health spending willnot be enough; thecomposition, quality andeffectiveness of public spendingis as important as raising itsquantity. This is especially true
of the poorer states in India,which are plagued with themost serious problems ofgovernance and service deliveryin the health (and other)sectors. Serious attention thusneeds to be paid to makinggovernment health serviceswork, especially for the poor. Asthe World Development Report2004 points out, this is acomplex and difficult task thatentails creation of the rightinstitutions and incentives inthe system to improve servicedelivery, such as devolvingresponsibility for servicedelivery to local governmentsand communities, contractingout certain types of servicedelivery to the non-governmentsector, and empoweringconsumers to demand betterservices from governmenthealth facilities.
Second, the finding thatpublic spending on health isassociated with infant mortalityreduction in the poor states is oflittle use to policy makers.Identifying the type of healthinterventions on which to spendresources in the poor states is ofmuch greater policy interest. Theevidence in this report, as well as the results of previous studies, suggest that a packageconsisting of expanded child and maternal immunization,antenatal care coverage, nutritionalsupplementation (includingpromotion of exclusive breast-feeding), and home-based neonatalservices (including treatment ofpneumonia) is likely to be a high-impact intervention strategy.
4
Attaining the Millennium Development Goals in India

Child MalnutritionThe millennium development
goal is to reduce the percentage ofunderweight children by one-halfbetween 1990 and 2015, whichwould imply, for India, a reductionin the child underweight rate from 54.8% in 1990 to 27.4% in 2015.
Child malnutrition rates inIndia are extraordinarily high.The NFHS-2 indicates thatnearly one-half of children aged0-35 months were underweightor stunted in 1998-99.2 About18-23 percent of children areseverely underweight or stuntedin the sense of being more thanthree standard deviations belowthe relevant NCHS standards. Acomparison of data from tworounds of the NFHS shows amodest decline of about 11%(from a rate of 52.7% to 47%)between 1992-93 and 1998-99.This is a much smaller declinethan in neighboring Bangladesh,where underweight rates fellfrom 68% in 1992 to 51% in 2000.
An average childunderweight rate of 47% maskswide variations in childmalnutrition across states. Childunderweight rates vary from alow of 24-28% in theNortheastern states and Kerala to51-55% in the states of Bihar,Rajasthan, Uttar Pradesh,Madhya Pradesh and Orissa
Likewise, the decline in childunderweight rates over time hasalso varied greatly across states.In Punjab, for instance, the childunderweight rate fell at anannual rate of 7.6% between1992-93 and 1998-99, whileRajasthan saw an increase of 2%per annum in the childunderweight rate during thesame period.
Sub-state variation in thechild underweight rate is alsovery large, with the rate ranging
from a low of 11% in the Hillsregion of Assam to a high of 60%in Chhattisgarh (Figure iii).More than a third of the regionsin the country have underweightrates of 50% or greater, showingthe pervasiveness of childmalnutrition in India. Evenmore worrying is the finding thatmore than a quarter of all theregions in the countryexperienced an increase in childunderweight rates. These regionsare scattered around the country- in the poor states (Jharkhand,
5
Executive Summary
% of children 0-35 months who
are underweight, 1998-99
% Children
>= 5035 to 4925 to 34 0 to 34 Missing
Figure iii : Regional estimates of underweight children aged 0-35 months, 1998-99
2 As in the literature, a child is considered underweight when his or her weight-for-age is more than two standard deviations belowthe NCHS reference weight. A child is stunted when his or her height-for-age is more than two standard deviations below theNCHS reference. Severe underweight and stunting occur when the relevant nutrition indicator is more than three standarddeviations below the NCHS reference.
Bihar, Orissa, and Uttar Pradesh)but also in the more prosperousstates, such as Gujarat,Maharashtra and Haryana.
Like infant deaths,underweight children are alsoconcentrated geographically in arelatively small number ofdistricts and villages. A mere10% of districts and villagesaccount for 27-28% - and aquarter of districts and villagesaccount for more than half - ofall the underweight children inthe country.
Several factors contribute tothe high rates of childmalnutrition in India: poormaternal nutrition leading tolow birth weights, which in turnincreases the risk of childmalnutrition; poor infantfeeding practices (such as waitingfor a day or longer after birthbefore breast-feeding an infant,discarding the first breast milk orcolostrum, early termination ofexclusive breast-feeding andintroduction of supplementaryfeeding); and high rates ofdiarrheal and other infections.
Much of the economicvariation in child underweightrates across economic groupsoccurs between the bottom fourconsumption quintiles and thetop quintile, with little variationamong the poorest 80% of thepopulation. However, even therichest quintile shows relativelyhigh child underweight rates(about 30%). The fact thatnearly a third of the topconsumption quintile in the
country - a group that is likely tohave good economic access tofood - is malnourished suggeststhat cultural and social factorshave an important role to play indetermining child malnutritionin India. This is also consistentwith the finding that the childunderweight rate is relativelyhigh in prosperous states such asGujarat and Maharashtra.
The other correlates of childmalnutrition are affiliation tosocially-disadvantaged groups(such as scheduled castes andtribes and other backward castes),maternal age and education, andbirth order (with higher birthorder girls having a greater risk ofmalnutrition than higher birthorder boys). In addition,infrastructural variables - accessto toilets, regular electricity, andgood roads - are significantlyassociated with reduced childmalnutrition.
Much of the publicspending on child nutrition inIndia takes place on theIntegrated Child DevelopmentServices program. This programconsists of anganwadi centers(AWCs) in each village, typicallystaffed by a village woman with5-8 years of schooling and anassistant, whose functions are toprovide growth monitoring, pre-school education and nutritionalsupplementation to targetedchildren aged 0-6 years in thevillage. Although the programcovers all the villages in thecountry, recent surveys from afew states suggest that relativelyfew (about 10-30%) children
aged 0-6 years in states such asUttar Pradesh, Madhya Pradeshand Rajasthan regularly attendthe AWCs in their community.This may be because the amountof food supplementationprovided to children is meager orirregular or both.
There are large disparities inpublic expenditure on nutritionacross states. Poor, high-malnutrition states like Bihar,Uttar Pradesh, Madhya Pradeshand Rajasthan spend only Rs.30-50 on nutrition programs perchild 0-6, while Gujarat, Punjab,and Haryana spend Rs. 90-100.Tamil Nadu's expenditure isclose to Rs. 170, while spendingin the Northeastern states isabove Rs. 500.
Simulations based onmultivariate analysis of childunderweight rates using unitrecord data show that if the poorstates were brought up to thenational average in terms ofcoverage of sanitation, road access,electricity, medical attention at thetime of delivery, adult femaleschooling, household income(consumption), and publicspending on nutrition programsper child, the cumulativereduction in the childunderweight rate in these stateswould be of the order of about 8percentage points (or 15%). If themagnitude of the proposedinterventions were scaled up, so asto bring the poor states to theaverage level prevailing in the non-poor states, the cumulativereduction in the childunderweight rate in the poor
6
Attaining the Millennium Development Goals in India

states would be 21 percentagepoints or 38%. These are largereductions in child malnutrition.Indeed, the simulations indicatethat, together, the proposedinterventions are associated with areduction of 25 percentage pointsin the child underweight rate inthe poor states - enough for themto attain the MD goal.
As noted earlier, a great dealof the spending on nutrition inIndia takes place via the ICDSprogram. The NFHS-1 datasuggests that, after controlling for other factors (includinghousehold living standards andmaternal education), thepresence of an ICDS anganwadicenter in a village is associatedwith a reduction of about 5% inthe child underweight rate, butonly for boys. A 5% reduction inunderweight rates is consistentwith anecdotal evidence thatfood rations distributed by mostanganwadi centers in the countryare limited, infrequent, and oftenirregular. However, the findingthat all of the positive nutritionalbenefits of anganwadi centersaccrue to boys, not girls, issurprising. It could reflect thatparents tend to selectively bringtheir boys, but not their girls, forsupplementary feeding at thecenter. Or it could indicate thatanganwadi workers or helpersprovide a larger allocation of foodto boys than girls. This is an issuethat merits further exploration.
Primary SchoolingThe millennium development
goal is to ensure that, by 2015, allchildren are in school, the net
primary enrollment ratio is 100%,and that all the pupils entering grade 1 are retained until grade 5(typically the last year of primaryschool).
India has made rapid stridesin education during the last 4-5decades. The gross primaryenrollment rate, which was only43% in 1950-51, reached 100%by 1990-91, and has fallenslightly since then. An averagegross primary enrollment rate of95% for the country in 1999-200for the country masks widevariations across states. Grossprimary enrollment rates varyfrom a low of 65% in UttarPradesh to a high of 139% inSikkim.
However, as in othercountries, gross enrollment rates obtained from schooladministrative records differsignificantly from householdsurvey-based estimates ofenrollment. Data from the 55thround of the NSS indicate agross primary enrollment rate of61% and a net rate of only52.5% in 1999-2000. The dataalso show that, even at the peakattendance ages of 9-11 years,nearly 15% of the populationdoes not attend school. This isindicative of a large class ofchildren who never attendschool.
In addition, there are largedifferences across states in the
7
Executive Summary
�������������� �����������
���������
��������������
���������������������������������
Figure iv : Regional estimates of the net primary enrollment rate, 1999-2000

primary attendance rate.Attendance rates for the age group6-11 exceed 90% in 9 states -Kerala, Tamil Nadu, Maharashtra,Goa, Himachal Pradesh, and thestates of the Northeast. At theother end, the primary attendancerates are only 75% or lower inBihar, Orissa, Rajasthan, UttarPradesh, and Madhya Pradesh.With only 53% of children aged6-11 attending school, Bihar ranksas the poorest-performing state onschool attendance in the country.
There is a large discrepancybetween the age-specific and thenet primary attendance rate in allthe states. Even in the states havinghigh attendance rates among 6-11year olds, the net primaryattendance rate is significantlylower. In Bihar, a mere 28% ofchildren aged 6-11 attend primaryschool !
Sub-state differences in thenet primary school attendancerate are very large as well. Sixregions in the country - largelyin Bihar, Jharkhand, Orissa and
Manipur - had a net primaryattendance rate of less than 40%in 1999-2000 (Figure iv).Sixteen regions, out of a total of78 regions, had a net primaryattendance rate of less than50%. Even more discouraging isthe fact that 29 regions in thecountry, out of a total of 77regions, either did not see animprovement in their netprimary attendance ratebetween 1993-94 and 1999-2000, or saw it decline.
Analysis of state-level dataover the period 1980-99generally seems to show asignificant positive associationbetween the gross primaryenrollment rate and per-childgovernment expenditure onelementary education acrossstates, even after controlling forper capita income and adultfemale literacy. In addition,depending upon differentspecifications, the positiveassociation between the grossprimary enrollment rate andgovernment elementary school
expenditure is observed to beweaker in the non-poor statesthan in the poor states. Thelatter result could reflect the factthat the only children whoremain out of school in the non-poor states are childrenbelonging to socially-excludedand fringe groups located inhard-to-reach areas andmainstreaming these childreninto the regular school system isoften difficult and expensive.
According to the NSS55th round data, there werenearly 30 million out-of-schoolchildren aged 6-11 in India in1999-2000. Nearly half of allthese children come from thetwo states of Uttar Pradesh andBihar. School nonattendance isalso very highly concentrated inrelatively few villages in thecountry. A mere 10% of villagesin the country account fornearly one-half of all out-of-school children aged 6-11,while 20% of villages accountfor three-quarters of all out-of-school children (Figure v).Most likely, these villages arescheduled tribe habitations thatdo not have a primary school oftheir own and are not withineasy walking reach of a primaryschool. They are also likely tobe poor villages where theopportunity cost of child labor(in terms of agricultural work)is high. These results indicatethe importance and potentialeffectiveness of targeting schoolinterventions to those villagesand districts having the largest number of out-of-schoolchildren.
8
Attaining the Millennium Development Goals in India
0
10
20
30
40
50
60
70
80
90
100
0 10 20 30 40 50 60 70 80 90 100
Cumulative % of villages or districts (ranked by number of out-of-school 6-11 year olds)
Cu
mu
lati
ve
%o
fal
lo
ut-
of-
sch
oo
l6
-11
yea
ro
lds
in
the
cou
ntr
y Districts Villages
Figure v : Cumulative distribution of all out-of-school 6-11 year olds in India across villages and districts, 1999-2000

Getting out-of-schoolchildren into school is only oneof the education-relatedmillennium development goals.Another goal is retention ofstudents - viz., to ensure that theentire cohort of children whobegins grade 1 remains in schooluntil grade 5. This report usesthe primary completion rate, asmeasured by the proportion of12-year old children who do notreport themselves as never havingattended school and also reportcurrently being in middle school,as a proxy for retention. Theprimary completion rate for thecountry was 61.4% in 1999-2000 - only slightly up from58.7% in 1993-99 - with large
interstate variations. Forinstance, Kerala had the highestrate (92.1%), followed by Goa,Maharashtra, Karnataka andTamil Nadu. The Northeasternstates and Bihar, MadhyaPradesh, Uttar Pradesh andRajasthan rank at the bottom,with primary completion rates of50% or lower. Intra-statevariations in the primarycompletion rate are also verylarge (Figure vi).
Analysis of unit-record datafrom the NSS 55th round showsignificant associations of the age-specific primary enrollment rate,net primary enrollment rate, andprimary completion rate with:
household living standards (asproxied by per capita consumptionexpenditure), affiliation tohistorically-disadvantaged socialgroups (such as scheduled castesand tribes), adult male and femaleschooling in the household,electricity coverage, and the levelof economic development in astate (as proxied by gross domesticproduct per capita). Better roadaccess has a significant associationwith primary completion but notwith enrollment. Governmentexpenditure on elementaryeducation per child 6-14 years in astate also has strong positiveassociations with primary schoolattendance and primarycompletion (but not with regularschool attendance).
The results also suggest thatcrime against women, as proxiedby the number of cognizablekidnappings of women and girlsper capita in a district, is inverselyassociated with both schoolattendance and completion forgirls.
The results with respect toschool infrastructure areinteresting. The availability ofprimary schools per 1,000children aged 6-11 in a district -an indicator of schoolingquantity - is strongly andpositively associated with schoolattendance, but not withprimary completion, among 6-11 year olds. On the other hand,an increase in the pupil-teacherratio at the primary level in adistrict - an indicator of poorquality of schools - is associatedwith lower rates of school
9
Executive Summary
Primary completion rates, 1999-2000
Completion Rates
>= 8070 to 79 60 to 69 50 to 59 45 to 49 0 to 44
Missing
Figure vi : Regional estimates of the primary completion rateamong 12-years olds, 1999-2000
attendance and primarycompletion. This suggests thatschool attendance is currentlyconstrained in India by theavailability of primary schools;hence, expanding the number ofprimary schools (in relation tothe population of 6-11 yearolds) would be associated withan increase in the schoolattendance rate. On the otherhand, quality improvements,such as a reduction in the pupilteacher ratio, would beassociated with an increase inprimary completion (as well asin school attendance).
A simulation analysisusing the multivariate modelsestimated above suggests thatsimultaneous pursuit of severalinterventions - economicgrowth, growth of governmentexpenditure on elementaryeducation, electricity coverage,expansion of male and femaleadult schooling, an increase inthe number of primary schoolsper 1,000 children aged 6-11,and a reduction of the pupil-teacher ratio - would beassociated with a 31.5percentage point increase in theschool attendance rate in thepoor states by 2015 - enoughfor them to attain universalprimary enrollment. However,the same package ofinterventions would beassociated with an increase ofonly about 27 percentage
points in the net primaryenrollment rate by 2015 - wellshort of the 50 percentagepoints needed to attain the MDgoal. These results suggest thatwhile it may be possible to getall children aged 6-11 in thepoor states in school by 2015with concerted action on manyfronts, raising the net primaryenrollment or attendance rateto 100% will be significantlymore challenging.
A comparable simulationanalysis of primary completionin the poor states suggests that,with a combination of the fore-mentioned interventions,3 theprimary completion rate islikely to increase by about 29percentage points by 2015 -significantly short of the 46percentage point increase thatwould be needed to attain theMD goal of 100% primarycompletion. The simulationresults thus highlight thechallenges that the Governmentof India is likely to face as itattempts to accomplish itsambitious goals of universalelementary schooling andcompletion by 2010.
It is important to note thatattainment of the education-relatedMDGs in India will require, inaddition to the interventionsdiscussed earlier, broad-ranginginstitutional reform in theeducation sector. Various surveys
indicate that the rates of teacherabsenteeism in government schoolsare very high in India, with thesituation often being worse in thepoor states. Teacher absenteeism isa reflection of the larger problem oflack of accountability of schooladministrators and teachers tostudents and their parents. Whilethere are no simple solutions to thisproblem, evidence from othercountries suggests the need forinstitutional reform that empowerscitizens and communities to hold the state accountable forschool performance, devolvesadministrative and financialpowers to communities, providesgreater autonomy to schools,involves parents in schoolmanagement, and motivates front-line workers to provide better-quality schooling.
Gender Disparity inSchool Enrollments
Another of the MD goals isto eliminate gender disparities inschooling, such that the ratio ofgirls to boys enrolled at allschooling levels, but particularlyat the primary and secondarylevels, is 100%.
School-based administrativedata suggest that India has madeimpressive gains in reducing themale-female gap in the grossprimary enrollment rate in thelast fifty years, with the ratio ofthe female to male gross primaryenrollment rate nearly doubling
10
Attaining the Millennium Development Goals in India
3 The package of interventions considered for primary completion is slightly different from that for enrollments. First, increasingthe number of primary schools per 1,000 children aged 6-11 is dropped from the projection (as it is not significantly associatedwith primary completion). Second, increased availability of village roads is included in the projection, as it is significantlyassociated with primary completion (but not with primary enrollment).
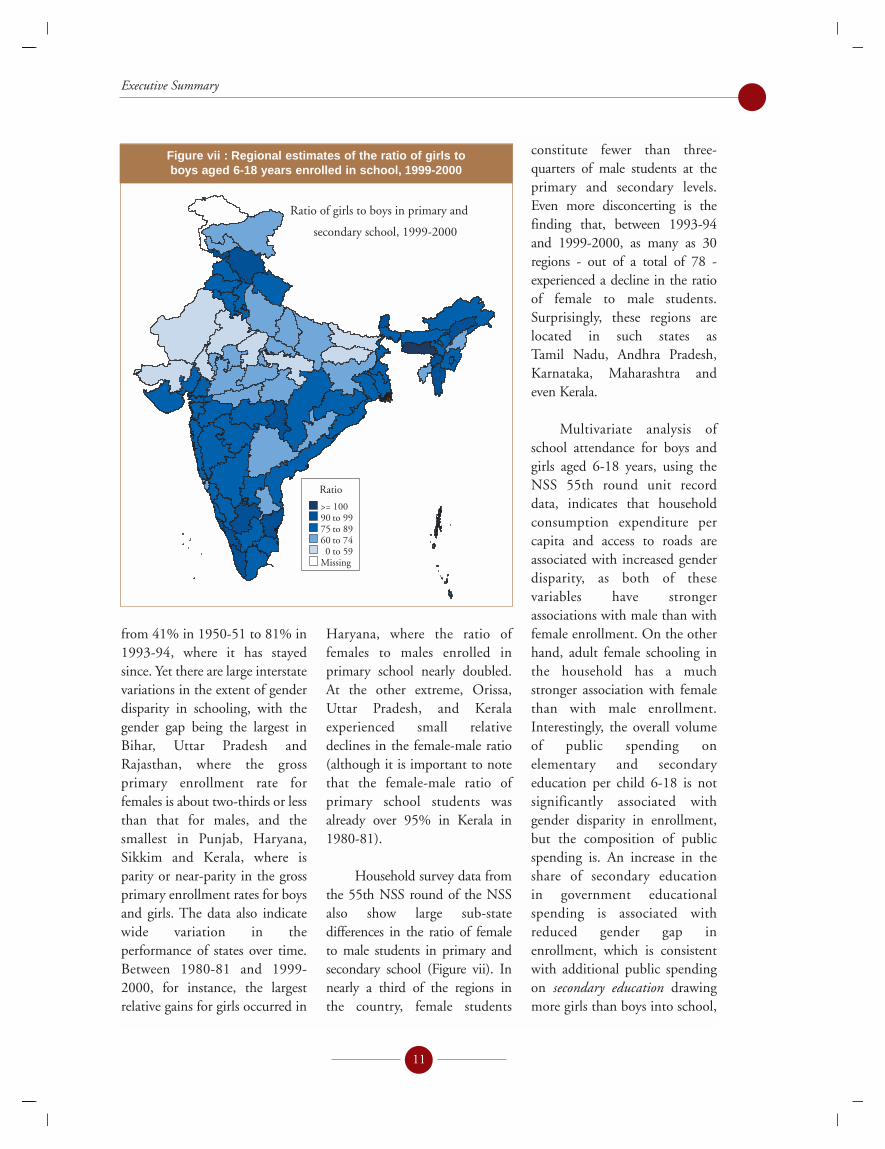
from 41% in 1950-51 to 81% in1993-94, where it has stayedsince. Yet there are large interstatevariations in the extent of genderdisparity in schooling, with thegender gap being the largest inBihar, Uttar Pradesh andRajasthan, where the grossprimary enrollment rate forfemales is about two-thirds or lessthan that for males, and thesmallest in Punjab, Haryana,Sikkim and Kerala, where isparity or near-parity in the grossprimary enrollment rates for boysand girls. The data also indicatewide variation in theperformance of states over time.Between 1980-81 and 1999-2000, for instance, the largestrelative gains for girls occurred in
Haryana, where the ratio offemales to males enrolled inprimary school nearly doubled.At the other extreme, Orissa,Uttar Pradesh, and Keralaexperienced small relativedeclines in the female-male ratio(although it is important to notethat the female-male ratio ofprimary school students wasalready over 95% in Kerala in1980-81).
Household survey data fromthe 55th NSS round of the NSSalso show large sub-statedifferences in the ratio of femaleto male students in primary andsecondary school (Figure vii). Innearly a third of the regions in the country, female students
constitute fewer than three-quarters of male students at theprimary and secondary levels.Even more disconcerting is thefinding that, between 1993-94and 1999-2000, as many as 30regions - out of a total of 78 -experienced a decline in the ratioof female to male students.Surprisingly, these regions arelocated in such states as Tamil Nadu, Andhra Pradesh,Karnataka, Maharashtra and even Kerala.
Multivariate analysis ofschool attendance for boys andgirls aged 6-18 years, using theNSS 55th round unit recorddata, indicates that householdconsumption expenditure percapita and access to roads areassociated with increased genderdisparity, as both of thesevariables have strongerassociations with male than withfemale enrollment. On the otherhand, adult female schooling inthe household has a muchstronger association with femalethan with male enrollment.Interestingly, the overall volumeof public spending onelementary and secondaryeducation per child 6-18 is notsignificantly associated withgender disparity in enrollment,but the composition of publicspending is. An increase in theshare of secondary education in government educationalspending is associated withreduced gender gap inenrollment, which is consistentwith additional public spendingon secondary education drawingmore girls than boys into school,
11
Executive Summary
Ratio of girls to boys in primary and
secondary school, 1999-2000
Ratio
>= 10090 to 9975 to 8960 to 740 to 59
Missing
Figure vii : Regional estimates of the ratio of girls to boys aged 6-18 years enrolled in school, 1999-2000

at least in comparison toadditional public spending onprimary education.
Other variables that areassociated with reduced genderdisparity in enrollment in themultivariate analysis are thenumber of elementary andsecondary schools per child aged6-18, better access to electricity,and crime against women (asmeasured by the number ofcognizable kidnappings ofwomen and girls per capita).
Simulations based on themultivariate analysis suggest that apackage of interventionsimplemented gradually over thenext decade would be associatedwith a reduction of 3.6 percentagepoints (from about 13 percentagepoints in 1999 to 9.4 percentagepoints in 2015) in the gender gapin primary and secondaryenrollments - less than a third ofthe distance to the MD goal of azero gender gap.
One issue that thesimulation analysis in unable tohighlight is the role of incentivesin narrowing gender disparities.Since gender disparities inschooling outcomes are largely caused by parentaldiscrimination against the girlchild, public policies thatincrease the parental incentive to
invest in girls, such as tuitionwaivers for girls and femalestipends and scholarships, arelikely to work well in narrowingthe gender gap. An example of apolicy intervention that hasworked remarkably well innarrowing gender disparities insecondary school enrollments isthe Female Secondary SchoolStipend program in Bangladesh(see Box V.1). This programseeks to not only increase theenrollment of girls at thesecondary level but to also ensurethat most of them are retaineduntil graduation from secondaryschool. Many states in India alsosubsidize the schooling of girls invarious ways.
Finally, it is important toreiterate the message that a simpleexpansion of school capacity or introduction of a femalescholarship program will notwork unless it is accompanied by broad-ranging institutionalreform to reduce teacherabsenteeism and to make schoolsand school managers moreaccountable to students and thecommunity.
Hunger-povertyThe last millennium
development goal we considerin this report is the reduction ofhunger-poverty. The goal hereis to halve the proportion of
people who suffer from hungerbetween 1990 and 2015.4 ForIndia, this would meanbringing down the headcountratio of calorie deficiency from 62.2% in 1990 to 31.1%in 2015.
Calorie deficiency ispervasive in India. In 1999-2000,more than one-half (53%) ofIndia's population consumedfewer calories than it required -down from a level of 60% in1993-94. This is nearly doublethe estimated national incidenceof consumption poverty of 22-26%. There are large interstatevariations in the extent of hunger-poverty, with Assam topping the list with nearly 78% of the population being caloriedeficient. The other Northeasternstates, Goa and Andhra Pradeshalso have very high proportions ofcalorie-deficient population. Atthe other extreme, Jammu &Kashmir, Rajasthan and UttarPradesh have the lowest rate ofcalorie deficiency (30-38%).
The rate at which hunger-poverty declined during the 1990salso varies significantly acrossstates. Uttar Pradesh as well asmany of the Northeastern states,such as Mizoram, Manipur,Arunachal Pradesh and Nagaland,experienced large declines (greaterthan 10%) in hunger-poverty
12
Attaining the Millennium Development Goals in India
4 Note that there is a separate MDG of halving, between 1990 and 2015, the proportion of people whose income is less than onedollar a day, which we do not consider. The notion of hunger-poverty differs from that of consumption- or income-poverty.Using household survey data on consumption of various foods and on the age, sex and occupations of different householdmembers, we have calculated calorie availability per capita to the household as well as calorie requirements (using normativeage-specific calorie requirements adjusted for heavy, moderate and sedentary work). Individuals residing in households whosecalorie requirements exceed availability are considered calorie-deficient or hunger-poor. In 1999-2000, the rate of hunger-poverty so defined was 53% in India, as compared to a consumption-poverty rate of 22-26%.

between 1993-94 and 1999-2000,while four states - Haryana,Assam, West Bengal and Jammu& Kashmir - experienced anincrease in the incidence ofhunger. Within-state differencesare also large (Figure viii). Forinstance, the incidence of hunger-poverty varies from 48% to 75%within the state of Gujarat.
Multivariate analysis ofcalorie deficiency indicates thatadult schooling in a household -both that of males and females -is strongly associated with areduction of hunger-poverty.Rural households and farmhouseholds are less likely to be hunger-poor than urban and non-farm households,
respectively, reflecting theimportance of land in reducingvulnerability. Availability ofelectricity is not a significantcorrelate of calorie deficiency,but access to safe drinking wateris, particularly in the poor states.Access to roads also has a strongnegative effect on hunger-poverty in both poor and non-poor states, but the effect isnearly two times as strong in thepoor states.
Production of food in adistrict and household access toland, particularly irrigated land,are associated inversely withcalorie deficiency, with theassociations being much strongerin the poor states than in the
non-poor states. This suggeststhat, even after controlling forother factors, access to the meansof food production reduces therisk of hunger and caloriedeficiency for individuals andhouseholds.
Finally, the empirical resultsindicate a very strong associationbetween economic growth andcalorie deficiency, with a onepercent increase in meanconsumption expenditure percapita in a district being associatedwith a 0.26% reduction in theincidence of hunger-poverty.
Simulations based on themultivariate analysis discussedabove suggest that the proportionof the calorie-deficient populationin the poor states is likely todecline by about 14 percentagepoints (from 47% to 33%) from1999 to 2015 with a package of sixinterventions (excluding economicgrowth) - just slightly short of theMD goal. However, the seventhintervention - viz., generaleconomic growth resulting in a3% annual rise in mean districtconsumption expenditure percapita - is associated with a furtherreduction of 12 percentage pointsin the calorie deficiency rate. Thisimplies that, together, the seveninterventions considered will easilyallow the hunger-poverty MDG tobe attained by 2015, even in thepoor states of the country.
ConclusionsThere are several major
findings and implications forpolicy that come out of thisreport. First, there are very large
13
Executive Summary
% of population that is
calorie-deficient, 1999-2000
% of population
>= 7060 to 6950 to 5940 to 49 0 to 39 Missing
Figure viii : Regional estimates of the percentage of population that is calorie deficient, 1999-2000

disparities across different statesand regions of India in terms of their performance on the millennium developmentindicators. Some regions ranklow on some MD indicators butnot on others. However, thereare 18 in the country that rankconsistently low on three ormore of the five MD indicatorsconsidered in this report (Figureix). Of these, 8 regions rankconsistently low on 4 or moreindicators, while two regionsrank low on all five indicators.These two regions are the South-Western region of MadhyaPradesh and the Southern regionof Rajasthan. In a sense, these are the most deprived regions inthe country.
The inter- and intra-statedisparities have importantimplications for the targeting ofinterventions and resources tothe lagging states and regions.But they also have anotherimportant implication - theneed for state-specificapproaches that allow for greater flexibility in addressingproblems. What works in a statesuch as Tamil Nadu may notwork well in another state, suchas Orissa. Even though healthand education are state-levelsubjects in India, the centralgovernment plays a strategic rolein these sectors via its centrally-sponsored schemes. In the caseof health, for instance, centrally-sponsored schemes account for a
large portion of the publichealth and reproductive healthactivities undertaken in a state.Likewise in the education sector,centrally-sponsored schemes,such as Operation Blackboard,finance a significant portion ofnon-salary costs of education inthe states. It will thus beimportant to make centrally-sponsored schemes more flexibleand more responsive to localconditions.
A second and relatedfinding of this report is thatmany of the millenniumdevelopment indicators havehigh levels of geographicalconcentration in India. Forinstance, one-fifth of the villagesand districts account for aboutone-half of all the infant deathsand underweight children in thecountry. Amazingly, three-quarters of all the out-of-schoolchildren aged 6-11 years areconcentrated in only 20% of thecountry's villages. Unfortunately,currently-available data do notallow us to identify these villages,because the sample surveys onthe basis of which theseobservations are made are notlarge or representative enough atthe village level. However,promising new methodologies,based on merging of householdsurvey and population censusdata, are available for identifyingspecific villages having the worsthuman development outcomes.It would be worthwhile toexplore the use of suchmethodologies to identify thevillages with the worst MDindicators in the country, so that
14
Attaining the Millennium Development Goals in India
Index Value
543< 3
Figure ix : Regions ranking among the lowest quartile of all regions in India on three or more of the five millennium
development indicators considered in this report, 1998-2000

policy interventions could bebetter targeted to these villages.
The results on geographicalconcentration of the MDindicators suggest that targetingresources and interventions tovillages and districts with theworst human developmentindicators is not only desirablefor improving equity, but willalso be the most effectivestrategy for attainment of theMDGs. How best to achieve thistargeting is an issue that wouldappear to merit priorityattention.
Third, there are other typesof disparities in most of the MDindicators, the reduction ofwhich would help in theattainment of the MDGs.Gender disparity is one example.It is estimated that overall childmortality in the country woulddrop by 20% if girls had thesame mortality rate as boysbetween the ages of 1 month and5 years. Likewise, the overallschool enrollment rate forchildren aged 6-11 years wouldincrease by about 7% if girls ofthese ages had the sameenrollment rate as boys. Amongolder children, the equivalentincrease in enrollment rateswould be even greater (about10% for 12-14 year olds and16% among children 15-18years of age). Just as geographicaltargeting is likely to narrow
regional disparities, targeting by gender can help reducegender inequalities. Since gender disparities in health and schooling outcomes arelargely caused by parentaldiscrimination against the girlchild, public policies thatincrease the parental incentive toinvest in girls, such as femalescholarships or health-caresubsidies for girls, are likely towork well in narrowing thegender gap. (Many states inIndia already subsidize theschooling of girls in variousways, although gender-targetedsubsidies for health-care andnutrition are much lesscommon.) Many empiricalstudies from around the world,including some evidencepresented in this report, suggestthat gender disparities in the health, schooling, andnutritional outcomes of childrentend to narrow with mother'sschooling, as mothers (relative tofathers) tend to invest more intheir female children.5
Another manifestation ofdisparity in human developmentoutcomes is along caste and triballines. Scheduled tribes and, inmany cases, scheduled castes havesignificantly higher levels of infantmortality and child malnutritionand significantly lower levels of schooling indicators thanmainstream groups. For instance,infant mortality among scheduled
tribes in the poor states is 60% greater than among other population groups aftercontrolling for living standards,adult schooling, and othercharacteristics. Given that thesegroups constitute between one-quarter and one-third of the totalpopulation of the poor states inthe country, improving their MDindicators would help significantlyin the attainment of the MDGs inthese states. It is likely that manyof the villages identified in thisreport as having the heaviestconcentration of infant deaths andunderweight and out-of-schoolchildren are, in fact, scheduledtribe/caste villages. If so, targetedinterventions to these villageswould achieve the dual objectivesof reducing geographical as well ascaste disparities. For severaldecades, India has had anextensive system of quotas andreservations for scheduled castesand tribes in employment andhigher education opportunities,but the results in this reportsuggest that targeting maternaland child health, child nutrition, and primary schoolinginterventions to scheduled castesand tribes is equally important.6
Fourth, there is evidence ofsignificant synergies among thedifferent MDGs. For instance, areduction in the proportion ofunderweight children is stronglyassociated with a reduction of child mortality. Although
15
Executive Summary
5 This is not always the case, however. For instance, it has been observed that excess female child mortality is even morepronounced among better-schooled women relative to women with no schooling, at least in rural Punjab (Das Gupta 1987).
6 Most state governments in India do offer incentives, such as free textbooks and uniforms, to primary school-aged childrenbelonging to scheduled castes and tribes.
maternal mortality is an MDindicator that has not beenanalyzed in this report, it is clearthat interventions that reducematernal mortality, such as tetanus immunization,expansion of antenatal carecoverage, and an increase in theratio of professionally-attendeddeliveries, will also bring aboutlarge reductions in infant(especially neonatal) mortality.Likewise, reducing childmalnutrition is likely to result inimprovement in both schoolingquantity and quality, as betternourished children are morelikely to attend school andperform better in school. Thusthere are synergies amongst theMDGs that will help in theirattainment, which implies thatproceeding with simultaneousaction on all these measures willhave the greatest impact onattainment of the MDGs.
Fifth, despite appreciableimprovement in many of the millennium developmentindicators during the 1990s, theanalysis in this report suggests thatattainment of the MDGs (at leastthe five specific goals considered inthis report) will remain extremelychallenging in the poor states ofIndia. Yet attainment of the MDGsby the poor states - most notably,Bihar, Uttar Pradesh, MadhyaPradesh, Orissa and Rajasthan - iscritical to MDG attainment by thecountry as a whole, because these states currently account for a disproportionately largeproportion of the country'spopulation (and will account for aneven larger population share by
2015 owing to more rapidpopulation growth).
Despite the grim situation,the poor states should be able to meet the MDGs relating to infant mortality, childmalnutrition, and hunger-poverty with a combination ofinterventions, including sector-specific interventions (such as nutrition supplementation and immunization), economicgrowth, improved coverage ofinfrastructure, and wide-rangingreforms in the institutions ofservice delivery. However,attaining the education goals willrequire considerably more effort.This report concludes that whilesubstantial progress could bemade by the poor states onincreasing the rates of netprimary enrollment and primarycompletion, it will be challengingfor them to attain the education-related MDGs of 100% netprimary enrollment and 100%primary completion, in large partbecause of the enormous gapbetween their current rates of net primary enrollment andcompletion (only 50% and 54%,respectively) and the MD targets. The simulation analysis also suggests that completeelimination of the gender gap in primary and secondaryenrollment, called for by theMDGs, will be a very challenginggoal to attain.
Sixth, the simulationscarried out in this report indicatethat, in the poor states, economicgrowth that brings about animprovement in household living
standards is strongly associatedwith virtually every MDindicator. For example, realeconomic growth of 3% perannum in the poor states couldalone bring down the childunderweight rate from 51% in1999 to 37% in 2015. This isnearly two-thirds of the totaldecline in the child underweightrate needed to be attainedbetween 1999 and 2015 to meetthe nutrition MDG. Likewise,3% annual growth could bringabout an increase in the netprimary enrollment rate from50% in 1999 to 74% in 2015 inthe poor states - about one-half ofthe total increase in the netprimary enrollment rate neededto be attained between 1999 and2015 to meet the schooling-related MDG. Another exampleof the important role ofeconomic growth on MDGattainment is provided by theestimates that suggest that a realgrowth rate of 3% would beassociated with a 12 percentagepoint decline in the incidence ofhunger-poverty - nearly three-quarters of the total declineneeded to be attained between1999 and 2015 to attain the MDgoal of halving poverty. In otherwords, rapid economic growthcould make a very significantcontribution to an improvementin most MD indicators by 2015.
In spite of the strongassociations between improvementsin MD indicators and economicgrowth in the poor states, the latterhave actually experienced anemicgrowth over the last two decades.Bihar's real GSDP per capita has
16
Attaining the Millennium Development Goals in India

grown at less than 1% per annumbetween 1980 and 1999, whileOrissa and Uttar Pradesh have seenannual real growth rates of about2% or less. In contrast, states suchas Maharashtra, Gujarat andKarnataka have seen theireconomies expand at real per capitarates of 4% or more over the sametime period. What these resultsunderscore is the importance ofaccelerating economic growth inthe poor states to speed progresstoward the MDGs. It is beyond thescope of this report to discuss theprecise mechanisms by whichgrowth in the poor states could bestimulated, but investment inphysical and social infrastructure,combined with improvedgovernance, would probably ranknear the top of the list.
Seventh, this report alsoindicates the importance ofinfrastructure in attaining theMDGs. For example, simplybringing the poor states to the(average) levels of road, electricityand sanitation coverage in thenon-poor states would beassociated with reductions of 6.2percentage points (or 12%) in theproportion of underweightchildren and of 13.2 deaths per1,000 live births (or 18%) in theinfant mortality rate. Universal(100%) road, electricity andsanitation coverage in the poorstates would be associated withreductions of 40% in the childunderweight rate and of 60% inthe infant mortality rate. Theestimated associations betweenschooling outcomes and physicalinfrastructure are generallysmaller, but the results
still suggest that universalelectrification in the poor stateswould be associated withincreases of 7 percentage point inthe school attendance rate (for 6-11 year olds), 5 percentage pointsin the net primary enrollmentrate, and 5 percentage points inthe primary completion rate. Allof these associations are mostlikely underestimated, since theydo not consider the indirectassociation between infrastructureand the MD indicators via thepositive association betweeninfrastructure and gross statedomestic product.
Eighth, consistent with thefindings of numerous empiricalstudies from around the world,this report finds evidence ofstrong associations betweenfemale adult schooling andvirtually every MD indicatorconsidered. An additional year ofmother's schooling is associatedwith a reduction of 4% in infantmortality and 3% in childunderweight rates and withincreases of 1-2% in the netprimary enrollment and primarycompletion rates. In addition,each additional year of adultfemale schooling is associatedwith a reduction in the incidenceof hunger-poverty by about 1.5%and of gender disparity in schoolenrollment by as much as 8%.
These results suggest thatthe large increases in girls' schoolenrollment that are likely to occurin the coming years (in part dueto the Government of India'sSarva Shiksha Abhiyan initiative)will fuel major improvements in
all of the MD indicators. Ofcourse, given the lag between agirl's attendance in elementaryschool and the birth of herchildren (especially sinceschooling typically delays bothage at marriage and age of firstbirth), increases in female primaryenrollments may not show theirfull effects on fertility, child andinfant mortality, child nutrition,and child schooling for severalyears (perhaps, a decade orlonger). However, increases infemale secondary enrollments arelikely to show their results muchsooner - well before 2015, theMDG reference year.
Ninth, notwithstanding theimportance of the generalinterventions discussed above (e.g.,economic growth, infrastructureexpansion, and female schooling),the analysis in this report suggeststhat carefully-targeted, sector-specific interventions will also beimportant in attaining the MDGs. For instance, a packageconsisting of expanded child and maternal immunization,antenatal care coverage, nutritionalsupplementation (includingpromotion of exclusive breast-feeding), and home-basedneonatal services (includingtreatment of pneumonia) is likelyto bring about significantreductions in both infant mortalityand child malnutrition. Likewise,our results suggest that anexpansion in the number ofprimary schools would improveaccess and likely raise school andprimary school attendance ratesamong 6-11 year olds, while alowering of the pupil-teacher ratio
17
Executive Summary

at the primary level would raiseprimary completion rates. Theseresults are consistent with evidencefrom around the world thatexpanded school access is typicallywell-targeted to the poor, sincepoor students are almost alwaysthe last to be enrolled in acommunity.
Tenth, while this report hasidentified the key interventions thatare likely to speed attainment of theMDGs, especially in the poorstates, it has not prioritized theseinterventions. The reason for this isthat prioritization of interventionsshould in part be based on the cost-effectiveness of these interventions,and the calculation of cost-effectiveness entails detailedknowledge of the costs of eachintervention. The latter is nottrivial, especially when theinterventions span several sectors(education, health, nutrition, ruralinfrastructure, etc.). However, thisis clearly the next step in thisresearch. In order to come up witha detailed road map for attainingthe MDGs, it will be essential toundertake the costing of each of theinterventions considered andproposed in this report.
Eleventh, none of the fore-mentioned interventions are likely
to work unless they aresimultaneously accompanied bysystematic reform of theinstitutions of service delivery inIndia. Additional schools areunlikely to increase enrollment orschool completion if teachersfrequently are absent from school.A package of home-basedneonatal services is unlikely toreduce neonatal mortality rates ifhealth workers are not sufficientlymotivated to reach out into thecommunity and deliver thepackage of services to the poorand most-at-risk. The problem ofmaking publicly-provided serviceswork, especially for the poor, hasreceived a great deal of attentionin the World DevelopmentReport 2004. The poor states ofIndia typically have the mostserious problems with governanceand service delivery in the social(and other) sectors. Better deliveryof public services - whether inhealth, schooling, nutrition, orinfrastructure - is a complex anddifficult task that entails creationof the right institutions andincentives, including devolvingresponsibility for service deliveryto local governments andcommunities, contracting outcertain types of service delivery tothe non-government sector,empowering consumers to
demand better services fromgovernment health facilities,introducing competition amongpublic providers, and ensuring themotivation of front-line workers.
Finally, the importance ofsystematically monitoring MDoutcomes at disaggregatedlevels and evaluating theimpact of public programscannot be overemphasized.This report has highlighted thepaucity of reliable, district-level data on most MDindicators. The lack of suchdata makes it virtuallyimpossible to monitor progresstoward attainment of theMDGs at lower levels ofadministration. In addition,despite the fact that much hasbeen spent by the governmenton public programs such as theIntegrated Child DevelopmentServices and the DistrictPrimary Education Program,these programs have not been adequately subjected to rigorous, independentevaluation. In order to choosethe right set of interventionswith which to attain theMDGs, it is critical to knowwhich programs have beensuccessful in improving MDindicators and which have not.
18
Attaining the Millennium Development Goals in India