Embed Size (px)
Citation preview

1© Copyright 2012 EMC Corporation. All rights reserved.

2© Copyright 2012 EMC Corporation. All rights reserved.
Niels RoetertPre-Sales Technical SpecialistMid-Tier Storage Division
FLASH 1ST
THE STORAGE STRATEGY FOR THE NEXT DECADE
3© Copyright 2012 EMC Corporation. All rights reserved.
2000 2003 2006 2009 2012 2015 2018 2021
140,000
60,000
100,000
40,000
120,000
80,000
20,000
0
Information Tipping Point AheadThe Future Will Be Nothing Like The Past
Data
Budget
Automation
WeWeWeWeareareareareHereHereHereHere
110XMORE DATA
EACH DECADE
A 10TB Data Center In 2001 Growing At 60% Y/Y Will Be A 120 Petabyte Data Center By 2021, - But IT Budgets Remain Flat
4© Copyright 2012 EMC Corporation. All rights reserved.
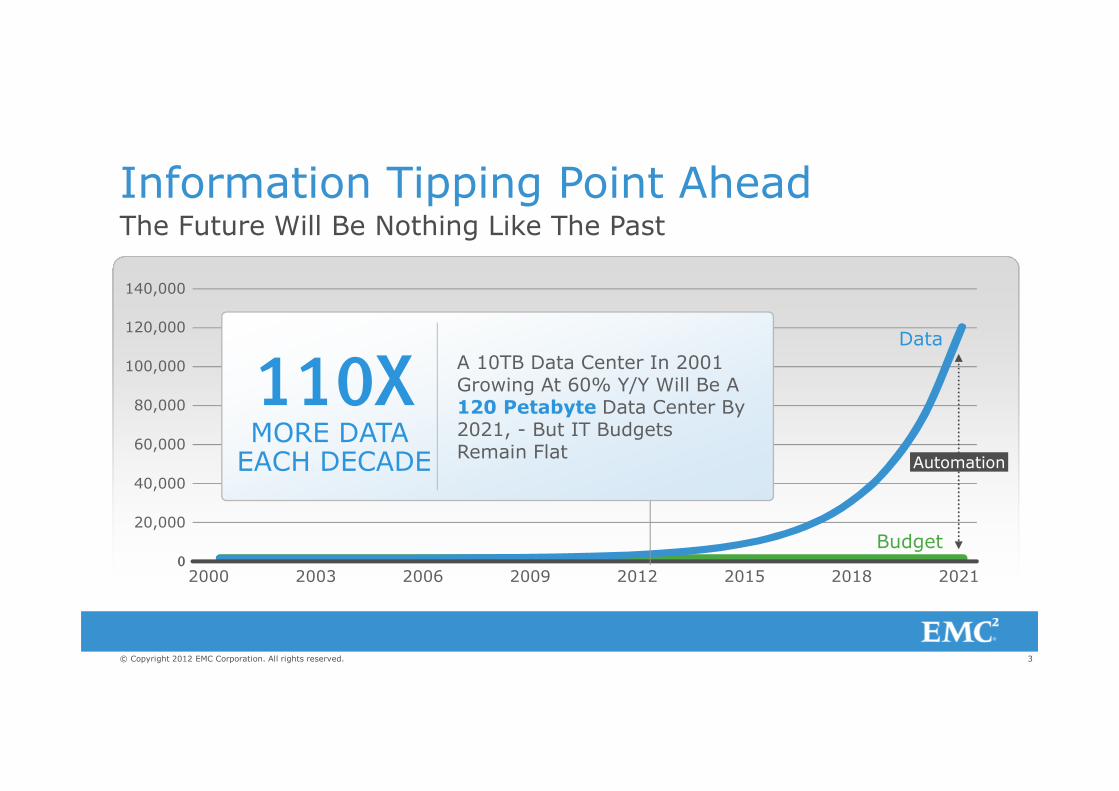
4,1234,1234,1234,123
TBTBTBTB
Most Data Will Be Stone ColdWhile We Increasingly Can’t Erase Data, We Can Store It Better
2011
2021
37.537.537.537.5
TBTBTBTB
Hot Warm Cold
Evolution Of 50 TBs In 10 Years
110 X
5© Copyright 2012 EMC Corporation. All rights reserved.
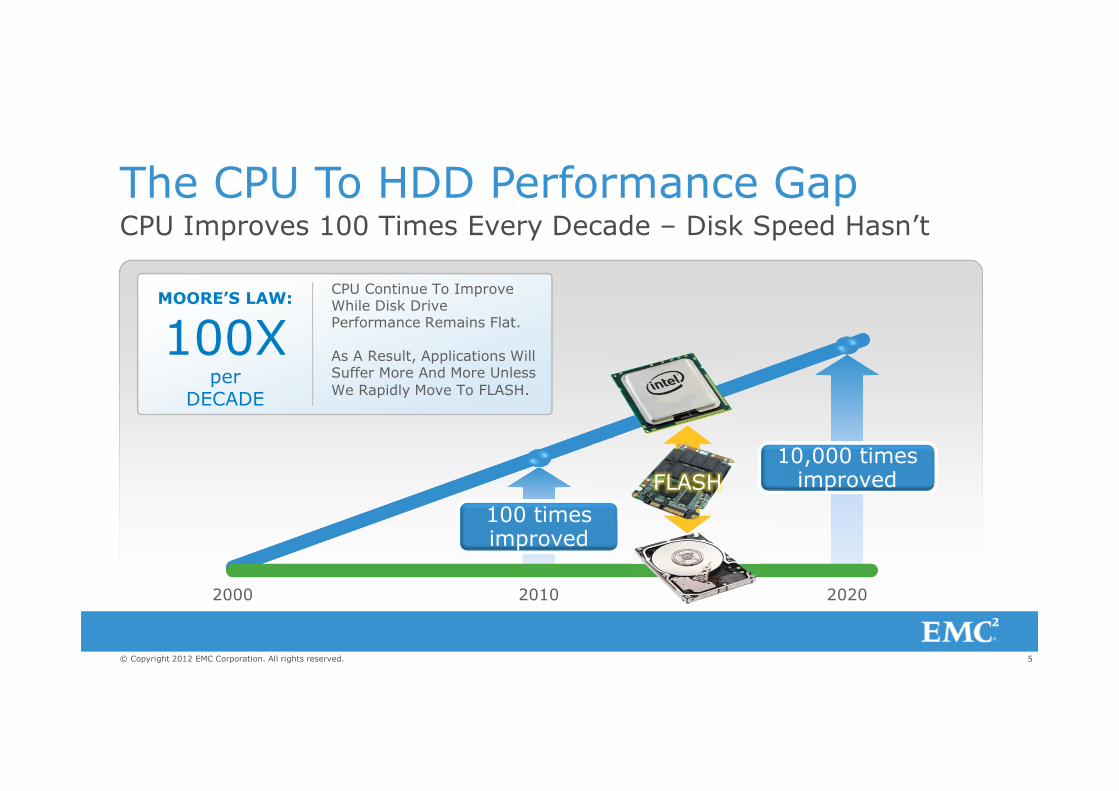
The CPU To HDD Performance GapCPU Improves 100 Times Every Decade – Disk Speed Hasn’t
100 times improved
10,000 times improvedFLASH
2000 2010 2020
MOORE’S LAW:
100Xper
DECADE
CPU Continue To Improve While Disk Drive Performance Remains Flat.
As A Result, Applications Will Suffer More And More Unless
We Rapidly Move To FLASH.
6© Copyright 2012 EMC Corporation. All rights reserved.
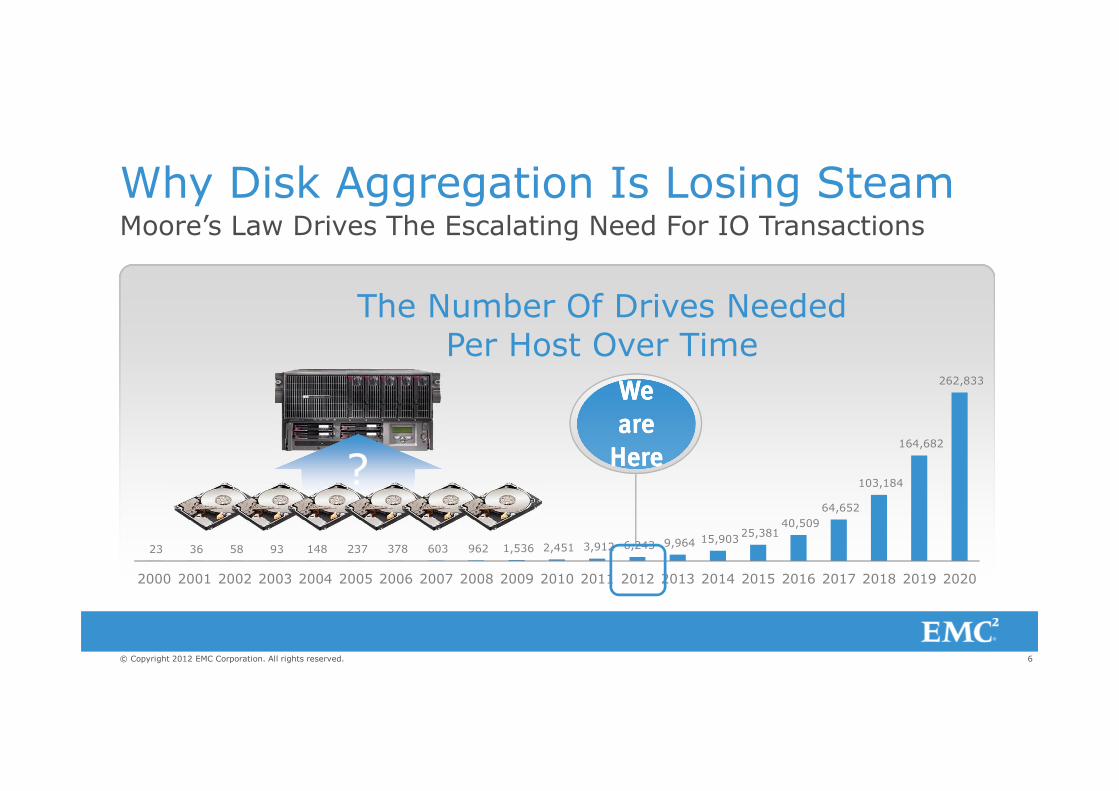
Why Disk Aggregation Is Losing SteamMoore’s Law Drives The Escalating Need For IO Transactions
23 36 58 93 148 237 378 603 962 1,536 2,451 3,912 6,243 9,964 15,903 25,381
40,509
64,652
103,184
164,682
262,833
2000 2001 2002 2003 2004 2005 2006 2007 2008 2009 2010 2011 2012 2013 2014 2015 2016 2017 2018 2019 2020
The Number Of Drives Needed Per Host Over Time
?
WeWeWeWe
areareareare
HereHereHereHere
7© Copyright 2012 EMC Corporation. All rights reserved.
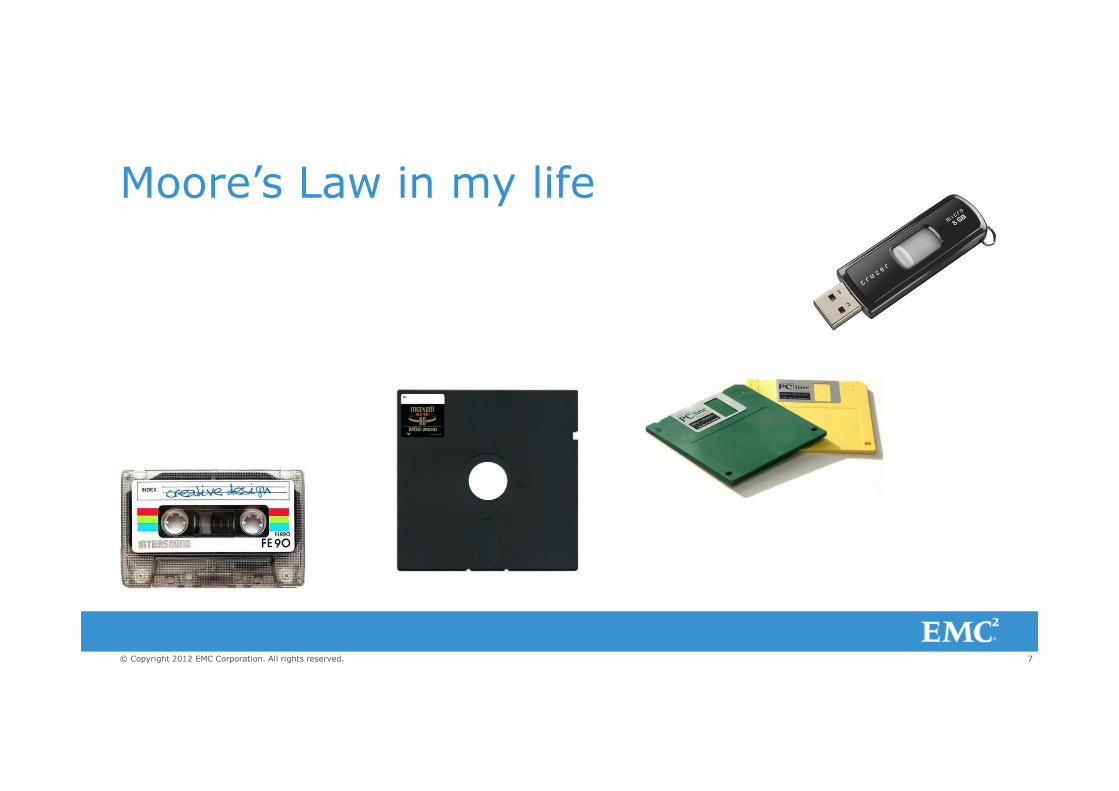
Moore’s Law in my life
8© Copyright 2012 EMC Corporation. All rights reserved.
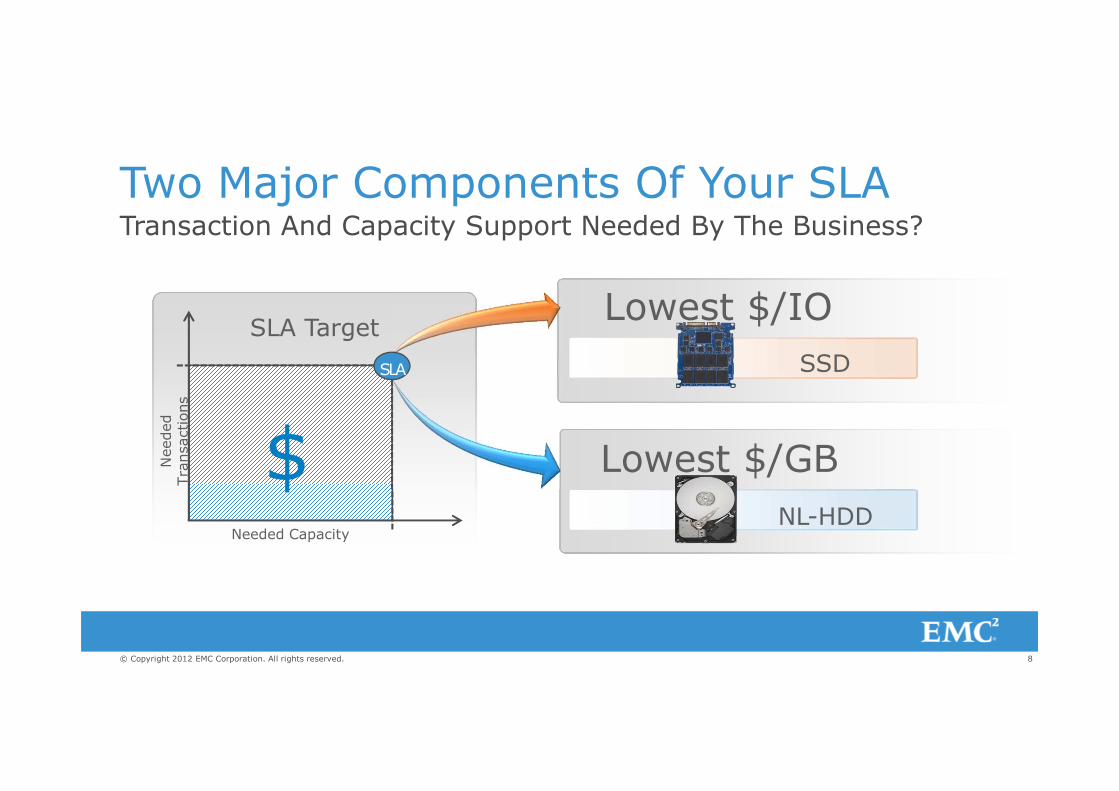
Transaction And Capacity Support Needed By The Business?
Two Major Components Of Your SLA
Needed Capacity
Needed
Tra
nsactions
$
Lowest $/IO
SSD
Lowest $/GB
NL-HDD
SLA
SLA Target
9© Copyright 2012 EMC Corporation. All rights reserved.
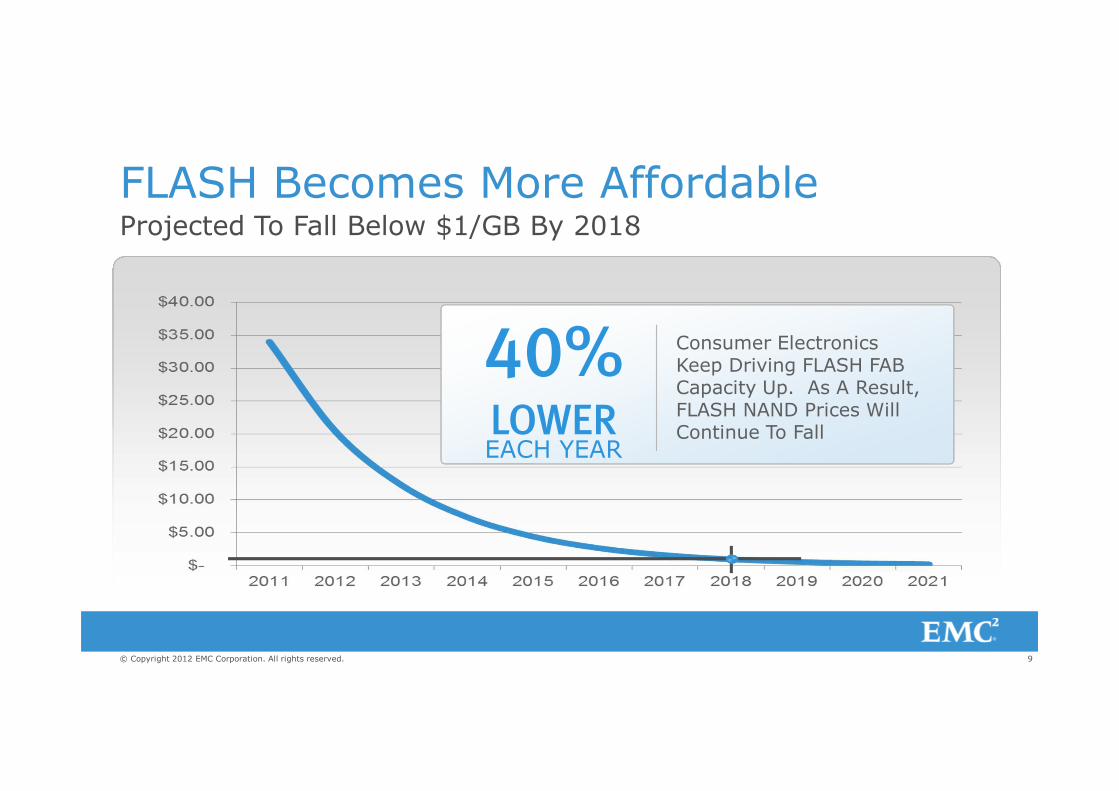
FLASH Becomes More AffordableProjected To Fall Below $1/GB By 2018
40%LOWEREACH YEAR
Consumer Electronics Keep Driving FLASH FAB Capacity Up. As A Result, FLASH NAND Prices Will Continue To Fall
10© Copyright 2012 EMC Corporation. All rights reserved.
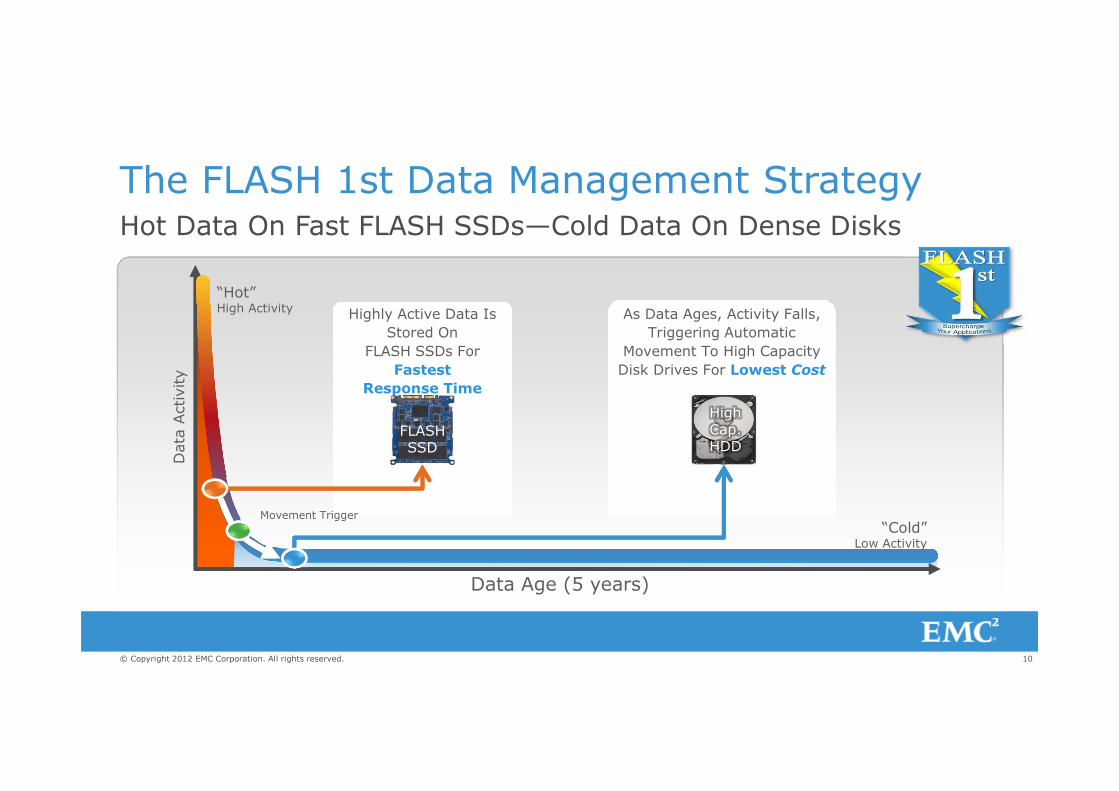
Hot Data On Fast FLASH SSDs—Cold Data On Dense Disks
The FLASH 1st Data Management Strategy
“Hot”High Activity As Data Ages, Activity Falls,
Triggering Automatic
Movement To High Capacity
Disk Drives For Lowest Cost
Highly Active Data Is
Stored On
FLASH SSDs For
Fastest
Response Time
Movement Trigger
FLASHSSD
“Cold”Low Activity
Data
Activity
High Cap.HDD
Data Age (5 years)
11© Copyright 2012 EMC Corporation. All rights reserved.
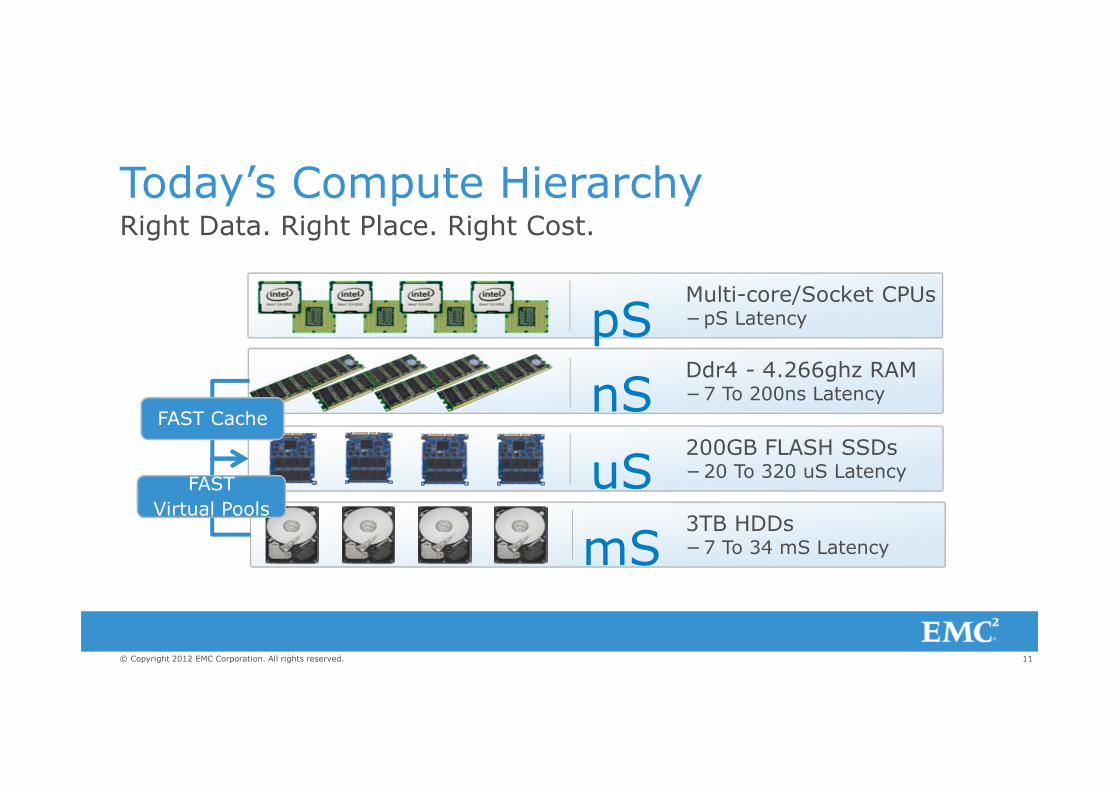
Today’s Compute HierarchyRight Data. Right Place. Right Cost.
Multi-core/Socket CPUs−pS Latency
Ddr4 - 4.266ghz RAM−7 To 200ns Latency
200GB FLASH SSDs−20 To 320 uS Latency
3TB HDDs−7 To 34 mS Latency
pS
nS
uS
mS
FAST Cache
FAST
Virtual Pools
FAST
Virtual Pools
12© Copyright 2012 EMC Corporation. All rights reserved.
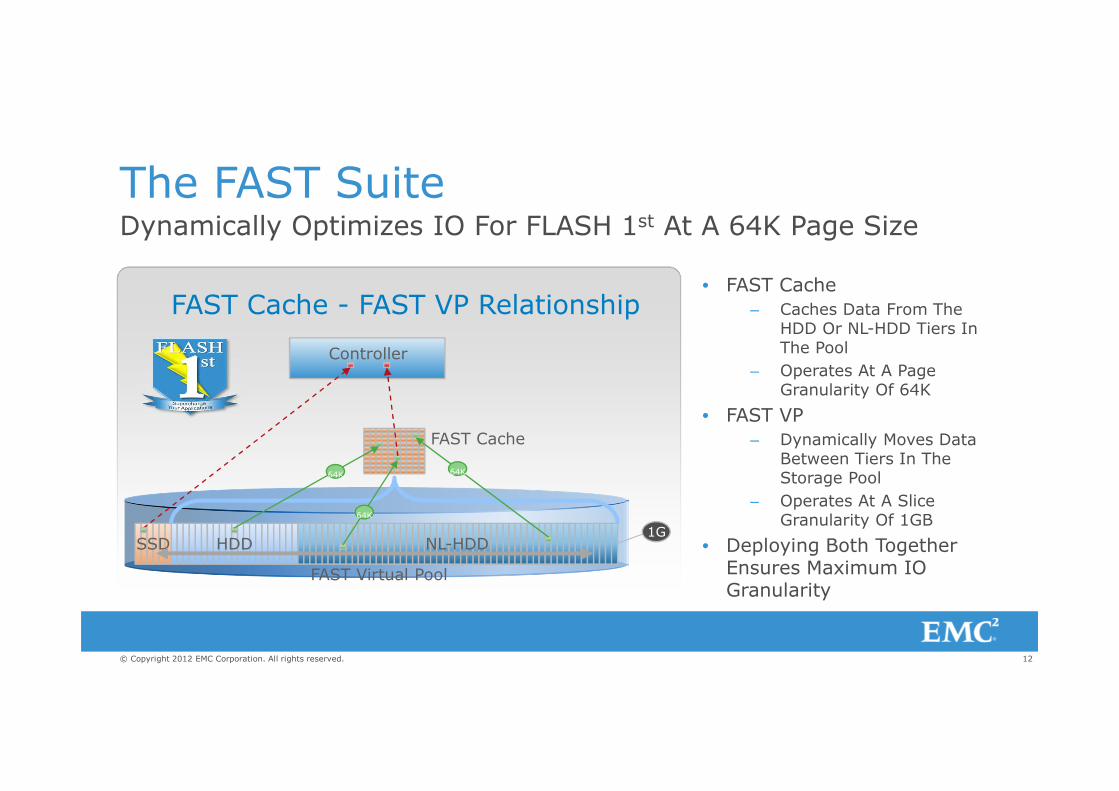
The FAST Suite Dynamically Optimizes IO For FLASH 1st At A 64K Page Size
• FAST Cache
– Caches Data From The HDD Or NL-HDD Tiers In The Pool
– Operates At A Page Granularity Of 64K
• FAST VP
– Dynamically Moves Data Between Tiers In The Storage Pool
– Operates At A Slice Granularity Of 1GB
• Deploying Both Together Ensures Maximum IO Granularity
64K64K
64K
Controller
FAST Virtual Pool
FAST Cache
NL-HDDHDDSSD1G
FAST Cache - FAST VP Relationship
13© Copyright 2012 EMC Corporation. All rights reserved.
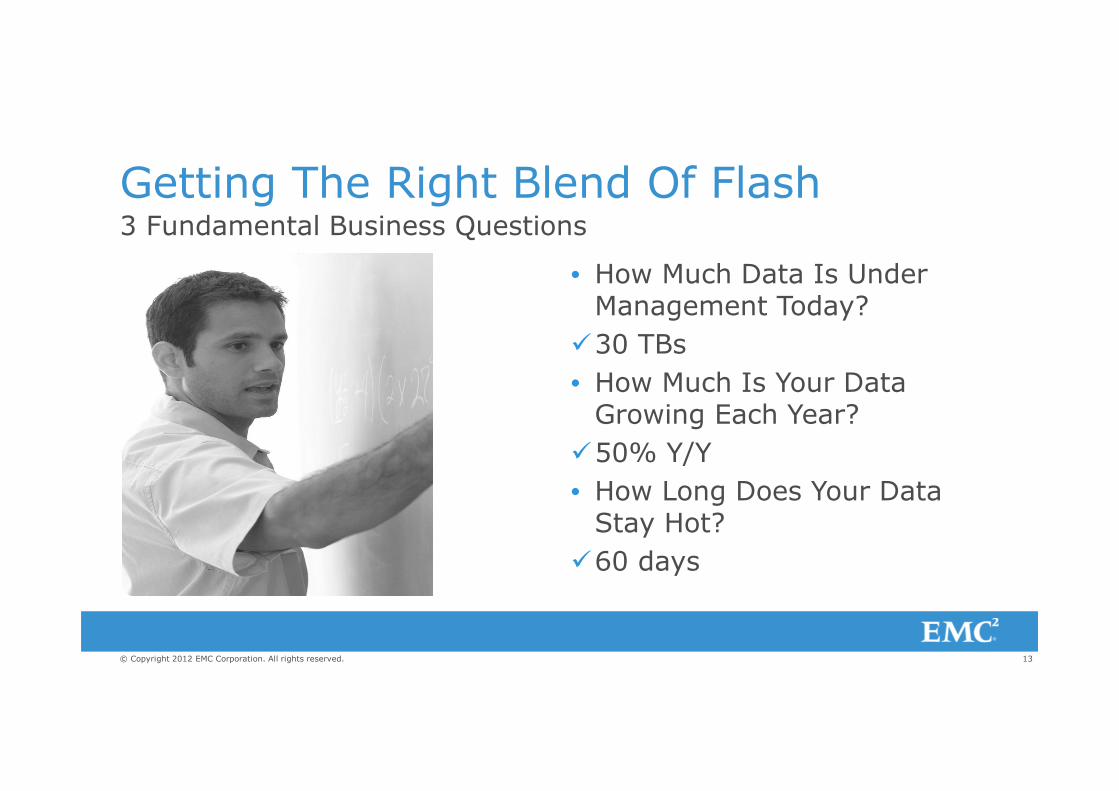
Getting The Right Blend Of Flash3 Fundamental Business Questions
• How Much Data Is Under Management Today?
�30 TBs
• How Much Is Your Data Growing Each Year?
�50% Y/Y
• How Long Does Your Data Stay Hot?
�60 days
14© Copyright 2012 EMC Corporation. All rights reserved.
How Long Does Your Data Stay Hot?
15© Copyright 2012 EMC Corporation. All rights reserved.
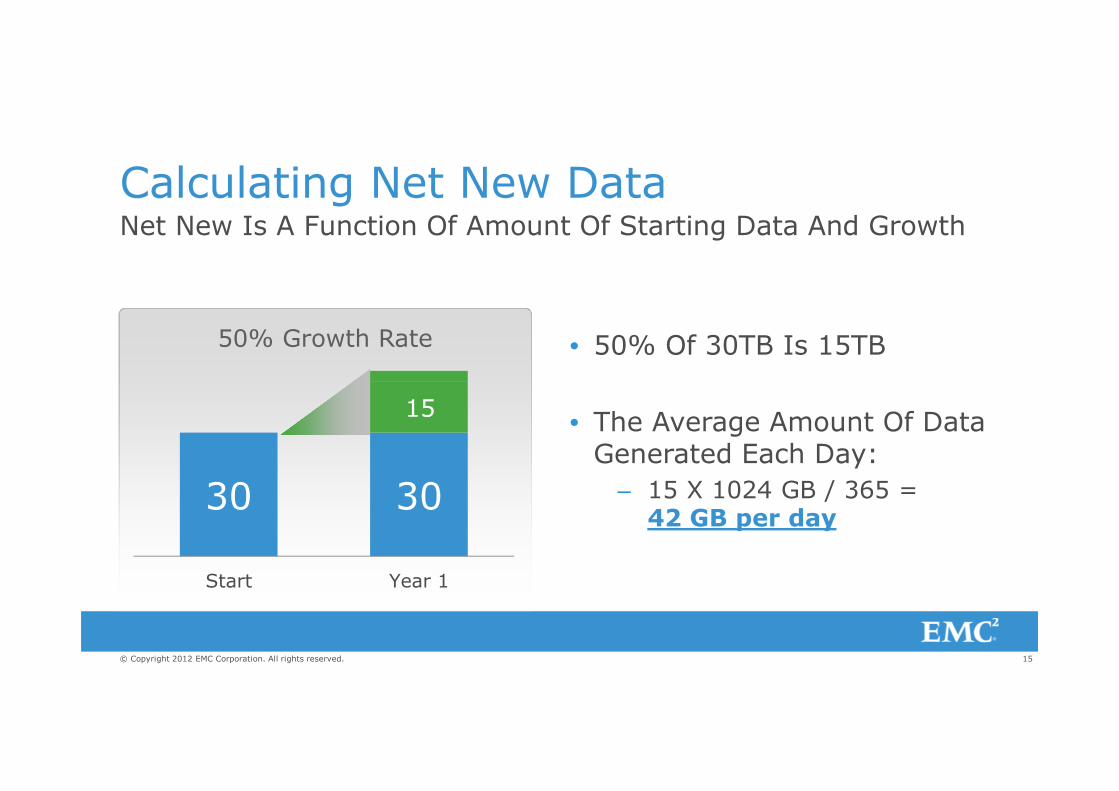
Calculating Net New DataNet New Is A Function Of Amount Of Starting Data And Growth
• 50% Of 30TB Is 15TB
• The Average Amount Of Data Generated Each Day:
– 15 X 1024 GB / 365 =42 GB per day
50% Growth Rate
30 30
Start Year 1
15
16© Copyright 2012 EMC Corporation. All rights reserved.
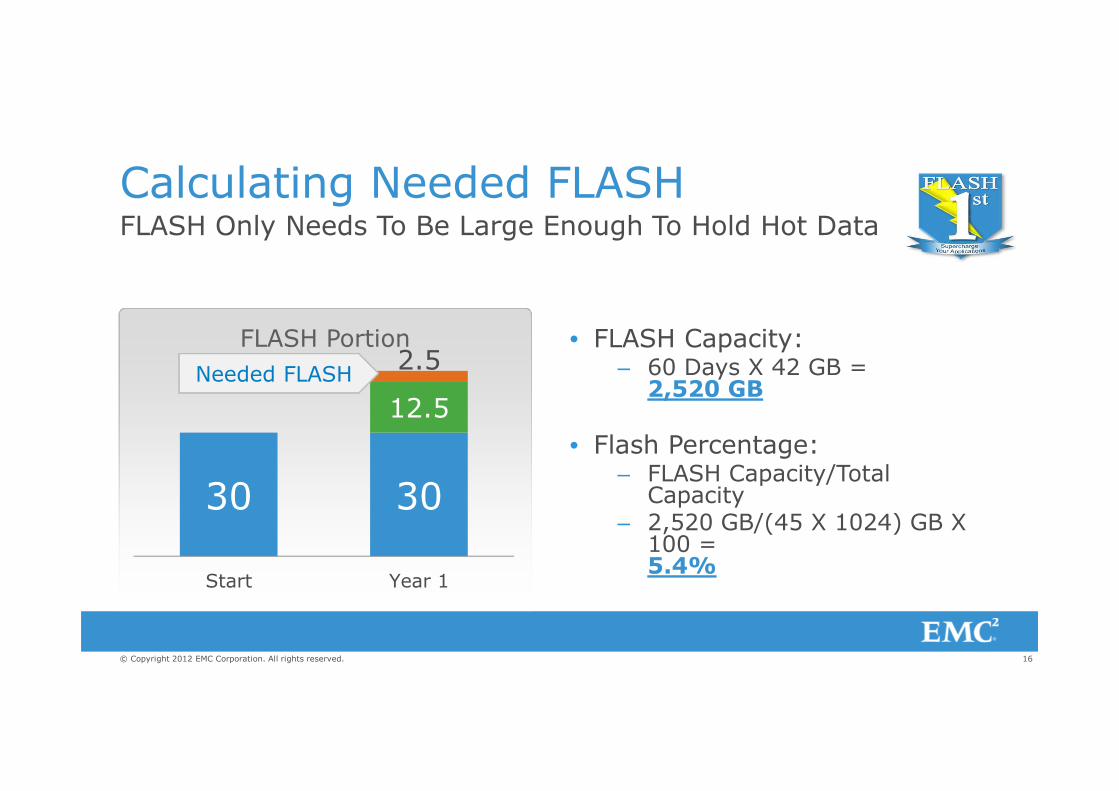
Calculating Needed FLASHFLASH Only Needs To Be Large Enough To Hold Hot Data
• FLASH Capacity:– 60 Days X 42 GB =2,520 GB
• Flash Percentage:– FLASH Capacity/Total
Capacity – 2,520 GB/(45 X 1024) GB X
100 = 5.4%
30 30
12.5
2.5
Start Year 1
Needed FLASH
FLASH Portion

17© Copyright 2012 EMC Corporation. All rights reserved.
Using The Business Data To ConfigureWith No Trace Data, The Model Is Used
SSD
NL-HDD
Hot
Cold
60 days
178 days
15K-HDD
3-TierFLASH 1st
Strategy
• The SSD Tier Retains A 80% Probability Of Data Re-use
• An 15K HDD Tier Is Used As Overflow With A 19% Chance Of Data Re-use
• Finally, The NL-HDD Tier Is Used For Long Term Online Storage With A 1% Chance And Lower Of Data Re-use
18© Copyright 2012 EMC Corporation. All rights reserved.
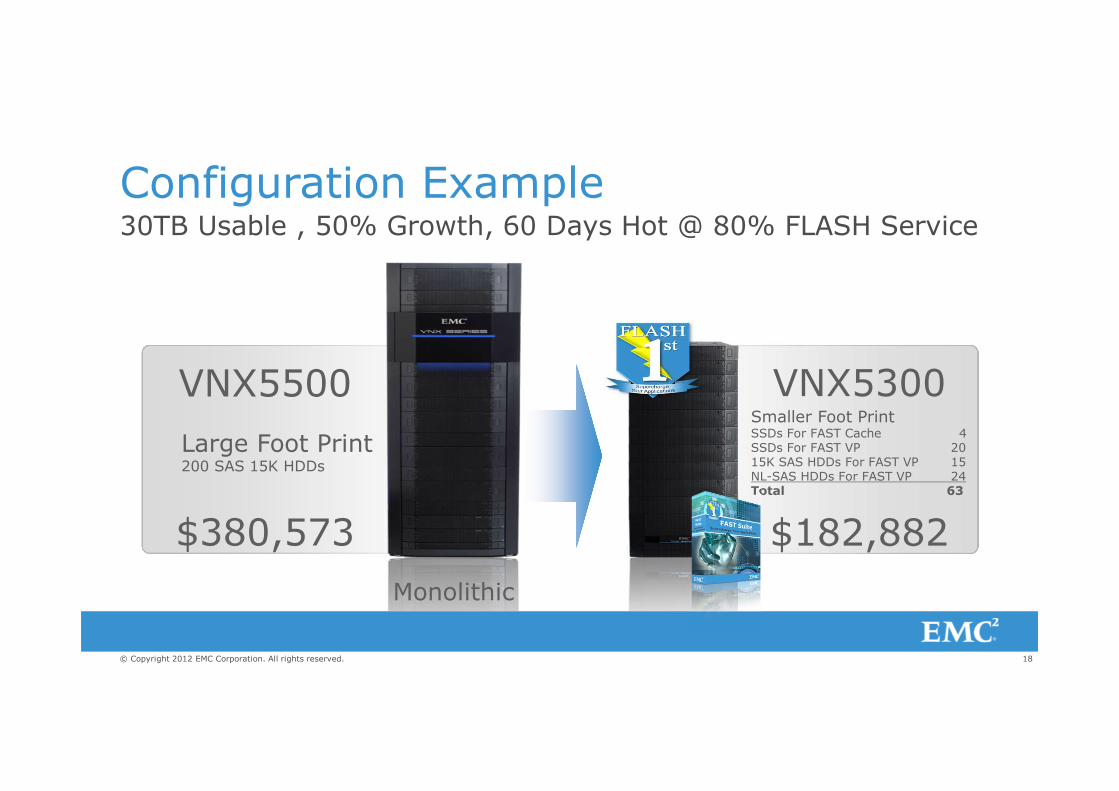
Smaller Foot PrintSSDs For FAST Cache 4SSDs For FAST VP 2015K SAS HDDs For FAST VP 15NL-SAS HDDs For FAST VP 24Total 63
$182,882
VNX5300
Configuration Example30TB Usable , 50% Growth, 60 Days Hot @ 80% FLASH Service
Monolithic
Large Foot Print200 SAS 15K HDDs
VNX5500
$380,573
19© Copyright 2012 EMC Corporation. All rights reserved.
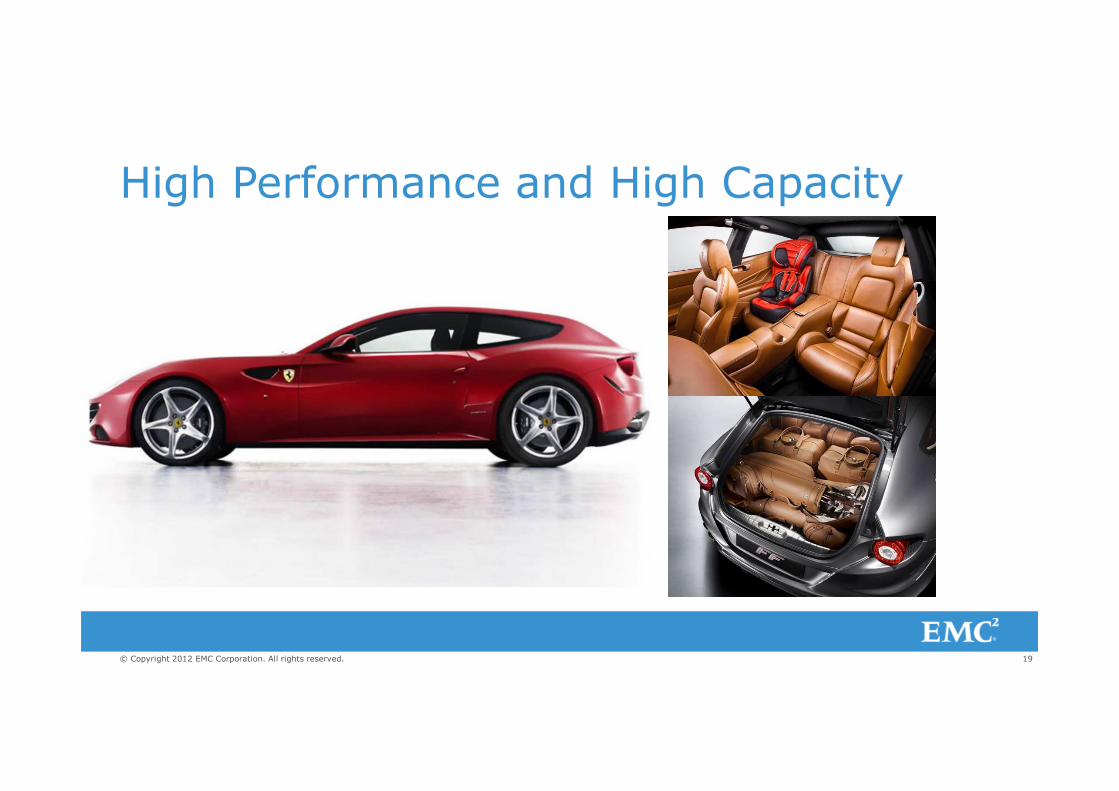
High Performance and High Capacity
20© Copyright 2012 EMC Corporation. All rights reserved.
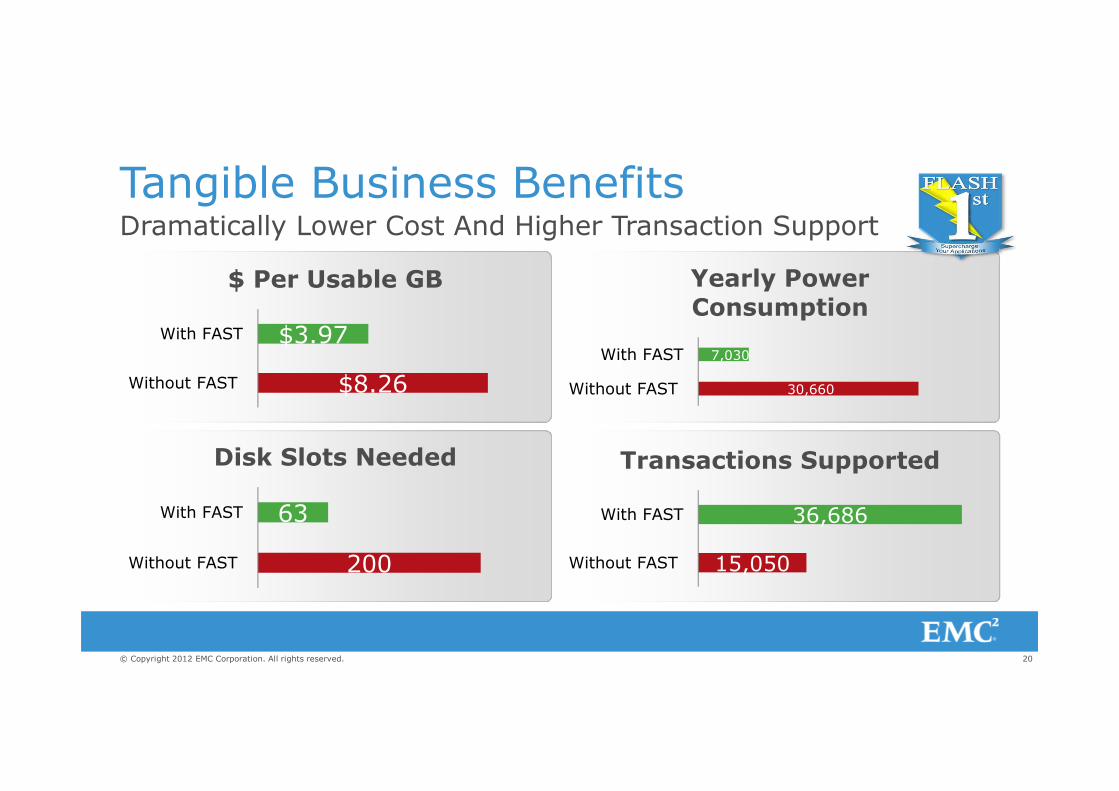
Tangible Business BenefitsDramatically Lower Cost And Higher Transaction Support
$8.26
$3.97
Without FAST
With FAST
$ Per Usable GB
200
63
Without FAST
With FAST
Disk Slots Needed
30,660
7,030
Without FAST
With FAST
Yearly Power
Consumption
15,050
36,686
Without FAST
With FAST
Transactions Supported
21© Copyright 2012 EMC Corporation. All rights reserved.
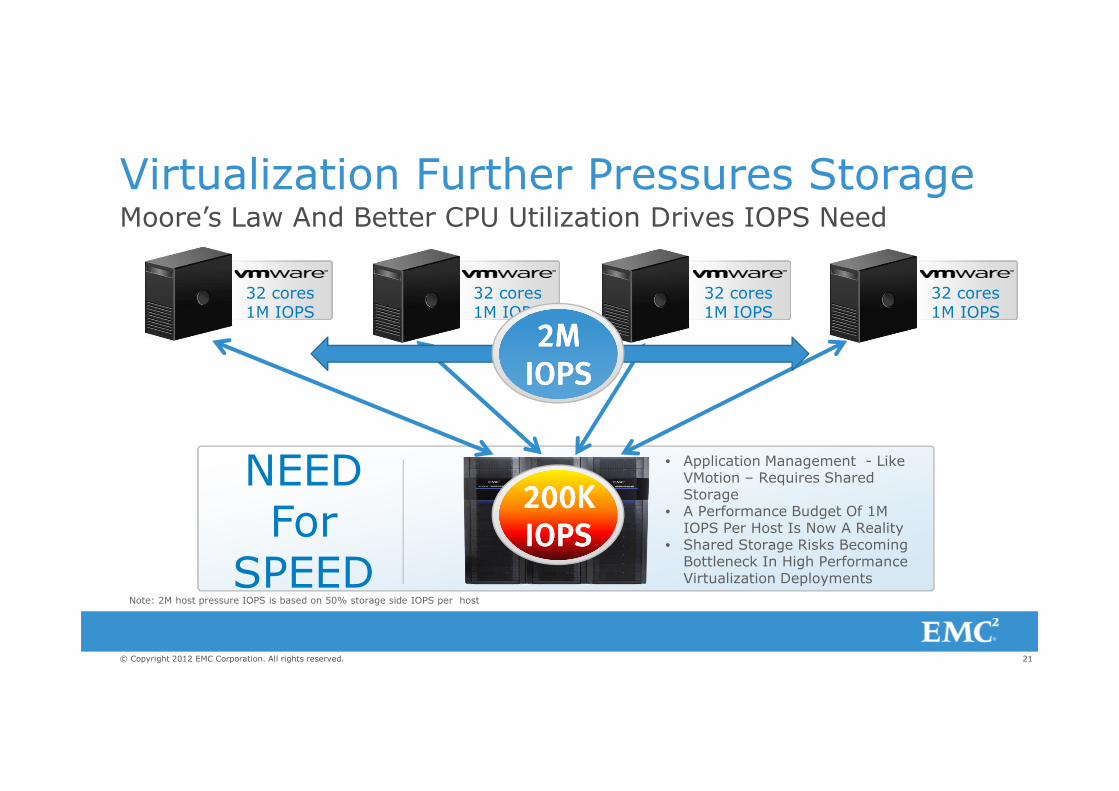
32 cores 1M IOPS
32 cores 1M IOPS
32 cores 1M IOPS
32 cores 1M IOPS
Virtualization Further Pressures StorageMoore’s Law And Better CPU Utilization Drives IOPS Need
NEED For
SPEED
• Application Management - Like VMotion – Requires Shared Storage
• A Performance Budget Of 1M IOPS Per Host Is Now A Reality
• Shared Storage Risks Becoming Bottleneck In High Performance Virtualization Deployments
200K200K200K200K
IOPSIOPSIOPSIOPS
2222MMMM
IOPSIOPSIOPSIOPS
Note: 2M host pressure IOPS is based on 50% storage side IOPS per host

22© Copyright 2012 EMC Corporation. All rights reserved.
VNX Virtualized Cloud ArchitectureHost-Side Read Caching Multiplies Performance
• Scale Out For “Hot Data” And Read Performance With FLASH Based Host-Side Caching
• Scale Up For Deep Archive Of “Cold Data”
• All Writes Are Protected By Synchronous Cache Mirroring To DRAM & FLASH In Central Array
Performance Scale
Capacity
Scale10X
BETTER PERFORMANCE
2M2M2M2M
IOPSIOPSIOPSIOPS
Note: 2M storage IOPS is based on 90%/10% read/write mix

23© Copyright 2012 EMC Corporation. All rights reserved.
High Performance Storage Hierarchy The Data Continuum Is FLASH Centric And Extends To The Host
• Host-Side Read FLASH Caching Shields Data From SAN And Array Latency
• Array-Side FLASH Protects Data Against Host Failure
• Array-Side HDDs Accumulates Inactive Data At Lowest Cost
HDD
SSDFLASH
PCIe FLASH
50uS
200uS
1,500uS
Work
ing S
et
Inactiv
eD
ata

24© Copyright 2012 EMC Corporation. All rights reserved.
The IO Spread: Access DensityPCIe FLASH Offers 8,333X Better Data Access Than 15K HDD
0.030.3
25
2,500
0.01
0.1
1
10
100
1000
10000
NL-HDD HDD SSD PCIe FLASH
Access Density: IOPS/GB
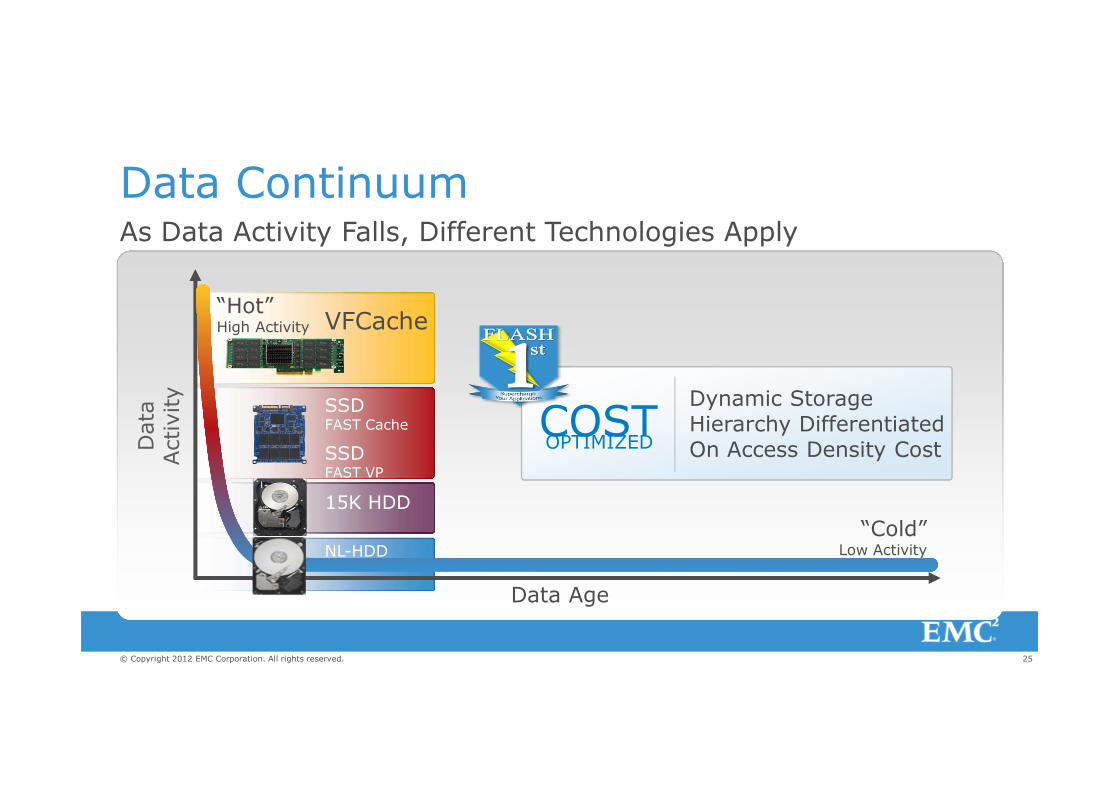
25© Copyright 2012 EMC Corporation. All rights reserved.
Data ContinuumAs Data Activity Falls, Different Technologies Apply
“Hot”High Activity
“Cold”Low Activity
Data
Activity
Data Age
VFCache
SSD FAST Cache
SSDFAST VP
15K HDD
NL-HDD
OPTIMIZEDCOST
Dynamic Storage Hierarchy Differentiated On Access Density Cost

26© Copyright 2012 EMC Corporation. All rights reserved.
� Think about your future– Capacity, growth and # days hot
– Performance requirements
� Come talk to me or my colleagues
� Visit the Hands on Labs
� TRANSFORM– IT+BUSINESS+YOURSELF