Embed Size (px)
Citation preview
AGER
r1 APR 2003
CUNNiNGHAM и g П А %. У
Іа •94 Ч є fl
Note: Pages marked ® may be photocopied for classroom use.
© Department of Education, Queensland, 1989
National Library of Australia Cataloguing-in-Publication Data
Years 1 to 10 mathematics sourcebook: activities for teaching mathematics in year 8.
ISBN 0 7242 33164.
1. Mathematics — Study and teaching (Secondary). I. Queensland. Dept of Education.
510'.7'12
éN 2.ј- іѓ 3О 2%
Acknowledgments Introduction Features of the Sourcebоо k Focus for teaching, learning and assessment — Year 8 overview Whole numbers, fractions and integers Percentage and money Time Mass Ratio and proportion Probability Statistics Pre-algebra Algebra Length Area Volume and three-dimensional shapes Angles, plane shapes and deductive geometry Co-ordinates and analytical geometry Trigonometry Geometry on a sphere
Page iv 1 5 9
35 I 49 ''
61 ...
69
81 89
101 115 133 143 155 165 183 193 203
Acknowledgments This Sourcebook was compiled by officers of Cur-riculum Services Branch in consultation with the Years 1 to 10 Mathematics Working Party, Re-gional Mathematics Consultants and teachers in trial schools.
The major writers were Neville Grace and John Cassidy of Curriculum Services Branch. Major sections were prepared by Lois Ornig and Patrick Trussler, Regional Consultants, Brisbane North Region. In preparing this Sourcebook for publi-cation, the support of Dolores Moore (editor) and other officers of Production and Publishing Services Branch is gratefully acknowledged. The book was designed and illustrated by John Pennisi.
Special thanks are extended to the many teachers who provided feedback on the materials presented in this publication. In particular, acknowledg-ment is made of the co-operation of the staff of the trial schools and also of the Regional Consult-ants who liaised closely with these schools and who contributed to the initial draft materials.
iv
Introduction
This Sourcebook has been developed to assist teachers with the implementation of the Queens-land Years 1 to 10 Mathematics Syllabus (1987). Information is provided relating to the scope of each topic, student and teacher activities, resource materials and assessment. This Sourcebook is not a collection of prescriptive activities to be covered by all teachers; rather it is a collection of ideas which can be used in a variety of ways to sup-plement individual teaching programs.
The activities in the Year 8 Sourcebook have been grouped into 16 topics that contribute to the sequential development of both the numerical and spatial domains of mathematics. There are, of course, many links and interrelationships among these topics, and teachers are encouraged to inte-grate and combine them as they see fit. The order in which the topics appear is not a suggested teaching sequence; schools should develop their own programs to best suit their students' needs.
It is not intended that the Sourcebook replace a textbook or a set of student resources. In fact, the emphasis is on the range of teaching approaches not widely emphasised generally in mathematics materials for students. Consolidation and practice exercises are extremely important, but because they are widely available in other resources, they are seldom included in this sourcebook series. It is recommended, therefore, that successful teach-ing strategies in Year 8 mathematics should incor-porate a blend of material from a text or a set of student resources and from the activities in this Sourcebook.
Learning experiences The successful implementation of the Years 1 to 10 Mathematics Syllabus and provision of appro-priate learning experiences rely very much upon the understanding that teachers have of the aims of the Syllabus.
Throughout Years 1 to 10 students should de-velop: • an understanding of both number and spatial
concepts, leading to an awareness of the basic structure of mathematics;
• the facility to think purposefully and logically to solve problems;
• positive attitudes to mathematics— attitudes which will encourage students to apply math-ematical concepts and processes in problem situations confronting them now and in the future; and
• an appreciation of the place of mathematics in our culture and its widespread applications in society.
To achieve goals commensurate with these aims, it is imperative that students are involved in learn-ing experiences which develop thinking processes as well as understanding and knowledge of
specific mathematical concepts. The school pro-gram needs to include a variety of practical and meaningful experiences for all students, making use of concrete materials and investigations and drawing upon `real life' or simulated `real-life' situations whenever possible.
Teaching approaches There is no definitive approach or style for the teaching of mathematics. Approaches to the teaching of any particular mathematical concept will be influenced by the nature of the concept itself and by the abilities and experiences of students. Successful mathematics teaching will embrace a wide variety of styles or approaches which include opportunities for: • direct teaching of individuals, groups and
whole classes; • activity-based learning; • `discussion between the teacher and students
and among the students themselves; • applications and problem solving; • open-ended investigations; and • consolidation and practice.
The aims of the Syllabus will certainly not be fulfilled if all teaching is done by `teacher expo-sition' followed by the setting of practice exercises.
The importance of developing in students strongly interconnected mathematical concepts demands that students be given the opportunity to meet the same concept in a variety of contexts. Teaching must be sufficiently varied and flexible to allow students to link the various ways that mathemat-ical concepts can be represented.
Problem solving Developing the ability to solve problems is an ulti-mate, but often elusive, goal of education. Clearly, problem solving is not exclusively the domain of mathematics; it is an integral part of life and of all school subjects. With mathematics, the term problem solving is most often used to refer to the application of mathematics in rela-tively new and unfamiliar situations. Effective mathematics teaching needs to promote the devel-opment of specific skills and abilities which facili-tate effective problem solving. An overview of the various skills that are to be developed throughout Years 1 to 10 is provided below.
Beginning years • Comparing, classifying and sorting objects and
events according to specific attributes. • Interpreting and explaining visual information. • Sequencing ideas, objects or events. • Identifying and using required number oper-
ations. • Creating oral problems from given infor-
mation.
в ---в --... в ---- вв -вв
• Identifying relevant information in problem situations.
• Identifying, extending and creating patterns. • Acting out situations. • Determining reasonableness of results. • Guessing and checking answers. • Reading information from tables, graphs and
maps. • Drawing sketches and diagrams. • Organising information in lists and tables. • Deciding if too much or too little information
is presented in problem situations.
Middle years As well as continuing to develop and consolidate the previous skills, students in the middle years will be • Simplifying and organising given information
in problems. • Eliminating possibilities from problem situ-
ations. • Constructing tables, charts and graphs. • Creating, writing and solving number sen-
tences. • Selecting appropriate notation to represent
problem situations. Solving a simpler or similar problem. Determining and applying formulae.
Later years As well as continuing to develop and consolidate the previous skills, students in the later years will be: • Identifying sub-tasks within a given task. • Using a variable to represent an unknown
quantity. • Checking the validity of given information. • Solving algebraic equations and inequations.
It is important to keep in mind, however, that proficiency in problem-solving skills does not necessarily result in ability to solve problems. Attention also needs to be directed towards the more global, managerial aspects of solving a problem, that is, knowing when to apply a par-ticular skill, algorithm or procedure and what the consequences of such an action will be. To help students in this regard, the following four-stage instructional model is recommended: (1) Under-stand the problem (See); (2) Devise a plan (Plan); (3) Carry out the plan (Do); and (4) Look back (Check). The essential value of this model is that it leads students to understand that the process of problem solving consists of many interrelated actions and decisions. For students the focus words for each stage (See, Plan, Do, Check) pro-vide a useful framework around which to design an attack strategy.
Note: Throughout the Sourcebook, this symbolis used to highlight situations which involve prob-lem solving.
Calculators The use of calculators throughout Years 1 to 10 is encouraged. They should be used when appropri-ate to free students from mechanical computation allowing logical thought processes to flow freely. Calculators are also valuable teaching aids assist-ing students to grasp mathematical ideas such as place value, number properties or principles, and operations.
Note: Throughout the Sourcebook, this symbol is used to highlight situations where calculators can play a significant role.
Calculators have an important role to play as tools in problem solving. Even students who do not have well-developed concepts of number and operations can participate in a wider range of problems and this participation will have positive effects on students' attitudes to mathematics. For calculators to be used to full advantage, it is essential that students have instant recall of number facts, and proficiency with mental calculations.
Individual differences Students vary greatly in their ability to grasp mathematical ideas. If the teaching pace is too rapid, understanding is unlikely to develop; con-versely, if the pace is too slow, students become bored and lose interest. The amount of time and depth of study required for a particular topic will also vary from student to student. It is important that students with exceptional ability be suitably extended, while at the same time it is equally important that adequate time be devoted to the needs of the less able students in the class. The achievement of a correct balance in these matters requires skilled professional judgment and flexi-bility in classroom organisation and management. To cater for the needs of these students, a variety of resources will need to be consulted.
The Years 1 to 10 Mathematics Syllabus reflects the philosophy that girls and boys have similar potential for success in mathematics. Many fac-tors have been suggested to explain differences in performance between girls and boys, including biological differences, socialisation patterns, fac-tors within the school and motivation and atti-tudes towards mathematics. Awareness of these possible factors will help ensure that the imple-mented mathematics program allows equality of opportunities for all students.
Finally, teachers are encouraged to draw upon the diversity of Australian culture in selecting materials and learning situations to develop the various concepts and processes. It is desirable that opportunities be provided for students to apply their mathematical knowledge to, and solve prob-lems in, settings which reflect the multicultural nature of Australian society.
Assessment.
The nature of assessment Assessment focuses on accomplishments of indi-vidual students in the educational setting. Evi-dence of these accomplishments is provided by information from different kinds of tests or obser-vation of students in the learning situation. Assessment is, to a large degree, an exercise in data collection and interpretation. Data can be provided through a variety of tasks for students, which, for example, could require them to: • recall information; • use imitative procedures; • apply mathematics in relatively familiar situ-
ations; • work continuously through tasks with, and
without, assistance; • explain verbally and demonstrate methods and
results; • use mathematical aids and instruments, and
concrete materials; • solve problems; and • evaluate their own understanding and perform-
ance.
Purposes of assessment The scope of an assessment program will be influ-enced by the purposes for which the data are to be used. Assessment is undertaken with a view to action leading to: • identification of individual strengths and diffi-
culties; • identification of individual learning styles; • feedback to students based on up-to-date infor-
mation about their present functioning in mathematics, leading towards self-evaluation;
• feedback to parents and students regarding progress and potential;
• evaluation of the mathematics program; and • certification regarding level of achievement on
exit from Year 10.
Care must be taken not to allow one narrow pur-pose to dictate the scope of the assessment pro-gram. For example, in reporting to parents or preparing exit certificates, one may need to con-sider time, space and audience expectations that may require the amalgamation of assessment data. Any amalgamation of data necessarily implies some loss of detail. If a particular form of school report or exit certificate is allowed to domi-nate thinking about assessment, there is a danger that information will be collected about a narrow range of student behaviours. When one keeps in mind the other purposes of assessment which include diagnosis of difficulties, feedback to students and evaluation of the mathematics pro-gram — the need for assessment across the range of concepts, processes and affective components outlined in the Syllabus becomes apparent.
It is clear, therefore, that assessment must involve ongoing monitoring of students' progress throughout the year. A. variety of procedures — such as observation of students as they work with materials, informal discussions and written tests - can be used to gather relevant information.
The assessment ideas provided in this Sourcebook with each topic include some items suitable for use in end-of-unit written tests. They go beyond that, however, to suggest the range of items necessary to gain a full understanding of how students are progressing.
4
Features of the Sourcebook
(Up to and Including) Vein 7 Уип 9 апд 10
■ A. Measuring heights of vertical objп ts and horizontal distances from the objects and comp'ruSaIд recording ratios.
■ В . Comparing ,"d graphing values of the ratios of height to - horizontal distance in right-angled triangles for: • Constant height • constant horizontal distance.
■ C. Measuring heights and bases of similar right-angled triangle and calculating ratios to infer that the ratio of height to base remains constant irrespective of the size of the trangle.
• D. Representing different-sized right-angled triangles according to a specified height:base ratio and measuring angia.
■ Experience for all sudents. Profciencyexpected at or befon Yeu 10.
Consolidation and extension of all previous work in addition to:
• the use of the term tangent ratio;
• sine ond cosine ratios and functions.
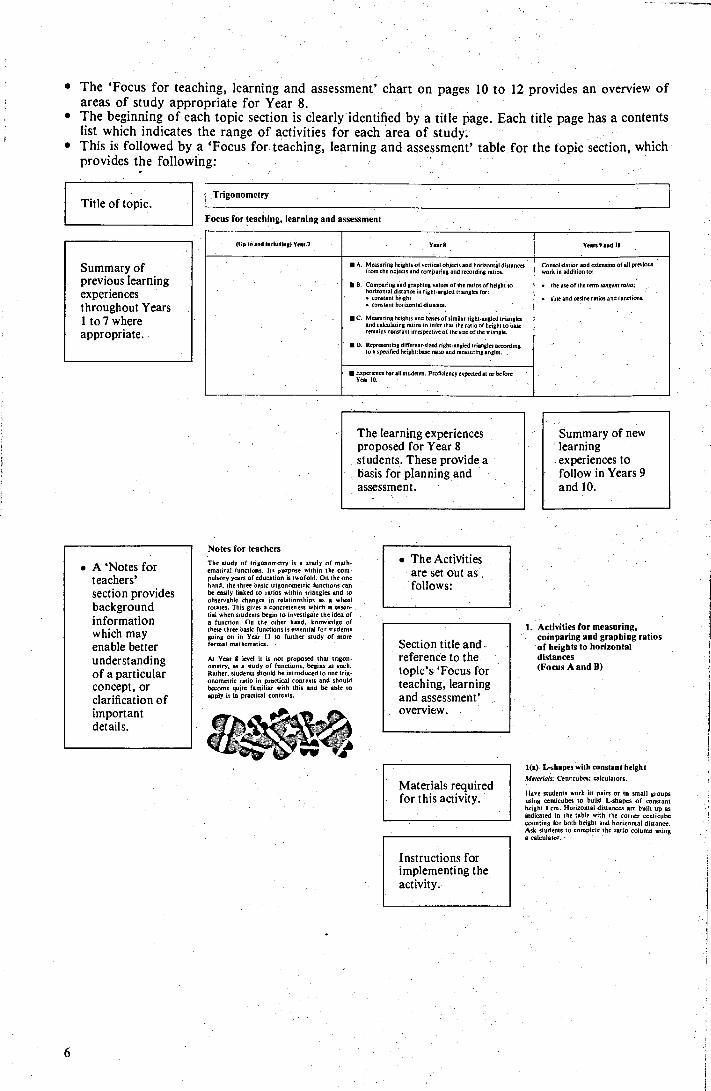
• The 'Focus for teaching, learning and assessment' chart on pages 10 to 12 provides an overview of areas of study appropriate for Year 8.
• The beginning of each topic section is clearly identified by a title page. Each title page has a contents list which indicates the range of activities for each area of study.
• This is followed by a 'Focus for teaching, learning and assessment' table for the topic section, which provides the following:
Title of topic.
Summary of previous learning experiences throughout Years 1 to 7 where appropriate.
Trigonometry
Focus for teaching, learning and assessment
The learning experiences proposed for Year 8 students. These provide a basis for planning and assessment.
Summary of new learning experiences to follow in Years 9 and 10.
• A 'Notes for teachers' section provides background information which may enable better understanding of a particular concept, or clarification of important details.
Notes for teachers
The nи dу of trigonometry is a study of math-ematical functions. Its purpose within the com-pulsory years of education is twofold. On the one hand, the three basic trigonometric functions can be easily linked to ratios within triangles and to observable changes in relationships as a wheel rotates. This gives a concreteness which is essen-tial when students begin to investigate the idea of a function. On the other hand, knowledge of these three basic functions is essential for students going on in Year I1 to further study of more formal mathematics.
At Year 8 levd it is not proposed that trigors. omary, as a study of functions, begins as such. Rather, students should be introduced to one trig-onometric ratio in practical contexts and should become quite familiar with this and be able to apply it in practical contexts.
• The Activities are set out as follows:
Section title and -reference to the topic's 'Focus for teaching, learning and assessment' overview.
Materials required for this activity.
Instructions for implementing the activity.
1. Activities for measuring, comparing and graphing ratios of heights to horizontal distances (Focus A and В )
i(o) L-shapes with constant height
MateriaLe: Centituba; calculators.
Have students work in pairs or in small groups using centicubes to build L-shapes of constant height 8 cm. Horizontal distances are built up as indicated in the tuble with the corner centicube counting for both height and horizontal distance. Ask students to complete the ratio column using a calculator.
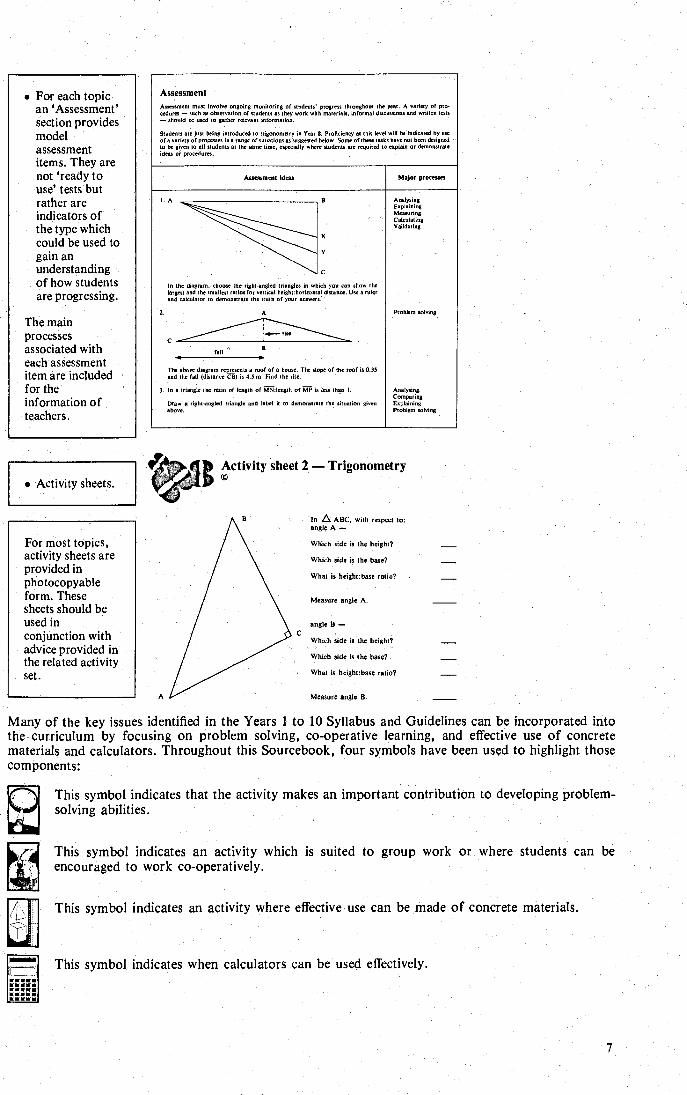
Assessment ideas Major processes
Assessment
Assessment must involve ongoing monitoring of students progress throughout the year, A variety of pro-cedure — such as observation of students a г Ρ they work with materials, informal discussions and written tests — should be used to gather relevant information.
Students are just being introduced to trigonometry in Year 8. Proficiency a this level will be indicated by use of a variety of processes in a raп gе of situations as suggested below. Some of these tasks have not been designed to be given to all students at the same time, especially where students are required to explain ar demonstrate ideu or procedures.
In the diagram, choose the right-angled triangles in which you can show the largest and the smallest ratios for vertical height:horizontal distance. Use a ruler aod calculator to demonstrate the truth of your answers.
2. А
. .. r rite
fall
I
The above diagram represents a roof of a house. The slope of the roof is 0.35 and the fall (distam CO) is 4,3 m. Find the rise.
З . In a triangle the ratio of length of WV:length of MP is leu than I.
Drum a right-angled triangle and label it to demonstrate the situation given abo e.
Analysing Explaining
e lculating Validating
Peohlem solving
Analysing. Compering Explaining Problem solviog
...s.ge
.....
trial ■mmm
ii
. For each topic an 'Assessment' section provides model assessment items. They are not 'ready to use' tests but rather are indicators of the type which could be used to gain an understanding of how students are progressing.
The main processes associated with each assessment item are included for the information of teachers.
• Activity sheets.
For most topics, activity sheets are provided in photocopyable form. These sheets should be used in conjunction with advice provided in the related activity set.
Activity sheet 2 —Trigonometry
In A ABC, with respect to: angle A —
Which side is the height?
Which side is the base?
What is height:base ratio?
Measure angle A.
angle B —
Which side is the height?
Which side is the base?
What is height:base ratio?
Measure angle B.
Many of the key issues identified in the Years 1 to 10 Syllabus and Guidelines can be incorporated into the curriculum by focusing on problem solving, co-operative learning, and effective use of concrete materials and calculators. Throughout this Sourcebook, four symbols have been used to highlight those components:
This symbol indicates that the activity makes an important contribution to developing problem solving abilities.
This symbol indicates an activity which is suited to group work or where students can be encouraged to work co-operatively.
This symbol indicates an activity where effective use can be made of concrete materials.
This symbol indicates when calculators can be used effectively.

Focus for teaching; learning and assessment ,
Year 8 overview
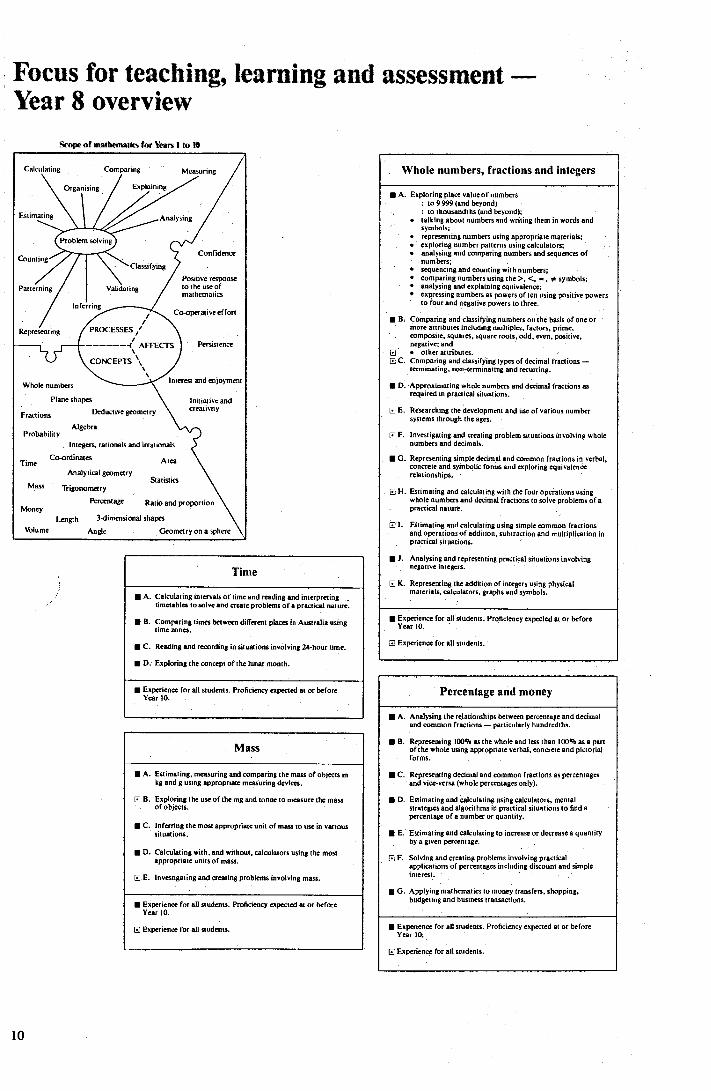
Time Coordinates
Analytical geometry
Trigonometry
Percentage
3-dimensional shapes
Angle Geometry on a sphere
Length Volume
Calculating Comparing Measuring
Probability Algebra
Organising Explaining
Estimating
Counting
Patterning
Representing
Whole numbers
Plane shapes
Fractions Deduclise geometry
Confidence
Positive response to the use of mathematics
Co-operatise effort
Persistence
Interest and enjoyment
Initiative and creativity
Integers, rationals and iгга tionats
Money
Arca
statis[ia
Ratio and proportion
Time
■ A. Calculating internals of time and reading and interpreting. timetables to solve and create problems of a pracriml• nature.
■ В . Comparing times between different places in Australia using time zones. - -
■ C. Reading and recording in situations involving 24-hour time.
■ D. Exploring the concept of the lunar month.
■ Enperience Гог all students. Proficiency expected at or before Year IO.
Mass
■ A. Estimating, measuring and comparing the mass of objects in kg and g using appropriate measuring denim.
В . Exploring the use of the mg and tonne to measure the mass of objects.
■ C. Inferring the most appropriate unit of mass to use in various situations.
■ D. Calculating with, and without, calculators using the most appropriate units of mass.
p E. Investigating and creating problems involving mass.
■ Experience Гог all students. Proficiency expected at or before Year 10.
O Experience Гог all students.
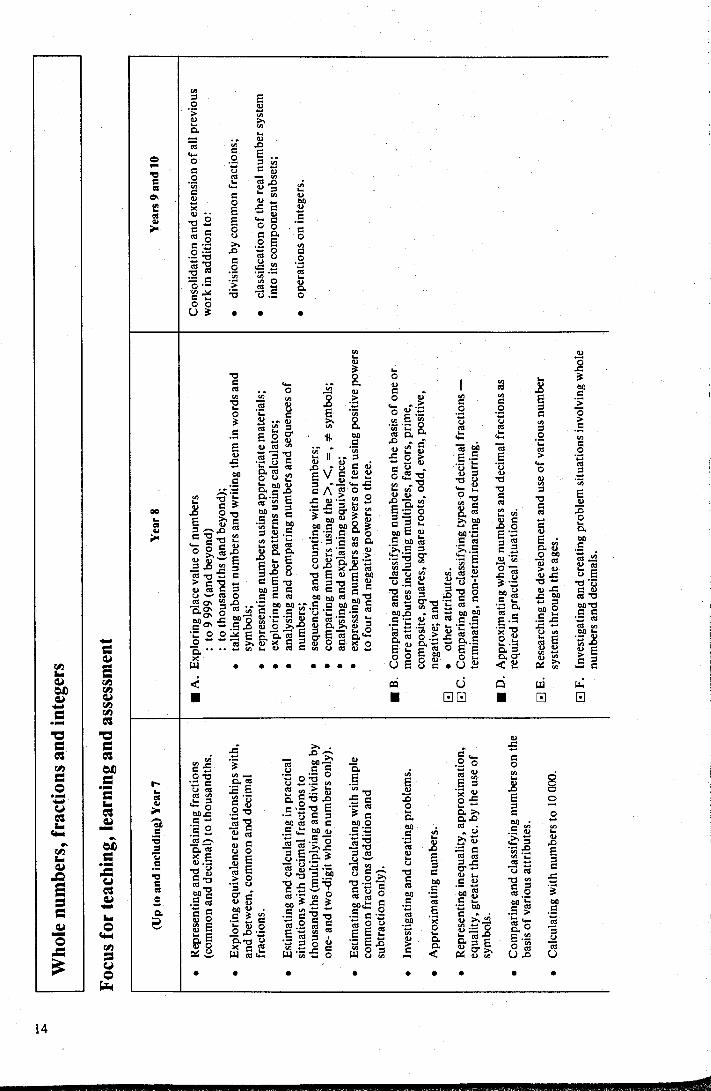
Whole numbers, fractions and integers
■ A. Exploring place value of numbers to 9 999 (and beyond) -
: to thousandths (and beyond); - • talking about numbers and writing them in words and
symbols; • representing numbers using appropriate materials; • exploring number patterns using calculators; • analysing and comparing numbers and sequences of
numbers; • sequencing and counting with numbers; • comparing numbers using the >, <, _, * symbols; • analysing and explaining equivalence; • expressing numbers as powers of ten using positive powers
to four and negative powers to three.
■ В . Comparing and classifying numbers on the basis of one or more attributes including multiples, factors, prime, composite, squares, square roots, odd, even, positive, negative; and • other attributes.
G C. Comparing and classifying types of decimal fractions — terminating, non-terminating and recurring.
■ D. Approximating whole numbers and decimal fractions as required in practical situations.
E, E. Researching the development and use of various number systems through the ages.
O F. Investigating and creating problem situations involving whole numbers and decimals.
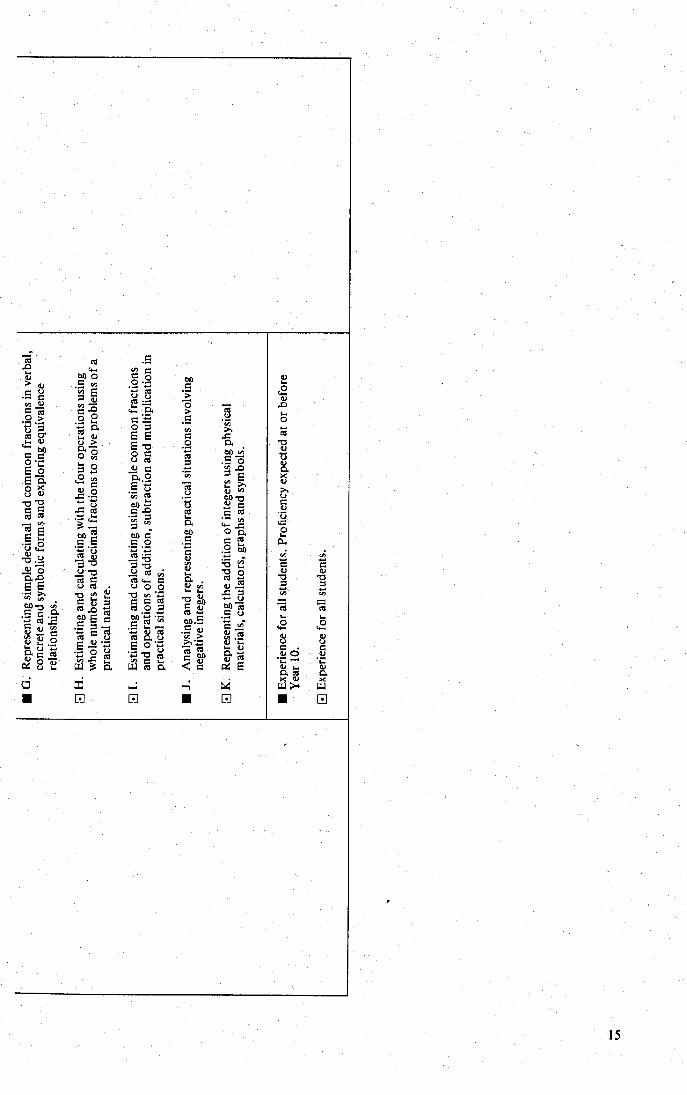
■ G. Representing simple decimal and common fractions in verbal, concrete and symbolic forms and exploring equivalence relationships.
G H. Estimating and calculating with the four operations using whole numbers and decimal fractions to solve problems of a
. practical nature.
Q'1. Estimating and calculating using simple common fractions and operations of addition, subtraction and multiplication in practical situations.
■ I. Analysing and representing practical situations involving negative integers.
CG K. Representing the addition of integers using physical materials, calculators, graphs and symbols.
■ Experience Гог all students. Proficiency expected at or before Year 10.
E Experience for all students.
Percentage and money
■ A. Analysing the relationships between percentage and decimal and common fractions — particularly hundredths.
■ В . Representing 100% as the whole and less than 100%s as a part of the whole using appropriate verbal, concrete and pictorial forms.
■ C. Representing decimal and common fractions as percentages and vim•versa (whole percentages only).
■ D. Estimating and calculating using calculators, mental strategies and algorithms in practical situations to find a percentage of a number or quantity.
■ E. Estimating and calculating to increase or decrease a quantity by a given percentage. ,
Solving and creating problems involving practical applications of percentages including discount and simple interest. -
Applying mathematics to money transfers, shopping, budgeting and business transactions.
■ Experience Гог all students. Proficiency expected at or before Year 10.
C Experience Гог all students.
G F.
■ G.
Focus for teaching, learning and assessment — Year 8 overview
St'б Ρpe of mathematics for Years I to 10
10
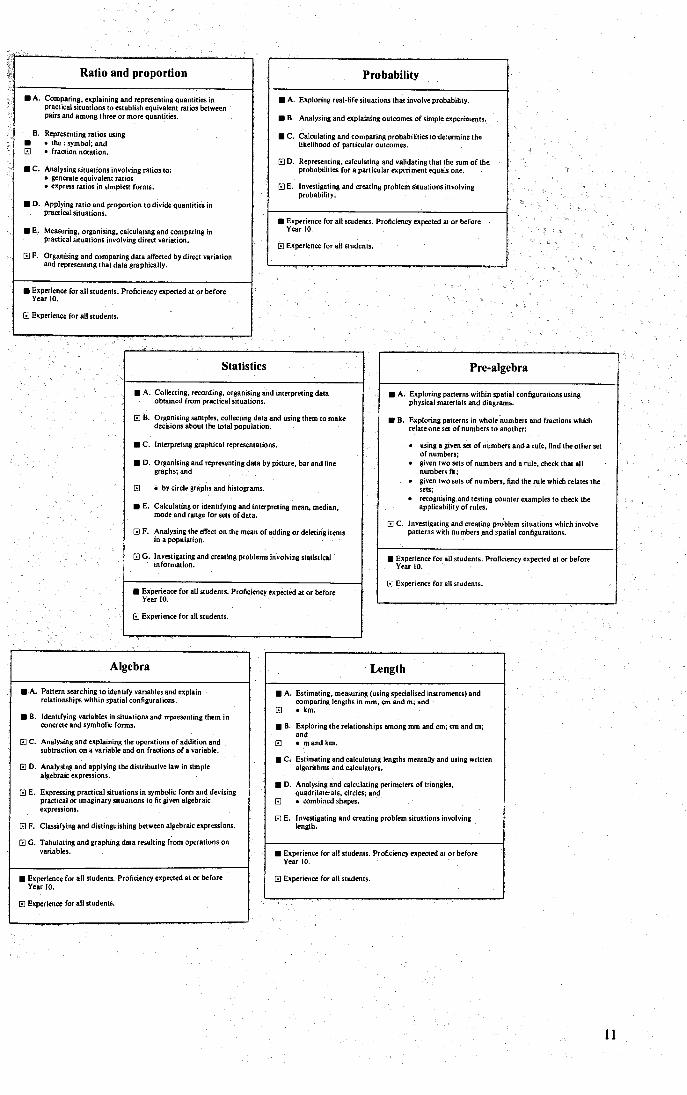
Length
■ A. Estimating, measuring (using specialised instruments) and comparing lengths in mm, cm and m; and
p • km.
• В . Exploring the relationships among mm and cm; cm and m; and
E • m and km.
■ C. Estimating and calculating lengths mentally and using written algorithms and calculators.
■ D. Analysing and calculating perimeters of triangles, quadrilaterals. circles; and
E • combined shapes.
E E. Investigating and creating problem situations involving length.
■ Experience for all students. Proficiency expected at or before Year 10.
E Experience for all students.
Ratio and proportion
■ A. Comparing, explaining and representing quantities in practical situations to establish equivalent ratios between pairs and among three or more quantities.
В . Representing ratios using ■ • the : symbol; and O • fraction notation.
■ C. Analysing situations involving ratios to: • generate equivalent ratios • express ratios in simplest forms.
■ D. Applying ratio and proportion to divide quantities in practical situations.
■ E. Measuring, organising, calculating and comparing in practical situations involving direct variation.
F. Organising and comparing data affected by direct variation and representing that data graphically.
■ Experience for all students. Proficiency expected at or before Year 10.
E Experience for all students.
Probability
■ A. Exploring real-life situations that involve probability.
■ В . Analysing and explaining outcomes of simple experiments.
■ C. Calculating and comparing probabilities to determine the likelihood of particular outcomes.
O D. Representing, calculating and validating that the sum of the probabilities for a particular experiment equals one.
E E. Investigating and creating problem situations involving probability.
■ Experience for all students. Proficiency expected at or before Year 10.
р Experience for а 11 students.
Pre-algebra
■ A. Exploring patterns within spatial configurations using physical materials and diagrams.
■ В . Exploring patterns in whole numbers and fractions which relate one set of numbers to another:
• using a given set of numbers and a rule, find the other set of numbers;
• given two sets of numbers und a rule, check that all numbers fit;
• given two sets of numbers, find the rule which relates the sets;
• recognising, and testing counter examples to check the applicability of rules.
0 C. Investigating and creating problem situations which involve patterns with numbers and spatial configurations.
■ Experience for all students. Proficiency expected at or before Year 10.
E Experience for all students.
Statistics
■ A. Collecting, recording, organising and interpreting data obtained from practical situations.
E В . Organising samples, collecting dete and using them to make decisions about the total population.
■ C. Interpreting graphical representations.
■ D. Organising and representing data by picture, bar and line. graphs; and
E • by circle graphs and histograms.
■ E. Calculating or identifying and interpreting mean, median, mode and range for sets of data.
E F. Analysing the effect on the mean of adding or deleting items in a population.
E G. Investigating and creating problems involving statistical information.
■ Experience for all students. Proficiency expected at or before Year 10.
E Experience Гог all students.
Algebra
■ A. Pattern searching to identify variables and explain relationships within spatial configurations.
■ E. Identifying variables in situations and representing them in concrete and symbolic forms.
E C. Analysing and explaining the operations of addition and subtraction on a variable and on fractions of a variable.
E D. Analysing and applying the distributive law in simple algebraic expressions.
E E. Expressing practical situations in symbolic form and devising practical or imaginary situations to fit given algebraic expressions.
E F. Classifying and distinguishing between algebraic expressions.
p G. Tabulating and graphing data resulting from operations on variables.
■ Experience for all students. Proficiency expected at or before Year 10.
E Experience for all students.
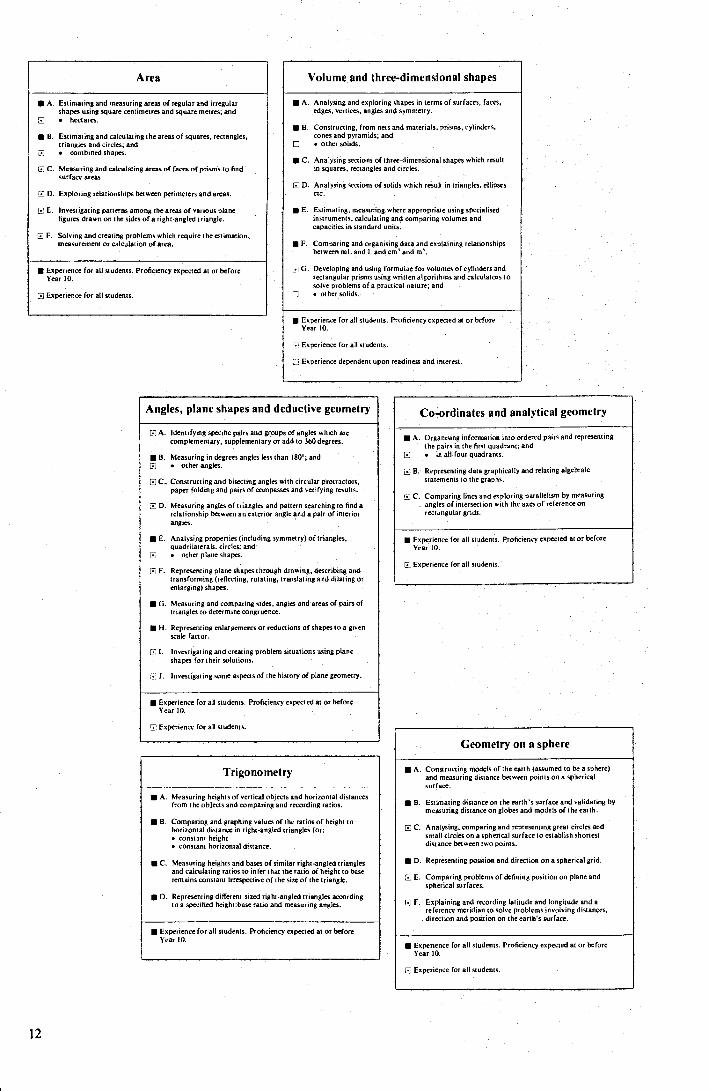
Angles, plane shapes and deductive geometry
E A. Identifying specific pairs and groups of angles which are complementary, supplementary or add to 360 degrees.
■ В . Measuring in degrees angles less than 180°; and E • other angles.
E C. Constructing and bisecting angles with circular protractors, paper folding and pairs of compasses und verifying results.
D. Measuring angles of triangles and pattern searching to find a relationship between an exterior angle and a pair of interior angles.
■ E. Analysing properties (including symmetry) of triangles, quadrilaterals, circles; and
E • other plane shapes.
E F. Representing plane shapes through drawing, describing and transforming (reflecting, rotating, translating and dilating or enlarging) shapes.
■ G. Measuring and comparing sides, angles and areas of pairs of triangles to determine congruence.
■ H. Representing enlargements or reductions of shapes to a given scale factor.
Investigating and creating problem situations using plane shapes for their solutions.
Investigating some aspects of the history of plane geometry.
■ Experience for all students. Proficiency expected at or before Year 10.
E. Experience for all students.
I.
Е J.
Trigonometry
■ A. Measuring heights of vertical objects and horizontal distances from the objects and comparing and recording ratios.
■ В . Comparing and graphing values of the ratios of height to horizontal distance in right-angled triangles for: • constant height . • constant horizontal distance.
■ C. Measuring heights and bases of similar right-angled triangles and calculating ratios to infer that the ratio of height to base remains constant irrespective of the size of the triangle.
■ D. Representing different-sized right-angled triangles according to a specified height:base ratio and measuring angles.
■ Experience for all students. Proficiency expected at or before Year 10.
Co-ordinates and analytical geometry
■ A. Organising information into ordered pairs and representing the pairs in the first quadrant; and
E • in all four quadrants.
В . Representing data graphically and relating algebraic statements to the graphs.
Е l C. Comparing lines and exploring parallelism by measuring angles of intersection with the axes of reference on rectangular grids.
■ Experience Гог all students. Proficiency expected at or before Year 10.
G! Experience Гог all students.
Geometry on a sphere
■ A. Constructing models of the earth (assumed to be a sphere) and measuring distance between points on a spherical surface.
■ 8. Estimating distance on the earth's surface and validating by measuring distance on globes and models of the earth.
C C. Analysing, comparing and representing great circles and small circles on a spherical surface to establish shortest distance between two points.
■ D. Representing position and direction on a spherical grid.
E E. Comparing probiems of defining position on plane and spherical surfaces.
l i F. Explaining and recording latitude and longitude and a reference meridian to solve problems involving distances, direction and position on the earth's surface.
■ Experience for all students. Proficiency expected at or before Year t0.
E Experience Гог all students.
Area
• A. Estimating and measuring ereas of regular and irregular shapes using square centiaretreu aud square metres; and • hectarcu.
■ В . Estimating and calculating the areas of squares, rectangles, triangles and circles; and
., • combined shapes.
( C. Measuring and calculating areas of faeeu of prisms to find surface areas.
E. D. Exploring relationships between peiimeters and areas.
Е E. Investigating patterns among the areas of various plane figures drawn on the sides of a right-angled triangle.
▪ F. Solving and creating problems which require the estimation, measurement or calculation of area.
■ Experience for all students. Proficiency expected at or before Year 10.
Experience Гог all students.
Volume and three-dimensional shapes
■ A. Analysing and exploring shapes in terms of surfaces, faces, edges, vertices, angles and symmetry..
■ В . Constructing, from nets and materials, prisms, cylinders, cones and pyramids; and.
❑ a other solids.
. C. Analysing sections of three-dimensional shapes which result in squares, rectangles and circles.
E D. Analysing sections of solids which result in triangles. ellipses etc.
■ E. Estimating, measuring: where appropriate using specialised instruments, calculating and comparing volumes and capacities in standard units.
• F. Comparing and organising data and explaining relationships between mL and L und cm' und m'.
If G. Developing and using formulae for volumes of cylinders und rectangular prisms using written algorithms and calculators to solve problems of a practical nature; and
❑ • other solids.
■ Experience for all students. Proficiency expected at or before Year 10.
f] Experience for all students.
❑ Experience dependent upon readiness and interest.
12
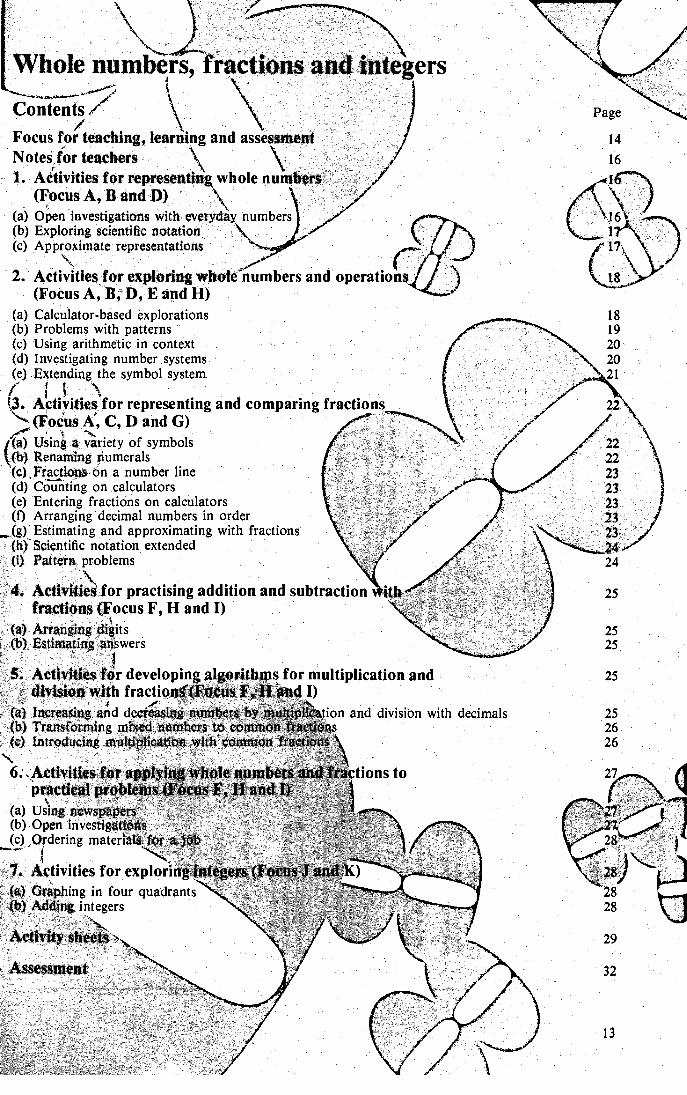
18 19 20 20 21
llic► ie numbers, fraс tioi
Contents
Focus fa teaching, tea Notes for teachers 1. Activities for represe
(Focus A, a and D) (a) Open investigations with everyday numbers (b) Exploring scientific notation' ., .
(c) Approximate representations
2. Activities for exploring whole numbers and operatio (Focus A,B, D, E and H)
(a) Calculator-based explorations (b) Problems with patterns (c) Using arithmetic in context (d) Investigating number systems (e) . Extending the symbol system
á t '3. Activities for representing and comparing
(Focus A, C, D and G) (a) Using a vvaariety of symbols (ł ) Renaming numerals (c) Fга ct иоп on a number line (d) Counting on calculators (e) Entering fractions on calculators (f) Arranging decimal numbers in order
;(g) Estimating and approximating with fractions (h)'Scientific notation extended
) Pattern probl ems
for practising addition and subtraction ocus F, H and I) tits
swers
14 16
"ё r developin h fracti
rid de g
6; Acti' pry
(a) Using (b) Open rove (c) Ordering maten
Activities for explori ing in four quadrants
integers
s for multiplication and d l)
ion and division with decimals
Yea
rs 9
and
10
и Ф ь .
3 О н S
и с••• 3 cco С ø и д ( со .С С
• и и О . о j . С С Е G 'C С . Ć . •и , о• Ф •..+ . С С▪ д о
3 Ф Ф л о и Ё >
,a . • , • ь ., о м cua
.
•
Е p g 14 tO . с аа
; « о и •
▪
L.
• .д сС.ь С II åi С . . Е 'ье . Е w' .
са u с ti . C
▪
Ф .'й ь. 'й С рай Ć V vw ьФ Ρ, ос :б •о p .
_ . С . O° Ф С
•
са р ы ь vî О ••• ьФ. . 0
и у
сад 'й Е ,у Ф . . ьи. .в v иТ 1 сСа . •С
.L1 o-o 0о и д . ы р • Ф ьи.. . Е •Q.С
. ya. ссд ьи. v . е д
Е ы С S с ео 3 0о Ф о Ф О а л ao Ф Ρ ❑ .. ó F. G'и а 30.. oc
6 . •С .с ° е
'н . С L. . сб а .. •е . ео са ,[ c~a ia •
•ы Ф Ф Е .О ь. Е о Ф Ć L ď ' • й и
•
• й Е ср , -OÉaкi Oбo й аиг ,д° й ú Ć
> c 'v «. Я E •v с o b °' и ,С Ф 3_._ •o b'и
й сб грд С0 0о 7 С са С С д Я ç у 0! С .о О й Ф .С С Ф
- и С C сб 0о 0o са b . c y о .0 Я Я С 4cб„ . ы 0o с Т 7 са С .р 00 00 ,[ С co С с са С и Ь •у м а С 0о '0
Ő р сб
00 ,0 С bA 0О сб 0D а .С. с 00 г 0о o й 'ь. 'и Ф с ca
▪
'й й ь. c...н ý сб io С С C С ,C е о ... á '}„ 'й а - • ' 'к b й и 0 о ьи. � оо : Е О аСЕ р Ек 04r Сдо . ес о ь. ' Ф о 'м лФ к е С Ф о е к р а а, а ... а ._ .. са Е и .0
Ф ø С и Ф са Ф ... Е ь • сб о Е Е . а C Ф Ρ a Ф Ρ E к о о Е ед р ь. ао ' и й > W • • • • • • • • . U E .
Ú д • U Q i д 4 ø .•.Я. д
а а; с $ ■ ■ оо ■ о о
(Up
to
and
incl
udi
ng) Y
ear
7
Ф .; ы
И øг ео л v 0 О О Сы
3 и С с a " Ф и р д и ... и о ;E и E а са _
cua й •. Е.
С . и '? Ń •и 'к Ф
•
.0 _
7 с бui а O 21 s
д О сУ ° •е_ ,Vq
к 3 е а . Oa, ń с aZ7 оосб 0t Я too ca Ø сп
❑ УО ьФ. сб
С с.. С á: С .., С ‚
:д . Ф C .Á са 'Т.С •:б T3 .' a са и р С са Ф . C й д
ак г .д v Е = ._ а 3 u.. c~i C . C ý Z7 у са Е й b ã 'ě_o й С л , g ь и д
ссб b • д t д• О Ń С .Е 9 д С
v сc о
E `a e ee т йв 3 ° ó с пг ,ы Ø с е°
._ _ С д о сд д ои к е к w
Е С р • й E í -, й 2 0 Е 0.-Q 'й дд ' Е >' °' a 7 ć
•
Е ! W cac. '• W 'ø ы o W cpi й .cr Q ß: Ń w И .д
• • • • • • • •
Foc
us f
or t
each
ing,
lea
rnin
g an
d as
sess
men
t
Wh
o le
num
bers
, fra
ctio
ns
and
inte
gers
14
E E
xper
ien
ce f
or
all
stu
den
ts.
. с ,
co o [ [ од
. > у [ и О •Д . . [ .
С .' U •
.и
Ú .;
И а ) .-ч .-ч .
[ [ а ) еб .н . . о > 4. а > .-.
с nY
С . . [ •v и u . .. а О а и л
ayi > Е . Ó Ó
.- _t
Е _o о ° a' [
. . Е cL . c° и °.• .И
О у ° о Ё v й •д b .. U • о 0 у. .
• U. N [ [. ..`
гб . .
3 гб .. [ . и . .
оа0 С
Е С Ć Ć o [ [cЧд цy
и . v
. b е о од
[b . [ •б ... . .b ьИ. a, b • ro й і b о 5 i йо ć a i a . с
. л •O и ь . Т1 и '... b
bq 00 [ . [
сб й . С [ . С ь . , Ć .,
•[
a) .о Е .
Е .р '. , л •.+ Ń o ú с сб
сб сб [ oA сб сд L1
г4 й W 3 á Wc[aá
< л: E С7 х -; ■ о о ■ о
15
Notes for teachers To a very large extent the following activities relating to whole numbers, fractions and integers in Year 8 aim to provide consolidation and prac-tice with numbers and operations in meaningful contexts. Those students who can demonstrate consistent performance with the standard algor-ithms might still have trouble applying their knowledge in practical situations. Other students, still struggling to developnumber concepts, might not learn to apply them . through out-of-context drill.
Strategies for mental calculation and estimation, and ready access to a calculator are proposed as major elements of an approach to help all students apply their knowledge.
Whether dealing with whole numbers, fractions or integers students must develop rich concepts and a variety of ways of recording, explaining and representing numbers. Students must feel confi-dent with the number system if they are to esti-mate, compare, classify and analyse numbers in practical situations.
In working with fractions students _ should also move confidently between common and decimal forms of symbolism. Students should also be able to choose approximations for fractions, input fractions into calculators and interpret calculator displays.
By Year 8, students will have developed some pro-ficiency in adding and subtracting fractions (in decimal and common forms) and simple mixed numbers. On the other hand, many students, or even most, will not have met multiplication of common fractions. Therefore, in introducing this new procedure, the teacher will need to make links among concrete, verbal and symbolic approaches.
Likewise, the addition of integers will be new work for Year 8 students. Again, representing this operation with positive and negative integers in a variety of ways will be essential to the learning experience.
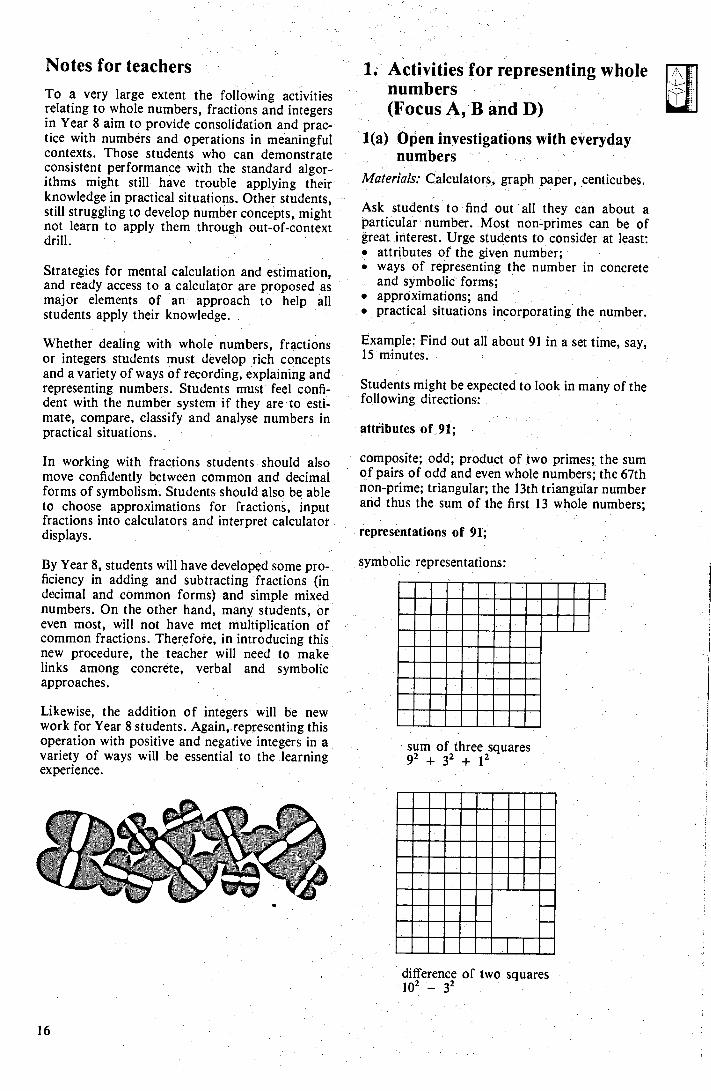
1. Activities for representing whole numbers (Focus A, B and D)
1(a) Open investigations with everyday numbers
Materials: Calculators, graph paper, centicubes.
Ask students to find out all they can about a particular number. Most non-primes can be of great interest. Urge students to consider at least: • attributes of the given number; • ways of representing the number in concrete
and symbolic forms; • approximations; and • practical situations incorporating the number.
Example: Find out all about 91 in a set time, say, 15 minutes.
Students might be expected to look in many of the following directions: .
attributes of 91;
composite; odd; product of two primes; the sum of pairs of odd and even whole numbers; the 67th non-prime; triangular; the 13th triangular number and thus the sum of the first 13 whole numbers;
representations of 91;
symbolic representations:
в ■в ■вв ■■■■■вв ■ввв ■вввввв ■ ввввввввввв ■ ввввввв ■■ ■■ввввввв ■ввввввв ■ ввв ■в ■в ■в ввввввв ■■ ■ввввввв ■
sum of three squares 92 ±32 ±12
difference of two squares 102 — з 2
ii
16
Find various other representations , involving squares. This might suggest a search using centicubes for solid representations.
sum of two cubes 43 + 33
A search for a representation involving the differ-ence between two cubes might follow.
number-line representations: Rulers might be used to show 91 in terms of mm or cm.
approximations of 91: The number 91 cm might be approximated as 90 cm in judging the winning margin in a snail race but would need to be approximated as 1 m in buying timber from which to cut a 91 cm piece.
practical situations involving 91: Students might suggest that 91 would be a golf score that Greg Norman would be very unhappy with.
The calculator provides other avenues for search-ing for information. Square roots and cube roots, for example, cart be approximated.
1(b) Exploring scientific notation (i) Investigation Materials: Scientific calculators.
Using a scientific calculator, investigate the con-ventions of scientific notation to represent large numbers.
Instruct students to try the following:
Display Display
1. О 3
2. 02
2. О 3
1000
200
2 000 3 EXP
EXP
EXP
Use questions to guide an investigation:
• What do you think 3' means?
Which will be the larger number, `2
• What would have to be inserted to give 5 000 or 50 000 or 500 000 in the final display?
• What is the largest number that can be inserted in the calculator in this way?
. What happens when you enter `2 50 ='? Why?
How does the display differentiate, between `2
decimal 3' and `2
(ii) Practice While students are studying exponential notation on calculator displays, they should also be intro-duced to other ways of writing these numbers. Then by way of consolidation, the class should complete tables as follows:
Make calculators readily available for checking conjectures.
Note: All students should eventually become con-fident with whole numbers and exponents. Some students will be ready in Year 8 to move on to the representation of fractions using exponents. See activity 3(h).
1(c) Approximate representations
Provide a range of situations that require students both to make approximations of large whole numbers and decide whether approximations are appropriate in the given context.
Materials: Newspaper reports and magazines as data sources.
17
EXP
3' or
3'?
EXP
2 000
З . 04 3 х 10°
Calculator entry
Calculator display
Scientific notation
Base-10 form
3 EXP 2
3 EXP 4
4. 02
1 000
30 000
5 x 10'
etc.
EXP
EXP
Example 1:
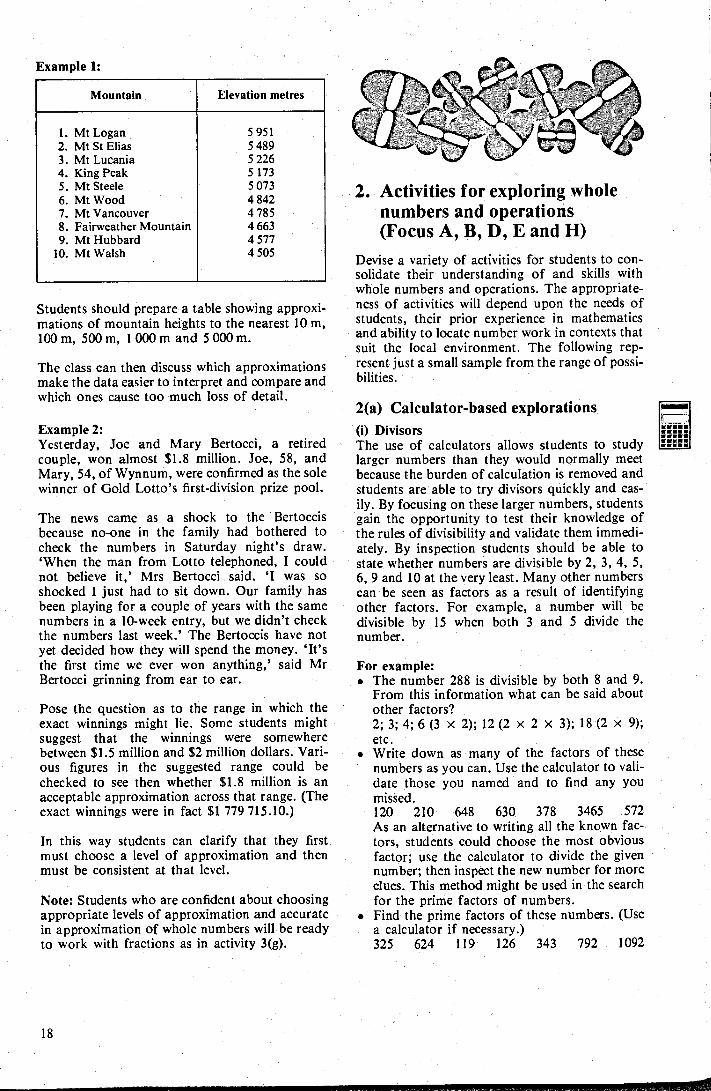
Mountain Elevation metres
1. Mt Logan 2. Mt St Elias 3. Mt Lucania 4. King Peak 5. Mt Steele 6. Mt Wood 7. Mt Vancouver 8. Fairweather Mountain 9. Mt Hubbard
10. Mt Walsh
5 951 5 489 5 226 5 173 5 073 4 842 4 785 4 663 4 577 4 505
Students should prepare a table showing approxi-mations of mountain heights to the nearest 10 m, 100m, 500m, 1000m and 5000m.
The class can then discuss which approximations make the data easier to interpret and compare and which ones cause too much loss of detail.
Example 2: Yesterday, Joe and Mary Bertocci, a retired couple, won almost $1.8 million. Joe, 58, and Mary, 54, of Wynnum, were confirmed as the sole winner of Gold Lotto's first-division prize pool.
The news came as a shock to the Bertoccis because no-one in the family had bothered to check the numbers in Saturday night's draw. `When the man from Lotto telephoned, I could not believe it,' Mrs Bertocci said. `I was so shocked I just had to sit down. Our family has been playing for a couple of years with the same numbers in a 10-week entry, but we didn't check the numbers last week.' The Bertoccis have not yet decided how they will spend the money. `It's the first time we ever won anything,' said Mr Bertocci grinning from ear to ear.
Pose the question as to the range in which the exact winnings might lie. Some students might suggest that the winnings were somewhere between $1.5 million and $2 million dollars. Vari-ous figures in the suggested range could be checked to see then whether $1.8 million is an acceptable approximation across that range. (The exact winnings were in fact $1 779 715.10.)
In this way students can clarify that they first must choose a level of approximation and then must be consistent at that level.
Note: Students who are confident about choosing appropriate levels of approximation and accurate in approximation of whole numbers will be ready to work with fractions as in activity 3(g).
2. Activities for exploring whole numbers and operations (Focus A, B, D, E and H)
Devise a variety of activities for students to con-solidate their understanding of and skills with whole numbers and operations. The appropriate-ness of activities will depend upon the needs of students, their prior experience in mathematics and ability to locate number work in contexts that suit the local environment. The following rep-resent just a small sample from the range of possi-bilities.
2(a) Calculator-based explorations (i) Divisors The use of calculators allows students to study larger numbers than they would normally meet because the burden of calculation is removed and students are able to try divisors quickly and eas-ily. By focusing on these larger numbers, students gain the opportunity to test their knowledge of the rules of divisibility and validate them immedi-ately. By inspection students should be able to state whether numbers are divisible by 2, 3, 4, 5, 6, 9 and 10 at the very least. Many other numbers can be seen as factors as a result of identifying other factors. For example, a number will be divisible by 15 when both 3 and 5 divide the number.
For example: . The number 288 is divisible by both 8 and 9.
From this information what can be said about other factors? 2; 3; 4; 6 (3 x 2); 12 (2 x 2 x 3); 18 (2 x 9); etc.
. Write down as many of the factors of these numbers as you can. Use the calculator to vali-date those you named and to find any you missed. 120 210 648 630 378 3465 572 As an alternative to writing all the known fac tors, students could choose the most obvious factor; use the calculator to divide the given number; then inspect the new number for more clues. This method might be used in the search for the prime factors of numbers.
. Find the prime factors of these numbers. (Use a calculator if necessary.) 325 624 119 126 343 792 1092
18
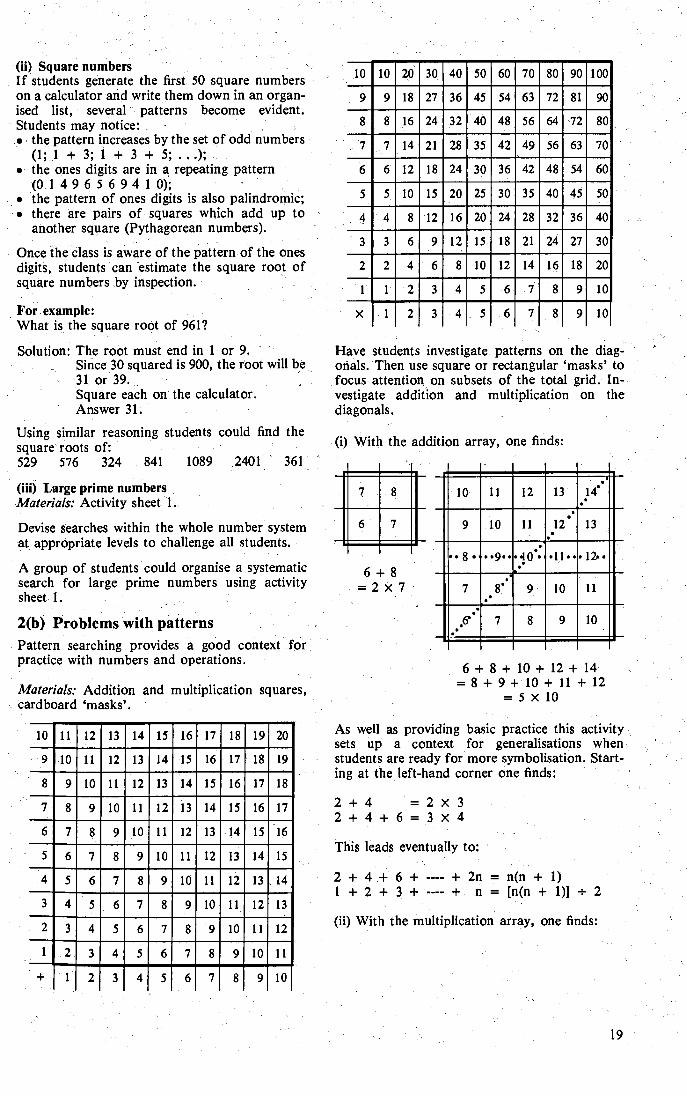
(ii) Square numbers If students generate the first 50 square numbers on a calculator and write them down in an organ-ised list, several patterns become evident. Students may notice: • the pattern increases by the set of odd numbers
(1;1 + 3; 1 + 3 + 5; ..); • the ones digits are in ą repeating pattern
(0.1496569410); • the pattern of ones digits is also palindromic; • there are pairs of squares which add up to
another square (Pythagorean numbers).
Once the class is aware of the pattern of the ones digits, students can estimate the square root of square numbers by inspection.
For . example: What is the square root of 961?
50 10
9
8
10 20 30 40 60 70 80 90 100
27 36 54 72 81 9 18 45 б 3 90
24 8 16 32 40 48 56 б 4 72 80
14 21 28 35 42 49 56 б 3 70 7 7
60 30 36 42 48 54 б 12 18 24 б
45 15 20 40 50 25 30 35 5 10 5
36 4 12 16 20 24 28 32 40 8 4
га 12 15 18 21 27 30 3 3 б 9
8 14 20 10 12 16 18 2 2 4 б
2 3 4 5 b 7 8 9 10 1 1
9 10 1 2
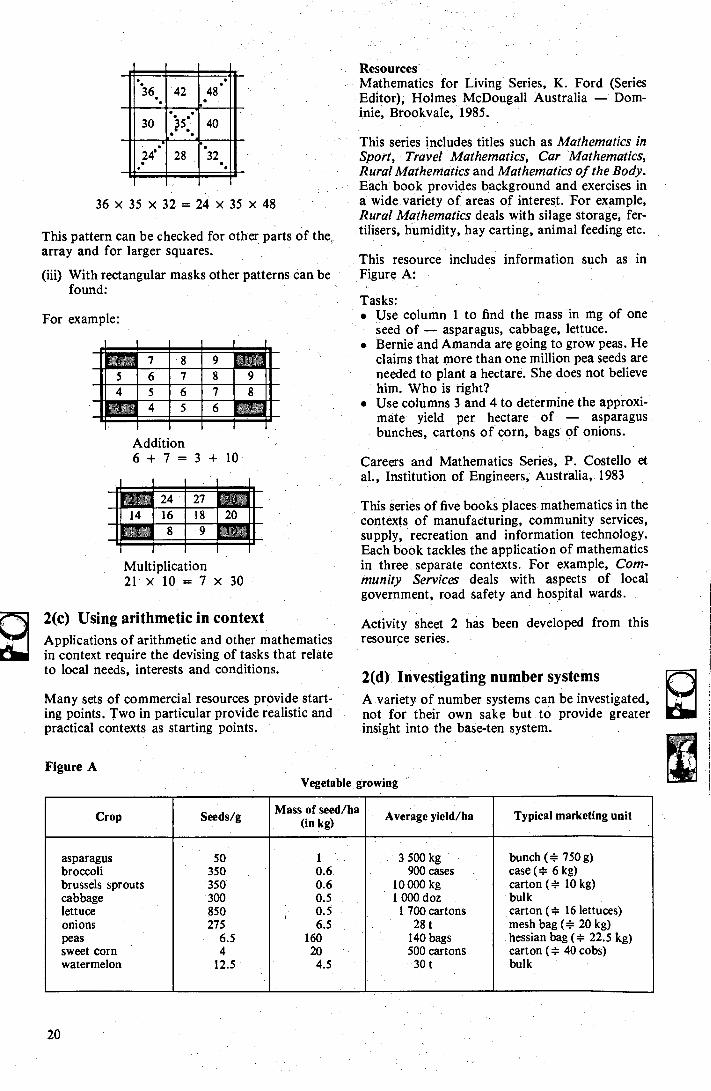
Have students investigate patterns on the diag- will be
onals. Then use square or rectangular `masks' to focus attention on subsets of the total grid. In-vestigate addition and multiplication on the diagonals.
Solution: The root must end in 1 or 9. Since 30 squared is 900, the root 31 or 39. Square each on the calculator. Answer 31.
Using similar reasoning students could find the square roots of: 529 576 324 841 1089 .2401 361
(i) With the addition array, one finds:
14 1•
(iii) Large prime numbers Materials: Activity sheet 1.
Devise searches within the whole number system at appropriate levels to challenge all students.
A group of students could organise a systematic search for large prime numbers using activity sheet 1.
7 8 10 12 13 11
б 7 11 12 13 9 10
•.10'. .11.. . 12g.. б + 8 ,
8• ,• = 2 х 7 9 10 11 7
10 8 9 •6• 7 2(b) Problems with patterns
Pattern searching provides a good context for practice with numbers and operations.
б + 8 + il ± 12 + 14 = 8 ± 9 ± 10 + il ± 12
= 5 x 10 Materials: Addition and multiplication squares, cardboard `masks'.
As well as providing basic practice this activity sets up a context for generalisations when students are ready for more symbolisation. Start-ing at the left-hand corner one finds:
10
9
8
7
б
5
4
3
2
1
13 19 20 11 14 15 16 17 18 12
18 19 10 12 13 14 15 16 17 11
18 9 13 14 15 16 17 10 11 12
2±4 = 2 x 3 2+ 4 + б = 3 x 4 8 12 13 14 15 16 17 9 10 11
7 12 13 14 15 16 8 9 10 11 This leads eventually to:
б 12 13 15 7 8 9 10 11 14
г +4 +6 +---- +2n= n(n+ 1) 1 + 2 ± 3 ± ---- ± n = [n(n + 1)] _ г
14 11 10 5 б 7 8 9 12 13
4 12 13 5 б 7 8 9 10 11 (ii) With the multiplication array, one finds:
3 4 12 5 б 7 8 9 10 11
2 3 4 5 б 7 8 9 10 11
2 3 4 5 б 7 8 9 10
19
Seeds/g Mass of seed/ha
(in kg) Typical marketing unit Crop Average yield/ha
asparagus broccoli brussels sprouts cabbage lettuce onions peas sweet corn watermelon
3500 kg 900 cases
10 000 kg 1 000 doz 1 700 cartons
28 t 140 bags 500 cartons 30 t
bunch (* 750 g) case (* 6 kg) carton (* 10 kg) bulk carton (* 16 lettuces) mesh bag ( ф 20 kg) hessian bag (* 22.5 kg) carton ( ф 40 cobs) bulk
50 350 350 300 850 275
6.5 4
12.5
0.6. 0.6 0.5 0.5 6.5
160 20 4.5
35 40
28
36x35x 32=24x35x48
This pattern can be checked for other parts of the array and for larger squares.
(iii) With rectangular masks other patterns can be found:
For example:
. 0 9 1 І© б 00 9 1 10® б 001 1- 0© б 1
Addition б + 7 = 3 + 10
Multiplication 21 х 10=7 х 30
2(c) Using arithmetic in context Applications of arithmetic and other mathematics in context require the devising of tasks that relate to local needs, interests and conditions.
Many sets of commercial resources provide start-ing points. Two in particular provide realistic and practical contexts as starting points.
Resources Mathematics for Living Series, K. Ford (Series Editor), Holmes McDougall Australia Dom- inie, Brookvale, 1985.
This series includes titles such as Mathematics in Sport, Travel ' Mathematics, Car Mathematics, Rural Mathematics and Mathematics of the Body. Each book provides background and exercises in a wide variety of areas of interest. For example, Rural Mathematics deals with silage storage, fer-tilisers, humidity, hay carting, animal feeding etc.
This resource includes information such as in Figure A:
Tasks: . Use. column 1 to find the mass in mg of one
seed of — asparagus, cabbage, lettuce. . Bernie and Amanda are going to grow peas. He
claims that more than one million pea seeds are needed to plant a hectare. She does not believe him. Who is right?
• Use columns 3 and 4 to determine the approxi- mate yield per hectare of — asparagus. bunches, cartons of corn, bags of onions.
Careers and Mathematics Series, P. Costello et al., Institution of Engineers, Australia, 1983
This series of five books places mathematics in the contexts of manufacturing, community services, supply, recreation and information technology. Each book tackles the application of mathematics in three separate contexts. For example, Com-munity Services deals with aspects of local government, road safety and hospital wards.
Activity sheet 2 has been developed from this resource series.
2(d) Investigating number systems A, variety of number systems can be investigated, not for their own sake but to provide greater insight into the base-ten system.
36 •.
48
30
32.,
Figure A Vegetable growing
20
i
(i) Roman numerals This system can be investigated through clockface numerals, page numbering in books or through a variety of puzzles.
For example:
How can you view this as- a true sentence?
XI=I—X
(Turn it upside down.)
or:
The price of CLIX Biscuits is hidden in the brand name. What is the price per packet?
or:
Shift one match to make a true statement.
VI- IV # X (VI + IV = X)
Vц + I =V (VII — I = VI)
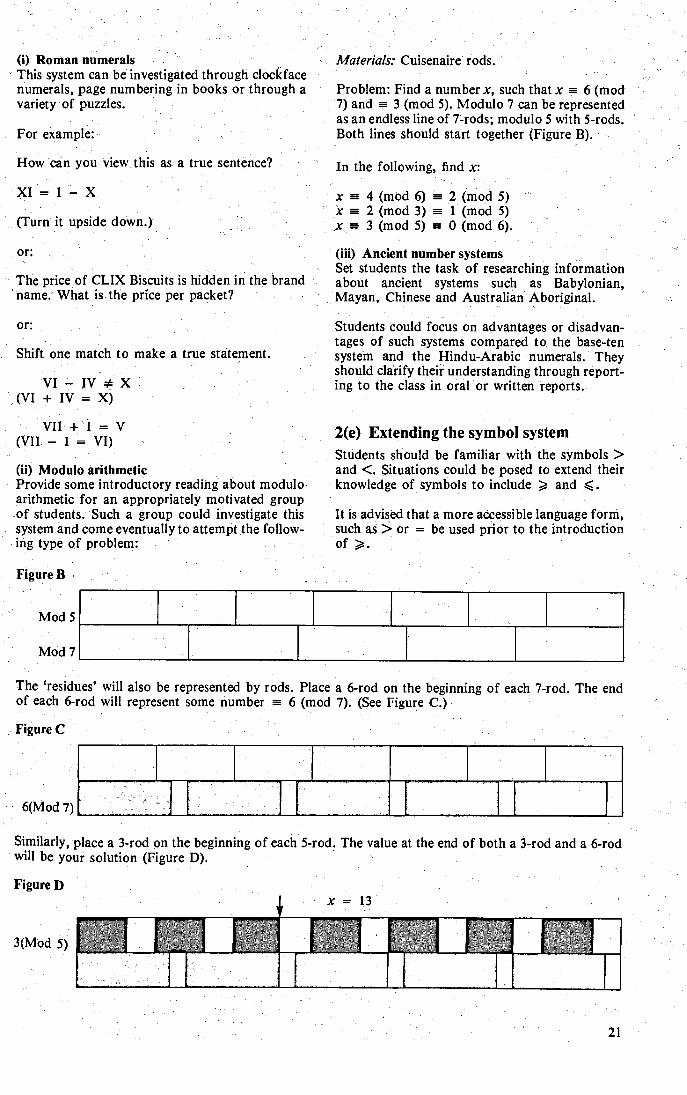
(ii) Modulo arithmetic Provide some introductory reading about modulo arithmetic for an appropriately motivated group of students. Such a group could investigate this system and come eventually to attempt the follow-ing type of problem:
Figure B
Materials: Cuisenaire rods.
Problem: Find a number x, such that x = 6 (mod 7) and m 3 (mod 5). Modulo 7 can be represented as an endless line of 7-rods; modulo 5 with 5-rods. Both lines should start together (Figure B).
In the following, find x:
x = 4 (mod 6) = 2 (mod 5) х = 2 (mod 3) = 1 (mod 5) X = З (mod 5) т O (mod 6).
(iii) Ancient number systems Set students the task of researching information about ancient systems such as Babylonian, Mayan, Chinese and Australian Aboriginal.
Students could focus on advantages or disadvan-tages of such systems compared to the base-ten system and the Hindu-Arabic numerals. They should clarify their understanding through report-ing to the class in oral or written reports.
2(e) Extending the symbol system Students should be familiar with the symbols > and <. Situations could be posed to extend their knowledge of symbols to include and <.
It is advised that a more accessible language form, such as > or = be used prior to the introduction of >.
Mod 5
Mod 7
The `residues' will also be represented by rods. Place a 6-rod on the beginning of each 7-rod. The end of each 6-rod will represent some number 6 (mod 7). (See Figure C.)
Figure C
6(Мод 7)
Similarly, place a 3-rod on the beginning of each 5-rod. The value at the end of both a 3-rod and a 6-rod will be your solution (Figure D).
Figure D
3(Mod 5)
х = 13
21
Whole
(mum Four-tenths
‚ I IiiiiiIII
(i) Arranging numbers Have students use a set of given numerals (for example 2, 4, 6), operator symbols, parentheses where appropriate and equality/inequality sym-bols to make number sentences.
Examples: 24 + б < 246 (2 + 4) x 66 > 2 x (4 + 66)
Others would read these back and check them for correctness.
Example: Let a be a variable that can take on the values 2, 4 or 6.
2 multiplied by a < or = 12
2 x a < 12
2 more than a > or = 4
2 + a > 4
Students should translate from verbal form to mathematical symbolic form and vice versa.
(ii) Making up stories . Set up some symbolic statement and ask students to make up a story that could be stated in this symbolic form.
Example: m + (3 x m) > 44
A story might be: A girl is a certain age (m years). Her mother is three times her age (3 x in years). Together their ages total 44 years or more.
3. Activities for representing and comparing fractions (Focus A, C, D and G)
These activities focus on the concept of a fraction and the interrelationship between the common and decimal forms of the symbols used to rep-resent fractions.
e I
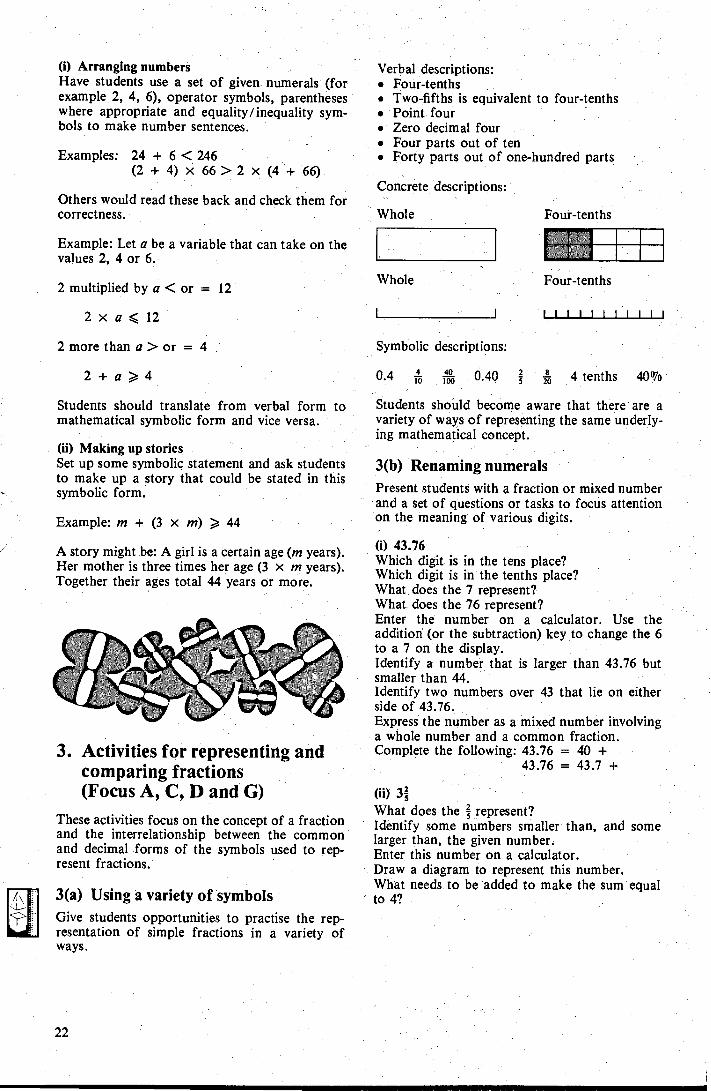
3(а ) Using a variety of symbols Give students opportunities to practise the rep-resentation of simple fractions in a variety of ways.
Verbal descriptions: • Four-tenths • Two-fifths is equivalent to four-tenths • Point four • Zero decimal four • Four parts out of ten • Forty parts out of one-hundred parts
Concrete descriptions:
Whole
Four-tenths
Symbolic descriptions:
0.4 io 0.40 š % 4 tenths 40%
Students should become aware that there are a variety of ways of representing the same underly-ing mathematical concept.
3(b) Renaming numerals Present students with a fraction or mixed number and a set of questions or tasks to focus attention on the meaning of various digits.
(i) 43.76 Which digit is in the tens place? Which digit is in the tenths place? What does the 7 represent? .
What does the 76 represent? Enter the number on a calculator. Use the addition (or the subtraction) key to change the 6 to a 7 on the display. Identify a number that is larger than 43.76 but smaller than 44. Identify two numbers over 43 that lie on either side of 43.76. Express the number as a mixed number involving a whole number and a common fraction. Complete the following: 43.76 = 40 +
43.76 = 43.7 +
(ii) 3š What does the š represent? Identify some numbers smaller than, and some larger than, the given number. Enter this number on a calculator. Draw a diagram to represent this number. What needs to be added to make the sum equal to 4?
22
Allowable digits Use all the digits to complete each line.
>
>-
0. 0.9 1.0
Allowable digits 3 4 5 5 0 2 Use all the digits to complete each line.
5.50 > 0.02 <
50.9 > 1.0543 > 5.54 >
.42 > 0.34 < 0.954 < 1.025 > .02 .. <
.3 0.55 Э .02 1. .3
C e.g.: 3 5
4
5 or C 4
5 MR Fl 3
3
Fl
3(c) Fractions on a number line 3(f) Arranging decimal numbers in order I г i 1 Mark 2.5 0 1 2 3 4 1 г I Mark 0.8 0 1 2 , 1 Mark Э .7 0 5
0 A 1 B 2 C D
Estimate fractions, in common and decimal forms, for A, В , C and D.
It can be useful to draw number lines such as these on cards covered with clear plastic for regular use.
3(d) Counting on calculators Have students work in pairs to check their under-standing of decimal fractions. The students should set up a calculator to count by tenths (or hundredths or thousandths) from some starting number.
For example:
5.7 + .1 = = = ---
5.73 + .1 = = = --
5.73+.01 = = =---
Ask one student to count by tenths (or hun-dredths or thousandths) while the other checks by pressing the = button.
3(e) Entering fractions on calculators Students then practise entering fractions into cal-culators, reading displays and translating from decimal displays to common fraction format.
Fractions used should be those commonly encountered or should come from practical con-texts. (See activity 6.)
Have students develop a strategy for entering mixed numbers (involving whole numbers and common fractions) into calculators and practise this.
р +
Students working in pairs could each enter a mixed number, compare results and check pro-cedures used, where necessary.
Many students have trouble arranging a set of fractions in ascending or descending order. Use a variety of approaches to provide practice in this.
Materials: Cards (similar to that following) on laminated cardboard or transparencies.
As a quick regular activity give students a set of digits and instructions to use each digit once only in completing each line.
Example: A card might be filled in as follows:
This type of activity can be made as simple or as challenging as required to suit the needs of all students. The card can be simplified if necessary or the number of allowable digits can be reduced.
3(g) Estimating and approximating with fractions
Just as students need to develop a feel for whole numbers, so students need to become comfortable about where commonly encountered fractions fit within the number system.
Materials: A collection of cuttings from news-papers, magazines, brochures etc. which includes references to fractions and mixed numbers involv-ing decimal and common forms of notation.
Pick at random some items from the collection of cuttings and ask students to provide information about each number found. Students can report individually to the whole class so that others can check. Ask students to concentrate on estimation and approximation in these reports.
•
23
Calculator entry
Calculator display
Base-10 form
Scientific notation
40 000 a 000
400 40` 4 .4 . о 4 .004
4x10° 4 Exp 4
4 Exp 1 ± 4. - 01
EXP
EXP
Enter Display Display
5 Exp 3 t 4 Exp 3 ± 4 Exp 2 ± 5 Exp 2 ± 2 Exp 1 ± 1 Exp 2 ±
0.005 0.004 0.04 0.05 0.2 0.01
5. -03 4.-03 4. - 02 5:-02 2. — 01 1. — 02
Reports might take the following form:
0.75 `This fraction is greater than one-half and less than 1. It is greater than seven-tenths but less than eight-tenths. It is often approximated as 0.8 or eight-tenths.'
31 'This number is the sum of a whole number and a fraction. It is less than 4.0; it is more than 3.5; it is more than 3.6. On a calculator it shows as 3.666667, so it is less than 3.7.'
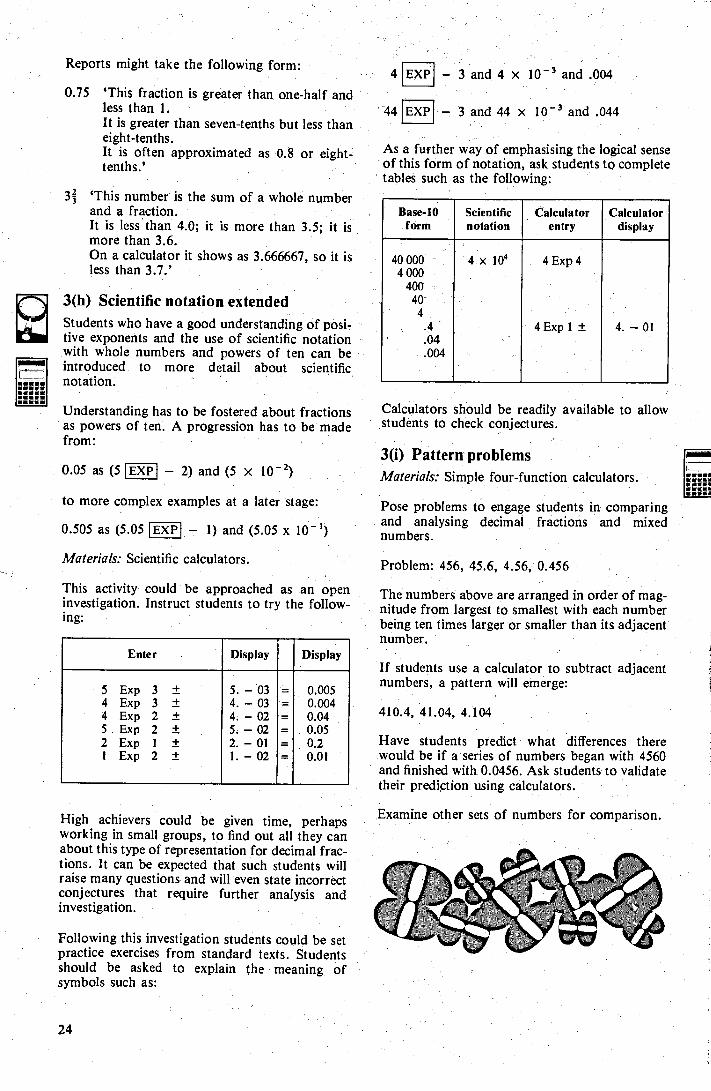
3(h) Scientific notation extended Students who have a good understanding of posi-tive exponents and the use of scientific notation with whole numbers and powers of ten can be introduced to more detail about scientific notation.
Understanding has to be fostered about fractions as powers of ten. A progression has to be made from:
— 3 and 4 x 10 - з and .004
- 3 and 44 х 10- з апд .044
As a further way of emphasising the logical sense of this form of notation, ask students to complete tables such as the following:
Calculators should be readily available to allow students to check conjectures.
44
0.05 as (5 EXP — 2) and (5 x 10_ 2) 3(i) Pattern problems Materials: Simple four-function calculators.
to more complex examples at a later stage:
0.505 as (5.05 EXP - 1) and (5.05 x 10_ 1)
Materials: Scientific calculators.
This activity could be approached as an open investigation. Instruct students to try the follow-ing:
High achievers could be given time, perhaps working in small groups, to find out all they can about this type of representation for decimal frac-tions. It can be expected that such students will raise many questions and will even state incorrect conjectures that require further analysis and investigation.
Following this investigation students could be set practice exercises from standard texts. Students should be asked to explain the meaning of symbols such as:
Pose problems to engage students in comparing and analysing decimal fractions and mixed numbers.
Problem: 456, 45.6, 4.56, 0.456
The numbers above are arranged in order of mag-nitude from largest to smallest with each number being ten times larger or smaller than its adjacent number.
If students use a calculator to subtract adjacent numbers, a pattern will emerge:
410.4, 41.04, 4.104
Have students predict what differences there would be if a series of numbers began with 4560 and finished with 0.0456. Ask students to validate their prediction using calculators.
Examine other sets of numbers for comparison.
24
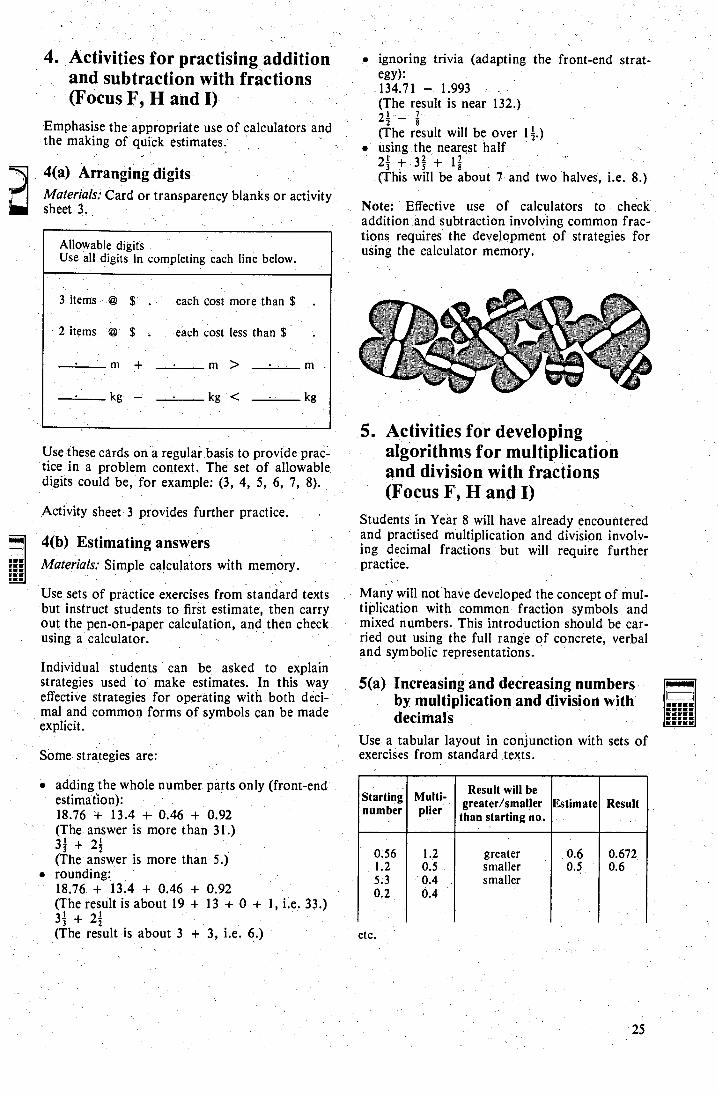
Allowable digits Use all digits. in completing each line below.
3 items © $ . each cost more than $
2 items @ $ each cost less than $
m + r> m
kg — kg < kg
Result will be greater/smaller
than starting no. Estimate Result Starting
number Mufti-plier
greater smaller smaller
0.56 1.2 1.2 0.5 5:з 0.4 о .2 0.4
0.6 0.672
0.5 0.6
■в ■ u. řii гп
4. Activities for practising addition and subtraction with fractions (Focus F, H and I)
Emphasise the appropriate use of calculators and the making of quick estimates.
4(a) Arranging digits Materials: Card or transparency blanks or activity sheet З .
Use these cards on a regular basis to provide prac-tice in a problem context. The set of allowable digits could be, for example: (3, 4, 5, 6, 7, 8).
Activity sheet 3 provides further practice.
4(b) Estimating answers Materials: Simple calculators with memory.
Use sets of practice exercises from standard texts but instruct students to first estimate, then carry out the pen-on-paper calculation, and then check using a calculator.
Individual students can be asked to explain strategies used to make estimates. In this way effective strategies for operating with both deci-mal and common forms of symbols can be made explicit.
Some strategies are:
• adding the whole number. parts only (front-end estimation): 18.76 + 13.4 + 0.46 + 0.92 (The answer is more than 31.) 3;+2? (The answer is more than 5.)
• rounding: 18.76 + 13.4 + 0.46 + 0.92 (The result is about 19 + 13 + 0 + 1, i.e. 33.) 33 + 2? (The result is about 3 + 3, i.e. 6.)
ignoring trivia (adapting the front-end strat- egy):
134.71 1.993 (The result is near 132.)
i 7 2 2 — 8 (The result will be over 11.)
. using the nearest half 21+35+ 1 (This will be about 7 and two halves, i.e. 8.)
Note: Effective use of calculators to check addition and subtraction involving common frac-tions requires the development of strategies for using the calculator memory.
5. Activities for developing algorithms for multiplication and division with fractions (Focus F, H and I)
Students in Year 8 will have already encountered and practised multiplication and division involv-ing decimal fractions but will require further practice.
Many will not have developed the concept of mul-tiplication with common fraction symbols and mixed numbers. This introduction should be car-ried out using the full range of ć oncrete, verbal and symbolic representations.
5(a) Increasing and decreasing numbers by multiplication and division with decimals
Use a tabular layout in conjunction with sets of exercises from standard texts.
etc.
25
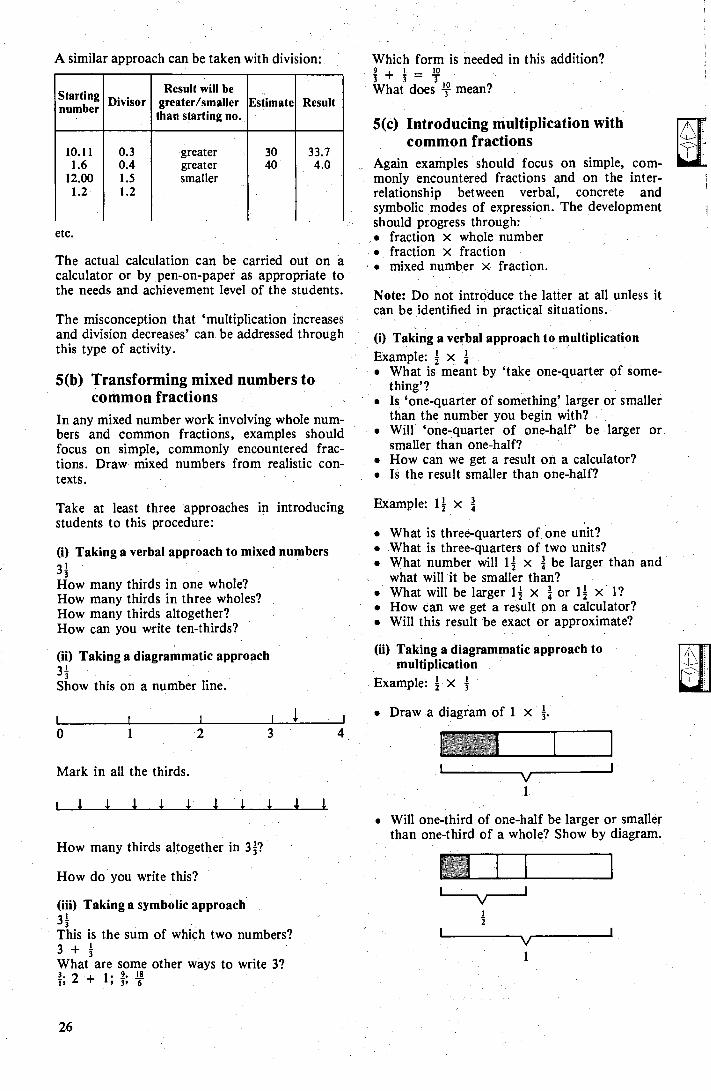
Result will be greater/smaller
than starting no. Divisor Result Estimate Starting
number
greater greater smaller
10.11 1.6
12.00 1.2
0.3 0.4 1.5 1.2
30 40
33.7 4.0
ii Mark in all the thirds.
Will one-third of one-half be larger or smaller than one-third of a whole? Show by diagram.
ž
A similar approach can be taken with division:
etc.
The actual calculation can be carried out on a calculator or by pen-on-paper as appropriate to the needs and achievement level of the students.
The misconception that `multiplication increases and division decreases' can be addressed through this type of activity.
5(b) Transforming mixed numbers to common fractions
In any mixed number work involving whole num-bers and common fractions, examples should focus on simple, commonly encountered frac-tions. Draw mixed numbers from realistic con-texts.
Take at least three approaches in introducing students to this procedure:
(i) Taking a verbal approach to mixed numbers 3 How many thirds in one whole? How many thirds in three wholes? How many thirds altogether? How can you write ten-thirds?
(ii) Taking a diagrammatic approach 3 Show this on a number line.
I i i i Ј I 0 1 2 3 4
Which form is needed in this addition? 9L _ 10 з + з - 3 .
What does mean?
5(c) Introducing multiplication with common fractions
Again examples should focus on simple, com-monly encountered fractions and on the inter-relationship between verbal, concrete and symbolic modes of expression. The development should progress through: • fraction x whole number • fraction x fraction • mixed number x fraction.
Note: Do not introduce the latter at all unless it can be identified in practical situations.
(i) Taking a verbal approach to multiplication Example: 1 x • What is meant by `take one-quarter of some-
thing'? • Is `one-quarter of something' larger or smaller
than the number you begin with? • Will `one-quarter of one-half' be larger or
smaller than one-half? • How can we get a result on a calculator? • Is the result smaller than one-half?
Example: 11 x
• What is three-quarters of one unit? • What is three-quarters of two units? • What number will 12 x ; be larger than and
what will it be smaller than? • What will be larger 11 x á or 1 ź x 1? • How can we get a result on a calculator? • Will this result be exact or approximate?
(ii) Taking a diagrammatic approach to multiplication
Example: i x
• Draw a diagram of 1 з
i 1 1
How many thirds altogether in 3?
How do you write this?
(iii) Taking a symbolic approach
This is the sum of which two numbers? 3 + What are some other ways to write 3? з . 9. IB T,2+ 1; 3' V
26
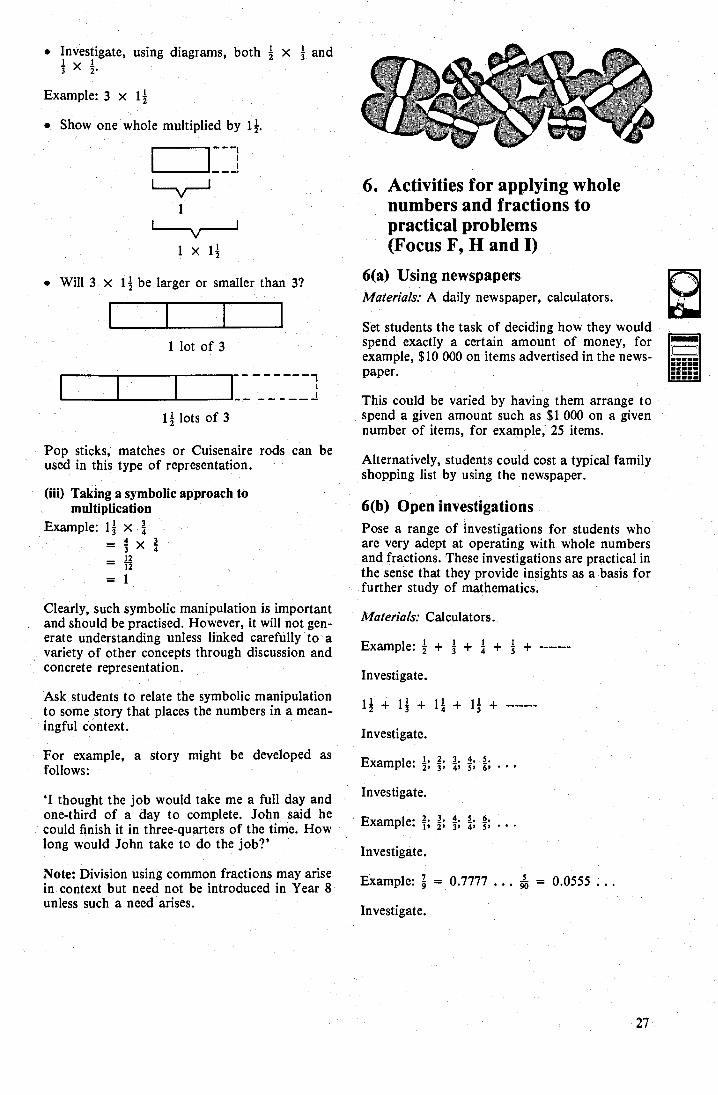
Е ЕЕЕЕ ЕЕЕ ø ЕЕЕЕЕ Е ЕЕЕЕ
• Investigate, using diagrams, both z 1 З Ρ x Ž•
Example: 3 x 12
• Show one whole multiplied by 11.
x 1?
• Will 3 x l i be larger or smaller than 3?
1 lot of 3
- 1
1? lots of 3
Pop sticks, matches or Cuisenaire rods can used in this type of representation.
(iii) Taking a symbolic approach to multiplication
Example: 13 x 4 3 З Ρ X 4 g _ 12
= 1
Clearly, such symbolic manipulation is important and should be practised. However, it will not gen-erate understanding unless linked carefully to a variety of other concepts through discussion and concrete representation.
Ask students to relate the symbolic manipulation to some story that places the numbers in a mean-ingful context.
For example, a story might be developed as follows:
`I thought the job would take me a full day and one-third of a day to complete. John said he could finish it in three-quarters of the time. How long would John take to do the job?'
Note: Division using common fractions may arise in context but need not be introduced in Year 8 unless such a need arises.
6. Activities for applying whole numbers and fractions to practical problems (Focus F, H and I)
б (a) Using newspapers Materials: A daily newspaper, calculators.
Set students the task of deciding how they would spend exactly a certain amount of money, for example, $10 000 on items advertised in the news-paper.
This could be varied by having them arrange to spend a given amount such as $1 000 on a given number of items, for example, 25 items.
Alternatively, students could cost a typical family shopping list by using the newspaper.
6(b) Open investigations
Pose a range of investigations for students who are very adept at operating with whole numbers and fractions. These investigations are practical in the sense that they provide insights as a basis for further study of mathematics.
Materials: Calculators.
Example: i + з + а + š +
Investigate.
12+ 13+ 1ą + 1S+
Investigate.
Example: ; 4; ; 4. s+ ..
Investigate.
Example: t; ź ; з ; а ; f; •..
Investigate.
Example:''- = 0.7777 . . . vo = 0.0555 . . .
Investigate.
be
27
Al 6(с ) Ordering materials for a job Provide students with situations concerned with measuring, calculating, ordering and costing materials. Jobs can be devised around printing, building, concreting, dressmaking, cooking, advertising, excavating etc.
(iii) Taking a symbolic approach Have students look for a logical extension down-wards of their addition tables.
4+ 3 = 7 3 + 3 =6 2 + 3 = 5 1 + 3 = 4 0 + 3 = 3
-1 + 3 = -2 +3-
etc.
It is not necessary to introduce students in Year 8 to the other operations of subtraction, multipli-cation and division with negative integers unless these arise in some context.
Al
7. Activities for exploring integers (Focus J and K)
7(a) Graphing in four quadrants Activities 1(a), 1(b), and 1(c) from the co-ordinates and analytical geometry topic can be used as introduction to negative integers once students are confident about graphing in the first quadrant.
7(b) Adding integers The introduction to addition involving negative integers should involve concrete, verbal and symbolic approaches.
(i) Taking a concrete approach • A 30 cm ruler can be used to trace out sums
such as 25 + -5 or 25 + -5 + 3 + 18. • Ask students to stand at integer points on a
number line drawn on the parade ground. Additions such as 3 + -6 or -6 + 3 or -3 + -4 can be modelled by counting along the line.
• Arrows on a number line on paper can be simi-lа rlу used as long as the abstract nature of the number-line concept for many students is appreciated,
I i — г i. i t 5 4 3 2 1 0 1 2 3 4 5
4 + -7 + 3 = 0
(ii) Taking a verbal approach Present students with a situation such as: -7 + 3, and ask questions as follows: • Will the result be larger or smaller than -7? • Will the result be larger or smaller than 3? • Is -7 larger or smaller than 3? • Is -7 larger or smaller than zero? • Will the answer be near 10? • Will the answer be larger than zero?
28
29
Activity sheet 1 Whole numbers, fractions and integers 0
If you inspect the whole numbers between 1 000 and 1 100, you can quickly eliminate those divisible by 2, 3 or 5
The 28 numbers left are shown on the wheel below. Use a calculator and systematically search to eliminate non-prime numbers. Colour in parts of the wheel connecting primes until you find a shape that indicates you have found all 16 prime numbers.
For numbers between 10 000 and 10 100 you can eliminate those divisible by 2, 3 and 5 and leave 28 prime suspects. Use a calculator to search for primes. Colour in parts of the wheel connecting primes until you find a shape that indicates that you have found all 11 prime numbers.
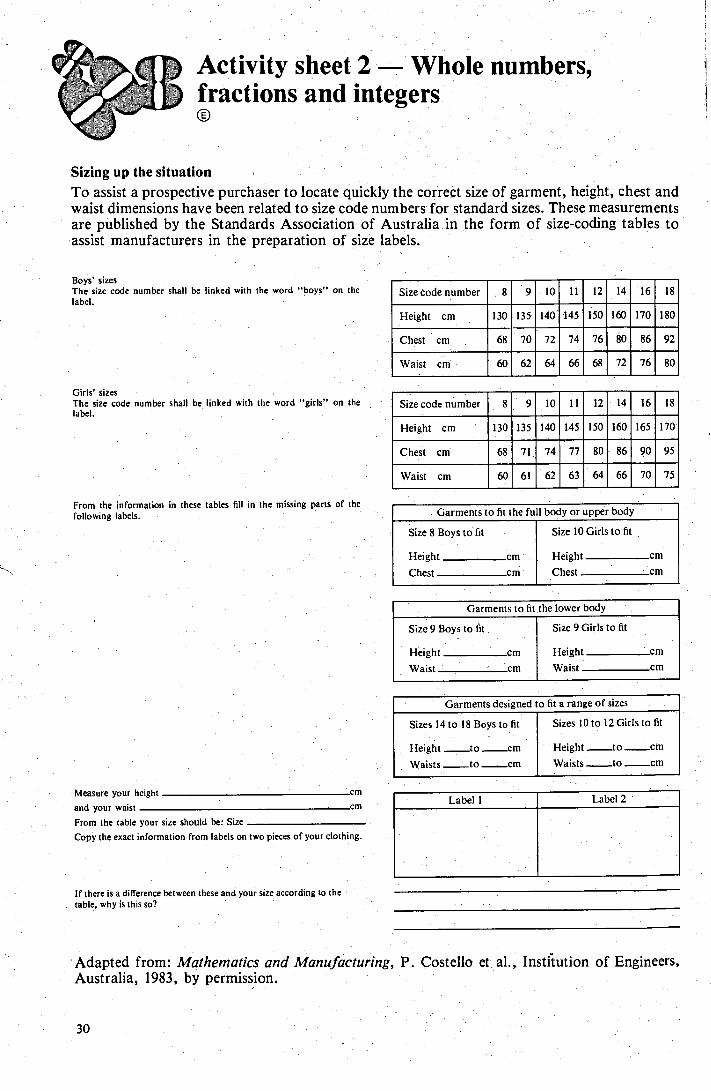
Activity sheet 2 Whole numbers, fractions and integers ó
Sizing up the situation To assist a prospective purchaser to locate quickly the correct size of garment, height, chest and waist dimensions have been related to size code numbers for standard sizes. These measurements are published by the Standards Association of Australia in the form of size-coding tables to assist manufacturers in the preparation of size labels.
Measure your height rm
and your waist cm
From the table your size should be: Size
Copy the exact information from labels on two pieces of your clothing.
If there is a difference between these and your size according to the table, why is this so?
Boys' sizes The size code number shall be linked with the word "boys" on the label.
10 14 16 18 12 11 9 Size code number 8
150 160 170 180 145 140 Height cm 130 135
80 76 86 92 74 70 72 68 Chest cm
76 72 68 80 60 62 66 Waist cm 64
Girls' sizes The size code number shall be linked with the word "girls" on the label.
14 18 12 16 11 Size code number 8 9 10
160 170 150 165 145 135 140 Height cm 130
95 80 86 90 77 74 68 71 Chest cm
б 6 70 75 64 62 63 60 61 Waist cm
From the information in these tables fill in the missing parts of the following labels. Garments to fit the full body or upper body
Size 10 Girls to fit Size 8 Boys to fit
Height cm
Chest cm Height cm
Chest cm
Garments to fit the lower body
Size 9 Girls to fit Si ż e 9 Boys to fit
Height cm
Waist cm Height
Waist
cm cm
Garments designed to fit a range of sizes
Sizes 10 to 12 Girls to fit Sizes 14 to 18 Boys to fit
Height _to _cm
Waists to _cm
Height _to _cm
Waists _to cm
Label 2 Label I
Adapted from: Mathematics and Manufacturing, P. Costello et al., Instiť ution of Engineers, Australia, 1983, by permission.
30
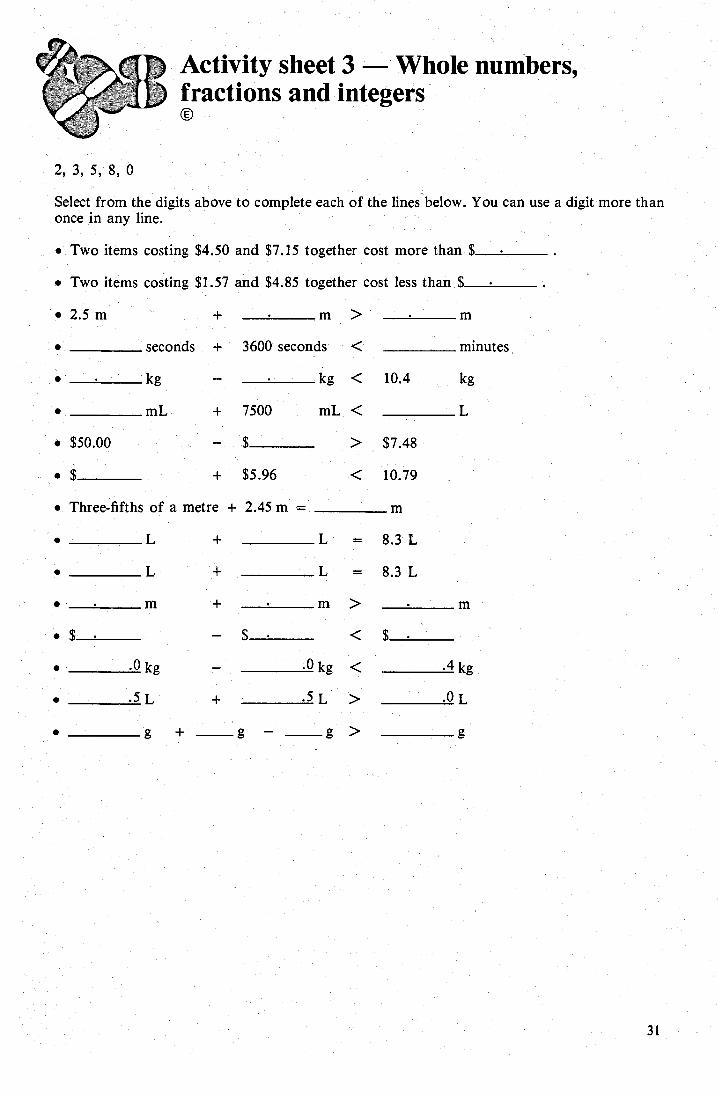
2, 3, 5, 8, 0
+
L = 8.3 L L
.0 kg
.5 L
.4 kg
.0 L
Activity sheet 3 Whole numbers, fractions and integers
Select from the digits above to complete each of the lines below. You can use a digit more than once in any line.
• Two items, costing $4.50 and $7.15 together cost more than $
• Two items costing $1.57 and $4.85 together cost less than $
> m
• seconds + 3600 seconds < minutes
• . kg — . kg < 10.4 kg
• mL + 7500 mL < L
• $50.00 $ > $7.48
• $ + $5.96 < 10.79
• Three-fifths of a metre + 2.45 т =
• L + L = 8.3 L
• 2.5 m
<
,р kу <
.5 L >
g> g
31
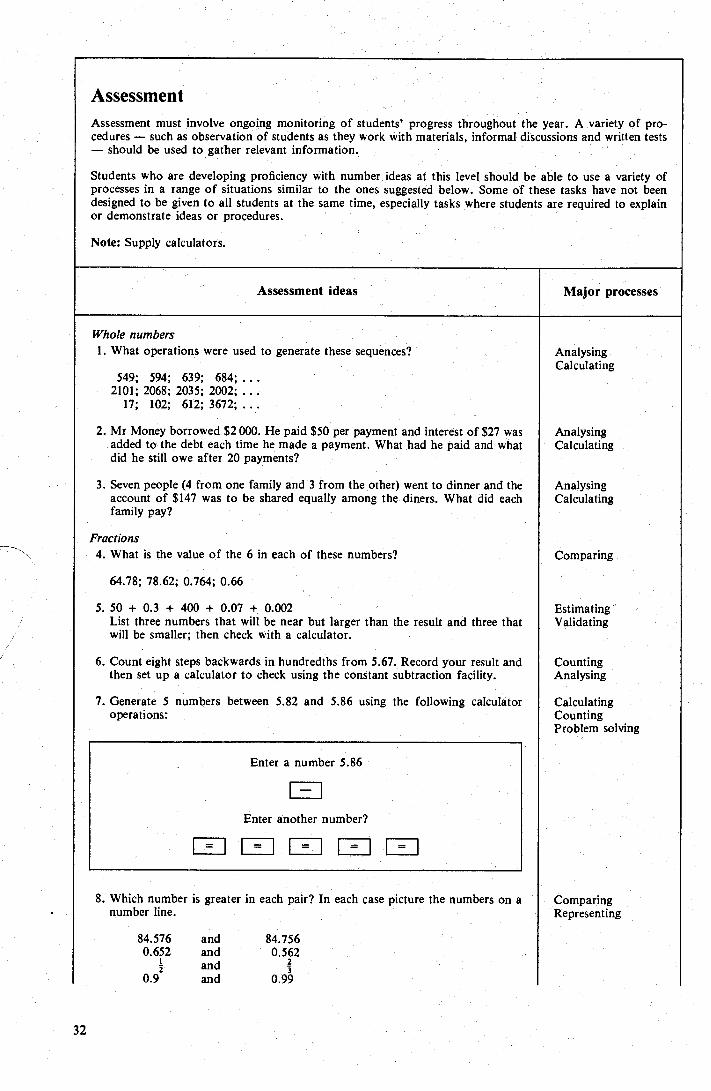
Enter another number?
Assessment Assessment must involve ongoing monitoring of students' progress throughout the year. A variety of pro- cedures such as observation of students as they work with materials, informal discussions and written tests — should be used to gather relevant information.
Students who are developing proficiency with number ideas at this level should be able to use a variety of processes in a range of situations similar to the ones suggested below. Some of these tasks have not been designed to be given to all students at the same time, especially tasks where students are required to explain or demonstrate ideas or procedures.
Note: Supply calculators.
Major processes Assessment ideas
Whole numbers 1. What operations were used to generate these sequences?
549; 594; 639; 684;... 2101; 2068; 2035; 2002; . . .
17; 102; 612; 3672; ...
2. Mr Money borrowed $2 000. He paid $50 per payment and interest of $27 was added to the debt each time he made a payment. What had he paid and what did he still owe after 20 payments?
3. Seven people (4 from one family and 3 from the other) went to dinner and the account of $147 was to be shared equally among the diners. What did each family pay?
Fractions 4. What is the value of the 6 in each of these numbers?
64.78; 78.62; 0.764; 0.66
5.50 + 0.3 + 400 + 0.07 + 0.002 List three numbers that will be near but larger than the result and three that will be smaller; then check with a calculator.
6. Count eight steps backwards in hundredths from 5.67. Record your result and then set up a calculator to check using the constant subtraction facility.
7. Generate 5 numbers between 5.82 and 5.86 using the following calculator operations:
8. Which number is greater in each pair? In each case picture the numbers on a number line.
84.576 and 84.756
0.652 and 0.562 and з
0.9 and 0.99
Analysing Calculating
Analysing Calculating
Analysing Calculating
Comparing
Estimating Validating
Counting Analysing
Calculating Counting Problem solving
Comparing Representing
32
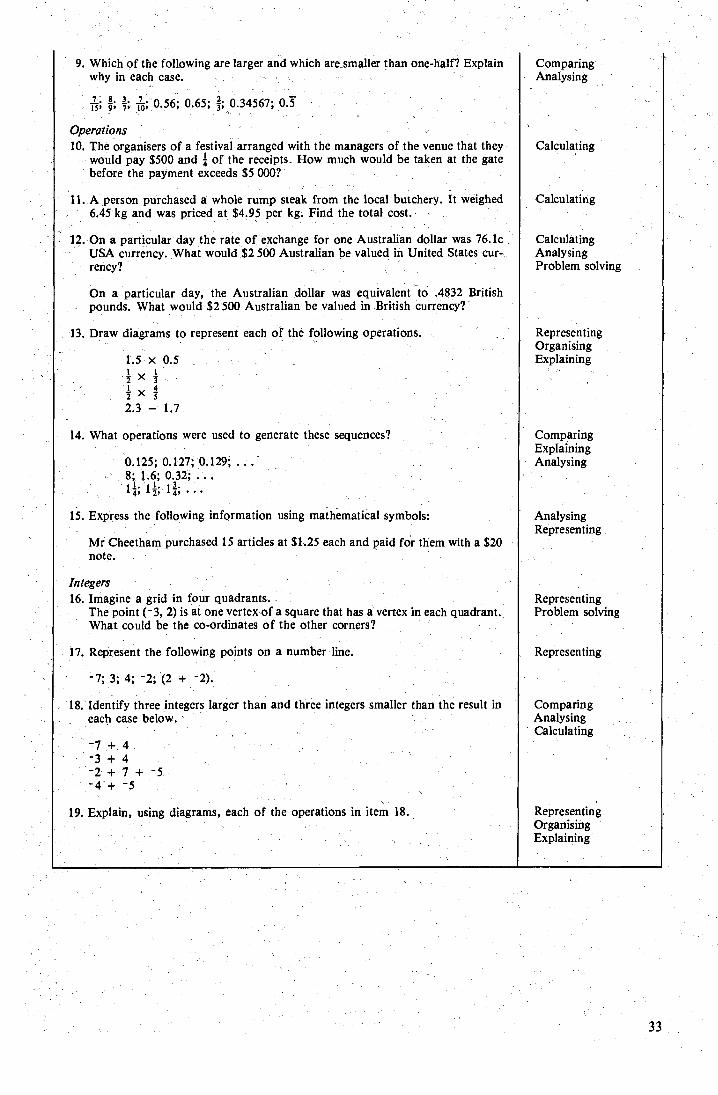
9. Which of the following are larger and which are smaller than one-half? Explain why in each case.
- 7 . 8, З , -7 , ,° 2 15, д , , о 0.56; 0.65; З ; 0.34567; 03
Operations 10. The organisers of a festival arranged with the managers of the venue that they
would pay $500 and á of the receipts. How much would be taken at the gate before the payment exceeds $5 000?
11.,A person purchased a whole rump steak from the local butchery. It weighed 6.45 kg and was priced at $4.95 per kg. Find the total cost.
12. On a particular day the rate of exchange for one Australian dollar was 76.1c USA currency. What would $2 500 Australian be valued in United States cur-rency?
On a particular day, the Australian dollar was equivalent to .4832 British pounds. What would $2500 Australian be valued in British currency?
13. Draw diagrams to represent each of the following operations.
14. What operations were used to generate these sequences?
0.125; 0.127; 0.129; : . . 8; 1.б ; 0.32; . 1 а ; 1 г ; 1 а ; ...
15. Express the following information using mathematical symbols:
Mr Cheetham purchased 15 articles at $1.25 each and paid for them with a $20 note.
Integers 16. Imagine a grid in four quadrants.
The point (-3, 2) is at one vertex of a square that has a vertex in each quadrant. What could be the co-ordinates of the other corners?
17. Represent the following points on a number line.
-7, 3, 4, 2, (2
+ -2)
18. Identify three integers larger than and three integers smaller than the result in each case below.
-7 + 4 -3 +4 -2+ 7 + -5 -4 + -5
19. Explain, using diagrams, each of the operations in item 18.
Comparing Analysing
Calculating
Calculating
Calculating Analysing Problem solving
Representing Organising Explaining
Comparing Explaining Analysing
Analysing Representing
Representing Problem solving
Representing
Comparing Analysing Calculating
Representing Organising Explaining
33

Percentage and money Contents i
Focus for teaching, learning and assessment Notes for teachers 1. Activities for discussing the usefulness of percentage
(Focus C, D and E)
З 6
(a) Discussing percentages (b) Practical situations
2. Activities for investigating relationships between fractions and percentages . .rw-- (Focus A, B and C)
(a) Analysing relationships using 10 x 10 grids (b) Practising fraction-percentage conversions
3.-Activities for calculating and estimating percentages of given numbers or quantities (Focus D, E and F)
(a) Finding percentages using a calculator '(b) Tables of growth . (c) Projects chosen by students (d) Comparing sporting results
4. Activities for developing mental strategies for estimating ,ї percentages `z,'
`(Focus D) (a) Flashcards
5. Activities for solving problems involving money and \ percentage (Focus D, E F and G)
(a) Population problem (b) Consumer report (c) Money problem
Activity sheets 7'
38 38
41 41 41
42
47 .
38 39 39 39
40
40 40
41
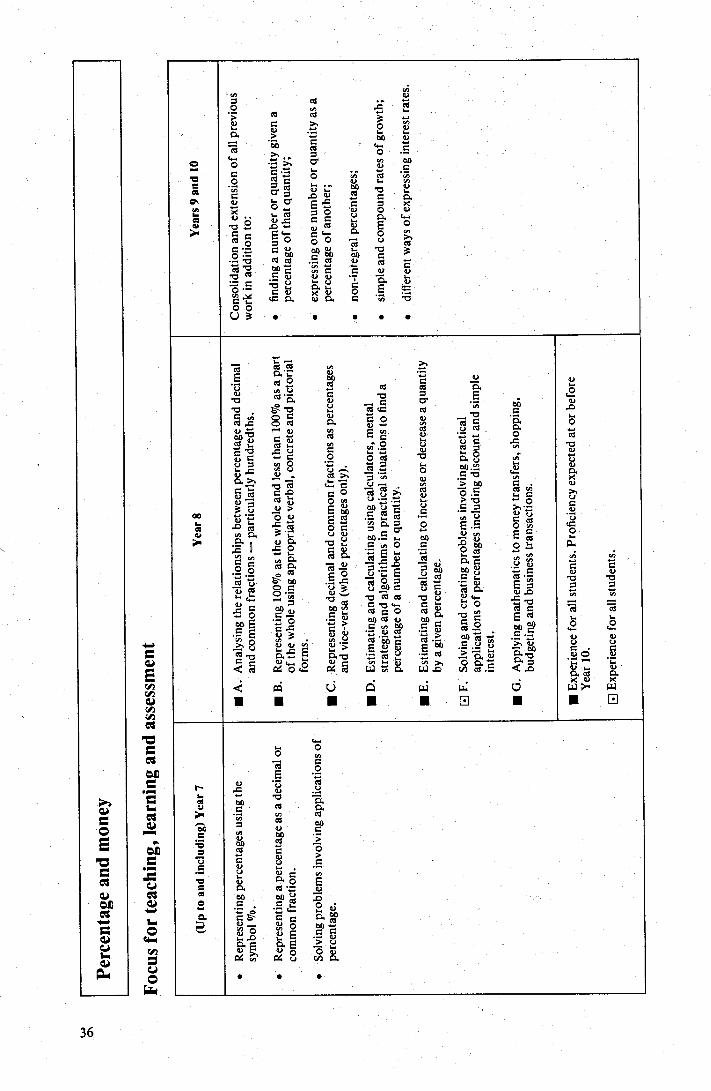
м O О
p E
xper
ienc
e fo
r al
l stu
den t
s.
Yea
rs 9
an
d 10
(U
p t
o an
d in
clud
ing)
Yea
r 7
Per
cent
age
and
mon
ey
vr и ш ° t
м о м 3 .,
C о ш а ш . > •б
С ^ О сб Q
Ом aиi ' й .и . 70• ш i." . 9 ьш.. aCi . О '.
. 5 .шС . .
Ď( О " 7. О .ш 7 .: ш .. О ш vš C еСд ы 0. С
О а ° а a0i 04 а°i b 3 ° и • .б сб С у ái aCi С а1 ьш. ., C ь. '. i Ő . й '- д С i сС д ш 0. С • й 0 0 U 3 • • • • •
tyб сб . и О а .. м ш .
а .+ . . .
N •E ( ° к `
t с а аi .n ć °д. ć. Е
д v ьpр Ρ°
д e '' . с . .. ,а С
а • Ń ' .u°
°U ~ ., сб Е С e v С С
_ .0 . . V С ьи. .
' . ш ш С «+ С O О сб
•
ь. г й с°i ć.> .: с б ..С.. О a1 ,Ć ? . cб . >. C •й C и 0. л с чм д C) и > bA С
°1,^ v 0 a с °.У ‚, о 'б « о v ?:> Е Ошд Одш С .UC, .Е .
ie
.д ý . . р .. с . ' б á.. '.•О ..
.Е О й
.¿ , V . ш C . у . ... C.
О д у • С и О С и и и 0. . cд 0.
.б ý
.б
СС С а ш гд а a C ш
. 'ó . -š eo Е 0 =' О и сб .С L б й
Q С й 3 ccд, ОдС й с м д Е о
ьм.. н 'й . . ..г .0 Ř { q7 b сшл ш w . . .D
C Од С 04 й ' Cb` ы 0O C .Я ý Cl д Ρ cб
С . Е •Ć s C >. . С и О 4 С м .О . О д С•и й 3 й й :д « _y
.?'8 ` у и е ; б •
¢ а о ° й сСб И й С . W саб
а ai d w w v
■ I ■ и ■ Е ■
36
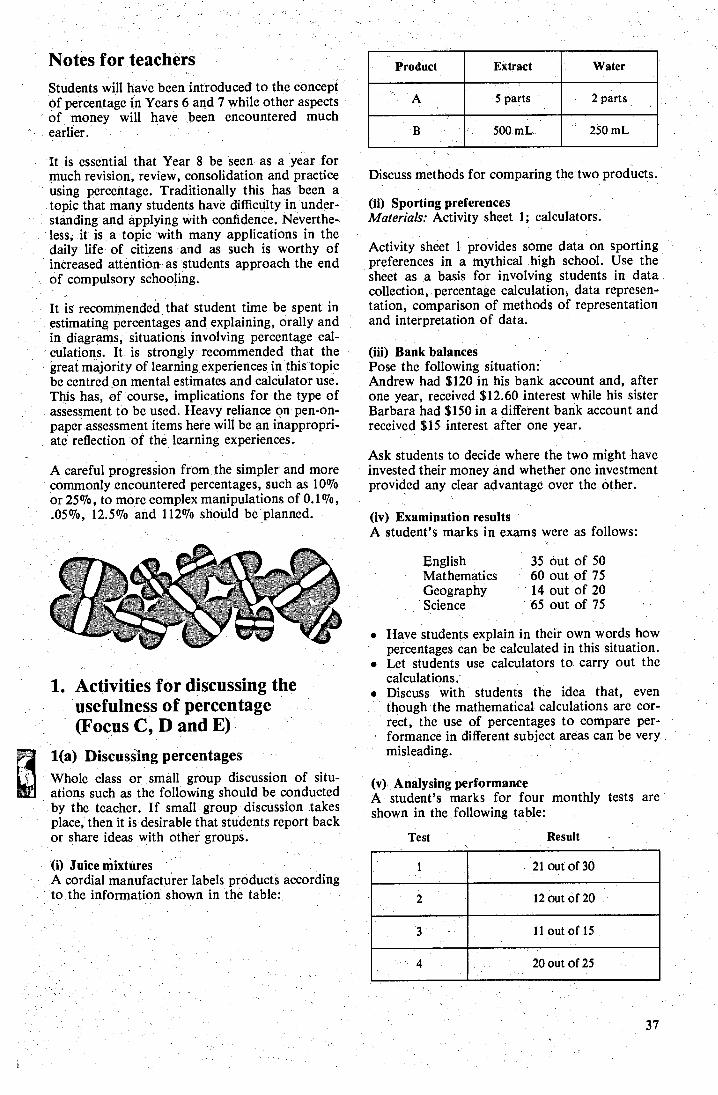
Water Product
A
Extract
2 parts 5 parts
250 mL 500mL.
21 out of 30 1
2 12 out of 20 .
(i) Juice mixtures A cordial manufacturer labels products according to the information shown in the table ć
1l out of 15 3
20 out of 25 4
37
Notes for teachers Students will have been introduced to the concept of percentage in Years 6 and 7 while other aspects of money will have been encountered much earlier.
it is essential that Year 8 be seen as a year for much revision, review, consolidation and practice using percentage. Traditionally this has been a topic that many students have difficulty in under-standing and applying with confidence. Neverthe-less, it is a topic with many applications in the daily life of citizens and as such is worthy of increased attention as students approach the end of compulsory schooling.
It is recommended that student time be spent in estimating percentages and explaining, orally and in diagrams, situations involving percentage cal-culations. It is strongly recommended that the great majority of learning experiences in this topic be centred on mental estimates and calculator use. This has, of course, implications for the type of assessment to be used. Heavy reliance on pen-on-paper assessment items here will be an inappropri-ate reflection of the learning experiences.
A careful progression from. the simpler and more commonly encountered percentages, such as 10% or 25%, to more complex manipulations of 0.1%, .05%, 12.5% and 112% should be planned.
Discuss methods for comparing the two products.
(ii) Sporting preferences Materials: Activity sheet 1; calculators.
Activity sheet 1 provides some data on sporting preferences in a mythical high school. Use the sheet as a basis for involving students in data collection, percentage calculation, data represen-tation, comparison of methods of representation and interpretation of data.
(iii) Bank balances Pose the following situation: Andrew had $120 in his bank account and, after one year, received $12.60 interest while his sister Barbara had $150 in a different bank account and received $15 interest after one year.
Ask students to decide where the two might have invested their money and whether one investment provided any clear advantage over the other.
(iv) Examination results A student's marks in exams were as follows:
1. Activities for discussing the usefulness of percentage (Focus C, D and E).
1(a) Discussing percentages Whole class or small group discussion of situ- ations such as the following should be conducted by the teacher. If small group discussion takes place, then it is desirable that students report back or share ideas with other groups.
English 35 out of 50 Mathematics 60 out of 75 Geography 14 out of 20 Science 65 out of 75
. Have students explain in their own words how percentages can be calculated in this situation.
. Let students use calculators to carry out the calculations. Discuss with students the idea that, even though the mathematical calculations are cor-rect, the use of percentages to compare per-formance in different subject areas can be very misleading.
(v) Analysing performance A student's marks for four monthly tests are shown in the following table:
Test
Result
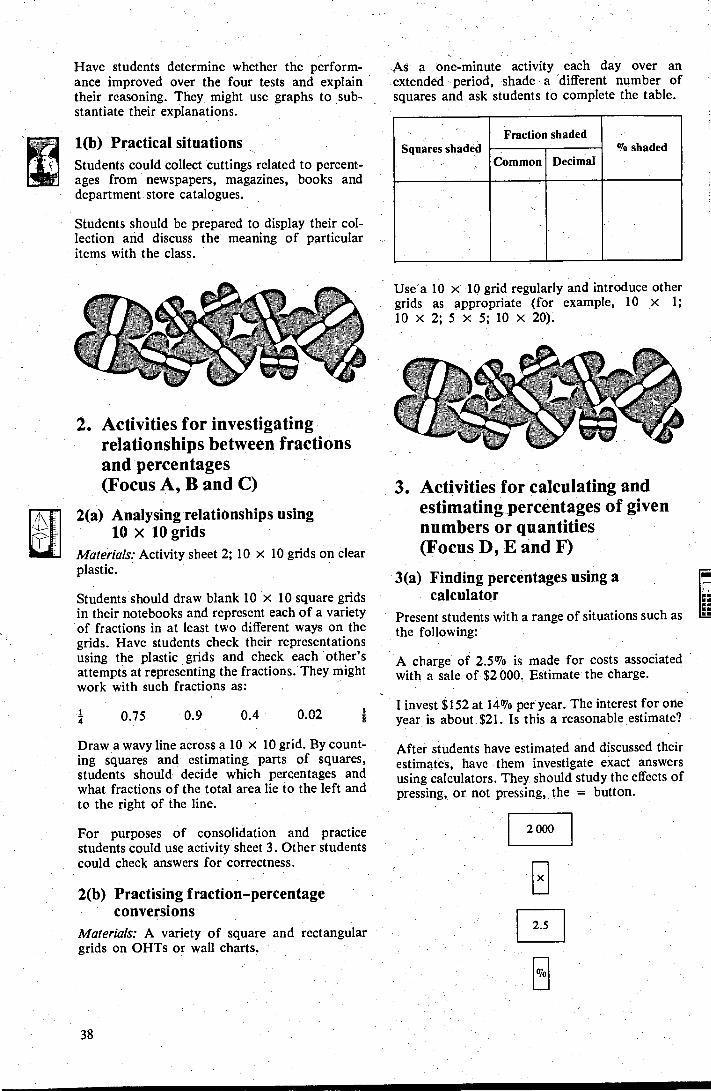
Fraction shaded % shaded Squarě s shaded
Decimal Common
el
в 0.02
3. Activities for calculating and estimating_percentages of given numbers or quantities (Focus D, E and F)
3(a) Finding percentages using a calculator
El
Present students with a range of situations such as řТ
the following:
A charge of 2.5% is made for costs associated with a sale of $2 000. Estimate the charge.
I invest $152 at 14% per year. The interest for one year is about $21. Is this a reasonable estimate?
After students have estimated and discussed their estimates, have them investigate exact answers using calculators. They should study the effects of pressing, or not pressing, the = button.
2 000
x
2.5
Wo
w
Have students determine whether the perform-ance improved over the four tests and explain their reasoning. They might use graphs to sub-stantiate their explanations.
1(b) Practical situations Students could collect cuttings related to percent-ages from newspapers, magazines, books and department store catalogues.
Students should be prepared to display their col-lection and discuss the meaning of particular items with the class.
As a one-minute activity each day over an extended period, shade a different number of squares and ask students to complete the table.
Use"a 10 x 10 grid regularly and introduce other grids as appropriate (for example, 10 x 1; 10x2;5x5;10x20).
2. Activities for investigating relationships between fractions and percentages (Focus A, B and C)
2(a) Analysing relationships using 10 x 10 grids
Materials: Activity sheet 2; 10 x 10 grids on clear plastic.
Students should draw blank 10 x 10 square grids in their notebooks and represent each of a variety of fractions in at least two different ways on the grids. Have students check their representations using the plastic grids and check each other's attempts at representing the fractions. They might work with such fractions as:
'-, 0.75 0.9 0.4
Draw a wavy line across a 10 x 10 grid. By count-ing squares and estimating parts of squares, students should decide which percentages and what fractions of the total area lie to the left and to the right of the line.
For purposes of consolidation and practice students could use activity sheet 3. Other students could check answers for correctness.
2(b) Practising fraction-percentage conversions
Materials: A variety of square and rectangular grids on OHTs or wall charts.
38
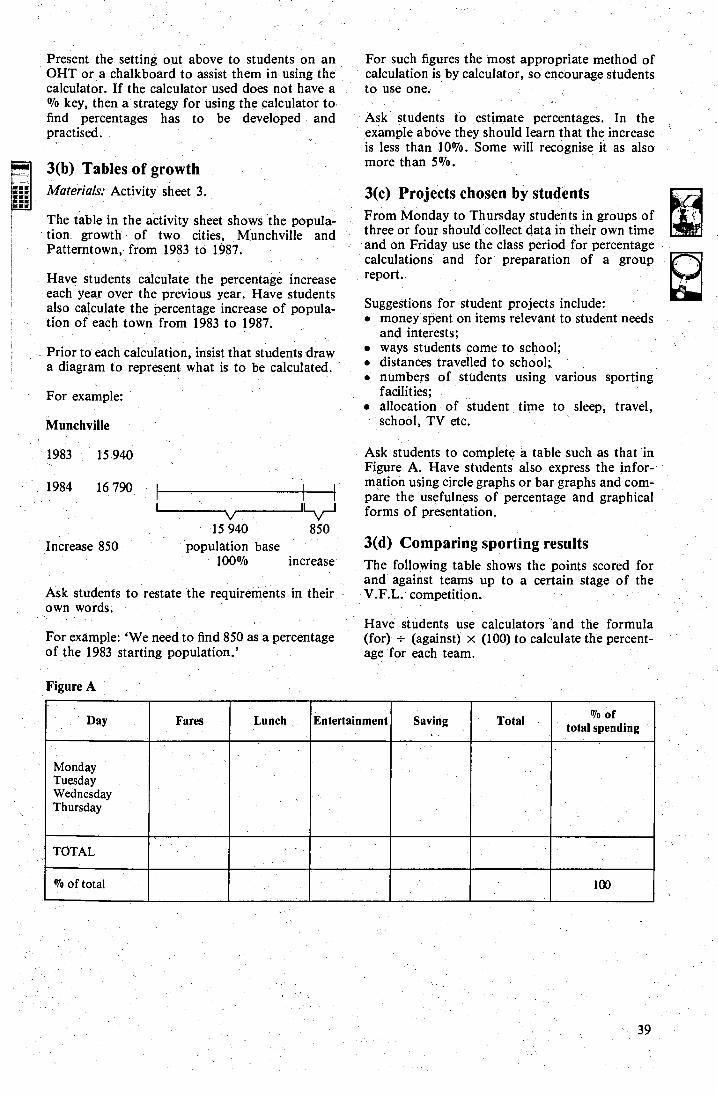
Present the setting out above to students on an OHT or a chalkboard to assist them in using the calculator. If the calculator used does not have a % key, then a strategy for using the calculator to find percentages has to be developed and practised.
3(b) Tables of growth Materials: Activity sheet 3.
The table in the activity sheet shows the popula-till growth of two cities, Munchville and Patterntown, from 1983. to 1987.
Have students calculate the percentage increase each year over the previous year. Have students also calculate the percentage increase of popula-tion of each town from 1983 to 1987.
Prior to each calculation, insist that students draw a diagram to represent what is to be calculated.
For example:
Munchville
1983 15.940
1984 16 790
Increase 850
I I Ì
15 940 850 population base
i00% increase
Ask students to restate the requirements in their own words.
For such figures the most appropriate method of calculation is by calculator, so encourage students to use one.
Ask students to estimate percentages. In the example above they should learn that the increase is less than 10%. Some will recognise it as also more than 5%.
3(c) Projects chosen by students From Monday to Thursday students in groups of three or four should collect data in their own time and on Friday use the class period for percentage calculations and for preparation of a group report.
Suggestions for student projects include: • money spent on items relevant to student needs
and interests; . ways students come to school; . distances travelled to school; . numbers of students using various sporting
facilities; . allocation of student time to sleep, travel,
school, TV etc.
Ask students to complete a table such as that in Figure A. Have students also express the infor-mation using circle graphs or bar graphs and com-pare the usefulness of percentage and graphical forms of presentation.
3(d) Comparing sporting results The following table shows the points scored for and against teams up to a certain stage of the V.F.L.competition.
Have students use calculators and the formula For example: `We need to find 850 as a percentage (for) - (against) x (100) to calculate the percent- of the 1983 starting population.' age for each team.
Figure A
39
Wo of total 100
Lunch .. . Entertainment % of total spending
Day Fares Total
Monday Tuesday Wednesday Thursday
TOTAL
Saving
For Against Percentage
Carlton Collingwood Essendon Fitzroy Footscray Geelong Hawthorn Melbourne North Melbourne Richmond St Kilda Sydney Swans
1957 1729` 1866 1584. 1546 1603 1983 1465 1766 1736 1449 1963
1402 1557 1608 1686 1447 1985 1479 2097 1861 2061 1932 1532
Discussion about the table should follow the per-centage calculations and address questions such as `Would the top five teams by percentage be the official top five in the competition?'.
Students might make up and investigate a table of sporting results of teams applicable to their dis-trict or State. For example, students might inves-tigate methods of expressing the strike rate in cricket as percentages.
4. Activities for developing mental strategies for estimating percentages (FOCUS D)
One of the most important practical skills that should come out of a study of percentage is the ability of students to use robust, quick and effec-tive strategies to make reliable estimates. The activities suggested here concentrate on the build-ing of personal strategies for estimation.
There is little evidence to support definite direc-tions for teaching about mental strategies. It is reasonable, however, to concentrate on the use of tenths, and multiples or fractions of tenths, to establish quick estimates.
4(a) Flash cards Each day, as a quick activity, nominate a percent-age to work with (for example, 30%) and hold up a series of ten flash cards with a number, amount of money or quantity of product on them.
Students should list estimates, check these against a list of exact answers and identify estimates that are clearly unacceptable. Students should then be urged to go back to these results, consider the mental calculations made and reformulate new ways of making mental estimates.
Students may be unable to reconcile some of the exact answers with their own mental estimates. They will then need to discuss these troublesome cases and resolve any difficulties.
It is reasonable to present percentages in the following sequence: • 10% or tenths . multiples of 10% • fractions of 10% (e.g. 5%; 15%; 45%) • approximations (e.g. 22% as more than 20%) . greater than 100% (e.g. 110%, 150%) • 1 % or hundredths • one half of 1 %о (0.5%).
Flash cards can also be used where the amount is nominated (for example, $391) and the cards held up show various percentages to be calculated (for example, 10%, 20%, 70%, 5%).
4(b) Personal strategy building,
In this activity students should be presented indi-vidually with an amount and a percentage to be calculated. For example:
365 kg 22%о
Ask students to develop their own estimation strategy, check it using a calculator for acceptable accuracy, and then try it out on a few other numbers.
For 22% one student might use: Divide by four; 22% will be less than the result.
Another might use: Divide by ten and double; 22% will be a little more than the result.
Another might more accurately, but less quickly, use: Divide by ten and double and then add one-tenth of the result.
Students should be required to develop, for the given percentage (for example, 22%), a strategy .
they are happy with and practise it. They could then ask the teacher or another student to test them by providing ten numbers for which esti-mates of 22% are to be made.
Check results for acceptability and discuss and clarify any anomalies. Organise a class compe-tition for speed and accuracy.
40
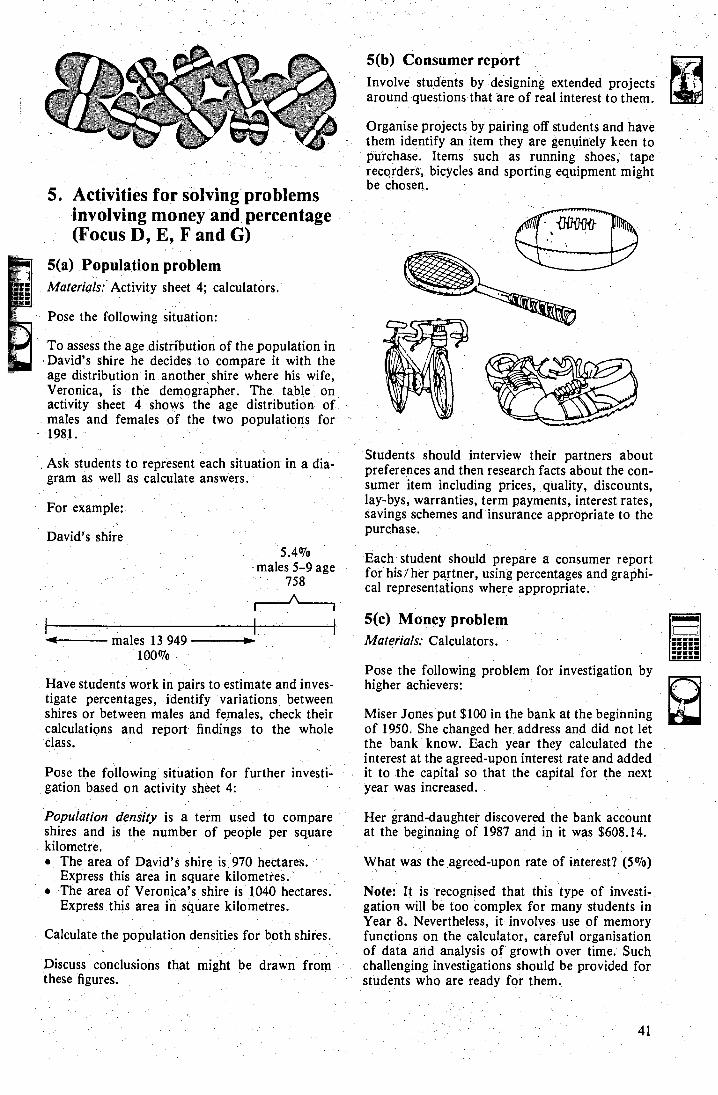
5(b) Consumer report Involve students by designing extended projects around questions that are of real interest to them.
5(c) Money problem Materials: Calculators. - males 13 949
100%
5. Activities for solving problems involving money and percentage (Focus D, E, F and G)
5(a) Population problem Materials: Activity sheet 4; calculators.
Pose the following situation:
To assess the age distribution of the population in David's shire he decides to compare it with the age distribution in another shire where his wife, Veronica, is the demographer. The table on activity sheet 4 shows the age distribution of. males and females of the two populations for 1981..
Ask students to represent each situation in a dia-gram as well as calculate answers.
For -example:
David's shire 5.4%о
males 5-9 age 758
___n____
Organise projects by pairing off students and have them identify an item they are genuinely keen to purchase. Items such as running shoes, tape recorders, bicycles and sporting equipment might be chosen.
Students should interview their partners about preferences and then research facts about the con-sumer item including prices, quality, discounts, lay-bys, warranties, term payments, interest rates, savings schemes and insurance appropriate to the purchase.
Each student should prepare a consumer report for his I her partner, using percentages and graphi-cal representations where appropriate.
Have students work in pairs to estimate and inves-tigate percentages, identify variations between shires or between males and females, check their calculations and report findings to the whole class.
Pose the following situation for further investi-gation based on activity sheet 4:
Population density is a term used to compare shires and is the number of people per square kilometre. • The area of David's shire is 970 hectares.
Express this area in square kilometres. • The area of Veronica's shire is 1040 hectares.
Express this area in square kilometres.
Calculate the population densities for both shires.
Discuss conclusions that might be drawn from these figures.
Pose the following problem for investigation by higher achievers:
Miser Jones put $100 in the bank at the beginning of 1950. She changed her address and did not let the bank know. Each year they calculated the interest at the agreed-upon interest rate and added it to the capital so that the capital for the next year was increased.
Her grand-daughter discovered the bank account at the beginning of 1987 and in it was $608.14.
What was the agreed-upon rate of interest? (5%)
Note: It is recognised that this type of investi-gation will be too complex for many students in Year 8. Nevertheless, it involves use of memory functions on the calculator, careful organisation of data and analysis of growth over time. Such challenging investigations should be provided for students who are ready for them.
41
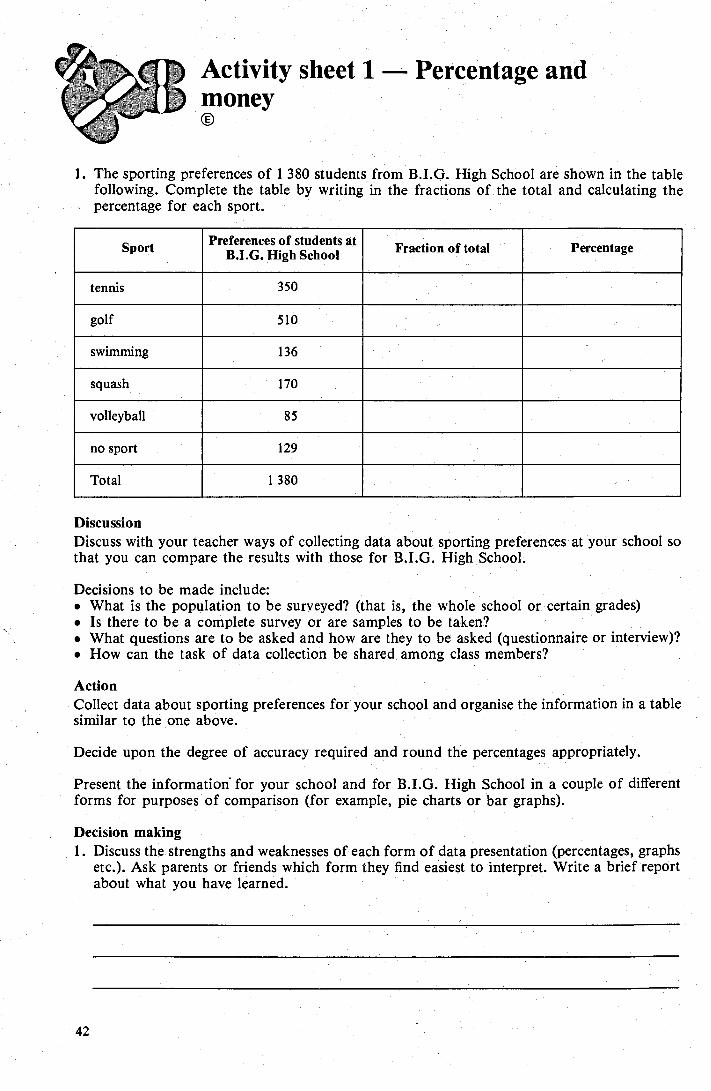
tennis 350
golf 510
swimming 136
squash 170
volleyball 85
no sport 129
1 380 Total
Preferences of students at B.I.G. High School
Sport Fraction of total Percentage
Activity sheet 1 money
Percentage and
1. The sporting preferences of 1 380 students from B.I.G. High School are shown in the table following. Complete the table by writing in the fractions of the total and calculating the percentage for each sport.
Discussion Discuss with your teacher ways of collecting data about sporting preferences at your school so that you can compare the results with those for B.I.G. High School.
Decisions to be made include: • What is the population to be surveyed? (that is, the whole school or certain grades) • Is there to be a complete survey or are samples to be taken? • What questions are to be asked and how are they to be asked (questionnaire or interview)? • How can the task of data collection be shared among class members?
Action Collect data about sporting preferences for your school and organise the information in a table similar to the one above.
Decide upon the degree of accuracy required and round the percentages appropriately.
Present the information for your school and for B.I.G. High School in a couple of different forms for purposes of comparison (for example, pie charts or bar graphs).
Decision making 1. Discuss the strengths and weaknesses of each form of data presentation (percentages, graphs
etc.). Ask parents or friends which form they find easiest to interpret. Write a brief report about what you have learned.
42

43
2. On the basis of the data, draw some conclusions about how your school and B.I.G. High School compare in terms of:
geographical position
interests of students
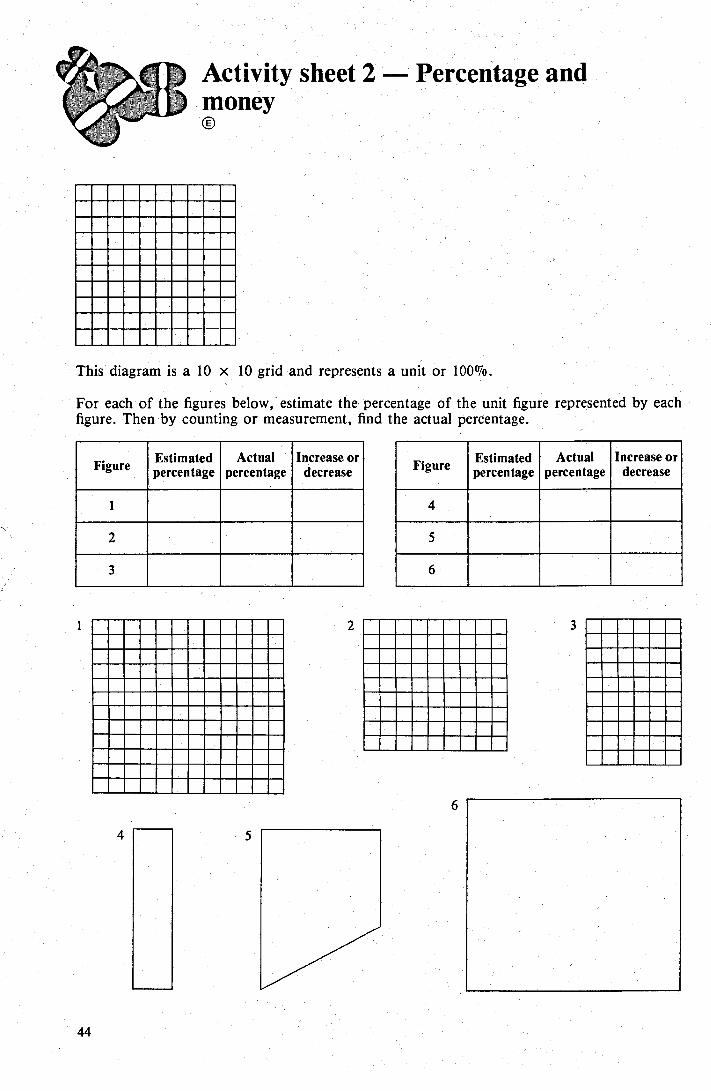
Activity sheet 2 Percentage and money о
This diagram is a 10 x 10 grid and represents a unit or 100%.
For each of the figures below, estimate the percentage of the unit figure represented by each figure. Then by counting or measurement, find the actual percentage.
Estimated percentage
Actual percentage
Increase or decrease
Estimated percentage
Actual percentage
Increase or decrease Figure Figure
4
5
б
2
3
4
44
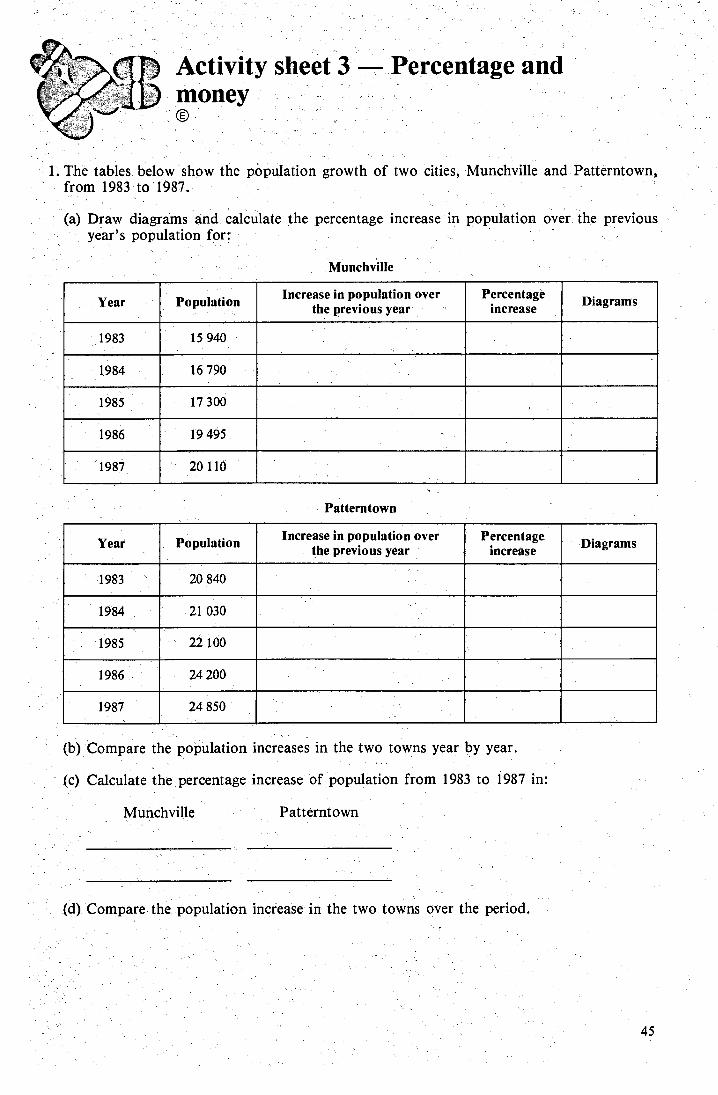
1 The tables below show the population growth of two cities, from 1983 to 1987.
(a) Draw diagrams and calculate the percentage increase in year's population for:
Munchville
Munchville and Patterntown,
population over the previous
Patterntown
(b) Compare the population increases in the two towns year by year.
(c) Calculate the percentage increase of population from 1983 to 1987 in
Munchville Patterntown
(d) Compare the population increase in the two towns over the period.
45
1983 15 940
1984. 16 790
1986 19 495
20 110 198?
Increase in population over the previous year
Percentage increase Diagrams Year
17 300
Population
1983 20 840
1984 21 030
1985 22 100
1986 24 200
24 850 1987
Increase in population over the previous year
Percentage. increase Diagrams Year Population
Activity sheet 4 Percentage and money
(b) Veronica's shire (а ) David's shire
Males Females Females Males
750 758 863
1 094 1617 1 616 1 323
996 680 787 768 691 556
1 450
Age group
3 040 4794 5 955 4 929 2 969 1 884 2 882 3 913 3 206 4 021 2 645 1 930 1 219 1 726
2878 4 635 5 690 4 689 2 572 2 281 3 836 4 505 2 807 3 945 2 229 1 681 1182 2617
0-4 5-9
10-14 15-19 20-24 25-29 30-34 35-39 40-44 45-49 50-54 55-59 60-64 65+
716 784 789
1 083 2008 1 692 . 1436 1 018
679 815 767 769 775
3 399`
46
David decides to assess the age distribution of the population in his shire by comparing it with the age distribution in another shire where his wife,• Veronica, is the demographer. The table below shows the age distributions of males and females of the two populations for 1981
1. What percentage of people in each shire are of preschool age?
(a) (b)
2. What percentage of males in each shire are in the 5-9 age group?
(a) (b)
3. What percentage of females in each shire are in the 20-39 age group?
(a)
(b)
4. What percentage of people in each shire are in the 65 + age group?
(a)
(ь )
In each case above draw a diagram to demonstrate the meaning of 100% and of the percentage you have calculated.
Assessment Assessment must involve ongoing monitoring of students' progress throughout the year. A variety of pro-cedures — such as observation of students as they work with materials, informal discussions, and written tests — should be used to gather relevant information.
Students who are developing proficiency with the concepts of money and percentage at this level should be able to use a variety of processes in a range of situations similar to those suggested below. Some of these tasks should not be given to all students at the same time, especially those tasks where students are required to explain or demonstrate ideas or procedures.
Major processes Assessment ideas
Estimating Representing
Estimate and shade in 30% of the area of the above rectangle.
About what percentage and what fraction of the figure are shaded and what are non-shaded?
3. The Medicare levy is at present approximately 1.5% of a person's net gross income of $14 750. Which is the best estimate of the levy to be paid?
(a) $225 (b) $200 (c) $25 (d) $2 250
Use a calculator to check your estimate.
4. Miss Tran needs to borrow $895 from the Easy Laan Cash Company whose interest charge is 2%о per month. If she repaid the money in six months, which of the following is the best estimate of the interest she would have to pay?
(a) $16 (b) $100 (c) $50 (д ) $540
Calculate exactly the amount of interest Miss Tran pays. Draw a diagram to show the meaning of your calculated answer.
5. Calculate 0.5% of $500.
6. Which of the following is the best estimate of 0.5%% of $200?
(a) $1 (b) $10 (c) $100 (d) $1 000
Estimating
Analysing Estimating Calculating Validating
Calculating Estimating Problem solving Representing Validating
Calculating
Estimating Calculating Analysing
47
Analysing Calculating Problem solving
Representing
Analysing Problem solving Representing Explaining
Estimating Analysing Explaining
7. The local post ollice has a bank of mail boxes on the front wall of the building. The darkened squares show those where mail was delivered on a certain day. What percentage of the mail boxes did not receive mail that day?
п ❑вп ❑и ■пв ■ ■■и ■ппп ■■ ■ ■в ■■■■■ _In ■ Ill I• ■ив ■■■виви Construct a pie chart to represent the information about mail boxes receiving or not receiving mail.
8. "A person went to the races with $200 and came home with $400. He therefore won 50%."
Decide whether or not you believe the above statement to be true and draw a diagram to explain your reasoning.
Teacher's Note: There is more than one possible correct response to this item.
9. Explain whether you would estimate or calculate, and why, in each of the following situations:
(a) Socks normally $3.99 a pair are reduced by 10%.
(b) A spacecraft travelling to the moon is off course by 2.5%.
(c) A baby six weeks after birth has increased her initial mass of 4.01 kg by 1.9%. What is her new mass?
(d) The population of a small town of 112 people increased 50% following. a minor gold strike. What was the new population?
i i 1 1
48
Focus for teaching, learning and assessment Notes for teachers 1. Activities for using time intervals for problem solving of a
practical nature (Focus A)
(a) Intervals of time between significant events (b) Measuring using stopwatches (c) Calculating dates (d) Graphing time. intervals
2 Activities for time-zone calculation and problem solving (Focus B)
(a) Time zones within Australia (b) Time differences across Australia
L(c) A fourth Australian time zone I i
. tt
3.-Activities for exploring measures " (Focus C and D)
k- (a) Mea ś uring the passage of time (b) Exploring the lunar month (c) 24-hour time
52
Activity sheets
Assessment
53 54 54
56
<. 59
а 9
52 53, 53
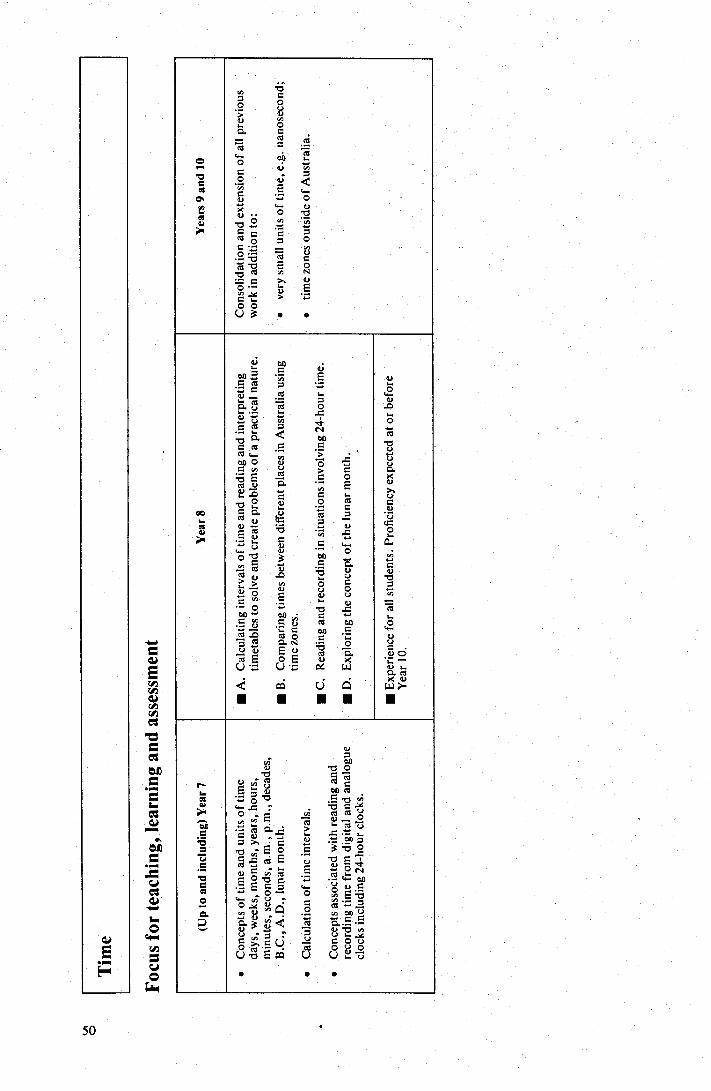
50
Foc
us f
or te
achi
ng,
lea
rnin
g an
d as
sess
men
t
'ь. с р 0 Я ..
гдб С ). Ń р и
C.) q) а Ø
U .
U 'E ОС W
<
•
СД V С ■ ■ ■ ■
сб у .b b • СО) >ь.? а , ОC) с0 ,
с о Ё ј- й .5 О ц .+ ..,
С v С у co to
v а
а ) с , сцо a) cco
с
tOCO
У 4.. i сцб ссб и0
• • •
(Up
to a
nd in
clud
ing)
Yea
r 7
▪
very
sm
all u
nits
of
time,
e.g
. nan
osec
ond
;
Yea
rs 9
and
10
• ti
me
zone
s ou
tsid
e of
Aus
tral
ia.
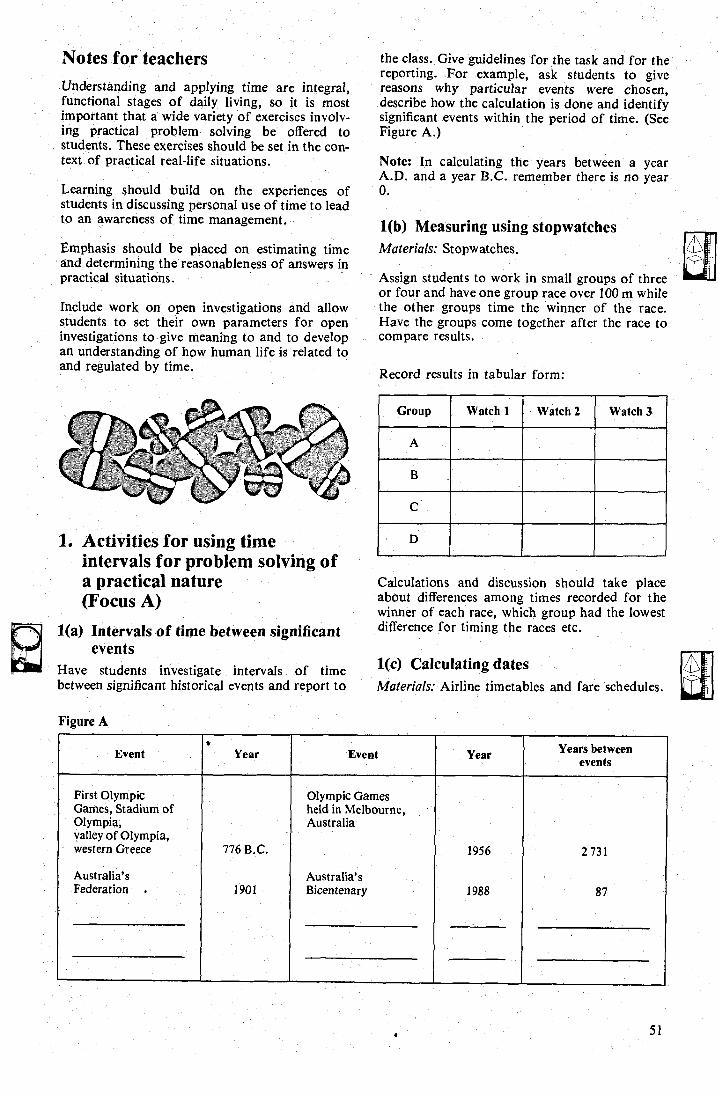
Watch 1 Group Watch 3 Watch 2
A
В
C
D
First Olympic Games, Stadium of Olympia, valley of Olympia, western Greece
Australia's Federation
Olympic Games held in Melbourne, Australia
Australia's Bicentenary
1956
1988
Years between events
. Year Event Event Year
2731
87
776 B.C.
1901
Notes for teachers
Understanding and applying time are integral, functional stages of daily living, so it is most important that a wide variety of exercises involy-ing practical problem solving be offered to students. These exercises should be set in the con-text of practical real-life situations.
Learning should build on the experiences of students in discussing personal use of time to lead to an awareness of time management.
Emphasis should be placed on estimating time and determining the reasonableness of answers in practical situations.
Include work on open investigations and " allow students to set their own parameters for open investigations to give meaning to and to develop an understanding of how human life is related to and regulated by time.
1. Activities for using time intervals for problem solving of a practical nature (Focus A)
1(a) Intervals of time between significant events
Have students investigate intervals of time between significant historical events and report to
the class. Give guidelines for the task and for the reporting. For example, ask students to give reasons why particular events were chosen, describe how the calculation is done and identify significant events within the period of time. (See Figure A.)
Note: In calculating the years between a year A.D. and a year B.C. remember there is no year 0.
1(b) Measuring using stopwatches Materials: Stopwatches.
Assign students to work in small groups of three or four and have one group race over 100 m while the other groups time the winner of the race. Have the groups come together after the race to compare results.
Record results in tabular form:
Calculations and discussion should take place about differences among times recorded for the winner of each race, which group had the lowest difference for timing the races etc.
1(c) Calculating dates Materials: Airline timetables and fare schedules.
Figure A
51
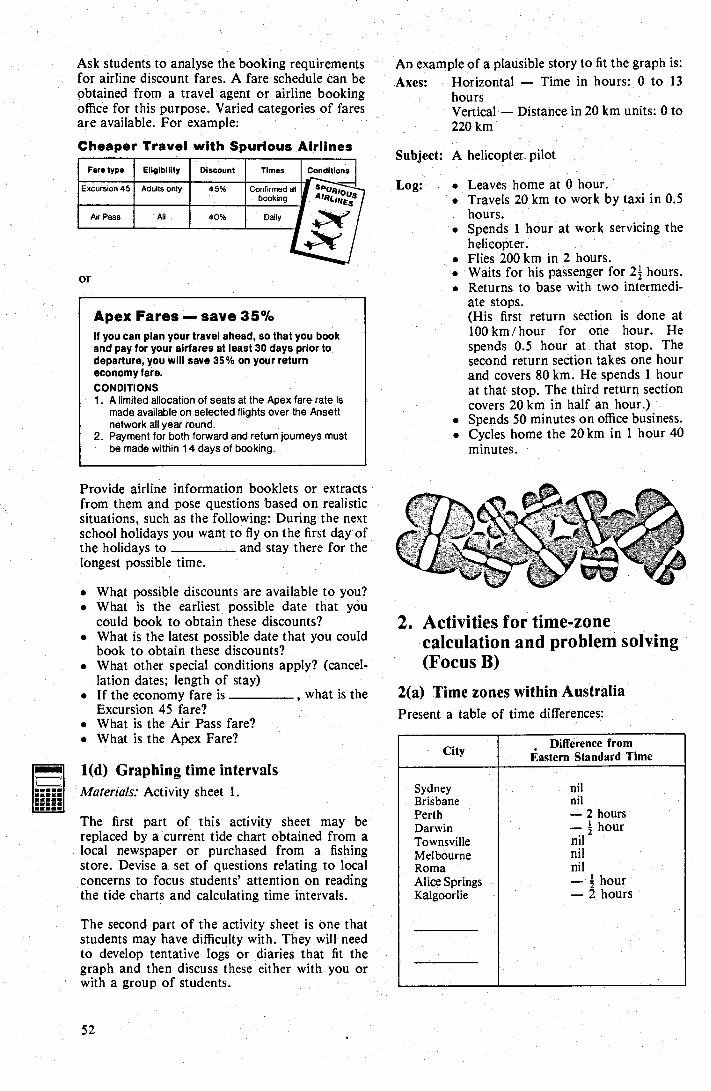
nil nil - 2 hours — ? hour nil nil nil
ź hour — 2 hours
Sydney Brisbane Perth Darwin Townsville Melbourne Roma Alice Springs Kalgoorlie
Difference from ¡astern Standard Time City
Ask students to analyse the booking requirements for airline discount fares. A fare schedule can be obtained from a travel agent or airline booking office for this purpose. Varied categories of fares are available. For example:
Cheaper Travel with Spurious Airlines
Fare type
Excursion 45 Adults only
Air Pass
Oi
Apex Fares - save 35°ío If you can plan your travel ahead, so that you book and pay for your airfares at least 30 days prior to departure, you will save 35% on your return economy fare.
CONDITIONS 1. A limited allocation of seats at the Apex fare rate is
made available on selected flights over the Ansett network all year round.
2. Payment for both forward and return journeys must be made within 14 days of booking.
Provide airline information booklets or extracts from them and pose questions based on realistic situations, such as the following: During the next school holidays you want to fly on the first day of the holidays to and stay there for the longest possible time.
. What possible discounts are available to you? What is the earliest possible date that you could book to obtain these discounts?
• What is the latest possible date that you could book to obtain these discounts?
• What other special conditions apply? (cancel-lation dates; length of stay)
. If the economy fare is , what is the Excursion 45 fare?
• What is the Air Pass fare? • What is the Apex Fare?
1(d) Graphing time intervals Materials: Activity sheet 1.
The first part of this activity sheet may be replaced by a current tide chart obtained from a local newspaper or purchased from a fishing store. Devise a set of questions relating to local concerns to focus students' attention on reading the tide charts and calculating time intervals.
The second part of the activity sheet is one that students may have difficulty with. They will need to develop tentative logs or diaries that fit the graph and then discuss these either with you or with a group of students.
An example of a plausible story to fit the graph is:
Axes: Horizontal Time in hours: 0 to 13 hours Vertical —Distance in 20 km units: 0 to 220 km
Subject: A helicopter pilot
Log: • Leaves home at 0 hour. • Travels 20 km to work by taxi in 0.5
hours. • Spends 1 hour at work servicing the
helicopter. • Flies 200 km in 2 hours. • Waits for his passenger for 2? hours. • Returns to base with two intermedi-
ate stops. (His first return section is done at 100 km /hour for one hour. He spends 0.5 hour at that stop. The second return section takes one hour and covers 80 km. He spends 1 hour at that stop. The third return section covers 20 km in half an hour.)
• Spends 50 minutes on office business. • Cycles home the 20 km in 1 hour 40
minutes.
2. Activities for time-zone calculation and problem solving (Focus В )
2(a) Time zones within Australia Present a table of time differences:
E11g1Ы 1ity
А 11
Discount
40%
45%
Times
Confirmed at booking
Daily
Conditions
52
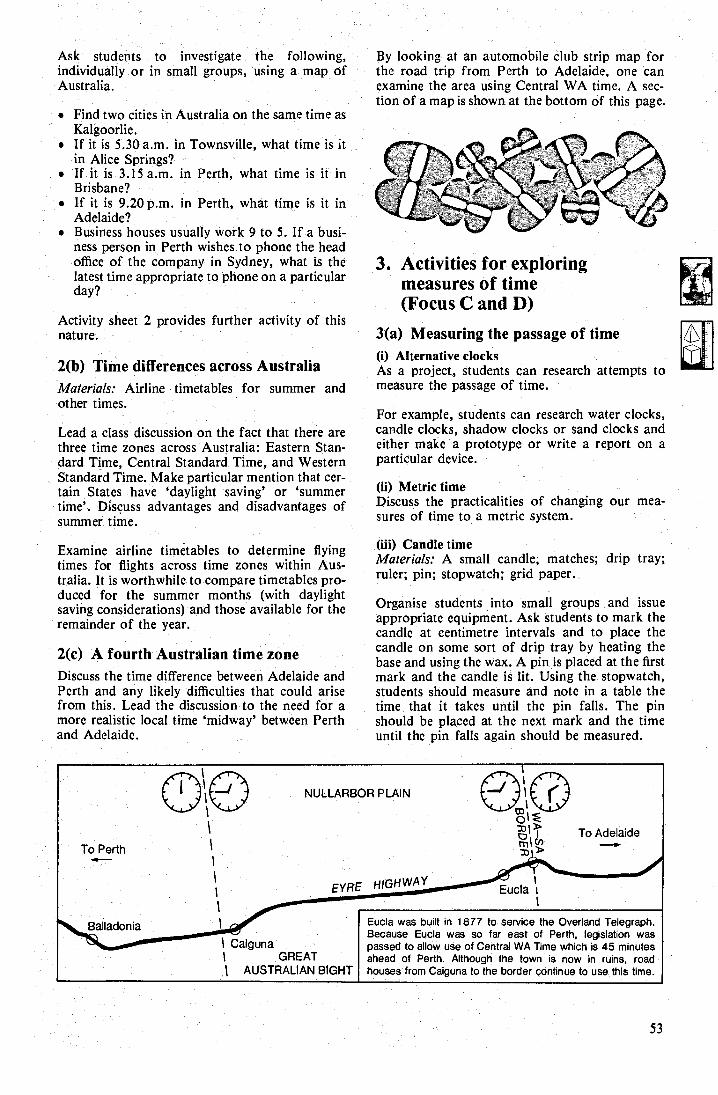
NULLARBOR PLAIN
To Adelaide
To Perth
Eucla 1
Eucla was built in 1877 to service the Overland Telegraph. Because Eucla was so far east of Perth, legislation was passed to allow use of Central WA Time which is 45 minutes ahead of Perth. Although the town is now in ruins, road houses from Caiguna to the border continue to use this time.
I Caiguna I GREAT
AUSTRALIAN BIGHT
Ask students to investigate the following, individually or in small groups, using a map of Australia.
• Find two cities in Australia on the same time as Kalgoorlie.
• If it is 5.30 a.m. in Townsville, what time is it in Alice Springs?
. 'If it is 3.15 a.m. in Perth, what time is it in Brisbane?
• If it is 9.20 p.m. in Perth, what time is it in Adelaide?
. Business houses usually work 9 to 5. If a busi-ness person in Perth wishes to phone the head office of the company in Sydney, what is the latest time appropriate to phone on a particular day?
Activity sheet 2 provides further activity of this nature.
2(b) Time differences across Australia Materials: Airline timetables for summer and other times.
Lead a class discussion on the fact that there are three time zones across Australia: Eastern Stan-dard Time, Central Standard Time, and Western Standard Time. Make particular mention that cer-tain States have `daylight saving' or `summer time'. Discuss advantages and disadvantages of summer time.
Examine airline timetables to determine flying times for flights across time zones within Aus-tralia. It is worthwhile to compare timetables pro-duced for the summer months (with daylight saving considerations) and those available for the remainder of the year.
2(c) A fourth Australian time zone Discuss the time difference between Adelaide and Perth and any likely difficulties that could arise from this. Lead the discussion to the need for a more realistic local time `midway' between Perth and Adelaide.
By looking at an automobile club strip map for the road trip from Perth to Adelaide, one can examine the area using Central WA time. A sec-tion of a map is shown at the bottom of this page.
3. Activities for exploring measures of time (Focus C and D)
3(а ) Measuring the passage of time (i) Alternative clocks As a project, students can research attempts to measure the passage of time.
For example, students can research water clocks, candle clocks, shadow clocks or sand clocks and either make a prototype or write a report on a particular device.
(ii) Metric time Discuss the practicalities of changing our mea-sures of time to a metric system.
(iii) Candle time Materials: A small candle; matches; drip tray; ruler; pin; stopwatch; grid paper.
Organise students into small groups and issue appropriate equipment. Ask students to mark the candle at centimetre intervals and to place the candle on some sort of drip tray by heating the base and using the wax. A pin is placed at the first mark and the candle is lit. Using the stopwatch, students should measure and note in a table the time that it takes until the pin falls. The pin should be placed at the next mark and the time until the pin falls again should be measured.
53
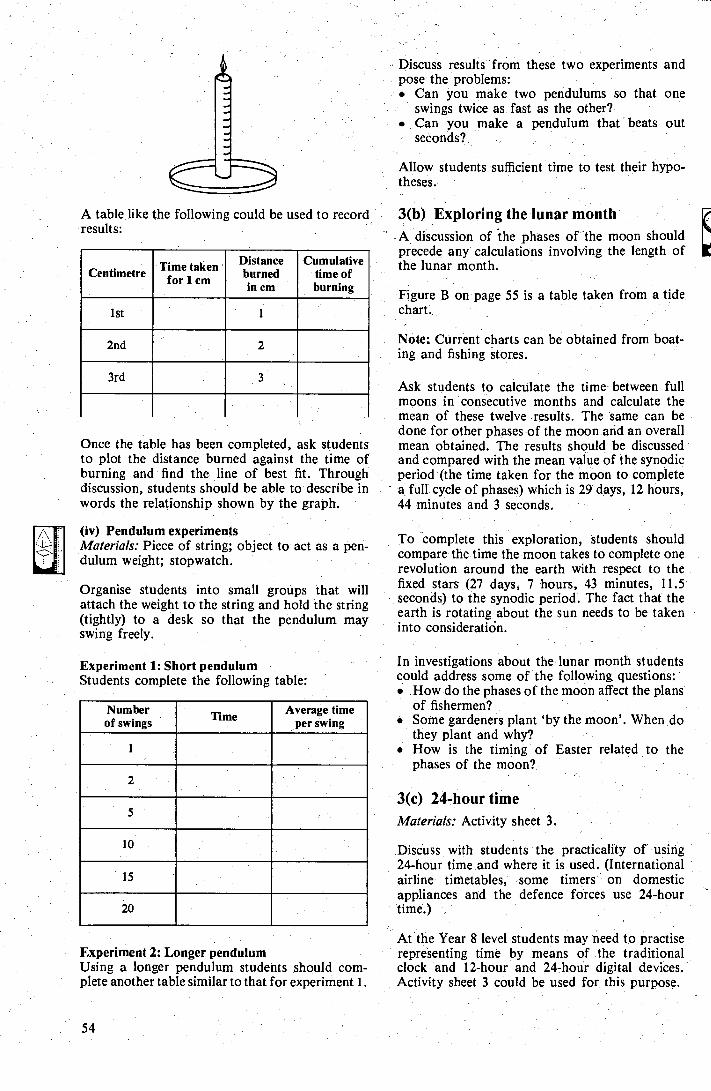
A table like the following could be used to record results:
Once the table has been completed, ask students to plot the distance burned against the time of burning and find the line of best fit. Through discussion, students should be able to describe in words the relationship shown by the graph.
(iv) Pendulum experiments Materials: Piece of string; object to act as a pen-dulum weight; stopwatch.
Organise students into small groups that will attach the weight to the string and hold the string (tightly) to a desk so that the pendulum may swing freely.
Experiment 1: Short pendulum Students complete the following table:
Experiment 2: Longer pendulum Using a longer pendulum students should com-plete another table similar to that for experiment 1.
Discuss results from these two experiments and pose the problems: • Can you make two pendulums so that one
swings twice as fast as the other? • Can you make a pendulum that beats out
seconds?
Allow students sufficient time to test their hypo-theses.
3(b) Exploring the lunar month A discussion of the phases of the moon should precede any calculations involving the length of the lunar month.
Figure B on page 55 is a table taken from a tide. chart.
Note: Current charts can be obtained from boat-ing and fishing stores.
Ask students to calculate the time between full moons in consecutive months and calculate the mean of these twelve results. The same can be done for other phases of the moon and an overall mean obtained. The results should be discussed and compared with the mean value of the synodic period (the time taken for the moon to complete a full cycle of phases) which is 29 days, 12 hours, 44 minutes and 3 seconds.
To complete this exploration, students should compare the time the moon takes to complete one. revolution around the earth with respect to the fixed stars (27 days, 7 hours, 43 minutes, 11.5 seconds) to the synodic period. The fact that the earth is rotating about the sun needs to be taken into consideratión.
In investigations about the lunar month students could address some of the following questions: • How do the phases of the moon affect the plans
of fishermen? • Some gardeners plant `by the moon'. When do
they plant and why? • How is the timing of Easter related to the
phases of the moon?
3(с ) 24-hour time Materials: Activity sheet 3.
Discuss with students the practicality of using 24-hour time and where it is used. (International airline timetables, some timers on domestic appliances and the defence forces use 24-hour time.)
At the Year 8 level students may need to practise representing time by means of . the traditional clock and 12-hour and 24-hour digital devices. Activity sheet 3 could be used for this purpose.
ii
Ist 1
2nd 2
3rd 3
Time taken for 1 cm
Distance burned in cm
Cumulative time of burning
Centimetre
Average time per swing
Number of swings Time
2
5
io
15
20
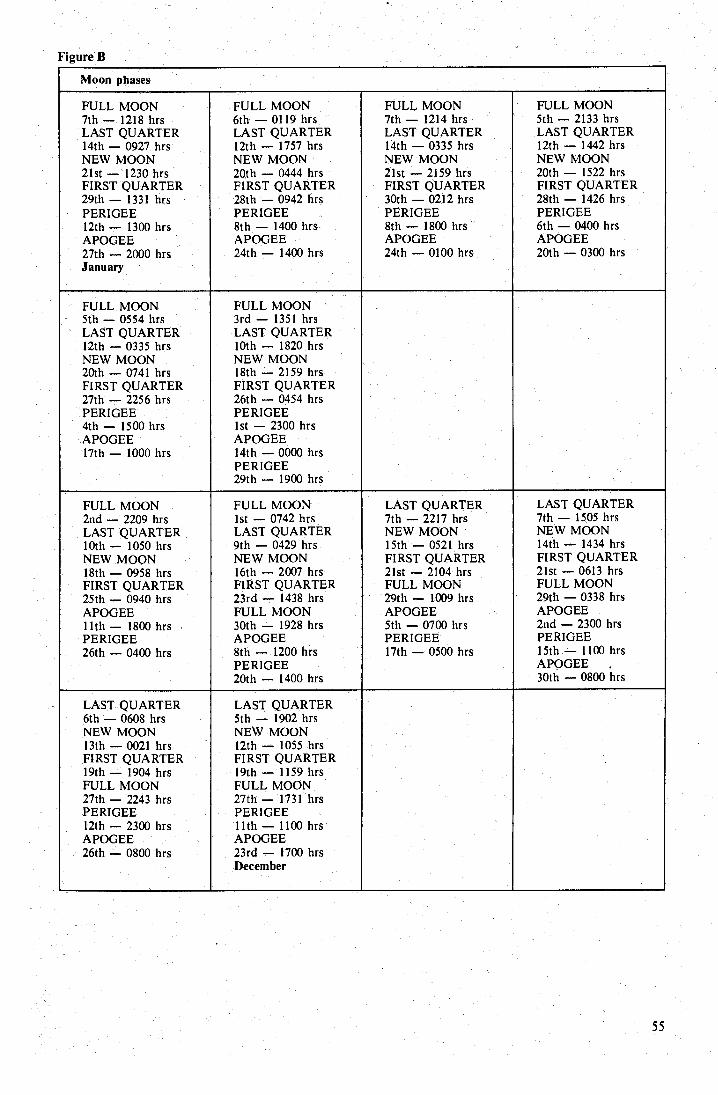
Figure В
Moon phases
FULL MOON 7th — 1218 firs LAST QUARTER 14th - 0927 hrs NEW MOON 21st 1230 firs FIRST QUARTER 29th — 1331 firs PERIGEE 12th — 1300 firs APOGEE 27th - 2000 firs January
FULL. MOON 6th 0119 firs LAST QUARTER 12th — 1757 hrs NEW MOON 20th — 0444 hrs FIRST QUARTER 28th 0942 hrs PERIGEE 8th - 1400 firs APOGEE 24th — 1400 firs
FULL MOON 7th — 1214 firs LAST QUARTER 14th — 0335 firs NEW MOON 21st - 2159 hrs FIRST QUARTER 30th — 0212 firs PERIGEE 8th 1800 firs APOGEE 24th — 0100 hrs
FULL MOON 5th — 2133 firs LAST QUARTER 12th — 1442 hrs NEW MOON 20th — 1522 firs FIRST QUARTER 28th — 1426 firs PERIGEE 6th — 0400 firs APOGEE 20th — 0300 hrs
FULL MOON 5th - 0554 hrs LAST QUARTER 12th — 0335 hrs NEW MOON 20th 0741 hrs FIRST QUARTER 27th — 2256 hrs PERIGEE 4th — 1500 hrs APOGEE 17th 1000 hrs
FULL MOON 3rd 1351 firs LAST QUARTER 10th — 1820 hrs NEW MOON 18th - 2159 hrs FIRST QUARTER 26th 0454 hrs PERIGEE 1st — 2300 hrs APOGEE 14th — 0000 hrs PERIGEE 29th — 1900 hrs
FULL MOON 2nd - 2209 hrs LAST QUARTER 10th — 1050 hrs NEW MOON 18th — 0958 hrs FIRST QUARTER 25th— 0940 hrs APOGEE 11th - 1800 hrs PERIGEE 26th - 0400 hrs
FULL MOON ist — 0742 hrs LAST QUARTER 9th 0429 hrs NEW MOON 16th — 2007 hrs FIRST QUARTER 23rd — 1438 hrs FULL MOON 30th— 1928 hrs APOGEE 8th — 1200 hrs PERIGEE 20th — 1400 hrs
LAST QUARTER 7th — 2217 hrs NEW MOON 15th — 0521 hrs FIRST QUARTER 21st — 2104 hrs FULL MOON 29th — 1009 hrs APOGEE 5th — 0700 hrs PERIGEE 17th — 0500 hrs
LAST QUARTER 7th — 1505 hrs NEW MOON 14th — 1434 hrs FIRST QUARTER 21st — 0613 hrs FULL MOON 29th — 0338 hrs APOGEE 2nd — 2300 hrs PERIGEE 15th 1100 hrs APOGEE 30th — 0800 hrs
LAST-QUARTER 6th - 0608 hrs NEW MOON 13th — 0021 hrs FIRST QUARTER 19th - 1904 hrs FULL MOON 27th - 2243 hrs PERIGEE 12th — 2300 hrs APOGEE 26th - 0800 hrs
LAST QUARTER 5th — 1902 hrs NEW MOON 12th 1055 hrs FIRST QUARTER 19th — 1159 firs FULL MOON 27th — 1731 hrs PERIGEE 11th — 1100 hrs APOGEE 23rd — 1700 hrs December
55
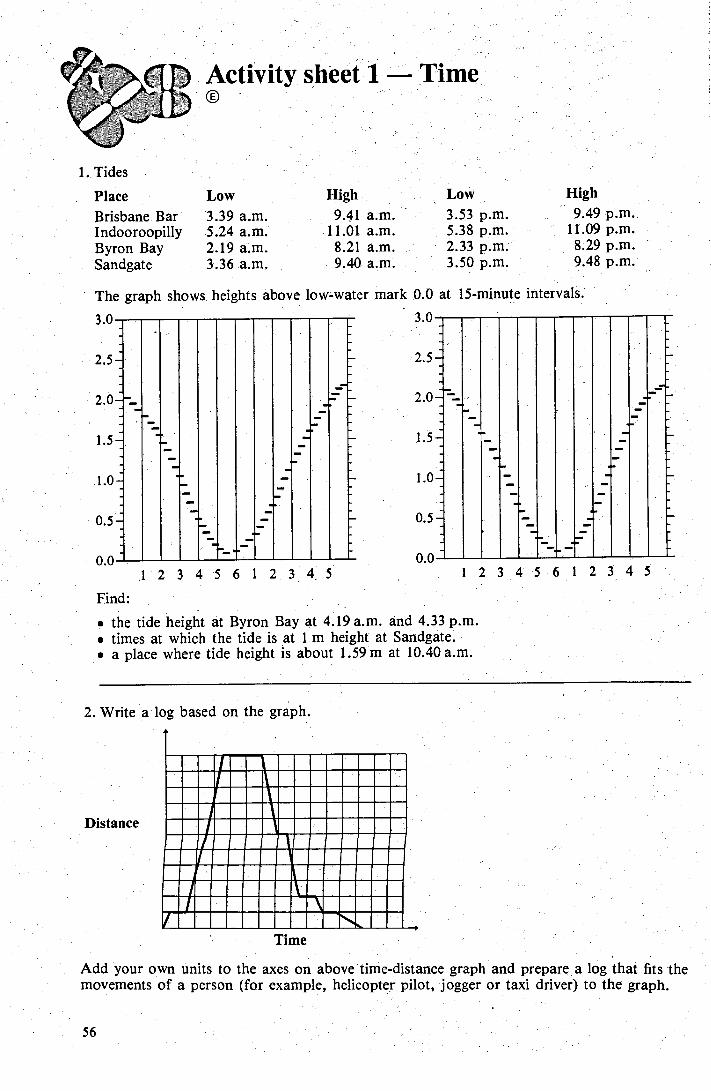
3.0 3.0
0.0 1 2 3 4 5 б 1 2 3 4 5 1 2 3 4 5 б 1 2 3 4 5
2.5
2.0
1.5
1.0
0.5
2.5
2.0
1.5
1.0
0.5
0.0
56
1. Tides
Place Low
Brisbane Bar 3.39 a.m. Indooroopilly 5.24 a.m. Byron Bay 2.19 a.m. Sandgate 3.36 a.m.
High 9.41 a.m.
11.01 a.m. 8.21 a.m. 9.40 a.m.
Low 3.53 p.m. 5.38 p.m. 2.33 p.m. 3.50 p.m.
High 9.49 p.m.
11.09 p.m. 8.29 p.m. 9.48 p.m.
The graph shows heights above low-water mark 0.0 at 15-minute intervals.
Find:
• the tide height at Byron Bay at 4.19 a.m. and 4.33 p.m. • times at which the tide is at 1 m height at Sandgate. • a place where tide height is about 1.59 m at 10.40 a.m.
2. Write a log based on the graph.
Distance
■■в i вв ,ввввв ■■в ■ ■■в iв ■в в ■в ■■вввв ■ввв ■в 1,■в ■вввв ■ ■вв ■■в ввв ■■вв ■ ■вг iвввв вв ■в ■ввв ввгвввввв iввввввв ввгвввввв 1вввввв ввввввв uввввввв вв вввввв► ®ввввв ■ в .в ■ввввв ввввв ► вввв ■ввввв .в ■■
Time
Add your own units to the axes on above time-distance graph and prepare a log that fits the movements of a person (for example, helicopter pilot, jogger or taxi driver) to the graph.
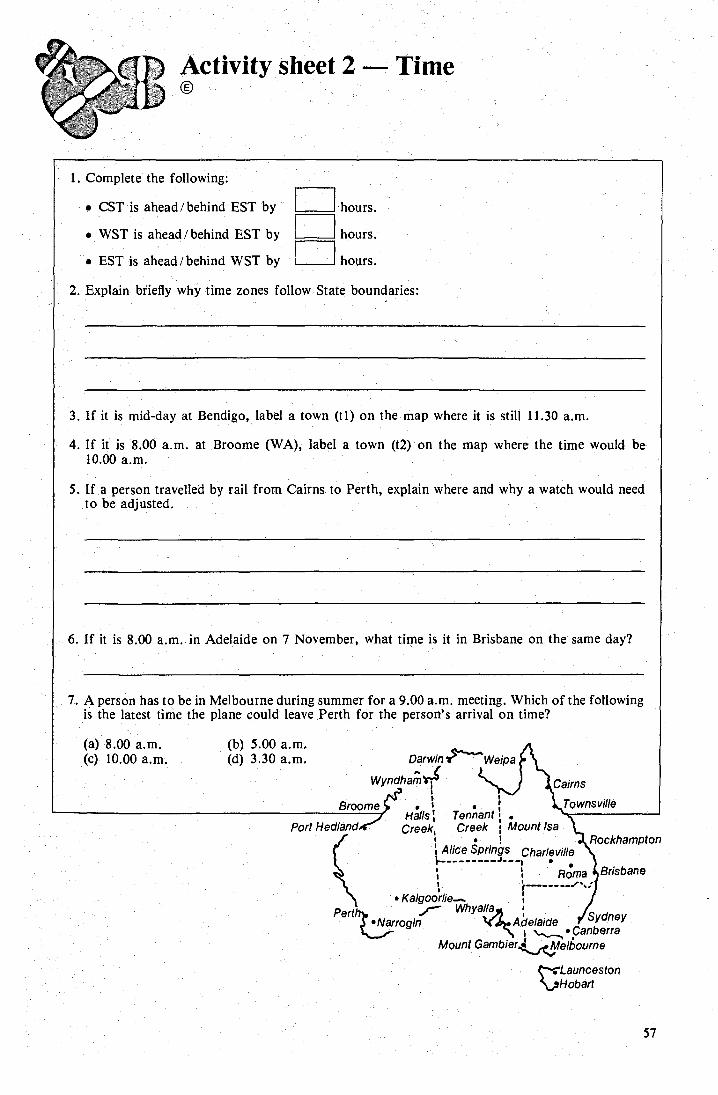
1. Complete the following:
▪ CST is ahead /behind EST by
• WST is ahead/behind EST by
. EST is :ahead /behind W ST by
hours.
hours.
hours.
2. Explain briefly why time zones follow. State boundaries:
3. If it is mid-day at Bendigo, label a town (ti) on the map where it is still 11.30 a.m.
4. If it is 8.00 a.m. at Broome (WA), label a town (t2) on the map where the time would be 10.00 a.m.
5. If a person travelled by rail from Cairns to Perth, explain where and why a watch would need to be adjusted.
6. If it is 8.00 a.m. in Adelaide on 7 November, what time is it in Brisbane on the same day?
7. A person has to be in Melbourne during summer for a 9.00 a.m. meeting. Which of the following is the latest time the plane could leave Perth for the person's arrival on time?
(b) 5.00 a.m. t .... (д ) 3.30 a.m. Darwin г Weipa
Wyndham Cairns 1 , Brume . . ;' Towns ville ,
Ha11s; Tennant i . Port Hedland Creek, Creek 1 Mount Isa
/
(l! A1iceSprings Charleville 1•- , •
Rockhampton
, Róma 13rísbane 1 ' -"г
• Kalgoorlie.. ; Perth / W hyalla
•Narrogin A ď elaide Canberra y . Mount Gambier¿Melboume
. Launceston Hobart
(a) 8.00 a.m. (с ) 10.00 а .т .
Activity sheet 2 — Time
57
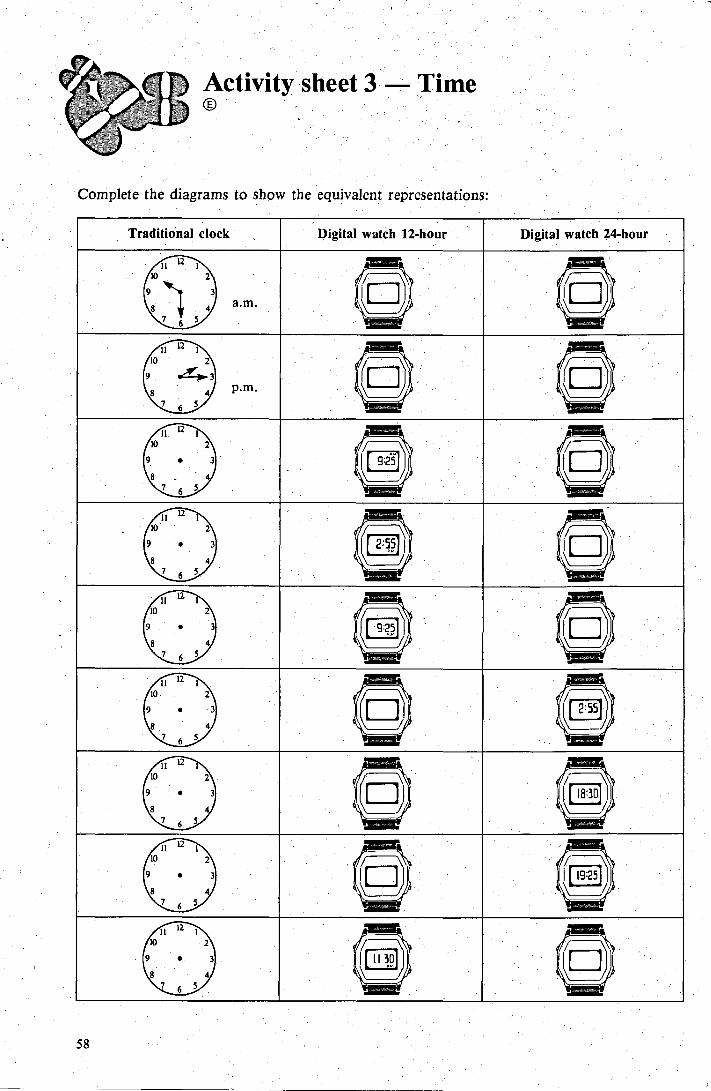
Digital watch 12-hour Digital watch 24-hour Traditional clock
a.m.
Activity sheet 3 Time
Complete the diagrams to show the equivalent representations:
58
Assessment Assessment must involve ongoing monitoring of students' progress throughout the year. A variety of pro- cedures such as observation of students as they work with materials, informal discussions and written tests — should be used to gather relevant information.
For students to be regarded as proficient with time concepts at this level they should be able to use a variety of processes in a range of situations similar to those suggested below. Some of these tasks have not been designed to be given to all students at the same time, especially those tasks where students are required to explain or demonstrate ideas or procedures.
Note: Select tasks appropriate to students' needs and interests (no. 1): Provide calculators (no. 2).
Assessment ideas
Major processes
1. Estimate each of the following in appropriate units:
Estimating • time to milk 20 cows • time to walk to the nearest high school • time to travel by Boeing 747 direct to Singapore from Brisbane • time to cover 1 km on your bicycle • time to carry out a particular classroom task (for example, cleaning the
chalkboard).
2. When orbiting the sun, the earth travels approximately 29.6 km in 1 second. At
Calculating that rate, how many kilometres would be covered in one hour?
Problem solving
3. One calendar year is given as 365 days, but this is only approximate. Explain
Explaining how the leap year is used to account for the difference. Organising
4. A tiny sea-snail wants to reach a patch of moss to eat. It travels at the rate of
Problem solving 20 mm every 75 minutes. For how long (hours, minutes and, seconds) must the
Calculating
snail travel before it can completely pass over onto the moss which is 1 metre away?
5. Find from the given airline timetable the time you must leave Perth in order to
Analysing attend a meeting in Brisbane at 9.00 a.m. (EST), Wednesday. Calculating
Comparing
59

Focus for teaching, learning and assessment Notes for teachers 1. Activities to justify a study of mass
(Focus A, B and C) (a) Concept of mass and associated language (b) Mass in real-life situations
2. Activities for estimating, measuring, comparing and recording the mass of objects (Focus A, C and D)
(a) Comparing masses (b) Mass of objects in grams (c) Using water as a measuring tool (d) The-kilogram (e) The milligram (f) The tonne
3 ' Activities for calculating and recording masses in appropriates', units (Focus C and D)
(a) Checking packaging of groceries (b) Best buys (c) Estimating masses
-- (d) Masses of large objects
4. Activities for solving and creating problems (Focus E)
(a) Recipes (b) Postal charges (c) Choosing masses
Activity sheets
Assessment 68
Yea
rs 9
and
10
i] Exp
erie
nce
for
all s
tude
nts.
и нб
00 ь
С и ы С
у Е с о
О .S ш <... О 2 . 'n . .. ы , .
с 'n CO
Ú 4) й
и д
. и
О Е o С bo C О
д .у С С
о
^ й
А . й
V Е ý С д
W
- С ) •ď C и
00 о, С. 3 Е С o ы . CL -
•
w
, G о w сб о
й [1 й . Ои
Е с - 4)
3 а и .+ .У ы ,4)+
С С .
oo'n .— ы,0 С ,'а Е С .9:Б ' • сб . о и
¢ d А ui ■ о ■ ■ о
Inve
stig
atin
g an
d cr
eat i
ng p
robl
ems
invo
lvin
g m
as
(Up
to a
nd in
clud
ing)
Yea
r 7
62
б 3
Notes for teachers During Years 1 to 7 students will have been intro-duced to all the terms and procedures required for estimating, measuring and calculating with masses. In Years 8 to 10 students will require opportunities to consolidate what they have learned and to gain further practice in the practi-cal application of their skills. In particular, the units of tonne and milligram will have been covered only late in the Years 1 to 7 span, and students might need a good deal of practice with these.
Make sure students have access to a variety of objects for estimating and comparing masses and to a variety of scales for measuring masses. Some of the equipment, such as balance scales, can be expensive and fragile. Plans have to be made for acquiring, storing and sharing such equipment.
1. Activities to justify a study of mass (Focus A, B, and C)
1(a) Concept of mass and associated language
Lead a discussion on the language of mass. Students should be aware that: • Mass is defined as the amount of matter con-
tamed in an object or body of material while weight is a force related to the pull of gravity. The Metrication Board recommended that the term mass be the only one acceptable for quan-tity of matter.
• Ongoing changes take place in common language usage. The verb to weigh will con-tinue to be used in everyday language. At the same time, people will use other terms, such as finding the mass or measuring the mass of objects.
• Language is used in different ways depending on the context. Terms such as heavier, lighter and the same weight are used in everyday con-versation. These terms are related to the terms that will be met in the classroom: greater mass, less mass and the same mass.
1(b) Mass in real-life situations Have students work in small groups brainstorm-ing instances where the concepts and language of mass might be used by members of a household.
Some starter examples: • buying meat, groceries, vegetables or nails; • cooking; • dieting; • chlorinating a pool; • tare `weight' and load capacity of a transport
vehicle; • fishing sinkers; • competition classes for boxing or weightlifting; • rules regarding mass of hockey sticks or cricket
bats; • handicapping in horseraces; • prescriptions for medicines; • postal charges.
Develop a comprehensive class list after each student group responds with its list.
2. Activities for estimating, measuring, comparing and recording the mass of objects (Focus A, C and D)
2(a) Comparing masses Materials: Activity sheet 1; a variety of objects per group (for example, a book, a piece of poly-styrene, a piece of fruit, a stone and a cricket ball would provide some differentiation in masses); balance scales for each group.
If balance scales are unavailable, they can be made using a piece of dowelling suspended on string and balance pans made out of string and lids of paint tins.
Once materials are distributed and it is clear that the class understands what is required, students should conduct the activity. To promote dis-cussion while the activity is in progress, ask students what is the least number of comparisons that need to be carried out to place the masses of 5 objects in order. Students should estimate by hand before checking, masses with the balance scales.
2(b) Mass of objects in grams Materials: Activity sheet 1; balances; centicubes for each group; a selection of small objects.
Students should check that the centicubes have a mass of 1 gram each. By taking up different num-bers of centicubes the `feel' of masses of 2 g, 5 g,
10 g etc. may be attained. The centicubes may be used to obtain the mass, to the nearest gram, of a variety of objects (Pencil, apple, sandwich, cal-culator and pencil sharpener are some examples). Estimates should be made first and validated using the balance scales.
2(c) Using water as a measuring tool Materials: Balance scales; graduated measuring jugs or cylinders.
The relationship of 1 mL of water having a mass of 1 g may be obtained by balancing a known. volume of water against centicubes after balanc-ing the container first. (Accuracy depends on the temperature of the water.)
Activity 2(b) may be repeated using a variety of different objects which will have their masses compared to a known volume of water.
Discuss and demonstrate the use of water dis-placement in conjunction with the mass of an object to give some meaning to the term density. The Archimedes principle may be discussed, and how the mass of a ship or other floating body can be determined.
2(d) The kilogram Through discussion lead students to investigate the relationship between 1 L of water and 1 kg. Pose questions of the form: • What would be the mass of water in a 10 L
bucket? • What mass of water would fill an electric urn?
After students have a `feel' for the mass of a kilogram, ask them to find objects, or a collection of objects, which have a mass of about 1 kg. Objects should be compared using a balance.
2(e) The milligram Making A4 bond paper available, ask students to find the mass of 10 sheets, 15 sheets, 20 sheets and, by division, to find the mass of 1 sheet (which should be about 5 g).
By finding the area of 1 sheet in cm2, ask students to find the mass of 1 cm2. They should find haw much paper will have a mass of 1 g.
A4 bond is 73 GSM [g/m2]; 1 ream is 500 sheets; 1 A4 sheet is about 600 cm2.
Ask students to find the mass of 2 reams etc.
2(f) The tonne Have students research the mass of large objects. For example, what is the mass of a large ship, the mass of a Boeing 747 jet plane, or the mass of the world's heaviest animal?
It might be possible for students to obtain data from a local weighbridge on the mass of different vehicles.
Students might get information about the mass of vegetables in bags or boxes or on pallets from the local greengrocer or fruit shop.
A hardware store manager could be helpful in supplying data about building materials, for example, bags of cement to the tonne.
З . Activities for calculating and recording masses in appropriate units (Focus C and D)
This section can be dealt with orally. By answer-ing questions pertaining to a variety of objects, students can obtain an appreciation of which unit (mg, g, kg and t) will be the most efficient for recording the mass of an object.
The recording of masses that involve kilograms, grams and milligrams will continue to cause prob-lems for many students at Year 8 level. The inter-relationships of these measures are tied closely to a student's appreciation of numeration, notation, place value and fractions. Measurement problems associated with recording often arise from a student's lack of confidence in recording num-bers.
Those students who require further consolidation and practice should be provided with ample opportunities to measure and record masses in practical contexts. Kitchen and bathroom scales will be required. Think of meaningful contexts for measurement rather than having students weigh-ing for the sake of weighing.
3(a) Checking packaging of groceries Ask students to bring canned or packet goods, marked in grams, from their kitchen pantries. In groups, students should check the mass of the items and obtain a class average using calculators. The results obtained should be discussed and the meaning of the term net weight investigated.
3(b) Best buys The notion of the best value for money in prepackaged materials can be investigated.
.
Ё вв
64
_ .. i ři .
Data such as the following can be collected and analysed using calculators:
Which cheese is cheapest per kilogram? 250 g packet for 98c 500 g packet for $1.78 1 kg packet for $3.58 2 kg packet for $7.20
Have students bring in packet prices from a supermarket or a hardware store or in a series of newspaper advertisements and calculate the best value for money.
Often discussion about the amount of material that has to be purchased to get the lower unit price will lead to a realisation that `best buy' decision making is not just a matter of mathemat ical calculation.
3(с ) Estimating masses Ask each student to estimate the average mass of students in the class group.
Using bathroom scales, each student should deter-mine his/her mass. The total mass and average mass of students in the class then can be found using calculators.
If some students in the class group are sensitive about this public `weighing' procedure, then con-duct the activity using only a group of volunteers.
Similar activities could involve finding the mass of one roof tile and hence the mass of tiles in a roof, or the mass of one brick leading to the mass of bricks in a wall. Other activities could be sug-gested by students about questions that interest them.
3(d) Masses of large objects Have students investigate how to estimate the mass of very large objects, for example, a tree, a hill, a bridge, the earth. It might be necessary to assist students in researching the dimensions of the earth and its density.
4. Activities for solving and creating problems (Focus E)
4(a) Recipes Provide students with a recipe and appropriate questions related to it.
The following is an example that could be used, or select a favourite recipe of your own:
Scones (Makes 6) 30 g butter 250 g self-raising flour 3/4 cup milk Serve with 60 g butter extra plus jam and cream.
This scone mixture provides the scones for Devonshire tea for two hungry people.
How much flour would be needed to make scones for 4, 6 or 16 people? How much butter would be needed to make scones for 4, 3 or 19 people? What ingredients are needed to make 3 scones or 36 scones? What would you do if asked to make 13 scones?
4(b) Postal charges (i) Overseas postage Materials: Activity sheet 2.
Booklets showing current postal charges are obtainable from post offices. After initial dis-cussion students could use the activity sheet, which relates to postal charges to overseas countries. When the sheet is completed, results should be discussed along with Australia Post's use of the term weight rather than mass. The terms surface mail and air mail probably will need to be explained to students. The various air-mail zones and terms such as Oceania may also need explanation.
(ii) Posting parcels Materials: Calibrated scales; postal charges book-lets; items wrapped and addressed for postage; calculators.
Arrange the materials at work stations and have students work in small groups to use the equip-ment and calculate the total cost of postage of the items.
4(c) Choosing masses Pose the following situation for investigation: `Using balance scales and four masses of 1 kg, 3 kg, 9 kg and 27 kg how many different masses (in kg) can you measure?'
65
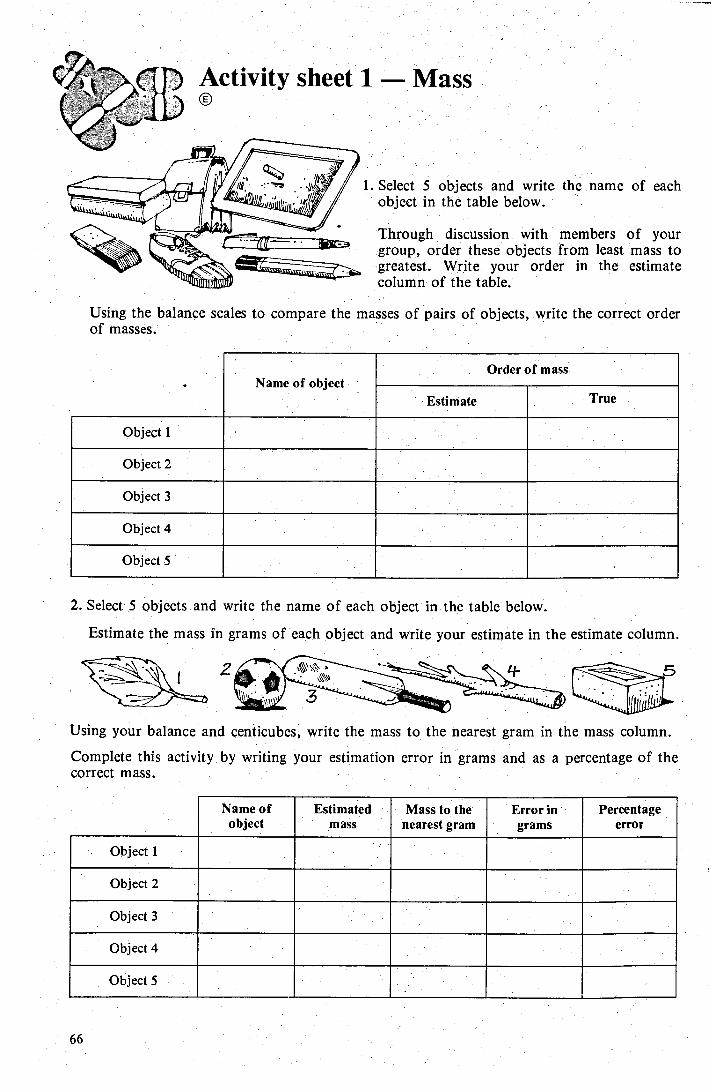
1. Select 5 objects and write the name of each object in the table below.
Through discussion with members of your group, order these objects from least mass to greatest. ` Write your order in the estimate column of the table.
Using the balance scales to compare the masses of pairs of objects, write the correct order of masses.
Order of mass Name of object
Estimate True
Object 1
Object 2
Object 3
Object 4
Object 5•
2. Select 5 objects and write the name of each object in the table below.
Estimate the mass in grams of each object and write your estimate in the estimate column.
3
Using your balance and centicubes, write the mass to the nearest gram in the mass column.
Complete this activity by writing your estimation error in grams and as a percentage of the correct mass.
Name of object
Estimated mass
Mass to the nearest gram
Error in grams
Percentage error
Object 1
Object 2
Object 3
Object 4
Object 5
66
Air Mail Zone 1 Zone 2 Zone 3 Zone 4 Zone 5
e.g.NZ e.g. e.g. e.g. e.g.
Papua Fiji, India, USA, UK.
New Indonesia, Japan Israel Europe Guinea Malaysia
Letters and Postcards - postcards bearing more than 5 Letters (max. 2 kg) $ $ $ $ $ (max. 2 kg) words of greeting added by the
sender. up to 20 g Asia/Oceania Other Countries Standard article 0.55 0.65 0.70 0.90 1.00
Weight s $ - Non-standard article 0.65 ' 0.75 0.90 1.10 1.35
up to 20 g over 20 g up to 50 g 0.73 0.94 1.05 1.20 1.50 - Standard article 0.45 0.56 - Non-standard article 0.62 0.78 over 50 g up to 100 g 1.40 1.75 2.00 2.25 2.70
over 20 g up to 50 g 0.68 0.83 over 100 g up to 250 g 2.10 2.60 3.20 3.90 4.35
over50gupto 100g 0.78 1.20 over 100 g up to 250 g 1.45 2.00 Aerogrammes 0.53 0.53 0.53 0.53 0.53
over 250 g up to 500 g 2.45 ' 4.00
To Overseas Countries Sea Mail (previously Surface Mail)
over 500 g up to 1 kg 4.85 over 1 kg up to 2 kg 6.25
Sma11 Packets (max. 500 g) up to 100 g over 100 g up to 250 g over 250 g up to 500 g
Small Packets (max. 500 g) Printed Papers including Endorse the envelope or wrapper Registered Publications "Printed Papers" and do not seal (max. 2 kg) against inspection. Books (max. 5 kg)
0.57 0.90 1.58
0.63 1.00 1.85
Parcels (maximum weight depends on country of destination.)
up to 1 kg over 1 kg up to 2 kg over 2 kg up to 3 kg over З kg up to 4 kg over 4 kg up to 5 kg
over 5 kg up to б kg 11.85
14.85 over6 kgupto7kg 13.25
16.75
over 7 kg up to 8 kg 14.65
18.65 over 8kgupto9kg 16.05
20.55
over 9 kg up to 10 kg 17.45
22.45 each additional kg up to 20 kg 1.40
[.90
up to 50 g 0.73 0.94 1.05 1.20 1.50 over 50 g up to 100 g 1,40 1.75 2.00 2.25 2.70 over 100 g up to 250 g 2.10 2.60 3.20 3.90 4. Э 5 over 250 g up to 500 g 4.15 5.10 630 7,45 8.60
Parcels (maximum mass depends on country of destination.)
up to 1 kg 8.25 10.15 12.50 14.85 17.15 over 1 kg up to 2 kg 12.05 15.85 20.55 25.25 29.85 over 2 kg up to 3 kg 15.85 21.55 28.60 35.65 42.55 over З kg up to 4 kg 19.65 27.25 36.65 46,05 55.25 over 4 kg up to 5 kg 23.45 32.95 44.70 5б .45 67.95
each additional kg 3.80 5.70 8.05 10.40 12.70
5.35 7.25 9.15
1I.05 12.95
4.85 6.25 7.65 9.05
10.45
5.35 7.25
Activity sheet 2 Mass 0
1. Find the cost of sending a small packet with a mass of 150 g to Singapore by:
(a) surface mail (b) air mail
2. Find the cost of sending a parcel by surface mail to England if the parcel has a mass of:
(а ) 580 g
(b) 1.5 kg
(c) 2.1 kg (d) 4 ź kg (е ) 5 kg (f) 6 kg
(g) 7 kß (h) 10 kg (i) 20 kg
з . Find the difference in cost in sending a letter with a mass of 25 g by surface mail and air mail to (а ) New Zealand (b) Japan (c) U.S.A. (d) France
4. Find the total cost of sending a
• 3.5 kg parcel to Italy by surface mail; . 55 g packet to Israel by air mail; • 60 g letter to Papua New Guinea by surface mail; . non-standard 15 g letter to Indonesia by air mail.
67
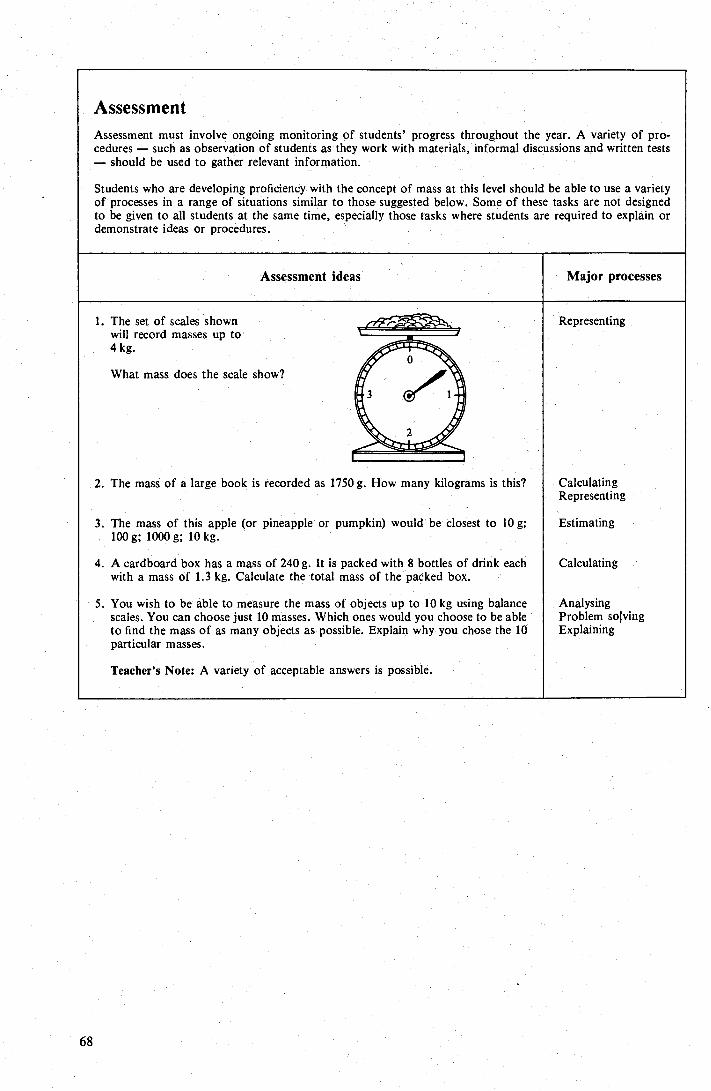
Assessment Assessment must involve ongoing monitoring of students' progress throughout the year. A variety of pro-cedures — such as observation of students as they work with materials, informal discussions and written tests — should be used to gather relevant information.
Students who are developing proficiency with the concept of mass at this level should be able to use a variety of processes in a range of situations similar to those suggested below. Some of these tasks are not designed to be given to all students at the same time, especially those tasks where students are required to explain or demonstrate ideas or procedures.
Major processes Assessment ideas
Representing 1. The set of scales shown will record masses up to 4 kg.
What mass does the scale show?
2. The mass of a large book is recorded as 1750 g. How many kilograms is this?
3. The mass of this apple (or pineapple or pumpkin) would be closest to 10 g; 100g; 1000g; 10 kg.
4. A cardboard box has a mass of 240 g. It is packed with 8 bottles of drink each with a mass of 1.3 kg. Calculate the total mass of the packed box.
5. You wish to be able to measure the mass of objects up to 10 kg using balance scales. You can choose just 10 masses. Which ones would you choose to be able to find the mass of as many objects as possible. Explain why you chose the 10 particular masses.
Teacher's Note: A variety of acceptable answers is possible.
Calculating Representing
Estimating
Calculating
Analysing Problem solving Explaining
68
Focus for teaching, learning and assessment Notes for teachers 1. Activities for exploring equivalent ratios
(Focus A, B and C) (a) Using physical objects (b) Using newspapers and repo (c) Identifying applications
2. Activities for integrating ratio with other mathematical topics (Focus A, B, C and D)
(a) Ratio and length (b) Ratio and number work (c) Ratio and trigonometry
з . ' Activities for applying ratios to divide given quantities (Focus D and E)
(a) Dividing intervals (b) Dividing quantities (c) Systematic organisation of data
4. Activities for describing rates of change (Focus E and F)
(a) Establishing constant ratios (b) Consumption rates (c) Rates of payment
4
Assessment
73 74 74
Ratio and própõř tion Contents
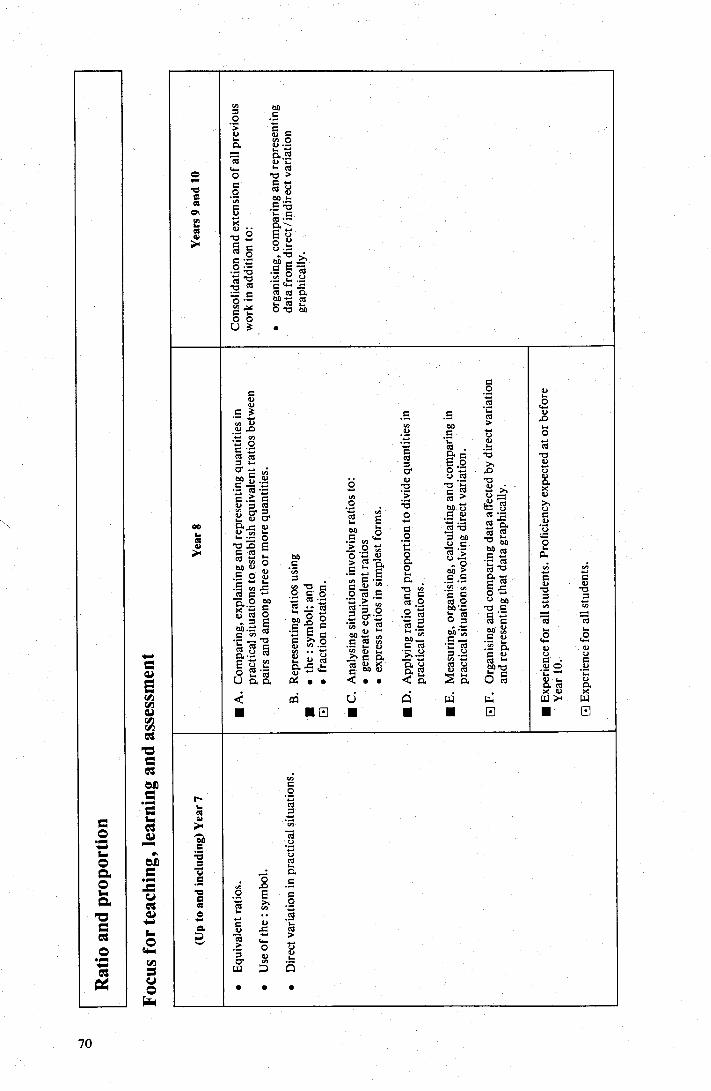
Yea
rs 9
and
10
Exp
erie
nce
for
all s
tude
nts.
С О
. ..
ё 3 С 'С и 'о 0 > • . н v
•~ и
' • ь _ о ...- Чс
• o ć v о ь - о
,о о 0%.
с v
С .4: •.. О b - . .С > o . и .. •>
.
сСб >
Ú ... .
С . . b0. Ú .. (L й
ь- С .✓ сд І- = 0
to д С о 0 c° • .., . U С .. b0
to
С
О
Ć О
•0С б0
> с0
• '
л с0 Ђ . 0.004) 4) 2 и •
' С
О'О б ,н
.. 0
, Оо 0 _ сб > О со
у
ан
е 0. и а ^ аО
. .
С '- С 7 ő
С й •á ь-•
о 0 и џ
с0 Ń й .О ❑ .í . Ń to
¿б . 'ь С .
. б •
v..
ь . о
а• •• Q• •• Q с . сь Ос
¢ ai c5 А ц . с.х.: ■ ■ о • ■ • о
(Up
to a
nd in
clud
ing)
Yea
r 7
•
Dir
ect v
aria
tion
in
pra
cti c
al s
itua
tion
s.
•
Equ
ival
ent r
atio
s.
•
Use
of
the
: sym
bol.
U 3 •
Foc
us f
or te
achi
ng, l
earn
ing
and
asse
ssm
ent
Rat
io a
nd p
ropo
rtio
n
7о
Notes for teachers
Students will have begun a study of ratio in Year 7. Most will have had experience in identifying equivalent ratios but will need much practice in the difficult task of choosing the appropriate ratio to use in a word problem.
Throughout Year 8 great emphasis should be placed on the use of language in this topic. Students will need to discuss and compare phrases such as `three in ten' and `three is to ten'. Fur-thermore, through having to verbalise their ideas, students will come to a deeper understanding of ratios and associated fractions in context.
Example: One hundred boats enter a race. The ratio of yachts to multihulls is 7 is to 10. How many of each type are there in the race?
In this example the ratio of yachts to multihulls can be written as 7:10 or as ¡. It is strongly recommended that in Year 8 the notation be used. The fractional notation can be misleading as in the situation posed in the preceding example. Students should be able to use and compare both fraction and ratio approaches to problems.
Ratio approach Yachts Multihulls Total 7 10 17
70 : 100 170 35 50 85
42 : 60 102
From this students can see that the given ratio of 7:10 is an approximation and quite appropriate in such a context. Acceptable answers might be `about 42 yachts' or `less than 42 yachts' or even `around 40 yachts'.
Fraction approach Yachts Multihulls 7 10
The number of yachts is seven-seventeenths of the total. The number of yachts is 41.18.
There were probably 41 yachts in the race.
Calculators should be readily accessible for all work with ratios and fractions. In this way real data from any source that is of interest to students can be used.
The activities suggested in this topic include some for integrating ratio with other mathematical topics. A case could be made for incorporating the topic completely within other topics as this may assist students in learning to apply their knowledge more effectively. This approach should be carefully considered when designing school programs for Year 8.
A ratio is a statement of comparison between, or a statement about, the relative sizes of two numbers or quantities.
A proportion is a statement of equality of two ratios.
A rate is a ratio. It is a statement of relative amount, quantity or degree and used in situations such as `rate of interest' or `rate of growth'. A rate is generally expressed with one of the quantities being an accepted standard unit. For example, `speed' is a rate that states the number of units of distance travelled in some standard unit of time such as one hour. The `birth rate' is an expression relating number of births in a year to a standard unit of population such as 1 000.
Spreadsheets If students have access to computers and spreadsheet software, it may be possible to devise activities that require students to apply their con-cepts of ratio. Spreadsheets are a relatively new tool for mathematics education. While they appear to have potential for the teaching of ratios, specific activities have not yet been developed or trialled widely.
1. Activities for exploring equivalent ratios (Focus A, B and C)
1(a) Using physical objects Materials: A collection of diverse objects (for example, coins), calculators, centicubes.
Direct students to: •` choose a ratio in, the material provided;
•
record it using the : notation; • identify and record several equivalent ratios;
and • explain some of these in their own words.
For example, a pile of coins might contain 20 x lc, 16 x 2c, 12 x 5c, 2 x 10c and 4 x 20c coins.
Some students might choose to investigate the ratio:
71
silver coins: copper coins 18: 36 9: 18 3: 6 1: 2 2: 4
0.5: 1 5: 10
50:100
*
ж *
Explanations: * `For every two copper coins in the pile we
would expect to find one silver coin.' ** `If there were a larger pile of coins with the
same ratio of silver to copper, I would expect to see 50 silver coins for every 100 copper coins.'
Other students might investigate the ratio of coins below 7c in value to those above 7c in value:
coins below 7c : coins above 7c 48: 6 24: 3
120: 15 8: 1
800:100 4: 0.5 2: 0.25 1: 0.125*
Explanation: * `For each large denomination coin I would find
8 smaller ones. To put that another way for each small denomination coin I could match it only with one-eighth of a large coin.'
Such an explanation could be accompanied by a rearrangement of the coins to show each large one surrounded by eight ones of small value.
Other students might encounter less manageable ratios and use the calculator immediately. The ratio of 2c toms to other coins is one such case:
16:38 8:19 1:(19 8) 1:2.375 (calculator)
16:38 (16 _ 38):1
.421 : 1 (calculator)
.4 : 1 (approximately) 4 : 10 (approximately)
Explanation: * `For every 10 non-two-cent coins there are
about 4 of the two-cent coins. In fact there are slightly more than 4 two-cent coins per 10 of the others.'
1(b) Using newspapers and reports Direct students to bring to school items such as company reports, mining operation reports, cattle
sales data, tourism documents, accident statistics, share-market reports or any material containing numerical data.
Alternatively provide a large pool of such resources to be drawn upon in this topic and others.
Ask students as in activity 1(a) to identify, inves-tigate and explain ratios. Highlight the fact that in many practical situations one needs to reduce the ratios to their lowest terms involving whole numbers or to ratios in which one of the numbers is 1.
Stress the importance of developing working approximations of ratios to suit particular circumstances.
For example:
(i) The ratio for a buyer of currency
Australian dollars : British pounds sterling 1 :0.4238
10000:4238
10 : 4 (approximately)
5 : 2 - (approximately)
2.5 :1 (approximately)
2.3596 : 1 (calculator)
Explanation: `As a buyer of pounds sterling I would need about 2.5 Australian dollars. In more exact terms I would need 2.3596 dollars for every 1 pound bought.'
(ii) The ratio for Emperor Gold share prices
1988 high price : 1988 low price 370 : 205 72: 41
(72 - 41): 1 1.756 1 (calculator)
1.8 : 1 (approximately)
Explanation: `If I had bought at the low price and sold at the high price this year then for every $1 of purchase price paid I would have collected about $1.80 in the sale — less costs of course.'
This context might not interest all Year 8 students but the same approach could be used with figures to do with local cattle prices, wool production figures or crime statistics.
Note: The calculator makes this sort of activity possible with real data from any source that students find relevant.
1(c) Identifying applications Ask students in groups to develop lists of every-day applications of ratio. A sample list is given,
* *
72
but students could suggest others depending their background and interests.
on Have students in pairs draw a table and complete the steps in Figure A.
Examples: • mixtures for medicine; ▪ feed for horses or other animals; • recipes for cooking ▪ soup mixtures; • concrete mixtures; ▪ composition of fabrics in carpets or clothing
(nylon, wool etc.); • mineral concentrations (for example, parts per
tonne); • paint tinting; • compost; • the `golden ratio' in art.
Each group could report its findings to develop a more comprehensive class list and to motivate students to think more creatively.
Students should distinguish between those situ-ations involving constant ratios and those where ratios are not constant (daily exchange rates) or where useful relationships do not exist (ratio of height to age).
2. Activities for integrating ratio with other mathematical topics (Focus A, B, C and D)
2(a) Ratio and length Materials: Large wall map of Australia, small 10 cm trundle wheel made of cardboard, pencil and a drawing pin (or commercial 'logimeter'), calculators.
Instruct students as follows:
Step 1: Using 4 units to represent the length of the Queensland coastline, estimate the required ratios just by looking at the wall map.
Step 2: Discuss your estimate with another pair of students and then change your estimate if you decide on a better estimate.
Step 3: Use a trundle wheel to measure coastlines and fill in the ratios using the measures made (for example, 30 cm : 20 cm).
Step 4: Use a calculator to generate equivalent ratios using 4 units as the length of the Queensland coastline.
At this point it is essential to initiate class discussion to:
• check the accuracy of measurements;
•
check that all students have an accurate method of calculating equivalent ratios;
• value the efforts of those who are good measurers or calculators; and
• discuss any problems of measurement that have arisen.
Step 5: Generate further equivalent ratios.
Step 6: Check official figures from an Australian Yearbook.
Discuss accuracy further now.
The inclusion of the ACT in this exercise provides an opportunity to discuss the lack of meaning in a ratio of 1 : 0.
Extension A student could draw a map of Australia on the board and others could measure (using the little trundle wheels) to check whether the map was
Figure A Ratios of lengths of coastlines
step 1 1st est.
Step 2 2nd est.
Step 3 3rd est.
step 4 Equivalent ratios
Lengths of coastlines Step 5
Q : NSW
4: Q : NT
4: Q : WA
4: Q : SA
4: Q : VIC
4: Q: TAS
4: Q : ACT
4:
4: 4: 4: 4: 4: 4: 4:
4: 4: 4: 4: 4: 4: 4:
1: 1: 1: 1: 1: 1: 1:
73
11
Get students to choose an angle for investigation. Begin with angles between 0° and 90°. Progress to angles between 90° and 180° later.
reasonably accurate in terms of ratios of lengths of coastline.
Al 2(b) Ratio and number work Materials: Centicubes.
Pose situations to involve students with practice in arithmetic. Encourage appropriate use of men-tal skills and calculators to check results.
Examples are plentiful in standard textbook series: • From a box 100 apples are divided between two
people who paid for them in the ratio $6 : $4. How many should each person receive?
• There are 191 oranges in a box with good ones and bad in the ratio of 3 : 2. How many of each kind are there?
• About 4000 people attended a rock concert and the ratio of children to adults was 120 : 8. How many children and how many adults attended the concert?
For students who have difficulty identifying ratios and establishing equivalent ratios, centicubes can be very helpful.
In the first example above the ratio could be modelled as:
= $1 ґ ((((( Total
6 4 10
If e= $10 the same model represents
60 40 100
In the second example 191 oranges are to be shared in the ratio of 3 : 2:
e = 1 ( Total
3 2 5
6= 10 30 20 50
e = 50 150 30 180
In 180 the split will be 150 : 30 with 11 left over.
е = l ((-(-‚ г (( іг (( Р ®®
6 : 4 10
The extra ones can be split 6 : 4 with one left over. The distribution will be 156 : 34 with one extra. Use a calculator to check results.
2(с ) Ratio and trigonometry Materials: Rulers, scientific calculators, protrac-tors.
Note: One or two scientific calculators for each class group would be sufficient.
Ask students to choose an angle, display the tan-gent ratio and draw an appropriate triangle to fit the data.
Example: Enter 40° Tan 0.8390996 (calculator) Tan 0.84 (approximately)
Vertical height : Horizontal distance 0.84 : 1 (approximately) 8.4 : 10 (approximately)
Have students draw a right triangle with side lengths of 8.4 cm and 10 cm and mark the appro-priate angle as measuring 40°. They should check for reasonable accuracy with a protractor.
Extension Students who are confident in applying the con-cept of tan ratios can investigate to sin and cos ratios in this manner.
A study of ratios and the drawing of triangles for 100, 20°, 30° ... can establish patterns of move-ment for sin and cos as angles increase from 0° to 90° and on to 180°.
Note: Remember that not all students will need to go beyond tan ratio at the Year 8 level to prepare for a more formal study of trigonometric func-tions.
3. Activities for applying ratios to divide given quantities (Focus D and E)
3(a) Dividing intervals Direction as follows will serve to develop the concept of proportional division:
. Draw an interval AB of length 6 cm. • Mark a point P on AB
-
such that AP is 4 cm in length.
• Then P divides AB in what ratio? • AP is what fraction of AB? • BP is what fraction of ` AB?
74
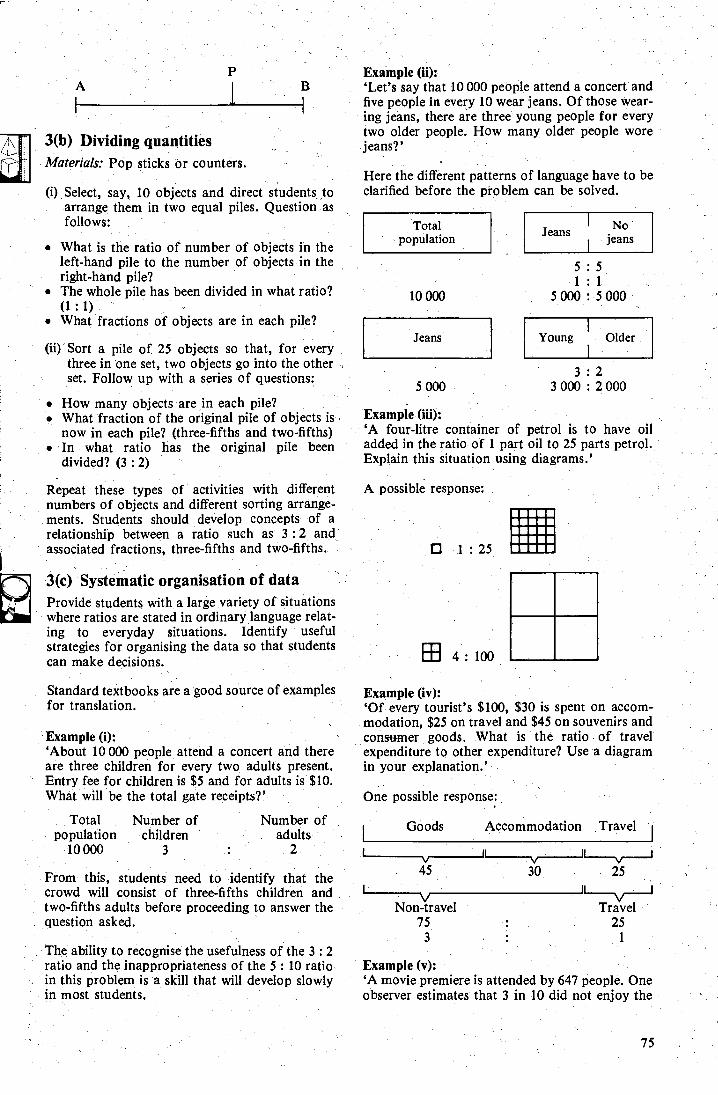
No jeans Jeans Total
population
10 000
Jeans
3(b) Dividing quantities Materials: Pop sticks or counters.
(i) Select, say, 10 objects and direct students to arrange them in two equal piles. Question as follows:
• What is the ratio of number of objects in the left-hand pile to the number of objects in the right-hand pile?
• The whole pile has been divided in what ratio? (1 : 1)
• What fractions of objects are in each pile?
(ii) Sort a pile of 25 objects so that, for every three in one set, two objects go into the other set. Follow up with a series of questions:
• How many objects are in each pile? What fraction of the original pile of objects is now in each pile? (three-fifths and two-fifths)
• In what ratio has the original pile been divided? (3 : 2)
Repeat these types of activities with different numbers of objects and different sorting arrange-rents. Students should develop concepts of a relationship between a ratio such as 3 : 2 and associated fractions, three-fifths and two-fifths.
3(с ) Systematic organisation of data Provide students with a large variety of situations where ratios are stated in ordinary language relat-ing to everyday situations. Identify useful strategies for organising the data so that students can make decisions.
Standard textbooks are a good source of examples for translation.
Example (i): `About 10 000 people attend a concert and there are three children for every two adults present. Entry fee for children is $5 and for adults is $10. What will be the total gate receipts?'
Total Number of
Number of population children adults
10 000 3
2
From this, students need to identify that the crowd will consist of three-fifths children and two-fifths adults before proceeding to answer the question asked.
The ability to recognise the usefulness of the 3 : 2 ratio and the inappropriateness of the 5 : 10 ratio•. in this problem is a skill that will develop slowly in most students.
Example (ii): `Let's say that 10 000 people attend a concert and five people in every 10 wear jeans. Of those wear-ing jeans, there are three young people for every two older people. How many older people wore jeans?'
Here the different patterns of language have to be clarified before the problem can be solved.
5:5 1: 1
5 000 : 5 000
Young Older .
5 000
Example (iii): `A four-litre container of petrol is to have oil added in the ratio of 1 part oil to 25 parts petrol. Explain this situation using diagrams.'
A possible response:
17 1 : 25
њ 4 : 100
Example (iv): `Of every tourist's $100, $30 is spent on accom-modation, $25 on travel and $45 on souvenirs and consumer goods. What is the ratio of travel expenditure to other expenditure? Use a diagram in your explanation.'
One possible response:
Goods Accommodation Travel
t i i 45 30 25
I Non -travel Travel 75 25 3 . . 1
Example (v): `A movie premiere is attended by 647 people. One observer estimates that 3 in 10 did not enjoy the
3:2 3 000 : 2 000
75
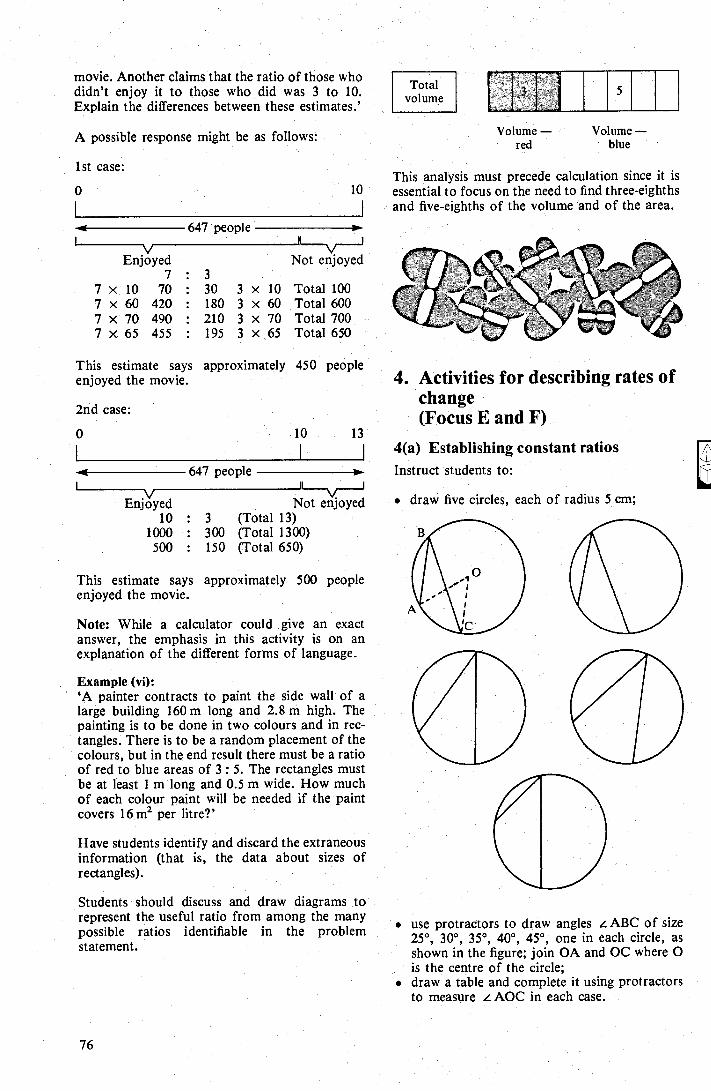
Total volume
5
approximately 450 people
movie. Another claims that the ratio of those who didn't enjoy it to those who did was 3 to 10. Explain the differences between these estimates.'
A possible response might be as follows: Volume — red
Vo ume - blue
1st case: This analysis must precede calculation since it is
0
i0 " essential to focus on the need to find three-eighths and five-eighths of the volume and of the area.
647 people 1 v
Enjoyed Not enjoyed
7 : 3 7 x 10 70 : 30 3 x 10 Total 100 7 x 60 420 : 180 3 x 60 Total 600 7 x 70 490 : 210 3 x 70 Total 700 7 x 65 455 : 195 - 3 x б 5 Total 650
This estimate says enjoyed the movie.
2nd case:
0
647 people
Not еń jo d 3 (Total 13) 300 (Total 1300) 150 (Total 650)
This estimate says approximately 500 people enjoyed the movie.
Note: While a calculator could give an exact answer, the emphasis in this activity is on an explanation of the different forms of language.
Example (vi): `A painter contracts to paint the side wall of a large building 160 m long and 2.8 m high. The painting is to be done in two colours and in rec-tangles. There is to be a random placement of the colours, but in the end result there must be a ratio of red to blue areas of 3 : 5. The rectangles must be at least 1 m long and 0.5 m wide. How much of each colour paint will be needed if the paint covers 16 m2 per litre?'
Have students identify and discard the extraneous information (that is, the data about sizes of rectangles).
Students should discuss and draw diagrams to represent the useful ratio from among the many possible ratios identifiable in the problem statement.
4. Activities for describing rates of change (Focus E and F)
4(a) Establishing constant ratios
Instruct students to:
• draw five circles, each of radius 5 cm;
• use protractors to draw angles .i ABC of size 25 30°, 35°, 40°, 45°, one in each circle, as shown in the figure; join OA and OC where O is the centre of the circle;
• draw a table and complete it using protractors to measure c AOC in each case.
Enjoyed 10
1000 500
їІ \
76
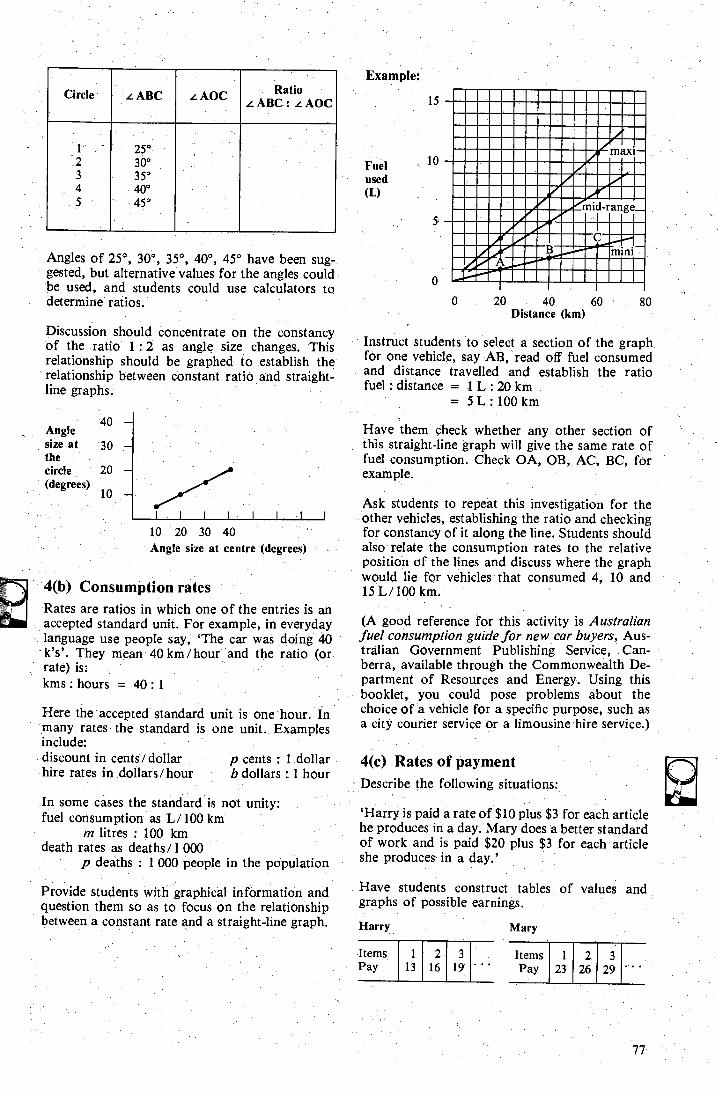
40
30
20
10
Angle size at the circle (degrees)
80 0 20 40 60 Distance (km)
Angles of 25°, 30°, 35°, 40°, 45° have been sug-gested, but alternative values for the angles could be used, and students could use calculators to determine ratios.
Discussion should concentrate on the constancy of the ratio 1 :2 as angle size changes. This relationship should be graphed to establish the relationship between constant ratio and straight-line graphs.
I i i i i i_ i I 10 20 30 40 Angle size at centre (degrees)
4(b) Consumption rates Rates are ratios in which one of the entries is an accepted standard unit. For example, in everyday language use people say, `The car was doing 40 k's'. They. mean 40 km /hour and the ratio (or-rate) is: kms : hours = 40 : 1
Here the accepted standard unit is one hour. In. many rates the standard is one unit. Examples include: discount in cents/ dollar p cents : 1 dollar hire rates in dollars /hour b dollars 1 hour
Iń some cases the standard is not unity: fuel consumption as L/ 100 km
m litres : 100 km death rates as deaths/ 1 000
p deaths : 1 000 people in the population
Provide students with graphical information and question them so as to focus on the relationship between a constant rate and a straight-line graph.
Example:
Fuel used (L)
Instruct students to select a section of the graph for one vehicle, say AB, read off fuel consumed and distance travelled and establish the ratio fuel : distance = -1 L 20 km
5L:100 km
Have them check whether any other section of this straight-line graph will give the same rate of fuel consumption. Check OA, OB, AC, BC, for example.
Ask students to repeat this investigation for the other vehicles, establishing the ratio and checking for constancy of it along the line. Students should also relate the consumption rates to the relative position of the lines and discuss where the graph would lie for vehicles that consumed 4, 10 and 15 L/100 km.
(A good reference for this activity is Australian fuel consumption guide for new car buyers, Aus-tralian Government Publishing Service, Can-berra, available through the Commonwealth De-partment of Resources and Energy. Using this booklet, you could pose problems about the choice of a vehicle for a specific purpose, such as a city courier service or a limousine hire service.)
4(c) Rates of payment .
Describe the following situations:
'Harry is paid a rate of $10 plus $3 for each article he produces in a day. Mary does a better standard of work and is paid $20 plus $3 for each article she produces in a day.'
Have students construct tables of values and graphs of possible earnings.
Harry
Items Pay
1 г 13 16
3 19
Mary
Items Pay
2 26
3 29
77
1 23
15
10 maxi-
mid-range_
C B mini
г 3 4 5
25° 30° 35° 40° 45°
Ratio L АВ C : LAIC
Circle L ABC L AOC.
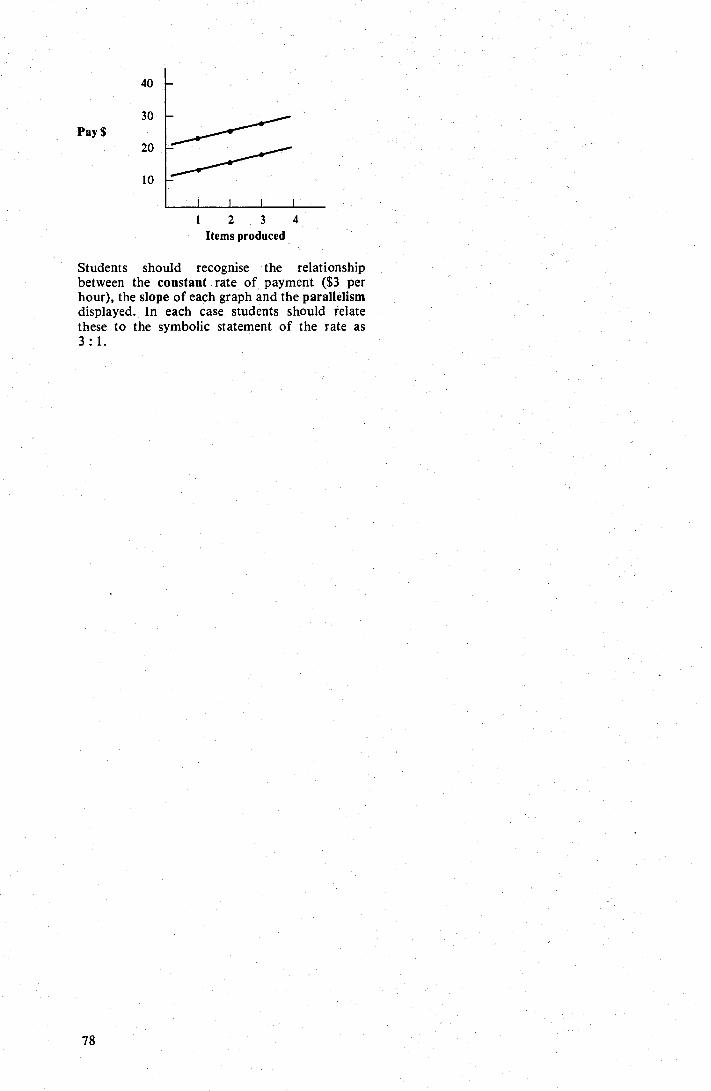
40
30
20
10
1 2 3 4 Items produced
Рау S
Students should recognise the relationship between the constant rate of payment ($3 per hour), the slope of each graph and the parallelism displayed. In each case students should relate these to the symbolic statement of the rate as 3 : 1.
78
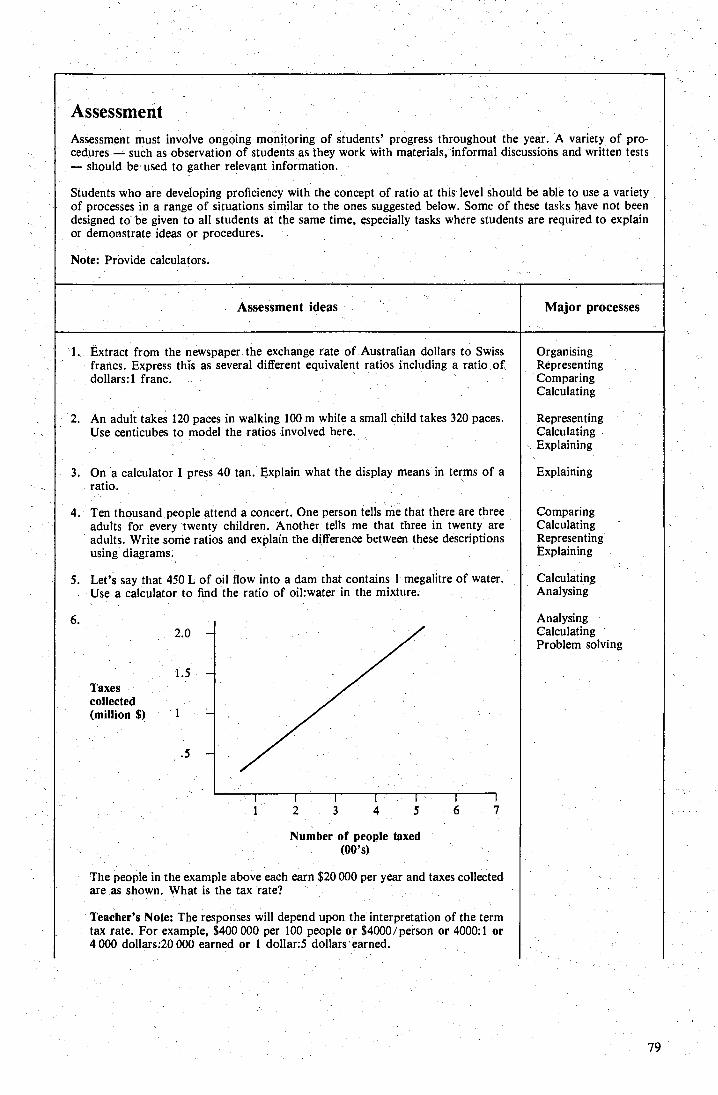
Assessment Assessment must involve ongoing monitoring of students' progress throughout the year. A variety of pro- cedures such as observation of students as they work with materials, informal discussions and written tests — should be used to gather relevant information.
Students who are developing proficiency with the concept of ratio at this level should be able to use a variety of processes in a range of situations similar to the ones suggested below. Some of these tasks have not been designed to be given to all students at the same time, especially tasks where students are required to explain or demonstrate ideas or procedures.
Note: Provide calculators.
Major processes Assessment ideas
1.. Extract from the newspaper the exchange rate of Australian dollars to Swiss francs. Express this as several different equivalent ratios including a ratio of dollars: 1' franc.
2. An adult takes 120 paces in walking 100 m while a small child takes 320 paces. Use centitubes to model the ratios involved here.
3. On a calculator I press 40 tan. Explain what the display means in terms of a ratio.
4. Ten thousand people attend a concert. One person tells me that there are three adults for every twenty children. Another tells me that three in twenty are adults. Write some ratios and explain the difference between these descriptions using diagrams.
5. Let's say that 450 L of oil flow into a dam that contains 1 megalitre of water. Use a calculator to find the ratio of oil:water in the mixture.
Organising Representing Comparing Calculating
Representing Calculating Explaining
Explaining.
Comparing Calculating Representing Explaining
Calculating Analysing
Analysing Calculating Problem solving
Taxes collected (million $)
Number of people taxed (00's)
The people in the example above each earn $20 000 per year and taxes collected are as shown. What is the tax rate?
Teacher's Note: The responses will depend upon the interpretation of the term tax rate. For example, $400 000 per 100 people or $4000/person or 4000:1 or 4 000 dollars:20 000 earned or 1 dollar:5 dollars earned.
79
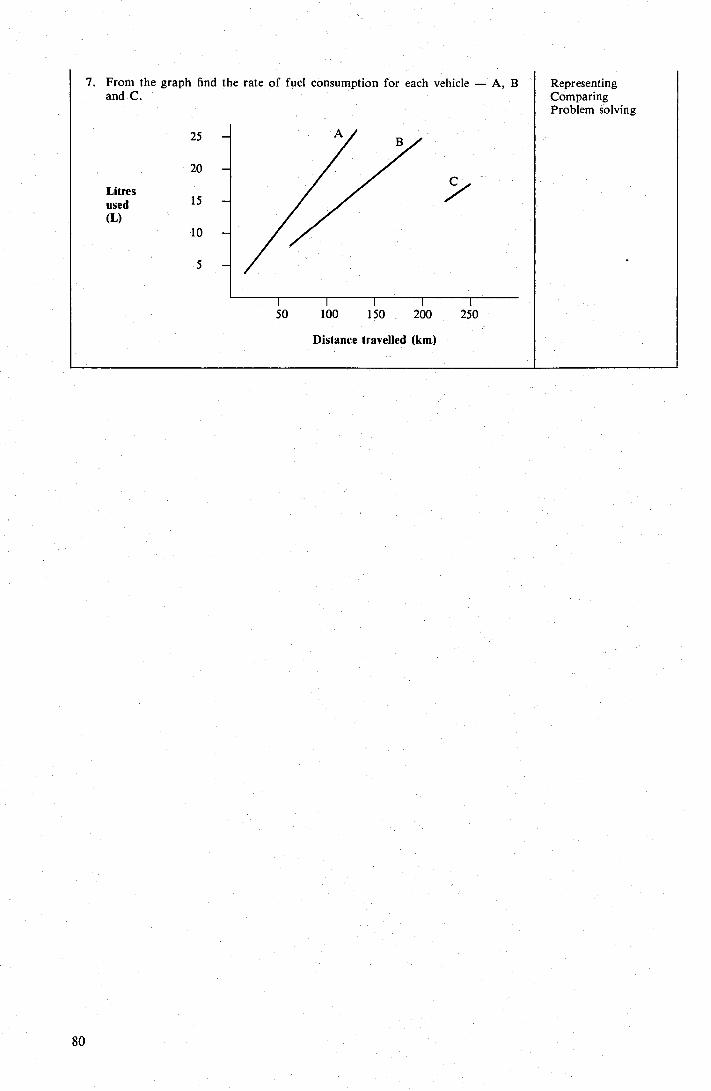
7. From the graph find the rate of fuel consumption for each vehicle — A, B and C.
Representing Comparing Problem solving
Litres used (L)
25 —
20 ' —
15 —
10 —
1 1 1 1 50 100 150 200
250
Distance travelled (km)
во
84
84
86 86
87
Focus for teaching, learning and assessment Notes for teachers 1. Activities for exploring probability in real-life situations
(Focus A) (a) Life chances
2. Activities for one-stage experiments with physical objects (Focus A, В and C)
(a) Tossing a standard matchbox (b) Tossing a bottle top
3. Activities for adding probabilities for a particular experiment (Focus В , C and D)
(a) Examining outcomes (b) Selecting a `,card (c) Certainty and impossibility
4. Activities for investigating problem situations involving probability
- (Focus E) (a) The pirate's problem (b) Coin games (c) Spinners (d) Investigating calculator displays (e) Telephone numbers
Assessment
Ye
ars
9 a
nd
10
com
plem
ent o
f an
eve
nt;
4)
4)
C
- t.—
f 1 -!; hi Ć
д и и
0 .С . ...0
CQ
w и
. С .7
> b_ • Е
к E v ß а и г а о Е > с и i1 Ои С ь, ь. а О сб ? 0.
00 0 0д 0q ćd C . • -' f.. К •у С
С С . . о-. и . С . 7 G
и ь О .. 0--_ ř . и ot сб L -
-;-ý сб и O C
- . C С . . y_„ . cd
и C с0 t._. 0р . и Ø ь. CO Ø 0. С ĆJ С А с д
с р ^ ^ ćd :^
- ь. .й б О й .С 04 А о й 1- о ý.Š L1, - Q) а 0 н 0
ci1 < U Y гх á á
Q W U С] W
■ • • о а 0 E
xper
ienc
e fo
r al
l stu
den t
s.
(Up
to
and
inclu
din
g) Y
ear
7
Rea
l-lif
e si
tuat
ions
inv
olvi
ng p
roba
bili
ty.
One
-sta
ge e
xper
imen
ts.
Foc
us f
or t
each
ing,
lea
rnin
g an
d as
sess
men
t
82
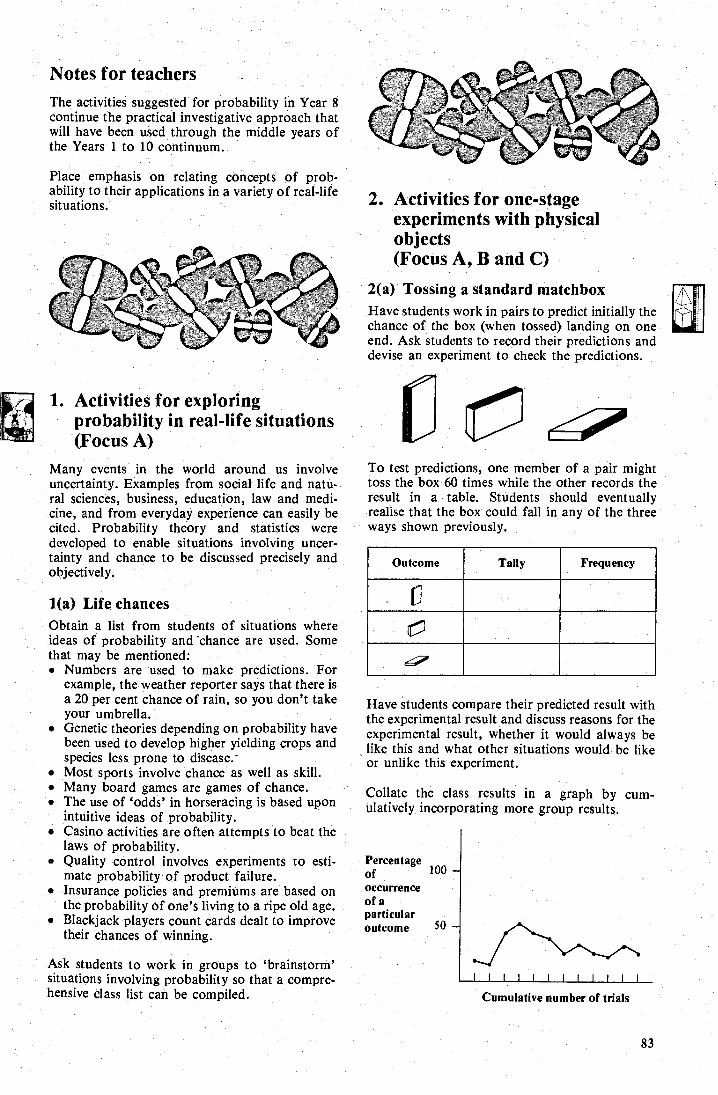
Notes for teachers The activities suggested for probability in Year 8 continue the practical investigative approach that will have been used through the middle years of the Years 1 to 10 continuum.
Outcome Tally Frequency
Percentage of 100 - occurrence of a particular outcome 50 —
1 1 1 1 1 1 1 11 1 I
Cumulative number of trials
83
Place emphasis on relating concepts of prob-ability to their applications in a variety of real-life situations.
1. Activities for exploring probability in real-life situations (Focus A)
Many events in the world around us involve uncertainty. Examples from social life and natu-ral sciences, business, education, law and medi-cine, and from everyday experience can easily be cited. Probability theory and statistics were developed to enable situations involving uncer-tainty and chance to be discussed precisely and objectively.
1(a) Life chances Obtain a list from students of situations where ideas of probability and 'chance are used. Some that may be mentioned: • Numbers are used to make predictions. For
example, the weather reporter says that there is a 20 per cent chance of rain, so you don't take your umbrella.
• Genetic theories depending on probability have been used to develop higher yielding crops and species less prone to disease. Most sports involve chance as well as skill.
• Many board games are games of chance. • The use of `odds' in horseracing is based upon
intuitive ideas of probability. • Casino activities are often attempts to beat the
laws of probability. • Quality control involves experiments to esti-
mate probability of product failure. • Insurance policies and premiums are based on
the probability of one's living to a ripe old age. • Blackjack players count cards dealt to improve
their chances of winning.
Ask students to work in groups to `brainstorm' situations involving probability so that a compre-hensive class list can be compiled.
2. Activities for one-stage experiments with physical objects (Focus A, B and C)
2(a) Tossing a standard matchbox Have students work in pairs to predict initially the chance of the box (when tossed) landing on one end. Ask students to record their predictions and devise an experiment to check the predictions.
To test predictions, one member of a pair might toss the box 60 times while the other records the result in a table. Students should eventually realise that the box could fall in any of the three ways shown previously.
Have students compare their predicted result with the experimental result and discuss reasons for the experimental result, whether it would always be like this and what other situations would be like or unlike this experiment.
Collate the class results in a graph by cum-ulatively incorporating more group results.
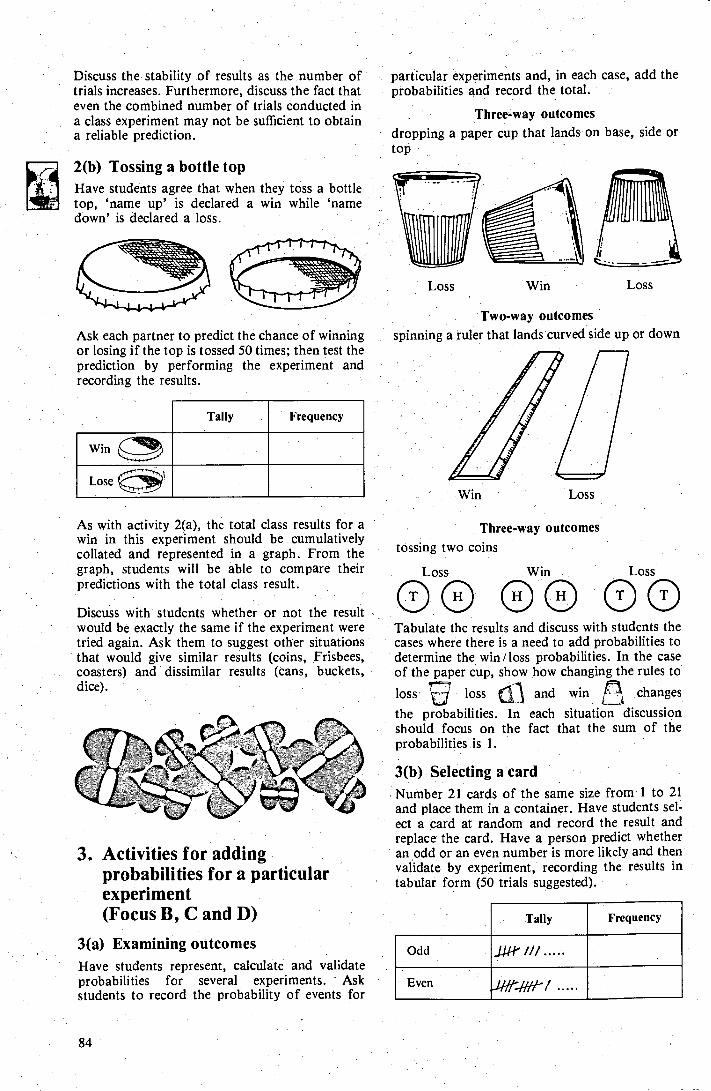
2(b) Tossing a bottle top Have students agree that when they toss a bottle top, `name up' is declared a win while `name down' is declared a loss.
Loss Win Loss
Ask each partner to predict the chance of winning or losing if the top is tossed 50 times; then test the prediction by performing the experiment and recording the results.
Frequency
Win
Lose
Two-way outcomes spinning a ruler that lands curved side up or down
Tally
Win Loss
Frequency Tally
Odd _ц 1- I// .....
Even _ielle /
Discuss the stability of results as the number of trials increases. Furthermore, discuss the fact that even the combined number of trials conducted in a class experiment may not be sufficient to obtain a reliable prediction.
particular experiments and, in each case, add the probabilities and record the total.
Three-way outcomes. dropping a paper cup that lands on base, side or top
As with activity 2(a), the total class results for a win in this experiment should be cumulatively collated and represented in a graph. From the graph, students will be able to compare their predictions with the total class result.
Discuss with students whether or not the result would be exactly the same if the experiment were tried again. Ask them to suggest other situations that would give similar results (coins, Frisbees, coasters) and dissimilar results (cans, buckets, dice).
3. Activities for adding probabilities for a particular experiment (Focus B, C and D)
3(а ) Examining outcomes Have students represent, calculate and validate probabilities for several experiments. Ask students to record the probability of events for
Three-way outcomes
tossing two coins
Loss Win
Loss
Tabulate the results and discuss with students the cases where there is a need to add probabilities to determine the win /loss probabilities. In the case of the paper cup, show how changing the rules to
loss loss and win changes
the probabilities. In each situation discussion should focus on the fact that the sum of the probabilities is 1.
3(b) Selecting a card Number 21 cards of the same size from 1 to 21 and place them in a container. Have students sel-ect a card at random and record the result and replace the card. Have a person predict whether an odd or an even number is more likely and then validate by experiment, recording the results in tabular form (50 trials suggested).
84
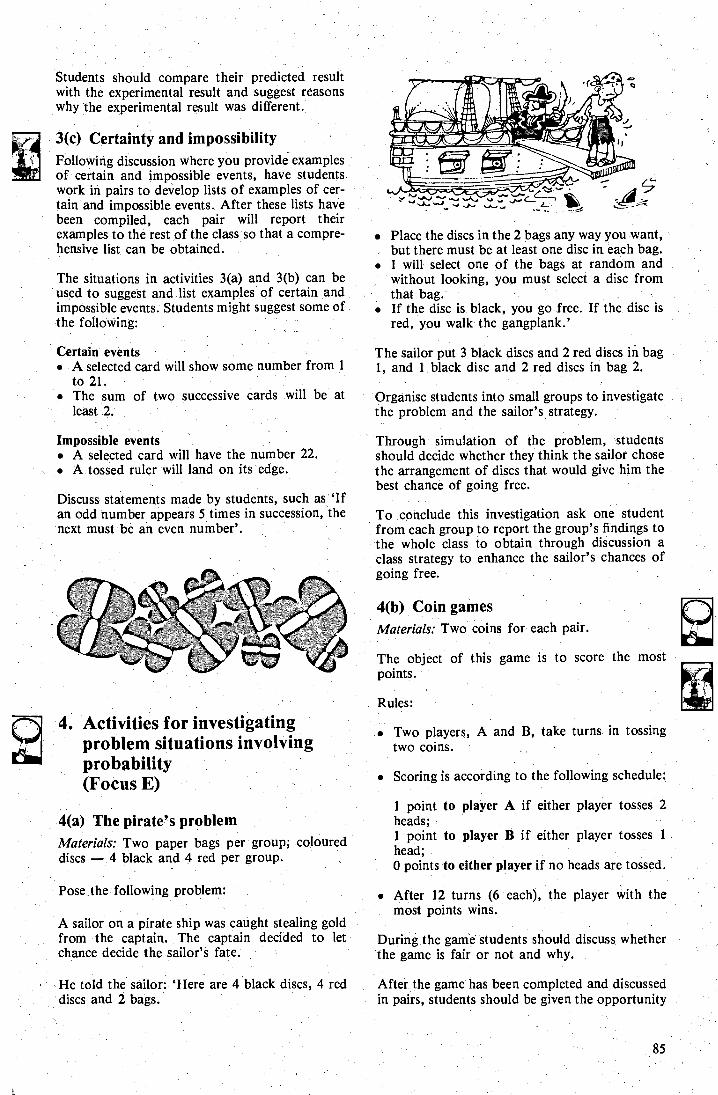
Students should compare their predicted result with the experimental result and suggest reasons why the experimental result was different.
3(c) Certainty and impossibility Following discussion where you provide examples of certain and impossible events, have students . work in pairs to develop lists of examples of cer-tain and impossible events. After these lists have been compiled, each pair will report their examples to the rest of the class so that a compre-hensive list can be obtained.
The situations in activities 3(a) and 3(b) can be used to suggest and list examples of certain and impossible events. Students might suggest some of the following:
Certain events • A selected card will show some number from 1
to 21. • The sum of two successive cards will be at
least 2.
Impossible events • A selected card will have the number 22. • A tossed ruler will land on its edge.
Discuss statements made by students, such as 'If an odd number appears 5 times in succession, the next must be an even number'.
4. Activities for investigating problem situations involving probability (Focus Е )
4(a) The pirate's problem Materials: Two paper bags per group; coloured discs — 4 black and 4 red per group.
Pose _ the following problem:
A sailor on a pirate ship was caught stealing gold from the captain. The captain decided to let. chance decide the sailor's fate.
He told the sailor: `Here are 4 black discs, 4 red discs and 2 bags.
• Place the discs in the 2 bags any way you want, but there must be at least one disc in each bag.
• I will select one of the bags at random and without looking, you must select a disc from that bag.
• If the disc is black, you go free. If the disc is red, you walk the gangplank.'
The sailor put 3 black discs and 2 red discs in bag 1, and 1 black disc and 2 red discs in bag 2.
Organise students into small groups to investigate the problem and the sailor's strategy.
Through simulation of the problem, students should decide whether they think the sailor chose the arrangement of discs that would give him the best chance of going free.
To conclude this investigation ask one student from each group to report the group's findings to the whole class to obtain through discussion a class strategy to enhance the sailor's chances of going free. .
4(b) Coin games Materials: Two coins for each pair.
The object of this game is to score the most points.
Rules:
Two players, A and B, take turns in tossing two coins.
• Scoring is according to the following schedule:,
1 point to player A if either player tosses 2 heads; 1 point to player B if either player tosses 1 head; 0 points to either player if no heads are tossed.
• After 12 turns (6 each), the player with the most points wins.
During the game students should discuss whether the game is fair or not and why.
After the game has been completed and discussed in pairs, students should be given the opportunity
85
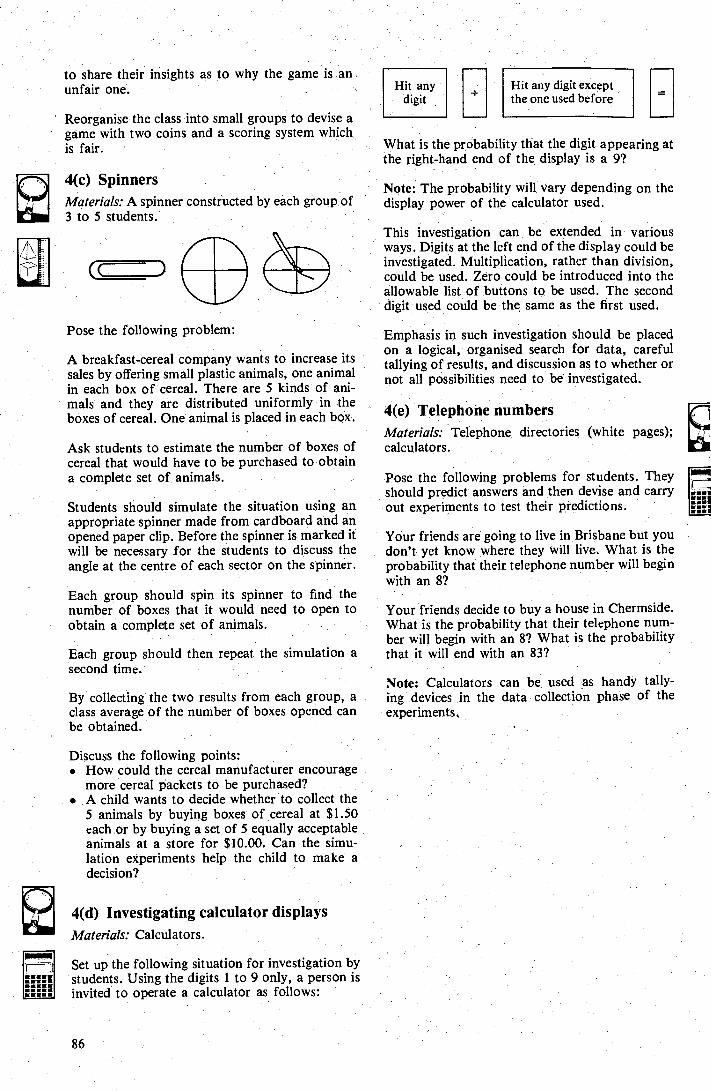
Hit any digit
What is the probability that the digit appearing at the right-hand end of the display is a 9?
Note: The probability will vary depending on the display power of the calculator used.
This investigation can be extended in various ways. Digits at the left end of the display could be investigated. Multiplication, rather than division, could be used. Zero could be introduced into the allowable list of buttons to be used. The second digit used could be the same as the first used.
Emphasis in such investigation should be placed on a logical, organised search for data, careful tallying of results, and discussion as to whether or not all possibilities need to be investigated.
4(e) Telephone numbers Materials: Telephone directories (white pages); calculators.
Pose the following problems for students. They should predict answers and then devise and carry out experiments to test their predictions.
Your friends are going to live in Brisbane but you don't yet know where they will live. What is the probability that their telephone number will begin with an 8?
Your friends decide to buy a house in Chermside. What is the probability that their telephone num-ber will begin with an 8? What is the probability that it will end with an 83?
Note: Calculators can be used as handy tally-ing devices in the data collection phase of the experiments.
Hit any digit except the one used before
Al
to share their insights as to why the game is an unfair one.
Reorganise the class into small groups to devise a game with two coins and a scoring system which is fair.
4(c) Spinners Materials: A spinner constructed by each group of 3 to 5 students.
Pose the following problem:
A breakfast-cereal company wants to increase its sales by offering small plastic animals, one animal in each box of cereal. There are 5 kinds of ani-mals and they are distributed uniformly in the boxes of cereal. One animal is placed in each box.
Ask students to estimate the number of boxes of cereal that would have to be purchased to obtain a complete set of animals.
Students should simulate the situation using an appropriate spinner made from cardboard and an opened paper clip. Before the spinner is marked it will be necessary for the students to discuss the angle at the centre of each sector on the spinner.
Each group should spin its spinner to find the number of boxes that it would need to open to obtain a complete set of animals.
Each group should then repeat the simulation a second time.
By collecting the two results from each group, a class average of the number of boxes opened can be obtained.
Discuss the following points: • How could the cereal manufacturer encourage
more cereal packets to be purchased? • A child wants to decide whether to collect the
5 animals by buying boxes of cereal at $1.50 each or by buying a set of 5 equally acceptable animals at a store for $10.00. Can the simu-lation experiments help the child to make a decision?
4(d) Investigating calculator displays Materials: Calculators.
Set up the following situation for investigation by students. Using the digits 1 to 9 only, a person is invited to operate a calculator as follows:
8б
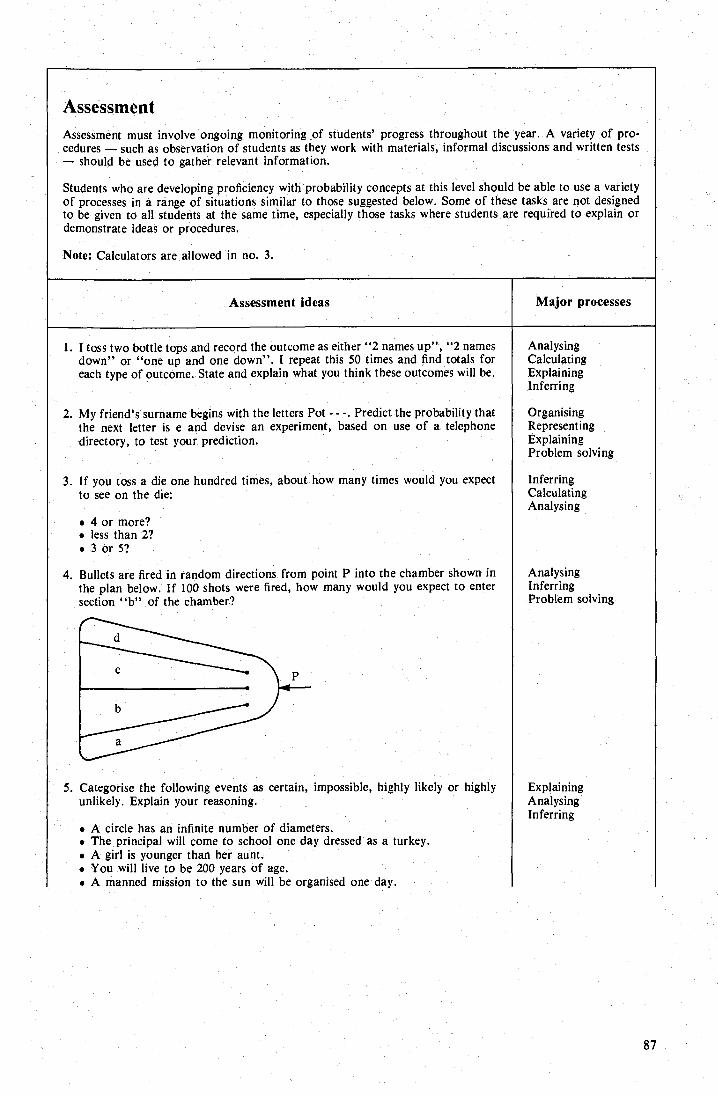
Assessment Assessment must involve ongoing monitoring of students' progress throughout the year. A variety of pro-cedures - such as observation of students as they work with materials, informal discussions and written tests — should be used to gather relevant information.
Students who are developing proficiency with probability concepts at this level should be able to use a variety of processes in a range of situations similar to those suggested below. Some of these tasks are not designed to be given to all students at the same time, especially those tasks where students are required to explain or demonstrate ideas or procedures.
Note: Calculators are allowed in no.
Major processes Assessment ideas
1. I toss two bottle tops and record the outcome as either "2 names up", "2 names down" or "one up and one down". I repeat this 50 times and find totals for each type of outcome. State and explain what you think these outcomes will be.
2. ly friend's surname begins with the letters Pot - - Predict the probability that the next letter is e and devise an experiment, based on use of a telephone directory, to test your prediction.
3. If you toss a die one hundred times, about how many times would you expect to see on the die:
• 4 or more? • less than 2? • 3 or 5?
4. Bullets are fired in random directions from point P into the chamber shown in the plan below. If 100 shots were fired, how many would you expect to enter section "b" of the chamber?
5. Categorise the following events as certain, impossible, highly likely or highly unlikely. Explain your reasoning.
• A circle has an infinite number of diameters. • The principal will come to school one day dressed as a turkey. • A girl is younger than her aunt. • You will live to be 200 years of age. • A manned mission to the sun will be organised one day.
Analysing Calculating Explaining Inferring
Organising Representing Explaining Problem solving
Inferring Calculating Analysing
Analysing Inferring Problem solving
Explaining Analysing Inferring
87
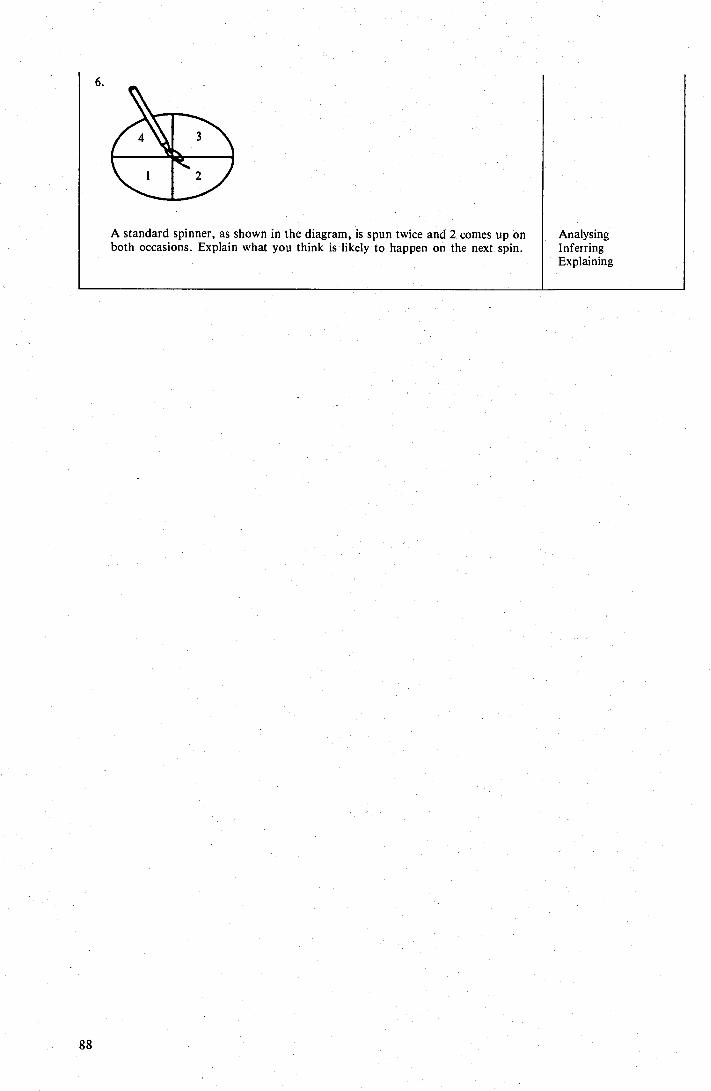
б .
A standard spinner, as shown in the diagram, is spun twice and 2 comes up on both occasions. Explain what you think is likely to happen on the next spin.
Analysing Inferring Explaining
88
Statistics
Contents
Focus for teaching, learning and assessment Notes for teachers 1. Activities for organising and representing data in appropriate
graphical forms (Focus A, C and D)
(a) Graphing temperature against time (b) Storytelling about graphs (c) Graphing sporting preferences
2. Activities for analysing measures of central tendency (Focus E and F)
(a) Using groups of students (b) Estimating means (c) Analysing data collected by students (d) Manipulating the mean (e) Estimating mean and range using computers
Activities for collecting and organising data to create and solve problems (Focus A, B, D and G)
(a) Focusing on problems (b) Focusing on samples (c) Focusing on data collection
4. Activities for reading and interpreting graphs'. (Focus C and G) .
(a) Collecting and discussing graphs (b) Open-ended interpretations
Activity sheets
Assessment
90
92
92 92 92 93
93
94
94 94
99
96
94 94
89
u Ё. е сö С
у
еö Е О о to u
ćö . . ..b .. аа С . Е b
а = 0
С í + ç Ř ,ç а •
а в.~ и..
й ..Чç.. 00 . О
ç Е Е b и
,ç Ř • и 4 e ... д л G
▪
• С и � '4; о • • о Е 0о
0
с •
:° Е • л «,. ø С ^
" ' 0д д у b й b iö 4) . р .
• •
д о ьи. С
Ó сçб Ь á
Ø'и у С1 0• .Y ..r С ..
О •
О • 0дй
áí и • А . м а С
0 Ú С ;vá
а
á b-
с
~ С О и О ď р
сЕиб.t 0 сд .
▪
OCL
O ~ сçб у 'î :О 0• Ø е„L„ ew cö д 00 G °3 С Ø^ . b . 'и С • :й еб
- • ь. fçб .й
2 а CO л й а, л
Е
О `Ú . D саö .С сб p С еö > ч .0. Uo ob • о • UE ¢._ ¢ .$d w w d ■ о
. I о ■ а Е
(Up
to a
nd
incl
ud
ing)
Yea
r 7
Rea
din
g a
nd
co
nstr
uct
ion
of
circ
le g
rap
hs.
• •
Foc
us f
or te
achi
ng, l
earn
ing
and
asse
ssm
ent
90
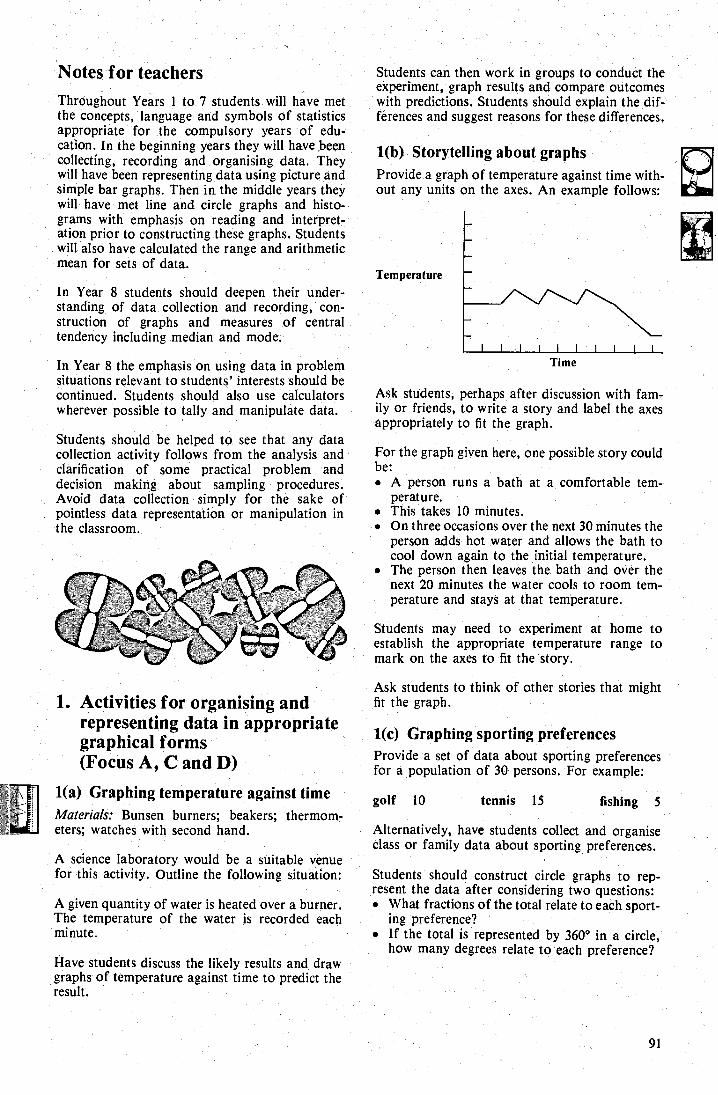
Temperature
Notes for teachers
Throughout Years 1 to 7 students will have met the concepts, language and symbols of statistics appropriate for the compulsory years of edu-cation. In the beginning years they will have been collecting, recording and organising data. They will have been representing data using picture and simple bar graphs. Then in the middle years they will have met line and circle graphs and histo-grams with emphasis on reading and interpret-ation prior to constructing these graphs. Students will also have calculated the range and arithmetic mean for sets of data.
In Year 8 students should deepen their under-standing of data collection and recording, con-struction of graphs and measures of central tendency including median and mode.
In Year 8 the emphasis on using data in problem situations relevant to students' interests should be continued. Students should also use calculators wherever possible to tally and manipulate data.
Students should be helped to see that any data collection activity follows from the analysis and clarification of some practical problem and decision making about sampling procedures. Avoid data collection simply for the sake of pointless data representation or manipulation in the classroom.
1. Activities for organising and representing data in appropriate graphical forms (Focus A, C and D)
1(a) Graphing temperature against time Materials: Bunsen burners; beakers; thermom-eters; watches with second hand.
A science laboratory would be a suitable venue for this activity. Outline the following situation:
A given quantity of water is heated over a burner. The temperature of the water is recorded each minute.
Have students discuss the likely results and draw graphs of temperature against time to predict the result.
Students can then work in groups to conduct the experiment, graph results and compare outcomes with predictions. Students should explain the dif-ferences and suggest reasons for these differences.
1(b) Storytelling about graphs Provide a graph of temperature against time with-out any units on the axes. An example follows:
Time
Ask students, perhaps after discussion with fam- ily or friends, to write a story and label the axes appropriately to fit the graph.
For the graph given here, one possible story could be: • A person runs a bath at a comfortable tem-
perature. • This takes 10 minutes. • On three occasions over the next 30 minutes the
person adds hot water and allows the bath to cool down again to the initial temperature.
• The person then leaves the bath and over the next 20 minutes the water cools to room tem-perature and stays at that temperature.
Students may need to experiment at home to establish the appropriate temperature range to mark on the axes to fit the story.
Ask students to think of other stories that might fit the graph.
1(с ) Graphing sporting preferences Provide a set of data about sporting preferences for a population of 30 persons. For example:
golf 10 tennis 15 fishing 5
Alternatively, have students collect and organise class or family data about sporting preferences.
Students should construct circle graphs to rep-resent the data after considering two questions: • What fractions of the total relate to each sport-
ing preference? • If the total is represented by 360° in a circle,
how many degrees relate to each preference?
91
ХХХХ б
ХХХХХХХХХ 7
ХХХХХ 8
ХХХХХ 9
45 65 24 45 71
62 41 53 30 49
23 35-19 40 28
37 53 14 59 27
81 26 45 63 7о
Students should then compare circle graphs with raw data and list some advantages and disadvan-tages of this form of representation. Ideas might include: • the value of a quick visual impression of data; • possible loss of detail; • use of colour to emphasise comparisons; • groups of different sizes to be graphed and
compared; • circle graphs, time consuming to construct.
2. Activities for analysing measures of central tendency (Focus E and F)
2(a) Using groups of students The measures of central tendency can be investi-gated using groups of students to represent data. For example, give students a 10-item general knowledge quiz and score their answers. Send students with particular scores to specific places in the classroom.
The mode can be identified by the group contain-ing the most students (7).
The need to find a sub-total for each group in order to find the total of all results is displayed visually.
To determine the median, arrange students in order from smallest score to largest.
Note: For an even number of items, the mean of the two scores in the middle is taken to be the median.
2(b) Estimating means Materials: Activity sheet 3.
Discuss briefly the uses for means, for example, sports scores, prices, monthly temperatures, rainfall.
Tell students that they will be required to make estimates of the mean of each of five sets of scores. Have the numbers written on A4 sheets using felt pen or on OHTs. Give the students about 20 seconds to make their estimate and after the last set, read out the correct answers and have students record their differences from the actual mean in terms of points.
Lists are:
Actual means: 29 38 47 57 50
Difference Points
1 or 0 2 3 4 5
5 4 3 2 1
Have students who obtain high scores, for example 4 or 5, explain how they made their orig-inal estimates. This emphasis on strategies is extremely important.
As an alternative, present students with the data in a different form, for example, $81, $26, $45, $63, $72.
Repeat the procedure and investigate if the indi-vidual estimates of the means improved or if students used different strategies. It could be more appropriate to use lengths of items or other mea-sures more relevant to students' needs and interests.
Activity sheet 3 provides further consolidation and practice to follow this activity.
2(c) Analysing data collected by students Materials: Activity sheet 3.
Collect data in the school or class group and pres-ent the information in a table to the students. Have them estimate the mean score of the group.
A
,. (С .: У ■1
92
Result out of 10 Number of students
0
4 3
10 12 9 7 б 5 3
o
2 3 4 5 б 7 8 9
10
Ask for suggestions for validating their estimates and have them calculate the mean and check against their estimate.
Tell students that particular scores, for example, the three scores of ten out of ten in the given table, are to be eliminated. Ask what effect that would have on the mean: Would it increase, decrease or stay the same? By how much would the mean change? Have students calculate the new mean and compare their result with their estimate of change.
Ask what scores could be eliminated to increase or decrease the mean.
Iń sist that students check with a calculator to test their conjectures. Ask whether two, three or four particular items can be deleted and the mean left unchanged.
Students should indicate where deletion or addition of results to a set of data might take place in a real-life situation.
2(d) Manipulating the mean Pose the following situation for investigation:
A student obtained the following results on a series of class tests — 48, 36, 58, 48. To obtain a satisfactory result overall, the student has to obtain an average result of 55 over 5 tests. Have students calculate the minimum result necessary on the next test to obtain this satisfactory result.
Ask students to list where this type of calculation might take place in a real-life situation. Situations could involve average earnings, savings plans or daily distance travelled on a journey.
Activity sheet 3 can be used for purposes o consolidation and practice.
2(e) Estimating mean and range using computers
Materials: Perfect Calc, Enter Mathematics Data Disk. - -
Using the materials above, students should carry out the following activity individually, in pairs or in small groups. • ` Load the file STAT1.PC. • Estimate the mean (arithmetic mean) or the.
scores for each of the three cricketers. • Calculate the range of scores for each player. • Enter the results in the appropriate cells on the
spreadsheet. • Page down with the PgDn key and compare the
estimates with the correct results. • Which player(s) has(have) the highest average
score? Which player(s) has(have) the highest score?
• Which measure, mean or range, would you use to determine the most consistent player?
• Explain why.
As an extension, some students may be able to develop their own spreadsheets on topics of interest to illustrate mean and range.
3. Activities for collecting and organising data to create and solve problems (Focus A, B, D and G)
There is great value in having students begin a statistical activity by concentrating on the prob-lem initially rather than commencing with data collection and manipulation.
Students should first consider three questions: • What is the specific nature of the problem? • What data should or can be collected? • What audience might be interested in the
conclusions?
Students should resolve these questions before commencing any data collection or statistical manipulation.
3(a) Focusing on problems Provide a problem relevant to the school as a basis for investigation. An example might be: Some students have said there are insufficient secure places at school to leave their bicycles. Consequently, students do not ride to school even though they would like to do so.
93
Divide the class into small groups to investigate how mathematics might be used to quantify, clarify and support solutions for the problem.
out surveys on samples and report back to the class. The results from different sampling procedures can be compared and analysed.
Group work can be enhanced by the appointment, in each group, of members with specific roles.
• Timekeeper — to keep the group to the task and to set the time limit.
• Recorder — to record decisions made by the group, how they will break up tasks and what deadlines will be set.
• Motivator — a manager, leader or chairperson to take responsibility to see that all members of the group are involved in the discussions and that all are contributing.
Some questions to help students focus on the application of statistical techniques are: • What is the problem? • How do we check if there is a problem? • How do we decide if it is a widespread
problem? • What data need to be collected? • What questions should be asked? • Who should be asked? • Who would be interested in the data collected? • How could data be organised and presented? • What sort of conclusions might we expect to
get? • Would a data collection exercise be worth the
effort?
If the outcomes of this activity are positive, students could go on to collect data and make a report to the appropriate people. The principal or the Parents and Citizens Association might be an audience for recommendations.
3(b) Focusing on samples Provide a problem of interest to students: A local fast-food business firm in your city, town or suburb decides to try advertising on television on Saturday night because rates are a bit cheaper then. It is interested in reaching the local audience and would like to know which station has the largest number of local viewers on that night.
A whole class discussion could give attention to a range of questions including: • Should every local person be interviewed? • Could every local person be interviewed? • What do we mean by a representative group? • How might a representative group be selected? • Would it be too costly to do a large group
survey? • Would a telephone survey, or a shopping mall
survey or a schoolyard survey be adequate?
If the problem turns out to be worth solving and if various sampling procedures are proposed, students could work in pairs or groups to carry
3(c) Focusing on data collection Materials: Activity sheets 1, 2.
After a worthwhile problem has been clarified and methods of selecting a representative sample finalised, data collection can begin.
Traffic flows, tuck-shop usage, library queues, travel costs, shopping surveys, physical fitness and many such areas have been used in problem solving in mathematics lessons. .
Before students collect data, questions to be resolved in the classroom include: • What accuracy in measurement or recording is
required? • How are data to be recorded and tallied? • How can calculators be used as tallying
devices?
When data have been collected, students should decide: . • How are data to be organised and amalga-
mated? • What graphical representations are to be used? • What is to be done with anomalous data items? • What measures are to be calculated (range,
mean, median, mode)?
Note: If students have access to computers or scientific calculators, some students might be interested in further data representation, and manipulation.
Activity sheets 1 and 2 can be used to provide starting points for a process of problem clarifi-cation, sampling and data collection.
4. Activities for reading and interpreting graphs (Focus C and G)
4(a) Collecting and discussing graphs Students can contribute to a display wall or scrap-book collection of interesting graphs.
Examples can be collected from old textbooks, newspapers and magazines, advertising material,
94
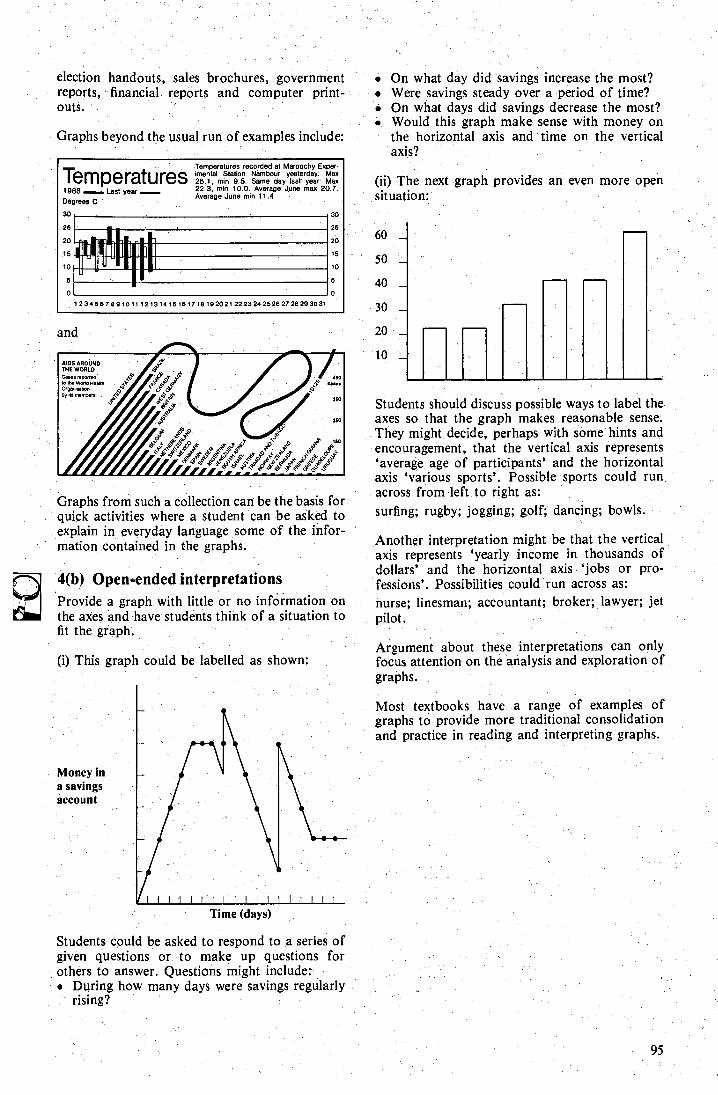
and
гу 4
} Т `
.... .. 760
ђ U &i р h
Р 150
760
А 103 AROUND THE WORLD о roØeĚ IC та WOW leAli' 011.1111.' by ы тет peл
Temperatures recorded at Meroochy Exper•
Tempе rat tres tmentв l Station NemO о yeatе rdey: Max i' 1J i U`lA res '25.1 , mín !з•.5. Same day 1eaY year: Мвх
1988 Last yeas ® 22.3, min 10.0. Average June max 20.7.
Degrees C - Average June min 11.4 ..
30
25
20
15
но
5
30
25
20
15
10
5
1 2 34 58 7 8 8 1011 12 1314 15 18 17 18 18 20 21 22 23 24 25 28 27 28 29 3031
0 0
Money in a savings account
/iti І iiiiittiiiiii Time (days)
election handouts, sales brochures, government reports, . financial reports and computer print-outs.
Graphs beyond the usual run of examples include:
Graphs from such a collection can be the basis for quick activities where a student can be asked to explain in everyday language some of the infor- mation contained in the graphs.
4(b) Open-ended interpretations Provide a graph with little or no information on the axes and have students think of a situation to fit the graph.
(i) This graph could be labelled as shown:
Students could be asked to respond to a series of given questions or to make up questions for others to answer. Questions might include: • During how many days were savings regularly
rising?
On what day did savings increase the most? • Were savings steady over a period of time? • On what days did savings decrease the most? ▪ Would this graph make sense with money on
the horizontal axis and time on the vertical axis?
(ii) The next graph provides an even more open situation:
60 -
50 -
40 _
30 _
20 _
10 -
Students should discuss possible ways to label the axes so that the graph makes reasonable sense. They might decide, perhaps with some hints and encouragement, that the vertical axis represents `average age of participants' and the horizontal axis `various sports'. Possible sports could run. across from left to right as: surfing; rugby; jogging; golf; dancing; bowls.
Another interpretation might be that the vertical axis represents `yearly income in thousands of dollars' and the horizontal axis `jobs or pro-fessions'. Possibilities could run across as: nurse; linesman; accountant; broker; lawyer; jet pilot.
Argument about these interpretations can only focus attention on the analysis and exploration of graphs.
Most textbooks have a range of examples of graphs to provide more traditional consolidation and practice in reading and interpreting graphs.
95
No. of hours 2 3 21 4 42 5 5 2 6 г
No. of students viewing
Activity sheet 1 Statistics 0
Survey of Year 8 night-time TV viewing
Class• Day of week:
Date•
Instructions:
For your viewing on the night chosen, round your viewing times to the nearest half hour.
Complete the following table:
Plot the information on the graph paper provided.
Use a column graph to represent the information.
1. Number of students surveyed in your class
2. Number of Year 8 students at your school
3. Using the information from your class, estimate the number of Year 8 students (at your school) who watched TV on the date above for:
(a) 0 hours (b) 3 hours (c) б hours
Construct a pie chart to display your results.
96
Activity Sleeping School Eating Sport TV
Approx. time (nearest hour)
Activity sheet 2 — Statistics
A day in the life of an average Year 8 student 1., With your teacher and classmates discuss your various activities for a period of 24 hours.
2. Come to some general agreement, or conduct a class survey, about the variety of activities and the average time spent on these by your class.
3. Complete the following table:.
4. On the grid below, construct a pie chart (or sector graph) to represent the day in the life of the average Year 8 student.
Label and shade your sectors carefully.
5. Discuss:
(a) Would the graph of a day in the life of a Year 12 student be similar to yours above?
(b) What would the graph of a day in the life of a six-month-old baby look like?
6 Draw graphs to describe what you believe to be a day in the life of a two-year-old toddler and of a retired grandparent about sixty-five years old.
97
Ratsperson Scores Estimate Difference Mean
Bob Rachel Dave Amanda Fred
23, 35, 19, 40, 26 37, 53, 14, 59, 28 62, 41, 53, 30,49 81, 26, 45, 63, 72 45, 65, 24, 45, 70
Total difference
Total difference Rating
А В C D E
0-5 6-10
11-15 16-20 21-25
Activity sheet 3 Statistics
Estimating the mean 1. (a) Over 5 innings of cricket Alan scored the following runs:
19, 22, 10, 17, 26. Using mathematics, he estimates his mean for the five innings to be 18. Explain in your own words why this is a reasonable estimate.
(b) Use your calculator to check Alan's estimate.
Answer here
2. The scores for other players in Alan's team are given below:
(a) Estimate their mean scores for the five innings.
(b) Use a calculator to find the actual mean for each player. Calculate the difference between your estimate and the actual mean. Total the differences and rate yourself as an estimator.
Rate yourself.
98
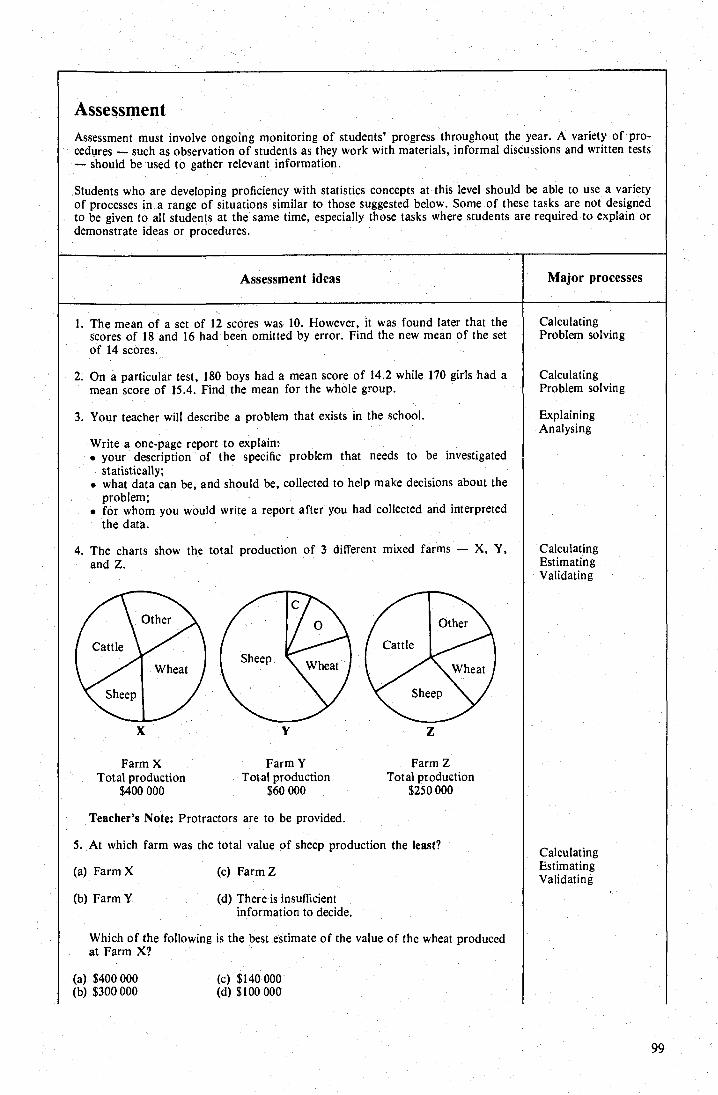
Assessment Assessment must involve ongoing monitoring of students' progress throughout the year. A variety of pro-cedures — such as observation of students as they work with materials, informal discussions and written tests — should be used to gather relevant information.
Students who are developing proficiency with statistics concepts at this level should be able to use a variety of processes in a range of situations similar to those suggested below. Some of these tasks are not designed to be given to all students at the same time, especially those tasks where students are required to explain or demonstrate ideas or procedures.
Major processes Assessment ideas
1. The mean of a set of 12 scores was 10. However, it was found later that the scores of 18 and 16 had been omitted by error. Find the new mean of the set of 14 scores.
2. On a particular test, 180 boys had a mean score of 14.2 while 170 girls had a mean score of 15.4. Find the mean for the whole group.
З . Your teacher will describe a problem that exists in the school.
Write a one-page report to explain: • your description of the specific problem that needs to be investigated
statistically; • what data can be, and should be, collected to help make decisions about the
problem; • for whom you would write a report after you had collected and interpreted
the data.
4. The charts show the total production of 3 different mixed farms - X, Y, and Z.
Calculating Problem solving
Calculating Problem solving
Explaining Analysing
Calculating Estimating Validating
Farm X Total production
$400 000
Farm Y Total production
$60 000
Farm Z Total production
$250 000
Teacher's Note: Protractors are to be provided.
5. At which farm was the total value of sheep production the least?
(a) Farm X (c) Farm Z
(b) Farm У (д ) There is insufficient information to decide.
Calculating Estimating Validating
Which of the following is the best estimate of the value of the wheat produced at Farm X?
(a) $400 000
(c) $140 000 (b) $300000
(d) $100 000
99
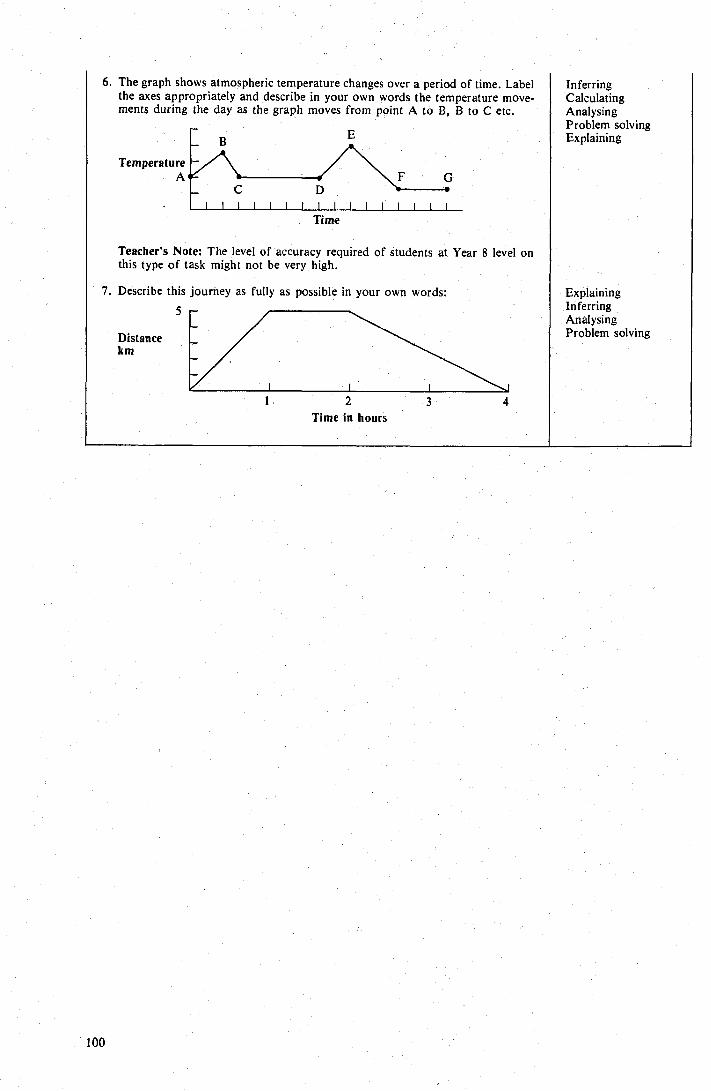
E
Temperature A _ C D
111111 г г г г г i Ili г Time
2 Time in hours
6. The graph shows atmospheric temperature changes over a period of time. Label the axes appropriately and describe in your own words the temperature move-ments during the day as the graph moves from point A to В , В to C etc.
Teacher's Note: The level of accuracy required of students at Year 8 level on this type of task might not be very high.
7. Describe this journey as fully as "possible in your own words:
Distance km
Inferring Calculating Analysing Problem solving Explaining
Explaining Inferring Analysing Problem solving
100
Contents
Focus for teaching, learning and assessment Notes for teachers 1. Activities for pattern searching
(Focus A and В ) (a) Number patterns (b) Spatial patterns (c) Magic squares
2. Activities for applying given rules (Focus A and B)
(a) Applying a rule to a given starting number (b) Applying a rule to a given starting shape (с ) Generating a shape pattern (d) Investigating three-dimensional shapes (e) Applying rules to real data
3 , Activities for finding rules (Focus A and B)
(a) Describing output as a set of numbers (b) Describing output in ordinary language (c) Deicribing output using diagrams
105 106 106
106 106
1о 7
4. Activities for operating on variables (Focus A and B)
(a) Using verbal instructions (b) Giving rules by example
5. Activities for creating problems with numbers (Focus C)
(a) Creating problems using real data (b) Problems on the hundreds board
Activity sheets
Yea
rs 9
and
10
а ) . -. >
.. . й Ń .. и N О н .у >
с 3 ° б c° x •° 'у . и а) ( ь 4). й t
к ti и
o
.✓ . V . . С О СО
c..,v
к o
с .— 3 и
i и. .. - . ď р , О '0 в +
с • , Ć î F. Е . b0 ' ' 4) с
С а i ;_. - ь + q)
- и с )
-. ь +
а ) ¶ О D
сб сб Я сб .д и ь. ø. й од - O Е О л од ° b в
Я Е Е .5.; б сЯС
b 3.b ce.. 7 O 'и ?? + и o и C . и o Ń O .. O 'б ш V.0 + С С И и и С: О . G ь, сд . 'r w ь. .2.. О > VИ , и -Сч и to , •, сб r.
~ • а ) O н О'
-., Я . bо _ O. сб С1. й с б
.0 3_
3 •^ . б С •3
•С
— ' О С С аЯ) С a0) 'vî ОС •Ø С о . .> в + • !‚ ť3. сб o Ø С О д _ ca >
W С . W ь . . .• • • гЯ-. С .
Q Са U . . E
Exp
erie
nce
for
all s
tude
nts
.
(Up
to
and
incl
udi
ng) Y
ear
7
U 3 •
Foc
us f
or t
each
ing,
lea
rnin
g an
d as
sess
men
t
i 02
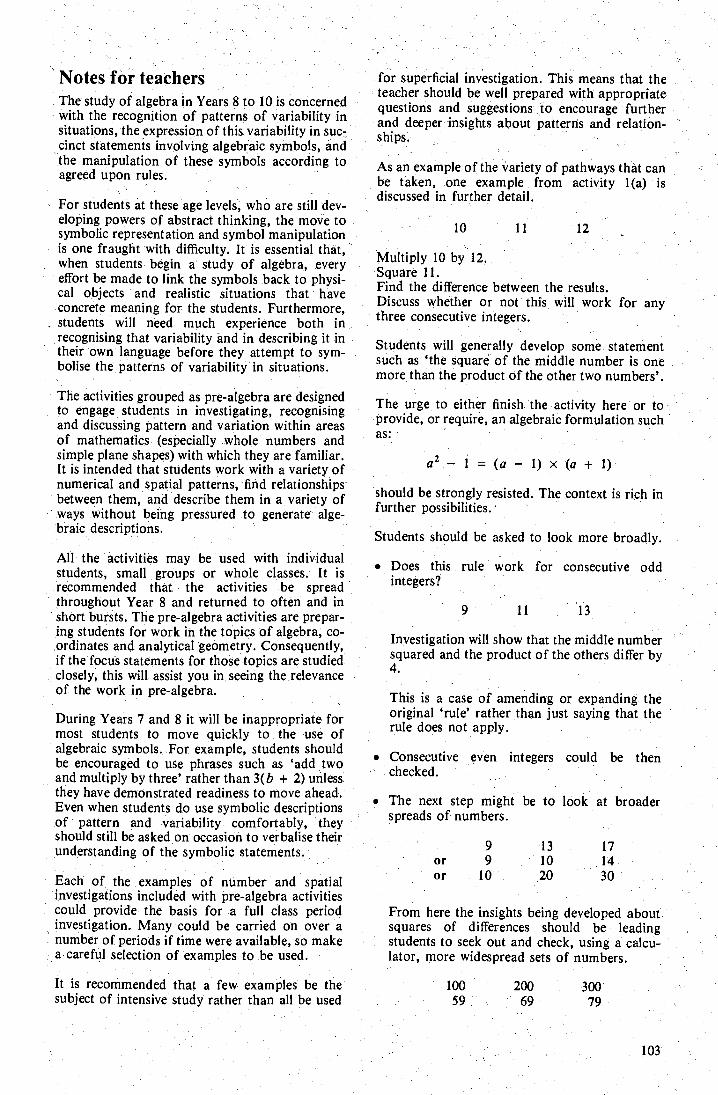
103
Notes for teachers The study of algebra in Years 8 to 10 is concerned with the recognition of patterns of variability in situations, the expression of this variability in suc-cinct statements involving algebraic symbols, and the manipulation of these symbols according to agreed upon rules.
For students at these age levels, who are still dev-eloping powers of abstract thinking, the move to symbolic representation and symbol manipulation is one fraught with difficulty. It is essential that, when students begin a study of algebra, every effort be made to link the symbols back to physi-cal objects and realistic situations that have concrete meaning for the students. Furthermore, students will need much experience both in recognising that variability and in describing it in their own language before they attempt to sym-bolise the patterns of variability in situations.
The activities grouped as pre-algebra are designed to engage students in investigating, recognising and discussing pattern and variation within areas of mathematics (especially whole numbers and simple plane shapes) with which they are familiar. It is intended that students work with a variety of numerical and spatial patterns, find relationships between them, anddescribe them in a variety of ways without being pressured to generate alge-braic descriptions.
All the activities may be used with individual students, small groups or whole classes. It is recommended that the activities be spread throughout Year 8 and returned to often and in short bursts. The pre-algebra activities are prepar-ing students for work in the topics of algebra, co-ordinates and analytical geometry. Consequently, if the focus statements for those topics are studied closely, this will assist you in seeing the relevance of the work in pre-algebra.
During Years 7 and 8 it will be inappropriate for most students to move quickly to the use of algebraic symbols. For example, students should be encouraged to use phrases such as `add two and multiply by three' rather than 3(b + 2) unless they have demonstrated readiness to move ahead. Even when students do use symbolic descriptions of pattern and variability comfortably, they should still be asked on occasion to verbalise their understanding of the symbolic statements.
Each of the examples of number and spatial investigations included with pre-algebra activities could provide the basis for a full class period investigation. Many could be carried on over a number of periods if time were available, so make a careful selection of examples to be used.
It is recommended that a few examples be the subject of intensive study rather than all be used
for superficial investigation. This means that the teacher should be well prepared with appropriate questions and suggestions to encourage further and deeper insights about patterns and relation-ships.
As an example of the variety of pathways that can be taken, one example from activity 1(a) is discussed in further detail.
10 11 12
Multiply 10 by 12. Square 11. Find the difference between the results. Discuss whether or not this will work for any three consecutive integers.
Students will generally develop some statement. such as `the square of the middle number is one more than the product of the other two numbers'.
The urge to either finish the activity here or to provide, or require, an algebraic formulation such as:
1 = (a — 1) x (a + 1)
should be strongly resisted. The context is rich in further possibilities. •
Students should be asked to look more broadly.
•
Does this rule work for consecutive odd integers?
11
13
Investigation will show that the middle number squared and the product of the others differ by 4.
This is a case of amending or expanding the original `rule' rather than just saying that the rule does not apply.
• Consecutive even integers could be then checked.
• The next step might be to look at broader spreads of numbers.
9
13 17 or 9
10 14 or 10
20 30
From here the insights being developed about squares of differences should be leading students to seek out and check, using a calcu-lator, more widespread sets of numbers.
100 200 300 59 ' 69 79
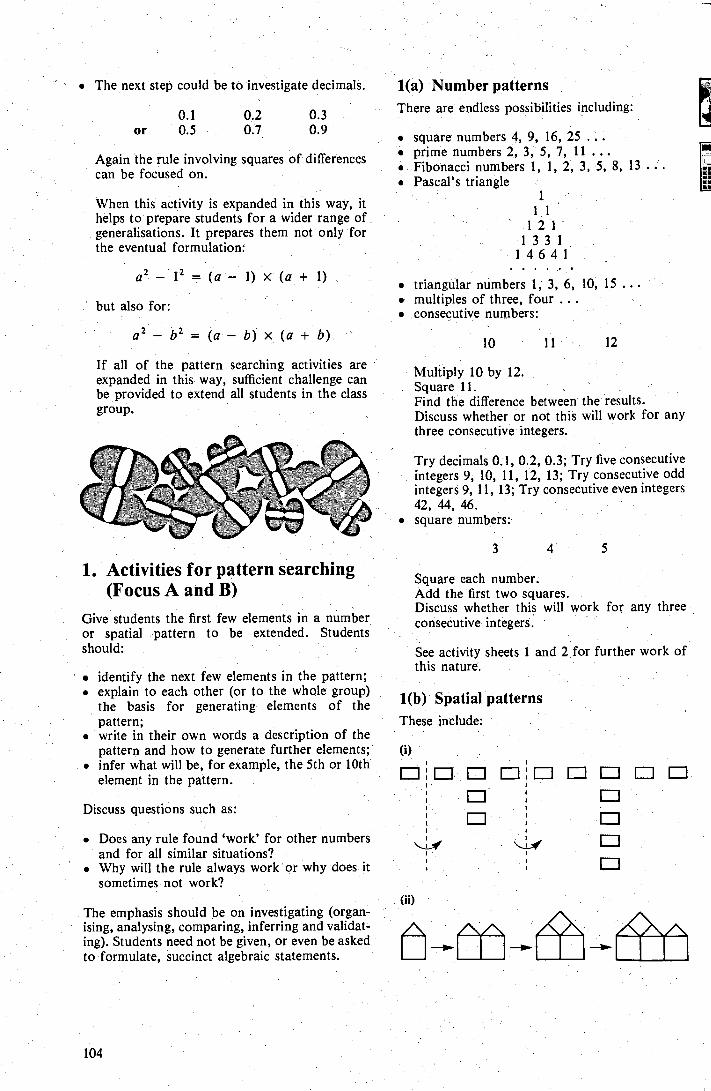
• The next step could be to investigate decimals. 1(a) Number patterns
0.1
0.2 0.3 There are endless possibilities including:
or 0.5 0.7 0.9
Again the rule involving squares of differences can be focused on.
When this activity is expanded in this way, it. helps to prepare students for a wider range of ... generalisations. It prepares them not only for the eventual formulation:
a2.-12 (a-1) х (a +1)
but also for:
a2 —b2 = (a — b) х (a+b)
If all of the pattern searching activities are expanded in this way, sufficient challenge can be provided to extend all students in the class group.
1. Activities for pattern searching (Focus A and B)
Give students the first few elements in a number or spatial pattern to be extended. Students should:
• identify the next few elements in the pattern; • explain to each other (or to the whole group)
the basis for generating elements of the pattern;
• write in their own words a description of the pattern and how to generate further elements;
• infer what will be, for example, the 5th or 10th element in the pattern.
Discuss questions such as:
• Does any rule found `work' for other numbers and for all similar situations?
• Why will the rule always work or why does it sometimes not work?
The emphasis should be on investigating (organ-ising, analysing, comparing, inferring and validat-ing). Students need not be given, or even be asked to formulate, succinct algebraic statements.
▪ square numbers 4, 9, 16, 25 . prime numbers 2, 3, 5, 7, 11 . . . . Fibonacci numbers 1, 1, 2, 3, 5, 8, 13 . • Pascal's triangle
1 1 1
121 1 33 1
1 464 1
• triangular numbers 1, 3, 6, 10, 15 . . • multiples of three, four .. . • consecutive numbers:
10 11 12
Multiply 10 by 12. Square 11. Find the difference between the results. Discuss whether or not this will work for any three consecutive integers.
Try decimals 0.1, 0.2, 0.3; Try five consecutive integers 9, 10, 11, 12, 13; Try consecutive odd integers 9, 11, 13; Try consecutive even integers 42, 44, 46.
• square numbers:
3
Square each number. Add the first two squares. Discuss whether this will work for any three consecutive integers.
See activity sheets 1 and 2 for further work of this nature.
1(b) Spatial patterns These include:
(i)
104
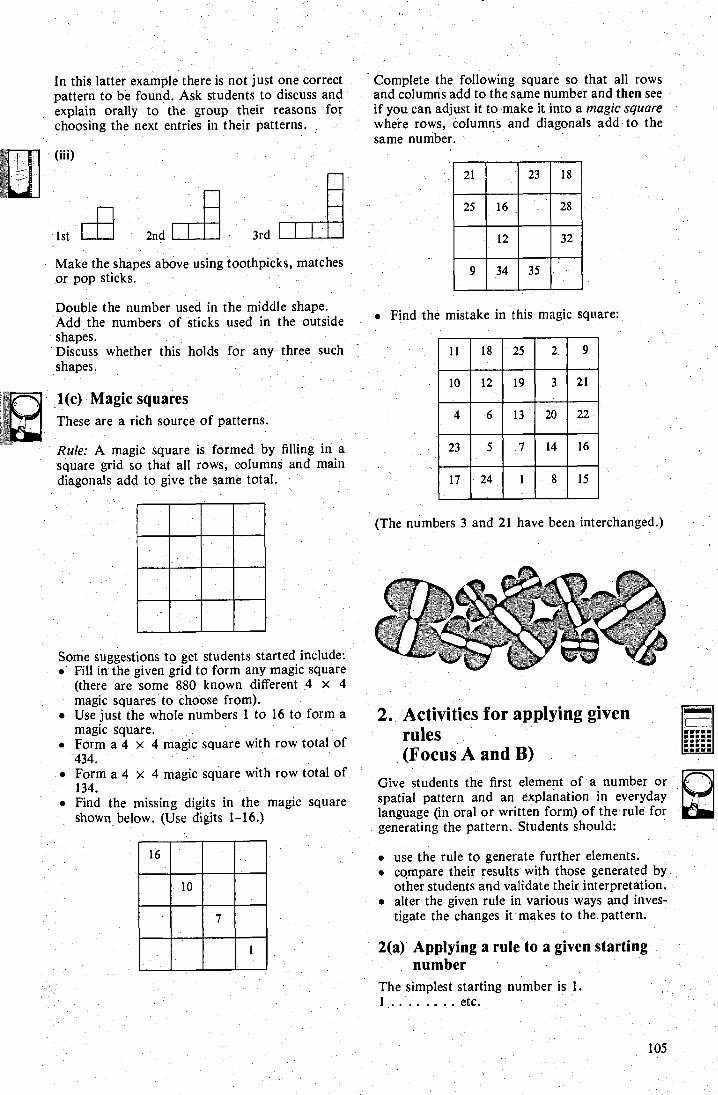
In this latter example there is not just one correct pattern to be found. Ask students to discuss and explain orally to the group their reasons for choosing the next entries in their patterns.
Complete the following square so that all rows and columns add to the same number and then see if you can adjust it to make it into a magic square where rows, columns and diagonals add to the same number.
1st
Make the shapes above using toothpicks, matches or pop sticks.
Double the number used in the middle shape. Add the numbers of sticks used in the outside shapes. Discuss whether this holds for any three such shapes.
Some suggestions to get students started include: . Fill in the given grid to form any magic square
(there are some 880 known different 4 x 4 magic squares to choose from).
• Use just the whole numbers 1 to 16 to form a magic square.
• Form a 4 x 4 magic square with row total of 434.
• Form a 4 x 4 magic square with row total of 134.
. Find the missing digits in the magic square shown below. (Use digits 1-16.)
Find the mistake in this magic square:
(The numbers 3 and 21 have been interchanged.)
2. Activities for applying given rules (Focus A and B)
Give students the first element of a number or spatial pattern and an explanation in everyday language (in oral or written form) of the rule for generating the pattern. Students should:
. use the rule to generate further elements. • compare their results with those generated by
other students and validate their interpretation. • alter the given rule in various ways and inves-
tigate the changes it makes to the pattern.
2(a) Applying a rule to a given starting number
The simplest starting number is 1. 1 .... etc.
105
1(c) Magic squares These are a rich source of patterns.
Rule: A magic square is formed by filling in a square grid so that all rows, columns and main diagonals add to give the same total.
1 б
10
7
1
23 18 21
16 28 25
12 32
9 35 34
9 2 18 25.
3 21 19 12 10
б 22 20 13 4
5 16 14 7 23
8 15 1 24 17
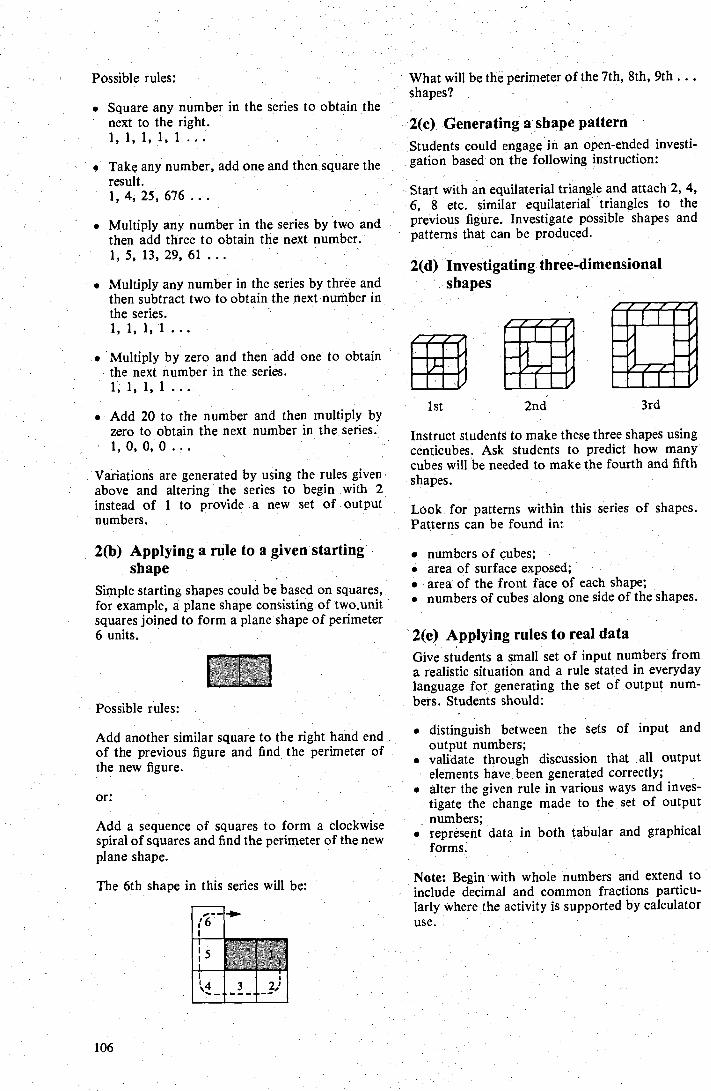
Possible rules: What will be the perimeter of the 7th, 8th, 9th .. .
shapes? • Square any number in the series to obtain the
next to the right. 1,1,1,1,1...
• Take any number, add one and then square, the result. 1, 4, 25, 676 .
• Multiply any number in the series by two and then add three to obtain the next number. 1, 5, 13, 29, 61 .. ,
• Multiply any number in the series by three and then subtract two to obtain the next number in the series. 1,1,1,1...
• Multiply by zero and then add one to obtain the next number in the series. 1, 1, 1, 1 ...
• Add 20 to the number and then multiply by zero to obtain the next number in the series. 1,0,0,0...
Variations are generated by using the rules given above and altering the series to begin with 2 instead of 1 to provide - a new set of output numbers.
2(b) Applying a rule to a given starting shape
Simple starting shapes could be based on squares, for example, a plane shape consisting of two.unit squares joined to form a plane shape of perimeter 6 units.
Possible rules:
Add another similar square to the right hand end .: of the previous figure and find the perimeter of the new figure.
or:
Add a sequence of squares to form a clockwise spiral of squares and find the perimeter of the new plane shape.
The 6th shape in this series will be:
2(c) Generating a shape pattern Students could engage in an open-ended investi-gation based on the following instruction:
Start with an equilaterial triangle and attach 2, 4, 6, 8 etc. similar equilaterial triangles to the previous figure. Investigate possible shapes and patterns that can be produced.
2(d) Investigating three-dimensional shapes •
ist 2nd 3rd
Instruct students to make these three shapes using centicubes. Ask students to predict how many cubes will be needed to make the fourth and fifth shapes.
Look for patterns within this series of shapes. Patterns can be found in:
• numbers of cubes; • area of surface exposed; • area of the front face of each shape; • numbers of cubes along one side of the shapes.
2(e) Applying rules to real data Give students a small set of input numbers from a realistic situation and a rule stated in everyday language for generating the set of output num-bers. Students should:
• distinguish between the sets of input and output numbers;
• validate through discussion that all output elements have been generated correctly;
• alter the given rule in various ways and inves-tigate the change made to the set of output numbers;
• represent data in both tabular and graphical forms.
Note: Begin with whole numbers and extend to include decimal and common fractions particu-larly where the activity is supported by calculator use.
106
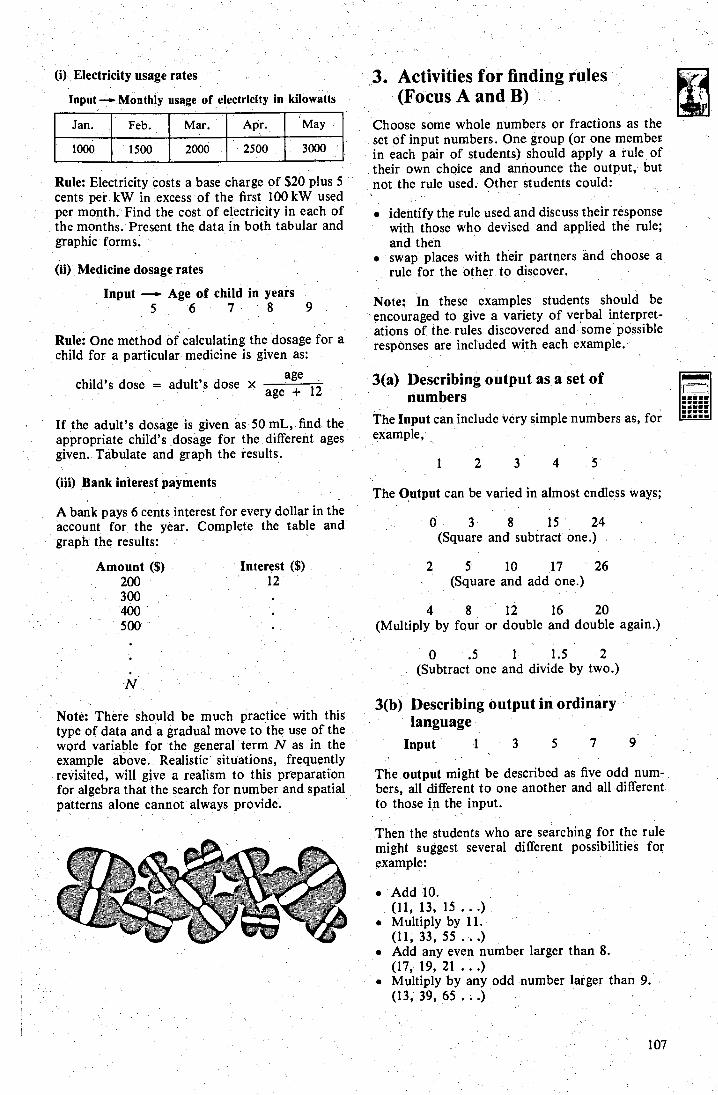
Feb. Jan. Mar. Apr. May
3000 1000 2000 2500 1500
107
(i) Electricity usage rates
Input Monthly usage of electricity in kilowatts
Rule: Electricity costs a base charge of $20 plus 5 cents per kW in excess of the first 100 kW used per month. Find the cost of electricity in each of the months. Present the data in both tabular and graphic forms.
(ii) Medicine dosage rates
Input Age of child in years 5 6 7 8 9
Rule: One method of calculating the dosage for a. child for a particular medicine is given as:
child's dose = adult's dose x age
age + 12
If the adult's dosage is given as 50 mL, find the appropriate child's dosage for the different ages given. Tabulate and graph the results.
(iii) Bank interest payments
A bank pays 6 cents interest for every dollar in the account for the year. Complete the table and graph the results:
Amount ($) Interest ($) 200 12 300 400 500 .
3. Activities for finding rules (Focus A ап d B)
Choose some whole numbers or fractions as the set of input numbers. One group (or one member in each pair of students) should apply a rule of their own choice and announce the output, but not the rule used. Other students could:
. identify the rule used and discuss their response with those who devised and applied the rule; and then
• swap places with their partners and choose a rule for the other to discover.
Note: In these examples students should be encouraged to give a variety of verbal interpret-ations of the rules discovered and some possible responses are included with each example.
3(a) Describing output as a set of numbers
The Input can include very simple numbers as, for example,
1 2 3 4
The Output can be varied in almost endless ways;
0 3 8 15 24 (Square and subtract one.)
5 10 17 26 (Square and add one.)
4 8 12 16. 20 (Multiply by four or double and double again.)
0 .5 1 1.5 2 (Subtract one and divide by two.)
Note: There should be much practice with this type of data and a gradual move to the use of the word variable for the general term N as in the example above. , Realistic situations, frequently revisited, will give a realism to this preparation for algebra that the search for number and spatial patterns alone cannot always provide.
3(b) Describing output in ordinary language
Input 1 3 5 7 9
The output might be described as five odd num-bers, all different to one another and all different to those in the input.
Then the students who are searching for the rule might suggest several different possibilities for example:
• Add 10. (11, 13, 15 ...)
• Multiply by 11. (11, 33, 55 ...)
• Add any even number larger than 8. (17, 19, 21 ...)
. Multiply by any odd number larger than 9. (13,39, 65 ...)
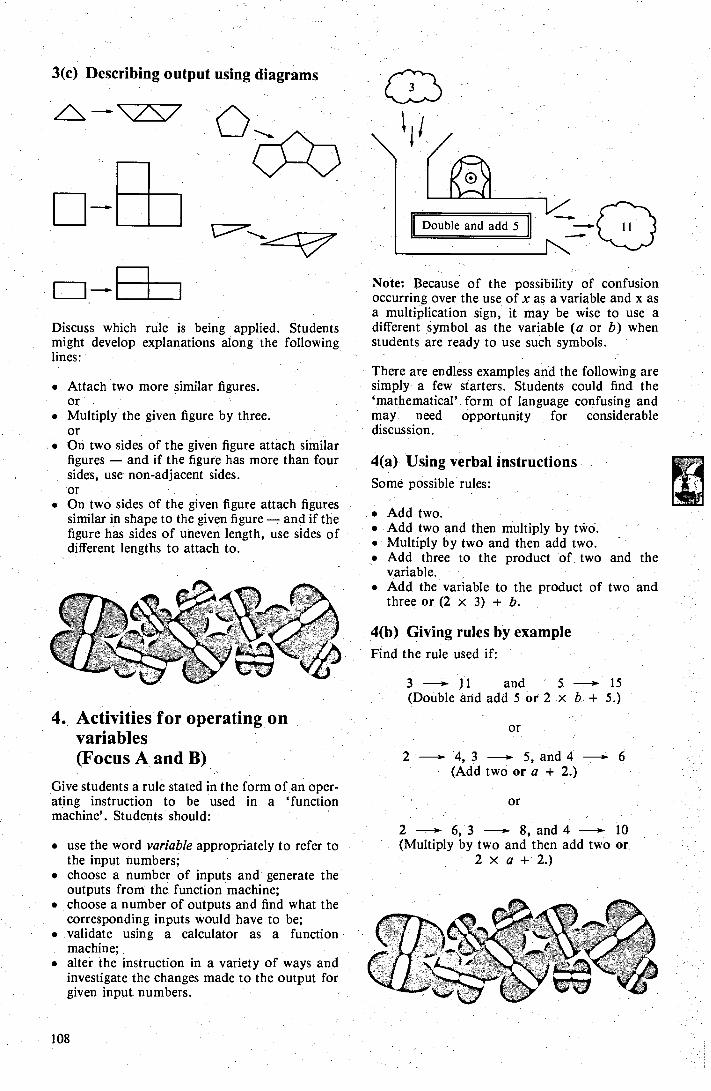
3(c) Describing output using diagrams
Double and add 5
—
Discuss which rule is being applied. Students might develop explanations along the following lines: .
Note: Because of the possibility of confusion occurring over the use of x as a variable and x as a multiplication sign, it may be wise to use a different symbol as the variable (a or b) when students are ready to use such symbols.
• Attach two more similar figures. or
• Multiply the given figure by three. or
• On two sides of the given figure attach similar figures — and if the figure has more than four sides, use non-adjacent sides. or
• On two sides of the given figure attach figures similar in shape to the given figure — and if the figure has sides of uneven Iength, use sides of different lengths to attach to.
4. Activities for operating on variables (Focus A and В )
Give students a rule stated in the form of an oper-ating instruction to be used in a `function machine'. Students should:
There are endless examples and the following are simply a few starters. Students could find the `mathematical'. form of language confusing and may need opportunity for considerable discussion.
4(a) Using verbal instructions Same possible rules:
• Add two. • Add two and then multiply by two. • Multiply by two and then add two. • Add three to the product of . two and the
variable. . Add the variable to the product of two and
three or (2 x 3) + b.
4(b) Giving rules by example Find the rule used if:
3 -> 11 and 5 —' 15 (Double and add 5 or 2 x Ь + 5.)
or
2 4, 3 —. 5, and 4 — б (Add two or a + 2.)
or
• use the word variable appropriately to refer to the input numbers;
• choose a number of inputs and generate the outputs from the function machine;
• choose a number of outputs and find what the corresponding inputs would have to be;
• validate using a calculator as a function machine;
• alter the instruction in a variety of ways and investigate the changes made to the output for given input numbers.
2 — 6, 3 —ł 8, and 4 --ł 10 (Multiply by two and then add two or
2 х a ± 2.)
108
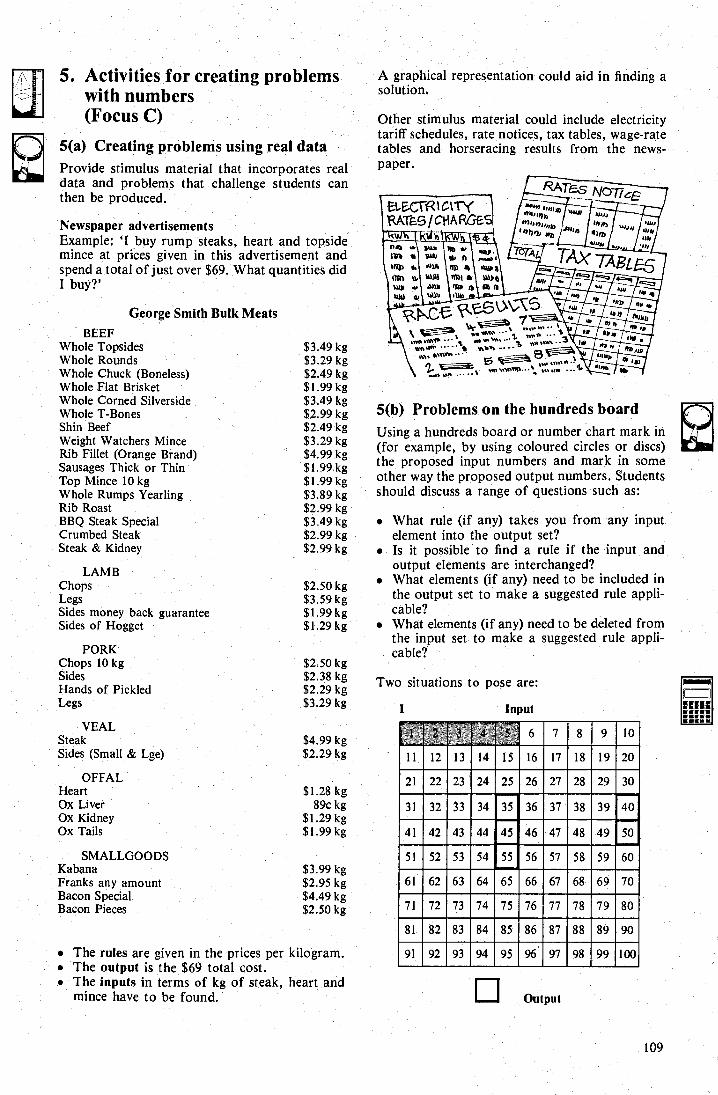
11
23 21 22 24
33 34
44 43
74
84
73
83
57 56
93 95 96 94
5. Activities for creating problems with numbers (Focus C)
5(a) Creating problems using real data Provide stimulus material that incorporates real data and problems that challenge students can then be produced.
Newspaper advertisements Example: `I buy rump steaks, heart and topside mince at prices given in this advertisement and spend a total of just over $69. What quantities did I buy?'
George Smith Bulk Meats
BEEF Whole Topsides Whole Rounds Whole Chuck (Boneless) Whole Flat Brisket Whole Corned Silverside Whole T-Bones Shin Beef Weight Watchers Mince Rib Fillet (Orange Brand) Sausages Thick or Thin Top Mince 10 kg Whole Rumps Yearling Rib Roast BBQ Steak Special Crumbed Steak Steak & Kidney
LAMB Chops Legs Sides money back guarantee Sides of Hogget
PORK Chops 10 kg Sides Hands of Pickled Legs
VEAL Steak $4.99 kg Sides (Sma11 & Lge) $2.29 kg
OFFAL Heart $1.28 kg Ox Liver 89с kg Ox Kidney $1.29 kg Ox Tails $1.99 kg
A graphical representation could aid in finding a solution.
Other stimulus material could include electricity tariff schedules, rate notices, tax tables, wage-rate tables and horseracing results from the news-paper.
м „nu
1
+1и
5(b) Problems on the hundreds board Using a hundreds board or number chart mark in (for example, by using coloured circles or discs) the proposed input numbers and mark in some other way the proposed output numbers. Students should discuss a range of questions such as:
• What rule (if any) takes you from any input element into the output set?
• Is it possible to find a rule if the input and output elements are interchanged?
• What elements (if any) need to be included in the output set to make a suggested rule appli-cable?
• What elements (if any) need to be deleted from the input set to make a suggested rule appli-cable?
Two situations to pose are:
Input
10
11 12 13 14 15 16
25 26
31 32
41 42
$3.49 kg $3.29 kg $2.49 kg $1.99 kg $3.49 kg $2.99 kg $2.49 kg $3.29 kg $4.99 kg $1.99 kg $1.99 kg $3.89 kg $2.99 kg $3.49 kg $2.99 kg $2.99 kg
$2.50 kg $3.59 kg $1.99 kg $1.29 kg
$2.50 kg $2.38 kg $2.29 kg $3.29 kg
E1,EGГ R1G1Tti( MATES / Cł iARGE
в 3^J71. ► h ► n u Mви ро w . . 1"!Д bi w NW v4 д ,.w1
пА а + 1ro W1) i1m 1L ‚g гп 11 • иИр
W д ,ц па ПØø
Ø YW ц/ 'doe ®® вь гнгр .Се ØØ7 .
7 - • лбб u nwu
Ø м ,ь no,,. ť !® ц r, li,1
.м .мР .... . м мви ....1 ®I ® ...з .....; ..дил ... пи
.Ч . 1,Чвип ... • , . в ØB :: •®Ø. . r un . ...\ .м øм nn.. •
Aм „p іЮ tY цщ М
«_и . D 1111А
•
ц l у
Р 'АТ NOTicE
M )ф
• чц
Т г 7Дв с gС
I
6 7 8 9
17 18 19 20
27 28 29 30
36 37 38 39 40
46 47 48 д 9' 50
SMALLGOODS Kabana Franks any amount Bacon Special Bacon Pieces
$3.99 kg $2.95 kg $4.49 kg $2.50 kg
51 52
61 62
71 72
81 82
91 92
58 59
65 б 6
75 76 77
85 86
97
Output
53 54
63 64
• The rules are given in the prices per kilogram. • The output is the $69 total cost. • The inputs in terms of kg of steak, heart and
mince have to be found.
60
67 68 69 70
78 79 80
87 88 89 90
98 99 100
1пђФ
109
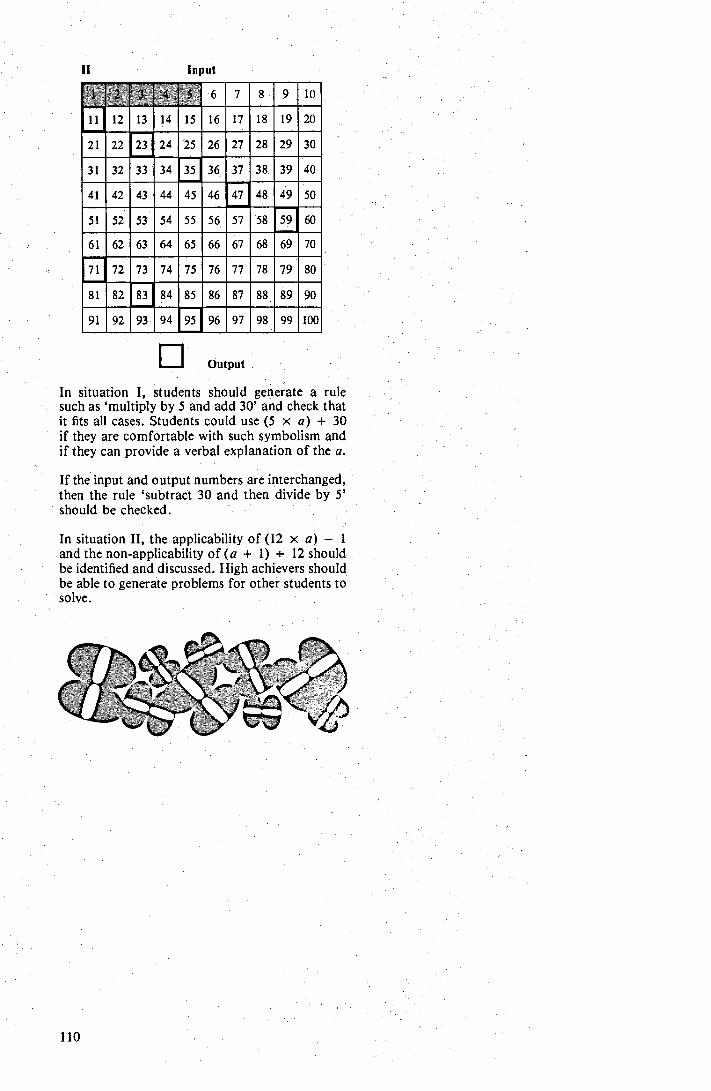
61 70 69 62 66 67 68
16
26
36
46
56
19
29
39
49
59
10
20
30
40
50
60
б 3 65
ФФФФФ ФФФФФ
80
86 87 88 89 90
91 92 93 94 95 96 97 98 99 100
ФФ 79 76
Input
D Output
In situation I, students should generate a rule such as `multiply by 5 and add 30' and check that it fits all cases. Students could use (5 x a) + 30 if they are comfortable with such symbolism and if they can provide a verbal explanation of the a.
If the input and output numbers are interchanged, then the rule `subtract 30 and then divide by 5' should be checked.
In situation II, the applicability of (12 х a) — 1 and the non-applicability of (a + 1) _ 12 should be identified and discussed. High achievers should be able to generate problems for other students to solve.
110
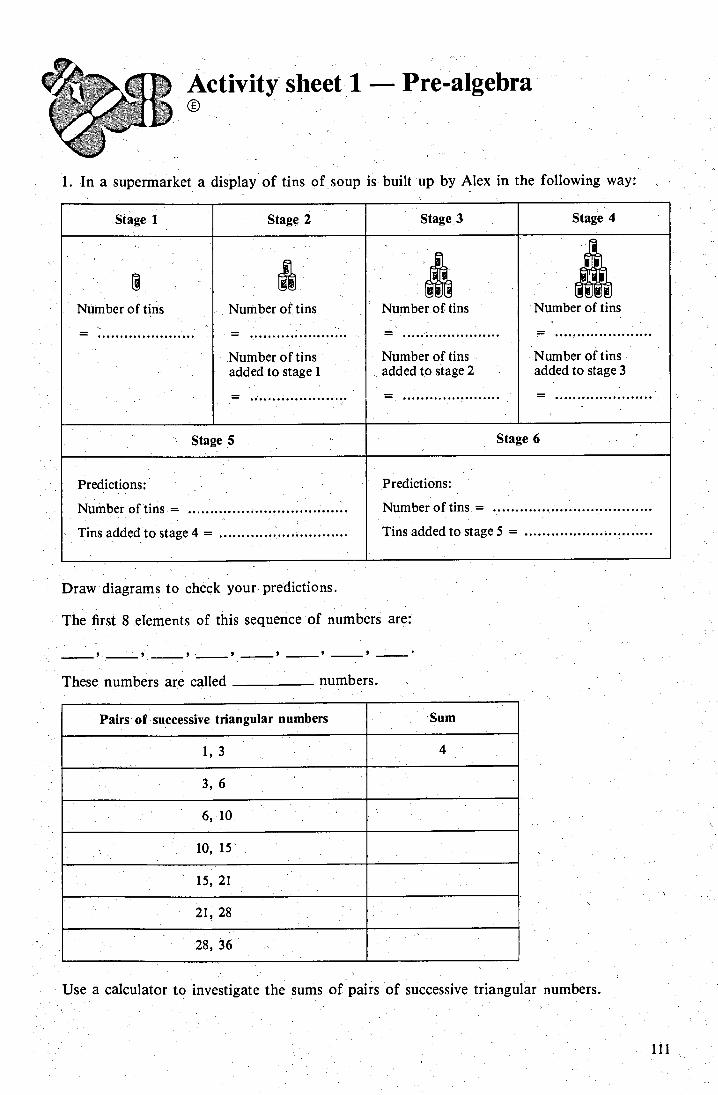
Activity sheet 1 — Pre-algebra
Stage 1 Stage 4 Stage 3 Stage 2
Stage 5 Stage б
Number of tins Number of tins
Number of tins added to stage 1 .
Number of tins
Number of tins added to stage 2
Number of tins
Number of tins• added to stage 3
Predictions:
Number of tins =
Tins added to stage 4 =
Predictions:
Number of tins =
Tins added to stage 5 =
1, 3 4
Pairs of successive triangular numbers Sum
3, 6
б , 10
10, 15
15,21
21, 28
28, 36
1 In a supermarket a display of tins of soup is built up by Alex in the following way:
Draw diagrams to check your predictions.
The first 8 elements of this sequence of numbers are:
These numbers are called numbers.
Use a calculator to investigate the sums of pairs of successive triangular numbers.
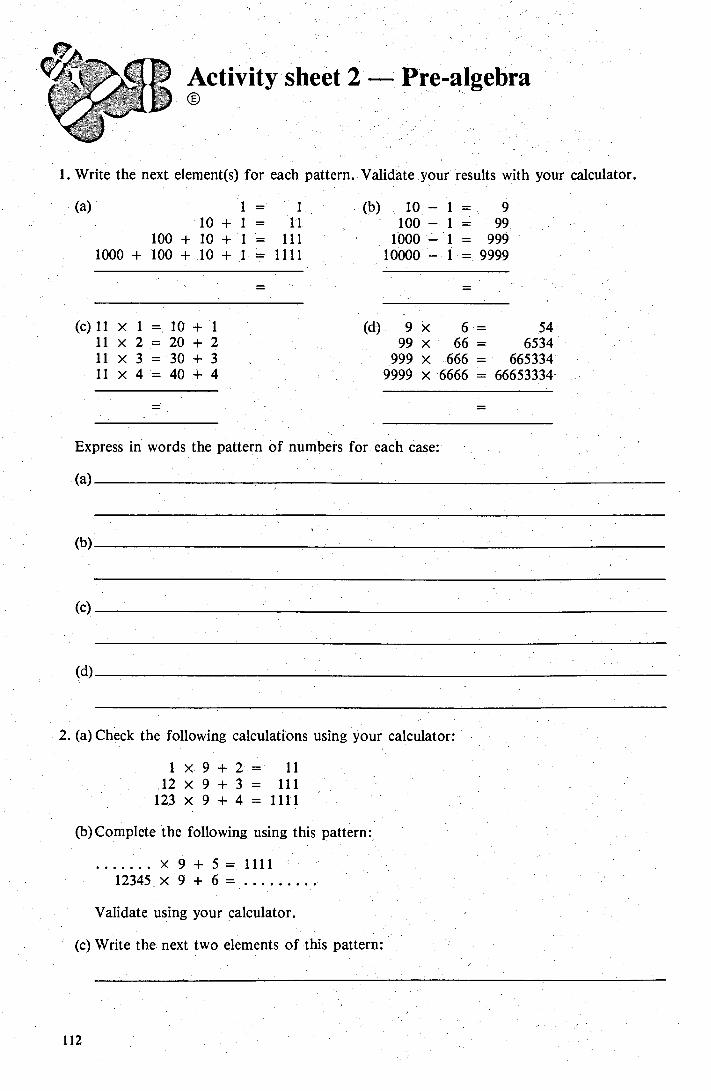
Activity sheet 2 Pre-algebra
1. Write the next element(s) for each pattern. Validate your results with your calculator.
(a)
1= 1 (b) 10 - 1= 9
10 + 1= 11 r 100 — 1 = 99
100 + 10 + 1= 111 1000 = 1= 999
1000 + 100 + _ 10 + 1 = 1111 10000 — 1 = 9999
(c) 11 x 1 =. 10 + 1 (d) 9 x 6= 54
11 x2=20+2 99x 66= 6534 11 x 3= 30 + 3 999 x 666 = 665334 11 x 4= 40 + 4 9999 x 6666 = 66653334
Express in words the pattern of numbers for each case:
(d)
2. (a) Check the following calculations using your calculator:
1 х 9+ 2= 11 12 х 9 +3 = 111
123 х 9+4= 1111
(b) Complete the following using this pattern:
x9+5=1I11 12345 x 9 + 6 =
Validate using your calculator.
(c) Write the next two elements of this pattern:.
112
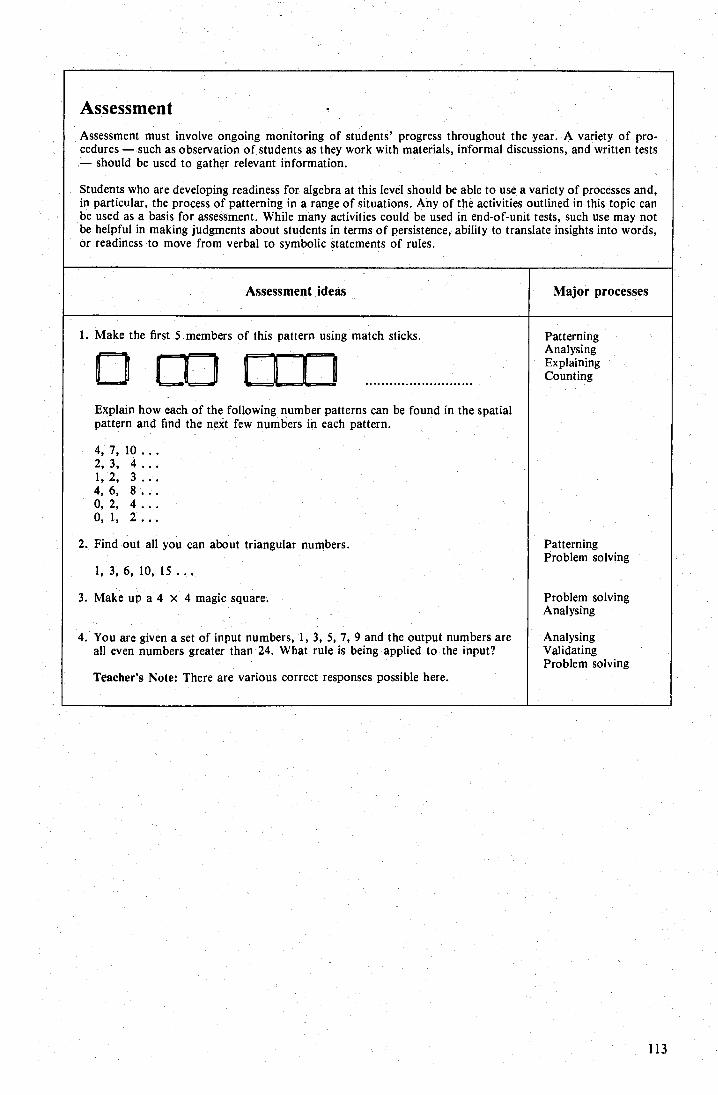
Assessment
Assessment must involve ongoing monitoring of students' progress throughout the year. A variety of pro-cedures — such as observation of students as they work with materials, informal discussions, and written tests
should be used to gather relevant information.
Students who are developing readiness for algebra at this level should be able to use a variety of processes and, in particular, the process of patterning in a range of situations. Any of the activities outlined in this topic can be used as a basis for assessment. While many activities could be used in end-of-unit tests, such use may not be helpful in making judgments about students in terms of persistence, ability to translate insights into words, or readiness to move from verbal to symbolic statements of rules.
Major processes Assessment ideas
1 Make the first 5 members of this pattern using match sticks.
j EED Explain how each of the following number patterns can be found in the spatial pattern and find the next few numbers in each pattern.
4, 7, 10... 2, 3, 4... 1,2, 3... 4, 6, 8 ... 0, 2, 4... 0, 1, 2...
2. Find out all you can about triangular numbers.
1, 3, 6, 10, 15 ...
3. Make up a 4 x 4 magic square.
4. You are given a set of input numbers, 1, 3, 5, 7, 9 and the output numbers are all even numbers greater than 24. What rule is being applied to the input?
Teacher's Note: There are various correct responses possible here.
Patterning Analysing Explaining Counting
Patterning Problem solving
Problem solving Analysing
Analysing Validating Problem solving
113

127'
127 127 128 .
129 129
131.
Algebra
Contents
Focus for teaching, learning and assessment Notes for teachers 1. Activities for linking pre-algebra
statements (Focus A, В and E)
(a) Symbolising general terms (b) Expressing generality in symbols
2. Activities for discussing the term variable (Focus A, В and E)
(a) Identifying variation in practical situations (b) Turning words into symbols (c) Building a strategy for translating from words to symbols (d) Turning symbols into words (e) Interpreting mathematical text (f) Think-of-a-number (ТН OANS) games
з ; Activities for modelling variables in concrete forms (Focus В , C, D and E)
(a) Using containers (b) Using grid paper (c) Using heaps and holes (d) Folding paper to model subtraction
4. Activities for representing relationships and operations (Focus В , E, F and G) •
(a) Using multiples of a variable (b) Expressing further linear relationships (c) Contrasting non-linear relationships (d) Using number machines (e) Using calculator games
Assessment
experiences to symbolic
120
120 121 122 122 123 123 '.
115
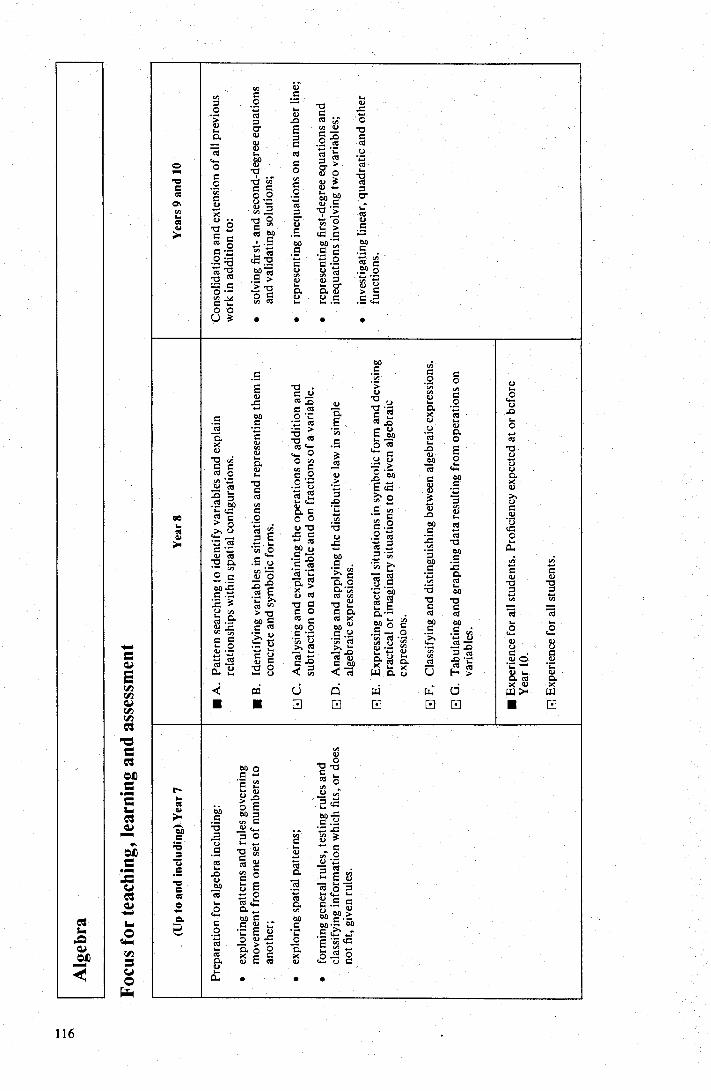
Yea
rs 9
an
d 10
Pro
fic i
ency
exp
ecte
d at
or
befo
re
(Up to
and
inc
ludi
ng) Y
ear
7
Pre
para
tion
for
alg
ebra
inc
ludi
ng:
exp
lori
ng s
pat
ial
p att
erns
;
• • •
a
` од ..' г .q)qб и 4.. С ^ po . •, и t7 L1. .— v сдд . С ..й А И И .С О
• .` . .л и _ ь.
0о г р б > LL О v..c. С . cб Ć и сд сбо й 0о
С сб
c. С tu. ` C С б еб .б . eo С сб с сб Х б ь. и
O д С ØO ед
•
Ć r. С
и су " 'й с) . ' .сб
� о л u
Q й <. W с v
Q дд U d W ■ ■ о а о
Foc
us f
or te
achi
ng, l
e arn
ing
and
asse
ssm
ent
116
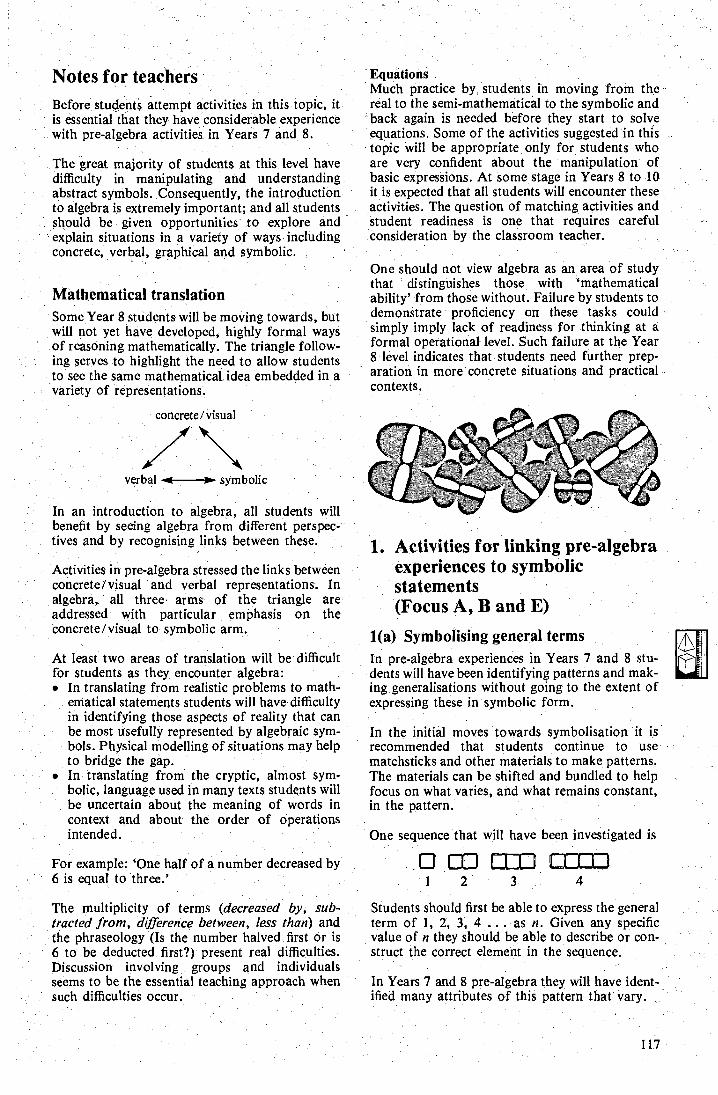
Notes for teachers Before students attempt activities in this topic, it is essential that they have considerable experience with pre-algebra activities in Years 7 and 8.
The great majority of students at this level have difficulty in manipulating and understanding abstract symbols. Consequently, the introduction, to algebra is extremely important; and all students should be given opportunities to explore and explain situations in a variety of ways including concrete, verbal, graphical and symbolic.
Mathematical translation Some Year 8 students will be moving towards, but will not yet have developed, highly formal ways of reasoning mathematically. The triangle follow-ing serves to highlight the need to allow students to see the same mathematical idea embedded in a variety of representations.
Equations Much practice by students in moving from the real to the semi-mathematical to the symbolic and back again is needed before they start to solve equations. Some of the activities suggested in this topic will be appropriate only for students who are very confident about the manipulation of basic expressions. At some stage in Years 8 to 10 it is expected that all students will encounter these activities. The question of matching activities and student readiness is one that requires careful consideration by the classroom teacher.
One should not view algebra as an area of study that distinguishes those with `mathematical ability' from those without. Failure by students to demonstrate proficiency on these tasks could simply imply lack of readiness for thinking at a formal operational level. Such failure at the Year 8 level indicates that students need further prep-aration in more concrete situations and practical contexts.
concrete / visual
verbal m---0- symbolic
In an introduction to algebra, all students will benefit by seeing algebra from different perspec-tives and by recognising links between these.
Activities in pre-algebra stressed the links between concrete /visual and verbal representations. In algebra, all three arms of the triangle are addressed with particular emphasis on the concrete/visual to symbolic arm.
At least two areas of translation will be difficult for students as they encounter algebra: • In translating from realistic problems to math-
ematical statements students will have difficulty in identifying those aspects of reality that can be most usefully represented by algebraic sym-bols. Physical modelling of situations may help to bridge the gap.
• In translating from the cryptic, almost sym-bolic, language used in many texts students will. be uncertain about the meaning of words in context and about the order of operations intended.
For example: `One half of a number decreased by б is equal to three.'
The multiplicity of terms (decreased by, sub-tracted from, difference between, less than) and the phraseology (Is the number halved first or is б to be deducted first?) present real difficulties. Discussion involving groups and `individuals seems to be the essential teaching approach when such difficulties occur.
1. Activities for linking pre-algebra. experiences to symbolic statements (Focus A, B and E)
1(a) Symbolising general terms In pre-algebra experiences in Years 7 and 8 stu-dents will have been identifying patterns and mak-ing generalisations without going to the extent of expressing these in symbolic form.
In the initial moves towards symbolisation it is recommended that students continue to use matchsticks and other materials to make patterns. The materials can be shifted and bundled to help focus on what varies, and what remains constant, in the pattern.
One sequence that will have been investigated is
о о :; LED 1 2 3 4
Students should first be able to express the general term of 1, 2, 3, 4 ... as n. Given any specific value of n they should be able to describe or con-struct the correct element in the sequence.
In Years 7 and 8 pre-algebra they will have ident-ified many attributes of this pattern that vary.
117
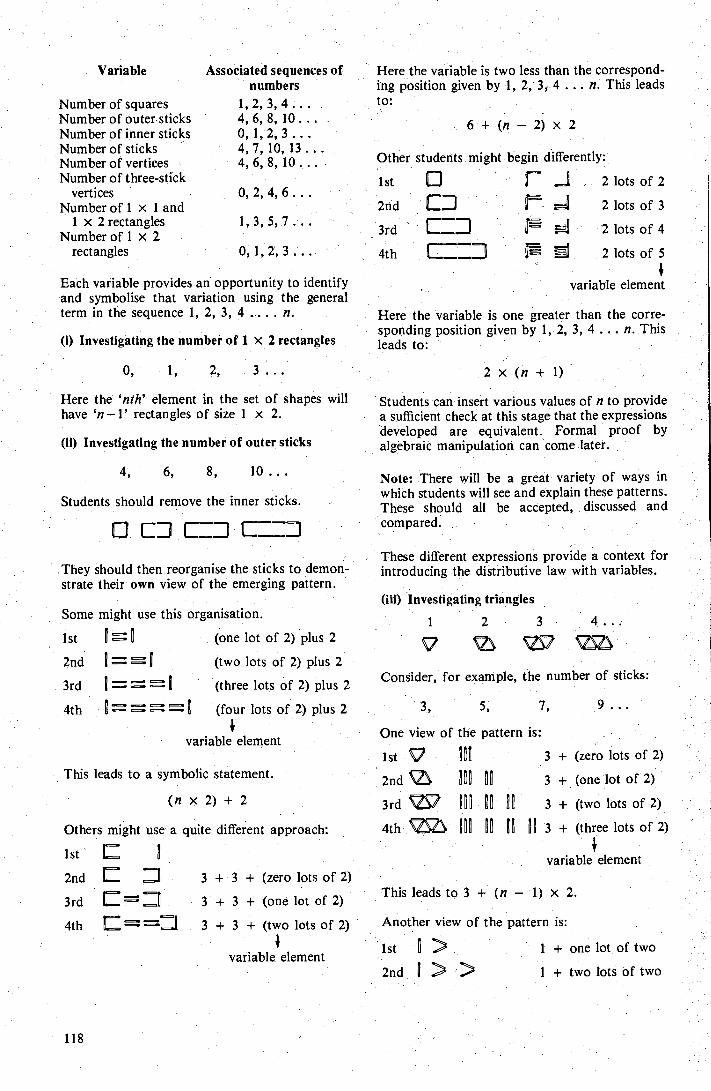
Some might use this organisation.
1st
2nd
3rd
4th
(one lot of 2) plus 2
(two lots of 2) plus 2
(three lots of 2) plus 2
(four lots of 2) plus 2 i
variable element
This leads to 3 + (n - 1) X. 2.
Another view of the pattern is:
ist A
2nd
1 + one lot of two
1 + two lots of two
Variable
Number of squares Number of outer sticks Number of inner sticks Number of sticks Number of vertices Number of three-stick
vertices Number of 1 x 1 and
1 x 2 rectangles Number of 1 x 2
rectangles
Associated sequences of numbers
1,2,3,4... 4, 6, 8, 10 . .. 0, 1,2,3... 4, 7, 10, 13. .. 4, 6, 8, 10 . . . 0, 2, 4, 6 .. 1,3,5,7... 0, 1, 2, 3 ...
Each variable provides an opportunity to identify and symbolise that variation using the general term in the sequence 1, 2, 3, 4 .... n.
(i) Investigating the number of 1 x 2 rectangles
оѓ 1, 2, 3 . . .
Here the `nth' element in the set of shapes will have `n - 1' rectangles of size 1 x 2.
(ii) Investigating the number of outer sticks
4, 6, 8, 10...
Students should remove the inner sticks.
They should then reorganise the sticks to demon-strate their own view of the emerging pattern.
This leads to a symbolic statement.
(n x 2) + 2
Others might use a quite different approach:
1st ' E
2nd Е 3 + 3 + (zero lots of 2)
3rd 3 + 3 + (one lot of 2)
4th
Here the variable is two less than the correspond-ing position given by 1, 2, 3, 4 ... n. This leads to:
б + (n - 2) х 2
Other students might begin differently:
ist O r ј 2 lots of 2
2nd Е D
2 lots of 3
3rd E__D
Ú° PQ 2 lots of 4
4th
2 lots of 5 i
variable element
Here the variable is one greater than the corre-sponding position given by 1, 2, 3, 4 ... n. This leads to:
2 х (n+ 1)
Students can insert various values of n to provide a sufficient check at this stage that the expressions developed are equivalent. Formal proof by algebraic manipulation can come later.
Note: There will be a great variety of ways in which students will see and explain these patterns. These should all be accepted, discussed and compared.
These different expressions provide a context for introducing the distributive law with variables.
(iii) Investigating triangles
1 2 3 . 4...
\Õ
Consider, for example, the number of sticks:
3, 5, 7, 9 ...
One view of the pattern is:
1st 3 + (zero lots of 2)
2nd A Р 0A 3 + (one lot of 2)
3rd 2 AAA 3 + (two lots of 2)
4th AAA AA AA OA 3 + (three lots of 2) I
variable element
3 + 3 + (two lots of 2) ť
variable element
118
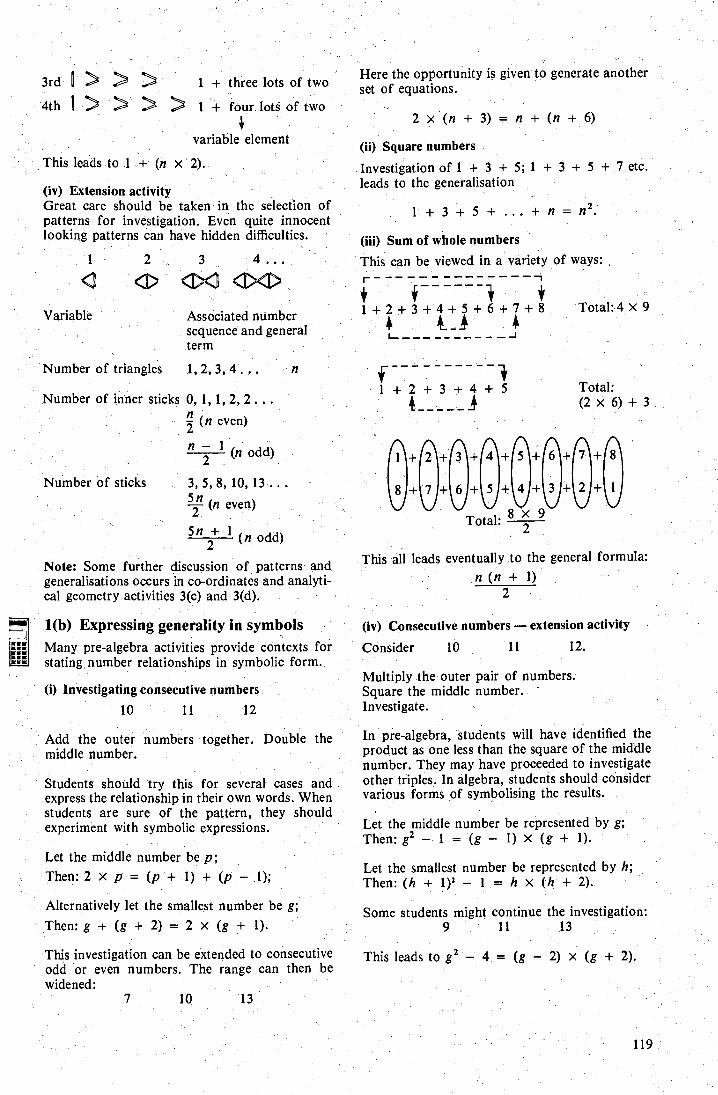
м
Ё::: -.-
3rd II о ) о 1 + three lots of two
4th II ) ) ) ) 1 + four lots of two
variable element
This leads to 1-+ (п x 2).
(iv) Extension activity Great care should be taken in the selection of patterns for investigation. Even quite innocent looking patterns can have hidden difficulties.
1 2 3 4...
фф
Associated number sequence and general term
Number of triangles 1, 2, 3, 4 ... n
Number of inner sticks 0, 1, 1, 2, 2 .. .
(n even)
— 1 (n odd) 2
Number of sticks 3, 5, 8, 10, 13 52 (n even)
5n + 1 (n odd) 2
Note: Some further discussion of patterns and generalisations occurs in co-ordinates and arralyti-cal geometry activities 3(c) and 3(d).
1(b) Expressing generality in symbols Many pre-algebra activities provide contexts for stating number relationships in symbolic form.
(i) Investigating consecutive numbers
10 11 12
Add the outer numbers together. Double the middle number.
Students should try this for several cases and express the relationship in their own words. When students are sure of the pattern, they should experiment with symbolic expressions.
Let the middle number be p; Then: 2 x p = (p + 1) + (p 1);
Alternatively let the smallest number be g;
Then: g + (g + 2) = 2 x (g + 1).
This investigation can be extended to consecutive odd or even numbers. The range can then be widened:
7 10 13
Here the opportunity is given to generate another set of equations.
2 x ( п + 3) _ n + (n + 6)
(ii) Square numbers
Investigation of 1 + 3 + 5; 1 + 3 + 5 + 7 etc. leads to the generalisation
1± 3+ 5 + ...+ п fl 2
(iii) Sum of whole numbers This can be viewed in a variety of ways: Г -'
1 / +2+8+4+5+ б +7+ 8 Total:4x9 . 4
і 1 + 2 + з +4+5
----.— Total: (2x6)+3
1+ 2 + 3 + 4 + 5 + б + 7 +
8 + Z + 6 + 5 + 4 + 3 + 2 +
Total: в x 9
This all leads eventually to the general formula: n ( п + 1)
2
(iv) Consecutive numbers — extension activity
Consider 10 11 12.
Multiply the outer pair of numbers. Square the middle number. Investigate.
In pre-algebra, students will have identified the product as one less than the square of the middle number. They may have proceeded to investigate other triples. In algebra, students should consider various forms of symbolising the results.
Let the middle number be represented by g; Then: g2 1= (g — 1) x (g + 1).
Let the smallest number be represented by h; Then: (h + 1)2 1 h x (h + 2).
Some students might continue the investigation: 9 11 13
This leads to g2 - 4; = (g — 2) x (g + 2).
Variable
2
119
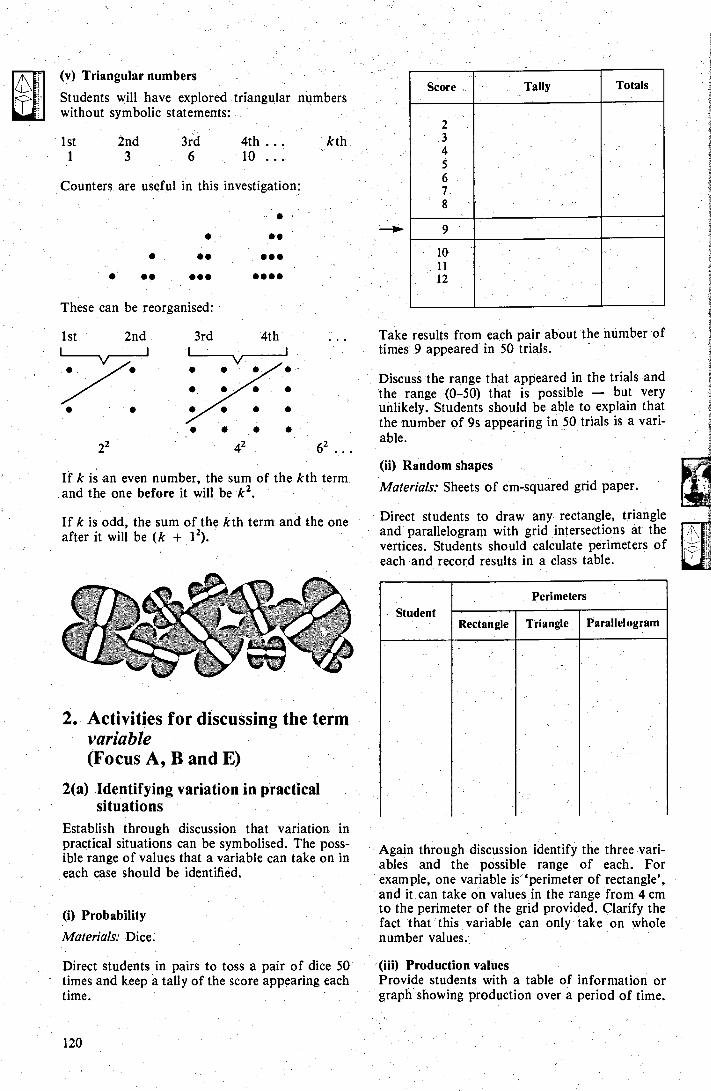
Score Totals Tally
.3
4 5 6
7 8
9
10 11 12
1st 2nd 3rd 4th
• в • •
42
(v) Triangular numbers ..
Students will have explored triangular numbers without symbolic statements:
1st 2nd 3rd 4th . .. kth
1 3 6 10 ...
Counters are useful in this investigation:
• •в .
• •• ...
•• •в • ....
These can be reorganised:
62
If k is an even number, the sum of the kth term and the one before it will be k2.
If k is odd, the sum of the kth term and the one after it will be (k + 12).
2. Activities for discussing the term variable (Focus A, В and E)
2(a) Identifying variation in practical situations
Establish through discussion that variation in practical situations can be symbolised. The poss-ible range of values that a variable can take on in each case should be identified.
(i) Probability
Materials: Dice.
Direct students in pairs to toss a pair of dice 50 times and keep a tally of the score appearing each time.
Take results from each pair about the number of times 9 appeared in 50 trials.
Discuss the range that appeared in the trials and the range (0-50) that is possible — but very unlikely. Students should be able to explain that the number of 9s appearing in 50 trials is a vari-able.
(ii) Random shapes .
Materials: Sheets of cm-squared grid paper.
Direct students to draw any rectangle, triangle and parallelogram with grid intersections at the vertices. Students should calculate perimeters of each . and record results in a class table.
Perimeters Student
Rectangle Triangle Parallelogram
Again through discussion identify the three vari-ables and the possible range of each. For example, one variable is `perimeter of rectangle', and it can take on values in the range from 4 cm to the perimeter of the grid provided. Clarify the fact that this variable can only take on whole number values.
(iii) Production values Provide students with a table of information or graph showing production over a period of time.
120
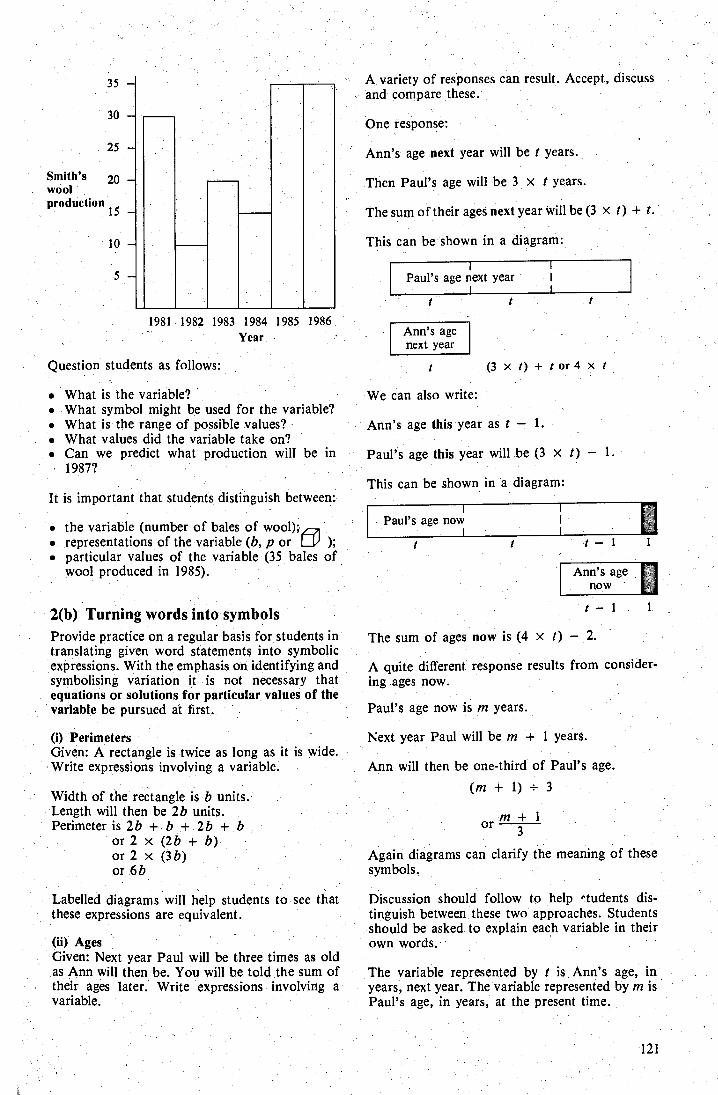
20 — Smith's wool production 15 —
1 t-.- 1
The sum of ages now is (4 x t) — 2.
A quite different response results from consider-ing ages now.
Paul's age now is m years.
Next year Paul will be in + 1 years.
Ann will then be one-third of Paul's age.
(m + 1) _ 3
1981 1982 1983 1984 1985 1986 Year
Question students as follows:
• What is the variable? • What symbol might be used for the variable? • What is the range of possible values? • What values did the variable take on?
Can we predict what production will be in 1987?
It is important that students distinguish between:
• the variable (number of bales of wool); • representations of the variable (b, p or ® ); • particular values of the variable (35 bales of
wool produced in 1985).
2(b) Turning words into symbols Provide practice on a regular basis for students in translating given word statements into symbolic expressions. With the emphasis on identifying and symbolising variation it is not necessary that equations or solutions for particular values of the variable be pursued at first.
(i) Perimeters Given: A rectangle is twice as long as it is wide. Write expressions involving a variable.
Width of the rectangle is Ь units. Length will then be 2b units. Perimeter is 2b + b + 2 Ь + b
or 2 x (2 Ь + b) or 2 x (3b) or 6 ђ
Labelled diagrams will help students to see that these expressions are equivalent.
(ii) Ages Given: Next year Paul will be three times as old as. Ann will then be. You will be told the sum of their ages later. Write expressions involving a variable.
A variety of responses can result. Accept, discuss and compare these.
One response:
Ann's age next year will be t years.
Then Paul's age will be 3 x t years.
The sum of their ages next year will be (3 x t) + t.
This can be shown in a diagram:
Paul's age next year
Ann's age next year
(3 х t) + t or 4 x t
We can also write:
Ann's age this year as t - 1.
Paul's age this year will be (3 x t) — 1.
This can be shown in a diagram:
or т + 1
Again diagrams can clarify the meaning of these symbols.
Discussion should follow to help ^.tudents dis-tinguish between these two approaches. Students should be asked to explain each variable in their own words.
The variable represented by t is Ann's age, in years, next year. The variable represented by m is Paul's age, in years, at the present time.
121
35 —
30 —
25 —
1 о —
S =
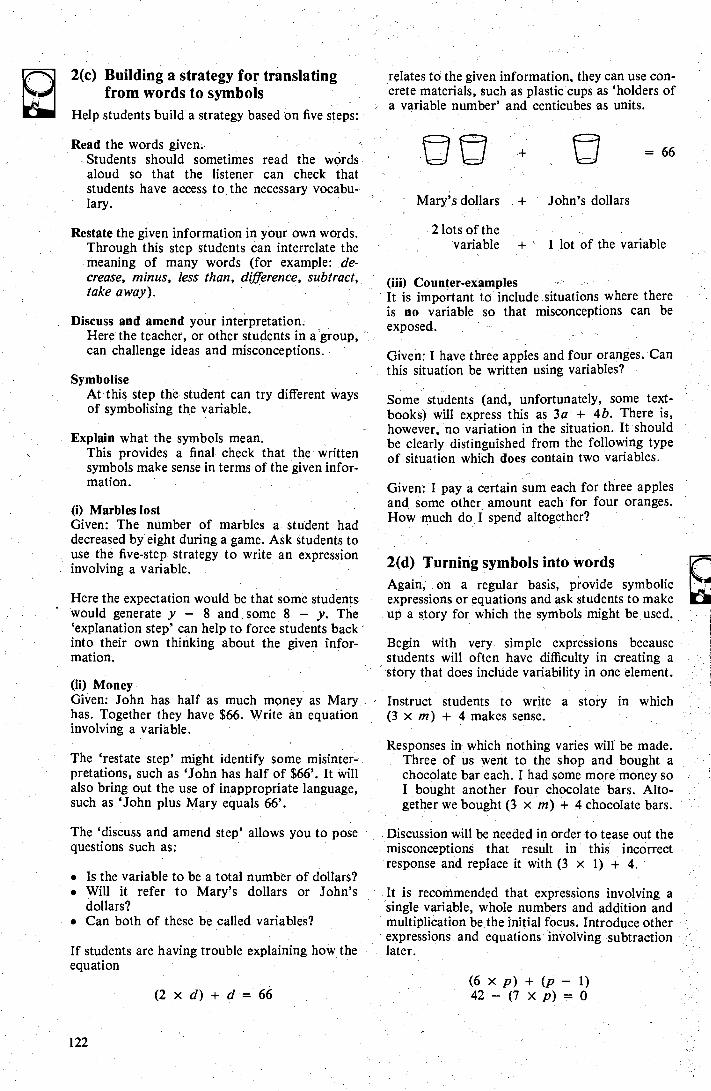
2(c) Building a strategy for translating from words to symbols
Help students build a strategy based on five steps:
Read the words given. Students should sometimes read the words aloud so that the listener can check that students have access to the necessary vocabu-lary.
Restate the given information in your own words. Through this step students can interrelate the meaning of many words (for example: de-crease, minus, less than, difference, subtract, take away).
Discuss and amend your interpretation. Here the teacher, or other students in a group, can challenge ideas and misconceptions.
Symbolise At this step the student can try different ways of symbolising the variable.
Explain what the symbols mean. This provides a final check that the written symbols make sense in terms of the given infor-mation.
(i) Marbles lost Given: The number of marbles a student had decreased by eight during a game. Ask students to use the five-step strategy to write an expression involving a variable.
Here the expectation would be that some students would generate y — 8 and some 8 y. The `explanation step' can help to force students back into their own thinking about the given infor-mation.
(ii) Money Given: John has half as much money as Mary has. Together they have $66. Write an equation involving a variable.
The `restate step' might identify some misinter-pretations, such as `John has half of $66'. It will also bring out the use of inappropriate language, such as `John plus Mary equals 66'.
The `discuss and amend step' allows you to pose questions such as:
. Is the variable to be a total number of dollars?
•
Will it refer to Mary's dollars or John's dollars?
. Can both of these be called variables?
If students are having trouble explaining how the equation
(2 х d) + d = 66
relates to the given information, they can use con-crete materials, such as plasticcups as `holders of a variable number' and centicubes as units.
= 66
Mary's dollars .. + John's dollars
2 lots of the variable + ` 1 lot of the variable
(iii) Counter-examples It is important to include situations where there is no variable so that misconceptions can be exposed.
Given: I have three apples and four oranges. Can this situation be written using variables?
Some students (and, unfortunately, some text-books) will express this as 3a + 4b. There is, however, no variation in the situation. It should be clearly distinguished from the following type of situation which does contain two variables.
Given: I pay a certain sum each for three apples and some other amount each for four oranges. How much do I spend altogether?
2(d) Turning symbols into words Again, on a regular basis, provide symbolic expressions or equations and ask students to make up a story for which the symbols might be used.
Begin with very simple expressions because students will often have difficulty in creating a story that does include variability in one element.
Instruct students to write a story in which (3 x m) + 4 makes sense.
Respónses in which nothing varies will be made. Three of us went to the shop and bought a chocolate bar each. I had some more money so I bought another four chocolate bars. Alto-gether we bought (3 x m) + 4 chocolate bars.
Discussion will be needed in order to tease out the misconceptions that result in this incorrect response and replace it with (3 x 1) + 4.
It is recommended that expressions involving a single variable, whole numbers and addition and multiplication be the initial focus. Introduce other expressions and equations involving subtraction later.
(6 хр ) + Х 1? 1) 42 — (7 х p) = O
122
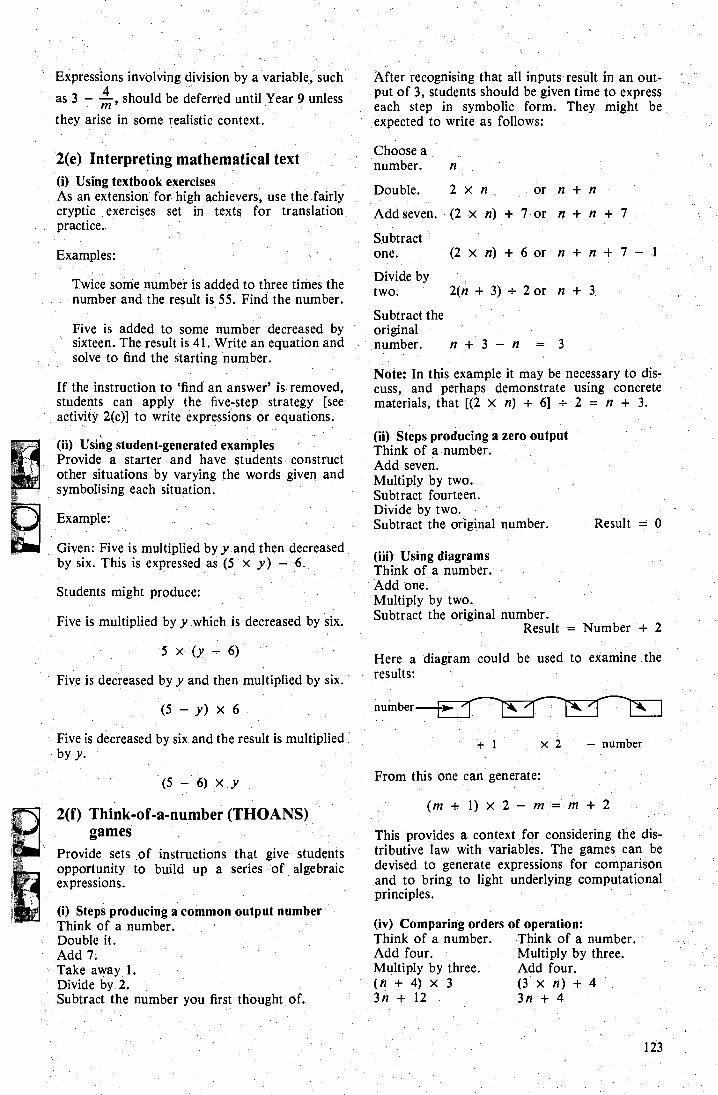
Expressions involving division by a variable, such
as 3 — m , should be deferred until Year 9 unless
they arise in some realistic context.
2(e) Interpreting mathematical text (i) Using textbook exercises As an extension for high achievers, use the fairly cryptic exercises set in texts for translation practice..
Examples:
Twice some number is added to three times the number and the result is 55. Find the number.
Five is added to some number decreased by sixteen. The result is 41. Write an equation and solve to find the starting number.
If the instruction to `find an answer' is removed, students can apply the five-step strategy [see activity 2(c)] to write expressions or equations.
After recognising that all inputs result in an out-put of 3, students should be given time to express each step in symbolic form. They might be expected to write as follows:
Choose a number.
Double. 2 x п or п + п
Add seven. (2 -х п ) + 7 or п + п + 7 -.
Subtract one. (2 х п ) + 6or п + п + 7—-1
Divide by . two. 2(п + 3) - 2 or n +_ 3
Subtract the original number. n+3— п = 3
Note: In this example it may be necessary to dis-cuss, and perhaps demonstrate using concrete materials, that [(2 x n) + 6] _ 2 = n + 3.
(ii) Using student-generated examples Provide a starter and have students construct other situations by varying the words given and symbolising each situation.
Example:
Given: Five is multiplied by y and then decreased by six. This is expressed as (5 x y) — 6.
Students might produce:
Five is multiplied by y which is decreased by six.
5 х (y-6)
Five is decreased by y and then multiplied by six.
(5 - y) x 0
(ii) Steps producing a zero output Think of a number. Add seven. Multiply by two. Subtract fourteen. Divide by two. Subtract the original number.
Result = 0
Think of a number. (iii) Using diagrams
Add one. Multiply by two. Subtract the original number.
+2 Result = Number
Here a diagram could be used to examine the results:
number
Five is decreased by six and the result is multiplied by y•
(5 — 6) x y
2(f) Think-of-a-number (THORNS) games
Provide sets of instructions that give students opportunity to build up a series of algebraic expressions.
(i) Steps producing a common output number Think of a number. Double it. Add 7. . Take away 1. Divide by 2. Subtract the number you first thought, of.
+1 х
From this one can generate:
(m + 1) X 2 — r = т + 2
This provides a context for considering the dis-tributive law with variables. The games can be devised to generate expressions for comparison and to bring to light underlying computational principles.
(iv) Comparing orders of operation: Think of a number. Think of a number. Add four. Multiply by three. Multiply by three.
Add four. (n+4)x3
(3 xn)+4 3n +12
31+4
— number
123
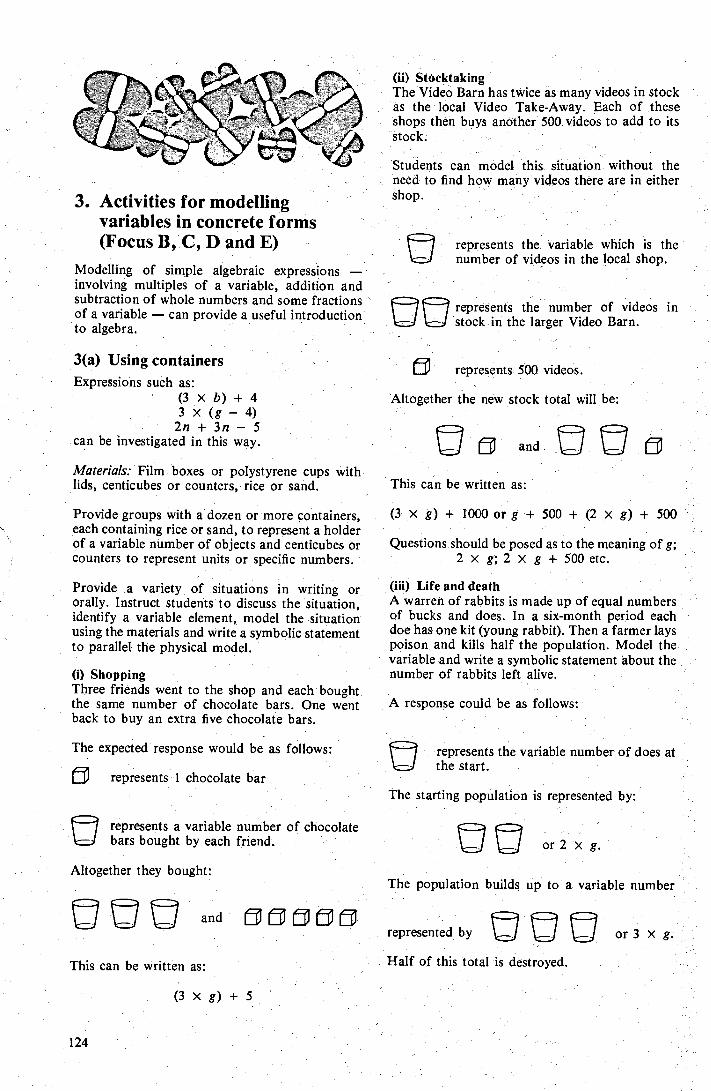
(ii) Stocktaking The Video Barn has twice as many videos in stock as the local Video Take-Away. Each of these shops then buys another 500 videos to add to its stock.
Students can model this situation without the need to find how many videos there are in either shop.
represents the variable which is the number of videos in the local shop.
E C7 represents the number of videos in stock in the larger Video Barn.
f represents 500 videos.
Altogether the new stock total will be:
а nd
This can be written as:
(3 x g) + 1000 o r g + 500 + (2 x g) + 500
Questions should be posed as to the meaning of g; 2 x g; 2 x- g + 500 etc.
(iii) Life and death A warren of rabbits is made up of equal numbers of bucks and does. In a six-month period each doe has one kit (young rabbit). Then a farmer lays poison and kills half the population. Model the variable and write a symbolic statement about the number of rabbits left alive.
A response could be as follows:
represents the variable number of does at the start.
or 2 Х g.
and ®®®®®
This can be written as:
(3 x g) + 5
3. Activities for modelling variables in concrete forms (Focus В , C, D and E)
Modelling of simple algebraic expressions — involving multiples of a variable, addition and subtraction of whole numbers and some fractions of a variable — can provide a useful introduction to algebra.
3(a) Using containers Expressions such as:
(3 x b) + 4 3 x (g - 4)
2п +3п -5 can be investigated in this way.
Materials: Film boxes or polystyrene cups with lids, centicubes or counters, rice or sand.
Provide groups with a dozen or more containers, each containing rice or sand, to represent a holder of a variable number of objects and centicubes or counters to represent units or specific numbers.
Provide a variety of situations in writing or. orally. Instruct students to discuss the situation, identify a variable element, model the situation using the materials and write a symbolic statement to parallel the physical model.
(i) Shopping Three friends went to the shop and each bought. the same number of chocolate bars. One went back to buy an extra five chocolate bars.
The expected response would be as follows:
represents 1 chocolate bar The starting population is represented by:
C represents a variable number of chocolate bars bought by each friend.
Altogether they bought: The population builds up to a variable number
represented by or 3 x
Half of this total is destroyed.
124
(3x t) -10
125
If there are 2 x g rabbits to begin with, then there
will be 3 2 g r abbits left after poisoning.
3(b) Using grid paper . Materials: Sheets of cm-squared grid paper.
Provide situations similar to those in activity 3(а ) and instruct students to represent the situations using 1 x 1 cm squares to represent known num-bers or amounts, and squares of random size to represent the variable.
Example:
Each resident in a street has two newspapers delivered daily, and three residents also receive an interstate paper daily. Use grids to represent this situation and also write an appropriate symbolic statement. Use a 1 x 1 cm square to represent one newspaper delivered.
Students will produce a variety of representations:
ввввв ■вввв ■в ■■в вв ■ -... ■ ..... вввв ■в ■ ■■ввв ■ ввввв ■■ вв ■в ■ ■в вввв вввв ■ в ■■вввв вв в вв в в в ввг ввввввв ввввввввввввввввв ■
(2, х n) + 3
A class or group discussion should follow to dis-cuss the specific value that each student has given to the unknown number of residents. In this way a concept of a variable can be built up. The dif-ference between a variable and specific values of a variable can also be established.
3(c) Using heaps and holes Some slightly. more abstract symbolic expressions, involving subtraction of variables and simple fractions of variables, can be modelled using heaps to represent something added and holes to represent something subtracted. These expres-sions are particularly useful when students are being introduced to, or experience difficulty with,' the distributive law involving variables. .
Ø positive negative
(i) Using materials
Materials: Empty plastic containers, and sections cut from an egg-carton to represent positive or negative units.
Identify a situation encountered in the classroom discussion where two students have generated dif-ferent expressions. Instruct students to model one expression and then regroup the materials to. check whether the other expression is equivalent.
3g + 9 3(g + 3)
Beginning with each concrete representation students should regroup to show that it can be changed into the other representation. They should also show that 3(g . + 3) cannot be re-grouped to give 3g + 3.
2( п - 3)+2 2 п -4
Students should regroup to show not only the equivalence of these two representations, but also to develop others such as 2 x (n — 2). .
(ii) Using diagrams The next stage in this sequence is to use diagrams of heaps and holes in place of the physical materials.
Provide a diagram such as the following and ask students to write appropriate symbolic state-ments.
Students should be able to describe. this as:
• two lots of the variable plus 4 (2 х g) + 4
. two lots of 2 (g + 2)
Introduce subtraction of units.
Three people go to the races with the same amount of money each. Altogether they lose 10 dollars. Show in diagrams and symbols what they finish with.
(2 х g) — 6 2x (g- 3)
t + 1 - t - 1 0
3 - (3 x m)
_1— 3 Х (1 —
3(d) Folding paper to model subtraction
Materials: Rectangular sheets of paper.
Only after students are confident about adding variables should they be introduced to subtracting variables.
Mary and Tom went to the races with $50 and they did not back a winner. She lost a certain amount and he lost twice as much. Describe in diagrams and symbols how much they finished with.
1 and (2 — t) or 2 and (1 — t)
• Write expressions for the perimeter of the new shape 1 + (2 t) + 1 + (2 t). Students may then intuitively collect like terms.
Students should discuss questions such as:
• What are expressions for side lengths of the new shape?
2 + 2 (2 — t) б — (2 X t)
50— (3x g)
This situation provides a context for discussing possible values of the variable if minimum bets are $1. Questions should be posed to focus on this:
• Can they lose a total of $1? • What is the smallest amount they can lose? • What is the largest total amount they can lose? . What is the largest amount Mary can lose? . Can Tom lose $35? • Can Tom lose $1? • Can Mary lose $16?
Provide students with a variety of symbolic expressions and heaps and holes diagrams and ask them to match expressions and diagrams.
Provide situations and questions to prompt inves-tigation.
A farmer has a rectangular shaped farm of length 2 km and width 1 km. A piece down one side is resumed for a railway line.
Have students use a paper shape and fold along one side to represent the area resumed. Two possibilities exist:
2
• What are the greatest and smallest values that t can be? Can t take on any value between these?
A square piece of paper of side length 2 m has a piece of width t m cut off one side.
2
Students should investigate, using a paper model:
side lengths of the new shape. 2m and (2 — t) m
perimeter of new shape. 8 — (2 x t) m perimeter of the piece cut off. 4 + (2 x t) m, side lengths if another piece of width t m is cut
off. perimeter of the piece left after the second cut.
8—(4x t) m perimeter of the second piece cut off.
4+(2x t) m r.
A square piece of card of side length g cm has smaller squares of side 2 cm cut out of each corner.
Ask students to make up a model and fold along dotted lines to make an open-topped box., Students should investigate questions such as:
• What is the side length of the box? g 4 cm • What is the distance around the box?
4 x (g — 4)cm or (4 x g) — 16 ▪ What is the height of the box? 2 cm
2
t
126
Let n be the number of hours Total area laid = 20 x n m2
Total earnings
Daughter's earnings
What is the area of one side? 2 x (g — 4) с m2
4. Activities for representing relationships and operations (Focus В , E, F and G)
It is important that students recognise that relationships involving variables can be expressed using tables of values, graphs and algebraic sym-bols. Students should eventually relate one form of representation to another.
4(a) Using multiples of a variable Materials: Grid paper.
Provide a realistic situation and a format for students to use in producing tabular, graphical and algebraic representations.
A team of tilers lays exactly 20 square metres of tiles each hour for б hours.
140—
120 —
ilo —
•
Discuss with students the lack of meaning of intervening points and the impossibility of extrapolating from the data in the given situation:
A man and his daughter run a business and share earnings on the basis of his earnings being twice her earnings. How can their total earnings be rep-resented?
Daughter's earnings
Total earnings
In addition to using a graph and an algebraic statement students might use a `function machine' diagram.
Discuss various forms of receiving income includ-ing payment by piecework. Begin with particular data such as 20c per item for 500 items per day and progress to general algebraic statements:
0.2 x n dollars per day 2 x n dollars per fortnight (10 working days)
In tabulating data and graphing these two re-lationships, students should compare the slopes of the graphs and link this to coefficients of n in the algebraic statements.
4(b) Expressing further linear relationships
Repeat the approach of interrelating tables, graphs and algebraic statements on the basis of realistic situations that give rise to expressions of the form:
(4 X r) + 3 (5 X с ) — 6
A student working at a shopping centre is paid $30 for the 5.00 p.m. to 9.00 p.m. evening shift and $7 per hour for any overtime. Represent this information in three forms:
2 3 4
Time in hours
Tabular form
Hours overtime
Total pay 30+(0 х 7) 30+(1 x7)
2
30 + (2 к 7)
S0 — Total area m2
60 —
40
20 —
Time Calculation Total area
20 х O 1 2
0
Rule
д х 3
--..- .-..-
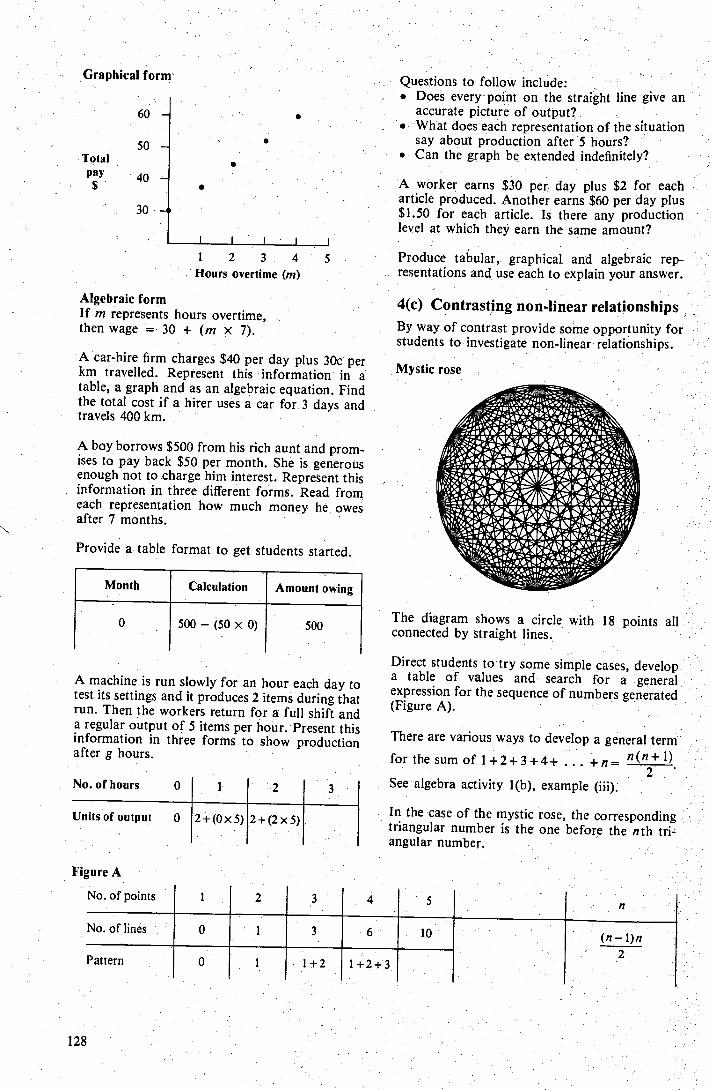
Month Amount owing Calculation
500 500 — (50 x0)
Mystic rose
No. of hours 2
Units of output 0 2+(0x 5) 2+(2x 5)
Graphical form
б 0 —
50 —
Total •
Pay 40 —
30 -.
1 2 3 4 5 Hours overtime (m)
Algebraic form If m represents hours overtime, then wage = 30 + (m x 7).
A car-hire firm charges $40 per day plus 30с per km travelled. Represent this information in a table, a graph and as an algebraic equation. Find the total cost if a hirer uses a car for 3 days and travels 400 km.
A boy borrows $500 from his rich aunt and prom-ises to pay back $50 per month. She is generous enough not to charge him interest. Represent this information in three different forms. Read from each representation how much money he owes after 7 months.
Provide a table format to get students started.
A machine is run slowly for an hour each day to test its settings and it produces 2 items during that run. Then the workers return for a full shift and a regular output of 5 items per hour. Present this information in three forms to show production after g hours.
Questions to follow include: Does every point on the straight line give an accurate picture of output?
• What does each representation of the situation say about production after 5 hours?
• Can the graph be extended indefinitely?
A worker earns $30 per day plus $2 for each article produced. Another earns $60 per day plus $1.50 for each article. Is there any production level at which they earn the same amount?
Produce tabular, graphical and algebraic rep-resentations and use each to explain your answer.
4(с ) Contrasting non-linear relationships By way of contrast provide some opportunity for students to investigate non-linear relationships.
The diagram shows a circle with 18 points all connected by straight lines.
Direct students to try some simple cases, develop a table of values and search for a general expression for the sequence of numbers generated (Figure A).
There are various ways to develop a general term
for the sum of 1+2+3+4+ ... +n= n(І + 1) 2
Figure A
No. of points 2
See algebra activity 1(b), example (iii).
In the case of the mystic rose, the corresponding triangular number is the one before the nth tri-angular number.
No. of lines o t 3 б to
Pattern 1+2+3 1+2
128
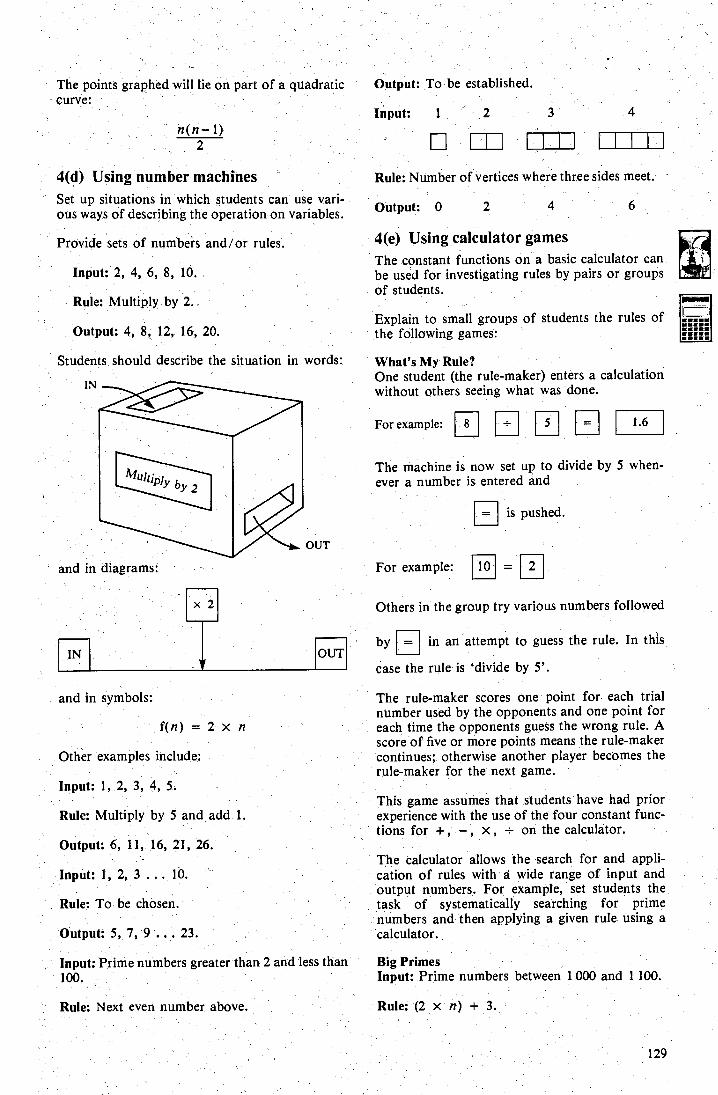
129
6 Output: 0 2 4
4(d) Using number machines
Set up situations in which students can use vari-ous ways of describing the operation on variables.
Provide sets of numbers and/or rules.
Input: 2, 4, 6, 8, 10.
Rule: Multiply by 2.
Output: 4, 8, 12, 16, 20.
Students should describe the situation in words:.
and in diagrams:
and in symbols:
f(n) = 2 x n
Other examples include:
Input: 1, 2, 3, 4, 5.
Rule: Multiply by 5 and add l
Output: 6, 11, 16, 21, 26.
Input: 1, 2, 3 . 10.
Ruler To be chosen.
Output: 5, 7, 9 . 23.
Input: Prime numbers greater than 2 and less than 100.
Rule: Next even number above.
Rule: Number ofvertices where three sides meet.
4(e) Using calculator games The constant functions on a basic calculator can be used for investigating rules by pairs or groups of students.
Explain to small groups of students the rules of the following games:
What's Mу Rule? One student (the rule-maker) enters a calculation without others seeing what was done.
For example:
The machine is now set up to divide by 5 when-ever a number is entered and
is pushed.
For example:
Others in the group try various numbers followed
in an attempt to guess the rule. In this
case the rule is `divide by 5'.
The rule-maker scores one point for each trial number used by the opponents and one point for each time the opponents guess the wrong rule. A score of five or more points means the rule-maker continues; otherwise another player becomes the rule-maker for the next game.
This game assumes that students have had prior experience with the use of the four constant func- tions for + , — , x , on the calculator.
The calculator allows the search for and appli-cation of rules with a wide range of input and output numbers. For . example, set students the task of systematically searching for prime numbers and then applying a given rule using a calculator.
Big Primes Input: Prime numbers between 1000 and 1 100.
Rule: (2 x п ) + 3.
1.6
by
The points graphed will lie on part of a quadratic curve•
Output: To be established.
Input: 1
I I i
2
IN OUT
10. 2
Output: To be established.
This example involves a systematic search for prime numbers and, therefore, provides consoli-dation of number work, as well as application of rules stated in algebraic form.
130
131
Assessment must involve ongoing monitoring of students' progress throughout the year. A variety of pro-cedures — such as observation of students as they work with materials, informal discussions, and written tests
should be used to gather relevant information.
Students who have developed proficiency with the identification, of patterns and rules as outlined in the pre-algebra topic and who have shown readiness to move to more formal algebraic symbolisation should be able to use a variety of processes in a range of situations as suggested below. These tasks are not intended to be given to all students at the same time, especially when students are required to explain or demonstrate ideas or procedures.
Major processes Assessment ideas
Representing Explaining Classifying
Analysing Representing Validating Explaining
1. Use centicubes and film boxes or other containers to represent a variable to provide representations of
g+2 3 g, 2g + g; 2g + 1; 2g±2
2. Consider the following set of events:
• John has some dollars. • Lisa gives him two more dollars. . His father doubles what he then had.
Provide a representation of these steps in two ways: (i) using materials or diagrams on paper; and (ii) using symbolic statements.
3. Mary earns m dollars for each set of books she sells and is also paid $80 per week salary. In one four-week period her income is given by:
m+3m+ 320+ m
What is the value of the variable m if her earnings total $1900? (Use a calculator to assist you.)
4. A man spends as much time in the morning shaving as he does dressing. Together these times add to half the time he spends eating breakfast. Write an algebraic expression to show the total time he spends getting ready to leave home.
Explain (in written form or orally) your algebraic expression in terms of the original situation.
5. Paul and Pauline earn some money. He gets half of what she gets, and she receives $6 more than he does. Write an equation based on this situation. Model the situation using plastic containers as holders of a variable and centicubes as units.
6. Write stories that can be a basis for the algebraic statements below:
2g+3 (g+ 4)+3g 3(g — 2) 2g+3=24 2(g+ 3) = 24.
7. Don and Mary have some young hens that lay, on average, 6 eggs each per week. They also have the same number of older hens that lay only 3 eggs per week each. They sell these eggs, plus another 4 dozen eggs from the next door farm. Altogether they sell 31 dozen eggs per week through their roadside stall.
Write an equation and find out, by trial and error, how many hens the cои plе own.
Analysing Inferring Calculating Validating
Analysing Representing Explaining
Analysing Comparing Representing
Explaining Representing Inferring
Calculating Analysing Representing Comparing Inferring Validating

Length
Contents
Focus for teaching, learning and assessment Notes for teachers 1. Ač tivities to justify a study of length''.
(Focus A, В and C) (a) Cultural and historical aspects of length (b) Real-life applications of length (c) Open investigations
2. Activities for estimating, measuring and comparing lengths (Focus A, В and C)
(a) Classroom-related distances (b) Scale drawing of a wing of the school (c) Distances between cities across Australia
3. Activities for measuring and calculating circular distances. (Focus C,"D and E)
(a) Ratio of circumference to diameter ; (b) Investigations on the circle . l (c) A sports problem (d) Creating problems
136
4. Activities for finding perimeters of polygons (Focus D and E)
(a) Marking a school court for ball games (b) Perimeters of triangles (c) Perimeters of rectangles
137
137
5. Activities for investigating and creating problems (Focus E)
(a) Coin trails (b) Stride lengths
138
138 138
Activity sheets . 139
Assessment 141
133
135 136 136
136 136 137 137
137 137
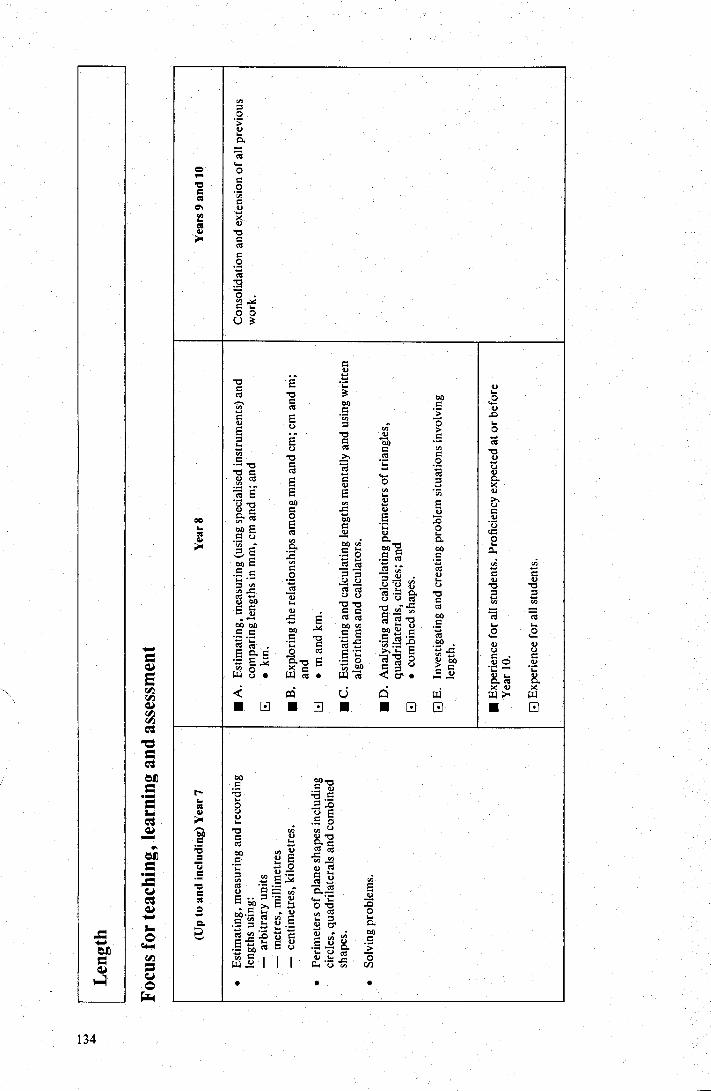
C а) . b Е ь,
сед b ý
04 од Е
Ё b 7 С Ú ca и
•e
Q ca сб
й сд у
гд E E E с
.,
с Ё cб =' и bD .
Е : Е о С
е .
уE•
О
:
•с
С
.
й
1
. . caca
с с оо • с Е с . ca . . ' ь.. С •п 7 ý_
0 ca ь, • E Ý G.•ц
Е О
W C)• W сед • W гд
Q W Ů
■ 0 в 0 ■
(Up
to
and
incl
udin
g) Y
ear
7
в
•
Sol
ving
pro
blem
s.
Focus fo
r te
achi
ng, l
earn
ing
and
asse
ssm
ent
134
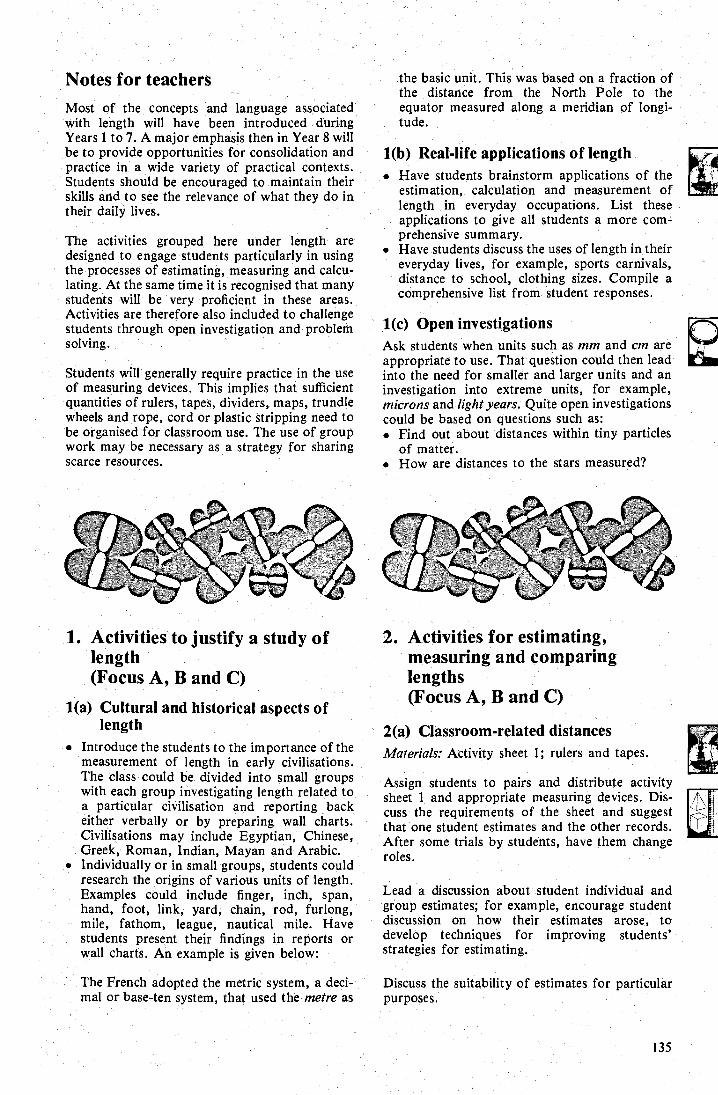
Notes for teachers Most of the concepts and language associated with length will have been introduced during Years 1 to 7. A major emphasis then in Year 8 will be to provide opportunities for consolidation and practice in a wide variety of practical contexts. Students should be encouraged to maintain their skills and to see the relevance of what they do in their daily lives.
The activities grouped here under length are designed to engage students particularly in using the processes of estimating, measuring and calcu-lating. At the same time it is recognised that many students will be very proficient in these areas. Activities are therefore also included to challenge students through open investigation and problem solving.
Students will generally require practice in the use of measuring devices. This implies that sufficient quantities of rulers, tapes, dividers, maps, trundle wheels and rope, cord or plastic stripping need to be organised for classroom use. The use of group work may be necessary as a strategy for sharing scarce resources.
the basic unit. This was based on a fraction of the distance from the North Pole to the equator measured along a meridian of longi-tude.
1(b) Real-life applications of length • Have students brainstorm applications of the
estimation, calculation and measurement of length in everyday occupations. List these applications to give all students a more com-prehensive summary.
. Have students discuss the uses of length in their everyday lives, for example, sports carnivals, distance to school, clothing sizes. Compile a comprehensive list from student responses.
1(c) Open investigations Ask students when units such as mm and cm are appropriate to use. That question could then lead into the need for smaller and larger units and an investigation into extreme units, for example, microns and light years. Quite open investigations could be based on questions such as: • Find out about distances within tiny particles
of matter. • How are distances to the stars measured?
1. Activities to justify a study of length (Focus A, B and C)
1(a) Cultural and historical aspects of length
• Introduce the students to the importance of the measurement of length in early civilisations. The class could be divided into small groups with each group investigating length related to a particular civilisation and reporting back either verbally or by preparing wall charts. Civilisations may include Egyptian, Chinese, Greek, Roman, Indian, Mayan and Arabic.
• Individually or in small groups, students could research the origins of various units of length. Examples could include finger, inch, span, hand, foot, link, yard, chain, rod, furlong, mile, fathom, league, nautical mile. Have students present their findings in reports or wall charts. An example is given below:
The French adopted the metric system, a deci- mal or base-ten system, that used the metre as
2. Activities for estimating, measuring and comparing lengths (Focus A, В and С )
2(a) Classroom-related distances Materials: Activity sheet 1; rulers and tapes.
Assign students to pairs and distribute activity sheet 1 and appropriate measuring devices. Dis-cuss the requirements of the sheet and suggest that one student estimates and the other records. After some trials by students, have them change roles.
Lead a discussion about student individual and group estimates; for example, encourage student discussion on how their estimates arose, to develop techniques for improving students' strategies for estimating.
Discuss the suitability of estimates for particular purposes.
135
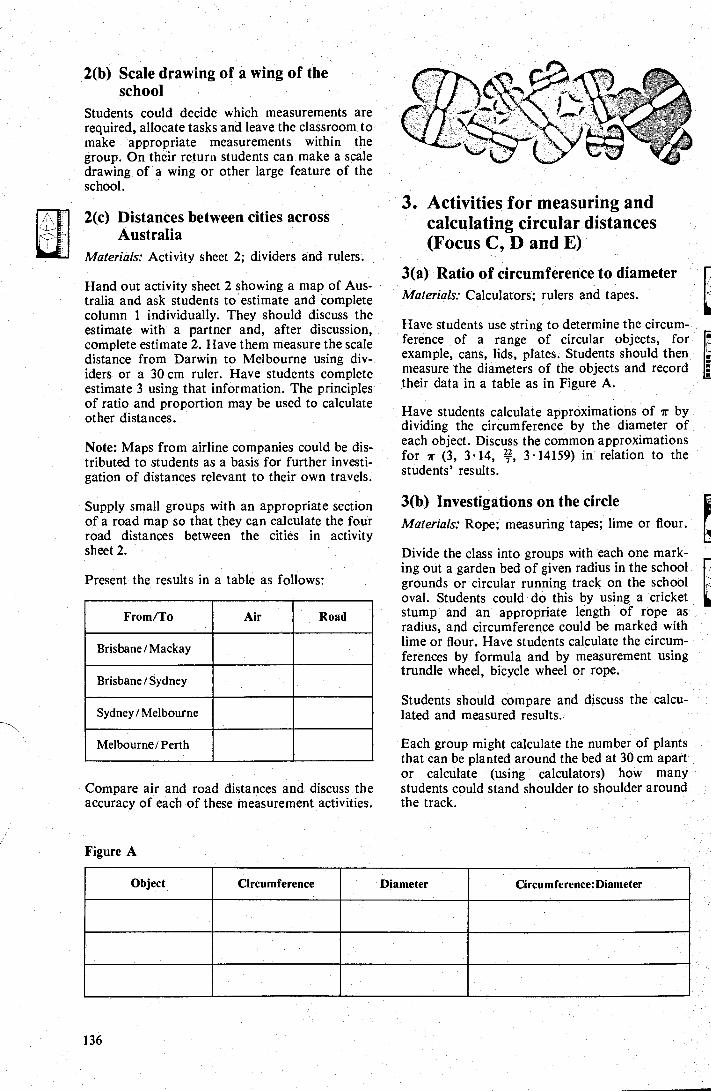
ii
2(b) Scale drawing of a wing of the school
Students could decide which measurements are required, allocate tasks and leave the classroom to make appropriate measurements within the group. On their return students can make a scale drawing of a wing or other large feature of the school.
2(c) Distances between cities across Australia
Materials: Activity sheet 2; dividers and rulers.
Hand out activity sheet 2 showing a map of Aus-tralia and ask students to estimate and complete column 1 individually. They should discuss the estimate with a partner and, after discussion, complete estimate 2. Have them measure the scale distance from Darwin to Melbourne using div-iders or a 30 cm ruler. Have students complete estimate 3 using that information. The principles of ratio and proportion may be used to calculate other distances.
Note: Maps from airline companies could be dis-tributed to students as a basis for further investi-gation of distances relevant to their own travels.
Supply small groups with an appropriate section of a road map so that they can calculate the four road distances between the cities in activity sheet 2.
Present the results in a table as follows:
From/To Air Road
Brisbane / Mackay
Brisbane / Sydney
Sydney I Melbourne
Melbourne / Perth
Compare air and road distances and discuss the accuracy of each of these measurement activities.
3. Activities for measuring and calculating circular distances (Focus C, D and Е )
3(a) Ratio of circumference to diameter Materials: Calculators; rulers and tapes.
Have students use string to determine the circum-ference of a range of circular objects, for example, cans, lids, plates. Students should then measure the diameters of the objects and record their data in a table as in Figure A.
Have students calculate approximations of ir by dividing the circumference by the diameter of each object. Discuss the common approximations for ir (3, 3.14, Z; , 3.14159) in relation to the students' results.
3(b) Investigations on the circle Materials: Rope; measuring tapes; lime or flour.
Divide the class into groups with each one mark-ing out a garden bed of given radius in the school grounds or circular running track on the school oval. Students could do this by using a cricket stump and an appropriate length of rope as radius, and circumference could be marked with lime or flour. Have students calculate the circum-ferences by formula and by measurement using trundle wheel, bicycle wheel or rope.
Students should compare and discuss the calcu-lated and measured results.
Each group might calculate the number of plants that can be planted around the bed at 30 cm apart or calculate (using calculators) how many students could stand shoulder to shoulder around the track.
w iC I. .
F
Figure A
Circu mference: Diameter Object Circumference Diameter
136
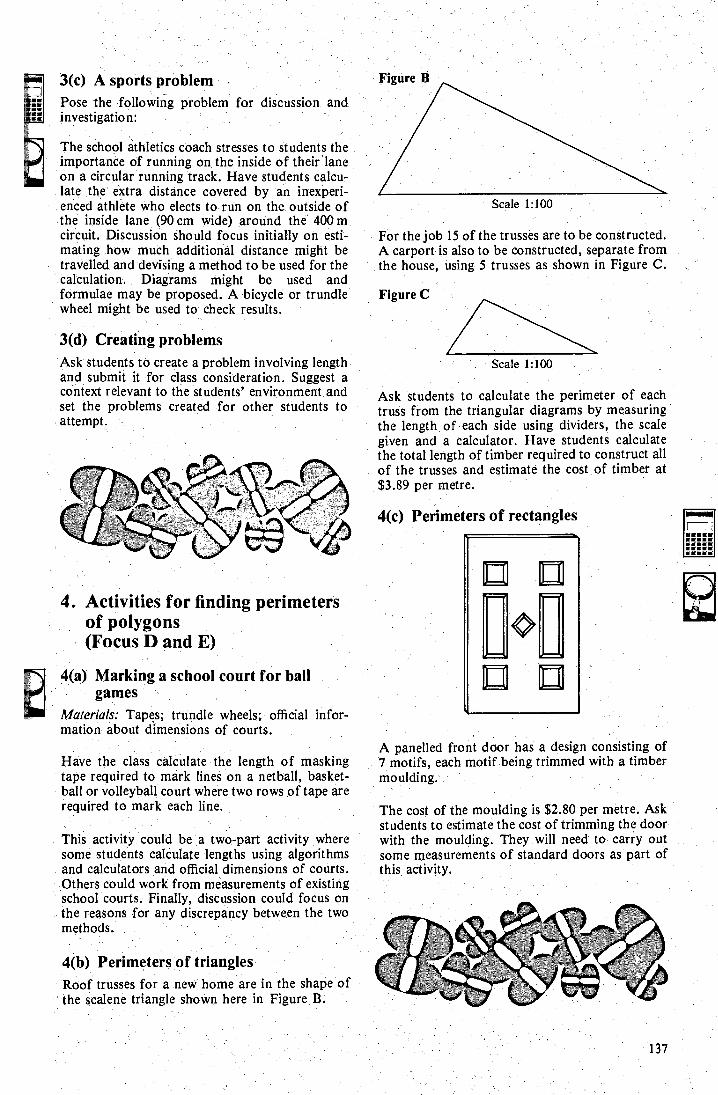
Scale 1:100
4. Activities for finding perimeters of polygons (Focus D and E)
4(a) Marking a school court for ball games
Materials:' Tapes; trundle wheels; official infor-mation about dimensions of courts.
3(с ) A sports problem Pose the following problem for discussion and investigation:
The school athletics coach stresses to students the importance of running on the inside of their lane on a circular running track. Have students calcu-late the extra distance covered by an inexperi-enced athlete who elects to run on the outside of the inside lane (90 cm wide) around the 400 m circuit. Discussion should focus initially on esti-mating how much additional distance might be travelled and devising a method to be used for the calculation. Diagrams might be used and formulae may be proposed. A bicycle or trundle wheel might be used to check results.
3(d) Creating problems Ask students to create a problem involving length and submit it for class consideration. Suggest a context relevant to the students' environment and set the problems created for other students to attempt.
Have the class calculate the length of masking tape required to mark lines on a netball, basket-ball or volleyball court where two rows of tape are required to mark each line.
This activity could be a two-part activity where some students calculate lengths using algorithms and calculators and official dimensions of courts. Others could work from measurements of existing school courts. Finally, discussion could focus on the reasons for any discrepancy between the two methods.
4(b) Perimeters of triangles Roof trusses for a new home are in the shape of the scalene triangle shown here in Figure В .
Figure В
Scale 1:100
For the job 15 of the trusses are to be constructed. A carport is also to be constructed, separate from the house, using 5 trusses as shown in Figure C.
Ask students to calculate the perimeter of each truss from the triangular diagrams by measuring the length , of each side using dividers, the scale given and a calculator. Have students calculate the total length of timber required to construct all of the trusses and estimate the cost of timber at $3.89 per metre.
4(c) Perimeters of rectangles
A panelled front door has a design consisting of 7 motifs, each motif being trimmed with a timber moulding:
The cost of the moulding is $2.80 per metre. Ask students to estimate the cost of trimming the door with the moulding. They will need to carry out some measurements of standard doors as part of this activity.
137
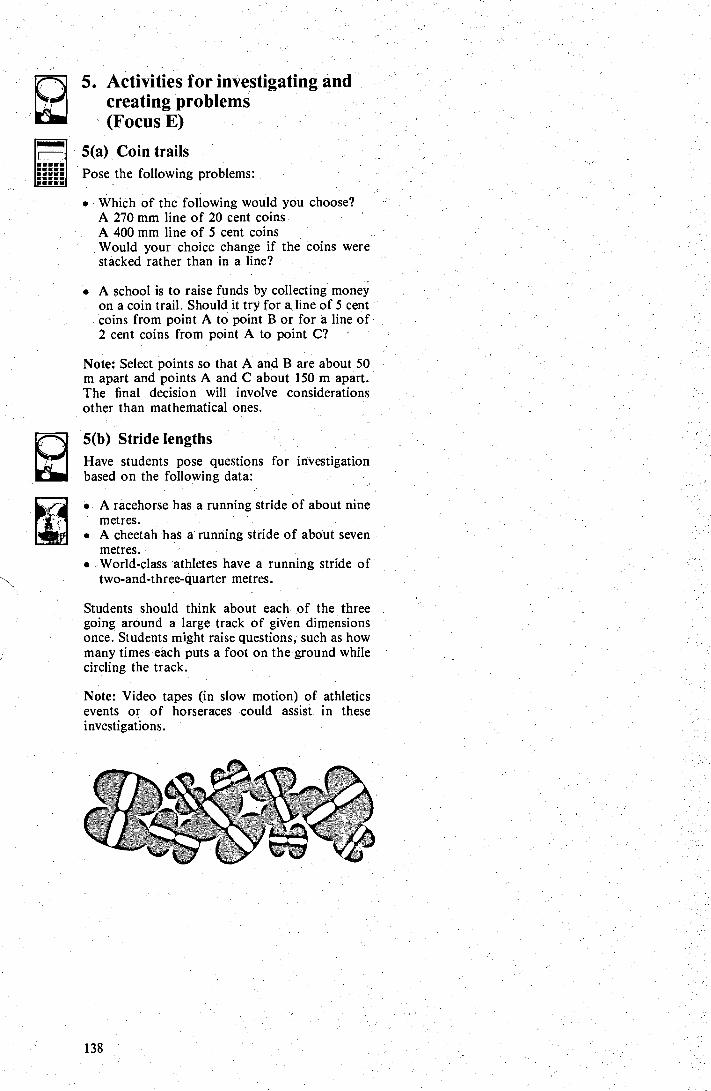
138
5. Activities for investigating and creating problems (Focus E)
5(a) Coin trails Pose the following problems:
. Which of the following would you choose? A 270 mm line of 20 cent coins A 400 mm line of 5 cent coins Would your choice change if the coins were stacked rather than in a line?
• A school is to raise funds by collecting money on a coin trail. Should it try for a line of 5 cent coins from point A to point B or for a line of 2 cent coins from point A to point C?
Note: Select points so that A and B are about 50 m apart and points A and C about 150 m apart. The final decision will involve considerations other than mathematical ones.
5(b) Stride lengths Have students pose questions for investigation based on the following data:
• A racehorse has a running stride of about nine metres.
• A cheetah has a running stride of about seven metres.
. . World-class athletes have a running stride of two-and-three-quarter metres.
Students should think about each of the three going around a large track of given dimensions once. Students might raise questions, such as how many times each puts a foot on the ground while circling the track.
Note: Video tapes (in slow motion) of athletics events or of horseraces could assist in these investigations.
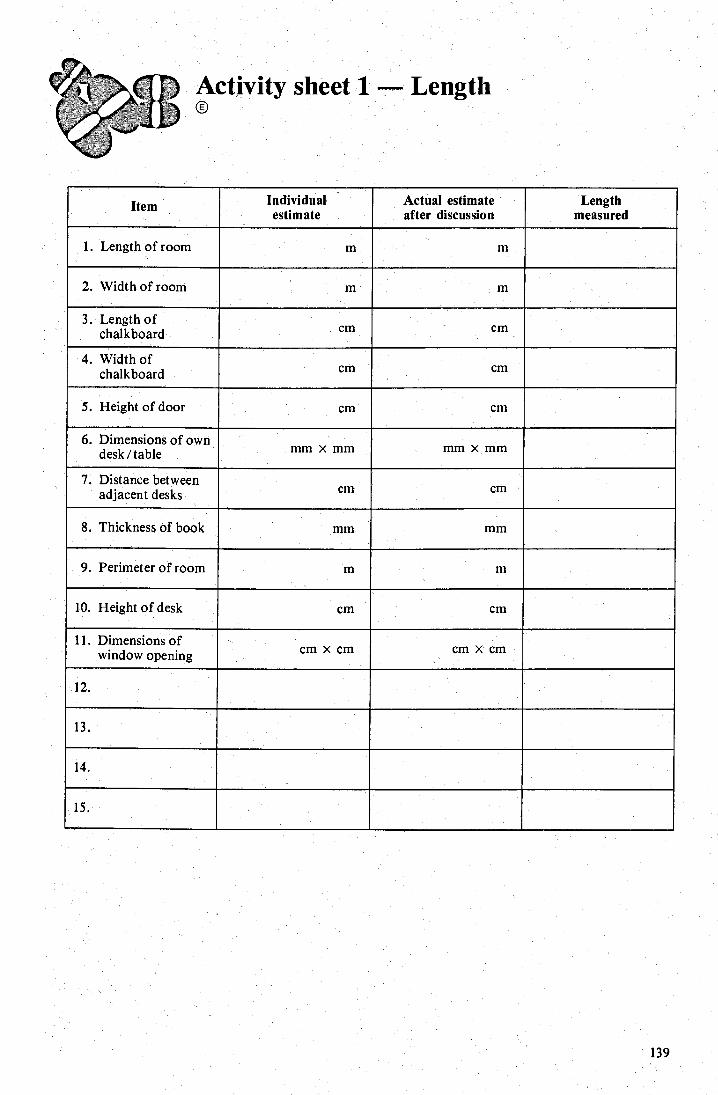
т ; m
Individual estimate
Actual estimate after discussion
Length measured
Item
6. Dimensions of own desk / table тт xmm mm x mm
11. Dimensions of window opening cm х Cr cm x cm
1. Length of room
с m Cr 5. Height of door
mm mm 8. Thickness of book
139
2. Width of room m m
3. Length of chalkboard
4. Width of chalkboard
Cr Cr
Cr ст
7. Distance between adjacent desks
9. Perimeter of room
10. Height of desk
cm Cr
m т
cm cm
12.
13.
14.
15.
Activity sheet 2 - Length
гк ;::ї новакт
It is about 3 100 km by air from Darwin to Melbourne. Use this fact to estimate the air distances.
From/To Estimate 3 Estimate 1 Estimate 2
Brisbane / Mackay
Brisbane / Sydney
Sydney / Melbourne
Melbourne / Perth
140
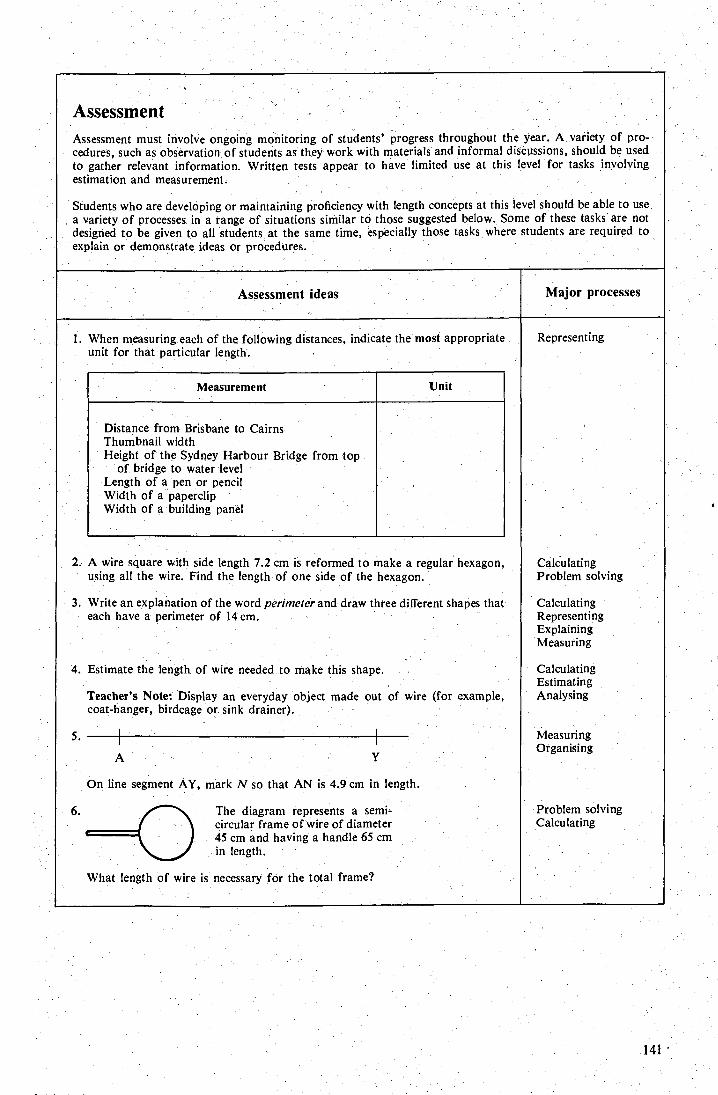
Assessment Assessment must involve ongoing monitoring of, students' progress throughout the year. A variety of pro-cedures, such as observation of students as they work with materials and informal disć ussions, should be used to gather relevant information. Written tests appear to have limited use at this level for tasks involving estimation and measurement:
Students who are developing or maintaining proficiency with length concepts at this level should be able to use. a variety of processes in a range of situations similar to those suggested below. Some of these tasks are not designed to be given to all students at the same time, especially those tasks where students are required to explain or demonstrate ideas or procedures.
Major processes Assessment ideas
Representing 1. When measuring each of the following distances, indicate the most appropriate unit for that particular length.
Measurement
Unit
Distance from Brisbane to Cairns, Thumbnail width Height of the Sydney Harbour Bridge from top
of bridge to water level Length of a pen or pencil Width of a paperclip Width of a building panel
2. A wire square with side length 7.2 cm is reformed to make a regular hexagon, using all the wire. Find the length of one side of the hexagon.
3. Write an explanation of the word perimeter and draw three different shapes that each have a perimeter of 14 cm.
4. Estimate the length of wire needed to make this shape.
Teacher's Note: Display an everyday object made out of wire (for example, coat-hanger, birdcage or sink drainer).
А Y
On line segment AY, mark N so that AN is 4.9 cm in length.
Calculating Problem solving
Calculating Representing Explaining Measuring
Calculating Estimating Analysing
Measuring Organising
Problem solving Calculating
The diagram represents a semi-circular frame of wire of diameter 45 cm and having a handle 65 cm in length.
What length of wire is necessary for the total frame?
141

147 148
149
Contents i
Focus for teaching, learning and assessment Notes for teachers 1. Activities for justifying a study of area
(Focus A, B and F) (a) Réal-lïfe applications: Occupations (b) Real-life applications:, Personal lives (c) Research, investigation: Units of area
2. Activities for estimating, calculating and comparing areas (Focus A and B)
(а ) Areas of familiar objects (b) Carpet-tile pattern problems
3—Activities for pattern searching among areas of figures constructed on sides of right-angled triangles (Focus E and F)
(a) Equilateral triangles (b) Other similar figures
I 4. Activities for finding surface areas of rectangular prisms
(Focus C and F) (a) Surface areas of rectangular prisms b) Cutting boxes
(e) Painting panels
5. Activities for applying formulae to solve practič al, proble (Focus F)
(a) Advertising related to area (b) Areas of combined shapes
144
6. Activities for solving and creating problems (FocusDandF)
(a) Puzzles and patterns w ť h area (b) Investigating perimeters and areas
г d
F, Activity sheets
Assessment
143
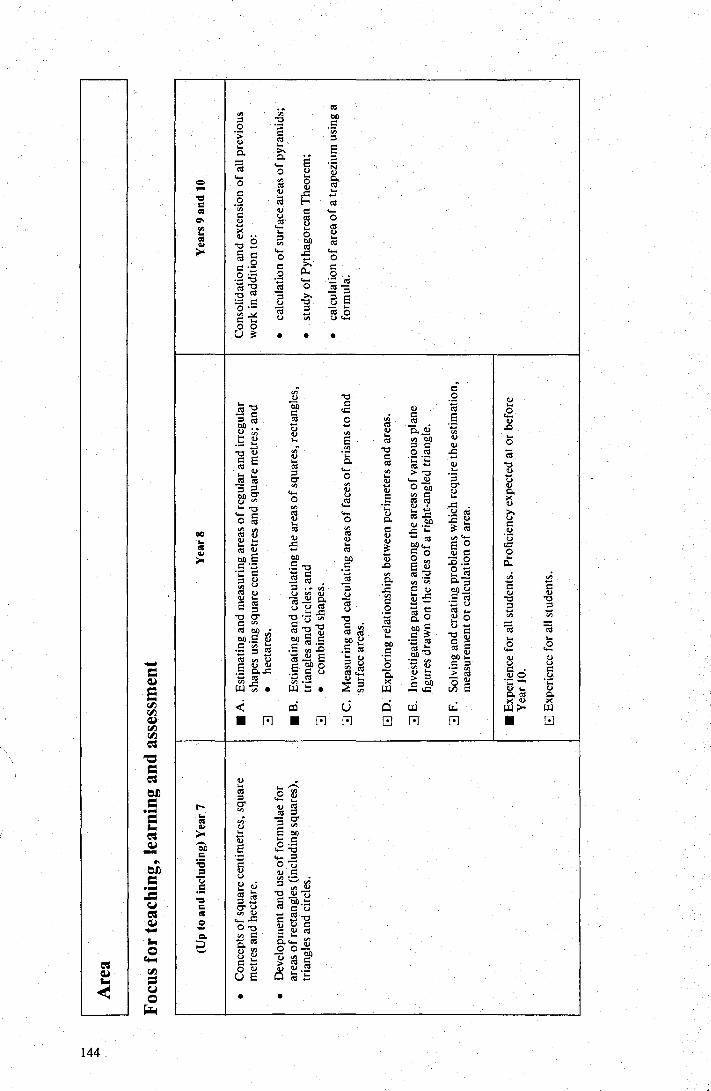
Yea
rs 9
and
10
U 3 •
•
stu
dy of
Py t
hago
rean
The
orem
;
CO á •v о
. Смд b a cĆ
b70 . CO. . .у0 CO С а, у , 0. a?
- ь. .. . . еб . и 00 :
Т 3 N И и G CO
COб С А
0. C C~б , ам.. N а) W . И
Смб _ COд ' О • . . o у . с.. á С .v L) о о 0 v w д 0 О Е
v гCC
С•r С ..
CO ., w.. . у CO .С •н Cб OCO а ) о G. ż од и и CO~
сиб CO ,. 3 смд
м CO ` N . bA w И о CO 4) -•- CO C о L) CO oa b0 а 0: . N о и Л ... CO . 'ß С Л 'ь. CO . CO и CO. тв м ć Чд Ρ С ' й E. CO Сд • Ř . и v и CO L) ü iл у C3j . й
Ń с сб . .'
4) CO CO й . сб CO C а -• и
. C . ь Ρ. Л О гб С CO м•
ц á• C И _ . о • о о
vi с _
i C С сб ` a COCO 3 й е 0 .., а ) Ø. CO C_ о 0 CO С С и Л •C Cб oa CO, Сб v.
•Cб и Ú • С
.L) С 4_ Q) •G ОА и b0 м
С С •. С .. с СО) и .. С д •й - CO, Сд аС) ь . Х > С ? CO
r•, а ) И й • И ..м, • G й W —' Й ¢ а; Ů СА иа • Е ■ о о о а о E
Exp
erie
nce
for
all s
tude
nts.
4) CO w
(Up
to
and
incl
ud
ing)
Ye a
r 7
Foc
us f
or te
ach
ing,
lear
ning
an d
ass
ess
144
Notes for teachers
Many of the concepts and much of the language associated with area will have been introduced during Years 1 to 7. A major emphasis in Year 8 will be to provide opportunities for consolidation and practice in a wide variety of practical con-texts. Students should be encouraged to maintain their skills and to see how the skills contribute to their daily lives.
The activities grouped here under area are designed to engage students particularly in using the processes of estimating, measuring and calcu-lating. At the same time it is recognised that many students will be very proficient in these areas., Activities, are also included to challenge students through open investigation and problem solving.
Students will generally require practice in the use of measuring devices. This means that sufficient quantities of area grids, grid paper, rulers, tapes, dividers, maps, trundle wheels and rope, cord or plastic stripping need to be organised for class-room use. Group work may be necessary as a strategy for sharing scarce resources.
When devising problems associated with area, make sure they are as practical as possible and linked to student interests and local concerns.
1. Activities for justifying a study of area (Focus A, В and F)
1(a) Real-life applications: Occupations Have students work in pairs or small groups list-ing occupations from their experience which require a knowledge or application of area. Some groups may need initial assistance or guidance, but most should be able to proceed indepen-dently. After the group discussion, ask students to compile a comprehensive class list.
1(b) Real-life applications: Personal lives Assign students to work in pairs or small groups to list applications of area which play a role in their personal life. Some groups may need some initial assistance to get started, for example, applications in sporting activities. After group discussion, have students compile a comprehen-sive class list following group reports.
1(c) Research investigation: Units of area Have students research the origins of units of area, for example, perch, rood, acre and compare them with metric units. Information such as the following can be collected and discussed:
The Anglo-Saxons decided that the amount of land ploughed in one day by a pair of oxen would be a unit called an acre.
2. Activities for estimating, calculating and comparing areas (Focus A and В )
2(a) Areas of familiar objects As a whole class discussion, establish a reason for estimating areas of objects familiar to students; for example, it may be necessary to repaint chalkboards throughout the school. Direct the following questions to students:
• How would we determine how much paint is required?
• How would we estimate the area of each chalkboard and the total area?
Record some of the upper and lower student esti-mates and discuss the seriousness of the differ-ences in real-life applications.
Encourage students, either individually or in small groups, to establish reasons for finding the areas of particular surfaces and subsequently to estimate and calculate areas.
2(b) Carpet-tile pattern problems Present students with the following problem either on a handout or an OHT:
Carpet tiles are 60 cm squares of carpet that fit together to carpet a floor. They can be cut to fit in awkward corners. You have to carpet a room that measures 360 cm by 480 cm. You have decided that you want a patterned floor, not a plain one, so you decide to buy carpet tiles in two colours and make your own pattern.
Create four distinct ways of carpeting the room.
For each pattern work out how many of each tile you need to buy. These tiles are sold only in packs
145
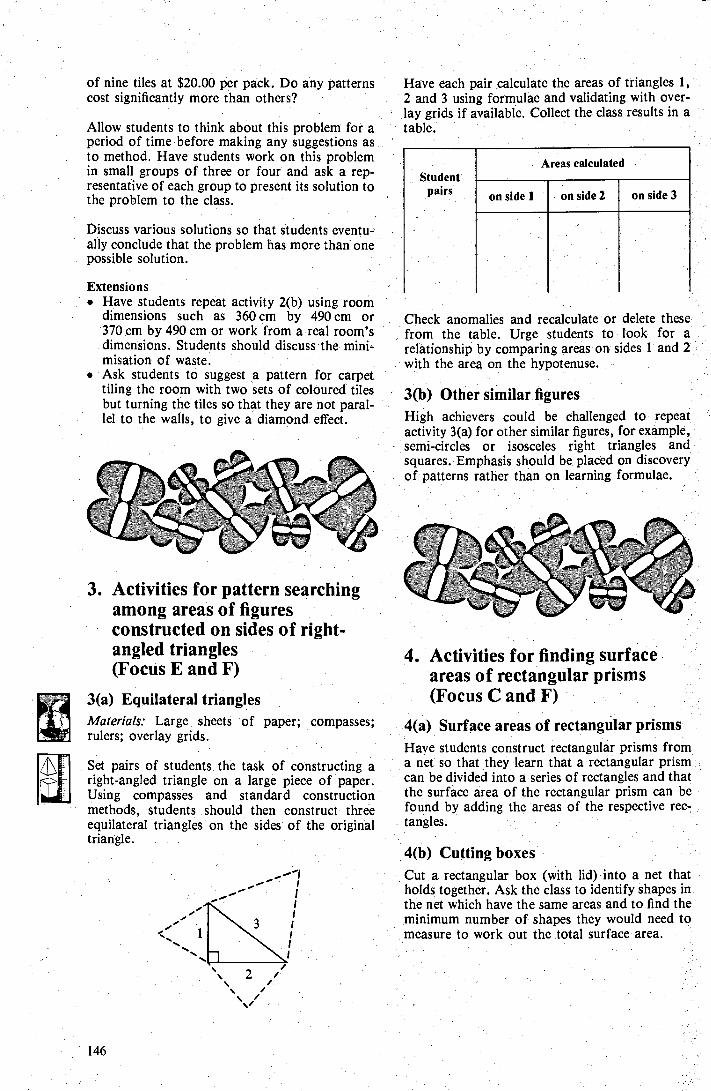
3. Activities for pattern searching among areas of figures constructed on sides of right-angled triangles (Focus E and F)
3(a) Equilateral triangles Materials: Large sheets of paper; compasses; rulers; overlay grids.
Set pairs of students the task of constructing a right-angled triangle on a large piece of paper. Using compasses and standard construction methods, students should then construct three equilateral triangles on the sides of the original triangle.
'
. ' . ...... .... .... .... i
`. 2 . . , ‚,
Have each pair calculate the areas of triangles 1,' 2 and 3 using formulae and validating with over-lay grids if available. Collect the class results in a table.
Areas calculated Student
pairs on side 1
on side 2
on side 3
Check anomalies and recalculate or delete these from the table. Urge students to look for a relationship by comparing areas on sides 1 and 2 with the area on the hypotenuse.
3(b) Other similar figures High achievers could be challenged to repeat activity 3(a) for other similar figures, for example, semi-circles or isosceles right triangles and squares. Emphasis should be placed on discovery. of patterns rather than on learning formulae.
4. Activities for finding surface areas of rectangular prisms (Focus C and F)
4(a) Surface areas of rectangular prisms Have students construct rectangular prisms from a net so that they learn that a rectangular prism can be divided into a series of rectangles and that the surface area of the rectangular prism can be found by adding the areas of the respective rec-tangles.
4(b) Cutting boxes Cut a rectangular box (with lid) into a net that holds together. Ask the class to identify shapes in the net which have the same areas and to find the minimum number of shapes they would need to measure to work out the total surface area.
of nine tiles at $20.00 per pack. Do any patterns cost significantly more than others?
Allow students to think about this problem for a period of time before making any suggestions as to method. Have students work on this problem in small groups of three or four and ask a rep-resentative of each group to present its solution to the problem to the class.
Discuss various solutions so that students eventu-ally conclude that the problem has more than one possible solution.
Extensions • Have students repeat activity 2(b) using room
dimensions such as 360 cm by 490 cm or 370 cm by 490 cm or work from a real room's dimensions. Students should discuss the mini-misation of waste.
• Ask students to suggest a pattern for carpet tiling the room with two sets of coloured tiles but turning the tiles so that they are not paral-lel to the walls, to give a diamond effect.
146
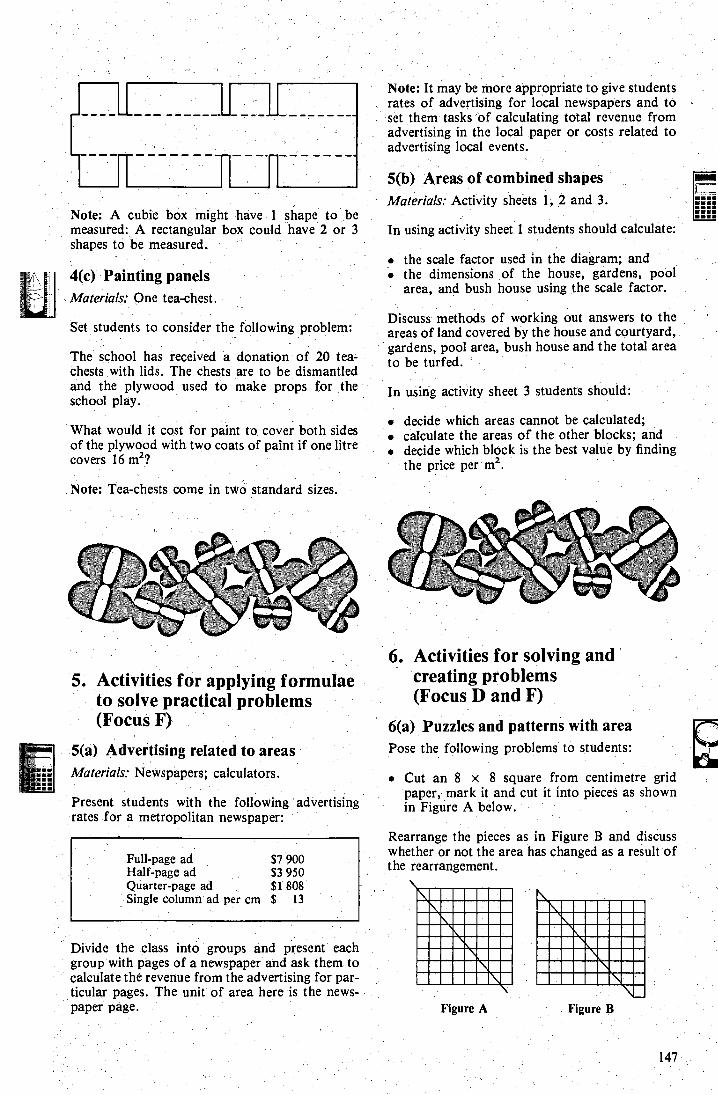
147
Note: A cubic box might have 1 shape to be measured: A rectangular box could have 2 or 3 shapes to be measured.
Note: It may be more appropriate to give students rates of advertising for local newspapers and to set them tasks of calculating total revenue from advertising in the local paper or costs related to advertising local events.
5(b) Areas of combined shapes Materials: Activity sheets 1, 2 and З . In using activity sheet 1 students should calculate:
4(c) Painting panels Materials: One tea-chest.
Set students to consider the following problem:
The school has received a donation of 20 tea-chests with lids. The chests are to be dismantled and the plywood used to make props for the school play.
What would it cost for paint to cover both sides of the plywood with two coats of paint if one litre covers 16 m2?
Note: Tea-chests come in two standard sizes.
• the scale factor used in the diagram; and • the dimensions of the house, gardens, pool
area, and bush house using the scale factor.
Discuss methods of working out answers to the areas of land covered by the house and courtyard, gardens, pool area, bush house and the total area to be turfed.
In using activity sheet 3 students should:
• decide which areas cannot be calculated; • calculate the areas of the other blocks; and • decide which block is the best value by finding
the price per m2.
5. Activities for applying formulae to solve practical problems (Focus F)
5(a) Advertising related to areas Materials: Newspapers; calculators.
Present students with the following advertising rates for a metropolitan newspaper:
Divide the class into groups and present each group with pages of a newspaper and ask them to calculate the revenue from the advertising for par-ticular pages. The unit of area here is the news-paper page.
6. Activities for solving and creating problems (Focus D and F)
б (a) Puzzles and patterns with area Pose the following problems to students:
• Cut an 8 x 8 square from centimetre grid paper, mark it and cut it into pieces as shown in Figure A below.
Rearrange the pieces as in Figure .13 and discuss whether or not the area has changed as a result of the rearrangement.
N Figure A Figure B
Full-page ad Half-page ad Quarter-page ad Single column ad per cm
$7 900 $3 950 $1 808 s '13
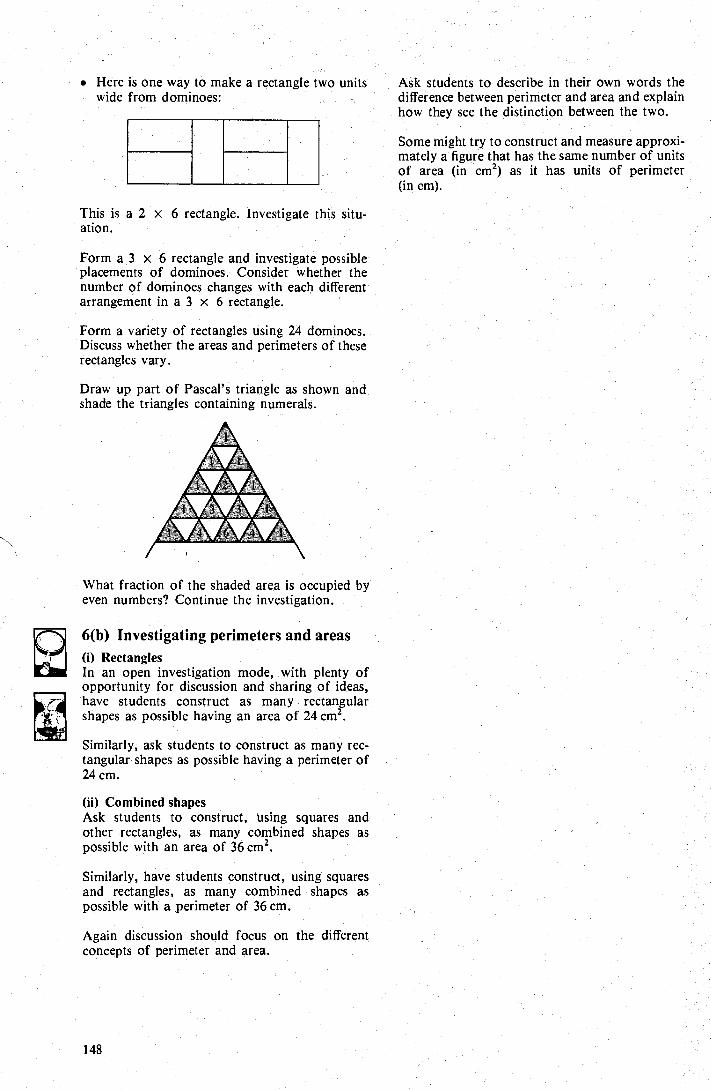
• Here is one way to make a rectangle two units wide from dominoes:
Ask students to describe in their own words the difference between perimeter and area and explain how they see the distinction between the two.
Some might try to construct and measure approxi-mately a figure that has the same number of units of area (in cm2) as it has units of perimeter (in cm).
This is a 2 x б rectangle. Investigate this situ-ation.
Form а 3 x б rectangle and investigate possible placements of dominoes. Consider whether the number of dominoes changes with each different arrangement in a 3 x б rectangle.
Form a variety of rectangles using 24 dominoes. Discuss whether the areas and perimeters of these rectangles vary.
Draw up part of Pascal's triangle as shown and shade the triangles containing numerals.
What fraction of the shaded area is occupied by even numbers? Continue the investigation.
O(b) Investigating perimeters and areas
(i) Rectangles In an open investigation mode, with plenty of opportunity for discussion and sharing of ideas, have students construct as many rectangular shapes as possible having an area of 24 cm2.
Similarly, ask students to construct as many rec-tangular shapes as possible having a perimeter of 24 cm.
(ii) Combined shapes Ask students to construct, using squares and other rectangles, as many combined shapes as possible with an area of 36 cm2.
Similarly, have students construct, using squares and rectangles, as many combined shapes as possible with a perimeter of 36 cm.
Again discussion should focus on the different concepts of perimeter and area.
148
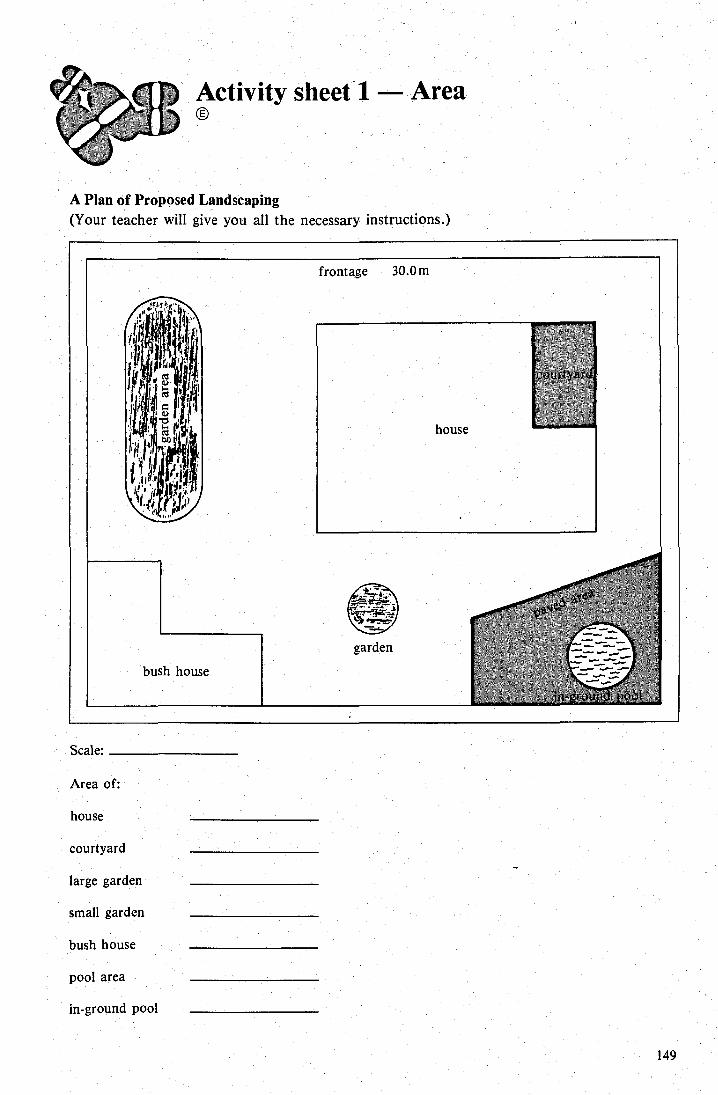
frontage 30.0 т
A Plan of Proposed Landscaping (Your teacher will give you all the necessary instructions.)
Sca1e:
Area of:
house
courtyard
large garden
small garden
bush house
pool area
in-ground pool
149
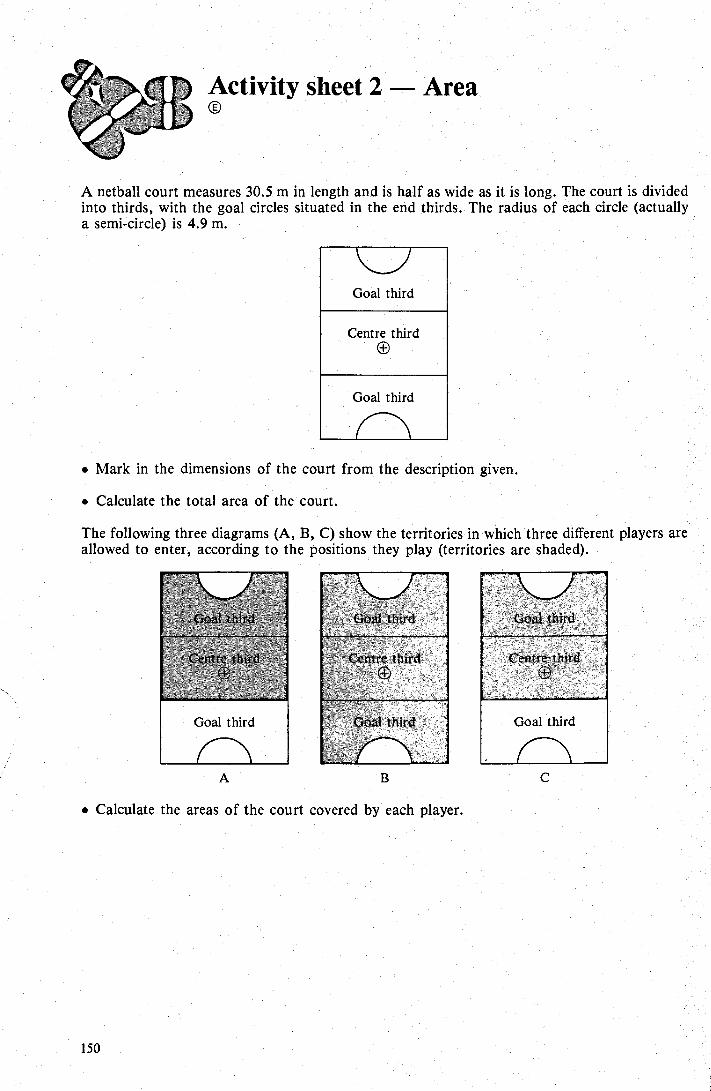
Goal third
Centre third
Goal third
A
Activity sheet 2 — Area о
A netball court measures 30.5 m in length and is half as wide as it is long. The court is divided into thirds, with the goal circles situated in the end thirds. The radius of each circle (actually a semi-circle) is 4.9 m.
• Mark in the dimensions of the court from the description given.
• Calculate the total area of the court.
The following three diagrams (A, В , C) show the territories in which three different players are allowed to enter, according to the positions they play (territories are shaded).
• Calculate the areas of the court covered by each player.
150
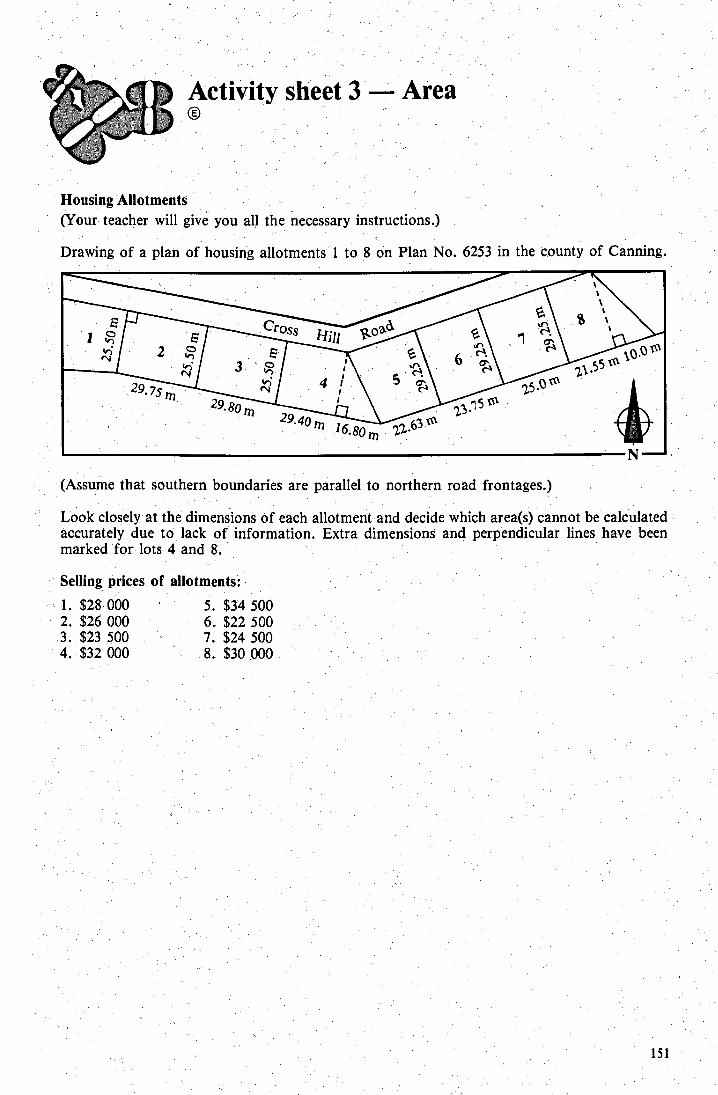
1. $28 000 2. $26 000 3. . $23 500 4. $32 000
5. $34 500 6. $22 500 7. $24 500 8. $30 000
151
Activity sheet 3 Area ®
Housing Allotments (Your teacher will give you all the necessary instructions.)
Drawing of a plan of housing allotments 1 to 8 on Plan No. 6253 in the county of Canning.
(Assume that southern boundaries are parallel to northern road frontages.)
Look closely at the dimensions of each allotment and decide which area(s) cannot be calculated accurately due to lack of information. Extra dimensions and perpendicular lines have been marked for lots 4 and 8.
Selling prices of allotments:
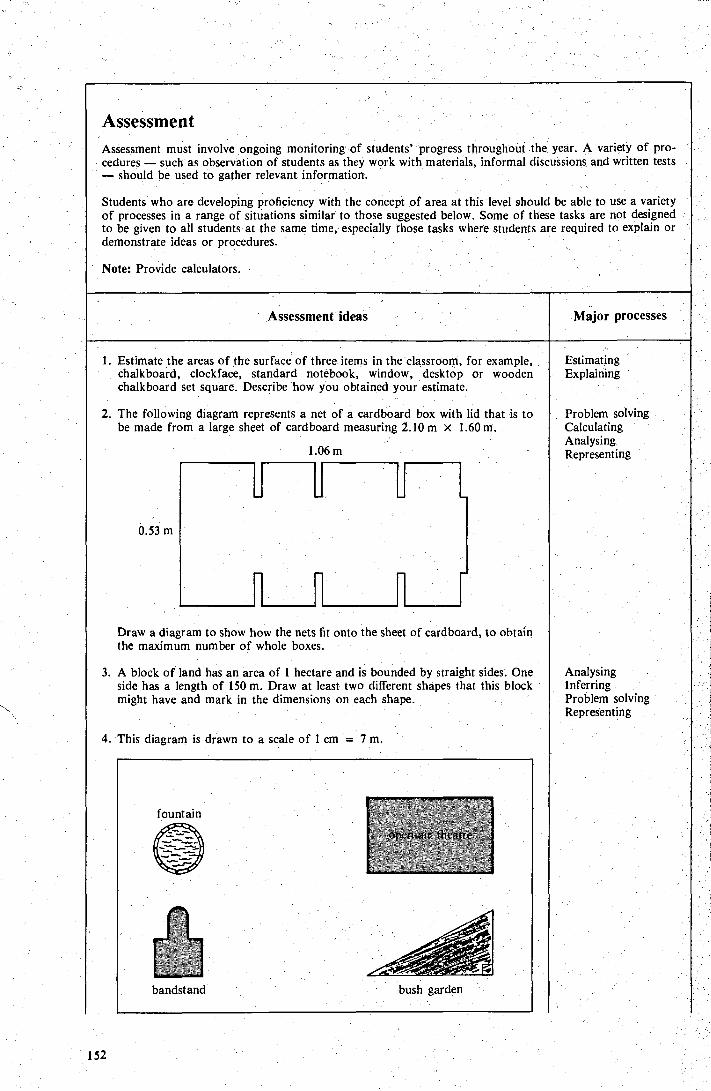
4. This diagram is drawn to a scale of 1 cm = 7 r,
Assessment Assessment must involve ongoing monitoring of students' progress throughout the. year. A variety of pro-cedures — such as observation of students as they work with materials, informal discussions and written tests — should be used to gather relevant information.
Students who are developing proficiency with the concept of area at this level should be able to use a variety of processes in a range of situations similar to those suggested below. Some of these tasks are not designed to be given to all students at the same time, especially those tasks where students are required to explain or demonstrate ideas or procedures.
Note: Provide calculators.
Major processes Assessment ideas
Estimating Explaining
1. Estimate the areas of the surface of three items in the classroom, for example, chalkboard, clockface, standard notebook, window, desktop or wooden chalkboard set square. Describe how you obtained your estimate.
2. The fòllowing diagram represents a net of a cardboard box with lid that is to be made from a large sheet of cardboard measuring 2.10 m x 1.60 m.
1.06 m
0:53 m
Problem solving Calculating Analysing Representing
Draw a diagram to show how the nets fit onto the sheet of cardboard, to obtain the maximum number of whole boxes.
3. A block of land has an area of 1 hectare and is bounded by straight sides. One side has a length of 150 m. Draw at least two different shapes that this block might have and mark in the dimensions on each shape.
Analysing . Inferring Problem solving Representing
152
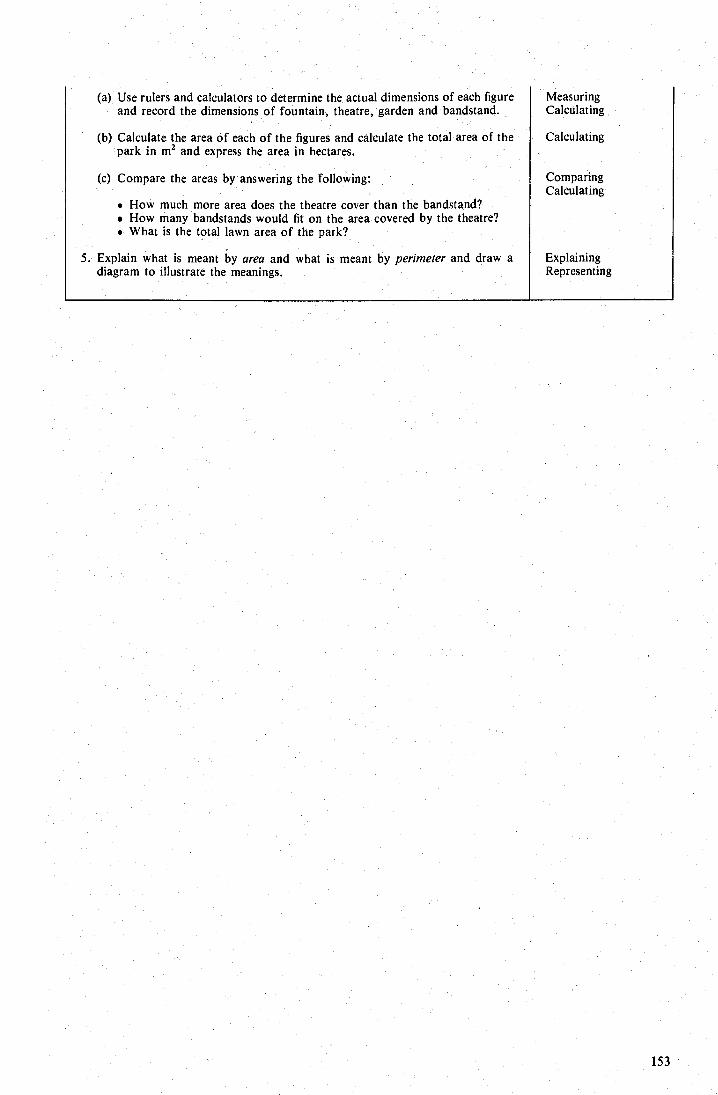
(a) Use rulers and calculators to determine the actual dimensions of each figure
Measuring and record the dimensions of fountain, theatre, garden and bandstand. Calculating
(b) Calculate the area of each of the figures and calculate the total area of the
Calculating park in m2 and express the area in hectares.
(c) Compare the areas by answering the following: Comparing
Calculating • How much more area does the theatre cover than the bandstand? • How many bandstands would fit on the area covered by the theatre? • What is the total lawn area of the park?
5. Explain what is meant by area and what is meant by perimeter and draw a
Explaining diagram to illustrate the meanings. Representing
153

159 159
160
1 60
160
160 161
Volume and three-dimensional shapes Contents ..
Focus for teaching, learning and assessment Notes for teachers 1. Activities for investigating the terminology and application of
volume in society (Focus E, F and G)
(a) Cultural and historical aspects (b) Everyday applications
2. Activities for estimating, measuring and comparing volumes (Focus E and F)
(a) Investigations using blocks (b) Large volumes (c) Small volumes
3. Activities for comparing and explaining relationships between lE units of volume f¿ (Focus E and F) (a) Relating cm3 to mL (b) Using commercial literature
4. Activities for finding volumes of cylinders and prisms (Focus B, C, D, E and G)
(a) Using stacked discs (b) Estimating volumes (c) Packaging problems
5. Activities for relating side length to area and volume (Focus A and G)
(a) Cubes
6. Activities for constructing and analysing shapes (Focus A and В )
(a) Basic shapes (b) Further shapes
7. Activities for exploring sections of solids (Focus A, В , C and D)
(a) Visualising faces, edges and vertices (b) Cutting sections of solids (c) Planes of symmetry
Assessment
155
Yea
rs 9
an
d 1
0
a
. . и .. . и 'С
й
• ç г и Ń а й b •
у
.г а 3 ь.0 Q у і . Ń . . С •ц с о•
у С ^ а) у С п f С ^
с д v 3 од ° и
� .
д
•
о и саб .~,, •,ń . п . . E . R
o ' .
•
о о и . а и
- .+ ..q)+ .^ ¿д сб 00 0• г•
❑ " а ) л о а, а " °'
.. ., 't: . й ~ . O а д С м
.E ro . Ú_ а Ф Е .
и
Ё ú а г ❑
С С
_
. v• b . Т 3м С .
п • м.
сб ..
р C 00 U О co
3 .
и Е
Ď 3...
2 сб а) eгб С и OO Е 7 .L3 w С cUtl •О N г гл" С ч . О
▪
•С .+. а п S C к
Ć L д Е b С C С и д ..a 'й и ,
со „u д Е• с '.. сЕб О сб О
•
a i сб Т 7 р TJ . О .
й ) Q
Qu, ø сc пв a u, -u
•С
С _ •и > ьг. сб у •и еб
• ; сУб Е ..+' с аС) О Ьд о . а") л и w и л á, л . С
L Ё
.. а ' а) г Я С сд . и R . E С о С ај й 4 о а)v — о < ' U °• < . < й W..E й е . А ь°3 °•
Q Ů д fг1 ц. d ■ ■ ❑ ■ о ■ ■ о p
Ex
p eri
ence
for
all
stu
den
ts.
(Up
to
an
d i
nc l
ud
ing)
Yea
r 7
. ne
ts o
f m
ore
com
ple
x so
lids
;
• - •
Vol
umes
of
cube
s a
n d p
r is m
s.
Pro
blem
so
lvin
g o
f a
pr a
ctic
al n
atu
re.
Fo
c us
for
teac
hin
g, l
earn
ing
and
ass
essm
ent
Vol
um
e an
d t
hre
e-d
imen
sio
nal
sh
apes
156
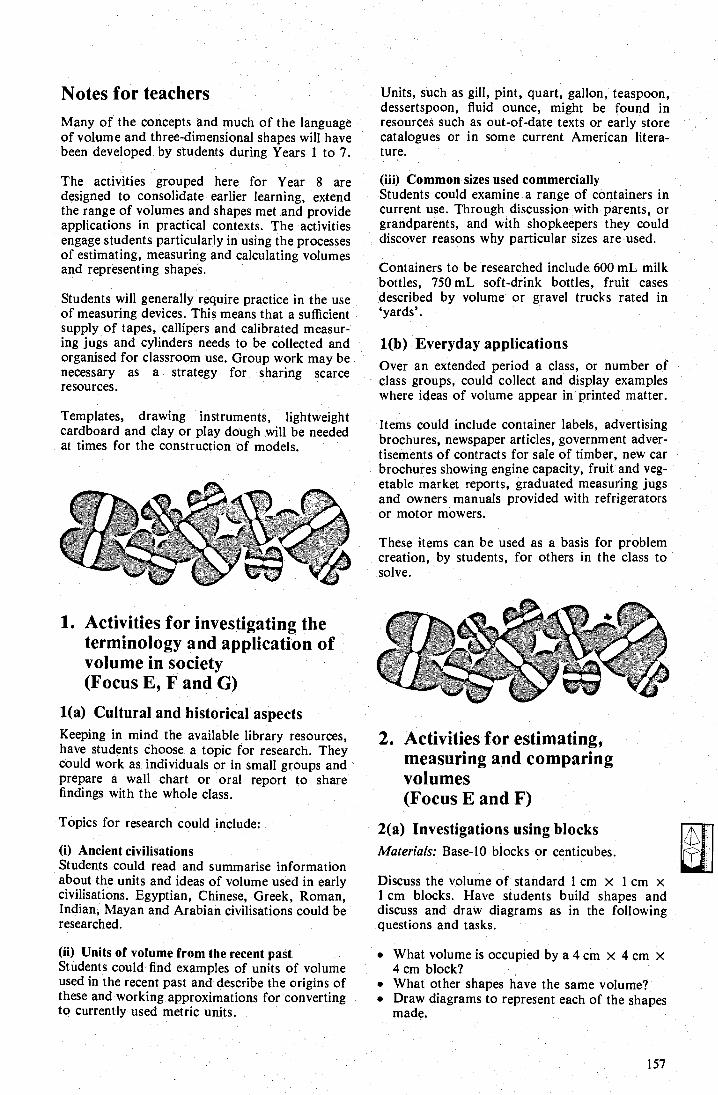
Notes for teachers
Many of the concepts and much of the language of volume and three-dimensional shapes will have been developed by students during Years 1 to 7.
The activities grouped here for Year 8 are designed to consolidate earlier learning, extend the range of volumes and shapes met and provide applications in practical contexts. The activities engage students particularly in using the processes of estimating, measuring and calculating volumes and representing shapes.
Students will generally require practice in the use of measuring devices. This means that a sufficient supply of tapes, callipers and calibrated measur-ing jugs and cylinders needs to be collected and organised for classroom use. Group work may be necessary as a strategy for sharing scarce resources.
Templates, drawing instruments, lightweight cardboard and clay or play dough will be needed at times for the construction of models.
Units, such as gill, pint, quart, gallon, teaspoon, dessertspoon, fluid ounce, might be found in resources such as out-of-date texts or early store catalogues or in some current American litera-ture.
(iii) Common sizes used commercially Students could examine a range of containers in current use. Through discussion with parents, or grandparents, and with shopkeepers they could discover reasons why particular sizes are used.
Containers to be researched include 600 mL milk bottles, 750 mL soft-drink bottles, fruit cases described by volume or gravel trucks rated in `yards'.
1(b) Everyday applications Over an extended period a class, or number of class groups, could collect and display examples where ideas of volume appear in printed matter.
Items could include container labels, advertising brochures, newspaper articles, government adver-tisements of contracts for sale of timber, new car brochures showing engine capacity, fruit and veg-etable market reports, graduated measuring jugs and owners manuals provided with refrigerators or motor mowers.
These items can be used as a basis for problem creation, by students, for others in the class to solve.
1. Activities for investigating the terminology and application of volume in society (Focus E, F and G)
1(a) Cultural and historical aspects Keeping in mind the available library resources, have students choose a topic for research. They could work as individuals or in small groups and prepare a wall chart or oral report to share findings with the whole class.
Topics for research could include:
(i) Ancient civilisations Students could read and summarise information about the units and ideas of volume used in early civilisations. Egyptian, Chinese, Greek, Roman, Indian, Mayan and Arabian civilisations could be researched.
(ii) Units of volume from the recent past Students could find examples of units of volume used in the recent past and describe the origins of these and working approximations for converting to currently used metric units.
2. Activities for estimating, measuring and comparing volumes (Focus E and F)
2(a) Investigations using blocks Materials: Base-10 blocks or centicubes.
Discuss the volume of standard i cm x 1 cm x 1 cm blocks. Have students build shapes and discuss and draw diagrams as in the following questions and tasks.
• What volume is occupied by a 4 cm x 4 cm x 4 cm block? What other shapes have the same volume?
• Draw diagrams to represent each of the shapes made.
157
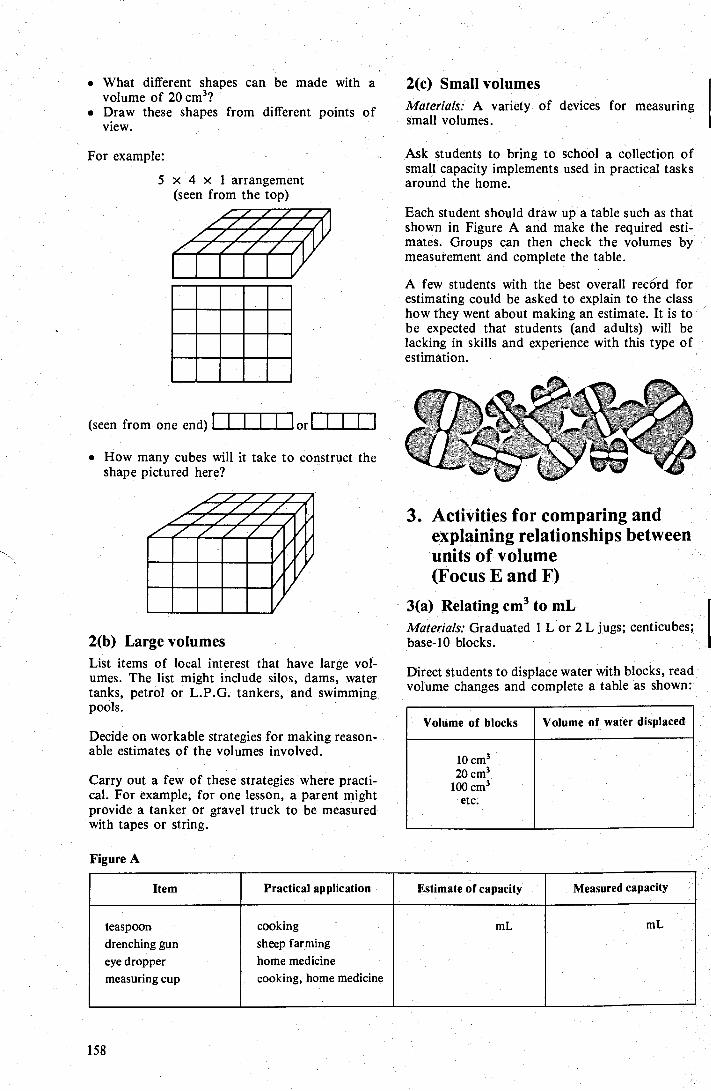
Volume of blocks Volume of water displaced
10 cm3 20 cm3
100 cm3 etc.
• What different shapes can be made with a volume of 20 cm3?
• Draw these shapes from different points of view.
For example:
5 x 4 x 1 arrangement (seen from the top)
2(с ) Small volumes Materials: A variety of devices for measuring small volumes.
Ask students to bring to school a collection of small capacity implements used in practical tasks around the home.
Each student should draw up a table such as that shown in Figure A and make the required esti-mates. Groups can then check the volumes by measurement and complete the table.
A few students with the best overall record for estimating could be asked to explain to the class how they went about making an estimate. It is to be expected that students (and adults) will be lacking in skills and experience with this type of estimation.
(seen from one end) I I I I or III
• How many cubes will it take to construct the shape pictured here?
2(b) Large volumes List items of local interest that have large vol-umes. The list might include silos, dams, water tanks, petrol or L.P.G. tankers, and swimming pools.
Decide on workable strategies for making reason-able estimates of the volumes involved.
Carry out a few of these strategies where practi-cal. For example, for one lesson, a parent might provide a tanker or gravel truck to be measured with tapes or string.
Figure A
3. Activities for comparing and explaining relationships between units of volume (Focus E and F)
3(а ) Relating cm3 to mL Materials: Graduated 1 L or 2 L jugs; centicubes; base-10 blocks.
Direct students to displace water with blocks, read volume changes and complete a table as shown:
Item Measured capacity Practical application Estimate of capacity
mL teaspoon drenching gun eye dropper measuring cup
mL cooking sheep farming home medicine cooking, home medicine
158
3(b) Using commercial literature Use the class collection of material from activity 1(b) as a basis for reading and • reporting by students.
For example, the collection might include a new car brochure with information about engine capacities. An explanation provided by a student along the following lines could be expected:
"This model car has an advertised engine capacity of 1948 cc and 4 cylinders. This means that if we were to fill the space in one cylinder with water, it would take 487 mL of water.
• What is the relationship between volume, area of base and height?
• How could this relationship be written down in words, and in symbols?
Consolidation:
For students who make mistakes using a formula for volume of a cylinder, further investigation will be necessary.
Cylinders of constant height, but increasing diam-eter, can be made out of Plasticine or clay. Again volumes can be measured by displacement or by discussion and analysis of patterns.
4. Activities for finding volumes of cylinders and rectangular prisms (Focus B, C, D, E and G)
4(a) Using stacked discs Materials: Callipers; rulers; coins or wooden discs; graduated cylinders.
Have students determine the area on one face of a coin or disc using callipers to measure the diameter first.
Ask students to make cylinders of coins or discs and then measure volumes of sets of coins by water displacement and complete a table (Figure B).
Follow up with a range of questions:
• As the height increases, how does the volume change?
• If the height doubles, how does the volume change?
▪ If the area of the base were doubled for a particular cylinder, how would the volume change?
Figure B
4(b) Estimating volumes Materials: A collection of small to large cylinders; calculators.
Determine a strategy for estimating cylinder volumes using the approximation.
3 x (radius squared) x height
Provide a range of items for estimation and sub-sequent approximate measurement of diameter and height and calculation of volume. Items could include soft-drink cans, lengths of PVC pipe, fuel can (empty), coffee mug and cylindrical vase or planter box.
Discuss the difference between the volume occu-pied by an object and its capacity to hold liquid.
Make calculators available. Offer students the opportunity to discuss and amend initial esti-mates. Do not underestimate the difficulty of this sort of activity.
4(c) Packaging problems Materials: Aluminium drink cans; cardboard boxes.
A whole range of problems cari be created around the difficulties of packing cylindrical containers in rectangular boxes.
Examples to pose: A manufacturer wishes to pack 24 x 375 mL drink cans into a carton. What size should the
•. .... • п -а ..
Discs in the cylinder Volume Height Area of base
cm3 cm2 cm s 10 15
etc.
carton be and how much volume in the carton is wasted?
Spray cans are of height 22 cm and diameter 6.4 cm. Draw a plan of a cardboard shape that will fold up to make a box to fit one dozen of the cans in a 3 x 4 arrangement.
5. Activities for relating side length to area and volume (Focus A and G)
This activity is intended to link together concepts of length, area and volume.
5(a) Cubes Materials: Cardboard; set squares; rulers.
Set each small group the task of constructing the net of a cube and folding it to form a cube. In this way the class produces a set of cubes of side lengths 1, 2, 3, 4, 5 cm.
Develop a set of data in a table on the chalkboard (Figure C).
Discussion should highlight the `square' in the ratio of units of length:units of area, and the `cube' in the ratio of units of length:units of volume.
Understanding can be further enhanced by graph-ing values for both face area and volume against side length.
Figure C
6. Activities for constructing and analysing shapes (Focus A and В )
Students learn substantially by drawing nets and constructing shapes. However, it is also important that students use any models as a context for ana-lysing properties of solids. Such analysis helps also to pinpoint mistakes and clarify misunder-standings that have caused students to produce unworkable nets.
б (a) Basic shapes The basic shapes are rectangular prisms (including cubes), pyramids, cylinders and cones. Students can construct these as a project in class time or in their own time. The best models can be decorated and hung on display.
The level of assistance to be provided depends entirely on the class group. Some students may need photocopies of nets to begin with. Others may be able to work from a small plan with angle sizes marked. Such a diagram or plan can assist by showing where to place tabs for gluing. Some students could begin with a complete model, cut it up and study it before making their own net.
Plans for nets are widely available commercially so are not reproduced here.
The analysis of solids constructed should address the following types of questions:
• How many different shaped nets exist for a given solid shape?
Surface area of face
cmZ
Volume cm3
Ratio Length: Volume
Edge length of side
cm
Ratio Length:Area
1:1 2:8 2
etc.
1 :1 2:4
160
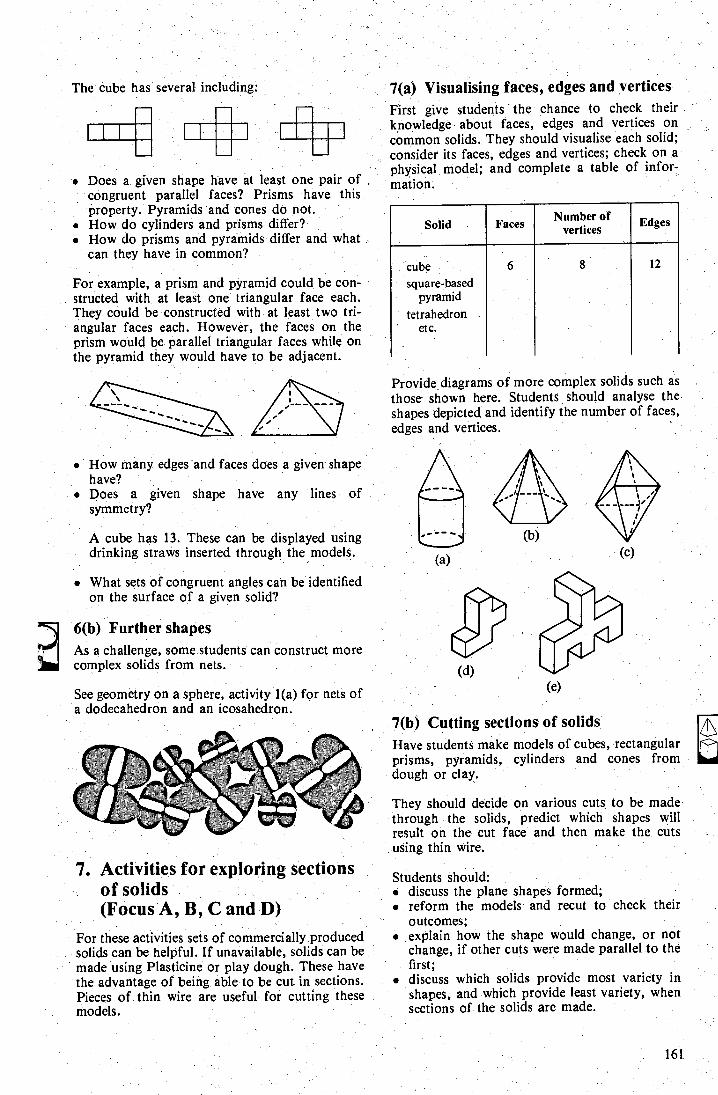
Faces Number of
vertices
cube 12
square-based pyramid
tetrahedron etc.
Solid Edges
The cube has several including:
• Does a given shape have at least one pair of congruent parallel faces? Prisms have this property. Pyramids and cones do not.
• How do cylinders and prisms differ? How do prisms and pyramids differ and what can they have in common?
For example, a prism and pyramid could be con-structed with at least one triangular face each. They could be constructed with at least two tri-angular faces each. However, the faces on the prism would be parallel triangular faces while on the pyramid they would have to be adjacent.
. How many edges and faces does a given shape have?
• Does a given shape have any lines of symmetry?
A cube has 13. These can be displayed using drinking straws inserted through the models.
What sets of congruent angles can be identified on the surface of a given. solid?
6(b) Further shapes. As a challenge, some students can construct more complex solids from nets.
See geometry on a sphere, activity 1(a) for nets of a dodecahedron and an icosahedron.
7(a) Visualising faces, edges and vertices First give students the chance to check their knowledge about faces, edges and vertices on common solids. They should visualise each solid; consider its faces, edges and vertices; check on a physical model; and complete a table of infor-mation:
Provide diagrams of more complex solids such as those shown here. Students should analyse the shapes depicted and identify the number of faces, edges and vertices.
(a)
(d) (e)
7(b) Cutting sections of solids Have students make models of cubes, rectangular prisms, pyramids, cylinders and cones from dough or clay.
They should decide on various cuts to be made through the solids, predict which shapes will result on the cut face and then make the cuts using thin wire.
7. Activities for exploring sections of solids (Focus A, B, C and D)
For these activities sets of commercially produced solids can be helpful. If unavailable, solids can be made using Plasticine or play dough. These have the advantage of being able to be cut in sections. Pieces of thin wire are useful for cutting these models.
Students should: • discuss the plane shapes formed; • reform the models and recut to check their
outcomes; • explain how the shape would change, or not
change, if other cuts were made parallel to the first;
• discuss which solids provide most variety in shapes, and which provide least variety, when sections of the solids are made.
161
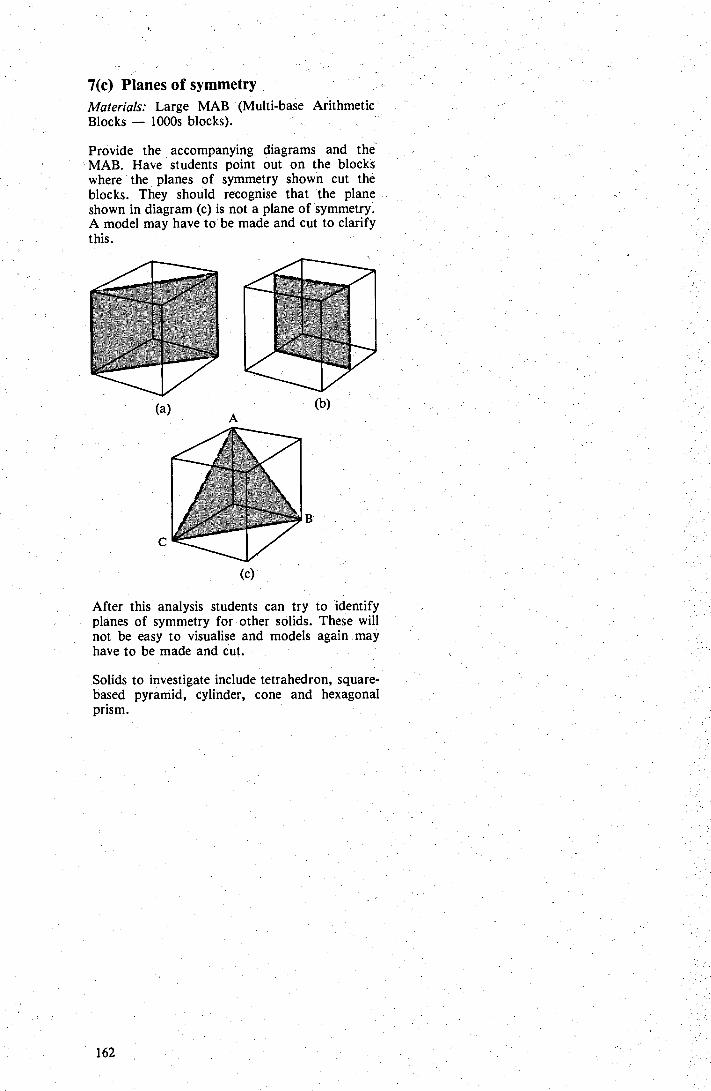
7(c) Planes of symmetry Materials: Large MAB (Multi-base Arithmetic Blocks — 1000s blocks).
Provide the accompanying diagrams and the lAB. Have students point out on the blocks where the planes of symmetry shown cut the blocks. They should recognise that the plane shown in diagram (c) is not a plane of symmetry. A model may have to be made and cut to clarify this. .
(a) (b)
(c).
After this analysis students can try to identify planes of symmetry for other solids. These will not be easy to visualise and models again may have to be made and cut.
Solids to investigate include tetrahedron, square-based pyramid, cylinder, cone and hexagonal prism.
162
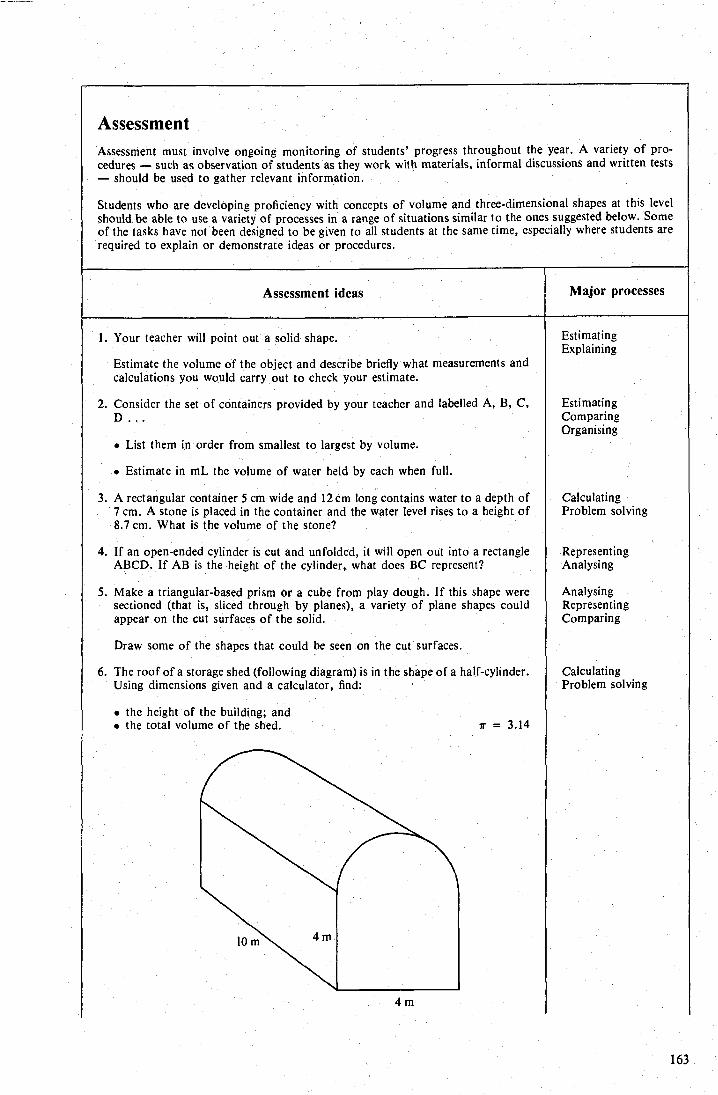
Assessment Assessment must involve ongoing monitoring of students progress throughout the year A variety of pro-cedures — such as observation of students as they work with materials, informal discussions and written tests — should be used to gather relevant information.
Students who are developing proficiency with concepts of volume and three-dimensional shapes at this level should be able to use a variety of processes in a range of situations similar to the ones suggested below. Some of the tasks have not been designed to be given to all students at the same time, especially where students are required to explain or demonstrate ideas or procedures.
Major processes Assessment ideas
1. Your teacher will point out a solid shape.
Estimate the volume of the object and describe briefly what measurements and calculations you would carry out to check your estimate.
2. Consider the set of containers provided by your teacher and labelled A, B, C,
• List them in order from smallest to largest by volume.
• Estimate in mL the volume of water held by each when full.
3. A rectangular container 5 cm wide and 12 cm long contains water to a depth of 7 cm. A stone is placed in the container and the water level rises to a height of 8.7 cm. What is the volume of the stone?
4. If an open-ended cylinder is cut and unfolded, it will open out into a rectangle ABCD. If AB is the height of the cylinder, what does BC represent?
5. Make a triangular-based prism or a cube from play dough. If this shape were sectioned (that is, sliced through by planes), a variety of plane shapes could appear on the cut surfaces of the solid.
Draw some of the shapes that could be seen on the cut surfaces.
6. The roof of a storage shed (following diagram) is in the shape of a half-cylinder. Using dimensions given and a calculator, find:
Estimating Explaining
Estimating Comparing Organising
Calculating Problem solving
Representing Analysing
Analysing Representing Comparing
Calculating Problem solving
• the height of the building; and • the total volume of the shed. ir = 3.14
163
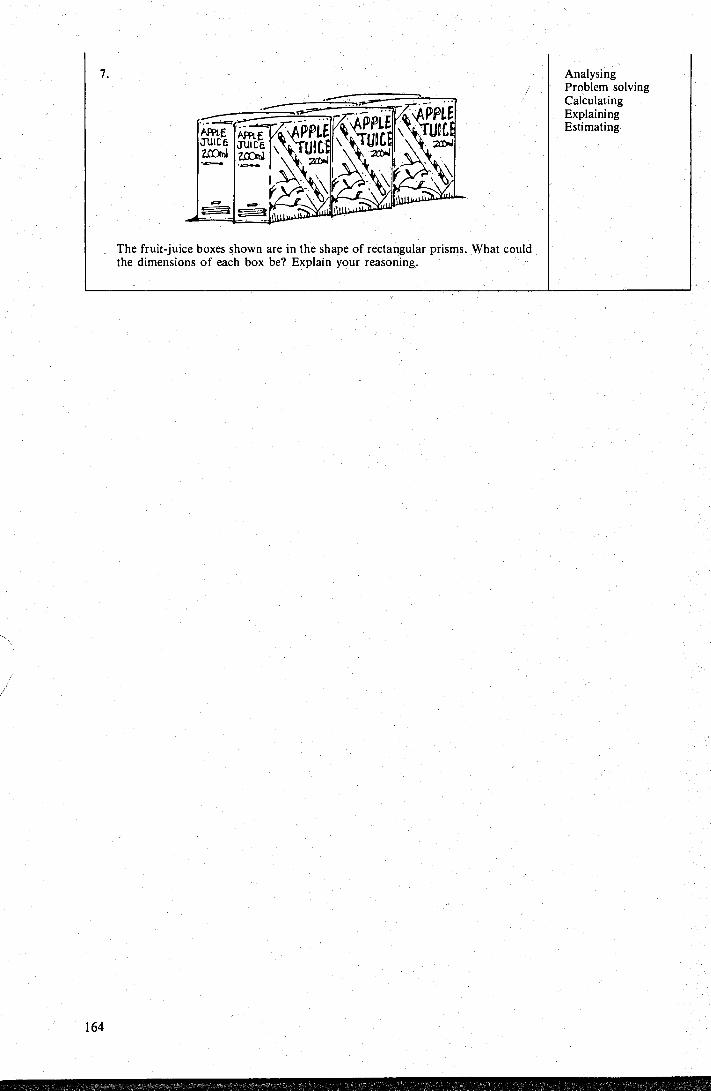
Analysing Problem solving Calculating Explaining Estimating
7.
The fruit-juice boxes shown are in the shape of rectangular prisms. What could the dimensions of each box be? Explain your reasoning.
164
6.``Activities for representing enlargements or reductions of shapes to a given scale factor (Focus H)
(a) Using the grid method (b) Using a point source of light (c) Using a lens (d) Using a pantograph
7. Activities for investigating problem situatio (Focus I)
(a) Puzzles with patterns and shapes
175
175
165
Angles, pialle shapes and deductive .. geometry
Page
Focus for teaching, learning and assessment Notes for teachers 1. Activities for estimating, measuring and constructing angles
(Focus A, B and C) (a) Making angles by folding paper (b) Estimating and measuring angles with a protractor (c) Estimating and measuring angles using a rotagram (d) Constructing angles " (e) Constructing regular figures (f) Bisecting angles
2. Activities for identifying specific pairs and groups of angles . (Focus A and D)
(a) Classifying angles at a point (b) Measuring angles of a triangle (c) Exterior angle of a triangle
З . Activities for analysing properties of plane shapes (Focus E)
(a) Rectangles (b) Triangles (c) A variety of plane shapes
4. Activities for measuring, comparing, and pattern searching to identify congruence and similarity in triangles (Focus F and G)
(a) Congruency testing by the side method (b) Recording side lengths, angles and areas of polygons (c) Congruency and similarity of triangles (d) Enlargements of a triangle using rubber bands
{
5. Activities for representing polygons through drawing, describing and transforming shapes (Focus F)
(a) Designing posters using reflections, rotations and translations
167
168
168
168 t 168
ł 68 170 170 170
173 173 173 173
173
171
174
174
8. Activities for investigating aspects of the history of plane 177 geometry (Focus J)
(a) Researching early geometry 177 (b) Biblical geometry 177
Activity sheets 178
Assessment 181
166
Yea
rs 9
an
d 1
0
„ °°' р .? • >
Сс Û
ьС b Ú •
.. b .. :
С у С и
•
и С .... ц CL О :.. w p ..., р А й О сб
•O . ý й Ř
ьц. .ц . b0
▪
..
.. С . • 0 с
с • °' v - Ø •=•
^ ó== сб с С " ё • и и b
с б ç„+ • . шл у , 00 cб и •,.... . •C сб
ьл. .. •у G1. • •и .ď ..
р •-. а' аСг и .>..+ •' .. Ø Т 3 cб
О O у U 30А • • •
с ;- с., с
. у ..~.•
р - С ь, сб С
•
o о 0
•
у +•
~ . Ú й ý ы сб ° с -°' g б а О а О•й р CO 00 w д =о р и co д L
С О
. сб U b и . v С у .
... е íL'Ť .., г . '— и С сб С 1. , "Cl н w U сб н е Сб е . с
у О : + снб С 4 о .. 0g й ÓD M .
• . С еСб
•
Ои •
•
О
С .• сСб 3 й а С b V
С Ρ н .. i
. и . . л .С • о
•
и Ń C1•• Ć . и . CO е е
• С
•
с . и • . С . н0 " •b н О 4„
С
Ú ć ?
... .. . ,, 'й ° г•н у
▪
О
b0 П и е ... v w OU к Т3 . и н bA .••• b0 .и+ ьи, у . C ... и .п s С С сб . С ]. 0А 'ь. Cpi °
С е
•cď ,Ф у .. ^. сб ::. vi . сб у С . к • нъ O.• д а р v
й c а °б н с Ø' °° н г и у р ..ц Т 3 и • ... .С С Ф v, О Ё сб . Г3
С y. 3 aл u и . aт и v • • Ø и •ц = сСб 00 v p v у с C.
н ❑ 0 co 00 С .D Он . L 00 00 С 'Ć 00 0А DA • C. С С сб CL i1 . С .С и R О C ь. C . C
• v 00 сб .« v 00 •- v а •r+ • -. oд .r о н
^ •7 •.0 . С `" О гл • _ . й О • • С аиг й w . b0 й •!
b С , •v•.. °. .. G. . у•. . •г,б bA с б . о
• U G. .G сСб Q G" • Оч ан+ Ń ьн.. .С. й . .С.
а ai Ů А w и: С7 х .; ti о ■ о о о
_ ґ ■ ■ о о Q E
xp
erie
nce
for
all
stu
den
ts.
(Up
to
an
d in
c lu
din
g) Y
ear
7
Cla
ssif
ying
and r
epre
sen
ting p
oly
g on
s:
So
lvin
g an
d c
reat
ing p
rob
lem
s.
Ч •ý и и C b
v ° b .ц 0д •b С
у С p снб сб ^ ° " б .
С ьл. . . р • О . С . .- ш и аСг . л и w 0А сд ca 4
ř . б V . T . N cб 00 гл dиj Oq О • Û о л . й С 0А ЬД
й ь. с.. 00 OV C •с у s . 3 сб
и ср б и кь. с
•С и Ои • •i b С CJ Ć ý а . С
Ои гб сд ь = с л а
. й ё д b •E 'E
С О . О baA я Š и 0
О . с Е оио ь.• . 0 • й
е ' о 0 С °' •
І " а О. сб й 00 С ь wл ý й e д e б .0A w w i -• w,л а 'й с°бо °: с ё °'
- е с
а Ć• á . . N b у н N с е .ц
• • , • • . r•b•,i сб .. ы а. + W . . й г.С. . . й
• • • • • • • • • • •
Foc
us f
or te
achi
ng, l
earn
ing
and
asse
ssm
ent
Ang
les,
pla
ne s
hap e
s an
d de
duct
i ve
g eom
etry
167
Notes for teachers
The sequence in Figure В should be used with a second piece of paper.
Throughout Years 1 to 7 students will have used the processes of representing, classifying, estimat ing and measuring with angles and plane shapes. They will also have used materials including compasses, pencils, rulers, set squares, protrac-tors, transparent grids and grid paper.
In Year 8 use of these materials and processes will continue, and use of rotagrams should commence.
It will be necessary to organise access to sets of protractors and rotagrams. At times more special-ised materials —such as mirrors, pantographs and area grids— will be beneficial.
During Years 1 to 7 intuitive understandings of properties of plane shapes will have been devel-oped. In Years 8 to 10 it is expected that students will develop more formal deductive reasoning about plane shapes. This move should be approached cautiously, and the introduction of symbolism accompanied by many opportunities for students to explain reasoning and symbols in. their own language. It is not expected that students will attempt , to `prove' relationships using chains of symbolic statements before they are quite clear in their own minds that what is being `proved' is true.
1. Activities for estimating, measuring and constructing angles .
(Focus A, B and C)
1(a) Making angles by folding paper Materials: Square pieces of paper; rulers and pencils; protractors or rotagrams.
Ask students to perform the actions in Figure A on page 169 with their first piece of paper and then ask appropriate questions.
Ask students to:
. identify congruent angles and angles that add to 180°.
• calculate the angle formed between any 2 lines, and identify the angle that remains.
1(b)` Estimating and measuring angles with a protractor
Materials: Rulers; protractors; activity sheet 1.
Students can work alone or in pairs. Students should observe each angle, estimate the size and record their estimates in a table. Then students . . should measure the angles with protractors and record these measurements in the table. Students should calculate the difference between the estimates and the measured values.
Students can use a scoring system to see how well they have estimated; for example, differences of 5 degrees or' less, score 3 points; differences of 10. degrees or less, score 2 points; and differences of 20 degrees or less, score 1 point. Points can be totalled to find the best estimator.
Variation: Students can draw their own angles for the other player to estimate and measure.
Extension Students more capable at estimating angle sizes could work with all angles, whereas other students may be working with angles less than 180 or 90 degrees. In this way, different students can inter-act with each other, with the more able student having larger angles to estimate. Time limits could be imposed for estimates in a game situation where students work together as a team in pairs or threes.
Note: When a time limit is not imposed for estimating, students should measure each angle after they estimate so they can learn from their measurements as they progress.
1(c) Estimating and measuring angles using a rotagram
Materials: Rotagrams; activity sheet 2.
If commercially produced rotagrams are not available, they can be made easily and inexpensively. They consist of one square piece of plastic with a side of approximately 10 cm and .. one circular piece of plastic with a diameter of approximately 8 cm.
168
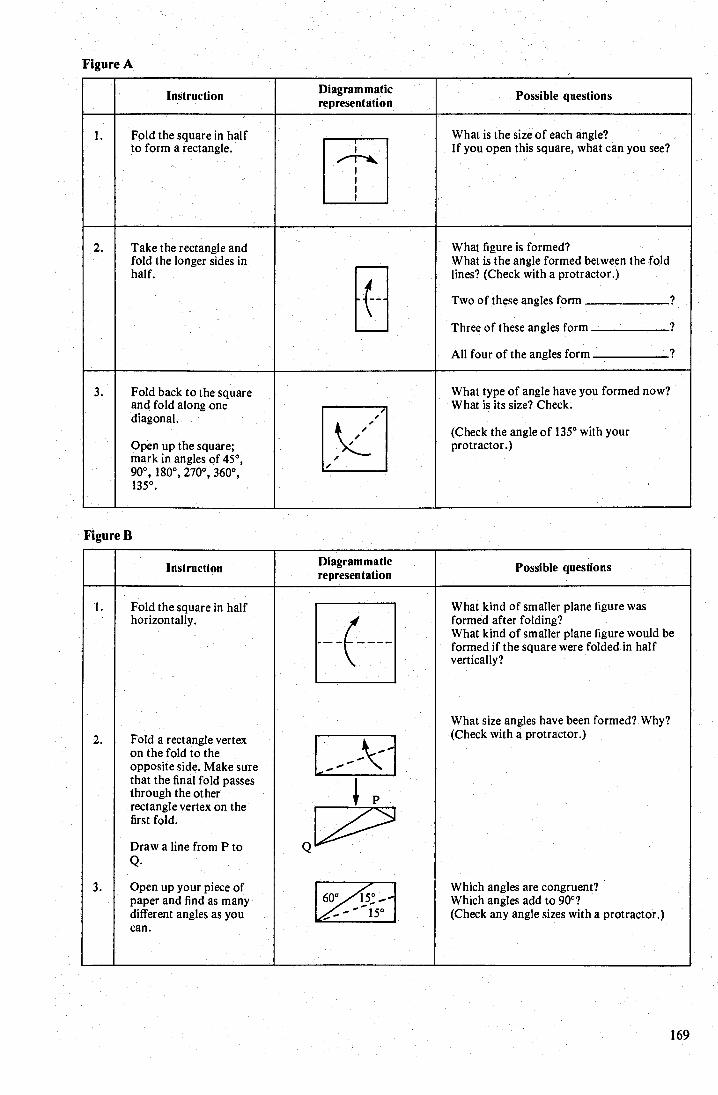
,
Diagrammatic representation Instruction Possible questions
What is the size of each angle? If you open this square, what can you see?
1. Fold the square in half to form a rectangle.
2. Take the rectangle and fold the longer sides in half.
What figure is formed? What is the angle formed between the fold lines? (Check with a protractor.)
Two of these angles form 9
Three of these angles form 9
All four of the angles form
3. What type of angle have you formed now? What is its size? Check.
Fold back to the square and fold along one diagonal.
(Check the angle of 135° with your protractor.) Open up the square;
mark in angles of 45°, 90°, 180°, 270°, 360°, 135°.
Figure B
Diagrammatic representation Instruction Possible questions
1. What kind of smaller plane figure was formed after folding? What kind of smaller plane figure would be formed if the square were folded in half vertically?
Fold the square in half horizontally.
Fold a rectangle vertex on the fold to the opposite side. Make sure that the final fold passes through the other rectangle vertex on the first fold.
Draw a line from P to Q.
Open up your piece of paper and find as many different angles as you can.
What size angles have been formed? Why? (Check with a protractor.)
Which angles are congruent? Which angles add to 90°? (Check any angle sizes with a protractor.)
169
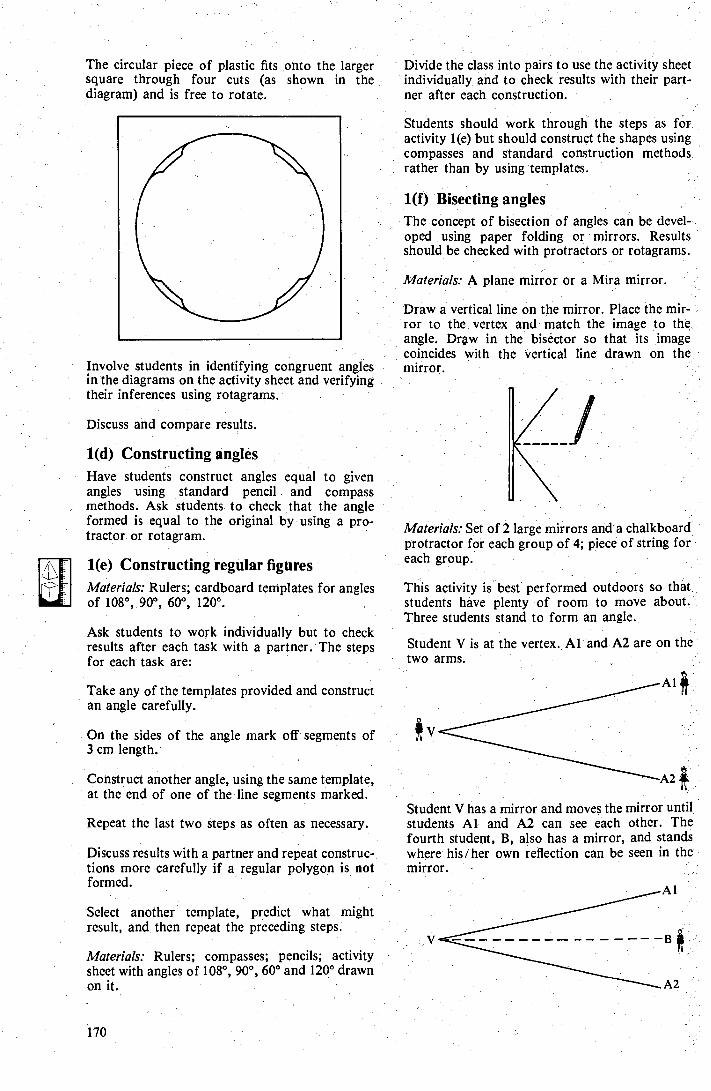
, V
ii
The circular piece of plastic fits onto the larger square through four cuts (as shown in the diagram) and is free to rotate.
Involve students in identifying congruent angles in the diagrams on the activity sheet and verifying their inferences using rotagrams.
Discuss and compare results.
1(d) Constructing angles Have students construct angles equal to given angles using standard pencil and compass methods. Ask students to check that the angle formed is equal to the original by using a pro-tractor or rotagram.
1(e) Constructing regular figures Materials: Rulers; cardboard templates for angles of 108°, 90°, 60°, 120°.
Ask students to work individually but to check results after each task with a partner. The steps for each task are:
Take any of the templates provided and construct an angle carefully.
On the sides of the angle mark off segments of 3 cm length.
Construct another angle, using the same template, at the end of one of the line segments marked.
Repeat the last two steps as often as necessary.
Discuss results with a partner and repeat construc-tions more carefully if a regular polygon is not formed.
Select another template, predict what might result, and then repeat the preceding steps.
Materials: Rulers; compasses; pencils; activity sheet with angles of 108°, 90°, 60° and 120° drawn on it.
Divide the class into pairs to use the activity sheet individually and to check results with their part-ner after each construction.
Students should work through the steps as for activity 1(e) but should construct the shapes using compasses and standard construction methods. rather than by using templates.
1(f) Bisecting angles The concept of bisection of angles can be devel-oped using paper folding or mirrors. Results. should be checked with protractors or rotagrams.
Materials: A plane mirror or a Mira mirror.
Draw a vertical line on the mirror. Place the mir-ror to the vertex and match the image to the angle. Draw in the bisector so that its image coincides with the vertical line drawn on the mirror. .
Materials: Set of 2 large mirrors and a chalkboard protractor for each group of 4; piece of string for each group.
This activity is best performed outdoors so that students have plenty of room to move about. Three students stand to form an angle.
Student V is at the vertex. Al and A2 are on the two arms.
-A2 ;
Student V has a mirror and moves the mirror until students Al and A2 can see each other. The fourth student, B, also has a mirror, and stands where his/her own reflection can be seen in the mirror.
Al
А 2
170
. Cut out the paper triangle, tear off the corners and fit them together. Discuss the result.
Cut out the paper triangle. Fold the apex so that this vertex lies on the base and the fold line is parallel to the base. Fold in the other vertices to meet the apex vertex at the base. Discuss results.
. Measure angles with a protractor and add.
Use a rotagram.
• Use a rotagram to `sum' pairs of interior angles and compare with the exterior angle.
After marking the spot, В lays out the piece of string from V to the spot to indicate the bisector. The activity is repeated for other angles, and students should measure the bisections.
Have students draw and bisect. ań gles using a pair of compasses or paper folding methods. Have the class check for accuracy using protractors or rotagrams.
2. Activities for identifying specific pairs and groups of angles (Focus A and D)
2(a) Classifying angles at a point Materials: Activity sheet 2.
Ask students to revise acute, obtuse, right and reflex angles and classify angles in the diagrams on the activity sheet.
2(b) Measuring angles of a triangle The angle sum of a triangle can be found in sev= eral ways. In each case, students will need to draw a large triangle on a piece of paper.
Step 3: Similar to Step 2. (Total rotation should be a straight angle.)
Step 1: Rotate variable arm to match first angle.
Step 2:. Place variable arm on arm of angle and rotate through the size of the angle. (This gives the sum of two of the angles.)
2(c) Exterior angle of a triangle The relationship can be found in several ways. In each instance students must draw a triangle with an exterior angle.
. Cut out the triangle carefully, leaving the imprint of the triangle and the intact exterior angle. Tear off the angles and try to find a relationship between the angles and the exterior angle.
171
to to i
unfold to
fold down
11 3. Activities for analysing properties of plane shapes (Focus E)
Each of the following activities is suitable for both group and individual work. Each activity should be concluded with students writing a sum-mary of the properties that have been discovered for a particular shape.
3(a) Rectangles Materials: Rectangular pieces of paper; scissors; rulers; protractors.
Instruct students to perform the following sequence of steps to form a square by folding paper:
discard
From
Ask students to investigate by measuring and folding:
• the lengths of the sides of the square; • the lengths of the diagonals of the square; • the size of each angle of the square; • the angles formed by a side and a diagonal of
a square; • the angles formed by the diagonals; • any symmetry; • any other discoveries.
discard
3(c) А variety of plane shapes Materials: Sheets of paper; compasses.
Ask students to draw and cut out a circle of - radius of at least 8 cm.
Stage 1:
Stage 2:
What figure is formed? Why?
Stage 3:
Stage 4:
From a square sheet
to
Repeat these investigations for a rectangular piece of paper. Stage 5:
Stage 6:
3(b) Triangles Materials: Rectangular pieces of paper; scissors; rulers and pencils; protractors.
discard
to to Draw any straight
line from fold line to adjacent
edge.
Ask students to investigate by measuring and folding:
• the lengths of the three sides of the triangle; • the sizes of the three angles of the triangle; • any symmetry; • any other discoveries.
Repeat these investigations for art equilateral triangle.
6АWА - Wy
Fold each vertex into the original centre.
At each stage ask students what figure is formed and why this is so. Now ask students to open the circle out to reveal all of the crease lines.
Students can investigate:
• all equilateral triangles formed; • all rhombi formed; • trapezia formed; • parallelograms formed; • other polygons formed; and • angle sums of polygons formed.
From
172
Side 2 Side 3 Triangle
ABC DEF
Side 1
Area Shape Side Lengths Angles
A
B
M 4. Activities for measuring, comparing and pattern searching to identify congruence and similarity in triangles (Focus F and G)
4(a) Congruency testing by the side method
Have students draw any triangle in the first quad-rant of the standard Cartesian system. Begin with vertices on points described by ordered pairs of integers. Have students label the triangle (for example, А ABC) and then produce triangles in the remaining three quadrants by reflecting A ABC in the appropriate vertical and horizon-tal axes. Students could work in pairs to measure side lengths and record results in their notebooks as shown in the table.
Have representatives from several pairs explain why the triangles are congruent. In the report on congruence, have students show the shape of the triangle to the class so that a range of different types of triangles is shown.
Students may use Mira mirrors (or their equi-valent) to assist with reflecting the triangles in the appropriate axes.
4(b) Recording side lengths, angles and areas of polygons
Materials: Activity sheet 3.
Ask students to work in pairs to discuss the plane shapes A to M on the activity sheet and to infer which pairs are congruent and which are similar. Have one member of each pair record side lengths, angles and area of a number of shapes. After half the answers have been recorded, students could change roles. Recording should take place in a table similar to the one shown. Some initial assistance may have to be given to students who are making estimates of parts of the squares on the grids.
After recording has taken place, students can report on which polygons are congruent or similar.
Open investigation: Ask students to investigate (in pairs) the change in area of particular polygons if sides are enlarged or reduced by different scale factors, for example, 0.5, 2, 3 etc.
4(c) Congruency and similarity of triangles
Materials: Sets of triangles cut from lightweight cardboard with some congruent to, and some similar to, others in the set or triangles drawn on an activity sheet; clear plastic (to be used to trace the triangles).
Assign students to work in small groups to com-pare triangles for congruence and similarity. Have one student record the results in tabular form. (See Figure C.)
Students should then work in the same groups and, using protractors, measure and record the angles of each triangle. Students can then report on the similarity of triangles to the whole class. If discrepancies occur, discuss these with the class.
4(d) Enlargements of a triangle using rubber bands
Materials: Rubber bands; thumbtacks; 30 cm rulers; paper; large table.
Ask students to make the device shown in the diagram. Loop two identical rubber bands together to form a knot in the middle.
Have students draw л ABC on a large piece of paper and select a point P so that the distance from P to A is longer than the length of a rubber band. Assign students to work in pairs with one student holding one end of the rubber bands until the knot is over A. Students should mark a dot with the pencil and label it A1, then repeat the procedure with the knot over B to find B and over C to find C1 as shown in the diagram.
173
Pattern 1
Rotate 90
Rotate 90
Rotate 90
Pattern 1
Reflect
Reflect
-► tJ
Reflect
Similar to Similar to Congruent to Congruent to
F G Н
А ß C D Е
174
Have students develop pattern 1 from:
0 2 1 3
1 0 2 3
2 0 3
3
Now ask students to develop new patterns from pattern 1 by the following transformations:
0 1 2
Pattern 1
Translate
5. Activities for representing polygons through drawing, describing and transforming shapes (Focus F)
5(a) Designing posters using reflections, rotations and translations
Students can investigate patterns or posters made by designing a unit pattern on grid paper and translating, reflecting or rotating it to produce a larger pattern. The numbers 0 to 3 are represented so that each row and each column has only one 0, one 1, one 2 and one 3. Students can discover that different effects can be made by substituting designs for the numbers, for example:
Figure C
Translate —
Translate
Rotating
Extension Some students should be challenged to investigate other grids, for example, 6 x 6, and combin-ations of transformations, for example, trans-lations and reflections, to produce new patterns.
Similarity/Соп gruencу Table
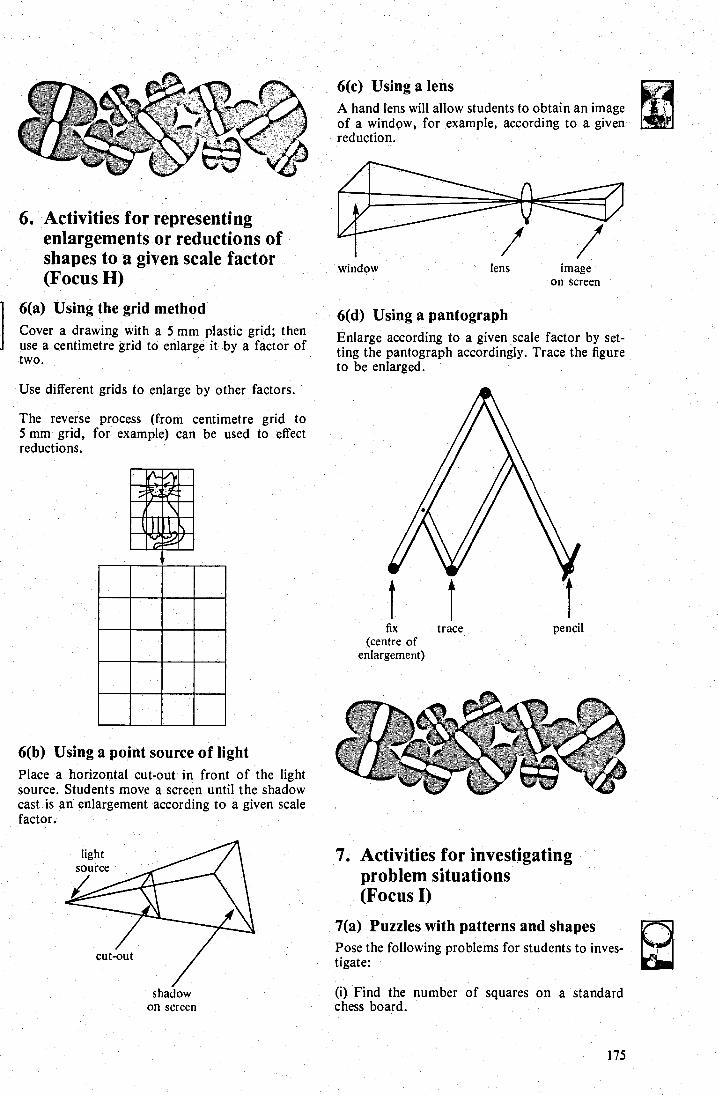
Iens window
6(c) Using a lens A hand lens will allow students to obtain an image of a window, for example, according to a given reduction.
6. Activities for representing enlargements or reductions of shapes to a given scale factor (Focus H)
6(a) Using the grid method Cover a drawing with a 5 mm plastic grid; then use a centimetre grid to enlarge it by a factor of two.
Use different grids to enlarge by other factors.
The reverse process (from centimetre grid to 5 mm grid, for example) can be used to effect reductions.
6(b) Using a point source of light Place a horizontal cut-out in front of the light source. Students move a screen until the shadow cast is an enlargement according to a given scale factor.
shadow on screen
image on screen
6(d) Using a pantograph Enlarge according to a given scale factor by set-ting the pantograph accordingly. Trace the figure to be enlarged.
fix trace pencil (centre of
enlargement)
7. Activities for investigating problem situations (Focus I)
7(a) Puzzles with patterns and shapes Pose the following problems for students to inves-tigate:
(i) Find the number of squares on a standard chess board.
175

How many other arrangements can you find?
(v) Can you make this design using a square, a ruler, pencil and a compass?
What other designs can you make with a square and the stated equipment?
P, Q, Rand S are midpoints
(viii) A polyomino is formed by fitting more than two squares together so that some of their edges are joined. For example:
is a tromino.
is a tetromino.
is a pentomino.
•
в
•
(vi) (ii) Using 8 x 8 grid paper, what size squares can you draw? Can you draw a square of size 2 square units?
A, B, C, D and E are midpoints of the respective intervals. .
• Draw a square on a piece of cardboard and reproduce CD, AE and BE.
• Cut out the four shapes formed. . Form a triangle from these pieces. . Investigate any congruences.
(iv) Is it possible to place 8 counters on a 4 x 4 board so that no three are in a straight line? This is one arrangement.
Show haw this figure can be cut into:
• two congruent shapes; . three congruent shapes; . four congruent shapes.
Into what other numbers of congruent shapes can you cut this figure?
(vii) Construct a regular octagon with the aid of a circle. Cut out the octagon and dissect it into 5 pieces as shown.
Rearrange the pieces to form a square. Investigate any congruences.
Investigate the number of possible arrangements to form trominoes, tetrominoes and pentominoes.
176
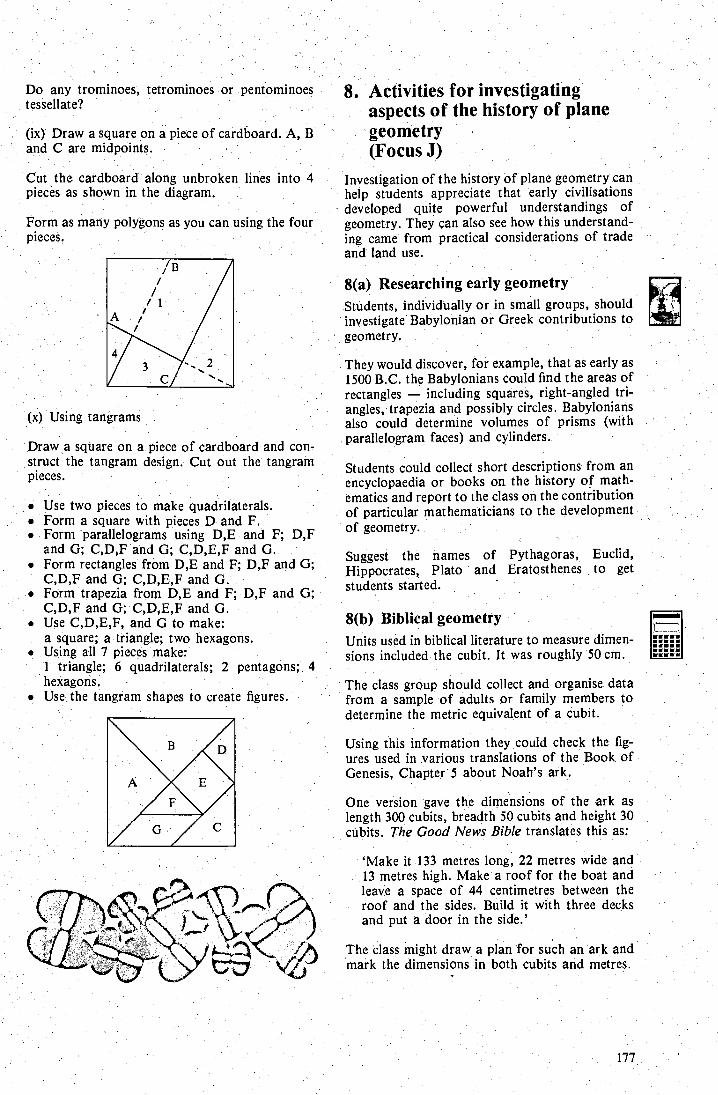
Do any trominoes, tetrominoes or pentominoes tessellate?
(ix) Draw a square on a piece of cardboard. A, В and C are midpoints.
Cut the cardboard along unbroken lines into 4 pieces as shown in the diagram.
Form as many polygons as you can using the four . pieces.
(x) Using tangrams
Draw a square on a piece of cardboard and con-struct the tangram design. Cut out the tangram pieces.
• Use two pieces to make quadrilaterals. • Form a square with pieces D and F. • Form parallelograms using D,E and F; D,F
and G; C,D,F and G; C,D,E,F and G. • Form rectangles from D,E and F;, D,F and G;
C,D,F and G; C,D,E,F and G. • Form trapezia from D,E and F; D,F and G;
C,D,F and G; C,D,E,F and G. • Use C,D,E,F, and G to make:
a square; a triangle; two hexagons. Using all 7 pieces make: 1 triangle; б quadrilaterals; 2 pentagons; 4 hexagons.
• Use the tangram shapes to create figures.
8. Activities for investigating aspects of the history of plane geometry (FOCUS J)
Investigation of the history of plane geometry can help students appreciate that early civilisations developed quite powerful understandings of geometry. They can also see how this understand-ing came from practical considerations of trade and land use.
8(a) Researching early geometry Students, individually or in small groups, should investigate Babylonian or Greek contributions to geometry.
They would discover, for example, that as early as 1500 B.C. the Babylonians could find the areas of rectangles — including squares, right-angled tri- angles, trapezia and possibly circles. Babylonians also could determine volumes of prisms (with parallelogram faces) and cylinders.
Students could collect short descriptions from an encyclopaedia or books on the history of math-ematics and report to the class on the contribution of particular mathematicians to the development of geometry.
Suggest the names of Pythagoras, Euclid, Hippocrates, Plato and Eratosthenes to get students started.
8(b) Biblical geometry Units used in biblical literature to measure dimen-sions included the cubit. It was roughly 50 cm.
The class group should collect and organise data from a sample of adults or family members to determine the metric equivalent of a cubit.
Using this information they could check the fig-ures used in various translations of the Book of Genesis, Chapter 5 about Noah's ark.
One version gave the dimensions of the ark as length 300 cubits, breadth 50 cubits and height 30 cubits. The Good News Bible translates this as:
`Make it 133 metres long, 22 metres wide and 13 metres high. Make a roof for the boat and leave a space of 44 centimetres between the roof and the sides. Build it with three decks and put a door in the side.'
The class might draw a plan for such an ark and mark the dimensions in both cubits and metres.
177
í(—_,} ...--i-i
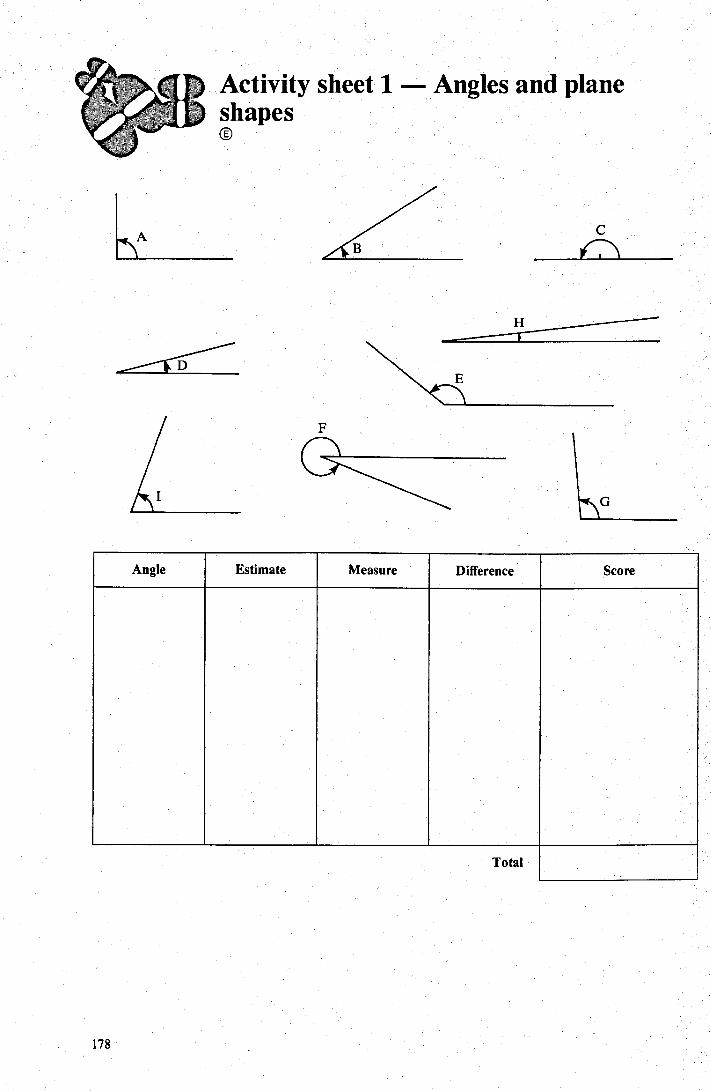
Activity sheet 1— Angles and plane shapes
Estimate Measure Angle Difference Score
Total
178
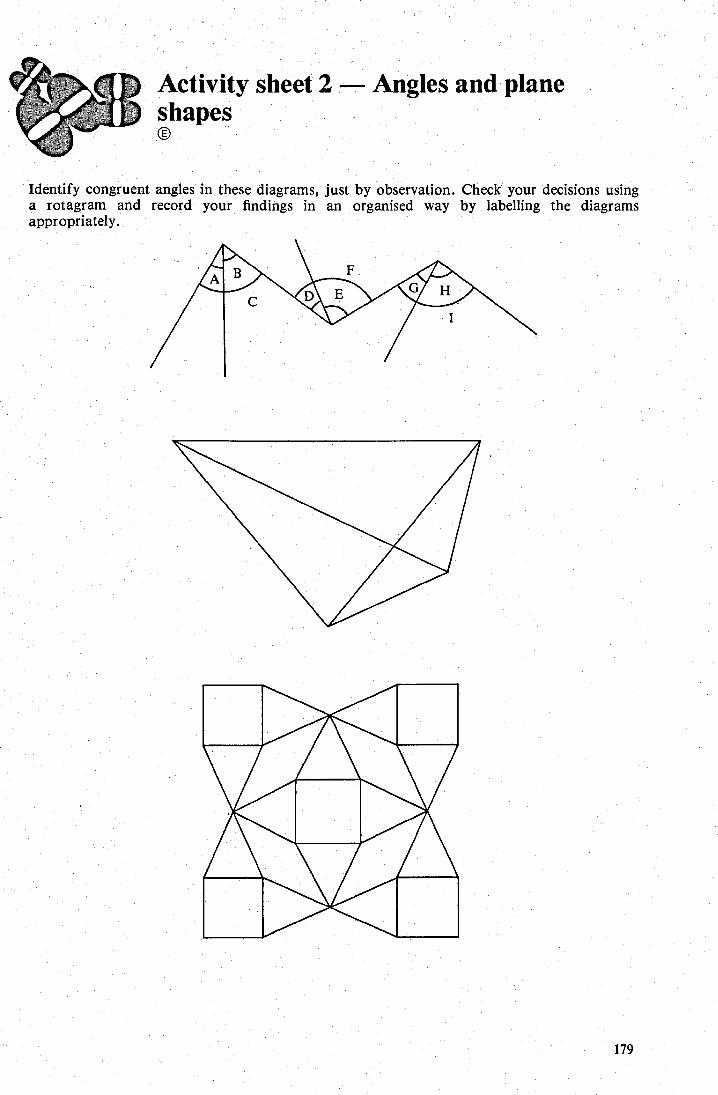
179
Activity sheet 2 - Angles and plane shapes
Identify congruent angles in these diagrams, just by observation. Check your decisions using a rotagram and record your findings in an organised way by labelling the diagrams appropriately.
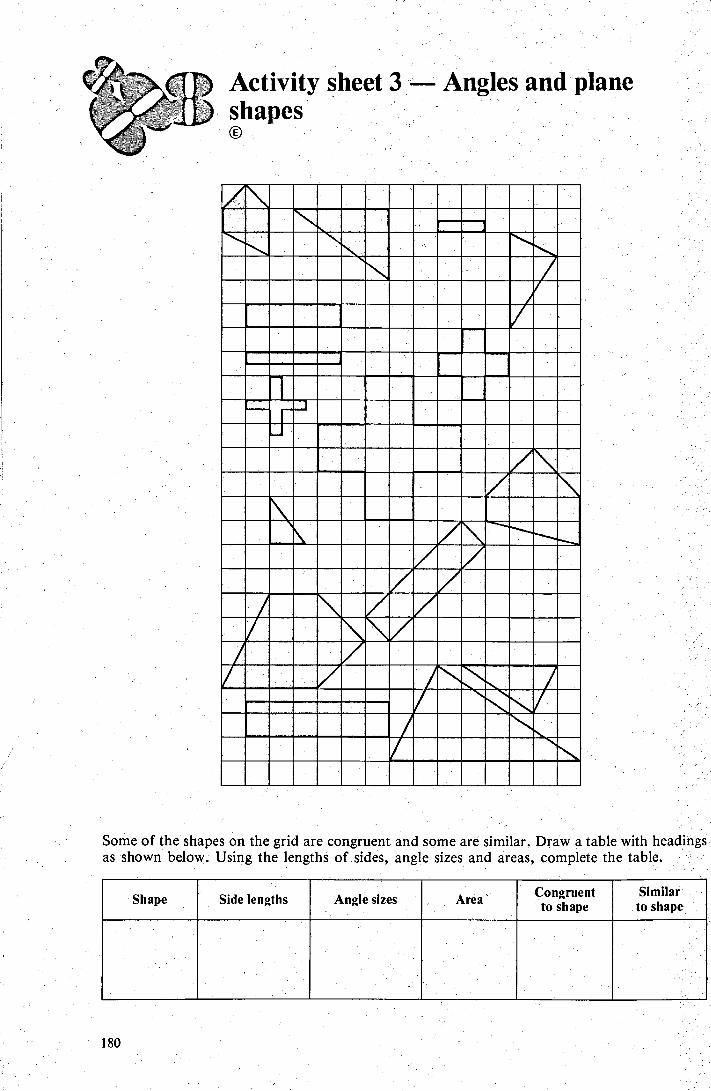
Activity sheet 3 Angles and plane shapes
n
1 - С
Some of the shapes on the grid are congruent and some are similar. Draw a table with headings as shown below. Using the lengths of sides, angle sizes and areas, complete the table.
Similar to shape Shape Side lengths Angle sizes Area Congruent
to shape
180
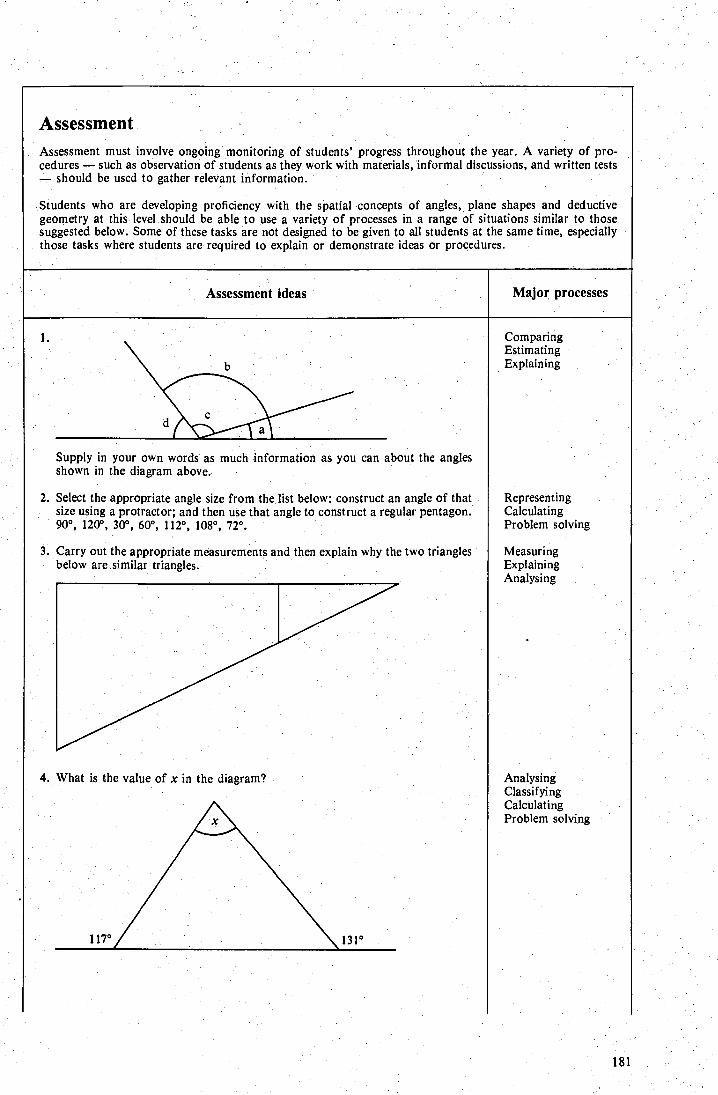
Assessment Assessment must involve ongoing monitoring of students' progress throughout the year. A variety of pro-cedures — such as observation of students as they work with materials, informal discussions, and written tests - should be used to gather relevant information.
Students who are developing proficiency with the spatial concepts of angles, plane shapes and deductive geometry at this level should be able to use a variety of processes in a range of situations similar to those suggested below. Some of these tasks are not designed to be given to all students at the same time, especially those tasks where students are required to explain or demonstrate ideas or procedures.
Major processes Assessment ideas
Supply in your own words as much information as you can about the angles shown in the diagram above.
2. Select the appropriate angle size from the list below: construct an angle of that size using a protractor; and then use that angle to construct a regular pentagon. 90°, 120°, 30°, 60°, 112°, 108°, 72°.
3. Carry out the appropriate measurements and then explain why the two triangles below are similar triangles.
4. What is the value of x in the diagram?
Comparing Estimating Explaining
Representing Calculating Problem solving
Measuring Explaining Analysing
Analysing Classifying Calculating Problem solving
181
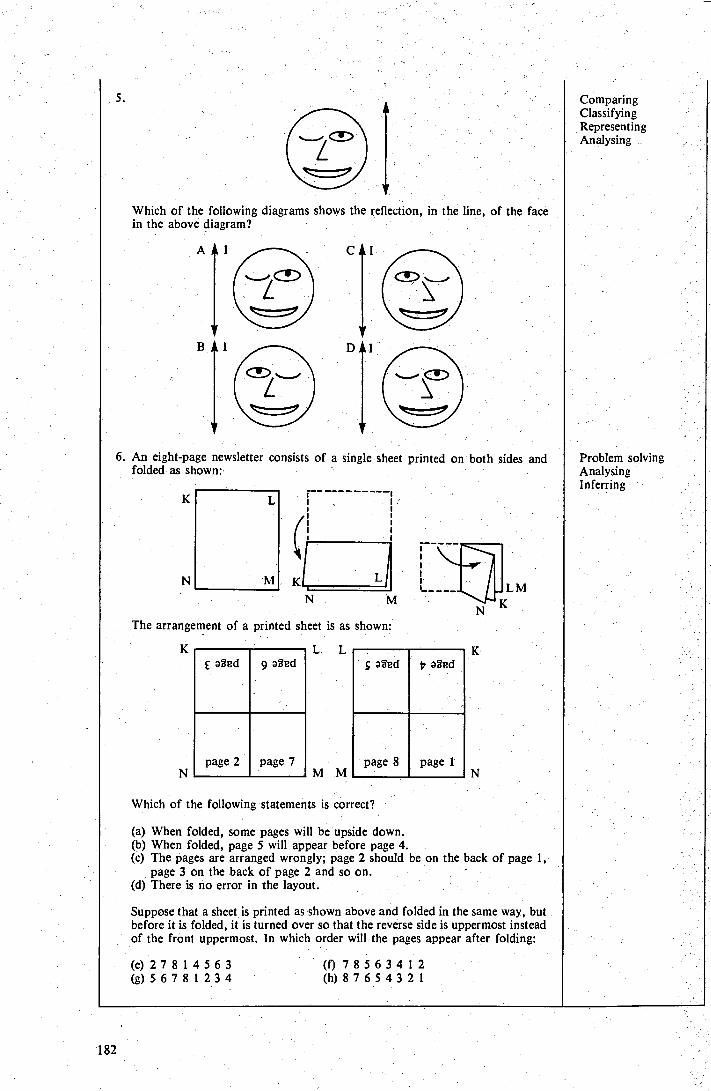
5.
Which of the following diagrams shows the reflection, in the line, of the face in the above diagram?
A I C I.
I В D
6. An eight-page newsletter consists of a single sheet printed on both sides and folded as shown:
К
N
of a printed sheet is
Which of the following statements is correct?
(a) When folded, some pages will be upside down. (b) When folded, page 5 will appear before page 4. (c) The pages are arranged wrongly; page 2 should be on the back of page I,
page 3 on the back of page 2 and so on. (d) There is no error in the layout.
Suppose that a sheet is printed as shown above and folded in the same way, but before it is folded, it is turned over so that the reverse side is uppermost instead of the front uppermost. In which order will the pages appear after folding:
(е ) 27814563 (f) 78563412 (g)56781234 (h)87654321
The arrangement
K
N page 2 page 7
Comparing Classifying Representing Analysing
Problem solving Analysing Inferring
L. L
M M
L
as shown:
'Т К N
page 8
ç adud b а 8uд
page 1
i 82
187 187
'ъ 188
C©-ordinates aud analytical ge©metry Contents,
Focus for teaching, learning and assessment Notes for teachers 1. Activities for representing ordered pairs on a grid
(Focus A) (a) Treasure hunt (b) Knight's moves (c) Integer battleships
2. Activities for representing continuous and discrete data (Focus A, В and C)
(a) Continuous and discrete data (b) Graphing a simple linear relationship
3.Activities for relating geometry to algebra (Focus В and C)
(a) Graphing formulae (b) Patterns in plane shapes (c) Patterns in three-dimensional shapes
1 Assessment'
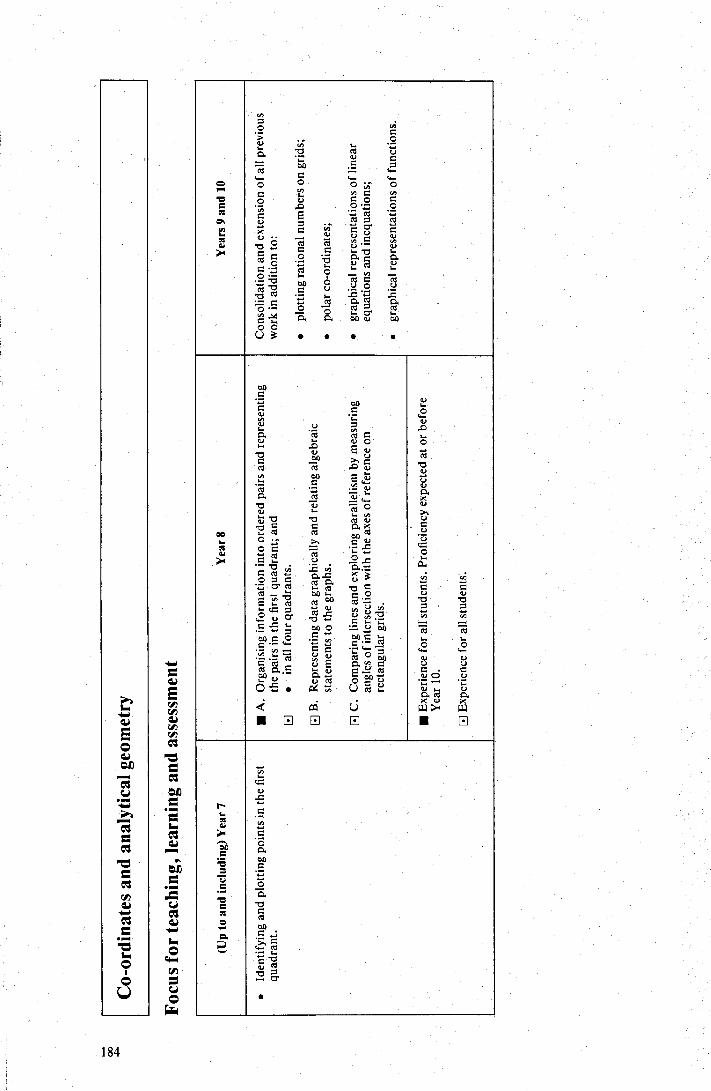
Yea
rs 9
and
10
g rap
h ica
l rep
rese
ntat
ion s
of
func
tion
s.
Е E
xper
ien c
e fo
r ai st
uden
ts.
to с .С СО
и С и е й G. сд п f c
,ui
b и од
co îo .о ± ас,
1.и. to G у
r- j н Ń (
a с
ř, a i ьи. С о
у и
‚_(O ( О •- >‚ ❑
O С ' ,
с . y° v О
•:- ;2' й
о
Q' сб -y RS T7 с п S у to 1- с o
с а г° oD са •й . , .Е
c С у С .С a..o., и . •- crб .
и
.џ - 4) са o оД
‚_4) е с І 0
о .
¢ c.i
■ о о а
(Up
to
and
incl
ud
ing)
Yea
r 7
r
Foc
us f
or t
each
ing,
lear
ning
and
ass
essm
ent
Co-
ordi
nate
s an
d an
aly t
ical
geo
met
ry
Notes for teachers
Students will have been introduced to the plotting of points in a rectangular co-ordinate system by Year 7. In Year 8 all students should become pro-ficietit in locating points using ordered pairs of numbers in the first quadrant. Students should also have experience in locating points and describing position using integers in all four quadrants.
The graphing of data on grids and the interpret-ation of relationships evident in graphs are both extremely important. Whenever possible, activi-ties should be designed to interrelate these aspects of graphing and interpretation.
Analytical geometry at Year 8 can only be at a very introductory and informal level since students are just being introduced to algebraic symbolism. The intention is that, whenever students recognise variability in situations and represent that variability in algebraic symbols, they also be given the chance to graph the relationships. In this way students can see a situation from both an algebraic and geometric perspective.
Introducing students to algebraic symbols at this early age is a teaching task fraught with difficulty. Be careful not to overload students with unnecess-ary symbolism.
For example, they might begin with a recognisable situation:
John is four times as old as Mary will be next birthday. What age might John be?
The essential algebra lies in expressing Mary's age as n and John's age as 4 x (n + 1). Understand-ing will not necessarily be enhanced by introduc-ing more symbols at this stage and expressing the situation as:
J = 4 x (n + 1)
or f(n) = 4 x (n + 1)
Tables of values and graphs can be constructed using language as follows:
• Complete the table.
4 )( (n + 1)
• Draw a graph to show the relationship between nand4 x (n + 1).
• When п is 4, what is the value of 4 x (n + 1)?
One purpose of analytical geometry at this Year 8 level is to allow students to get a `feel' for the position and slope of graphs formed. The class should recognise the equivalence of expressions such as 4 x (n + 1) and (4 x n) + 4 and the difference between that and (4 x n) + 1.
Students should become comfortable about mov-ing from simple algebraic expressions to graphical representations. This will be preparation for the more formal study in Years 9 or 10 when students begin with geometric lines and move to algebraic representations of these lines.
1. Activities for representing ordered pairs on a grid (Focus A)
1(a) Treasure hunt Present students with the labelled 15 x 15 grid containing a map of an island.
Direct the following questions to students to start the investigations:
• What is the nearest grid point to B at which a boat could land?
. Which other grid points are reasonably close landing sites?
• Is travel possible in a series of straight lines from B to C (6,6) and passing through just three grid points?
• What are the co-ordinates of those points?
Encourage discussion about different possible pathways.
Using the same map, give students a set of instructions that allow them to find a `hidden treasure'. Instructions such as the following could be given verbally, on an OIT or on the chalkboard.
Example 1: Land at (12,6). Travel in straight lines from the landing point to (8,8), then to (9,11) and to (11,4). The treasure will be at the point of intersection of these three paths. Where is it?
185.
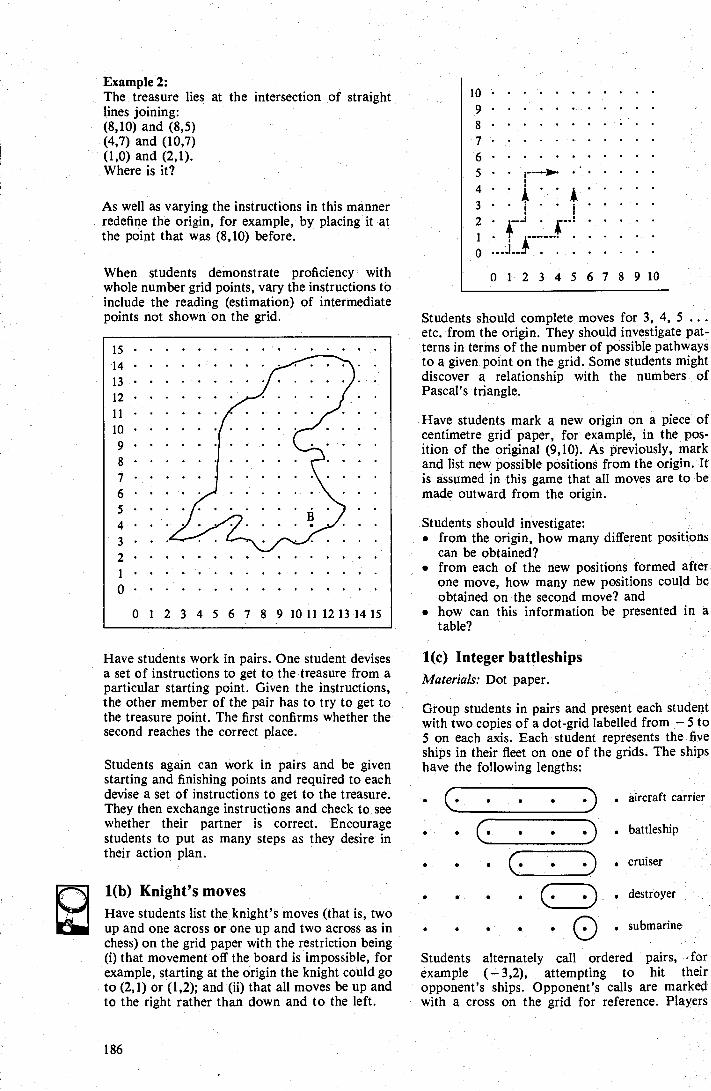
▪ j
г
у ..__ •ť
10 9 8 7 6 5 4 3 2 1 o
0 1 2 '3 4 5 б 7 8 9 10
Example 2: The treasure lies at the intersection of straight lines joining: (8,10) and (8,5) (4,7) and (10,7) (1,0) and (2,1). Where is it?
As well as varying the instructions in this manner redefine the origin, for example, by placing it at the point that was (8,10) before.
When students demonstrate proficiency with whole number grid points, vary the instructions to include the reading (estimation) of intermediate points not shown on the grid.
Have students work in pairs. One student devises a set of instructions to get to the treasure from a particular starting point. Given the instructions, the other member of the pair has to try to get to the treasure point. The first confirms whether the second reaches the correct place.
Students again can work in pairs and be given starting and finishing points and required to each devise a set of instructions to get to the treasure. They then exchange instructions and check to see whether their partner is correct. Encourage students to put as many steps as they desire in their action plan.
1(b) Knight's moves Have students list the knight's moves (that is, two up and one across or one up and two across as in chess) on the grid paper with the restriction being (i) that movement off the board is impossible, for example, starting at the origin the knight could go to (2,1) or (1,2); and (ii) that all moves be up and to the right rather than down and to the left.
Students should complete moves for 3, 4, 5 . .. etc. from the origin. They should investigate pat-terns in terms of the number of possible pathways to a given point on the grid. Some students might discover a relationship with the numbers of Pascal's triangle.
Have students mark a new origin on a piece of centimetre grid paper, for example, in the pos-ition of the original (9,10). As previously, mark and list new possible positions from the origin. It is assumed in this game that all moves are to be made outward from the origin.
Students should investigate: . from the origin, how many different positions
can be obtained? • from each of the new positions formed after
one move, how many new positions could be obtained on the second move? and
• how can this information be presented in a table?
1(с ) Integer battleships Materials: Dot paper.
Group students in pairs and present each student with two copies of a dot-grid labelled from 5 to 5 on each axis. Each student represents the five ships in their fleet on one of the grids. The ships have the following lengths:
.) . aircraft carrier
. battleship
• cruiser
. destroyer
• submarine
Students alternately call ordered pairs, for example (-3,2), attempting to hit their opponent's ships. Opponent's calls are marked with a cross on the grid for reference. Players
. (: . (.
186
\ . . . . . ., \;
0 1 2 3 4 5 б 7 8 9 10
—► strawberry
4 б 8 7 5 1 2 3 P
b 10 4 9 7 5 8 3 J
350 200 300 150 100 50 250 extract e
300 600 200 100 water w 400 700 500
inform their opponents when a ship has been hit. A ship is sunk when all the points it encloses have been hit.
2. Activities for representing continuous and discrete data (Focus A, B and C)
To develop the principle of representing ordered pairs on a grid, students should find data from realistic situations, tabulate the information and plot the points before making inferences based on graphical representations. It is important to pres- ent examples that develop an understanding of the concept of continuous data as well as of discrete data.
2(a) Continuous and discrete data Pose the following situations for students to investigate:
(i) Tuckshop sales A school tuckshop sells orange and strawberry lollipops for 50c each. How many different com-binations can be bought for $5?
Divide the class into pairs or small groups to dis-cuss the problem and to report possible solutions orally. After the. combinations have been listed, students should present them on a grid as shown.
Student discussion questions сап include:
▪ Why are the points in a straight line? • Is it meaningful to join the points? (Explain.
(ii) Luggage allowance Mr Travel is allowed to take luggage which, when weighed, meets the stipulated 20 kg limit. His belongings are to be packed. into two bags each weighing 1 kg when empty, one red and one brown. What combinations are possible which meet the total 20 kg allowance each time? Discuss the problem and compare this example with the lollipop one. Graph the results and discuss the straight line relationship and the meaning of inter-mediate points.
2(b) Graphing a simple linear relationship
(i) Ages The table below shows the respective ages at each birthday of Peter and Joan, of the Smithwick family.
Have students plot ordered pairs (1,3) ... on squared paper using the horizontal axis for Peter's age and the vertical axis for Joan's age..
Questions to students can include: • From the graph, what is Peter's age when Joan.
is 15? • From the graph, what is Joan's age when Peter
is 24? • Do the intermediate points have meaning if
Peter and Joan share the same birthday? • Is the situation different if they have different
birthdays?
(ii) Juice mixtures The table following shows the volume of water added to pure orange extract to make orange drinks of consistent strength.
Have students plot the volume of water against the volume of extract. Students should:
• read from the graph the volumes of water to be added to various volumes of extract and vice versa.
• discuss the slope of the graph and the relat-ionship between that slope and the statement w = 2 x e
187
е.п в Е
200 150 100 175 250 300 hamburgers m
wages d
О I i
• investigate what happens to the table of figures and the slope of the graph when a weaker mix-ture is made using
w=3 xeorw=4x e.
Students can try to explain in their own words the meaning, of symbols w, e, 4 x. e, w = 3 x e etc.
(iii) Hamburgersales Wendy has been promoted to manager at the fast-food store and will receive $220 per week salary and 30 cents for each hamburger sold. Complete the table below where m represents the number of hamburgers sold in the week.
Students should. . draw a straight line through points plotted and
discuss whether every point on the line has meaning in the given wages context. For example, what wage, if any, corresponds to the sale of 200.5 hamburgers?
• interpret the slope of the graph in terms of the expression 220 + (0.3 x d).
• examine what happens to the algebraic expression and to the graph when Wendy's wage rises to $260 or to $300 per week with the hamburger fee remaining constant.
Extension Some students could proceed to a fairly open investigation to examine other alterations. Students might discover what happens to the algebraic expression and to the slope of the graph when Wendy's wage is held at $220, but the hamburger fee rises to 50c or falls to 20c.
A computer could be useful in such an investi-gation.
3. Activities for relating geometry to algebra (Focus В and C)
The purpose of the work by Descartes in analyti-cal geometry was to unify the numerical and spatial aspects of mathematics.
Whenever students recognise variability in a situ-ation and are ready to express that variability in algebraic symbols, they should be allowed also to take a geometric point of view. Thus, whenever students find algebraic expressions in practical situations or in patterns they should be encour-aged to graph these and investigate the shape and slope of graphs drawn.
3(a) Graphing formulae When the formula ; for perimeter of a square is being developed, students will generate data and - eventually a relationship.
Side length
1
Perimeter 4
This relationship should be graphed and questions posed.
• If the side length is 2.5 m, what is the per-imeter?
• If the perimeter were 100 m, what would be the side length?
▪ What value of 4 x s corresponds to a side length of 0.5 m?
• Does (4 x s) ever have a negative value?
Other questions might be posed for higher achievers:
• Is (4 x s) always larger than (4 x s) —1? • What does the graph of (4 x s) — 1 look like? • What figure would have a perimeter of (4 x s)
— I? • Is the graph of 4 x (s — 1) different?
What figure has a perimeter of 4 x (s 1)?
3(b) Patterns in plane shapes Materials: Matchsticks or pop sticks.
In pre-algebra, students will have searched for a variety of patterns in simple configurations of plane shapes such as the one shown above. In algebra, students will seek to express the general terms of such patterns in algebraic symbols.
Students may have formed the above elements of a series out of matchsticks. They might investigate the total number of matches used.
4, 7, 10, 13, 1б . ..
Different groups of students might rebundlé the sticks in different ways and express the general terms differently.
2
8 12 16 4xs
188
Example А :
• Number of sticks along the top 1,2,3,4 п
Number of internal sticks (or number of 2 x 1 rectangles) 0, 1, 2, 3 п — 1
• Number of external sticks 4,6,8,10 2n+2
1+ (2x 3)
General term
u J 1+ (3x3)
1 + (п х 3)
etc.
о
о 4+ (2 x 3) i .
General term 4+ [( п - 1) х 3]
Example C:
U (1 + 1) + (2 х 1)
U°°=U. (1 + 2) + (2 x 2)
0=0=1=1 (1
General term (1
+ 3) + (2 х 3) i i
+ n) ± (2 х п )
From here, one teaching strategy is to show by algebraic manipulation that all these expressions for the general term are equivalent.
Number of 3 match intersections 0, 2, 4, 6 2 n 2
The importance of using physical materials, such as matchsticks, for these investigations cannot be overemphasised. Most students will have difficulty in developing an appropriate general term for pat-terns. The opportunity to remove and rebundle the sticks helps in this regard. In the last example above some students might reduce the pattern from:
о о Y ELD m ~ to:
r пт - -гґґ ---•
and see the number of three match intersections as `two lots of one less than n', that is, 2 x (n - 1) .
Then the opportunity to graph both (2 x n) — 2 and 2 x (n — 1) can help to reinforce the idea of the equivalence of these expressions.
3(c) Patterns in three-dimensional shapes Materials: Centicubes (interlocking cubes).
Set students the task of forming the first few of the following series of blocks with missing squares in the middle.
4±0
4 + (1 х 3)
Another strategy is to urge students to form tables of values and draw graphs.
4+(n-1)x3
This approach provides a geometric reinforce-ment of the idea of equivalent expressions. It also shows up those `general terms' where mistakes have been made and inappropriate expressions generated.
Many other patterns can be similarly investigated just on the basis of this same spatial pattern.
This provides another context for investigation of patterns, conjectures about general terms and graphing to provide a geometrical view of the expressions.
Numbers of blocks
8, 12, 16, 20 ... 4 x (n + 1)
Students can use different coloured blocks arranged so as to show the way they see the pat-tern. For example:
189
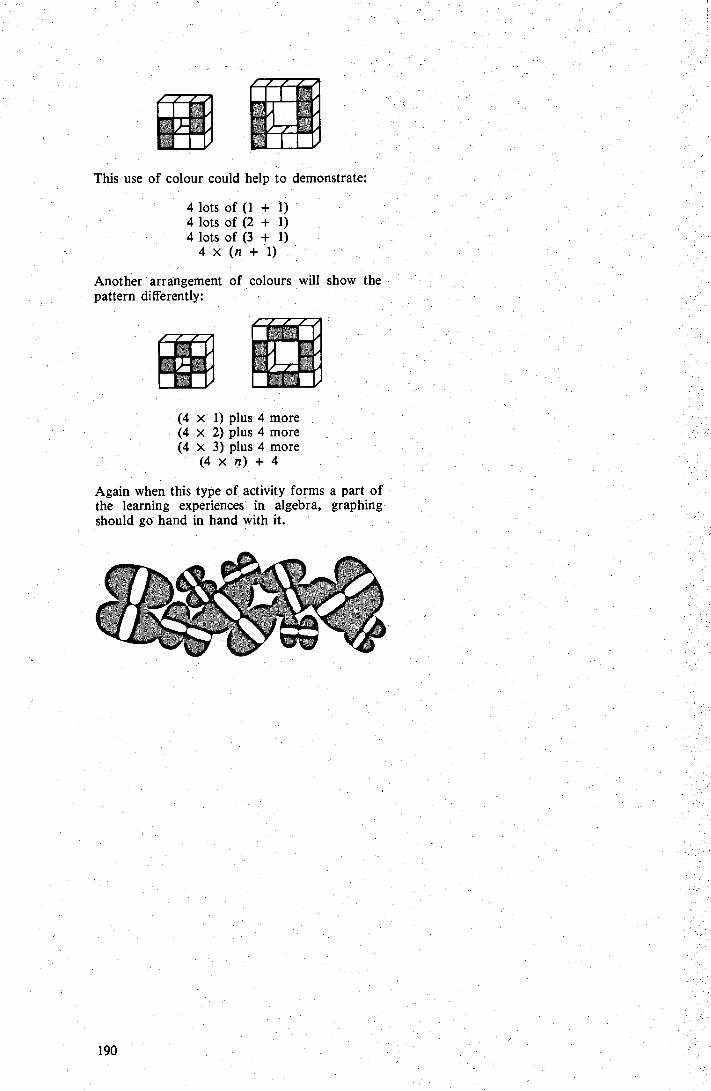
This use of colour could help to demonstrate:
4 lots of (1 + 1) 4 lots of (2 + 1) 4 lots of (3 + 1)
4 x (n + 1)
Another arrangement of colours will show the pattern differently:
(4 x 1) plus 4 more (4 x 2) plus 4 more (4 x 3) plus 4 more
(4x п ) +4
Again when this type of activity forms a part of the learning experiences in algebra, graphing should go hand in hand with it.
190
Cost Number of Rides
0
2 3 4 5
$1.00 $1.50
Assessment Assessment must involve ongoing monitoring of students' progress throughout the year. A variety of pro-cedures — such as observations of students as they work with materials, informal discussions and written tests - should be used to gather relevant information.
Students who are developing proficiency with the concepts of co-ordinates and introductory analytical geometry at this level should be able to use a variety of processes in a range of situations similar to those suggested below. Some of these tasks are not designed to be given to all students at the same time, especially those tasks where students are required to explain or demonstrate ideas or procedures.
Major processes Assessment ideas
1. A rectangle of perimeter 14 cm was drawn. Draw a table listing possible whole number lengths and breadths for that rectangle. Draw a graph to represent the data.
2. The table outlines input and output numbers as a result of the application of a particular rule. Find a rule which fit the data.
Organising Representing
Problem solving Analysing Organising
Input
5 7
Output
7 11 15
з . An amusement park has an admission charge of $1 and a charge of $0.50 for each ride. Complete the table for up to 10 rides.
• Represent the information graphically by plotting cost against number of rides.
• If rides were $0.25 each but admission $2, represent the information graphi- cally. Which situation would be the more attractive financially? Why?
4. On a 15 x 15 grid, a marker is placed at (0,0), and it can move only in an L-move that is one up and three across or three up and one across.
▪ Is it possiЫ e for the marker to reach the top right-hand corner, point (15.15)?
• If so, what is the minimum number of moves for the task?
5. Two students investigate a pattern in some shapes and arrive at different ways of expressing the general term.
Student A: 4 x (n + 1) Student B: 3 x n + (n + 1)
Demonstrate graphically whether or not these expressions are equivalent.
Representing Problem solving Calculating Explaining
Problem solving Representing Analysing ..
Representing Analysing Comparing Organising
191

Trigonomе try m
Contents '` ,
Focus for teaching, lе Notes tor teachers
oing and assessment
1. Activities for measuring comparing and graphing ratios of heights to horizontal distances (Focus A and B);
(a) L-shapes with constant height (b) Shadow sticks (c) L-shapes with constant horizontal distance (d) Pathways .>...
2. Activities for analysing height base ratios in similar right-angled triangles (Focus C and D)
(a) Similar right-angled triangles (b) Checking for similarity ".(c) Problems with heights (d) Consolidation and practice (е )"Open investigation of tangent ratios
'Activity sheeť s
Assessment
; ;
196`
196 196 А 196 197 ` 197
193
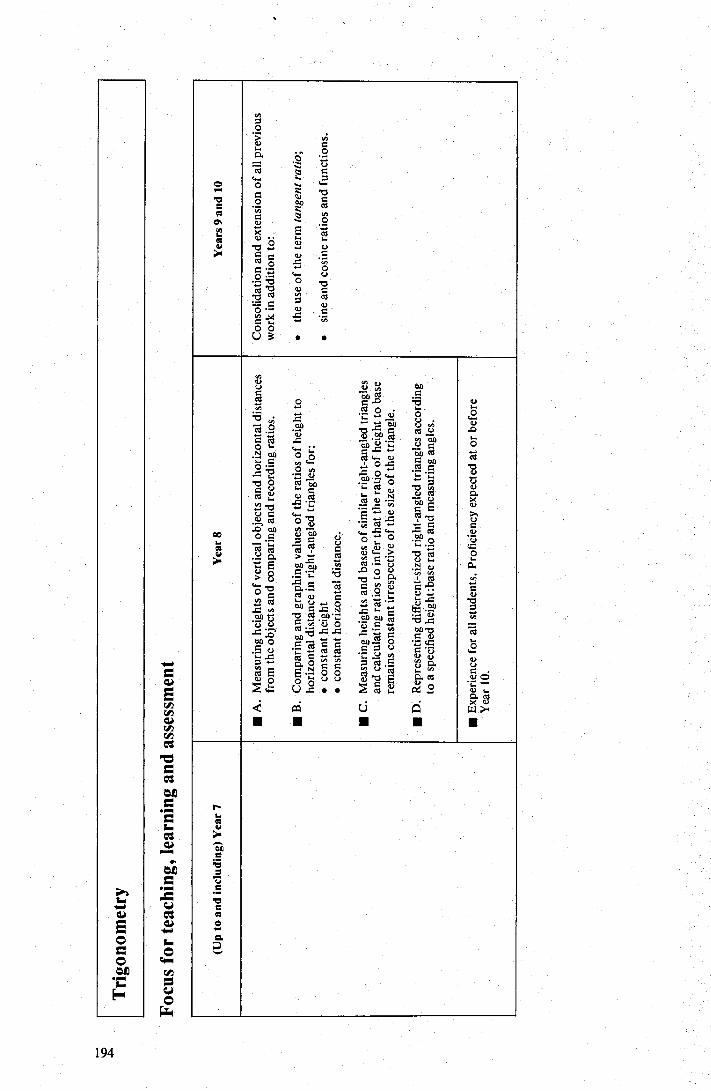
Ye
ars
9 a
nd
10.
и и
С .. . ,а? .. и С . Ý сб
О С д 1
. и +- сö О ь ,. :а .С •у a i О
v с
, д . 00 •p •C q ý
+ а ) , . сд . и Ø С
I- w w ö0 C) ;_ N[
N г ь С с2 . ..'+ Ó š . С eO
ь С1 [ Ои ь . ' . ь%
Ь I
й сö а, a пн ь и •
v, Rs и «г+
.-
CC) .-
_ и С
C)..
Ф
O С ý eD
i
г ч-
av":
сд_.Ч °
С[б и 4. .
сö сд R [ а а > cö ш >
^ [ ' ý'ь. С ео 0D й> О ['ь .. b° О .
'и
с a•[ с ;: у ь г о . c г и °° [ оо й .eл •C ео eo c[a :â С = :b
C) .д . š •ь .,[ , ер -v
ео о tn_o [ с
ь . [ й й
.L и . и . .C) •C)
,
й а o Са v
C) ° cö •; ° á к о О o c [ д
w С ) г .•.• G с ьи. . 61С O
¢ ai Ů L1 ■ ■ ■ ■
(Up
to
an
d in
clu
din
g) Y
ea
r 7
Focu
s fo
r tea
chin
g, le
arni
ng a
n d a
sses
smen
t
Tri
g ono
met
ry
194
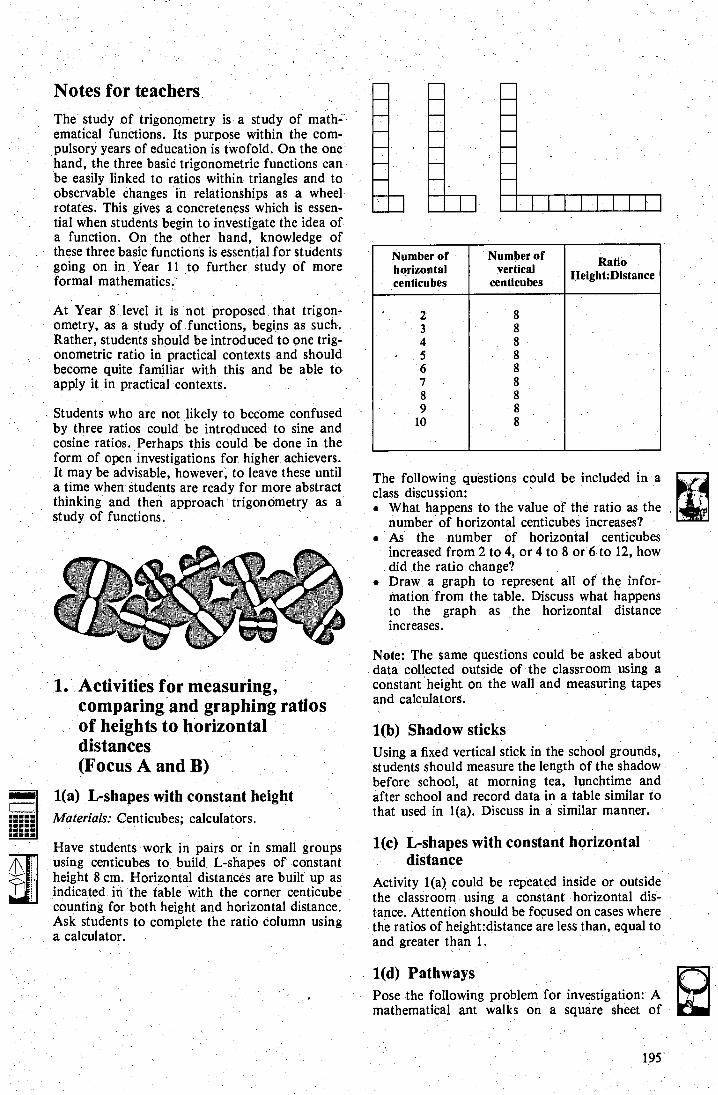
— г ..... ввввв ввввв вввв ■ ввввв
8 8 8 8 8 8 8 8 8
2 3 4 5 б 7 8 9
10
Numberof horizontal centicubes
Number of vertical
centicubes
Ratio Height:Distance
a be included in
1(d) Pathways Pose the following problem for investigation: A mathematical ant walks on a square sheet of
195
Notes for teachers The study of trigonometry is a study of math-ematical functions. Its purpose within the com-pulsory years of education is twofold. On the one hand, the three basic trigonometric functions can be easily linked to ratios within triangles and to observable changes in relationships as a wheel rotates. This gives a concreteness which is essen-tial when students begin to investigate the idea of a function. On the other hand, knowledge of these three basic functions is essential for students going on in Year 11 to further study of more formal mathematics.
At Year 8 level it is not proposed that trigon-ometry, as a study of functions, begins as such. Rather, students should be introduced to one trig-onometric ratio in practical contexts and should become quite familiar with this and be able to apply it in practical contexts.
Students who are not likely to become confused by three ratios could be introduced to sine and cosine ratios. Perhaps this could be done in the form of open investigations for higher achievers. It may be advisable, however, to leave these until a time when students are ready for more abstract thinking and then approach trigonometry as a study of functions.
1• Activities for measuring, comparing and graphing ratios of heights to horizontal distances (Focus A and В )
1(a) L-shapes with constant height Materials: Centicubes; calculators.
Have students work in pairs or in small groups using centicubes to build L-shapes of constant height 8 cm. Horizontal distances are built up as indicated in the table with the corner centicube counting for both height and horizontal distance. Ask students to complete the ratio column using a calculator.
The following questions could class discussion: • What happens to the value of the ratio as the
number of horizontal centicubes increases? • As the number of horizontal centicubes
increased from 2 to 4, or 4 to 8 or б to 12, how did the ratio change?
• Draw a graph to represent all of the infor- mation from the table. Discuss what happens to the graph as the horizontal distance increases.
Note: The same questions could be asked about data collected outside of the classroom using a constant height on the wall and measuring tapes and calculators.
1(b) Shadow sticks Using a fixed vertical stick in the school grounds, students should measure the length of the shadow before school, at morning tea, lunchtime and after school and record data in a table similar to that used in 1(a). Discuss in a similar manner.
1(c) L-shapes with constant horizontal distance
Activity 1(a) could be repeated inside or outside the classroom using a constant horizontal dis-tance. Attention should be focused on cases where the ratios of height:distance are less than, equal to and greater than 1.
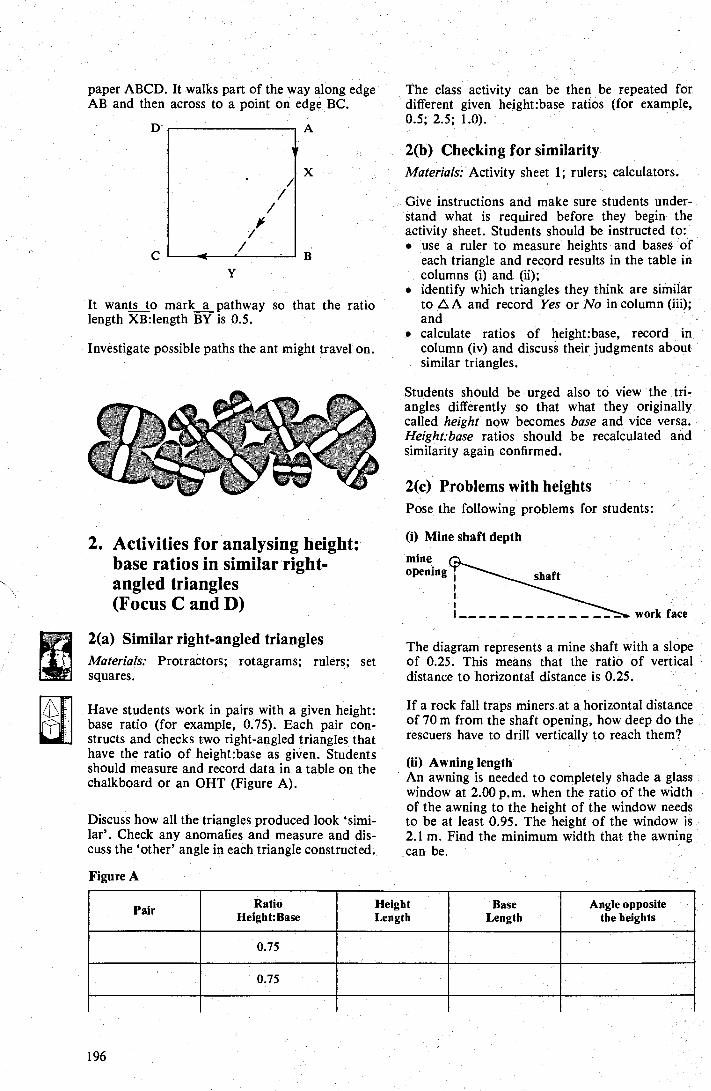
y
/ /
/ y
/ /
A
Ratio Height:Base Pair Angle opposite
the heights Height Length
Base Length
0.75
0.75
paper ABCD. it walks part of the way along edge AB and then across to a point on edge BC.
D
C Y
It wants to marka pathway so that the ratio length XB:length BY is 0.5.
Investigate possible paths the ant might travel on.
2. Activities for analysing height: base ratios in similar right-angled triangles (Focus C and D)
2(a) Similar right-angled triangles Materials: Protractors; rotagrams; rulers; set squares.
Have students work in pairs with a given height: base ratio (for example, 0.75). Each pair con-structs and checks two right-angled triangles that have the ratio of height:base as given. Students should measure and record data in a table on the chalkboard or an OHT (Figure A).
Discuss how all the triangles produced look 'simi-lar'. Check any anomalies and measure and dis-cuss the `other' angle in each triangle constructed.
The class activity can be then be repeated for different given height:base ratios (for example, 0.5 2.5; 1.0).
2(b) Checking for similarity Materials: Activity sheet 1; rulers; calculators.
Give instructions and make sure students under-stand what is required before they begin the activity sheet. Students should be instructed to: •, use a ruler to measure heights and bases of
each triangle and record results in the table in columns (i) and (ii);
• identify which triangles they think are similar to a A and record Yes or No in column (iii); and
• calculate ratios of height:base, record in column (iv) and discuss their judgments about similar triangles.
Students should be urged also to view the tri-angles differently so that what they originally called height now becomes base and vice versa. Height:base ratios should be recalculated and similarity again confirmed.
2(c) Problems with heights Pose the following problems for students:
(i) Mine shaft depth
mine opening shaft
--------- work face
The diagram represents a mine shaft with a slope of 0.25. This means that the ratio of vertical distance to horizontal distance is 0.25.
If a rock fall traps miners.at a horizontal distance of 70 m from the shaft opening, how deep do the rescuers have to drill vertically to reach them?
(ii) Awning length An awning is needed to completely shade a glass window at 2.00 p.m. when the ratio of the width of the awning to the height of the window needs to be at least 0.95. The height of the window is 2.1 m. Find the minimum width that the awning can be.
Figure A
196
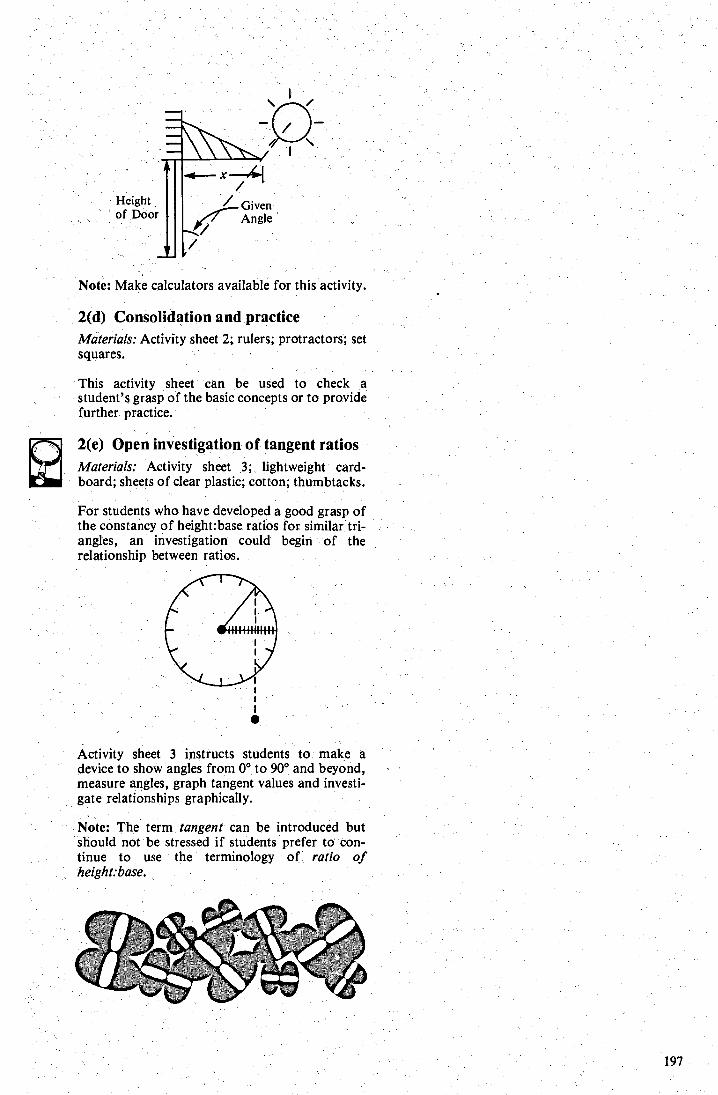
Note: The term tangent can be introduced but should not be stressed if students prefer to con-tinue to use the terminology of ratio of height:base.
Note: Make calculators available for this activity.
2(d) Consolidation and practice Materials: Activity sheet 2; rulers; protractors; set squares
This activity sheet can be used to check a student's grasp of the basic concepts or to provide further practice.
2(e) Open investigation of tangent ratios Materials: Activity sheet 3; lightweight card-board; sheets of clear plastic; cotton; thumbtacks.
For students who have developed a good grasp of the constancy of height:base ratios for similar tri-angles, an investigation could begin of the relationship between ratios.
Activity sheet 3 instructs students to make a device to show angles from 0° to 90° and beyond, measure angles, graph tangent values and investi-gate relationships graphically.
197
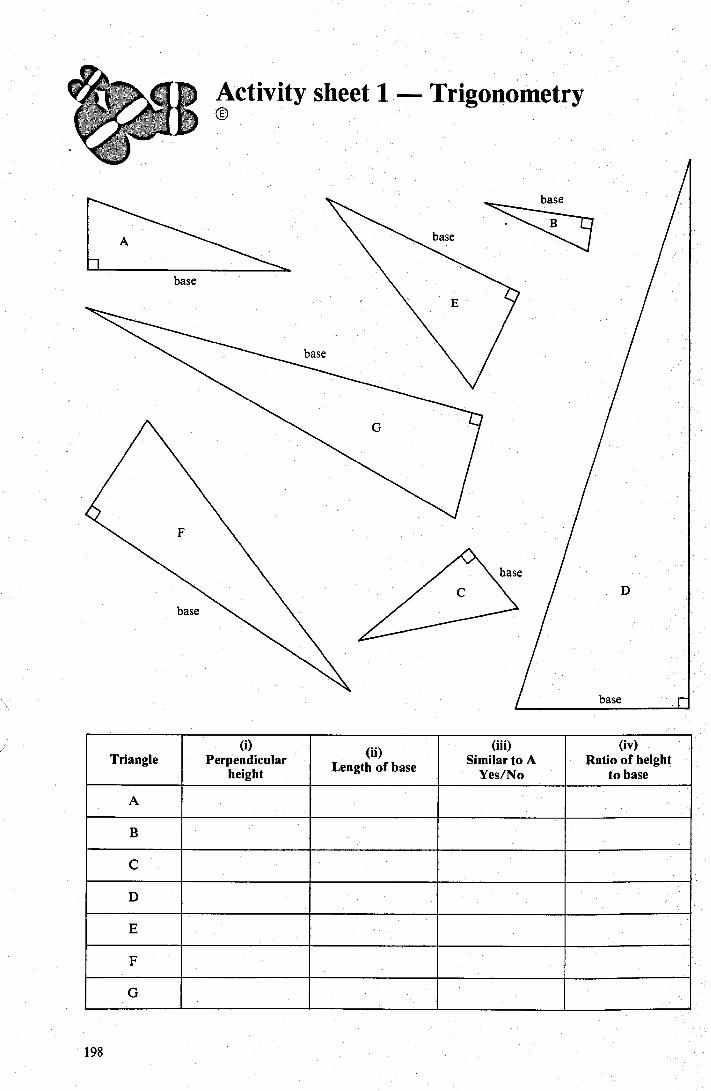
198
(i) Perpendicular
height
(ii) Length of base
(iii) Similar to A
Yes/No
(iv) Ratio of height
to base Triangle
A
В
C
D
Е
F
с
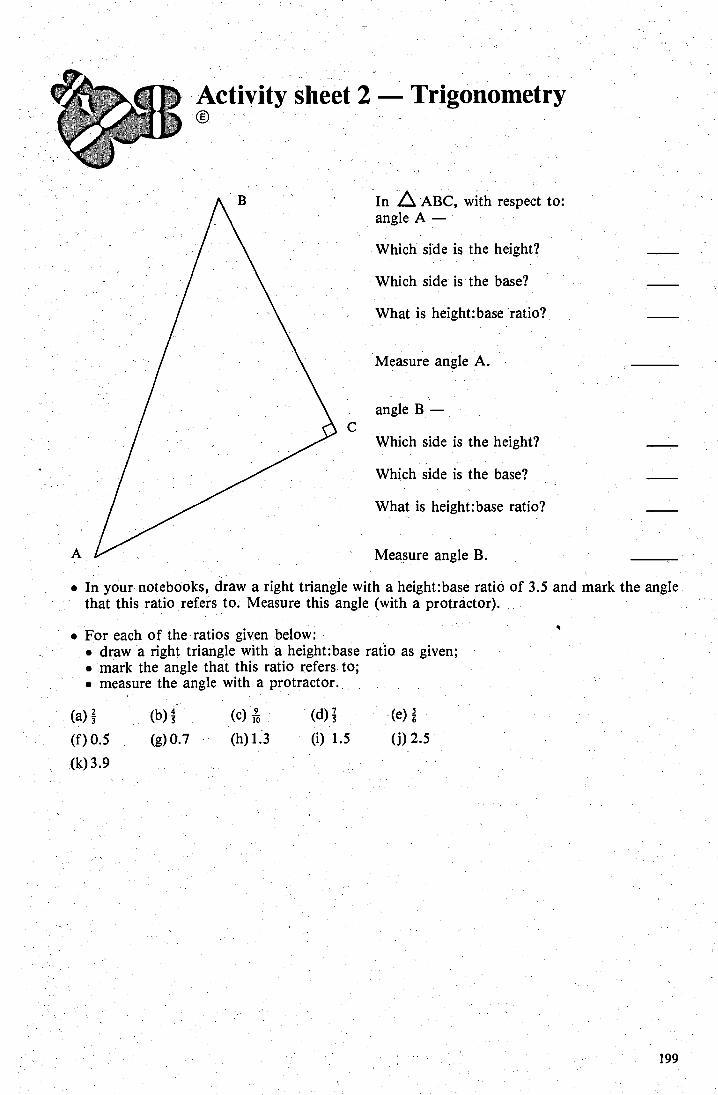
199
Activity sheet 2 — Trigonometry O
In А ABC, with respect to: angle A —
Which side is the height?
Which side is the base?
What is height:base ratio?
Measure angle A.
angle B —
Which side is the height?
Which side is the base?
What is height:base ratio?
Measure angle B.
• In your notebooks, draw a right triangle with a height:base ratio of 3.5 and mark the angle that this ratio refers to. Measure this angle (with a protractor).
• For each of the ratios given below: • draw a right triangle with a height:base ratio as given; • mark the angle that this ratio refers to; • measure the angle with a protractor.
(a) э (b) š (c) о (d) š (e) ь ..
(f)0.5 (g)0.7 (h)1.3 (i) 1.5 (j)2.5
(k) з .9
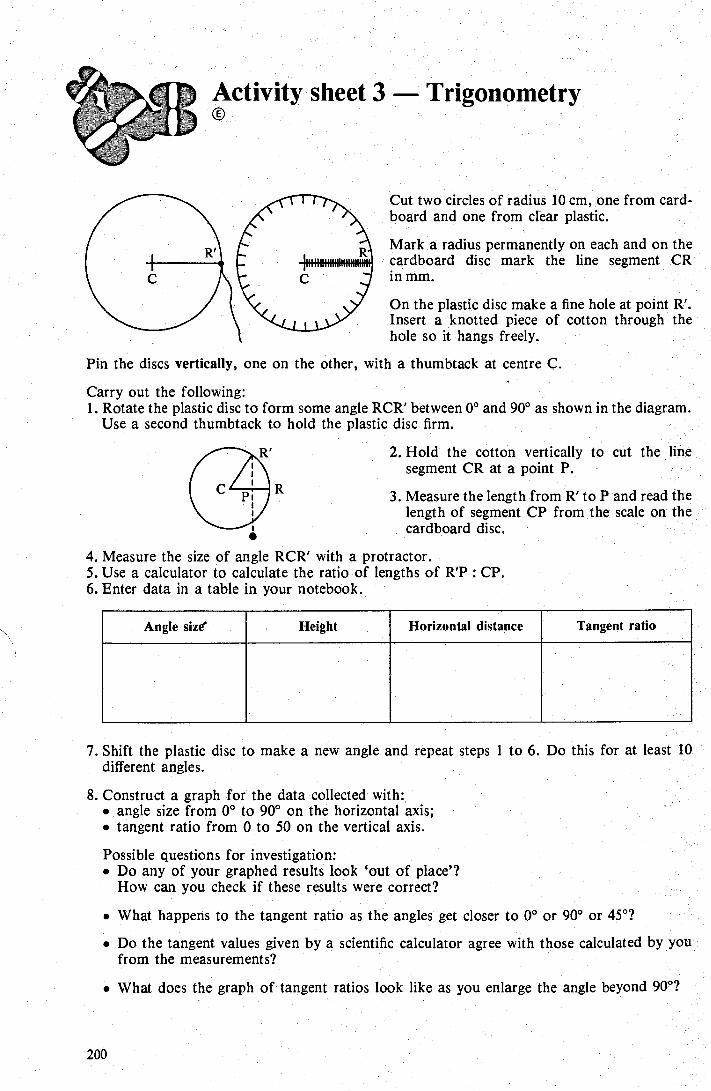
•
Angle size Height Horizontal distance Tangent ratio
Activity sheet 3 — Trigonometry 0
Cut two circles of radius 10 cm, one from card-board and one from clear plastic.
Mark a radius permanently on each and on the cardboard disc mark the line segment CR in, mm.
On the plastic disc make a fine hole at point R'. Insert a knotted piece of cotton through the hole so it hangs freely.
Pin the discs vertically, one on the other, with a thumbtack at centre C.
Carry out the following: 1. Rotate the plastic disc to form some angle RCR' between 0° and 90° as shown in the diagram.
Use a second thumbtack to hold the plastic disc firm.
2. Hold the cotton vertically to cut the line segment CR at a point P.
3. Measure the length from R' to Pand read the length of segment CP from the scale on the cardboard disc.
4. Measure the size of angle RCR' with a protractor. 5. Use a calculator to calculate the ratio of lengths of R'P : CP. 6. Enter data in a table in your notebook.
7. Shift the plastic disc to make a new angle and repeat steps 1 to 6. Do this for at least 10 different angles.
8. Construct a graph for the data collected with • angle size from 0° to 90° on the horizontal axis; • tangent ratio from 0 to 50 on the vertical axis.
Possible questions for investigation: • Do any of your graphed results look `out of place'?
How can you check if these results were correct?
• What happens to the tangent ratio as the angles get closer to 0° or 90° or 45°?
• Do the tangent values given by a scientific calculator agree with those calculated by you from the measurements?
• What does the graph of tangent ratios look like as you enlarge the angle beyond 90°?
200
Assessment Assessment must involve ongoing monitoring of students' progress throughout the year. A variety of pro- cedures - such as observation of students as they work with materials, informal discussions and written tests
should be used to gather relevant information.
Students are just being introduced to trigonometry in Year 8. Proficiency at this level will be indicated by use of a variety of processes in a range of situations as suggested below. Some of these tasks have not been designed to be given to all students at the same time, especially where students are required to explain or demonstrate ideas or procedures.
Major processes Assessment ideas
In the diagram, choose the right-angled triangles in which you can show the largest and the smallest ratios for vertical height:horizontal. distance. Use a ruler and calculator to demonstrate the truth of your answers.
The above diagram represents a roof of a house. The slope of the roof is 0.35 and the fall (distance CB) is 4.5 m. Find the rise.
3. In a triangle the ratio of length of MN:length of M Р is less than 1.
Draw a right-angled triangle and label it to demonstrate the situation given above.
What can you say about the size of each angle in your triangle?
4. Draw two similar right-angled triangles in which you can show a ratio of per-pendicular height:horizontal distance of 0.7.
B
X
Y '
C
Analysing Explaining Measuring Calculating Validating
Problem solving
Analysing Comparing Explaining Problem solving
Representing Explaining Validating
201

Yea
rs 9
and
10
л .. д
v С . Z7 .. . . г ._ v • a к пг
L • • v й оС пг а
к
О
•
а T3 ий -
•аг . а . и в ` к а v п . С о
С
• °
с е С и г.- •fl С N ~ О О 'гл и С О
' 05 Z С г С с:д Ú С
acбi 3 а к г а й и и 'Č г О N .&О . ск г • .. С . . г.. у . b0 к • 4 к О :
• Ii • N. N •С .
а о Č Č b ..b и и с д и 3 р . и
Ск. çу сд С од ř й Е С Ń р •
0 cнб
С • ь. 'ç% , ы co Ø и t on и Ú й С Ç OD Û д С
1 Ć 7i C 'C • й •V u и cб u й Я сид Č й л ... С С v с
. г й
к
. • С , u
0
џ и в b '
а cň u ci u.i ■ ■ о ■ о
(Up
to a
nd in
clu
din
g) Y
ear
7
Pla
ne g
eom
etry
. cд Ρ „ к . у. С •+ . г.. рг О о ; o и .✓ ^ .
.+ ос к
• о
� а ё ôo
с 8 С о о к и
С ьх, ы Ои ы й °v ń •. . .
о о U 3 • • • •
. Pro
ficie
ncy
exp e
cted
at o
r be
f ore
ј E
xper
ienc
e fo
r all
stud
ents
.
Foc
us
for
teac
hin
g, lea
rnin
g an
d as
sess
men
t
Geo
met
ry on a
sphe
re
204
dodecahedron
Notes for teachers The major purpose of an investigation of geometry on a sphere is to provide students with an `accessible geometry that is an alternative to the traditional one based on rectangular co-ordinates. It is intended that the comparison of the two will both deepen students' appreciation of the power and limitations of the traditional plane geometry and generate awareness of their position on the (almost) spherical surface on which they live.
The treatment suggested in these activities is informal and investigative. It is not intended that students in Years 8 to 10 use the formulae . of spherical geometry. These experiences are not intended to constitute any significant part of formal assessment procedures at Year 8 level.
Language Some terminology will need to be discussed care-fully with students in order to clarify under-standing:
• circle — a plane curve consisting of all points at a given distance (radius) from a fixed point (centre) in the plane;
. great circle — a section of a sphere by a plane through its centre.
л &іА АУАУАУАУА 'ї 'w' icosahedron
1(b) Skeletal models Materials: Activity sheets 3, 4 and 5; lightweight cardboard.
First have students work in pairs or small groups to construct the spherical icosahedron as follows:
• Cut out 20 pieces as in the diagram and score along the straight lines.
1. Activities for constructing models of a sphere (Focus A and C)
1(a) Constructing models that are `almost' spheres
Materials: Activity sheets 1 and 2; lightweight cardboard.
Have students draw on large pieces of cardboard nets of the dodecahedron and icosahedron, using the diagrams as guides but with larger base shapes (pentagon or triangle). The shapes made by fold-ing and gluing tabs can be decorated, hung on display and used as discussion starters.
• Are the shapes spheres or almost spheres?
•
How can they be made more spherical? • Are there objects around you similar to these
models? (For example, soccer balls, netballs and geodesic dome houses.)
• Fold each piece towards you along the lines to make a spherical triangle. Do, not overlap pieces but rather glue the two half-sectors of one piece to a full-sector of another piece.
Complete by gluing pieces together and ensur-ing that five triangles always meet at each vertex. .
205
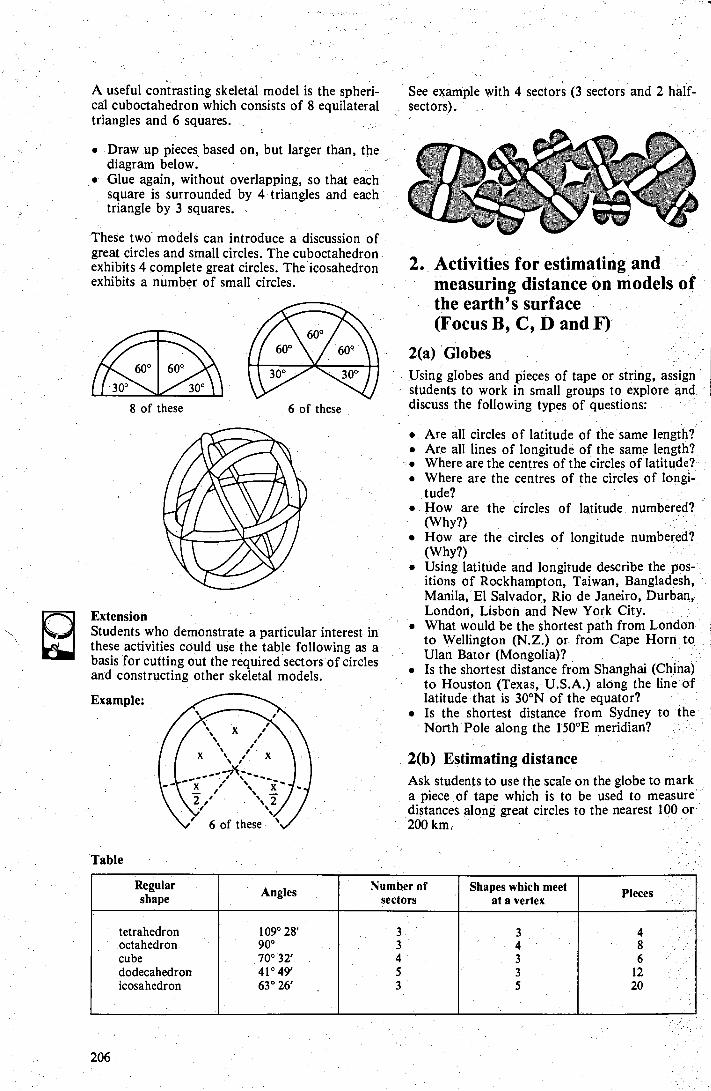
A useful contrasting skeletal model is the spheri-cai cuboctahedron which consists of 8 equilateral triangles and б squares.
See example with 4 sectors (3 sectors and 2 half-sectors).
.
• Draw up pieces based on, but larger than, the diagram below.
• Glue again, without overlapping, so that each square is surrounded by 4 triangles and each triangle by 3 squares.
These two models can introduce a discussion of great circles and small circles. The cuboctahedron exhibits 4 complete great circles. The icosahedron exhibits a number of small circles.
8 of these 6 of these
Extension Students who demonstrate a particular interest in these activities could use the table following as a basis for cutting out the required sectors of circles and constructing other skeletal models.
Example:
X
_ ___ ' '\«:
::
'' Х
Х
б of these
Table
2• Activities for estimating and measuring distance on models of .
the earth's surface (Focus B, C, D and F)
2(a) Globes Using globes and pieces of tape or string, assign students to work in small groups to explore and. discuss the following types of questions:
• Are all circles of latitude of the same length? • Are all lines of longitude of the same length? • Where are the centres of the circles of latitude? • Where are the centres of the circles of longi-
tude? • How are the circles of latitude numbered?
(Why?) • How are the circles of longitude numbered?
(Why?) • Using latitude and longitude describe the pos-
itions
of Rockhampton, Taiwan, Bangladesh, Manila, El Salvador, Rio de Janeiro, Durban, London, Lisbon and New York City.
• What would be the shortest path from London to Wellington (N.Z.) or from Cape Horn to Ulan Bator (Mongolia)?
• Is the shortest distance from Shanghai (China) to Houston (Texas, U.S.A.) along the line of latitude that is 30°N of the equator?
• Is the shortest distance from Sydney to the North Pole along the 150°E meridian?
2(b) Estimating distance Ask students to use the scale on the globe to mark a piece of tape which is to be used to measure distances along great circles to the nearest 100 or 200 km:
i , ; 'ѕ
X s i X
Regular shape Angles Number of
sectors Shapes which meet
at a vertex Pieces
3 4 3 3 5
4 в б
12 20
3 3 4 5 3
10%° 28' 90° 70° 32' 41° 49' 63° 26'
tetrahedron octahedron cube dodecahedron icosahedron
206
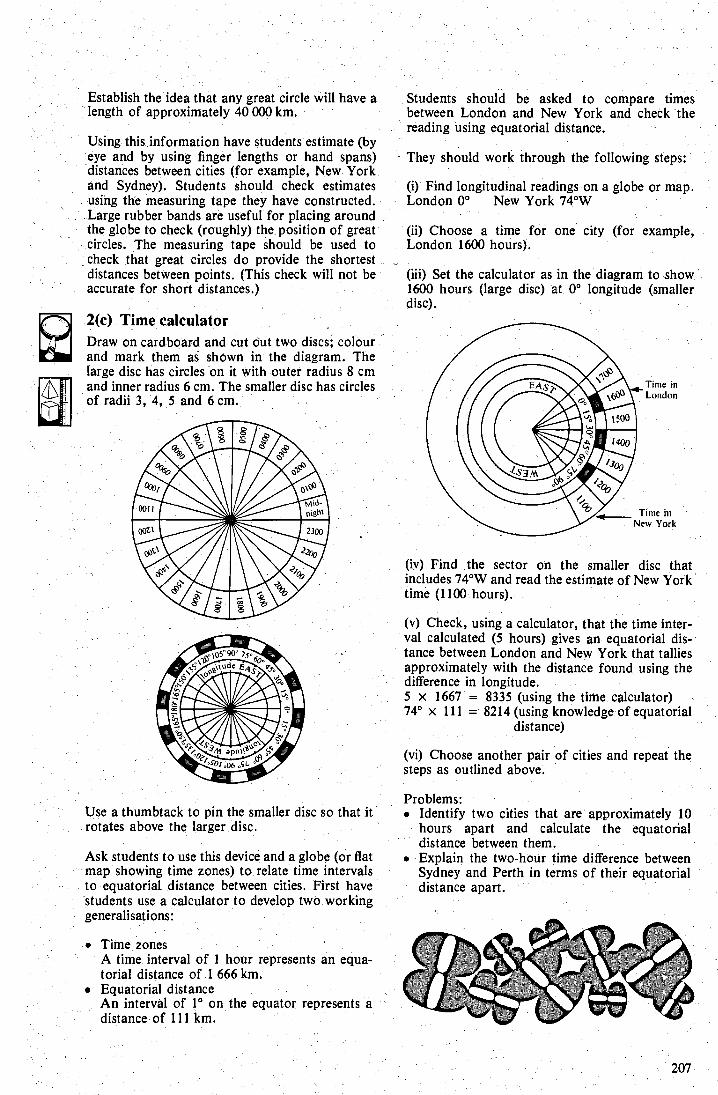
Time in London
Time in New York
Establish the idea that any great circle will have a length of approximately 40 000 km.
Students should be asked to compare times between London and New York and check the reading using equatorial distance.
Using this information have students estimate (by eye and by using finger lengths or hand spans) distances between cities (for example, New York and Sydney). Students should check estimates using the measuring tape they have constructed. Large rubber bands are useful for placing around the globe to check (roughly) the position of great circles. The measuring tape should be used to check that great circles do provide the shortest. distances between points. (This check will not be accurate for short distances.)
2(c) Time calculator Draw on cardboard and cut out two discs; colour and mark them as shown in the diagram. The large disc has circles on it with outer radius 8 cm and inner radius 6 cm. The smaller discpas circles of radii 3, 4, 5 and 6 cm.
Use a thumbtack to pin the smaller disc so that it rotates above the larger disc.
Ask students to use this device and a globe (or flat map showing time zones) to relate time intervals to equatorial distance between cities. First have students use a calculator to develop two working generalisations:
• Tim ě zones A time interval of 1 hour represents an equa-torial distance of 1 666 km.
• Equatorial distance An interval of 1° on the equator represents a distance of 111 km.
They should work through the following steps:
(i) Find longitudinal readings on a globe or map. London 0° New York 74°W
(ii) Choose a time for one city (for example, London 1600 hours).
(iii) Set the calculator as in the diagram to show. 1600 hours (large disc) at 0° Iongitude (smaller disc).
(iv) Find the sector on the smaller disc that includes 74°W and read the estimate of New York time (1100 hours).
(v) Check, using a calculator, that the time inter-val calculated (5 hours) gives an equatorial dis-tance between London and New York that tallies approximately with the distance found using the difference in longitude. 5 x 1667 = 8335 (using the time calculator) 74° x 111 = 8214 (using knowledge of equatorial.
distance)
(vi) Choose another pair of cities and repeat the steps as outlined above.
Problems: • Identify two cities that are approximately 10
hours apart and calculate the equatorial distance between them.
• Explain the two-hour time difference between Sydney and Perth in terms of their equatorial distance apart.
207
з . Activities for defining position on spherical surfaces (Focus C, D, E and F)
3(a) Position on a sphere Some students may be already quite familiar with the conventions of labelling position on the earth's surface using latitude and longitude and 0° longitude as a reference meridian. Students can be challenged by being asked to consider the positive and negative aspects of using a different system.
A group of high achievers could be given the following instructions and questions. They could proceed to develop and investigate further questions.
Establish the point in the Gulf of Guinea where the 0° meridian crosses the equator as an `origin'. Establish a numbering convention based on the lines of latitude and longitude marked on your globe. For example, you might decide to label the 300, 60° etc. lines of longitude 1, 2, 3 . 12 so that the origin is both (0,0) and (12,0). The 15° lines of latitude might be Iabelled 1, 2, 3 ... 6 above and —1, —2 ... —6 below the equator.
Discussion should focus on questions such as:
▪ How do we name the position of Bangladesh (3, 1.5) or Sydney (5, —2.3) or Guatemala (9, 1)?
• What lies at (0, 3.5) or (12, -2.5)? • What problems arise in naming the North and
South Poles? • Is the shortest distance between (2, 2) and (2, 3)
the same as that between (1, 2) and (1, 3)? • Is the shortest distance between (3, 1) and (4, 1)
the same as that between (3, 5) and (4, 5)? • What are the advantages and disadvantages of
such a system? • What other questions does this raise in your
mind about such a system?
3(b) The Straight-Line Airlines company Present the following situation to students:
Straight-Line Airlines is a company that schedules only straight-line (great circle) routes and will land only at major cities on (or at least very close to) those routes.
• Have students use large rubber bands to simu-late great circles on a globe. Have them ident-ify a number of routes for Straight-Line Airlines and identify some ports of call on each.
• Students should then map out these routes on a flat map of the earth.
Students might choose a great circle route through. Brisbane, Ho Chi Minh City, Georgia (Russia), Lisbon, Georgetown (Guyana), Lima (Peru) and Auckland. The corresponding route on a flat map will demonstrate the quite different meanings of the term straight-line in spherical and plane geometries.
208
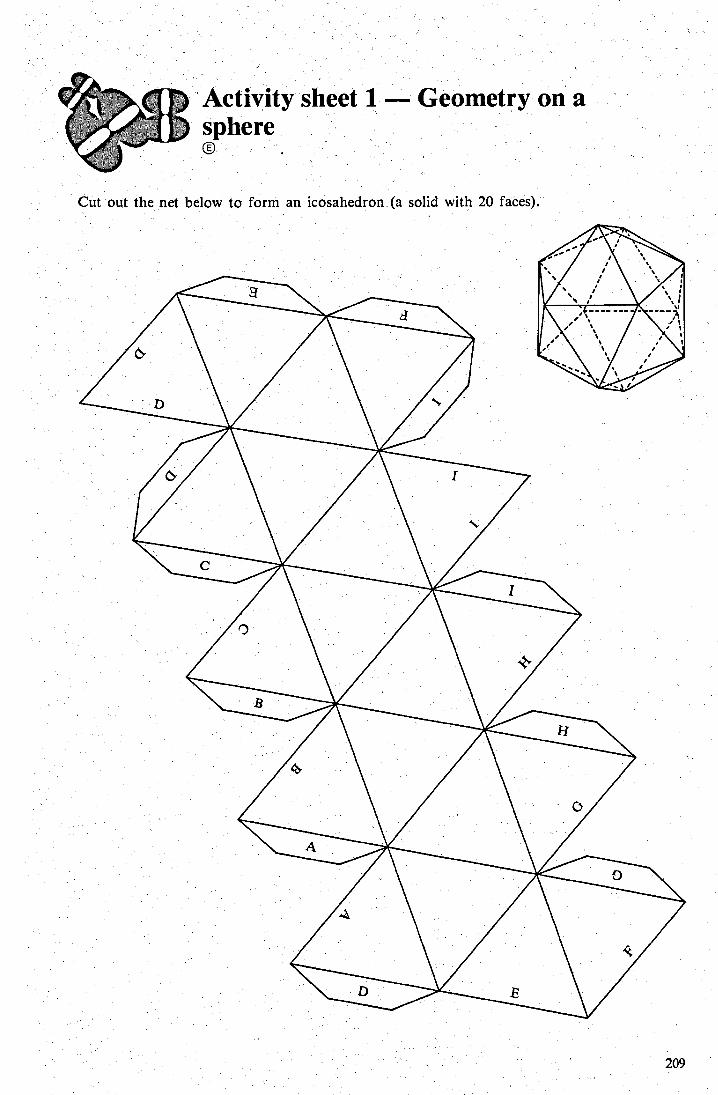
Cut out the net below to form an icosahedron (a solid with 20. faces).
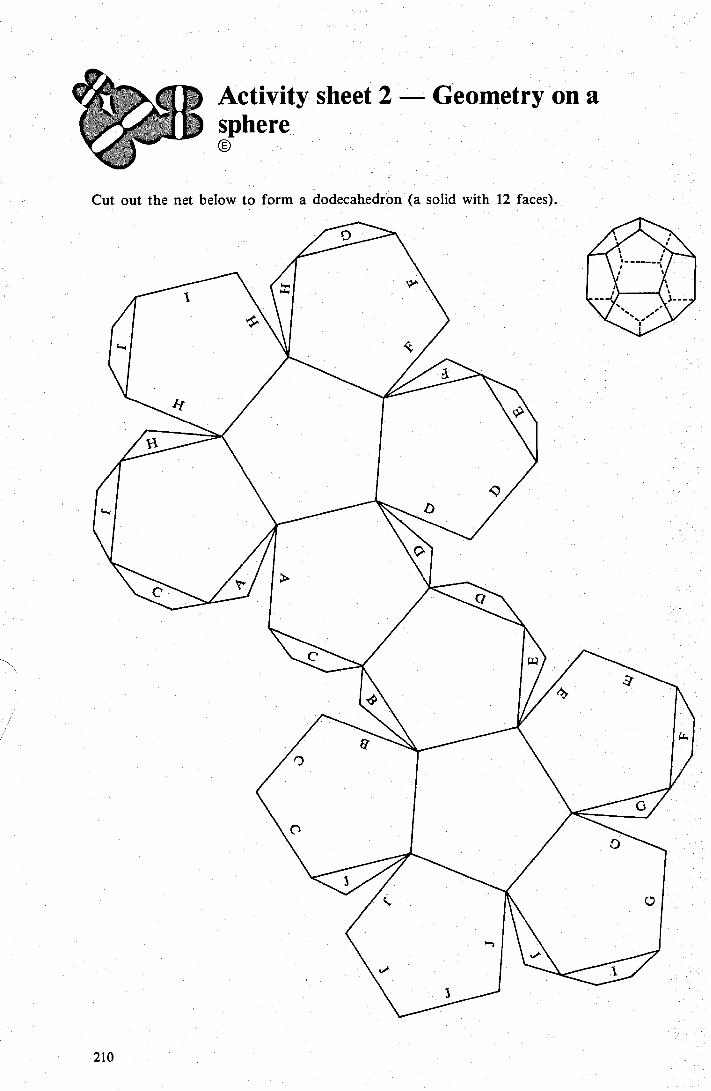
Activity sheet 2 sphere
Geometry on a
Cut out the net below to form a dodecahedron (a solid with 12 faces
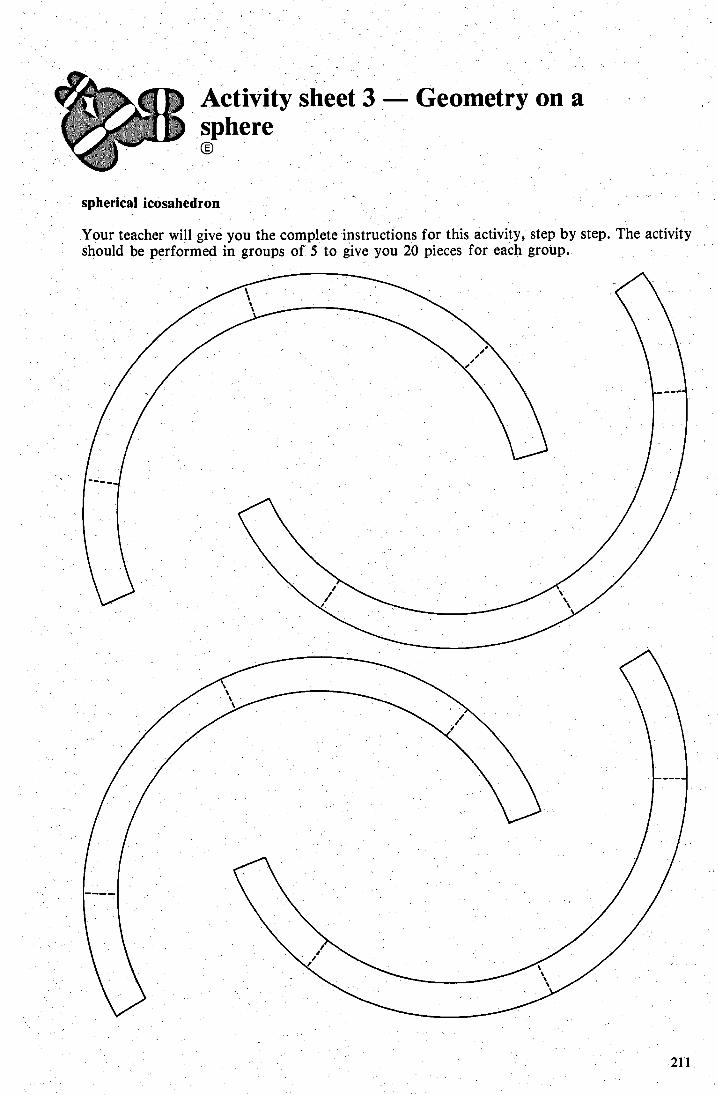
Activity sheet 3 sphere О
Geometry on a
spherical icosahedron
Your teacher will give you the complete instructions for this activity, step by step. The activity should be performed in groups of 5 to give you 20 pieces for each group.
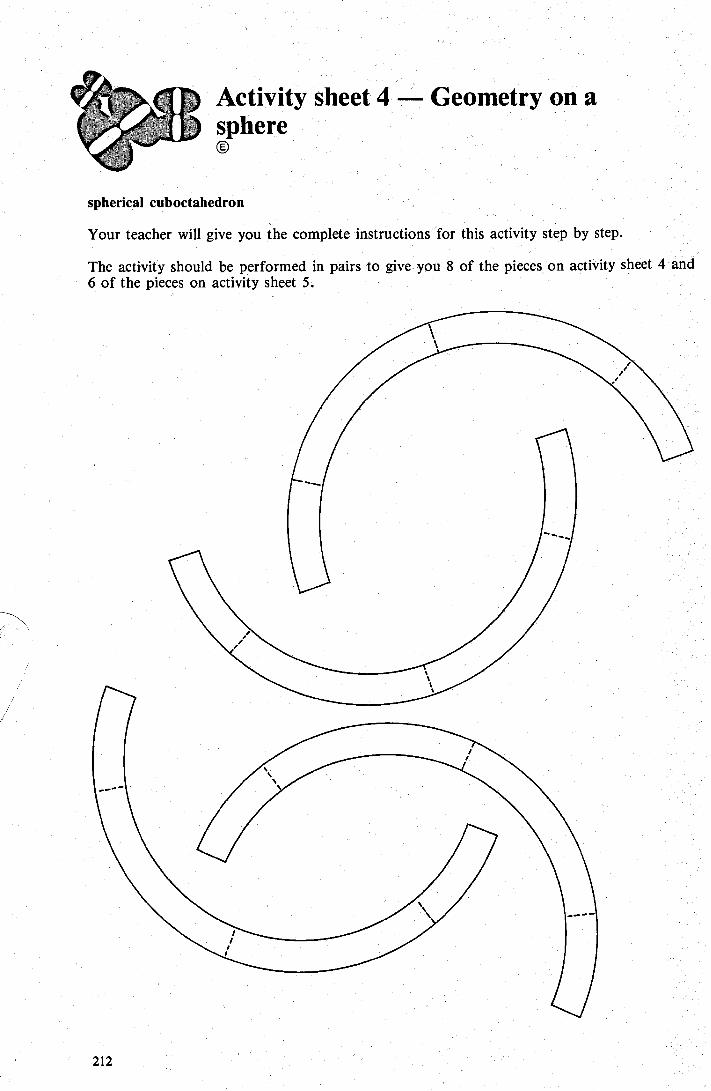
Activity sheet 4 Geometry on а sphere ®
spherical cuboctahedron
Your teacher will give you the complete instructions for this activity step by step.
The activity should be performed in pairs to give you 8 of the pieces on activity sheet 4 and б of the pieces on activity sheet 5.
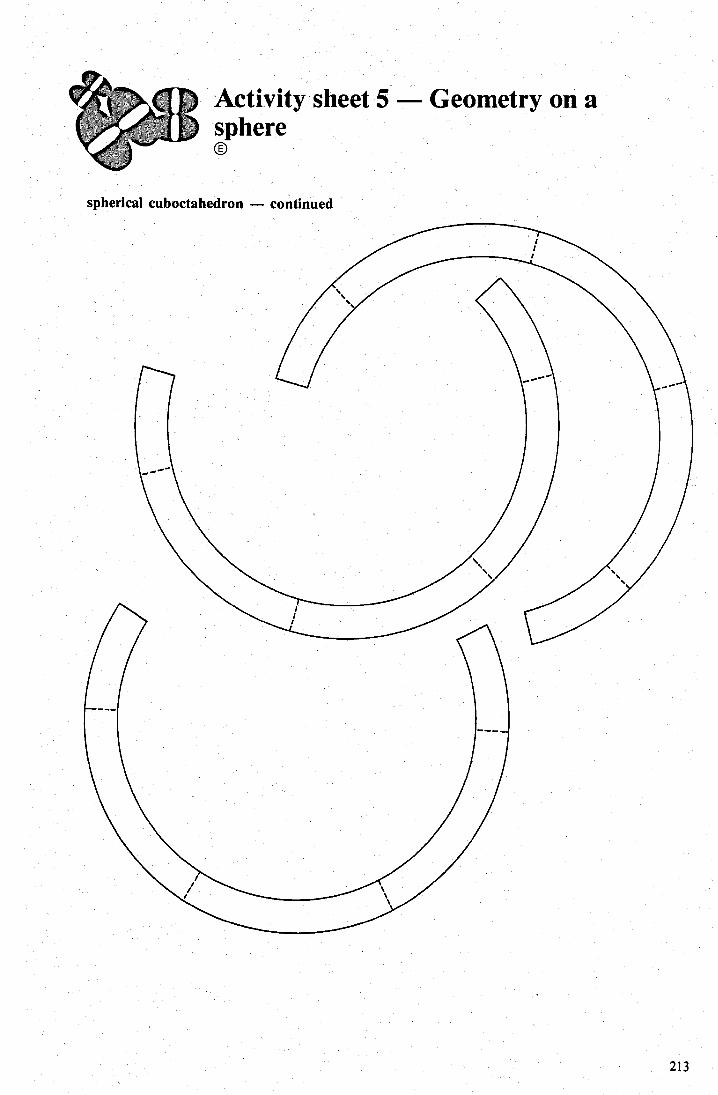
Activity sheet 5 sphere
Geometry on a
spherical cuboctahedron - continued
213
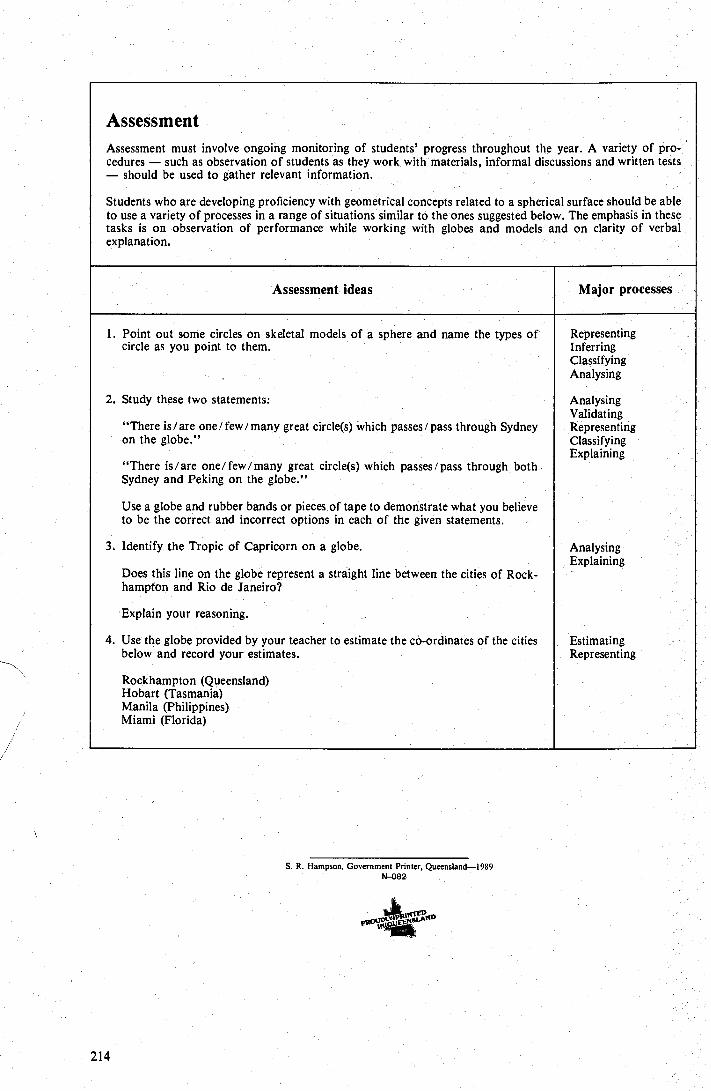
Assessment Assessment must involve ongoing monitoring of students' progress throughout the year. A variety of pro-cedures — such as observation of students as they work with materials informal discussions and written tests — should be used to gather relevant information.
Students who are developing proficiency with geometrical concepts related to a spherical surface should be able to use a variety of processes in a range of situations similar to the ones suggested below. The emphasis in these tasks is on observation of performance while working with globes and models and on clarity of verbal explanation.
Assessment ideas
Major processes
1. Point out some circles on skeletal models of a sphere and name the types of
Representing circle as you point to them. Inferring
Classifying Analysing
2. Study these two statements: Analysing Validating
"There is / are one / few / many great circle(s) which passes / pass through Sydney
Representing on the globe."
Classifying Explaining
"There is/are one/few/many great circle(s) which passes/pass through both. Sydney and Peking on the globe."
Use a globe and rubber bands or pieces of tape ta demonstrate what you believe to be the correct and incorrect options in each of the given statements.
3. Identify the Tropic of Capricorn on a globe.
Analysing Explaining
Does this line on the globe represent a straight line between the cities of Rock-hampton and Rio de Janeiro?
Explain your reasoning.
4. Use the globe provided by your teacher to estimate the co-ordinates of the cities Estimating below and record your estimates. Representing
Rockhampton (Queensland) Hobart (Tasmania) Manila (Philippines). Miami (Florida)
S. R. Hampsan, Government Printer, Queensland-1989 N-082
Ø ń tÉÉh ;°но
214

Library Digitised Collections
Author/s:
Queensland. Department of Education
Title:
Years 1 to 10 Mathematics Sourcebook. Year 8
Date:
1989
Persistent Link:
http://hdl.handle.net/11343/115444