Embed Size (px)
Citation preview


Construction Mathematics
Construction Mathematics is an introductory level mathematics text, written specifi cally for students of construction and related disciplines.
• Learn by tackling exercises based on real-life construction maths. Examples include: costing calculations, labour costs, cost of materials and setting out of building components.
• Suitable for beginners and easy to follow throughout.
• Learn the essential basic theory along with the practical necessities.
The second edition of this popular textbook is fully updated to match new curricula, and expanded to include even more learning exercises. End of chapter exercises cover a range of theoretical as well as practical problems commonly found in construction practice, and three detailed assignments based on practical tasks give students the opportunity to apply all the knowledge they have gained.
Construction Mathematics addresses all the mathematical requirements of Level 2 construction NVQs from City & Guilds/CITB and Edexcel courses, including the BTEC First Diploma in Construction. Additional coverage of the core unit Construction Mathematics from BTEC National Construction, Civil Engineering and Building Services courses makes this an essential revision aid for students who do not have Level 2 mathematics experience before commencing their BTEC National studies. This is also the ideal primer for any reader who wishes to refresh their mathematics knowledge before going into a construction HNC or BSc.
Surinder Virdi is a lecturer in construction at South and City College Birmingham. He worked as a structural engineer for a number of years before starting his teaching career in further education. He has been teaching mathematics, construction science and construction technology on BTEC National and Higher National courses for the last 25 years.
Roy Baker spent forty years teaching mathematics, construction science and structural mechanics at the City of Wolverhampton College before retiring in 2005. He now works as a visiting lecturer.
Narinder Kaur Virdi is a programme manager at the South and City College Birmingham and responsible for managing the provision of basic skills. She worked as a biochemist for a number of years before becoming a trained teacher. She has been teaching literacy and numeracy for the last 15 years.

This is an excellent resource for construction students with step by step instructions helping them to understand and enjoy mathematics. Each chapter has an instruction and methodology section with solutions and testing at the end, enabling individual tracking and progression. This book will help my students improve their numeracy skills to achieve their diploma qualifi cation.
Michael Cook, Lecturer, The Sheffi eld College
Construction Mathematics has proved to be an ideal text for Construction and Civil Engineering students at National Certifi cate level, whilst providing Undergraduates with a well laid out revision text. The logical progression of ideas and the simple and clear examples prove valuable to students as they pass onto a higher level of study.
Derek Spalton, Senior Lecturer, University of Derby

Construction MathematicsSecond Edition
Surinder Virdi, Roy Baker and Narinder Kaur Virdi

First edition published 2007by Butterworth Heinemann, an imprint of Elsevier
This edition published 2014by Routledge2 Park Square, Milton Park, Abingdon, Oxon OX14 4RN
and by Routledge711 Third Avenue, New York, NY 10017
Routledge is an imprint of the Taylor & Francis Group, an informa business
© 2014 Surinder Virdi, Roy Baker and Narinder Kaur Virdi
The right of Surinder Virdi, Roy Baker and Narinder Kaur Virdi to be identifi ed as authors of this work has been asserted by them in accordance with sections 77 and 78 of the Copyright, Designs and Patents Act 1988.
All rights reserved. No part of this book may be reprinted or reproduced or utilised in any form or by any electronic, mechanical, or other means, now known or hereafter invented, including photocopying and recording, or in any information storage or retrieval system, without permission in writing from the publishers.
Trademark notice: Product or corporate names may be trademarks or registered trademarks, and are used only for identifi cation and explanation without intent to infringe.
British Library Cataloguing in Publication DataA catalogue record for this book is available from the British Library
Library of Congress Cataloging-in-Publication DataVirdi, Surinder Singh. Construction mathematics.—Second edition / Surinder Virdi, Roy Baker, and Narinder Kaur Virdi. pages cm Includes bibliographical references and index. 1. Building—Mathematics. I. Baker, Roy T. II. Virdi, Narinder Kaur. III. Title. TH437.V57 2014 510.24'624—dc23
2012046094
ISBN13: 978-0-415-81078-4 (pbk)ISBN13: 978-0-203-42780-4 (ebk)
Typeset in Helveticaby Keystroke, Station Road, Codsall, Wolverhampton

Contents
Preface to the second edition xiPreface to the fi rst edition xiiiHow to use this book xvAcknowledgements xviiAbbreviations and units xix
1 Using a scientifi c calculator 11.1 Introduction 11.2 Keys of a scientifi c calculator 1
2 Numbers 92.1 Introduction 92.2 History of numbers 92.3 Positive numbers, negative numbers and integers 102.4 Prime and composite numbers 112.5 Square numbers 112.6 Addition and subtraction 112.7 Decimal numbers 13
2.7.1 Place value 142.7.2 Adding, subtracting and multiplying decimals 142.7.3 Multiplication and division by the powers of 10 15
2.8 Order of operations 172.8.1 Brackets 17
3 Basic algebra 213.1 Introduction 213.2 Addition and subtraction 213.3 Multiplication and division 223.4 Brackets 233.5 Simple equations 243.6 Application of linear equations 26
4 Indices and logarithms 314.1 Indices 314.2 Laws of indices 31
4.2.1 Multiplication 324.2.2 Division 324.2.3 Power of a power 334.2.4 Negative powers 344.2.5 Zero index 34
4.3 Logarithms 35

vi Contents
5 Standard form, signifi cant fi gures and estimation 375.1 Standard form 375.2 Signifi cant fi gures 385.3 Estimation 40
6 Transposition and evaluation of formulae 436.1 Transposition of formulae 43
6.1.1 Type 1 formulae 436.1.2 Type 2 formulae 446.1.3 Type 3 formulae 44
6.2 Evaluation of formulae 466.3 Evaluation of formulae: practical examples 48
7 Fractions and percentages 557.1 Fractions 55
7.1.1 Simplifi cation of fractions 577.1.2 Equivalent fractions 597.1.3 Addition and subtraction of fractions 597.1.4 Multiplication and division of fractions 607.1.5 Conversion of fractions to decimals. 61
7.2 Percentages 617.2.1 Conversion of fractions and decimals into percentages 617.2.2 Value added tax (VAT) 62
7.3 Bulking of sand 63
8 Graphs 698.1 Introduction 698.2 Cartesian axes and coordinates 698.3 Straight-line graphs 738.4 The law of the straight line 75
8.4.1 The gradient (m) 768.4.2 The intercept (c) 77
8.5 Simultaneous equations 798.6 Quadratic equations 80
9 Units and their conversion 859.1 Introduction 859.2 Length 86
9.2.1 Conversion factors 869.2.2 Use of the graphical method 88
9.3 Mass 899.3.1 Conversion factors 899.3.2 Graphical method 90
9.4 Area, volume and capacity 929.5 Temperature 94
10 Geometry 9710.1 Angles 97
10.1.1 Types of angle 99

viiContents
10.2 Polygons 10010.3 Triangles 101
10.3.1 Types of triangle 101 10.3.2 Theorem of Pythagoras 102 10.3.3 Similar triangles 104
10.4 Quadrilaterals 10710.5 Sum of the angles in a polygon 11010.6 The circle 111
11 Areas (1) 11511.1 Introduction 11511.2 Area of triangles 11611.3 Area of quadrilaterals 11711.4 Area of circles 11811.5 Application of area to practical problems 120
11.5.1 Cavity walls 123
12 Volumes (1) 12912.1 Introduction 12912.2 Volume of prisms, cylinders, pyramids and cones 13012.3 Mass, volume and density 13612.4 Concrete mix and its constituents 137
13 Trigonometry (1) 14513.1 Introduction 14513.2 The trigonometrical ratios 14513.3 Trigonometric ratios for 30°°, 45°, 60° 14713.4 Angles of elevation and depression 15113.5 Stairs 15213.6 Roofs 15613.7 Excavations and embankments 161
14 Setting out 16714.1 Introduction 16714.2 Setting out a simple building site 16714.3 Bay windows and curved brickwork 16914.4 Checking a building for square corners 17214.5 Circular arches 17414.6 Elliptical arches 178
15 Costing: materials and labour 18315.1 Introduction 18315.2 Foundations 18315.3 Cavity walls 18515.4 Flooring 18815.5 Painting 189
16 Statistics 19516.1 Introduction 19516.2 Tally charts 195

viii Contents
16.3 Tables 19616.4 Types of data 196
16.4.1 Discrete data 196 16.4.2 Continuous data 197 16.4.3 Raw data 197 16.4.4 Grouped data 197
16.5 Averages 198 16.5.1 The mean 199 16.5.2 The mode 199 16.5.3 The median 199 16.5.4 Comparison of mean, mode and median 199
16.6 The range 20016.7 Statistical diagrams 201
16.7.1 Pictograms 202 16.7.2 Bar charts 202 16.7.3 Pie charts 202 16.7.4 Line graphs 202
16.8 Frequency distributions 206 16.8.1 Histograms 206 16.8.2 Frequency polygons 206 16.8.3 Cumulative frequency distribution 208
17 Areas and volumes (2) 21517.1 Introduction 21517.2 Surface area of a pyramid 215
17.2.1 Frustum of a pyramid 21617.3 Surface area of a cone 218
17.3.1 Frustum of a cone 219
18 Areas and volumes (3) 22318.1 Introduction 22318.2 Mid-ordinate rule 22318.3 Trapezoidal rule 22418.4 Simpson’s rule 22518.5 Volume of irregular solids 22718.6 Prismoidal rule 228
19 Trigonometry (2) 23519.1 The sine rule and the cosine rule 235
19.1.1 The sine rule 235 19.1.2 The cosine rule 240
19.2 Area of triangles 243
20 Computer techniques 24920.1 Introduction 24920.2 Microsoft Excel 2000 249

ixContents
21 Assignments 26321.1 Assignment 1 26321.2 Assignment 2 26621.3 Assignment 3 270
Appendix 1: Concrete mix 273Appendix 2: Solutions 275Index 313

This page intentionally left blank

Preface to thesecond edition
This book is intended to provide the essential mathematics required by students on construction technician/craft courses. It covers the learning outcomes of the mathematics part of the unit ‘Construction Science and Mathematics’ for BTEC Level 2 Diploma course in construction. The book is also intended to help students studying the subject of Mathematics in Construction and Built Environment in the BTEC National/Extended Diploma in construction/civil engineering/building services and Higher National Certifi cate/Diploma courses in construction, although these syllabuses are not covered in their entirety.
Little previous knowledge is needed by students who use this text. The basic concepts and examples are explained in such a way that those construction students whose fi rst interest is not mathematics will fi nd it easy to follow. The contents have been divided into 20 chapters, providing information on a range of topics in algebra, geometry, trigonometry and statistics. Wherever applicable the basic concepts have been used to solve practical tasks in construction. Three assignments and 20 exercises are included to check and reinforce readers’ learning.
This edition includes the solution of all questions included in the end of chapter exercises. The solutions will be benefi cial to learners who may need some help in arriving at the right answers while solving questions from the exercises.
The authors would like to thank their students and colleagues for the interest they have shown in this project. A big thank-you to: Brian Guerin (Commissioning Editor, Routledge), Alice Aldous (Editorial Assistant) and Alanna Donaldson (Production Editor) for their support during the publication of this edition.
S.S. VirdiR.T. BakerN.K. Virdi

This page intentionally left blank

Preface to the fi rst edition
This book is intended to provide the essential mathematics required by construction craft students. It covers the learning outcomes of the mathematics part of the unit Construction Science and Mathematics for BTEC First Diploma course in construction. The book is also intended to help construction students studying the subject of analytical methods in the BTEC National Diploma/Certifi cate in Construction and BTEC National Certifi cate in Civil Engineering, although these syllabuses are not covered in their entirety.
Little previous knowledge is needed by students who use this text. The basic concept and examples are explained in such a way that those construction students whose fi rst interest is not mathematics will fi nd it easy to follow. There are 20 exercises and two assignments for the students to check and reinforce their learning.
The authors would like to thank their wives, Narinder and Anne, for the encouragement and patience during the preparation of this book. The authors extend their thanks to the publishers and their editors, Rachel Hudson (Commissioning Editor) and Doris Funke, for their advice and guidance.
S.S. VirdiR.T. Baker

This page intentionally left blank

How to use this book
Students pursuing level 3/4 courses should study all chapters in this book. Students pursuing level 2 courses should study all chapters except Chapters 4, 17, 18 and 19. The solutions for all questions included in the end of chapter exercises are given in Appendix 2. The reader should fi rst try to solve the questions on their own, and only refer to the solutions if they experience some diffi culty in fi nding the right answer.
Chapter 21 has three contextualised assignments, which the reader should attempt after studying topics relevant to the assignment tasks. The solutions are given online at www.routledge.com/9780415810784.

This page intentionally left blank

Acknowledgements
We are grateful to HMSO for permission to quote regulations on stairs from Building Regulations – Approved Document K.

This page intentionally left blank

Abbreviations and units
Units
Quantity Name of unit Symbol
Length millimetrecentimetremetre
mmcmm
Mass kilogram kgTime second sFahrenheit temperature degrees Fahrenheit °°FPlane angle radian
degreesrad°
Force Newton NStress stress N/mm2
kN/mm2
Fluid pressure Pascal PaAcceleration due to gravity g m/s2
Potential difference volts VElectrical resistance Ohms �Celsius temperature degrees Celsius °CCoeffi cient of thermal transmittance
U-value W/m2 °C
Heat loss watt WLuminous intensity candela cdIlluminance lux lx

xx Abbreviations and units
Prefi xes
Name Symbol Factor
Tera T 1012
Giga G 109
Mega M 106
Kilo k 103
Hecto h 102
Deca da 10Deci d 10–1
Centi c 10–2
Milli m 10–3
Micro μ 10–6
Nano n 10–9
Pico p 10–12
Abbreviations/symbols
Description Symbol
Approximately Approx.For example e.g.Triangle �
Less than <
Greater than >
Degrees, minutes, seconds °° ’”Angle �
Signifi cant fi gures s.f.Therefore �
Decimal places d.p.

C H A P T E R 1Using a scientifi c
calculator
Learning outcomes:
(a) Identify the right keys to perform a calculation
(b) Perform a range of calculations
1.1 Introduction
The use of electronic calculators became popular during the early 1970s. Before the invention of calculators, slide-rules and tables of logarithms and antilogarithms were used to perform simple as well as complex calculations. The exercises and assignments in this book require the use of a scientifi c calculator; this chapter deals with the familiarisation of some of the main keys of a calculator.
With most calculators the procedure for performing general calculations is similar. However, with complex calculations this may not be the case. In that situation the reader should consult the instructions manual that came with their calculator. The dissimilarity in calculators is not just limited to the procedure for calculations, as the layout of the keys could be different as well.
The sequence in which the keys of a new calculator are pressed is the same as the sequence in which a calculation is written. With the old calculators this might not be the case. All calculations given in this section are based on the new calculators. Scientifi c calculators have a range of special function keys and it is important to choose one that has all the functions most likely to be needed. Some of the commonly used keys are shown in Section 1.2.
1.2 Keys of a scientifi c calculator
The keys of a typical scientifi c calculator are shown in Figure 1.1.

2 1 Using a scientific calculator
+ Adds two or more numbers
– Subtracts a number from another
÷ Divides a number by another
× Used to multiply two or more numbers
AC Cancels or clears an existing calculation
SHIFT Press this key to use the second function of a key
MODE Use this key to set the calculator for performing calculations in terms of degrees or radians
� Calculates the square root of a number3� Calculates the cube root of a number
x2 Use this key to determine the square of a number
x3 Use this key to determine the cube of a number
^ or x A number can be raised to any power by pressing this key
� Use this key wherever � occurs in a formula
sin cos tan Use the appropriate key to determine the sine/cosine/tangent of an angle
0.03 × 0.04
SHIFT
1.2–03
ONMODE % π
sin OFFcos tan x3
a bc log
sin–1 cos–1 tan–1 3
10x
x2
+/– M+º ’ ” ( )
7 AC8 9 DEL
4 ×5 6 ÷
1 +2 3 –
0 =· EXP Ans
Figure 1.1

3Using a scientific calculator 1sin–1 cos–1 tan–1 If the sin/cos/tan of an angle is given, use the
appropriate key to determine the anglelog Use this key if the calculation involves logarithm to
the base 10
10x This key is used to calculate antilogarithms, i.e. the reverse of log
EXP Use this key to raise 10 to the power of a given number
a Use this key to perform calculations involving
fractions
M+ This key is used to input values into memory% Press this key to express the answer as a
percentage°’” This key is used to convert an angle into degrees,
minutes and seconds( ) These keys will insert brackets in the calculations
involving complicated formulae.
DEL Press this key to delete the number at the current cursor position
Example 1.1Calculate 37.80 – 40.12 + 31.55
Solution:
The sequence of pressing the calculator’s keys is:
3 7 . 8 0 – 4 0 . 1 2 +
3 1 . 5 5 = 29.23
Example 1.2
Calculate
Solution:
The sequence of inputting the information into your calculator is:
3 4 . 9 × 5 7 . 3 ÷ 4 1 . 6
6 = 48.0
Example 1.3
Calculate
b c
34.9 x 57.3 41.66
87.3 x 67.81 23.97 x 40.5

4 1 Using a scientific calculator
Solution:
This question can be solved in two ways. The calculator operations are:
(1) 87.3 × 67.81 ÷ 23.97 ÷ 40.5
8 7 . 3 × 6 7 . 8 1 ÷ 2 3 .
9 7 ÷ 4 0 . 5 = 6.098
(2) 87.3 × 67.81 ÷ (23.97 × 40.5). In this method it is important to put 23.97 × 40.5 within brackets. Failure to do so will result in the wrong answer.
8 7 . 3 × 6 7 . 8 1 ÷ ( 2 3
. 9 7 × 4 0 . 5 ) = 6.098
Example 1.4Calculate �4.5 × �5.5 + �3.4
Solution:
The calculator operation is shown below:
� 4 . 5 × � 5 . 5 + � 3 . 4
= 6.819
Example 1.5Calculate the value of �r2 if r = 2.25
Solution:
The calculator operation is:
� × 2 . 2 5 x2 = 15.904
Example 1.6Find the value of (2.2 × 4.8) + (5.2 × 3)
Solution:
The sequence of calculator operation is:
( 2 . 2 × 4 . 8 ) + ( 5 . 2
× 3 ) = 26.16
Example 1.7
Evaluate S'x4' 2'

5Using a scientific calculator 1Solution:
In this question the ^ key will be used to raise a number to any power.
Press the following keys in the same sequence as shown:
6 ^ 3 × 4 ^ 4 ÷ 2 ^ 5 = 1728
Example 1.8
Calculate 10 log10
Solution:
The EXP key will be used to raise 10 to any power, as shown:
1 0 LOG ( 4 EXP +/– 7 ÷ 2 EXP +/–
1 2 ) = 53.01
Example 1.9
Calculate
Solution:
The calculator must show D in the display area. If the calculator displays R or G then use the MODE key or the SETUP key to change the angle unit to degrees, and press the following keys:
sin 6 0 ÷ cos 6 0 = 1.732
Example 1.10Find the angle if: (a) the sine of an angle is 0.6
(b) the cosine of an angle is 0.45 (c) the tangent of an angle is 0.36
Solution:
Use the MODE key or the SETUP key to change the angle unit to degrees. As this question involves the determination of angles, the process is the reverse of that used in Example 1.9. Instead of sin, cos or tan keys, use sin–1, cos–1 and tan–1.
(a) Use the following sequence to determine the angle as a decimal number fi rst, and then change to the sexagesimal system (i.e. degrees, minutes and seconds)
SHIFT sin 0 . 6 = 36.8699°° °’” 36°5211.6
(b) SHIFT cos 0 . 4 5 = 63.2563°° °’” 63°1522.7
(c) SHIFT tan 0 . 3 6 = 19.7989°° °’” 19°4756
sin 60" c0960·
4X10-' 2x10"

6 1 Using a scientific calculator
Exercise 1.1
The solutions to Exercise 1.1 can be found in Appendix 2.
1. Calculate 37.85 – 40.62 + 31.85 – 9.67.
2. Calculate .
3. Calculate .
4. Calculate �4.9 × �8.5 + �7.4.
5. Calculate the value of �r2 if r = 12.25.
6. Find the value of: (a) (2.2 × 9.8) + (5.2 × 6.3)
(b) (4.66 × 12.8) – (7.5 × 5.95)
(c) (4.6 × 10.8) ÷ (7.3 × 5.5).
7. Evaluate: (a) .
(b) .
8. Calculate 10 log10 .
9. Calculate: (a)
(b) .
10. Find the angle if: (a) the sine of an angle is 0.85
(b) the cosine of an angle is 0.75
(c) the tangent of an angle is 0.66.
11. Calculate the values of: (a) sin 62°4235
(b) cos 32°2235
(c) tan 85°1020.
Answers to Exercise 1.1
1. 19.41
2. 41.8
3. 8.83
4. 9.17
5. 471.44
33.9 x 56.3 45.66
67.3 x 69.81 25.97 x 20.5
53 X 3'
2'
43 X 63
54
(::~~~, sin 7[1'
cos 6[1'
tan 45" cos 35"

7Using a scientific calculator 1 6. (a) 54.32 (b) 15.02 (c) 1.24
7. (a) 316.41 (b) 22.12
8. 36.53
9. (a) 1.879 (b) 1.221
10. (a) 58°°1242 (b) 41°2434.64 (c) 33°2529.32
11. (a) 0.8887 (b) 0.8445 (c) 11.8398

This page intentionally left blank

C H A P T E R 2Numbers
Learning outcomes:
(a) Identify positive numbers, negative numbers, integers and decimal numbers
(b) Perform calculations involving addition, subtraction, multiplication and division
(c) Use order of operations (BODMAS) to perform calculations
2.1 Introduction
Mathematics involves the use of numbers in all of its branches like algebra, geometry, statistics, mechanics and calculus. The use of numbers also extends to other subjects like estimating, surveying, construction science and structural mechanics. As we shall be dealing with numbers in all sections of this book, it is appropriate to deal with the different types of numbers at this stage.
2.2 History of numbers
In early civilisations different types of counting systems were used in business and other fi elds. It all started with the use of lines, which later developed into alphabets (Rome, Greece), symbols (Babylon), hieroglyphics (Egypt), pictorials (China) and lines and symbols (India). The Roman numerals (I, V, X, L, C, D and M), although widely used in commerce and architecture had two major fl aws. First, there was no zero; and second, for large numbers different types of systems were used.
Indian-Arab numerals, the forebears of modern numbers, were used in India more than 2500 years ago. Originally there were nine symbols to represent 1–9 and special symbols were used for tens, hundreds and thousands. It appears that the Indians later introduced zero in the form of a dot (to represent nothing), which they either borrowed from other systems or invented themselves. The credit for

10 2 Numbers
disseminating to the European countries goes to the Arabs, who started to expand their trade about 1500 years ago and had links with several countries. After some resistance, the use of Indian-Arab numerals became widespread during the sixteenth century and the Roman numerals were restricted to special use.
The main reasons for the universal adoption of the Indian-Arab numerals were that it was a place-value system and that it was also very easy to use. For example, if you were to write, say, 786 and 1998 in Roman numerals, just imagine the time taken to do so. In Roman numerals 786 is written as DCCLXXXVI. Similarly, 1998 is written as MCMXCVIII.
2.3 Positive numbers, negative numbers and integers
Numbers with either a plus (+) sign or no sign on their left are called positive numbers. For example:
2, +3, 5, 11, 5000
The greater a positive number, the greater is its value. Negative numbers have a minus (–) sign on their left. For example:
–3, –2, –21, –250.
The greater a negative number, the smaller its value. For instance, the value of –15 is less than –10. This can be explained by considering a thermometer, as shown in Figure 2.1.
Temperaturesbelow zero degreeare negative
(a)
30ºC
20
10
0
–10
–20
–30
(b)
30ºC
20
10
0
–10–15–20
–30
Figure 2.1
If the object is at –10°C, and its temperature is reduced by 5°C, the new temperature will be:
–10 – 5 = –15°C

11Numbers 2What we see from Figure 2.1 can be generalised to say that the value of positive numbers is greater than zero, whereas the value of negative numbers is less than zero.
An integer is a whole number, positive or negative. For example, the following are integers:
10, –30, 0, 24, –270
2.4 Prime and composite numbers
Any positive integer having no factors other than itself and unity is called a prime number. Also, prime numbers are greater than 1. Some of the prime numbers are: 2, 3, 5, 7, 11, 13, 17, 19, 23, 29, 31, 37. For example, the factors of 7 are 7 and 1, as 7 × 1 = 7; similarly, the factors of 11 are 11 and 1, as 11 × 1 = 11.
Prime numbers can be divided only by their factors. For example:
and
A composite number can have other factors in addition to itself and 1. For example, 12, which is not a prime number, has the following factors:
2 × 6 = 12
2 × 2 × 3 = 12
3 × 4 = 12
1 × 12 = 12
2.5 Square numbers
A number that can be obtained by squaring another number is called a square number; 1, 4, 9, 16, 25, 36, 49, 64, 81, 100 are some of the square numbers as they can be obtained by squaring 1, 2, 3, 4, 5, 6, 7, 8, 9 and 10, respectively.
2.6 Addition and subtraction
Addition involves combining two or more numbers to give the sum total. The plus sign (+) is used to denote addition. Subtraction involves taking a number away from another number. The minus or negative sign (–) is used to denote subtraction. The following rules apply to addition/subtraction:
(1) x + y = x + y for example: 11 + 5 = 16
(2) x – y = x – y 11 – 5 = 6
(3) x + (–y) = x – y 11 + (–5) = 11 – 5 = 6
(4) x – (–y) = x + y 11 – (–5) = 11 + 5 = 16
(5) –x – y = –(x + y) –11 – 5 = – (11 + 5) = –16
==
===
=

12 2 Numbers
Example 2.1A bricklayer bought the following items at a local DIY store:
• Concrete bricks: £120.00
• Cement: £11.70
• Sand: £10.50
If the cost of delivering the materials was £12.00, fi nd:
(a) The total amount of the bill
(b) The change he received if he gave £160 to the cashier.
Solution:
(a) Total amount of the bill = £120.00 + £11.70 + £10.50 + £12.00 = £154.20
(b) Change = £160.00 – £154.20 = £5.80
Example 2.2The air temperature today at 9 p.m. was –1°C and is expected to be 6 degrees lower at 6 a.m. tomorrow. It is also expected that at 11 a.m. tomorrow the temperature will be 5 degrees higher than that expected at 6 a.m. Find the temperatures expected tomorrow at 6 a.m. and 11 a.m.
Solution:
The fall in temperature involves subtraction and the rise in temperature involves addition.
Temperature at 6 a.m. tomorrow = –1 – 6 = –7°C
Temperature at 11 a.m. tomorrow = –7 + 5 = –2°C
Example 2.3Calculate the length of skirting board required for the room shown in Figure 2.2.
(All dimensionsin metres)
2.7
m
2.06
0.86
4.1 m3.2 m
Figure 2.2

13Numbers 2Solution:
Length of skirting board = Total length of the walls – door width
= 4.1 + 3.2 + 4.1 + 3.2 – 0.86
= 14.6 – 0.86 = 13.74 m
2.7 Decimal numbers
Decimals may be used when a number:
• is not divisible by another number, e.g. 106 ÷ 4 = 26.5
• is less than 1 (or the numerator is less than the denominator). For example:
(1)
(2)
(3)
The number of digits after the decimal depends on the value of the
denominator. In , the denominator has only one zero. Therefore, the
decimal should be put in the numerator after one digit, moving from right to left:
In there are two zeros in the denominator. In this case the decimal
is placed in the numerator after two digits. Since there is only one digit in the numerator, another digit needs to be added. This extra digit has to be a zero:
, the decimal put after two digits.
In , there are no zeros in the denominator, but by multiplying the
numerator and denominator by 4, we have , with
the decimal put after two digits.If a number is smaller than 1, for example .04 or .1, it is standard
practice to put a zero before the decimal, so .04 becomes 0.04 and .1 becomes 0.1.
1= 0.1 10
1 -=0.04 25
1 =0.01
100
1 -= ,1 10
1 100
1 -=.01
100
1 25
1 10
1 lx4 4-04 25 = 25:><:4 =100 - .

14 2 Numbers
2.7.1 Place value
In a number, each place has its own value. Some of the place values are:
thousands for example 1000
hundreds 100
tens 10
units 1
tenths or 0.1
hundredths or 0.01
thousandths or 0.001
The decimal point is introduced between units and tenths.Take a number, say 21.367. It is made up of 2 tens, 1 unit, 3 tenths,
6 hundredths and 7 thousandths, which give 21.367 when added:
2 × 10 1 × 1 3 × 0.1 6 × 0.01 7 × 0.001
= 20 = 1 = 0.3 = 0.06 = 0.007
20 + 1 + 0.3 + 0.06 + 0.007 = 21.367
A feature of decimals is that the addition of more zeros between a number and the decimal point reduces its value. Referring to the example, 0.06 is smaller than 0.3; similarly 0.007 is smaller than 0.06.
2.7.2 Adding, subtracting and multiplying decimals
The methods of carrying out the addition and subtraction of decimal numbers are similar to those used for whole numbers. However, because of the decimal, the numbers are written with their decimals aligned, as shown in Example 2.4.
Example 2.4(a) Add 25.12, 106.239 and 8340.0191
(b) Subtract 237.347 from 645.591
Solution:
(a) Write the numbers with their decimals aligned and move from right to left:
25.12
+ 106.239
+ 8340.0191
8471.3781
1 10
1 100
1 1000

15Numbers 2(b) Again, write the numbers with their decimals aligned, and proceed
from right to left:
645.591
–237.347
408.244
In multiplication the easiest way is to ignore the decimals and multiply as done with whole numbers. The decimal point is inserted afterwards, as shown in Example 2.5
Example 2.5Multiply 13.92 and 5.4
Solution:
Consider the given numbers to be whole numbers and multiply:
1392
× 54
5568 69600
75 168
Count the number of digits to the right of the decimal points in the numbers being multiplied:
In 13.92 there are two digits to the right of the decimal; in 5.4 there is only one digit to the right of the decimal. Therefore, the total number of digits to the right of the decimal in the two numbers is the sum of 2 and 1, i.e. 3.
Counting from right to left, put the decimal after three digits. Hence the answer is 75.168.
2.7.3 Multiplication and division by the powers of 10
When a number (say x) is divided by another number that is greater than 1, the value of the answer will be less than x. The opposite is true when a number is multiplied by a number greater than 1. The process becomes very simple when a number is multiplied or divided by the powers of 10. This is illustrated in Examples 2.6 and 2.7
Example 2.6Multiply (a) 451 by 100
(b) 28.67 by 10
(c) 28.67 by 100
(d) 28.67 by 1000

16 2 Numbers
Solution:
(a) An integer (whole number) becomes bigger in value when it is multiplied by a number greater than 1. When multiplying an integer by 10, 100, 1000, etc. simply add the appropriate number of zeros to the original number. The multiplier in this question (i.e. 100) has two zeros, therefore put two zeros after writing 451 to make the answer bigger:
451 × 100 = 45 100
(b) A decimal number also becomes bigger on multiplying with a number greater than 1. To do this, move the decimal point to the right by the same number of places as there are zeros in the multiplier. As there is only one zero in 10, move the decimal point by one place to a position between 6 and 7:
28.67 × 10 = 286.7
(c) As 100 has two zeros, move the decimal to the right by two places:
28.67 × 100 = 2867.
As there is nothing after the decimal, 2867. = 2867
(d) Following the procedure explained in (b) and (c) move the decimal point by three places. Add zero or zeros to fi ll the blank space.
28.67 × 1000 = 2867_. = 28 670. = 28 670
Example 2.7Divide (a) 451 by 100
(b) 28.67 by 100
(c) 28.67 by 1000
Solution:
Division will give an answer that is smaller in value than the original number. This will involve introduction/movement of the decimal point, moving from right to left. The number of places the decimal point has to be moved will be equal to the number of zeros in the divisor.
(a) The divisor (i.e. 100) has two zeros. Place the decimal after two digits, moving from right to left:
4.51
(b) The solution to this question will involve the movement of the decimal point by two places to the left:
= 0.2867
j
j
451 100=
j
j
j 28.67 100 ~.2a67
j
j
j
j
j
j
j
j
j
j
j
j
j
j
j

17Numbers 2(c) To solve this question, move the decimal point by three places to the
left. This will leave a blank space, which should be fi lled with a zero.
= .02867 = 0.02867
2.8 Order of operations
A calculation in arithmetic and algebra may involve one or more of: addition, subtraction, multiplication and division. If we are asked to evaluate 3 + 4 × 2, our answer could be 11 or 14:
3 + 4 × 2 = 3 + 8 = 11
3 + 4 × 2 = 7 × 2 = 14
For calculations of this nature an order of precedence of operation, or in other words the order in which the calculations are to be done, is used. This can be remembered using the acronym BODMAS, which stands for:
B brackets
O of (same as multiplication, e.g. ½ of 8 = ½ × 8 = 4)
D division
M multiplication
A addition
S subtraction
The correct evaluation of 3 + 4 × 2 is 11 as the multiplication is done before addition. Modern calculators will automatically carry out all calculations using the rules of precedence.
2.8.1 Brackets
Brackets are used in mathematical problems to indicate that the operation inside the brackets must be done before the other calculations. For example:
(4 – 2) × 10 = 2 × 10 = 20
There are many ways in which we can have brackets in mathematical calculations. Some of the rules that we need to follow are:
• If there is a number in front of a bracket, then multiply the contents of the brackets by that number.
• If there is no number before or after a bracket, then assume the number 1 and multiply the contents of the brackets by 1.
Example 2.8Solve: (a) 4 – 2 + 3(4 × 1.5) + 5
(b) 12 – (2 × 4 + 2)
2B.67 1000 = ._2867

18 2 Numbers
Solution:
(a) 4 – 2 + 3(4 × 1.5) + 5 = 4 – 2 + 3(6) + 5 = 4 – 2 + 18 + 5 = 25
(b) 12 – (2 × 4 + 2) = 12 – 1(8 + 2) = 12 – 1(10) = 12 – 10 = 2
Exercise 2.1
The solutions to Exercise 2.1 can be found in Appendix 2.
1. Add 34.21, 26.05 and 370.30 without using a calculator.
2. Subtract 20.78 from 34.11 without using a calculator.
3. Solve 309.1 – 206.99 – 57.78.
4. Multiply 40.0 and 0.25 without using a calculator.
5. Solve 25 × 125 ÷ 625.
6. Multiply: (a) 379 by 100
(b) 39.65 by 1000
(c) 39.65 by 10 000.
7. Divide: (a) 584 by 100
(b) 45.63 by 100
(c) 45.63 by 1000.
8. Solve: (a) 6 – 2 – 3(4 × 1.5 × 0.5) + 15
(b) 15 – (2 × 4 + 2) – (4 – 3).
9. The minimum temperature on Monday was –2°C and by 0600 hours on the next day the temperature had dropped by a further 5°C. Find the temperature at 0600 hours on Tuesday.
10. Bob Sands bought the following items at a DIY store (all prices include VAT): emulsion paint: £29.85; non-drip gloss paint: £19.98; paint brushes: £15.50.
(a) Find the total amount of the bill.
(b) If Bob gave the cashier four £20 notes, fi nd the amount of change he received.
11. Figure 2.3 shows Amanda’s dining room, where she wants to replace the old skirting board and the coving.
(All dimensionsin metres)
2.8
m
1.2
m
2.06
m
4.2 m3.8m
0.86
2.0 m
Figure 2.3

19Numbers 2 Find: (a) the cost of buying the skirting boards if they are available in
2.4 m lengths, and a pack of four costs £34.99
(b) the cost of buying the coving, if they are available in 3.0 m lengths, and cost £6.00 per length.
12. Find the cost of changing the wallpaper in the room shown in Figure 2.3 if each roll of the selected wallpaper costs £21.99. Include a lump sum of £25.00 for the wallpaper glue and other accessories. Each roll of wallpaper consists of a 52 cm wide and 10.0 m long sheet; assume the wastage of wallpaper is 15 per cent. The size of the window is 2.0 m × 1.2 m high, and the width of the skirting board as well as the coving is 100 mm.
Answers to Exercise 2.1
1. 430.56
2. 13.33
3. 44.33
4. 10.0
5. 5
6. (a) 37 900 (b) 39 650 (c) 396 500
7. (a) 5.84 (b) 0.4563 (c) 0.04563
8. (a) 10 (b) 4
9. –7°C
10. (a) £65.33 (b) £14.67
11. (a) £69.98 (b) £36.00
12. £222.91

This page intentionally left blank

C H A P T E R 3Basic algebra
Learning outcomes:
(a) Add and subtract algebraic expressions
(b) Multiply and divide algebraic expressions
(c) Solve linear equations
3.1 Introduction
In algebra numbers are used with letters, the latter denoting anything like age, area, volume, temperature, etc. Using algebraic notation we can form equations that can be used to solve many mathematical problems. The rules of adding, subtracting, multiplying and dividing algebraic expressions are identical to those used for numbers. In algebraic expressions, however, we must distinguish between the different expressions. For example, in x2 – 4x + 5, x2 and 4x are different expressions and cannot be subtracted as such.
3.2 Addition and subtraction
Only similar expressions can be added or subtracted as the addition and subtraction of dissimilar expressions will result in a wrong answer. In the expression 2a + 3b – a + b, symbols a and b may be assumed to represent aerated concrete blocks and bricks, respectively. As the two materials are different, the terms with ‘a’ (2a and –a) need to be processed separately from the terms with ‘b’ – i.e. 3b and b.
2a + 3b – a + b = 2a – a + 3b + b
= 2a – 1a + 3b + 1b (a = 1a; b = 1b)
= a + 4b (simplify 2a – 1a, separately from 3b + 1b)

22 3 Basic algebra
Example 3.1Simplify (a) 5a + 2b – 3b + 2a
(b) –5x –3y + 2x – 3y
Solution:
(a) Rearrange the terms of 5a + 2b – 3b + 2a:
5a + 2b – 3b + 2a = 5a + 2a – 3b + 2b
= 7a – b (5a + 2a = 7a; –3b + 2b = –1b or –b)
(b) Rearrange the terms of –5x –3y + 2x – 3y:
–5x –3y + 2x – 3y = 2x – 5x –3y – 3y
= –3x – 6y (2x – 5x = –3x; –3y –3y = –6y)
3.3 Multiplication and division
Multiplication of letters is done in the same manner as the multiplication of numbers. For example:
5 × 5 = 52
a × a = a2 (also see Chapter 4 on indices)
As in addition and subtraction, only the similar terms are multiplied. However, in addition and subtraction y2 and y3 are treated as different terms, but in multiplication and division they can be multiplied and/or divided as the base – in this case ‘y’ – is the same. Examples 3.2 and 3.3 explain the processes of multiplication and division involving simple algebraic expressions. For complex questions (for example: multiply 5a2 – 2a + 6 by 2a2 + 8a – 3) refer to a textbook on analytical methods.
Example 3.2Simplify 2xy2 × 5x2y3
Solution:
As the numbers, x terms and y terms are different from one another, they will be multiplied separately fi rst and then combined to give the answer.
2 × 5 = 10 (1)
x × x2 = x × x × x = x3 (2)
y2 × y3 = y × y × y × y × y = y5 (3)
Combining (1), (2) and (3):
2xy2 × 5x2y3 = 10 x3y5
Example 3.3Divide 25a3 b2c4 by 5a2 bc2

23Basic algebra 3Solution:
Mathematically the question can be written as: 25a3b2c4 ÷ 5a2 bc2, or
. The numbers and other terms will be simplifi ed individually
fi rst, but combined later to give the answer:
= 5 (1)
= = a (2)
= = b (3)
= = c × c = c2 (4)
Combining 1, 2, 3 and 4:
= 5abc2
Example 3.4Multiply 2x + 3 by x – 1
Solution:
Write the two expressions as shown:
2x + 3
× x – 1
Multiplication in algebra proceeds from left to right. 2x + 3 is multiplied by x fi rst and then by –1. After multiplication the terms are added or subtracted, if necessary:
2x + 3
× x – 1
2x2 + 3x – 2x – 32x2 + x – 3
3.4 Brackets
Brackets may be used in algebra to simplify expressions, taking the common factors out and leaving the rest within. In 2x + 6y, 2 is a common factor as 2 and 6 are both divisible by 2.
2Sa"b'c' Sa"bc'
25 5
a' aX/lxa /l' axa
b' bxb
b b
c' cxcxcxc c' cxc
2Sa'b'c' Sa"bc'

24 3 Basic algebra
Therefore, 2x + 6y can be written as 2(x + 3y). As there is no mathematical sign between 2 and the bracket, it means that both x and 3y will be multiplied by 2 when the brackets are removed:
2(x + 3y) = 2 × x + 2 × 3y = 2x + 6y
In an expression like 2 + (3x – 4y), there is no number or symbol just before the brackets. There is a + sign, which implies that nothing will change if the brackets are removed,
2 + (3x – 4y) = 2 + 3x – 4y
A minus sign in front of the brackets would mean changing the signs of the terms within the brackets, if simplifi cation is required,
2 – (3x – 4y) = 2 – 3x + 4y (3x becomes –3x and –4y becomes +4y)
Example 3.5Simplify: (a) 3(2x – 3y)
(b) 2(–4x +2y)
(c) 6 + (x + 2y + 3z)
(d) 6 – (x + 2y – 3z)
Solution:
(a) Simplify 3(2x – 3y) by removing the brackets. As explained earlier, the removal of brackets will involve the multiplication of 2x and –3y by 3:
3(2x – 3y) = 3 × 2x – 3 × 3y
= 6x – 9y
(b)
2(–4x + 2y) = 2 × –4x + 2 × 2y
= –8x + 4y
(c) In this question there is no symbol or number, but a plus sign in front of the brackets. The signs of the terms that are within the brackets will not change if the removal of brackets is undertaken:
6 + (x + 2y + 3z) = 6 + x + 2y + 3z
(d) In this question the signs of the terms within the brackets will change, as there is a minus sign before the brackets:
6 – (x + 2y – 3z) = 6 – x – 2y + 3z
3.5 Simple equations
An equation is a mathematical statement that shows the equality of two expressions. The two expressions are separated by the = sign. There are several types of equation, but an equation which has only one symbol and in which the symbol is only raised to the power 1, is known as a simple equation. A simple equation is also known as a linear equation as it can be represented graphically by a straight line.

25Basic algebra 3Consider the equation x + 4 = 6. The left hand side (LHS) of this
equation, x + 4, must be equal to 6, the right hand side (RHS) of the equation. The value of the unknown, x, should be such that the LHS is also equal to 6. In other words x must be equal to 2. Finding the value of the unknown quantity in an equation is known as ‘solving the equation’. The solution of simple equations may require:
• addition or subtraction of symbols or numbers
• multiplication or division by symbols or numbers.
It is important to remember that whatever is done to one side of the equation, the same must be done to the other side to maintain the equality of the two sides. Example 3.6 illustrates this point.
Example 3.6Solve (a) x – 6 = 12
(b) 3a = 15
(c) = 3
(d) 2x – 7 – 3x = 3 – 5x
Solution:
(a) Method 1: In questions of this type we can either add or subtract a number to leave x, the unknown quantity, on its own. The same operation should be carried out on the other side of the equation as well. In this example, 6 is added to both sides of the equation, which in turn leaves the LHS simplifi ed:
x – 6 + 6 = 12 + 6
or x = 18
Method 2: Transfer –6 to the RHS. It becomes +6 in this process
x – 6 = 12
x = 12 + 6 = 18
(b) To solve this question, both sides will be divided by 3 to leave a on its own:
a = 5 , therefore
(c) In this question, both sides of the equation will be multiplied by 5 to leave y on its own,
× 5 = 3 × 5
y = 15 , therefore
y 5
3a 15 ---3 3
y 5
(~=1 ~X5=YX1=Y)
(~=1 ~X5=YX1

26 3 Basic algebra
(d) Transpose –7 to the RHS and –5x to the LHS to have the unknown terms on one side and the numbers on the other side.
2x – 3x + 5x = 3 + 7
7x – 3x = 10
4x = 10, or x = = 2.5
3.6 Application of linear equations
Equations can be used to solve many problems, simple as well as complex. The given information, which could be either in the written form or a sketch, can be used to form an equation
Example 3.7A triangle has two unknown angles, as shown in Figure 3.1. Find the magnitudes of �A and �B.
B
C
90º
2xº
xºA
Figure 3.1
Solution:
The sum of the three angles of a triangle is 180°. Therefore:
x + 2x + 90° = 180°
3x + 90° = 180°
Transfer 90° to the RHS
3x = 180° – 90° = 90°
x = = 30°
Therefore, �A = x = 30° and �B = 2x =60°
Example 3.8The length : width ratio of a rectangle is 2.5. If the perimeter of the rectangle is 42 cm, fi nd its length and width.
90 3
10 4

27Basic algebra 3Solution:
The perimeter of a rectangle is the sum of all the sides. The length : width ratio of 2.5 means that the length of the rectangle is 2.5 times the width. Assume the width of the rectangle to be x.
Length of the rectangle = 2.5x
Perimeter = sum of the measurements of all sides
= x + x + 2.5x + 2.5x = 42
7x = 42
Therefore, x = = 6 cm
Width of the rectangle = x = 6 cm
Length = 2.5 × width = 2.5 × 6 = 15 cm
Exercise 3.1
The solutions to Exercise 3.1 can be found in Appendix 2.
1. Simplify (a) 5a + 2b + 3b – 2a
(b) 5x – 3y – 2x – 3y.
2. Simplify 2xy3 × 5x3y3.
3. Divide 25a3b2c4 by 5a3bc3.
4. Simplify: (a) 4(2x + 3y)
(b) 2(3x – 6y)
(c) 5 + (x + 2y + 10)
(d) 3 – (– 1x + 3y – 4z).
5. Solve the following equations:
(a) x – 5 = 14
(b) 2a = 15
(c) = 3.5
(d) 3(2x + 4) – 2(x – 3) = 4(2x + 4)
(e) + = .
6. A triangle has two unknown angles, �A and �B. If �A is twice the size of �B and �C = 75°, fi nd the magnitudes of �A and �B.
7. The length : width ratio of a rectangle is 2.0. If the perimeter of the rectangle is 42 cm, fi nd its length and width.
8. The length of a rectangle is 3 cm greater than its width. Obtain an expression for the perimeter of the rectangle by assuming the length to be x. Use the expression to calculate the length and width of a rectangle whose perimeter is 30 cm.
9. The angles of a quadrilateral ABCD are as shown in Figure 3.2. If the sum of the four angles is 360°, fi nd the value of each angle.
42 7
y 5
x x+3 2><+1 2 4 3

28 3 Basic algebra
B
CD
A
xº
xº + 40ºxº + 20º
2xº
Figure 3.2
10. Three building plots are for sale in the Black Country. The price of plot A is £20 000 less than that of plot B, and the price of plot C is £30 000 more than that of plot B. Find the price of each plot if their total value is £190 000.
11. The outline plan of a building is shown in Figure 3.3. Find the lengths of the unknown sides if the perimeter of the building is 40 m.
x – 6A
F
B
C
D
E
x – 4
8 m
12 m
x
12 –
x
Figure 3.3
Answers to Exercise 3.1
1. (a) 3a + 5b
(b) 3x – 6y
2. 10x4 y6

29Basic algebra 3 3. 5bc
4. (a) 8x + 12y
(b) 6x – 12y
(c) x + 2y + 15
(d) 3 + x – 3y + 4z
5. (a) x = 19
(b) a = 7.5
(c) y = 17.5
(d) x = 0.5
(e) x = –5
6. �A = 70°°, �B = 35°
7. Width = 7 cm; length = 14 cm
8. Width = 6 cm; length = 9 cm
9. �A = 120°, �B = 60°, �C = 100°, �D = 80°
10. Plot A = £40 000; Plot B = £60 000; Plot C = £90 000
11. AB = 3 m; BC = 3 m; CD = 5 m; DE = 9 m

This page intentionally left blank

C H A P T E R 4Indices and logarithms
Learning outcomes:
(a) Identify the laws of indices
(b) Perform calculations involving multiplication and division of powers
(c) Calculate logarithms and antilogarithms of numbers
4.1 Indices
This topic deals with numbers which are raised to a power. A question may involve a single number, or several numbers that are multiplied and/or divided. The rules that allow us to fi nd solutions easily and quickly are called ‘laws of indices’, and are explained in Section 4.2.
Sometimes we come across a number which is multiplied by itself two times, three times or more. For example, 2 multiplied by itself four times can be written as 2 × 2 × 2 × 2. This can be written in a short form using indices:
2 × 2 × 2 × 2 = 24 (two raised to the power 4)
2 is called the base, and 4 the index. The index tells us the number of times the base number is to be multiplied. Indices may be used when numbers and/or symbols are raised to a power, as shown in Example 4.1. The laws of indices are applicable to both.
4.2 Laws of indices
The laws of indices may be used to solve problems involving numbers raised to a power. They are applicable to negative and fractional indices in the same way as they are to positive whole-number indices.

32 4 Indices and logarithms
4.2.1 Multiplication
When a number raised to a power is multiplied by the same number raised to a power, the indices are added:
am × an = am + n
In this case, a is the base and m and n are the powers. It is important that in any one calculation the base numbers are the same.
Example 4.1Simplify: (a) 32 × 34
(b) a3 × a2
Solution:
(a) am × an = am + n:
32 × 34 = 32 + 4 = 36 = 729
Proof: 32, or 3 raised to the power 2, means that 3 is multiplied by itself twice. Similarly, 34 means that 3 is multiplied by itself 4 four times.
32 × 34 = (3 × 3) × (3 × 3 × 3 × 3)
= 36
= 729
(b) a3 × a2 = a3 + 2 = a5
Example 4.2Simplify 52 × 56 × 54
Solution:
The base numbers are the same in this question:
52 × 56 × 54 = 52 + 6+ 4 = 512 = 244 140 625
4.2.2 Division
In division the indices are subtracted if the base numbers are the same:
Example 4.3
Simplify
am _=am. n an ..,. a =a m- n
7' 7'

33Indices and logarithms 4Solution:
The numerator and the denominator have the same base number, i.e. 7. Therefore we can use the law of indices:
= 76 – 4 = 72 = 49
Proof:
= = 7 × 7 = 72 = 49
Example 4.4
Simplify
Solution:
Use both laws (explained in Sections 4.2.1 and 4.2.2) to solve this question:
=
=
= m11 – 9 = m2
4.2.3 Power of a power
If a number raised to a power is raised to another power, multiply the indices:
(am)n = amn
Example 4.5Simplify: (a) (32)4
(b) (4a2)3
Solution:
(a) (32)4 means that 32 is multiplied by itself four times as the power (or index) is 4.
(32)4 = 32 × 32 × 32 × 32 = 32 + 2 + 2 + 2 = 38 = 6561
Using the law (am)n = amn, (32)4 = 32 × 4 = 38 = 6561
(b) (4a2)3 = 43 × a2×3 = 64 a6
7' 74
7' 7x7x7x7x7x7 74 7x7x7x7
m2 x m9 m2+9
max mB m3+6
mi1
m'
3 3
~ .
"""'i
:""-
J ~. ~
x x
"'I"""
~
~
3~ 3
" 3
3 ~
N
.... X
X
x
3~13
~ 3
3 3
3 ""
"" ~ .
~
~
x x
• +
'" ....
~
~
x x
"" ....
x x
.... """ x ....

34 4 Indices and logarithms
4.2.4 Negative powers
A simple example of a negative power is 2–3, which can also be written as
. This can be written in a generalised form as:
a–n =
Example 4.6
Solve
Solution:
Apply the division law = am – n:
= 23 – 6 = 2–3 (1)
Also,
=
= = = (2)
Answers (1) and (2) must be equal as they have resulted from the same
problem, therefore, 2–3 =
Example 4.7
Simplify
Solution:
= =
Apply the division rule, = m4 – 6
= m–2 =
4.2.5 Zero index
Any number raised to the power zero equals 1, or a0 = 1. Example 4.8 verifi es this law.
Example 4.8Simplify 53 ÷ 53
2' 2'
1 an
2' 2'
an
2' 2x2x2 2' 2x2x2x2x2x2
B 1 1 Bx2x2x2 2x2x2 2'
m'
m4 m4 m4
m3xm3 m3+3 m6
1 2'
m' m6
1 m'
1 2'
2' 2'
1 an
2' 2'
am an
2' 2x2x2 2' 2x2x2x2x2x2
8 1 1 8x2x2x2 2x2x2 2'
m'
1 2'
m3 xm 3
m' m3 xmS
m4 m4
mS+s m6
m' m'
1 m'

35Indices and logarithms 4Solution:
53 ÷ 53 = = 53 – 3 = 50 (1)
Also,
= = = 1 (2)
From (1) and (2), 50 = 1
From Example 4.8 we can conclude that any number raised to the power zero is equal to 1.
(281)0 = 1
(65 839)0 = 1
x0 = 1
4.3 Logarithms
Logarithms were essential tools to perform calculations involving multiplication, division, etc. before the use of electronic calculators. If a positive number x is expressed in the form: x = ay, then y is called the logarithm of x to base a.
In mathematical terms: y = loga x, where log is the short form of logarithm. The most commonly used form of logarithms in mathematics and science are to the base 10. Use the log key on your calculator to determine the logarithm of a number.
Sometimes we know the logarithm of a number but have to fi nd the number itself. This involves the reverse process of fi nding the logarithm of a number and is known as the antilogarithm. Use the shift/second function key before the log key to fi nd the antilogarithm of a number.
Example 4.9 (a) Find the value of log10 2.5 × 10⁵
(b) Calculate the antilogarithm of 5.5
Solution:
Press the calculator keys in the following sequence:
(a) log 2 . 5 EXP 5 = 5.3979
(b) SHIFT LOG 5 . 5 = 316 227.766
Exercise 4.1
The solutions to Exercise 4.1 can be found in Appendix 2. For questions 1–7, evaluate or simplify.
1. (a) 42 × 47 (b) m2 × m3
53
53
53 5x5x5 125 53 5x5x5 125

36 4 Indices and logarithms
2. (a) 32 × 35 × 37
(b) 4 × 42 × 47
3. (a)
(b)
4. (a) (23)5
(b) (3x2)4
5.
6. (a)
(b)
7. (a)
(b)
8. Find the logarithm of (a) 25, (b) 150 and (c) 1204.
9. Find the logarithm of (a) 2.2 × 10² and (b) 3.8 × 10⁻³.
10. Find the antilogarithm of (a) 8.5, (b) 0.72 and (c) 0.0014.
Answers to Exercise 4.1
1. (a) 49 or 262 144; (b) m5
2. (a) 314 or 4 782 969; (b) 410 or 1 048 576
3. (a) n; (b) x4
4. (a) 215 or 32 768; (b) 81x8
5. or
6. (a) or a–4; (b) or x–2
7. (a) 1; (b) 1
8. (a) 1.3979; (b) 2.1761; (c) 3.0806
9. (a) 2.3424; (b) –2.4202
10. (a) 316 227 766; (b) 5.248; (c) 1.003
3' 3'
as a-i-x--as-
X')(Jl4 y'xy'xy'
~:~
~I'i
Il
l. ~
'" II
I "
" II>
" "
~ I~
~ ~.
~'"
.. X
~
~
~
m
~I~
X
.. w
X
X
X
m
m
III
X
X
M
X
X
'"
X
X
~
" "
II>
" "
'" '"
w'"
III
X
w
~
W
M
W
~
X
• ~ ..
'" •
M
". M ~

C H A P T E R 5Standard form,
signifi cant fi gures and estimation
Learning outcomes:
(a) Write a number in the standard form
(b) Write a number to any number of signifi cant fi gures
(c) Estimate the answer of a calculation
5.1 Standard form
In scientifi c calculations, it is more convenient to write large or small numbers in a form known as the standard form. In the standard form a number is split into two parts:
(a) a decimal number that is greater than 1 but less than 10; and
(b) 10n, where n could be a positive or negative integer, depending on the original number.
For example, 3530 is written in the standard form as:
3530 = 3.530 × 10³
As a starting point 3530 can be written as 3530.0The fi rst part (a) should be more than 1.0 but less than 10. Therefore
move the decimal point by three places to the left to achieve this:
3 5 3 0 . 0 = 3.5300 × b (3530.0 becomes 3.5300 after movingthe decimal)
The second part (b) is a number that we must introduce to keep the value of 3530 unchanged. Since we have moved the decimal by three places to the left (or reduced the value of 3530), therefore, we must multiply 3.5300 by 1000. The three zeros in 1000 correspond to the number of places that the decimal has been moved.
3.5300 × b = 3.5300 × 1000

38 5 Standard form, significant figures and estimation
1000 can further be written as 10 × 10 × 10 or 103. Therefore,
3.5300 × 1000 = 3.5300 × 103 = 3.53 × 10³ (3.5300 = 3.53)
Another method of representing 3530 (which is not much different from the above) in the standard form is to divide and multiply it by 1000. This
will not change the value of 3530 and at the same time will result in
a number that is greater than 1 but less than 10.
= 3.530 × 1000 = 3.530 × 10³ or 3.53 × 10³
A similar approach can be used if a number is less than 1. Consider 0.05, which can be written in a fractional form as:
Example 5.1Write the following numbers in the standard form: (a) 425; (b) 15 230; (c) 0.0056; (d) 0.0000621
Solution:
(a) 425 can also be written as 425.0:
425 = 425.0 = 4.25 0 × 100 = 4.25 x 10²
(b) 15 230 can be written as 15230.0:
15230 = 15230.0 = 1.52300 x 10000 = 1.52300 x 104
= 1.523 x 10⁴
(c) 0.0056 = 0005.6 = 5.6 = 5.6 x 10⁻³
1000 103
In this question the decimal point has been moved to the right by three places. Division by 1000 is necessary to keep the number unchanged. The three zeros in 1000 correspond to the number of places that the decimal has been moved.
(d) 0.0000621 = 000006.21 = 6.21 = 6.21 x 10⁻⁵
100000 105
5.2 Signifi cant fi gures
This is a method of approximating a number so that its value is not much different from the approximated value.
Consider a decimal number, say 8.354; it has been represented to four signifi cant fi gures (s.f.). To reduce it to 3 s.f., the last fi gure has to be
3530 = 3530 1000 x 1000
0.05 = 05 5 100 = 100
5 1 00 = 1Q2 = 5 x 1 0-2
5
3530
1000
5 100
100

39Standard form, significant figures and estimation 5discarded. This process may affect the next fi gure, depending on the value of the discarded fi gure. If the last fi gure is between 0 and 4, the next fi gure remains the same. If, however, the last fi gure is 5 or greater, the next fi gure is increased by 1.
The last fi gure in 8.354 is 4. As it is less than 5, the next fi gure remains unchanged.
8.354 = 8.35 correct to 3 s.f.
If we want to reduce 8.35 to two signifi cant fi gures, again the last fi gure will be discarded. As the value of the last fi gure is 5, the next fi gure will be increased by 1.
8.35 = 8.4 correct to 2 s.f.
Similarly,
8.4 = 8 correct to 1 s.f.
In very small decimal numbers, e.g. 0.005739, the zeros after the decimal point are signifi cant fi gures and must be kept during the approximation process. Example 5.2 illustrates this point.
Example 5.2Write: (a) 12.268 5, correct to fi ve, four, three and two signifi cant fi gures.
(b) 0.005739 correct to three, two and one signifi cant fi gures.
Solution:
(a) 12.2685 has six signifi cant fi gures and is slightly more than 12. Discarding fi gures after the decimal point will not have a major effect on the value of 12.2685. Each time the last fi gure is discarded, the number of signifi cant fi gures is reduced by one.
12.2685 = 12.269 correct to 5 s.f.
= 12.27 correct to 4 s.f.
= 12.3 correct to 3 s.f.
= 12 correct to 2 s.f.
(b)
0.005739 = 0.00574 correct to 3 s.f.
= 0.0057 correct to 2 s.f.
= 0.006 correct to 1 s.f.
Example 5.3Write 478 353 to fi ve, four, three, two and one signifi cant fi gures.
Solution:
The solution of this example is different from the previous one as 478 353 is an integer (whole number). The last fi gure cannot be discarded as this

40 5 Standard form, significant figures and estimation
will change the value of the number completely. Instead, the procedure involves replacing the last fi gure by zero:
478 353 = 478 350 correct to 5 s.f.
= 478 400 correct to 4 s.f.
= 478 000 correct to 3 s.f.
= 480 000 correct to 2 s.f.
= 500 000 correct to 1 s.f.
5.3 Estimation
Estimation is the process of fi nding an approximate answer to a question. It can be used to check if the actual answer is right, as sometimes the data input on a calculator may not be right if a wrong key is pressed. Estimation is done by rounding the fi gures, which makes addition, multiplication, division, etc. simpler and quicker. For example, 210 can be rounded to 200 (nearest 100)
Example 5.4(a) Estimate the results of: (1) 263 + 187 + 221
(2) 23 × 13
(3)
(b) Solve the above questions using a calculator and compare the results.
Solution:
(a) (1) To estimate the answer to 263 + 187 + 221, round the fi gures and add:
250 + 200 + 200 = 650
(2) After rounding the fi gures, 23 × 13 becomes:
25 × 10 = 250
(3) can be rounded to:
= = 7.5
(b) (1) 263 + 187 + 221 = 671
(2) 23 × 13 = 299
(3) = 6.625
A comparison of the estimated and the actual answers is given in Table 5.1
27 x 53 12 x 18
30 x 50 15 10 x 20 2
27 x 53
12 x 18
27 x 53 12 x 18

41Standard form, significant figures and estimation 5Table 5.1
Question Estimated answer Actual answer
263 + 187 + 221 650 67123 × 13 250 299
7.5 6.625
Exercise 5.1
The solutions to Exercise 5.1 can be found in Appendix 2.For questions 1–2 write the numbers in standard form.
1. (a) 976; (b) 1478; (c) 377 620
2. (a) 0.025; (b) 0.00071; (c) 0.000000437
3. Write the following standard forms as ordinary numbers: (a) 1.721 × 10²; (b) 2.371 × 10⁻³; (c) 9.877 × 10⁴; (d) 9.1 × 10⁻⁶.
4. Write 361.7297 correct to fi ve, four, three and two signifi cant fi gures.
5. Write 867 364 correct to fi ve, four, three, two and one signifi cant fi gures.
6. Write 0.000839 correct to two and one signifi cant fi gures.
7. Estimate the results of the following and draw a table comparing your estimated answers with the accurate answers: (a) 462 + 122 + 768;
(b) 38 × 15; (c) .
Answers to Exercise 5.1
1. (a) 9.76 × 10²; (b) 1.478 × 10³; (c) 3.7762 × 10⁵
2. (a) 2.5 × 10⁻²; (b) 7.1 × 10⁻⁴; (c) 4.37 × 10⁻⁷
3. (a) 172.1; (b) 0.002371; (c) 98 770; (d) 0.0000091
4. 361.73, 361.7, 362, 360
5. 867 360, 867 400, 867 000, 870 000, 900 000
6. 0.00084, 0.0008
7.
Question Estimated answer Actual answer
462 + 122 + 768 1350 135238 × 15 600 570
18 17.019
27x53
12 x 18
61 x 89 11 x 29
61 x 89 11 x 29

This page intentionally left blank

C H A P T E R 6Transposition and
evaluation of formulae
Learning outcomes:
(a) Transpose simple formulae involving one or more of addition, subtraction, multiplication, division, squares or square roots
(b) Evaluate simple formulae
6.1 Transposition of formulae
Formulae are used in mathematics and science to work out solutions to many problems. For example, the area of a circle is given by:
Area, A = �r2, where � is a constant and r is the radius of the circle.
In this formula, A is called the subject of the formula, and can be evaluated by putting in the values of � and the radius.
There might be a situation where the area of a circle is given and we are asked to calculate the radius. Before the calculations are performed it is better to rearrange the formula to make r the subject. This process of rearranging formulae is called the transposition of formulae.
The method of transposition depends on the given formula. Three types of formula are considered here:
Type 1 the components of a formula are added and/or subtracted
Type 2 the components of a formula are multiplied and/or divided
Type 3 a combination of Type 1 and Type 2 formulae.
6.1.1 Type 1 formulae
Consider the formula a = b – c + dA formula is an equation. The ‘equal to’ sign (=) creates the left-hand
side (LHS) and the right-hand side (RHS). If we want to make b the

44 6 Transposition and evaluation of formulae
subject of the formula, the method will involve rearrangement so that it is:
• on the LHS of the formula
• on its own
• on the numerator side.
When a number or a symbol is moved to the other side of the equation, its sign will change from + to –, and from – to +. The objective in this example is to rearrange c and d so that in the end there is only b on one side of the equation.
Take c to the LHS; its sign will change from – to +:
a + c = b + d
Take d to the LHS; its sign will change from + to –:
a + c – d = b
As the LHS is equal to the RHS, this equation can be written as:
b = a + c – d
6.1.2 Type 2 formulae
Consider the formula for determining the volume of a cuboid:
Volume, V = L × W × H
where L, W and H are the length, width and height, respectively. If we want to make L the subject of the formula, then we need to transfer W and H to the LHS. This can be achieved by dividing both sides by W × H.
;
or L =
6.1.3 Type 3 formulae
The formulae in this category are combinations of Type 1 and Type 2. For example:
y = mx + c
Suppose we are required to make m the subject of the formula. To achieve this, fi rst transfer c to the LHS and then transpose x as explained in Sections 6.1.1 and 6.1.2. On transferring c to the LHS,
y – c = mx
V LxWxH =
WxH WxH
W~H=LX1X1 (:=1 Z=1) V
WxH

45Transposition and evaluation of formulae 6As m and x are multiplied, the only way to have just m on the RHS is to divide both sides by x:
or m =
Example 6.1Transpose a + 2c – b = d + c – a to make d the subject.
Solution:
Transfer –a and +c to the LHS. Their signs will change:
a + a + 2c – c – b = d
2a + c – b = d
or d = 2a + c – b
Example 6.2Transpose c = 2�r to make r the subject
Solution:
Divide both sides by 2�. This will leave only r on the RHS and hence it becomes the subject.
∴ r =
Example 6.3Transpose: (a) A = �r2 to make r the subject
(b) r = to make V the subject
Solution:
(a) A = �r2 can be written as �r2 = A. Divide both sides by � to have only r2 on the LHS:
1L -= J If ~
1L 1L
If ~J1L
x o-A"
x W=--
o-A" x x
XW= o-A"
x x XW= o-A"
x o-A"
x o-A"
x o-A"

46 6 Transposition and evaluation of formulae
Take square root of both sides. As the square root is the reverse of squaring, the square and the square root cancel out to yield r:
=
∴ r =
(b)
r = can be written as = r
Square both sides to get rid of the square root, as explained before
= r2
Multiply both sides by �h:
= r2�h, or V = r2πh
Example 6.4
Transpose F = C + 32 to make C the subject
Solution:
Transpose +32 to the LHS. Its sign will change from + to –:
F – 32 = C
Multiply both sides by 5:
5(F – 32) = 5 × C
5(F – 32) = 9C
Divide both sides by 9 to get only C on the RHS
(F – 32) = C
(F – 32) = C
or C = (F – 32)
6.2 Evaluation of formulae
Evaluation of formulae involves quantifying one term in a formula by replacing the other terms by their given values. For example, the area of a rectangle:
Area = length × width
V
Tth
VTth
Tth
9 -
5
9 -5
5 9 - -9 9
5 -9
5
9
9 -
5
V
Tth Tth
V
Tth
V
Tth V
Tth

47Transposition and evaluation of formulae 6If the length and the width of a rectangle are 10 cm and 6 cm, respectively, the area of the rectangle is:
A = 10 × 6 = 60 cm2
It is essential that the units of different quantities are compatible, otherwise the answer will be wrong. For instance, the length of a rectangle could be in metres and the width in centimetres. In this case it is necessary to convert either the length into centimetres or the width into metres. Example 6.5 illustrates this point.
Example 6.5The surface area, S, of a circular column, excluding the ends, is given by S = 2�rh, where r and h are the radius and the height, respectively. Calculate the surface area of the column in cm2 if r = 30 cm and h = 3.0 m.
Solution:
As the units of r and h are not similar, and because the answer is required in cm2, convert 3.0 m into centimetres.
h = 3.0 m × 100 = 300 cm (1 m = 100 cm)
S = 2�rh = 2 × � × 30 × 300
= 56 548.67 cm2
Example 6.6If C = –10°°, calculate F in the formula F = C + 32.
Solution:
F = (–10) + 32
= –18 + 32 = 14°
Example 6.7
Evaluate r in the formula r = , if s = 400 cm2
Solution:
r =
r =
r = = 5.64 cm
9
6
~!.J QQ!}
if
9
6
if
if

48 6 Transposition and evaluation of formulae
6.3 Evaluation of formulae: practical examples
Example 6.7Figure 6.1 shows two resistors connected in parallel in a circuit. Calculate
the total resistance (R) of the circuit, if
9ΩR2
R1
6Ω
Figure 6.1
Solution:
From Figure 6.1, R1 = 6 � and R2 = 9 �:
= =
After transposition, 5R = 18, or R = = 3.6 � (Ohm (�) is the unit of
electrical resistance).
Example 6.8A transformer steps down the mains supply of 230 V to 110 V to operate power tools. If the secondary coil of the transformer has 88 turns, use the following formula to calculate the number of turns on the primary coil:
Solution:
Transformers are used to increase/decrease the voltage so that some electrical devices can work using the mains supply. For example, the mains voltage of 230 V is reduced for using calculators, laptops, power tools, etc.
1 1 1 -=-+-R R, R2
1 1 1 -=-+-R 6 9
Vs Ns
3+2 18
5 18
18 5
1 1 1 -=-+-R R, R2
Vs Ns

49Transposition and evaluation of formulae 6The following formula can be used to solve this question:
or Np = = 184
Example 6.9The volume of internal air in a building is 600 m3, which is to be maintained at a temperature of 22°°C while the external air temperature is 2°C. Calculate the rate of heat loss due to ventilation if one air change is to be allowed per hour and the specifi c heat capacity of air is 1200 J/m3 °C.
Solution:
The rate of heat loss due to ventilation is:
where Cv is the volumetric specifi c heat capacity of air, V is the volume of the internal air, N is the number of air changes per hour and T is the difference between the internal and external temperatures.
Cv = 1200 J/m3 °C; V = 600 m3; N = 1 per hour; T = 22 – 2 = 20°C.
Rate of heat loss due to ventilation = = 4000 W
Example 6.10A cold water storage cistern feeds water to a vessel as shown in Figure 6.2.
(a) Use the formula, p = �gh to calculate the pressure (p) on the base of the vessel.
(b) Calculate the force acting on the base of the vessel, if force = pressure × area.
The density of water (�) is 1000 kg/m3, and the acceleration due to gravity (g) is 9.81 ms–2.
Solution:
(a) Water pressure at the base of the vessel,
p = �gh
= 1000 × 9.81 × 3.2
= 31 392 N/m2 or 31 392 Pa
(Note: 1 Newton/m2 = 1 Pascal (Pa))
3.2m
1.0m1.5m
Vessel
Figure 6.2
Primary voltage (V.l _ Number of turns In the primary coil (N.l Secondary voltage (V,) - Number of turns in the secondary coil (JV,
230 = No 110 88
230 x 88 110
C,xVxNxT 3600
1200 x 600 x 1 x 20 3600

50 6 Transposition and evaluation of formulae
(b)
force = pressure × area
= 31 392 × (1.5 × 1)
= 47 088 N or 47.088 kN
Example 6.11A circular drain of 300 mm diameter runs half-full of water. Use Chézy’s formula to fi nd the velocity of fl ow if the drain is laid at a gradient of 1 in 100. The value of Chézy coeffi cient (c) is 50 m1/2/s.
Solution:
Chézy’s formula is used to fi nd the velocity (v) of liquid fl ow in drains and partly fi lled pipes:
v = c , where c is the Chézy coeffi cient, R is the hydraulic radius and S is the slope (or gradient).
In this case, the radius of the drain is 150 mm or 0.150 m:
Cross-sectional area of fl ow = (the drain runs half-full)
= = 0.03534 m2
Wetted perimeter = (half perimeter as the drain runs half-full)
= = 0.47124 m
Hydraulic radius, R =
= = 0.075
Slope, S = 1 in 100
= = 0.01
Velocity of fl ow, v = c = 50
= 50 × 0.02739 = 1.37 m/s
Example 6.12A street lamp, having a luminous intensity (I) of 750 candela (cd), is suspended 5.5 m above the edge of a road, as shown in Figure 6.3. If the road is 6.0 m wide, calculate the illuminance (E):
(a) At point B, which is directly under the lamp;
(b) At point C, which is directly opposite B, but on the other edge of the road. Illuminance directly under the lamp: E = and illuminance at
other points: E = cos3
$S
100
21tr
2
1tr2
2
1t x(0.150)2
2
2x1t xO.150 2
Cross-sectional area of flow
Wetted perimeter
0.03534 0.47124
$S ";0.075 x 0.01
h 2
h 2
2
2
2

51Transposition and evaluation of formulae 6
θ
h = 5.5 m
6.0 m
d
B C
Figure 6.3
Solution:
(a) At point B:
Illuminance, E = = = 24.8 lux
(b) From Figure 6.3, d2 = 5.52 + 62. Therefore,
d = = 8.1394 m
cos = = 0.6757
E = cos3 = × (0.6757)3
= 7.7 lux
Exercise 6.1
The solutions to Exercise 6.1 can be found in Appendix 2.
1. Transpose b = c – d – a, to make a the subject.
2. (a) Transpose y = mx + c, to make c the subject.
(b) Calculate c if y = 10, x = 2 and m = 4.
3. Transpose v = u + at, to make t the subject.
4. Transpose p = to make d the subject.
5. (a) The fl ow of heat (Q) through a material is given by, Q = .
Transpose the formula to make k the subject.
(b) Find the value of k if Q = 2000, A = 10, = 40 and d = 0.5.
6. (a) The surface area (A) of an object is given by, A = 4�r2. Transpose the formula to make r the subject.
(b) Find the value of r if A = 5000 cm2.
.J66.25
5.5 8.1394
h 2
h 2
750 5.52
red 2
750 5.52
kA8
d
h
h

52 6 Transposition and evaluation of formulae
7. The volume of a cylinder is given by V = �r2h. Transpose the formula:
(a) to make h the subject
(b) to make r the subject.
8. (a) Transpose v2 – u2 = 2as, to make s the subject of the formula.
(b) Find the value of s if v = 5 m/s, u = 0 and a = 2.5 m/s2.
9. Transpose y = mx + c, to make x the subject.
10. Transpose y = + d, to make x the subject.
11. Transpose V = , to make r the subject.
12. The velocity (v) of water fl owing in an open channel is given by v = c .
(a) Transpose the formula to make m the subject.
(b) Calculate m if v = 2.42 m/s, c = 50 and i = 0.025.
13. A 5 � resistor and 10 � resistor are connected in parallel in a circuit. Calculate the total resistance (R) of the circuit. Refer to Example 6.7 for the formula.
14. The rate of heat loss due to ventilation is given by the following formula:
Rate of heat loss due to ventilation =
If Cv = 1212 J/m3 °°C, V = 400 m3, N = 2.0 and T = 21°C, calculate the rate of heat loss due to ventilation.
15. Calculate the heat energy and power required to raise the temperature of 162 litres of water from 10°C to 50°C:
Heat energy = MST, where M is the mass of water, S is the specifi c heat capacity of water and T is the temperature difference
Power: 1 kW/hr = × 3600 seconds
The specifi c heat capacity of water is 4.186 kJ/kg °C.
16. A cold water storage cistern (CWSC) feeds water to a vessel, which is sited 4.0 m below the CWSC. Calculate the force exerted by water on the base of the vessel that measures 1.5 m × 1.2 m. Use the formulae given in Example 6.10.
17. (a) A circular drain of 150 mm diameter runs half-full of water. Use Chézy’s formula (v = c ) to fi nd the velocity of fl ow if the drain is laid at a gradient of 1 in 80. The values of Chézy coeffi cient (c) and hydraulic radius (R) are 50 m1/2/s and 0.0375, respectively.
(b) If A represents the cross-sectional area (m2) of fl ow and v represents the fl ow velocity (m/s), calculate the fl ow rate (Q) in m3/s from the following formula:
Q = A × v
1 second
GvxVxNxT
3600
GvxVxNxT
3600 3600
3600
3600
second

53Transposition and evaluation of formulae 6Answers to Exercise 6.1
1. a = c – d – b
2. (a) c = y – mx; (b) 2
3. t =
4. d =
5. (a) k = ; (b) 2.5
6. (a) r = ; (b) 19.95 cm
7. (a) h = ; (b) r =
8. (a) s = ; (b) 5 m
9. x =
10. x =
11. r =
12. (a) m = ; (b) 0.0937
13. 3.33 �
14. 5656 W
15. Heat energy required = 27 125.3 kJ; power required = 7.53 kW
16. (a) 39 240 Pa; (b) 70 632 N or 70.632 kN
17. (a) 1.53 m/s; (b) 0.0135 m3/s
v-u a
2p
" Qd AS
~ V
~ ",' V 2 _U2
2a y-c m
7y - 2z -7d 3
l! "h v' c 2j

This page intentionally left blank

C H A P T E R 7Fractions and percentages
Learning outcomes:
(a) Add, subtract, multiply and divide fractions
(b) Convert fractions into decimals and percentages, and vice versa
(c) Calculate percentages and bulking of soils
7.1 Fractions
Consider a circle divided into fi ve equal parts, as shown in Figure 7.1
15
15
15
15
15
Figure 7.1
Each part is of the circle. This method of expressing the result, i.e. , is
called a fraction. Similarly:
two parts = × 2 = of the circle (Figure 7.2a)
three parts = × 3 = of the circle (Figure 7.2b)
1 1 -
5 5
1 2
5 5 1 3
- -
5 5

56 7 Fractions and percentages
(a) (b)
Figure 7.2
The top number in a fraction is called the numerator; the bottom number
is the denominator. If we consider the fraction , 2 is the numerator and
5 the denominator.Fractions can also be written in words, for example:
– half – one-third
– two-thirds – one-quarter
– three-quarters
Example 7.1Express the shaded portions of the shapes shown in Figure 7.3 as a fraction.
(a) (b)
Figure 7.3
Solution:
(a) Total number of squares = 9; shaded square = 1; each square is of
the shape.
Therefore, the shaded portion = of the shape.
1 -
2 2 -
3 3 -
4
1 3 1
-
4
1 9
2 5
1 9

57Fractions and percentages 7The above method can also be expressed as:
Answer (as a fraction) = =
(b) In this case: the number of shaded squares = 4; total number of squares = 9
Answer (as a fraction) = =
Example 7.2
Calculate (a) of 35; (b) of £19.80
Solution:
To solve these questions, replace ‘of’ with multiplication and simplify.
(a)
of 35 = × 35
= = = 10
(b)
of 19.80 = × 19.80
= = = 13.20
7.1.1 Simplifi cation of fractions
In some fractions the numerator and the denominator can both be divided by the same number (known as the common factor), resulting in a simplifi ed answer.
For example, in the fraction , both 2 and 6 can be divided by 2:
= =
cannot be further simplifi ed, hence the fraction is said to be in its
lowest terms.
Example 7.3Express 20 pence as a fraction of 90 pence.
Solution:
As explained in Example 7.1, 20 pence as a fraction of 90 pence is .
can be simplifi ed by dividing 20 and 90 by 10, which is a common factor:
= =
2 2 7 3
2 2 -
7 7 2,,35 70 --
7 7
2 2 -
3 3 2,,19.80
2 2+2 1 6 6+2 3
1 3
20 90
20 20+10 2 90 90+10 9
3
Shaded part/parts 1 Total numberolparts 9
Shadad squares 4 Total numberolsquaras 9
39.80 3
2 6
20 90

58 7 Fractions and percentages
Example 7.4A patio consists of four red and eight grey slabs. Express the number of red slabs as a fraction of the total slabs.
Solution:
Total number of slabs = 4 + 8 = 12
Red slabs as a fraction of 12 slabs =
=
To reduce to its lowest terms, divide 4 and 12 by their common factor,
i.e. 4:
= =
Example 7.5The components of a mortar mix and their masses are shown in Figure 7.4. Express the mass of lime as a fraction of the total mass of the mortar.
W – WaterC – CementL – Lime
W25 kg
C25 kg
L20kg
Sand – 150 kg
Figure 7.4
Solution:
Mass of lime as a fraction of the total mass =
=
=
Divide 20 and 220 by 10, their common factor:
= =
4 12
4 4+4 1 12 12+4 3
20 20+10 2 220 220+10 22
Numberof red slabs
Total numberofslabs
4
12
Mass of lime Total mass of mortar
20 25+20+150+25
20 220

59Fractions and percentages 7 can be further simplifi ed:
= =
7.1.2 Equivalent fractions
Two equal fractions are known as equivalent fractions. In Example 7.4,
results in after simplifi cation, which means that is equal to as the
simplifi cation process is used only to express the fraction in its lowest
terms. The equality of and can be verifi ed by converting these
fractions to decimals. Some examples of equivalent fractions are:
is equivalent to
is equivalent to
7.1.3 Addition and subtraction of fractions
Fractions can be added/subtracted using a range of methods. One of these methods is explained here:
Step 1: Multiply and divide each fraction by a suitable number to make the denominators of the fractions equal. Although different numbers can be used for different fractions, multiply and divide a fraction by the same number.
Step 2: Add or subtract the numerators and divide by the denominator.
Step 3: Simplify the fraction, if necessary, to bring it to its lowest terms. Example 7.6 illustrates this procedure.
Example 7.6
Add and
Solution:
Step 1: Multiply and divide by 5 and by 3 to make the denominator in
both fractions equal:
× =
× =
Step 2:
+ = =
2 22
2 2+2 1 22 22+2 11
1 -
3
2 3
1 2
1 2 3 5
1 5 5 - -
3 5 15 2 3 6
5 :3 15
5 6 5+6 -
15 15 15
4
4 1 12
-
12 3
4 1 -
12 3
10 CO_10+5_2) ------15 15 15+5 3
:3 (~=~:~=J) 6
1 2 - -
3 5
11
15

60 7 Fractions and percentages
Step 3: cannot be simplifi ed as there are no common factors.
Therefore, is the answer.
Example 7.7
Subtract from
Solution:
Using mathematical symbols, the question is written as: –
Step 1: Multiply and divide by 3 and by 4 to make the denominators
equal.
× =
× =
Step 2:
– = =
Step 3: cannot be simplifi ed further, and hence is the answer.
7.1.4 Multiplication and division of fractions
In order to multiply two or more fractions:
Step 1: Multiply the top numbers
Step 2: Multiply the bottom numbers
Step 3: Simplify the answer to its lowest terms.
In division, the dividing fraction is inverted to change division into
multiplication. For example, 5 divided by 6 = 5 ÷ 6 = 5 × . Here 6 is
inverted as division is changed into multiplication. Similarly, ÷ = × .
Example 7.8
(a) Multiply and ; (b) divide by
Solution:
(a) Steps 1 and 2:
× = =
3 -
4 2 -
3
9 12
11 15
11 15
2 3 -
3 4
3 -
3 4 -
4
8 12
1 12
9 12 8 12
9-8
3
7
12
1 2
1 12
3 1 3x1 3 -
7 2 7 x 2 14
3 2 - -4 3
3 2 -4 3
1
6 1 2 1 3 -
3 3 3 2
3 1 - -7 2

61Fractions and percentages 7Step 3: is the answer as it cannot be simplifi ed to lower terms
(b) The question can be written as ÷ . Invert the dividing fraction:
÷ = ×
= =
7.1.5 Conversion of fractions to decimals
A fraction can be converted to a decimal number by dividing the numerator by the denominator. For example:
= 1 ÷ 5 = 0.2 (for details on decimals see Chapter 2)
Example 7.9
Convert into decimal numbers: (a) ; (b) .
Solution:
(a) = 1 ÷ 4 = 0.25; (b) = 2 ÷ 5 = 0.40
7.2 Percentages
Percentage calculation is a convenient and easily understandable method of comparing fractions, and forms an important topic of mathematics. The words ‘per cent’ have been taken from Latin, and mean ‘per hundred’. Percentages are used in everyday life – for example, bank/building society interest rates, VAT and discounts in shops/stores are shown as percentages.
A discount of 10% (per cent is denoted as %) means that if a customer wants to buy goods worth £100, they will get a discount of £10, and hence pay £90.
7.2.1 Conversion of fractions and decimals into percentages
As per cent means ‘per hundred’ the conversion of either a fraction or a decimal can be achieved by multiplying them by 100 and vice versa. Examples 7.10–7.13 illustrate the procedure.
Example 7.10
Convert into a percentage.
3 7
1 5
1 4
1 2
3 14
3 2 7 1 3x2
3 25
7x1 6 -
7
2
5
3 1 7 2
1 2 4 5

62 7 Fractions and percentages
Solution:
To convert a fraction into a percentage, multiply it by 100:
= × 100 = = 12%
Example 7.11Convert 0.25 into a percentage.
Solution:
Multiply the decimal number by 100 to convert it into a percentage:
0.25 = 0.25 × 100 = 25%
Example 7.12A student has obtained 60 marks out of 75 in the science examination. What is her percentage mark?
Solution:
To solve this question, express 60 marks as a fraction of 75 and multiply by 100
60 marks out of 75 =
= × 100 = 80%
Example 7.13Convert 40% into: (a) a fraction; (b) a decimal
Solution:
40% means ‘40 per 100’ or .
(a) is a fraction which can be simplifi ed further:
= =
(b) can be written as 40 ÷ 100
40 ÷ 100 = 0.4
7.2.2 Value added tax (VAT)
VAT is a sale tax which is added to the cost of most of the goods sold in shops, supermarkets, etc. The current rate of VAT is 20%, which means
3 3 300 25 25 25
40 100
40 40+20 2 -
100 100+20 5
40 100
60 75 60 75
40 100
3 3 300 25 25 25
40 100
40 40+20 2 -
100 100+20 5
40 100
60 75 60 75
40 100

63Fractions and percentages 7an item costing £100 without VAT will cost £120.00 with VAT. For other amounts the VAT will increase or decrease accordingly.
Example 7.14The price of a chainsaw, displayed in a warehouse, is £109.95 excluding VAT. If VAT is charged at 20%, fi nd the price of the chainsaw, inclusive of VAT.
Solution:
The amount of VAT = 20% of 109.95
= × 109.95 = £21.99
The price of the chainsaw, including VAT = £109.95 + £21.99 = £131.94.
7.3 Bulking of sand
Sand is one of the three types of soils which, as a subsoil, supports the weight of buildings and other structures. Sand is also used in the manufacture of concrete and cement/sand mortar. When concrete mixes are specifi ed by volume, the sand is assumed to be dry. However, in many cases sand may not be completely dry. When dry sand comes into contact with a small amount of water, a thin fi lm of moisture is formed around the particles. This causes the particles to move away from each other and results in an increase in the volume of sand. This phenomenon is known as the bulking of sand. Unless allowance is made for bulking when measuring by volume, the concrete/mortar may contain too little sand.
The term ‘bulking’ is also used when soil is excavated in construction projects and the volume of the excavated soil is more than its original volume when it was in a compact state. The bulking of soils is due to the loss of their compaction during the excavation process and may amount to about a 5–15% increase in volume. The bulking factor should be taken into account when working out the plant requirement for transporting the soil away from a site.
Example 7.15A trench measuring 10.0 m × 0.6 m × 0.9 m deep is to be excavated in sandy clay. If the excavated soil bulks by 12%, fi nd the volume of the soil after excavation.
Solution:
Volume of the soil in compact state = length × width × depth
=10.0 × 0.6 × 0.9 (see also chapter 12)
= 5.4 m3
20 100

64 7 Fractions and percentages
Increase in the volume of the soil due to bulking =
= 0.648 m3
Volume of the soil after bulking = 5.4 + 0.648 = 6.048 m3
Exercise 7.1
The solutions to Exercise 7.1 can be found in Appendix 2.
1. Express the shaded portions of the shapes shown in Figure 7.5 as a fraction.
(a) (b)
Figure 7.5
2. Express:
(a) 20 pence as a fraction of £1.20
(b) 250 grams as a fraction of 1.200 kg (1000 g = 1 kg)
(c) 60° as a fraction of 120°.
3. Convert the following fractions into their lowest terms:
(a) ; (b) ; (c) .
4. Solve the following:
(a) ; (b) ; (c) ; (d) .
5. Calculate:
(a) m2; (b) £1.50; (c) m.
6. Convert the following fractions into decimal numbers and percentages:
(a) ; (b) ; (c) ; (d) .
7. Calculate: (a) 20% of 150; (b) 75% of 3000; (c) 90% of 900.
8. Nikki obtained 40 marks out of 60 in mathematics and 50 marks out of 80 in science. In which subject did she do better?
10 12 -
12 15
2 5 1 1 -+- -+-3 6 3 5
1 3 0f33
3 3 - -
4 5
40 100
3 2 -+-4 5
1 - of 5
7 10
3 4
~x5.4 100
-+-4 5
3 - of200 4
4 -
5

65Fractions and percentages 7 9. Ray wants to distribute part of £200 among his friends as shown:
25% to Peter
30% to Karen
15% to Dave
How much money will he be left with after distribution to the above?
10. A building society offers 4.5% annual interest for one of its accounts. Calculate the interest that Imran will get if he deposits £1200.00 for one year.
11. Kiran bought the following goods at a warehouse where the prices are displayed exclusive of VAT:
One boiler: £845.00
Seven radiators: £80.00 each
Find the total amount paid by Kiran if VAT was charged at 20%.
12. A batch of concrete is made using the following materials:
Cement = 200 kg
Sand = 450 kg
Gravel = 750 kg
Water = 100 kg
(a) Express the amount of sand as a fraction, and a percentage of the total mass of concrete.
(b) Express the amount of water as a fraction, and a percentage of the amount of cement.
13. Two bricks were tested for water absorption. The results were:
Brick Mass of dry brick (kg)
Mass of water absorbed (kg)
A 2.200 0.200B 2.500 0.250
If water absorption = , fi nd the water
absorption of each brick as a fraction and as a percentage.
14. The total heat loss from a building is 25 000 Watts. Find the heat loss through the windows and the roof, given that:
• 15% of the total heat loss is through the windows
• 35% of the total heat loss is through the roof.
15. 27 m2 of external brickwork of a recently built building are affected by effl orescence. Express this as a fraction and as a percentage of 216 m2, the total area of brickwork.
16. Figure 7.6 shows the amount of money spent on different construction activities in building a house extension. Express:
(a) the money spent on foundations and brickwork as a fraction of the total cost
(b) the money spent on fi nishes as a percentage of the total cost.
mass of water absorbed
mass of dry brick

66 7 Fractions and percentages
Roof£1800
Brickwork£1200
Foundations£1000
Patio door£1000
Finishes£1000
Figure 7.6
17. A sample of timber was tested in a laboratory to determine its moisture content. It was found that:
Mass of wet timber = 2.350 kg
Mass of dry timber = 2.0 kg
Find the moisture content of timber, as a percentage, if:
Moisture content =
Answers to Exercise 7.1
1. (a) ; (b)
2. (a) ; (b) ; (c)
3. (a) ; (b) ; (c)
4. (a) ; (b) ; (c) ; (d)
5. (a) 11 m2 (b) £0.30 (c) 150 m
6. (a) 0.75/75%; (b) 0.6/60%; (c) 0.7/70%; (d) 0.8/80%;
7. (a) 30; (b) 2250; (c) 810
8. Mathematics (percentage marks: maths = 66.67; science = 62.5)
9. £60
10. £54
11. £1686.00
12. (a) /30%; (b) /50%
13. Brick A: /9.09%; Brick B: /10%
1 -
3 1 -
6
5 -
6
3 -
2
3 10
1 -
3 5
-
24 4 5 8 15
1 11
1 -
2 2 -
5 23 20
1 -
2
Mass of wet timber-Massofdrytimber Mass of dry timber
31 20
1
10

67Fractions and percentages 714. Windows: 3750 W; Roof : 8750 W
15. /12.5%
16. (a) ; (b) 16.67%
17. 17.5%
1 -
8 11 30

This page intentionally left blank

C H A P T E R 8Graphs
Learning outcomes:
(a) Plot straight-line graphs from linear equations
(b) Plot experimental data and produce the ‘best-fi t’ line
(c) Calculate the gradient of the straight line (m) and the intercept on the y-axis (c)
(d) Determine the law of the straight-line graph
8.1 Introduction
A graph shows the relationship between two variables. Graphical representation is a quick and easy way to show the information collected from a test or an observation. The shape of a graph depends on the data being plotted and helps us to draw conclusions. Figure 8.1 shows four typical graphs that we may come across in construction and engineering.
8.2 Cartesian axes and coordinates
A graph consists of two axes drawn at right angles to each other. The horizontal line is called the x-axis and the vertical line is called the y-axis. The point where the axes intersect is called the origin, and at this point the values of x and y are zero. The axes are known as rectangular or Cartesian axes, as shown in Figure 8.2.
The space on the right-hand side of the y-axis is used for the positive values of x. The space on the left-hand side of the y-axis is used for the negative values of x. The space above the x-axis is used to plot the positive values of y, and the space below for the negative values of y.
Each point that is to be plotted on a graph must have two values, i.e. the x value and the y value. These are also known as the x coordinate and the y coordinate, respectively. If the coordinates of a point are (3, 5) it means that:
• the fi rst number, i.e. 3, is the x coordinate;
• the second number, i.e. 5, is the y coordinate.

70 8 Graphs
Graphs are usually plotted on A4-size graph paper. Appropriate scales are used for the axes so that all the data can be plotted on the graph paper. It is not necessary to use the same scale for the two axes, but whatever scales are selected they should be easy to use.
30
20
10
00000 0800 1600 2400
Time
Extension
Tem
per
atur
e (º
C)
(a)
Forc
e
(c)
1.2
0.8
0.4
2 4 6p.d. (v)
Cur
rent
(I)
(b)
TimeP
rofit
(d)
Figure 8.1
Origin(x = 0, y = 0)
y
y
x x
x-axis
y-axis
Figure 8.2

71Graphs 8Example 8.1Plot the following points on a graph: A (–5, –3), B (–6, 5), C (3, –7), D (8, 6)
Solution:
Assume that each centimetre on the graph paper represents two units, as shown in Figure 8.3.
Point A has x = –5 and y = –3
A point is located on the x-axis where x = –5. From this point, a vertical line is drawn downwards as the value of y is negative. A horizontal line is drawn through the –3 mark on the y-axis. The point where these two lines meet is the plot of point A.
6
4
2
–6 –4 –2 2 4 6 8
C (3, –7)
D (8, 6)
x
y
–2
–4
–6
–8
B (–6, 5)
A (–5, –3)
Figure 8.3
Point B has x = –6 and y = 5. The procedure, as before, involves the location of the point on the x-axis where x = –6. From this point, a vertical line is drawn upwards as the value of y is positive. A horizontal line is drawn through the 5 mark on the y-axis. The point where these two lines meet is the plot of point B. Following this procedure, points C and D can be plotted as well, as shown in Figure 8.3.
Example 8.2The air temperatures on last year’s hottest day were:
Time 0800 1000 1200 1400 1600 1800 2000
Temperature (°C) 16 20 28 30 29 27 24
Plot a graph to show the air temperature against time.

72 8 Graphs
Solution:
On graph paper the axes are drawn as shown in Figure 8.4. The x-axis is normally used for the independent variable and the y-axis for the dependent variable. Time is the independent variable and is marked on the x-axis. Temperature, the dependent variable, is marked on the y-axis as shown in Figure 8.4. As 16°C is the lowest temperature, the fi rst point on the y-axis can be anything from 0°C to 14°C. But here we will start from 12°C. The fi rst point on the x-axis is 0800. The scales used in this example are:
• x-axis: 1 cm = 2 hours
• y-axis: 1 cm = 4°C
32
28
24
20
16
120800 1200 1600 2000
Time
Tem
per
atur
e (º
C)
Figure 8.4
The air temperature at 0800 hours was 16°C; to mark this point on the graph paper we must draw a vertical line through the 0800 hours mark and a horizontal line through the 16°C mark. As the vertical line through the 0800 mark is the y-axis and already drawn, mark a point at the 16°C mark with a cross or a dot.
At 1000 hours the temperature was 20°C. To mark this point on the graph, draw a vertical line through the 1000 hours mark and a horizontal line through the 20°C mark. Mark the point where the two lines meet with a dot or a cross. Repeat this process to mark the other points and join them, as shown in Figure 8.4
Example 8.3A material was heated to 68°C and then allowed to cool down to room temperature. Its temperature, as it cooled, was recorded and is given below:
Time (minutes) 0 0.5 1 2 3 4 6 8 10 15
Temperature (°C) 68 65 63 60 57 55 52 50 48 46

73Graphs 8Produce a graph of temperature versus time by drawing a smooth curve through all points.
Solution:
On a graph paper draw the axes as shown in Figure 8.5. The scales used for the axes are:
• x-axis: 1 cm = 2 minutes
• y-axis: 1 cm = 4°C
60
56
52
48
44
400 2 4 6 8 10 12
Time (minutes)
14 16
64
68
Tem
per
atur
e (º
C)
Figure 8.5
The time and temperature are marked on the axes as shown in Figure 8.5. The coordinates of the points to be plotted are: (0, 68), (0.5, 65), (1, 63), (2, 60), (3, 57), (4, 55), (6, 52), (8, 50), (10, 48) and (15, 46). The points are plotted as described in the earlier examples and joined by a smooth curve.
8.3 Straight-line graphs
The general equation of the straight line is given by:
y = mx + c,
where x is the independent variable and y the dependent variable, m is the slope or gradient of the straight line and c is the intercept made by the straight line on the y-axis.
Any equation that is written in this form will produce a straight-line graph, as explained in Examples 8.4 and 8.5.

74 8 Graphs
Example 8.4Draw the graph of y = 2x + 3 from x = –2 to x = 4
Solution:
Before plotting the points on the graph paper we need to use different values of x from the given range, and fi nd the corresponding values of y.
If x = –2, y = (2 × –2) + 3
= –4 + 3 = –1
Similarly for x = –1, 1, 2 and 4, the corresponding values of y are determined, which are:
x –2 –1 1 2 4
y –1 1 5 7 11
We now have fi ve points, the coordinates of which are: (–2, –1), (–1, 1), (1, 5), (2, 7) and (4, 11). Suitable scales are selected and the points plotted, as shown in Figure 8.6. A straight line is drawn that passes through all the points. This is the graph of the equation: y = 2x + 3. (Actually, three points should be suffi cient to produce a straight-line graph).
543
(4, 11)
(2, 7)
(1, 5)
(–2, –1)
12
10
8
6
4
2
–2
–4
y
210–1–2–3 x
Figure 8.6
Example 8.5Draw the graph of y = 5 – 6x, between the limits x = –2 and x = 3.

75Graphs 8Solution:
Use different values of x, from the given range, and determine the corresponding values of y.
If x = –2, y = 5 – (6 × –2)
= 5 + 12 = 17
Similarly for x = –1, 1, 2 and 3, the corresponding values of y are calculated. These are:
x –2 –1 1 2 3
y 17 11 –1 –7 –13
The coordinates of the points are: (–2, 17), (–1, 11), (1, –1), (2, –7) and (3, –13). The points are plotted as shown in Figure 8.7, and a straight line drawn passing through all the points. This is the graph of the equation: y = 5 – 6x
43
20
15
10
5
–5
–10
y
2
(2, –7)
(3, –13)
(–1, 11)
(–2, 17)
10–1–2
–15
x
Figure 8.7
8.4 The law of the straight line
In building technology and civil engineering, practical work is often undertaken to understand and prove some fundamental concepts. In some cases the results obtained from experimental work produce a perfect straight-line graph or linear relationship, whereas in others the points do not exactly lie on a straight line but exhibit a linear relationship. A best-fi t line is drawn in the latter case. The law of the straight line can be determined using the equation y = mx + c.

76 8 Graphs
8.4.1 The gradient (m)
The gradient (m) of a straight line is a measure of how steep the line is. To calculate the gradient, draw a right-angled triangle of a reasonable size on the straight line. Find the length of the vertical and the horizontal sides of the triangle using the scales of the axes. Figure 8.8 shows a straight-line graph and a right-angled triangle ABC.
6
A
B C
AC = 1.5BC = 3
543210
1
2
3
4
Figure 8.8
Gradient of the line, m = = = 0.5
The gradient is positive if the line rises, i.e. the right end of the line is higher than the left end. The gradient is negative if the left end of the line is higher than the right end, as shown in Figure 8.9.
Positivegradient
0
(a)
C
y
x
Negativegradient
0
(b)
C
y
x
Figure 8.9
AC 1.5 BC 3

77Graphs 88.4.2 The intercept (c)
The intercept made by the straight-line graph on the y-axis, when x = 0, is called the y-axis intercept (see Figure 8.9). If x is not equal to zero at the origin, then the coordinates of a point that lies on the line are noted and substituted in the equation y = mx + c, to obtain the value of c.
Example 8.6Find the law of the straight line shown in Figure 8.10
6 7 8 9
A
B C
AC = 2BC = 4
543210
1
2
3
4
5
6
y
x
Figure 8.10
Solution:
The intercept on the y-axis (c) = 1. To fi nd the gradient of the straight line, a right-angled triangle ABC is drawn as shown in Figure 8.10. The right end of the line is higher than the left end – therefore the gradient is positive.
Gradient m = = = 0.5
As y = mx + c
∴ The law of the straight line is: y = 0.5x + 1
Example 8.7Find the law of the straight line shown in Figure 8.11
AC 2
BC 4

78 8 Graphs
6 7 8 9
A
BC
AC = –4BC = 4
543210
1
2
3
4
5
6
y
x
Figure 8.11
Solution:
The intercept on the y-axis (c) = 6. To fi nd the gradient, a right-angled triangle ABC is drawn as shown in Figure 8.11. As the left end of the line is higher than the right end, the gradient of the line is negative.
Gradient m = = = –1
� The law of the straight line is: y = –1x + 6 (y = mx + c)
or y = –x + 6
Example 8.8The results of a tensile test on a metal are:
Stress (S) 0 0.04 0.08 0.10 0.12 0.16 kN/m2
Strain (N) 0 0.0004 0.0008 0.001 0.0012 0.0016
(a) Select suitable scales and plot a graph of stress versus strain, and show that the equation connecting stress (S) and strain (N) is of the form S = mN + c
(b) Find the equation of the graph
(c) Find the stress in the metal when the strain is increased to 0.002 (assuming that the behaviour of the metal does not change)
Solution:
(a) In this example the independent and the dependent variables are different from those used earlier. N is used instead of x, and S is used instead of y. Stress (S) is plotted on the y-axis and strain (N) on the x-axis.
AC 4 BC 4

79Graphs 8Suitable scales are selected and marked on the axes as shown in
Figure 8.12. It is evident on plotting the points that they follow a straight line. Therefore we can say that the equation connecting S and N is of the form S = mN + c.
Strain
Str
ess
(kN
/m2 )
A
BC
0.05
0.10
0.15
0.20
0.0005 0.0010
0.001
0.0015 0.00200
0.10
Figure 8.12
(b) A straight line is drawn through the points and the gradient m and intercept c are determined as explained in Example 8.6.
Gradient m = = = 100
Intercept c = 0
The equation of the straight line is S = mN + c
= 100N + 0
or S = 100N
(c) When N = 0.002, S = 100 × 0.002 = 0.2 kN/m2
8.5 Simultaneous equations
The procedure for drawing the graphs of straight lines has already been explained in Section 8.3. The simultaneous equations should be rearranged so that their form is similar to the standard straight-line equation. The graphs are plotted on the same axes and the answer obtained by fi nding the coordinates of the point of intersection. The point of intersection is common to both lines (or equations), as shown in Example 8.9.
AC 0.10 BC 0.001

80 8 Graphs
Example 8.9Solve graphically the simultaneous equations:
x + 3 = –2y
and
x – y = 3
Solution:
The equations may be given in any form, but it is necessary to rearrange each equation into the form of the straight-line law, i.e. y = mx + c. The fi rst equation can be written as:
2y = –x – 3
or (1)
Similarly, the second equation becomes:
y = x – 3 (2)
At least three values of x are assumed in each case and the corresponding values of y determined:
Equation 1: If x = 1, = = –2
If x = 3, = = –3
Similarly when x = 5, y = –4
The coordinates for Equation (2) are calculated in a similar manner. The following table summarises the calculations:
Equation 1 x 1 3 5–2 –3 –4
Equation 2 x 1 3 5y = x – 3 –2 0 2
The graphs are plotted as shown in Figure 8.13. The solution of the two equations is the point of intersection (1, –2). Therefore x = 1 and y = –2.
8.6 Quadratic equations
The graphical method, although time consuming, can be used to solve any quadratic equation. There is only one unknown (e.g. x) in a quadratic equation, therefore for the graphical solution it is necessary to equate the quadratic equation to y. For example, if we are asked to solve the equation, 2x2 – 6x – 8 = 0, then as a starting point we say that:
y = 2x2 – 6x – 8 = 0
-x-3 y---
2
-1-3 y---
2
-3-3 y---
2
-x - 3 y=--
2
-4 2
-6 2

81Graphs 8
At least six values of x are assumed and the corresponding values of y are determined. The points are plotted on a graph and joined by a smooth curve. The solution of the equation is determined by fi nding the values of x coordinates where the curve meets the x-axis (y = 0 on the x-axis).
Example 8.10Solve the equation 2x2 – 6x – 8 = 0, by graphical method.
Solution:
Initially fi ve values of x (–4, –2, 0, 2, 4) are assumed and the corresponding values of y calculated as shown below. Depending on the shape of the graph, further points may be necessary to fi nd the solution.
x –4 –2 0 2 4
2x2 32 8 0 8 32
–6x 24 12 0 –12 –24
–8 –8 –8 –8 –8 –8
2x2 – 6x – 8 48 12 –8 –12 0
The equation 2x2 – 6x – 8 is evaluated by adding –8 and the values of 2x2 and –6x. This is also the value of the y coordinate, as y = 2x2 – 6x – 8.
We have fi ve points (–4, 48), (–2, 12), (0, –8), (2, –12) and (4, 0), which are plotted as shown in Figure 8.14. A smooth curve is drawn passing through all the points.
43
4
3
2
1
–1
–2
y
21–1–2
–3
–4
5
(1, –2)
–3–4 x
x + 3 = – 2y
x – y
= 3Figure 8.13

82 8 Graphs
43
40
30
20
10
–10
–20
y
21–1–2
–30
50
5–3–4 6 x
2x 2 – 6x –8
Figure 8.14
As the last point just touches the x-axis, another point is needed to extend the curve. The value of y is determined at x = 6, as shown:
x –4 –2 0 2 4 6
2x2 32 8 0 8 32 72–6x 24 12 0 –12 –24 –36–8 –8 –8 –8 –8 –8 –82x2 – 6x – 8 48 12 –8 –12 0 28
The curve crosses the x-axis at x = –1 and x = 4, therefore the solutions of the equation 2x2 – 6x – 8 = 0 are:
x = –1 and x = 4
Exercise 8.1
The solutions to Exercise 8.1 can be found in Appendix 2.
1. The fi gures below show the profi t made by a building company during the last fi ve years. Represent the data in the form of a graph.
Year 1 2 3 4 5
Profi t (£) 60 000 100 000 200 000 160 000 230 000
2. A test was conducted to determine the effect of water content on the density of compacted soil. The results are shown below:
Density (kg/m3) 1810 1860 1880 1885 1830
Water content (%) 10 12 13 14 16

83Graphs 8 Draw a graph between density and water content, showing density
on the y-axis.
3. Draw the graphs of the following equations:
(a) y = 2x – 4, taking values of x between –2 and 4.
(b) y = –0.6x + 5, taking values of x between –2 and 4.
4. The fi gures below show how the current through a metal wire varies with the potential difference applied across its ends:
Potential difference (V) 0.65 1.26 1.90 2.50 3.15
Current (I) 0.1 0.2 0.3 0.4 0.5
(a) Plot a graph of potential difference (y-axis) against current (x-axis).
(b) Find the gradient of the graph and determine the law connecting V and I.
5. In an experiment to prove Hooke’s Law, the following data were obtained by stretching a spring:
Stretching force, F (Newton) 0 1 2 3 4 5 6
Extension, L (mm) 0 8.5 16 24.5 33 41.5 50
(a) Plot a graph of stretching force (y-axis) against extension (x-axis) and fi nd the gradient of the straight line.
(b) Show that the law connecting F and L is of the form F = mL, and fi nd the law.
6. The results of a tensile test on steel are shown below:
Stress (S) kN/m2 0 0.08 0.16 0.2 0.24 0.32
Strain (N) 0 0.0004 0.0008 0.0010 0.0012 0.0016
(a) Plot a graph of stress versus strain. Show that the law connecting stress (S) and strain (N) is of the form S = mN, and fi nd the law.
(b) Find the stress in steel when the strain is increased to 0.002 (assuming that the straight-line law holds good outside the range of the given data).
7. A sample of plastic pipe expanded as shown below:
Length, L (mm) 1000 1001.1 1002.3 1003.1
Temperature, T (°°C) 20 32 45 54
(a) Plot a graph of expansion (E) against temperature (T) and fi nd the equation of the line.
(b) Find the length of the pipe at 10°C.
8. Figure 8.15 shows the relationship between the compressive strength and the water content of concrete. Find the equation of the straight line.
9. Solve the following simultaneous equations graphically:
x + y = 5, and 3x – 2y = –5
10. Solve graphically the quadratic equation: x2 + x – 20 = 0.

84 8 Graphs
Answers to Exercise 8.1
1. See Appendix 2
2. See Appendix 2
3. See Appendix 2
4. (a) See Appendix 2
(b) m = 6.25; c = 0; Law: V = 6.25I
5. (a) See Appendix 2
(b) m = 0.12; c = 0; Law: F = 0.12L
6. (a) See Appendix 2
m = 200 and c = 0
S = 200N
(b) S = 0.4 kN/m2
7. (a) See Appendix 2 (consider 20°C as the initial temperature)
m = 0.091; c = –1.8; Law: E = 0.091T – 1.8
(b) 999.11 mm
8. m = –4.583; c = 45.67; Law: Y = –4.583x + 45.67
9. x = 1, y = 4 (see graph in Appendix 2)
10. x = –5, x = 4 (see graph in Appendix 2)
8.04.0 5.0 6.0 7.00
10
20
30
Water content (%)C
omp
rehe
nsiv
e st
reng
th (N
/mm
2 )
Figure 8.15

C H A P T E R 9Units and their
conversion
Learning outcomes:
(a) Use graphs and conversion factors to convert the units of length, mass, area and volume from one system to the other
(b) Use tables to convert the units of temperature
9.1 Introduction
Units of measurement, in one form or another, have been with us for many centuries. It is quite likely that the units for length and mass were the fi rst ones to be invented. Our ancestors used the body parts as measuring instruments. Early Babylonian, Egyptian and other records indicate that length was measured with the forearm, hand or fi ngers. As civilisations evolved, units of measurement became more complicated to cater for trade, land division, taxation and other uses. As the means of communication were not very good before the eighteenth century, different units were developed in different countries, or even different parts of the same country, for the same purpose. In Britain, units from Egyptian, Babylonian, Anglo-Saxon and other European cultures evolved into the inch, foot and yard. In Britain and many other countries, the FPS system had been in use till the late 1950s. The basic units for length, mass and time were the foot, pound and second.
During the 1960s scientists and mathematicians started to use the metric system to simplify their calculations and promote communication across different nations. Even in the metric system two branches of systems co-existed for a long time: the CGS and MKS systems. The base units for length, mass and time, in the two systems are:
CGS system the centimetre, gram and second
MKS system the metre, kilogram and second.
In 1960 the metric system was revised and simplifi ed for international use. The metre, kilogram and second were kept as the basic units for length, mass and time. This system, which includes four other basic units, is called

86 9 Units and their conversion
the SI system (International System of Units). A brief comparison of the metric systems and the FPS system is given in Table 9.1.
Although in formal work the metric units have replaced the British units, the inch, mile, ounce, pound, stone, pint, gallon, etc. are still used in everyday life in Britain, and it becomes necessary sometimes to convert a unit from one system into the other.Conversion of units may be done using a range of methods:
• conversion factors
• tables
• graphs
The following sections give examples of converting the units of length, mass, temperature, etc. based on these methods.
9.2 Length
The SI unit of length is metre, but millimetre, centimetre and kilometre are quite commonly used in mathematics. The use of conversion factors gives the most accurate results, but the use of graphs is a fairly straightforward method.
9.2.1 Conversion factors
Table 9.2 gives the conversion factors for some of the commonly used units in the metric as well as the FPS system:
Example 9.1Convert: (a) 56 mm into metres
(b) 445 mm into metres
Table 9.1
CGS/MKS system FPS system
Length Millimetre (mm), centimetre (cm), metre (m), kilometre (km)
Inch (in), foot (ft), yard (yd), mile
Mass Gram (g), kilogram (kg), tonne
Ounce (oz), pound (lb), stone, ton
Time Second (s) Second (s)Temperature Degrees Celsius (°°C) Degrees Fahrenheit (°F)Capacity Millilitre (ml), centilitre (cl),
litre (l)Pint, gallon
Volume Cubic millimetre, cubic centimetre, cubic metre
Cubic foot, cubic yard
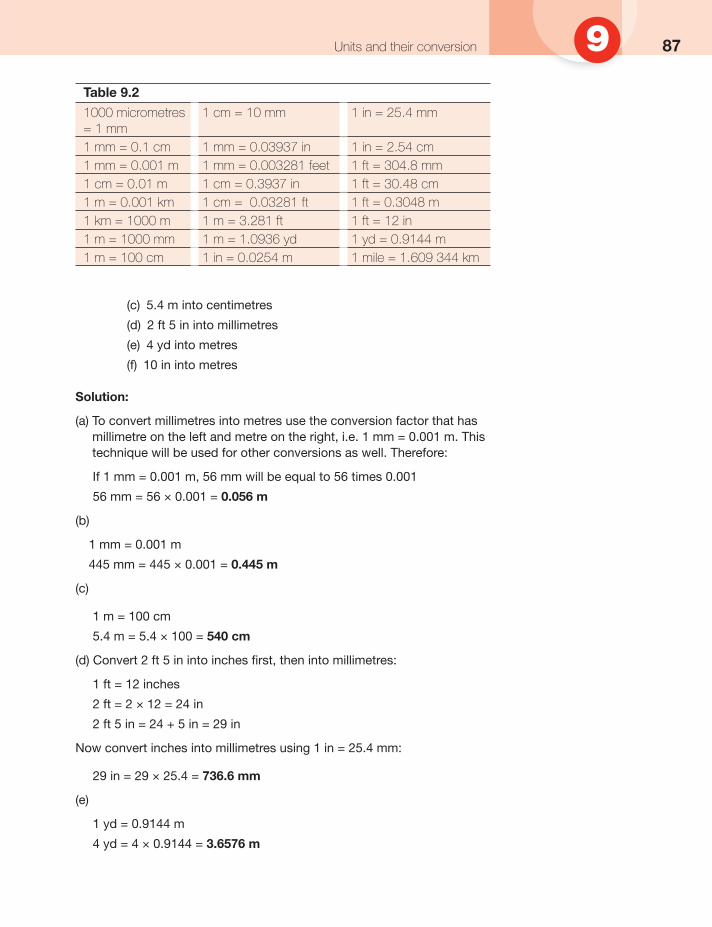
87Units and their conversion 9
(c) 5.4 m into centimetres
(d) 2 ft 5 in into millimetres
(e) 4 yd into metres
(f) 10 in into metres
Solution:
(a) To convert millimetres into metres use the conversion factor that has millimetre on the left and metre on the right, i.e. 1 mm = 0.001 m. This technique will be used for other conversions as well. Therefore:
If 1 mm = 0.001 m, 56 mm will be equal to 56 times 0.001
56 mm = 56 × 0.001 = 0.056 m
(b)
1 mm = 0.001 m
445 mm = 445 × 0.001 = 0.445 m
(c)
1 m = 100 cm
5.4 m = 5.4 × 100 = 540 cm
(d) Convert 2 ft 5 in into inches fi rst, then into millimetres:
1 ft = 12 inches
2 ft = 2 × 12 = 24 in
2 ft 5 in = 24 + 5 in = 29 in
Now convert inches into millimetres using 1 in = 25.4 mm:
29 in = 29 × 25.4 = 736.6 mm
(e)
1 yd = 0.9144 m
4 yd = 4 × 0.9144 = 3.6576 m
Table 9.2
1000 micrometres = 1 mm
1 cm = 10 mm 1 in = 25.4 mm
1 mm = 0.1 cm 1 mm = 0.03937 in 1 in = 2.54 cm1 mm = 0.001 m 1 mm = 0.003281 feet 1 ft = 304.8 mm1 cm = 0.01 m 1 cm = 0.3937 in 1 ft = 30.48 cm1 m = 0.001 km 1 cm = 0.03281 ft 1 ft = 0.3048 m1 km = 1000 m 1 m = 3.281 ft 1 ft = 12 in1 m = 1000 mm 1 m = 1.0936 yd 1 yd = 0.9144 m1 m = 100 cm 1 in = 0.0254 m 1 mile = 1.609 344 km

88 9 Units and their conversion
(f)
1 in = 0.0254 m
10 in = 10 × 0.0254 = 0.254 m
9.2.2 Use of the graphical method
A graph can be plotted for any two units, and the resulting straight line used to convert one unit to the other. Figure 9.1 shows a graph that can be used to convert metres into feet and vice versa. Known conversion factors are used to plot the straight-line graph:
1 ft = 0.3048 m
10 ft = 3.048 m
20 ft = 6.096 m
30 ft = 9.144 m
40 ft = 12.192 m
140 2 4 6Meters
Feet
8 10 12
40
35
30
25
20
15D
A
B
10
5
Figure 9.1

89Units and their conversion 9In Figure 9.1 the x-axis is used for metres and y-axis for feet; however, the choice of an axis for a particular unit is immaterial. Using the scale shown in Figure 9.1, plot four points having the coordinates (3.048, 10), (6.096, 20), (9.144, 30) and (12.192, 40). Draw a straight line through all the points. This graph can be used to convert feet into metres and vice versa, as shown in Example 9.2.
Example 9.2Draw a graph between feet and metres and use it to convert:
(a) 15 ft into metres
(b) 5 m into feet
Solution:
The procedure for drawing the graph has already been explained above. The following method explains how to use this graph for the conversion of units:
1. Draw a horizontal line from the 15 feet mark and extend it to meet the straight-line graph at point A (Figure 9.1). Draw a vertical line from point A to meet the x-axis at point B. Point B represents 4.51 m, which is the required conversion.
2. Draw a vertical line from the 5 m mark to meet the straight-line graph at point C. From point C draw a horizontal line to meet the y-axis at point D. Read off point D to get the conversion. The answer is 16.5 feet.
9.3 Mass
The SI unit of mass is kilogram, but gram and tonne are also used in mathematics, science and daily use. Two methods are given in the following sections to convert from one system into the other.
9.3.1 Conversion factors
Table 9.3 gives the conversion factors for some of the commonly used units in the metric as well as the FPS system:
Table 9.3
1 g = 0.001 kg 16 oz = 1 lb 1 g = 0.03527 oz1 g = 0.000001 tonne 14 lb = 1 stone 1 kg = 2.204 62 lbs1 kg = 1000 g 112 lb = 1 hundred
weight (cwt)1 lb = 453.59237 g
1 kg = 0.001 tonne 20 cwt = 1 ton 1 lb = 0.45359 kg1 tonne = 1000 kg 2240 lb = 1 ton 1 oz = 28.3495 g1 tonne = 1 000 000 g

90 9 Units and their conversion
Example 9.3Convert: (a) 0.050 kg into grams
(b) 20 500 kg into tonnes (c) 505 g into ounces
Solution:
(a) To convert kilograms into grams, use the conversion factor that has kilogram on the left and gram on the right, i.e. 1 kg = 1000 g:
1 kg = 1000 g.
0.050 kg = 0.050 × 1000 = 50 g
(b)
1 kg = 0.001 tonne
20 500 kg = 20 500 × 0.001 = 20.5 tonne
(c)
1 g = 0.03527 oz
505 g = 505 × 0.03527 = 17.811 oz
9.3.2 Graphical method
As explained in Section 9.2.2, a straight-line graph can be plotted between two units and used to convert one unit into the other. Figure 9.2 shows a graph that can be used to convert kilograms into pounds and vice versa. Known conversion factors are used to plot the straight-line graph:
1 kg = 2.20462 lb
10 kg = 22.0462 lb
20 kg = 44.0924 lb
30 kg = 66.1386 lb
In Figure 9.2, the x-axis represents kilograms and the y-axis represents pounds. Use the scales as shown in the fi gure and draw a straight line passing through all the points. Using this straight line will result into the desired conversion, i.e. kilograms into pounds or pounds into kilograms. Example 9.4 explains this process.
Example 9.4Use two methods to convert the following units and compare the results:
(a) Convert 10.500 kg into pounds
(b) Convert 50 lb into kilograms

91Units and their conversion 9
Solution:
(a) Graphical method. Use the graph between kilograms and pounds as shown in Figure 9.2. To convert 10.5 kg into pounds, draw a vertical line from the 10.5 kg mark on the x-axis to meet the straight-line graph at point A. Draw a horizontal line from point A to meet the y-axis at point B. Read off point B to get the answer in pounds.
Answer = 23 lb
Use of conversion factors. 1 kg = 2.20462 lb
10.5 kg = 10.5 × 2.204 62 = 23.15 lb
(b) Graphical method. To convert 50 lb into kilograms, use the procedure already explained in the fi rst part of this example, but start from 50 lb on the y-axis. Draw a horizontal line to meet the straight-line graph at point C. From point C draw a vertical line to meet the x-axis at point D. Read off point D to get the answer.
Answer = 22.75 kg
355 10 15Kilograms
Pounds
20 25 30
70
60
50
40
30
20
B A
D
C
10.5
10
Figure 9.2
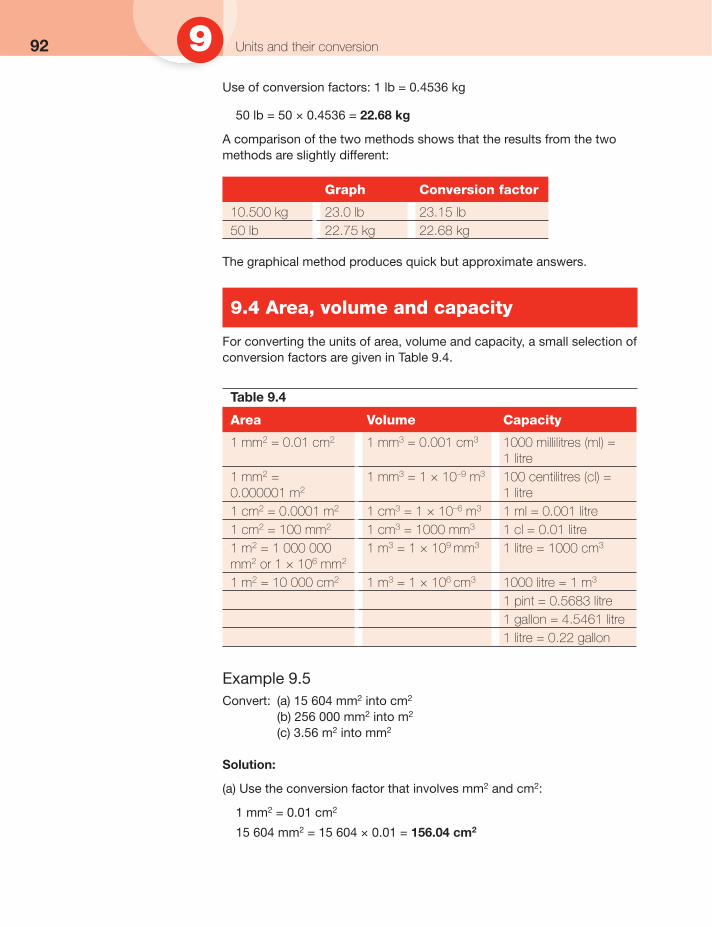
92 9 Units and their conversion
Use of conversion factors: 1 lb = 0.4536 kg
50 lb = 50 × 0.4536 = 22.68 kg
A comparison of the two methods shows that the results from the two methods are slightly different:
Graph Conversion factor
10.500 kg 23.0 lb 23.15 lb50 lb 22.75 kg 22.68 kg
The graphical method produces quick but approximate answers.
9.4 Area, volume and capacity
For converting the units of area, volume and capacity, a small selection of conversion factors are given in Table 9.4.
Table 9.4
Area Volume Capacity
1 mm2 = 0.01 cm2 1 mm3 = 0.001 cm3 1000 millilitres (ml) = 1 litre
1 mm2 = 0.000001 m2
1 mm3 = 1 × 10⁻⁹ m3 100 centilitres (cl) = 1 litre
1 cm2 = 0.0001 m2 1 cm3 = 1 × 10⁻⁶ m3 1 ml = 0.001 litre1 cm2 = 100 mm2 1 cm3 = 1000 mm3 1 cl = 0.01 litre1 m2 = 1 000 000 mm2 or 1 × 106 mm2
1 m3 = 1 × 109 mm3 1 litre = 1000 cm3
1 m2 = 10 000 cm2 1 m3 = 1 × 106 cm3 1000 litre = 1 m3 1 pint = 0.5683 litre1 gallon = 4.5461 litre1 litre = 0.22 gallon
Example 9.5Convert: (a) 15 604 mm2 into cm2
(b) 256 000 mm2 into m2 (c) 3.56 m2 into mm2
Solution:
(a) Use the conversion factor that involves mm2 and cm2:
1 mm2 = 0.01 cm2
15 604 mm2 = 15 604 × 0.01 = 156.04 cm2

93Units and their conversion 9(b) This question involves mm2 and m2:
1 mm2 = 0.000001 m2
256 000 mm2 = 256 000 × 0.000001 = 0.256 m2
(c)
1 m2 = 106 mm2
3.56 m2 = 3.56 × 106 = 3 560 000 mm2
Example 9.6Convert: (a) 6 593 000 mm3 into m3 (b) 0.00024 m3 into mm3
Solution:
(a)
1 mm3 = 1 × 10⁻⁹ m3
6 593 000 mm3 = 6 593 000 × 1 × 10–9 = 0.0066 m3
(b)
1 m3 = 1 × 109 mm3
0.00024 m3 = 0.00024 × 1 × 109 = 240 000 mm3
Example 9.7Convert: (a) 12 560 ml into litres
(b) 6.67 litres into centilitres (c) 0.0053 m3 into litres (d) 30 litres into gallons
Solution:
(a)
1 ml = 0.001 litre
12 560 ml = 12 560 × 0.001 = 12.560 litres
(b)
1 litre = 100 cl
6.67 litres = 6.67 × 100 = 667 cl
(c)
1 m3 = 1000 litres
0.0053 m3 = 0.0053 × 1000 = 5.3 litres
(d)
1 litre = 0.22 gallons
30 litres = 30 × 0.22 = 6.6 gallons

94 9 Units and their conversion
9.5 Temperature
Temperature may be converted using a range of methods, but here only the use of tables is given. Table 9.5 shows a selection of temperatures in degrees Celsius and their equivalent temperatures in degrees Fahrenheit. It shows that for a change of 1°C the corresponding change in degrees Fahrenheit is 1.8.
Table 9.5
Temperature Temperature Temperature°C °F °C °F °C °F
0 32 40 104 80 176 5 41 45 113 85 18510 50 50 122 90 19415 59 55 131 95 20320 68 60 140 100 21225 77 65 149 105 22130 86 70 158 110 23035 95 75 167
Example 9.8Convert the following temperatures into degrees Fahrenheit: (a) 21°°C(b) 37.5°C(c) 74°C
Solution:
(a) A change of 1°C = a change of 1.8°F:
21°C = 20°C + 1°C
From Table 9.5, 20°C = 68°F
� 21°C = 68 + 1.8 = 69.8°F
(b) 37.5 is an average of 35 and 40:
35°C = 95°F and 40°C = 104°F
The average of 95 and 104 is 99.5
� 37.5°C = 99.5°F
(c)
74°C = 75°C – 1°C
= 167°F – 1.8°F
= 165.2°F

95Units and their conversion 9
Exercise 9.1
The solutions to Exercise 9.1 can be found in Appendix 2.
1. Convert: (a) 86 mm into metres
(b) 385 mm into metres
(c) 7.4 m into centimetres
(d) 3 ft 2 in into millimetres
(e) 6 yd into metres
(f) 14 in into metres.
2. Use two methods to convert the following units and compare the results:
(a) 24 ft into metres
(b) 9 m into feet.
3. Convert: (a) 0.070 kg into grams
(b) 25 500 kg into tonnes
(c) 815 g into ounces.
4. Convert: (a) 15.500 kg into pounds
(b) 250 kg into pounds
(c) 75 lb into kilograms.
5. Convert: (a) 12 550 mm2 into cm2
(b) 655 000 mm2 into m2
(c) 2.75 m2 into mm2
(d) 5.25 m2 into cm2.
6. Convert: (a) 95 450 mm3 into m3
(b) 9545 mm3 into cm3
(c) 0.00094 m3 into mm3.
7. Convert: (a) 12 560 ml into litres
(b) 6.67 litres into centilitres
(c) 350 cl into litres
(d) 0.0053 m3 into litres
(e) 25 litres into gallons.
8. Convert 37°C and 61.5°C to degrees Fahrenheit.
Answers to Exercise 9.1
1. (a) 0.086 m; (b) 0.385 m; (c) 740 cm; (d) 965.2 mm; (e) 5.4864 m; (f) 0.3556 m
2. (a) 7.25 m (using graph); 7.315 (using conversion factor)
(b) 29 feet 9 inches (using graph); 29 feet 6.3 inches (using conversion factors)

96 9 Units and their conversion
3. (a) 70 g; (b) 25.5 tonnes; (c) 28.745 oz
4. (a) 34.172 lb; (b) 551.155 lb; (c) 34.019 kg
5. (a) 125.5 cm2; (b) 0.655 m2; (c) 2 750 000 mm2; (d) 52 500 cm2
6. (a) 9.545 × 10⁻⁵ m3; (b) 9.545 cm3; (c) 940 000 mm3
7. (a) 12.560 litres; (b) 667 cl; (c) 3.5 litres; (d) 5.3 litres; (e) 5.5 gallons
8. 98.6°°F and 142.7°F

C H A P T E R10Geometry
Learning outcomes:
(a) Identify the different types of angles, triangles and quadrilaterals
(b) Find angles in triangles, quadrilaterals and other geometrical constructions
(c) Use Pythagoras’ theorem to determine diagonals in quadrilaterals and sides of right-angled triangles
(d) Calculate the circumference of a circle
10.1 Angles
When two straight lines meet at a point an angle is formed, as shown in Figure 10.1. There are two ways in which an angle can be denoted, i.e. either �CAB or �A.
Angle
A B
C
Figure 10.1
The size of an angle depends on the amount of rotation between two straight lines, as illustrated in Figure 10.2. Angles are usually measured in degrees, but they can also be measured in radians. A degree, defi ned
as of a complete revolution, is easier to understand and use as 1 360

98 10 Geometry
compared to the radian. Figure 10.2 shows that the rotation of line AB
makes (a) revolution or 90°, (b) revolution or 180°, (c) revolution or
270° and (d) a complete revolution or 360°.
180º90º
(a) (b)
(c)(d)
C
A
A B
B C
CC
A A BB
Figure 10.2
For accurate measurement of an angle a degree is further divided into minutes and seconds. There are 60 minutes in a degree and 60 seconds in a minute. This method is known as the sexagesimal system:
60 minutes (60) = 1 degree
60 seconds (60) = 1 minute (1)
The radian is also used as a unit for measuring angles. The following conversion factors may be used to convert degrees into radians and vice versa.
1 radian = 57.30° (correct to 2 d.p.)
� radians = 180° ( � = 3.14159; correct to 5 d.p.)
2� radians = 360°
Example 10.1Convert: (a) 20°1525 into degrees (decimal measure)
(b) 32.66° into degrees, minutes and seconds.
(c) 60°2545 into radians.
Solution:
(a) The conversion of 1525 into degree involves two steps. The fi rst step is to change 1525 into seconds, and the second to convert seconds into a degree. This is added to 20° to get the fi nal answer.

99Geometry 101525 = 15 × 60 + 25 (1 minute = 60 seconds)
= 900 + 25 = 925 seconds
= degree = 0.257°
20°1525 = 20 + 0.257 = 20.257°
(b) In 32.66°, 32° need no conversion but 0.66° will be converted into minutes and seconds.
0.66° = 0.66 × 60 minutes = 39.6
0.6 = 0.6 × 60 seconds = 36
Hence 32.66° = 32°39′36″
(c)
60°2545 = 60.4292°
1 degree = radians
60.4292° = × 60.4292 = 1.0547 radians
10.1.1 Types of angle
Some of the main types of angle are:
• acute angle: an angle less than 90° (Figure 10.1)
• right angle: an angle equal to 90° (Figure 10.2a)
• obtuse angle: an angle that is greater than 90° but less than 180° (Figure 10.3a)
• complementary angles: angles whose sum is 90°. For example, 40° and 50° are complementary angles as 40° + 50° = 90°.
• supplementary angles: angles whose sum is 180°. For example, 110° and 70° are supplementary angles as 110° + 70° = 180°.
• adjacent angles: angles on a straight line whose sum is 180°. In Figure 10.3b �A and �B are adjacent angles.
Obtuse angle
Lines jk and lm are parallel
(a) (b) (c)
AB E
F
GH
AB
CD
j k
l m
Figure 10.3
925 3600
It
180 It
180

100 10 Geometry
• alternate angles: in Figure 10.3c, �D and �F, and �C and �E are alternate angles. Alternate angles are equal: �D = �F and �C = �E
• corresponding angles: in Figure 10.3c, �B and �F; �A and �E; �C and �G; �D and �H are corresponding angles. Like alternate angles, corresponding angles are also equal. �B = �F, �A = �E, �C = �G, �D = �H
• opposite angles: there are four pairs of opposite angles (also called vertically opposite angles) in Figure 10.3c. For example, �A and �C are opposite and equal: �A = �C, �B = �D, �E = �G, �F = �H.
Example 10.2Calculate angles c, d and e shown in Figure 10.4. Line LM is parallel to line NP.
M
P
L
N
d f = 70º
a = 120º
c
b
e
g
Figure 10.4
Solution:
LM is a straight line, therefore �a + �b = 180°
�b = 180° – �a
= 180° – 120° = 60°
As �b and �d are corresponding angles, �b = �d
Therefore �d = 60°
�g = �f, as these are alternate angles
�g = 70°
Now �g + �e = 180°
or �e = 180° – �g
Hence �e = 180° – 70° = 110°
∠c = �a = 120° (angles c and a are opposite and equal)
10.2 Polygons
Figures bounded by straight lines are called plane fi gures. Plane fi gures have only two dimensions, i.e. length and width. Shapes or fi gures made

101Geometry 10by straight lines are also called polygons, some of which are: triangles, rectangles, squares, trapeziums and pentagons.
10.3 Triangles
Triangles are plane fi gures bounded by three straight lines. A triangle is a very stable geometric shape and it is not possible to distort it without changing the length of one or more sides. Roof trusses and trussed rafters are used in the construction of roofs to dispose of rainwater and snow quickly. Their triangular shape also provides stability, which is one of the important requirements of a roof structure. Triangles also fi nd use in the construction of multi-storey steel frames. Triangulation, a process used to convert the rectangular grids of steel frames into triangles, is necessary to make the frames and hence the buildings more stable.
10.3.1 Types of triangle (�)
The conventional method of denoting the angles of a triangle is to use capital letters, e.g. A, B, C, P, R, etc. The sides are given small letters; side a opposite angle A, side b opposite angle B and so on, as illustrated in Figure 10.5.
A
B Ca
c b
A + B + C = 180º
Figure 10.5
Figure 10.5 shows a triangle which has each of its angles as less than 90°. This type of triangle is known as an acute angled triangle. Other types of triangles are described below:
• obtuse angled triangle: has one angle more than 90° (Figure 10.6a)
• right-angled triangle: one of the angles is equal to 90° (Figure 10.6b)
• equilateral triangle: has equal sides (Figure 10.6c). Because of the equal sides the angles are equal as well, each being 60°.
• isosceles triangle: has two sides and two equal angles (Figure 10.6d).
• scalene triangle: has all angles of different magnitude and all sides of different length. Acute angled, obtuse angled and right-angled triangles can be scalene triangles as well.

102 10 Geometry
A small squarerepresents a
90º angle
(b) Right-angled triangle(a) Obtuse angled triangle
120º
(c) Equilateral triangle
60º 60º
60º
(d) Isosceles triangle
Side AB = Side AC
B C
A
B = C
Figure 10.6
10.3.2 Theorem of Pythagoras
In a right-angled triangle (Figure 10.6b) the longest side, known as the hypotenuse, is opposite the right angle.
3 cm
3 cm
5 cm
5 cm 4 cm4
cm
Each squareis 1 cm × 1 cm
(b)(a)
B
A
C
Figure 10.7
Figure 10.7a shows a right-angled triangle with sides 3 cm and 4 cm long. Side AC, the hypotenuse, is 5 cm long, which can be proved

103Geometry 10mathematically by drawing 1 cm × 1 cm squares on all sides of the triangle, as illustrated in Figure 10.7b.
Number of squares on side AB = 16
= 42 = (side AB)2 or (AB)2
Number of squares on side BC = 9
= 32 = (BC)2
Number of squares on side AC = 25 = 52 or (AC)2
The area of each square is 1 cm2, therefore the total area of the large square on any side is equal to the number of squares drawn on that side. As all squares are equal, we can say that:
Area of squares on side AC = Sum of area of squares on sides AB and BC
or AC2 = AB2 + BC2 (1)
Take the square root of both sides
AC =
=
=
= = 5 cm
Equation 1 can be used to determine any side of a right-angled triangle if the other two are known.
Example 10.3Figure 10.8 shows three right-angled triangles. For each triangle, fi nd the unknown side.
4 cm
4 cm 6
cm
(a)
B C
A
3 cm
(b)
B C
A
6 cm
(c)
CB
A
10 cm
Figure 10.8
J(ABj+(BCj
J(4)' +(3)'
,J16+9
.J25

104 10 Geometry
Solution:
Use Pythagoras’ Theorem for each triangle.
(a) In �ABC, AC = BC = 4 cm. AB is the hypotenuse:
AB2 = BC2 + AC2
= 42 + 42
= 16 + 16 = 32
Taking the square root of both sides
AB = = 5.657 cm
(b) In �ABC, AB = 6 cm and BC = 3 cm. AB is the hypotenuse:
AB2 = BC2 + AC2
Side AC is to be determined; transpose the above equation to make AC2 the subject:
AB2 – BC2 = AC2 or AC2 = AB2 – BC2
AC2 = 62 – 32
= 36 – 9 = 27AC = = 5.196 cm
(c) Given: AB = 6 cm, AC = 10 cm. AC is the hypotenuse:
AC2 = AB2 + BC2
Transpose the above equation to make BC the subject
AC2 – AB2 = BC2
or BC2 = AC2 – AB2
=102 – 62
= 64
BC = = 8 cm
10.3.3 Similar triangles
Two triangles are similar if the angles of one triangle are equal to the angles of the other triangle. Similar triangles are different in size but have the same shape (see Figure 10.9) and their sides are proportional.
In similar triangles, one of the following conditions will apply:
• Two angles in one triangle are equal to two angles in the other triangle.
• Two sides of one triangle are proportional to two sides of the other triangle and the angles included between the two sides are equal.
• The three sides of one triangle are proportional to the three sides of the other triangle.
AB BC CA -=-=-DE EF FD
CA
CA
CA

105Geometry 10
Example 10.4Figure 10.10 shows �ADE with a line BC forming another triangle. If line BC is parallel to line DE and the sides of the triangle are as shown, show that:
(a) Triangles ABC and ADE are similar.
(b) Calculate AD and DE.
D
A
E
B C
5 cm
2.4 cm
3 cm
4 cm
Figure 10.10
Solution:
(a) Line BC is parallel to line DE, therefore:
�ABC = �BDE, and �ACB = �CED
�A is common to both triangles.
Hence �ABC and �ADE are similar (three angles equal)
(b) As �ABC and �ADE are similar, their sides should be proportional:
45º 72º
B C
A
45º 72º
E F
D
Figure 10.9
BC AC -=-DE AE

106 10 Geometry
(AE = 3 + 2.4 = 5.4)
Transposing, 3DE = 4 × 5.4
�DE = = 7.2 cm
Transposing, 3AD = 5 × 5.4
or AD = = 9.0 cm
Example 10.5Figure 10.11 shows a Fink roof truss. Find the length of members AB and BE.
A
2.0 m
3.464 m
30º 60º
B EC D
Figure 10.11
Solution:
From point A draw a vertical line to meet BE at point D. As the truss is symmetrical, BE = 2BD. We will calculate BD and multiply it by 2 to get BE.
Consider �ABD and �ACD. Angle ADB is a right angle and common to both triangles.
�BAD = 180° – 90° – 30° = 60°
�CAD = 180° – 90° – 60° = 30°
�ACD is a right-angled triangle
AC2 = AD2 + CD2
=3.4642 + 22
= 16
AC = = 4 m
�ABD and �ACD are similar as the three angles are equal (Figure 10.12). Therefore, their sides are proportional.
4 3 - = -DE 5.4
4 x 5.4 3
AB AC -=-AD AE
5 3 -=-AD 5.4
5 x 5.4 3
AE

107Geometry 10A
B D30º
C
A D30º
Figure 10.12
2BD = 3.464 × 3.464
BD = (3.464 × 3.464) ÷ 2 = 6.0 m
BE = 2 × BD = 2 × 6.0 = 12 m
Consider �ABD and �ACD again:
2AB = 3.464 × 4
AB = (3.464 × 4) ÷ 2 = 6.928 m
10.4 Quadrilaterals
Figures bounded by four straight lines are called quadrilaterals. Rectangle, square, trapezium, parallelogram and kite are called special quadrilaterals (Figure 10.13). A line joining the opposite corners of a quadrilateral is called a diagonal. There are two diagonals in a quadrilateral, and depending on the shape of the quadrilateral they may or may not be equal. A diagonal divides a quadrilateral into two triangles, so the sum of the internal angles of a quadrilateral is 360°.
In a rectangle each angle is equal to 90° and the opposite sides are equal (Figure 10.13a).
Side AB = side DC, and side DA = side CB.
As explained earlier, lines DB and CA are called diagonals, which can be calculated by using Pythagoras’ Theorem:
CA2 = AB2 + BC2 (�DAB and �CAB are right-angled triangles)
DB2 = DA2 + AB2
AD BD -=-CD AD
3.464 BD --=--
2 3.464
AB AD -=-CA CD
AB 3.464 -=--4 2

108 10 Geometry
A square (Figure 10.13b) is a special form of rectangle in which all four sides are equal. Other properties are similar to those of a rectangle.
A quadrilateral with its opposite sides parallel and equal is called a parallelogram (Figure 10.13c). The sum of all internal angles is 360°°, but only the opposite angles are equal. The rectangle is a special form of parallelogram with all internal angles equal. The diagonals in a parallelogram are not equal, and unlike the rectangle cannot be determined using Pythagoras’ Theorem.
Side EH is parallel and equal to side FG.
Side EF is parallel and equal to side HG.
A rhombus is basically a parallelogram in which all four sides are equal (Figure 10.13d). The diagonals are not equal, but they bisect each other at right angles.
A kite is a quadrilateral that has two pairs of equal sides. The equal sides are adjacent to each other, as shown in Figure 10.13e.
Side NP = side NS
Side RP = side RS
diagonal
(a) Rectangle (b) Square (c) Parallelogram
A
D
B
C D
A
C
B
F
E
G
H
F
(d) Rhombus
(f) Trapezium
(e) Kite
E H R
N
GP S
X
Z Y
W
Figure 10.13

109Geometry 10A trapezium (Figure 10.13f) is a quadrilateral with a pair of parallel sides which are not of equal length:
Sides WX and ZY are parallel but unequal
Example 10.6The size of a rectangle is 12 cm × 9 cm. Calculate the length of each diagonal.
Solution:
Figure 10.14 shows the dimensions of the rectangle.
9 cm
A
D
B
C
12 cm
Figure 10.14
Use Pythagoras’ Theorem to determine the length of one diagonal.
AC = BD =
= = 15 cm
Example 10.7Figure 10.15 shows a parallelogram EFGH. Calculate angles a, b, c and d.
E
ab
c
d
30º 130º
F
H G
Figure 10.15
Solution:
In a parallelogram the opposite angles are equal and the sum of the internal angles is equal to 360°.
�a = �FGH = 130°
�EFG = �EHG =
= 50°
~12' + 9'
../225
360· -130· -130· 2

110 10 Geometry
�d = �b = 50° – 30° = 20°
In �HFG, �c = 180° – 130° – 20° = 30°
10.5 Sum of the angles in a polygon
The sum of the angles in a polygon can be determined using a number of techniques, but in this section only two of them are described.
The fi rst method involves the splitting of the given polygon into triangles. The sum of the angles will be equal to the number of triangles formed multiplied by 180°. This is shown in Figure 10.16.
3 (triangles) × 180º = 540º
(a) Pentagon
4 (triangles) × 180º = 720º
(b) Hexagon
Figure 10.16
The second method involves the use of the formula:
The sum of the internal angles of a polygon = (2n – 4) right angles where n is the number of the sides of the polygon
Table 10.1 shows some of the calculations
Table 10.1
Polygon Number of sides
Number of right angles (2n – 4)
Sum of the internal angles
Triangle 3 2 × 3 – 4 = 2 2 × 90 = 180°°
Quadrilaterals (rectangle, square, etc.)
4 2 × 4 – 4 = 4 4 × 90 = 360°
Pentagon 5 2 × 5 – 4 = 6 6 × 90 = 540°
Hexagon 6 2 × 6 – 4 = 8 8 × 90 = 720°
Heptagon 7 2 × 7 – 4 = 10 10 × 90 = 900°
Octagon 8 2 × 8 – 4 = 12 12 × 90 = 1080°
Nonagon 9 2 × 9 – 4 = 14 14 × 90 = 1260°
Decagon 10 2 × 10 – 4 = 16 16 × 90 = 1440°

111Geometry 10
10.6 The circle
If we take a compass, open it by a certain amount (OA) and draw a curved line, the result is a shape as shown in Figure 10.17a. The plane fi gure enclosed by the curved line is called a circle. Line OA is called the radius (r) of the circle. Every point on the curved line is equidistant from the centre of the circle. In Figure 10.17b, OA, OB and OC are the radii (plural of radius) of the circle and are equal.
Circumference
(c)
Diameter
(b)
A B
RadiusA O
C
B(a)
A O
Figure 10.17
The length of the curved line (Figure 10.17c) is called the circumference (c). A straight line that passes through the centre with its ends touching the circumference is called a diameter (d), e.g. line AB in Figure 10.17c is a diameter.
d = 2 × radiusor d = 2r
A diameter divides the circle into two equal parts, each known as a semicircle. The ratio of the circumference to the diameter of a circle is a constant and known by the Greek letter � (pi):
= �, or = �
� c = �d
Circumference c Diameter d

112 10 Geometry
Also:
c = � × 2r = 2�r (d = 2r)
� = 3.14159265 (to 8 d.p.) = 3.142 (to 3 d.p.)
Any straight line from circumference to circumference, such as line EF in Figure 10.18a, is called a chord. A chord divides a circle into two segments. The smaller segment is called the minor segment and the larger one is called the major segment.
The plane fi gure contained by the two radii and an arc of the circumference is called a sector. If the angle contained by the two radii is less than 180°, the sector is called the minor sector, as shown in Figure 10.18b.
Major segment
Minor segment
E F
(a)
Major sector
Minor sector
yº
(b)
Figure 10.18
Area of minor sector = area of the circle ×
Example 10.8Calculate the circumference of a circle if its radius is 20 cm.
Solution:
Radius r = 20 cm
The circumference of the given circle = 2�r = 2� × 20 = 125.66 cm
Exercise 10.1
The solutions to Exercise 10.1 can be found in Appendix 2.
1. Convert: (a) 72°3851 into degrees (decimal measure)
(b) 63.88° into degrees, minutes and seconds.
(c) 30°4850 into radians.
y. 360·

113Geometry 10 2. Calculate angles x, y and z shown in Figure 10.19. Line AB is parallel
to line CD.
3. For each of the right-angled triangles shown in Figure 10.20, fi nd the unknown side.
6 m
7 m
A
C
B
5.5 m
10.5 m
9.4 m
11.8 m
Figure 10.20
4. In Figure 10.21, line XY is parallel to line PN and creates another triangle, i.e. � MRQ:
(a) Show that triangles MNP and MRQ are similar.
(b) Calculate the lengths of PQ and RN.
R
M
X Q
P
N
Y
80 m
70 m
40 m
110 m
Figure 10.21
5. Find the lengths of all the members of the King Post roof truss shown in Figure 10.22.
D
C
B
A
107º
z
76º
x
y
Figure 10.19

114 10 Geometry
30º30º
30º 30º
B
A
D
E
C
F
6 m
Figure 10.22
6. A building site has two roads at right-angles to each other, each forming a boundary to the site. If the boundaries are 26 m and 38 m long, and the site is triangular, what is the length of the third boundary?
7. A parallelogram is shown in Figure 10.23. Find the angles A, B and C.
B
C D
A
113º
Figure 10.23
8. Calculate the circumference of a circle having a radius of 5.6 m.
Answers to Exercise 10.1
1. (a) 72.6475°; (b) 63°5248; (c) 0.5378 radians
2. �x = 104°, �y = 107°, �z = 73°
3. A = 9.220 m, B = 8.944 m, C = 7.133 m
4. (a) �M is common to both �s; �Q = �P; �R = �N; ��s are similar.
(b) PQ = 15 m and RN = 26.25 m
5. AB = BC = CD = DE = DF = BF = CF = 3.0 m; AF = FE = 5.196 m
6. 46.043 m
7. �B = 113°, �A = 67°, �C = 67°
8. 35.186 m

C H A P T E R11Areas (1)
Learning outcomes:
(a) Calculate the areas of triangles, quadrilaterals and circles
(b) Identify and use the correct units
(c) Solve practical problems involving area calculation
11.1 Introduction
Area is defi ned as the amount of space taken up by a two-dimensional fi gure. The geometrical properties of triangles, quadrilaterals and circles have been explained in Chapter 10. A summary of the formulae used in calculating the areas and other properties of these geometrical shapes is given in Table 11.1. The units of area used in metric systems are: mm2, cm2, m2 and km2.
Table 11.1
Shape Area and other properties
Triangle
b
h
Rectangle
l
bArea = l × bPerimeter = 2l + 2b = 2(l + b)
(Continued)
Area=bxh 2

116 11 Areas (1)
Shape Area and other properties
l
l
Square
Area = l × l = l2
Perimeter = 4l
Trapezium
a
b
h Area = (a + b) × h
l
h
Parallelogram
Area = l × h
Circle
Or
Area = �r2
Circumference = 2�r
11.2 Area of triangles
There are many techniques and formulae that can be used to calculate the area of triangles. In this section we consider the triangles with known measurements of the base and the perpendicular height, or where the height can be calculated easily.
Table 11.1 (Continued)

117Areas (1) 11Example 11.1Find the area of the triangles shown in Figure 11.1.
(a)
6 cm
8 cm
(b)
3 cm
6 cm
5 cm 4 cm
A
D
B C C
D
E
Figure 11.1
Solution:
(a)
Area of triangle ABC =
Base BC = 8 cm
We need to calculate height AD, which has not been given. As sides AB and AC are equal, BD must be equal to DC. Therefore, BD = DC = 4 cm. Now we can use Pythagoras’ Theorem to calculate height AD:
(AD)2 = (AB)2 – (BD)2
= 62 – 42
= 36 – 16 = 20
Therefore
AD = = 4.47 cm
Area of triangle ABC = = 17.88 cm2
(b)
Area of triangle DEF =
= = 6 cm2
11.3 Area of quadrilaterals
A plane fi gure bounded by four straight lines is called a quadrilateral. The calculation of area of some of the quadrilaterals is explained in this section.
base x height 2
8 x 4.47 2
base x height 2
3x4
2
base x height
2
8 x 4.47 2
base x height
2
3x4
2
4.47

118 11 Areas (1)
Example 11.2Find the area of the shapes shown in Figure 11.2.
15 cm
(a)
D C
A B
6 cm
9 cm
a = 8 cm
b = 6 cm
(b)
(d)
(c)
H G
J
ML
KE F
6 cm 6 cm
5 cm
h = 4 cm
Figure 11.2
Solution:
(a)
Area of a rectangle = length × width
Length = 15 cm, and width = 6 cm
Area of rectangle ABCD = 15 × 6 = 90 cm2
(b)
In a square, the length is equal to the width. Therefore:
Area of a square = length × length (or length2)
Area of square EFGH = (6)2 = 36 cm2
(c)
Area of trapezium JKLM = (a + b) × h
= (8 + 6) × 4
= × 14 × 4 = 28 cm2
(d)
Area of a parallelogram = length × height
Length = 9 cm, and height = 5 cm
Area of the parallelogram = 9 × 5 = 45 cm2
11.4 Area of circles
Some of the important properties of circles are explained in Chapter 10. The following formula is used to calculate the area of a circle:
Area of a circle = �r2, where r is the radius of the circle.
1 2 1
-
2 1 2

119Areas (1) 11Example 11.3Figure 11.3 shows a circle having a diameter of 4 m. Find:
(a) the area of the circle(b) the area of the major and minor sectors.
Diameter = 4 m
280º
80º
OMajor sector
Minor sector
Figure 11.3
Solution:
Radius (r) of the circle = = = 2 m
(a)
Area of the circle = �r2 = � × 22 = 12.57 m2
(b)
Area of the major sector = �r2 ×
= � × 22 × = 9.774 m2
Area of the minor sector = �r2 ×
= � × 22 × = 2.793 m2
Example 11.4Figure 11.4 shows a circular concrete path (shaded) around a lawn.Find the area of the path.
Concrete path
O B
A
10 m
12 m
Figure 11.4
Diameter 4 -
2 2
2800
3600
280 360
800
3600
80 360

120 11 Areas (1)
Solution:
Area of the path = area of the bigger circle – area of the smaller circle
= � × (12)2 – � × (10)2
= 452.39 – 314.16 = 138.23 m2
11.5 Application of area to practical problems
The concepts learned from Sections 11.2–11.4 may be used to solve many practical problems, some of which are dealt with in this section.
Example 11.5Figure 11.5 shows the cross-section of a steel girder. Calculate its area in cm2 and mm2.
12 cm
2 cm
1.0 cm
12 cm
1.5 cm
25 cm
Figure 11.5
Solution:
The steel section shown in Figure 11.5 can be divided into three parts as shown in Figure 11.6
12 cm 1 cm
A
B
2 cm
12 cm
1.5 cm
C
25 cm
Figure 11.6

121Areas (1) 11Area of the steel section = Area A + Area B + Area C
= 12 × 1 + 25 × 2 + 12 × 1.5
= 12 + 50 + 18
= 80 cm2
= 80 × 100 = 8000 mm2 (1 cm2 = 100 mm2)
(Note: where the cross-section of a component is given, the area is also called the cross-sectional area.)
Example 11.6The fl oor of a kitchen, measuring 3.20 m × 3.00 m, is to be fi nished with marble-effect fl oor tiles, each measuring 330 mm × 330 mm. If there are nine tiles in a pack, calculate the number of packs required. Allow 10% for wastage.
Solution:
Area of the fl oor = 3.20 × 3.00 = 9.60 m2
Area of one tile = 330 mm × 330 mm
= 0.33 m × 0.33 m = 0.1089 m2
As there are nine tiles in a pack, each pack will cover 0.1089 × 9 or 0.98 m2 of the fl oor.
Number of packs required =
= = 9.8
Wastage = 10% of 9.8 = 9.8 × = 0.98
Number of packs required (including 10% for wastage) = 9.8 + 0.98 = 10.78, so 11.
Example 11.7The fl oor of a room measuring 6.0 m × 4.2 m is to be covered with laminate fl ooring. If one pack covers an area of 2.106 m2, calculate the number of packs required. Consider wastage to be 5%.
Solution:
Area of the fl oor = 6.0 m × 4.2 m
= 25.20 m2
Number of packs required =
= = 11.97
Wastage of 5% = × 11.97 = 0.65 100
Area of the floor
Area oftiles in one pack
9.6 0.98
10 100
Floor area
Area covered by one pack
25.2 2.106

122 11 Areas (1)
Number of packs required = 11.97 + 0.6
= 12.57, so 13
Example 11.8The 3D view of a room is shown in Figure 11.7. The internal wall and ceiling surfaces require a coat of emulsion paint. Calculate their areas in m2. Given: size of the door = 2 m × 1 m wide; height of the skirting board = 100 mm
Wall 3
Wall 2Wall 1
Wall 4
Window
Door
4 m
5 m
2.9 m
1.2 m1.2 m
Figure 11.7
Solution:
The area of each wall will be calculated separately and added later to fi nd the total wall area. The areas of the window, door and skirting board have to be excluded.
Area of wall 1 (see Figure 11.8a) = length × height
= 4.0 × (2.9 – 0.1)
= 4.0 × 2.8 = 11.2 m2
Wall 1Wall 3
4.0 m
(a)
Skirting board0.1 m
2.9 m
4.0 m
(b)
0.1 m
1.5 m 1.5 m1.0 m
2.9 m
2.0 mDoor
Figure 11.8

123Areas (1) 11Area of wall 2 = length × height
= 5.0 × (2.9 – 0.1)
= 5.0 × 2.8 = 14.0 m2
Area of wall 3 = Gross area of the wall – Area of the door – Area of the skirting board
= 4.0 × 2.9 – 2.0 × 1.0 – (1.5 × 0.1 + 1.5 × 0.1) (see Figure 11.8b)
= 11.6 – 2.0 – 0.3 = 9.3 m2
The details of wall 4 are shown in Figure 11.9.
Wall 4
5.0 m
Window
1.2 m
Skirting board0.1 m
2.9 m1.2 m
Figure 11.9
Area of wall 4 = gross area of the wall – area of the window – area of the skirting board
= 5.0 × (2.9 – 0.1) – 1.2 × 1.2
= 5.0 × (2.8) – 1.44
= 12.56 m2
Total wall area = 11.2 + 14.0 + 9.3 + 12.56
= 47.06 m2
Area of the ceiling = 5.0 × 4.0 = 20 m2
11.5.1 Cavity walls
The cavity wall of a domestic building consists of brickwork as outer leaf and blockwork as inner leaf, with the cavity between the two fi lled with Rockwool. The outer leaf of brickwork is 103 mm thick (also called half-brick-thick wall). The inner leaf of concrete blocks is 100 mm thick. The measurements of bricks and concrete blocks used in the area calculations are shown in Figure 11.10. The number of bricks and concrete blocks per m2 are 60 and 10, respectively.

124 11 Areas (1)
Example 11.9A cavity wall 5.4 m long and 2.7 m high (Figure 11.10) is to be constructed using facing bricks and aerated concrete blocks. Find the number of bricks and blocks required. Allow 5% for wastage.
Aerated concrete blocks440 mm long × 215 mm high
(c)(b)
Bricks215 mm long × 65 mm high
(a)
10 mm thick mortarjoints
5.4 m
2.7 m
Brick workCavity
Block work
Figure 11.10
Solution:
Size of a brick without mortar joints = 215 × 102.5 × 65 mm
Size of a brick with mortar joints = 225 × 102.5 × 75 mm
Size of a block without mortar joints = 440 × 215 ×100 mm
Size of a block with mortar joints = 450 × 225 × 100 mm
Area of a brick = 225 × 75 = 16 875 mm2
Area of a block = 450 × 225 = 101 250 mm2
We must have compatible units of all components. Therefore, change the length and the height of the wall into millimetres.
Length of the wall = 5.4 m = 5400 mm
Height of the wall = 2.7 m = 2700 mm
Area of the wall = 5400 × 2700 = 14 580 000 mm2

125Areas (1) 11Number of bricks required =
= = 864
Wastage of 5% = 864 × = 43.2, say 44
Total number of bricks = 864 + 44 = 908
Number of blocks required = = 144
Wastage of 5% = 144 × = 7.2, say 8
Total number of blocks = 144 + 8 = 152
Exercise 11.1
The solutions to Exercise 11.1 can be found in Appendix 2.
1. Find the area of the shapes shown in Figure 11.11.
A
D C
B
A
C
8 cm
12 cm12 cm
B E
D
FG
6 cm
10 cm
(a)
8 cm
(b)
11 cm
(c)
7.5
cm
a = 12 cm
(e)
11 cm
(f)
b = 8 cm
E
H G
F
7 cm
(d)
7 cm
h =
6 c
m
5.5
cm
Figure 11.11
5
100
5
100
Area of the wall Area of one brick
14580000 16875
14580000 101250

126 11 Areas (1)
2. Figure 11.12 shows a circle having a diameter of 3.5 m. Find:
(a) the area of the circle
(b) the area of the major and minor sectors.
3. Figure 11.13 shows a circular concrete path (shaded) around a lawn. Find the area of the path.
15 m
16 m
Concrete path
Figure 11.13
4. A concrete path is to be provided around a rectangular garden measuring 15 m in length and 11 m in width. Find the area of the path if it is 1.2 m wide.
5. Figure 11.14 shows the cross-section of a steel girder. Calculate its area in cm2 and mm2.
10 cm
1.5cm
1.0
cm
12 cm
1.5 cm
20 c
m
Figure 11.14
6. The fl oor of a kitchen, measuring 3.50 m × 3.00 m, is to be fi nished with marble effect fl oor tiles each measuring 330 mm × 330 mm. If there are nine tiles in a pack, calculate the number of packs required. Allow 10% for wastage.
Diameter = 3.5 m
115º
O
Major sector
Minor sector
Figure 11.12

127Areas (1) 11 7. Find the number of 200 × 100 × 50 mm concrete blocks required for
paving the drive shown in Figure 11.15. Allow 10% for cutting and wastage.
House
Drive
r = 4.0 m
Circulararc
9.0 m
8.0
m
Figure 11.15
8. The fl oor of a room, measuring 5.0 m × 4.0 m is to be covered with laminate fl ooring. If one pack covers an area of 2.106 m2, calculate the number of packs required. Add 10% for wastage.
9. The 3D view of a room is shown in Figure 11.16. The internal wall and ceiling surfaces require a coat of emulsion paint. Calculate their areas in m2. Given: size of the door = 2 m × 1 m wide; height of the skirting board = 100 mm.
100 mm highskirting board
4.8 m 3.8 m
2.8 mDoor
1.8 m
1.2
m
Figure 11.16
10. Calculate the number of rolls of wallpaper required for the room shown in Figure 11.16. Each roll is 52 cm wide and 10.0 m long. Allow an extra 15% for wastage.

128 11 Areas (1)
11. A cavity wall 5.0 m long and 2.4 m high is to be constructed using facing bricks and aerated concrete blocks. Find the number of bricks and blocks required. Allow 5% extra for wastage.
12. Figure 11.17 shows the gable end of a building. Calculate the number of bricks and aerated concrete blocks required for its construction. Allow an extra 5% for wastage.
Gable endcavity wall
Roof
9.4m
12 m
5.4
m
Figure 11.17
Answers to Exercise 11.1
1. (a) 24 cm2; (b) height = 11.31 cm; area = 45.255 cm2; (c) 82.5 cm2; (d) 49 cm2; (e) 60 cm2; (f) 60.5 cm2
2. Area (circle) = 9.621 m2; area (major sector) = 6.548 m2; area (minor sector) = 3.073 m2
3. 97.389 m2
4. 68.16 m2
5. 58 cm2 or 5800 mm2
6. 12 packs
7. 3269 blocks
8. 11 packs
9. Wall area = 42.38 m2, ceiling area = 18.24 m2
10. 10 rolls
11. 747 bricks, 125 blocks
12. 5526 bricks, 921 blocks

C H A P T E R12Volumes (1)
Learning outcomes:
(a) Identify cubes, cuboids, rectangular and triangular prisms, pyramids and cones
(b) Perform calculations to calculate the volumes of the above solids
(c) Perform calculations to determine the volume of concrete required for constructing different elements of a building
(d) Calculate the volume of cement, sand and gravel required to prepare a concrete mix
12.1 Introduction
Volume may be defi ned as the space in a three-dimensional object. This is different from the area, which is applicable to two-dimensional shapes. The most basic shapes in volume calculations are the cube and the cuboid. A cube is a three-dimensional fi gure which has six square faces. This means that the length, width and height are equal in a cube. In a cuboid, at least one of the sides will be different from the others. A typical example of a cuboid is an aerated concrete block.
To understand the concept of volume, divide a cuboid into smaller units, as shown in Figure 12.1. Each small unit, a cube, measures 1 cm × 1 cm × 1 cm.
Volume of a cuboid = length × width × height
or Volume, V = l × w × h
Volume of the unit cube = 1 cm × 1 cm × 1 cm
= 1 cm3
In Figure 12.1a there are 18 unit cubes. Therefore:
Volume of the cuboid = 1 cm3 × 18 = 18 cm3
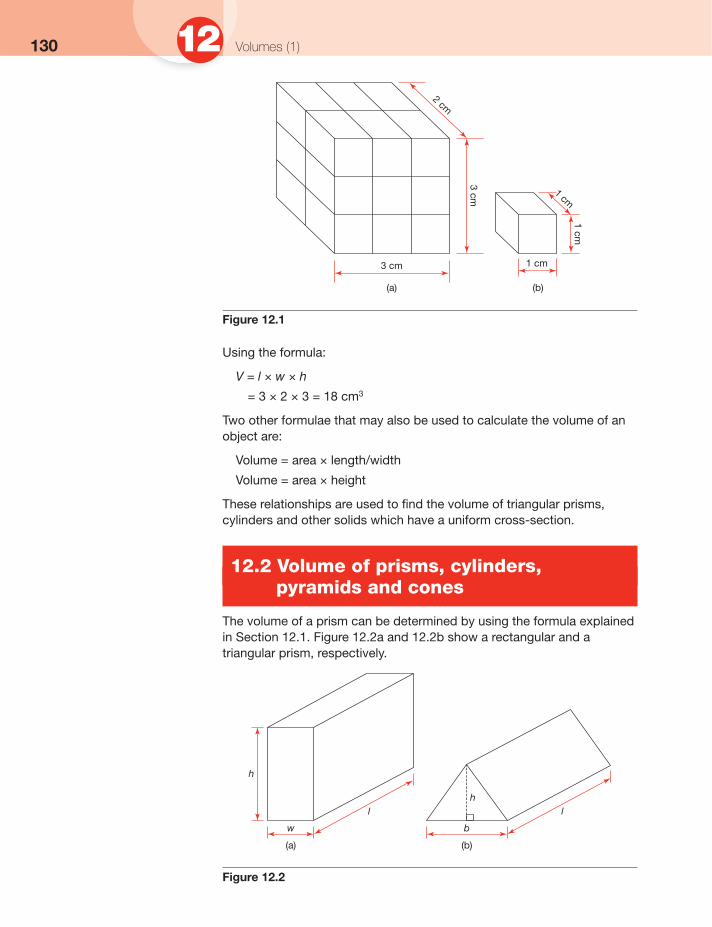
130 12 Volumes (1)
Using the formula:
V = l × w × h
= 3 × 2 × 3 = 18 cm3
Two other formulae that may also be used to calculate the volume of an object are:
Volume = area × length/width
Volume = area × height
These relationships are used to fi nd the volume of triangular prisms, cylinders and other solids which have a uniform cross-section.
12.2 Volume of prisms, cylinders, pyramids and cones
The volume of a prism can be determined by using the formula explained in Section 12.1. Figure 12.2a and 12.2b show a rectangular and a triangular prism, respectively.
(a)
w
h
l l
(b)
b
h
Figure 12.2
3 cm
(a)
1 cm
(b)
2 cm
3 cm 1 cm
1 cm
Figure 12.1

131Volumes (1) 12Volume of a rectangular prism = cross-sectional area × length
= (w × h) × l = lwh
Volume of a triangular prism = cross-sectional area × length
= × l
The plan view of a cylinder (Figure 12.3) is a circle; its area is given by the formula, A = �r2.
Volume of a cylinder = cross-sectional area × height
= �r2 × h = �r2h
A three-dimensional fi gure whose lateral sides are triangles is called a pyramid. The shape of a pyramid depends on the shape of its base (Figure 12.4). The base could be a rectangle, square, triangle or any other polygon, but in each case the top is a vertex. A regular pyramid has all its lateral sides equal.
Triangularbase
Square base
Rectangular base
Face
Vertex
Edge
(a) (b)
Vertex
Vertex
h
(c)
h
h
Figure 12.4
hhh
r
Figure 12.3
bxh 2

132 12 Volumes (1)
The calculation of the volume of a pyramid can be generalised as:
Volume of a pyramid = × area of the base × perpendicular height
Volume of a pyramid with rectangular base = (l × w)h
A cone and a pyramid are similar except that the base of a cone is a circle. Depending on the geometry of a cone it can be a right cone or an oblique cone:
right cone: the altitude intersects the base of the cone at its centre;
oblique cone: the altitude does not intersect the base of the cone at its centre.
Volume of a cone = × area of the base × perpendicular height
= �r2h
Example 12.1Find the volume of the solids shown in Figure 12.5.
Solution:
(a) Length = 15 cm; width = 10 cm; height = 20 cm
Volume of the cuboid = 15 × 10 × 20 = 3000 cm3
(b) Diameter of the cylinder = 200 mm
Radius r = = 100 mm
Volume of the cylinder = �r2 × h
= � (100)2 × 200
= 6 283 200 mm3 or 6.283 × 106 mm3
(c) Volume of triangular prism = cross-sectional area × length
= × 100
= 240 000 mm3
(d) The base of the pyramid is a square (0.3 × 0.3 m)
Volume of the pyramid = × area of the base × perpendicular height
= × (0.3 × 0.3) × 0.4
= 0.012 m3
(e) Diameter of the base = 12 cm
Radius of the base = = 6 cm
200 2
1 3 1 3
1 -3
1
3
1 -3
12 2
BOx60
2
1 -
3

133Volumes (1) 12
Volume of the cone = × area of the base × perpendicular height
= × �(6)2 × 15 = 565.5 cm3
200 mm
(b)(a)
(c)
200
mm
20 c
m15 cm10 cm
80 mm
(d)
(e)
0.3 m
100 mm60 m
m
0.4
m
0.3
m0.
3 m
12 cm
15 c
m
Figure 12.5
1 -
3 1
3

134 12 Volumes (1)
Example 12.2Figure 12.6 shows the measurements of the roof of a building. Calculate the volume of the loft space.
Sec
tion AGHD
AA D
G H
Side
ele
vatio
n
B C12 m
(c)
10 m
(b)
(a)
C
F
H
EA
G
B
4 m
D
10 m12 m
LOFT
Figure 12.6
Solution:
The shape of the roof is similar to a triangular prism. The cross-section of the roof is a triangle with a base of 10 m and perpendicular height of 4 m.
Volume of the loft space = area of �ABC × length
= × 12 = 240 m3
Example 12.3The dimensions of a concrete pipe are shown in Figure 12.7. Find the volume of concrete used in its manufacture.
10x4 2

135Volumes (1) 12
1.3 m1.2 m
I = 3 m
Figure 12.7
Solution:
The cross-section of the pipe is shown in Figure 12.7. To fi nd the volume of concrete used, calculate the cross-sectional area of the concrete and multiply this by the length.
Cross-sectional area of concrete pipe = �R2 – �r2
= � (1.3)2 – � (1.2)2
= 5.31 – 4.52 = 0.79 m3
Volume of concrete = cross-sectional area × length
= 0.79 × 3.0 m = 2.37 m3
Example 12.4The roof of a building has been designed as a pyramid (Figure 12.8). Find the volume of the space enclosed by the building.
Solution:
The building can be divided into a cuboid and a pyramid.
Volume of the cuboid = 40 × 40 × 5 = 8000 m3
Volume of the pyramid = × (40 × 40) × 7
= 3733.33 m3
Total volume = 8000 + 3733.33 = 11 733.33 m3
Example 12.5The cross-section of an embankment is trapezoidal (trapezium) in shape. The measurements at the top and the base of the
7 m
40 m
40 m5
m
Figure 12.8
1 3

136 12 Volumes (1)
embankment are 10.0 m and 16.0 m, respectively. The height of the embankment is 2.0 m and the length 200 m. If the cross-section remains constant throughout the length of the embankment, fi nd the volume of the soil:
(a) in its loose state (the soil bulks by 15%);
(b) in its compact state, after the construction of the embankment.
Solution:
Consider the embankment to be a prism as its cross-section is uniform throughout the length. Find the cross-sectional area of the embankment (trapezium) and multiply by the length to fi nd the answer to part (b) of the question. Add 15% to fi nd the volume of the earth in its loose state.
(a) Cross-sectional area of the embankment (trapezium) =
= = 26 m2
Volume of soil in compact state = 26 × 200 = 5200 m3
(b) Increase in the volume of soil due to bulking = = 780 m3
Volume of soil in its loose state = 5200 + 780 = 5980 m3
12.3 Mass, volume and density
The density of building materials is an important property that a structural engineer has to consider for calculating the forces acting on a building. The self-weight of building components is permanent and known as the dead load. The live load, on the other hand, keeps changing, and typical examples are the weight of people using a building and wind force acting on a building.
Mass of a material/component = density × volume
Example 12.6A water storage cistern measuring 2.5 m × 2.0 m × 1.2 m high is to be provided in a building.
(a) Calculate the volume of water when the cistern is fi lled to 15 cm from the top rim.
(b) Use the volume of water calculated in part (a) to determine the mass of water. The density of water is 1000 kg/m3.
(c) Find the load (force) on the joists supporting the cistern. 1 kg = 9.8 Newtons (N)
Solution:
(a) Convert 15 cm into metres. To do this divide 15 by 100 as
1 cm = m1
100
10 +16 x 2.0 2
13 x 2.0
~x 5200 100

137Volumes (1) 1215 cm = m = 0.15 m
Depth of water in the cistern = 1.20 – 0.15 = 1.05 m
Volume of water = lwh
= 2.5 × 2.0 × 1.05 = 5.25 m3
(b) Density of water = 1000 kg/m3. This means that 1 m3 of water has a mass of 1000 kg.
Mass of 5.25 m3 of water = 5.25 × 1000 = 5250 kg
(c) Load (or force) on the joists = 5250 × 9.8 = 51 450 N
12.4 Concrete mix and its constituents
Concrete is one of the important materials used in the construction of buildings and civil engineering structures. The constituents of a concrete mix are cement, fi ne aggregates (sand), coarse aggregates (gravel, blast-furnace slag, etc.) and water. Water is added for the chemical reaction between cement and water to take place and produce a solid concrete from a semi-fl uid state. The amounts of these constituents may be determined by considering either their volume or mass. If the proportions of cement, sand and gravel are measured by volume, the concrete mix is known as a nominal mix. Mixing by volume does not take into account the moisture content of the aggregates, therefore, nominal mixes are used only for minor work. Typical examples of nominal mixes are 1:2:4 concrete and 1:3:6 concrete. The 1:2:4 concrete means that it is prepared by mixing one part cement, two parts fi ne aggregates and four parts coarse aggregates. The volume of water is about 50–60% of the volume of cement. In this section only nominal mixes are considered.
If we want to prepare 1 m3 of 1:2:4 concrete mix, the quantities of dry materials may be calculated as shown below. The volume of cement in a 25 kg bag is 0.0166 m3.
Assuming the volume of water to be 55% of the volume of cement, the proportions of the concrete mix may be written as 1:2:4:0.55. The total of these proportions is 7.55.
Volume of cement = = 0.132 m3
Volume of fi ne aggregates = = 0.265 m3
Volume of coarse aggregates = = 0.53 m3
Volume of water = = 0.073 m3 or 73 litres
The coarse aggregates contain a lot of air voids which are fi lled by the other ingredients when they are mixed. The fi nal volume of the concrete mix will be less than 1 m3. The volume of the dry materials must be
15 100
1 --x1 7.55
1 --x2 7.55
1 -- x 0.55 7.55
1 --x4 7.55

138 12 Volumes (1)
increased by 50% (approximately) to get the required quantity of concrete. The detailed calculations are given in Appendix 1.
Example 12.7A concrete drive to a garage is to be 10 m long, 3 m wide and 150 mm thick. Calculate:
(a) The volume of concrete required to construct the drive
(b) The quantities of cement, sand and gravel required if 1:2:4 concrete is to be used.
Solution:
(a) Convert 150 mm into metres, as the units of all measurements should be the same:
150 mm = = 0.15 m
The shape of the drive is a rectangular prism:
Volume of concrete required = lwh
= 10 × 3 × 0.15
= 4.5 m3
(b) The quantities of dry materials to make 1 m3 are (from Appendix 1): cement = 0.198 m3; sand = 0.397 m3; gravel = 0.8 m3; water = 109 litres. The quantities of these materials to make 4.5 m3 are:
Cement = 4.5 × 0.198 = 0.891 m3
Sand = 4.5 × 0.397 = 1.787 m3
Gravel = 4.5 × 0.8 = 3.60 m3
Water = 4.5 × 109 = 491 litres
Example 12.8Figure 12.9 shows the plan of the proposed extension to a building. Find:
(a) the volume of the earth to be excavated.
(b) the volume of concrete required to construct the deep strip foundation.
Solution:
Figure 12.9 shows the sectional details of the deep strip foundation. The foundation may be considered to be a rectangular prism; hence its volume will be the product of the plan area and the depth. The width of the trench will be equal to the width of the foundation, i.e. 500 mm (or 0.5 m). The foundation plan, shown in Figure 12.10 has been divided into parts A, B and C to simplify the calculations.
150 1000
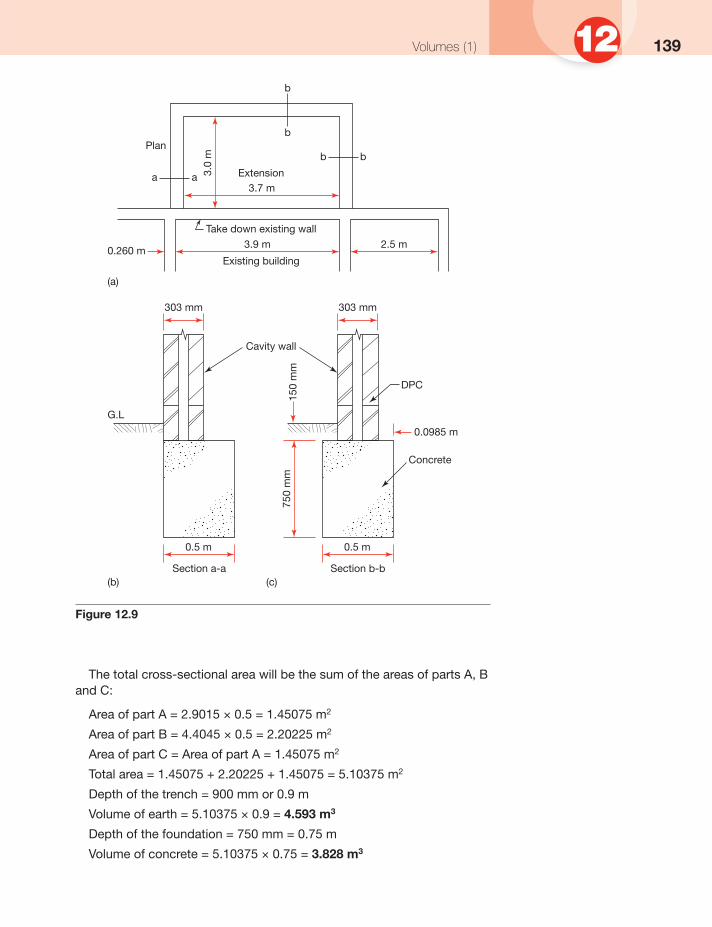
139Volumes (1) 12
2.5 m3.9 m
3.7 m
3.0
m
a
b
b
b
a
bPlan
(a)
(b)Section a-a
0.260 m
G.L
Extension
Take down existing wall
Existing building
Cavity wall
0.5 m
303 mm
(c)Section b-b
0.5 m
303 mm
750
mm
150
mm
0.0985 m
Concrete
DPC
Figure 12.9
The total cross-sectional area will be the sum of the areas of parts A, B and C:
Area of part A = 2.9015 × 0.5 = 1.45075 m2
Area of part B = 4.4045 × 0.5 = 2.20225 m2
Area of part C = Area of part A = 1.45075 m2
Total area = 1.45075 + 2.20225 + 1.45075 = 5.10375 m2
Depth of the trench = 900 mm or 0.9 m
Volume of earth = 5.10375 × 0.9 = 4.593 m3
Depth of the foundation = 750 mm = 0.75 m
Volume of concrete = 5.10375 × 0.75 = 3.828 m3

140 12 Volumes (1)
Exercise 12.1
The solutions to Exercise 12.1 can be found in Appendix 2.
1. Find the volume of a room measuring 3.24 m × 4.38 m × 2.46 m.
2. A cylinder has a diameter of 450 mm and a height of 950 mm. Find the volume of the cylinder (a) in cubic metres; (b) in litres. Note that 1 m3 is equal to 1000 litres.
3. A decorative feature on the front of a college building takes the form of a square-based pyramid of side 3.5 m, while its height is 6.0 m. Calculate its volume.
4. The spire of a church is in the form of a cone measuring 8 m high. If the diameter of its base is 3 m, what will be its volume?
5. Calculate the volume of concrete contained in the solid feature shown in Figure 12.11.
Existing building
Extension
3.70 m
2.90
15m
3.0
m
0.303 + 3.70 + 0.303 + 0.0985 = 4.4045 m
0.09
850.
0985 303 mm
500 mm wide foundation trench
0.0985 m
500 mm
303 mm thickcavity wall
C
B
A
303 mm
500 mm widefoundation
trench
Figure 12.10

141Volumes (1) 12
400
mm
400
mm
300 mm
300 mm
Figure 12.11
6. Figure 12.12 shows the dimensions of the roof of a building. Calculate the volume of the loft space.
4.0 m
14 m12 m
Figure 12.12

142 12 Volumes (1)
7. A rectangular culvert is to be used to enclose and protect a small river where it passes through an industrial estate. The culvert has external dimensions of 1.75 m by 1.25 m, and has a wall thickness of 150 mm. What will be the volume of concrete used to manufacture each linear metre of the culvert?
8. Figure 12.13 shows part of an embankment and its dimensions. What is its volume?
10.85 m
8.40 m
2.95
m
25 m
Figure 12.13
9. A water storage cistern measuring 2.4 m × 1.8 m × 1.2 m high is to be provided in a building.
(a) Calculate the volume of water when the cistern is fi lled to 15 cm from the top rim.
(b) Use the volume of water calculated in part (a) to determine the mass of water. The density of water is 1000 kg/m3.
(c) Find the load (force) on the joists supporting the cistern. 1 kg = 9.8 newton (N).
10. A concrete drive to a garage is to be 8.5 m long, 3.5 m wide and 150 mm thick. Calculate:
(a) the volume of concrete required to construct the drive
(b) the quantities of cement, sand and gravel required if 1:2:4 concrete is to be used.
11. The plan of a building extension is shown in Figure 12.14.
(a) Calculate the volume of soil to be excavated from the foundation trench. The depth of the trench is 900 mm.
(b) If the soil bulks by 15%, fi nd its volume after bulking.
(c) Find the volume of concrete required to construct a 600 mm wide and 200 mm thick strip foundation.

143Volumes (1) 12
Answers to Exercise 12.1
1. 34.910 m3
2. (a) 0.15109 m3; (b) 151.09 litres
3. 24.5 m3
4. 18.85 m3
5. 48 000 000 mm3 or 0.048 m3
6. 336 m3
2.8
m
2.65
1 ma a b
b
1
b
b
260 mm 260 mm
0.148 m
Foundation
G.L
Take down existing wall
Extension
Existing building
4.2 m
4.606 m
(a)
(b)
303 mm
600 mm200 mm
Section a-a
150
mm
700
mm
Cavity wall303 mm
600 mm
Section b-b
149 mm148 mm
23
Concrete
Figure 12.14

144 12 Volumes (1)
7. 0.81 m3
8. 709.844 m3
9. (a) 4.536 m3; (b) 4536 kg; (c) 44 452.8 N
10. (a) 4.4625 m3; (b) Cement = 0.884 m3, sand = 1.772 m3, gravel = 3.57 m3, water = 486 litres
11. (a) 5.430 m3; (b) 6.245 m3; (c) 1.207 m3

C H A P T E R13Trigonometry (1)
Learning outcomes:
(a) Perform calculations to determine the sine, cosine and tangent of given angles and vice versa
(b) Perform calculations to fi nd the angle of pitch and headroom of a fl ight of stairs
(c) Find the true length of common and hip rafters and the area of a roof
13.1 Introduction
The word trigonometry comes from two Greek words, trigonon (triangle) and metria (measure). Trigonometry may be defi ned as a branch of mathematics that deals with the study of relationships between the sides and the angles of triangles (�). The complex history of the term ‘sine’ reveals that the origins of trigonometry trace to the ancient cultures of Egyptian, Babylonian, Greek and Indus Valley civilisations. Originally, the use of trigonometry became popular as developments started to take place in astronomy. To calculate the position of the planets the astronomers used concepts we now refer to as trigonometry.
The use of trigonometry is not just limited to mathematics. It is also used in physics, land surveying, engineering, satellite navigation and other applications.
13.2 The trigonometrical ratios
Consider a right-angled triangle CAB, shown in Figure 13.1

146 13 Trigonometry (1)
Opposite
C
BAAdjacent
Hypotenuse
Figure 13.1
Angle CBA (�B) is a right angle, i.e. 90°. If �A is being considered, side BC is called the ‘opposite side’ or opposite. Side AC, which is the longest side, is called the ‘hypotenuse’. The third side, AB, is called the ‘adjacent side’ or adjacent and is common to �A as well as the right angle.
The ratios of the sides of a right-angled triangle, called the ‘trigonometrical ratios’ are sine, cosine and tangent. In �CAB (Figure 13.1):
= sine of �A or sin A
= cosine of �A or cos A
= tangent of �A or tan A
It is also known that tan A = . If �CAB is rotated clockwise through
90°, we have �ABC, as shown in Figure 13.2. If �C is being considered, then AB is the opposite side. AC and BC are the hypotenuse and adjacent side, respectively.
Hypotenuse
Adjacent
Opposite
A
CB
Figure 13.2
opposite BC hypotenuse AC
adjacent AB hypotenuse AC
opposite BC adjacent AB
sin A --
cos A

147Trigonometry (1) 13The trigonometric ratios in this case are:
= sine of �C or sin C
= cosine of �C or cos C
= tangent of �C or tan C
13.3 Trigonometric ratios for 30°, 45°, 60°
The 30°, 60°, 90° and 45°, 45°, 90° triangles are shown in Figure 13.3
8.66 cm
10 cm
5 cm
(a)
A
CB
30º
60º
5 cm
7.071 cm
5 cm
(b)
A
CB
45º
Figure 13.3
Figure 13.3a shows a 30°, 60°, 90° triangle whose sides are in the ratio 1:2:�3 (or 1:2:1.732). If side AC = 5 cm, then AB, being two times AC, is equal to 10 cm. Using Pythagoras’ Theorem, BC = 8.66 cm.
sin 30° = = = 0.5
cos 30° = = = 0.866
tan 30° = = = 0.577
Figure 13.3b shows a 45°, 45°, 90° triangle whose sides are in the ratio 1:1:�2 or (1:1:1.4142). Side BC = AC = 5 cm, and AB = 7.071 cm. Following the above process:
sin 45° = = 0.707
cos 45° = = 0.707
tan 45° = = 1.0
opposite AB -
hypotenuse AC
adjacent BC hypotenuse AC
opposite
adjacent
AB BC
opposite
hypotenuse
adjacent
hypotenuse
opposite
adjacent
5
7.071
5
7.071
5
5
AC 5 AB 10
BC 8.66 AB 10
AC 5 --
BC 8.66

148 13 Trigonometry (1)
A summary of the above values (correct to 3 d.p.) and the values for other angles which can be determined using the above procedure are given in Table 13.1
Table 13.1
Angle0°° 30°° 45°° 60°° 90°°
sin 0 0.5 0.707 0.866 1
cos 1 0.866 0.707 0.5 0
tan 0 0.577 1 1.732 Infi nity
Example 13.1Determine angles A and B of �ABC shown in Figure 13.4.
A
CB
5 cm 3 cm
4 cm
Figure 13.4
Solution:
With reference to �B, label the sides as adjacent, opposite and hypotenuse:
BC = adjacent; AC = opposite; AB = hypotenuse
As all three sides of the triangle are known, any trigonometric ratio can be used to fi nd �B.
sin B =
Using a scientifi c calculator:
�B = sin–1 0.6 = 36.87° or 36°52′12″
(Refer to Chapter 1 for instructions on the use of a scientifi c calculator.)
�A can be calculated by two methods.
Method 1The sum of all angles of a triangle = 180°
Therefore, �A = 180° – �B – �C
= 180° – 36°5212 – 90° = 53°07′48″
opposite hypotenuse
AC =~=O.6 AB 5

149Trigonometry (1) 13Method 2
With reference to �A, BC = opposite side
AB = hypotenuse
AC = adjacent side
cos A = adjacent
hypotenuse35
0.6= = =ACAB
�A = cos–1 0.6 = 53.13° or 53°07′48″
Example 13.2Find side AB of the triangle shown in Figure 13.5.
A
B C10 cm
40º
Figure 13.5
Solution:
With reference to �C in the above triangle:
AB = opposite side (to be determined)
BC = adjacent side = 10 cm
The trigonometric ratio involving sides AB and BC is the tangent ratio:
tan C =
tan 40° =
Transposing, tan 40° × 10 = AB
Therefore AB = 0.839 × 10 = 8.39 cm (tan 40° = 0.839)
Example 13.3A fl at roof of 3 m span has a fall of 75 mm. Find the pitch of the roof.
Solution:
The cross-section of the roof is shown in Figure 13.6:
opposite AB adjacent Be
AB 10

150 13 Trigonometry (1)
Roof75 mm
C
A B3 m
Figure 13.6
The pitch of a roof is the angle that it makes with the horizontal. In this example �A is the pitch of the roof. Convert 3 m into millimetres (or 75 mm into metres) to have both dimensions in the same units.
3 m = 3.0 × 1000 = 3000 mm (1 m = 1000 mm)
As the opposite and adjacent sides are known, the tangent ratio will be used:
tan A =
= = 0.025
�A or Pitch = tan–1 0.025
= 1.432° or 1°25′56″
Example 13.4The gradient of a road is 1 in 5. Find the angle that the road makes with the horizontal.
Solution:
Figure 13.7 shows the slope of the road:
Road1 m
C
B5 m
A
Figure 13.7
Gradient of 1 in 5 means that for every 5 m of horizontal distance there is a rise or fall of 1 m. If AB represents the horizontal distance of 5 m, the rise of 1 m is represented by BC. To calculate �A, the tangent ratio will be used as the opposite and adjacent sides are known
tan A = = 0.2
� �A = tan–1 0.2 = 11.31° or 11°18′36″
opposite BC =
adjacent AB
75 3000
opposite BC 1 =-=-
adjacent AB 5

151Trigonometry (1) 13
13.4 Angles of elevation and depression
If an observer looks at an object that is higher than him, the angle between the line of sight and the horizontal is called an angle of elevation (Figure 13.8a). When the observer is higher than the object, the angle, as shown in Figure 13.8b, is called an angle of depression.
Line of sight
Horizontal
(a)
Object
Angle of elevation
ObserverLine of sight
Horizontal
(b)Object
Angle of depression
Observer
Figure 13.8
Example 13.5A surveyor, 100 m from a building, measures the angle of elevation to the top of a building to be 40° (Figure 13.9). If the height of the instrument is 1.400 m and the ground between the surveyor and the building is level, fi nd the height of the building.
100 m
40º
1.4
m
C
B
DE
A
Figure 13.9
Solution:
Height of the building = CD = BC + BD
Height of the instrument = AE = BD = 1.4 m
tan 40° = Be AB

152 13 Trigonometry (1)
Transposing, BC = AB × tan 40°
= 100 × 0.8391 = 83.91 m
Height of the building, CD = BC + BD
= 83.91 + 1.400 = 85.310 m
Example 13.6Jane, standing on the fi fteenth fl oor of a building, looks at her car parked on the nearby road. Find the angle of depression if the other details are as shown in Figure 13.10.
Car
40 m
60 m
B
C
AD
Figure 13.10
Solution:
Assuming the building is vertical and the ground is level, horizontal line AD is parallel to BC. Therefore, the angle of depression �A = �C. To calculate �C, consider �ABC: �B = 90°, AB = opposite side, and BC = adjacent side:
tan C = = 0.6667
� �C = tan–1 0.6667 = 33°41′24″
13.5 Stairs
Stairs in buildings provide access from one fl oor to another. The Building Regulations give guidelines on their design for use in domestic and commercial buildings. According to the Building Regulations 2000:
1. The pitch (see Figure 13.11) of stairs in dwelling houses should not be more than 42°
2. Maximum rise (R) = 220 mm
3. Minimum going (G) = 220 mm
opposite AB 40 =-=-
adjacent Be 60

153Trigonometry (1) 134. 2 × Rise + Going (or 2R + G) must be within 550 and 700 mm.
5. The headroom should not be less than 2.0 m.
(b)
(a)
Headroom
Pitch Ground floor
Joists
First floor
Going
Rise
Tread
Riser
Handrail
Figure 13.11

154 13 Trigonometry (1)
Example 13.7A fl ight of stairs has 12 steps. Each step has a rise of 210 mm and going equal to 230 mm.
(a) Find the pitch of the stairs
(b) If the pitch exceeds the limit set by the Building Regulations, fi nd the satisfactory dimensions of the rise and going.
Solution:
(a) Figure 13.12 shows a portion of the stairs
Pitch
C
BA
Figure 13.12
Join points A and C. In �CAB
AB = Going = 230 mm
BC = Rise = 210 mm
�B = 90°
�A = The pitch of the stairs (to be calculated).
With reference to �A, in �CAB:
Side BC = opposite side, and side AB = adjacent side
tan A = = 0.913
� �A = tan–1 0.913 = 42.4°
The current Building Regulations stipulate that the maximum pitch of a private stair should not be more than 42°.
(b) To reduce the pitch, increase the going (AB) to, say, 235 mm
tan A = = 0.8936
� �A = tan–1 0.8936 = 41.8° < 42°, satisfactory
(Note: the pitch may also be reduced by decreasing the rise to (say) 205 mm.)
2R + G = 2 × 210 + 235
= 420 + 235 = 655
which is more than (>) 550, but less than (<) 700, i.e. within the permissible limits.
opposite adjacent
opposite
BC 210 AB 230
BC 210 =-=-
adjacent AB 235

155Trigonometry (1) 13Example 13.8The fl oor to fl oor height in a house is 2.575 m and the space to be used for providing the stairs is shown in Figure 13.13. Design a staircase that satisfi es the requirements of the Building Regulations.
Headroom
Section
Plan
0.9
m
2.7 m
Figure 13.13
Solution:
Distance between two fl oors (height) = 2575 mm. Table 13.2 shows the number of risers and the rise of each step
Table 13.2
Number of risers
Rise of each step
10 2575 ÷ 10 = 257.5 mm > 220 mm (unsatisfactory)
11 2575 ÷ 11 = 234.09 mm > 220 mm (unsatisfactory)
12 2575 ÷ 12 = 214.58 mm (satisfactory)
13 2575 ÷ 13 = 198.08 mm (satisfactory)
A staircase with 12 or 13 risers can be provided
Number of risers = 12:
Number of treads = 11; (one less than the number of risers)
Rise of each step = 214.58 mm
Going of each step = 2700 ÷ 11 = 245.45 mm

156 13 Trigonometry (1)
In Figure 13.14, join points A and C to form �CAB. In �CAB:
�A = Pitch of the stair
Pitch
C
A = Pitch
BA
Figure 13.14
AB = Going = 245.45 mm
BC = Rise = 214.58 mm
tan A =
Pitch = �A = tan–1
� �A = tan–1 0.874 = 41.16° < 42°, satisfactory
Number of risers = 13:
Rise of each step = 198.08 mm
Number of steps = 12
Going of each step = 2700 ÷ 12 = 225 mm
Pitch = �A = tan–1
� �A = tan–1 0.88 = 41.36° < 42°, satisfactory
Headroom
Assuming the depth of fi rst-fl oor joists to be 250 mm, the total depth of fi rst-fl oor construction is 285 mm (approx.).
Floor to ceiling height = 2.575 – 0.285 = 2.290 m
From Figure 13.13, the headroom = 2.290 – 0.215 m
= 2.075 m
The headroom is satisfactory as it is more than 2.0 m.
13.6 Roofs
Some of the terms associated with roof construction are shown in Figure 13.15.
The gable end is a vertical wall right up to the ridge, but in a hipped roof the vertical wall does not extend beyond the eaves. The hipped end normally slopes at the same angle to the main roof, and is tiled like the rest of the roof.
opposite
adjacent
Be 214.58 -=--AB 245.45
214.58 245.45
198.08 225

157Trigonometry (1) 13
The true length of a rafter can be seen and calculated from some of the views, as shown in Example 13.9.
Example 13.9The roof shown in Figure 13.16 has a height of 4 m and a span of 10 m. Calculate:
(a) Pitch of the roof
(b) True lengths of common rafters
(c) Surface area of the roof
(d) The number of single lap tiles required to cover the roof.
(a) (b)
(c)
Gableend
Ridge
Commonrafters
Hipped end
Hip rafters Commonrafters
Eaves
Eaves
Longitudinalridge brace
Trussedrafters
Longitudinalbraces
Wall plate
600 mm c/c
Diagonal brace
Figure 13.15

158 13 Trigonometry (1)
Common rafters
Common rafters
12 m 10 m
End elevation
Plan
Frontelevation
B
B D
A
C
A
C
B´
A´
C´
10 m
4 m
Figure 13.16
Solution:
(a) As the roof is symmetrical, BD = DC and AB = AC. With reference to �B in the right-angled triangle ABD:
AD = opposite side = 4 m; BD = adjacent side = 5 m
tan B = 0.8
� �B = tan–1 0.8 = 38.66°
The pitch of the roof is 38.66°
(b) The plan and the front elevation do not give the true length of a rafter. From the front elevation a common rafter appears to be 4 m long and from the plan it appears to be 5 m. Both are incorrect. The true length of a common rafter is equal to AB or AC in �ABC
cos B = or AB =
�True length of the common rafter = 6.403 m
(This can also be calculated by using Pythagoras’ Theorem.)
(c) Again, the plan area of the roof surface does not give the correct value.
Referring to Figure 13.17:
Surface area of the roof = 2 × Area of surface A A� C� C
AC = A�C� = 6.403 m
AD 4 -=-= BD 5
BD BD AB cosB
= 5 5 =6.403m cos 38.66" 0.7809

159Trigonometry (1) 13Therefore,
surface area of the roof = 2 × (AA� × AC)
= 2 × (12 × 6.403)
= 153.672 m2
A
A´
C´
C
Figure 13.17
(d) The size of a trough-type single lap roof tile is 330 mm × 413 mm.
The exposed area of each tile is:
292 mm × 338 mm = 98 696 mm2
= 9.8696 × 10⁻² m2
(Alternatively: 0.292 m × 0.338 m = 0.0987 m2)
Number of tiles =
=
= 1557.02 or 1558
Example 13.10The pitch of a 14 m long hipped roof is 45°. If other dimensions are as shown in Figure 13.18, fi nd:
(a) Height of the roof
(b) Length of common rafter XZ
(c) True length of hip rafter DA.
45º
ZD
G
C
BF
XE
A
10 m
Figure 13.18
Surface area of roof
Area of a tile
153.672 9.8696 x 1 0-2

160 13 Trigonometry (1)
Solution:
(a) The height of the roof is the same as the height DF, a vertical line that makes an angle of 90° with the horizontal. It can be determined from the right-angled triangle DEF.
45º
(b)
D
FE
F
A(a)
D
Figure 13.19
In �DEF (see Figure 13.19a), �E = 45° and EF = 5 m
= tan 45°
= 1
Transposing, DF = 1 × 5 = 5 m
Hence the height of the roof is 5 m
(b) Common rafter XZ = DE; DE can also be determined from �DEF
= sin 45°
= 0.7071
DE = = 7.071 m
True length of rafter XZ = 7.071 m
(c) To fi nd the length of rafter DA, consider the right-angled triangle DFA (Figure 13.19b). DF = 5 m; but this information is not enough to fi nd DA. We need to fi nd another side of �DFA to do further calculations. ABFE is a square with each side equal to 5 m. FA is the diagonal of the square, which can be determined using Pythagoras’ Theorem:
FA = = = = = 7.071 m
tan A = = = 0.7071
� �A = tan–1 0.7071 = 35.26°
= sin A
OF opposite -=
EF adjacent
OF 5
OF opposite OE hypotenuse
5 OE
5 0.7071
.JAB'+BF" .J5'+5' .J25+25 ,J5O
OF opposite 5 FA adjacent 7.071
OF opposite OA hypotenuse

161Trigonometry (1) 13 = sin 35.26°
Transposing, 5 = DA × sin 35.26°
or DA
Hip rafter DA is 8.660 m long.
13.7 Excavations and embankments
Trench and pit excavations are required for the construction of foundations and other processes. The excavations can have vertical or battered (sloping) sides. Similarly, embankments which are quite commonly used in the construction of roads have battered sides.
Trigonometric ratios can be used to determine the volume of soil either removed from an excavation or required to construct an embankment. The following example is based on an excavation, but the same method can also be used to perform calculations in the case of an embankment.
Example 13.11A 10 m long trench has battered sides which make angles of 40° with the horizontal. If the base of the trench is 1.0 m wide and depth 1.5 m, fi nd the volume of the soil to be excavated.
Solution:
Volume of the excavated soil = cross-sectional area of trench × length The cross-sectional area can be found either by treating the trench as a trapezium or by dividing the cross-section into three parts, i.e. two triangles and a rectangle (see Figure 13.20). The latter approach will be used here.
1.0 m
40º
B
A C FE
D
1.5
m
Figure 13.20
Cross-sectional area of the trench = area of �ABC + area of rectangle BCED + area of �DEF
Area of �ABC = area of �DEF
�Cross-sectional area of the trench = 2 × area of �ABC + area of rectangle BCED
5
DA
5 sin 35.26" = 0.577 = 8.660 m
5
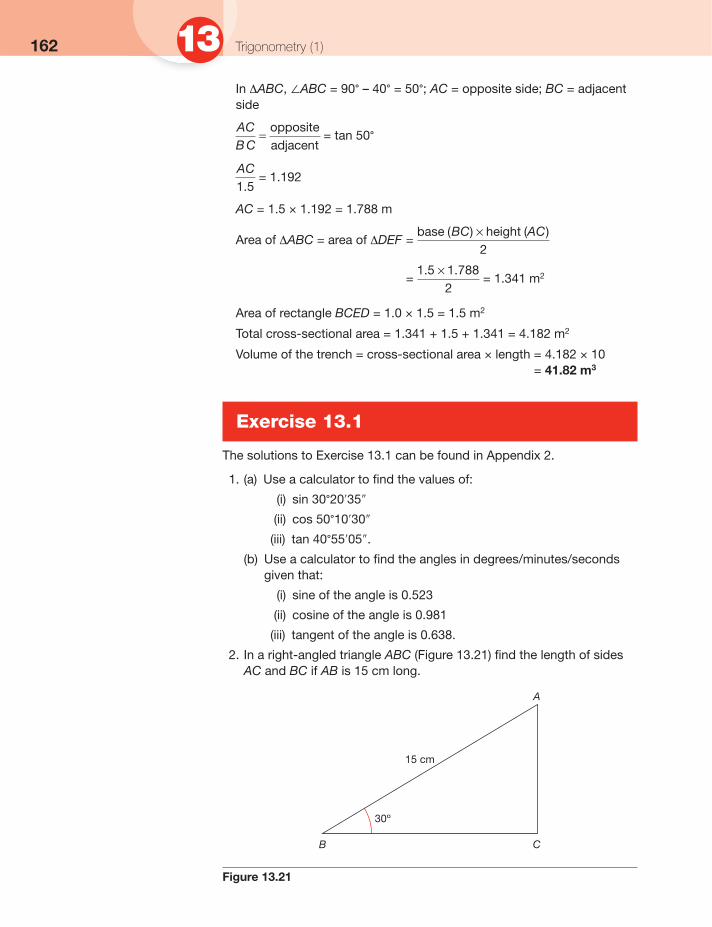
162 13 Trigonometry (1)
In �ABC, �ABC = 90° – 40° = 50°; AC = opposite side; BC = adjacent side
= tan 50°
= 1.192
AC = 1.5 × 1.192 = 1.788 m
Area of �ABC = area of �DEF =
= = 1.341 m2
Area of rectangle BCED = 1.0 × 1.5 = 1.5 m2
Total cross-sectional area = 1.341 + 1.5 + 1.341 = 4.182 m2
Volume of the trench = cross-sectional area × length = 4.182 × 10 = 41.82 m3
Exercise 13.1
The solutions to Exercise 13.1 can be found in Appendix 2.
1. (a) Use a calculator to fi nd the values of:
(i) sin 30°20�35�
(ii) cos 50°10�30�
(iii) tan 40°55�05�.
(b) Use a calculator to fi nd the angles in degrees/minutes/seconds given that:
(i) sine of the angle is 0.523
(ii) cosine of the angle is 0.981
(iii) tangent of the angle is 0.638.
2. In a right-angled triangle ABC (Figure 13.21) fi nd the length of sides AC and BC if AB is 15 cm long.
15 cm
30º
A
CB
Figure 13.21
AC opposite BC adjacent
AC 1.5
base (BC) x height (AC)
2
1.5x1.788 2

163Trigonometry (1) 13 3. A surveyor wants to fi nd the width of a river and stands on one bank
at point C, directly opposite a building (B), as shown in Figure 13.22. He walks 60 m along the river bank to point A. If angle BAC = 60°35� 30�, fi nd the width of the river.
60 m
River
Plan
C
B
A
Figure 13.22
4. A tall structure is stabilised by fi ve steel cables. The upper ends of the cables hold the top of the building and the lower ends are anchored into a concrete base. If the length of each cable is 35 m and they make an angle of 60° with the ground, fi nd:
(a) the height of the building
(b) the distance between the building and the anchored end of one of the cables.
5. The gradient of a road is 9%. Find the vertical rise/fall if the length of the road is 2450 m.
6. John has designed a fl at roof for his house extension. The span of the roof is 3.5 m and the slope of the roof is 1 in 48. Find the pitch of the roof in degrees.
7. The dimensions of a building plot are as shown in Figure 13.23. Find the area of the plot if AC is parallel to BD.
95º
50 m
65 mD
B
A
C
125º40´
Figure 13.23

164 13 Trigonometry (1)
8. The pitch of a 15 m long hipped roof is 40°. If other dimensions are as shown in Figure 13.24, fi nd the height of the roof and
(a) true length of common rafter HJ
(b) true length of hip rafter DA
(c) area of the roof surface.
40º40
º
JD
G
C
BF
HE
A
10 m
Figure 13.24
9. A 1.200 km long section of a road is provided on an embankment. The average cross-section of the embankment is as shown in Figure 13.25. Find the cross-sectional area and the volume of soil required to construct the embankment.
40 m
35º 35º3.0
m
Figure 13.25
10. The fl ight of a domestic staircase is shown in Figure 13.26. Calculate the pitch of the staircase and check if it conforms to the Building Regulations. If necessary, select new dimensions of the rise and the going to satisfy the Building Regulations.

165Trigonometry (1) 13
Rise (R) = 220 mm
Going (G) = 230 mm
Figure 13.26
Answers to Exercise 13.1
1. (a) (i) 0.5052; (ii) 0.6404; (iii) 0.8668
(b) (i) 31°32� 1.3�; (ii) 11°11� 12.4�; (iii) 32°32� 16.4�
2. BC = 12.99 cm, AC = 7.5 cm
3. 106.447 m
4. (a) 30.311 m; (b) 17.5 m
5. 219.612 m
6. 1°11� 36.56�
7. 3763.04 m2
8. (a) HJ = 6.527 m, (b) DA = 8.222 m, (c) area = 195.81 m2
9. Cross-section area = 107.147 m2, volume = 128 576.4 m3
10. rise = 201.67 mm, going = 224 mm

This page intentionally left blank

C H A P T E R14Setting out
Learning outcomes:
(a) Set out a simple building
(b) Prepare data (ordinate lengths) for setting out circular curves
(c) Check that the corners of a building are square
(d) Prepare data for setting out elliptical arches
14.1 Introduction
‘Setting out’ is an expression used in the construction industry to cover the general measurement and control of the horizontal and vertical positions of buildings, roads and drains (and other features) on a building or civil engineering site. Some of the curvilinear shapes which are set out by builders and civil engineers include bay windows, circular brickwork, arches and curves in roads. In this chapter calculations required for setting out building sites, bay windows, curved brickwork and arches, and a brief procedure for utilising these calculations, are given.
14.2 Setting out a simple building site
Figure 14.1 shows a building site containing two blocks of factory units and one three-storey offi ce block. When a site is originally surveyed for any construction work it is usual for some points (often referred to as stations) to be made so that they are permanent features and can be found at a later date. On Figure 14.1 two points, A and B, are such stations. Now, it is quite easy to see that on the drawing a pair of compasses could be used with the point in station A and the drawing tip set to 50.7 m (or 50 700 mm as shown on the drawing), to describe an arc near the lower corner of the three-storey block. Similarly, with the compass point in B another arc could be drawn with the compass set at 81.4 m. Where the arcs cross will give the position of the lower corner of the offi ce block. A similar method would be used on-site, measuring
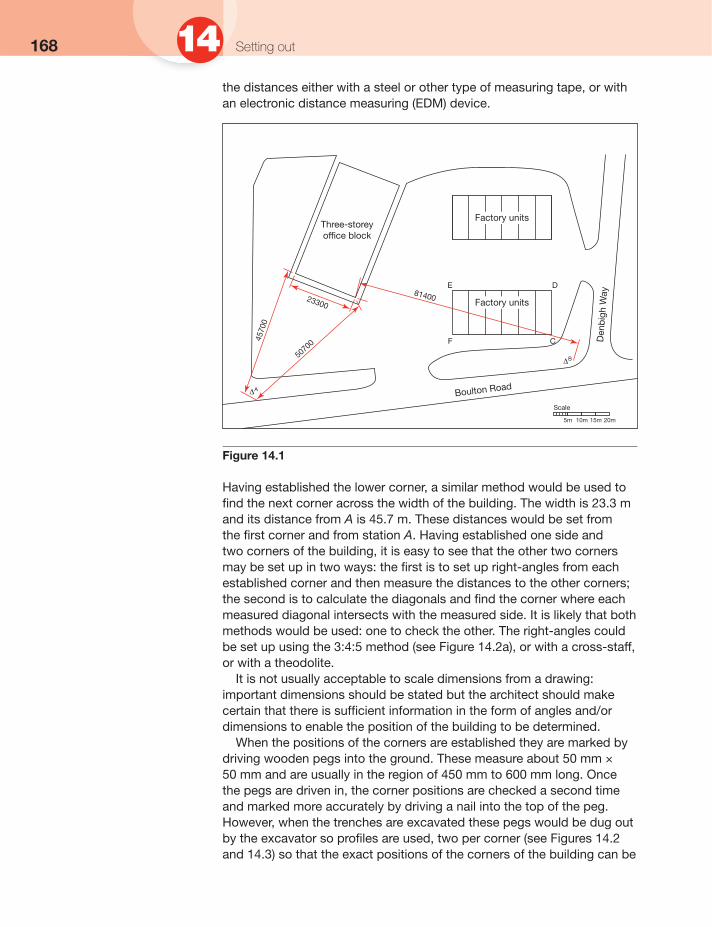
168 14 Setting out
the distances either with a steel or other type of measuring tape, or with an electronic distance measuring (EDM) device.
Factory unitsThree-storeyoffice block
Factory units
E
F
D
C
Scale
5m 10m 15m 20m
23300
Boulton Road
4570
0
5070
0
81400
Den
big
h W
ay
ΔA
ΔB
Figure 14.1
Having established the lower corner, a similar method would be used to fi nd the next corner across the width of the building. The width is 23.3 m and its distance from A is 45.7 m. These distances would be set from the fi rst corner and from station A. Having established one side and two corners of the building, it is easy to see that the other two corners may be set up in two ways: the fi rst is to set up right-angles from each established corner and then measure the distances to the other corners; the second is to calculate the diagonals and fi nd the corner where each measured diagonal intersects with the measured side. It is likely that both methods would be used: one to check the other. The right-angles could be set up using the 3:4:5 method (see Figure 14.2a), or with a cross-staff, or with a theodolite.
It is not usually acceptable to scale dimensions from a drawing: important dimensions should be stated but the architect should make certain that there is suffi cient information in the form of angles and/or dimensions to enable the position of the building to be determined.
When the positions of the corners are established they are marked by driving wooden pegs into the ground. These measure about 50 mm × 50 mm and are usually in the region of 450 mm to 600 mm long. Once the pegs are driven in, the corner positions are checked a second time and marked more accurately by driving a nail into the top of the peg. However, when the trenches are excavated these pegs would be dug out by the excavator so profi les are used, two per corner (see Figures 14.2 and 14.3) so that the exact positions of the corners of the building can be

169Setting out 14
re-established after excavation. A profi le is a piece of board about 25 mm by 125 mm nailed to two pegs set at least 2 m from the trench. A typical profi le is shown in Figure 14.2b.
The nails along the top of the board represent the positions of the excavation lines, the outer and inner leaves of the wall and the cavity. Strings, or lines, are stretched from one profi le to another so that the corners and faces of the brickwork can easily be re-established.
14.3 Bay windows and curved brickwork
There may be many methods available for setting out bay windows and curved brickwork, but here a method in which ordinates are used will be explained. This method requires the calculation of a number of ordinates, which later are measured off the base line (on-site). By joining the ends of these ordinates, a curve is obtained.
Line of side of buildingat 90º to building line
Tape
(b) A profile
(a)
Excavation line
Excavation line
Outer face of wall
Cavity
Inner face of wall
3 units4 units
5 units
Figure 14.2

170 14 Setting out
Figure 14.4a shows a circular curve with a span of 2.1 m and a rise of 0.5 m. To set out this curve, a number of ordinates are required at suitable intervals, but fi rst of all it is necessary to calculate the radius of the curve. Figure 14.4b shows the circle of which curve AD�G is a part. OA, OG and OD� are the radii, AD is 1.05 m (half the span) and DD� is the rise of 0.5 m:
OA and OD� are denoted as R and OD as r
OD� = OD + DD�
or R = r + 0.5 (1)
Also r2 = R2 – (1.05) 2
= (r + 0.5) 2 – (1.05) 2
= r2 + r + 0.25 – 1.1025
r2 – r2 = r + 0.25 – 1.1025
1.1025 – 0.25 = r
� r = 0.8525 or OD = 0.8525 m or 0.853 m (to 3 d.p.)
From equation 1,
R = r + 0.5
= 0.8525 + 0.5 = 1.3525 m or = 1.353 m (to 3 d.p.)
The above procedure may be generalised in the form of the following formula:
Positions of profileswell away fromexcavations so thatsetting out can bere-established afterexcavation
Plan
Figure 14.3
(7 J + (rise)'
R= 2xrise

171Setting out 14Span 2100 mm
D´C´
B´
DCBA
(a)
(b)
E´
F´
E F G
J
Ris
e 50
0 m
m
H O
O
D´
GAD
rR
Figure 14.4

172 14 Setting out
Other methods or formulae are available to work out this radius. Now divide the base line into an even number of equal parts (six or more). Here we have used six. The next stage is to determine ordinates CC� and BB�. Consider triangle OC�H from Figure 14.4a.
Using Pythagoras’ Theorem, (C�H)2 = (OC�)2 – (OH)2
CC� = C�H – CH
= 1.307 – 0.853 = 0.454 m
Similarly, in triangle OB�J:
= 1.158 m
B�B = B�J – BJ
BB� = 1.158 – 0.853 = 0.305 m.
Due to the symmetry of the diagram:
EE� = CC� = 0.454 m
FF� = BB� = 0.305 m
From the established base line AG, measure and mark ordinates BB�, CC�, DD�, EE� and FF� on the ground and join the points A, B�, C�, D� ,etc. with a smooth curve.
This method can also be used to set out segmental arches.
14.4 Checking a building for square corners
After setting out a building it is important to check that all corners are square (make 90° angles). Example 14.1 shows the procedure of checking the corners.
Example 14.1A building is set out using a builder’s square (see Figure 14.5). Show how the builder can check that the corners are square.
C' H = ~(OC')' - (OJ-/)'
C' H = ~(1.353)' - (0.350),
C' H = ,j1.708
C'H=1.307m
B' J = ~(OB')' - (OJ)'
B'J= ~(1.353)' - (0.70)'
B' J = ./1.341

173Setting out 147000
10000
6000
9000
F
A
E
D C
B
(All dimensions in mm)
Figure 14.5
Solution:
Divide the area into rectangles, as shown in Figure 14.6
7000
10000
6000
9000
6000
F
A
E
DG C
B
(All dimensions in mm)
Figure 14.6

174 14 Setting out
(a) Diagonals AC and BG should be equal.
= 11.662 m. Diagonal BG should also be 11.662 m
(b) Diagonals GE and DF should also be equal.
7.616 m
(c) Additionally, BF and AE should be checked.
= 13.454 m
11.402 m
The builder should measure the diagonals AC, BG, GE and DF. AC and BG should be equal at 11.662 m long. Similarly, GE and DF should both be equal to 7.616 m. Additionally, BF and AE may be measured: they should both be as stated above.
14.5 Circular arches
Stone and brick arches have been in use in the construction of buildings and bridges for more than 3000 years. These are still used in buildings, though not so much for their structural purpose as their architectural appearance. Figure 14.7 shows the shapes of some of the arches which have been used in buildings, viaducts and aqueducts.
Because brick and stone in arches cannot support themselves before the mortar has gained enough strength, temporary supports known as centres are used, as shown in Figure 14.8. In order to construct a centre a number of ordinates are required at suitable intervals, as shown in Figures 14.9 and 14.10. The upper surface of the centre is shaped according to the required appearance of the arch.
AC=~(AB)' + (BC)'
AC = ,J1O' + 6'
Ac=vhoo+36
AC=.J136
GE = ~(GD)' + (DE)'
GE=,J7' +3'
GE=.J49+9
GE=..J58 =
BF=,JAB'+AF'
BF=,J1O'+9'
BF=.J100+B1
BF=.J181
AE = ~(AF)' + (FE)'
AE=,J9' + 7'
AE=.JB1+49
AE=.J130 =

175Setting out 14
Semicircular arch
Arch formed with two circular curves
Arch with circular curve
Elliptical arch
Figure 14.7
1.0 m to 3.5 m
Figure 14.8

176 14 Setting out
(All dimensions in mm)
3000
200
Figure 14.9
OB = OA = radius = 5.725 m
KGFE
DC
AB
C´ D´ E´ F´ G´ K´ J´ L´ M´ N´ P´
Q R S T U O
J LM
NP
200
mm
Figure 14.10
Example 14.2Calculate the ordinates required to set out the arch shown in Figure 14.9.
Solution:
To fi nd the radius of the curve, use the following formula:
= 5.725 m
(7 J + (rise)'
R 2xrise
(H + (0.2)'
R = 2 x 0.2

177Setting out 14To fi nd the lengths of the ordinate, use Pythagoras’ Theorem (as explained in Section 14.3). Draw the outline of the arch as shown in Figure 14.10. Establish the centre O and divide AB into 12 equal parts, each 3.0 m ÷ 12 = 0.25 m apart.
To fi nd ordinate GG� consider triangle OGU:
OG = radius = 5.725 m
OU = 0.250 m
= 5.720 m
Ordinate GG� = GU – G�U
GG� = 5.70 – 5.525 = 0.195 m
To fi nd ordinate FF�:
= 5.703 m
Ordinate FF� = FT – F�T
FF� = 5.703 – 5.525 = 0.178 m
To fi nd ordinate EE�:
ES = 5.676 m
Ordinate EE� = ES – E�S
EE� = 5.676 – 5.525 = 0.151 m
To fi nd ordinate DD�:
DR = 5.637 m
DD� = 5.637 – 5.525 = 0.112 m
To fi nd ordinate CC�
CQ = 5.587 m
CC� = 5.587 – 5.525 = 0.062 m
GU=J(5.725)2 -(0.25)2
G U = .j(32.776) - (0.0625)
GU= .J32.713
FT = J(F0)2 - (0T)2
FT = J(5.725)2 - (0.5)2
FT = .J32.776 - 0.25
ES = J(EO)2 - (OS)2
ES = J(5.725)2 - (0.75)2
DR = J(OD)2 - (R0)2
DR = J(5.725)2 - (1.0)2
CQ= J(CO)2 - (QO)2
CQ= J(5.725)2 - (1.25)2

178 14 Setting out
14.6 Elliptical arches
Example 14.3Calculate the ordinates for setting out an elliptical arch having a span of 3.0 m and a rise of 0.45 m
Solution:
The horizontal and vertical axes of an ellipse are called the major and minor axes, respectively (see Figure 14.11a).
(b)
X
This is basically a graphical method but can be based on a mathematical approach
(a)
f
s
ed
cba t
qn
lj
g
h k m p r
e
d
c
b
a
Major axis
Sem
imin
or a
xis
Figure 14.11
In this example the major axis = span = 3.0 m; the minor axis = 2 × rise = 2 × 0.45 = 0.90 m. Draw the two semicircles from the same centre, one with a radius of 1.5 m (half the major axis) and the other with 0.45 m (half the minor axis), as shown in Figure 14.11b.
Draw fi ve or any other convenient number of radii te, td, tc, tb and ta. A smooth curve passing through points x, g, j, l, n, q and s will yield part of the ellipse. Because the ellipse is symmetrical the calculated

179Setting out 14ordinates gh, jk, lm, etc. can also be used on the other side to complete the curve.
To locate the points g, j, l, n and q mathematically, draw vertical lines er, dp, cm, bk and ah. Now points a, b, c, d, e and f divide the quarter-circle into six equal parts so that the angle that each part makes at the centre is 15°°.
In triangle ert:
er/te = sin �rte
�er = te × sin�rte
= 1500 × sin 75°
= 1500 × 0.966 = 1448.9 mm
In triangle eqe�:
eq/e�e = sin 75°
�eq = e�e × 0.966 (e�e = 1500 – 450 = 1050)
= 1050 × 0.966 = 1014.3 mm
distance
= 388.2 mm
Ordinate qr = er – eq = 1448.9 – 1014.3
= 434.6 mm
In triangle dpt:
�dpt = 90° and �ptd = 60°
dp/td = sin �ptd
dp = td × sin 60°
dp = 1500 × 0.866 = 1299.04 mm
In triangle dnd�:
dn/d�d = sin 60°
dn = dd� × 0.866 = 1050 × 0.866 = 909.3 mm
Distance
= 750.00 mm
Ordinate np = 1299.04 – 909.3 = 389.7 mm
Similarly, ordinates lm, jk and gh can be calculated.
lm = 318.1 mm
mt = 1060.8 mm
jk = 225.0 mm
kt = 1299.0 mm
gh = 116.2 mm
ht = 1448.9 mm
rt = ~(te)' - (ef)'
rt = ~(1500)' - (1448.9)'
pt = ~(td)' - (Pd)'
pt = ~(1500)' - (1299.04)'

180 14 Setting out
Join points X, g, j, l, n, q and s to get a smooth curve. These ordinates and the corresponding horizontal distances ht, kt, mt, pt and rt can be used to set out the other half of the ellipse. Figure 14.11b shows the end result.
Exercise 14.1
The solutions to Exercise 14.1 can be found in Appendix 2.
1. The factory unit EDCF in Figure 14.1 measures 36 m by 15 m. Prepare suffi cient setting out information to enable the position of this factory unit to be established. Distances from stations A and B are: AB = 116.861 m; AF = 74.447 m; BF = 45.641 m; AC = 109.252 m; BC = 11.722 m.
2. Figure 14.12 gives dimensions of a building which is believed to be out of square. Calculate the lengths of suffi cient diagonals so that the squareness of the building can be fully checked.
7.00 m
C D
B
E F
A
H G
7.56
m
5.33
m5.
11 m
6.55 m 3.78 m
Figure 14.12
3. The plan of a bay window is formed by part of a circular curve of 3.0 m diameter. It is just less than a semicircle, having an inside dimension from chord to quadrant point of 1.4 m. Prepare data in the form of ordinate lengths so that the bricklayers will be able to set out the plan.
4. A circular arch has a span of 2.7 m and a rise of 1.0 m. Find the radius of the arch and the lengths of nine ordinates in order that the arch may be set out.
5. An elliptical arch has a span of 3.6 m and a rise of 1.2 m. Prepare setting-out data for the arch.

181Setting out 14 6. An old brick sewer, shown in Figure 14.13, has a short section that
has collapsed; the remainder is in good condition. The cheapest remedy is to rebuild the collapsed section. Prepare data so that a centre may be constructed.
3200 mm
1400
mm
Figure 14.13
Answers to Exercise 14.1
1. See Appendix 2.
2. Diagonal measurements are:
AG = 18.91 m EH = 14.48 m CG = 14.69 m
FH = 18.07 m HB = 10.30 m BD = 7.16 m
CE = 8.44 m AC = 7.57 m EG = 6.36 m
DH = 17.11 m
3. The fi ve ordinates on the left of the arch centre other than zero and 1.4 m are: 1.379 m, 1.314 m, 1.199 m, 1.018 m and 0.729 m.
4. R = 1.411 m. Splitting half the arch into eight strips, the seven intermediate ordinates are: 0.361 m, 0.572 m, 0.720 m, 0.828 m, 0.906 m, 0.959 m and 0.990 m.
5. Referring to Figure 14.14:
Horizontal distance Vertical distance
th = 1.739 m hg = 0.311 m
tk = 1.559 m kj = 0.600 m
tm = 1.273 m lm = 0.849 m

182 14 Setting out
tp = 0.900 m np = 1.039 m
tr = 0.466 m rq = 1.159 m
X
f
s
ed
cb
a
qn
lj
g
h k m p r t
e
d
c
b
a
Figure 14.14
6. Horizontal distance Vertical distance
th = 1.545 m hg = 0.362 m
tk = 1.386 m kj = 0.700 m
tm = 1.131 m lm = 0.990 m
tp = 0.800 m np = 1.212 m
tr = 0.414 m rq = 1.352 m

C H A P T E R15Costing: materials
and labour
Learning outcomes:
(a) Calculate the quantities of materials for a range of construction activities
(b) Work out the cost of materials
(c) Calculate the cost of labour for a range of construction activities
15.1 Introduction
One of the important branches of building technology is to prepare the estimates of the cost involved in constructing a building. The overall cost of a project determines its viability and enables the client to arrange capital for fi nancing the construction. The main components of the cost of constructing a building are the cost of materials, labour, plant and contractor’s profi t.
This chapter gives some examples on how to prepare approximate estimates. The costs of materials and labour are never constant and they also differ from one region to another. For the latest information on the cost of materials, labour and plant, reference should be made to publications which update this information at regular intervals.
15.2 Foundations
Concrete is by far the most commonly used material in the construction of foundations of buildings. For plain concrete, 1:3:6 concrete mix is usually used, but for reinforced concrete 1:2:4 or a stronger mix is used. As described in Chapter 12, the quantities of cement and aggregates for preparing a concrete mix may be determined by considering either their volume or mass. In this section we will consider how to work out the mass of the cement and the aggregates. This gives a better quality of concrete as we can take into account the moisture content of the aggregates if they are not dry.

184 15 Costing: materials and labour
Consider a 1:3:6 concrete mix. The density of concrete is approximately 2400 kg/m3 or in other words, 1 m3 of concrete has a mass of 2400 kg. To prepare 1 m3 of concrete the quantities of cement and the aggregates are:
Cement = = 240 kg (the quantity of cement is 1 part out of 10)
Fine aggregates = = 720 kg
Coarse aggregates = = 1440 kg
The amount of water depends on where the concrete is to be used. For strip foundations the amount of water could be about 50% of the amount of cement, giving a water–cement ratio of 0.5.
Example 15.1Calculate the cost of materials and labour required to construct the 1:3:6 concrete strip foundation shown in Figure 15.1, given that:
Cost of materials
Cement = £4.90 per 25 kg bag
Fine aggregates = £36.00 per 850 kg jumbo bag
Coarse aggregates = £36.00 per 850 kg jumbo bag
Labour
Approximate labour hours = 2 per m3 for mixing and placing concrete.
Hourly rate = £15.00
Solution:
Area of foundation = 2[(7.3 + 0.6 + 0.6) × 0.6 + (6.3 × 0.6)]
= 2[(8.5) × 0.6 + (3.78)]
= 17.76 m2
Volume of concrete = 17.76 × thickness
= 17.76 × 0.2 = 3.552 m3
The quantities of materials to prepare 1 m3 of concrete are given in Section 15.2. For preparing 3.552 m3 of concrete the quantities of materials and their costs are:
Material Mass
Cement 240 × 3.552 = 852 kg 35 × 25 kg bagsFine aggregates 720 × 3.552 = 2557 kg 3 × 850 kg jumbo bagsCoarse aggregates
1440 × 3.552 = 5115 kg 6 × 850 kg jumbo bags
Cost of cement = £4.90 × 35 = £171.50
Cost of fi ne aggregates = £36.00 × 3 = £108.00
1 10
X24OO
~X2400 10
6 - x2400 10

185Costing: materials and labour 15
Cost of coarse aggregates = £36.00 × 6 = £216.00
Total cost of materials = £495.50
Labour hours = 2 × 3.552 = 7.104
Labour cost = 7.104 × £15.00 = £106.56
Total cost (materials and labour) = £495.50 + £106.56 = £602.06
15.3 Cavity walls
The cavity walls in dwelling houses consist of 102.5 mm thick outer leaf of bricks and a 100 mm thick inner leaf of lightweight concrete blocks. The space between the two leaves, called the cavity, is 100 mm wide
(a) Foundation plan (b) Section
Concretestrip
Ground level60
060
0
600 7300
700
600
6300
200
600
(c) Cavity wall
200
600 wide stripfoundation
(All dimensions in mm)
G.L.
Figure 15.1

186 15 Costing: materials and labour
and provided with mineral wool or other insulation material suitable for the purpose.
Figure 15.2 shows a brick and a block as they are laid in the construction of walls. The dimensions shown are without the mortar joints. With 10 mm thick mortar joints their dimensions are:
Bricks: 225 × 102.5 × 75 mm
Concrete blocks: 450 × 100 × 225 mm
Surface area of one brick = 0.225 × 0.075 m = 0.0169 m2
Number of bricks per m2 = = 59.26, so 60
Surface area of one concrete block = 0.450 × 0.225 m = 0.10125 m2
Number of concrete blocks per m2 = = 9.88, so 10
(b) Concrete block
(a) Brick
100 mm
440 mm
215
mm
215mm102.5 mm
65 m
m
Figure 15.2
The quantity of mortar required for 1 m2 of brickwork is 0.026 m3 and for 1 m2 of blockwork is 0.012 m3.
1 0.0169
1 0.10125

187Costing: materials and labour 15Example 15.2A traditional cavity wall, 4.0 m × 2.8 m high, has a 2.0 m × 1.2 m high window. Calculate:
(a) The number of bricks and 100 mm thick aerated concrete blocks, and the quantities of cement and sand required to construct the wall. Allow for 5% extra bricks and blocks and 10% extra mortar.
(b) The cost of labour, if the labour rates are: £36.00/m2 for brickwork and £9.00/m2 for blockwork.
Solution:
Area of the wall = 4.0 × 2.8 – (2.0 × 1.2)
= 11.2 – 2.4 = 8.8 m2
Number of bricks = 8.8 × 60 = 528
Number of bricks with 5% extra allowance = 528 × 1.05 = 554.4, so 555
Note: For increasing a quantity by 5%, simply multiply it by 1.05. Similarly for increasing a quantity by 10%, multiply it by 1.10
The extra allowance of 5% may also be calculated as:
Number of 5% extra bricks = = 26.4, so 27
Number of bricks with 5% extra allowance = 528 + 27 = 555
Number of blocks = 8.8 × 10 = 88
Number of blocks with 5% extra allowance = 88 × 1.05 = 92.4, so 93
Mortar required for brickwork = 0.026 × 8.8 = 0.2288 m3
Quantity of mortar with 10% extra allowance = 1.1 × 0.2288 = 0.252 m3
Mortar required for blockwork = 0.012 × 8.8 = 0.1056 m3
Quantity of mortar with 10% extra allowance = 1.1 × 0.1056 = 0.116 m3
Brickwork
Assume the density of 1:3 cement/sand mortar to be 2300 kg/m3
Mass of 0.252 m3 of mortar = 0.252 × 2300 = 579.6 kg
Mass of cement =
Mass of sand =
Blockwork
Assume the density of 1:6 cement/sand mortar to be 2300 kg/m3
Mass of 0.116 m3 of mortar = 0.116 × 2300 = 266.8 kg
Mass of cement =
Mass of sand =
Total quantity of cement = 144.9 + 38.11 = 183.01 kg
Total quantity of sand = 434.7 + 228.69 = 663.39 kg
5 100 x 528
1 4 x 579.6 = 144.9 kg
3 'Ix 579.6 = 434.7 kg
1 7x 266.8 = 38.11 kg
6 7 x 266.8 = 228.69 kg

188 15 Costing: materials and labour
Cost of labour
Brickwork = £36.00 × 8.8 = £316.80
Blockwork = £9.00 × 8.8 = £79.20
15.4 Flooring
Softwood boards and chipboard sheets are used as fl oor-covering materials in dwelling houses. The thickness of these materials depends on the spacing between the fl oor joists. For a spacing of 400 mm between the joists, 18 mm thick fl oorboards and chipboard sheets are satisfactory. The coverage provided by tongued and grooved fl oor boards/chipboard is slightly less than their actual surface area as the tongue of one board fi ts into the groove of the next one. A fl oorboard measuring 2400 × 121 × 18 provides coverage of 0.272 m2. Figure 15.3 shows the joists and fl oorboards of an upper fl oor.
Softwood floorboards
Floor joists
(b)
(a)
Tongued and groovedfloorboards
Figure 15.3

189Costing: materials and labour 15Example 15.3Find the cost of providing and fi xing:
(a) Softwood fl oorboards in a room measuring 4.5 m × 3.9 m.
(b) Chipboard fl ooring in a room measuring 5.0 m × 4.2 m.
Floorboards measuring 3000 × 121 ×18 mm thick cost £29.50 for a pack of fi ve. One pack covers an area of 1.71 m2. Cost of labour is £10.00/m2.
One sheet of chipboard measuring 2400 × 600 × 22 mm thick costs £11.50. One sheet covers an area of 1.44 m2. Labour cost is £6.00/m2.
Allow wastage of 10%.
Solution:
(a)
Area of the fl oor = 4.5 × 3.9 m = 17.55 m2
Number of packs of fl oorboards =
= = 10.26
Wastage of 10% = 10.26 × = 1.026
Total number of packs required = 10.26 + 1.026 = 11.286 or 12
Cost of material = 12 × £29.50 = £354.00
Labour cost = 17.55 × £10.00 = £175.50
Total cost = £354.00 + £175.50 = £529.50
(b)
Area of the room = 5.0 × 4.2 = 21.0 m2
Area of one sheet of chipboard = 2.4 × 0.6 = 1.44 m2
Number of sheets required = = 14.58
Wastage of 10% = 14.58 × = 1.458
Total number of chipboard sheets = 14.58 + 1.458 = 16.038 or 16
Cost of material = 16 × £11.50 = £184.00
Labour cost = 21 × £6.00 = £126.00
Total cost = £184.00 + £126.00 = £310.00
15.5 Painting
Painting is necessary to give doors, windows, walls, etc. a fi nish that enhances their appearance and provides protection from dust, dirt and other harmful substances. In this section only the external surfaces of walls are considered. Some of the main factors that affect the amount of paint required are the type of surface, the number of coats and the type of paint.
10 100
21.0 1.44
10 100
17.55 coverage provided by one pack
17.55 1.71

190 15 Costing: materials and labour
Example 15.4The front wall of a house, shown in Figure 15.4, is fi nished with roughcast rendering and needs two coats of masonry paint. The spreading rate of paint is 3 m2 per litre. Find the cost of paint and labour if one fi ve-litre can of masonry paint costs £25.39, and the labour cost is £5.80 per m2.
(All dimensions in mm)
dpc
3000
9000
20001000
2100
1200
150
Figure 15.4
Solution:
The net area of the wall is calculated by subtracting the area of the door and window from the total wall area:
Area of roughcast fi nish on the wall = 9.0 × (3.0 – 0.15) – 2.0 × 1.2 – 2.1 × 1.0
= 25.65 – 2.4 – 2.1 = 21.15 m2
Volume of paint required =
= = 7.05 litres
Two coats of paint require 2 × 7.05 or 14.1 litres of paint
Number of fi ve-litre cans = = 2.82, so 3
Cost of paint = 3 × £25.39 = £76.17
Labour cost (two coats) = 21.15 × £5.80 = £122.67
Total cost = £76.17 + £122.67 = £198.84
Exercise 15.1
The solutions to Exercise 15.1 can be found in Appendix 2.
area of wall spreading rate of paint
21.15 3
14.1 5

191Costing: materials and labour 15For the following tasks refer to the relevant example for material and
labour costs:
1. Calculate the cost of materials and labour required to construct the 1:3:6 concrete strip foundation shown in Figure 15.5.
(All dimensions in mm)
(All dimensions in mm)
450 mm wide deep strip foundation
Brickwork
Blockwork
Deep strip foundation
(a) Foundation plan
(b) Section
(c)
450
450
450
150
750
7100
450
4508600
G.L.
Figure 15.5

192 15 Costing: materials and labour
2. Calculate the number of bricks and 100 mm thick aerated concrete blocks, and the quantities of cement and sand to construct a 5.5 m × 2.7 m high cavity wall with two 1.80 m × 1.2 m high windows. Allow for 5% extra bricks and blocks and 10% extra mortar.
3. Allowing wastage of 10%, fi nd the cost of providing and fi xing:
(a) softwood fl oorboards in a room measuring 5.0 m × 4.2 m
(b) chipboard fl ooring in a room measuring 4.5 m × 3.9 m.
4. The walls of a house, shown in Figure 15.6, are fi nished with roughcast rendering and need two coats of masonry paint. The spreading rate of paint is 3 m2 per litre. Find the cost of paint and labour if one fi ve-litre can of masonry paint costs £25.39, and the labour cost is £5.80 per m2.
915070
00
W2 W3
D2
D1
dpc
150
Plan
W1: 2000 × 1300 highW2: 1500 × 1300 highW3: 1200 × 1300 high
(a)
(b)
Front elevation
(All dimensions in mm)
(All dimensions in mm)
D1: 940 × 2000 highD2: 838 × 2000 high
D2 D2
W2
D2
W2 W2
W2
W1
2950
9150
Figure 15.6 (Continued)

193Costing: materials and labour 15
dpc
(c) 3D view showing front and side of building
dpc
(d) 3D view showing rear and side of the building
Figure 15.6 (Continued)
Answers to Exercise 15.1
1. Cost of materials = £1573.20
Cost of labour = £336.15
2. Number of bricks = 664
Number of blocks = 111
Mass of cement = 218.86 kg
Mass of sand = 793.6 kg
Labour: brickwork = £379.08; blockwork = £94.77
3. Softwood fl oorboards: material = £413.00; labour = £210.00
Chipboard fl ooring: material = £161.00; labour = £105.30
4. Cost of paint = £279.29; labour cost = £461.07

This page intentionally left blank

C H A P T E R16Statistics
Learning outcomes:
(a) Arrange data into groups and prepare frequency tables
(b) Calculate mean, mode and median of the given data
(c) Present the data/results in the form of a statistical diagram
(d) Prepare histograms, frequency polygons and cumulative frequency curves, and calculate the mode, median and interquartile range
16.1 Introduction
Statistics is a branch of mathematics that involves the collection, preparation, analysis, presentation and interpretation of data. The data may be either primary data or secondary data. Primary data are obtained from people by carrying out surveys via questionnaires and interviews. Primary data are published in many newspapers, journals, magazines and other publications. The collection of primary data can be very time consuming and expensive. The information obtained from opinion polls and market research surveys are typical examples of primary data.
Samples of primary data may be extracted for other purposes. This is known as secondary data.
16.2 Tally charts
The data collected from the questionnaires or publications may be aggregated using a tally chart. For example, in a survey, 25 people shopping in a DIY store were asked about the type of house/building they lived in. Their responses were: semi-detached (semi), detached, terraced, semi, bungalow, fl at, detached, fl at, terraced, semi, bungalow, fl at, semi, terraced, detached, semi, bungalow, fl at, terraced, semi, detached, fl at, fl at, semi, terraced. The fi ve types of accommodation are entered in the tally chart as shown in Table 16.1. To make the totalling easier and less

196 16 Statistics
confusing, the numbers are grouped in fi ves, four vertical bars and the fi fth a diagonal/horizontal through the four.
Tally charts may also be used for recording other data, such as traffi c counts.
16.3 Tables
Data may also be presented in a tabular form. Table 16.2 shows the variation in daily temperature and humidity in a college building.
Table 16.2
Week number
Day Temperature (°C)
Relative humidity (%)
1 MondayTuesdayWednesdayThursdayFriday
20.521.622.022.422.1
4345444650
2 MondayTuesdayWednesdayThursdayFriday
19.020.221.021.821.5
5251474345
16.4 Types of data
Depending on the method used, the data collected may be either discrete data or continuous data.
16.4.1 Discrete data
Data collected as integers (whole numbers) is called discrete data. For example, number of employees in construction companies, number of radiators in buildings, number of cars per family, etc.
Table 16.1
Accommodation Tally Number or frequency
FlatTerraced houseSemi-detached houseDetached houseBungalow
IIII IIIIIIIII IIIIIIIII
65743

197Statistics 1616.4.2 Continuous data
Continuous data, unlike discrete data, do not increase in jumps, but can have any value between the given limits. For example, height of people, daily temperatures, weight of people, cost of materials, labour costs, etc.
16.4.3 Raw data
In a survey involving the weight (kg) of fi rst-year college students, the following data were obtained:
60.1, 65.5, 63.6, 55.0, 58.8, 61.5, 65.9, 56.6, 55.2, 59.3, 56.5, 64.1, 63.2, 56.0, 58.3, 64.6, 57.4, 63.9, 66.0, 60.7
This is an example of raw data, as it is shown in the manner in which it was collected. It has not been re-arranged to show either ascending/descending values or any other form of arrangement.
16.4.4 Grouped data
The data given in Section 16.4.3 shows that the weight of the students varies between 55.0 kg and 66.0 kg. In order to present and understand the information easily, the data may be arranged in groups. The number of groups will depend on the amount of data. For a small set of data, e.g. 25–50 items, the number of groups may be 5–10. For larger amounts of data the upper limit should be 20. For the data shown in Section 16.4.3, the following groups may be used:
54.0–56.4 kg, 56.5–58.9 kg, 59.0–61.4 kg, 61.5–63.9 kg, 64.0–66.4 kg
A group is called a class and each class is specifi ed by two limits, the lower class limit and the upper class limit. For the fi rst class, 54.0 is the lower and 56.4 the upper limit. Theoretically, this class includes the data between 53.95 and 56.45. Therefore, 53.95 is called the lower class boundary and 56.45 the upper class boundary.
Example 16.1In a traffi c count, the following vehicles passed by the observation point between 0845 and 0846:
Car, heavy goods vehicle (HGV), car, motorbike, HGV, car, car, van, bus, car, bus, car, car, HGV, car, HGV, motorbike, van, bus, car, bus, van, car
Prepare a tally chart.
Solution:
There are fi ve types of vehicles that passed by the observation point. The tally chart is shown in Table 16.3.

198 16 Statistics
Table 16.3
Type of vehicle Tally Number or frequency
MotorbikeCarVanBusHGV
IIIIII IIIIIIIIIIIIIII
210 3 4 4
Example 16.2The crushing strengths (unit: N/mm2) of 50 concrete cubes are given here. Group the data into seven classes and fi nd the frequency of each class.
34 46 40 37 40 35 40 42 34 43 40 45
39 38 46 45 44 34 50 45 35 39 38 35
48 37 42 50 39 46 41 44 41 51 42 47
49 36 47 48 49 50 38 44 44 43 51 34
41 37 N/mm2
Solution:
The minimum and the maximum strengths are 34 N/mm2 and 51 N/mm2, respectively. The seven classes and their frequencies are shown in Table 16.4.
Table 16.4
Class interval Tally Frequency
32–3435–3738–4041–4344–4647–4950–52
IIIIIIII IIIIII IIIIIIII IIIIIII IIIIIIII IIIII
4 710 810 6 5Total = 50
16.5 Averages
After the collection of data, it is often necessary to calculate the average result. In statistics there are three types of average: mean, mode and median.

199Statistics 1616.5.1 The mean
The mean, also called the arithmetic mean, is calculated by dividing the sum of all items of the data by the number of items:
Mean =
This can also be written as: where (read as ‘x bar’) denotes the mean.
� x means the sum of all items of the data. (� (Sigma, a Greek symbol) is used to denote the sum in many mathematical operations) and n denotes the number of items of the data.
In the case of grouped data it becomes necessary to determine the class midpoint. The class midpoint is the average of the lower class boundary and the upper class boundary. For grouped data:
Mean,
where, x = class midpoint and f = frequency of each class.
16.5.2 The mode
The number that occurs most often in a set of data is called its mode. Sometimes the data may not have a clear mode and sometimes there may be more than one mode. In the case of grouped data, the class having the highest frequency is called the modal class.
16.5.3 The median
If the data are arranged in ascending or descending order, the middle number is called the median. Therefore, the median value of a set of data divides it into two equal halves.
16.5.4 Comparison of mean, mode and median
The mean is the most commonly used average in mathematics, science and engineering. This is the only average that involves all the data, but its value is easily affected if some of the values are extremely high or low as compared to the rest of the data. It can also give an answer that may be impossible, e.g. 2.8 children per family.
The median is not affected by extreme values, but large amounts of data are needed for the median value to be reliable. The median does not
sum olall items oldata number of items in the data
- l;fx X=-
l;f
- l;x X=
n n

200 16 Statistics
involve all the data, but, the answer is an actual value. Its calculation also involves the rearrangement of data in an ascending or descending order.
The mode is easy to fi nd and can be useful when the mean gives meaningless results, as in the example of the number of children per family. The mode of a data set can be an actual value, but sometimes the data may show more than one mode. Like the median, the mode does not involve all the data.
16.6 The range
The range is a measure of the spread or dispersion of data and is defi ned as the difference between the highest and the lowest values.
Range = highest value – lowest value
Sometimes, two or more sets of data have the same mean, but the data values are very different. For example, two groups of students conducted compression tests on concrete cubes made from the same concrete mix, and obtained the following data:
Group 1: 10, 15, 18, 20, 23, 28 N/mm2
Group 2: 15, 18, 19, 20, 21, 21 N/mm2
Both groups obtained the same mean strength of their samples, i.e. 19 N/mm2, but the actual data were very different. The range of the two sets shows this difference.
Group 1: Range = 28 – 10 = 18 N/mm2
Group 2: Range = 21 – 15 = 6 N/mm2
Group 2’s observations show more consistency as the range is smaller.The dispersion of data may also be calculated by determining the
interquartile range, which is described in Section 16.8.
Example 16.3A water absorption test was performed using a sample of 12 bricks. The results, expressed as a percentage, were:
13, 11, 12, 10, 12.5, 12.7, 13, 13.3, 11.2, 13.8, 15 and 13.
Calculate the mean, mode, median and range.
Solution:
(a) Mean:
=
= = 12.54%
- :Ex x=n
13+11 +12 + 10 + 12.5 + 12.7 + 13 + 13.3 + 11.2 + 13.8 + 15 + 13
12
150.5
12

201Statistics 16(b) The data have been arranged in an ascending order to fi nd the median
(middle number):
10, 11, 11.2, 12, 12.5, 12.7, 13, 13, 13, 13.3, 13.8, 15
There are two middle numbers: 12.7 and 13. The median is the mean of 12.7 and 13, i.e. 12.85%.
(c) Number 13 occurs three times, all other numbers occur once. Therefore, the mode is 13%.
(d)
Range = highest number – lowest number
= 15 – 10 = 5
Example 16.4In an investigation a group of students was asked to fi nd the compressive strength (N/mm2) of 40 bricks. The results were:
20 27 21 26 22 25 24 23 32 2728 27 29 28 27 20 29 28 27 2630 29 28 27 26 25 30 29 28 2724 23 35 28 34 29 33 30 32 31
Group the data into six classes and calculate the mean compressive strength.
Solution:
The six classes and their frequencies are shown in Table 16.5.
Table 16.5
Class interval
Class mid-point (x)
Frequency (f) f × x
19–2122–2425–2728–3031–3334–37
202326293235
3 51214 4 2
20 × 3 = 6023 × 5 = 11526 × 12 = 31229 × 14 = 40632 × 4 = 12835 × 2 = 70
f = 40 fx = 1091
Mean, = = 27.3 N/mm2
16.7 Statistical diagrams
After analysing the data, a variety of statistical diagrams may be used to present the results. The purpose of a diagram is not to display the details
_ I.fx 1091 x=-
I.f 40

202 16 Statistics
within the data, but to show the general pattern. Some commonly used diagrams are pictograms, bar charts, pie charts and line graphs.
16.7.1 Pictograms
Pictograms use pictures to show the information, and hence make the presentation of results more interesting as compared to other diagrams. A lot of care is required in selecting the picture. It should be able to represent all features of the data.
16.7.2 Bar charts
Bar charts consist of data represented in the form of vertical or horizontal bars of equal width. Their heights or lengths vary depending on the quantity they represent. A bar chart may consist of:
• single bars
• multiple bars
• component bars: multiple bars placed directly on top of each other
• Gantt charts: these charts show progress over a period of time
• back-to-back bars.
The fi rst two types are dealt with in Examples 16.5 and 16.6.
16.7.3 Pie charts
A pie chart or a pie diagram is a circle divided into a number of sectors, each sector representing one portion of the data. In order that the sizes of the sectors are in accordance with the quantities they represent, angles at the centre of a pie chart are determined. Several variations of a pie chart can be used, e.g. simple pie, exploded pie, three-dimensional pie, etc. Example 16.5 explains the procedure for producing pie charts.
16.7.4 Line graphs
A detailed discussion on line graphs has already been given in Chapter 8.
Example 16.5An architects practice employs 4 architect directors, 16 project architects, 20 architect assistants, 10 technicians and 6 administrative staff. Represent the data as: (a) a pictogram, (b) a vertical bar chart, (c) a horizontal bar chart (d) pie charts showing a simple pie and an exploded pie.

203Statistics 16Solution:
(a) The pictogram is shown in Figure 16.1.
Category of employees
Architect directors
Project architects
Architect assistants
Technicians
Administrative staff
Number
– Represents five employees
– Represents four employees
– Represents one employee
Figure 16.1
(b) In Figure 16.2 the x-axis represents the staff and the y-axis represents their numbers. The width of a bar is unimportant, but in a chart all bars should be of the same width. The height of the bars is proportional to the number or frequency they represent.
Archit
ect d
irect
ors
25
20
15
10
5 4
Freq
uenc
y
0
Projec
t arc
hitec
ts
16
Archit
ect a
ssist
ants
20
Tech
nician
s
10
Admini
strat
ive st
aff
6
Figure 16.2
(c) In a horizontal bar chart the length of a bar is proportional to the number or frequency it represents, as shown in Figure 16.3.

204 16 Statistics
Administrative staff 6
Frequency
0 5 10 15 20 25
Technicians 10
Architect assistants 20
Project architects 16
Architect directors 4
Figure 16.3
(d) There are fi ve types of employee to be shown on the pie chart. The total number of employees is 56, which the circle will represent. The
total angle at the centre of a circle is 360°, hence ° represents
one employee. Table 16.6 shows the angles representing the different categories of employees.
Table 16.6
Category of employee Number of employees
Angle representing each category
Architect directors 4 = = 25.7°°
Project architects 16 = = 102.9°
Architect assistants 20 = = 128.6°
Technicians 10 = = 64.3°
Administrative staff 6 = = 38.6°
The pie charts are shown in Figure 16.4. The exploded pie shows the sectors separated from one another.
(~~O)
360 x 16 56
360 x 20 56
360 x 10 56
360 x 6 56
(~~O)
360 x4 56
36()X16 56
"flO x 20 56
36() x10 56
360 x 6 56

205Statistics 16Technicians, 10
Administrative staff, 6
Administrative staff, 6
Architect directors, 4
Architect directors, 4
Project architects, 16
Project architects, 16
(a) Simple pie
(b) Exploded pie
Architect assistants, 20
Architect assistants, 20
128.6º
102.9º
25.7º
38.6º64.3º
Technicians, 10
Figure 16.4
Example 16.6Table 16.7 shows the typical prices of terraced, semi-detached and detached houses in a British town. These were recorded on 1 July each year, over a period of three consecutive years. Represent the data as a bar chart.
Table 16.7
Year Price (£)
Terraced Semi-detached
Detached
Year 1 75 000 145 000 200 000Year 2 90 500 170 000 220 000Year 3 115 000 190 000 265 000

206 16 Statistics
Solution:
Figure 16.5 shows the prices of the houses as a bar chart with multiple bars.
T – Terraced
S
Year 1
Price(£)
300,000
250,000
200,000
150,000
100,000
50,000
S – Semi detached
D – Detached
T
D
S
Year 2
T
D
S
Year 3
T
D
Figure 16.5
16.8 Frequency distributions
The frequency of a particular observation is the number of times it occurs in the data, as shown earlier in Tables 16.1 and 16.3. There are many ways in which the frequency distribution of the given data may be shown, some of which are frequency tables, histograms, frequency polygons and cumulative frequency polygons. The frequency tables are the same as tally charts, as shown in Tables 16.3 and 16.4.
16.8.1 Histograms
A histogram is like a bar chart but with connected bars or rectangles. In a bar chart a scale is only used for the y-axis, but in a histogram scales are used for both axes. This means that a histogram can be used to display continuous data. The area of a bar is equal to the class interval multiplied by frequency. Unlike a bar chart, the bars of a histogram can be of different widths. Usually the class intervals in a frequency distribution are of equal widths, in which case the heights of the bars represent the frequencies, as shown in Figure 16.6. A histogram can also be used to determine the mode of grouped data.
16.8.2 Frequency polygons
A frequency polygon is another method of representing a frequency distribution. It is drawn by plotting the frequencies at the midpoints of the

207Statistics 16groups, and joining the points by straight lines (see Figure 16.7a). Alternatively, a frequency polygon can be constructed by joining the mid points of the histogram bars by straight lines. As a polygon should be closed, extra class intervals are added and the straight lines extended to meet the x-axis, as shown in Figure 16.7b.
Example 16.7Thirty-two samples of timber were tested to determine their moisture content, the results of which are given in Table 16.8. Display the results as (a) a histogram and (b) a frequency polygon. Use the histogram to calculate the mode value.
Table 16.8
Moisture content (%)
8–10 11–13 14–16 17–19 20–22
Frequency 4 7 11 8 2
Solution:
(a) In a histogram the frequency is shown on the y-axis and the other quantity on the x-axis. In this example the moisture content is shown on the x-axis and the frequency on the y-axis. The next step is to select suitable scales and mark them on the x-axis and y-axis.
As the group sizes (or class intervals) are the same, bars of uniform width will be used. To show the fi rst bar two vertical lines are drawn, one at the lower class boundary (7.5%) and the other at the upper class boundary (10.5%) of the fi rst class. The height of the bar should be equal to the frequency of the group. Therefore, a horizontal line is drawn from the point that represents a frequency of 4. This produces the fi rst bar; similarly, the rest of the diagram is drawn as shown in Figure 16.6.
Moisture content (%)
Freq
uenc
y
12
10
8
6
4
2
7 9 11 13 15
c
a
b
d
17 19 21 23
o
e
Figure 16.6

208 16 Statistics
(b) A frequency polygon may be drawn as explained above. The fi rst step is to determine the class midpoints and then to plot them against relevant frequencies. The class midpoints in this example are 9, 12, 15, 18 and 21. The points are joined by straight lines, as shown in Figure 16.7a. As a polygon should be closed, extra class intervals are added and the straight lines extended to meet the x-axis, as shown in Figure 16.7b.
Moisture content (%)(a)
Freq
uenc
y
12
10
8
6
4
2
3 5 7 9 11 13 15 17 19 21 23
Moisture content (%)(b)
Freq
uenc
y
12
10
8
6
4
2
3 5 7 9 11 13 15 17 19 21 23 25
Figure 16.7
To determine the mode value, draw diagonal lines ab and cd in the tallest bar. Draw a vertical line from the point of intersection, o, to meet the x-axis at e. Point e gives the mode value, which in this case is 15.2%.
16.8.3 Cumulative frequency distribution
A cumulative frequency curve may also be used to represent a frequency distribution. To draw a cumulative frequency curve, the data are grouped into an appropriate number of classes as in the case of frequency polygons. Cumulative frequency is then determined for each class as a number less than the upper class boundary. The cumulative frequencies are plotted against corresponding upper class boundaries and the points joined by a smooth curve. The curve is called a cumulative frequency curve or ogive.

209Statistics 16Cumulative frequency curves may be used to determine the median
and the dispersion of the data. As discussed in Section 16.5.3, the median divides the frequency distribution into two equal halves. The values, which divide the data into four equal parts, are called quartiles and denoted by Q1, Q2 and Q3. Q1 is called the lower quartile or fi rst quartile. Q2, called the middle quartile or second quartile, is equal to the median of the data. Q3 is called the upper quartile or third quartile. The difference between the upper and lower quartiles is called the interquartile range:
Interquartile range = Q3 – Q1
Interquartile range is one of the measures used to determine the dispersion of the data. The main advantage of using the interquartile range is that only the middle half of the data is used and thus this measure is considered to be more representative than the range
Example 16.8Use the data given in Example 16.7 to draw a cumulative frequency curve, and fi nd:
(a) the median moisture content
(b) the interquartile range
(c) the number of samples with moisture content less than 14%.
(d) the number of samples with moisture content more than 18%.
Solution:
Before the data are plotted we need to fi nd the cumulative frequency for each class (or group). This is shown in Table 16.9. The fi rst two columns show the same data as displayed in table 16.8.
Table 16.9
Class interval (moisture content)
Frequency Moisture content – less than
Cumulative frequency
7.5 0 8–10 4 10.5 411–13 7 13.5 4 + 7 = 1114–16 11 16.5 11 + 11 = 2217–19 8 19.5 22 + 8 = 3020–22 2 22.5 30 + 2 = 32
The cumulative frequencies are calculated as shown and plotted against the upper class boundaries. A smooth curve is drawn through the points to get the cumulative frequency curve. The cumulative frequency is divided into four parts, as shown in Figure 16.8.
Q1 = 8, Q2 = 16 and Q3 = 24.

210 16 Statistics
Moisture content (%)
Cum
ulat
ive
Freq
uenc
y
35
30
25
20
15
10
5
252015105
26.5
12
75%
18%
14%
Q3
= 1
7.25
%
Q2
= 1
5.25
%
50%
25%
Q1
= 1
2.5%
Figure 16.8
(a) Median moisture content = 15.25% (Q2)
(b) Interquartile range = Q3 – Q1 = 17.25 – 12.5 = 4.75
(c) The cumulative frequency corresponding to 14% moisture content is 12. Therefore, the moisture content of 12 samples is below 14%.
(d) The cumulative frequency corresponding to 18% moisture content is 26.5. Therefore, the number of samples with moisture content more than 18% is 32 – 26.5 = 5.5 or 6.
Exercise 16.1
The solutions to Exercise 16.1 can be found in Appendix 2.
1. Twelve samples of sand were tested to determine their silt content. The amounts of silt, expressed as a percentage, were: 6.0, 8.5, 7.1, 6.3, 5.5, 7.8, 8.2, 6.5, 6.0, 7.7, 8.0 and 7.2. Calculate the mean, mode and median silt contents.
2. The moisture contents (%) of 15 samples of timber were determined in a laboratory and are shown below. Calculate the mean, mode, median and range: 11.5, 14, 11, 12, 13.5, 10, 12.5, 12.8, 13, 13.3, 11.4, 13.6, 15, 10.5 and 9.8.
3. The crushing strengths (unit: N/mm2) of 45 concrete cubes are given here. Group the data into seven classes and fi nd:
(a) the frequency of each class
(b) the mean crushing strength.

211Statistics 1634 40 45 39 35 38 46 45 4434 50 45 35 39 38 35 37 3943 48 37 42 50 39 46 41 4441 51 42 47 49 36 47 48 4950 38 44 44 43 51 34 41 37
4. The number of personnel in S & R Consulting Engineers is given in the table:
Directors Associate directors
Civil engineers
Technician engineers
Technicians Administrative staff
3 4 3 3 4 4
Represent this information in the form of
(a) a vertical bar chart
(b) a horizontal bar chart
(c) a pie chart.
5. The table below shows the typical prices of terraced, semi-detached and detached houses in a British town. These were recorded on 1 August each year over a period of three consecutive years. Represent the data as a bar chart.
Year Price (£)
Terraced Semi-detached Detached
Year 1 80 000 150 000 220 000Year 2 92 500 185 000 235 000Year 3 120 000 200 000 270 000
6. A multinational construction company has recently published the annual data on the number of accidents that occurred at its construction sites. The following extract shows the number of accidents that occurred due to trenches and excavations:
Depth of trench/excavation
0.1–1.5 m 1.6–3.0 m 3.1–4.5 m 4.6–6.0 m 6.1 m and over
Number of accidents
32 23 22 9 4
Represent the data as:
(a) a pie chart
(b) a horizontal bar chart.
7. A group of construction students were asked to fi nd the level of illuminance (unit: lux) in different rooms of a building. Their observations were:
370 400 500 450 425 500 400550 450 350 520 450 460 350

212 16 Statistics
410 500 410 330 460 400 380430 470 370 390 420 360 460380 450 440 360 470 490 510460 530 440 480 440
(a) Group the data into 6–8 classes and prepare a frequency chart.
(b) Display the illuminance levels as a histogram and a frequency polygon.
(c) Determine the mean and mode of the data.
8. The table below shows the compressive strength of 35 samples of concrete (1:2:4 concrete):
Compressive strength (N/mm2)
19–22 23–26 27–30 31–34 35–38
Frequency 3 7 15 6 4
(a) Display the compressive strength as a histogram and a cumulative frequency curve.
(b) Determine the mean, mode and median of the data.
9. The following table shows the compressive strength of class-B engineering bricks:
Compressive strength (N/mm2)
34–37 38–41 42–45 46–49 50–53 54–57 58–61
Frequency 2 8 15 20 13 10 2
(a) Prepare a cumulative frequency chart and plot the data to produce a cumulative frequency curve.
(b) Find the median compressive strength and the interquartile range.
Answers to Exercise 16.1
1. Mean = 7.07%; median = 7.15%; mode = 6.0%
2. Mean = 12.26%; there is no mode; median = 12.5%; range = 5.2%
3. (a) See Appendix 2
(b) Mean = 42.33 N/mm2
4. (a) See bar chart in Appendix 2
(b) See bar chart in Appendix 2
(c) See pie chart in Appendix 2
5. See Appendix 2
6. (a) See pie chart in Appendix 2
(b) See bar charts in Appendix 2

213Statistics 167. (a) See Appendix 2
(b) See Appendix 2
(c) Mean = 440.5 lux; Mode = 456 lux
8. (a) See Appendix 2
(b) Mean = 28.6 N/mm2; Mode = 28.5 N/mm2; Median = 28.5 N/mm2
9. (a) See ogive in Appendix 2
(b) Median = 47.5 N/mm2; Interquartile range = 7.5

This page intentionally left blank

C H A P T E R17Areas and volumes (2)
Learning outcomes:
(a) Perform calculations to determine the surface area of cones and pyramids
(b) Perform calculations to determine the surface area and volume of a frustum of a pyramid
(c) Perform calculations to determine the surface area and volume of a frustum of a cone
17.1 Introduction
In this chapter we shall calculate the surface area of cones, pyramids and frusta of cones and pyramids. We shall defi ne the frustum of a pyramid/cone and use the standard formulae to determine their surface areas and the volume enclosed. There are many practical problems that can be solved by using the methods explained in this chapter. As the solution to these problems requires the use of complex formulae, this chapter will be more relevant to the students on level 3 and level 4 courses.
17.2 Surface area of a pyramid
The base of a pyramid may be a triangle, rectangle, square or any other polygon, but the lateral faces in each case are triangles. As the lateral faces slope at a certain angle, we must determine their true length before we can use the formula:
Area of a triangle = .
If the vertex is vertically above the centre of the base, the pyramid is known as a right pyramid. A pyramid is also known as a regular pyramid if its base is a regular fi gure.
base x height 2

216 17 Areas and volumes (2)
Example 17.1The roof of a building is in the form of a pyramid. If the base measures 30 m × 30 m, and the perpendicular height is 7.0 m, calculate the area of the roof covering.
Solution:
Figure 17.1 shows the elevation and sectional view of the roof. Use Pythagoras’ Theorem to fi nd the true length of the sloping face.
Elevation
15 m
30 m
15 m
7.0
m
7.0
m
(b)(a)
Section
G
C
CF O
B
F
ED
O
AA
30 m
Figure 17.1
(AF)2 = (AO)2 + (OF)2
= (7)2 + (15)2 = 274
AF = = 16.55 m
Area of face ABE =
= = 248.25 m2
Due to the symmetry of the (pyramid) roof, all lateral faces are equal.
Total area of roof covering = 4 × 248.25 = 993 m2
17.2.1 Frustum of a pyramid
Imagine a pyramid being cut by a plane parallel to the base. The portion of the pyramid between the cutting plane JKLM and base EFGH is known as a frustum. In this case the lateral faces are not triangles but trapezia, as shown in Figure 17.2.
The volume (V) of a frustum of a pyramid is given by:
Volume = h(A + + B)
where A and B are the areas of the base and the top (see Figure 17.2) and h is the vertical height of the frustum.
1 3
base x height 2
30 x 16.55 2
1 -
3
base x height
2 30 x 16.55
2
2
2

217Areas and volumes (2) 17
Example 17.2The roof of an old building is shaped like a frustum of a pyramid (Figure 17.3). Find the surface area of the roof and the volume enclosed.
Solution:
Figure 17.4 shows a vertical section through the middle of the frustum.
4 m
6 m 4 m
4 m 4 m LJ
PK O M
Figure 17.4
Surface area:
Length of the lateral side (JK) =
=
= 7.21 m
Area of side EFBA = (8 + 20) × 7.21 = 100.94 m2
Total surface area = area of lateral sides + area of the top
= (4 × 100.94) + (8 × 8)
= 467.76 m2
Area of top = B
Area of base = A
L
K
G
FE
H
h
J
M
Figure 17.2
GL
J F
C
M
KBA
O
D
E
H
20 m20 m
8 m
8 m
4 m
Figure 17.3
1
2
~(Jp)'+(pK)'
~(4)' +(6)'

218 17 Areas and volumes (2)
Volume enclosed by the roof:
Volume = h(A + + B)
Vertical height of the roof = 4 m
Area of the top (B) = 8 × 8 = 64 m2
Area of the base (A) = 20 × 20 = 400 m2
Volume = 4(400 + + 64)
= 4(400 + 160 + 64)
= 4(624) = 832 m3
17.3 Surface area of a cone
If a cone (Figure 17.5a) is made of paper and the paper is cut along the joint, the shape of the paper will be like the sector of a circle, as shown in Figure 17.5b.
Arc length = 2πr
(a) (b)
O
O
r
ll
radius = l
Figure 17.5
Lateral surface area = �rl
where, r = radius of the base, l = slant height.
Example 17.3A historical building has circular towers at each corner. The roof of each tower is in the form of a regular cone. If the diameter of one of the towers is 10 m and the height of its conical roof is 4.0 m, fi nd the surface area of the roof.
Solution:
Radius of the base = Diameter ÷ 2
= 10 ÷ 2 = 5 m
1
3
1 3 J400x64
1 3 1 3
J400

219Areas and volumes (2) 17Height of the roof = 4.0 m
Slant height = = 6.403 m
Surface area of the roof = �rl
= � × 5 × 6.403 = 100.58 m2
17.3.1 Frustum of a cone
The area of the lateral surface of a conical frustum (Figure 17.6) is given by:
Area = �l(r + R)
Total surface area = area of the top + �l(r + R) + area of the base
= �r2 + �l(r + R) + �R2
Volume = �h(r2 + rR + R2)
Area of top = πr2
hl
R
r
Area of base = πR2
Figure 17.6
Example 17.4The roof of a part of a historical building is shaped like a frustum of a cone, as shown in Figure 17.7. Find the surface area of the roof and the volume of the space enclosed.
h
3 m
1 m
(a) (b)
3 m
1 m
1 m 2 m
3 m
Figure 17.7
3 3
3 3

220 17 Areas and volumes (2)
Solution:
Surface area of the roof:
Slant height (l) = = 3.606 m
Total surface area of the roof = �r2 + �l(r + R)
= �(1)2 + � × 3.606 (1 + 3)
= 3.142 + 45.314
= 48.456 m2
Volume enclosed by the roof:
Volume = �h(r2 + rR + R2)
= � × 3(12 + (1 × 3) + 32)
= � × 3(1 + 3 + 9)
= � × 3(13) = 40.84 m3
Exercise 17.1
The solutions to Exercise 17.1 can be found in Appendix 2.
1. The roof of a building is in the form of a pyramid. If the base measures 35 m × 35 m, and the perpendicular height is 7.5 m, calculate the surface area of the roof.
2. A multi-storey building is shaped like a cone. The height of the building is 60 m and the diameter of its base 50 m. Calculate its surface area.
3. Find the area of external cladding for the building in question 2 if the doors and windows have a combined area of 500 m2.
4. The roof of a building is shaped like the frustum of a pyramid. The dimensions of the base and the top are 45 m × 45 m and 5 m × 5 m, respectively. If the perpendicular height of the roof is 6 m, calculate:
(a) the surface area of the roof
(b) the volume enclosed by the roof.
5. During the process of making ready-mixed concrete the dry mixture is placed in a container which is in the form of an inverted frustum of a right cone 4.5 m high while the top and bottom diameters are 4 m and 2 m, respectively. The base is sealed to another vessel in the form of a shallow inverted right cone 2 m diameter but only 0.5 m high. What is the combined volume of the two vessels?
6. What will be the combined curved surface area of the two containers in question 5?
7. Two water fi lters are designed to fi t into a 150 mm diameter pipe. One consists of a right circular cone 150 mm diameter at its base and 350 mm long. The other consists of a frustum of the same cone with
1
3 1 3 1
3 1 3
1
3 1
3 1
3
1 3
3 3

221Areas and volumes (2) 17the smaller end sealed. The length of the frustum is 200 mm. Its whole surface area acts as a fi lter. Find:
(a) the diameter of the smaller end of the frustum
(b) which fi lter has the greater surface area and by how much.
Answers to Exercise 17.1
1. 1332.76 m2
2. 5105.09 m2
3. 4605.09 m2
4. (a) 2113.06 m2; (b) 4550 m3
5. 33.51 m3
6. 46.96 m2
7. (a) 64.29 mm; (b) The cone has a larger surface area by 12 245.11 mm2

This page intentionally left blank

C H A P T E R18Areas and volumes (3)
Learning outcomes:
(a) Calculate the area of irregular shapes using the mid-ordinate rule, trapezoidal rule and Simpson’s rule
(b) Use the trapezoidal rule and Simpson’s rule to determine the volume of irregular solids and their application to practical problems
(c) Apply the prismoidal rule to determine the volume of trenches, cuttings and embankments
18.1 Introduction
There are many situations in which we are faced with the determination of the area of plane fi gures which are bounded by straight lines, and curved lines that do not follow any regular geometrical pattern. The approximate area of an irregular shape can be determined easily by using a range of methods such as graphical technique, planimeter, mid-ordinate rule, trapezoidal rule and Simpson’s rule. In this chapter the last three are explained with examples, and later their use is extended to determine the volume of irregular objects.
18.2 Mid-ordinate rule
The irregular fi gure is divided into a number of strips of equal width by vertical lines, called ordinates. Each strip is considered as approximating to a rectangle of length equal to its mid-ordinate, as shown in Figure 18.1. The mid-ordinate of each strip can be determined by calculating the average of its ordinates. The area of a fi gure is fi nally calculated by adding the areas of all the strips.

224 18 Areas and volumes (3)
Mid-ordinates
w
y1
w
y2
w
y3
w
y4
w
y5
w
y6
w
y7
Figure 18.1
Area = wy1 + wy2 + wy3 + wy4 + . . . + wy7
= w (y1 + y2 + y3 + y4 + . . . + y7)
Area = width of strip × sum of mid-ordinates
18.3 Trapezoidal rule
The irregular fi gure is divided into a number of strips of equal width w (Figure 18.2). Each strip is assumed to be a trapezium. Consider the fi rst strip ACDB; its parallel sides are y1 and y2 and the distance between them is w.
w w w w w
y1
B
A
D F H K M
L
J
GE
C
y2 y3 y4 y5 y6
Figure 18.2
Area of strip ACDB = (y1 + y2) w
Area of strip CEFD = (y2 + y3) w
1 2 1 2

225Areas and volumes (3) 18Similarly, the area of other strips can be calculated. Finally, all the areas are added to fi nd the area of fi gure ALMB.
Area of fi gure ALMB
= (y1 + y2)w + (y2 + y3)w + . . .+ (y5 + y6)w
= w + + + +
= w
= width of strip × [ (sum of the fi rst and last ordinates)
+ (sum of the remaining ordinates)]18.4 Simpson’s rule
This method is more complicated than the previous methods but gives a more accurate answer. The fi gure is divided into an even number of vertical strips of equal width (w), giving an odd number of ordinates (Simpson’s rule will not work with an even number of ordinates).
Area = (width of strip) [(fi rst + last ordinate) + 4 (sum of the even
ordinates) + 2 (sum of the remaining odd ordinates)]
Example 18.1Find the area of the irregular shape shown in Figure 18.3 using the mid-ordinate rule, the trapezoidal rule and Simpson’s rule. Compare the results obtained if the exact answer is 25.33 cm2.
Even ordinates = 2 cm, 10 cm
Firstordinate
Lastordinate
1 cm
1.0 1.0
2 cm
5 cm
10 cm
1.0 1.0 cm
17 cm
Figure 18.3
1 3
1 2
1 2
1
2
= w (y,+ y, + y, + Ya + Ya ; Y. + Y. + y, + y, + y, )
(y,+y, 2y, 2Ya 2y. 2Y,) 22222
(y,;y, +Y,+Ya+Y4+Y')
1 2

226 18 Areas and volumes (3)
Solution:
Mid-ordinate rule:
Mid-ordinate of the fi rst strip = = 1.5
Mid-ordinate of the second strip = = 3.5
Mid-ordinates of the third and fourth strip are 7.5 and 13.5, respectively.
Area = width of strip × sum of mid-ordinates
= 1.0 × (1.5 + 3.5 + 7.5 + 13.5) = 26 m2
Trapezoidal rule:
Area = width of strip × [ (sum of fi rst and last ordinates) + (sum of the
remaining ordinates] = 1.0 × [ (1 + 17) + (2 + 5 + 10)] = 1.0 × [9 + 17] = 26 m2
Simpson’s rule:
Area = × (width of strip) [(fi rst + last ordinate) + 4 (sum of the even
ordinates) + 2 (sum of the remaining odd ordinates)]
= (1.0) [(1 + 17) + 4 (2 + 10) + 2 (5)]
= (1.0) [(18) + 48 + 10]
= (1.0) [76] = 25.33 m2
The answer produced by the mid-ordinate rule as well as the trapezoidal rule is 26 m2, which is higher than the exact area. Simpson’s rule, considered to be more accurate than the other two methods, has produced an accurate answer in this example.
Example 18.2Calculate the area of the plot of land shown in Figure 18.4
28 m 30 m 32 m 33 m 35 m 32 m 29 m
10 m 10 m 10 m 10 m 10 m 10 m
Figure 18.4
1 3
1
3 1 3 1
-
3
1 2
1 2
1 + 2 2
2+5 2

227Areas and volumes (3) 18Solution:
Mid-ordinate rule:
Area = width of strip × sum of mid-ordinates
= 10 (29 + 31 + 32.5 + 34 + 33.5 + 30.5)
= 10 (190.5) = 1905 m2
Trapezoidal rule:
Area = width of strip × [ (sum of the fi rst and last ordinates) + (sum of
the remaining ordinates)] = 10 × [ (28 + 29) + (30 + 32 + 33 + 35 + 32)] = 10 [190.5] = 1905 m2
Simpson’s rule:
Area = × (width of strip) [(fi rst + last ordinate) + 4 (sum of the even
ordinates) + 2 (sum of the remaining odd ordinates)]
= (10) [(28 + 29) + 4 (30 + 33 + 32) + 2 (32 + 35)]
= (10) [(57) + 380 + 134]
= (10) [571] = 1903.33 m2
18.5 Volume of irregular solids
The volume of irregular solids may be determined by any of the three methods explained in the previous section, i.e. the mid-ordinate rule, the trapezoidal rule and Simpson’s rule. The only difference is that rather than the ordinates, the cross-sectional areas are used in the volume calculations.
Trapezoidal rule:
Volume = Width of strip × [ (fi rst area + last area) + (sum of the
remaining areas)]Simpson’s rule:
Volume = (width of strip) × [(fi rst area + last area) + 4 (sum of the
even areas) + 2 (sum of the remaining odd areas)]
Example 18.3The cross-sectional areas of a trench at 10 m intervals are shown in Figure 18.5. Use the trapezoidal rule and Simpson’s rule to calculate the volume of earth excavated.
1 -
3
1 -
3 1
-
3 1 3
1 -
3
1 -
2
1 -
2
1 -
2

228 18 Areas and volumes (3)
1.44 m2
10 m
10 m
10 m
10 m
1.62 m21.83 m2
2.0 m22.1 m2
Figure 18.5
Solution:
Trapezoidal rule:
A1 = 1.44 m2, A2 = 1.62 m2, A3 = 1.83 m2, A4 = 2.0 m2, A5 = 2.1 m2
Volume = 10 × [ (1.44 + 2.1) + (1.62 + 1.83 + 2.0)]Volume = 10 × [(1.77) + (1.62 + 1.83 + 2.0)]
= 10 [1.77 + 5.45] = 72.2 m3
Simpson’s rule:
Volume = (width of strip) [(fi rst area + last area) + 4 (sum of the even
areas) + 2 (sum of the remaining odd areas)]
= (10) [(1.44 + 2.1) + 4 (1.62 + 2.0) + 2 (1.83)]
= (10) [(3.54) + 4 (3.62) + 2 (1.83)]
= (10) [3.54 + 14.48 + 3.66]
= (10) [21.68] = 72.267 m3
18.6 Prismoidal rule
The prismoidal rule is basically Simpson’s rule for two strips, and may be used to determine the volume of prisms, pyramids, cones and frusta of cones and pyramids.
Volume, by prismoidal rule = (width of strip) × [(area of one end + 4
(area of the middle section) + area of the other end]
= (width of strip) [A1 + 4 (A2) + A3]
1 -
2
1 -
3
1 -
3 1
-
3 1
-
3
1 -
3
1 -
3
1 -
3

229Areas and volumes (3) 18where A1 = area of one end of the object; A2 = area of the mid-section; A3 = area of the other end of the object
If h is the height or length of the solid (see Figure 18.6), the height/
length of one strip is .
h—2
h—2
Figure 18.6
Volume = [A1 + 4 (A2) + A3]
= [A1 + 4 (A2) + A3]
Example 18.4An excavation for a basement measures 50 m × 40 m at the top and 44 m × 34 m at the base. If the depth of the excavation is 3.0 m, use the prismoidal rule to calculate the volume of the soil to be excavated.
Solution:
The dimensions at the mid-section of the excavation are:
Length = = 47 m; width = = 37 m
Depth of the excavation, h = 3.0 m
Area of top (A1) = 50 × 40 = 2000 m2
Area of mid-section (A2) = 47 × 37 = 1739 m2
Area of base (A3) = 44 × 34 = 1496 m2
Volume = [A1 + 4 (A2) + A3]
= [2000 + 4 (1739) + 1496]
= [10 452] = 5226 m3
h -
6
50+44 2
h -
6 3 -
6 3 -
6
h
2
40+34 2
h -
6
50+44 2
h -
6 3 -
6 3 6
h
2
40+34 2
6 6
6 6

230 18 Areas and volumes (3)
Exercise 18.1
The solutions to Exercise 18.1 can be found in Appendix 2.
1. Find the area of the irregular shape shown in Figure 18.7, using the mid-ordinate rule and the trapezoidal rule. Compare the results obtained if the exact answer is 25.833 cm2.
13.5 cm
9 cm
1 cm1 cm1 cm1 cm1 cm
1 cm 5.5 cm3 cm
1.5 cm
Figure 18.7
2. Find the area of the building plot shown in Figure 18.8 using any two methods and compare the results obtained.
45 m 52 m 56 m 53 m 49 m 45 m 43 m
15 m 15 m 15 m 15 m 15 m 15 m
Figure 18.8

231Areas and volumes (3) 18 3. Find the area of the irregular shape shown in Figure 18.9 by using
Simpson’s rule.
2 cm2.5 cm
3.3 cm4.6 cm
6.3 cm
8.2 cm
3 cm
10.9 cm
3 cm3 cm3 cm3 cm3 cm
Figure 18.9
4. Figure 18.10 shows the longitudinal section of a trench to be excavated in undulating ground. The depths of the drain below the ground surface are shown at intervals of 12 m. Calculate:
(a) the area of the section, by the trapezoidal rule
(b) the volume of the earth to be excavated – width of the trench = 1.2 m.
Drain
(All measurements in metres)
12
1.25 1.25 1.4 1.65 1.6 1.6 1.8 1.9 2.15
12 12 12 12 12 12 12
Figure 18.10

232 18 Areas and volumes (3)
5. Calculate the area of the building plot shown in Figure 18.11.
(All measurements in metres)
12 12
11
2332 37 29
16
12
23
31 29
22
12
12 12 12 12 12
Figure 18.11
6. Draw a scale diagram of the building plot shown in Figure 18.12 and divide it into a number of strips. Find the length of the ordinates and hence calculate the area of the building plot.
105 m
95 m
100 m
114
m
50º
A
BC
D
Figure 18.12
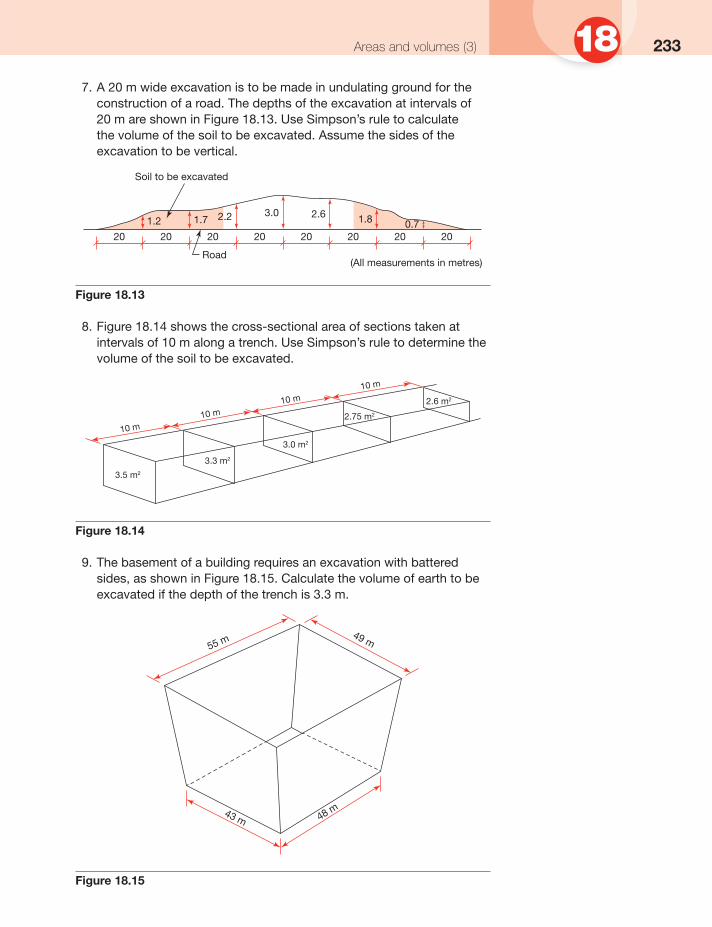
233Areas and volumes (3) 18 7. A 20 m wide excavation is to be made in undulating ground for the
construction of a road. The depths of the excavation at intervals of 20 m are shown in Figure 18.13. Use Simpson’s rule to calculate the volume of the soil to be excavated. Assume the sides of the excavation to be vertical.
20 20 20
1.2 1.7
20 20 20 20
2.2 3.0 2.6 1.8 0.720
(All measurements in metres)Road
Soil to be excavated
Figure 18.13
8. Figure 18.14 shows the cross-sectional area of sections taken at intervals of 10 m along a trench. Use Simpson’s rule to determine the volume of the soil to be excavated.
3.5 m2
3.3 m2
3.0 m2
2.75 m2
2.6 m2
10 m
10 m
10 m
10 m
Figure 18.14
9. The basement of a building requires an excavation with battered sides, as shown in Figure 18.15. Calculate the volume of earth to be excavated if the depth of the trench is 3.3 m.
55 m49 m
43 m 48 m
Figure 18.15

234 18 Areas and volumes (3)
10. The plan of an excavation is shown in Figure 18.16, with the depth at the corners circled. What is the volume of the soil to be excavated?
40 m
15 m
30 m12 m
0 m
17 m
0 m
Figure 18.16
Answers to Exercise 18.1
1. 26.25 cm2 (mid-ordinate rule); 26.25 cm2 (trapezoidal rule)
2. 4485 m2 (mid-ordinate rule); 4485 m2 (trapezoidal rule); 4490 m2 (Simpson’s rule)
3. 93.3 cm2
4. (a) 154.8 m2; (b) 185.76 m3
5. 3324 m2
6. 10 656.48 m2
7. 5306.67 m3
8. 121 m3
9. 7829.25 m3
10. 6137.5 m3

C H A P T E R19Trigonometry (2)
Learning outcomes:
(a) Show, that in �ABC:
(sine rule)
a2 = b2 + c2 – 2bc cos A (cosine rule)
(b) Apply the sine rule and the cosine rule to solve triangles and practical problems in construction
(c) Find the area of a triangle if two sides and the included angle are given
19.1 The sine rule and the cosine rule
In Chapter 13 we applied the trigonometrical ratios to determine the unknown angles and sides of right-angled triangles. For triangles without a right angle, the trigonometrical ratios cannot be applied directly; instead sine and cosine rules may be used to determine the unknown angles and sides.
19.1.1 The sine rule
The sine rule states that in any triangle the ratio of the length of a side to the sine of the angle opposite that side is constant:
= =
where a, b and c are the sides of �ABC, as shown in Figure 19.1. Side a, b and c are opposite �A, �B and �C, respectively.
abc sin A = sinB = sinG
abc sinA sinB sinG

236 19 Trigonometry (2)
A
a
bc
B C
Figure 19.1
To prove the sine rule, draw a perpendicular from A to meet line BC at point D (Figure 19.2a). Triangles ADB and ACD are right-angled triangles; therefore we can apply the trigonometric ratios to determine the length of AD. In �ADB,
Therefore, AD = c sin B (1)
Similarly in �ACD, AD = b sin C (2)
From equations (1) and (2):
c sin B = b sin C
or = (3)
In �BAC, draw a perpendicular from B to meet line CA at E, as shown in Figure 19.2b.
A
D
B a
c b a c
C
(a)
B
E
C b A
(b)
Figure 19.2
In �BAE,
Therefore, BE = c sin A (4)
Similarly in �BEC, BE = a sin C (5)
AD . B -=Sln c
c b sin C sin B
BE . A -=Sln c

237Trigonometry (2) 19From equations (4) and (5):
c sin A = a sin C
or = (6)
From equations (3) and (6):
= =
The above rule can be adapted if we have triangles PQR, XYZ and so on. In �PQR,
= =
In �XYZ,
= =
The sine rule may be used for the solution of triangles when:
1. two angles and one side are known
2. two sides and the angle opposite one of them are known.
Example 19.1In �ABC, �B = 50°, �C = 75° and AB = 80 cm. Find �A and sides BC and AC.
Solution:
�ABC is shown in Figure 19.3.
c = 80 cmb
50º 75º
C
A
B a
Figure 19.3
�A = 180° – �B – �C
= 180° – 50° – 75° = 55°
To fi nd side c, solve: =
c a sin G sinA
a b sinA sinB
p q sinP sinO
x y --
sinX sin Y
c sinG
r --
sinR
z --
sinZ
a c sinA sinG

238 19 Trigonometry (2)
Transposing, a =
= (c = side AB = 80 cm)
= = 67.84 cm = side BC
= cCsin
Transposing, b =
=
= = 63.44 cm = side AC
Example 19.2The members of a roof truss slope at 35° and 60°, as shown in Figure 19.4. Calculate the length of all members of the truss.
7.0 m
A
B D C
35º 67º 60º
Figure 19.4
Solution:
In �ABC:
�B = 35°, �C = 60°
Therefore, �A = 180 – 35° – 60° = 85°
In �ABC,
= =
= =
a --
sin A
7 sin 85°
b
ex sin A sinG
80 x sin 55° sin 75°
80 x 0.8192 0.966
b sinS
c x sinS sinG
80 x sin 50° sin 75°
80 x 0.766 0.966
c sinS sinG
b c --
sin 35° sin 60°

239Trigonometry (2) 19To calculate b, solve:
=
b = = 4.03 m (AC)
=
c = = 6.085 m (AB)
In �ADC (Figure 19.5a),
= =
(a)
67º 60º
aD C
A
c d = 4.03 m
(b)
35º
aB D
A
db
Figure 19.5
�A = 180° – 67° – 60° = 53°
= =
a = = 3.496 m (DC)
c = = 3.791 m (AD)
In �ABD (Figure 19.5b), �B = 35°, �D = 180° – 67 = 113°, �A = 32°
=
=
a = = 3.502 m (BD)
7 b sin 85· sin 35·
7 x sin 35· sin 85·
7 c -- --
sin 85· sin 60·
7 x sin 60· sin 85·
a c d sin A sin C sin D
a sin 53·
c sin 60·
4.03 x sin 53·
sin6?"
4.03 x sin 60· sin6?"
a b sinA sinB
a 3.791 -- --
sin 32" sin 35·
3.791 x sin 32· sin 35·
4.03 sin6?"

240 19 Trigonometry (2)
19.1.2 The cosine rule
The cosine rule may be used for the solution of triangles, if:
1. two sides and the included angle are known
2. three sides are known
The cosine law can be written in the form of the following equations
a2 = b2 + c2 – 2bc cos A
b2 = c2 + a2 – 2ac cos B
c2 = a2 + b2 – 2ab cos C
To prove the cosine rule, consider �ABC, as shown in Figure 19.6.
b – xx
b
A C
B
c a
D
Figure 19.6
From B draw a perpendicular to meet line AC at D. In �ABD,
(BD)2 = c2 – x2 (1)
Similarly in �BCD
(BD)2 = a2 – (b – x)2
= a2 – b2 + 2bx – x2 (2)
From equations (1) and (2):
c2 – x2 = a2 – b2 + 2bx – x2
c2 = a2 – b2 + 2bx (3)
In �ABD,
x = c cos A (4)
From equations (3) and (4):
c2 = a2 – b2 + 2bc cos A
or a2 = b2 + c2 – 2bc cos A

241Trigonometry (2) 19Similarly, it can be shown that,
b2 = c2 + a2 – 2ca cos B
c2 = a2 + b2 – 2ab cos C
Example 19.3Solve the triangle shown in Figure 19.7
b = 130 cm
60º
A C
B
c a = 100 cm
Figure 19.7
Solution:
In this question we have been asked to determine side c, �A and �B.We have been given the lengths of the two sides and the included
angle, therefore we’ll use the cosine rule. As �C is known, we must use the version of the cosine rule that contains cos C, i.e.,
c2 = a2 + b2 – 2ab cos C
= 1002 + 1302 – 2 × 100 × 130 × cos 60°
= 10 000 + 16 900 – 26 000 × 0.5
= 26 900 – 13 000 = 13 900
Therefore, c = �13 900 = 117.898 cm
To fi nd �A, use:
a2 = b2 + c2 – 2bc cos A
1002 = 1302 + 117.8982 – 2 × 130 × 117.898 × cos A
10 000 = 16 900 + 13 900 – 30 653.48 cos A
30 653.48 cos A = 30 800 – 10 000
cos A = 20 800/30 653.48 = 0.67855
�A = cos–1 0.67855 = 47°16�10�
�B = 180° – 60° – 47°16�10� = 72°43�50�

242 19 Trigonometry (2)
Example 19.4A large piece of land has been divided into triangles to facilitate the survey of the area. The dimensions of one of the triangles are shown in Figure 19.8.
(a) Identify the technique that can be used to determine the angles of the triangle.
(b) Calculate the value of the angles.
b = 100 m
a = 152 m
c =
90 m
CA
B
Figure 19.8
Solution:
(a) Initially the cosine rule may be used to fi nd one of the angles. The second angle may be determined by either the cosine rule or the sine rule. The third angle may be calculated by subtracting the sum of the two angles already determined from 180°.
(b) According to the cosine rule,
a2 = b2 + c2 – 2bc cos A
1522 = 1002 + 902 – 2 × 100 × 90 × cos A
23 104 = 10 000 + 8100 – 18 000 cos A
18 000 cos A = –5004
cos A = –5004 ÷ 18 000 = –0.278
�A = cos–1 (– 0.278) = 106.14° or 106°08�27�
To calculate �C, use
c2 = a2 + b2 – 2ab cos C
902 = 1522 + 1002 – 2 × 152 × 100 × cos C

243Trigonometry (2) 198100 = 23 104 + 10 000 – 30 400 cos C
cos C = 25 004 ÷ 30 400 = 0.8225
�C = cos–1 0.8225 = 34.664° or 34°39�51�
�B = 180° – 106°08�27� – 34°39�51� = 39°11�42�
19.2 Area of triangles
If two sides and the included angle are known, then trigonometry may be used to determine the area of the triangle:
Area = = =
Depending on the information given, one of the above formulae may be used for area calculation.
Example 19.5Find the area of the triangle shown in Figure 19.7
Solution:
In Figure 19.7, a = 100 cm; b = 130 cm; angle between sides a and b, i.e. �C = 60°
Area of �ABC =
=
=
= 5629 cm2
Example 19.6The plan of a building plot is shown in Figure 19.9. Calculate:
(a) �D, �B, �DAC, �DCA and �CAB
(b) the area of the building plot.
Solution:
(a) Consider �ACB and apply the sine rule:
= =
= = 50 m B
A
C
D
50º
60 m
55 m
45 m
Figure 19.9
~ab sinG ~bC sin A ~ca sinB
~abSinG
~ 100 x 130 x sin 60'
1 2100 x 130 x 0.866
abc sinA sinB sinG
50 b 55 sinA sinB sin50

244 19 Trigonometry (2)
To fi nd �A, solve:
=
50 × sin 50 = 55 × sin A
sin A = = 0.6964
�A (or �CAB) = sin–1 0.6964 = 44°°08�21�
�B = 180° – 50° – 44°08�21� = 85°51�39�
To fi nd the length of AC, use the sine rule:
=
=
b = = 71.6 m
To fi nd the angles of �ADC, use the cosine rule. According to the cosine rule:
a2 = c2 + d2 – 2cd cos A
452 = 602 + 71.62 – 2 × 60 × 71.6 × cos A
2025 = 3600 + 5126.56 – 8592 cos A
8592 cos A = 6701.56
cos A = 6701.56 ÷ 8592 = 0.7799
�A (or �DAC) = cos–1 0.7799 = 38.74° or 38°44�30�
To fi nd �D, use the sine rule, i.e.
=
sin D = = 0.9957333
�D = 84°42�19�
�DCA = 180° – 38°44�30� – 84°42�19� = 56°33�11�
(b)
Area of the plot = area of �ACB + area of �ADC
= +
= 1371.22 + 1344.21
= 2715.43 m2
50 55 sinA sin 50
50 x sin 50 55
b c sinB sinG
b 55 sin 85" 51' 39" sin 50'
55 x sin 85'51'39" sin 50"
a d slnA sin 0
71.6 x sin 38° 44' 30" 45
1 1 "2 50 x 71.6 x sin 50" "2 45 x 71.6 x sin 56"33'11"

245Trigonometry (2) 19
Exercise 19.1
The solutions to Exercise 19.1 can be found in Appendix 2.
1. In �ABC, �A = 72°, sides a and c are both equal to 50 cm. Calculate side b, �B and �C.
2. In �ABC, �B = 40°, �C = 55° and a = 30 cm. Find �A and sides b and c.
3. A Fink truss is shown in Figure 19.10. Find the length of members AE, EC, AG, GE and FG.
2.666 m
A
B F
D
30º 60º
CG
E
30º60º 60º
Figure 19.10
4. In �PQR, �Q = 44°, side p = 30 cm and side r = 25 cm. Calculate �P, �R and side q.
5. In �ABC, side a = 8 cm, side b = 6 cm and side c = 10 cm. Calculate �A, �B and �C.
6. A surveyor set up his instrument at point A and took measurements of a building plot as shown in Figure 19.11. Calculate the area of the plot.
A B
D
C
192
m
200 m
303 m
48º
46º
Figure 19.11

246 19 Trigonometry (2)
7. The plan of a building plot is shown in Figure 19.12. Calculate �A, �C, �ABC and �ADC.
105 m
95 m
100 m
114
m
50º
B
CD
A
Figure 19.12
8. A surveyor takes measurements of a building plot from two corners, as shown in Figure 19.13. Calculate the length of sides AD, AB and BC.
500 m
95º 88º43º 41º
AB
D C
Figure 19.13

247Trigonometry (2) 199. Figure 19.14 shows the plan of a plot of land. Find �HEF, �EFG, sides EH, EF and FG.
500 m
102º80º
38º
51º
E
F
H G
Figure 19.14
Answers to Exercise 19.1
1. Side b = 30.9 cm; �B = 36°; �C = 72°
2. �A = 85°; b = 19.36 cm; c = 24.67 cm
3. AE = 2.309 m; EC = 2.309 m; AG = 2.666 m; GE = 1.333 m; FG = 2.666 m
4. �P = 80.681°; �R = 55.319°; side q = 21.12 cm
5. �A = 53.13°; �B = 36.87°; �C = 90°
6. 43 412.59 m2
7. �A = 95.936°; �C = 87.781°
�ABC = 81.671°; �ADC = 94.6126°
8. AD = 472.217 m; AB = 525.726 m; BC = 451.828 m
9. �HEF = 82.328° (82°19�40.8�); �EFG = 95.672° (95°40�19.2�); EH = 478.899 m; EF = 511.623 m; FG = 514.864 m

This page intentionally left blank

C H A P T E R 20Computer techniques
Learning outcomes:
(a) Perform simple calculations involving addition, subtraction, multiplication and division
(b) Use a range of functions to determine the sum, mean, range, etc.
(c) Display the results as pie charts and bar charts
20.1 Introduction
We have at our disposal many devices like calculators and computers to make mathematical calculations easier and faster than the manual techniques. It has taken inventors several centuries to reach the present stage. In the early 1600s John Napier, a Scottish mathematician, invented logarithms. The use of logarithms made several types of calculations easier and faster. Later, William Oughtred used Napier’s logarithms as the basis for the slide rule, which remained in common use for over 300 years. The use of the slide rule came to an end in the early 1970s, when pocket calculators became popular. The next development was an electronic spreadsheet invented by Daniel Bricklin, a student at Harvard Business School. Originally the electronic spreadsheet was invented to make calculations in business easier, but now it is used in many disciplines. Many spreadsheet softwares are available now, but this chapter is based on the widely used Microsoft Excel.
20.2 Microsoft Excel 2000
Microsoft Excel 2000 is a spreadsheet program that lets us work with numbers and text. An Excel fi le is known as a workbook, and one workbook can hold several sheets, e.g. sheet 1, sheet 2, sheet 3, etc. Each sheet is divided into rows and columns and their intersections create cells, which are known by a reference. A cell reference is a combination of letter(s) and number, e.g. B10 or AA5 to signify the

250 20 Computer techniques
intersection of a column and a row. Figure 20.1 shows a spreadsheet in which the reference of the selected cell is D6.
Chart wizard
Figure 20.1
Each cell can hold text, a number or a formula. A formula is a special way to tell Excel to perform a calculation using information present in other cells. Formulae can use not only the normal arithmetic operations like plus (+), minus (–), multiply (*) and divide (/), but also the built-in functions to fi nd square roots, average, sine of an angle, etc. A summary of these is given in Table 20.1.
Table 20.1
Symbol/function Action
+ Addition– Subtraction* Multiplication/ Division= Equal to^ Raised to a powerSum The sum of the valuesAverage The average (or mean) of the values
Example 20.1Jas is planning to renovate her house and wants to replace the old carpets with laminated fl ooring in two rooms. If the rooms measure

251Computer techniques 205.8 m × 4.2 m and 4.5 m × 4.1 m, and one pack of the laminated boards covers 2.106 m2, fi nd the number of packs required. Consider wastage as 10%.
Solution:
The cells are labelled as length, width, area, etc. on a Microsoft Excel spreadsheet, as shown in Figure 20.2. The length and the width of Room 1 are entered and multiplied to determine the fl oor area. The formula for the fl oor area (= B4*C4) is entered in cell D4. It is necessary to use the equal sign before a formula, otherwise the computer will not do the required calculation. The area (cell D4) is divided by 2.106 to calculate the number of packs required, as shown in cell E4. Cell F4 shows the formula to work out the wastage, 10/100 representing 10%. The total number of packs required (cell G4) is the sum of the answers in cells E4 and F4, i.e. the number of actual packs required plus the wastage.
Enter the dimensions of Room 2, and replicate all the formulae. The total number of packs is the sum of cells G4 and G6. Figure 20.2a shows the formulae used and Figure 20.2b the results.
Figure 20.2a

252 20 Computer techniques
Figure 20.2b
Example 20.2Figure 20.3 shows the foundation plan of a building extension and the sectional details of the foundation. Find the volume of concrete required to build a 0.200 m thick foundation.
(a) Plan (b) Section 1-1
7.35 m
A
DB
3.4
m0.
6 m
0.6 m 0.6 m 0.6 m
0.2
m
0.4 m
22 11
(c) Section 2-2
0.4 m
0.2
m
Foun
dat
ion
C
Figure 20.3
Solution:
The foundation plan is divided into four parts: A, B, C and D. The length and width are entered in columns B and C. The thickness of the foundation (0.200 m) is uniform throughout and entered in cells D4 to D7. The volume of concrete is determined by multiplying the length, width

253Computer techniques 20and height (or thickness); therefore, the formula entered in cell E4 is: =B4*C4*D4. The formula is replicated in cells E5, E6 and E7, as shown in Figure 20.4a. Figure 20.4b shows the results.
Figure 20.4a
Figure 20.4b

254 20 Computer techniques
Example 20.3Five groups of students were asked to prepare concrete cubes and test them to failure to determine the crushing strength. The test results were:
Group 1: 50, 52, 53, 53, 55, 57, 60, 54, 54, 55 N/mm2
Group 2: 50, 52, 53, 54, 55, 58, 61, 54, 54, 55 N/mm2
Group 3: 49, 52, 52, 53, 55, 58, 60, 55, 54, 56 N/mm2
Group 4: 50, 52, 53, 60, 55, 59, 62, 54, 54, 55 N/mm2
Group 5: 48, 52, 52, 53, 55, 57, 58, 54, 53, 55 N/mm2
Find the mean and the range of each group’s data.
Solution:
The data of all the groups are entered as shown in Figure 20.5a. To fi nd the mean, the formula is: =average(fi rst cell:last cell). For Group 1 this is: =average(B3:K3). The formula is entered without any spaces. The range of a set of data is equal to the maximum value minus the minimum value. Max(B3:K3) means the maximum value from the cells ranging between B3 and K3. Similarly, Min(B3:K3) means the minimum value from the cells ranging between B3 and K3. The formula to fi nd the range is entered in cell M3 and replicated in cells M4, M5, M6 and M7.
The results are shown in Figure 20.5b.
Figure 20.5a

255Computer techniques 20
Figure 20.5b
Example 20.4Twenty-six bricks were tested to determine their compressive strength in N/mm2. The results are:
49 50 55 54 51 52 56 55 53 54 54 53 6055 53 58 61 56 57 52 54 57 55 58 56 59
Arrange the data into fi ve groups and calculate the mean compressive strength.
Solution:
The data have been arranged into fi ve groups as shown in Figure 20.6a. The class midpoints are entered in cells C4 to C8. As the mean of grouped
data is determined by the formula: Mean = , the next step is to fi nd the
product of frequency (f ) and class midpoint (x). The formula to determine fx is entered in cell D4 and replicated for the other cells. The sum of the frequencies (�f) and the sum of fx (�fx) is found by entering the formulae shown in Figure 20.6a. Finally, the mean is shown in cell E11.

256 20 Computer techniques
Figure 20.6a
Figure 20.6b

257Computer techniques 20Example 20.5The number of personnel in S & R Consulting Engineers is given in the table:
Directors Associate directors
Civil engineers
Technician engineers
Technicians Administrative staff
2 4 3 6 4 3
Represent this information in the form of: (a) a horizontal bar chart; (b) a pie chart.
Solution:
The data are entered into the cells, as shown in Figure 20.7a. The data and the headings are selected and the chart wizard icon clicked to display the list of charts available. The horizontal bar chart is selected and the computer instructions followed to produce the diagram.
To produce the pie chart (Figure 20.7b) an appropriate type of pie is selected and instructions that appear on the computer screen followed.
Figure 20.7a

258 20 Computer techniques
Figure 20.7b
Example 20.6The heat loss from a room is given by:
Heat loss = U × A × T
where U is the U-value of the material/component, A is the surface area in m2, T is the temperature difference in °C (or K).
If the temperature difference between the inside and outside air is 20°C, fi nd the heat loss from a room given that:
U-values (W/m2 °C)
Cavity wall = 0.35; fl oor = 0.35; roof = 0.30; door = 0.46; window = 2.6
Areas (m2)
Wall = 46.5 (gross); fl oor = 15; roof = 15; door = 1.7; window = 2.0
Solution:
The fi rst step is to fi nd the net wall area, which can be determined by taking away the area of door and window from the gross wall area. The U-values, areas and the temperature difference are entered into a worksheet and multiplied, as the heat loss = U × A × T. The heat losses from the various components are added to fi nd the total heat loss, as shown in Figure 20.8.

259Computer techniques 20
Figure 20.8a
Figure 20.8b

260 20 Computer techniques
Exercise 20.1
1. Jane is planning to renovate her house and has decided to replace the old carpets with laminated fl ooring in the dining room, living room and the hall. The dining room measures 3.5 m × 3.5 m, the living room 6.1 m × 4.2 m and the hall 4 m × 2 m. If one pack of the laminated boards covers 2.106 m2, fi nd the number of packs required. Consider wastage as 10%.
2. Figure 20.9 shows the foundation plan of a building extension and the sectional details of the foundation. Find the volume of concrete required to build the 0.750 m deep foundation.
(a) Plan (b) Section 1-1
7.50 m
A
B
3.5
m
0.75
0 m
0.5
m
0.5 m 0.5 m0.5 m
0.40 m
22 11
(c) Section 2-2
0.75
0 m
0.40 m
Foundation
DC
Figure 20.9
3. A group of students was asked to perform tensile tests on 15 samples of steel and fi nd the maximum tensile force in kN taken by each sample. The test results were:
9.9, 12.1, 10.0, 12.0, 10.2, 11.9, 10.3, 11.6, 10.5, 11.5, 11.3, 10.9, 11.3, 11.6, 11.0 kN.
Find the mean tensile force and the range of the data.
4. Twenty-fi ve samples of PVC were tested to determine their coeffi cient of linear thermal expansion. The results were:
63 70 66 70 74 71 67 77 78 72 66 76 64 69 73 82 69 76 70 65 71 72 74 78 73 (×10–6/°C)

261Computer techniques 20 Arrange the data into a number of appropriate groups and calculate
the mean coeffi cient of thermal expansion.
5. The number of personnel in R & S Consulting Engineers is given in the table:
Directors Associate directors
Civil engineers
Technician engineers
Technicians Administrative staff
3 5 4 8 6 4
Represent this information in the form of a horizontal and a vertical bar chart.
6. The amounts of the materials required to make a concrete mix are: cement: 60 kg; sand: 100 kg; gravel: 200 kg; water: 35 kg. Represent the above information as a pie chart.
7. The heat loss from a room is given by:
Heat loss = U × A × T
If the temperature difference between the inside and outside air is 20°°C, fi nd the heat loss from a room given that:
U-values (W/m2°C)
Cavity wall = 0.35; fl oor = 0.35; roof = 0.30; door = 0.46; patio door = 2.6
Areas (m2)
Wall = 54.0 (gross); fl oor = 20; roof = 20; door = 1.7; patio door = 5.0
Answers to Exercise 20.1
1. 24
2. 6.488 m3
3. Mean = 11.07 N; range = 2.2 N
4. 71.4 × 10⁻⁶/°C
5. See Appendix 2
6. See Appendix 2
7. 866.74 W

This page intentionally left blank

C H A P T E R 21Assignments
21.1 Assignment 1
Task 1
(a) Find the area of the shapes shown in Figure 21.1.
20 cm
(i) (ii)
15.5 cm15 cm
30 cm
12 cm
26 cm
Diameter = 50 mm
(iii) (iv)
10 cm
Figure 21.1

264 21 Assignments
(b) Find the volume of the objects shown in Figure 21.2.
103 mm215 mm
(i)
65 mm
10 cm
(ii)
20 m
(iv)(iii)
25 cm
15 mh = 9 m
10 m8 m
Figure 21.2
Task 2
Figure 21.3 shows the foundation and fl oor plan of a building. Calculate:
(a) the volume of soil that will be excavated to form 1000 mm deep foundation trenches
(b) the volume of the excavated soil after bulking, if the bulking factor is 10%
(c) the volume of 1:3:6 concrete required to construct 200 mm thick strip foundation
(d) the number of fl oor tiles required if each tile measures 330 mm × 330 mm. Allow 10% for wastage.

265Assignments 210.
6 m
0.6
m3.
2 m
3.9
m0.
4
0.4 m
9.6 m
4.8 m 5.0 m
10.8 m
(a) Foundation Plan
(b) Floor Plan
4.3 m5.5 m4.2
m
3.5
mKITCHEN
Figure 21.3
Task 3
Figure 21.4 shows the cross-section of a drain and the depth of water fl ow. If the diameter of the drain is 300 mm, fi nd:
(a) the cross-sectional area of the water fl ow
(b) the fl ow rate (m3/s) if the velocity of fl ow is 1.5 m/s.
Note:
D
B
O
A C150 mm
120º
Figure 21.4
Task 4
Each step of a stair has a rise of 210 mm and a going of 230 mm. Find the pitch of the stair
Velocity (mts) = Flow rate (m'ts) Cross-sectional area of flow (m')

266 21 Assignments
Task 5
A surveyor who wants to fi nd the height of a building sets up his instrument at point A and fi nds that the angle of elevation to the top of the building is 45°. He then moves the instrument by 40.0 m towards the building and fi nds that the angle of elevation now is 60°. Assuming that the ground is horizontal and the height of the instrument is 1.45 m, calculate the height of the building.
Task 6
In an experiment to prove Hooke’s Law the following data was obtained by stretching a metal specimen:
Stretching force (kN) 0 1.5 3.0 4.5 6.0 7.5
Extension (mm) 0 0.02 0.04 0.06 0.08 0.10
(a) Plot a graph of stretching force (F) versus extension (E) and determine the law connecting F and E.
(b) Find the extension when the stretching force is increased to 8.5 kN, assuming the straight-line law still holds good.
21.2 Assignment 2
Task 1
(a) Use your scientifi c calculator to answer the following and show your answers to two decimal places:
(i)
(ii)
(iii) (5.7 × 106) × (2.3 × 10–4)
(iv) sin 50.5°
(b) Use your scientifi c calculator to answer the following and show your answer to three signifi cant fi gures:
(i) ×
(ii)
(iii) log10 1575
(iv) 0.0055 × 10²/3
12.3 x 280.9 115.8
6.5' + 9.3'
..)27.1 ..)15.08
sin80.r cos 78.3'

267Assignments 21Task 2
Solve graphically:
(a) the simultaneous equations, x – y = –3 and 2x + 3y = 4
(b) the quadratic equation, x2 – 3x – 4 = 0.
Task 3
The width of a rectangle is 5.0 cm shorter than its length. If the perimeter of the rectangle is 74.0 cm, fi nd its length and width.
Task 4
The dimensions of a kitchen are shown in Figure 21.5. Calculate:
(a) the length of skirting board required
(b) the number of porcelain fl oor tiles measuring 600 mm × 600 mm, assuming wastage of 10%
(c) the quantity (in litres) of emulsion paint required for painting the walls. One litre of emulsion covers 10 m2 (approx.).
(a)
4.5 m
D1 D2
Door D1 = 0.84 m wide
Door D2 = 0.76 m wide
3.8
m
Figure 21.5 (Continued)

268 21 Assignments
(b)
3.8 m 4.5 m
0.6
1.2 m
W
D1
D22.0 m 2.
5 m
Window: The upper halfis a semicircle
Figure 21.5 (Continued)
Task 5
Figure 21.6 shows the cross-section of a concrete drainage channel. Find the volume and mass of concrete used to make a 2.0 m long section. Assume the density of concrete to be 2400 kg/m3.
0.9 m
45º
0.45 m
0.075 m
0.075 m
Figure 21.6
Task 6
A building is shaped like the frustum of a pyramid. If the building measures 75 m × 75 m at the base, 40 m × 40 m at the top and its vertical height is 40 m, calculate:
(a) the volume of space enclosed by the building
(b) the surface area, excluding the top and bottom.

269Assignments 21Task 7
A hot water cylinder has a diameter of 500 mm and is 1500 mm high. The main body is a cylinder, but the top part is a hemisphere. Calculate:
(a) the capacity of the cylinder in litres (volume of a sphere = ; r is the radius)
(b) the surface area of the cylinder (including the base).
Task 8
Calculate the area of the plot of land shown in Figure 21.7 by two methods.
55 m
70 m
66 m68 m
A
D
CB
95º
Figure 21.7
Task 9
The cross-sectional areas of a trench at 10 m intervals are shown in Figure 21.8. Use the trapezoidal rule and Simpson’s rule to calculate the volume of earth excavated.
10 m
10 m
10 m
10 m0.96 m2
1.0 m2
0.95 m2
0.9 m2
0.8 m2
Figure 21.8
~7tr3 3

270 21 Assignments
21.3 Assignment 3
Task 1
Bill Gateway has a 6.0 m long ladder that he wants to use to clean the rainwater gutters of his house. He knows that for safety the ladder should make an angle of 75° with the horizontal. How far from the wall should the foot of the ladder be?
Task 2
A surveyor wants to fi nd the width of a river and stands on one bank at point C opposite a building (B), as shown in Figure 21.9. She sets up one station at point C and another at point A, which is 50 m from point C along the bank. On measuring the angles she fi nds �BCA and �CAB to be 85° and 60°, respectively. Find the width of the river.
50 m
85º 60º
C D
B
A
Figure 21.9
Task 3
Two technicians performed tests on bricks from the same batch to determine their compressive strength:
Technician A: 30, 31, 35, 36, 38, 36, 39, 37, 34, 36 N/mm2
Technician B: 32, 34, 36, 34, 37, 34, 35, 38, 37, 35 N/mm2
For each set of data, calculate:
(a) the mean, mode and median strength
(b) the range.
Compare the results and give your comments.

271Assignments 21Task 4
The crushing strengths (unit: N/mm2) of 40 concrete cubes are given here. Group the data into six or seven classes and fi nd:
(a) the frequency of each class
(b) the mean crushing strength.
40 45 39 35 38 46 45 44 45 3539 38 35 37 39 43 48 37 42 5039 46 41 44 41 51 42 47 49 3647 48 49 38 44 44 43 51 41 37
Task 5
Use the data given in Task 4 to produce a cumulative frequency curve, and fi nd:
(a) the median crushing strength
(b) the interquartile range
(c) the number of samples having strength more than 40 N/mm2.

This page intentionally left blank

A P P E N D I X 1Concrete mix
A1.1 1:2:4 concrete
A concrete mix can be prepared by two methods: (1) mixing by volume and (2) mixing by mass. In the latter method the mass of cement, fi ne aggregates (sand) and coarse aggregates (gravel, crushed stone, crushed bricks, blast-furnace slag, etc.) are calculated for preparing the concrete mix. In this section only the former method is described.
If we want to prepare 1 m3 of 1:2:4 concrete mix, the quantities of dry materials may be calculated as shown below. The volume of cement in a 25 kg bag is 0.0166 m3.
Assuming the volume of water to be 55% of the volume of cement, the proportions of the concrete mix may be written as 1:2:4:0.55. The total of these proportions is 7.55.
Cement : fi ne aggregates : coarse aggregates : water
1 : 2 : 4 : 0.55
Volume of cement = = 0.132 m3
Volume of fi ne aggregates = = 0.265 m3
Volume of coarse aggregates = = 0.53 m3
Volume of water = = 0.073 m3 or 73 litres
The coarse aggregates contain a lot of air voids which are fi lled by cement, water and fi ne aggregates when they are mixed. The mass of each ingredient can be calculated by multiplying its volume by density:
Mass of 0.132 m3 of cement = 0.132 × 1506 = 198.8 kg
Mass of 0.265 m3 of sand = 0.265 × 1650 = 437.25 kg
Mass of 0.53 m3 of gravel = 0.53 × 1600 = 848 kg
Mass of 0.073 m3 of water = 0.073 × 1000 = 73 kg
Total = 1557 kg/m3
1 7.55 x 1
1 7.55 x 2
1 7.55 x 4
1 7.55 x 0.55

274 1 Concrete mix
The density of fresh concrete is 2350 kg/m3. The ratio in which the volumes of the dry materials should be increased
is or 1.5. The volumes of dry materials that will give 1 m3 of
concrete after mixing are:
Volume of cement = 0.132 × 1.5 = 0.198 m3
Volume of sand = 0.265 × 1.5 = 0.397 m3
Volume of gravel = 0.53 × 1.5 = 0.8 m3
Volume of water = 0.073 × 1.5 = 0.109 m3 or 109 litres
A1.2 1:3:6 concrete
Cement : fi ne aggregates : coarse aggregates : water
1 : 3 : 6 : 0.55
Volume of cement = = 0.095 m3
Volume of fi ne aggregates = = 0.284 m3
Volume of coarse aggregates = = 0.569 m3
Volume of water = = 0.052 m3 or 52 litres
The mass of each ingredient can be calculated by multiplying its volume by density:
Mass of 0.095 m3 of cement = 0.095 × 1506 = 143.1 kg
Mass of 0.284 m3 of sand = 0.284 × 1650 = 468.6 kg
Mass of 0.569 m3 of gravel = 0.569 × 1600 = 910.4 kg
Mass of 0.052 m3 of water = 0.052 × 1000 = 52 kg
Total = 1574 kg/m3
The density of fresh concrete is 2350 kg/m3 (approx.). The ratio in which
the volumes of the dry materials should be increased is or 1.49
(say 1.5). The volumes of dry materials that will give 1 m3 of concrete after mixing are:
Volume of cement = 0.095 × 1.5 = 0.143 m3
Volume of sand = 0.284 × 1.5 = 0.426 m3
Volume of gravel = 0.569 × 1.5 = 0.854 m3
Volume of water = 0.052 × 1.5 = 0.078 m3 or 78 litres
2350 1557
1 10.55
x 1
1 x 3
10.55
1 x 6
10.55
1 10.55
x 0.55
2350 1574

A P P E N D I X 2Solutions
Exercise 1.1
1. 3 7 . 8 5 – 4 0 . 6 2 +
3 1 . 8 5 – 9 . 6 7 = 19.41
2. 3 3 . 9 × 5 6 . 3 ÷ 4 5 .
6 6 = 41.8
3. 6 7 . 3 × 6 9 . 8 1 ÷ 2 5
. 9 7 ÷ 2 0 . 5 = 8.83
4. � 4 . 9 × � 8 . 5 + � 7
. 4 = 9.17
5. � × 1 2 . 2 5 x2 = 471.44
6. (a) ( 2 . 2 × 9 . 8 ) + ( 5
. 2 × 6 . 3 ) = 54.32
(b) ( 4 . 6 6 × 1 2 . 8 ) -
( 7 . 5 × 5 . 9 5 ) = 15.02
(c) ( 4 . 6 × 1 0 . 8 ) ÷ (
7 . 3 × 5 . 5 ) = 1.24

276 2 Solutions
7. (a) 5 ^ 3 × 3 ^ 4 ÷ 2 ^ 5 = 316.41
(b) 4 ^ 3 × 6 ^ 3 ÷ 5 ^ 4 = 22.12
8. 1 0 Log ( 9 EXP +/– 8 ÷ 2 EXP
+/– 1 1 ) = 36.53
9. (a) sin 7 0 ÷ cos 6 0 = 1.879
(b) tan 4 5 ÷ cos 3 5 = 1.221
10. (a) SHIFT sin 0 . 8 5 = 58.2117°° °′″ 58°12′42″
(b) SHIFT cos 0 . 7 5 = 41.4096°° °′″ 41°24′34.64″
(c) SHIFT tan 0 . 6 6 = 33.4248°° °′″ 33°25′29.32″
11. (a) sin 6 2 °°′″ 4 2 °′″ 3 5 °′″ = 0.8887
(b) cos 3 2 °°′″ 2 2 °′″ 3 5 °′″ = 0.8445
(c) tan 8 5 °°′″ 1 0 °′″ 2 0 °′″ = 11.8398
Exercise 2.1
1. 34.21 + 26.05 + 370.30 = 430.56
2. 34.11 – 20.78 = 13.33
3. 309.1 – 206.99 – 57.78 = 44.33
4. 40.0 × 0.25 = 10.0
5. 25 × 125 ÷ 625 = 5
6. (a) 379 × 100 = 37 900
(b) 39.65 × 1000 = 39 650
(c) 39.65 × 10 000 = 396 500
7. (a) 584 ÷ 100 = 5.84
(b) 45.63 ÷ 100 = 0.4563
(c) 45.63 ÷ 1000 = 0.04563
8. (a) 6 – 2 – 3( 4 ×1.5 × 0.5 ) + 15
= 6 – 2 – 3(3) + 15 = 10
(b) 15 – ( 2 × 4 + 2 ) – ( 4 – 3 )
= 15 – ( 10 ) – 1 = 4
9. – 2° – 5° = – 7°C

277Solutions 210. (a) £29.85 + £19.98 + £15.50 = £65.33
(b) (20 × 4) – 65.33 = £14.67
11. (a) Length of skirting board required = 4.2 + 4.2 + 3.8 + 3.8 – 0.86 = 15.14 m
Lengths of 2.4 m long skirting board required = 15.14 ÷ 2.4 = 6.31
Two packs will be required; cost = 2 × £34.99 = £69.98
(b) Length of coving = 4.2 + 4.2 + 3.8 + 3.8 = 16 m
Lengths required (3 m long) = 16 ÷ 3 = 5.33, say 6
Cost = £6.00 × 6 = £36.00
12. Height of the walls = 2.8 – 0.1 – 0.1 = 2.6 m
Wall area (gross) = 2.6 × (4.2 + 3.8 + 4.2 + 3.8) = 41.6 m2
Wall area (net) = 41.6 – 2.06 × 0.86 – 2.0 × 1.2 = 37.43 m2
Area of one roll = 10.0 × 0.52 = 5.2 m2
Number of rolls required = 37.43 ÷ 5.2 = 7.2
Number of rolls, including wastage = 7.2 + = 8.28 or 9 rolls
Cost = 9 × £21.99 + £25.00 = £222.91
Exercise 3.1
1. (a) 5a + 2b + 3b – 2a = 5a – 2a + 2b + 3b = 3a + 5b
(b) 5x – 3y – 2x – 3y = 5x – 2x – 3y – 3y = 3x – 6y
2. 2xy3 × 5x3y3 = 2 × 5 × (x × x3) × (y3 × y3) = 10x4y6
3. = 5a3 – 3b2 – 1c4 – 3 = 5a0b1c1 = 5bc
4. (a) 4(2x + 3y) = 4 × 2x + 4 × 3y = 8x + 12y
(b) 2(3x – 6y) = 6x – 12y
(c) 5 + (x + 2y + 10) = x + 2y + 15
(d) 3 – (– x + 3y – 4z) = 3 + x – 3y + 4z
5. (a) x – 5 = 14; x = 14 + 5 or x = 19
(b) 2a = 15; a = = 7.5
(c) = 3.5; y = 3.5 × 5 = 17.5
(d) 3(2x + 4) – 2(x – 3) = 4(2x + 4)
6x + 12 – 2x + 6 = 8x + 16
12 + 6 – 16 = 8x – 6x + 2x
4x = 2; or x = = 0.5
(e) + =
Multiply both sides by 12: 6x + 3(x + 3) = 4(2x + 1)
6x + 3x + 9 = 8x + 4; 9x – 8x = 4 – 9; or x = –5
25a'b'c' 5a'b c'
!" 5
15 2
2 4
x x+3 2x+1 2 4 3
7.2x~ 100

278 2 Solutions
6. Let �B = x; � �A = 2x
x + 2x + 75 = 180°; 3x = 105°; � x = 35°
�B = x = 35°; �A = 2x = 70°
7. Let the width be x cm; length = 2x
Perimeter = x + 2x + x + 2x = 42; therefore x = 7 cm
width = 7 cm; length = 2 × 7 = 14 cm
8. Let the width be x cm; length = x + 3 cm
Perimeter = x + (x + 3) + x + (x + 3) = 30
4x + 6 = 30; therefore x = 6 cm
Width = 6 cm; Length = 6 + 3 = 9 cm
9. 2x + x + (x + 40) + (x + 20) = 360
5x + 60 = 360; or x = 60°
�A = 120°, �B = 60°, �C = 60° + 40° = 100°, �D = 60° + 20° = 80°
10. Price of plot B = x (£); Price of plot A = x – 20 000
Price of plot C = x + 30 000
x + (x – 20 000) + (x + 30 000) = £190 000
3x + 10 000 = 190 000; or x = 60 000
Prices: Plot B = £60 000; Plot A = £40 000; Plot C = £90 000
11. 8 + 12 + x – 6 + 12 – x + x – 4 + x = 40
22 + 2x = 40; 2x = 18; or x = 9 m = DE
AB = x – 6 = 3 m; BC = 12 – x = 3 m; CD = x – 4 = 5 m
Exercise 4.1
1. (a) 42 × 47 = 42 + 7 = 49 = 262 144
(b) m2 × m3 = m2 + 3 = m5
2. (a) 32 × 35 × 37 = 32 + 5 + 7 = 314 = 4 782 969
(b) 4 × 42 × 47 = 41 + 2 + 7 = 410 = 1 048 576
3. (a) = n7 – 6 = n1 = n
(b) = x8 – 4 = x4
4. (a) (23)5 = 23 × 5 = 215 = 32 768
(b) (3x2)4 = 34x2 × 4 = 81x8
5. = 34 – 7 = 3–3 = or
6. (a) = a3 – 7 = a– 4
(b) = x6 – 8 = x–2
3' 3'
n3 xn4
n1 xn 5
X 6 XX 2
X 3 XX
a 3
a2 xa5
X4
XX2
X3 XX 5
1 1 33 27

279Solutions 2 7. (a) = a7 – 7 = a0 = 1
(b) = y10 – 10 = y0 = 1
8. (a) log 2 5 = 1.3979
(b) log 1 5 0 = 2.1761
(c) log 1 2 0 4 = 3.0806
9. (a) log 2 . 2 EXP 2 = 2.3424
(b) log 3 . 8 EXP - 3 = –2.4202
10. (a) SHIFT LOG 8 . 5 = 316 227 766
(b) SHIFT LOG 0 . 7 2 = 5.248
(c) SHIFT LOG 0 . 0 0 1 4 = 1.003
Exercise 5.1
1. (a) 976 = 9.76 × 10²
(b) 1478 = 1.478 × 10³
(c) 377 620 = 3.7762 × 10⁵
2. (a) 0.025 = 2.5 × 10⁻²
(b) 0.00071 = 7.1 × 10⁻⁴
(c) 0.000000437 = 4.37 × 10⁻⁷
3. (a) 1.721 × 102 = 172.1
(b) 2.371 × 10–3 = 0.002371
(c) 9.877 × 104 = 98770
(d) 9.1 × 10–6 = 0.0000091
4. 361.73 correct to 5 s.f.
361.7 correct to 4 s.f.
362 correct to 3 s.f.
360 correct to 2 s.f.
5. 867 360 correct to 5 s.f.
867 400 correct to 4 s.f.
867 000 correct to 3 s.f.
870 000 correct to 2 s.f.
900 000 correct to 1 s.f.
a1 xa2 xa 4
a3 xa4
y'xy' y' xy'xy'

280 2 Solutions
6. 0.00084 correct to 2 s.f.
0.0008 correct to 1 s.f.
7. Estimated answer Actual answer
(a) 450 + 150 + 750 = 1350 1352
(b) 40 × 15 = 600 570
(c) = 18 17.019
Exercise 6.1
1. b = c – d – a
After transposition, a = c – d – b
2. (a) y = mx + c; this can be written as mx + c = y
After transposition, c = y – mx
(b) c = 10 – 4 × 2 = 2
3. v = u + at, which can be written as u + at = v
at = v – u or t =
4. p = or = p
�d = 2p or d =
5. (a) = Q; after transposition, kA = Qd
Transpose A to the RHS, k =
(b) k = = 2.5
6. (a) A = 4�r2 or 4�r2 = A
Transpose 4� to the RHS, r2 =
� r =
(b) r = = 19.95 cm
7. V = �r2h or �r2h = V
(a) Transpose �r2 to the RHS, h =
(b) r2 = or r =
66x90
11 x 30
'ltd -
2
kA9 d
'ltd -
2
2000 x 0.5
10 x 40
Hi lOOO
4'1t
V 'lth
v-u a
2p II:
Qd A9
A 4'1t
V IIr2
~

281Solutions 2 8. (a) 2as = v2 – u2 or s =
(b) s = = 5 m
9. mx + c = y
After transposition, mx = y – c or x =
10. y = + d
Multiply both sides by 7:
7y = 3x + 2z + 7d
3x = 7y – 2z – 7d
or x =
11. V =
�r2h = 3V
r2 =
� r =
12. (a) v = c , which can be written as c = v
Square both sides, c2 mi = v2 or m =
(b) m = = 0.0937
13. = = 0.2 + 0.1 = 0.3
= 0.3, or R = = 3.33 �
14. Rate of heat loss due to ventilation =
Cv = 1212 J/m3 °C, V = 400 m3, N = 2.0 and T = 21°C
Rate of heat loss due to ventilation = = 5656 W
15. One litre of water has a mass of 1 kg.
Heat energy required = M × S × T (T = 50 – 10 = 40°C)
= 162 × 4.186 × 40 = 27 125.3 kJ
Assuming no loss of heat energy, power required to heat the water in
one hour = = 7.53 kW
5' - 0' 2x2.5
3x+2z 7
7y- 2z-7d
3
~r'h 3
3V
lth
{3V Vih
.Jmi
(2.42)' 50' x 0.025
1 1 1 1 1 -=-+- -+-R R, R, 5 10
1
R 1
0.3
27125.3 3600
y-c m
v' el;
C,xVxNxT 3600
1212 x 400 x 2 x 21 3600
5' - 0' 2x2.5
3x+2z 7
7y-2z-7d 3
~r'h 3
3V
Ith
~ ,Jmi
(2.42)' 50' x 0.025
1 1 1 1 1 -=-+- .... + ....... . R R, R, 5 10
1
R 1
0.3
27125.3 3600
y-c m
v' eli
C,xVxNxT 3600
1212 x 400 x 2 x 21 3600
0' 0' 0'
0'

282 2 Solutions
16. (a) Water pressure at the base of the vessel,
p = �gh
= 1000 × 9.81 × 4
= 39 240 N/m2 or 39 240 Pa
Note: 1 Newton/m2 = 1 Pascal (Pa)
(b) Force = pressure × area
= 39 240 × (1.5 × 1.2)
= 70 632 N or 70.632 kN
17. (a) Radius of the drain = 75 mm or 0.075 m
Cross-sectional area of fl ow = = 0.008836 (the drain runs
half-full)
Slope, S = 1 in 80 or = 0.0125
Velocity of fl ow, v = c = 50
= 50 × 0.0306 = 1.53 m/s
(b) Flow rate = A × v = 0.008836 × 1.53 = 0.0135 m3/s
Exercise 7.1
1. (a)
(b)
2. (a)
(b)
(c)
3. (a) =
(b) =
(c) =
4. (a) = = =
(b) = =
1 80
7t x(0.075)' 2
.JRS ,j0.075 x 0.0125
3 1 9=3 3 1 9=3 20 1 -=-120 6
250 25 5 --=-=-1200 120 24
60 1 -=-120 2
10 5 12 6
12 4 -
15 5
40 2 - -
100 5
2 5 -+-3 6
1 1 -+-3 5
2x2 + lx5 6
lx5 + lx3 15
9 3 -
6 2
8 15

283Solutions 2 (c) = =
(d) = =
5. (a) of 33 = × 33 = 11 m2
(b) of 1.50 = × 1.50 = £0.30
(c) of 200 = × 200 = 150 m
6. (a) = 0.75 = 75%
(b) = 0.60 = 60%
(c) = 0.70 = 70%
(d) = 0.80 = 80%
7. (a) × 150 = 30
(b) × 3000 = 2250
(c) × 900 = 810
8. Maths: × 100 = 66.67%; science: × 100 = 62.5%
Nikki did better in Maths.
9. = £50 (Peter); = £60 (Karen); = £30
(Dave); Money left = 200 – 50 – 60 – 30 = £60
10. = £54
11. Total without VAT = 845.00 + (7 × 80) = 1405.00
VAT = = 281.00
Total (including VAT) = 1405.00 + 281.00 = £1686.00
12. Total mass of concrete = 1500 kg
(a) = = or 30%
(b) = or 50%
3 2 3x5 + 2x4 -+-4 5 20
3 4 3x5 + 4x4 -+-4 5 20
1 1 - -
3 3
1 1 - -
5 5
3 3 - -
4 4
3 -
4
3 -
5
7 10
4 -
5
20 -
100
75 -
100
90 100
40 60
25 x 200 100
4.5 x 1200 100
20 x 1405.00 100
450 30 3 1500 100 10
100 1 200 2
23 20
31 20
30 x 200 100
50 -
80
~X200 100

284 2 Solutions
13. Brick A: or 9.09%
Brick B: or 10%
14. Heat loss through windows = = 3750 W
Heat loss through roof = = 8750 W
15. ; × 100 = 12.5%
16. Total money spent = £6000
(a) Money spent on foundation and brickwork = =
(b) Money spent on fi nishes = = 16.67%
17. Moisture content = = 17.5%
Exercise 8.1
1. 300,000
200,000
100,000
1 2 3
Year
4 5
Pro
fit (£
)
2.
1900
1880
1860
1840
1820
1800
Water content (%)
16141210
Den
sity
(kg/
m3 )
0.2 2 1 --;;;;-;;;;-
2.200 22 11
0.25 2.5 1 -=-=-2.5 25 10
~x25000 100
35 x 25000 100
27 3 1 1 -=-=- -216 24 8 8
1000 x 100 6000
(2.35 - 2.0) x 100 2.0
2200 22 11 --=-6000 60 30

285Solutions 2 3.
4xx
y
y = –0.6x + 5
y = 2x –4
y
321
6
–1–2–3
4
2
–2
–4
–6
–8
4. (a)
4
3
2
1
Current (l)
0.50.40.3
A
m = ACBC
CB
0.20.1
p.d
. (V
)
= = 6.252.50.4
(b) m = 6.25; c = 0; Law: V = 6.25I
5. (a) 6
5
4
3
2
1
Extension, L (mm)
5040302010
Str
etch
ing
forc
e, F
(N)
C
A
B
m = ACBC
= 4.8
0.12
40
=
(b) m = 0.12; c = 0; Law: F = 0.12L
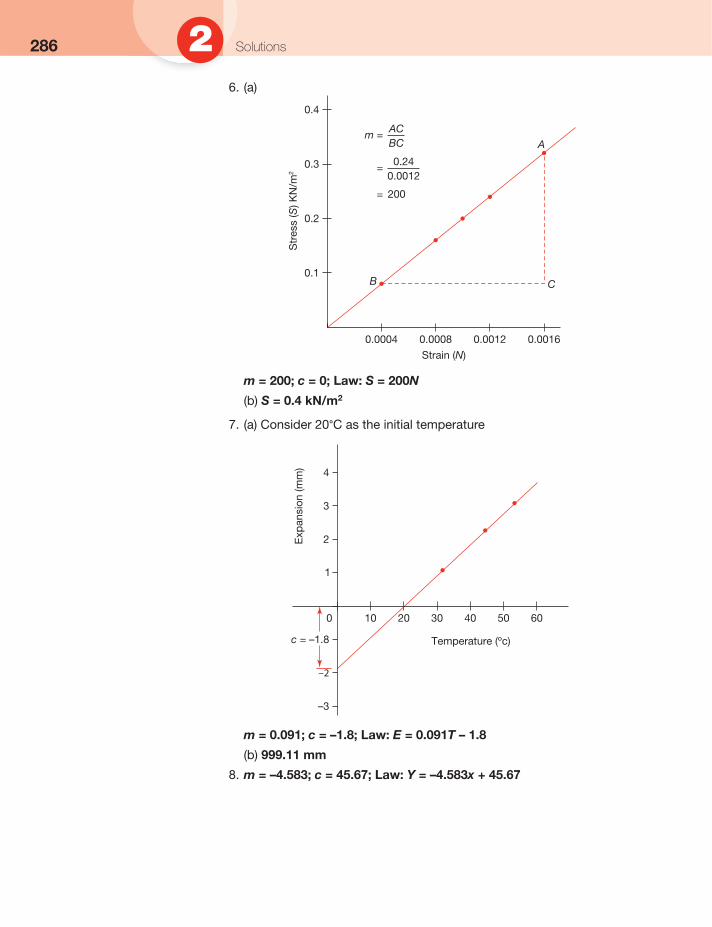
286 2 Solutions
6. (a)
0.4
0.3
0.2
0.1
Strain (N)
0.00160.00120.00080.0004
Str
ess
(S) K
N/m
2CB
Am = AC
BC
= 0.24
200
0.0012
=
m = 200; c = 0; Law: S = 200N
(b) S = 0.4 kN/m2
7. (a) Consider 20°C as the initial temperature
Temperature (ºc)
Exp
ansi
on (m
m) 4
3
2
1
c = –1.8
–2
–3
6050403020100
m = 0.091; c = –1.8; Law: E = 0.091T – 1.8
(b) 999.11 mm
8. m = –4.583; c = 45.67; Law: Y = –4.583x + 45.67

287Solutions 2 9.
4x
y
321
(1, 4)
6
–1–2–3–4
4
2
–2
–4
–6
–8
8
x + y = 5
3x – 2y =
–5
x = 1, y = 4
10.
x
y
642
15
–2–4–6–8
10
5
–5
–10
–15
–20
20
25
–25
x = –5, x = 4

288 2 Solutions
Exercise 9.1
1. (a) 86 mm = = 0.086 m
(b) 385 mm = = 0.385 m
(c) 7.4 m = 7.4 × 100 = 740 cm
(d) 3 ft 2 in = (38 in) × 25.4 = 965.2 mm
(e) 1 yd = 0.9144 m; 6 yd = 6 × 0.9144 = 5.4864 m
(f) 14 in = 14 × 25.4 = 355.6 mm, or 0.3556 m
2. (a) 24 ft = 24 × 0.3048 = 7.315 m
(b) 9 m = 9/0.3048 = 29.528 ft = 29 ft + (0.528 × 12 in) = 29 ft 6.3 in
3. (a) 0.070 kg × 1000 = 70 g
(b) 25 500 kg = = 25.5 tonnes
(c) 815 g = 815 × 0.03527 = 28.745 oz
4. (a) 15.500 kg = 15.5 × 2.20462 = 34.172 lb
(b) 250 kg = 250 × 2.20462 = 551.155 lb
(c) 75 lb = = 34.019 kg
5. (a) 12 550 mm2 = 12 550 × 0.01 = 125.5 cm2
(b) 655 000 mm2 = 655 000 × 10–6 = 0.655 m2
(c) 2.75 m2 = 2.75 × 106 = 2 750 000 mm2
(d) 5.25 m2 = 5.25 × 10 000 = 52 500 cm2
6. (a) 95 450 mm3 = 95 450 × 10–9 = 9.545 × 10⁻⁵ m3
(b) 9545 mm3 = 9545 × 0.001 = 9.545 cm3
(c) 0.00094 m3 = 0.00094 × 109 = 940 000 mm3
7. (a) 12 560 ml = 12 560 × 0.001 = 12.560 litres
(b) 6.67 litres = 6.67 × 100 = 667 centilitres
(c) 350 centilitres = 350 × 0.01 = 3.50 litres
(d) 0.0053 m3 = 0.0053 × 1000 = 5.3 litres
(e) 25 litres = 25 × 0.22 = 5.5 gallons
8. 37°C = 95 + 3.6 = 98.6°F
61.5°C = 140 + 2.7 = 142.7°F
Exercise 10.1
1. (a) = 72.6475°
(b)
86 1000
385 1000
25500 1000
75 2.20462
72038'51" = 720 + (38)+ ( 51 ) 60 60x60
, 63.88° = 63° + (0.88 x 60) = 63° + 52.8' = 63°52' + (0.8 x 60)"
= 63"52'48"

289Solutions 2 (c) = 30.81389° = (30.81389 × ) radians
= 0.5378 radians.
2. �y = 107° (opposite angles); �y + �z = 180°
�z = 180° – �y = 180° – 107° = 73°
�x = 360° – 76° – 73° – 107° = 104°
3. (a) Unknown side = = 9.220 m
(b) Unknown side = = 8.944 m
(c) Unknown side = = 7.133 m
4. (a) Line XY is parallel to line PN, therefore �MPN and �MQR are equal. �PMN is common to both triangles, therefore the triangles are similar.
(b)
PQ = 55 – 40 = 15 m
= 96.25 m
RN = MN – MR = 96.25 – 70 = 26.25 m
5. All angles of �BCF are equal (60°) therefore all sides are equal as well. In �BAF side BA must be equal to side BF. � BC = CF = BF = BA = 3 m
AF = FE = = 5.196 m
6. Length of third boundary = = 46.043 m
7. �B = �D = 113°
�A = �C = ½ (360 – 2 × 113) = 67°
8. Circumference = 2�r = 2 × � × 5.6 = 35.186 m
Exercise 11.1
1. (a) Area = ½ × 6 × 8 = 24 cm2
(b) GD = = 11.3137 cm
� area = ½(11.3137 × 8) = 45.255 cm2
(c) Area = 11 × 7.5 = 82.5 cm2
(d) Area = 7 × 7 = 49 cm2
(e) Area = ½(8 + 12) × 6 = 60 cm2
(f) Area = 11 × 5.5 = 60.5 cm2
2. (a) Area: circle = � × 1.752 = 9.621 m2
(b) Area: major sector = = 6.548 m2
Area: minor sector = = 3.073 m2
3. Area of concrete path = � × 162 – � × 152 = 97.389 m2
30'48'50"
.,fi2;62
.J10.5' - 5.5'
.J11.8' - 9.4'
40 _ PM :. PM- 40x110 _ 55m 80 110 80
70 _ 80 :.MN- 70x110 MN 110 80
~6' - 3'
~12' - 4'
~38' + 26'
245 x 9.621 360
115 x9.621 369
21t 360

290 2 Solutions
4. Length (including path) = 15 + 1.2 + 1.2 = 17.4 m
Width (including path) = 11 + 1.2 + 1.2 = 13.4 m
Area = (17.4 × 13.4) – (15 × 11) = 68.16 m2
5. Area of girder = (12 × 1.5) + (20 × 1.5) + (10 × 1.0) = 58 cm2, or 5800 mm2
6. Area of fl oor = 3.50 × 3.00 = 10.5 m2
Area of one tile = 0.33 × 0.33 = 0.1089 m2
Therefore number of tiles = = 96.42
Add 10% = 1.1 × 96.42 = 106.06 tiles
Number of packs required = = 11.78, so 12 packs
7. Area of drive = 9.0 × 8.0 – = 59.434 m2
Area of one block = 0.2 × 0.1 = 0.02 m2
Number of blocks = = 2971.68
Add 10% for cutting/wastage = 1.1 × 2971.68 = 3268.9, so 3269 blocks.
8. Area of fl oor = 5.0 × 4.0 = 20.0 m2
Number of packs = = 9.5
Add 10% for wastage = 1.1 × 9.5 = 10.45 packs, so 11 packs.
9. Length of internal walls = 2(4.8 + 3.8) = 17.2 m
Height of internal walls = 2.8 – 0.100 = 2.7 m
Wall area (including door and window) = 17.2 × 2.7 = 46.44 m2
Area of door and window = 1.9 × 1.0 + 1.8 × 1.2 = 4.06 m2
Net wall area = 46.44 – 4.06 = 42.38 m2
Area of ceiling = 4.8 × 3.8 = 18.24 m2
10. Area of one roll = 0.52 × 10.0 = 5.2
Number of rolls = = = 8.15
Add 15% = 1.15 × 8.15 = 9.37, so 10 rolls.
11. Area of the wall = 5.0 × 2.4 = 12.0 m2
Area of one brick = 0.016875 m2; number of bricks
= = 711.1
Add 5% for wastage = 1.05 × 711.1 = 746.7, so 747 bricks
Area of one block = 0.101250 m2; number of blocks
= = 118.5
Add 5% = 1.05 × 118.5 = 124.4, so 125 blocks
59.434 0.02
20.0 2.106
10.5 0.1089
106.06 9
wall area 42.38 5.2 5.2
12.0 0.016875
12.0 0.101250
434 434

291Solutions 212. Area of gable end = 12 × 5.4 + = 88.8 m2
Number of bricks = = 5262.2 bricks
Add 5% = 5262.2 × 1.05 = 5525.3, so 5526 bricks
Number of blocks = = 877.04 blocks
Add 5% = 877.03 × 1.05 = 920.89, so 921 blocks
Exercise 12.1
1. Volume = 3.24 × 4.38 × 2.46 = 34.91 m3
2. Radius = 225 mm or 0.225 m; volume = � × (0.225)2 × 0.950
= 0.15109 m3
0.15109 m3 = 0.151 09 × 1000 = 151.09 litres
3. Volume = × (3.5 × 3.5) × 6.0 = 24.5 m3
4. Radius of the base = 1.5 m
Volume = × � × (1.5)2 × 8 = 18.85 m3
5. Volume = (300 × 300 × 400) +
= 48 000 000 mm3 or 0.048 m3
6. Volume = × 14 = 336 m3
7. Internal size of the culvert is 1.45 m × 0.95 m
Cross-sectional area of culvert = 1.75 × 1.25 – 1.45 × 0.95 = 0.81 m2
Volume of concrete per linear metre = 0.81 × 1.0 = 0.81 m3
8. Cross-sectional area = × (10.85 + 8.40) × 2.95 = 28.39375 m2
Volume = 28.39375 × 25 = 709.844 m3
9. (a) Volume of water = 2.4 × 1.8 × (1.20 – 0.15) = 4.536 m3
(b) Mass = Volume × Density = 4.536 × 1000 = 4536 kg
(c) Force on the joists = 4536 × 9.8 = 44 452.8 N
10. (a) Volume = 8.5 × 3.5 × 0.150 = 4.4625 m3
(b) Quantities: Cement = 0.198 × 4.4625 = 0.884 m3
Sand = 0.398 × 4.4625 = 1.772 m3
Gravel = 0.8 × 1.772 = 3.57 m3
Water = 109 × 4.4625 = 486 litres
11. (a) Plan area of foundation trench: Area 1 = 4.754 × 0.6 = 2.8524 m2
Area 2 = 2.651 × 0.6 = 1.5906 m2
Area 3 = 2.651 × 0.6 = 1.5906 m2
1
3
1 -
3
88.8 0.016875
88.8 0.101250
12 x 4.0 2
[~ x (300 x 300) x 400]
1 -
2
1
3
1 3
88.8 0.016875
88.8 0.101250
(iX12X4)
1 2
12 x 4.0 2
1 x (300 x 300) x 400]

292 2 Solutions
Total plan area = 6.0336 m2; Volume of soil = 6.0336 × 0.9
= 5.430 m3
(b) Volume of soil after bulking = + 5.430 = 6.245 m3
(c) Volume of concrete = 6.0336 × 0.2 = 1.207 m3
Exercise 13.1
1. (a) sin 30°20�35� = 0.5052
cos 50°10�30� = 0.6404
tan 40°55�05� = 0.8668
(b) = 31°32�1.3�
cos–1 0.981 = 11°11�12.4�
tan–1 0.638 = 32°32�16.4�
2. AC = 15 sin 30° = 7.5 cm
BC = 15 cos 30° = 12.99 cm
3. �BAC = 60°35�30�; = tan 60°35�30�
BC = AC × tan 60°35�30�
= 60 × tan 60°35�30� = 106.447 m
4. In �ABC, angle C is the right angle and AC represents the height of the building.
Building
60º
Cable
B
A
C
35 m
(a) = sin 60°; AC = AB × sin 60° = 30.311 m
(b) = cos 60°; BC = AB × cos 60° = 17.5 m
5. A gradient of 9% means that the road rises nine units for every 100 units of its horizontal measurement (see fi gure below). Let h = the rise or fall of the road.
sin-' 0.523
AC AB BC AB
BC Opp -=-AC Adj
(~X5.430) 100

293Solutions 2
100 m
9 m
Road
θ
h2450 m
tan = = 0.09; = tan–1 0.09 = 5.142764°
= sin 5.142764°, � h = 2450 × sin 5.142764 ° = 219.612 m
6. If is the pitch of the roof, then tan =
� pitch = tan–1 = 1.193° or 1°11�36.56�
7.
35º40´
125º40´
95º
5º
50 m
65 mD
F
E
C
A
B
CF = 65 × cos 35°40� = 52.8075 m (also CF = AE)
BD = DF + FE + EB = 65 × sin 35°40� + 50 + 52.8075 × tan 5°
= 92.519 m
Area of plot (trapezium) = × 52.8075 = 3763.04 m2
8. (a) In �DEF, DF = height of roof = 5 tan 40° = 4.195 m
Common rafter HJ = DE = = 6.527 m
(b) In �DFA, FA = = 7.071 m
Hip rafter DA = = 8.222 m
(c) BD = = 6.527 m
Area of roof = 2 × [ × (15 + 5) × 6.527 + × 10 × 6.527] = 195.81 m2
h 2450
9
100
(4~)
OF sin40·
50+92.519 2
OF sin40·
,f5'+5'
~7.071' +4.195'
1 -
2
1 48
1 -
2

294 2 Solutions
9. Length of top of embankment = 40 – 2 ( ) = 31.431 m
Cross-sectional area = × (40 + 31.431) × 3.0 = 107.147 m2
Volume = 1200 × 107.147 m2 = 128 576.4 m3
10. Pitch = tan–1 = 43.73°. Stairs are too steep.
The pitch could be reduced by increasing the going and/or decreasing the rise.
Floor to ceiling height = 220 × 11 risers = 2420 mm
Try 12 risers, therefore new rise = = 201.67 mm
New going = = 223.98 mm (say 224 mm)
2R + G = 2(201.67) + 224 = 627.34 < 700; therefore satisfactory
Use rise = 201.67 mm and going = 224 mm
Exercise 14.1
1. Refer to Figure 14.1 in Chapter 14.
Stations A and B, and corner F form a triangle whose sides are: AB = 116 861 m; AF = 74.447 m; and BF = 45 641 m. The angles of �AFB may be calculated by sine/cosine rule which will enable the location of corner F of the factory unit.
In �ABF, 116.8612 = 74.4472 + 45.6412 – 2(74.447)(45.641) cos F
� �F = 152.559°
� �A = 10.369°
� �B = 180 – 152.558 – 10.369 = 17.072°
In �ACB distances AC and BC are 109.252 m and 11.722 m, respectively.
109.2522 = 116.8612 + 11.7222 – 2(116.861)(11.722) cos B
� �B = 47.301°
� �A = 4.523° and �C = 128.176°
Having the necessary information the setting out will depend on the inter-visibility of the site stations and the equipment available. It is often done with a total station, but could be completed with a theodolite and tapes or EDM.
2. The angles at all corners must be 90°. The lengths of the diagonals must be:
Diagonal HB = = 10.30 m
Diagonal AC = = 7.57 m
(220) 230
201.67 tan42"
116.861 45.641 sin 152.559 sinA
1 -
2
109.252 116.861 11.722 sin 47.301 sin C sin A
'/7.56' + 7.0'
2420 12
3.0 tan 35"
~7.00' + (5.11 + 5.33 - 7.56)'

295Solutions 2 Diagonal BD = = 7.16 m
Diagonal CE = = 8.44 m
Diagonal EG = = 6.36 m
Diagonal FH = = 18.07 m
Diagonal AG = = 18.91 m
Diagonal DH = = 17.11 m
Diagonal EH = = 14.48 m
Diagonal CG = = 14.69 m
3. Refer to Figure 14.10. Take the right-hand quadrant of a 3.00 m diameter semicircle, divide it into six strips (i.e. seven ordinates) then calculate the lengths of the ordinates starting at the longest.
Ordinate number Calculation Length
1 1.5 m
2 1.479 m
3 1.414 m
4 1.299 m
5 1.118 m
6 0.829 m
7 0.0 m
The curve set out with these ordinates (each used twice: once for each quadrant) will describe a semicircle of 3.00 m diameter. A line parallel to the diameter must be drawn 100 mm from it to fi nish the setting out.
4. Eight strips will give nine ordinates.
m. Now divide half the arch into eight strips and
fi nd the seven intermediate ordinates (the fi rst and last are 1 m and 0.0 m). Let the lengths of ordinates be h1, h2, etc.
h1 = 1.000 m
h2 = – 0.411 = 0.990 m
h3 = – 0.411 = 0.959 m
h4 = – 0.411 = 0.906 m
h5 = – 0.411 = 0.828 m
h6 = – 0.411 = 0.720 m
h7 = – 0.411 = 0.572 m
h8 = – 0.411 = 0.361 m
h9 = 0.0 m
R= (¥J +1'
2x1.0
~6.55' + (5.11 + 5.33 - 7.56)'
,J5.33' + 6.55'
,J3.78' + 5.11'
~5.11' +(7.00+6.55+3.78)'
~7 .56' + (7.0 + 6.55 + 3.78)'
~(5.11 + 5.33)' + (7.0 + 6.55)'
~5.11' + (7.0 + 6.55)'
~(6.55 + 3.78)' + (5.11 + 5.33)'
1.411
,J1 .5' - .25'
,J1.5' - .5'
,J1.5' - .75'
,J1.5' -1.0' ,J1 .5' -1 .25'
,J1 .5' -1 .5'
~1.411' - (1 x 0.16875)'
~1.411' - (2 x 0.16875)'
~1.411' - (3 x 0.16875)'
~1.411' - (4 x 0.16875)'
~1.411' - (5 x 0.16875)'
~1.411' - (6 x 0.16875)'
~1.411' - (7 X 0.16875)'

296 2 Solutions
5. Span 2100 mm
D´C´
B´
DCBA
(a)
(b)
E´
F´
E F G
J
Ris
e 50
0 m
m
H O
O
D´
GAD
rR
Referring to diagram 14.14:
Horizontal distance Vertical distance
th = 1.8 cos 15° = 1.739 m gh = 1.2 sin 15° = 0.311 m

297Solutions 2 tk = 1.8 cos 30° = 1.559 m jk = 1.2 sin 30° = 0.600 m
tm = 1.8 cos 45° = 1.273 m lm = 1.2 sin 45° = 0.849 m
tp = 1.8 cos 60° = 0.900 m np = 1.2 sin 60° = 1.039 m
tr = 1.8 cos 75° = 0.466 m qr = 1.2 sin 75° = 1.159 m
6. Using a similar diagram and labelling to that in the previous question:
th = 1.6 cos 15° = 1.545 m gh = 1.4 sin 15° = 0.362 m
tk = 1.6 cos 30° = 1.386 m jk = 1.4 sin 30° = 0.700 m
tm = 1.6 cos 45° = 1.131 m lm = 1.4 sin 45° = 0.990 m
tp = 1.6 cos 60° = 0.800 m np = 1.4 sin 60° = 1.212 m
tr = 1.6 cos 75° = 0.414 m qr = 1.4 sin 75° = 1.352 m
Exercise 15.1
1. Area of foundation = 2[(8.6 + 0.45 + 0.45) × 0.45 + (7.1 × 0.45)]
= 2[(9.5) × 0.45 + (3.195)] = 14.94 m2
Volume of concrete = 14.94 × thickness = 14.94 × 0.750 = 11.205 m3
For preparing 11.205 m3 of concrete the quantities of materials and their costs are:
Material Mass
Cement 240 × 11.205 = 2689 kg 108 × 25 kg bagsFine aggregates 720 × 11.205 = 8068 kg 10 × 850 kg
jumbo bagsCoarse aggregates
1440 × 11.205 = 16 135 kg 19 × 850 kg jumbo bags
Cost of cement = 108 × £4.90 = £529.20
Cost of fi ne aggregates = 10 × £36.00 = £360.00
Cost of coarse aggregates = 19 × £36.00 = £684.00
Total cost of materials = £1573.20
Labour hours = 2 × 11.205 = 22.41
Labour cost = 22.41 × £15.00 = £336.15
2. Area of the wall = 5.5 × 2.7 – 2(1.8 × 1.2)
= 14.85 – 4.32 = 10.53 m2
Number of bricks = 10.53 × 60 = 631.8
Number of bricks with 5% extra allowance = 631.8 × 1.05 = 663.39, so 664
Number of blocks = 10.53 × 10 = 105.3
Number of blocks with 5% extra allowance = 105.3 × 1.05 = 110.57, so 111
Mortar required for brickwork = 0.026 × 10.53 = 0.2738 m3

298 2 Solutions
Quantity of mortar with 10% extra allowance = 1.10 × 0.2738 = 0.3012 m3
Mortar required for blockwork = 0.012 × 10.53 = 0.1264 m3
Quantity of mortar with 10% extra allowance = 1.10 × 0.1264 = 0.139 m3
Brickwork
Assume the density of 1:3 cement/sand mortar to be 2300 kg/m3
Mass of 0.3012 m3 of mortar = 0.3012 × 2300 = 692.76 kg
Mass of cement =
Mass of sand =
Blockwork
Assume the density of 1:6 cement/sand mortar to be 2300 kg/m3
Mass of 0.139 m3 of mortar = 0.139 × 2300 = 319.7 kg
Mass of cement =
Mass of sand =
Total quantity of cement = 173.19 + 45.67 = 218.86 kg
Total quantity of sand = 519.57 + 274.03 = 793.6 kg
Cost of labour
Brickwork = £36.00 × 10.53 = £379.08
Blockwork = £9.00 × 10.53 = £94.77
3. (a) Area of the fl oor = 5.0 × 4.2 = 21.0 m2
Number of packs of fl oorboards =
= = 12.28
Wastage of 10% = 12.28 × = 1.228
Total number of packs required = 12.28 + 1.228 = 13.51, so 14
Cost of material = 14 × £29.50 = £413.00
Labour cost = 21.0 × £10.00 = £210.00
Total cost = £413.00 + £210.00 = £623.00
(b) Area of the room = 4.5 × 3.9 = 17.55 m2
Area of one sheet of chipboard = 2.4 × 0.6 = 1.44 m2
Number of sheets required = = 12.19
Wastage of 10% = 12.19 × = 1.22
1 4x 692.76 = 173.19 kg
~ x 692.76 = 519.57 kg
1 'ix 319.7 = 45.67 kg
6 -x 319.7 = 274.03 kg 7
21.0 coverage provided by one pack
21.0
10 100
1.71
17.55 1.44
10 100

299Solutions 2 Total number of chipboard sheets = 12.19 + 1.22 = 13.41 or 14
Cost of material = 14 × £11.50 = £161.00
Labour cost = 17.55 × £6.00 = £105.30
Total cost = £161.00 + £105.300 = £266.30
4. Area of roughcast fi nish on the wall = 2 × 9.15 ×2.95 + 2 × 7.0 × 2.95 – 5 ×(1.5 × 1.3) – 2.0 × 0.940 – 2.0 × 1.3 – 1.2 × 1.3
= 79.495 m2
Volume of paint required = = = 26.5 litres
Two coats of paint require 2 × 26.5 or 53 litres of paint
Number of fi ve-litre cans = = 10.6 or 11
Cost of paint = 11 × £25.39 = £279.29
Labour cost (two coats) = 79.495 × £5.80 = £461.07
Exercise 16.1
1. Mean = 1/12(5.5 + 6.0 + 6.0 + 6.3 + 6.5 + 7.1 + 7.2 + 7.7 + 7.8 + 8.0 + 8.2 + 8.5)
Mean = 7.07%
Mode = 6.0%
Place in rank order: 5.5, 6.0, 6.0, 6.3, 6.5, 7.1, 7.2, 7.7, 7.8, 8.0, 8.2, 8.5
Median = (7.1 + 7.2)/2 = 7.15%
2. Mean = (11.5 + 14 + 11 + 12 +13.5 +10 + 12.5 + 12.8 + 13 + 13.3 + 11.4 + 13.6 + 15 + 10.5 + 9.8)/15 = 183.9/15 = 12.26%
There is no mode.
Place in rank order: 9.8 + 10 + 10.5 + 11 + 11.4 + 11.5 + 12+ 12.5 + 12.8+ 13 + 13.3 +13.5 + 13.6 + 14 + 15
The median = the eighth term = 12.5%
The range is 15 – 9.8 = 5.2%
3. (a)
Class interval Class midpoint Frequency f × x
(crushing strength: (x) (f )N/mm2 )
32–34 33 3 99
35–37 36 7 252
38–40 39 8 312
41–43 42 7 294
44–46 45 9 405
area of wall 79.495 spreading rate of paint 3
53 5

300 2 Solutions
47–49 48 6 288
50–52 51 5 255
�f = 45 �fx = 1905
(b) Mean = = 1905/45 = 42.33 N/mm2
4.
Administrative staff
Freq
uenc
y
Direct
ors
(a)5
4
3
2
1
0
(b)
Assoc
iate d
irect
ors
Civil e
ngine
ers
Tech
nician
engin
eers
Tech
nician
s
Admini
strat
ive st
aff
Technicians
Technician engineers
Civil engineers
Associate directors
Directors
543210Frequency
(Continued)
I,fx I,f

301Solutions 2(c)
Directors, 3
Associatedirectors, 4
Civilengineers, 3
Technicianengineers, 3
Technicians, 4
Administrativestaff, 4
68.57º
51.43º
5.
Pric
e (£
)
300,000
250,000
200,000
150,000
100,000
50,000
Year 2
S
0
T
D
Year 1
S
T
D
Year 3
T – Terraced
S – Semi-detached
D – Detached
S
T
D
6.
(a)
Accidents in trenches/excavations
6.1 m and over4%
4.6–6.0 m10%
3.1–4.5 m24%
1.6–3.0 m26%
0.1–1.5 m
Depth of trench
0.1–1.5 m36%
1.6–3.0 m
3.1–4.5 m
4.6–6.0 m
6.1 m and over
(Continued)
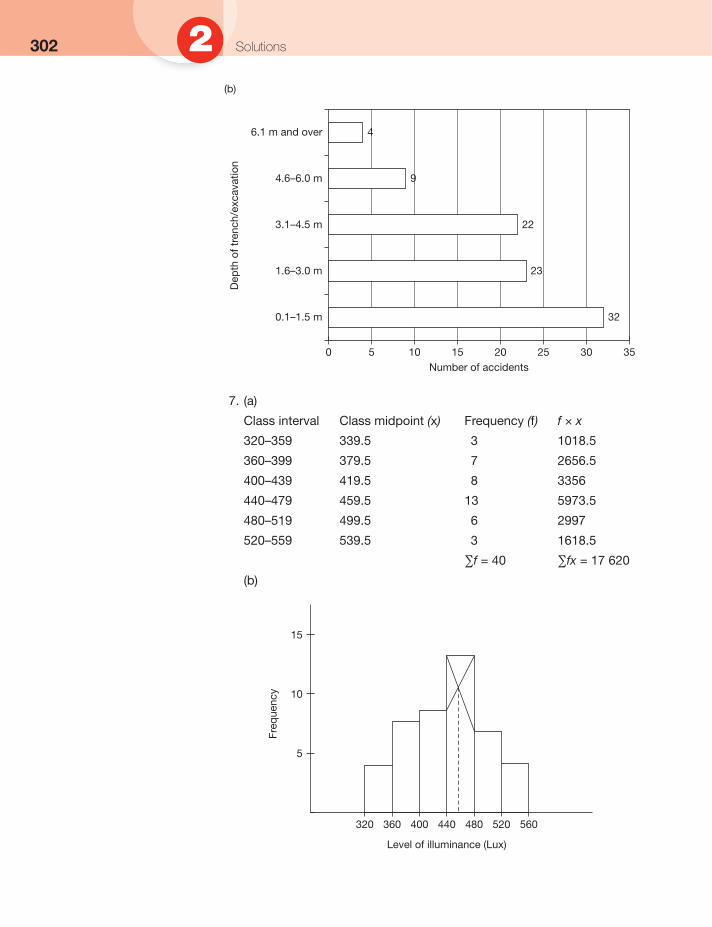
302 2 Solutions
6.1 m and over 4
(b)
350 5 10 15 20 25 30Number of accidents
4.6–6.0 m 9
3.1–4.5 m 22
1.6–3.0 m 23
0.1–1.5 m 32
Dep
th o
f tre
nch/
exca
vatio
n
7. (a)
Class interval Class midpoint (x) Frequency (f) f × x
320–359 339.5 3 1018.5
360–399 379.5 7 2656.5
400–439 419.5 8 3356
440–479 459.5 13 5973.5
480–519 499.5 6 2997
520–559 539.5 3 1618.5
�f = 40 �fx = 17 620
(b)
Freq
uenc
y
15
10
5
Level of illuminance (Lux)
560520480440400360320

303Solutions 2
15
10
5
Level of illuminance (Lux)
280 320 360 400 440 480 520 560 600
Freq
uenc
y
(c) Mean = = 17 620/40 = 440.5 lux
Mode (from the histogram) = 456 lux
8. (a)
Freq
uenc
y
15
10
5
(a)
Compressive strength (N/mm2)
403020
Cum
ulat
ive
freq
uenc
y
40
30
20
10
Compressive strength (N/mm2)
40302010
50%
Q2
= 2
8.5
2..fx
2..f

304 2 Solutions
Class interval (comp. strength)
Class midpoint x
Frequency f
f × x Comp. strength less than
Cumulative frequency
18.5 0
19–22 20.5 3 61.5 22.5 3
23–26 24.5 7 171.5 26.5 10
27–30 28.5 15 427.5 30.5 25
31–34 32.5 6 195 34.5 31
35–38 36.5 4 146 38.5 35
�f = 35 �fx = 1001.5
(b) Mean = = 1001.5/35 = 28.6 N/mm2
Mode = 28.5 N/mm2 (from the histogram)
Median = 28.5 N/mm2 (from the cumulative frequency curve)
9. (a)
Cum
ulat
ive
freq
uenc
y
80
60
40
20
Compressive strength (N/mm2)
60504030
25%
Q2
= 4
7.5
Q3
= 5
1.5
50%
75%
Q1
= 4
4
Class interval (comp. strength)
Frequency Comp. strength – less than
Cumulative frequency
33.5 0
34–37 2 37.5 2
38–41 8 41.5 10
42–45 15 45.5 25
46–49 20 49.5 45
50–53 13 53.5 58
54–57 10 57.5 68
58–61 2 61.5 70
2..fx
2..f

305Solutions 2(b) The median is the 50th percentile on the graph = 47.5 N/mm2
Inter-quartile range = 51.5 N/mm2 – 44 N/mm2 = 7.5 N/mm2
Exercise 17.1
1. Slant height from centre of base to apex = = 19.0394 m
Surface area of one side = ½(35 × 19.0394) = 333.19 m2
Surface area of four sides = 4 × 333.1895 = 1332.76 m2
2. Slant height, l = = 65 m
Surface area = �rl = � × 25 × 65 = 5105.09 m2
3. Area = 5105.09 – 500 = 4605.09 m2
4. (a) Slant height = m2
Area of one side = = 522.0153 m2
Area of four sides + top = 4 × 522.0153 + 25 = 2113.06 m2
(b) Volume =
= × 6 (2025 + 225 + 25) = 4550 m3
5. Volume of top part = �h (r2 + rR + R2 )
= � × 4.5 (12 + 1 × 2 + 22 ) = 32.987 m3
Volume of right cone = �r2h = � × 12 × 0.5 = 0.524 m3
Total volume = 32.987 + 0.524 = 33.51 m3
6. Slant height, l = m
Slant height of small cone, l1 = m
Surface area of both vessels = �l(r + R) + �rl1
= � × 4.61(1 + 2) + � × 1 ×1.118
= 43.448 + 3.512 = 46.96 m2
7. Let d = diameter of smaller end of frustum
(a) then �d = 64.29 mm
(b) Slant height of frustum = mm
Slant height of cone = mm
Surface area of cone = = 84 338.93 mm2
Surface area of frustum:
= = 72 093.82 mm2
~60' + 25'
'/20' + 6' = 20.8806
(45;5) x 20.8806
i x 6 (45 x 45 + ~(45 x 45) x (5 x 5) + 5 x 5)
1 -
3 1
3 1 3
1 1 - -
3 3
'/1' + 4.5' = 4.61
d 150 150 350
,,'"i''-+-0-.5-=' = 1.118
'/200' + 42.857' = 204.54
'/75' + 350' = 357.946
It x75x357.946
It x 204.54(75 + 32.1429) +It x 32.1429'
,jeD' + 25'
'/20' + 6' = 2008806
(45;5) x 2008806
35' 22+ 705'
i x 6 (45 x 45 + ,j(45 x 45) x (5 x 5) + 5 x 5)
1 3
1
3 1 3
1 1 - -
3 3
'/1' + 405' = 4061
d 150 ------=--
150 350
'/'"1''-+-0-05-=' = 1 0118
../200' + 420857' = 204054
../75' + 350' = 3570946
" x75x3570946
It x 204054(7S + 3201429) +1t x 3201429'

306 2 Solutions
Difference in area = 84338.93 – 72093.82 = 12 245.11 mm2
Therefore the cone is larger by 12 245.11 mm2
Exercise 18.1
1. Mid-ordinates are: 0.5(1 + 1.5) = 1.25 cm
0.5(1.5 + 3) = 2.25 cm
0.5(3 + 5.5) = 4.25 cm
0.5(5.5 + 9) = 7.25 cm
0.5(9 + 13.5) = 11.25 cm
Area by mid-ordinate rule = 1(1.25 + 2.25 + 4.25 + 7.25 + 11.25)
= 26.25 cm2
Area by trapezoidal rule = 1{0.5(1 + 13.5) + 1.5 + 3 + 5.5 + 9}
= 26.25 cm2
Both results are higher than the exact answer.
2. By trapezoidal rule:
15{0.5(45 + 43) + 52 + 56 + 53 + 49 + 45} = 4485 m2
By mid-ordinate rule area equals 4485 m2
By Simpson’s rule, area = 15/3{45 + 43 + 2(56 + 49) + 4(52 + 53 + 45)
= 4490 m2
3. Area by Simpson’s rule = 3/3{2 + 10.9 + 2(3.3 + 6.3) + 4(2.5 + 4.6 + 8.2)}
= 93.3 cm2
4. (a) Area by trapezoidal rule = w[½(fi rst + last) + sum of remaining ordinates]
= 12[½(1.25 + 2.15) + 1.25 + 1.4 + 1.65 + 1.6 + 1.6 + 1.8 + 1.9]
= 12[(1.7) + 11.2] = 154.8 m2
(b) Volume = 154.8 × 1.2 = 185.76 m3
5. Area by trapezoidal rule = w[½(fi rst + last) + sum of remaining ordinates]
= 12[½( 0 + 0 ) + 23 + 46 + 63 + 66 + 51 + 28]
= 12[277] = 3324 m2
6. Your answer depends on the accuracy of your draughtsmanship. But here a different method is given to show accurate answers.
In �ACB, , ��A = 42.219°
��B = 180 – 50 – 42.219 = 87.781°
Area of �ACB = 0.5(114)(100) sin 87.781 = 5695.726 m2
In �ACB, , �b = 148.705 m
In �DCA, 148.7052 = 952 + 1052 – 2(105)(95) cos D
��D = 95.936°
114 100 --=--sin50 sinA
114 b
sin 50 sin 87.78

307Solutions 2 Area of �DCA = 0.5(105)(95) sin 95.936 = 4960.757 m2
Total area = 5695.726 + 4960.757 = 10 656.48 m2
7. Area = w [(fi rst + last) + 4 (sum of the even ordinates) + 2 (sum of
the remaining odd ordinates)]
= × 20[(0 + 0) + 4 (1.2 + 2.2 + 2.6 + 0.7) + 2 (1.7 + 3.0 + 1.8)]
= × 20[(0 + 0) + 4 (6.7) + 2 (6.5)] = 265.333 m2
Therefore volume = area × width of excavation
= 265.333 × 20 = 5306.67 m3
8. Volume = × 10[3.5 + 2.6 + 2(3.0) + 4(3.3 + 2.75)] = 121 m3
9. Area of top = 55 × 49 = 2695 m2
Area base = 48 × 43 = 2064 m2
Area mid-section = ½(49 + 43) × ½(55 + 48) = 2369 m2
Volume = [2695 + 4(2369) + 2064] = 7829.25 m3
10. The cross-sections are triangles.
Area of left-hand side = ½(15 × 12) = 90 m2
Area of right-hand side = ½(40 × 17) = 340 m2
Area mid-section = ½[½(40 + 15) × ½(17 + 12)] = 199.375 m2
Therefore volume = × [90 + 4(199.375) + 340] = 6137.5 m3
Exercise 19.1
1. If side a = side c then �A = �C = 72°
�B = 180 – 2(72°) = 36°
Side b = = 30.9 cm
2. �A = 180° – 40° – 55° = 85°
� c = = 24.67 cm
and b = = 19.36 cm
3. In �EGC, CE = 2.666 cos 30° = 2.309 m
GE = 2.666 sin 30° = 1.333 m
In �AGC, �A = �C
1
3
1 -
3 1
-
3
1 3
3.3 6
b 50 sin 36 sin 72
50 x sin 36· sin 72·
30
6
30 c b --=--=--sin 85· sin 55· sin 40·
30 x sin 55· sin 85·
30 x sin 40· sin 85·

308 2 Solutions
Therefore side AE = side CE = 2.309 m
Also, side AG = side CG = 2.666 m
�AFG is an equilateral triangle, � FG = AG = 2.666 m
4. q2 = 252 + 302 – 2(25)(30) × cos 44°°
q2 = 445.99
�q = 21.12 cm
��P = 80.681°
and �R = 180 – 44 – 80.681 = 55.319°
5. a2 = b2 + c2 – 2bc cos A
82 = 62 + 102 – (2 × 6 × 10) cos A
cos A = 0.6, � �A = cos–1 0.6 = 53.13°
b2 = c2 + a2 – 2ca cos B
62 = 102 + 82 – (2 × 10 × 8) cos B
cos B = 0.8, � �B = cos–1 0.8 = 36.87°
�C = 180 – 53.13° – 36.87° = 90°
6. Area = ½(200)303 × sin 46° = 21 795.996 m2
Area = ½(303)192 × sin 48° = 21 616.597 m2
Total area = 43 412.59 m2
7. In �BDC, , ��B = 42.219°
�C = 180° – 50° – 42.219° = 87.781°
, �c = 148.705 m
In �ADB, 148.7052 = 952 +1052 – 2(95)(105) × cos A
cos A = –0.103417, or �A = 95.936°
952 = 148.7052 + 1052 – 2(148.705)(105) × cos B
�B = 39.4514°
�D = 180° – 95.936° – 39.4514° = 44.6126°
��ADC = 50° + 44.6126° = 94.6126°
�In �BDC, �B = 180 – 50 – 87.781 = 42.219°
��ABC = 42.219 + 180 – 44.614 – 95.936
= 81.671°
8. In �ADC, �A = 180° – 95° – 41° = 44°
, � AD = 472.217 m
, � AC = 717.039 m
In �BDC, �B = 180° – 43° – 88° = 49°
30 21.1184 sinP sin 44·
114 100 --= --sin 50· sinB
c 114 sin 87.781" sin 50·
500 AD sin 44· sin 41"
AC 500 sin 95· sin 44·

309Solutions 2 , � BC = 451.828 m
In �ABC, �C = 88° – 41° = 47°
AB2 = 717.0392 + 451.8282 – 2(717.039)(451.828) × cos 47°
AB2 = 276 388.134, � AB = 525.726 m
9. In �EHG, , �EH = 478.899 m
In �FHG, , �FG = 514.864 m
, �FH = 652.442 m
In �EHF, EF2 = 652.4422 + 478.8992 – 2(652.442)(478.899) × cos 51°
EF2 = 261 757.6935, �EF = 511.623 m
In �EHG, EG2 = 5002 + 478.8992 – 2(500)(478.899) × cos 102°
�EG = 760.864 m
In �EFG,
sin E = 0.67337, ��E = 42.328°
�HEF = 40° + 42.328° = 82.328°
�EFG = 360° – (82.328° + 102° + 80°) = 95.672°
Exercise 20.1
1.
500 Be sin 49" - si1 43"
EH 500 --- : ---sln S8" sin 40-
FG 500 ---0---sin 5~ sin 49"
FH 500 sin eO" = sin 49"
511 .623 514.864 sin 42' sinE

310 2 Solutions
2.
3.

311Solutions 24.
5.

312 2 Solutions
6.
7.

Index
Acute angle 99Addition of
fractions 59numbers 11
Adjacent angles 99Aggregates 137, 273Algebra
addition and subtraction 21multiplication and division 22
Alternate angles 100Angles 97Angles of
depression 151elevation 151
Antilogarithms 35Area of
circles 118irregular surfaces 223quadrilaterals 117triangles 116, 243
Arches 175Axes – Cartesian 69Averages 198
Bar chart 202BODMAS 17Brackets 17Bulking of sand 63
Calculator 1Cartesian axes 69Cavity walls 123, 185Chezy’s formula 50Chipboard fl ooring 188Circle 111Circular arch 174Circumference 111Common rafter 157Complementary angles 99Composite numbers 11Computer techniques 249
Concrete mix 137, 273Cone
frustum of 219surface area of 218volume of 132
Continuous data 197Conversion of units 85Coordinates 69Corresponding angles 100Cosine 146Cosine rule 240Costing 183Cumulative frequency 208
Decagon 110Decimal numbers 13Deep strip foundation 138Degrees 97Denominator 56Density 136Diameter 111Discrete data 196Drains 265
Eaves 157Effl orescence 65Elliptical arch 178Embankments 161Equations
simple 24of straight line 75linear, application of 26
Estimation 40Evaluation of formulae 48Excavations 161Exponential key 3, 5
Floorboards 188Foundations:
deep strip 138strip 184

314 Index
Fractions 55equivalent 59addition and subtraction of 59multiplication and division of 60
Frequency distribution 206Frequency polygon 206Frustum of
cone 219pyramid 216
Gable end 157Geometry 97Going (stairs) 153Gradient 76Graphs 69Graphical solution of:
quadratic equations 80simultaneous equations 79
Grouped data 197
Headroom 153Heptagon 110Hexagon 110Hipped end 157Hip rafter 157, 159Histogram 206Hypotenuse 102
Indices 31Integers 10Intercept 77Interquartile range 209Isosceles triangle 101
Joists 188
Laws of indices 31Linear equations 24Logarithms 35
Mass 136Mean 199Median 199Mid-ordinate rule 223Mode of
calculator 2data 199
Multiplication ofdecimal numbers 14fractions 60
Negative numbers 10Nonagon 110Numbers
addition of 11history of 9subtraction of 11
Numerator 56
Obtuse angle 99Octagon 110Ogive 208Opposite angles 100Origin (in graphs) 70
Parallelogramarea of 116, 118properties of 108
Pentagon 110Percentages 61Pictograms 202Pie chart 202Pitch
of roof 158of stairs 152, 153
Place value 14Polygons 100Positive numbers 10Primary data 195Prime numbers 11Prism 130, 131Prismoidal rule 228Profi le 169Pyramid 131
surface area of 215frustum of 216
Pythagoras, theorem 102
Quadrilaterals 107Quadratic equations 80Quartiles 209
Radian 97Radius 111Range 200Raw data 197Rectangle 107, 108Resistors 48Rhombus 108Right angle 99Right-angled triangle 102

315Index
Rise (of stairs) 153Roman numerals 9Roof 156
Secondary data 195Sector 112Segment 112Setting out of
bay windows 169buildings 167curved brickwork 169
SI units 86Signifi cant fi gures 38Simpson’s rule 225Simultaneous equations 79Sine 146Sine rule 235Spreadsheet 249Square 108Stairs 152Standard form 37Statistical diagrams 201Statistics 195Straight-line:
graphs 73law of 75
Subtraction ofdecimal numbers 14fractions 59
Supplementary angles 99Surface area of
cone 218pyramid 215
Tangent 146Tally chart 195Temperature 94Theorem of Pythagoras 102Transformer 48Transposition of formulae 43Trapezium, area of 116, 118Trapezoidal rule 224Trench 227Triangles
area of 115types of 101similar 104
Trigonometric ratios 145Trigonometry 145
Units 85area 92length 86mass 89volume 92
Value added tax 62Volume of
cone 130cuboid 129cylinder 131irregular solids 227pyramid 130


