Embed Size (px)
Citation preview

Western Wildlife the Journal of the Western section of the Wildlife society
Volume 6 • 2019online issn: 2475-4250Print issn: 2577-2147
Photo: John H. Harris

editor
DaviD J. Germano
associate editors
Brian L. Cypher
Jeffrey r. SinGLe
Production manager
howarD o. CLark, Jr.

VOLUME 6 • 2019
Range Extension of the Western Yellow Bat (Dasypterus xanthinus) in New Mexico—James E. Zabriskie, Patricia L. Cutler, and James N. Stuart……………………………………………………………………………………1
Survey of Potential Predators of the Endangered Amargosa Vole (Microtus californicus scirpensis)—Austin N. Roy, Deana L. Clifford, Anna D. Rivera Roy, Robert C. Klinger, Greta M. Wengert, Amanda M. Poulsen, and Janet Foley………………………………………………………………………………………...5
Wrestling for Real Estate: Male-male Interactions in Breeding Foothill Yellow-Legged Frogs (Rana boylii)—Jeffery T. Wilcox and Jeff A. Alvarez………………………………………………………………………14
Growth Curve of White-tailed Antelope Squirrels From Idaho—Roberto Refinetti…………………………18Recent Observation of Kit Fox (Vulpes macrotis) Outside of Its Known Range in Oregon—Tim L. Hiller and
Philip J. Milburn…………………………………………………………………………………………………..21 Diet of the San Joaquin Antelope Squirrel in the Southern Portion of its Range—John H. Harris……………23Solar Energy Development and Endangered Species in the San Joaquin Valley, California: Identification of
Conflict Zones—Scott E. Phillips and Brian L. Cypher……………………………………………………… 29California Red-Legged Frog Response to Pond Restoration—David L. Riensche, Connor D. Tutino, and Leslie
Koenig………………………………………………………………………………………………………………45Wildlife Mortalities in Open-Topped Pipes in Central California—Michelle Harris, Barbara Clucas, Jenna
Stanek, and Mary Whitfield………………………………………………………………………………………50 Habitat Selection by Newly Metamorphosed Great Basin Spadefoots (Spea intermontana): a Microcosm Study—
Jo-Anne Hales and Karl W. Larsen………………………………………………………………………………61Survey for Coccidioides Antibodies in Blood Sera from California Sea Lions and Northern Fur Seals that
Stranded Along the Coast of California (2013–2015)—Antje Lauer, Lauren Palmer, Carl Kloock, Heather E.M. Liwanag, Tenaya Norris, Birgitte McDonald, Jazmine Mejia Muñoz, Catherine Mulcahy, Shawn Hannah, and Shawn Johnson……………………………………………………………………………………69
2019 Annual Meeting Review…………………………………………………………………………………………82 TWS Western Section Board Members…………………………………………………..……………………………83
C ON T E N T S

1
Peer-edited
Notes
raNge exteNsioN of the WesterN YelloW Bat (Dasypterus xanthinus) iN NeW Mexico
James e. Zabriskie1, patricia L. cutLer2, anD James n. stuart3,4
1Parks and Recreation Department, City of Las Cruces,P.O. Box 20000, Las Cruces, New Mexico 88004, USA
2White Sands Missile Range, Conservation Branch, Building 163,Springfield Avenue, White Sands Missile Range, New Mexico 88002, USA
3New Mexico Department of Game and Fish, Wildlife Management Division,1 Wildlife Way, Santa Fe, New Mexico 87507, USA
4Corresponding author, e-mail: [email protected]
Abstract.—The Western Yellow Bat (Dasypterus [= Lasiurus] xanthinus), a state-listed threatened species in New Mexico, occurs in the southwestern U.S. and has been previously reported in New Mexico only from the southwestern corner of the state. We document its occurrence based on photographs of a specimen from Las Cruces, Doña Ana County, New Mexico, which represents a northeastward range extension from previous localities in the state. Our record also documents the use of fan palms (Washingtonia spp.) in New Mexico as day roost habitat. We discuss distribution and habitat use of D. xanthinus in the Southwest.
Key Words.—bats; Chihuahuan Desert; geographic distribution; fan palm; Lasiurus xanthinus; roost habitat; Washingtonia.
The Western Yellow Bat, Dasypterus xanthinus, is a tree-roosting vespertilionid species that ranges from the southwestern U.S. to southern Mexico (Simmons 2005; Harvey et al. 2011). The bat was formerly classified as a subspecies of Lasiurus ega (e.g., Kurta and Lehr 1995), but genetic studies have supported its recognition as a distinct species (Baker et al. 1988; Morales and Bickham 1995; Simmons 2005). More recently, Baird et al. (2015) proposed the reassignment of all yellow bat species from the genus Lasiurus to Dasypterus. In the U.S., D. xanthinus has been most often recorded from southern California and central and southern Arizona (Constantine 1966, 1998; Hoffmeister 1986) and was more recently documented in southern Nevada (O’Farrell et al. 2004). The species was first discovered in Texas in 1996 and is currently known from multiple sites in the western part of that state (Higginbotham et al. 1999; Ammerman et al. 2012; Schmidly and Bradley 2016). The geographic range in New Mexico has been considered to be peripheral and limited to the southwestern corner of the state (Findley et al. 1975; Cook 1986). Herein we document a new locality record and range extension in New Mexico, which partially fills a distributional gap in the southern part of the state.
On 2 January 2019, four D. xanthinus (unknown sex) were discovered roosting in the canopy of a mature ornamental fan palm tree (Washingtonia filifera × robusta; Fig. 1) by two workers (Kailin Miller and Jesus Rodriguez) while they were pruning the palms in a city park in Las Cruces, Doña Ana County, New Mexico (32.34586, ˗106.77520, WGS 84; 1,234 m elevation).
Western Wildlife 6:1–4 • 2019Submitted: 30 January 2019; Accepted: 1 February 2019.
The bats, which appeared to be torpid, were observed sequestered within the cluster of dead fronds encircling the trunk below the live fronds as the dead growth was being trimmed and removed (Fig. 2). After their removal from the tree, the bats were briefly lethargic, thereby allowing photographs of one individual (Fig. 3), before they became active and flew off. Ambient temperature on this date in Las Cruces ranged from about ˗4 to 14° C. The photographs were sent to us and we identified the photographed individual as D. xanthinus based on the pale yellow color of the pelage, the presence of fur
figure 1. Ornamental fan palm trees (Washingtonia filifera × robusta) where Western Yellow Bats (Dasypterus xanthinus) were found roosting in a city park in Las Cruces, New Mexico, 2 January 2019. The four bats were found in the dead fronds of the fourth tree from the left. (Photographed by Jesus Rodriguez).

2
Zabriskie et al. • Range Extension of the Western Yellow Bat in New Mexico.
figure 2. A Western Yellow Bat (Dasypterus xanthinus) found roosting among dead fronds of a fan palm tree at Las Cruces, New Mexico, 2 January 2019. (Photographed by Kailin Miller).
figure 3. A Western Yellow Bat (Dasypterus xanthinus) following removal from dead fronds of a fan palm tree at Las Cruces, New Mexico, 2 January 2019. (Photographed by Kailin Miller).

3
Western Wildlife 6:1–4 • 2019
on the anterior part of the uropatagium, the blackish color of the wing membranes, the lack of a dark face mask, and an estimated total body length of 105 mm. This combination of characteristics (after Ammerman et al. 2012) are consistent with only this species in New Mexico. The other three bats found in the same tree were not photographed but had similar characteristics and were presumably also D. xanthinus.
Prior to its discovery in Las Cruces, D. xanthinus was known in New Mexico only from southern Hidalgo County, in the southwestern corner of the state, where it was first detected in 1962 in Guadalupe Canyon in association with a riparian woodland of Eastern Cottonwood (Populus deltoides), Arizona Sycamore (Platanus wrightii), and Netleaf Hackberry (Celtis reticulata; Mumford and Zimmerman 1963). Additional specimens were mist-netted in the early 1980s at stream pools and livestock ponds near the Animas Mountains (Cook 1986). All specimens from New Mexico have been collected during late spring or summer (Cook 1986). Due to its very restricted range and presumed reliance on limited riparian woodlands in New Mexico, D. xanthinus has been listed by the state as threatened under the New Mexico Wildlife Conservation Act since 1975 (Jones and Schmitt 1997).
The Las Cruces record provides a northeastward range extension in New Mexico of about 210 km and is the first New Mexico record from the Chihuahuan Desert ecoregion. The species, however, has been verified to occur in adjacent El Paso County, Texas (about 60 km to the southeast; Tipps et al. 2011), as well as elsewhere in the Chihuahuan Desert ecoregion of Trans-Pecos Texas. Its occurrence, therefore, in south-central New Mexico is not unexpected. Other researchers have suggested that D. xanthinus is expanding its range in the U.S., perhaps in response to the planting of ornamental trees such as fan palms that are suitable as day roost sites and possibly as winter refugia (e.g., Barbour and Davis 1969; Constantine 1998). Although the Las Cruces record might represent a recent range expansion, we cannot exclude the possibility that the species has simply evaded detection in this area until recently.
Our record also provides the first evidence of D. xanthinus using a fan palm tree (Washingtonia filifera × robusta; Fig. 1) as a day roost site in New Mexico and is the first winter record of this species in the state. The species is known to use the dead fronds of fan palms as both summer and winter roost sites in Arizona, southern Nevada, and southern California (Hoffmeister 1986; Constantine 1998; O’Farrell et al. 2004), where native and non-native palms are more common, particularly as ornamentals. In New Mexico, suitable climate for non-native ornamental palms is limited to a few southern locations such as Las Cruces, Truth or Consequences, Carlsbad, and Deming. In western Texas, D. xanthinus has been found roosting in the dead fronds of Giant
Dagger (Yucca carnerosana; syn. Y. faxoniana), a plant with structural similarities to fan palms that apparently make it a suitable shelter (Higginbotham et al. 2000). Yucca plants (Yucca spp.) are common in much of the Chihuahuan Desert ecoregion of southern New Mexico, including in the Las Cruces area, which suggests that suitable roosting habitat for D. xanthinus might be more widespread and available in the state than previously believed.
Acknowledgments.—We thank Kailin Miller and Jesus Rodriguez who co-discovered the bats and kindly permitted us to use their photographs herein. Ernest Valdez reviewed the manuscript and photographs; Michael Bogan, Jennifer Frey, and Keith Geluso also examined the photographs and confirmed our species identification. Marcy Scott provided editorial assistance.
literature cited
Ammerman, L.K., C.L. Hice, and D.J. Schmidly. 2012. Bats of Texas. Texas A&M University Press, College Station, Texas.
Baird, A.B., J.K. Braun, M.A. Mares, J.C. Morales, J.C. Patton, C.Q. Tran, and J.W. Bickham. 2015. Molecular systematic revision of tree bats (Lasiurini): doubling the native mammals of the Hawaiian Islands. Journal of Mammalogy 96:1255–1274.
Baker, R.J., J.C. Patton, H.H. Genoways, and J.W. Bickham. 1988. Genic studies of Lasiurus (Chiroptera: Vespertilionidae). Occasional Papers, Museum of Texas Tech University 117:1–15.
Barbour, R.W. and W.H. Davis. 1969. Bats of America. University of Kentucky Press, Lexington, Kentucky.
Constantine, D.G. 1966. New bat locality records from Oaxaca, Arizona and Colorado. Journal of Mammalogy 47:125–126.
Constantine, D.G. 1998. Range extensions of ten species of bats in California. Bulletin of the Southern California Academy of Science 97:49–75.
Cook, J.A. 1986. The mammals of the Animas Mountains and adjacent areas, Hidalgo County, New Mexico. Occasional Papers, Museum of Southwestern Biology, University of New Mexico 4:1–45.
Findley, J.S., A.H. Harris, D.E. Wilson, and C. Jones. 1975. Mammals of New Mexico. University of New Mexico Press, Albuquerque, New Mexico.
Harvey, M.J., J.S. Altenbach, and T.L. Best. 2011. Bats of the United States and Canada. Johns Hopkins University Press, Baltimore, Maryland.
Higginbotham, J.L., L.K. Ammerman, and M.T. Dixon. 1999. First record of Lasiurus xanthinus (Chiroptera: Vespertilionidae) in Texas. Southwestern Naturalist 44:343–347.
Higginbotham, J.L., M.T. Dixon, and L.K. Ammerman. 2000. Yucca provides roost for Lasiurus xanthinus

4
(Chiroptera: Vespertilionidae) in Texas. Southwestern Naturalist 45:338–340.
Hoffmeister, D.F. 1986. Mammals of Arizona. University of Arizona Press and Arizona Game and Fish Department, Phoenix, Arizona.
Jones, C., and C.G. Schmitt. 1997. Mammal species of concern in New Mexico. Pp. 179–205 In Life Among the Muses: Papers in Honor of James S. Findley. Yates, T.L. W.L. Gannon, and D.E. Wilson (Ed.). Special Publications, Museum of Southwestern Biology, University of New Mexico 3:1–290.
Kurta, A., and G.C. Lehr. 1995. Lasiurus ega. Mammalian Species 515:1–7.
Morales, J.C., and J.W. Bickham. 1995. Molecular systematics of the genus Lasiurus (Chiroptera: Vespertilionidae) based on restriction-site maps of the mitochondrial ribosomal genes. Journal of Mammalogy 76:730–749.
Mumford, R.E., and D.A. Zimmerman. 1963. The Southern Yellow Bat in New Mexico. Journal of Mammalogy 44:417–418.
O’Farrell, M.J., J.A. Williams, and B. Lund. 2004. Western Yellow Bat (Lasiurus xanthinus) in southern Nevada. Southwestern Naturalist 49:514–518.
Schmidly, D.J., and R.D. Bradley. 2016. The Mammals of Texas. 7th Edition. University of Texas Press, Austin, Texas.
Simmons, N.B. 2005. Order Chiroptera. Pp. 312–529 In Mammal Species of the World: a Taxonomic and Geographic Reference. 3rd Edition. Wilson, D.E. and D.M. Reeder (Ed.). Johns Hopkins University Press, Baltimore, Maryland.
Tipps, T.M., B. Mayes, and L.K. Ammerman. 2011 (2014). New county records for six species of bats (Vespertilionidae and Molossidae) in Texas. Texas Journal of Science 63:141–152.
Zabriskie et al. • Range Extension of the Western Yellow Bat in New Mexico.

5
Survey of Potential PredatorS of the endangered amargoSa vole (Microtus californicus scirpensis)
austin n. roy1,2, Deana l. clifforD1,2, anna D. rivera roy2, robert c. Klinger3, greta M. Wengert4, aManDa M. poulsen2, anD Janet foley2,5
1Wildlife Investigations Lab, California Department of Fish & Wildlife, 1701 Nimbus Road, Rancho Cordova, California 956702Department of Veterinary Medicine and Epidemiology, University of California, Davis, California 95616
3Western Ecological Research Center, U.S. Geological Survey, 568 Central Avenue, Bishop, California 93514 4Integral Ecology Research Center, 239 Railroad Avenue, P.O. Box 52, Blue Lake, California 95525
5Corresponding author, email: [email protected]
Abstract.—As part of a comprehensive program assessing threats to the persistence of the endangered Amargosa Voles (Microtus californicus scirpensis) in the Mojave Desert of California, we used point counts, owl call surveys, camera-trapping, and scat transects to investigate diversity and activity of potential predators near Tecopa, California, USA. Of 31 predator species within the critical habitat of the vole, the most commonly detected were Coyotes (Canis latrans), Domestic Dogs (C. lupus familiaris), and Great Blue Herons (Ardea herodias). Predator species richness and detections were highest in the northern part of the study site where voles are more abundant. Predator detections were most common in the fall. We observed vole remains in 3.9 % of scat or pellet samples from Coyotes, Bobcats (Lynx rufus), and Great-horned Owls (Bubo virginianus). These data can support management activities and provide needed baseline information for assessment of the impact of predators on Amargosa Voles, including whether over-predation is limiting recovery and whether predators regulate this species.
Key Words.—endangered species; Mojave Desert; population regulation; species richness.
introduction
Predators can regulate prey populations (Korpimaki et al. 2002; Banks et al. 2004), limit prey dispersal and patch colonization (Nie and Liu 2005; Smith and Batzli 2006) and restrict prey species to sub-optimal patches (Fey et al. 2006; Eccard et al. 2008). Overharvest of endangered prey species by predators may reduce prey population viability (Hartt and Haefner 1995), particularly when predator numbers are maintained by common prey species that are sympatric with endangered prey. The Amargosa Vole (Microtus californicus scirpensis) is a Mojave Desert rodent that is federally listed as endangered and has one of the narrowest niche breadths of any North American mammal (U.S. Fish and Wildlife Service [USFWS] 1997). Limited, fragmented, and lost habitat, low genetic diversity, predation, and disease all impact Amargosa Vole persistence (USFWS 1997; Ott-Conn et al. 2014).
Fewer than 500 individuals exist, occupying approximately 36 marsh patches near Tecopa, Inyo County, California (Cudworth and Koprowski 2010; Janet Foley et al., unpubl. report). Survival rates as low as 0.35 individuals/month were inferred to be caused at least partly by predation (Klinger et al. 2015). With low survival rates and high variability in population growth rates, population viability analysis predicted unacceptably high risks of extinction within 20–24 y (Foley and Foley 2016). Importantly, impacts of predators on voles could be enhanced by abundance of sympatric prey species. The Recovery Plan for Amargosa Voles (USFWS 1997) lists the study of predation on Amargosa Voles as an
Western Wildlife 6:5–13 • 2019Submitted: 28 December 2018; Accepted: 26 April 2019.
important task. The primary objective of our research was to inventory potential predators of the Amargosa Vole by species and guild. We also explored data for temporal trends, geographical distributions, and habitat associations in predator detections.
methodS
Study site.—We conducted this study near Tecopa in the Mojave Desert in southeastern Inyo County, California. The climate is characterized by wide daily and annual fluctuations in temperature, from a mean winter low of 3.2° C to a mean summer high of 41.0° C (www.ncdc.noaa.gov). The region experiences low and variable precipitation with mean annual rainfall of 12.3 cm. Amargosa Voles are almost completely dependent on Olney’s Three square Bulrush (Schoenoplectus americanus) for food and cover (Klinger et al. 2015). Additional common plant species include rushes (Juncus spp.), Common Reed (Phragmites australis), cattail (Typha sp.), Salt Grass (Distichlis spicata), Yerba Mansa (Anemopsis californica), Boraxweed (Nitrophila occidentalis), Slender Arrowgrass (Triglochin concinna), Alkali Sacaton (Sporobolus airodes), mesquite (Prosopis spp.), and other wetland and desert plants (Rado and Rowlands 1984).
Marshes inhabited by voles tend to be patchy, fed by springs and surface flow, and from 290–420 m in elevation (Janet Foley et al., unpubl. report). There are approximately 40 marsh patches in the Tecopa region and three in Shoshone. For this study, we surveyed in and near marshes with and without Amargosa Voles, in

6
Roy et al. • Potential predators of Amargosa Voles.
figure 1. Locations near Tecopa and Shoshone, Inyo Coun-ty, California, where surveys for predators of Amargosa Vole (Microtus californicus scirpensis) were conducted using point counts, owl call surveys, camera traps, and cover boards.
was to identify as many different predator species in the range of Amargosa Voles as possible, we implemented camera-trapping, cover boards, point counts, callback surveys, and scat surveys, and recorded incidental observations. Stations for each of these survey techniques differed: (1) we performed callbacks and point counts on hilltops to maximize hearing and viewing of predators at multiple nearby marshes, (2) camera-trapping within marsh patches, and (3) scat surveys along inter-marsh transects (Fig. 1).
For camera trapping, we chose nine marshes that were evenly spaced over the range of Amargosa Voles and accessible from a road in Tecopa (Fig. 1), and a tenth marsh that was in the type locality for the Amargosa Vole in Shoshone, California, and was undergoing restoration for future vole reintroduction. At each site, we deployed 2-3 RC Covert or PC900 HyperFire (Reconyx, Holmen, Wisconsin, USA) cameras if a marsh was < 0.5 ha or 4–5 cameras in marshes > 0.5 ha, for a total of 36 cameras. Where signs of Amargosa Voles were absent at a marsh, we baited cameras with predator lure (Carmin’s Canine Call, New Milford, Pennsylvania, USA, and Caven’s Terminator Bait, Pennock, Minnesota, USA) to increase sensitivity, but we did not bait cameras in vole-occupied marshes so as not to increase predation on voles. We mounted cameras to U-posts using bailing wire and placed them along the marsh periphery near game trails or predator scat. We trimmed vegetation as needed to minimize false triggers, and programmed cameras to take five photographs at a time, with no delay between the next set of images if the camera was triggered. Cameras were active for 13 mo starting November 2013. We downloaded camera data monthly, although occasionally memory cards filled in less than a month. Skilled personnel (ADR, ANR) recorded date, time, and species of predators from images. Each of the 10 trapped marshes also received two 1-m2 cover boards under which snakes and lizards were expected to hide (Grant et al. 1992), which we checked once per month.
We performed predator point counts at seven high vantage points from which we could see and hear predators in the same marshes assessed by cameras, as well as 30 additional marshes and playa between marshes. We surveyed the marshes and playa for diurnal and crepuscular species with binoculars one day per month, three times each day (dawn, mid-day, and dusk) for 15 min. At these same point count locations, we also conducted monthly 15-min callback surveys beginning approximately one hour after dusk, using recorded calls of the three most common owl species (Leonard Warren, personal communication): Great-horned Owl (Bubo virginianus), Long-eared Owl (Asio otus), and Barn Owl (Tyto alba). Although calls could attract predators, the duration of the survey was very short and we thought it unlikely to represent a risk to voles.
Lastly, we conducted monthly scat surveys beneath roost sites in trees and power-lines and along seven
three different elevation zones (playa to the west, canyon south of the Old Spanish Trail, and in the Tecopa Hills on the east side of the site), and along an array from north to south (Shoshone, north Tecopa, south Tecopa separated at a natural break among marshes; Fig. 1). Each survey method (e.g., cameras, point counts, etc.) was conducted with a different spatial focus as described below. Sites with and without voles were included to evaluate whether voles might be an attractant for certain types of predators, or conversely, if certain predator assemblages affected vole presence. The elevation zones were chosen because of similarities within zone in vegetation community and hydrogeology. Playa areas tended to be very flat, and marshes in the playa were surrounded by alkaline playa dirt with very little vegetation cover. Hills housed the sources of most local warm springs and marshes in this zone were surrounded by moderately more diverse vegetation, while towards the canyon, the Amargosa River comes above ground, vegetation is progressively more diverse, and patches between marsh are characterized by saltbush scrub (Barbour et al. 2007).
Field methods.—We collected data on potential predators of voles between October 2013 and December 2014. We obtained data on vole presence from complementary live-trapping and sign survey studies (Deana Clifford et al., unpubl. report). Because our goal

7
Western Wildlife 6:5–13 • 2019
200–700 m long transects located proximally to camera-trapping sites (Fig. 1). We recorded numbers of scat, removing samples from transects to avoid duplicate observations in subsequent surveys. Owl pellets were tentatively attributed to species based on repeated observations of a single owl species at the roost site. We identified the species of scat using a field guide (Elbroch 2003). When rodent bones were present, we disinfected the material in mild bleach solution, and identified bones to the lowest taxonomic level possible (Lawlor 1979; Jones and Manning 1992).
Analysis. —We maintained data in Excel and analyzed them with the statistical program R (http://www.r-project.org). We used Sanderson’s AllPictures Method to differentiate repeated camera shots of the same predator individual from differing individuals (Sanderson and Harris 2013). We inferred statistical significance at P ≤ 0.05. We compiled a comprehensive list of vole predators from all assays and reported numbers of observations by point counts, camera-trapping, and incidental observation grouped into the following guilds: aerial hunters, pursuit hunters, waders, and non-native (Table 1). Summary statistics of point counts and camera data included species richness (S) and number of records by guild for north vs. south marshes, and whether the marsh was in the Amargosa Canyon, hills, or desert playa. We examined differences in S by region (hills, playa, or canyon) using ANOVA and by district (north or south) with a Student’s t-test.
Because of bias due to some marshes having baited cameras, we did not perform spatial statistical analyses for predators. We did compile data from marshes with and without bait to perform temporal statistical summaries. We used a Mann-Whitney U test to assess whether baited and unbaited marshes differed in median detections per marsh. We evaluated whether the number of what we considered independent camera detections (i.e., occurring at least 120 min apart) of all predator species combined and of the most common species differed seasonally (winter: December-February, spring: March-May, summer: June-August, fall: October-November), and between night (between sunset and sunrise) and day (between sunrise and sunset) using Poisson regression. We calculated prevalence of vole remains in predator scat and pellets (number of scats or pellets with vole remains/ number total number of scats or pellets examined) using the prop.test function in R, and inferred statistical differences in prevalence among the three predator species whose scat or pellets contained vole bones using a Chi-square test.
reSultS
We recorded 31 predator species observed over the course of this study (Table 1). The most commonly detected were Common Ravens (Corvus corax),
Northern Harriers (Circus cyaneus), Great Blue Herons (Ardea herodias), Great Egrets (Ardea alba), Coyotes (Canis latrans), Bobcats (Lynx rufus), and Dogs (Canis lupus familiaris). Incidental observations of Long-eared Owls, Greater Roadrunners (Geococcyx californianus), California Kingsnakes (Lampropeltis californiae), Gopher Snakes (Pituophis catenifer), a Coachwhip (Masticophis flagellum), a Spotted Skunk (Spilogale gracilis), and Domestic Cats (Felis catus; Table 1) were made. Anecdotally outside the temporal scope of this study, a Desert Kit Fox (Vulpes macrotis arsipus) was observed on camera in a marsh occupied by voles. We checked cover boards once per month, resulting in 240 trap nights, but did not detect any predators under cover boards.
Cameras recorded 13,614 camera-trap days across 10 sample marshes, resulting in the detection of 15 predator species (Table 1), including Bobcats, which were not detected through other methods and were only detected at baited camera sites. Of 8,520 images that clearly showed a predator, there were 831 independent events. Overall camera-trap success (number of independent events/number of camera-trap days) was 5.5%. The most frequently observed species on camera was Coyote, occurring in all 10 sampled marshes and at least once within each sample period. Baited cameras (two marshes) yielded 282 total detections and unbaited cameras (eight marshes) yielded 549; however, the average number of detections across periods was significantly higher (1.54) in unbaited compared with baited (1.29) marshes (t = 2.99, df = 574, P = 0.003).
Overall detections were more common during the day than night (Χ2 = 15.37, df = 1, P < 0.001), with all common species being more active in day except Bobcats (Table 2). Coyotes were active during 24-h periods, with the fewest number of detections between 1400–1500 (n = 8) and the greatest number of detections between 1800–1900 (n = 55). While Bobcats were also active throughout the entire 24-h period, more events were observed during night (n = 77) than day (n = 52). Far more predators were detected on cameras in the playa than in the hills or canyon (Χ2 = 377.1, df = 2, P < 0.001), comprising primarily Coyotes, although notable exceptions were Domestic Dogs and Bobcats found mostly in the hills and common wading birds (Great Blue Herons and Great Egrets) seen in both canyon and playa. Northern marshes also tended to have more predators on camera than southern or Shoshone (Χ2 = 240.9, df = 2, P = < 0.001), with coyotes most commonly detected in northern marshes, but Domestic Dogs were more common in southern marshes and Shoshone, and Bobcats were far more common in southern marshes. Total predator detections varied significantly among seasons (Fig. 2) and was greatest in fall and lowest in winter and spring (Χ2 = 354.4, df = 3, P < 0.001). Coyotes were the most abundant predators in all seasons except spring and were most abundant in fall. Domestic Dogs were absent during summer presumably due to changes

8
in the behavior of owners, and there was little seasonal change in detections of Bobcats.
Point counts yielded 717 predator observations, with predators documented in 40 marsh patches (Table 1). Coyotes and Common Ravens were present in the greatest number of marshes (n = 18) and were the most frequently detected species overall. Over the course of
all sample periods, S per marsh ranged from zero to 29 (Table 3). Average S in northern marshes (8.83 ± 9.4 SD) was higher although not significantly so than in southern marshes (5.0 ± 5.0; t = 1.36, df = 35, P = 0.182, Fig. 3); similarly S across regions was not significantly different (F2,36 = 1.006, P = 0.376), with mean S in playa of 7.9 ± 8.5, canyon of 14.5 ± 2.1, and hills of 5.0 ± 7.2 (Fig. 3).
table 1. Number of detections of predator species grouped by guild, as described in text, near Amargosa Vole (Microtus californi-cus scirpensis) habitat in Shoshone and Tecopa, Inyo County, California, between 2013 and 2014. Methods of observation include point count, camera-trap, and incidental observation.
Number detected on:Guild Common name Scientific name Point count Camera trap Incidental observationAerial
American Kestrel Falco sparverius 9Barn Owl Tyto alba 1 4Cooper’s Hawk Accipiter cooperii 1 7Common Raven Corvus corax 246 8Great-horned Owl Bubo virginianus 10 1Long-eared Owl Asio otus 3Loggerhead Shrike Lanius ludovicianus 6 2Merlin Falco columarius 2Northern Harrier Circus cyaneus 57 4Osprey Pandion haliaetus 1Prairie Falcon Falco mexicanus 7Red-shouldered Hawk Buteo lineatus 3Red-tailed Hawk Buteo jamaicensis 17 3Turkey Vulture Cathartes aura 4
WadersAmerican Bittern Botaurus lentiginosus 17 5Black-crowned Night-heron Nycticorax nycticorax 1Great Blue Heron Ardea herodias 56 36Great Egret Ardea alba 49 3Green Heron Butorides virescens 1Snowy Egret Egretta thula 5
PursuitCoyote Canis latrans 114 593Greater Roadrunner Geococcyx californianus 2 7 3Bobcat Lynx rufus 129Kingsnake Lampropeltis getula 4Gopher Snake Pituophis catenifer 1 3Coachwhip Masticophis flagellum 1Spotted Skunk Spilogale gracilis 1Desert kit fox Vulpes macrotis At least 1 (scat)
InvasiveAmerican Bullfrog Lithobates catesbeianus 40 2Domestic Dog Canis lupus familiaris 63 27Domestic Cat Felis catus 4 6
Total 714 831 22
Roy et al. • Potential predators of Amargosa Voles.

9
Callback surveys yielded 11 observations of Great-horned Owls including six in northern marshes, three in southern marshes, and two in Shoshone. We found 509 predator scat samples in the field, including 285 from Coyotes, 115 from Domestic Dogs, 67 from Bobcats, two from Spotted Skunks, and one from a Desert Kit Fox. We could not identify the rest. We found mammal bones in 219 samples. These scats originated from Coyotes, Domestic Dogs, Domestic Cats, and Bobcats. Thirty-nine owl pellets originated from Long-eared Owls (93.1% of pellets) and Great-horned Owls (6.9% of pellets). Pellets and feces were most abundant in southern marshes (n = 326, 59% of samples recovered), followed by northern marshes (n = 183, 33.4%), and Shoshone (n = 39, 7.1%). There were more scat samples recovered in January (n = 103) and February (n = 101) than all other months, during which we found no more than 53 samples. There were vole remains in one pellet sample, from a Great-horned Owl
(3.6%; n = 29), and 18 scat samples from Coyotes (2.9%, n = 285) and Bobcats (17.5%, n = 67). The prevalence in Bobcats was significantly higher than for Coyotes and Great-horned Owls (Χ2 = 16.97, df = 2, P = 0.002).
diScuSSion
Our survey of predators in the Amargosa River basin reveals a high diversity of 31 species of potential predators of Amargosa Voles, and vole bones in feces from Bobcats and Coyotes and pellets of Great-horned Owls confirm these species as predators. Extensive presence of some wading bird species in bulrush habitat occupied by voles strongly supports their potential as predators of the vole. We show increased predator pressure in autumn, and specific predators occupying differing spatial patches.
Among confirmed vole predators, Bobcats had high prevalence of vole bones within scat but were found only
figure 2. Seasonal patterns (number of independent events captured on camera) of predators of Amargosa Vole (Microtus californicus scirpensis) near Tecopa, Inyo County, California, between 2013 and 2014.
table 2. Differences in predator detections, inferred from independent observations on camera-traps near Amargosa Vole (Microtus californicus scirpensis) habitat in Shoshone and Tecopa, Inyo County, California, between 2013 and 2014. The most common wading bird species were Great Blue Herons (Ardea herodias) and Great Egrets (Ardea alba). Descriptions of how day and night, northern and southern, marsh region, and season are differentiated are provided in the text.
All species combined
Common Raven Coyotes
Domestic Dogs Bobcats
Northern Harriers
Common wading birds
Day 472 8 320 27 52 4 39Night 359 0 273 0 77 0 0
Canyon 46 0 14 0 1 0 22Hills 282 2 125 22 128 0 0Playa 503 6 454 5 0 4 17
North marshes 464 2 424 4 0 4 17South marshes 268 6 118 9 95 0 22Shoshone 99 0 51 14 34 0 0
Western Wildlife 6:5–13 • 2019

10
in a few marshes in the hill region. We only detected this reclusive species using baited cameras, and such cameras were only used in southern sites where habitat heterogeneity is greater than in the north. We cannot differentiate a detection bias because of baited cameras or whether Bobcats do not occur in northern marshes we did not bait. The most abundant non-native predator was Domestic Dogs with incidental Domestic Cats, highlighting potential anthropogenic threats to the Amargosa Vole.
Geographical patterns ranged from Shoshone, where habitat is being restored for future vole introduction, with 16 species of predators, including two snake species found only in Shoshone, to Tecopa where predator species richness tended to be higher to the north. Northern marshes tend to be more numerous, larger, and possibly more productive which could allow for coexistence of some species (Brown 1981). Total predator detections were also more numerous in the north. Voles are unlikely to move among northern and southern marshes based on genetic data (Krohn et al. 2017) although most predators we recorded would be able to readily move between northern and southern areas.
Habitat associations reflected different predator preferences as well as risk of predation for voles. Thick bulrush litter as well as tall, dense cover of live bulrush are very important cover for Voles (Klinger et al. 2015). Nevertheless, pursuit predators were abundant, and
bulrush litter likely does not completely protect voles from being captured by Coyotes and Bobcats. Predator species richness was higher in the Amargosa River canyon than playa or hills, while total detections were higher in playa marshes than hills or canyon. Predator species richness was likely influenced by habitat heterogeneity, and in this
figure 3. Yearly mean (left panel) and total (right panel) species richness of data collected monthly in marshes classified by region (North or South) and habitat type (Playa, Hills, Canyon) sampled through point count methods. Sampling occurred near Tecopa, Inyo County, California, between 2013 and 2014.
table 3. Summary statistics associated with predator obser-vations using point counts (direct observation) near Amargosa Vole (Microtus californicus scirpensis) habitat in Shoshone and Tecopa, Inyo County, California, between 2013 and 2014. Spe-cies richness is indicated by S: PSA = Predator S for all spe-cies, AS = Aerial S, WS = Wading bird S, PS = Pursuit S, IS = Invasive S, and PO = number of point count predator observa-tions of predators. Predator guild, marsh grouping by north and south, region, and presence or absence or voles and bulrush are explained in text.
Guild of PredatorSites PSA AS WS PS IS PONorthern 19 10 6 1 3 413Southern 16 9 2 2 3 236Shoshone 9 5 0 2 2 66
Playa region 20 11 5 1 3 478Hill region 8 5 0 1 2 174Canyon region 8 3 1 2 2 63
All marshes 25 13 6 2 3 717
Roy et al. • Potential predators of Amargosa Voles.

11
regard both southern sites and those in the canyon have the greatest diversity due to the close juxtaposition of wetland, upland, and edge plant communities. Domestic Dogs were uncommon on playa, which we expected as most homes in the area are in the hills, relatively distant from the playa. Possible spatial differences could also be influenced by intraguild interactions as described previously (Fedriana et al. 2000).
Our study examined daily and seasonal trends in predator detections. Aerial and wader predators were more abundant during the day. Nocturnal pressure from raptors was likely underestimated because of our use of a limited number of calls of owl species, reluctance of some species to call back, and our inability to see most raptors at night. Coyotes were common day and night. The majority of the predators are resident, while migrants such as Long-eared Owls, Osprey (Pandion haliaetus), and Black-crowned Night-heron (Nycticorax nycticorax), and seasonally active predators such as Gopher Snakes and Coachwhips, were not observed during much of the year. Overall seasonality of predator detections favored the fall (comprising predominantly Coyotes and herons), during the period when vole populations are in the downward phase of their population cycle (Foley and Foley 2016, Janet Foley et al., unpubl. report). It is unlikely that this is a delayed numerical response (given the annual birth pulses and long generation times of most predators) but rather a behavioral response. Predators may be recruited to the area throughout the time of abundant prey due to high birth rates of small mammals in the summer but then remain and even increase into the fall even as prey resources diminish. In addition, predator activity may appear increased if they are more visible because they are spending more time hunting in the face of reduced food.
The question of whether these predators are regulating voles or possibly overharvest voles and diminish population viability is very important for vole conservation. All of the seven most ubiquitous species (Ravens, Coyotes, Domestic Dogs, Great Egrets, Great Blue Herons, Northern Harriers, and Bobcats) are generalists, and we did not detect specialist predators (e.g., weasels, Mustela sp.). Among studies examining how microtine populations are influenced by top-down regulatory factors (Korpimaki et al. 2002; Banks et al. 2004), many are done at high latitude and examine voles subject to specialist predators. Instead, the Amargosa Vole occurs at one of the lowest latitudes in which predation on microtines has been studied. Further work would be helpful to clarify specific vole-predator interactions, as incidence, abundance, and proportional frequency of a species are not necessarily indicators of potential impacts. For instance, there was an approximately 700% increase in Common Ravens in the western Mojave Desert from 1969 to 2004 (Boarman and Kristan 2006), with a shift toward individuals becoming permanent residents due to human-provided
food, water, and nest sites (Knight et al. 1993; Boarman and Berry 1995). Despite this, and their relatively high frequency in our sampling, we have no evidence that they are a meaningful predator on Amargosa Voles. In contrast, American Bitterns (Botaurus lentiginosus) were of moderate frequency in our samples, but this is likely because they are cryptic and less likely to be detected by of our survey methods. Nevertheless, bitterns have disproportionally greater effects on voles than our data would indicate, as we have directly observed bitterns hunting and even capturing voles.
Our study is preliminary and narrow in temporal scope, and our assessment of predator activity is unfortunately not paired with detailed data from the same space and time on vole numbers. The fact that baited cameras were used in the only two marshes where we were confident there were no voles was a bias in that more predators were likely observed because of the bait, precluding us from comparing numbers between marshes with and without bait and (or voles). Some methods, such as scat surveys, which were conducted monthly, may have underestimated predators, although in this highly arid environment, we have observed scat persisting for multiple months. Nevertheless, there is a very large number of potential predators on the Amargosa Vole, some of which may have a strong influence on vole population dynamics and demography, particularly Coyote, Bobcat, American Bittern, Great-blue Heron, Great Egret, Northern Harrier, and owls. Our study provides valuable baseline data for assessing potential top-down influences on Amargosa Voles, in support of earlier writers emphasizing the need for such research to manage this species (USFWS 1997; Leroy McClenaghan and Stephen Montgomery, unpubl. report).
Acknowledgments.—This study was done in accordance with California Department of Fish and Wildlife (Scientific Collecting Permit #000854), University of California (U.C.), Davis IACUC (Protocol #18179), and U.S. Fish and Wildlife Service (Recovery Permit TE54614A-1) permits and protocols. Technical support for this project was supplied by the Wildlife Investigations Lab at California Department of Fish & Wildlife and the Laboratory in Infectious Disease Ecology at U.C. Davis. We thank U.S. Bureau of Land Management, U.S. Fish and Wildlife Service, Shoshone Village, the Amargosa Conservancy, the Integral Ecology Research Center, U.S. Geological Survey, and the many supportive local stakeholders. David Delaney (U.S. Army Corps of Engineers) was integral in camera-trap training and supplying equipment. Leonard Warren (Point Blue) was especially helpful with his knowledge of local wildlife ecology. Funding for this research was provided in part by a USFWS Traditional Section 6 Grant in Aid (F13AP00015), the U.C. Davis Center for Vector-borne Disease, and the U.S. Bureau of Land Management.
Western Wildlife 6:5–13 • 2019

12
literature cited
Banks, P.B., K. Norrdahl, M. Nordstrom, and E. Korpimaki. 2004. Dynamic impacts of feral mink predation on vole metapopulations in the outer archipelago of the Baltic Sea. Oikos 105:79–88.
Barbour, M., T. Keeler-Wolf, and A. Schoenherr. 2007. Terrestrial Vegetation of California. 3rd Edition. University of California Press, Berkeley, California.
Boarman, W., and K. Berry. 1995. Common ravens in the southwestern United States, 1968-92. Pp. 73-75 In Our Living Resources: A Report to the Nation on the Distribution, Abundance, and Health of US Plants, Animals, and Ecosystems. LaRoe, E., G. Farris, C. Puckett, P. Doran, and M. Mac (Eds.). National Biological Service, Washington, D.C.
Boarman, W.I., and W.B. Kristan. 2006. Evaluation of evidence supporting the effectiveness of desert tortoise recovery actions. U.S. Geological Service, Scientific Investigations Report No. 2006-5143. 40 p.
Brown, J.H. 1981. Two decades of homage to Santa Rosalia: toward a general theory of diversity. American Zoologist 21:877–888.
Cudworth, N., and J. Koprowski. 2010. Microtus californicus (Rodentia: Cricetidae). Mammalian Species 42:230–243.
Eccard, J.A., J. Pusenius, J. Sundell, S. Halle, and H. Ylonen. 2008. Foraging patterns of voles at heterogeneous avian and uniform mustelid predation risk. Oecologia 157:725–734.
Elbroch, M. 2003. Mammal Tracks & Sign: A Guide to North American Species. Stackpole Books, Mechanicsburg, Pennsylvania.
Fedriana, J.M., T.K. Fuller, R.M. Sauvajot, and E.C. York. 2000. Competition and intraguild predation among three sympatric carnivores. Oecologia 125:258–270.
Fey, K., P. B. Banks, and E. Korpimaki. 2006. Different microhabitat preferences of field and bank voles under manipulated predation risk from an alien predator. Annales Zoologici Fennici 43:9–16.
Foley, J., and P. Foley. 2016. Rapid assessment of population viability using stochastic extinction analysis for the endangered Amargosa Vole, Microtus californicus scirpensis. Wildlife Biology in Practice 12:21–31.
Grant, B.W., A. Tucker, J. Lovich, A. Mills, P. Dixon, and J. Gibbons. 1992. The use of coverboards in estimating patterns of reptile and amphibian biodiversity. Pp. 379-403 In Wildlife 2001. McCullough, D., and R. Barrett (Eds.). Elsevier, London, UK.
Hartt, L., and J.W. Haefner. 1995. Inbreeding depression effects on extinction time in a predator-prey system. Evolutionary Ecology 9: 1–9.
Jones, J.K., and R. Manning. 1992. llustrated Key to the Skulls of Genera of North American Land Mammals. Texas Tech University Press, Lubbock, Texas.
Klinger, R., M. Cleaver, S. Anderson, P. Maier, and J. Clark. 2015. Implications of scale-independent habitat specialization on persistence of a rare small mammal. Global Ecology and Conservation 3:100–114.
Knight, R.L., H.A. Knight, and R.J. Camp. 1993. Raven populations and land-use patterns in the Mojave Desert, California. Wildlife Society Bulletin 21:469–471.
Korpimaki, E., K. Norrdahl, T. Klemola, T. Pettersen, and N.C. Stenseth. 2002. Dynamic effects of predators on cyclic voles: field experimentation and model extrapolation. Proceedings of the Royal Society of London 269:991–997.
Krohn, A.R., C.J. Conroy, R. Pesapane, K. Bi, J.E. Foley, and E.B. Rosenblum. 2017. Conservation genomics of desert dwelling California Voles (Microtus californicus) and implications for management of endangered Amargosa Voles (Microtus californicus scirpensis). Conservation Genetics Online:1–13. https://doi.org/ 10.1007/s10592-017-1010-2.
Lawlor, T.E. 1979. Handbook to the Orders and Families of Living Mammals. Mad River Press, Eureka, California.
Nie, H., and J. Liu. 2005. Regulation of Root Vole population dynamics by food supply and predation: a two-factor experiment. Oikos 109:387–395.
Ott-Conn, C., D. Clifford, T. Branston, R. Klinger, and J. Foley. 2014. Pathogen infection and exposure, and ectoparasites of the federally endangered Amargosa Vole (Microtus californicus scirpensis), California, USA. Journal of Wildlife Diseases 50:767–776.
Rado, T., and P. Rowlands. 1984. A small mammal survey and plant inventory of wetland habitats in Amargosa Canyon and Grimshaw Lake Areas of Critical Environmental Concerns. Report No. 20310.3(C-068.26). U.S. Department of the Interior, Bureau of Land Management, Washington, D.C. 27 p.
Sanderson, J., and G. Harris. 2013. Automatic data organization, storage, and analysis of camera trap pictures. Journal of Indonesian Natural History 1:6–14.
Smith, J.E., and G.O. Batzli. 2006. Dispersal and mortality of Prairie Voles (Microtus ochrogaster) in fragmented landscapes: a field experiment. Oikos 112:209–217.
U.S. Fish and Wildlife Service. 1997. Recovery Plan for the Amargosa Vole (Microtus californicus scirpensis). U.S. Fish and Wildlife Service, Portland, Oregon. 43 p.
Roy et al. • Potential predators of Amargosa Voles.

13
auStin roy is a Ph.D. student at the University of Texas at El Paso in the Ecology and Evolutionary Biology program. He received his B.S. in Wildlife Management and Conservation from Humboldt State University, Arcata, California, in 2012. Austin’s research focuses on small mammal ecology including his work as an Environmental Scientist with the California Department of Fish and Wildlife conducting research on the Amargosa Vole. (Photographed by Anna Rivera Roy).
deana clifford received her B.S. in Wildlife Conservation Biology, Doctor of Veterinary Medicine, and Master’s and Ph.D. in Epidemiology from the University of California (U.C.) , Davis. She is currently the veterinarian for Nongame, Threatened and Endangered Species at the California Department of Fish and Wildlife and an Assistant Clinical Professor at U.C. Davis. (Photographed by Janet Foley).
anna d. rivera roy is a graduate student in the School of Earth, Environmental, and Marine Sciences at the University of Texas, Rio Grande Valley in Port Isabel, Texas. She received her B.S. in Wildlife Conservation Biology and Applied Vertebrate Ecology from Humboldt State University, Arcata, California, in 2012. She is experienced in using camera traps to study wildlife ecology. Her current research focuses on the effectiveness of wildlife crossing structures and fencing in reducing road mortalities. (Photographed by Austin Roy).
rob Klinger is a Population and Community Ecologist with the Western Ecological Research Center of the U.S. Geological Service, Oakhurst, California. For the last 12 y he has studied inter-relationships between climate, plant community structure and function, and the population dynamics of both rare and common plant and animal species in the Mojave Desert and high elevation zone of the Sierra Nevada mountain range. He is particularly interested in the relative importance of direct and indirect effects of climatic shifts on rare species such as the Amargosa Vole. (Photographed by U.S. Geological Service).
greta m. Wengert is the Co-Director and Chief Financial Officer of Integral Ecology Research Center, Blue Lake, California. She is lead on projects from Bobcats (Lynx rufus)/Fisher (Pekania pennanti) spatial ecology, forensic identification of predators, to Southern Mountain Yellow-legged Frogs (Rana muscosae)/ Sierra Nevada Yellow-legged Frog (R. sierra) projects. Greta earned her B.S. in Wildlife Biology at Cornell University, Ithaca, New York, her M.S. in Wildlife Ecology at Humboldt State University Arcata, California, and her Ph.D. in Ecology at the University of California, Davis. (Photographed by Morgan Heim).
amanda m. PoulSen completed her M.S. degree in Ecology at the University of California, Davis, and has since worked as a Vector Ecologist for the Santa Cruz County Mosquito and Vector Control, Santa Cruz, California. She is particularly interested in disease ecology and the interactions of small mammals including the Amargosa Vole with ectoparasites. (Photographed by Tom Melkonian).
Janet foley is a Professor and Researcher for the Department of Veterinary Medicine and Epidemiology in the School of Veterinary Medicine at the University of California, Davis. She studies the ecology and epidemiology of infectious diseases in complex communities. Research in her lab aims to understand how community complexity contributes to disease persistence and emergence, and how driving factors are affected by anthropogenic change. (Photographed by Austin Roy).
Western Wildlife 6:5–13 • 2019

14
Wrestling for real estate: Male-Male interactions in Breeding foothill YelloW-legged frogs (Rana boylii)
JeffeRy T. Wilcox1,3 and Jeff a. alvaRez2
1Sonoma Mountain Ranch Preservation Foundation, 3124 Sonoma Mountain Road, Petaluma, California 949542The Wildlife Project, P.O. Box 188888, Sacramento, California 95818
3Corresponding author, e-mail: [email protected]
Abstract.—Male-male aggression is common among anurans competing for females at traditional breeding sites. We describe two male-male behavioral interactions observed between male Foothill Yellow-legged Frogs (Rana boylii) at a surrogate breeding habitat, with two different outcomes.
Key Words.—aggression; anurans; amplexus; behavior; breeding; competing, dam, lek, surrogate
For many anurans from temperate climates, annual congregations at breeding sites are a cauldron of male-male competition for mates (Wells 1977, 2007). The arrival of females intensifies selective pressure on the more numerous males to find a mate quickly, often pressuring males to grasp anything in an amplexal hold, including a different species, and sometimes even inanimate objects (Wells 2007; sensu Alvarez 2011). Males often mistakenly grasp conspecific males, but in most species the amplexed male emits a release call that is recognized by the grasping male, which often results in a timely release from amplexus (Wells 1977; Simović et al. 2014). Males may also aggressively defend display sites, often calling from stationary positions, which may include territories, or resources such as oviposition sites (Howard 1978; Wells 2007).
Foothill Yellow-legged Frogs (Rana boylii) historically inhabit coastal streams and rivers from Marion County, Oregon, to Ventura County, California, and inland along the Sierra foothills, south to Kern County, California (Zweifel 1955). They have a lek mating system and often return to certain lek sites within a stream year after year (Kupferburg 1996; Wheeler 2007). Males establish and defend territories within oviposition sites, calling from underwater (Davidson 1995; MacTague and Northen 1993) or from emergent rocks, where they shift position to vary the direction of their acoustic message. Male-male aggression in this species includes males vocally and physically defending specific sites that include above-water calling substrates within a breeding area (Stebbins 1951; Zwiefel 1955; Wheeler 2007; Wheeler and Welsh 2008; Silver 2018). Wheeler and Welsh (2008) observed that calling by males elicited aggression from other males, and that males with a larger territory size engaged in more aggression interactions than males with smaller territories. Observed aggression included acoustic dueling, wresting, chasing, or a combination thereof (Wheeler and Welsh 2008). Here, we describe observations of two types of male-male interaction in the unusual setting (atypical breeding habitat) of a small concrete dam impounding an artificial reservoir, a habitat
Western Wildlife 6:14–17 • 2019Submitted: 27 February 2019; Accepted: 29 April 2019.
not considered typical for a stream obligate such as R. boylii (Jeff Alvarez and Jeffery Wilcox, unpubl. data).
Stewart Pond is a privately owned reservoir in eastern Sonoma County, California, used for irrigating vineyards and for recreation. At full capacity, the reservoir surface area is approximately 0.8 ha and it reaches a maximum depth of 8 m. A dam (approximately 10 m long and 1 m tall) on the northwest side of the reservoir impounds the water. The dam has a recessed, extended block that directs the water over the center of the dam (Fig. 1). On the evening 20 April 2017, while conducting a control project for American Bullfrogs (Lithobates catesbeianus; Jeff Alvarez et al., in review), we stopped at the outfall side of the dam to remove three L. catesbeianus from the outflowing stream at the base of the dam. After removing the bullfrogs, we withdrew to the nearby bank to process them and await nightfall. At the base of the dam, we noticed five R. boylii, three on the concrete footing and two at the top of the dam. The frogs (all approximately 40–50 mm snout-urostyle length) were on either side of the flow over the dam: some above, and some below (Fig. 2). Suddenly, one of the R. boylii turned to face the vertical dam wall, leapt approximately 0.3 m up the concrete face and began climbing. The dam face had an undulating surface from corrugated metal roofing material used to form the concrete during construction, and the wet surface was covered in a film of algae. Nevertheless, the frog was able to slowly climb the slick surface toward the top of the dam (Fig. 2). Near the top of the dam it slipped and fell, but repeated the effort and made it to a ledge in the face of the dam. The frog sat on the ledge for less than 1 min, and then suddenly leapt approximately 0.6 m to the top of the dam, landing on top of another, slightly larger, R. boylii that had been vocalizing.
The leaping frog (which had no line of sight on the vocalizing frog prior to jumping) immediately grasped the vocalizing frog in a partial amplexal hold (Fig. 3) such that it positioned its left front leg in pectoral amplexus and its right front leg in cephalic amplexus of the bottom frog, facing the posterior end of the bottom frog. What

15
Wilcox and Alvarez • Male-male interactions in Rana boylii.
figure 1. Stewart Pond, a reservoir created by impounding three intermittent streams, at the foot (western slope) of Mount Saint Helena in Sonoma County, California. The dam measures approximately 1 m tall and 10 m wide. (Photographed by Jeffery T. Wilcox).
large reservoirs and the regulation of flows from those impoundments (Lind 1996, 2005; Kupferburg et al. 2012). Recent reports, however, reveal that R. boylii may exhibit behavioral plasticity in using small reservoirs for mating, oviposition, tadpole rearing, and as dispersal habitat once non-native predators and competitors are removed (Jeff Alvarez and Jeffery Wilcox, unpubl. data). In the 3 y after numbers of L. catesbieanus were greatly reduced at Stewart Pond, we observed R. boylii egg masses, two generations of tadpoles, and three cohorts of post-metamorphic R. boylii (Jeff Alvarez and Jeffery Wilcox, unpubl. data). Our observations indicate that small concrete dams may be suitable as surrogate calling substrates for calling male R. boylii, and that R. boylii are excellent climbers; able to climb wet, slick, vertical surfaces. The climbing ability we documented may have management implications in situations where anthrogenic structures, such as dams and wiers, are placed within habitat used by R. boylii. The ability of this species to
ensued was a 20-min wrestling match, with the bottom frog trying to throw off the top frog. Sometimes the amplexed (lower) frog vibrated violently, interspersing the vibrations with low croaking, and other times it spun, bucked, and tried to wipe the frog off with its right rear leg (Fig. 3). Bursts of struggling activity were followed by periods of inactivity, which presumably afforded a rest period. Over the 20 min, the scuffling frogs covered an area of approximately 0.5 m. They moved from the recessed area of the dam, nearly tumbled over the dam face, and then moved to the top of the dam and out of the water (Fig. 4).
Concurrent with the activities described above, on the other side of the dam another R. boylii climbed the dam face (Fig. 4) and amplexed a non-calling conspecific. In this case, the second frog was already situated on the ledge, so the climbing frog was able to see it before pouncing on it from a much shorter distance. In this interaction, no wrestling ensued, but the amplexed frog did vocalize and vibrate. After about 2 min, the amplexing (top) frog dismounted and moved a short distance away. After 20 min of observations, we left to continue catching L. catesbeianus. We returned after approximately 1 h had passed to find only one R. boylii on the dam. Therefore we do not know the fate of the first pair that we observed.
Our observations suggest that male R. boylii may use concrete dam sites as they woud traditional lek sites in unaltered streams. In the first encounter, the length of the wrestling match suggests that the aggression was perhaps for the calling site itself. Both males vibrated and vocalized during the struggle, yet neither yielded during the observation. In the second, short-duration interaction, only the amplexed (bottom) male vocalized and vibrated, suggesting an incident of misdirected amplexus; the release call signaling the amplexing frog to release its hold.
Rana boylii populations are in decline in many areas of their native range due to the construction of
figure 2. (Top) Locations (arrows) of three of the four Foothill Yellow-legged Frogs (Rana boylii) that were observed engaging in combative behaviors on the dam of Stewart Pond, Sonoma County, California. The upper left frog was vocalizing at the time of the photograph and prior to being amplexed by a second male. (Bottom) One of two R. boylii that climbed the vertical face of the concrete dam on Stewart Pond Sonoma County, California. Upon reaching the shelf, it settled for a moment and then leapt over the dam and on to the back of the calling male (arrow), apparently locating this conspecific by sound. (Photographed by Jeffery T. Wilcox).

16
Western Wildlife 6:14–17 • 2019
climb should be considered prior to placing structures in riparian areas potentially occupied by this frog.
Acknowledgments.—We are grateful to the Peter Michael Winery for access to Stewart Pond in support of this and other projects.
literature cited
Alvarez, J.A. 2011. Bufo boreas (Western Toad). Davian Behavior. Herpetological Review 42:408–409.
Davidson, C. 1995. Frog and Toad Calls of the Pacific Coast. Library of Natural Sounds. Cornell Laboratory of Ornithology, Ithica, New York.
Howard, R.D. 1978. The evolution of mating strategies in Bullfrogs, Rana catesbeiana. Evolution 32:850–871.
Kupferberg, S.J. 1996. Hydrologic and geomorphic factors effecting conservation of a river-breeding frog (Rana boylii). Ecological Applications 6:1332–1344.
Kupferberg, S.J., W.J. Palen, A.J. Lind, S. Bobzien, A. Catenazzi, J. Drennan, and M.E. Power. 2012. Effects of flow regimes altered by dams on survival, population declines, and range-wide losses of California river-breeding frogs. Conservation Biology 26:513–524.
Lind, A.J. 2005. Reintroduction of a declining amphibian: determining an ecologically feasible approach for the Foothill Yellow-legged Frog (Rana boylii) through analysis of decline factors, genetic structure, and habitat associations. Ph.D. dissertation, University of California, Davis, California. 169 p.
Lind, A.J., H.H. Welsh, Jr., and R.A. Wilson. 1996. The effects of a dam on breeding habitat and egg survival of the Foothill Yellow-legged Frog (Rana boylii) in northwestern California. Herpetological Review 27:62–67.
MacTague, L., and P.T. Northen. 1993. Underwater vocalization by the Foothill Yellow-legged Frog
figure 3. (Top) Position of the amplexing male-male Foothill Yellow-legged Frogs (Rana boylii), which was followed by apparent combative behavior. Shortly after landing on the bottom male, the top male R. boylii appeared to grasp the bottom male, both frogs vocalizing during the struggle. Note the inflated vocal sacs of the top frog; concentric rings in the water indicate the pulsations of the vocal sacs of the lower frog. (Bottom) Combative behavior between two male R. boylii. Note the rippling water, which is produced by vibrations of the amplexed (lower) conspecific, which also used vocalization and rear leg movements to dislodge the amplexing (upper) male. (Photographed by Jeffery T.Wilcox).
figure 4. (Top) Two male Foothill Yellow-legged Frogs (Rana boylii) in combat to the extent that they nearly fell over the face of the dam on Stewart Pond. (Bottom) A third male R. boylii (extended hind leg), climbed the dam face to pursue and combat a fourth male R. boylii (center right). (Photographed by Jeffery T. Wilcox).

17
(Rana boylii). Transactions of the Western Section of the Wildlife Society 29:1–7.
Silver, C.S. 2018. Population-level variation in vocalizations of Rana boylii, the Foothill Yellow-legged Frog. M.S. Thesis, Chico State University, Chico, California. 39 p.
Simović, A., N. Anderson, M. Anđelković, S. Gvozdenović, and S. Đorđević. 2014. Unusual amplexus between anurans and caudates. Herpetological Notes 7:25–29.
Stebbins, R.C. 1951. Amphibians of Western North America. University of California Press, Berkeley, California.
Wells, K.D. 1977. The social behavior of anuran amphibians. Animal Behaviour 25:666–693.
Wells, K.D. 2007. The Ecology and Behavior of Amphibians. University of Chicago Press, Chicago, Illinois.
Wheeler, C.A. 2007. Temporal breeding patterns and mating strategy of the Foothil Yellow-legged Frog (Rana boylii). M.S. Thesis, Humboldt State University, Arcata, California. 42 p.
Wheeler, C.A., and H.H. Welsh. 2008. Mating strategy and breeding patterns of the Foothill Yellow-legged Frog (Rana boylii). Herpetological Conservation and Biology 3:128–142.
Zweifel, R.G. 1955. Ecology, distribution, and systematics of frogs of the Rana boylii group. University of California Publications in Zoology 54:207–292.
Wilcox and Alvarez • Male-male interactions in Rana boylii.
JefferY t. Wilcox is an Ecologist working for the Sonoma Mountain Ranch Preservation Foundation, Petaluma, California. He has worked with landscape-scale parcels to manage sites for endangered species, native grasses, and compatible uses such as organic cattle grazing, education, and research. Jeff has decades of experience working collaboratively on projects that include pond management and construction, native grasses restoration, and species-level projects with California Red-legged Frogs (Rana draytonii), Wild Pigs (Sus scrofa), American Bullfrogs (Lithobates catesbieanus), and California Tiger Salamanders (Ambystoma californiense). (Photographed by Jeff Alvarez).
Jeff a. alvarez is a Herpetologist who has specialized in California reptiles and amphibians for 30 y. He has worked with California Red-legged Frogs (Rana draytonii), California Tiger Salamanders (Ambystoma californiense), Western Pond Turtles (Actinemys marmorata), and Alameda Whipsnakes (Masticophis euryxanthus) for much of his career. His focus is on the conservation and natural history of herpetofauna, survey techniques development, and conducting peer-level special-status species workshops. (Photographed by Wendy Dexter).

18
Growth Curve of white-tailed antelope SquirrelS from idaho
RobeRto Refinetti
Department of Psychological Science, Boise State University, Boise, Idaho 83725, email: [email protected]
Abstract.—Daytime rodent trapping in the Owyhee Desert of Idaho produced a single diurnal species: the White-tailed Antelope Squirrel (Ammospermophilus leucurus). I found four females that were pregnant and took them back to my laboratory to give birth and I raised their litters in captivity. Litter size ranged from 10 to 12 pups. The pups were born weighing 3–4 g, with purple skin color and with the eyes closed. Pups were successfully weaned at 60 d of age and approached the adult body mass of 124 g at 4 mo of age.
Key Words.—Ammospermophilus leucurus; Great Basin Desert; growth; Idaho; Owyhee County
The White-tailed Antelope Squirrel (Ammo-spermophilus leucurus; Fig. 1) is indigenous to a large segment of western North America, from as far north as southern Idaho and Oregon (43° N) to as far south as the tip of the Baja California peninsula (23° N; Belk and Smith 1991; Koprowski et al. 2016). I surveyed a small part of the northernmost extension of the range of the species in Owyhee County, Idaho, south of the Snake River, which initially I searched for likely habitat. Positive confirmation was obtained of a considerable amount of undisturbed desert habitat and I sighted squirrels at and near localities previously recorded in museum databases (vertnet.org). The area surveyed was about 200 km2 in the Owyhee Desert, south of Oreana (43°00’N, 116°20’W, elevation 850 m). Much of the Owyhee Desert is public land managed by the U.S. Bureau of Land Management. The soils and vegetation were typical of arid lowland scrub within the Great Basin Desert, with sparsely distributed shrubs, predominantly Great Basin Sagebrush (Artemisia tridentata) and Greasewood (Sarcobatus vermiculatus). The ground squirrels were strongly associated with the more alkaline soils dominated by Greasewood.
Once I confirmed the existence of suitable habitat, I set out Sherman live traps (model LFAGTD, H.B. Sherman Traps Inc., Tallahassee, Florida) in mid-December and again in early April. I captured one female and two males 12–13 December 2016 and four females and five males 1–2 April 2017. I took the animals into the laboratory immediately upon capture. White-tailed Antelope Squirrels were the only vertebrate animals I captured in the traps. I prevented unintentional capture of nocturnal rodents by closing the traps at night. Although other diurnal rodents, such as Least Chipmunks (Tamias minimus), Townsend’s Ground Squirrels (Urocitellus townsendii), and Belding’s Ground Squirrel (Urocitellus beldingi) are reportedly present in southwestern Idaho (Groves et al. 1997), I did not find them in this transect.
The average body mass of 12 White-tailed Antelope Squirrels I captured in December and April was 108 g (91–122 g). The four females I captured in the spring were pregnant but were early in their pregnancies, and the body masses of the seven males and five females did
Western Wildlife 6:18–20 • 2019Submitted: 24 February 2019; Accepted: 3 May 2019.
not differ significantly (t = 0.715, df = 10, P = 0.503). After four months in the laboratory (after parturition and lactation for the four pregnant females), average body mass stabilized at 124 g (106–145 g).
The four pregnant females were left undisturbed in individual polypropylene cages with wire tops (36 cm length, 24 cm width, 19 cm height). The cages were lined with cellulose bedding (Comfort Bedding, BioFresh, Ferndale, Washington) and were kept inside light-tight, ventilated chambers maintained under a light-dark cycle with 12 h of light per day (12L:12D) in a room kept at 25° C with 25% relative humidity. I provided nest-building material of thin strips of crinkled paper (Crink-l’Nest, Andersons Lab Bedding Products, Maumee, Ohio) and square cotton pads (Signature Care, Better Living Brands, Pleasanton, California). I provided Purina rodent chow (Rodent Diet 5001, Lab Diet, St. Louis, Missouri) ad libitum on the metal cage top, which also held a water bottle with a sipping tube extending into the cage. I provided fresh carrot slices and grapes three times a week.
The four females gave birth 14–19 April. The litter sizes were 10, 10, 10, and 12, which fall within the range of six to 14 reported for a sample of 31 litters from Oregon (adjacent to Idaho) as assessed by autopsy (Whorley and Kenagy 2007). The pups were born with purple skin
fiGure 1. White-tailed Antelope Squirrel (Ammospermophilus leucurus) from Owyhee County, Idaho. (Photographed by Roberto Refinetti).

19
Refinetti • Growth of captive Ammospermophilus leucurus.
Squirrels from the Mojave and Great Basin deserts. As is the case in primates (Altmann et al. 1981; Cheverud et al. 1992; Bolter and Zihlman 2003), it is likely that captive individuals have accelerated rates of growth in comparison to their wild counterparts.
Litter size cannot be reliably compared because of the small number of litters in both cases, but the litter size reported by Pengelley (1966) in California (range, 8–11 pups) was slightly smaller than what I found in Idaho (range, 10–12 pups). In the wild, mean litter size is known to be smaller in California (7.4) than in Oregon (9.3) and even smaller further south in Baja California (5.9; Whorley and Kenagy 2007). Benchmarks of development, such as the timing of the onset of skin pigmentation and opening of the eyes, were also similar to observations for California squirrels (Pengelley 1966), except that the Idaho animals opened their eyes, and later could be weaned, about 5 d ahead of the California animals. In general, my observations from Idaho are in agreement with observations from California that the young of White-tailed Antelope Squirrels are born in larger litters and develop more slowly than the young of three other ground squirrel species, Golden-mantled Ground Squirrel (Callospermophilus lateralis), Mohave Ground Squirrel (Xerospermophilus mohavensis), and Round-tailed Ground Squirrel (Xerospermophilus tereticaudus; Pengelley 1966).
Acknowledgments.—The procedures were conducted with approval by Idaho Department of Fish and Game Permit No. 160812 and Boise State University Animal Care and Use Committee Protocol No. 006-AC16-013. I thank Dr. Jim Kenagy (University of Washington) for invaluable assistance in animal trapping.
literature Cited
Altmann J., S.A. Altmann, and G. Hausfater. 1981. Physical maturity and age estimates of Yellow Baboons, Papio cynocephalus, in Amboseli National
color and with the eyes closed (Fig. 2). By 9 d of age, the skin began to show some darker pigmentation. By day 13, the eyelids became conspicuous but remained closed. By 19 d, a light, soft body pelage was noticeable. By 24 d, body stripes were showing along the flanks (Fig. 2). After 30 d, the eyes were opened, and pups began to venture out of the nest. After 35 d, the pups were exploring the cage more extensively and starting to nibble on solid food (Fig. 2). After 40 d, all pups moved extensively around the cage and consumed solid food. All pups were successfully separated from their mothers at postnatal day 60, when body mass ranged from 66 to 95 g. I provided grapes ad libitum to the recently weaned animals to ensure appropriate hydration.
I initially weighed pups in groups and later individually in intervals of 11 d. The growth curve based on weight gain for squirrels from Oregon is similar to the curve by Pengelley (1966) from four litters raised in the laboratory by females trapped in the Mojave Desert in California (Fig. 3). Both curves show an acceleration of growth around day 40, when the pups start to eat solid food. The similarity of the two curves reveals little difference in the growth of captive White-tailed Antelope
fiGure 2. Development of White-tailed Antelope Squirrel (Ammospermophilus leucurus) pups in captivity: (Left) Postnatal day 2, (Middle) day 24, (Right) day 36. (Photographed by Roberto Refinetti).
fiGure 3. Growth curve of White-tailed Antelope Squirrels (Ammospermophilus leucurus) in captivity. Closed squares: data from this study (means ± SD). Open circles: data from Pengelley (1966).

20
Western Wildlife 6:18–20 • 2019
Park, Kenya. American Journal of Primatology 1:389–399.
Belk, M.C., and H.D. Smith. 1991. Ammospermophilus leucurus. Mammalian Species 368:1–8.
Bolter, D.R., and A.L. Zihlman. 2003. Morphometric analysis of growth and development in wild-collected Vervet Monkeys (Cercopithecus aethiops), with implications for growth patterns in Old World monkeys, apes and humans. Journal of Zoology 260:99–110.
Cheverud J.M., P. Wilson, and W.P.J. Dittus. 1992. Primate population studies at Polonnaruwa. III. Somatometric growth in a natural population of Toque Macaques (Macaca sinica). Journal of Human Evolution 23:51–77.
Groves, C.R., B. Butterfield, A. Lippincott, B. Csuti, and J.M. Scott. 1997. Atlas of Idaho’s Wildlife. Idaho Department of Fish and Game, Boise, Idaho. 372 p.
Koprowski, J.L., E.A. Goldstein, K.R. Bennett, and C. Pereira-Mendes. 2016. Family Sciuridae, Genus Ammospermophilus. Pp. 795–796 in Handbook of the Mammals of the World. Volume 6. Wilson, D.E., T.E. Lacher, and R.A. Mittermeier (Ed.). Lynx Edicions, Barcelona, Spain.
Pengelley, E.T. 1966. Differential developmental patterns and their adaptive value in various species of the genus Citellus. Growth 30:137–142.
Whorley, J.R., and G.J. Kenagy. 2007. Variation in reproductive patterns of antelope ground squirrels, Ammospermophilus leucurus, from Oregon to Baja California. Journal of Mammalogy 88:1404–1411.

21
Peer edited
Notes
receNt observatioN of Kit fox (Vulpes macrotis) outside of its KNowN raNge iN oregoN
tim l. Hiller1,3 and pHilip J. milburn2
1Wildlife Ecology Institute, P.O. Box 4725, Helena, Montana 596042Oregon Department of Fish and Wildlife, Malheur District, 3814 Clark Blvd., Ontario, Oregon 97914
3Corresponding author, email: [email protected]
Abstract.—Here we report on an observation of a Kit Fox (Vulpes macrotis) outside of its known range, near Ontario, Oregon.
Key Words.—distribution; Great Basin Desert; roadkill
On 15 February 2017, we collected an apparent vehicle-caused mortality of a male Kit Fox (Vulpes macrotis) on Interstate Highway 84 in eastern Oregon, USA (Fig. 1). The specimen was located on the highway near the crossing of the Snake River and the border with Idaho (UTM zone 11T 0504666, 4872846; datum: NAD 83). We used a 3-mm biopsy punch to collect an ear-tissue sample from the carcass to confirm species identification as Kit Fox using DNA (Benjamin Sacks, pers. comm.). We also extracted a tooth for determining age, and based on cementum annuli analysis (Matson’s Laboratory, Manhattan, Montana), this individual was 2 y old.
Historically, Kit Foxes ranged from southeastern Oregon and southwestern Idaho south through the deserts and semi-arid regions of California, Nevada, Arizona, and New Mexico, into northcentral Mexico (McGrew 1979). The current distribution is somewhat unknown, although in Oregon, recent research (Milburn and Hiller 2013; Vesely, D. 2015. Conservation assessment of the Kit Fox in Southeast Oregon. Oregon Wildlife Institute, Corvallis, Oregon, USA. https://www.fs.fed.us/r6/sfpnw/issssp/documents3/ca-ma-kit-fox-in-oregon-2015-08-508.pdf. [Accessed 20 April 2018]; Eckrich et al. 2018) has confirmed the species presence in southeastern Harney and southwestern Malheur counties, west and southwest of Burns Junction in southeastern Oregon (Fig. 2). Prior to those studies, the most recent confirmed detections occurred in 1993 (Keister 1994). An unusual past record indicated an individual present in Klamath County (Laughlin and Cooper 1973). Recent (1992–2012) observations in Idaho are generally restricted to the southwestern portion of the state (Idaho Department of Fish and Game. 2016. Idaho Fish and Wildlife Information System, Species Diversity Database, Idaho Natural Heritage Data. https://idfg.idaho.gov/species/taxa/17479. [Accessed 3 May 2018]; Fig. 2). Recent harvest records from Nevada confirm presence in all
Western Wildlife 6:21–22 • 2019Submitted: 19 April 2019; Accepted: 6 May 2019.
northern-tier counties (Russell Woolstenhulme, unpubl. data). Our recent observation was located about 175 km from the known recent (2012–2015) detections in Oregon, and about 110 km from nearest recent detection in Idaho. We cannot determine whether the individual kit fox described here was a wild or a captive individual, a dispersing individual, or a potential indication of range expansion. We recommend additional efforts, however, to study the distribution and ecology of this species in Oregon (and elsewhere) because the Kit Fox is a species of conservation concern in Oregon (e.g., Vesely 2015. op. cit.; http://www.oregonconservationstrategy.org/ ).
Literature cited
Eckrich, C.A., M.J. Warren, D.A. Clark, P.J. Milburn, S.J. Torland, and T.L. Hiller. 2018. Space use and cover selection of Kit Foxes (Vulpes macrotis) at their distributional periphery. American Midland Naturalist 179:247–260.
figure 1. Kit Fox (Vulpes macrotis) mortality found near Ontario, Oregon, about 110 km from the nearest recent known detection of the species. (Photographed by Philip Milburn).

22
Hiller and Milburn • Kit Fox range extension in Oregon.
McGrew, J.C. 1979. Vulpes macrotis. Mammalian Species No. 123.
Milburn, P., and T.L. Hiller. 2013. Recent Kit Fox detections at their northern-most extent in southeastern Oregon. Northwestern Naturalist 94:150–153.
Keister, Jr., G.P. 1994. The use of scent stations to survey Kit Fox in southeastern Oregon. Technical Report #94-5-03. Oregon Department of Fish and Wildlife, Portland, Oregon, USA. 9 p.
Laughlin, J.M., and A.L. Cooper. 1973. A range extension of the Kit Fox in Oregon. Murrelet 54:23.
figure 2. Recent detections of Kit Foxes (Vulpes macrotis) in Idaho (1992–2012), Nevada (northern-tier counties based on harvest data), and Oregon (gray polygon = 2012–2015, closed circle = 2017), USA.

23
Diet of the San Joaquin antelope Squirrel in the Southern portion of itS range
John h. harris
12806 Lancaster Road, Oakdale, California 95361Biology Department, Mills College, 5000 MacArthur Blvd., Oakland, California 94613
e-mail: [email protected]
Abstract.—During studies of distribution and population density of the San Joaquin Antelope Squirrel (Ammospermophilus nelsoni), I collected fecal samples from two sites in the core of the current distribution of the species: The Paine Preserve of The Nature Conservancy on the floor of the San Joaquin Valley, and the Elkhorn Plain, an upland site on the southwestern edge of the range of the species. A commercial analysis of these samples showed that the San Joaquin Antelope Squirrel was omnivorous, consuming a wide variety of foods including leaves, fungi, seeds, arthropods and occasionally other animal matter. The breadth of food types here was greater than that previously documented, though not unusual for a sciurid. Plant material consumed included the foliage, stems and seeds of grasses, herbs, and shrubs. Non-native plants, such as the grasses Bromus sp. and Arabian Grass (Schismus arabicus), and the herb Storksbill (Erodium cicutarium), were a significant proportion of the diet.
Key Words.—Ammospermophilus nelsoni; forbs; grasses; San Joaquin Desert; shrubs
introDuction
The San Joaquin Antelope Squirrel (Ammo-spermophilus nelsoni) is a 140-180 g diurnal rodent (Fig. 1) found in the San Joaquin Desert (Germano et al. 2011) of the southern San Joaquin Valley of California (Best et al. 1990; Williams 1981). The species is listed as Threatened by the California Fish and Game Commission (California Department of Fish and Game 1980). Its elevational distribution spans from about 50 to 1,100 m and it may be found on open terrain and gently sloping hills (Best et al. 1990). Habitats occupied are open perennial bunchgrass, non-native annual grasslands, Saltbush (Atriplex) scrub, Jointfir (Ephedra) scrub, and other open shrublands on sandy loam and alluvial soils. Cultivated croplands are avoided (Grinnell and Dixon 1918; Hawbecker 1953; Williams 1981). Although shrubs may provide significant thermal cover (Hawbecker 1953; Heller and Henderson 1976), San Joaquin Antelope Squirrels are also found in areas devoid of shrubs (Best et al. 1990; Harris and Stearns 1991).
Little is known concerning the diet of this species and the relation of diet to habitat use. The only prior study of diet is that of Hawbecker (1947). That study was conducted in the Panoche Hills, San Benito County, California, near the northern range limit of the species. The study area was dominated by non-native annual grassland, with few to no shrubs. During studies of distribution and population density (Harris and Stearns 1991), I collected fecal samples from two sites in the southern portion of the geographic range of the species. In this article, I describe the results of fecal analysis from the two study areas and relate the results to the characteristics of the occupied habitats. The two sites are compared to each other and to the results of Hawbecker (1947).
Western Wildlife 6:23–28 • 2019Submitted: 27 November 2018; Accepted: 19 May 2019.
MethoDS
Study sites.—I collected fecal samples at two locations: a 13-ha live-trapping study plot located on the Elkhorn Plain, San Luis Obispo County, and at the Paine Preserve in Kern County. The Elkhorn Plain is situated between the Carrizo Plain and the Temblor Range. The topography of the study area is rolling terrain gently sloping upward to the east. Vegetation at the site was dominated by grasses and widely spaced shrubs, primarily California Jointfir (Ephedra californica), with a few Anderson’s Boxthorn (Lycium andersonii). Smaller Yellow Aster (Eastwoodia elegans) and buckwheat (Eriogonum spp.) were common. Herbaceous cover was dominated by the introduced annual grass Arabian Grass (Schismus arabicus) although a number of other grasses and herbs were present.
figure 1. San Joaquin Antelope Squirrel (Ammospermophilus nelsoni) from the Panoche Hills, San Benito County, California. (Photographed by John H. Harris).

24
Harris • Diet of Ammospermophilus nelsoni.
Analysis Lab with a plant list for each site and a list of the species in the bait seed mix. The importance of various items in the diet was quantified in two ways. For each sample slide, 20 microscope fields of view were examined. The occurrence of individual food types was recorded for each field. The percentage frequency among microscope fields was then calculated. This frequency can be converted to density if certain assumptions are made (Hansen et al. 1973; Sparks and Malechek 1968), including equal fragment size and the random distribution of plant fragments over the slide. Once the density of fragments was estimated, the percentage relative density was calculated by dividing the density of fragments of a particular species by the density of fragments of all species. The results provided by the commercial laboratory included the percentage relative density of each food type in each sample. I report the means of these relative densities for each location and sampling date, which provides an estimate of the proportion of the diet made up by a particular food type. I also calculated the percentage frequency of occurrence: the percentage of samples from a given site and time period in which a food type occurred for each food type for each site and time period.
reSultS
Composite and grass seeds were found in nearly every sample (Table 1). The results for the Paine Preserve site for 9–10 June 1988 indicate that seeds made up the largest proportion (58.8%) of the diet (Table 2). Even at this date, when the site was very dry, leaves made up an appreciable proportion (16.2%) of the diet. The only leaves that were found in a high proportion of the samples were Atriplex leaves. Fungal fragments made up a similar proportion (17.2%) of the diet and arthropods composed the remaining 7.5%. The Paine Preserve samples I collected about one month later (13–14 July 1988) revealed a somewhat different pattern. Arthropods made up the largest proportion (41.2%) of the diet and were found in all samples. Seeds had decreased in the proportion (39.1%) of the diet. The category denoted as seed includes unknown seeds, possibly including bait. If this category is eliminated, the proportions of arthropods and green vegetation would be slightly increased. Leaves continued to make up a significant fraction of the diet during this later sampling period (19.9%) but fungi were absent (Table 2).
At the Elkhorn Plain site, seeds were the largest diet category during all three sampling periods, but this category was dominated by the unknown seed category, leaving considerable uncertainty regarding the true importance of seeds at this site. Identified seeds which I found in the diet included grass seeds, chenopod seeds, and seeds of Lycium andersonii. Leaves were important during the 31 May to 1 June 1988 sampling period (22.4%). The most important plant foods eaten at this time included the leaves of grasses (Bromus sp. and
The second location was a 5.6-ha live-trapping study plot located at the Paine Preserve of The Nature Conservancy. This site, on the floor of the San Joaquin Valley, was a low-lying area dominated by Spinescale Saltbush (Atriplex spinifera) and Shrubby Seablight (Sueda fruticosa). Low hummocks were separated by seasonally flooded alkali flats. Most squirrel captures and all burrowing activity were located on these low mounds or on road banks. I collected fecal samples at various times from the end of May through mid-July, so any annual vegetation was dry as one would expect (Germano et al. 2011). Rainfall at the Bakersfield Airport weather station was 141 mm (86% of normal) for 1987–1988 and 95 mm (58% of normal) for 1988–1989; these were the two rainfall years preceding sampling (https://www.weather.gov/hnx/bflmain).
Sample collection.—Characterization of the diet based on fecal samples has been shown to be comparable to stomach samples for several species of ground squirrels, including the Columbian Ground Squirrel (Urocitellus columbianus; Harestad 1986), Black-tailed Prairie Dog (Cynomys ludovicianus; Wydeven and Dahlgren 1982), and Townsend’s Ground Squirrel (Urocitellus townsendii; Van Horne et al. 1998), making this an appropriate method for a protected species that should not be sacrificed for gastro-intestinal contents. I collected fecal samples at the Elkhorn Plain site at three times: 31 May to 1 June 1988 (24 samples), 7–8 July 1988 (18 samples), and 27–28 May 1989 (50 samples). At the Paine Preserve study site, I collected fecal samples 9–10 June 1988 (13 samples) and 13–14 July 1988 (five samples). I collected fecal samples from Sherman XLK live-traps that were baited with commercially available mixed bird seed and peanut butter. I emptied traps after each capture to avoid mixing of feces from different animals. I stored fecal samples in plastic bags with no residual bait from traps. Later, I transferred the dried samples to labeled paper envelopes and I kept them in dry conditions thereafter.
Sample analysis.—I selected three random fecal pellets from the first capture of each individual to standardize the overall amount of fecal material between samples. Using the three fecal pellets, a slide was prepared by Composition Analysis Laboratory, Inc., Fort Collins, Colorado, in the following manner (Hansen et al. (1973): the feces were crushed or ground and then cleared with a bleach solution. The resulting fragments were washed through a 200 mesh Tyler standard screen (0.074 mm openings), which removes solubles and extremely small, unidentifiable particles. The washed material was then transferred to a microscope slide, making an effort to ensure that roughly equal amounts of material were on each slide.
Plant materials in the fecal samples were identified by experienced technicians using the characteristics of leaf epidermis or seed coats. I provided the Composition

25
Schismus arabicus) and the leaves of Lycium andersonii and Storksbill (Erodium cicutarium). Arthropods were also important (18.2% of the diet) and bone fragments were found in one sample.
Samples collected five weeks later (7–8 July 1988) on the Elkhorn Plain site showed a surprisingly large proportion of leaves in the diet. By far the most important species in the diet was Ephedra californica (35.5% relative density, 94% of samples). I also found foliage of Eriogonum sp., Erodium cicutarium, and Lycium
andersonii in relative densities of 1% or greater. I found arthropods in most samples, but they made up only 7.3% of the diet.
Samples collected during from 27–28 May 1989 on the Elkhorn Plain were different from those collected during the same time of year in 1988 (Table 2). Unknown seeds were again the largest category, but arthropods composed a large fraction of the diet (32.5%) and green vegetation composed a small proportion (8.3%) of the material eaten. Only the foliage of Lycium andersonii made up
table 1. Percentage frequency of occurrence of food types in the diet of the San Joaquin Antelope Squirrel (Ammospermophilus nelsoni). The percentage of samples in which a given food type was found is given for each study site and season. The abbreviation n is the number of individual squirrels from which fecal samples were collected. The locations of study areas and time of sample collection are given in the text.
Paine Spring 1988
n = 13
Paine Summer 1988
n = 5
Elkhorn Spring 1988
n = 24
Elkhorn Summer 1988
n = 18
Elkhorn Spring 1989
n = 50Seeds Grass 92.3 60.0 12.5 44.4 32.0 Chenopod 15.4 60.0 4.2 0 0 Composite 84.6 80.0 0 5.6 2.0 Lycium spp. 0 0 50.0 22.2 18.0 Unknown seed 0 40.0 100.0 89.9 100.0 Unknown pod 0 0 0 16.7 0Leaf Tissue Allenrolfea 7.7 0 0 0 0 Atriplex 76.9 40.0 8.3 0 0 Baileya 0 20.0 0 0 0 Eremalche 30.8 0 12.5 0 0 Bromus 0 0 50.0 5.6 4.0 Schismus 0 0 62.5 0 10.0 Distichlis 0 0 0 0 2.0 Oryzopsis 0 0 0 0 2.0 Chrysothamnus 0 0 0 5.6 0 Trifolium 0 0 0 0 2.0 Oenothera 23.1 0 4.2 0 2.0 Medicago 0 0 4.2 0 6.0 Kochia 7.7 40.0 0 0 2.0 Ephedra 0 0 8.3 94.4 8.0 Erodium 0 0 37.5 16.7 4.0 Lycium 0 0 41.7 22.2 44.0 Gutierrezia 0 0 0 0 0 Lotus 0 0 0 5.6 0 Lupinus 0 0 0 5.6 0 Eriogonum 0 20.0 0 27.8 0 Gilia 0 0 0 0 0 Sida 0 20.0 0 0 0Unknown flower 7.7 0 0 5.6 4.0Fungi 76.9 0 0 0 0Arthropods 76.9 100.0 100.0 77.8 98.0Bone fragments 0 0 4.2 0 6.0
Western Wildlife 6:23–28 • 2019

26
more than 1% of the diet, and I found bone fragments in three samples.
DiScuSSion
Hawbecker (1947) studied the diet of San Joaquin Antelope Squirrels at three sites in the Panoche Hills, San Benito County, California, during 1940–1946. Unfortunately, Hawbecker did not present quantitative
results (i.e., the number of samples, etc.), the method of sample collection (observation, stomach, or fecal samples) or the method of analysis, but presented qualitative and descriptive results of his sampling, summarized in a figure showing the percentage of various food types in the diet over an annual cycle. He found that the species was omnivorous, eating a variety of plant foods (including leaves, stems, and seeds) as well as arthropods and occasional carrion. The overall
table 2. Mean percentage relative density (see text for explanation) of food types in the diet of the San Joaquin Antelope Squirrel (Ammospermophilus nelsoni) for each study site and season. The abbreviation n is the number of individual squirrels from which fecal samples were collected. The mean and standard deviation are given for each food type. The locations of study areas and dates of sample collection are given in the text.
Paine Spring 1988
n = 13
Paine Summer 1988
n = 5
Elkhorn Spring 1988
n = 24
Elkhorn Summer 1988
n = 18
Elkhorn Spring 1989
n = 50Seeds Grass 22.4 ± 30.7 3.9 ± 5.6 0.5 ± 1.5 9.3 ± 19.4 5.4 ± 12.8 Chenopod 0.8 ± 1.9 6.2 ± 10.8 1.3 ± 6.1 0 0 Composite 35.6 ± 34.6 18.7 ± 33.7 0 1.4 ± 5.9 0.1 ± 0.7 Lycium spp. 0 0 4.8 ± 6.8 22.5 ± 6.1 2.1 ± 5.4 Unknown seed 0 10.3 ± 21.2 49.1 ± 23.9 38.3 ± 32.7 51.9 ± 24.0 Unknown pod 0 0 0 10.7 ± 1.8 0Leaf Tissue Allenrolfea 0.2 ± 0.8 0 0 0 0 Atriplex 6.2 ± 6.6 5.3 ± 10.6 0.6 ± 2.2 0 0 Baileya 0 0.4 ± 1.0 0 0 0 Eremalche 7.2 ± 23.3 0 0.7 ± 9 0 0 Bromus 0 0 4.7 ± 6.2 0.2 ± 0.6 0.1 ± 0.6 Schismus 0 0 10.4 ± 12.4 0 0.5 ± 1.8 Distichlis 0 0 0 0 0.1 ± 0.4 Oryzopsis 0 0 0 0 0.1 ± 0.4 Chrysothamnus 0 0 0 0.2 ± 0.9 0 Trifolium 0 0 0 0 0.1 ± 0.4 Oenothera 2.1 ± 5.7 0 0.1 ± 0.7 0 0.7 ± 0.1 Medicago 0 0 0.1 ± 0.5 0 0.2 ± 0.1 Kochia 0.2 ± 0.5 12.8 ± 8.2 0 0 0.1 ± 1.0 Ephedra 0 0 0.7 ± 2.9 35.5 ± 26.6 0.2 ± 0.9 Erodium 0 0 1.6 ± 2.3 1.0 ± 2.5 0.1 ± 0.6 Lycium 0 0 3.5 ± 5.8 1.0 ± 2.1 6.0 ± 13.9 Gutierrezia 0 0 0 0 0 Lotus 0 0 0 0.2 ± 0.9 0 Lupinus 0 0 0 0.1 ± 0.6 0 Eriogonum 0 0.6 ± 1.4 0 3.4 ± 8.8 0 Gilia 0 0 0 0 0 Sida 0 0.6 ± 1.4 0 0 0Unknown flower 0.3 ± 1.1 0 0 0.4 ± 1.8 0.1 ± 0.7Fungi 17.2 ± 19.9 0 0 0 0Arthropods 7.5 ± 7.8 41.2 ± 21.5 18.2 ± 15.2 7.3 ± 7.6 32.3 ± 20.5Bone fragments 0 0 0.3 ± 1.4 0 0.2 ± 0.8
Harris • Diet of Ammospermophilus nelsoni.

27
seasonal pattern was one in which green vegetation was most important from December through early May. From early May to December, insects were most important. Seeds were never more than 20% of the relative density of food types but were most important from March to May and from December to January. In 1946, insects were less abundant, and seeds had a higher importance than insects in the summer. Although many plant species were consumed, by far the majority of leaves consumed was Red Brome (Bromus rubens) and Erodium cicutarium. Both of these plant species are not native to California. A wide variety of arthropods was consumed, including beetles, Jerusalem crickets, June beetles, grasshoppers, and camel crickets. Grasshoppers were the most important summer arthropods, Jerusalem and camel crickets were most important in winter and spring. Seeds important in the diet included Erodium cicutarium, Bromus rubens, and Ephedra californica.
My results differ in some respects from those of Hawbecker (1947), perhaps because of the different habitats at the study sites and study methods. Results of the Hawbecker study came from a population occupying an upland, annual grassland that had been grazed by livestock with virtually no shrub cover. My samples were collected from an Atriplex-dominated alkali sink on the floor of the San Joaquin Valley (Paine Preserve) and from an upland, grazed Ephedra scrub community (Elkhorn Plain). At the Paine Preserve, seeds were important in both sampling periods, and were at least twice as prevalent as the 20% reported by Hawbecker. I found that fungi were an important spring food, which no author has previously reported being used by this species (Hawbecker 1947; Best et al. 1990); however, the consumption of fungi is widespread among sciurids (Landry 1970). Perhaps winter flooding of the site provides sufficient moisture for spring fungal growth. Leaves remained an important food source into mid-summer, in contrast to the pattern seen by Hawbecker. This probably stems from the availability of perennial shrubs such as Atriplex, Iodine bush (Allenrolfea occidentalis), and Kochia (Kochia scoparia) in combination with a few summer annuals, which did not occur at the Panoche Hills site. Arthropod consumption increased in summer but did not dominate the diet to the extent reported by Hawbecker (1947).
On the Elkhorn Plain, seeds were also important, although the large proportion of unknown seed material makes interpretation of this result difficult. It is possible that seeds were no more important at this site than they were in the study by Hawbecker (1947). Leaves were consumed during all three sample periods on the Elkhorn Plain, and included the foliage of grasses and shrubs, with a few annual herbs represented in smaller quantities. The foliage of perennial shrubs, particularly Ephedra, Lycium, and Eriogonum was an important source of green vegetation not available on the study area of Hawbecker in any significant quantity. The heavy consumption of Ephedra foliage during the sampling period in summer
1988 sampling period was a striking deviation from the pattern described by Hawbecker. The small proportion of arthropod material in the same sample is also quite different from the heavy preponderance of arthropods in the summer samples of Hawbecker.
The results of my study demonstrate a broader array of food types used, both generally and specifically, in comparison with the results from the Panoche Hills. This is not surprising, given that both of my study areas had more complex and diverse vegetation than the shrubless annual grassland sites of Hawbecker. The ecologically similar White-tailed Antelope Squirrel (Ammospermophilus leucurus) has been studied more extensively and has been shown to be omnivorous, consuming leaves, seeds, arthropods, and other materials (Belk and Smith 1991). Green vegetation is the primary food from December through May, seeds are consumed at all times of year, and arthropods are eaten primarily in late summer and autumn (Belk and Smith 1991).
There are significant limitations to interpretation of the data presented here. I collected samples incidental to other work, and as a result, the time period in which samples were collected was limited for the most part to early and mid-summer (late May to mid-July). In addition, the two years of study took place after relatively low winter rainfall. It is likely that earlier sampling at these sites would reveal more use of herbaceous green vegetation. Further diet studies should include a broader range of seasons and annual conditions and should include estimates of the availability of food types. Studies that compare food availability to reproduction would be especially useful.
Acknowledgments.—I collected fecal samples incidental to a study of population density and distribution of the San Joaquin Antelope Squirrel. That study was supported by the California Department of Fish and Game, Nongame Bird and Mammal Section, with funds from the California Endangered Species Income Tax Check-off Fund. The laboratory analysis described in this report was supported by the U.S. Fish and Wildlife Service under Contract #86855-2-0163. Mills College students Lisa Christiansen, Ana Ferrus Garcia, Elizabeth Moore, Jeanette Moore, Marge Nelson, Kirsten Rinehart, Danielle Stearns, Kerri Sweet, and Leah Zippert assisted with field work. Previous drafts of this report were reviewed by Galen Rathbun, Cathy Langtimm, and two anonymous reviewers.
literature citeD
Belk, M.C., and H.D. Smith. 1991. Ammospermophilus leucurus. Mammalian Species Account No. 368. American Society of Mammalogists, Lawrence, Kansas. 8 p.
Best, T.L., A.S. Titus, C.L. Lewis, and K. Caesar. 1990. Ammospermophilus nelsoni. Mammalian Species
Western Wildlife 6:23–28 • 2019

28
Account No. 367. American Society of Mammalogists, Lawrence, Kansas. 7 p.
California Department of Fish and Game. 1980. At the Crossroads: A Report on California’s Endangered and Rare Fish and Wildlife. California Department of Fish and Game, Sacramento, California. 147 p.
Germano, D.J., G.B. Rathbun, L.R. Saslaw, B.L. Cypher, E.A. Cypher, and L.M. Vredenburgh. 2011. The San Joaquin Desert of California: ecologically misunderstood and overlooked. Natural Areas Journal 31:138–147.
Grinnell, J., and J. Dixon. 1918. Natural history of the ground squirrels of California. Bulletin of the California State Commission of Horticulture 7:597–708.
Hansen, R.M., D.G. Peden, and R.W. Rice. 1973. Discerned fragments in feces indicates diet overlap. Journal of Range Management 26:103–105.
Harris, J.H., and D.M. Stearns. 1991. Population density, census methods, habitat relationships and home range of the San Joaquin Antelope Squirrel, 1988–89. California Department of Fish and Game, Nongame Bird and Mammal Section Report 91–02, Sacramento, California. 37 p.
Harestad, A.S. 1986. Food habits of Columbian ground squirrels: a comparison of stomach and fecal samples. Murrelet 67:75–78.
Hawbecker, A.C. 1947. Food and moisture requirements of the Nelson Antelope Ground Squirrel. Journal of Mammalogy 28:115–125.
Hawbecker, A.C. 1953. Environment of the Nelson Antelope Ground Squirrel. Journal of Mammalogy 34:324–334.
Heller, H.C., and J.A. Henderson. 1976. Hypothalamic thermosensitivity and regulation of heat storage behavior in a day-active desert rodent Ammo-spermophilus nelsoni. Journal of Comparative Physiology 108:255–270.
Landry, S.O. 1970. The Rodentia as omnivores. The Quarterly Review of Biology 45:351–372.
Sparks, D.R., and J.C. Malechek. 1968. Estimating percentage dry weight in diets using a microscope technique. Journal of Range Management 21:264–265.
Van Horne, B., R.L. Schooley, and P.B. Sharpe. 1998. Influence of habitat, sex, age, and drought on the diet of Townsend’s Ground Squirrels. Journal of Mammalogy 79:521–537.
Williams, D.F. 1981. Distribution and population status of the San Joaquin Antelope Squirrel and Giant Kangaroo Rat. California Department of Fish and Game, Nongame Wildlife Investigations Final Report. E-W-4. Sacramento, California. 48 p.
Wydeven, P.A., and R.B. Dahlgren. 1982. A comparison of prairie dog stomach contents and feces using a microhistological technique. Journal of Wildlife Management 46:1104–1108.
John harriS is Professor Emeritus of Biology at Mills College in Oakland, California, having taught there from 1986–2013. He received his B.S. in Biology from Stanford University, Palo Alto, California, and his Ph.D. in Ecology from the University of California, Davis. He taught courses in ecology, zoology, and natural history, and has conducted research on threatened and endangered small mammals and birds, including Willow Flycatcher (Empidonax traillii), San Joaquin Antelope Squirrel, Mohave Ground Squirrel (Xerospermophilus mohavensis), and Tricolored Blackbird (Agelaius tricolor). He has written a book on Mammals of the Mono Lake - Tioga Pass Region as well as scientific papers. John served as President of the Western Section of The Wildlife Society for 2004–2005. (Photographed by Salvatore Salerno).
Harris • Diet of Ammospermophilus nelsoni.

29
Solar EnErgy DEvElopmEnt anD EnDangErED SpEciES
in thE San Joaquin vallEy, california:iDEntification of conflict ZonES
Scott E. Phillips and Brian L. Cypher1
Endangered Species Recovery Program, California State University-Stanislaus, One University Circle,Turlock, California 95382
1Corresponding author, email:[email protected]
Abstract.—A number of animal and plant species in the San Joaquin Valley (SJV) of California are rare due to profound habitat loss and degradation. A significant portion of the remaining habitat for these species also has high potential for solar energy generation. We conducted a spatially explicit GIS analysis of lands in the SJV to identify areas of potential conflict between rare species and solar energy development and also to identify areas where such conflict would be minimized. We modeled solar energy generation potential and also modeled habitat suitability for five federally listed animal species whose ranges encompass those of additional rare species. We then layered the model results to identify areas of greater or lesser conflict. Approximately 4,145 km2 have moderate to high potential for solar energy development and also have moderate to high quality habitat for listed species. The potential for environmental conflicts is high on these lands. Approximately 8,436 km2 have moderate to high potential for solar energy development but no or low-quality habitat for rare species. These lands are the optimal sites for solar energy generation projects. Furthermore, siting projects on lands with no or marginal habitat value could enhance the value of these lands for rare species and create linkages between occupied areas. Our approach can be applied in other locations to identify general areas and even specific locations where siting solar facilities would result in minimal or no impacts to sensitive resources and possibly even enhance regional conservation efforts.
Key Words.—Ammospermophilus nelsoni; forbs; grasses; San Joaquin Desert; shrubs
introDuction
Solar power is a rapidly growing renewable energy source world-wide, and concomitant with this has been an accelerated rate of construction of utility-scale solar energy generation facilities. The marked increase in such facilities has been particularly acute in California (Solar Energy Industries Association 2016) where optimal conditions (e.g., flat terrain, high insolation rates) are abundant, and where the state legislature passed a bill in 2015 requiring all power-supplying utilities to obtain at least 50% of their electricity from renewable energy sources by 2030 (de León 2015). This bill was followed by another in 2018 (de León 2018) that mandated that the 50% target be reached by 2026, that 60% be achieved by 2030, and that renewable and zero-carbon sources supply 100% of retail sales of electricity by 2045. This could further accelerate the construction of solar facilities in California.
Although the rapid proliferation of solar facilities is positive with regards to helping ameliorate climate change impacts, a significant concern is adverse effects to sensitive biological resources resulting from these facilities (Lovich and Ennen 2011; Turney and Fthenakis 2011, Hernandez et al. 2015), particularly when the facilities are constructed on lands that provide habitat for species at risk (Leitner 2009; Lovich and Ennen 2011; Stoms et al. 2013; Moore-O’Leary et al. 2017). Some of the rare species affected by recent solar projects in California include the San Joaquin Kit Fox (Vulpes macrotis mutica), federally listed Endangered (FE) and
Western Wildlife 6:29–44 • 2019Submitted: 5 February 2019; Accepted 25 July 2019.
California-listed Threatened (CT), Giant Kangaroo Rat (Dipodomys ingens), FE and California-listed Endangered (CE), Desert Tortoise (Gopherus agassizii), Federally listed Threatened (FT) and CT, and Mohave Ground Squirrel (Xerospermophilus mojavensis), CT (Leitner 2009; Moore-O’Leary et al. 2017).
Numerous utility-scale solar facilities have been constructed or proposed for the San Joaquin Valley (SJV) region of California. In addition to high insolation rates and an abundance of flat terrain, relatively low land prices and proximity to transmission corridors enhance the attractiveness of this region for such facilities (Pearce et al. 2016); however, a large number of rare species also occurs in this region due to geographic isolation and high levels of endemism coupled with profound habitat loss (U.S. Fish and Wildlife Service [USFWS] 1998). By 2004, approximately 70% of the over 3.9 million ha of historical habitat in the SJV had been replaced by irrigated agriculture and urban development (Kelly et al. 2005). Thus, developments in the remaining natural lands further enhance the risk of extinction for multiple animal and plant species.
We conducted a spatially explicit analysis using a GIS-based model to assess location-specific potential for conflicts between listed species and solar energy development in the SJV. Our objectives were to identify areas more conducive to solar energy facilities due to high solar energy potential and low impacts to rare species, and identify areas where solar projects should be avoided based on the presence of high-value habitat and the potential for the occurrence of multiple rare species.

30
Phillips and Cypher • Solar energy and endangered species conflicts.
the grasslands and shrublands have been significantly reduced to a fraction of their former acreage (USFWS 1998; Kelly et al. 2005). Urban regions in the SJV are growing rapidly and major population centers include Stockton, Modesto, Merced, Fresno, Visalia, and Bakersfield. Most constructed and planned solar energy plants are located in the more arid western and southern SJV described by Germano et al. (2011) as the San Joaquin Desert.
To examine conflicts between listed species and energy development in the SJV, we developed a GIS-based model (see Appendix A for model schematic) to determine how those areas best-suited for solar development compare with the suitability of remaining habitat for five federally or state listed animal species typically associated with the San Joaquin Desert. The five species were the Blunt-Nosed Leopard Lizard (Gambelia sila), FE and CE, San Joaquin Kit Fox, FE and CT, San Joaquin Antelope Squirrel (Ammospermophilus nelson), Federal Species of Concern and CT, Giant Kangaroo Rat, FE and CE, and San Joaquin Kangaroo Rat (Dipodomys nitratoides),
This approach can be applied in other regions as well where the potential for conflict between rare species and solar energy development is high.
mEthoDS
Study area.—The SJV in central California (Fig. 1) extends about 415 km from north to south, and encompasses approximately 3.44 million hectares below the 152-m (500-ft) contour (USFWS 1998). The SJV is bounded on the east by the Sierra Nevada, on the west by the Coast Ranges, on the south by the Transverse Ranges and on the north by the extensive delta of the Sacramento and San Joaquin Rivers. The SJV is an arid region characterized by hot, dry summers and cool, rainy winters. Historical habitat types included arid grasslands, arid shrublands, woodland savannahs, and lakes and marshes on the valley floor connected by rivers and sloughs (USFWS 1998, Germano et al. 2011). The savannahs, lakes, and wetlands have been all but eliminated by agricultural and urban development, and
figurE 1. The San Joaquin Valley region in California. Land use/land cover classes are from a state-wide vegetation layer (University of California-Santa Barbara Biogeography Lab 1998) combined with a more recent layer of farmland and urban areas in California (California Department of Conservation 2015).

31
which consists of three subspecies: Tipton Kangaroo Rat (D. n. nitratoides), FE and CE, Fresno Kangaroo Rat (D. n. exilis), FE and CE, and Short-nosed Kangaroo Rat (D. n. brevinasus), Federal Species of Concern and California Species of Special Concern. We selected these species because of their relatively wide distributions, which encompass those of most other rare species occurring in the San Joaquin Desert. GIS models have been used elsewhere to identify areas of conflict between solar energy development and conservation goals (Cameron et al. 2012; Stoms et al. 2013). Our analysis did not explicitly include other regionally important components of conservation concern, in particular wetland habitats and associated species, and listed or rare plants.
Suitability for solar development.—We evaluated suitability for solar development using methods similar to those used by Butterfield et al. (2013) to evaluate site-suitability for large-scale (e.g., photovoltaic sites > 20 MW) solar facilities. Our criteria included land use, terrain, protected land status, and insolation rates (Table 1). These criteria are not comprehensive and other factors, such as proximity to transmission corridors and land values, also can affect site selection for solar farms; however, as noted by Pearce et al. (2016), these other factors can change rapidly and so we did not consider them in this analysis. We assumed that utility-scale solar facilities sites would need to be larger than 80 ha (200 acres) in area based on a high estimate (75th percentile) of acres/MW for photovoltaic solar sites larger than 20 MW estimated by the National Renewable Energy Laboratory (NREL 2013), and screened out areas smaller than that minimum size. Because we did not include all possible factors, some areas identified as suitable may be impractical to develop because of other limiting factors.
We developed a GIS layer of current land use classes based on a combination of the National Agricultural Statistics Service (NASS) 2014 cropland data layer (U.S. Department of Agriculture NASS 2015) and the California Department of Conservation (CDOC) Farmland Mapping and Monitoring Program (FMMP) 2012 important farmland layer (CDOC 2015). We
combined land use classes from both layers to create a simplified classification (Table 2) that we used to evaluate both solar site potential and habitat availability. The two source layers (FMMP, NASS) are created using different methods and for different purposes and so differ in thematic accuracy (correct classification) and thematic resolution (number of mapped land use classes). The FMMP layer is created using direct interpretation from aerial photography and field observations (CDOC 2004), whereas NASS uses semi-automatic classification of satellite imagery. Based on a comparison of NASS classifications to observed classifications in reconnaissance surveys (Endangered Species Recovery Program, unpubl. data), we found that semi-automatic classification techniques are less reliable for land uses that have similar vegetation and ground cover such as rangeland and idle farmland (two important categories for our analysis). We also found that the FMMP included a more accurate depiction of the extent of rangeland but lacked the thematic resolution (detailed land use categories) of NASS (e.g., orchards, vineyards, wetlands, and forest). Because it takes less time to produce, NASS is updated on a yearly cycle, and is usually more current than what is available from FMMP at any given time. To
Western Wildlife 6:29–44 • 2019
Potential for Solar Development
Criteria None to low Moderate Highest
Land use Developed (urban areas, industrial, extractive), permanent crops (orchards or vineyards), open water, forests, or wetlands.
Irrigated farmland excluding per-manent crops (e.g., row crops)
Rangeland, fallow/idle farmland, or dryland-farmed areas (e.g., winter wheat)
Slope > 15° < 15° < 15°
Protected lands Protected lands (public lands, private conservation lands, or conservation easements)
Other private land Other private land
Insolation N/A 5.68 - 6 kWh/m2/day (or row crops with > 6 kWh/m2/day)
6.00–6.42 kWh/m2/day
tablE 1. Criteria used to evaluate suitability for large-scale solar development in the San Joaquin Valley, California. Slope was averaged over a 128-ha (320-ac) neighborhood.
Land use class Primary source Secondary source
Urban/Industrial/Other developed FMMP NASS
Permanent crops NASS1 -
Row crops NASS1 -
Fallow or dryland-farmed NASS1 -
Rangeland FMMP NASS
Barren NASS1 -
Forests or wetlands NASS1 -
Water FMMP NASS
tablE 2. Land use classification used to evaluate solar and habitat potential in the San Joaquin Valley, California. The acronym FMMP = Farmland Mapping and Monitoring Program 2012 important farmland layer from the California Department of Conservation and NASS = National Agricultural Statistics Service 2014 cropland data layer. For primary source, NASS1 has no equivalent category in FMMP.

32
take advantage of both the thematic accuracy of FMMP and thematic resolution of NASS, we used a GIS overlay analysis to combine information data from both sources using the following classification rules: Where FMMP land use was classified as agricultural land or unknown, we used the more-detailed categories from the NASS. Otherwise, we used the FMMP land use categories that we found to be more-thematically accurate for non-agricultural areas, urban areas, and water. For the non-agricultural area (e.g., rangeland), we added supplemental information where the more-detailed NASS data had identified areas of forest or wetlands (classes included in the NASS but not included in the FMMP).
We calculated slope (in degrees) from digital elevation models available from the U.S. Geological Survey (USGS) National Elevation Program (USGS 2014). To screen out small patches of flat slope in otherwise steep terrain, we used a spatial averaging function (Focal Statistics in ArcGIS). Specifically, we calculated each cell as the mean value of cells within a 640-m-radius circular area (approximately 320 ac or 128 ha).
We screened out areas identified as protected fee or easement lands (GreenInfo Network 2015). While fee and easement lands have varying levels of protection from development such as large-scale utility solar facilities, we considered them all as having generally higher protection against solar development and focused our analysis on private lands. We also estimated insolation using solar resource data available from the National Renewable Energy Laboratory (NREL 2012). Solar resource data were derived from NREL estimates for photovoltaic energy (tilt = latitude collector) available as 10-km grids. To match the resolution of our other data sources, we converted the grids to a higher-resolution surface using a spatial interpolation function using an Inverse Distance Weighting function in ArcGIS (Power = 2; Search Radius = 12 neighboring cells). We combined map layers for the four criteria using a series of GIS Map Algebra steps statements (Appendix A) to create a composite map of potential suitability for solar development consisting of three categories: Low, Moderate, and High (Fig. 2).
Phillips and Cypher • Solar energy and endangered species conflicts.
figurE 2. Estimated solar potential based on land use, protected land status, slope, and insolation in the San Joaquin Valley, California.

33
Suitability for listed species.—We evaluated habitat quality for the listed species using an approach similar to Germano et al. (2011) who used the distribution of multiple species along with ancillary information to identify a general region (i.e., San Joaquin Desert) important to multiple arid-adapted species of the SJV. Our approach was to develop a relatively detailed (approximately 1:125,000) GIS layer of historical land cover. To do this (Fig. 3), we digitized map units from a set of soil surveys of the San Joaquin Valley that pre-date most of the conversion of rangelands to irrigated agriculture (Holmes et al. 1919; Nelson et al. 1918; Nelson et al. 1921). To fill some data gaps near the edges of our study area, we also used information from contemporary soil surveys (U.S. Department of Agriculture, Natural Resources Conservation Service 2014, 2015). We assigned vegetation classes to map units primarily using descriptions (and example photographs) of soil series map units (Appendix B). For example, series descriptions may include descriptions of grazing conditions, presence of brush, or information on terrain
and drainage.While we assigned classes mostly by the description
of the soil type, we also reviewed historical map sources (Hall, W.H. 1890. Topographic and irrigation maps of San Joaquin Valley, Sheets 1-4. Water Resources Archives, University of California, Berkeley, California; Piemeisel and Lawson 1937; Kuchler 1977; Werschull et al. 1984), historical photographs (MVZ 2015), and climate data (PRISM Group at Oregon State University 2014) and in some cases updated our classification based on climate or another secondary source (Appendix B). We used a subset of species occurrence records from the Natural Diversity Database (CDFW 2014) and the recovery plan for upland species of the San Joaquin Valley of California (USFWS 1998) along with habitat descriptions from literature sources (Grinnell 1918, 1922, 1932) to assign historical presence of each of our target species to our historical land cover map units. We used the occurrence records and habitat descriptions to estimate the historical geographic distribution of each species and then used the historical vegetation classes to refine the distribution. For
Western Wildlife 6:29–44 • 2019
figurE 3. Estimated historical land cover in the San Joaquin Valley, California.

34
example, we used historical records of Fresno Kangaroo Rats to identify map units where they were present, but also included contiguous or nearby map units with similar conditions. For map units with few occurrence records, we reviewed the descriptions and sources of the record to screen out those with high spatial uncertainty or those where the species identification was questionable (e.g., San Joaquin Kit Fox records based only on presence of sign but no captures).
We estimated historical habitat value by adding up the number of co-occurring species (Fig. 4). Using the slope
layer, we identified and removed steep and rugged lands (> 30º slope) and grouped the remaining lands into four habitat quality categories: No to low, Low to moderate, Moderate to high, and Highest (Fig. 5). We combined the estimated composite historical habitat layer (Fig. 5-A) with a layer of contemporary land use (Fig. 5-B). Contemporary rangelands (e.g., grasslands, saltbush scrub) were assigned their estimated historical value and non-rangelands (e.g., irrigated farmland, developed areas) were assigned a value of No to Low habitat value (Table 3, Fig. 6).
figurE 4. Total number of range overlaps for Giant Kangaroo Rats (Dipodomys ingens), Short-nosed Kangaroo Rats (D. nitratoides brevinasus), Fresno Kangaroo Rats (D. n. exils), Tipton Kangaroo Rats (D. n. nitratoides), San Joaquin Antelope Squirrels (Ammospermophilus nelsoni), Blunt-nosed Leopard Lizards (Gambelia sila), and San Joaquin Kit Foxes (Vulpes macrotis mutica) based on historical ranges in the San Joaquin Valley, California.
Habitat value
Criteria None to low Low to moderate Moderately high Highest
Estimated historical species ranges - 0–1 overlapping range 2–4 overlapping ranges Greater than 4 overlapping ranges
Land use Not rangeland Rangeland Rangeland Rangeland
Slope > 30° < 30° < 35° < 30°
tablE 3. Criteria used to evaluate habitat quality for potential solar projects in the San Joaquin Valley, California. Slope was averaged over a 128-ha (320-ac) neighborhood.
Phillips and Cypher • Solar energy and endangered species conflicts.

35
rESultS
We determined the habitat value for listed species and the potential for solar development for 42,707 km2 in the SJV (Table 4). In particular, arid shrublands and grasslands tended to have attributes favorable for solar energy development. Thus, of the species we evaluated, Blunt-nosed Leopard Lizards, San Joaquin Antelope Squirrels, Giant Kangaroo Rats, Short-nosed Kangaroo Rats, and San Joaquin Kit Foxes would be most affected. Tipton and Fresno kangaroo rats primarily occur in alkali sink habitat, which was less suitable for solar development and so would be less affected.
Nearly 40% of areas with the highest potential for solar development were in areas with the highest habitat value. Thus, these areas can be considered conflict zones. This overlap increased to 64% when both the highest and moderate to high habitat value categories were considered (Table 4; Fig. 7). These conflict areas were concentrated in the southwestern portion of the SJV. Nearly a third (31%) of areas with the highest potential for solar development were in areas of less conflict (e.g., No to Low quality habitat consisting of marginal or idle farmland). Likewise, two thirds (67%) of the areas of highest habitat value were in the areas with the highest potential for solar development (Table 4; Fig. 7).
figurE 5. Estimated historical habitat value (A) and contemporary land use showing current rangeland or non-rangeland (B) in the San Joaquin Valley, California.
Solar Potential
Habitat Value Low Moderate High Total
None to low value 24,821 km2 (9,584 mi2)
3,002 km2 (1,159 mi2)
1,789 km2 (691 mi2)
29,612 km2 (11,433 mi2)
Low to moderate value 1,931 km2 (746 mi2)
3,337 km2 (1,288 mi2)
308 km2 (119 mi2)
5,576 km2 (2,153 mi2)
Moderate to high value 2,349 km2 (907 mi2)
440 km2 (170 mi2)
1,375 km2 (531 mi2)
4,164 km2 (1,608 mi2)
Highest value 1,025 km2 (396 mi2)
85 km2 (33 mi2)
2,245 km2 (867 mi2)
3,355 km2 (1,295 mi2)
Total 30,126 km2 (11,632 mi2)
6,864 km2 (2,650 mi2)
5,717 km2 (2,207 mi2)
42,707 km2 (16,489 mi2)
tablE 4. Cross-tabulation of area for zones of suitability for solar development and habitat quality zones in the San Joaquin Valley, California.
Western Wildlife 6:29–44 • 2019

36
DiScuSSion
Our analysis indicated that there is considerable overlap between site qualities needed for solar energy generation and those that constitute suitable habitat for listed species in the SJV. Consequently, a large proportion of the remaining high-quality habitat for these species also is optimal for solar energy development. This overlap results in the potential for significant conflict between development of new energy sources and conservation of at-risk species. Most historical habitat for these species has been converted to other land uses (e.g., agriculture) and habitat loss continues to be the greatest threat to listed arid-adapted species (USFWS 1998). Additional conversion of habitat for any reason, including solar energy development, could further imperil these species. Furthermore, although our analysis was based on select species, a number of other rare species share similar habitat requirements with the featured species (USFWS 1998), and therefore the results of our analyses are applicable to a large suite of species of conservation concern in the SJV.
Based on our analyses, there are approximately 4,145 km2 (1,601 mi2) with moderate to high potential for solar energy development and that also constitute moderate to high quality habitat for listed species. These lands comprise the highest potential for conflict. Securing permits to develop these lands, particularly from agencies such as USFWS and California Department of Fish and Wildlife that are charged with protecting listed species, is difficult and also costly due to the complex impact analyses and substantial mitigation measures typically required. Furthermore, environmental groups commonly have filed lawsuits against project proponents proposing solar energy projects in good quality habitat and this further increases the cost of constructing solar facilities. For three large solar farms recently constructed in high quality habitat for listed species in the SJV (Topaz Solar Farms, California Valley Solar Ranch, Panoche Valley Solar Farm), impact analyses and permitting required several years to complete and mitigation costs were in the 10s of millions of dollars (David Hacker, pers. comm.). Environmental groups initiated legal challenges to all three projects resulting in many more millions of dollars
figurE 6. Estimated habitat value based on historical species ranges, land use, and slope in the San Joaquin Valley, California.
Phillips and Cypher • Solar energy and endangered species conflicts.

37
in additional mitigation costs. Potential conflict areas with moderate to high habitat
value and moderate to high potential for solar energy development are particularly concentrated in the southwestern portion of the SJV from Kern County up into southwestern Fresno County. Other areas include private lands in the northern and eastern Carrizo Plain, valley floor lands in northern Kern and southern Tulare counties, and the Panoche Valley region in eastern San Benito County. These areas all are recognized as being important for the conservation and recovery of the listed species considered in this report and other rare species as well (USFWS 1998).
Conversely, approximately 8,436 km2 (3,257 mi2) have moderate to high potential for solar energy development but no to moderate value quality habitat for listed species. These lands constitute more optimal sites for solar energy generation projects. Conflicts with listed species would be minimal or non-existent on these lands. Permit acquisition would be easier and mitigation requirements would be lower. With the ample availability of lands that have high potential for solar development but low habitat
value for listed species, there appears to be abundant opportunity to site new solar projects in areas where at-risk species will be minimally affected, and could reduce the additional costs (e.g., mitigation requirements) associated with higher-quality habitats.
Lands with low habitat value but high potential for solar energy development are scattered throughout the southern SJV with particular concentrations in western Fresno County, southern Kings County, and southern Kern County. There also is a small concentration of such lands on the east side of the valley on the Kern-Tulare County boundary. Many of the lands in western Fresno County are in the Westlands Water District (https://wwd.ca.gov/) where considerable agricultural land already has been taken out of production (retired) or otherwise retired due to salt concentrations and drainage issues (Brian Cypher et al., unpubl. report). Solar energy generation would constitute an excellent alternate use of these lands.
GIS-based approaches have been used previously to identify areas of conflict with solar energy development. Cameron et al. (2012) used GIS modeling to identify areas of least conflict between biodiversity values and
figurE 7. Combined suitability for solar development with contemporary habitat conditions for five listed animal species in the San Joaquin Valley, California.
Western Wildlife 6:29–44 • 2019

38
solar energy development in the Mojave Desert of California and Nevada. Stoms et al. (2013) conducted a similar effort for the Mojave and Colorado Desert regions in California. Three previous analyses have been conducted for the SJV, although the objectives, methods, and conclusions differed from ours. Butterfield et al. (2013) identified 1,592 km2 (615 mi2) of lands where suitability for solar farms was high but conservation value was low. Similarly, Jane Cowan et al. (unpubl. report) and Pearce et al. (2016) identified 4,047 km2 (1,563 mi2) and 1,902 km2 (734 mi2) respectively, of lands where conflict between solar development and conservation would be limited. These studies and ours differed in two significant ways. A much broader collection of lands (e.g., fallow agricultural lands, wetlands), were used to assess conservation values, but in many instances these lands do not support listed species. We focused on lands considered important for arid-adapted listed species (USFWS 1998). Each of these other analyses also included conservation of agricultural lands as an objective, and this likely is the reason that the least conflict lands totaled considerably less than the 8,436 km2 (3,257 mi2) that we identified. Agricultural lands in the SJV generally are flat and therefore are optimal for solar farms, but agricultural lands have little or no value for the listed species we considered (Warrick et al. 2007; Cypher et al. 2013).
A notable point of agreement among our study and the three others conducted in the SJV is the identification of a sizeable concentration of lands in western Fresno County where conflicts between solar energy development and conservation values would be minimal. As described previously, many of these lands lie within the Westlands Water District. Due to soil salinity and other issues, many acres within the District have been taken out of agricultural production. Thus, this region potentially could serve as a focal area for solar energy production.
Siting projects in areas with no or marginal habitat value actually might increase the value of these lands for listed species. Preliminary data from recently constructed solar generating facilities indicated continued, and in some cases increased, use by listed species (Cypher et al. 2019). The Topaz Solar Farms in northeastern San Luis Obispo County was largely constructed on active and fallowed dry-land farmed fields. San Joaquin Kit Foxes were present in low abundance on the site prior to construction, and they continue to occupy the site now that construction has been completed and the facility is fully operational (Meade, Althouse and Meade, Inc., pers. comm.). The results of surveys involving genetic analyses of fecal samples indicate that kit fox numbers have increased on the site (Jesus Maldonado and Tammy Wilbert, unpubl. report). Similarly, kit foxes continue to use another nearby solar facility, the California Valley Solar Ranch (Robyn Powers, pers. comm.). This facility was constructed on lands that were previously farmed or intensively grazed. Both solar sites appear to be used
by kit foxes to fulfill all life-history requirements (e.g., foraging, denning, resting). Reproduction by kit foxes also has been documented on both sites. Furthermore, Giant Kangaroo Rats were present in low numbers on the California Valley Solar Ranch lands prior to construction and continue to be present and have even increased in some areas now that construction has been completed (Robyn Powers, pers. comm.). Conservation measures that have facilitated use of these solar facilities by listed species include permeable fencing, movement corridors, vegetation management, enhancements such as artificial dens, and prohibition of rodenticide use.
The examples above indicate that if designed and managed appropriately, solar generating facilities can provide habitat value for listed species. Given the overlap in habitat requirements (USFWS 1998) among the listed species used in our analyses, we predict that San Joaquin Kangaroo Rats, San Joaquin Antelope Squirrels, and Blunt-Nosed Leopard Lizards also potentially would use solar facilities, similar to that observed for San Joaquin Kit Foxes and Giant Kangaroo Rats. Thus, solar facilities constructed in low value habitat adjacent to lands occupied by any of these species might actually increase the amount and patch size of useable habitat. Such construction of solar facilities could be particularly valuable if sited in such a manner as to create a corridor across marginal habitat to link areas of higher quality habitat. With the extensive fragmentation of habitat that currently exists in the SJV ecoregion (e.g., USFWS 1998; Kelly et al. 2005; Cypher et al. 2013), the potential for improving conditions for listed species by connecting habitat patches is immense. The recovery plan for upland species in the SJV (USFWS 1998) specifically calls for establishing corridors and improving connectivity in the region in western Fresno County that includes the Westlands Water District. As described previously, species habitat values are generally low and solar energy development potential is relatively high in this region, and solar projects potentially could contribute to conservation strategies as well-managed solar facilities could provide greater habitat value than the existing agriculture.
Per our previous caution, our analysis did not consider all possible factors that could influence the selection of a proposed site for a solar facility in the SJV (for example, listed species associate with wetlands). Our analysis, however, constitutes a useful decision support tool for identifying general areas and even specific locations in this region where siting such facilities would result in minimal or no impacts to listed species. Of the remaining 7,519 km2 of moderate and high-quality habitat in the SJV, almost half (48.2%) is also highly suitable for solar energy generation. Consequently, the potential for conflict between these two competing land uses is high; however, there are 29,612 km2 of low-quality habitat that also is highly suitable for solar energy generation. Thus, there is abundant opportunity to site solar energy plants on lands that will not adversely affect listed species.
Phillips and Cypher • Solar energy and endangered species conflicts.

39
Acknowledgments.—This project was funded by the California Department of Fish and Wildlife (CDFW) with funds from the U.S. Fish and Wildlife Service, State Wildlife Grant Program. We thank Krista Tomlinson at CDFW for administrative assistance and project support.
litEraturE citED
Cameron, D.R., B.S. Cohen, and S.A. Morrison. 2012. An approach to enhance the conservation-compatibility of solar energy development. PLoS ONE 7(6):e38437. doi:10.1371/journal.pone.0038437
Cypher, B.L., S.E. Phillips, and P.A. Kelly. 2013. Quantity and distribution of suitable habitat for endangered San Joaquin kit foxes: conservation implications. Canid Biology and Conservation 16:25–31.
Cypher, B. L., T. L. Westall, K. A. Spencer, D. E. Meade, E. C. Kelly, J. Dart, and C. L. Van Horn Job. 2019. Response of San Joaquin Kit Foxes to Topaz Solar Farms: implications for conservation of kit foxes. California State University-Stanislaus, Endangered Species Recovery Program, Turlock, California. 80 p.
Germano, D.J., G.B. Rathburn, L.R. Saslaw, B.L. Cypher, E.A. Cypher, and L.M. Vredenburgh. 2011. The San Joaquin Desert of California: ecologically misunderstood and overlooked. Natural Areas Journal 31:138–147.
Grinnell, J. 1918. Natural History of the Ground Squirrels of California. University of California Press, Berkeley, California.
Grinnell, J. 1922. A Geographical Study of the Kangaroo Rats of California. University of California Press, Berkeley, California.
Grinnell, J. 1932. Habitat relations of the Giant Kangaroo Rat. Journal of Mammalogy 13:305–320.
Hernandez, R.R., M.K. Hoffacker, M.L. Murphy-Mariscal, G.C. Wu, and M.F. Allen. 2015. Solar energy development impacts on land cover change and protected areas. Proceedings of the National Academy of Science 112:13579–13584.
Holmes, L.C., E.C. Eckmann, J.W. Nelson, and J.E. Guernsey. 1919. Reconnaissance soil survey of the middle San Joaquin Valley, California. United States Agriculture Department, Soils Bureau, Washington, D.C. 119 p.
Kelly, P.A., S.E. Phillips, and D.F. Williams. 2005. Documenting ecological change in time and space: the San Joaquin Valley of California. Pp. 57–78 in Mammalian Diversification: From Chromosomes to Phylogeography. Lacey, E.A., and P. Myers (Ed.). Publications in Zoology Series. University of California Press, Berkeley, California.
Kuchler, A.W. 1977. The map of the natural vegetation of California. Pp. 909–938 + supplement In Terrestrial Vegetation of California. Barbour, M.G., and J. Major (Ed.). John Wiley & Sons, New York, New York.
Leitner, P. 2009. The promise and peril of solar power.
Wildlife Professional 3:48–53.Lovich, J.E., and J.R. Ennen. 2011. Wildlife conservation
and solar energy development in the Desert Southwest, United States. BioScience 61:982–992.
Moore-O’Leary, K.A., R.R. Hernandez, D.S. Johnston, S.R. Abella, K.E. Tanner, A.C. Swanson, J. Kreitler, and J.E. Lovich. 2017. Sustainability of utility-scale solar energy - critical ecological concepts. Frontiers in Ecology and the Environment 15:385–394.
National Energy Renewal Laboratory (NREL). 2013. Land-use requirements for solar power plants in the United States. Technical Report NREL/TP-6A20–56290. National Energy Renewal Laboratory, Golden, Colorado.
Nelson, J.W., J.E. Guernsey, L.C. Holmes, and E.C. Eckmann. 1918. Reconnaissance soil survey of the Lower San Joaquin Valley, California. U.S. Agriculture Department, Soils Bureau, Washington, D.C. 106 p.
Nelson, J.W., W.C. Dean, and E.C. Eckmann. 1921. Reconnaissance soil survey of the Upper San Joaquin Valley, California. U.S. Agriculture Department, Soils Bureau, Washington, D.C. 112 p.
Piemeisel, R.L., and F.R. Lawson. 1937. Types of vegetation in the San Joaquin Valley of California and their relation to Beet Leafhopper. Technical Bulletin No. 557, U.S. Department of Agriculture, Washington, D.C.
Stoms, D.M., S.L. Dashiell, and F.W. Davis. 2013. Siting solar energy development to minimize biological impacts. Renewable Energy 57:289–298.
Turney, D., and V. Fthenakis. 2011. Environmental impacts from the installation and operation of large-scale solar power plants. Renewable and Sustainable Energy Reviews 15:3261–3270.
U.S. Fish and Wildlife Service (USFWS). 1998. Recovery plan for upland species of the San Joaquin Valley, California. United States Fish and Wildlife Service, Portland, Oregon. 319 p.
Warrick, G.D., H.O. Clark, Jr., P.A. Kelly, and D.F. Williams, and B.L. Cypher. 2007. Use of agricultural lands by San Joaquin Kit Foxes. Western North American Naturalist 67:270–277.
Werschull, G.D., F.T. Griggs, and J.M. Zaninovich. 1984. Tulare Basin Protection Plan. The California Nature Conservancy, San Francisco, California.
on-linE WorkS
Butterfield, H.S., D. Cameron, E. Brand, M. Webb, E. Forsburg, M. Kramer, E. O’Donoghue, and L. Crane. 2013. Western San Joaquin Valley least conflict solar assessment. The Nature Conservancy, San Francisco, California. https://www.scienceforconservation.org/assets/downloads/WSJV_SolarAssessment_2013.pdf.
California Department of Conservation (CDOC). 2004. CDOC, Division of Land Resource Protection, A Guide to the Farmland Mapping and Monitoring Program,
Western Wildlife 6:29–44 • 2019

40
2004 Edition. https://www.conservation.ca.gov/dlrp/fmmp/Documents/fmmp_guide_2004.pdf
California Department of Conservation (CDOC). 2015. CDOC, Division of Land Resource Protection, Farmland Mapping and Monitoring, Important Farmland (multiple counties), Geospatial data. http://conservation.ca.gov/dlrp/FMMP/
California Department of Fish and Wildlife (CDFW). 2014. California Natural Diversity Database. Geospatial data. http://www.dfg.ca.gov/biogeodata/cnddb/
de León, K. 2015. Senate Bill 350: Clean Energy and Pollution Reduction Act, Chapter 547, Statutes of 2015. https://leginfo.legislature.ca.gov/faces/billNavClient.xhtml?bill_id=201520160SB350
de León, K. 2018. Senate Bill 100: California Renewables Portfolio Standard Program: Emissions of Greenhouse Gases, Chapter 312, Statutes of 2018. https://leginfo.legislature.ca.gov/faces/billTextClient.xhtml?bill_id=201720180SB100
GreenInfo Network. 2015. California Protected Areas Database (CPAD) and the California Conservation Easement Database (CCED). Geospatial data. http://calands.org/
Museum of Vertebrate Zoology at Berkeley (MVZ). 2015. MVZ Field Note, Photograph, and Annotated Map Collections. Online resource (digital photographs). http://mvz.berkeley.edu/FieldnotePhotoMap_Collection.html
National Energy Renewal Laboratory (NREL). 2012. Lower 48 and Hawaii PV 10km Resolution 1998 to 2009 (us9809_latilt_updated). Geospatial data. http://www.nrel.gov/gis/data_solar.html
Pearce, D., J. Strittholt, T. Watt, and E.N. Elkind. 2016. A path forward: identifying least-conflict solar PV
development in California’s San Joaquin Valley. Conservation Biology Institute, Corvallis, Oregon. https://consbio.org/products/reports/path-forward-identifying-least-conflict-solar-pv-development-californias-san-joaquin-valley.
PRISM Group at Oregon State University. 2014. United States 30-Year Normals, 1981 – 2010. The PRISM Group at Oregon State University, Corvallis, Oregon. Geospatial data. http://prism.oregonstate.edu/normals/
Solar Energy Industries Association. 2016. www.seia.org/research-resources/solar-industry-data
University of California Santa Barbara Biogeography Lab (CGAP). 1998. California Gap Analysis Vegetation Layer (Statewide). 1:100,000-1:250,000. University of California, Santa Barbara, CA. Geospatial data. http://www.biogeog.ucsb.edu/projects/gap/gap_home.html
U.S. Department of Agriculture (USDA), National Agricultural Statistics Service (NASS). 2015. USDA, NASS, Research and Development Division, Geospatial Information Branch, Spatial Analysis Research Section 2014 California Cropland Data Layer, Geospatial data. http://www.nass.usda.gov/research/Cropland/Release/
U.S. Department of Agriculture, Natural Resources Conservation Service (USDA NRCS). 2014. General Soil Map (STATSGO2). Geospatial Data. https://gdg.sc.egov.usda.gov/
U.S. Department of Agriculture, Natural Resources Conservation Service (USDA NRCS). 2015. Gridded Soil Survey Geographic (gSSURGO). Geospatial Data. https://gdg.sc.egov.usda.gov/
U.S. Geological Survey. 2014. National Elevation Dataset (1/3 arc-second). Geospatial data. http://ned.usgs.gov/
Scott phillipS has B.A. and M.A. degrees in Geography from Fresno State University, California. Scott has been with the Endangered Species Recovery Program of California State University, Stanislaus since 1995. He has been using GIS and other analyses to facilitate the conservation of species and natural communities in the San Joaquin Valley of California. Scott also currently holds a full-time faculty appointment in the Geography Department at Clovis Community College, California. (Photographed by Carmen Jimenez Philips).
brian cyphEr holds a B.S. degree in Wildlife Biology, M.S. in Wildlife Management, and a Ph.D. in Zoology. Brian has been conducting research and conservation projects on species and natural communities, primarily in California, since 1990. Although his particular specialty is the ecology and conservation of wild canids, he works with a variety of other animal and plant species as well. Brian currently is a Research Ecologist and Assistant Director with the Endangered Species Recovery Program of California State University, Stanislaus. (Photographed by Ellen Cypher).
Phillips and Cypher • Solar energy and endangered species conflicts.

41
App
endi
x A
. G
eogr
aphi
c In
form
atio
n Sy
stem
(GIS
) mod
el fo
r ass
essi
ng o
verla
p be
twee
n so
lar e
nerg
y po
tent
ial a
nd h
abita
t sui
tabi
lity
for fi
ve a
t-ris
k an
imal
spe
cies
in th
e Sa
n Jo
aqui
n Va
lley,
Cal
iforn
ia.
Western Wildlife 6:29–44 • 2019

42
Appendix B. Soil series and vegetation classifications for historical land cover.
Soil series Vegetation classPrimary classification source N map units
Aiken loam Grassland Soil description 11Aiken stony loam Grassland Soil description 25Alamo clay adobe Grassland Soil description 45Altamont adobe soils Grassland Soil description 33Altamont and Diablo loam and clay loam, undifferentiated Grassland Soil description 2Altamont loam and clay loam Grassland Soil/climate 165
Arid grassland Soil/climate 3Altamont sandy loam Grassland Soil/climate 42
Arid grassland Soil/climate 2Antioch loam and clay loam Arid grassland Soil/climate 17
Grassland Soil/climate 4Arnold sandy loam Arid grassland Soil/climate 3Capay and Merced clay, undifferentiated Alkali sink Soil description 2Chino and Foster loam, undifferentiated Wetland Secondary sources 43
Alkali sink Secondary sources 1Desert scrub Secondary sources 1
Corning and Pleasanton loam, undifferentiated Grassland Soil/climate 5Arid grassland Soil/climate 1
Cuyama sandy loam and loam Grassland Soil/climate 7Arid grassland Soil/climate 2
Delano loam Arid grassland Soil/climate 14Grassland Soil/climate 1
Delano sand and sandy loam Arid grassland Soil/climate 21Grassland Soil/climate 6
Diablo adobe soils Vernal pool grassland Soil description 30Dublin adobe soils Grassland Soil description 20Dublin and Yolo loam and clay loam, undifferentiated Grassland Soil description 1Ducor loam Grassland Soil description 1Foster sandy loam Valley oak Secondary sources 29
Alkali sink Secondary sources 4Fresno and Merced loam, undifferentiated Alkali sink Soil description 8Fresno clay loam Alkali sink Soil description 1Fresno clay loam, dark phase Alkali sink Soil description 4Fresno clay loam, light phase Alkali sink Soil description 14Fresno fine sandy loam, dark phase Grassland Soil description 72Fresno fine sandy loam, light phase Alkali sink Soil description 61Fresno loam, dark phase Grassland Secondary sources 48
Alkali sink Secondary sources 1Fresno loam, light phase Alkali sink Soil description 5Fresno sandy loam, heavy phase Grassland Soil description 132Fresno sandy loam, light phase Alkali sink Soil description 40Hanford and Foster sandy loam, undifferentiated Desert scrub Soil description 1Hanford fine sandy loam Riparian Secondary sources 68
Valley oak Secondary sources 45
Phillips and Cypher • Solar energy and endangered species conflicts.

43
Soil series Vegetation classPrimary classification source N map units
Grassland Secondary sources 1Hanford loam Alkali sink Secondary sources 15
Riparian Secondary sources 10Hanford sand Riparian Soil description 67
Desert scrub Secondary sources 7Arid grassland Secondary sources 3
Hanford sandy loam Valley oak Secondary sources 88Grassland Secondary sources 32Desert scrub Secondary sources 11Arid grassland Secondary sources 4Alkali sink Secondary sources 1
Holland loam Grassland Soil description 24Holland sandy loam Valley oak Soil description 34
Grassland Secondary sources/climate 6Arid grassland Secondary sources/climate 1
Holland sandy loam, dark phase Vernal pool grassland Soil description 1Honcut loam Valley oak Secondary sources 2
Grassland Secondary sources 1Kettleman loam and clay loam Arid grassland Soil description 55Kettleman sandy loam Arid grassland Soil description 35Laguna loam and sandy loam Arid grassland Soil description 1Madera and San Joaquin sandy loam, undifferentiated Vernal pool grassland Soil description 22Madera clay loam and clay Vernal pool grassland Soil description 30Madera loam Vernal pool grassland Soil description 78Madera sandy loam Grassland Soil/climate 110
Arid grassland Soil/climate 3Mariposa sandy loam and silt loam Grassland Soil description 8Merced clay loam Wetland Soil description 11Merced loam Wetland Soil description 15Mohave sandy loam Arid grassland Soil description 3Montezuma clay adobe Grassland Soil description 23Muck and Peat Wetland Soil description 3Oakdale sandy loam Grassland Soil description 39Oakley and Fresno sand, undifferentiated Sand dune Soil description 121Oakley and Madera sand, undifferentiated Sand dune Soil description 66Oakley sand Sand dune Soil description 27Olympic adobe soils Grassland Soil description 19Olympic loam Grassland Soil description 14Panoche adobe soils Arid grassland Soil description 2Panoche clay loam Arid grassland Soil description 32Panoche loam Desert scrub Secondary sources 52
Arid grassland Secondary sources 1Grassland Secondary sources 1
Panoche loam and clay loam Arid grassland Soil description 33
Appendix B (continued). Soil series and vegetation classifications for historical land cover.
Western Wildlife 6:29–44 • 2019

44
Soil series Vegetation classPrimary classification source N map units
Panoche sandy loam Desert scrub Soil description 80Placentia loam and sandy loam Grassland Soil description 3Pleasanton and Antioch loam and clay loam, undifferenti-ated Grassland Soil/climate 9
Arid grassland Soil/climate 3Pleasanton loam and sandy loam Arid grassland Soil description 16Pond clay loam Desert scrub Soil description 8Pond loam Desert scrub Soil description 15Pond sandy loam Desert scrub Soil description 7Porterville adobe soils Grassland Soil description 35Redding gravelly loam Vernal pool grassland Soil description 47Riverwash and Tailings Riparian Soil description 4Rough broken land Rock Soil description 64Rough stony land Rock Soil description 113Sacramento clay Water Secondary sources 3
Wetland Secondary sources 1Sacramento clay loam Wetland Soil description 9San Joaquin and Altamont sandy loam, undifferentiated Vernal pool grassland Soil description 6San Joaquin and Madera sandy loam, undifferentiated Vernal pool grassland Soil description 1San Joaquin clay loam and clay Vernal pool grassland Soil description 21San Joaquin loam Vernal pool grassland Soil description 105San Joaquin sandy loam Vernal pool grassland Soil description 105
Arid grassland Secondary sources 1Sierra sandy loam Grassland Soil description 6Stockton adobe soils Grassland Soil description 9Stockton and Fresno soils, undifferentiated Wetland Soil description 1Stockton and Madera soils, undifferentiated Grassland Soil description 5Tulare clay Water Secondary sources 1
Wetland Secondary sources 1Tulare clay loam Wetland Soil description 3Tulare loam Wetland Soil description 3Tulare sandy loam and sand Wetland Soil description 3
Alkali sink Secondary sources 1Water Water Soil description 5Yolo adobe soils Grassland Soil description 17Yolo clay loam Grassland Soil description 26Yolo loam Grassland Soil description 26
Appendix B (continued). Soil series and vegetation classifications for historical land cover.
Phillips and Cypher • Solar energy and endangered species conflicts.

45
Notes
CaliforNia red-legged frog respoNse
to poNd restoratioN
David L. Riensche1, Connor D. Tutino1,2, and Leslie Koenig3,4
1East Bay Regional Park District, 2950 Peralta Oaks Court, Oakland, California 946052California State University, East Bay, 25800 Carlos Bee Boulevard Hayward, California 94542
3Alameda County Resource Conservation District, 3585 Greenville Road Suite 2, Livermore, California 945504Swaim Biological Inc., 4435 First Street PMB 312, Livermore, California 94551
Abstract.—The California Red-legged Frog (Rana draytonii) is federally listed as threatened. Habitat alteration is a significant contributing factor in their decline. Pond restoration and enhancement efforts are tools that can reverse this trend by improving habitat conditions that support recovery goals for the species. We removed excess sediment and emergent vegetation at the Garin Newt Pond Wildlife Area in central California to determine if these actions benefited this species. After sediment removal in 2017, the hydroperiod of the pond improved resulting in California Red-legged Frog egg masses and tadpoles increasing by 99% and 97%, respectively, compared to 2008–2016. We also found significant increases in number of adult and larvae sampled pre-restoration (2008 to 2017) and post-restoration (2018 to 2019). Although only one pond, this site-specific information on California Red-legged Frog response to pond hydroperiod improvements in a central California rangeland may assist recovery efforts designed to preserve and manage habitat for this threatened species.
Key Words.—amphibian breeding; conservation; pond hydroperiod improvements; Rana draytonii
Western Wildlife 6:45–49 • 2019Submitted: 12 July 2019; Accepted: 11 October 2019.
The California Red-legged Frog (Rana draytonii) was once abundant in central California, ranging from the coast to the Sierra Nevada foothills, but is now consid-ered a threatened species (U.S Fish and Wildlife Service [USFWS] 1996). This frog inhabits permanent and sea-sonal water sources (streams, lakes, marshes, natural and human-made ponds, and ephemeral drainages) in valley bottoms and foothills up to 1,500 m in elevation (Bulger et al. 2003; Jennings and Hayes 1994). The terrestrial habitat used by this species generally includes an abun-dance of cover (e.g., burrows, wood debris, and vegeta-tion) in close proximity to water (Fellers and Kleeman 2007; Tatarian 2008; USFWS 2002). Its diet is depen-dent on prey availability, but mostly consists of terrestrial invertebrates (Bishop et al. 2014).
Breeding adult California Red-legged Frogs (Fig. 1) make use of a variety of aquatic habitats, while larvae use streams, deep pools, and the backwater areas of creeks, ponds, marshes and lagoons (Thomson, et al. 2016). Livestock ponds commonly serve as breeding sites when they provide the proper hydroperiod and pond and veg-etative structure (Ford et al. 2013). From November through April, breeding adults may be observed in still or slow-moving water with light to dense riparian or emer-gent vegetation, such as cattails (Typha spp.), tules (Scir-pus spp.) and willows (Salix spp.; Hayes and Jennings 1988). Their egg masses are attached to plants below the surface of the water and hatch after 6–14 d (Jennings and Hayes 1994; Storer 1925). Following hatching, lar-vae undergo metamorphosis within 3.5–7 mo and reach sexual maturity at 2–3 y of age (Thomson et al. 2016; Jennings and Hayes 1994).
The California Red-legged Frogs is the largest native frog in California but has disappeared from over 70% of its historical range (Fisher and Shaffer 1996; Hayes and Jennings 1986). Major factors that have contributed to this decline include habitat loss, habitat fragmenta-tion, and introduction of the invasive American Bull-frog (Lithobates catesbeiana; Hayes and Jennings 1986; Lawler et al.1999). Altered pond sedimentation loading and inundation period are two other leading stressors as-sociated with amphibian declines (Richter et al. 1997).
Restoration efforts aimed at improving the conditions for native species should be judged by how successful wildlife species respond to such attempts (Morrison
Figure 1. California Red-legged Frog (Rana draytonii) from the Garin Regional Park, California. (Photographed by Daniel I. Riensche).

46
Riensche et al. • Response of Rana draytonii to pond restoration.
2002). The benefits of restoration may increase over time due to system stability and generation succession (Rowe and Garcia 2014). After almost a decade (2008–2016) of us observing only the occasional adult Califor-nia Red-legged Frog in the seasonal pond known as the Garin Newt Pond Wildlife Area (GNPWA; managed by the East Bay Regional Park District) with no evidence of reproduction except in the 2017 season, we embarked on an effort to improve the breeding habitat and larvae survival of the species. Here we report on how the Cali-fornia Red-legged Frog responds to improved pond hy-droperiod resulting from the removal of excess sediment and emergent vegetation.
We studied frogs at the GNPWA (37°38'7.02"N, 122°1'28.44"W), which is part of the Garin Regional Park (a wildlands area) located in Hayward, California (Fig. 2). This lentic environment (0.2 ha) is situated be-tween the transition of Oak Woodland, Grassland, and Riparian habitat types. Earning its name from its impor-tance to California Newts (Taricha torosa), Auza (1969) reported that more than 1,600 newts annually traveled 3.2 km (2 mi) or more to breed at the GNPWA. Other wildlife species making use of this seasonal pond area
included: Black-tailed Deer (Odocoileus hemionus), Golden Eagles (Aquila chrysaetos), Western Fence Liz-ards (Sceloporus occidentalis), Pacific Tree Frogs (Pseu-dacris regilla), and California Red-legged Frogs (Cog-swell 1966; Samuel McGinnis, unpubl. report). This site is within the California Red-legged Frog critical habitat unit ALA-1B (USFWS 2010). Due to the seasonal na-ture of the pond, there are no American Bullfrogs found at this site.
We conducted surveys for all life stages of the Califor-nia Red-legged Frog from 2008 to 2019, from January through June, using the standardized habitat assessment and protocol-level survey guidelines (USFWS 2005). Daytime visual encounter surveys for egg masses and adults occurred twice monthly (January through June, ≥ eight visits), with no more than 14 d between visits (we did not conduct nighttime surveys). During these assess-ments, we used binoculars (10 × 42 mm) to search the pond bank, water, floating and emergent vegetation, and woody debris, to sight adult frogs or egg masses.
Due to staffing limitation, from 2008–2019, we con-ducted one survey annually in the pond for the presence of larval amphibians (in early May). Prior to restoration, the
Figure 2. Site map of the Garin Regional Park, Hayward, California, where we conducted a pond restoration project at the Newt Pond Wildlife Area.

47
Western Wildlife 6:45–49 • 2019
GNPWA pond was very shallow (ranging from 0.25–0.5m in depth), choked with Cattails (100% vegetative cover), and did not maintain water throughout the spring (the pond typically dried by mid-to-late June) and supported few adult frogs (Fig. 1). Due to the exceptional rainfall in 2017, when the site received 150% of its normal annual precipitation (https://water.weather.gov/precip/index), this was the only record of larval production in a decade (Fig. 2). In all years, we sampled the pond using D-shaped (ra-dius 23 cm), long-handled dipnets (3.2 mm mesh). Dipnet sweeps consisted of moving a net 1.5 m through represen-tative portions of aquatic features, thus sampling 28 L of larval amphibian habitat per sweep. To minimize distur-bance of pond flora and fauna, we stopped sampling after 10 dipnet sweeps if we found California Red-legged Frog tadpoles. We recorded all life stages of frogs, the number of individuals found, and size classes.
The pond restoration efforts that occurred Septem-ber 2017 included the removal of 199 m3 of sediment and cattails by use of a long-reach excavator, loader, and dump truck. We dredged to improve the hydrope-riod of the pond to make it 1–1.5 m in depth (from early April into mid-May) and to remove upwards of 80% of the vegetative cover (thick stand of cattails that covered 100% of the pond surface area). After dredging, the pond held water into late July and early August in 2018 and 2019. We collected population data preceding and fol-lowing the restoration by using the systematic survey protocols (see above). To compare the reproductive out-put (average number of egg masses and larvae) before (2008–2017) and after (2018–2019) restoration, we used a two-sample t-test with α = 0.05. Since the restoration effort in the fall of 2017, the California Red-legged Frog population at the GNPWA significantly increased in the average number of egg masses (t = ˗5.73 df = 10, P < 0.001) and the average number of larvae (t = ˗6.27, df = 10, P < 0.001; Fig. 3).
Excess emergent vegetation is recognized as creating
detrimental habitat conditions for the reproductive out-put of California Red-legged Frogs because it prevents the surface water from reaching suitable temperatures for larvae development (Norman Scott, pers. comm.). Fur-ther, sediment removal can create greater seasonal pond depth, thus increasing the inundation period during the spring and early summer, and its potential for success-ful native amphibian development. American Bullfrogs tend to inhabit ponds changed in some way by humans and they breed in perennial ponds (D’Amore et al. 2010; Doubledee et al. 2003). Apparently, de-sedimentation and the removal of excessive emergent vegetation in sea-sonal ponds favors the California Red-legged Frog be-cause this species tends to breed and lay its eggs in deep water (Natural Resources Conservation Service 2006; Bradely Shaffer and Robert Fisher, unpubl. report).
To restore a successful breeding population of Califor-nia Red-legged Frogs at the GNPWA, we removed sedi-ment and cattails to increase the overall depth of the pond and lengthened the amount of time water would be held in this seasonal pond, until early summer. Restoration at this one pond increased the number of egg masses and larvae of California Red-legged Frogs over the two-years following this action, suggesting that regular pond main-tenance (sediment and emergent vegetation removal) can be an effective management tool that may benefit this threatened species at similar aquatic sites. Generally, a pond restoration project with the appropriate operations and maintenance has a lifespan of about 20 y (Jackie Charbonneau, pers. comm.).
Such restorative efforts may increase benefits over time because frogs born in a certain pond are likely to remain and have offspring of their own in the same loca-tion. Tatarian (2008) reported that most tagged Califor-nia Red-legged Frogs in her study did not migrate from their source pool over two seasons. Likewise, Feller and Kleeman (2007) reported that only a few of the 123 California Red-legged Frogs studied in Marin County, California, moved farther than the nearest suitable non-breeding habitat. In their study, the furthest distance traveled was 1.4 km and most dispersing frogs moved through grazed pastures to reach the nearest riparian habitat (Feller and Kleeman 2007). Bulger et al. (2003) suggested that breeding sites should take priority in res-toration planning because they will allow the species to recover in population size.
Acknowledgments.—Survey efforts and equipment were largely funded by the Regional Parks Foundation, Alameda County Fish & Wildlife Commission, USFWS Partners for Fish & Wildlife Program, and the California Department of Fish and Wildlife. We would also like to express gratitude to many individuals that contributed to this work: N. Beadle, J. Dorcy, A. Dwyer, J. Geoghe-gan, S. Gidre, T. Groff, N. Hector, S. Lockett, C. New-ell, M. Orcutt, M. Pearson, M. Peixoto, M. Riensche, S. Riensche, D. Riensche, N. Riensche, R. Riensche, B.
Figure 3. Adults, egg masses, and larvae of California Red-legged Frog (Rana draytonii; CRLF) at the Newt Pond Wildlife Area, California, before (2010–2017) and following pond res-toration (2018–2019).

48
Riensche et al. • Response of Rana draytonii to pond restoration.
Singleton, R. Smith, B. Surges, M. Tinoco, and B. Wain-wright. This work was conducted in accordance with the terms and conditions of U.S. Fish and Wildlife Ser-vice permit #TE-817400-12 and the California Depart-ment of Fish and Wildlife permit #SC-2298, California Regional Water Quality Control Board San Francisco Bay Region -CIWQS Reg. Meas. 406893 & CIWQS place ID 825468, USFWS BO Permit No. 08ESMF00-2016-F-2130, VLP Permit No. 2086-2012-001-03, and California Department of Fish and Wildlife-Final Lake or Streambed Alteration Agreement Notification No. 1600-2016-0188-R3.
literature Cited
Auza, B. 1969. Some aspects of the life of the California Newt, Taricha torosa. M.S. Thesis, California State University, Hayward. 98 p.
Bishop, M., R. Drews, and V. Vredenburg. 2014. Food web linkages demonstrate importance of terrestrial prey for the threatened California Red-legged Frog. Journal of Herpetology 48: 137–143.
Bulger, J.B., N.J. Scott, and R.B. Seymour. 2003. Ter-restrial activity and conservation of adult California Red-legged Frogs (Rana aurora draytonii) in coast-al forests and grasslands. Biological Conservation 110:85–95.
Cogswell, H.L. 1966. Garin Woods population densities of breeding birds. Audubon Field Notes 20:633–634.
D’Amore A., V. Hemingway, and K. Wasson. 2010. Do a threatened native amphibian and its invasive conge-ner differ in response to human alteration of the land-scape? Biological Invasions 12:145–154.
Doubledee, R.A., E.B. Muller, and R.M. Nisbet. 2003. Bullfrogs, disturbance regimes, and the persistence of California Red-legged Frogs. Journal of Wildlife Management 67:424–438.
Fellers, G.M., and P.M. Kleeman. 2007. California Red-legged Frog (Rana draytonii) movement and habitat use: implication for conservation. Journal of Herpe-tology 41:276–286.
Fisher, R.N., and H.B. Shaffer. 1996. The decline of am-phibians in California’s Great Central Valley. Conser-vation Biology 10:1387–1397.
Ford, L.D., P.A. Van Hoorn, D.R. Rao, N.J. Scott, P.C. Trenham, and J.W. Bartolome. 2013. Managing Rangelands to Benefit California Red-legged Frogs and California Tiger Salamanders. Alameda County Resource Conservation District, Livermore, Califor-nia. 68 p.
Hayes, M.P., and M.R. Jennings. 1986. Decline of ranid frog species in western North America: are Bullfrogs (Rana catesbeiana) responsible? Journal of Herpetol-ogy 20:490–509.
Hayes, M.P., and M.R. Jennings. 1988. Habitat corre-lates of distribution of the California Red-legged Frog (Rana aurora draytonii) and the Foothill Yellow-
legged Frog (Rana boylii): implications for manage-ment. Pp. 144–158 In Proceedings of the Symposium on the Management of Amphibian, Reptiles and Small Mammals in North America. Szaro, R.C., K.E. Sever-son, and D.R. Patton (Tech. Coord.). General Techni-cal Report (GTR0-166), U.S. Department of Agricul-ture, Forest Service, Fort Collins, Colorado.
Jennings, M.R., and M.P. Hayes. 1994. Amphibian and reptile species of special concern in California. Cali-fornia Department of Fish and Game, Sacramento, California. 255 p.
Lawler, S.P., D. Dritz, T. Strange, and M. Holyoak 1999. Effects of introduced Mosquitofish and Bull Frogs on the threatened California Red-legged Frog. Conserva-tion Biology 13:613–622.
Morrison, M.L. 2002. Wildlife Restoration: Techniques for Habitat Analysis and Animal Monitoring. Island Press, Washington, D.C.
Natural Resources Conservation Service (NRCS). 2006. Draft pond restoration design and plan per practice re-quirements 643 (Restoration and management of de-clining habitats) and 378 (Pond). Natural Resources Conservation Service, Livermore, California. 8 p.
Richter, B.D., D.P. Braun, M.A. Mendelson, and L.L. Master. 1997. Threats to imperiled freshwater fauna. Conservation Biology 11:1081–1093.
Rowe, J.C., and T.S. Garcia. 2014. Impacts of wetland restoration efforts on an amphibian assemblage in a multi-invader community. Wetlands 34:141–153.
Storer, T.I. 1925. A Synopsis of the Amphibia of Cali-fornia. University of California Press, Berkeley, Cali-fornia.
Tatarian, P.J. 2008. Movement patterns of California Red-legged Frogs (Rana draytonii) in an inland Cali-fornia environment. Herpetological Conservation and Biology 3:155–169.
Thomson, R.C., A.N. Wright, H.B. Shaffer. 2016. Cali-fornia Amphibian and Reptile Species of Special Con-cern. University of California Press, Oakland, Cali-fornia.
U.S. Fish and Wildlife Service (USFWS). 1996. Endan-gered and threatened wildlife and plants: determina-tion of threatened status for the California Red-legged Frog. Federal Register 61:25813–25833
U.S. Fish and Wildlife Service (USFWS). 2002. Recov-ery plan for the California Red-legged Frog (Rana au-rora draytonii). U.S. Fish and Wildlife Service, Port-land, Oregon. 173 p.
U.S. Fish and Wildlife Service (USFWS). 2005. Revised guidance on site assessments and field surveys for the California Red-legged Frog. U.S Fish and Wildlife Service, Sacramento, California. 25 p.
U.S. Fish and Wildlife Service (USFWS). 2010. En-dangered and threatened wildlife and plants; revised designation of critical habitat for the California Red-legged Frog; Final Rule. Federal Register 75:12816–12959.

49
Western Wildlife 6:45–49 • 2019
david l. rieNsChe is a Certified Wildlife Biologist and a Wildlife Biologist for the East Bay Regional Park Dis-trict, California, where he has worked for 31 y. For over 21 y, he has been a member of the Biology Department faculty at Las Positas College, where he teaches courses in Biology, Ecology, Vertebrate Natural History and Field Biology. He is a recipient of The National Association for Interpretation (Region 9) - Outstanding Field Naturalist Award. David holds advanced degrees in both Natural Resource Management and Environmental Education, and has an undergraduate degree in Biology (Wildlife). (Photographed by Sarah K. Riensche).
CoNNor d. tutiNo earned his Bachelor of Science from California State University, East Bay, in 2019. He worked as a Wildlife Intern for the East Bay Regional Park District in 2018 and 2019. During this time, he gained experience working with California Red-legged Frogs, Bald Eagles (Haliaeetus leucocephalus), West-ern Snowy Plovers (Charadrius alexandrines nivosus), and California Least Terns (Sterna antillarum browni). (Photographed by David L. Riensche).
leslie KoeNig is a Senior Wildlife Biologist with Swaim Biological, Incorporated, a small, woman-owned consulting firm based out of Livermore, California. Leslie has over 10 y of biological experience in both public and private sectors. Her background in conservation biology focuses on special-status species management with an emphasis in permitting and restoration of habitats that support amphibians, birds, reptiles, and local mammals. She has extensive experience managing restoration projects with a strong knowledge of state and federal environmental policies and permitting processes. Leslie has overseen more than 30 livestock pond res-toration projects in Alameda and Contra Costa counties that support listed amphibian species and many other wildlife. (Photographed by Ashley Estacio).

50
Wildlife Mortalities in open-topped pipes in Central California
Michelle harris1,3, BarBara clucas1,4, Jenna stanek2,3, and Mary Whitfield3
1Department of Wildlife, Humboldt State University, 1 Harpst Street, Arcata, California 95521, USA2Environmental Stewardship Group, Los Alamos National Laboratory, MS J978, Los Alamos, New Mexico 87545, USA
3Southern Sierra Research Station, 7872 Fay Ranch Road, Weldon, California 93283, USA4Corresponding author, e-mail: [email protected]
Abstract.—Nearly 20 billion birds are killed in the United States each year by a number of anthropogenic causes, but a lesser known threat is open-topped pipes. Open-topped pipes are prevalent across the landscape, as they are used for a multitude of purposes including agriculture, mining, and infrastructure. Birds, herptiles, and small mammals can be attracted to the pipes as sites for nesting or shelter but they soon can become trapped by the smooth interior and small diameter. Cavity-nesting birds are the most likely animals to enter these pipes, potentially due to competition over a decreasing number of tree cavities in their natural habitat. We inspected pipes in several areas in central California including the South Fork Kern River Valley, Ridgecrest, and Fresno. The main goal of this study was to document the prevalence and predominant taxa comprising the wildlife mortalities in pipes, while also examining the influence of pipe dimensions and adjacent landscape types. We found 13.3% of pipes studied caused mortality: the majority of those mortalities were birds and significantly more deaths were in desert landscapes. The results of this study reveal the need for future research and pipe alteration projects to prevent further mortalities, especially in high priority desert shrubland areas.
Key Words.—birds; cavity-nesting; mortality; desert shrubland; herptiles; mining claim posts; mammals; PVC pipes.
Western Wildlife 6:50–60 • 2019Submitted: 3 July 2019; Accepted: 16 October 2019.
introduCtion
It is estimated that up to 20 billion birds are killed in the United States each year due to direct anthropogenic causes, including collisions with vehicles and various manmade structures, poisoning by oil spills and other contaminants, and predation by domestic cats (Loss et al. 2012, 2015). A lesser-known threat to birds are hollow metal or PVC (polyvinyl chloride) pipes or posts, which have the potential to kill a large number of birds annually (Ogden 2013; American Bird Conservancy 2016; Malo et al. 2016). Open-topped pipes, found on farms, ranches, oil production facilities, construction sites, residential areas, and rooftops, serve a variety of purposes including fencing, irrigation, plumbing, ventilation, and mining claim markers. Birds, small mammals, and reptiles enter the pipes to nest or find shelter, but the smooth interior and tight confines of the pipes prevent individuals from escaping, leading to a slow death by stress, dehydration, or starvation (Brattstrom 1995; Hathcock et al. 2014; Malo et al. 2016; Peter Bradley and Jason Williams, unpubl. report). In 2017, the Bureau of Land Management (BLM) estimated that there were 3.6 million mining claims (each with four or more markers) in the western United States, with Nevada having about a third of the claims (1.1 million; Bureau of Land Management [BLM]. 2018. Public Land Statistics 2017. Available from https://www.blm.gov/about/data/public-land-statistics. [Accessed 22 March 2019]). Previously these markers were often made of wood, but in the 1970s they started being replaced by PVC pipes, which were typically hollow and open-topped with about a 10-cm diameter opening (Wilshire et al. 2008). These mining claim markers and other open-topped pipes present a potentially large scale and wide ranging threat to birds in the western United States.
The Nevada Department of Wildlife (NDOW) conducted one of the first studies on bird mortalities in open-topped mining claim markers (Peter Bradley and Jason Williams, unpubl. report). The study began in 1986 after a local chapter of the Sierra Club reported that Mountain Bluebirds (Sialia currucoides) were found trapped in mining claim markers. NDOW biologists found 914 dead birds representing 33 species in 7,058 posts in northeast Nevada and estimated that there were 13 dead birds per 100 posts (Peter Bradley and Jason Williams, unpubl. report).
California had an estimated 320,617 mining claims (BLM, op. cited) in 2017, which could total to an estimated 1.2 million potential open-topped markers. The issue was first addressed in California in 1990 by LaPre (1990), who reported that 262 dead birds and lizards were found in 820 mining claim posts in the Eastern Mojave National Scenic Area. This study prompted the BLM in California to conduct their own survey of 750 mining claim markers and they found 25% had dead birds and lizards (unpubl. report). Subsequently, California passed legislation that required using solid metal or wooden posts or mounds of stone when marking mines (State of California 1991; Baicich 2012); however, open-topped pipes can still be found in California (e.g., mining claims placed prior to 1991) or pipes that are used for other purposes (irrigation vent pipes, fence posts, rooftop vent pipes).
Across news articles and Audubon newsletters, the prevalence of bird mortalities in open-topped pipes were reported as being quite substantial, although variable. Compared to the news media and gray literature, peer-reviewed scientific research documenting wildlife mortality in open-topped pipes in North America is limited. One of the few studies published was conducted in the mountains of eastern San Bernardino County in California (Brattstrom 1995). In this study,

51
Harris et al. • Wildlife mortalities in open-topped pipes.
140 PVC mining claim posts were searched and found to contain the carcasses of birds (19%), lizards (28%), and mammals (4%). Another study, in north central New Mexico on the Los Alamos National Laboratory property, searched open bollard pipes and open pipes on gates and found 19.6% of the 188 pipes had dead birds (Hathcock and Fair 2014). Similar to the study conducted by the NDOW (Peter Bradley and Jason Williams, unpubl. report), both Brattstrom (1995) and Hathcock and Fair (2014) found that a large majority of the dead birds identified in pipes were native cavity-nesting songbirds: Mountain Bluebirds in Nevada, Ash-throated Flycatchers (Myiarchus cinerascens) and Cactus Wrens (Campylorhynchus brunneicapillus) in California, and Western Bluebirds (Sialia mexicana) in New Mexico.
The habitat surrounding open-topped pipes are likely to influence the diversity and abundance of species that are attracted and trapped. Tree cavity shortages limit the numbers of hole-nesting birds an area can support, as several species can compete to use the same sites (Newton 1994). Lower habitat quality and increased competition can drive cavity-nesting birds to occupy manmade holes. In the case of nest boxes, Mänd et al. (2005) found a greater occupancy of nest boxes placed near deciduous habitat where a higher number of cavity-nesting species existed, compared to nest boxes placed near less diverse coniferous habitat. In some cavity nesting species such as bluebirds (Sialia spp.), use of artificial cavities is most frequent in areas with perches, wooded pastures, high grass and shrub availability, and sparse ground cover (Munro and Rounds 1985; Hsu and Humpert 1988).
We documented wildlife mortalities in various types of open-topped pipes in several areas in central California: the Kern River Valley, Ridgecrest, and Fresno and King counties. The objective of this study was to quantify the prevalence of wildlife mortalities in open-topped pipes in central California to add to the more extensive work done in Nevada. We examined how several factors may have influenced the prevalence of mortalities in pipes including: (1) taxonomic group (birds, herptiles and mammals); (2) pipe dimensions (height and diameter); and (3) surrounding habitat type (orchard, agriculture, riparian or desert). The results of this study will add to the understanding of the potential threat that open-topped pipes pose to wildlife.
Methods
Study site. —We conducted this study in four areas in central California (Fig. 1). The first area was in the South Fork Kern River Valley on the lands adjacent to Audubon’s Kern River Preserve (35.6690N, 118.3050W), California Department of Fish and Wildlife Canebrake Ecological Reserve, and the South Fork Wildlife Area of the U.S. Forest Service. This area encompasses approximately 20 km of contiguous riparian forest (Fig. 1). Kern River Preserve employees have covered most
of the open-topped pipes on the preserve itself (unpubl. report), but the surrounding grazing pasture upstream of the Kern River Preserve, and the adjoining South Fork Wildlife Area remained undocumented. The South Fork Kern River Valley is 16 km long and 800 m in elevation and is located at the southern end of the Sierra Nevada, and has been designated as an important area for birds (National Audubon Society [NAS]. 2017. Important bird areas: South Fork Kern River Valley. NAS. Available from https://www.audubon.org/important-bird-areas/south-fork-kern-river-valley. [Accessed 26 November 2017]). The riparian habitat in the SFWA is composed of Fremont Cottonwoods (Populus fremontii), Red Willows (Salix laevigata), and Goodding’s Black Willow (Salix gooddingii) as the canopy, and Coyote Willow (Salix exigua), Mule Fat (Baccharis salicifolia), Stinging Nettle (Urtica dioica holosericea), Mugwort (Artemesia douglasiana), and a variety of grasses and forbs as the understory (Whitfield et al. 1999). The forest is intermixed with freshwater marshes characterized by cattails (Typha spp.) and tules (Scirpus spp.; Whitfield et al. 1999). The area supports a diverse range of wildlife species that are potentially at risk of entrapment in pipes, including several small rodents (e.g., Peromyscus sp.), fence lizards (Sceloporus sp.), and over 339 birds (Hewett 1984). A number of cavity-nesting birds exist in the area, such as flycatchers, bluebirds, woodpeckers, swallows, chickadees, wrens, kestrels, and owls.
In addition to the South Fork Kern River Valley, we inspected pipes in nearby areas with similar landscapes and characteristics, including near Ridgecrest (35.9749N, 117.3540W) within Kern County and Sanger (36.7080N, 119.5560W) within Fresno County, and near Riverdale (36.3008N, 119.7829W) within Kings County (Fig. 1). We examined mining claim markers on BLM land north of Ridgecrest and west of the China Lake Naval Air Weapons Station. The area is situated at the edge of the Mojave Desert and the foothills of the Sierra Nevada and is characterized as high desert shrubland with rocky hills. We found pipes near Riverdale that were situated in agricultural fields and in small, neighborhood orchards and vineyards in Sanger. These two cities lie within the San Joaquin Valley and have relatively flat landscapes. Their semi-arid climates include hot, dry summers and mild, rainy winters (Tucker 2013). A number of cavity nesting birds, as well as small mammals, reptiles, and amphibians inhabit these areas.
Data collection. —We collected data from the middle of May through August 2017. We conducted weekly roadside surveys in search of pipes. We planned the general survey locations in advance to contact any known landowners for permission to access their properties. When a pipe was spotted, we pulled over and initially documented what the pipe was being used for, assigned it a number, and used a GPS unit (Garmin GPSMAP 76CSx, Garmin Ltd., Olathe, Kansas) to mark location

52
Western Wildlife 6:50–60 • 2019
coordinates. We checked an average of 41 pipes during a full day of search effort. Most pipes were gate markers or fence posts, but we also surveyed irrigation pipes, livestock corrals, signposts, BLM mining claim markers, and lone pipes that appeared to serve no function. Of the 295 pipes inspected, 256 (87%) pipes were made of metal and only 39 (13%) were of plastic material.
We documented several factors about each pipe and its location in order to assess how they might affect wildlife mortalities. The diameter and length of each pipe were measured with a measuring tape (length was taken from the ground to the top of the pipe that was above ground and thus did not include the portion below ground) and classified position as upright, horizontal, or leaning. The majority of the pipes were positioned upright (277) with only 12 leaning and six horizontal; therefore, we did not include this characteristic in our analyses. We also described the habitat and vegetation components surrounding each pipe based on general visual observations, noting whether the pipe was near roads, buildings, cow pastures, forests, or orchards and then used this information to categorize each pipe into a habitat type category.
The contents of each pipe were searched for any signs of wildlife, dead or alive, using a 700+ lumen flashlight. The flashlight allowed us to identify the presence or absence of an animal, as well as categorize what taxa it belonged to and the number of individuals inside of a single pipe. The presence of trash and debris was also noted, as this could potentially affect our ability to
accurately estimate taxa or number of individuals.Data analysis.—Because we did not necessarily
predict a linear relationship of pipe diameter and height with wildlife mortality, we grouped the data by pipe diameter and height into interval categories depending on the range of values obtained. We expected that the pipe frequencies would not be equal across categories, but we tried to make it so that each category contained an adequate number of pipes so a pattern of wildlife mortality could be detected during analyses. We ended up using three diameter intervals of 2.5–8.33 cm (small), 8.34–14.16 cm (intermediate), and ≥ 14.17 cm (large), and the numbers of pipes that fell within each category were fairly equal (Table 1). The height variable, however, was more uniform (most pipes were 120–160 cm tall), therefore we only split height into two categories, 12.7–120.9 cm (short) and 121.0 cm and taller (tall); and there were far fewer pipes in the short height category than the tall category (Table 2).
In addition, we grouped the habitat descriptions into landcover categories using available types within the study areas. These categories included: urban, agriculture, orchard, riparian/temperate forest, and desert shrubland; however, only two pipes could be classified as urban, so that category was removed from the analysis. We defined agriculture as a crop field, cow pasture, or otherwise open, grassy area. An orchard contained uniform rows of trees or vineyards. We defined riparian/temperate forest by groupings of trees > 5 m tall, an understory of shrubs or saplings, and possible water bodies. Desert shrubland
figure 1. The locations of the pipes checked May-August 2017 in the Kern River Valley and Ridgecrest in Kern County, Sanger in Fresno County, and near Riverdale in Kings County, California, representing those empty and those with wildlife mortalities.
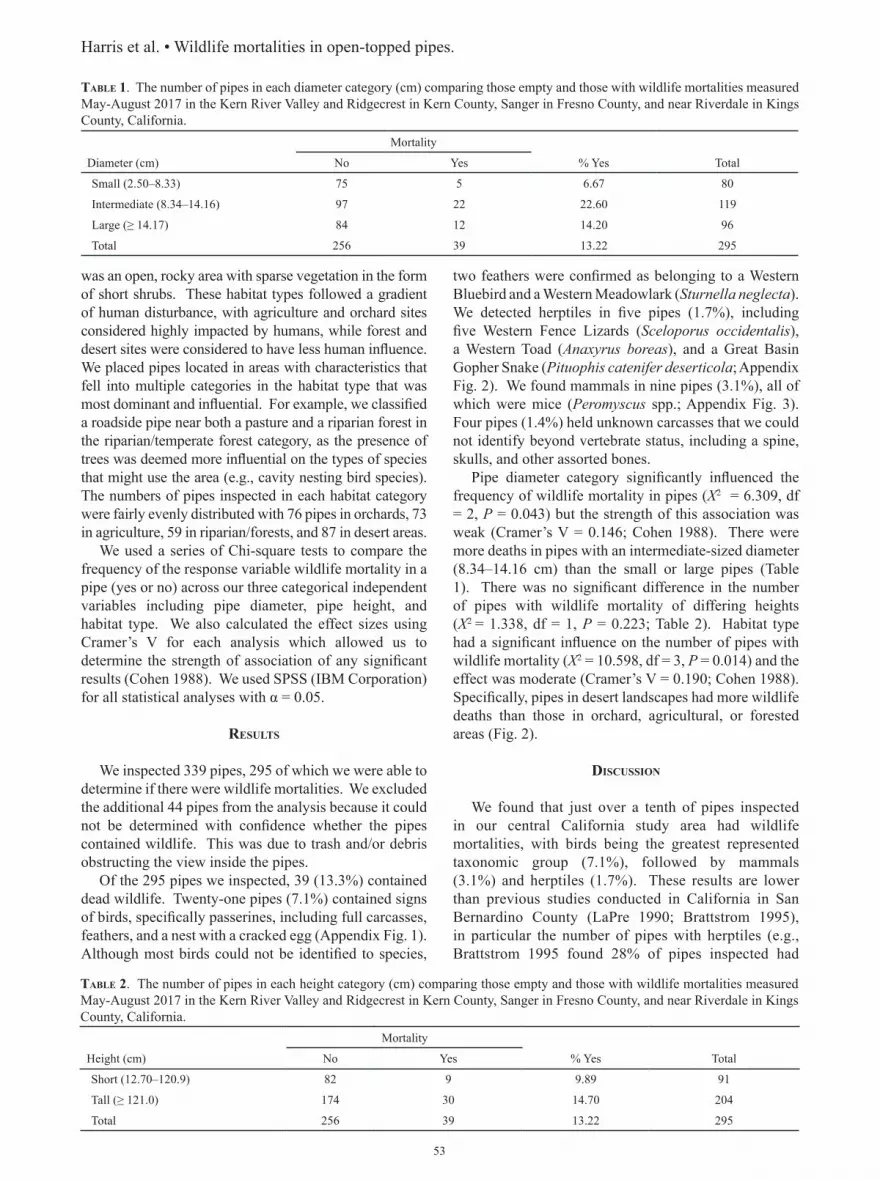
53
Harris et al. • Wildlife mortalities in open-topped pipes.
was an open, rocky area with sparse vegetation in the form of short shrubs. These habitat types followed a gradient of human disturbance, with agriculture and orchard sites considered highly impacted by humans, while forest and desert sites were considered to have less human influence. We placed pipes located in areas with characteristics that fell into multiple categories in the habitat type that was most dominant and influential. For example, we classified a roadside pipe near both a pasture and a riparian forest in the riparian/temperate forest category, as the presence of trees was deemed more influential on the types of species that might use the area (e.g., cavity nesting bird species). The numbers of pipes inspected in each habitat category were fairly evenly distributed with 76 pipes in orchards, 73 in agriculture, 59 in riparian/forests, and 87 in desert areas.
We used a series of Chi-square tests to compare the frequency of the response variable wildlife mortality in a pipe (yes or no) across our three categorical independent variables including pipe diameter, pipe height, and habitat type. We also calculated the effect sizes using Cramer’s V for each analysis which allowed us to determine the strength of association of any significant results (Cohen 1988). We used SPSS (IBM Corporation) for all statistical analyses with α = 0.05.
results
We inspected 339 pipes, 295 of which we were able to determine if there were wildlife mortalities. We excluded the additional 44 pipes from the analysis because it could not be determined with confidence whether the pipes contained wildlife. This was due to trash and/or debris obstructing the view inside the pipes.
Of the 295 pipes we inspected, 39 (13.3%) contained dead wildlife. Twenty-one pipes (7.1%) contained signs of birds, specifically passerines, including full carcasses, feathers, and a nest with a cracked egg (Appendix Fig. 1). Although most birds could not be identified to species,
two feathers were confirmed as belonging to a Western Bluebird and a Western Meadowlark (Sturnella neglecta). We detected herptiles in five pipes (1.7%), including five Western Fence Lizards (Sceloporus occidentalis), a Western Toad (Anaxyrus boreas), and a Great Basin Gopher Snake (Pituophis catenifer deserticola; Appendix Fig. 2). We found mammals in nine pipes (3.1%), all of which were mice (Peromyscus spp.; Appendix Fig. 3). Four pipes (1.4%) held unknown carcasses that we could not identify beyond vertebrate status, including a spine, skulls, and other assorted bones.
Pipe diameter category significantly influenced the frequency of wildlife mortality in pipes (Χ2 = 6.309, df = 2, P = 0.043) but the strength of this association was weak (Cramer’s V = 0.146; Cohen 1988). There were more deaths in pipes with an intermediate-sized diameter (8.34–14.16 cm) than the small or large pipes (Table 1). There was no significant difference in the number of pipes with wildlife mortality of differing heights (Χ2 = 1.338, df = 1, P = 0.223; Table 2). Habitat type had a significant influence on the number of pipes with wildlife mortality (Χ2 = 10.598, df = 3, P = 0.014) and the effect was moderate (Cramer’s V = 0.190; Cohen 1988). Specifically, pipes in desert landscapes had more wildlife deaths than those in orchard, agricultural, or forested areas (Fig. 2).
disCussion
We found that just over a tenth of pipes inspected in our central California study area had wildlife mortalities, with birds being the greatest represented taxonomic group (7.1%), followed by mammals (3.1%) and herptiles (1.7%). These results are lower than previous studies conducted in California in San Bernardino County (LaPre 1990; Brattstrom 1995), in particular the number of pipes with herptiles (e.g., Brattstrom 1995 found 28% of pipes inspected had
Diameter (cm)
Mortality
TotalNo Yes % Yes
Small (2.50–8.33) 75 5 6.67 80
Intermediate (8.34–14.16) 97 22 22.60 119
Large (≥ 14.17) 84 12 14.20 96
Total 256 39 13.22 295
table 1. The number of pipes in each diameter category (cm) comparing those empty and those with wildlife mortalities measured May-August 2017 in the Kern River Valley and Ridgecrest in Kern County, Sanger in Fresno County, and near Riverdale in Kings County, California.
Height (cm)
Mortality
TotalNo Yes % Yes
Short (12.70–120.9) 82 9 9.89 91
Tall (≥ 121.0) 174 30 14.70 204
Total 256 39 13.22 295
table 2. The number of pipes in each height category (cm) comparing those empty and those with wildlife mortalities measured May-August 2017 in the Kern River Valley and Ridgecrest in Kern County, Sanger in Fresno County, and near Riverdale in Kings County, California.

54
lizards). This difference may be due to differences in habitat types as well as distribution and abundance of species in Kern, Kings, and Fresno counties compared to San Bernardino.
We found differences in habitat types in our study with the largest proportion of wildlife deaths in the pipes found in the desert shrubland landscape type, which may in part be explained by the observed scarce vegetation and therefore potential lack of natural cavities in those areas. Orchards and riparian/temperate forests provide trees for nesting and roosting that may be preferred over man-made holes. Agricultural areas are similarly open landscapes with a lack of trees and natural cavities or shelter, but desert shrubland represents a more natural habitat type and may have more native species. In contrast, the Nevada Department of Wildlife found a positive relationship between the distances to Pinon-Juniper Woodlands with bird mortality in open-topped pipes; however, mortalities were also found in Sagebrush Steppe and Salt Desert Shrub landcover (Peter Bradley and Jason Williams, unpubl. report). It is likely that across species these relationships will vary as some species will prefer to use natural areas, whereas others may also use disturbed areas and perhaps even expand into disturbed areas because of human structures (e.g., Dunning and Bowers 1990) and in some cases can benefit from new nesting structures (Morelli et al. 2014). We did not systematically survey the presence of natural cavities across our sites in this study, and thus cannot quantify what options were available for cavity nesting birds; however, future studies should consider this variable to test if entrapment in pipes is greater in areas with fewer natural cavities.
The structure, dimensions, and type of some pipes may be more hazardous for certain wildlife species than others. Overall, we found that intermediate-sized diameter (8.34–14.16 cm) pipes were more likely to have wildlife mortalities. This may simply be due to easier access; however, it was more difficult to clearly see to the bottom of pipes with smaller diameters so this may have
also played a role in this relationship. For mammals, we found that four of the nine pipes we inspected that caused mice mortalities were irrigation pipes dispersed throughout a Sequoia National Forest campsite. We found the remains of several mice in each individual pipe, along with a western toad and a bird. We did not find a distinct pattern for herptiles, but Brattstrom (1995) found all pipes with lizards were perforated posts. Although we only examined very few horizontal pipes, one could predict that wildlife may have an easier time escaping compared to vertical pipes. Nevertheless, Brattstrom (1995) discovered a dead Desert Cottontail (Sylvilagus audubonii) in a post laying on the ground, and an Audubon employee found over 200 birds in a fallen irrigation standpipe on the Kern River Preserve (Audubon, unpubl. report), but in the latter case the pipe was previously upright.
The areas with the most mortalities for wildlife in our study was located on BLM land near Ridgecrest, where six out of 11 pipes (54.5%) contained at least one bird. These pipes were previously used as mining claim markers and were dispersed along the crest of a rocky hill far from any urban structures. A BLM employee estimated that at least half of the several dozen mining claim markers he had capped in the surrounding area contained dead birds (Robert Enriquez, pers. comm.). Nationwide, BLM registered 3.6 million mining claims in 2017 (BLM 2018, op. cited), which could represent millions of death traps for wildlife. Moreover, mining claim markers are only a small subset of the open-topped pipes used for a variety of other purposes. Comparing the extent of mortality across pipes of different uses and structures, such as mining claim markers, gate markers, vent pipes on buildings and irrigation pipes, would be interesting for a future study.
This study was limited to presence or absence of wildlife mortalities in pipes because pipes were inspected with a flashlight and contents were not removed. We were only able to count the actual number of individuals within a few pipes, so it is unknown if pipes contained one or more individuals. The data likely underestimate the number of pipes with wildlife mortalities, as well. Even though pipes obscured by trash and debris were removed from the analysis, we could have easily overlooked carcasses in seemingly empty pipes. Hathcock and Fair (2014) also used a flashlight to inspect bollards and gate markers except for the few that were removable. Their findings were fairly similar, with positive detections in 11% of gate markers and 27% of bollards. Malo et al. (2016) were much more thorough when investigating uncapped tubular poles along the Madrid-Levante high-speed railway line in central Spain. They examined poles using flashlights and a borescope and extracted carcasses with wire hooks that were later identified. Their findings were significantly higher, with one or more bird remains found in 70 out of 96 poles (72.9%) for a total of 162 carcasses.
Western Wildlife 6:50–60 • 2019
figure 2. The percentage of pipes with wildlife mortalities in four habitat types observed May-August 2017 in the Kern River Valley and Ridgecrest in Kern County, Sanger in Fresno County, and near Riverdale in Kings County, California. The total number of pipes inspected in each habitat were 73 in agriculture, 76 in orchard, 59 in forest/riparian, and 87 in desert.

55
Solutions for decreasing open-topped pipe mortalities include filling, crimping, capping, or removing unused pipes, which for mining claim markers in California and Nevada is now required by law (State of California 1991; State of Nevada 2009). In the case of PVC pipes used for mining claims, capping pipes with plastic caps has been shown to not be effective as they are often not monitored once installed and often fall off due to desert weather wear (Peter Bradley and Jason Williams, unpubl. report). Removal of unused pipes or replacing them with other mine markers (wooden posts or rock piles) is obviously the most effective permanent solution. Taking into account labor and material costs, capping existing poles in the field is much more costly than sealing them in the factory in the first place (Malo et al. 2016) or using alternatives that are not open-topped. Solutions for other types of open-topped pipes vary and include securing metal caps for chain link fence posts, filling pipes that cannot be removed with sand or concrete, and covering rooftop and heating vents with galvanized hardware cloth held in place by stainless steel pipe clamps or gutter guard leaf filters (Southern Sierra Research Station. Avian Mortality Epidemic - Death Pipes. Available from http://www.southernsierraresearch.org/Information/DeathPipes/ [Accessed 26 November 2017]). Nevertheless, pipes may still need to be monitored, as installments such as hardware cloth can fall off. One specialized solution that appears very effective has been developed to reduce the entrapment of raptor and other bird species in vault toilets (e.g., pit toilets; Teton Raptor Center. Poo-poo Project. https://tetonraptorcenter.org/our-work/poo-poo-project/ [Accessed 13 December 2017]). Raptors enter the vault toilets through ventilation pipes and the Teton Raptor Center created a stainless-steel screen that secures to the top of the pipe, preventing entry by birds while allowing for ventilation. With the increasing awareness of the issue and solutions being implemented, future research will be able to test the long-term effectiveness of these variety of solutions.
Our study provides insight into the severity of bird and wildlife mortality caused by open-topped pipes in central California. The extent to which these pipes are having a population level effect is unknown (Loss et al. 2015), but the presence of open-topped pipes in areas where threatened or endangered wildlife exists could be of conservation concern. This issue can be invisible to the general public, as wildlife trapped in pipes die completely unnoticed in these hidden locations compared to birds colliding with windows or dead animals brought home by cats. Raising awareness is vital, and a larger dataset of mortalities could attract funding for projects to remove unused pipes and securely close off others. Quantifying the number of potentially threatening pipes that exist would also shed light on the scope of this issue and garner support. Furthermore, open-topped pipes are not the only source of entrapment, as several other human-made structures endanger wildlife such as
uncovered trenches dug into the ground (Germano et al. 1993, Germano 1995, Simpson et al. 2011) and oil pits (U.S. Fish and Wildlife Service 2013). Collaboration across federal, state and local natural resource agencies, agricultural workers, landowners, and the public is necessary for successful solutions and preventative measures to be implemented to lessen the impacts of wildlife entrapment and mortality.
Acknowledgments.—This study was initiated due to the previous work conducted by Jeff King and Sean Rowe at the Kern River Preserve of Audubon California, which helped raised awareness of the dangers of open-topped pipes to wildlife. We also appreciate advice received from Chuck Hathcock regarding his own study on open-topped pipes. We would like to thank Bruce Hafenfeld and Reed Tollefson for permission to inspect pipes on their properties, as well as Robert Enriquez for leading us to mining claim markers on Bureau of Land Management (BLM) land. We would also like to thank Ana Davidson, Leigh Douglas, Chad Moura, Molly Parren, and Trinity Smith for helpful suggestions on a previous version of this manuscript, and Christy Klinger and MacKenzie Jeffress for providing an internal Nevada Department of Wildlife (NDOW) report.
literature Cited
American Bird Conservancy. 2016. BLM targets open pipes and mining claim markers to reduce bird deaths. Inside Bird Conservation March:1–5.
Baicich, P.J. 2012 Killer pipes threatening bird in the west. Bird Watchers Digest July/August:47–51.
Brattstrom, B.H. 1995. Wildlife mortalities in PVC claim posts. Wildlife Society Bulletin 23:765–766.
Cohen, J. 1988. Statistical Power Analysis for the Behavioral Sciences. 2nd Edition. Lawrence Earlbaum Associates, Hillsdale, New Jersey.
Dunning, J.B., and R.K. Bowers. 1990. Lethal temperatures in Ash-throated Flycatcher nests located in metal fence poles. Journal of Field Ornithology 61:98–103.
Germano, D.J. 1995. Waterfowl blinds in the San Joaquin Valley: death traps for endangered species. Transactions of the Western Section of The Wildlife Society 31:33–35.
Germano, D.J., E. Cypher, and R. McCormick. 1993. Use of a barrier to exclude Blunt-nosed Leopard Lizards from a construction zone. Transactions of the Western Section of The Wildlife Society 29:16–19.
Hathcock, C.D., and J.M. Fair. 2014. Hazards to birds from open metal pipes. Western North American Naturalist 74:228–230.
Hewett, R.P. 1984. A management strategy for the Kern River Preserve, California. Pp. 962–964 In California Riparian Systems: Ecology, Conservation, and Productive Management. Warner, R.E., and
Harris et al. • Wildlife mortalities in open-topped pipes.

56
K.M. Hendrix (Eds.). University of California Press, Berkley, California.
Hsu, M., and M.J. Humpert. 1988. Use of artificial nest cavities along Ohio interstate highways by Bluebirds (Sialia sialis) and mice (Peromyscus sp.). Ohio Journal of Science 88:151–154.
LaPre, L. 1990. Mining claim markers as deathtraps for small animals. Western Meadowlark 41:1–3.
Loss, S.R., T. Will, and P.P. Marra. 2012. Direct human-caused mortality of birds: improving quantification of magnitude and assessment of population impact. Frontiers in Ecology and the Environment 10:357–364.
Loss, S.R., T. Will, and P.P. Marra. 2015. Direct mortality of birds from anthropogenic causes. Annual Review of Ecology, Evolution, and Systematics 46:99–120.
Malo, J.E., E.L. García de la Morena, I. Hervás, C. Mata, and J. Herranz. 2016. Uncapped tubular poles along high-speed railway lines act as pitfall traps for cavity nesting birds. European Journal of Wildlife Research 62:483–489.
Mänd, R., V. Tilgar, A. Lõhmus, and A. Leivits. 2005. Providing nest boxes for hole-nesting birds - does habitat matter? Biodiversity & Conservation 14:1823–1840.
Morelli, F., M. Beim, L. Jerzak, D. Jones, and P. Tryjanowski. 2014. Can roads, railways and related structures have positive effects on birds? A review. Transportation Research Part D: Transport and Environment 30:21–31.
Munro, H.L. and R.C. Rounds. 1985. Selection of artificial nest sites by five sympatric passerines. Journal of Wildlife Management 49:264–276.
Newton, I. 1994. The role of nest sites in limiting the numbers of hole-nesting birds: a review. Biological Conservation 70:265–276.
Ogden, A.G. 2013. Dying for a solution: incidental taking under the Migratory Bird Treaty Act. William & Mary Environmental Law and Policy Review 38:1–79.
Simpson, N., K.M. Stewart, and V.C. Bleich. 2011. What have we learned about water developments for wildlife? Not enough! California Fish and Game 97:190–209.
State of California. 1991. California Public Resources Code, Chapter 1. Manner of locating mining claims, tunnel rights, and millsites. Section 3915. State of California, Sacramento.
State of Nevada. 2009. Nevada Revised Statutes, Chapter 517. Monumenting of claim; required removal of plastic monuments. Section 030. State of Nevada, Carson City.
Tucker, V.R. 2013. Mammalian biodiversity survey and population dynamics at Naval Air Station Lemoore. M.S. Thesis, California State University, Fresno, California. 51 p.
U.S. Fish and Wildlife Service. 2013. Migratory bird mortality in oil and gas facilities in Colorado, Kansas, Montana, Nebraska, North Dakota, South Dakota, Utah, and Wyoming. Environmental Contaminants Program Report. Number R6/726C/13. U.S. Fish Wildlife Service, Arlington, Virginia. 25 p.
Whitfield, M. J., K. M. Enos, and S. P. Rowe. 1999. Is Brown-headed Cowbird trapping effective for managing populations of the endangered Southwestern Willow Flycatcher? Studies in Avian Biology 18:260–266.
Wilshire, H.G., J.E. Nielson, and R.W. Hazlett. 2008. The American West at Risk: Science, Myths, and Politics of Land Abuse and Recovery. Oxford University Press, New York, New York.
Western Wildlife 6:50–60 • 2019

57
Harris et al. • Wildlife mortalities in open-topped pipes.
MiChelle harris completed her Bachelor’s degree in Wildlife Biology at Humboldt State University, Arcata, California, in December 2017. Her interests are broad, but she is particularly passionate about public outreach, avian ecology, ecosystem services, outdoor recreation, and sustainability. She is currently exploring these interests through seasonal employment and plans to pursue graduate school in the near future. She has worked as a Naturalist at a science camp, a Keeper at a nonprofit zoo, and a Field Biologist for Southwestern Willow Flycatchers (Empidonax traillii extimus), Painted Buntings (Passerina ciris), and Santa Cruz Island Scrub-Jays (Aphelocoma insularis). (Photographed by Cindy Harris).
barbara CluCas is an Assistant Professor in the Department of Wildlife at Humboldt State University, Arcata, California. She received her Ph.D. in Animal Behavior from the University of California, Davis and conducted her postdoctoral work at the University of Washington in Seattle and Humboldt-Universität in Berlin, Germany. She earned her B.S. in Biology at Purdue University in West Lafayette, Indiana. Her general research interests are in animal behavior, urban ecology, conservation biology, and human dimensions of wildlife biology. Her research focuses on interspecifc interactions and how species can adapt and survive in human-modified environments, as well as how we can conserve biodiversity in urban areas. (Photographed by Kellie Brown).
Jenna stanek is an Ecologist for the Los Alamos National Laboratory, Los Alamos, New Mexico. She earned her M.S. in Wildlife and Fisheries Biology from Clemson University, Clemson, South Carolina, a B.S. in Biology and Ecology from Western State Colorado University, Gunnison, Colorado, and a B.A. in Environmental Policy and Spanish at Albright College, Reading, Pennsylvania. Her experience and research interests include environmental toxicology, community ecology in aquatic systems, and restoration ecology and management, particularly for special status species. (Photographed by Gene Stanek).
Mary Whitfield is the Research Director at the Southern Sierra Research Station, Weldon, California. She holds a B.S. degree in Wildlife and Fisheries Biology from the University of California, Davis, and a M.S. degree in Biology from California State University, Chico. She has also taken post-graduate classes at the University of California, Santa Barbara. Her research interests include conservation biology, breeding ecology (particularly with the Willow Flycatcher (Empidonax traillii), Brown-headed Cowbird (Molothrus ater) and Yellow-billed Cuckoo (Coccyzus americanus), behavioral ecology, full lifecycle research, and riparian systems. She has been the Research Director of the Southern Sierra Research station since the station opened in 2000. (Photographed by Justin Schuetz).

58
appendix figure 1. The contents of a gate marker with (Top) a Western Bluebird (Sialia mexicana) and (Bottom) a mining claim marker with an unidentified bird. (Photographed by Michelle Harris).
Western Wildlife 6:50–60 • 2019

59
appendix figure 2. The contents of three metal livestock corral pipes revealing (Top and Bottom Left) two living Western Fence Lizards (Sceleporus occidentalis) and (Bottom Right) a Great Basin Gopher Snake (Pituophis catenifer deserticola). (Photographed by Michelle Harris).
Harris et al. • Wildlife mortalities in open-topped pipes.

60
appendix figure 3. The contents of an irrigation pipe revealing several deer mice (Peromyscus sp.). (Photographed by Michelle Harris).
Western Wildlife 6:50–60 • 2019

61
Habitat Selection by newly MetaMorpHoSed Great baSin SpadefootS (Spea intermontana): a MicrocoSM Study
Jo-anne HaleS1,2,4 and Karl W. larSen3
1Environmental Science Program, Thompson Rivers University, 805 TRU Way, Kamloops, British Columbia, Canada V2C 0C82Current Address: 1269 Kootenay Way, Kamloops, British Columbia, Canada V2H 1K2
3Department of Natural Resource Sciences, Thompson Rivers University, 805 TRU Way, Kamloops, British Columbia, Canada V2C 0C8
4Corresponding author, email: [email protected]
Abstract.—Wetlands and their surrounding upland areas provide crucial habitat for the Great Basin Spadefoot (Spea intermontana), a species at risk in the grasslands of the southern interior of British Columbia, Canada. Understanding habitat selection and how these animals respond to change is crucial in the creation and implementation of conservation plans for the Great Basin Spadefoot. Little is known about the habitat selection of the Great Basin Spadefoot as they transition from aquatic larvae to terrestrial animals. The objective of this study was to determine microhabitat preferences of newly metamorphosed Great Basin Spadefoots. The small size of the metamorphs (18.7 mm SVL ± 2.8 mm (SD; n = 130) and 0.66 g ± 0.33 g (n = 130) precluded telemetry, so we conducted 13 simple habitat selection trials within four artificial enclosures. The trials were run in four batches over a 36-h period in the field near a spawning site. At release in the enclosures, the metamorphs immediately dispersed into all four habitat types (e.g., dry-bare, dry-cover, moist-bare, moist-cover). After 12 h, 75% of the metamorphs were located in moist-cover habitat, indicating a preference for that habitat. At the 36-h time period, it was clear that metamorphs were selecting for moist-cover habitat (79%, P < 0.001). Favourable habitat attributes for metamorphic spadefoots may be more specific than that of adults, requiring a more complex, holistic approach to habitat management for the Great Basin Spadefoot.
Key Words.—amphibian; British Columbia; conservation; cover; desiccation; grasslands; juvenile; larval emergence.
Western Wildlife 6:61–68 • 2019Submitted: 21 December 2018; Accepted: 6 November 2019.
introduction
Habitat selection by juvenile animals may differ sub-stantially from that of adults, particularly for species where parental care is nonexistent or only occurs for very short periods of time (McHugh et al. 2011; Pereira et al. 2019; Delancey and Islam 2019). In situations where there is no parental care, juvenile animals should demon-strate habitat associations and preferences critical to im-mediate survival and, ultimately, successful recruitment into the population (Patrick et al. 2008). Amphibians provide striking examples of habitat associations: indi-viduals transforming from aquatic larvae to terrestrial an-imals will abruptly face a different suite of environmen-tal conditions, and the ability to find appropriate habitat may be imperative to survival (Rittenhouse et al. 2008). Understanding habitat selection during this stage of de-velopment is important to designing and implementing conservation strategies that do not focus solely on adult habitat needs (Biek et al. 2002; Vonesh and De la Cruz 2002).
North American spadefoots (genera Scaphiopus and Spea) are terrestrial, burrowing amphibians associated with arid or semi-arid habitats. North American spade-foots rely on two distinct habitats to survive: water bod-ies for breeding and tadpole development and terrestrial habitat for feeding, aestivation, and hibernation (Pearson 1955). Habitat studies on North American spadefoots have focused largely on adult breeding sites (e.g., Nys-trom et al. 2002; Morey and Reznick 2004). As a result,
very little is known about the habitat preference of newly metamorphosed spadefoots (metamorphs), owing in part to their small size (18.7 mm SVL ± 2.8 SD, n = 130, and 0.66 g ± 0.33, n = 130; our data) and cryptic nature. As post-metamorphic juveniles do not remain in the water, they are likely vulnerable to desiccation and predation upon emergence, so habitat available near the edge of water likely plays a key role in enabling some propor-tion of the animals to survive the critical early stages of terrestrial life (Rothermel and Semlitsch 2006; Roznik and Johnson 2009). Heinen (1993) and Baughman and Todd (2007) conducted lab experiments on recently metamorphosed anurans (American Toad, Bufo america-nus, Southern Toad, Bufo terrestris, and Eastern Spade-foot, Scaphiopus holbrookii) and concluded that vegeta-tive cover was chosen over bare ground, and that cover was significant in providing protection from predators; however, neither of these studies included soil moisture as a factor. Jansen et al. (2001) concluded that Eastern Spadefoot metamorphs preferred moist substrate over dry. Grover (1998) analyzed cover and soil moisture and found both to be significant in predicting abundance of both juvenile and adult terrestrial salamanders (Red-backed Salamander, Plethodon cinereus, and Northern Slimy Salamander, Plethodon glutinosus) in a Virginia forest. Further studies are clearly required to explore the relationship between cover and moisture in determining habitat selection during the critical emergence stage of amphibians. Such work can guide the creation of artifi-cial breeding ponds or the retention of key microhabitats

62
Hales and Larsen • Habitat selection of newly metamorphosed Great Basin Spadefoots.
during habitat restoration or other land management.The Great Basin Spadefoot (Spea intermontana) rang-
es further north than any other spadefoot in North Ameri-ca, occupying the semi-arid grasslands of British Colum-bia (Committee on the Status of Endangered Wildlife in Canada [COSEWIC] 2007; BCSIRAWG 2017). This ecosystem makes up < 1% of British Columbia and has been affected over many decades by various forms of both anthropogenic and natural disturbance, substantially altering the habitat (Wikeem and Wikeem 2004). This includes a dramatic decrease (63%) in grassland ephem-eral ponds (Coelho 2015) used by Great Basin Spade-foots. Cattle grazing and water use also has degraded the habitat around many of the remaining ponds (Jones et al. 2011; Teuber et al. 2013). Previous research on the Great Basin Spadefoot in British Columbia is limited and pri-marily restricted to the movement and breeding ecology of adults (Garner 2012; Ashpole et al. 2014).
Given the small size of metamorphic spadefoots, we hypothesized that newly metamorphosed animals would select habitat that provided cover in the warm, dry cli-mate in the semi-arid grasslands of British Columbia. In this study, we report on a microcosm experiment used to investigate microhabitat preferences of newly metamor-phosed Great Basin Spadefoots. The ultimate purpose of this work was to provide information that would help shape emerging guidelines for the rehabilitation, protec-tion, and creation of Great Basin Spadefoot habitat on the British Columbia interior landscape.
MetHodS
Study site.—This study took place throughout Au-gust 2014 in the semi-arid grasslands in the Thompson River Valley, approximately 10 km west of Kamloops, British Columbia, Canada (50°41’38”N, 120°32’7”W). Typically, summers in the Kamloops area are warm and dry (Chilton 1981). In 2014, Kamloops average daily temperatures in June, July, and August ranged from 11.2° C to 25.8° C, 14.6° C to 32.2° C, and 15.1° C to 29.7° C, respectively (http://climate.weather.gc.ca/index_e.html#access). Total precipitation in June, July, and Au-gust was 31.4 mm, 30.5mm, and 51.1 mm, respectively (http://climate.weather.gc.ca/index_e.html#access). Ephemeral alkaline ponds and wetlands are sporadic on the landscape, a feature typical of this zone (Meidinger and Pojar 1991). Due to current and historical cattle grazing, Big Sagebrush (Artemisia tridentata), Cheat-grass (Bromus tectorum), and Knapweed (Centaurea sp.) dominate upland sites. The elevation of the study site is about 643 m. We conducted this work outdoors, in close proximity (< 10 m) to a known breeding pond of Great Basin Spadefoots (Fig. 1) where tadpole develop-ment naturally occurred. This outdoor location was open to fluctuating ambient temperature and humidity, and the diurnal cycle.
Microcosm (arena) construction.—We established four enclosures (i.e., microcosms) using plastic arenas
fiGure 1. Location of the study site for microhabitat selection of metamorphic Great Basin Spadefoots (Spea intermontana) in the semi-arid grasslands in the Thompson River Valley, approximately 10 km west of Kamloops, British Columbia, Canada. A natural spadefoot breeding pond is located in the center of the photo. The four microcosms (arenas) are located to the right of the breeding pond, within the fenced enclosure. (Photographed by Jo-Anne Hales).

63
Western Wildlife 6:61–68 • 2019
(children wading pools) approximately 1.2 m diameter with a wall height of approximate 20 cm. We divided each microcosm into four quadrants (surface area of one quadrant = 0.6 m2) with a central platform of rigid, trans-lucent plastic (about 27 × 27 cm) and inner ring of the same material (about 23 × 23 cm; Fig. 2, 3). We placed the central platform and inner ring at the center of the arena and prevented the metamorphs from burrowing into the soil and entering the quadrants prior to release. Across these quadrants, we established four microhabitat types: dry-bare, dry-cover, moist-bare, and moist-cover. We filled each arena to a depth of 5 cm (volume = 0.06 m3) with a 1:1 mixture of sand and silt obtained from a local gold mining operation (about 4 km south of study site), which was stockpiling the materials for tailings dam construction. We applied 2 L of deionized water to the half of the microcosm containing moist habitat. After water application, soil saturation was visibly evi-dent (Fig. 3). Subsequent applications of water occurred at the 12 h observation to maintain moisture in the soil. We used plastic dividers to prevent moisture from seep-ing into the dry treatments, but we took care to ensure that there were no physical surface barriers for the meta-morphs between the moist and dry halves. Following Baughman and Todd (2007), we used a fresh soil mixture in each trial. The soil mixture was sifted prior to being placed into the arena to ensure all large particles were removed. Light raking ensured an even surface prior to commencement of the trial. We placed pine cover boards (about 15 × 15 × 1 cm) in two of the four quadrants to create covered habitats (pine naturally occurs at the study site and we acquired cover boards locally). We raised
the boards about 2.5 cm above the soil with wooden sticks and positioned stones on top of the cover boards to ensure stability. During the trials, we covered each arena with a metal screen (about 1.5 × 0.8 cm mesh) fine enough to prevent predators from entering the pools and to prevent metamorphs from escaping, but coarse enough to prevent shading.
We sequentially rotated each arena 0°, 90°, 180°, and 270° at the start of each trial to avoid bias in direc-tional orientation. Following Heinen (1993) and Baugh-man and Todd (2007), the rotation of the arenas also controlled for other possible stimuli in the surrounding environment (e.g., presence of a wetland, direction of the sun). To collect comparative soil temperatures, we buried two Maxim Integrated iButton Thermochron ® temperature data loggers (Model DS1921G, San Jose, California, USA) 2.5 cm deep along the outside edge of each quadrant (Fig. 2, 3). These loggers recorded soil temperatures every 1 h over the 36-h time period. Data from the loggers allowed us to determine whether soil temperatures across the four treatment quadrants differed significantly and therefore possibly exerted an effect on the metamorphs.
Metamorph introduction.—The average size of the metamorphs used in this study at emergence from the water was 18.7 mm SVL ± 2.8 SD (n = 130) and 0.66 g ± 0.33 (n = 130). We fenced two natal ponds (about 2.5 km and about 900 m from microcosms) when tadpoles neared the later stages of metamorphosis to capture the spadefoots immediately upon emergence from the wa-ter. We hand captured metamorphs in the evening (about 2000) inside these fences less than 45 min before each series of trials was about to begin. We only selected indi-viduals that had completely absorbed their tail into their body (i.e., Gosner stage 46; Gosner 1960) and that we observed to be physically able to move onto land. We transported animals to the arenas in small plastic con-tainers. Once at the arenas, we weighed individuals (g) on a portable electronic scale (Model 1250BKEF, Salter Housewares Canada Inc., Burlington, Ontario, Canada), measured their snout-vent length (SVL), and tagged them on the right, hind foot using manual injection fluorescent yellow Visible Implant Elastomer (VIE; Northwest Ma-rine Technology, Inc., Shaw Island, Washington, USA). We used the VIE marker to ensure individuals partici-pated in only one trial and were not later recaptured from the natal pond and retested. Each trial consisted of 10 newly metamorphosed spadefoots being introduced into the center of each of the four microcosm arenas. Meta-morphs were removed from the arenas and immediately released back into their original natal pond once each trial was complete.
Microhabitat analysis.—We conducted 13 trials (i.e., one set of 10 spadefoots in an enclosure = one trial), run in four batches (i.e., four arenas used simultaneously).
fiGure 2. Schematic of artificial enclosure (i.e., microcosm) divided into four habitat types (e.g., dry-bare, dry-cover, moist-bare, moist-cover) to investigate microhabitat selection by newly metamorphosed Great Basin Spadefoots (Spea inter-montana) in the Thompson River Valley, British Columbia, Canada. Enclosure diameter was 1.2 m. Dashed grey lines define the half of the enclosure that was moistened with water.

64
Hales and Larsen • Habitat selection of newly metamorphosed Great Basin Spadefoots.
Each batch took place over two nights, spanning 36 h from start to finish. Prior to initial release into the arena, as per Baughman and Todd (2007), we placed the metamorphs on the central platform and covered them within the inner ring for 10 min, allowing time for the individuals to partially adjust to their surroundings. We then removed the inner ring and cover and visually monitored metamorphs until each had left the central platform and entered one of the four habitat quadrants, which was typically an immediate response. We re-corded the location of each metamorph, according to quadrant association, at three time periods: At release, 12 h, and 36 h. At release was defined as the exact mo-ment each individual left the inner ring and entered a quadrant. Our rationale for the later time periods was to provide ample time (including two night periods) for the metamorphs to explore, adjust, and choose a posi-tion within their new surroundings.
To determine locations of the metamorphs in the are-nas at 12 h and 36 h, we removed the screen gently to prevent disturbance and we completed a visual inspec-tion. When necessary, we briefly removed cover boards and counted the metamorphs. Once we accounted for all 10 individuals in each arena, we gently repositioned cover boards and screens. Extreme care was taken to acquire individual locations as quickly as possible with no disturbance to either the metamorph or the arena. We gently unearthed metamorphs if no sighting could be made but evidence of a burrow existed; we promptly re-covered these metamorphs with soil.
Statistical analysis.—We performed statistical analysis using R 3.2.5 (R Core Team, 2015). Prior to conducting analysis, the categorical variables were ap-propriately designated using the ordered (for ordered categorical [ordinal] variables, e.g., trial number, time period) and factor (for categorical [nominal]) variables, e.g., direction, habitat-type) functions (Kabacoff 2011; Bolker, B.M., M.E. Brooks, C.J. Clark, S.W. Geange, J.R. Poulsen, M.H.H. Stevens, and J-S.S. White. 2011. GLMMs in action: gene-by-environment interaction in total fruit production of wild populations of Arabidopsis thaliana, revised version, part 1. Available from www.cell.com/cms/attachment/601623/4742452/mmc1.pdf [Accessed 1 December 2015]). We tested for correla-tion among our predictor variables (i.e., direction, cover type, soil temperature) by calculating a Generalized Vari-ance Inflation Factor (GVIF) following Zuur et al. (2012) and Fox and Monette (1992). The GVIF measures how much the variance of a predictor is increased due to lin-ear dependence with other predictors. As recommended by Zuur et al. (2010), we used a GVIF value of three as the pre-selected threshold (indicating no collinearity), versus the higher (and more flexible) value of ten used by Montgomery and Peck (1992).
We used Fisher’s Exact Tests using the lattice package in R (Sarkar 2008) to explore if metamorphs exhibited equal preference for the four habitat types and direction-ality in each arena. The results indicated whether data within each batch of trials could be pooled for a robust analysis of metamorph microhabitat preference using
fiGure 3. Photographs of artificial enclosures (i.e., microcosms) divided into four habitat types (e.g., dry-bare, dry-cover, moist-bare, moist-cover) to investigate microhabitat selection by newly metamorphosed Great Basin Spadefoots (Spea intermontana) in the Thompson River Valley, British Columbia, Canada. A natural spadefoot breeding pond is located within the fenced enclosure, adjacent to the microcosms. (Photographed by Janessa Ekman, left, and Jo-Anne Hales, right).

65
Pearson’s Chi-squared Tests in the lattice package in R (Sarkar 2008). We analyzed the zero-inflated, grouped, non-normal count data with mixed effects using a zero-inflated Poisson (ZIP) Generalized Linear Mixed Model (GLMM; Bolker et al. 2013) to effectively predict meta-morph microhabitat selection. The ZIP model accounted for the high number (38.5%) of true zeros in the count data (Lambert 1992; Zuur et al. 2009). We used the glm-mADMB package (Fournier et al. 2012; Skaug et al. 2015) with a loglink function to determine whether there was a relationship between the number of observations (i.e., number of metamorphs) within each quadrant for each trial and time period, and the three explanatory vari-ables direction, habitat-type, and soil temperature. We attributed the random effects to our grouping (i.e., nest-ing) variables, time at 0 h, 12 h, 36 h and trial number 1,
2, 3, 4. We completed the analysis by checking the data set for overdispersion (Crawley 2002; Zuur et al 2012).
reSultS
In total, we collected data from 13 arena trials (in four batches) and 130 animals. The mean soil temperature collected from the data loggers ranged from 20.6° ± 1.8° C and 26.6° ± 4.9° C at three time periods (i.e., At re-lease, 12 h, and 36 h) and four habitat types (i.e., moist-cover, dry-bare, dry-cover, and moist-bare; Table 1). A strong trend towards the increase in the selection of the moist-cover habitat quadrant was seen over the duration of the study (Fig. 4).
Data on microhabitat choice from the 13 trials could be pooled for both cover type (Fisher’s Exact Test, P = 0.070) and direction (Fisher’s Exact Test, P = 0.070). The GVIF values for direction, cover, and soil tempera-ture were 1.02, 1.11, and 1.09 respectively. We frequent-ly found metamorphs (n = 130) concentrated in the dif-ferent quadrants, which in turn resulted in the majority of quadrant counts containing zero animals.
The resulting analysis of the pooled data indicated that metamorph habitat choice was dependent on cover type (Χ2 = 17.82, df = 9, P = 0.037) but independent of the direction of the arena (Χ2 = 7.65, df = 9, P = 0.619). At release, the percentages of metamorphs that dispersed into the moist-cover, dry-bare, dry-cover, and moist-bare habitats were 26%, 25%, 24%, and 25%, respec-tively. After 12 h, 75% of the metamorphs were located in moist-cover habitat. After 36 h, 79% of metamorphs were located in moist-cover habitat rather than dry-bare, dry-cover, or moist-bare habitats. Metamorphs strongly preferred moist-cover habitat type (z = 6.24, P < 0.001, n = 130). All other habitat types (i.e., dry-bare, dry-cover, moist-bare), direction, and soil temperature (recorded by data loggers) were not significant (all other Ps > 0.190).
diScuSSion
Previous laboratory experiments have shown that re-cently metamorphosed anurans prefer some type of veg-etative cover over bare ground (not including moisture as a factor; Heinen 1993; Baughman and Todd 2007), but
Western Wildlife 6:61–68 • 2019
fiGure 4. Observations of the number of metamorphic Great Basin Spadefoots (Spea intermontana; n = 130) in the four available habitat types in each arena: dry-bare (DB), dry-cover (DC), moist-bare (MB) and moist-cover (MC). The locations of the metamorphs were determined over three time periods: At Release, after 12 h, and after 36 h. A value of 7 means that seven of 10 spadefoots in a trial (n = 10 spadefoots per trial; n = 13 trials) selected the given habitat type. Closed circle = outliers, shaded box = interquartile range, dark horizontal bar = median, top horizontal bar = greatest value excluding outliers, and the bottom horizontal bar = least value excluding outliers.
table 1. The mean soil temperature (°C; ± standard deviation) for each habitat type: dry-bare (DB), dry-cover (DC), moist-bare (MB) and moist-cover (MC), at three time periods at the study site in the Thompson River Valley, British Columbia, Canada: At release, at 12 h, and at 36 h. We used eight Maxim Integrated iButton Thermochron ® temperature data loggers (Model DS1921G, San Jose, California, USA) to record soil temperature every hour within the artificial enclosures.
Time Period DB DC MB MC
At release 26.1 ± 4.9 26.6 ± 4.9 25.5 ± 4.8 25.6 ± 4.6
12 h 24.5 ± 3.1 22.9 ± 1.5 21.1 ± 1.6 20.6 ± 1.8
36 h 24.6 ± 3.3 23.0 ± 1.9 21.8 ± 2.2 21.7 ± 3.1

66
this study demonstrates that newly metamorphosed Great Basin Spadefoots more specifically prefer moist micro-habitats with cover. Although this response is intuitive for a metamorphic amphibian entering an arid terrestrial environment, this study is the first clear demonstration for such a preference within the metamorphic stage of the Great Basin Spadefoot. Whereas this work was performed in an arena, it seems likely that metamorphs emerging from water bodies would exhibit similar be-havior in a natural setting. Observations in the field sup-port this idea: we detected metamorphs taking refuge in visibly moist soil under plywood adjacent to an evaporat-ing pond and within moist fissures at the edges of other ponds (Hales 2018). Our results parallel those of Wein-traub (1980), who found recently metamorphosed New Mexico Spadefoot (Scaphiopus multiplicatus) individu-als under boards, in shallow retreats, cow dung, or fis-sures caused by drying of pond edges during the daytime. Baughman and Todd (2007) found newly metamor-phosed Eastern Spadefoots preferred habitat with for-est litter (i.e., cover) in laboratory experiments in South Carolina. Walston and Mullin (2008) found that juvenile amphibians in Illinois, specifically the Small-mouthed Salamander (Ambystoma texanum), American Toad, and Wood Frog (Rana sylvatica), exhibited non-random ori-entation moving in the direction of forested habitat versus disturbed open areas with little canopy cover. Combined, these findings suggest that many, if not most, species of amphibians transitioning from an aquatic juvenile stage to one that uses drier upland habitat would preferentially seek out moist habitat with cover.
Garner (2012) studied upland habitat selection of Great Basin Spadefoots near their northern range limit (about 110 km northwest of the present study). Using telemetered adult animals, Garner (2012) found selection for daytime retreat sites that contained a relatively high proportion of bare ground. Superficially, this seems to suggest a very different pattern of habitat selection be-tween adults and emerging newly metamorphosed Great Basin Spadefoots (i.e., habitat preferences might change or shift as the animals ages). The Garner (2012) study site, however, was situated within a cooler, moister eco-system than the present study, suggesting the animals may have been more limited by heat and thus selected for bare (warmer) ground in which to bury. In 2014, av-erage daily temperatures near the Garner (2012) study site in June, July, and August ranged from 3.9–17.9° C, 6.6–24.0° C, and 6.2–23.3° C, respectively (http://cli-mate.weather.gc.ca/index_e.html#access). Total precipi-tation in June, July, and August was 36.5 mm, 49.7mm, and 17.4 mm, respectively (http://climate.weather.gc.ca/index_e.html#access). Further, the smaller surface area-to-volume ratio of adult animals may enable them to remain buried underground for long periods of time, retaining and/or absorbing soil moisture through their permeable skin (Ruibal et al. 1969). Metamorphs, being much smaller in size, likely have a lower tolerance for
dry conditions, and therefore have different habitat re-quirements. This study did not examine all factors (e.g., food availability, body condition) that could influence the terrestrial habitat choice of newly metamorphosed spade-foots, but it did determine that, given the conditions pro-vided in the arena, moist habitat with cover is preferred directly following metamorphosis.
This work has important implications for the manage-ment of the Great Basin Spadefoot, particularly in the semi-arid grasslands of British Columbia. Given the results of this study and the Environment and Climate Change Canada (ECCC; 2017) recovery strategy, we recommend retaining or establishing breeding water bod-ies with natural or artificial cover material (e.g., plants, coarse woody debris, cover boards) situated along the immediate perimeter of the pond edge to provide shel-ter and moisture. Such conditions should increase the quality of suitable terrestrial microhabitats for vulner-able, newly metamorphosed spadefoots. The presence of cover features may be extended over larger areas sur-rounding water bodies to provide additional resources for both newly metamorphic and adult Great Basin Spade-foots as they disperse from the breeding pond (ECCC 2017; Hales 2018). Breeding ponds should be protected (e.g., fencing, enclosures) from sources of disturbance (e.g., cattle, development). Metamorph mortality caused by cattle disturbance (e.g., metamorphs trapped in hoof prints along pond edge) was observed by the author at Great Basin Spadefoot breeding ponds throughout the study. Livestock use of water bodies and riparian areas can also leave shorelines and neighboring habitat devoid of vegetation and other cover (Cragg 2007).
Technology (particularly telemetry) currently restricts our knowledge of upland habitat requirements for meta-morphs of the Great Basin Spadefoot. Knowledge of the dispersal phase for these animals is particularly limited: the distance travelled from the breeding pond upon meta-morphosis, daytime retreat site locations and types, and hibernation locations are virtually unknown for juvenile Great Basin Spadefoots. Inventive methods will need to be employed to collect these sorts of data. For exam-ple, Popescu and Hunter (2011) tracked movement and recorded habitat preferences of newly metamorphosed Wood Frogs using runway enclosures with pitfall traps and tracking stations. Similar methods may be needed to further our understanding of habitat requirements for spadefoots across all life-history stages.
Acknowledgments.—This study was financially sup-ported by Tk’emlúps te Secwépemc and New Gold - New Afton Mine. We thank our research assistants, Katie Bennett and Janessa Ekman, and our volunteers, Gerad Hales, Bevan Ernst and Jeff Morgan. This work was conducted under permit number KA13-86639 (Brit-ish Columbia Ministry of Forests, Lands, Natural Re-source Operations and Rural Development) and animal ethics protocol 100349 (Thompson Rivers University
Hales and Larsen • Habitat selection of newly metamorphosed Great Basin Spadefoots.

67
Animal Care Committee).
literature cited
Ashpole, S.L., C.A. Bishop, and J.E. Elliott. 2014. Clutch size in the Great Basin Spadefoot (Spea inter-montana), South Okanagan Valley, British Columbia, Canada. Northwestern Naturalist 95:35–40.
Baughman, B., and B.D. Todd. 2007. Role of substrate cues in habitat selection by recently metamorphosed Bufo terrestris and Scaphiopus holbrookii. Journal of Herpetology 41:154–157.
British Columbia Southern Interior Reptile and Amphib-ian Working Group (BCSIRAWG). 2017. Recovery plan for the Great Basin Spadefoot (Spea intermon-tana) in British Columbia. Prepared for the British Columbia Ministry of Environment, Victoria, Brit-ish Columbia, Canada. 40 p. (Reprint of 1st Edition. Southern Interior Reptile and Amphibian Working Group, Victoria, British Columbia, Canada. 40 p. (Original publication date 2016).
Biek, R., W.C. Funk, B.A. Maxell, and L. Scott Mills. 2002. What is missing in amphibian decline research: insights from ecological sensitivity analysis. Conser-vation Biology 16:728–734.
Bolker, B.M., B. Gardner, M. Maunder, C.W. Berg, M. Brooks, L. Comita, E. Crone, S. Cubaynes, T. Davies, P. de Valpine, et al. 2013. Strategies for fitting nonlin-ear ecological models in R, AD Model Builder, and BUGS. Methods in Ecology and Evolution 4:501–512.
Chilton, R.H. 1981. A summary of climate regimes of British Columbia. British Columbia Ministry of En-vironment, Victoria, British Columbia, Canada. 46 p.
Coelho, A.J.A. 2015. Assessing climate change induced declines in ponds in British Columbia’s semi-arid grasslands. M.Sc. Thesis, Thompson Rivers Univer-sity, Kamloops, British Columbia, Canada. 71 p.
Committee on the Status of Endangered Wildlife in Canada (COSEWIC). 2007. COSEWIC assessment and update status report on the Great Basin Spade-foot (Spea intermontana) in Canada. Committee on the Status of Endangered Wildlife in Canada, Ottawa, Ontario, Canada. 34 p.
Cragg, J. 2007. The effects of livestock grazing on the amphibians of British Columbia. Wildlife Working Report No. WR-111, British Columbia Ministry of Environment, Victoria, British Columbia, Canada.
Crawley, M.J. 2002. Statistical computing: an introduc-tion to data analysis using S-Plus. Wiley, New York, New York, USA.
Delancey, C.D., and K. Islam. 2019. Post-fledging habi-tat use in a declining songbird. PeerJ. 7:e7358. http://doi.org/10.7717/peerj.7358.
Environment and Climate Change Canada (ECCC). 2017. Recovery strategy for the Great Basin Spade-foot (Spea intermontana) in Canada. Species at Risk
Act Recovery Strategy Series. Environment and Cli-mate Change Canada, Ottawa, Ontario, Canada. 71 p.
Fournier, D.A., H.J. Skaug, J. Ancheta, J. Ianelli, A. Magnusson, M. N. Maunder, A. Nielsen, and J. Sibert. 2012. AD model builder: using automatic differentia-tion for statistical inference of highly parameterized complex non-linear models. Optimization Methods and Software 27:233–249.
Fox, J. and G. Monette. 1992. Generalized collinearity diagnostics. Journal of the American Statistical Asso-ciation 87:178–183.
Garner, J.L. 2012. Movement and habitat-use of the Great Basin Spadefoot (Spea intermontana) at its northern range limit. M.Sc. Thesis, Thompson Rivers Univer-sity, Kamloops, British Columbia, Canada. 81 p.
Gosner, K.L. 1960. A simplified table for staging anuran embryos and larvae with notes on identification. Her-petologica 16:183–190.
Grover, M.C. 1998. Influence of cover and moisture on abundances of the terrestrial salamanders Plethodon cinereus and Plethodon glutinosus. Journal of Herpe-tology 32:489–497.
Hales, J. 2018. Habitat selection of the Great Basin Spadefoot (Spea intermontana) in the grasslands of British Columbia. M.Sc. Thesis, Thompson Rivers University, Kamloops, British Columbia, Canada. 82 p.
Heinen, J.T. 1993. Substrate choice and predation risk in newly metamorphosed American Toads Bufo ameri-canus: an experimental analysis. American Midland Naturalist 130:184–192.
Jansen, K.P., A.P. Summers, and P.R. Delis. 2001. Spade-foot Toads (Scaphiopus holbrookii holbrookii) in an urban landscape: effects of nonnatural substrates on burrowing in adults and juveniles. Journal of Herpe-tology 35:141–145.
Jones, W.M., L.H. Fraser, and P. Jefferson Curtis. 2011. Plant community functional shifts in response to live-stock grazing in intermountain depressional wetlands in British Columbia, Canada. Biological Conservation 144:511–517.
Kabacoff, R.I. 2011. R in Action: Data analysis and graphics with R. Manning Publications Company, Shelter Island, New York, USA.
Lambert, D. 1992. Zero-inflated Poisson regression, with an application to defects in manufacturing. Techno-metrics 34:1–14.
McHugh, K.A., J.B. Allen, A.A. Barleycorn, and R.S. Wells. 2011. Natal philopatry, ranging behavior, and habitat selection of juvenile bottlenose dolphins in Sarasota Bay, Florida. Journal of Mammalogy 92:1298–1313.
Meidinger, D., and J. Pojar (Compilers and Editors). 1991. Ecosystems of British Columbia. Special Re-port Series 6. Research Branch, Ministry of Forests, Victoria, British Columbia, Canada.
Montgomery, D.C., and E.A. Peck. 1992. Introduction to
Western Wildlife 6:61–68 • 2019

68
Hales and Larsen • Habitat selection of newly metamorphosed Great Basin Spadefoots.
Linear Regression Analysis. 2nd Edition. Wiley Inter-science, New York, New York, USA.
Morey, S.R., and D.N. Reznick. 2004. The relationship between habitat permanence and larval develop-ment in California spadefoot toads: field and labora-tory comparisons of development plasticity. Oikos 104:172–190.
Nyström, P., L. Birkedal, C. Dahlberg, and C. Brönmark. 2002. The declining spadefoot toad Pelobates fus-cus: calling site choice and conservation. Ecography 25:488–498.
Patrick, D.A., E.B. Harper, M.L. Hunter Jr., and A.J.K. Calhoun. 2008. Terrestrial habitat selection and strong density-dependent mortality in recently metamor-phosed amphibians. Ecology 89:2563–2574.
Pearson, P.G. 1955. Population ecology of the spadefoot toad, Scaphiopus h. holbrooki (Harlan). Ecological Monographs 25:233–267.
Pereira, J.J., E.P. Lopes, M.Á. Carretero, and R. Vas-concelos. 2019. Insular geckos provide experimental evidence on refuge selection priorities by ectotherms. Behavioural Processes 164:260–267.
Popescu, V.D., and M.L. Hunter, Jr. 2011. Clear-cutting affects habitat connectivity for a forest amphibian by decreasing permeability to juvenile movements. Eco-logical Applications 21:1283–1295.
R Core Team. 2015. R: A language and environment for statistical computing. R Foundation for Statistical Computing, Vienna, Austria. https://www.R-project.org/.
Rittenhouse, T.A.G., E.B. Harper, L.R. Rehard, and R.D. Semlitsch. 2008. The role of microhabitats in the des-iccation and survival of anurans in recently harvested oak-hickory forest. Copeia 2008:807–814.
Rothermel, B.B., and R.D. Semlitsch. 2006. Conse-quences of forest fragmentation for juvenile survival in Spotted (Ambystoma maculatum) and Marbled (Ambystoma opacum) salamanders. Canadian Journal of Zoology 84:797–807.
Roznik, E.A., and S.A. Johnson. 2009. Burrow use and survival of newly metamorphosed Gopher Frogs
(Rana capito). Journal of Herpetology 43:431–437.Ruibal, R., L. Tevis Jr., and V. Roig. 1969. The terrestrial
ecology of the spadefoot toad Scaphiopus hammondii. Copeia 1969:571–584.
Sarkar, D. 2008. Lattice: Multivariate Data Visualization with R. Springer, New York New York, USA.
Skaug, H., D. Fournier, B. Bolker, A. Magnusson and A. Nielsen. 2015. Generalized linear mixed models using AD model builder. R package version 0.8.3.3. http://glmmadmb.r-forge.r-project.org/.
Teuber, L.M., N. Hölzel, and L.H. Fraser. 2013. Live-stock grazing in intermountain depressional wetlands. Effects on plant strategies, soil characteristics and biomass. Agriculture, Ecosystems and Environment 175:21–28.
Vonesh, J.R., and O. De la Cruz. 2002. Complex life cycles and density dependence: assessing the contri-bution of egg mortality to amphibian declines. Oeco-logia 133:325–333.
Walston, L.J., and S.J. Mullin. 2008. Variation in amount of surrounding forest habitat influences the ini-tial orientation of juvenile amphibians emigrating from breeding ponds. Canadian Journal of Zoology 86:141–146.
Weintraub, J.D. 1980. Selection of daytime retreats by recently metamorphosed Scaphiopus multiplicatus. Journal of Herpetology 14:83–84.
Wikeem, B., and S. Wikeem. 2004. The grasslands of British Columbia. Grasslands Conservation Council of British Columbia, Kamloops, British Columbia, Canada. 479 p.
Zuur, A.F., E.N. Ieno, and C.S. Elphick. 2010. A proto-col for data exploration to avoid common statistical problems. Methods in Ecology and Evolution 1:3–14.
Zuur, A.F., E.N. Ieno, N.J. Walker, A.A. Saveliev, and G.M. Smith. 2009. Mixed Effects Models and Exten-sions in Ecology with R. Springer, New York, New York, USA.
Zuur, A.F., J.M. Hilbe, and E.N. Ieno. 2012. Zero Inflated Models and Generalized Linear Mixed Models with R. Highland Statistics Ltd., Newburgh, UK.
Jo-anne HaleS received her M.Sc. in Environmental Science from Thompson Rivers University, Kamloops, British Columbia, Canada, in 2018. For her thesis research, she studied habitat selection of the Great Basin Spadefoots in the grasslands of British Columbia. She is currently the Environmental Specialist for the Tk’emlúps te Secwépemc Lands, Leasing and Tax Department in Kamloops, British Columbia. (Photographed by Gerad Hales).
Karl w. larSen is a Professor in the Department of Natural Resource Sciences at Thompson Rivers University, Kam-loops, British Columbia, Canada. He and his students work on the conservation and ecological issues facing a variety of vertebrate wildlife species. (Photographed by Jared Hobbs).

69
Survey for CoCCidioides AntibodieS in blood SerA from CAliforniA SeA lionS And northern fur SeAlS thAt StrAnded Along the CoASt
of CAliforniA (2013–2015)Antje LAuer1,6, LAuren PALmer2, CArL KLooCK1, HeAtHer e.m. LiwAnAg3, tenAyA norris5,
Birgitte mCdonALd4, jAzmine mejiA muñoz1, CAtHerine muLCAHy5, sHAwn HAnnAH3,4, And sHAwn joHnson5
1Department of Biology, California State University Bakersfield, 9001 Stockdale Highway, Bakersfield, California 933112Marine Mammal Care Center Los Angeles, 3601 South Gaffey Street, San Pedro, California 90731
3Department of Biological Sciences, California Polytechnic State University, 1 Grand Avenue, San Luis Obispo, California 934074Moss Landing Marine Laboratories, San José State University, Moss Landing, 8272 Moss Landing Road,
Moss Landing, California 950395The Marine Mammal Center, 2000 Bunker Road, Fort Cronkhite, Sausalito, California 94965-2619
6Corresponding author, e-mail: [email protected]
Abstract.—Coccidioidomycosis, also known as Valley Fever, infects marine mammals along the coast of California. These animals reside far from the Central Valley of California and the Mojave Desert where the fungal pathogen Coccidioides immitis is endemic. An agar gel immunodiffusion (AGID) assay established to screen for coccidioidomycosis exposure in humans and canines was used on blood sera collected from 136 stranded California Sea Lions (Zalophus californianus) of all age groups and 17 Northern Fur Seals (Callorhinus ursinus) between 2013 and 2015, to quantify the prevalence of exposure to the pathogen. We detected Coccidioides-specific antibodies in approximately 11% of California Sea Lions and 24% of Northern Fur Seal pups that were diagnosed with respiratory problems at time of admission to two marine mammal care centers. No significant difference was detected in risk of exposure to the pathogen when comparing sex, or stranding location of California Sea Lions, however, we found that yearlings of California Sea Lions did not show any evidence of seroconversion. Our results confirm that exposure to Coccidioides occurs among pinnipeds, likely due to strong Santa Ana winds, which carry dust from mainland California to the Pacific Ocean. Thus, disease resulting from infection with Coccidioides should be considered as a possible cause for stranding in pinnipeds. The risk of exposure to the pathogen can be considered equal for California Sea Lions, Northern Fur Seals, and other marine mammals that spend significant time in an area affected by mainland dust. The location of greatest exposure is difficult to determine, however, because of sea lion migration behavior and variable wind and weather patterns. The findings of this study have implications for marine mammal rehabilitation and conservation, and also for public health.
Key Words.—agar gel immunodiffusion assays; Callorhinus ursinus; coccidioidomycosis; immunoglobulin M; immunoglobulin G; marine mammal rehabilitation; pinnipeds; stranding; Zalophus californianus
Western Wildlife 6:69–81 • 2019Submitted: 20 September 2019; Accepted: 10 December 2019.
introduCtion
Major causes of pinniped (seals and sea lions) strandings along the coast of California include natural or manmade disasters, storm surges, El Niño events (that often result in malnutrition), human or predator related injuries, infectious diseases, and non-infectious diseases (cancer, congenital, etc.) including domoic acid poisoning (Gerber et al. 1993; Colegrove et al. 2005; Greig et al. 2005). Malnutrition lowers the functional performance of the immune system and renders animals more vulnerable to infectious diseases (Simeone et al. 2015). Stranded pinnipeds that suffer from malnutrition are often also diagnosed with pneumonia, which can be caused by various infectious agents (viruses, bacteria, fungi, and/or parasites). The cause of pneumonia, and other infectious diseases, must be identified for successful treatment, rehabilitation, and release of a rescued marine mammal.
In coastal California, pinnipeds and other marine mammals (i.e., Sea Otters [Enhydra lutris], dolphins,
and whales) have occasionally been diagnosed with coccidioidomycosis, also known as Valley Fever, a disease caused by a soil-borne fungal pathogen (Reed et al. 1976; Cornell et al. 1979; Fauquier et al, 1996; Kirkland and Fierer 1996; Reidarson et al. 1998; Carlson-Bremmer et al. 2012). Recently, coccidioidomycosis was identified as the most common mycosis in stranded marine mammals along the central California coast (Huckabone et al. 2015; Simeone et al. 2015). Unfortunately, the disease is often diagnosed postmortem, when treatment with antibacterial drugs was unsuccessful or when supportive care of animals failed. At that stage, the disease likely disseminated throughout the body, and affected lymph nodes, lungs, and bones (Gerber et al. 1993; Shubitz and Dial, 2005; Simpson and Cornell 2018). For example, over a six-year period, 22.2% of rehabilitated pinnipeds in California presented with pneumonia of unknown origin (suspected bacterial or verminous infections). Some of these animals might have contracted coccidioidomycosis (Gerber et al. 1993) but were not diagnosed. Between 2005 and 2014, 12 California Sea Lions (Zalophus

70
Lauer et al. • Coccidioides antibodies in blood sera of California marine mammals.
californianus) rescued at The Marine Mammal Center (TMMC) succumbed to coccidioidomycosis (Appendix Table). Early detection and proper treatment of coccidioidomycosis could have improved the outcomes for these stranded animals. Understanding the potential sources of this pathogen, typically associated with dry, desert habitats, may be helpful to determine when and where testing for the pathogen may be a cost-effective diagnostic tool for marine mammal rescue efforts.
The opportunistic fungal pathogens, Coccidioides immitis and C. posadasii, both cause coccidioidomycosis. In California, C. immitis is highly endemic in the central and southern San Joaquin Valley and the western Mojave Desert where it can be found in non-disturbed fine particulate soils (alluvium) dominated by salt bushes (particularly Allscale, Atriplex polycarpa, Spiny Saltbush, A. spinifera, Shadscale, A. confertifolia, and Fourwing Saltbush A. canescens) and Creosote (Larrea tridentata), whereas C. posadasii is established in other areas of the Southwestern U.S., Mexico, and parts of South America (Baptista-Rosas et al. 2007; Fisher et al. 2007). Arthroconidia (dormant forms of the pathogens) can become airborne when soil is disturbed and when inhaled, arthroconidia can form spherules in the lung, potentially resulting in pneumonia and occasionally disseminating to other internal organs (Pappagianis 1980).
The migratory behavior of marine mammals hinders precise determination of where these animals may be exposed to the pathogen. California Sea Lions tend to migrate long distances along the U.S. west coast and can range from southern Mexico and Baja California, where C. posadasii resides, to British Columbia (considered non-endemic for Coccidioides). Rookeries (breeding grounds) are located almost entirely on the Channel Islands of California, western Baja California, and the Gulf of California (Aurioles et al. 1983; Laake et al. 2018). Therefore, it can be inferred that pinnipeds spend significant time in waters and rookeries exposed to mainland dust potentially containing C. immitis (California) or C. posadasii (Mexico) and are likely at risk of exposure while in these areas. Northern Fur Seals (Callorhinus ursinus), which have established rookeries on San Miguel Island close to the C. immitis endemic mainland, are at risk of pathogen exposure as well, but instead of migrating south, these pelagic animals prefer the north Pacific Ocean with another large rookery on the Farallon islands near San Francisco, California; however, most breeding grounds of this species are in the Aleutians Islands in the Bering Sea.
There are two likely sources of the pathogen: fugitive dust from offshore islands and from areas known to be endemic for C. immitis and/or C. posadasii on the mainland. Although many of the Channel Island plant communities resemble comparable communities on the California mainland, they are dominated by endemic species unique to the islands. In response to soil and
climate conditions that are different from the mainland, communities on the islands form distinct plant alliances and associations such as Island Chaparral, Coastal Sage Scrub, and Grassland. Atriplex polycarpa and other Atriplex species, as well as Creosote that are adapted to saline-alkaline desert soils, can indicate a suitable habitat for Coccidioides, but are not established on the Channel Islands (Junak et al. 2007; Channel Island National Park. 2019. Channel Islands Plant Check List. National Park Service, U.S. Department of the Interior. Available from https://www.nps.gov/chis/planyourvisit/upload/A-Checklist-of-Vascular-Plants-all-v1.pdf [Accessed 6 October 2019]). Therefore, it seems unlikely that Coccidioides are an important part of the fungal community in Channel Islands soils.
The recent surge (from about 2010 to now) in land development in the California deserts for utility-scale solar energy development (USSED), in addition to fallow farmland resulting from a long-term drought, has contributed to an increase in fugitive dust and coccidioidomycosis in highly endemic areas of the pathogen in the Mojave Desert (Hector et al. 2011; Thompson III et al. 2015; Guevara et al. 2015; Grayzel et al. 2017). Recent studies in the western Mojave Desert, located north of the San Gabriel Mountains that separates the Los Angeles Basin from the Mojave Desert, revealed the presence of C. immitis in 29% of all soil samples collected from disturbed and non-disturbed soils at sites destined for large-scale renewable energy projects west of Lancaster, California (Etyemezian et al. 2018). Since 2011, a significant increase in coccidioidomycosis among humans has been observed in Kern (southern San Joaquin Valley) and northern Los Angeles (Mojave Desert) counties (Cooksey et al. 2017; Colson et al. 2017). Recent research also revealed an earlier onset of the spring fine dust season in the endemic area of the pathogen due to climate change (Hand et al. 2016), which likely leads to an increased risk of exposure to Coccidioides for animals and humans.
Strong seasonal Santa Ana winds arriving at the end of the long summer drought season (May-September/October) in California can transport pathogenic arthroconidia from dry and eroded land in the Mojave Desert to the Los Angeles Basin and beyond, putting people as well as domestic and wild animals at risk of developing coccidioidomycosis (Westerling et al. 2004; Duniway et al. 2019; Appendix Figure). Between 2013 and 2017, strong Santa Ana winds carried dust from the Mojave Desert to non-endemic areas of the pathogen along the coast and fanned several wildfires (Kolden and Abatzoglou 2018). These events increased particulate matter concentrations of 10 μm or less in diameter (PM10) in the air along the coast of California and are a growing public health issue (Black et al. 2017).
In anticipation of regular Valley Fever surveillance in the future, we aimed to obtain initial information about how common exposure to Coccidioides is among stranded

71
Western Wildlife 6:69–81 • 2019
California Sea Lions admitted to two marine mammal care centers in California over a 3-y period. A small number of Northern Fur Seal pups was also included in this study because of unusually high numbers of strandings in 2014 and 2015. Here we present preliminary data from a series of planned tests that will continue monitoring coccidioidomycosis in California Sea Lions and Northern Fur Seals through 2021 (NOAA permit # 19706). Valley Fever monitoring would also be of interest to scientists at the National Oceanic and Atmospheric Administration (NOAA) Fisheries agency (https://www.fisheries.noaa.gov/national/marine-life-distress/2013-2017-california-sea-lion-unusual-mortality-event-california) who are investigating California Sea Lion Unusual Mortality Events (CSL UME).
methodS
Study sites.—Pinnipeds admitted to the Marine Mammal Care Center Los Angeles (MMCCLA) in San Pedro, California, and to The Marine Mammal Care Center (TMMC) in Sausalito, California, were included in this study. The MMCCLA admits animals stranded in Los Angeles County (Malibu to Seal Beach); whereas, TMMC responds to animals stranded between San Luis Obispo County and Mendocino County. Both Marine Mammal Care centers (collectively, MMCs) identify the causes of stranding, document and diagnose stranded animals, and treat them with the intent of rehabilitation and release.
Blood serum samples.—We tested stored, frozen blood serum samples from California Sea Lions and Northern Fur Seals rescued between 2013 and 2015 for antibodies against Coccidioides spp. Additional information was gathered as available, including the cause of stranding, any diagnoses and analyses performed by the veterinarians at the MMCs at any stage of treatment at the site of recovery, and whether the animal was released. Information gathered from animals found dead or that were euthanized while in rehabilitation (e.g., lesions in the lung, in bones, or in inner organs) was included as well. We focused on stranded California Sea Lions and Northern Fur Seals diagnosed with a respiratory disease (suspected pneumonia) because respiratory problems can indicate coccidioidomycosis in an early stage (Pappagianis 1980; Valdivia et al. 2006). Overall, we analyzed serum samples from 136 California Sea Lions (all age groups; MMCCLA San Pedro: n = 70, TMMC Sausalito: n = 66). In addition, we included 17 stranded Northern Fur Seals (16 pups and one subadult) that stranded in 2014 and 2015 in this study.
Immunodiffusion assays.—We performed an agar gel immunodiffusion (AGID) assay for Coccidioides specific immunoglobulin M (IgM) and immunoglobulin G (IgG) on serum samples. Samples were frozen, aliquots were
prepared by personnel of the MMCs, and were shipped on dry ice to the Public Health Laboratory at Kern Medical in Bakersfield, California. These assays were performed following the method described in Pappagianis and Zimmer (1990). This method is identical to the method performed at the School of Veterinary Science of the University of California, Davis (UC Davis), which is used to diagnose coccidioidomycosis in humans, dogs, and occasionally marine mammals (Pappagianis 2001; Gautam et al. 2013; Schmitt and Procter 2014).
Statistical analyses.—We limited all statistical tests to California Sea Lions because the number of positive AGID assays from Northern Fur Seal pups was too small to conduct meaningful statistical analyses (n = 17, with four positive tests). Furthermore, we pooled all positive immunodiffusion assays from California Sea Lions because a positive test for either IgG or IgM indicates exposure to the pathogen. We conducted statistical analyses based on the binary variable of exposure (positive vs. negative) for either test for each animal.
We used the Log-Likelihood Ratio test for Contingency Tables (Zar 1999; McDonald 2014) to determine if AGID test results of blood serum from California Sea Lions were significantly different between individual years from 2013–2015, sexes, and age classes. We conducted post-hoc power analyses with Gpower, assuming either a moderate effect size of 0.3 or a small effect size of 0.1. Finally, we used the G-test (Woolf 1957) with Yates correction for continuity (Haviland 1990) to analyze if stranding location (by county) might be indicative of a higher risk of Coccidioides exposure in California Sea Lions.
reSultS
We screened 136 serum samples from California Sea Lions admitted to MMCCLA or TMMC between 2013 and 2015 for the presence of Coccidioides specific antibodies IgM and IgG using AGID assays to investigate the prevalence of exposure to the pathogen. Serum from adult female sea lions comprised most samples obtained from animals rescued by MMCCLA at San Pedro (about 77%, n = 54); whereas, samples from TMMC in Sausalito had a fairly even distribution of sex and age groups. For both MMCCs combined, about 36% of the sea lions were adults and about 16% were pups (Table 1).
We tested California Sea Lions of all age groups that stranded between Los Angeles County and Mendocino County. Overall, 51% of serum samples were from animals recovered by MMCCLA in San Pedro and 49% from animals rescued by TMMC Sausalito (Table 2). Positive immunodiffusion assays for IgM ranged from about 8–14% between 2013–2015. The prevalence of positive IgG test results was low and ranged between about 2–3% in each year (Table 3). The proportions of California Sea Lions testing positive for IgM or IgG

72
Lauer et al. • Coccidioides antibodies in blood sera of California marine mammals.
across years was not significantly different (G = 1.427, P = 0.499). There was also no significant difference in risk of exposure to the pathogen between sexes (with year and age groups pooled; G = 0.007, P = 0.935); however, we observed a significant difference between age groups and exposure to the pathogen (with years and sex pooled; G = 10.12, P = 0.018; Table 4).
Stranding in an area closer to the endemic regions of the pathogen (Los Angeles Basin) was also not an indicator of increased risk of exposure to the pathogen in these cases (Yates corrected G = 0.020, df = 1, P = 0.888). In Los Angeles County about 13% of the 70 stranded sea lions tested positive for either IgG (1.43%) or IgM (11.43%), compared to 10.6% (3.03% positive for IgG, 7.57% positive for IgM) for all other counties combined (n = 66; Fig. 1). Overall, 10.86% of animals that stranded in either area had detectable amounts of IgM or IgG.
Results of the AGID assays from blood sera of Northern Fur Seals identified four of 17 animals positive for Coccidioides exposure. Two animals were positive for Coccidioides specific IgM only, while two additional fur seals were positive for both antibodies (all pups). No fur seals were positive for IgG alone. Most of these animals stranded in San Luis Obispo County, but strandings occurred as far north as Sonoma and Marin counties. The two Northern Fur Seal pups rescued in Los Angeles County were negative for both antibodies. Overall, 24% of Northern Fur Seal pups were positive: 12% of the pups tested positive for IgM alone and 12% tested positive for both IgM and IgG. Of the four animals that showed an immune response to Coccidioides antigens, two stranded in 2014 and two in 2015.
tAble 1. Number of stranded California Sea Lions (Zalophus californianus), by sex and age class, admitted to Marine Mammal Care Center Los Angeles in San Pedro (MMCCLA), California, and to The Marine Mammal Center in Sausalito (TMMC), California, between 2013 and 2015 that presented with a respiratory infection (n = 136) and which contributed to this study. Distribution % is the distribution of age classes from all animals at both Marine Mammal Care Centers.
MMCCLA(n = 70)
TMMC (n = 66)
Distribution % (n = 136)
Females 54 34 64.71Males 16 32 35.29Pup 2 20 16.18Yearling 2 18 14.71Juvenile 0 6 4.41Subadult 23 16 28.68Adult 43 6 36.03
tAble 2. Percentage of California Sea Lions (Zalophus californianus) of all age classes (n = 136) and Northern Fur Seals (Callorhinus ursinus), with few individuals, mostly pups (n = 17), that were part of this study, sorted by stranding location (counties, from south to north). The sea lion from Stanislaus County (not a coastal county) lived in a zoo.
Counties California sea lions %
(n = 136)Northern fur seals %
(n = 17)
Los Angeles 51.47 11.77
Santa Barbara 8.82 0
San Luis Obispo 8.08 29.40
Monterey 11.03 5.88
Santa Cruz 5.88 11.77
Stanislaus 0.74 0
San Mateo 7.35 5.88
Alamedo 0.74 0
San Francisco 2.21 5.88
Marin 1.47 5.88
Sonoma 2.21 11.77
Mendocino 0 11.77
Total 100% 100%
figure 1. Results of agarose gel immunodiffusion assays for Coccidioides specific antibodies (IgM and IgG) comparing the percentage of California Sea Lions (Zalophus californianus) that (A) stranded in north-central counties (Mendocino-Santa Barbara County) of California and (B) the percentage of animals that stranded in Los Angeles County.

73
diSCuSSion
Our results support earlier studies showing that California Sea Lions and Northern Fur Seals living along the coast of California or those migrating through this area are at risk of exposure to C. immitis, a fungal pathogen that may be transported to coastal areas via strong Santa Ana winds from endemic areas in the Mojave Desert (Simeone et al. 2015; Huckabone et al. 2015). This fugitive dust can be transported to the South Coast Air Basin that includes areas in Los Angeles, Orange, Riverside, and San Bernardino counties. Extreme weather events have been associated with cases of coccidioidomycosis in traditionally non-endemic areas of the pathogen, including one in a gorilla in the Sacramento Zoo (Pappagianis and Einstein 1978). The Northridge earthquake in 1994 is another event that transported dust and Coccidioides arthroconidia north to Sacramento, California, and into Oregon (Schneider et al. 1997). We cannot exclude the possibility that C. immitis persists or grows in soils near pinniped rookeries, however, possibly inoculated by transported dust. Muhs (1983) and Muhs et al. (2007, 2008) provided evidence from soil and dust minerology studies supported by Landsat imagery that aeolian dust originating from the Mojave Desert deposits regularly on the Channel Islands
where pinniped rookeries are established (Laake et al. 2018). Muhs (1983) estimates that dust deposit rates on San Clemente Island range between 28–31 g/m2/y, reflecting ongoing and accelerated erosion of soil surfaces disturbed by human activity in the Mojave Desert, which has increased in recent years (Sprigg et al. 2014; Tong et al. 2017). Urban et al. (2018) suggest that the minimum dust emission (PM10) from the Mojave Desert currently ranges between 3–8 Tg/y. While Atriplex polycarpa and other plants associated with Coccidioides in the San Joaquin Valley and the Mojave Desert are not established on the Channel Islands (Junak et al. 2007), other Atriplex species do occur. Recent efforts, however, to detect Coccidioides in coastal soils north of Cambria (San Luis Obispo County near a Northern Elephant Seal rookery), near Ventura (Ventura County) and on Santa Catalina Island (several different inland and coastal ecosystems) have been unsuccessful (Antje Lauer, unpubl. data). Therefore, fugitive dust from mainland sources either in California or Baja California in Mexico (Laniado-Laborin 2007) appears to be a more probable exposure risk for marine mammals along the coast of California.
Although dust generated in the Mojave Desert and transported to coastal areas has not been investigated for the presence of Coccidioides arthroconidia, indirect evidence suggests that fugitive dust generated in endemic areas of
Western Wildlife 6:69–81 • 2019
tAble 3. Results of agarose gel immunodiffusion assays for blood serum from 136 California Sea Lions (Zalophus californianus) that stranded between 2013 and 2015 and which were diagnosed with respiratory problems including suspected pneumonia. Results are separated by year of stranding and by age classes. The abbreviation n = sample size.
Sex Positive AGID assays
Age classes n Females Males IgM IgG
2013
Adult 22 21 1 3 0
Subadult/Juvenile 8 6 2 1 1
Yearling 1 0 1 0 0
Pup 5 4 1 1 0
Total n 36 31 5 5 1
Percentage 100 86.11 13.89 13.89 2.78
2014
Adult 21 17 4 1 0
Subadult/Juvenile 16 7 9 2 0
Yearling 5 4 1 0 0
Pup 9 4 5 2 1
Total n 51 32 19 5 1
Percentage 100 61.54 37.25 9.8 1.92
2015
Adult 7 7 0 0 1
Subadult/Juvenile 20 8 12 3 0
Yearling 13 13 0 0 0
Pup 8 3 5 0 0
Total n 49 24 25 3 1
Percentage 100 48.98 51.02 8.33 2.78
Total n (2013–2015) 136 87 49 13 4

74
the pathogen has caused disease elsewhere (Pappagianis and Einstein 1978; Flynn et al. 1979; Schneider et al. 1997; Fisher et al. 2012). Dust potentially carries Coccidioides arthroconidia to offshore islands and could therefore be a source of infection for pinnipeds and other marine mammals. Recently, Polymerase Chain Reaction (PCR) fragments of Coccidioides ribosomal DNA from dead California Sea Otters (Enhydra lutris nereis) found in coastal counties were shown to be 99% related to a 460 bp fragment obtained from soils west of Lancaster, California (98% query coverage, GenBank nucleotide database at the National Center for Biotechnology and Informatics [NCBI]: GenBank Accession # KY306699; Huckabone et al. 2015; Colson et al. 2017), which is consistent with the hypothesis that fugitive dust from the Antelope Valley of California is a source of exposure and possible infection with Coccidioides in traditionally non-endemic areas.
We detected no significant differences in exposure risk for California Sea Lions between 2013 and 2015. Because many adult females remain near the Channel Islands year-round, we anticipated an increased risk of pathogen exposure for these females relative to subadult and adult males, which roam to areas that are not as impacted by fugitive dust from the mainland (far out into the Pacific Ocean or further north), but our data show that both sexes had similar exposure risks (rates of seroconversion). When comparing age groups, however, we found that yearlings which made up about 16% of the sea lions did not show any evidence of seroconversion to the pathogen based on AGID assays. This led to the observed significant difference between age classes. A larger sample size may provide some insights as to whether older animals have higher risk of exposure to Coccidioides and if pups benefit from maternal antibodies for at least some time. We also expected to see a higher risk of exposure for animals stranding in counties closer to endemic areas of the pathogen, such as San Luis Obispo and Los Angeles counties, but instead we found no significant difference among locations. This
could indicate similar risks of exposure across coastal counties or could instead reflect the migratory behavior of the animals meaning that stranding location may not be a useful proxy for location of exposure.
The dramatic increase in reported coccidioidomycosis incidence among humans residing in coastal California counties since 2016 is a concern (California Department of Public Health [CDPH] 2019. Infectious diseases by disease, county, year, and sex. CDPH. Available from https://data.chhs.ca.gov/dataset/infectious-disease. [Accessed 19 September 2019]) and should also alert animal conservationists to consider potential increases among wildlife populations, including pinnipeds (Appendix Figure 2). A comparison between locations in which sea lions presented with Coccidioides exposure and location in which humans presented with coccidioidomycosis could be attempted in the future with more expanded sampling and analysis of sea lion serum. A significant increase in Coccidioides titers in screened sea lions or other pinnipeds, such as Harbor Seals (Phoca vitulina) might serve as a warning for human exposure to the pathogen. Indeed, in 2017 and 2018, TMMC reported additional cases of coccidioidomycosis among California Sea Lions and MMC San Pedro identified several suspected cases that responded to antifungal treatment (pers. observ.). In addition, it is interesting to note that California Sea Lions are being used as sentinels for ocean and public health serving as indicators for domoic acid poisoning and other health concerns (Bossart 2011).
AGID is the most commonly employed serological test used to diagnose exposure to Coccidioides in humans and animals but has not been used on pinniped blood samples on a regular basis. The sensitivity of this test when performed on canine blood serum samples was determined to be 87% for immunoglobulin G and 46% for immunoglobulin M (Gunstra et al. 2019). The sensitivity and specificity of AGID assays are generally similar to antibody Enzyme Immuno Assays (EIAs) using infected canines (Holbrook et al. 2019). In another study investigating canines, AGID for IgG and IgM was
Lauer et al. • Coccidioides antibodies in blood sera of California marine mammals.
tAble 4. Coccidioides prevalence in California Sea Lions (Zalophus californianus) that were part of this study across years (log-likelihood test; sex and age class pooled) 2013–2015, between sexes (year and age-class pooled, with Yates correction), and between age classes (years and sex pooled). Independent rather than joint comparisons were made due to sample size considerations; given that none of the comparisons were significant, no corrections for non-independence have been included. Statistical power was calculated post-hoc under assumptions of a moderate effect size of 0.3 and a small effect size of 0.1 to provide a reasonable range. The abbreviations n = sample size, df = degrees of freedom, G = G*Power, P = P-value.
Comparison CategoriesPercentage
Positiveover-all n df G P
power (0.3)
power (0.1)
between years 201320142015
16.711.78.2
365149
2 1.43 0.49 0.89 0.17
between sexes femalemale
10.312.3
8749
1 0.007 0.94 0.94 0.21
between age groups
pupyearling
subadult/juvenileadult
18.20
15.910.0
22204450
3 10.02 0.02 0.85 0.14

75
found to be 100% sensitive (100%) confirming results by histopathology (Johnson et al. 2003). Determining antibody titers can help distinguish acute from chronic disease; however, quantitative titration of antibodies does not always correlate with clinical disease in dogs or other animals (Greene and Troy 1995; Shubitz and Dial 2005; Shubitz 2007; Graupmann-Kuzma et al. 2008; Burgdorf-Moisuk et al. 2012). Therefore, AGID results should be evaluated with caution and results from ancillary diagnostic studies (e.g., from cytology, histopathology, culture, or PCR) should be included when available to confirm the diagnosis. Although this serology method has not yet been validated in sea lions or other marine mammals to correctly diagnose coccidioidomycosis, the test might serve as an indicator of exposure to the pathogen. According to Pappagianis and Zimmer (1990), the concentration of antibodies in sera from human patients generally decreases to undetectable levels for most patients with resolved infections. Therefore, patients with detectable anti-coccidioidal antibodies likely have recent exposure, illness or reactivation, or have chronic active disease.
Based from results from this and past studies, it is reasonable to assume that an AGID assay detects Coccidioides specific IgM in pinnipeds and indicates coccidioidomycosis in an early stage of the disease (acute infection). As disease progresses, IgM is replaced with IgG, which can indicate late or chronic disease process, or low levels may indicate acquired or waning immunity from previous exposure to the pathogen (Pappagianis and Zimmer, 1990). In our study, the titer of anti-Coccidioides antibodies in pinniped blood sera was not determined but would be necessary to distinguish actual disease (and the severity of it) from cell mediated immunity that indicates exposure to the pathogen (Pappagianis and Zimmer 1990). Paired serology studies would improve our ability to interpret titers (acute versus convalescent), but this method was beyond the budget of this study. Recently, Chow et al. (2017) developed an enzyme immunoassay (EIA) to detect Coccidioides specific antibodies in mammalian species in general by validating this method on dogs and mice. Neither method has been tried on blood sera from pinnipeds. A careful validation of the AGID and EIA as an indicator of both disease and exposure to Coccidioides would increase the confidence of using this method as a diagnostic tool for pinnipeds.
Because cell mediated immunity is the key mechanism of defense against coccidioidomycosis (Graupmann-Kuzma et al. 2008), early diagnosis of coccidioidomycosis, followed by treatment with an antifungal agent and supportive care that strengthens the immune system of an animal, should improve recovery from the disease. Delayed diagnosis of the disease poses the risk of dissemination, environmental contamination, unsuccessful rehabilitation, and potential death. For example, coccidioidomycosis was not considered as an
underlying cause of stranding for three sea lions (one subadult female [case # 11977, stranded in Santa Cruz County] and two juvenile males (case #12549, stranded in San Mateo County, and case #11502, stranded in San Luis Obispo County) that were euthanized or died in treatment in the same year (2011 and 2012); all animals were IgM positive for Coccidioides. Approximately 1/3 of California Sea Lions with positive immunodiffusion assays (either IgM or IgG) in this study died during treatment or were euthanized.
Use of a quantitative titer in addition to AGID assays for IgM and IgG to distinguish acquired immunity to the pathogen from acute or chronic infection, particularly if the animal does not respond to treatment for more common causes of pneumonia (bacteria and parasites) and the exclusion of other causes of respiratory disease, may enhance detection of active infections with Coccidioides. This strategy will increase the chance for successful rehabilitation and avoid expensive and ineffective treatments with potentially hazardous side effects (Butler et al. 1964; Graupmann-Kuzma et al. 2008). The focus of this study was on blood serum from animals that presented with respiratory problems, but it is important to acknowledge that not all pinnipeds that present with respiratory issues are infected with Coccidioides. Future studies should continue to examine blood serum from all stranded animals and determine if respiratory problems are a good indicator to consider coccidioidomycosis as an underlying cause of stranding in pinnipeds as it is in human patients.
We plan to continue our work with pinniped blood sera to 2021 (under NOAA permit 19706), to relate seroprevalence or rate of detected cases of coccidioidomycosis to environmental changes, such as El Niño events (in 2015 and 2016), effects of future droughts, and increases in fugitive dust from the endemic mainland due to increases in soil disturbance and dust events. Analysis of this long-term dataset may provide correlations between human and pinniped exposure and possibly disease incidence, which could provide conservationists with an early warning of expected increases in strandings due to coccidioidomycosis. We are confident that these early efforts will help to establish a continuous monitoring project for disease incidence among stranded California Sea Lions, which are the most numerous rescued pinnipeds in the MMCs, as indicators for Coccidioides exposure risk for other marine mammals along the coast of California. Our data are an important baseline to help achieve this goal. Our work will contribute to improved outcomes in pinniped rehabilitation and conservation efforts by raising awareness of a disease that is often misdiagnosed and overlooked in regions that are not endemic for Coccidioides but may be impacted by fugitive dust emission from endemic areas of the pathogen. Furthermore, assessment of the health status of stranded marine mammals not only provides valuable information concerning care of these animals but also
Western Wildlife 6:69–81 • 2019

76
Lauer et al. • Coccidioides antibodies in blood sera of California marine mammals.
provides information about existing and emerging health problems in wild populations and environmental health.
Acknowledgments.—We thank Terry Oubsuntia for performing all AGID assays. We also thank Dr. Claudia Jonah (Kern Medical Center, Public Health Laboratory) and Dr. Zed Mason (California State University, Long Beach) and his wife Helen Batchelor (MMCCLA San Pedro) for supporting our research. This work was supported financially by the California State University Council on Ocean Affairs, Science and Technology (COAST), NOAA Fisheries (permit #19706), and by the Louis Stokes Alliance for Minorities (LSAMP, National Science Foundation HRD-1302873).
literAture Cited
Aurioles, D., F. Sinsel, C. Fox, E. Alvarado, and O. Maravilla. 1983. Winter migration of subadult male California Sea Lions (Zalophus californianus) in the southern part of Baja California. Journal of Mammalogy 64:513–518.
Baptista Rosas, R.C., A. Hinojosa, and M. Riquelme. 2007. Ecological niche modeling of Coccidioides spp. in western North American deserts. Annals of the New York Academy of Sciences 1111:35–46.
Black, C., Y. Tesfaigzi, J.A. Bassein, and L.A. Miller. 2017. Wildfire smoke exposure and human health: significant gaps in research for a growing public health issue. Environmental Toxicology and Pharmacology 55:186–195.
Bossart, G.D. 2011. Marine mammals as sentinel species for oceans and human health. Veterinary Pathology 48:676–690.
Burgdorf-Moisuk, A., I.H. Stalis, and G.W. Pye. 2012. Disseminated coccidioidomycosis in a Koala (Phascolarctos cinereus). Journal of Zoo and Wildlife Medicine 43:197–199.
Butler, W.T., J.E. Bennett, D.W. Alling, P.T. Wertlake, J.P. Utz, and G.J. Hill. 1964. Nephrotoxicity of Amphotericin B - Early and late effects in 81 patients. Annual Internal Medicine 61:175–87.
Carlson-Bremer, D., C.K. Johnson, R.H. Miller, F.M. Gulland, P.A. Conrad, J.D. Wasmuth, K.M. Colegrove, and M.E. Grigg. 2012. Identification of two novel coccidian species shed by California Sea Lions (Zalophus californianus). Journal of Parasitology 98:347–354.
Chow, N.A., M.D. Lindsley, O.Z. McCotter, D. Kangiser, R.D. Wohrle, W.R. Clifford, H.D. Yaglom, L.E. Adams, K. Komatsu, M.M. Durkin, and R.J. Baker. 2017. Development of an enzyme immunoassay for detection of antibodies against Coccidioides in dogs and other mammalian species. PLoS ONE 12:e0175081. https://doi.org/10.1371/journal.pone.0175081.
Colson, A.J., L. Vredenburgh, R.E. Guevara, N.P. Rangel, C.T. Kloock, and A. Lauer. 2017. Large-
scale land development, fugitive dust, and increased coccidioidomycosis incidence in the Antelope Valley of California, 1999–2014. Mycopathologia 182:439–458.
Cooksey, G.S., A. Nguyen, K. Knutson, F. Tabnak, K. Benedict, O. McCotter, S. Jain, and D. Vugia. 2017. Notes from the field: increase in coccidioidomycosis - California, 2016. Morbidity and Mortality Weekly Report 66:833.
Cornell, L.H., K.G. Osborn, J.E. Antrim Jr, and J.G. Simpson. 1979. Coccidioidomycosis in a California Sea Otter (Enhydra lutris). Journal of Wildlife Diseases 15:373–378.
Duniway, M.C., A.A. Pfennigwerth, S.E. Fick, T.W. Naumanm, J. Belnap, and N.N. Barger. 2019. Wind erosion and dust from US drylands: a review of causes, consequences, and solutions in a changing world. Ecosphere 10:e02650. https://doi.org/10.1002/ecs2.2650.
Etyemezian V., G. Nikolich, and A. Lauer. 2018. Assessing the impacts of climate and land use/land cover change on Valley Fever incidence. Defense Technical Information Center, Technical Report AD1073439. SERDP Project RC-2650, Strategic Environmental Research and Development Program, Alexandria, Virginia.
Fauquier, D.A., F.M.D. Gulland, J.G. Trupkiewicz, T.R. Spraker, and L.J. Lowenstine. 1996. Coccidioidomycosis in free-living California Sea Lions (Zalophus californianus) in central California. Journal of Wildlife Diseases 32:707–710.
Fisher, F.S., M.W. Bultman, S.M. Johnson, D. Pappagianis, and E. Zaborsky. 2007. Coccidioides niches and habitat parameters in the southwestern United States. Annals of the New York Academy of Sciences 1111:47–72.
Fisher, F., M.W. Bultman, M.E. Gettings, S.M. Johnson, D. Pappagianis, and N.M. Ampel. 2012. A habitat overview, Valley Fever and Airborne Dust Forecasts and Simulation Workshop. Pp. 180 in Airborne Dust Models: A Tool in Environmental Health Tracking; final report, the U.S. Centers for Disease Control and Prevention and the National Aeronautics and Space Administration’s program in Applied Sciences for Health and Air Quality. Sprigg, W.A., J.N. Galgiani, S. Nickovic, G. Pejanovic, M. Vujadinovic, A. Vukovic, A. Prasad, S. Petkovic, H. El-Askary, R. Gaddi, and Z. Janjic (Eds.). Center of Disease Control and Prevention, Atlanta, Georgia.
Flynn, N.M., P.D. Hoeprich, M.M. Kawachi, K.K. Lee, R.M. Lawrence, E. Goldstein, G.W. Jordan, R.S. Kundargi, and G.A. Wong. 1979. Unusual outbreak of windborne coccidioidomycosis. New England Journal of Medicine 301:358–361.
Gautam, R., I. Srinath, A. Clavijo, B. Szonyi, M. Bani-Yaghoub, S. Park, and R. Ivanek. 2013. Identifying areas of high risk of human exposure to coccidioidomycosis

77
in Texas using serology data from dogs. Zoonoses and Public Health 60:174–181.
Gerber, J.A., J. Roletto, L.E. Morgan, D.M. Smith, and L.J. Gage 1993. Findings in pinnipeds stranded along the central and northern California coast, 1984–1990. Journal of Wildlife Diseases 29:423–433.
Graupmann-Kuzma, A., B.A. Valentine, L.F. Shubitz, S.M. Dial, B. Watrous, and S.J. Tornquist. 2008. Coccidioidomycosis in dogs and cats: a review. Journal of the American Animal Hospital Association 44:226–235.
Grayzel, S.E., B. Martínez-López, and J.E. Sykes. 2017. Risk factors and spatial distribution of canine coccidioidomycosis in California, 2005–2013. Transboundary and Emerging Diseases 64:1110–1119.
Greig, D.J., F.M. Gulland, and C.A. Kreuder. 2005. Decade of live California Sea Lion (Zalophus californianus) strandings along the Central California Coast: causes and trends, 1991–2000. Aquatic Mammalogy 31:11–22.
Greene, R.T., and G.C. Troy. 1995. Coccidioidomycosis in 48 cats: a retrospective study (1984–1993). Journal of Veterinary Internal Medicine 9:86–91.
Guevara, R.E., T. Motala, and D. Terashita. 2015. The changing epidemiology of coccidioidomycosis in Los Angeles (LA) County, California, 1973–2011. PloS ONE 10:e0134753. https://doi.org/10.1371/journal.pone.0136753.
Gunstra, A., J.A. Steurer, R.L. Seibert, B.C. Dixon, and D.S. Russell. 2019. Sensitivity of serologic testing for dogs diagnosed with coccidioidomycosis on histology: 52 Cases (2012–2013). Journal of the American Animal Hospital Association 55:238–242.
Hand, J.L., W.H. White, K.A. Gebhart, N.P. Hyslop, T.E. Gill, and B.A. Schichtel. 2016. Earlier onset of the spring fine dust season in the southwestern United States. Geophysical Research Letters 43:4001–4009.
Haviland, M.G. 1990. Yates's correction for continuity and the analysis of 2×2 contingency tables. Statistics in Medicine 9:363–367.
Hector, R.F., G.W. Rutherford, C.A.Tsang, L.M. Erhart, O. McCotter, S.M. Anderson, K. Komatsu, F. Tabnak, D.J. Vugia, Y. Yang, and J.N. Galgiani. 2011. The public health impact of coccidioidomycosis in Arizona and California. International Journal of Environmental Research in Public Health 8:1150–1173.
Holbrook, E.D., R.T. Greene, S.I. Rubin, J.S. Renschler, B.P. Book, A.S. Hanzlicek, M.M. Durkin, M.L. Smedema, and L.J. Wheat. 2019. Novel canine anti-Coccidioides immunoglobulin G enzyme immunoassay aids in diagnosis of coccidioidomycosis in dogs. Medical Mycology 57:800–806.
Huckabone, S.E., F.M.D. Gulland, S.M. Johnson, K.M. Colegrove, E.M. Dodd, D. Pappagianis, R.C. Dunkin, D. Casper, E.L. Carlson, J.E. Sykes, and W. Meyer. 2015. Coccidioidomycosis and other systemic mycoses of marine mammals stranding along the
central California, USA coast: 1998–2012. Journal of Wildlife Diseases 51:295–308.
Johnson, L.R., E.J. Herrgesell, A.P. Davidson, and D. Pappagianis. 2003. Clinical, clinicopathologic, and radiographic findings in dogs with coccidioidomycosis: 24 cases (1995–2000). Journal of the American Veterinarian Medical Association 222:461–466.
Junak, S., D.A. Knapp, J.R. Haller, R. Philbrick, A.L. Schoenherr, and T. Keeler-Wolf. 2007. The California Channel Islands. Terrestrial Vegetation of California. 3rd Edition. University of California Press, Berkeley, California.
Kirkland, T.N., and J. Fierer. 1996. Coccidioidomycosis: a reemerging infectious disease. Emerging Infectious Diseases 2:192.
Kolden, C., and J. Abatzoglou. 2018. Spatial distribution of wildfires ignited under katabatic versus non-katabatic winds in Mediterranean Southern California USA. Fire 1:19.
Laake, J.L., M.S. Lowry, R.L. DeLong, S.R. Melin, and J.V. Carretta. 2018. Population growth and status of California Sea Lions. Journal of Wildlife Management 82:583–595.
Laake, J.L., S.R. Melin, A.J. Orr, D.J. Greig, K.C. Prager, R.L. DeLong, and J.D. Harris. 2016. California Sea Lion sex- and age-specific morphometry. National Oceanographic and Atmospheric Administration, Technical Memorandum NMFS-AFSC-312. https://doi.org/10.7289/V5/TM-AFSC-312.
Laniado-Laborin, R. 2007. Expanding understanding of epidemiology of coccidioidomycosis in the western hemisphere. Annals of the New York Academy of Sciences 1111:19–34.
McDonald, J.H. 2014. G–test of goodness-of-fit. Pp. 53–58 In Handbook of Biological Statistics. 3rd Edition. McDonald, J.H. (Ed.). Sparky House Publishing, Baltimore, Maryland.
Muhs, D.R. 1983. Quaternary sea-level events on northern San Clemente Island, California. Quaternary Research 20:322–341.
Muhs, D.R., J.R. Budahn, D.L. Johnson, M. Reheis, J. Beann, G. Skipp, E. Fisher, and J.A. Jones. 2008. Geochemical evidence for airborne dust additions to soils in Channel Islands National Park, California. Geological Society of America Bulletin 120:106–126.
Muhs, D.R., J. Budahn, M. Reheis, J. Beann, G. Skipp, and E. Fisher. 2007. Airborne dust transport to the eastern Pacific Ocean off southern California: evidence from San Clemente Island. Journal of Geophysical Research: Atmospheres 112:1–17.
Pappagianis, D. 1980. Epidemiology of coccidioidomycosis. Pp. 63–85 In Coccidioidomycosis. Pappagianis, D. (Ed.). Springer, Boston, Massachusetts.
Pappagianis D. 2001. Serologic studies in coccidioidomycosis. Seminars in Respiratory Infection 16:242–250.
Pappagianis, D., and H. Einstein. 1978. Tempest from
Western Wildlife 6:69–81 • 2019

78
Tehachapi takes toll or Coccidioides conveyed aloft and afar. Western Journal of Medicine 129:527–530.
Pappagianis, D, and B.L. Zimmer. 1990. Serology of coccidioidomycosis. Clinical Microbiology Reviews 3:247–268.
Reed, R.E., G. Migaki, and J.A. Cummings. 1976. Coccidioidomycosis in a California Sea Lion (Zalophus californianus). Journal of Wildlife Diseases 12:372–375.
Reidarson, T.H., L.A. Griner, D. Pappagianis, and J. McBain. 1998. Coccidioidomycosis in a Bottlenose Dolphin. Journal of Wildlife Diseases 34:629–631.
Schmitt, T.L. and D.G. Procter. 2014. Coccidioidomycosis in a Pacific Walrus (Odobenus rosmarus divergens). Journal of Zoo and Wildlife Medicine 45:173–175.
Schneider, E., R.A. Hajjeh, R.A. Spiegel, R.W. Jibson, E.L. Harp, G.A. Marshall, R.A. Gunn, M.M. McNeil, R.W. Pinner, R.C. Baron, and R.C. Burger. 1997. A coccidioidomycosis outbreak following the Northridge, California, earthquake. Journal of the American Medical Association 277:904–908.
Shubitz, L.F. 2007. Comparative aspects of coccidioidomycosis in animals and humans. Annals of the New York Academy of Sciences 1111:395–403.
Shubitz, L.F., and S.M. Dial. 2005. Coccidioidomycosis: a diagnostic challenge. Clinical Techniques in Small Animal Practice 20:220–226.
Simeone, C.A., F.M. Gulland, T. Norris, and T.K. Rowles. 2015. A systematic review of changes in marine mammal health in North America, 1972–2012: the need for a novel integrated approach. PloS ONE 10:e0142105. https://doi.org/10.1371/journal.pone.0142105.
Simpson, J.G., and L.H. Cornell. 2018. Diseases associated with stranding and captivity. Pp. 35–70 In Pathobiology of Marine Mammal Diseases. Howard,
E.B. (Ed.). CRC Press, Taylor and Francis Group, Los Angeles, California.
Sprigg, W.A., S. Nickovic, J.N. Galgiani, G. Pejanovic, S. Petkovic, M. Vujadinovic, A. Vukovic, M. Dacic, S. DiBiase, A. Prasad, and H. El-Askary. 2014. Regional dust storm modeling for health services: the case of Valley Fever. Aeolian Research 14:53–73.
Thompson, III, G.R., A. Stevens, K.V. Clemons, J. Fierer, R.H. Johnson, J. Sykes, G. Rutherford, M. Peterson, J.W. Taylor, and V. Chaturvedi. 2015. Call for a California coccidioidomycosis consortium to face the top ten challenges posed by a recalcitrant regional disease. Mycopathologia 179:1–9.
Tong, D.Q., J.X. Wang, T.E. Gill, H. Lei, and B. Wang. 2017. Intensified dust storm activity and Valley Fever infection in the Southwestern United States. Geophysical Research Letters 44:4304–4312.
Urban, F.E., H.L. Goldstein, R. Fulton, and R.L. Reynolds. 2018. Unseen dust emission and global dust abundance: documenting dust emission from the Mojave Desert (USA) by daily remote camera imagery and wind-erosion measurements. Journal of Geophysical Research: Atmospheres 123:8735–8753.
Valdivia, L., D. Nix, M. Wright, E. Lindberg, T. Fagan, D. Lieberman, T.P. Stoffer, N.M. Ampel, and J.N. Galgiani. 2006. Coccidioidomycosis as a common cause of community-acquired pneumonia. Emerging Infectious Disease 12:958.
Westerling, A.L., D.R. Cayan, T.J. Brown, B.L. Hall, and L.G. Riddle. 2004. Climate, Santa Ana winds and autumn wildfires in southern California. Eos, Transactions American Geophysical Union 85:289–296.
Woolf, B. 1957. The log likelihood ratio test (the G-test). Annals of Human Genetics 21:397–409.
Zar, J.H. 1999. Biostatistical Analysis. 4th Edition. Prentice–Hall, Inc., Upper Saddle River, New Jersey.
Antje lAuer is a Professor at California State University Bakersfield (CSUB) having taught there since 2007. She received her M.S. in Biology from the University in Oldenburg, Germany, her Ph.D. in Microbiology from the University of Kiel, Germany, and obtained additional research experience at the University of North Carolina at Chapel Hill (Department of Marine Sciences) and at James Madison University in Virginia (Department of Biology). At CSUB, she teaches courses in Environmental and Medical Microbiology and is currently conducting research on Valley Fever in California. (Photographed by Nancy Lauer).
lAuren PAlmer has been the Staff Veterinarian at Marine Mammal Care Center Los Angeles (California) since 2005. She has contributed to several publications on Elephant Seal (Mirounga angustirostris) anatomy, pinniped parasitology, and infectious diseases of stranded marine mammals. She received her Veterinary degree from the University of Minnesota, Minneapolis, Minnesota, her Master of Public Health degree from the University of Iowa, Iowa City, Iowa, and an undergraduate degree in Environmental Science from California State University, Northridge. (Photographed by Lauren Palmer).
Lauer et al. • Coccidioides antibodies in blood sera of California marine mammals.

79
CArl KlooCK has been at California State University Bakersfield since 2001 and is a Professor of Biology. He received his B.S. (1989) in Zoology and M.S. (1991) in Ecology from the University of California, Davis, and his Ph.D. in Evolution, Ecology and Behavioral Biology from Michigan State University, East Lansing (2000). He is a Behavioral Ecologist and works primarily on problems of aggressive mimicry, particularly in arachnids. (Photographed by Carl Kloock).
Heather Liwanag is an Assistant Professor of Biology at Cal Poly San Luis Obispo, California. She earned her B.S. in Biology from the University of California, San Diego, a Ph.D. in Ecology & Evolutionary Biology from the University of California, Santa Cruz, and was a post-doctoral fellow at the University of California, San Diego, and the California State University, Northridge. She is interested in the physiological adaptations of animals to their environment, and the evolutionary processes involved in those adaptations. (Photographed by Center for Teaching, Learning & Technology at Cal Poly San Luis Obispo).
tenAyA norriS has been involved in marine mammal research and conservation since 2004. She completed her Master’s degree at Moss Landing Marine Laboratories, Sausalito, California, in 2013. For her thesis research, she studied the efficacy of translocations as a conservation strategy for endangered Hawaiian Monk Seals (Monachus schauinslandi). In her current role as Marine Scientist at The Marine Mammal Center, Sausalito, California, Tenaya collaborates with scientists in the USA and Mexico to study the abundance, distribution, foraging behavior, habitat use, and health of pinnipeds in the California Current System, particularly Guadalupe Fur Seals (Arctocephalus townsendi). (Photographed by Brandon Stone).
birgitte mCdonAld is an Assistant Professor at Moss Landing Marine Laboratories, Moss Landing, California, where she has been teaching courses on Ecology and Physiology of Marine Vertebrates and Scientific skills since 2015. She obtained her Ph.D. at the University of California, Santa Cruz, and conducted postdoctoral research at Scripps Institution of Oceanography, San Diego, California, and Aarhus University in Denmark. As a Physiological and Behavioral Ecologist, Gitte investigates adaptations that allow animals to survive in extreme environments. (Photographed by Inge McDonald).
jAzmine mejiA muñoz received her B.S. in Biology from California State University, Bakersfield. She is currently a graduate student in the Environmental Science Master of Science program at California State University, Monterey Bay. She is a Louis Stokes Alliance for Minority Participation (LSAMP) Scholar, a Maximizing Access to Research Careers Undergraduate Student Training in Academic Research (MARC U-STAR) Scholar, a Sally Casanova Scholar, and a Fuhs Fellow. (Photographed by Anna Jacobsen).
CAtherine mulCAhy received a B.S. degree from Worcester State University, Worcester, Massachusetts, in 2014 and was a Research Assistant at The Marine Mammal Center, Sausalito, California, from 2015–2016. (Photographed by Catherine Mulcahy).
ShAwn hAnnAh is a graduate student at Moss Landing Marine Laboratories (MLML), Moss Landing, California, working toward her M.S. in Marine Science, and she received her B.S. in Biology at Cal Poly San Luis Obispo, California. At MLML, Shawn is examining the plasticity of the dive response of Northern Elephant Seals (Mirounga angustirostris) and how it is affected by fine-scale dive behavior. (Photographed by Lauren Cooley).
ShAwn johnSon joined The Marine Mammal Center in Sausalito, California, in 2012. His role as Director of Veterinary Science is to guide the science team's study of marine mammal health issues around cancer in sea lions, toxic algae poisoning effects, and Harbor Seal (Phoca vitulina) health analysis, among others. He has also worked with the Alaska Sealife Center, Alaska's Fish and Wildlife Services, the National Marine Mammal Laboratory, the Oiled Wildlife Care Network and the Wildlife Health Center at the University of California, Davis. (Photographed by Elena Graham © The Marine Mammal Center).
Western Wildlife 6:69–81 • 2019

80
APPendix tAble. Information about California Sea Lions (Zalophus californianus) diagnosed with coccidioidomycosis postmortem between 2005 and 2014 at The Marine Mammal Center (TMMC) in Sausalito, California. Age classes are based on straight length of body (Laake et al. 2016). Abbreviations for age classes are Y = yearling, J = juvenile, S = subadult, and A = adult, and for sexes are M = male and F = female.Case # Date County Age class Sex Result Cause of death6519 30 April 2005 San Luis
ObispoY M died in treatment disseminated coccidioidomycosis,
malnutrition6897 5 June 2006 Santa Barbara J M died in treatment disseminated coccidioidomycosis,
malnutrition7036 17 September 2006 San Luis
ObispoA F died in treatment disseminated coccidioidomycosis,
malnutrition7830 13 August 2008 Santa Cruz A F euthanized severe coccidioidomycosis,
domoic acid toxicity, malnutrition8108 4 May 2009 Santa Cruz A F died in treatment disseminated coccidioidomycosis,
domoic acid toxicity9739 2 July 2010 San Luis
ObispoY F died in treatment peritonitis (unknown), malnutri-
tion9748 4 July 2010 Monterey S M died in treatment peritonitis (unknown)9991 7 July 2011 Santa Cruz S F died in treatment disseminated coccidioidomycosis10054 13 August 2011 San Luis
ObispoA F died in treatment disseminated coccidioidomycosis,
sepsis10279 3 June 2012 Monterey S M died in treatment disseminated coccidioidomycosis,
sepsis (perforation)10630 21 April 2013 Monterey J M euthanized disseminated coccidioidomycosis,
myocardinal infarction10700 14 August 2013 Monterey J M euthanized disseminated coccidioidomycosis
APPendix figure 1. (A) Example of dust transport from mainland California during Santa Ana conditions on 9 February 2002 (modified from NASA image, Multi-angle Imaging SpectroRadiometer [MISR] 2019). (B) Sparked by strong Santa Ana winds, inland dust and smoke from the Thomas Fire (13 December 2017) was carried several hundred miles into the Pacific Ocean (modified from NASA image, NASA Worldview Application operated by the NASA/Goddard Space Flight Center Earth Science Data and Information System [ESDIS] project). Actively burning areas were detected by Moderate Resolution Imaging Spectroradiometer [MODIS]; thermal bands are displayed in red. The numbers refer to Channel Islands of California. 1: San Miguel Island, which supports major California Sea Lion (Zalophus californianus) and Northern Fur Seal (Callorhinus ursinus) rookeries, 2: Santa Rosa Island, 3: Santa Cruz Island, 4: Santa Barbara Island, 5: San Nicolas Island (major California Sea Lion rookeries), 6: Santa Catalina Island, 7: San Clemente Island.
Lauer et al. • Coccidioides antibodies in blood sera of California marine mammals.

81
APPendix figure 2. Reported incidence of coccidioidomycosis in humans residing in coastal California counties between 2001 and 2018. Counties are shown from south (bottom) to north (top; data obtained from: https://data.chhs.ca.gov/dataset/infectious-disease).
Western Wildlife 6:69–81 • 2019

82
2019 AnnuAl Meeting Review
Program Chair: Matthew Bettelheim. AECOM.
Attendance: 616 participants including 153 students and 57 Early Career Professionals.
Plenary Theme: Death And Taxas: Extinction and Speciation During the Anthropocene.
Plenary Speakers: Dr. Alexis Mychajliw, Paleobiologist, La Brea Tar Pits of Los Angeles, California; Dr. Peter H. Bloom, Zoologist, V.P. , Bloom Biological, Inc.; Dr. Ben Sacks, Professor, University of California, Davis; Tom Maloney, Director of Conservation, Revive & Restore.
Keynote Address: Adapt or Die: Changes in who we serve and who we are. Dr. Jennifer Malpass, Bird Banding Lab Biologist at the USGS Patuxent Wildlife Research Center.
Awards Bestowed
• The Raymond F. Dasmann Award for the Professional of the Year went to David J. Germano.
• The Conservationist of the Year Award went to the Yosemite Conservancy.
• The Chapter of the Year Award went to the Nevada Chapter.• The James D. Yoakum for Outstanding Service and
Commitment to The Western Section of The Wildlife Society went to Cynthia Perrine and Richard Burg.
Student Presentation Awards
Oral Presentations:
1st Place: Leila S. Harris, Assessment of the status of the Townsend’s big-eared bat in California, University of California, Davis
2nd Place: Connor M. Wood, Broad-scale monitoring for broad-scale challenges: bioacoustics and the California spotted owl, University of Wisconsin-Madison
3rd Place: Trinity N. Smith, Elucidating patterns of bat species occupancy across a disturbed landscape in California’s Central Valley, Humboldt State University
Best Posters:
1st Place: Diana Munoz, Feral horses disrupt greater sage-grouse lekking activity in the Great Basin, US Geological Survey/UC Davis
2nd Place: Matthew Delgado, Ornament morphology and soft tissue and skeletal correlates in Aleutian cackling geese (Branta hutchinsii leucopareia), Humboldt State University
3rd Place: Shelby P. Moshier, Climate change vulnerability is phylogenetically clustered for most of California’s birds, California State University, Fresno
2019 Western Section Membership
Regular: 670 Life-Full: 35
Student: 181 Life-Partial: 5
Early Career Professional: 118 Honorary: 1
Retired: 54 Supporting: 14
Contributing: 1
Total: 1079

83
TWS WeSTern SecTion Board MeMBerS
Executive Committee
President Matthew BettelheimAECOM
Past-PresidentJeff DavisColibri Ecological Consulting
President-ElectKelly HollandGEI Consultants
Section RepresentativeCynthia PerrineTWS Western Section
TreasurerJohn McNerneyCity of Davis
Secretary Bridget Sousa, AWB®Swaim Biological, Inc.
Student Chapter Representatives
Cal Poly San Luis Obispo Ryan Vosbigian
Humboldt StateSarah Daniel
San Francisco State Noelle Kasilly
UC Davis Bruce Markman
UC Santa Barbara Dimitri Katsiouleris
University of Nevada, Reno Krymsen Hernandez
Chapter Representatives
California Central CoastClint ScheuermanEnvironmental Consultant
California North CoastElizabeth MeismanGHD Inc.
HawaiiLaura LutherUniversity of Hawai’i
NevadaMitchell GrittsNevada Dept of Wildlife
Sacramento-ShastaCarlos AlvaradoAscent Environmental
San Francisco Bay AreaNatasha DvorakSwaim Biological, Inc.
San Joaquin ValleyRandi McCormickMcCormick Biological
Southern CaliforniaJeff Lincer
Contractors
AccountantMike Chapel
Program DirectorCynthia Perrine
Project Manager and Meeting PlannerCandace Renger
WebmasterEric Renger
Workshop CoordinatorIvan Parr
Committee Chairs
Awards and GrantsRichard BurgCalifornia Dept. Fish & Wildlife
Communications ChairSuzanne MarczakSan Diego Zoo Institute for Conservation Research
Conservation AffairsKelly HollandGEI Consultants
Diversity Committee – Ad HocBayan AhmedDept of Water Resources
Membership/HistorianDon Yasuda, CWB®USDA Forest Service
Professional DevelopmentJanine Payne
Student AffairsKatie SmithCDFW/UC Davis
Western WildlifeHoward O. Clark, Jr., CWB®Colibri Ecological Consulting, LLC