Embed Size (px)
Citation preview

1
Detecting Hunts in Wildlife DocumentariesNiels C. Haering, Richard J. Qian, M. Ibrahim Sezan, and Niels daVitoria Lobo
N. C. Haering and N. Lobo are with the University of Central Florida, Orlando, Florida, U.S.A.R. J. Qian and M. I. Sezan are with Sharp Labs of America, Camas, Washington, U.S.A.January 11, 1999 DRAFT

2AbstractWe propose a multi-level video event detection methodology and apply it to animal hunt detection inwildlife documentaries. The proposed multi-level approach has three levels. The �rst level extracts color,texture, and motion features, and detects moving object blobs. The mid-level employs a neural networkto verify whether the moving object blobs belong to animals. This level also generates shot descriptorsthat combine features from the �rst level and contain results of mid-level, domain speci�c inferences madeon the basis of shot features. The shot descriptors are then used by the domain-speci�c inference processat the third level to detect the video segments that contain hunts. The proposed approach can be appliedto di�erent domains by adapting the mid and high-level inference processes. Event based video indexing,summarization and browsing are among the applications of the proposed approach.KeywordsVideo content analysis; content-based indexing and retrieval; browsing and visualization.I. IntroductionThe amount of video information that can be accessed and consumed from people'sliving rooms has been ever increasing. This trend may be further accelerated due to theconvergence of both technology and functionalities supported by future television receiversand personal computers. To obtain the information that is of interest and to provide betterentertainment, tools are needed to help users to extract relevant content and to e�ectivelynavigate through the large amount of available video information. For ordinary users, suchtools may also have to satisfy the following requirements: (1) they should be easy to usein terms of operations; and (2) they should be easy to understand and predict in terms ofbehaviors.Existing content-based video indexing and retrieval methods do not seem to provide thetools which are called for in the above applications. Most of those methods may be clas-si�ed into the following three categories: (1) syntactic structurization of video; (2) videoclassi�cation; and (3) extraction of semantics. The work in the �rst category has concen-trated on (a) shot boundary detection and key frame extraction, e.g., [1], [33]; (b) shotclustering, e.g., [31]; (c) table of content creation, e.g., [9]; (d) video summarization, e.g.,[20]; and (e) video skimming [26]. These methods are in general computationally simpleand their performance is relatively robust. Their results, however, may not necessarily besemantically meaningful or relevant since they do not attempt to model and estimate theJanuary 11, 1999 DRAFT

3semantic content of the video. For consumer oriented applications, semantically irrelevantresults may distract the user and lead to frustrating search or browsing experience. Thework in the second category tries to classify video sequences into certain categories suchas news, sports, action movies, close-ups, crowd, etc. [17], [28]. These methods provideclassi�cation results which may facilitate users to browse video sequences at a coarse level.Video content analysis at a �ner level is probably needed, to more e�ectively help users�nd what they are looking for. In fact, consumers often express their search items in termsof more exact semantic labels, such as keywords describing objects, actions, and events.The work in the third category has been mostly speci�c to particular domains. For exam-ple, methods have been proposed to detect certain events in (a) football games [16]; (b)soccer games [32]; (c) basketball games [25]; (d) baseball games [18]; and (e) sites undersurveillance [5]. The advantages of these methods include that the detected events are se-mantically meaningful and usually signi�cant to users. The major disadvantage, however,is that many of these methods are heavily dependent on speci�c artifacts such as editingpatterns in the broadcast programs, which makes them di�cult to extend for the detectionof other events. A query-by-sketch method has also been proposed recently in [2] to detectcertain motion events. The advantage of this method is that it is domain-independentand therefore may be useful for di�erent applications. For consumer applications, how-ever, sketching needs cumbersome input devices, specifying a query sketch may take undueamounts of time and learning the sketch conventions may discourage users from using suchtools.In this paper, we propose a computational framework and several algorithmic compo-nents towards an extensible solution to semantic event detection. The automated eventdetection algorithm may enable users to e�ectively �nd certain semantically signi�cantevents in their video content and help generate semantically meaningful highlights for fastbrowsing. In contrast to most existing event detection work, our goal is to develop anextensible computational approach which may be adapted to detect di�erent events indi�erent domains. To achieve this goal, we propose a three-level video event detectionalgorithm. The �rst level extracts color, texture, and motion features, and detects movingobject blobs. The mid-level employs a neural network to verify whether the moving blobsJanuary 11, 1999 DRAFT

4belong to objects of interest. This level also generates shot descriptors that combine fea-tures from the �rst level and contain results of mid-level, domain speci�c inferences madeon the basis of shot features. The shot descriptors are then used by a domain-speci�cinference process at the third level to detect the video segments that contain events ofinterest. To test the e�ectiveness of our algorithm, we have applied it to detect animalhunt events in wildlife documentaries. In our implementation we do not attempt to detectthe stalking phase that precedes many hunts. Our purpose is to detect the swift or rapidchase of a eeing or running animal. Since hunts are among the most interesting events ina wildlife program, the detected hunt segments can be composed into a program highlightsequence. The proposed approach can be applied to di�erent domains by adapting themid and high-level inference processes while directly utilizing the results from the low-levelfeature extraction processes.In the following section, we describe the proposed computational framework and its algo-rithmic components. In Section 3, we present experimental results obtained as we appliedthe proposed algorithm to detection of animal hunt events in a number of commerciallyavailable wildlife video tapes. Implementation details are also furnished in Section 3.Finally in Section 4, we summarize our work and discuss some future directions.II. MethodologyWe focus on the classi�cation and detection of non-rigid, amorphous or articulate naturalobjects, such as animals, trees, grass, sky, clouds, etc., as well as the motion of objects insuch scenes. Our approach therefore has object classi�cation and motion detection com-ponents. The object classi�cation component makes use of feature extraction methodsbased on multi-resolution Gabor �lters, the Gray-Level Co-occurrence Matrix (GLCM),the fractal dimension, and color. The feature representations of the objects are then classi-�ed by a back-propagation neural network and combined with shot boundary informationand frame motion estimates to detect semantic events such as predators hunting prey.The problem of detecting semantic events in video, e.g., hunts in wildlife video, can beseen as having three levels as shown in Figure 1. At the lowest level we determine theboundaries between shots, estimate the global motion, and express each frame in a colorand texture space. We also compensate for the estimated global motion between each pairJanuary 11, 1999 DRAFT

5of frames. The earlier frame of each pair is transformed by the motion estimate and adi�erence image is produced to highlight areas of high residual error. We assume that thisresidual error is mostly due to independent object motion, and therefore the highlightedareas correspond to independently moving objects which are also referred as motion blobs.At the intermediate level the detected motion blobs are then veri�ed with the classlabels assigned to that region by a neural network. The network uses the color and texturerepresentation of the input obtained by the lower level, and performs a crude classi�cationof image regions into sky, grass, tree, rock, and animal regions. If (1) the motion betweentwo consecutive frames is large, (2) a blob exists that has a high motion residual (motionother than that of the background), and whose motion and position in consecutive framesvaries smoothly, and (3) is labeled as animal region by the network then we assert that weare tracking a fast moving animal. The intermediate level generates and integrates suchframe information and produces a summary for an entire shot. If throughout the shotthere was support for a fast moving animal and the location/motion of the animal wasfound to be stable enough then the shot summary will indicate that a fast moving animalwas tracked throughout the shot.At the highest level a domain speci�c analysis of these shot summaries is used to inferthe presence of a hunt in the underlying video sequence.Motion Blob Verification
Texture/Color Analysis
Event Inference
Detected Events
Shot Summarization
Motion Estimation Shot Detection
Video SequencesFig. 1. The owchart of our method.January 11, 1999 DRAFT

6A. Global Motion Estimation and Motion Blob DetectionWe assume that the global motion can be estimated with a three parameter systemallowing only for zoom, horizontal and vertical translation.u(x; y) = a0 + a2xv(x; y) = a1 + a2yThe robust recovery of the three parameters has to deal with the following problems,� corresponding points in adjacent frames are often far apart (50-60 pixel displacementsare not uncommon, peak displacements exceed 100 pixels),� interlacing between frames drastically changes the appearance of small objects and tex-tures in adjacent frames,� the object and hence the global motion we are trying to estimate is often very large andmotion blur eliminates texture in the direction of that motion (of course the motion inthis direction is also the motion we are most interested in),� often animals need to be tracked under strongly varying lighting conditions and occlusion,as when a hunt leads through areas with trees or bushes.Given the large possible displacements between corresponding patches of adjacent framesan exhaustive search creates unreasonable processing requirements. Therefore we use apyramid of reduced resolution representations of each frame. At each level of the 5-levelpyramid we consider matches from a 5� 5 neighborhood around the location of the patchin the source frame, enabling a maximum matching distance of 62 pixels. The levels ofthe pyramid are obtained by subsampling the lower level image rather than computing amore accurate Gaussian pyramid. We expect the use of a Gaussian pyramid to producebetter results at a slight computational cost.At the lowest level of the pyramid, i.e. the full resolution representation of the frame,the patches used for matching are of size 64� 64. Patches from uniform areas often resultin erroneous displacement estimates. To avoid matching such patches we discard patcheswith insu�cient \texture". We use a 2D variance measure to determine the \amount oftexture". varx = nXj=0( mXi=0(a(i; j)� a(:; j))2 � a(:; :))2January 11, 1999 DRAFT

7vary = nXj=0( mXi=0(a(i; j)� a(i; :))2 � a(:; :))2where a(i; j) is an m� n image patch, a(i; :); a(:; j); and a(:; :) are the averages of the ithrow, the jth column, and the entire patch a respectively.We compute motion estimates at each of the four corners of a frame, as shown inFigure 5(a). Bad motion estimates are often due to matching errors made high up inthe pyramid that are subsequently not recovered by the lower levels. Since the motionof the tracked animals often does not vary drastically between consecutive frames (i.e.their acceleration is small) we also use the previous best motion estimate to predict thelocation of the four patches in the next frame. A limited search in a 5� 5 neighborhoodaround the predicted location, improves the motion estimates in many cases. Thereforewe obtain up to eight motion estimates, one pyramid based estimate for each of the fourpatch locations, and one for each of the four estimates based on a limited search aroundthe predicted match locations. Since some patches may not pass the \texture" test wemay have fewer than eight motion estimates. The highest normalized dot product betweena source patch P1 and matched patch P2 determines the \correct" global motion estimatebetween the current and next frame. The normalized dot product is equal to the cosineof the angle (�) between the two patches (vectors) P1, and P2:cos(�)P1;P2 = Pi;j P1(i; j)P2(i; j)Pi;j P1(i; j)Pi;j P2(i; j)We would like to point out that� almost all wildlife videos are taken with a tele lens at a great distance to the objects ofinterest. For our motion analysis, we therefore assume an orthographic model, in whichthe camera pan and tilt appear as plain translations, thus supporting our assumption ofuniform background motion,� motion estimates based on the feature space representation of the frames are very similarto those obtained on the original color frames, and� although the described motion estimation scheme is su�cient for our purpose a Kalman�lter based approach [11] might yield more consistent results.The motion estimates are then used to compensate for the global motion between con-secutive frames. Finally, we use the grayvalue di�erence between the current image andJanuary 11, 1999 DRAFT

8the motion compensated next frame to estimate the location of the animal in the frame.Areas with low residual error are assumed to have motion values similar to those of thebackground and are ignored. The independent motion of animals on the other hand usuallycauses high residual errors between the current frame and the following motion compen-sated frame. Therefore we can make use of a robust estimation technique to obtain anestimate of the animal location within the frame. This estimation technique iterativelyre�nes the mean x and y values dependent on the residual error within a �xed size neigh-borhood around the mean values for the entire di�erence image. The robust estimationmethod was �rst developed in [24] for real-time human face tracking. Here we brie ydescribe how the method is applied to the application discussed in this paper. Based onthe frame di�erence result, the algorithm constructs two 1D histograms by projecting theframe di�erence map along its x and y direction, respectively. The histograms, therefore,represent the spatial distributions of the motion pixels along the corresponding axes. Fig-ure 2(a) illustrates an ideal frame di�erence map where there is only one textured ellipticalmoving object in the input sequence, and the corresponding projection histograms.x
y
h(y)
h(x)
x
h(x) mean(k+1)
trimmed interval(k)trimmed interval(k+1)
mean(k)(a) (b)Fig. 2. (a) Two 1D histograms constructed by projecting the frame di�erence map along the x and ydirection, respectively. (b) Robust mean estimation for locating the center position of a dominantmoving object.The instantaneous center position and size of a object in the image can be estimatedbased on statistical measurements derived from the two 1D projection histograms. Forexample, a simple method estimates the center position and size of a dominant movingobject in an input sequence using the sample means and standard deviations of the dis-January 11, 1999 DRAFT

9tributions. More speci�cally, let hx(i); i = 0; 1; : : : ; and hy(i); i = 0; 1; : : :, denote theelements in the projection histograms along the x and y direction, respectively. Then theobject center position (xc; yc) and object width and height (w; h) may be estimated as:xc=Pi xihx(i)Pi hx(i) ; yc=Pi yihy(i)Pi hy(i) ; w=� "Pi(xi � �x)2hx(i)Pi hx(i) # 12; h=� "Pi(yi � �y)2hy(i)Pi hy(i) # 12where � and � are constant scaling factors.However, the object center position and size derived from the sample means and stan-dard deviations may be biased in the cases where other moving objects appear in the scene.It is therefore necessary to develop a more robust procedure to address this problem. Wepropose the use of robust statistical estimation routines to achieve robust measurementsfor object center position and size [30]. More speci�cally, the center position of a dominantmoving object in an input sequence is estimated based on the robust (trimmed) means ofthe two 1D projection histograms in the x and y directions. Figure 2(b) illustrates theprocess of the estimation of the motion center.Step 1 Compute sample mean � and standard deviation � based on all the samples of thedistribution.Step 2 Let �t(0) = � and � = max(a �; b � sampleSpaceWidth) where a and b are scalingfactors, e.g., a = 1:0 and b = 0:2, and sampleSpaceWidth is the image-width and image-height in the x and y direction, respectively.Step 3 Compute trimmed mean �t(k+1) based on the samples within the interval [�t(k)��; �t(k) + �].Step 4 Repeat Step 3 until j�t(k + 1)� �t(k)j < � where � is the tolerance, e.g., � = 1:0.Denote the converged mean as ��.Step 5 Let center-position = ��.In addition to the robust estimation of object center position, we propose the followingroutine for robust estimation of object size. The method �rst re-projects the frame di�er-ence result in a neighborhood of the located center. It then derives the object size basedon the robust (trimmed) standard deviation. Given the robust mean �� and � obtainedfrom the above center locating routine, the routine for estimation the size in either x or ydirection is as follows.January 11, 1999 DRAFT

10Step 1 Construct a clipped projection histogram Hclip by projecting the color �lteringmap within the range [��opp � �; ��opp + �] in the opposite direction, where ��opp is therobust mean in the opposite direction and � determines the number of samples used inthe calculation.Step 2 Based on Hclip, compute the trimmed standard deviation �t based on the sampleswithin the interval [�� � �; �� + �].Step 3 IF Hclip(�� + d�t) � g Hclip(��) OR Hclip(�� � d�t) � g Hclip(��),where e.g., d = 1:0 and g = 0:4, THEN increase �t until the condition is no longer true.Step 4 Let size = c �t where c is a scaling factor, e.g., c = 2:0.B. Texture and Color Analysis: Low-Level DescriptorsTo obtain rich, and hence robust and expressive descriptions of the objects in the videoframes we describe each pixel in terms of color and texture measures. The color measuresare the normalized red, green, and blue intensities of the pixel, and its grayvalue, while thetexture measures are derived from the Gray Level Co-occurrence Matrix (GLCM), FractalDimension estimation methods, and a Gabor �lter bank. The feature space representationsof each pixel are classi�ed into the categories sky/clouds, grass, trees, animal, rock using aback-propagation neural network. The use of these features in conjunction with the back-propagation classi�er have previously been shown to enable the detection of deciduoustrees in unconstrained images [14].The rich image descriptions are formed from 56 Gray-Level Co-occurrence Matrix, 4fractal dimension, 12 Gabor, and 4 color based measures. No one of the types of measure(e.g. color or Gabor measures) has the power of the combined set of measures. Theneural network described in Section II-C is well suited to combine this set of measures androbustly classify image regions into various animal and non-animal classes. Note that weare only computing features from still frames and that motion is included explicitly at ahigher level. In an alternative approach [27] uses temporal textures for classi�cation, bycombining spatial and temporal changes in image sequences.January 11, 1999 DRAFT
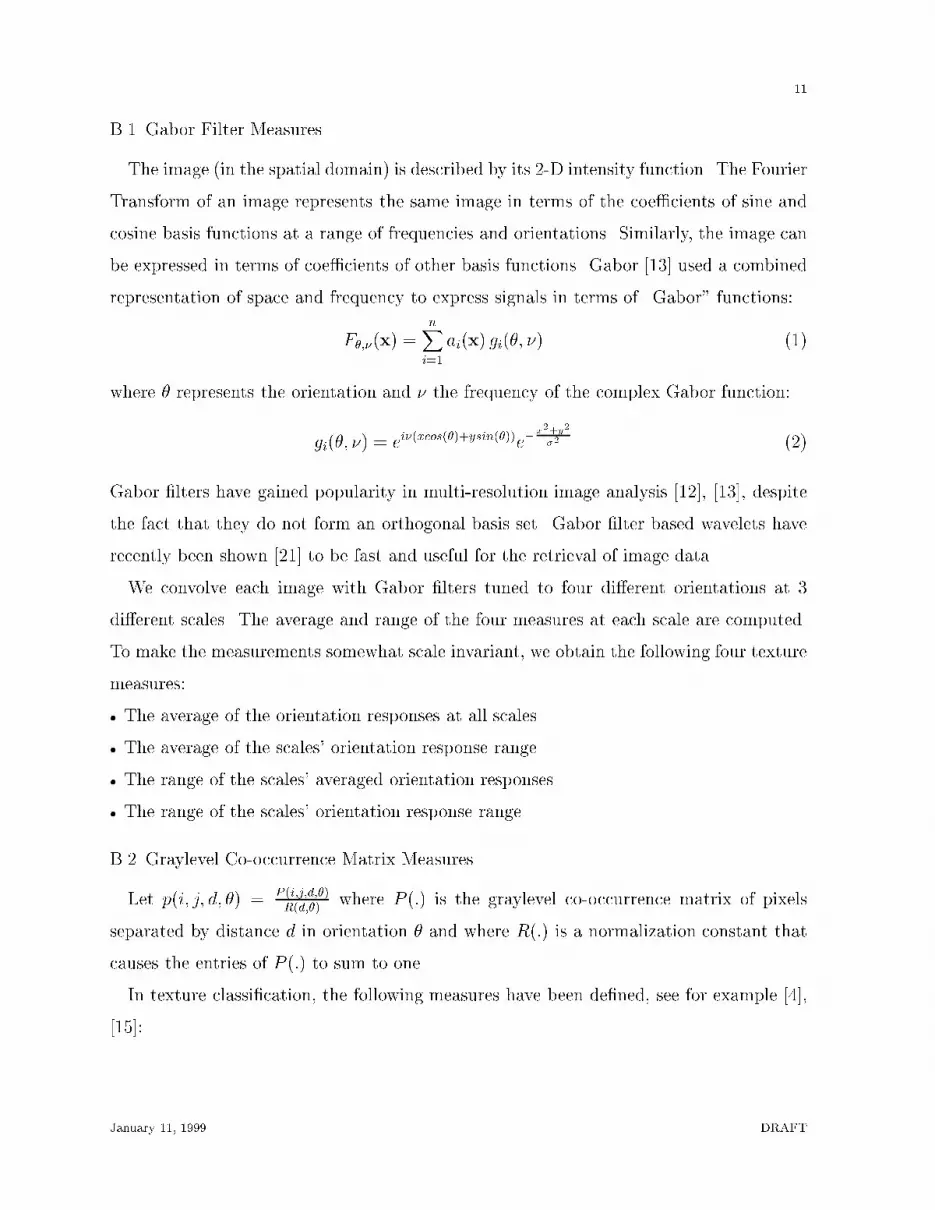
11B.1 Gabor Filter MeasuresThe image (in the spatial domain) is described by its 2-D intensity function. The FourierTransform of an image represents the same image in terms of the coe�cients of sine andcosine basis functions at a range of frequencies and orientations. Similarly, the image canbe expressed in terms of coe�cients of other basis functions. Gabor [13] used a combinedrepresentation of space and frequency to express signals in terms of \Gabor" functions:F�;�(x) = nXi=1 ai(x) gi(�; �) (1)where � represents the orientation and � the frequency of the complex Gabor function:gi(�; �) = ei�(xcos(�)+ysin(�))e�x2+y2�2 (2)Gabor �lters have gained popularity in multi-resolution image analysis [12], [13], despitethe fact that they do not form an orthogonal basis set. Gabor �lter based wavelets haverecently been shown [21] to be fast and useful for the retrieval of image data.We convolve each image with Gabor �lters tuned to four di�erent orientations at 3di�erent scales. The average and range of the four measures at each scale are computed.To make the measurements somewhat scale invariant, we obtain the following four texturemeasures:� The average of the orientation responses at all scales.� The average of the scales' orientation response range.� The range of the scales' averaged orientation responses.� The range of the scales' orientation response range.B.2 Graylevel Co-occurrence Matrix MeasuresLet p(i; j; d; �) = P (i;j;d;�)R(d;�) where P (:) is the graylevel co-occurrence matrix of pixelsseparated by distance d in orientation � and where R(:) is a normalization constant thatcauses the entries of P (:) to sum to one.In texture classi�cation, the following measures have been de�ned, see for example [4],[15]:January 11, 1999 DRAFT

12The Angular Second Moment (E) (also called the Energy) assigns larger numbersto textures whose co-occurrence matrix is sparse.E(d; �) = NgXj=1 NgXi=1 [p(i; j; d; �)]2The Di�erence Angular Second Moment (DASM) assigns larger numbers to tex-tures containing only a few graylevel patches. This and other features use px�y(n; d; �) =PNg PNgj=1 i=1ji�jj=n p(i; j; d; �) DASM(d; �) = NgXn=0 px�y(n; d; �)2The Contrast (Con) is the moment of inertia around the co-occurrence matrix's maindiagonal. It is a measure of the spread of the matrix values and indicates whether pixelsvary smoothly in their local neighborhood.Con(d; �) = Ng�1Xn=0 n2 26664NgX NgXj=1 i=1ji�jj=n p(i; j; d; �)37775The Inverse Di�erence Moment (IDM) measures the local homogeneity of a tex-ture. It weighs the contribution of the co-occurrence matrix entries inversely proportionalto their distance to the main diagonal.IDM(d; �) = Ng�1Xi=1 Ng�1Xj=1 11� (i� j)2p(i; j; d; �)The Mean (M) is similar to the contrast measure above but weights the o�-diagonalterms linearly with the distance from the main diagonal, rather than quadratically as forthe Contrast. M(d; �) = Ng�1Xn=0 n 26664NgX NgXj=1 i=1ji�jj=n p(i; j; d; �)37775January 11, 1999 DRAFT

13Similar to the Angular Second Moment the Entropy (H) is large for textures that giverise to co-occurrence matrices whose sparse entries have strong support in the image. Itis minimal for matrices whose entries are all equally large.H(d; �) = � NgXj=1 NgXi=1 p(i; j; d; �) log (p(i; j; d; �))Other measures are, Sum Entropy (SH), which uses px+y(n; d; �) = PNg PNgj=1 i=1ji+jj=n p(i; j; d; �)SH(d; �) = � 2�Ng�1Xn=0 px+y(n; d; �) log (px+y(n; d; �))Di�erence Entropy (DH)DH(d; �) = � NgXn=0 px�y(n; d; �) log (px�y(n; d; �))Di�erence Variance (DV)DV = � 2NgXn=2(n�DH)2px�y(n; d; �)The Correlation (Cor) measure is an indication of the linearity of a texture. Thedegree to which rows and columns resemble each other strongly determines the value ofthis measure. This and the next two measures use �x = Pi iPj p(i; j; d; �) and �y =Pj jPi p(i; j; d; �). Cor(d; �) = PNg�1i=1 PNg�1j=1 ijp(i; j; d; �)� �x � �y�2Shade (S) S(d; �) = NgXi NgXj (i+ j � �x � �y)3p(i; j; d; �)Prominence (P) P (d; �) = NgXi NgXj (i+ j � �x � �y)4p(i; j; d; �)Note that the directionality of a texture can be measured by comparing the valuesobtained for a number of the above measures as � is changed. The above measures werecomputed at � = f0o; 45o; 90o; and 135og using d = 1. For further discussion of thesegraylevel co-occurrence matrix measures, see [4], [15], [29].January 11, 1999 DRAFT
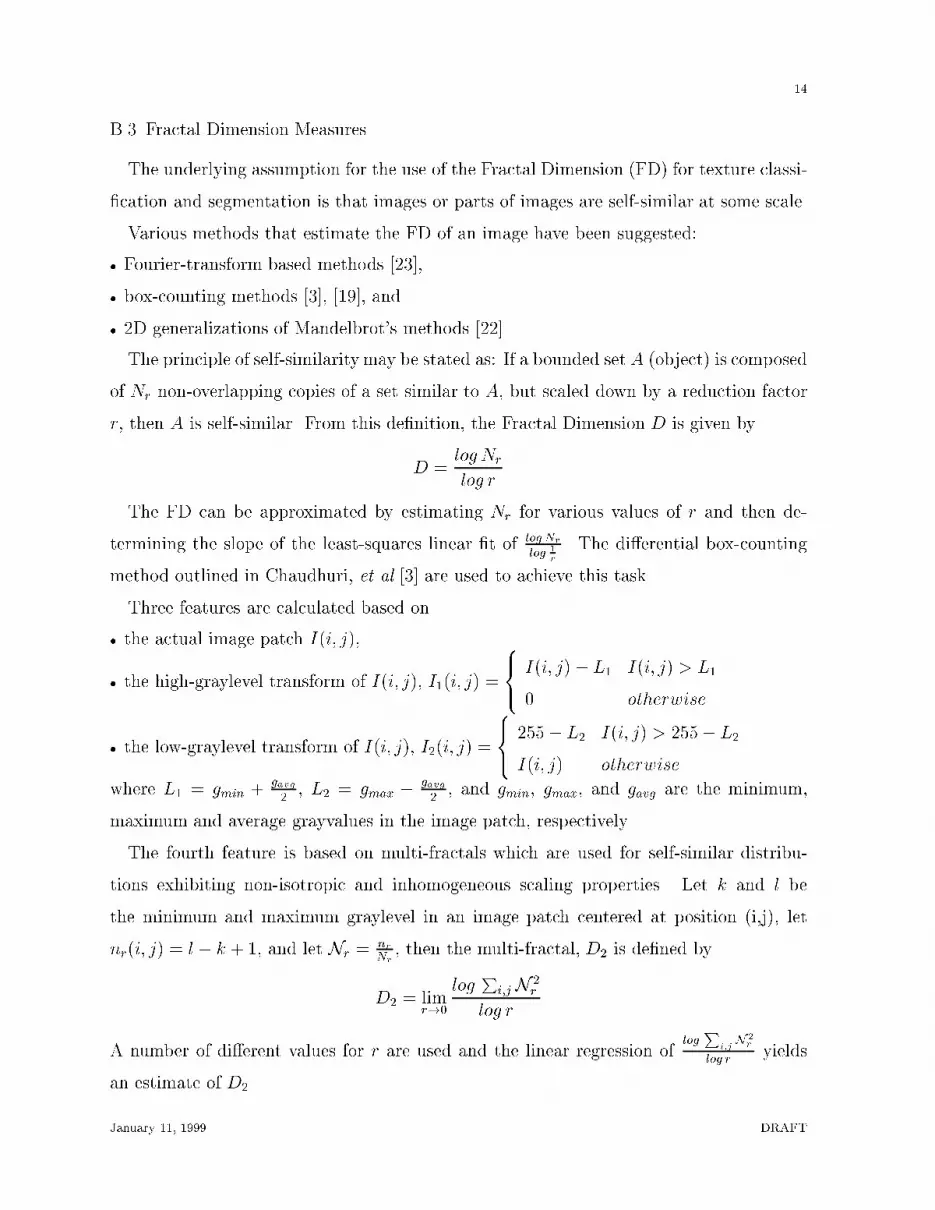
14B.3 Fractal Dimension MeasuresThe underlying assumption for the use of the Fractal Dimension (FD) for texture classi-�cation and segmentation is that images or parts of images are self-similar at some scale.Various methods that estimate the FD of an image have been suggested:� Fourier-transform based methods [23],� box-counting methods [3], [19], and� 2D generalizations of Mandelbrot's methods [22].The principle of self-similarity may be stated as: If a bounded set A (object) is composedof Nr non-overlapping copies of a set similar to A, but scaled down by a reduction factorr, then A is self-similar. From this de�nition, the Fractal Dimension D is given byD = log Nrlog rThe FD can be approximated by estimating Nr for various values of r and then de-termining the slope of the least-squares linear �t of log Nrlog 1r . The di�erential box-countingmethod outlined in Chaudhuri, et al [3] are used to achieve this task.Three features are calculated based on� the actual image patch I(i; j),� the high-graylevel transform of I(i; j), I1(i; j) = 8><>: I(i; j)� L1 I(i; j) > L10 otherwise� the low-graylevel transform of I(i; j), I2(i; j) = 8><>: 255� L2 I(i; j) > 255� L2I(i; j) otherwisewhere L1 = gmin + gavg2 , L2 = gmax � gavg2 , and gmin, gmax, and gavg are the minimum,maximum and average grayvalues in the image patch, respectively.The fourth feature is based on multi-fractals which are used for self-similar distribu-tions exhibiting non-isotropic and inhomogeneous scaling properties. Let k and l bethe minimum and maximum graylevel in an image patch centered at position (i,j), letnr(i; j) = l � k + 1, and let Nr = nrNr , then the multi-fractal, D2 is de�ned byD2 = limr!0 log Pi;jN 2rlog rA number of di�erent values for r are used and the linear regression of logPi;j N 2rlog r yieldsan estimate of D2.January 11, 1999 DRAFT

15B.4 The Color FeaturesThe �nal set of features are the 3 normalized color measures r; g; b and the intensity Ir = RR +G+B ; g = GR +G+B ; b = BR +G+B ; I = R +G+BRmax +Gmax +BmaxWe generally observed that although our feature set is theoretically redundant it isbene�cial for the classi�er to use all the measures rather than a carefully selected subset.C. Region Classi�cation and Motion Blob Veri�cationWe use a back-propagation neural network to arbitrate between the di�erent featuresdescribing the image. Our back-propagation neural network [10] has a single hidden layerand uses the sigmoidal activation function �(act) = 11+e�act�0:5, where act is the activationof the unit before the activation function is applied. A single hidden layer in a back-propagation neural network has been shown to be su�cient to uniformly approximate anyfunction (mapping) to arbitrary precision [6]. Although this existential proof doesn't statethat the best network for some task has a single hidden layer, we found one hidden layeradequate. The architecture of the network is shown in Figure 3. The back-propagationalgorithm propagates the (input) function values layer by layer, left to right (input tooutput) and back-propagates the errors layer by layer, right to left (output to input).As the errors are propagated back to the input units, part of each unit's error is beingcorrected.A number of factors prevent zero error results. A few of these complicating factors arethat often there is no correct classi�cation. For instance, should bushes be labeled as treeor non-tree areas? What if a bush is actually a small tree? In general it is di�cult tolabel class border pixels correctly; and misclassi�cations need not all be equally important.Misclassifying a distant herd of animals as trees or rocks is not as severe a mistake as, forexample, classifying a nearby lion as sky.We trained the network using a total of 14 labels. 9 animal labels (lion, cheetah, leopard,antelope, impala, zebra, gnu, elephant, and an all-other-animal class) and 5 non-animallabels (rock, sky/clouds, grass, trees, and an all-other-non-animal class) as well as a don'tcare label that was used to tell the network to ignore border regions between instances ofthe di�erent groups, which arguably are bad training inputs.January 11, 1999 DRAFT

16Σ
1
2
3
Σ
n
n+1Feature
Feature
Feature
Feature
Feature
Output
SigmoidalNon-linearities
Σ Adders
Σk
2
1Σ
Output LayerInput Layer Hidden LayerFig. 3. The Neural Network architecture.After training, we found that the proposed network performed well at classifying grass,trees, rocks, sky, and animals as a whole group. However, it is di�cult for the networkto classify lions, cheetahs, leopards, antelopes, impalas, gnus, hyenas, and even zebras,rhinos and elephants each into di�erent groups. This is probably due to the fact thatthose animals di�er mostly in their shape and size which we do not model. Hence, whilethe network was still trained on the di�erent animal labels, we arti�cially grouped thoselabels into a single \animal" label when using the network for animal region veri�cation.We also found that the network did not perform well at solving the opposite problemof classifying, grass, trees, rocks, and sky together as a single \non-animal" group. Thedi�erences between the appearance of instances of these groups are severe. Asking thenetwork to assign one label to them and a di�erent label to animals proves to be moredi�cult than the classi�cation into the individual non-animal groups.The output of the network is then used to verify the motion blob candidates fromsection II-A. In our current implementation, a simple procedure is employed which imple-ments the following test. A region that has high residual motion after motion compensationand that contains a signi�cant amount of animal labels, as detected by the neural network,is considered as a possible moving animal region.January 11, 1999 DRAFT

17D. Shot Summarization and Intermediate-Level DescriptorsWe use a simple color histogram based technique to decompose video sequences intoshots. To avoid missing important events in extended shots, we also force a shot summaryevery 200 frames. A third kind of shot boundary is inserted whenever the direction of theglobal motion changes. Shot boundaries of this last kind ensure that the motion withinshots is homogeneous. Each shot is then summarized in terms of intermediate-level de-scriptors. The purpose of generating intermediate-level shot summaries is two-fold. First,the shot summaries provide a way to encapsulate the low-level feature and motion anal-ysis details so that the high-level event inference module may be developed independentof those details, rendering it robust against implementational changes. Second, the shotsummaries abstract the low-level analysis results so that they can be read and interpretedmore easily by humans. This simpli�es the algorithm development process and may alsofacilitate video indexing, retrieval and browsing in video database applications.In general, the intermediate-level descriptors may consist of (1) object, (2) spatial, and(3) temporal descriptors. The object descriptors, e.g., \animal", \tree", \sky/cloud",\grass", \rock", etc. indicate the existence of certain objects in the video frames. Thespatial descriptors represent the location and size information about objects and the spa-tial relations between them in terms of spatial prepositions such as \inside", \next to",\on top of", etc. [7], [8]. The temporal descriptors represent motion information aboutobjects and the temporal relations between them in terms of temporal prepositions suchas \while", \before", \after", etc. [7], [8].For the hunt detection application, we currently employ a particular set of intermediate-level descriptors which describe: (1) whether the shot summary is due to a forced ordetected shot boundary; (2) the frame number of the beginning of the shot; (3) the framenumber of the end of the shot; (4) the global motion; (5) the object motion; (6) the initialobject location; (7) the �nal object location; (8) the initial object size; (9) the �nal objectsize; (10) the smoothness of the motion; (11) the precision throughout shot; and (12)the recall throughout shot. More precisely, the motion descriptors provide informationabout the x- and y- translation and zoom components of motion. The location and sizedescriptors indicate the location and size of the detected dominant motion blob at theJanuary 11, 1999 DRAFT

18beginning and the end of the shot. The precision is the average ratio of the number ofanimal labels within the detected dominant motion blob versus the size of the blob, whilethe recall is an average of the ratio of the animal labels within the detected dominantmotion blob versus the number of animal labels in the entire frame. In addition, we alsoemploy descriptors indicating (13) that tracking is engaged; (14) that object motion is fast;(15) that an animal is present; (16) the beginning of a hunt; (17) number of consecutivehunt shot candidates found; (16) the end of a hunt; and (19) whether a valid hunt is found.See Section III-F for an example and further explanation.E. Event InferenceHunt events are detected by an event inference module which utilizes domain-speci�cknowledge and operates at the shot level based on the generated shot summaries. Fromobservation and experimentation with a number of wildlife documentaries, a set of ruleshave been deduced for detecting hunts. The rules re ect the fact that a hunt usuallyconsists of a number of shots exhibiting smooth but fast animal motion which are followedby subsequent shots with slower or no animal motion. In other words, the event inferencemodule looks for a prescribed number of shots in which (a) there is at least one animal ofinterest; (b) the animal is moving in a consistently fast manner for an extended period;and (c) the animal stops or slows down drastically after the fast motion. Figure 4 showsand describes a state diagram of our hunt detection inference model.Automatic detection of the properties and sequences of actions in the state digram isnon-trivial and the low-level feature and motion analysis described earlier in this paperare necessary to realize the inference. Since any event can be de�ned by the occurrence ofobjects involved and the speci�cation of their spatio-temporal relationship, the proposedmechanism, of combining low-level visual analysis and high-level domain-speci�c rules,may be applicable to detect other events in di�erent domains. In Section III-G, we providean example and further explanation for using this inference model for hunt detection.III. Experimental ResultsThe proposed algorithm has been implemented in C++ and tested on Sun workstations.To evaluate the e�ectiveness of the algorithm, we have digitized wildlife video footage fromJanuary 11, 1999 DRAFT

19
of
εStart
NonHunt
End
Hunt
ValidHunt
2ndHuntShot
Beginning
Huntof
Shot
AnimalFast
Tracking
AnimalFast
TrackingTrackingFast
AnimalNot
TrackingFast
Animal NotTracking
FastAnimal
AnimalFast
TrackingNot
Fig. 4. The state diagram of our hunt detection method. Initially the control is in the Non-Hunt stateon the left. When a fast moving animal is detected the control moves to the Beginning of Hunt stateat the top of the diagram. When three consecutive shots are found to track fast moving animals thenthe Valid Hunt ag is set. The �rst shot afterwards that does not track a fast moving animal takesthe control to the End of Hunt state, before again returning to the Non-Hunt state.a number of commercially available VHS tapes from di�erent content providers. In thefollowing sections we show examples of the extracted texture and color features, the motionestimation and detection results, the region classi�cation results, the shot summaries, andthe �nal hunt event detection results.A. Test DataAbout 45 minutes of actual wildlife video footage have been digitized and stored as testdata for our hunt detection experiments. The frame rate of the video is 30 frames persecond and the digitized frame resolution is 360 x 243 pixels. A total of 10 minutes offootage 4= 18000 frames 4= 100 shots have been processed so far.January 11, 1999 DRAFT

20B. Global Motion EstimationFigure 5(a) shows the size and locations of the four regions at which the global motion isestimated. For each pair of frames motion estimates are computed using a 5 level pyramidscheme at the shown patch locations. In addition the previous motion estimate is takenas the current motion estimate and a tight local search around the four predicted patchlocations yields another four patch matches. The best match of any of these 8 patchcomparisons becomes the motion estimate for the current frame pair. Figure 5(b) showsthe motion estimates during a hunt.0 100 200 300 400 500 600 700 800 900
−10
−8
−6
−4
−2
0
2
4
6
8
10
(a) (b)Fig. 5. (a) The locations used to estimate the global motion, and (b) the motion estimates during a hunt.C. Motion Blob DetectionFigure 6 shows an example of the motion blob detection results. It is apparent thatreliable estimation and compensation of global motion makes the task of motion blobdetection relatively easier. When the accuracy of the global motion estimation results arepoor, the performance of the motion blob detection relies largely on the robustness of themotion blob detection and tracking algorithm described in Section 2.1.D. Feature Space Representation of the Video FramesFigure 7 shows the feature space representation of a video frame. The features shownare the results of the Gray-Level Co-occurrence Matrix based measures (�rst 56 featureimages), the Fractal Dimension based measures (next 4 feature images), the color basedmeasures (next 4 feature images), and the Gabor based measures (last 12 feature images).January 11, 1999 DRAFT

21(a) (b) (c)Motion Estimate�x = �7�y = 0zoom = 1:0(d) (e) (f)Fig. 6. Two consecutive frames from a hunt (a) and (b), the di�erence image (c), the estimated motionbetween the two frames (d), the motion compensated di�erence image (e), and the box around thearea of largest residual error in the motion compensated di�erence image.
Fig. 7. The feature space representation of the �rst frame in Figure 6.January 11, 1999 DRAFT
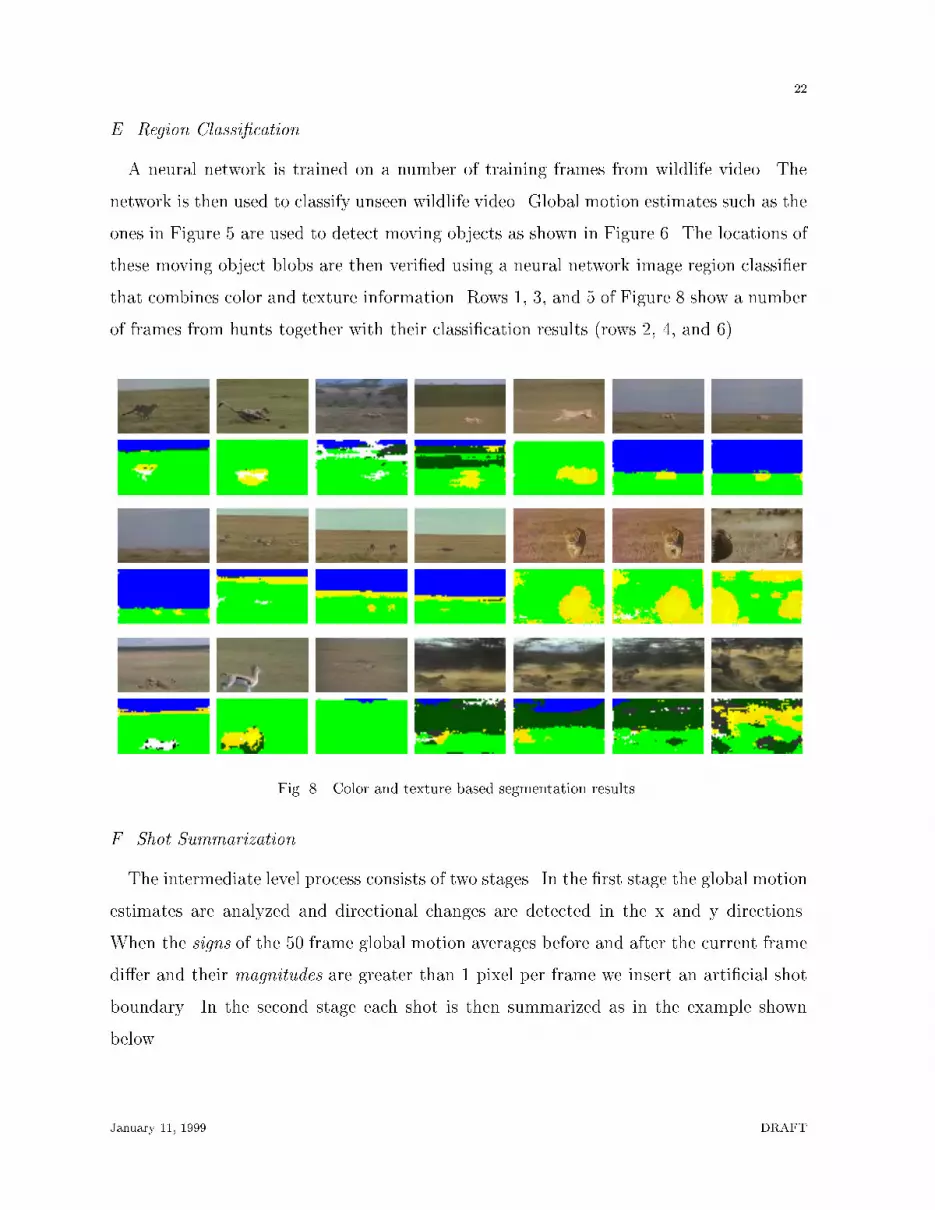
22E. Region Classi�cationA neural network is trained on a number of training frames from wildlife video. Thenetwork is then used to classify unseen wildlife video. Global motion estimates such as theones in Figure 5 are used to detect moving objects as shown in Figure 6. The locations ofthese moving object blobs are then veri�ed using a neural network image region classi�erthat combines color and texture information. Rows 1, 3, and 5 of Figure 8 show a numberof frames from hunts together with their classi�cation results (rows 2, 4, and 6).
Fig. 8. Color and texture based segmentation results.F. Shot SummarizationThe intermediate level process consists of two stages. In the �rst stage the global motionestimates are analyzed and directional changes are detected in the x and y directions.When the signs of the 50 frame global motion averages before and after the current framedi�er and their magnitudes are greater than 1 pixel per frame we insert an arti�cial shotboundary. In the second stage each shot is then summarized as in the example shownbelow.January 11, 1999 DRAFT

23---------- General Information ------------ ------- Hunt Information -------Forced/real shot summary : 0 Tracking : 1First frame of shot : 64 Fast : 1Last frame of shot : 263 Animal : 1Global motion estimate (x,y) : (-4.48, 0.01) Beginning of hunt : 1Within frame animal motion estimate (x,y) : (-0.17, 0.23) Number of hunt shot candidates : 1Initial position (x,y) : (175,157) End of hunt : 0Final position (x,y) : (147,176) Valid hunt : 0Initial size (w,h) : ( 92, 67)Final size (w,h) : (100, 67)Motion smoothness throughout shot (x,y) : ( 0.83, 0.75)Precision throughout shot : ( 0.84)Recall throughout shot : ( 0.16)The summary consists of two parts, the �rst part, under General Information showsgeneral statistics extracted for this shot, while the second, under Hunt Information con-sists of inferences based on those statistics for the hunt detection application.The �rst row of the general Information part of the summary shows whether the shotboundary corresponding to this shot summary was real, i.e. whether it was detected bythe shot boundary detector, or if it was forced because the maximum number of framesper shot was reached or the global motion has changed. The next two rows show the�rst and last frame numbers of this shot. The following measurements are shot statistics,i.e., the average global motion over the entire shot on row four, and the average objectmotion within the shot on row �ve. The next four rows measure the initial positionand size, as well as the �nal position and size of the detected dominant motion blob.The third last row shows the smoothness of global motion where values near 1 indicatesmooth motion and values near 0 indicate unstable motion estimation. The detection of areversal of the global motion direction, described above, was based on a long term averageof the motion estimates around the current frame, indicates a qualitative change in theglobal motion. The smoothness measure described here, on the other hand, provides aquantitative measure of the smoothness of the estimated motion. Finally the last two rowsshow the average precision and recall for the entire shot. As de�ned in Section II-D, theprecision is the average ratio of the number of animal labels within the detected dominantmotion blob versus the size of the blob, while the recall is an average of the ratio of theanimal labels within the detected dominant motion blob versus the number of animalJanuary 11, 1999 DRAFT

24labels in the entire frame.The hunt information part of the shot summary shows a number of predicates thatwere inferred from the statistics in part one. The shot summary shown above summarizesthe �rst hunt shot following a forced shot boundary. The system is indicating that itis Tracking a Fast moving Animal and hence, that this could be the Beginning of ahunt. The Tracking predicate is true when the motion smoothness measure is greater thana prescribed value and the motion blob detection algorithm detects a dominant motionblob. The Fast predicate is set to true if the translational components of the estimatedglobal motion are su�ciently large in magnitude, and the Animal predicate is true if theprecision, i.e. the number of animal labels within the tracked region, is su�ciently large.(The recall measure has not been used in our current implementation.) The remainingpredicates are determined and used by the inference module as described below.G. Event Inference and Final Detection ResultsThe event inference module infers the occurrence of a hunt based on the intermediate de-scriptors as described in Section III-F. In doing so, it employs four predicates, Beginningof hunt, Number of hunt shot candidates, End of hunt, and Valid hunt, which arecurrently embedded in the shot summary. If the intermediate descriptors Tracking, Fastand Animal are all true for a given shot, the inference module sets Beginning of huntto be true, which means the shot could potentially be the beginning of a hunt event. Theinference module tracks the intermediate descriptors Tracking, Fast and Animal for con-secutive shots and increments the value of the Number of hunt shot candidates if allthose three descriptors hold true for consecutive shots. In our current implementation,when the Number of hunt shot candidates is equal or greater than 3, Valid hunt isset to be true. Finally the inference module sets End of hunt to be true if one of theintermediate descriptors Tracking, Fast and Animal becomes false, which implies eitherthe animal is no longer visible or trackable, or the global motion is slow enough indicatinga sudden stop after fast chasing.In our �nal results, hunt events are speci�ed in terms of their starting and endingframe numbers. In the 10 minutes (18000 frames) of wildlife video footage which we haveprocessed, there exist 7 hunt events. Table I shows the actual frames of the 7 hunts andJanuary 11, 1999 DRAFT

25all the frames of the detected hunts when we applied the proposed algorithm to the 10minute video footage. The table also shows the retrieval performance of our method interms of the two commonly used evaluation criteria (1) precision and (2) recall.TABLE IA comparison of the actual and detected hunts in terms of the first and last huntframe, and the associated precision and recall.Sequence Actual Detected Precision RecallName Hunt Frames Hunt Frameshunt1 305 - 1375 305 - 1375 100 % 100 %hunt2 2472 - 2696 2472 - 2695 100 % 99.6%hunt3 3178 - 3893 3178 - 3856 100 % 94.8%hunt4 6363 - 7106 6363 - 7082 100 % 96.8%hunt5 9694 - 10303 9694 - 10302 100 % 99.8%hunt6 12763 - 14178 12463 - 13389 67.7% 44.2%hunt7 16581 - 17293 16816 - 17298 99.0% 67.0%Average 95.3% 86.0%IV. Summary and DiscussionIn this paper, we have presented a new computational framework and a number ofenabling algorithmic components for automatic event detection in video and applied itto detect hunts in wildlife documentaries. Our experimental results have veri�ed thee�ectiveness of the proposed algorithm. The developed framework decomposes the taskof extracting semantic events into three stages where visual information is analyzed andabstracted. The �rst stage extracts low-level features and is entirely domain-independent.The second stage analyzes the extracted low-level features and generates intermediate-leveldescriptors some of which may be domain-speci�c. In this stage, shots are summarized interms of both domain-independent and domain-speci�c descriptors. To generate the shotsummaries, regions of interest are detected, veri�ed and tracked. The third and �nal stageis domain-speci�c. Rules are deduced from speci�c domains and an inference model is builtbased on the established rules. In other words, each lower stage encapsulates certain low-level visual processing from the higher stages. Therefore the processes in the higher stagesJanuary 11, 1999 DRAFT

26can be stable and relatively independent of any potential detail changes in the lower levelmodules. In order to detect di�erent events, the expected changes are (a) the additionof descriptors in the second stage and (b) the design of a new set of rules in the thirdstage. The proposed algorithm also provides several reusable algorithmic components. Infact, the extracted low-level texture and color features are domain independent and manyobjects involved in events carry certain texture and color signatures. The neural networkused for image region classi�cation can be easily re-con�gured or extended to handle othertypes of objects [14]. The robust statistical estimation based object tracking method hasalready been used in di�erent applications and its robustness and simplicity are veri�edin experiments repeatedly [24].It is important for us to point out that the proposed algorithm detects hunt events bydetecting certain spatial-temporal phenomena which are physically associated with a huntevent in the nature. More precisely, the physical phenomenon which we attempt to captureis the combination of the presence of animals in space and their movement patterns in time.This is in contrast to many existing event detection methods which detect certain eventsby detecting arti�cial postproduction editing patterns or other artifacts. The drawbacksof detecting speci�c editing patterns or other artifacts are that those patterns are oftencontent provider dependent and it is di�cult, if not impossible, to modify the detectionmethods and apply them to the detection of other events. It is also important to pointout that our algorithm solves a practical problem and the solution is needed in the realworld. In the wildlife video tapes which we obtained, the speech from the audio trackand the text from the close-caption are loosely correlated with the visual footage. It istherefore unlikely that the hunt segments may be accurately located by analyzing theaudio track and close-caption. In other words, given the existing wildlife tapes, a visual-information-based detection algorithm is needed to locate the hunt segments otherwisemanual annotation is required.An immediate focus of future work is to develop a full set of intermediate-level de-scriptors for generating shot summaries. The purpose of developing the descriptors is toprovide a wider coverage over di�erent domains and events so that fewer domain-speci�cdescriptors need to be added in new applications. Other future work is to improve theJanuary 11, 1999 DRAFT

27procedure which detects and tracks regions of interest. Finally, it would be interesting toadopt machine learning techniques into the event inference engine so that it can improveits performance over time automatically.References[1] F. Arman, R. Depommier, A. Hsu, and M.-Y. Chiu, \Content-based Browsing of Video Sequences," Proc.ACM Multimedia, pp. 97-103, 1994.[2] S.-F. Chang, W. Chen, H. J. Meng, H. Sundaram, and D. Zhong, \A Fully Automated Content Based VideoSearch Engine Supporting Spatio-Temporal Queries," IEEE Trans. Circuits and Systems for Video Technology,1998.[3] B.B. Chaudhuri, N. Sarkar, and P. Kundu, \Improved Fractal Geometry Based Texture Segmentation Tech-nique," IEE Proceedings, part E, vol. 140, pp. 233-241, 1993.[4] R.W. Conners, C.A. Harlow, \A Theoretical Comparison of Texture Algorithms," IEEE Trans. Pattern Anal-ysis and Machine Intelligence, vol. 2, no 3, pp. 204-222, 1980.[5] J. D. Courtney, \Automatic Video Indexing via Object Motion Analysis," Pattern Recognition, vol. 30, no. 4,pp. 607-626, 1997.[6] G. Cybenko, \Approximation by Superposition of Sigmoidal Function," Mathematics of Control, Signals, andSystems, Chapter 2, pp. 303-314, 1989.[7] A. Del Bimbo, E. Vicario, D. Zingoni, \A Spatial Logic for Symbolic Description of Image Contents," J. VisualLanguages and Computing, vol. 5, pp. 267-286, 1994.[8] N. Dimitrova and F. Golshani, \Motion Recovery for Video Content Classi�cation," ACM Trans. InformationSystems, vol. 13, no 4, pp 408-439, 1995.[9] P. England, R.B. Allen, M. Sullivan, and A. Heybey, \I/Browse: The Bellcore Video Library Toolkit," SPIEProc. Storage and Retrieval for Image and Video Databases, pp. 254-264, 1996.[10] S. Fahlman, \Faster-Learning Variations on Back-Propagation: An Empirical Study," Proc. ConnectionistModels Summer School, Morgan Kaufmann, 1988.[11] O. Faugeras, Three-Dimensional Computer Vision: A Geometric Viewpoint, MIT Press, 1993.[12] I.Fogel and D.Sagi, \Gabor Filters as Texture Discriminator," J. Biological Cybernetics, vol. 61, pp. 103-113,1989.[13] D. Gabor, \Theory of communication," J. IEE, vol. 93, pp. 429-457, 1946.[14] N. Haering, Z. Myles, and N. da Vitoria Lobo, \Locating Deciduous Trees," Proc. IEEE Workshop on Content-based Access of Image and Video Libraries, pp. 18-25, 1997.[15] R.M. Haralick, K. Shanmugam, and I. Dinstein, \Textural Features for Image Classi�cation," IEEE Trans.Systems Man and Cybernetics, vol. 3, no 6, pp. 610-621, 1973.[16] S. S. Intille, \Tracking Using a Local Closed-World Assumption: Tracking in the Football Domain," MasterThesis, M.I.T. Media Lab, 1994.[17] G. Iyengar and A. Lippman, \Models for Automatic Classi�cation of Video Sequences", SPIE Proc. Storageand Retrieval for Image and Video Databases, pp. 216-227, 1997.[18] T. Kawashima, K. Tateyama, T. Iijima, and Y. Aoki, \Indexing of Baseball Telcast for Content-based VideoRetrieval," Proc. International Conference on Image Processing, pp. 871-875, 1998.January 11, 1999 DRAFT

28[19] J.M. Keller and S. Chen, \Texture Description and Segmentation through Fractal Geometry," ComputerVision, Graphics and Image Processing, vol. 45, pp. 150-166, 1989.[20] R. L. Lagendijk, A. Hanjalic, M. Ceccarelli, M. Soletic, and E. Persoon, \Visual Search in a SMASH System",Proc. International Conference on Image Processing, pp. 671-674, 1997.[21] B.Manjunath and W.Ma, \Texture Features for Browsing and Retrieval of Image Data," IEEE Trans. PatternAnalysis and Machine Intelligence, vol. 18, no. 8, pp. 837-859, 1996.[22] S. Peleg, J. Naor, R. Hartley, and D. Avnir, \Multiple Resolution Texture Analysis and Classi�cation," IEEETrans. Pattern Analysis and Machine Intelligence, vol. 6, no 4, pp. 518-523, 1984.[23] A.P. Pentland, \Fractal-based Description of Natural Scenes," IEEE Trans. Pattern Analysis and MachineIntelligence, vol. 6, no 6, pp. 661-674, 1984.[24] R. J. Qian, M. I. Sezan and K. E. Matthews, \A Robust Real-Time Face Tracking Algorithm", Proc. Inter-national Conference on Image Processing, pp. 131-135, 1998.[25] D. Saur, Y.-P. Tan, S.R. Kularni, and P.J. Ramadge, \Automated Analysis and Annotation of BasketballVideo," SPIE Proc. Storage and Retrieval for Image and Video Databases, pp. 176-187, 1997.[26] M. Smith and T. Kanade, \Video Skimming for Quick Browsing Based on Audio and Image Characterization,"CMU Computer Science Department Technical Report CMU CS-95-186, 1995.[27] M. Szummer, \Temporal Texture Modeling," Master Thesis, M.I.T. Media Lab, 1995.[28] N. Vasconcelos and A. Lippman, "A Bayesian Framework for Semantic Content Characterization," Proc.Computer Vision and Pattern Recognition, pp. 566-571, 1998.[29] J.S. Weszka, C.R. Dyer, and A. Rosenfeld, \A Comparative Study of Texture measures for Terrain Classi�-cation," IEEE Trans. Systems Man and Cybernetics, vol. 6, no 4, pp. 269-285, 1976.[30] R.R. Wilcox, Introduction to Robust Estimation and Hypothesis Testing, Statistical Modeling and DecisionScience Series, Academic Press, 1997.[31] M. Yeung, and B.-L. Yeo, \Video Visualization for Compact Presentation and Fast Browsing of PictorialContent," IEEE Trans. Cicuits and Systems for Video Technology, vol. 7, no 5, pp. 771-785, 1996.[32] D. Yow, B.L.Yeo, M. Yeung, and G. Liu, \Analysis and Presentation of Soccer Highlights from Digital Video,"Proc. Asian Conference on Computer Vision, 1995.[33] H. J. Zhang, S. W. Smoliar, and J. H. Wu, \Content-Based Video Browsing Tools," SPIE Proc. Storage andRetrieval for Image and Video Databases, pp. 389-398, 1995.
January 11, 1999 DRAFT