Embed Size (px)
Citation preview

2015: Issue 497, Week: 19th - 22nd October

Contents
Equity 4-7
Derivatives 8-9
Commodity 10-13
Currency 14
IPO 15
FD Monitor 16
Insurance 17
Mutual Fund 18
SMC RESEARCH TEAMREGISTERED OFFICES:
11 / 6B, Shanti Chamber, Pusa Road, New Delhi 110005.
Tel: 91-11-30111000, Fax: 91-11-25754365
MUMBAI OFFICE:
Dheeraj Sagar, 1st Floor, Opp. Goregaon sports Club, Link Road
Malad (West), Mumbai 400064
Tel: 91-22-67341600, Fax: 91-22-28805606
KOLKATA OFFICE:
18,Rabindra Sarani, Poddar Court, Gate No-4,5th Floor, Kolkata-700001
Tel : 91-33-39847000 Fax No : 91-33-39847004
AHMEDABAD OFFICE :
10/A, 4th Floor, Kalapurnam Building, Near Municipal Market,
C G Road, Ahmedabad-380009, Gujarat
Tel : 91-79-26424801 - 05, 40049801 - 03
CHENNAI OFFICE:
Salzburg Square, Flat No.1, III rd Floor, Door No.107, Harrington Road,
Chetpet, Chennai - 600031.
Tel: 044-39109100, Fax -044- 39109111
SECUNDERABAD OFFICE:
206, 3rd Floor, above CMR Exclusive, Bhuvana Towers, S.D.Road,
Secunderabad - 500003
Tel: 91-40-30780298/99, 39109536
DUBAI OFFICE:
312, Belshalat Building, Al Karama, Dubai, P.O. Box 117210, U.A.E.
Tel: 97143963120, Mobile : 971502612483
Fax : 9714 3963122
Email ID : [email protected]
Printed and Published on behalf of
Mr. Saurabh Jain @ Publication Address
11/6B, Shanti Chamber, Pusa Road, New Delhi-110005
Website: www.smcindiaonline.com
Investor Grievance : [email protected]
Printed at: S&S MARKETING
102, Mahavirji Complex LSC-3, Rishabh Vihar, New Delhi - 110092 (India)
Ph.: +91-11- 43035012, 43035014, Email: [email protected]
lobal stocks rallied on the expectation of delay in the interest rate hike by
U.S. Federal Reserve and more reforms by Chinese authorities to stem Gslowing growth. The probability of hike in interest rate by U.S. Fed by
December has receded to 30% from 70% in August as per data from Bloomberg.
Consumer prices in September rose at a slower pace, giving more room to the Chinese
central bank to ease monetary policy. Economic data out of the U.S. showed better
than expected jobless report along with disappointing retail sales. Such mixed
economic data give an impression of patchy recovery and therefore tantamount to
liberal policy by a central bank for some more time.
Back at home, caution over the upcoming results and disappointing monthly export
data coupled with a rise in fuel prices kept market participants cautious. On the data
front, the Index of Industrial Production (IIP) for the month of August rose 6.4%, a
three-year high, compared with 4.1% in the previous month. Though the growth came
as a positive surprise, but a closer look at the data reveals that the gems and jewelry
sector and Rubber-insulated cables contributed as much as 1.66% and 1.58% point or
about half of the growth in the month. India's exports continue to see contraction for
consecutive 10 months. Exports have fallen nearly 24% in the month of September
compared to a year earlier reflecting weakness in the global economy. The earnings
season kick started with some of the misses from the Information Technology, FMCG
sector that included majors like Infosys, TCS, Hindustan Unilever, etc. Going next
week some of the key economic data that market participants would be eyeing on
includes Chinese economy GDP data for the quarter ended September 2015, India
Macroeconomic data, trends in global markets, investment by foreign portfolio
investors (FPIs) and domestic institutional investors (DIIs), the movement of the rupee
against the dollar and crude oil price movement.
On the commodities front, mixed moves were witnessed in the week gone by. Fall in
the dollar index gave some support to the bullion as well as industrial metal counter
while crude prices slipped on oversupply issue. Bullion counter may trade on a volatile
path as some profit booking can be seen at higher levels. Gold can move in the range of
26500-28000 while Silver can move in the range of 36000-38000. Crude oil may trade
in a range as a decline in rig count may give support to the prices, but at the same time
rise in EIA crude oil stocks is keeping the prices downbeat. Celebration of Navratri may
result in thin trading volume, especially in agri commodities. Chinese GDP, Bank of
Canada Rate Decision, European Central Bank Rate Decision, CPI of Canada, etc. are
few data which are scheduled to release this week.
From The Desk Of Editor
(Saurabh Jain)
SMC Global Securities Limited is proposing, subject to receipt of requisite approvals, market conditions and other considerations, a further public offering of its equity shares and has filed the Draft Red Herring Prospectus with the Securities and Exchange Board of India (“SEBI”) and the Stock Exchanges. The Draft Red Herring Prospectus is available on the website of SEBI at www.sebi.gov.in and on the websites of the Book Running Lead Manager i.e., ICICI Securities Limited at www.icicisecurities.com and the Co- Book Running Lead Manager i.e., Elara Capital (India) Private Limited at www.elaracapital.com . Investors should note that investment in equity shares involves a high degree of risk and for details relating to the same, please see the section titled “Risk Factors” of the aforementioned offer document.
SMC Global Securities Ltd. (hereinafter referred to as “SMC”) is a registered Member of National Stock Exchange of India Limited, Bombay Stock Exchange Limited and its associate is member of MCX stock Exchange Limited. It is also registered as a Depository Participant with CDSL and NSDL. Its associates merchant banker and Portfolio Manager are registered with SEBI and NBFC registered with RBI. It also has registration with AMFI as a Mutual Fund Distributor.
SMC has applied with SEBI for registering as a Research Entity in terms of SEBI (Research Analyst) Regulations, 2014. SMC or its associates has not been debarred/ suspended by SEBI or any other regulatory authority for accessing /dealing in securities Market.
SMC or its associates including its relatives/analyst do not hold any financial interest/beneficial ownership of more than 1% in the company covered by Analyst. SMC or its associates and relatives does not have any material conflict of interest. SMC or its associates/analyst has not received any compensation from the company covered by Analyst during the past twelve months. The subject company has not been a client of SMC during the past twelve months. SMC or its associates has not received any compensation or other benefits from the company covered by analyst or third party in connection with the research report. The Analyst has not served as an officer, director or employee of company covered by Analyst and SMC has not been engaged in market making activity of the company covered by Analyst.
The views expressed are based solely on information available publicly available/internal data/ other reliable sources believed to be true.
SMC does not represent/ provide any warranty express or implied to the accuracy, contents or views expressed herein and investors are advised to independently evaluate the market conditions/risks involved before making any investment decision.
NEWS
DOMESTIC NEWSEconomy• India's wholesale prices fell for an 11th straight month in September,
plunging an annual 4.54% primarily on the back of tumbling oil prices. The wholesale fuel prices fell 17.71% from a year ago. Prices of manufactured goods declined 1.73% on year in September. Food prices, however, inched up 0.69% year-on-year last month.
• As per the Reserve Bank of India data, credit in the system grew by 9.4% by October 02, 2015 to ̀ 68,30,245 crore from ̀ 62,40,256 crore a year ago.
• In a measure of relief to the fertilizer industry, a cabinet panel on Wednesday approved a special banking arrangement for a loan of `7,000 crore for payment of outstanding subsidy to fertiliser firms for 2014-15.
Pharmaceuticals• Aurobindo Pharma has received final approval from the US FDA to
manufacture and market Memantine Hydrochloride tablets used in treatment of Alzheimer's. The product is ready for launch.
• Lupin has signed a marketing agreement with drug maker BoehringerIngelheim to sell the latter's anti- diabetes drug linaglipitin under its own brand name.
Capital Goods• McNally Bharat Engineering Company in its recently formed 50:50 SPV with
EMC Group in Muscat, Sultanate of Oman, received a contract for Construction, detailed engineering, construction supervision, mechanical commissioning and supply for a value of US$ 315 million (`2048 crore approximately) from Sohar Bitumen LLC in Oman for their Bitumen Refinery in Sohar, Muscat, Sultanate of Oman.
• Siemens Ltd announced that together with its parent company Siemens AG, it has won an order totalling approximately ̀ 183 crore from NTPC Ltd. The component of Siemens Ltd in the order is of ̀ 97 crore.
Realty/ Construction• Punj Llyod has won an EPCC contract at Paradip Refinery, Odisha from
Indian Oil Corporation for a value of ̀ 367 crore. The scope of work for the project involves the Residual Basic Engineering including HAZOP study, detailed engineering, procurement, construction and commissioning of the Coker LPG Treating Unit and offsite and utility facility.
• Hindustan Construction Company (HCC) has bagged ̀ 942.58 crore worth contract from BARC to construct first phase of its Integrated Nuclear Recycle Plant.
Infrastructure• IVRCL announced that IVRCL Chengapalli Tollways, a SPV formed for
implementing the project envisaging 4/6 laning of the road in Chengapalli - Coimbatore - Walayar (Tamil Nadu / Kerala Border) on NH-47 in the State of Tamil Nadu being executed as BOT (Toll) on DBFOT basis has obtained the provisional certificate for commercial operations and toll collection has started on 14 October 2015.
Trading• PTC India has inked pact with the Solar Energy Corporation of India (SECI)
for sale and purchase of power generated from 3,000-mw solar projects.Information Technology• NIIT has been awarded a multi-year contract to provide managed training
services to Citi in the Europe Middle East and African region. With this new partnership, NIIT's Corporate Learning Group will source and manage third party training procured by Citi across EMEA.
INTERNATIONAL NEWS• US consumer price index slipped by 0.2 percent in September after edging
down by 0.1 percent in August. Economists had expected prices to dip by 0.2 percent. The decrease by the headline index was partly due to another steep drop in energy prices, which plunged by 4.7 percent in September after tumbling by 2.0 percent in August.
• US initial jobless claims fell to 255,000, a decrease of 7,000 from the previous week's revised level of 262,000. The drop surprised economists, who had expected jobless claims to climb to 270,000 from the 263,000 originally reported for the previous week.
• US business inventories came in virtually unchanged in August after revised data showed that inventories were also unchanged in July. Economists had expected inventories to inch up by 0.1 percent, matching the modest increase originally reported for the previous month.
• US producer price index for final demand fell by 0.5 percent in September after coming in unchanged in August. Economists had expected the index to dip by 0.2 percent.
• US retail sales edged up by 0.1 percent in September, while economists had expected sales to rise by 0.2 percent. Retail sales in August were also downwardly revised to unchanged compared to the previously reported 0.2 percent increase.
• According to the data from the People's Bank of China revealed, China's bank lending increased more than expected in September. Banks extended CNY 1.05 trillion loans in September. Economists had forecast it to rise to CNY 900 billion from CNY 809.6 billion in August.
• Japan's industrial output declined more than estimated and tertiary industry activity grew only marginally in August. Industrial output fell 1.2 percent in August from July, which was bigger than a 0.5 percent drop estimated initially.
• China's consumer price inflation slowed to 1.6 percent in September from a 12-month high of 2 percent seen in August. It was forecast to fall to 1.8 percent.
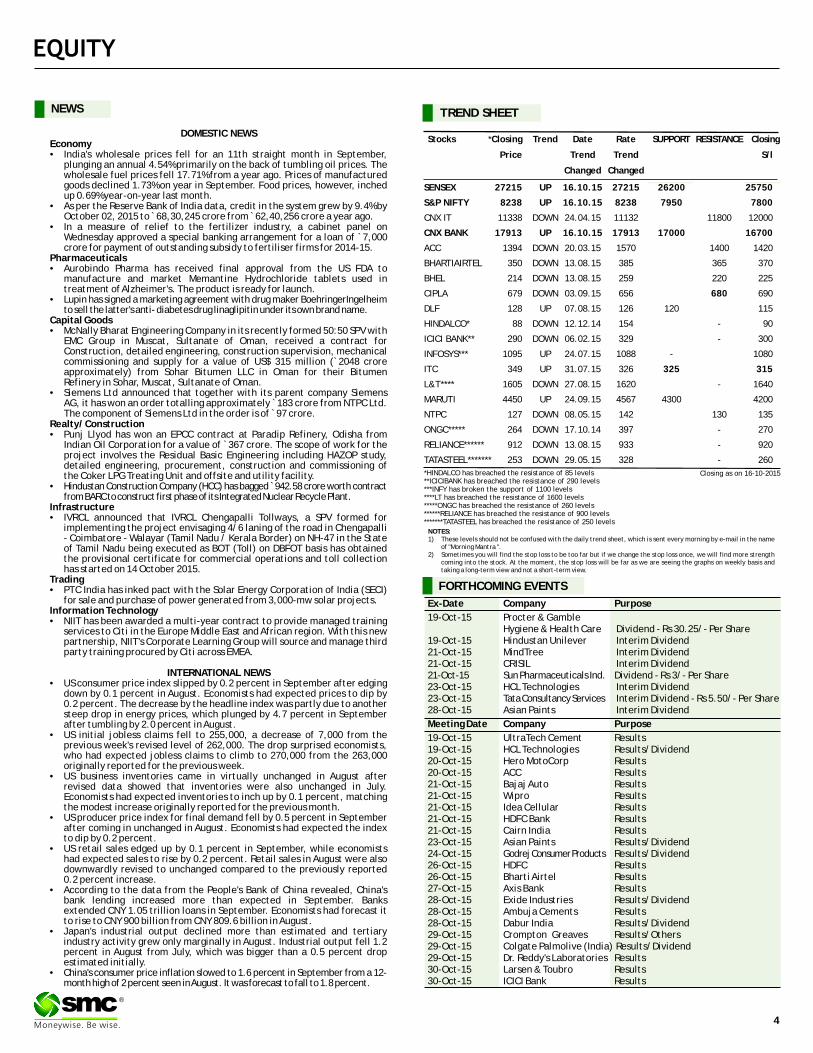
Ex-Date Company Purpose
19-Oct-15 Procter & GambleHygiene & Health Care Dividend - Rs 30.25/- Per Share
19-Oct-15 Hindustan Unilever Interim Dividend21-Oct-15 MindTree Interim Dividend21-Oct-15 CRISIL Interim Dividend21-Oct-15 Sun Pharmaceuticals Ind. Dividend - Rs 3/- Per Share23-Oct-15 HCL Technologies Interim Dividend23-Oct-15 Tata Consultancy Services Interim Dividend - Rs 5.50/- Per Share28-Oct-15 Asian Paints Interim Dividend
Meeting Date Company Purpose
19-Oct-15 UltraTech Cement Results19-Oct-15 HCL Technologies Results/Dividend20-Oct-15 Hero MotoCorp Results20-Oct-15 ACC Results21-Oct-15 Bajaj Auto Results21-Oct-15 Wipro Results21-Oct-15 Idea Cellular Results21-Oct-15 HDFC Bank Results21-Oct-15 Cairn India Results23-Oct-15 Asian Paints Results/Dividend24-Oct-15 Godrej Consumer Products Results/Dividend26-Oct-15 HDFC Results26-Oct-15 Bharti Airtel Results27-Oct-15 Axis Bank Results28-Oct-15 Exide Industries Results/Dividend28-Oct-15 Ambuja Cements Results28-Oct-15 Dabur India Results/Dividend29-Oct-15 Crompton Greaves Results/Others29-Oct-15 Colgate Palmolive (India) Results/Dividend29-Oct-15 Dr. Reddy's Laboratories Results30-Oct-15 Larsen & Toubro Results30-Oct-15 ICICI Bank Results
FORTHCOMING EVENTS
NOTES:1) These levels should not be confused with the daily trend sheet, which is sent every morning by e-mail in the name
of "Morning Mantra ".2) Sometimes you will find the stop loss to be too far but if we change the stop loss once, we will find more strength
coming into the stock. At the moment, the stop loss will be far as we are seeing the graphs on weekly basis and taking a long-term view and not a short-term view.
TREND SHEET
Stocks *Closing Trend Date Rate SUPPORT RESISTANCE Closing
Price Trend Trend
Changed Changed
SENSEX 27215 UP 16.10.15 27215 26200 25750
S&P NIFTY 8238 UP 16.10.15 8238 7950 7800
CNX IT 11338 DOWN 24.04.15 11132 11800 12000
CNX BANK 17913 UP 16.10.15 17913 17000 16700
ACC 1394 DOWN 20.03.15 1570 1400 1420
BHARTIAIRTEL 350 DOWN 13.08.15 385 365 370
BHEL 214 DOWN 13.08.15 259 220 225
CIPLA 679 DOWN 03.09.15 656 680 690
DLF 128 UP 07.08.15 126 120 115
HINDALCO* 88 DOWN 12.12.14 154 - 90
ICICI BANK** 290 DOWN 06.02.15 329 - 300
INFOSYS*** 1095 UP 24.07.15 1088 - 1080
ITC 349 UP 31.07.15 326 325 315
L&T**** 1605 DOWN 27.08.15 1620 - 1640
MARUTI 4450 UP 24.09.15 4567 4300 4200
NTPC 127 DOWN 08.05.15 142 130 135
ONGC***** 264 DOWN 17.10.14 397 - 270
RELIANCE****** 912 DOWN 13.08.15 933 - 920
TATASTEEL******* 253 DOWN 29.05.15 328 - 260
S/l
4
®
Closing as on 16-10-2015*HINDALCO has breached the resistance of 85 levels**ICICIBANK has breached the resistance of 290 levels***INFY has broken the support of 1100 levels****LT has breached the resistance of 1600 levels*****ONGC has breached the resistance of 260 levels******RELIANCE has breached the resistance of 900 levels*******TATASTEEL has breached the resistance of 250 levels
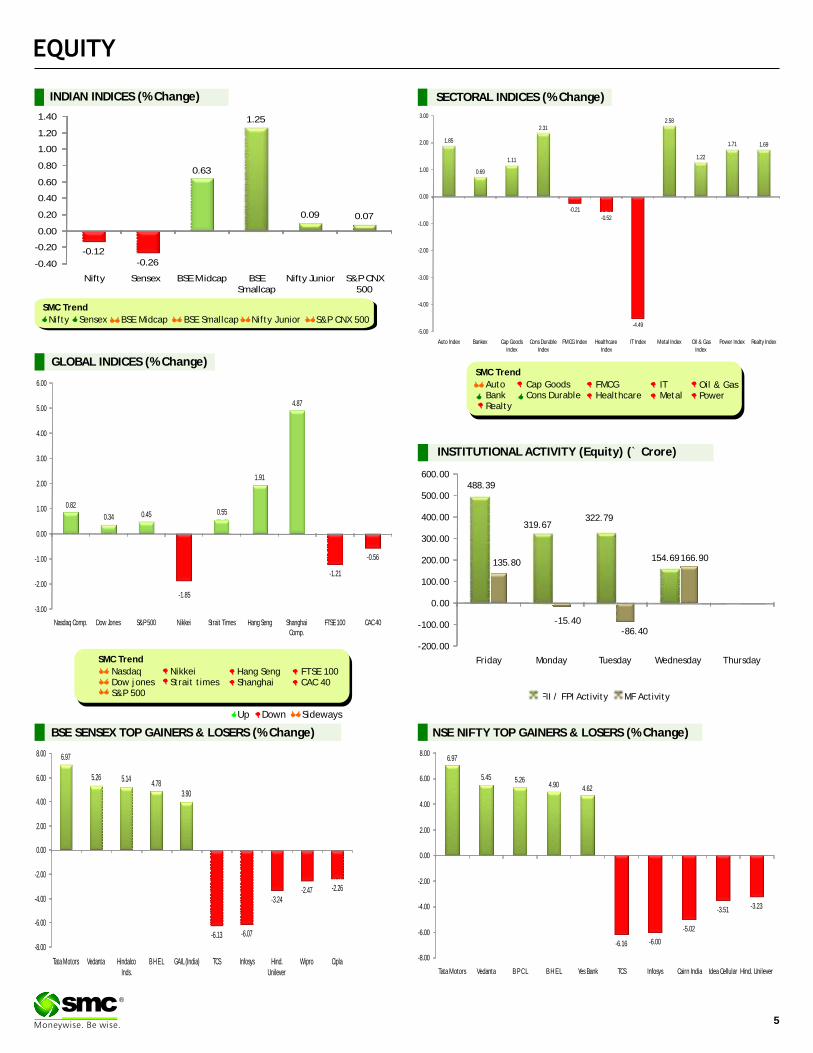
BSE SENSEX GAINERS & LOSERS TOP (% Change) NSE NIFTY GAINERS TOP & LOSERS (% Change)
SECTORAL INDICES (% Change)
SMC Trend
SMC Trend
FMCGHealthcare
FTSE 100CAC 40
Auto BankRealty
Cap GoodsCons Durable
Oil & GasPower
NasdaqDow jonesS&P 500
NikkeiStrait times
Hang SengShanghai
ITMetal
Down SidewaysUp
GLOBAL INDICES (% Change)
INDIAN INDICES (% Change)
5
®
SMC Trend
Nifty BSE Midcap S&P CNX 500BSE SmallcapSensex Nifty Junior
-15.40-86.40
488.39
319.67322.79
154.69135.80 166.90
-200.00
-100.00
0.00
100.00
200.00
300.00
400.00
500.00
600.00
Friday Monday Tuesday Wednesday Thursday
FII / FPI Activity MF Activity
6.97
5.45 5.264.90 4.62
-6.16 -6.00
-5.02
-3.51 -3.23
-8.00
-6.00
-4.00
-2.00
0.00
2.00
4.00
6.00
8.00
Tata Motors Vedanta B P C L B H E L Yes Bank TCS Infosys Cairn India Idea Cellular Hind. Unilever
6.97
5.26 5.144.78
3.90
-6.13 -6.07
-3.24-2.47 -2.26
-8.00
-6.00
-4.00
-2.00
0.00
2.00
4.00
6.00
8.00
Tata Motors Vedanta Hindalco Inds.
B H E L GAIL (India) TCS Infosys Hind. Unilever
Wipro Cipla
-0.12-0.26
0.63
1.25
0.09 0.07
-0.40
-0.20
0.00
0.20
0.40
0.60
0.80
1.00
1.20
1.40
Nifty Sensex BSE Midcap BSE Smallcap
Nifty Junior S&P CNX 500
-0.21
-0.52
-4.49
1.85
0.69
1.11
2.312.58
1.22
1.71 1.69
-5.00
-4.00
-3.00
-2.00
-1.00
0.00
1.00
2.00
3.00
Auto Index Bankex Cap Goods Index
Cons Durable Index
FMCG Index Healthcare Index
IT Index Metal Index Oil & Gas Index
Power Index Realty Index
0.82
0.34 0.45 0.55
1.91
4.87
-1.85
-1.21
-0.56
-3.00
-2.00
-1.00
0.00
1.00
2.00
3.00
4.00
5.00
6.00
Nasdaq Comp. Dow Jones S&P 500 Nikkei Strait Times Hang Seng Shanghai Comp.
FTSE 100 CAC 40
INSTITUTIONAL ACTIVITY (Equity) (` Crore)
Beat the street - Fundamental Analysis
Above calls are recommended with a time horizon of 8 to 10 months. Source: Company Website Reuters Capitaline
6
®
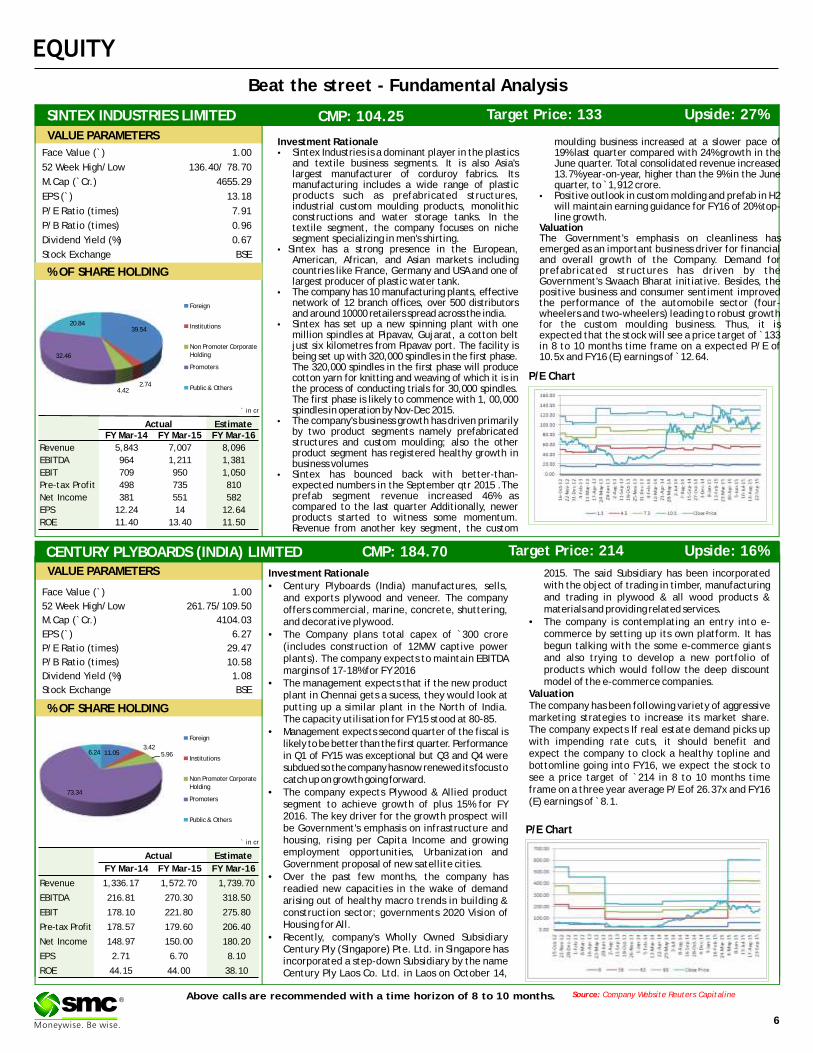
Investment Rationale 2015. The said Subsidiary has been incorporated with the object of trading in timber, manufacturing •Century Plyboards (India) manufactures, sells, and trading in plywood & all wood products & and exports plywood and veneer. The company materials and providing related services.offers commercial, marine, concrete, shuttering,
and decorative plywood. •The company is contemplating an entry into e-commerce by setting up its own platform. It has •The Company plans total capex of `300 crore begun talking with the some e-commerce giants (includes construction of 12MW captive power and also trying to develop a new portfolio of plants). The company expects to maintain EBITDA products which would follow the deep discount margins of 17-18% for FY 2016model of the e-commerce companies.•The management expects that if the new product
Valuationplant in Chennai gets a sucess, they would look at The company has been following variety of aggressive putting up a similar plant in the North of India. marketing strategies to increase its market share. The capacity utilisation for FY15 stood at 80-85.The company expects If real estate demand picks up •Management expects second quarter of the fiscal is with impending rate cuts, it should benefit and likely to be better than the first quarter. Performance expect the company to clock a healthy topline and in Q1 of FY15 was exceptional but Q3 and Q4 were bottomline going into FY16, we expect the stock to subdued so the company has now renewed its focus to see a price target of `214 in 8 to 10 months time catch up on growth going forward. frame on a three year average P/E of 26.37x and FY16 •The company expects Plywood & Allied product (E) earnings of ̀ 8.1.segment to achieve growth of plus 15% for FY
2016. The key driver for the growth prospect will be Government's emphasis on infrastructure and housing, rising per Capita Income and growing employment opportunities, Urbanization and Government proposal of new satellite cities.
•Over the past few months, the company has readied new capacities in the wake of demand arising out of healthy macro trends in building & construction sector; governments 2020 Vision of Housing for All.
•Recently, company's Wholly Owned Subsidiary Century Ply (Singapore) Pte. Ltd. in Singapore has incorporated a step-down Subsidiary by the name Century Ply Laos Co. Ltd. in Laos on October 14,
Face Value (`) 1.00
52 Week High/Low 261.75/109.50
M.Cap (`Cr.) 4104.03
EPS (`) 6.27
P/E Ratio (times) 29.47
P/B Ratio (times) 10.58
Dividend Yield (%) 1.08
Stock Exchange BSE
` in cr
% OF SHARE HOLDING
P/E Chart
CENTURY PLYBOARDS (INDIA) LIMITED CMP: 184.70 Upside: 16%Target Price: 214
VALUE PARAMETERS
Actual Estimate
FY Mar-14 FY Mar-15 FY Mar-16
Revenue 1,336.17 1,572.70 1,739.70
EBITDA 216.81 270.30 318.50
EBIT 178.10 221.80 275.80
Pre-tax Profit 178.57 179.60 206.40
Net Income 148.97 150.00 180.20
EPS 2.71 6.70 8.10
ROE 44.15 44.00 38.10
SINTEX INDUSTRIES LIMITED CMP: 104.25 Upside: 27%Target Price: 133
Investment Rationale moulding business increased at a slower pace of •Sintex Industries is a dominant player in the plastics 19% last quarter compared with 24% growth in the
and textile business segments. It is also Asia's June quarter. Total consolidated revenue increased largest manufacturer of corduroy fabrics. Its 13.7% year-on-year, higher than the 9% in the June manufacturing includes a wide range of plastic quarter, to ̀ 1,912 crore.products such as prefabricated structures, •Positive outlook in custom molding and prefab in H2 industrial custom moulding products, monolithic will maintain earning guidance for FY16 of 20% top-constructions and water storage tanks. In the line growth.textile segment, the company focuses on niche Valuationsegment specializing in men's shirting. The Government's emphasis on cleanliness has
• Sintex has a strong presence in the European, emerged as an important business driver for financial American, African, and Asian markets including and overall growth of the Company. Demand for countries like France, Germany and USA and one of prefabricated structures has driven by the largest producer of plastic water tank. Government's Swaach Bharat initiative. Besides, the
•The company has 10 manufacturing plants, effective positive business and consumer sentiment improved network of 12 branch offices, over 500 distributors the performance of the automobile sector (four-and around 10000 retailers spread across the india. wheelers and two-wheelers) leading to robust growth
•Sintex has set up a new spinning plant with one for the custom moulding business. Thus, it is million spindles at Pipavav, Gujarat, a cotton belt expected that the stock will see a price target of ̀ 133 just six kilometres from Pipavav port. The facility is in 8 to 10 months time frame on a expected P/E of being set up with 320,000 spindles in the first phase. 10.5x and FY16 (E) earnings of ̀ 12.64.The 320,000 spindles in the first phase will produce cotton yarn for knitting and weaving of which it is in the process of conducting trials for 30,000 spindles. The first phase is likely to commence with 1, 00,000 spindles in operation by Nov-Dec 2015.
•The company's business growth has driven primarily by two product segments namely prefabricated structures and custom moulding; also the other product segment has registered healthy growth in business volumes
•Sintex has bounced back with better-than-expected numbers in the September qtr 2015 .The prefab segment revenue increased 46% as compared to the last quarter Additionally, newer products started to witness some momentum. Revenue from another key segment, the custom
Face Value (`) 1.00
52 Week High/Low 136.40/ 78.70
M.Cap (`Cr.) 4655.29
EPS (`) 13.18
P/E Ratio (times) 7.91
P/B Ratio (times) 0.96
Dividend Yield (%) 0.67
Stock Exchange BSE
VALUE PARAMETERS
% OF SHARE HOLDING
P/E Chart
` in cr
Actual Estimate FY Mar-14 FY Mar-15 FY Mar-16
Revenue 5,843 7,007 8,096
EBITDA 964 1,211 1,381
EBIT 709 950 1,050
Pre-tax Profit 498 735 810
Net Income 381 551 582
EPS 12.24 14 12.64
ROE 11.40 13.40 11.50
11.053.42
5.96
73.34
6.24
Foreign
Institutions
Non Promoter Corporate Holding
Promoters
Public & Others
39.54
2.744.42
32.46
20.84
Foreign
Institutions
Non Promoter Corporate Holding
Promoters
Public & Others
Charts by Spider Software India Ltd
7
EQUITY
Above calls are recommended with a time horizon of 1-2 months
Disclaimer : research. The analysis contained in the analyst research is based on numerous assumptions. Different assumptions could result in materially different results.The analyst, not any of its affiliated companies, not any of their members, directors, employees or agents accepts any liability for any loss or damage arising out of the use of all or any part of the analysis research.
The analyst and its affiliates companies make no representation or warranty in relation to the accuracy, completeness or reliability of the information contained in its
SOURCE: CAPITAL LINE
®
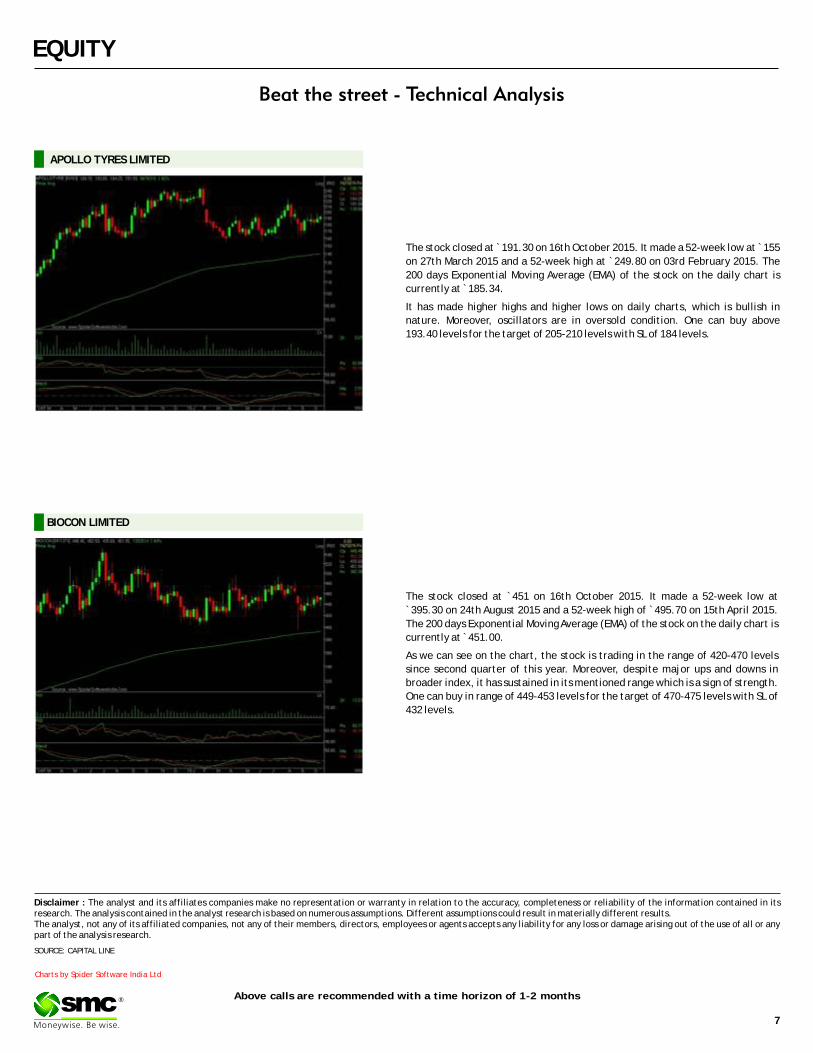
The stock closed at ̀ 191.30 on 16th October 2015. It made a 52-week low at ̀ 155
on 27th March 2015 and a 52-week high at `249.80 on 03rd February 2015. The
200 days Exponential Moving Average (EMA) of the stock on the daily chart is
currently at ̀ 185.34.
It has made higher highs and higher lows on daily charts, which is bullish in
nature. Moreover, oscillators are in oversold condition. One can buy above
193.40 levels for the target of 205-210 levels with SL of 184 levels.
APOLLO TYRES LIMITED
The stock closed at `451 on 16th October 2015. It made a 52-week low at
`395.30 on 24th August 2015 and a 52-week high of `495.70 on 15th April 2015.
The 200 days Exponential Moving Average (EMA) of the stock on the daily chart is
currently at ̀ 451.00.
As we can see on the chart, the stock is trading in the range of 420-470 levels
since second quarter of this year. Moreover, despite major ups and downs in
broader index, it has sustained in its mentioned range which is a sign of strength.
One can buy in range of 449-453 levels for the target of 470-475 levels with SL of
432 levels.
BIOCON LIMITED
DERIVATIVES
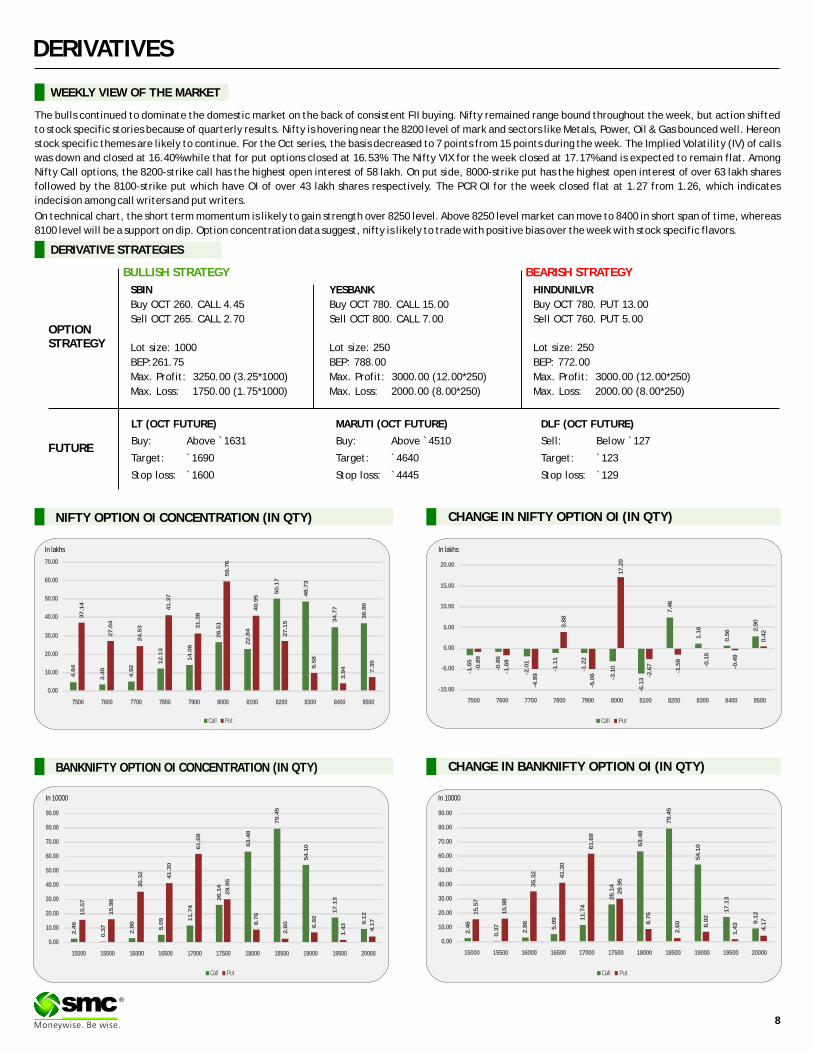
CHANGE IN NIFTY OPTION OI (IN QTY)
WEEKLY VIEW OF THE MARKET
NIFTY OPTION OI CONCENTRATION (IN QTY)
CHANGE IN BANKNIFTY OPTION OI (IN QTY)BANKNIFTY OPTION OI CONCENTRATION (IN QTY)
®
LT (OCT FUTURE)
Buy: Above `1631
Target: `1690
Stop loss: `1600
HINDUNILVR
Buy OCT 780. PUT 13.00
Sell OCT 760. PUT 5.00
Lot size: 250
BEP: 772.00
Max. Profit: 3000.00 (12.00*250)
Max. Loss: 2000.00 (8.00*250)
OPTIONSTRATEGY
FUTURE
SBIN
Buy OCT 260. CALL 4.45
Sell OCT 265. CALL 2.70
Lot size: 1000
BEP:261.75
Max. Profit: 3250.00 (3.25*1000)
Max. Loss: 1750.00 (1.75*1000)
YESBANK
Buy OCT 780. CALL 15.00
Sell OCT 800. CALL 7.00
Lot size: 250
BEP: 788.00
Max. Profit: 3000.00 (12.00*250)
Max. Loss: 2000.00 (8.00*250)
DERIVATIVE STRATEGIES
MARUTI (OCT FUTURE)
Buy: Above `4510
Target: `4640
Stop loss: `4445
DLF (OCT FUTURE)
Sell: Below `127
Target: `123
Stop loss: `129
BULLISH STRATEGY BEARISH STRATEGY
The bulls continued to dominate the domestic market on the back of consistent FII buying. Nifty remained range bound throughout the week, but action shifted
to stock specific stories because of quarterly results. Nifty is hovering near the 8200 level of mark and sectors like Metals, Power, Oil & Gas bounced well. Hereon
stock specific themes are likely to continue. For the Oct series, the basis decreased to 7 points from 15 points during the week. The Implied Volatility (IV) of calls
was down and closed at 16.40% while that for put options closed at 16.53%. The Nifty VIX for the week closed at 17.17% and is expected to remain flat. Among
Nifty Call options, the 8200-strike call has the highest open interest of 58 lakh. On put side, 8000-strike put has the highest open interest of over 63 lakh shares
followed by the 8100-strike put which have OI of over 43 lakh shares respectively. The PCR OI for the week closed flat at 1.27 from 1.26, which indicates
indecision among call writers and put writers.
On technical chart, the short term momentum is likely to gain strength over 8250 level. Above 8250 level market can move to 8400 in short span of time, whereas
8100 level will be a support on dip. Option concentration data suggest, nifty is likely to trade with positive bias over the week with stock specific flavors.
In lakhs
In 10000 In 10000
Call Put
4.8
4
3.4
5
4.9
2
12
.13
14
.06
26
.51
22
.84
50
.17
48
.73
34
.77
36
.86
37
.14
27
.04
24
.53
41
.37
31
.38
59
.76
40
.95
27
.15
9.5
8
3.9
4 7.3
5
0.00
10.00
20.00
30.00
40.00
50.00
60.00
70.00
7500 7600 7700 7800 7900 8000 8100 8200 8300 8400 8500
Call Put
-1.6
5
-0.8
6
-2.0
1
-1.1
1
-1.2
2
-3.1
0
-6.1
3
7.4
6
1.1
6
0.5
6 2.9
0
-0.8
9
-1.6
9
-4.9
9
3.8
8
-5.0
6
17
.20
-2.6
7
-1.5
8
-0.1
5
-0.4
9
0.4
2
-10.00
-5.00
0.00
5.00
10.00
15.00
20.00
7500 7600 7700 7800 7900 8000 8100 8200 8300 8400 8500
Call Put
2.4
6
0.3
7
2.8
6
5.0
9 11
.74
26
.14
63
.48
79
.45
54
.10
17
.13
9.1
215
.57
15
.98
35
.32
41
.30
61
.69
29
.95
8.7
6
2.6
0
6.9
2
1.4
3
4.1
7
0.00
10.00
20.00
30.00
40.00
50.00
60.00
70.00
80.00
90.00
15000 15500 16000 16500 17000 17500 18000 18500 19000 19500 20000
Call Put
2.4
6
0.3
7
2.8
6
5.0
9 11
.74
26
.14
63
.48
79
.45
54
.10
17
.13
9.1
215
.57
15
.98
35
.32
41
.30
61
.69
29
.95
8.7
6
2.6
0
6.9
2
1.4
3
4.1
7
0.00
10.00
20.00
30.00
40.00
50.00
60.00
70.00
80.00
90.00
15000 15500 16000 16500 17000 17500 18000 18500 19000 19500 20000
8
In lakhs
9
DERIVATIVES
®
FII’s ACTIVITY IN DERIVATIVE SEGMENT
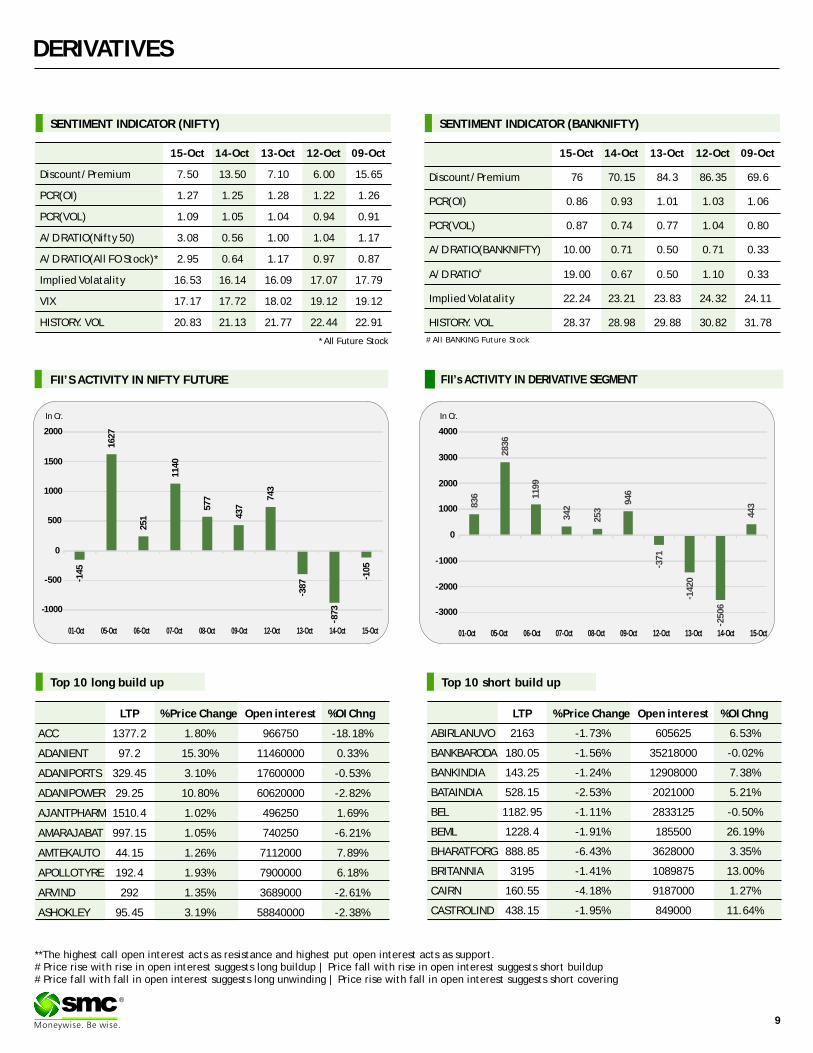
SENTIMENT INDICATOR (NIFTY)
15-Oct 14-Oct 13-Oct 12-Oct 09-Oct
Discount/Premium 7.50 13.50 7.10 6.00 15.65
PCR(OI) 1.27 1.25 1.28 1.22 1.26
PCR(VOL) 1.09 1.05 1.04 0.94 0.91
A/D RATIO(Nifty 50) 3.08 0.56 1.00 1.04 1.17
A/D RATIO(All FO Stock)* 2.95 0.64 1.17 0.97 0.87
Implied Volatality 16.53 16.14 16.09 17.07 17.79
VIX 17.17 17.72 18.02 19.12 19.12
HISTORY. VOL 20.83 21.13 21.77 22.44 22.91
*All Future Stock
SENTIMENT INDICATOR (BANKNIFTY)
15-Oct 14-Oct 13-Oct 12-Oct 09-Oct
Discount/Premium 76 70.15 84.3 86.35 69.6
PCR(OI) 0.86 0.93 1.01 1.03 1.06
PCR(VOL) 0.87 0.74 0.77 1.04 0.80
A/D RATIO(BANKNIFTY) 10.00 0.71 0.50 0.71 0.33
#A/D RATIO 19.00 0.67 0.50 1.10 0.33
Implied Volatality 22.24 23.21 23.83 24.32 24.11
HISTORY. VOL 28.37 28.98 29.88 30.82 31.78
FII’S ACTIVITY IN NIFTY FUTURE
**The highest call open interest acts as resistance and highest put open interest acts as support.# Price rise with rise in open interest suggests long buildup | Price fall with rise in open interest suggests short buildup # Price fall with fall in open interest suggests long unwinding | Price rise with fall in open interest suggests short covering
# All BANKING Future Stock
Top 10 short build up
In Cr. In Cr.
Top 10 long build up
LTP % Price Change Open interest %OI Chng
ACC 1377.2 1.80% 966750 -18.18%
ADANIENT 97.2 15.30% 11460000 0.33%
ADANIPORTS 329.45 3.10% 17600000 -0.53%
ADANIPOWER 29.25 10.80% 60620000 -2.82%
AJANTPHARM 1510.4 1.02% 496250 1.69%
AMARAJABAT 997.15 1.05% 740250 -6.21%
AMTEKAUTO 44.15 1.26% 7112000 7.89%
APOLLOTYRE 192.4 1.93% 7900000 6.18%
ARVIND 292 1.35% 3689000 -2.61%
ASHOKLEY 95.45 3.19% 58840000 -2.38%
LTP % Price Change Open interest %OI Chng
ABIRLANUVO 2163 -1.73% 605625 6.53%
BANKBARODA 180.05 -1.56% 35218000 -0.02%
BANKINDIA 143.25 -1.24% 12908000 7.38%
BATAINDIA 528.15 -2.53% 2021000 5.21%
BEL 1182.95 -1.11% 2833125 -0.50%
BEML 1228.4 -1.91% 185500 26.19%
BHARATFORG 888.85 -6.43% 3628000 3.35%
BRITANNIA 3195 -1.41% 1089875 13.00%
CAIRN 160.55 -4.18% 9187000 1.27%
CASTROLIND 438.15 -1.95% 849000 11.64%
- 14
5
16
27
25
1
11
40
57
7
43
7
74
3
- 38
7
- 87
3
- 10
5
-1000
-500
0
500
1000
1500
2000
01-Oct 05-Oct 06-Oct 07-Oct 08-Oct 09-Oct 12-Oct 13-Oct 14-Oct 15-Oct
83
6
28
36
11
99
34
2
25
3
94
6
- 37
1
- 14
20
- 25
06
44
3
-3000
-2000
-1000
0
1000
2000
3000
4000
01-Oct 05-Oct 06-Oct 07-Oct 08-Oct 09-Oct 12-Oct 13-Oct 14-Oct 15-Oct
Turmeric futures (Nov) is likely to trade with an upside bias in the range of 7900-8500 levels. The sentiments of the spot markets are optimistic & the prices of the yellow spices are rising as the upcountry exporters have received fresh orders from North Indian pockets before the festivities. Moreover, the sales at Erode have increased due to arrival of quality produce. At the Erode Turmeric Merchants Association sales yard, the finger turmeric was sold at `5,799-8,699 a quintal; the root variety `5,699-7,839. Jeera futures (Nov) will possibly trade range bound within 16350-17050 levels. At the spot markets, the exporters at Unjha Mandi are active & procuring to meet the export demand from Singapore and Sri Lanka. The downtrend in cardamom futures (Nov) might get extended & fall towards 795-785 levels. The weather is being favourable in growing regions for the current picking and is expected to increase the production. The third round of picking activity is going on in Kerala growing regions it will continue till one month. The counter is under selling pressure as the fresh capsules are arriving in the spot markets and secondly, the stockist are releasing their old inventories on expectations of higher production during the current year. Coriander futures (Nov) is expected to consolidate in the range of 11600-12600 levels. In days to come, the cultivation process will start on time in major growing regions & hopes of better sowing may pressurize prices at higher levels in coming days. The gains may remain capped on the back of strong stocks in local mandies along with receding export demand. It is estimated that the stocks have been higher around 75-77 lakh tonnes in the major mandies.
SPICES
Bullion counter may trade on a volatile path as some profit booking can be seen at higher levels. Expectation about the delay in the interest rate hike in the US and decline in dollar index has given further support to the prices. On the domestic bourses, movement in the local currency rupee has affected the prices which can move in the range of 64-66 in the near term. Meanwhile, the dollar index can move in the range of 93.5-96.5 levels. Gold can move in the range of 26500-28000 while Silver can move in the range of 36000-38000. Signs of stagnating U.S. inflation and retail sales added to the case to keep rates low, which revives the appeal of gold as a store of value. The gold price has been driven by expectations of the U.S. dollar and as the next Fed hike gets pushed out to probably March 2016. Gold discounts in India widened to a three-month high recently as retail demand remained sluggish amid ample supplies and higher prices. Buying elsewhere in Asia was also lackluster. Top consumer China disappointed with moderate post-holiday demand and physical prices fell in some other major trading centres. Prolonged weakness in Asian demand could hamper a rally in global gold prices, which hit a three-month high earlier this week before giving up some gains. In India, the second-biggest gold consumer, dealers were offering a discount of $7 to $11 an ounce to the global benchmark, compared to $6 to $8 last week. Holdings in exchange-traded products backed by bullion are headed for the fourth gain in five weeks.
BULLIONS
10
Base metal counter may witness some short covering at lower levels as Lead and Zinc may outperform other base metals amid Glencore mine closure. Copper may move in the range of 325-365. Rio Tinto has no plans to join rival Glencore in cutting copper output next year to boost prices, having already reduced production at its U.S. operations this year. Prices were supported by expectations for a tightening of the market as several mining groups consider output cuts in the face of slowing demand growth in China, which accounts for nearly half of global copper consumption. Codelco, the world's largest copper producer, stated that it would have to rethink or delay expansion projects after lower metal prices weighed on its earnings. This follows Glencore's announcement last month that it will suspend operations at some of its units in Zambia and the Democratic Republic of Congo for 18 months, removing 400,000 tonnes of cathode from the market. Aluminum may move in the range of 98-107 in MCX. While zinc can move in the range of 114-124 and lead can move in the range of 112-120. Glencore also announced a 500,000-mt reduction of contained zinc metal mine production across its operations in Australia, South America and Kazakhstan to preserve the value of its reserves at a time of low zinc and lead prices. Nickel may move in the range of 640-720 in MCX. A unit of China steel producer Tsingshan Group is set to triple its capacity to produce nickel pig iron in Indonesia. Chinese stainless steel mills often feed nickel pig iron into furnaces to strengthen their product as a cheaper alternative to refined nickel.
®
BASE METALS
Crude oil may remain on a volatile path as decline in rig count may give support to the prices while rise in EIA crude oil stocks is keeping the prices downbeat. Crude oil can move in the range of 2900-3300 in MCX. The Energy Information Administration (EIA) stated that crude inventories rose by 7.6 million barrels for the week ended Oct 9. The crude builds comes amid lower processing of oil in the United States as refiners shut for maintenance after the peak summer driving season. Gasoline stockpiles fell by 2.6 million barrels as less of the motor fuel was turned out last week. Refinery utilization in the U.S. Midwest fell to the lowest on record since 2010. Energy agencies such as the IEA (International Energy Agency) and the EIA (U.S. Energy Information Administration) expect crude oil production to fall over the long term in the non-OPEC (Organization of the Petroleum Exporting Countries) region. Even OPEC highlighted in its recent report that crude oil production from non-OPEC countries are expected to fall, led by the United States. Natural gas prices are expected to remain on a volatile path as weather conditions and EIA inventory position to give further direction to the prices. Overall, it can move in the range of 140-170 in MCX. Weather forecasts showing unseasonably cold weather spreading almost everywhere east of the Mississippi River through early next week. Commodity Weather Group LLC's update shows colder weather than expected, maybe as much as 15-degrees-Fahrenheit-below normal from eastern Kentucky through Vermont.
ENERGY COMPLEX
The Bull Run is likely to persist in soybean futures (Nov) & the counter will possibly rise further to test 4200-4300 levels. As cited by the U.S Department of Agriculture, the abnormal weather conditions will reduce yields and lead to an overall production decline in oilseeds. The month of August and September saw deficit and uneven rainfall distribution in most production areas of beans & hence yields were adversely affected. Abnormal weather conditions in some growing areas also led to greater instances of pests, diseases, and weeds. The production this year in Madhya Pradesh has been hit by white mosaic and shortage of water. According to preliminary survey, soybean had been sowed in 58 lakh hectares of land and damage has been reported in 18 lakh hectares of land. As a result, the farmers have moved away from soybean to other options such as paddy and lentils. CPO futures (Nov) will possibly continue to face resistance near 440 levels. In the current scenario, the supplies are comfortable in the domestic as well as in the international market. As reported by the Solvent Extractors' Association of India, India's monthly requirement of edible oil is about 16.0 lakh tonnes against which currently holding stock is more than 22.40 lakh tonnes equal to 42 days requirements. The palm oil inventory in Malaysia also rose to a lifetime-high in September, by 26% year-on-year to 2.63 million tonnes. Refined soy oil futures (Nov) is expected to gain for the fifth consecutive week towards 655 levels, pushed by rising demand by stockiest to meet their requirements for upcoming festivities & winter season.
OIL AND OILSEEDS
OTHER COMMODITIES
Kapas futures (April '16) is expected to consolidate in the range of 885-920 levels & remain stable with downside getting capped. This season there are hopes that cotton export from India is expected to surge up by around 5% to 958 thousand tonnes from 914 thousand tonnes from the previous season, as cited by the U.S Department of Agriculture. There is a crunch on the supply side as the early sown cotton is at the flowering/boll development stage & the first picking in Gujarat is expected to be delayed by two weeks. Sugar futures (Dec) is likely to take support near 2645 levels & trade with an upside bias. In the current scenario, the Indian mills are looking to boost refined sugar exports in order to raise cash for the coming crushing season, taking advantage of tight Thai supplies and longer shipping times from Brazil to major importing nations. The white sugar exports from Indian refineries have the potential to compete to markets in the Red Sea, East Africa and the Indian Ocean. The rally in Chana futures (Nov) might get capped & the counter may face resistance near 5500 levels. The government is continuously monitoring & taking measures to control the spiraling prices of pulses. Recently, it was announced that the Government will import another 2,000 tonne of pulses, in addition to 5,000 tonnes lying at the ports and another 2,000 ton of pulses that are in transit. The government has also decided to invoke the Rs 500-crore Price Stabilization Fund that will be used to pay for transportation, handling, milling and processing to reduce the cost of imported pulses, so as to make pulses available in the retail markets at lower rates.
11
TECHNICAL RECOMMENDATIONS
COMMODITY
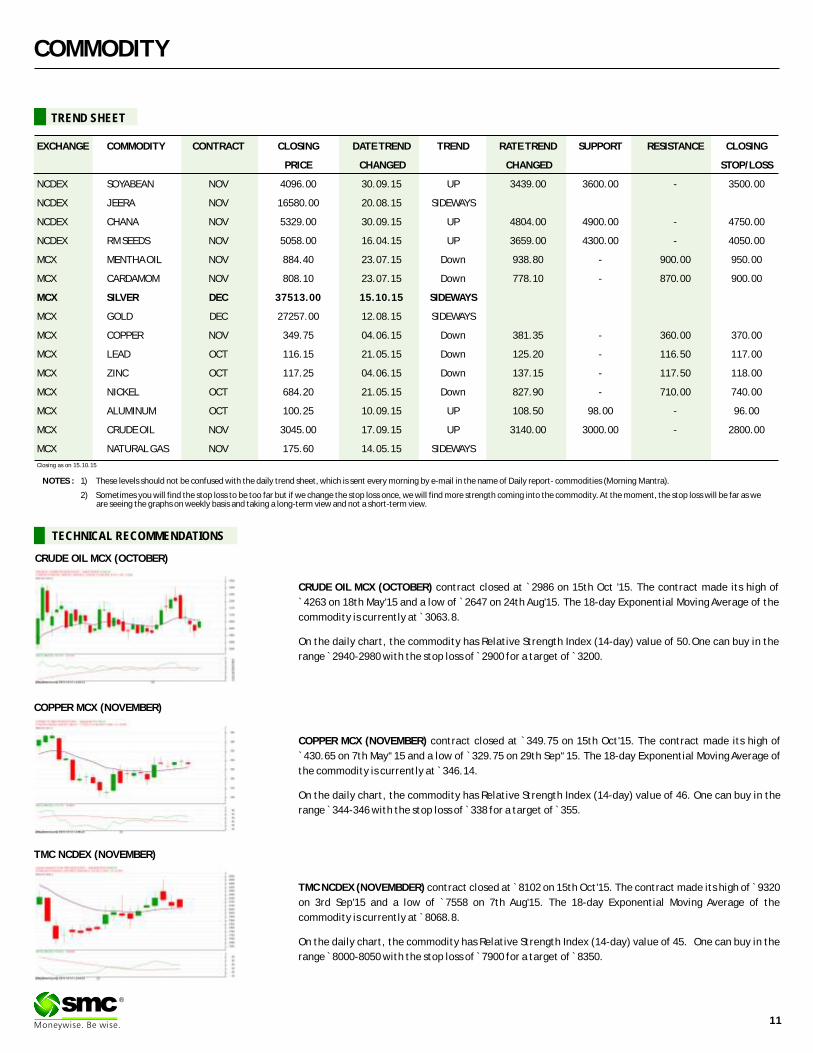
CRUDE OIL MCX (OCTOBER) contract closed at `2986 on 15th Oct '15. The contract made its high of
`4263 on 18th May'15 and a low of ̀ 2647 on 24th Aug'15. The 18-day Exponential Moving Average of the
commodity is currently at ̀ 3063.8.
On the daily chart, the commodity has Relative Strength Index (14-day) value of 50.One can buy in the
range ̀ 2940-2980 with the stop loss of ̀ 2900 for a target of ̀ 3200.
COPPER MCX (NOVEMBER) contract closed at 349.75 on 15th Oct'15. The contract made its high of
`430.65 on 7th May“15 and a low of ̀ 329.75 on 29th Sep“15. The 18-day Exponential Moving Average of
the commodity is currently at ̀ 346.14.
On the daily chart, the commodity has Relative Strength Index (14-day) value of 46. One can buy in the
range ̀ 344-346 with the stop loss of ̀ 338 for a target of ̀ 355.
`
TMC NCDEX (NOVEMBDER) contract closed at 8102 on 15th Oct'15. The contract made its high of 9320
on 3rd Sep'15 and a low of `7558 on 7th Aug'15. The 18-day Exponential Moving Average of the
commodity is currently at ̀ 8068.8.
On the daily chart, the commodity has Relative Strength Index (14-day) value of 45. One can buy in the
range ̀ 8000-8050 with the stop loss of ̀ 7900 for a target of ̀ 8350.
` `
®
CRUDE OIL MCX (OCTOBER)
COPPER MCX (NOVEMBER)
TMC NCDEX (NOVEMBER)
NOTES : 1) These levels should not be confused with the daily trend sheet, which is sent every morning by e-mail in the name of Daily report- commodities (Morning Mantra).
2) Sometimes you will find the stop loss to be too far but if we change the stop loss once, we will find more strength coming into the commodity. At the moment, the stop loss will be far as we are seeing the graphs on weekly basis and taking a long-term view and not a short-term view.
EXCHANGE COMMODITY CONTRACT CLOSING DATE TREND TREND RATE TREND SUPPORT RESISTANCE CLOSING
PRICE CHANGED CHANGED STOP/LOSS
NCDEX SOYABEAN NOV 4096.00 30.09.15 UP 3439.00 3600.00 - 3500.00
NCDEX JEERA NOV 16580.00 20.08.15 SIDEWAYS
NCDEX CHANA NOV 5329.00 30.09.15 UP 4804.00 4900.00 - 4750.00
NCDEX RM SEEDS NOV 5058.00 16.04.15 UP 3659.00 4300.00 - 4050.00
MCX MENTHA OIL NOV 884.40 23.07.15 Down 938.80 - 900.00 950.00
MCX CARDAMOM NOV 808.10 23.07.15 Down 778.10 - 870.00 900.00
MCX SILVER DEC 37513.00 15.10.15 SIDEWAYS
MCX GOLD DEC 27257.00 12.08.15 SIDEWAYS
MCX COPPER NOV 349.75 04.06.15 Down 381.35 - 360.00 370.00
MCX LEAD OCT 116.15 21.05.15 Down 125.20 - 116.50 117.00
MCX ZINC OCT 117.25 04.06.15 Down 137.15 - 117.50 118.00
MCX NICKEL OCT 684.20 21.05.15 Down 827.90 - 710.00 740.00
MCX ALUMINUM OCT 100.25 10.09.15 UP 108.50 98.00 - 96.00
MCX CRUDE OIL NOV 3045.00 17.09.15 UP 3140.00 3000.00 - 2800.00
MCX NATURAL GAS NOV 175.60 14.05.15 SIDEWAYS
TREND SHEET
Closing as on 15.10.15
COMMODITY
NEWS DIGEST
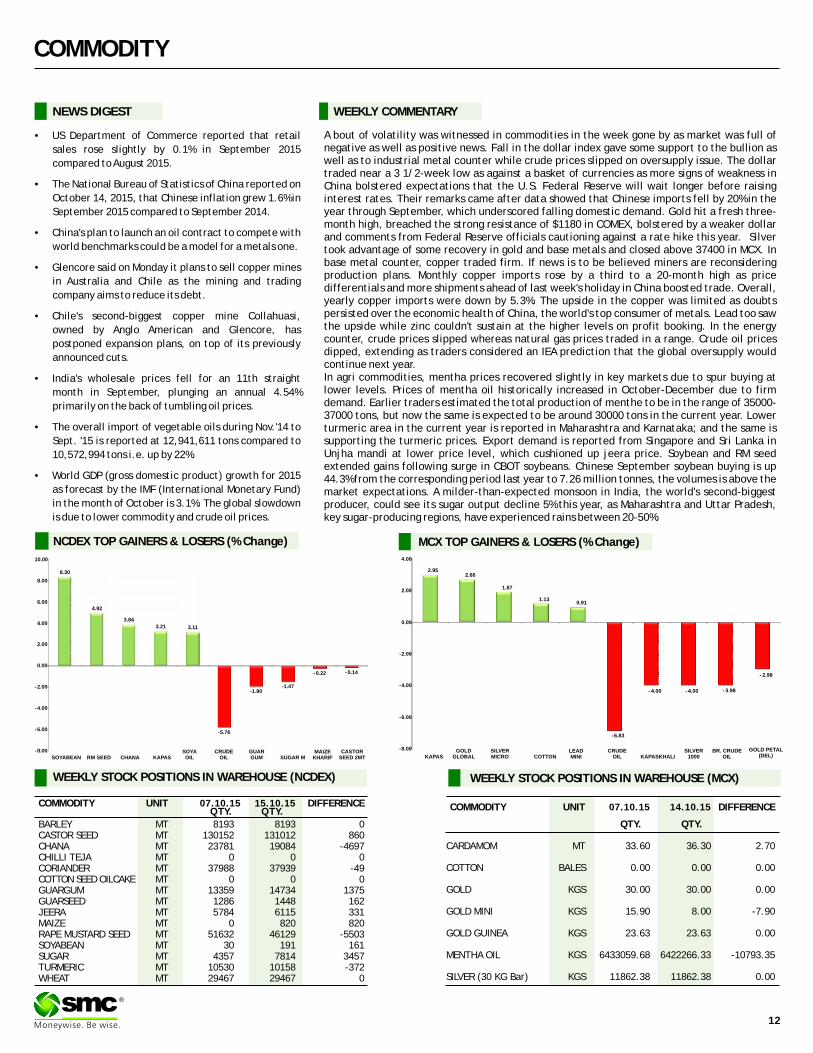
A bout of volatility was witnessed in commodities in the week gone by as market was full of negative as well as positive news. Fall in the dollar index gave some support to the bullion as well as to industrial metal counter while crude prices slipped on oversupply issue. The dollar traded near a 3 1/2-week low as against a basket of currencies as more signs of weakness in China bolstered expectations that the U.S. Federal Reserve will wait longer before raising interest rates. Their remarks came after data showed that Chinese imports fell by 20% in the year through September, which underscored falling domestic demand. Gold hit a fresh three-month high, breached the strong resistance of $1180 in COMEX, bolstered by a weaker dollar and comments from Federal Reserve officials cautioning against a rate hike this year. Silver took advantage of some recovery in gold and base metals and closed above 37400 in MCX. In base metal counter, copper traded firm. If news is to be believed miners are reconsidering production plans. Monthly copper imports rose by a third to a 20-month high as price differentials and more shipments ahead of last week's holiday in China boosted trade. Overall, yearly copper imports were down by 5.3%. The upside in the copper was limited as doubts persisted over the economic health of China, the world's top consumer of metals. Lead too saw the upside while zinc couldn't sustain at the higher levels on profit booking. In the energy counter, crude prices slipped whereas natural gas prices traded in a range. Crude oil prices dipped, extending as traders considered an IEA prediction that the global oversupply would continue next year. In agri commodities, mentha prices recovered slightly in key markets due to spur buying at lower levels. Prices of mentha oil historically increased in October-December due to firm demand. Earlier traders estimated the total production of menthe to be in the range of 35000-37000 tons, but now the same is expected to be around 30000 tons in the current year. Lower turmeric area in the current year is reported in Maharashtra and Karnataka; and the same is supporting the turmeric prices. Export demand is reported from Singapore and Sri Lanka in Unjha mandi at lower price level, which cushioned up jeera price. Soybean and RM seed extended gains following surge in CBOT soybeans. Chinese September soybean buying is up 44.3% from the corresponding period last year to 7.26 million tonnes, the volumes is above the market expectations. A milder-than-expected monsoon in India, the world's second-biggest producer, could see its sugar output decline 5% this year, as Maharashtra and Uttar Pradesh, key sugar-producing regions, have experienced rains between 20-50%.
WEEKLY COMMENTARY
WEEKLY STOCK POSITIONS IN WAREHOUSE (NCDEX)
COMMODITY UNIT 15.10.15 DIFFERENCEQTY. QTY.
BARLEY MT 8193 8193 0CASTOR SEED MT 130152 131012 860CHANA MT 23781 19084 -4697CHILLI TEJA MT 0 0 0CORIANDER MT 37988 37939 -49COTTON SEED OILCAKE MT 0 0 0GUARGUM MT 13359 14734 1375GUARSEED MT 1286 1448 162JEERA MT 5784 6115 331MAIZE MT 0 820 820RAPE MUSTARD SEED MT 51632 46129 -5503SOYABEAN MT 30 191 161SUGAR MT 4357 7814 3457TURMERIC MT 10530 10158 -372WHEAT MT 29467 29467 0
07.10.15 COMMODITY UNIT 14.10.15 DIFFERENCE
QTY. QTY.
CARDAMOM MT 33.60 36.30 2.70
COTTON BALES 0.00 0.00 0.00
GOLD KGS 30.00 30.00 0.00
GOLD MINI KGS 15.90 8.00 -7.90
GOLD GUINEA KGS 23.63 23.63 0.00
MENTHA OIL KGS 6433059.68 6422266.33 -10793.35
SILVER (30 KG Bar) KGS 11862.38 11862.38 0.00
07.10.15
•US Department of Commerce reported that retail
sales rose slightly by 0.1% in September 2015
compared to August 2015.
•The National Bureau of Statistics of China reported on
October 14, 2015, that Chinese inflation grew 1.6% in
September 2015 compared to September 2014.
•China's plan to launch an oil contract to compete with
world benchmarks could be a model for a metals one.
•Glencore said on Monday it plans to sell copper mines
in Australia and Chile as the mining and trading
company aims to reduce its debt.
•Chile's second-biggest copper mine Collahuasi,
owned by Anglo American and Glencore, has
postponed expansion plans, on top of its previously
announced cuts.
•India's wholesale prices fell for an 11th straight
month in September, plunging an annual 4.54%
primarily on the back of tumbling oil prices.
•The overall import of vegetable oils during Nov.'14 to
Sept. '15 is reported at 12,941,611 tons compared to
10,572,994 tons i.e. up by 22%.
•World GDP (gross domestic product) growth for 2015
as forecast by the IMF (International Monetary Fund)
in the month of October is 3.1%. The global slowdown
is due to lower commodity and crude oil prices.
WEEKLY STOCK POSITIONS IN WAREHOUSE (MCX)
12
®
NCDEX TOP GAINERS & LOSERS (% Change) MCX TOP GAINERS & LOSERS (% Change)
8.30
4.92
3.84
3.21 3.11
-5.76
-1.90-1.47
-0.22 - 0.14
-8.00
-6.00
-4.00
-2.00
0.00
2.00
4.00
6.00
8.00
10.00
SOYABEAN RM SEED CHANA KAPASSOYAOIL
CRUDEOIL
GUARGUM SUGAR M
MAIZEKHARIF
CASTORSEED 2MT
2.952.66
1.87
1.130.91
-6.83
- 4.00 -4.00 - 3.98
- 2.98
-8.00
-6.00
-4.00
-2.00
0.00
2.00
4.00
KAPASGOLD
GLOBALSILVERMICRO COTTON
LEADMINI
CRUDEOIL KAPASKHALI
SILVER1000
BR. CRUDEOIL
GOLD PETAL(DEL)
Oilseed area and production update
Production estimates • According to USDA latest report, based on a preliminary field assessment
and prevailing weather conditions, in MY 2015/16 soybean production forecast is revised from 12.5 MMT to 11 MMT.
• Peanut production for MY 2015/16 is also revised lower to 5.6 MMT. But this estimate is higher than the 5.2 MMT production in MY 2014/15.
• Gujarat contributes almost 40% of total kharif peanut production.• Sunflower area and production for MY 2015/16 is also revised down to
580,000 hectares and 530,000 metric tons, respectively.Sowing area
• USDA has revised up the soybean planted area estimate from 11.5 million hectares to 11.6 million hectares.
• The Ministry of Agriculture, Government of India (GOI) for crop year 2015 (July-June) also states that area planted for kharif (fall harvest) soybeans, peanuts, and sunflower will be 15.3 million hectares, 3% increase over the previous marketing year.
• According to USDA, Soybean planting in Madhya Pradesh, which accounts for about 54% of India's total soybean production, grew 6.5% over last year.
• Maharashtra, which accounts for 32% of India's total soybean production, stood close to last year's level, while Rajasthan (8% of total production) experienced a 35% increase over last year.
• Peanut area for MY 2015/16 is also revised lower to 4.6 million hectares compared to 5.4 million hectares in MY 2014/15.
• The kharif sunflower planted on 115,000 hectares compared to 171,000 hectares planted during corresponding period last year.
Weather conditions affected the area• Abnormal weather conditions will reduce yields and lead to an overall
production decline, despite higher area planted for kharif oilseeds. • Normal rainfall during peak planting through mid-July encouraged
farmers to plant additional oilseed hectares, particularly soybean• August and September saw deficit and uneven rainfall distribution in most
production areas and consequently, yields were adversely affected. • Abnormal weather conditions in some growing areas also led to greater
instances of pests, diseases, and weeds. • According to IMD, The cumulative rainfall deficit, which hovered at
around 3% by end of July, increased to 16% through mid-September. • Moreover, the late rains during the third week of September could delay
the harvest in several few places and decrease the productive recovery of the beans.
Imports of Veg oils and export of Oilmeals• According to USDA softening International Prices of vegetable Oil are
encouraging the higher Imports in India despite of weaker domestic currency.• The MY 2015/16 vegetable oil imports are revised from an earlier
estimate of 12.9 MMT to 14.5 MMT to indicate higher imports of both soft and palm oils.
• India's growing population, rising income levels, lower-than-anticipated oilseed production in MY 2015/16, and narrowing price premium for soft oils will support higher imports, which are forecast to rise 6% over MY 2014/15.
• According to the Solvent Extractors' Association (SEA) of India, July imports of edible oil reached 1.5 MMT, the highest level of any single month in the past two decades.
• On September 17, 2015, GOI raised the import duty on both crude and refined edible oils by 5% to current 12.5% and 20%, respectively.
• According to latest estimates, Indian oilmeal exports are lowest in decades MY 2015/16. oilmeal exports are revised lower to 3.3 MMT.
• Sluggish international demand for Indian soymeal is likely to cap total oilmeal sales.
COMMODITY
COMMODITY EXCHANGE CONTRACT 15.10.15 CHANGE%
ALUMINIUM LME 3 MONTHS 1613.00 1574.00 -2.42
COPPER LME 3 MONTHS 5295.00 5308.00 0.25
LEAD LME 3 MONTHS 1780.00 1795.00 0.84
NICKEL LME 3 MONTHS 10500.00 10565.00 0.62
ZINC LME 3 MONTHS 1836.00 1827.00 -0.49
GOLD COMEX DEC 1155.90 1187.50 2.73
SILVER COMEX DEC 15.82 16.16 2.19
LIGHT CRUDE OIL NYMEX NOV 49.63 46.38 -6.55
NATURAL GAS NYMEX OCT 2.50 2.45 -1.96
09.10.15
PRICES OF METALS IN LME/ COMEX/ NYMEX (in US $)
WEEKLY STOCK POSITIONS IN LME (IN TONNES)
COMMODITY STOCK POSITION STOCK POSITION DIFFERENCE
08.10.15 15.10.15
ALUMINIUM 3147075 3108850 -38225
COPPER 308100 297175 -10925
NICKEL 446400 439038 -7362
LEAD 158150 153700 -4450
ZINC 588650 588250 -400
INTERNATIONAL COMMODITY PRICES
COMMODITY EXCHANGE CONTRACT UNIT 09.10.15 15.10.15 CHANGE(%)
Soya CBOT NOV Cent per Bushel 885.75 905.25 2.20
Maize CBOT DEC Cent per Bushel 382.75 375.50 -1.89
CPO BMD JAN MYR per MT 2217.00 2324.00 4.83
Sugar LIFFE DEC 10 cents per MT 392.00 388.60 -0.87
13
®
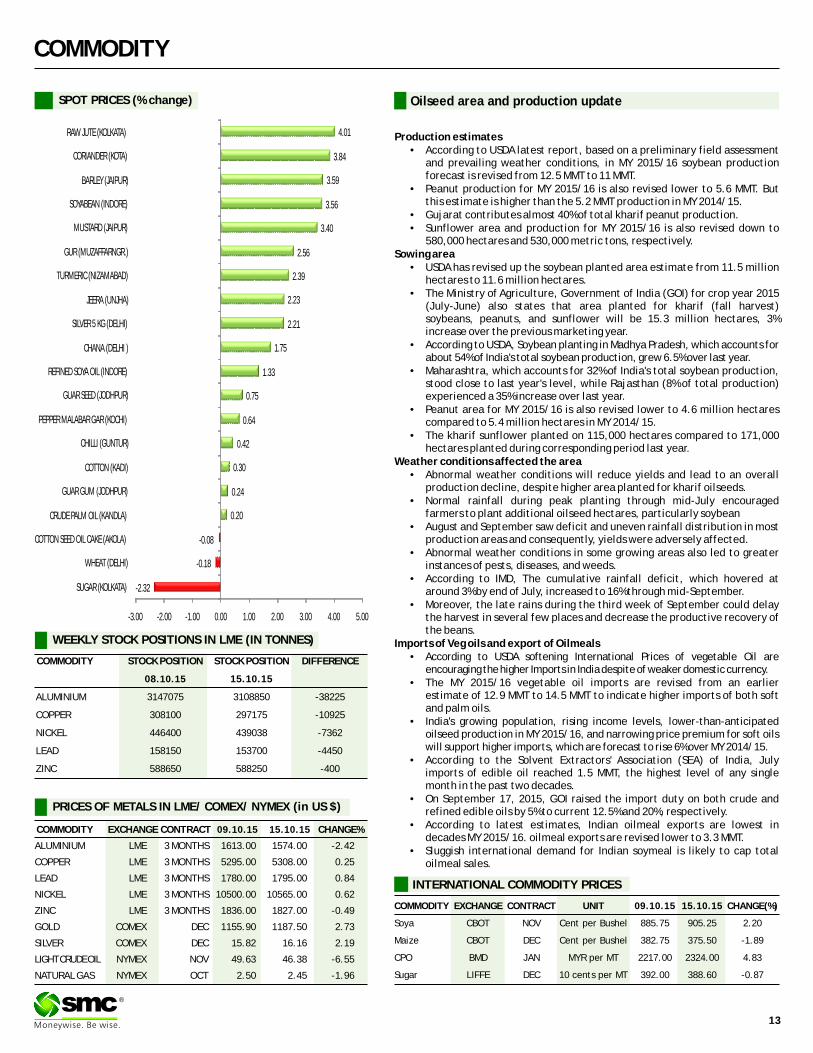
SPOT PRICES (% change)
-2.32
-0.18
-0.08
0.20
0.24
0.30
0.42
0.64
0.75
1.33
1.75
2.21
2.23
2.39
2.56
3.40
3.56
3.59
3.84
4.01
-3.00 -2.00 -1.00 0.00 1.00 2.00 3.00 4.00 5.00
SUGAR (KOLKATA)
WHEAT (DELHI)
COTTON SEED OIL CAKE (AKOLA)
CRUDE PALM OIL (KANDLA)
GUAR GUM (JODHPUR)
COTTON (KADI)
CHILLI (GUNTUR)
PEPPER MALABAR GAR (KOCHI)
GUAR SEED (JODHPUR)
REFINED SOYA OIL (INDORE)
CHANA (DELHI )
SILVER 5 KG (DELHI)
JEERA (UNJHA)
TURMERIC (NIZAMABAD)
GUR (MUZAFFARNGR.)
MUSTARD (JAIPUR)
SOYABEAN (INDORE)
BARLEY (JAIPUR)
CORIANDER (KOTA)
RAW JUTE (KOLKATA)
CURRENCY
Currency Table
Currency Pair Open High Low Close
USD/INR 64.99 65.36 64.82 64.93
EUR/INR 74.01 74.64 73.74 74.26
GBP/INR 99.60 100.64 99.39 100.55
JPY/INR 53.94 54.97 53.94 54.91
(Source: Reliable Software, Open: Monday 9.00 AM IST, Close: Thursday (5.00 PM IST)
News Flows of last week
13th Oct Japanese wholesale prices fell 3.9 percent in the year to September, Bank of Japan
14th Oct UK jobless rate hit seven-year low, BoE to note cooler pay growth14th Oct Euro zone industrial production declined in line with expectations
in August14th Oct China third-quarter growth seen dipping to 6.8 percent, weakest
since 200914th Oct U.S. mortgage application activity plunged last week from an
eight-month high15th Oct U.S. consumer prices fell on cheaper gasoline15th Oct U.S. fiscal year budget deficit narrowed to $439 billion
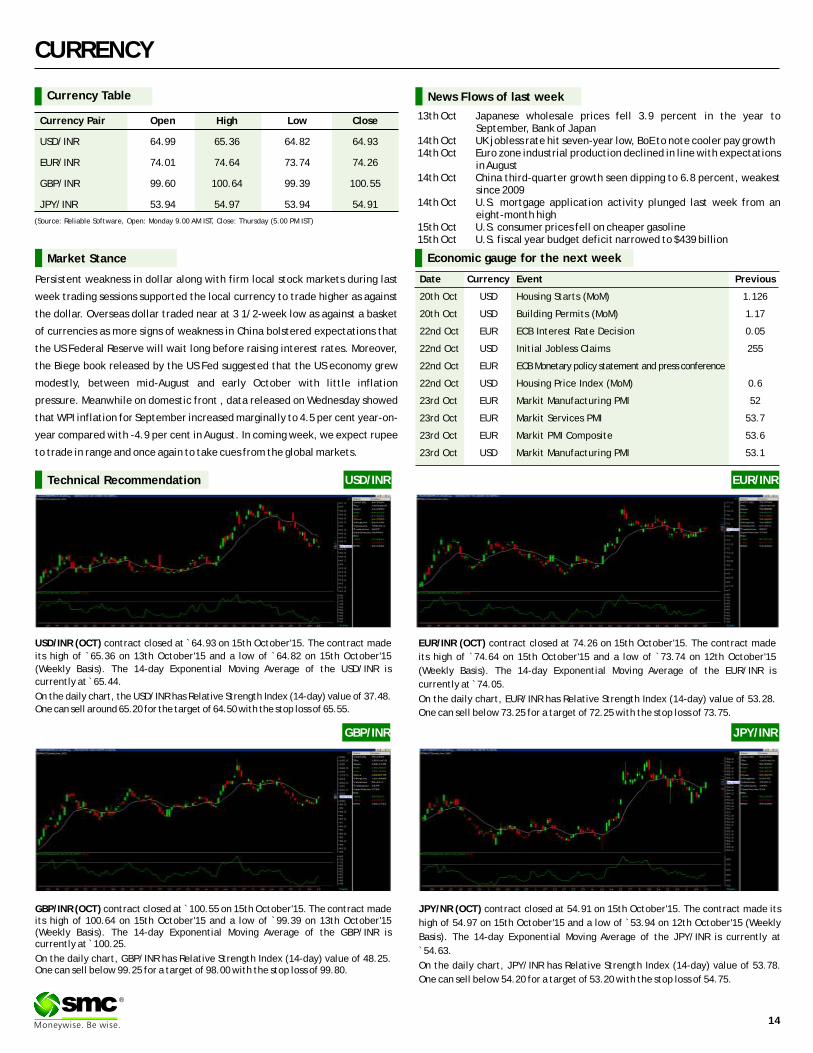
EUR/INR (OCT) contract closed at 74.26 on 15th October'15. The contract made
its high of `74.64 on 15th October'15 and a low of `73.74 on 12th October'15
(Weekly Basis). The 14-day Exponential Moving Average of the EUR/INR is
currently at ̀ 74.05.
On the daily chart, EUR/INR has Relative Strength Index (14-day) value of 53.28.
One can sell below 73.25 for a target of 72.25 with the stop loss of 73.75.
JPY/NR (OCT) contract closed at 54.91 on 15th October'15. The contract made its
high of 54.97 on 15th October'15 and a low of `53.94 on 12th October'15 (Weekly
Basis). The 14-day Exponential Moving Average of the JPY/INR is currently at
`54.63.
On the daily chart, JPY/INR has Relative Strength Index (14-day) value of 53.78.
One can sell below 54.20 for a target of 53.20 with the stop loss of 54.75.
Market Stance
Persistent weakness in dollar along with firm local stock markets during last
week trading sessions supported the local currency to trade higher as against
the dollar. Overseas dollar traded near at 3 1/2-week low as against a basket
of currencies as more signs of weakness in China bolstered expectations that
the US Federal Reserve will wait long before raising interest rates. Moreover,
the Biege book released by the US Fed suggested that the US economy grew
modestly, between mid-August and early October with little inflation
pressure. Meanwhile on domestic front , data released on Wednesday showed
that WPI inflation for September increased marginally to 4.5 per cent year-on-
year compared with -4.9 per cent in August. In coming week, we expect rupee
to trade in range and once again to take cues from the global markets.
EUR/INR
USD/INR (OCT) contract closed at ̀ 64.93 on 15th October'15. The contract made
its high of `65.36 on 13th October'15 and a low of `64.82 on 15th October'15
(Weekly Basis). The 14-day Exponential Moving Average of the USD/INR is
currently at ̀ 65.44.
On the daily chart, the USD/INR has Relative Strength Index (14-day) value of 37.48.
One can sell around 65.20 for the target of 64.50 with the stop loss of 65.55.
GBP/INR (OCT) contract closed at 100.55 on 15th October'15. The contract made its high of 100.64 on 15th October'15 and a low of `99.39 on 13th October'15 (Weekly Basis). The 14-day Exponential Moving Average of the GBP/INR is currently at ̀ 100.25.
On the daily chart, GBP/INR has Relative Strength Index (14-day) value of 48.25. One can sell below 99.25 for a target of 98.00 with the stop loss of 99.80.
`
USD/INRTechnical Recommendation
GBP/INR JPY/INR
Economic gauge for the next week
Date Currency Event Previous
20th Oct USD Housing Starts (MoM) 1.126
20th Oct USD Building Permits (MoM) 1.17
22nd Oct EUR ECB Interest Rate Decision 0.05
22nd Oct USD Initial Jobless Claims 255
22nd Oct EUR ECB Monetary policy statement and press conference
22nd Oct USD Housing Price Index (MoM) 0.6
23rd Oct EUR Markit Manufacturing PMI 52
23rd Oct EUR Markit Services PMI 53.7
23rd Oct EUR Markit PMI Composite 53.6
23rd Oct USD Markit Manufacturing PMI 53.1
14
®
IPO
IPO NEWSIPO NEWS
Fund-raising by India Inc Surges as Companies Sing the IPO TuneIndian companies raised `4,950 crore through IPOs in the first half of FY15 versus `1,017 crore in the same period in FY14. Fund raising through the primary market route so far this year is nearly five times higher compared to last year. 19 companies have received approval from Sebi to raise ̀ 11,545 crore. Seventeen other companies have sought permission to raise ̀ 6,795 crore. Sensex return over the last one year stood at 1.7% whereas the BSE IPO index gave a return of 18.3%
Hindi daily Amar Ujala plans to raise ̀ 300 via IPO next month A mar Ujala Publications, which publishes the Hindi daily Amar Ujala, is likely to enter the capital market next month to raise ̀ 300 crore through a mix of fresh issue of shares and secondary sale by shareholders. The proposed offer size of ̀ 300 crore would result in about 30% dilution of equity capita . According to the banker, the Maheshwaris, the promoters of Amar Ujala, are likely to offer 15% stake through the initial public offer (IPO). In addition, Pun Undertaking, a strategic investor in Amar Ujala, is expected to sell 9% stake, lowering its ownership to 9%. The fresh issue of shares is expected to account for another 6% of the share sale. It is India's fourth largest Hindi daily with 19 editions in seven states and one Union Territory. It reported a net profit of ̀ 41 crore on a turnover ̀ 570 crore in the nine months to December 2014. AXIS Capital and IDFC Securities have been appointed lead managers for the issue.
Sebi seeks clarifications from Teamlease, Dr Lal Path on IPOsThe Securities and Exchange Board of India (Sebi) has sought clarifications from merchant bankers of Teamlease and Dr Lal PathLabs in connection with their proposed initial share sale plans. Sebi has said it is awaiting a response from lead managers. According to the latest weekly update, Sebi has said that as of October 9, the clarifications were awaited from these two companies. The next update will be uploaded on the Sebi website on October 19. The market watchdog said it might issue observations on draft offer documents within 30 days after receiving a satisfactory reply from the lead merchant bankers or any additional information sought from them. These two companies, which plan to utilise initial public offering (IPO) proceeds for business expansion plans and working capital requirements, had filed draft offer documents with Sebi last month. As per the Draft Red Herring Prospectus (DRHP), Teamlease's IPO comprises fresh issue of shares worth Rs 150 crore and an offer for sale of up to 32.2 lakh by existing shareholders. The company is expected to raise Rs 450-500 crore. In Dr Lal PathLabs' case, promoters and other existing shareholders will collectively sell 1.16 crore shares of the company amounting to 14.1 per cent stake.
IndiGo Plans ̀ 2500 Cr IPO Launch On Oct 26thInterGlobe Aviation Ltd, which owns IndiGo Airlines has announced their initial public offer (IPO) launch on October 26th.Citigroup Global Markets India Pvt. Ltd, JP Morgan India Pvt. Ltd and Morgan Stanley India are the official bankers for this IPO launch, while Barclays Bank, Kotak Mahindra Capital and UBS Securities India are other bankers for this issue. IndiGo is right now India's biggest and most profitable airlines company, and their IPO launch has created a buzz in the market.IndiGo is currently operating 97 planes and offers 648 flights daily, and commands 33.8% market share of domestic traffic. In August this year, they placed an order of 250 Airbus A320 Neo Single-Aistle jet, worth $26.5 billion. As of now, IndiGo has ordered 530 aircrafts from A320 family, out of which 100 has been delivered.
Alkem Promoters Unlock Value After 42 Years, Plan IPO By December Alkem Laboratories, India's fifth largest drugmaker by domestic sales, is planning its initial public offer (IPO) after 42 years of its founding in 1973. The company, which filed its draft red herring prospectus (DRHP) to the market watchdog Securities Exchange Board of India (Sebi) recently, will offer 10.75 per cent of its equity (up to 12,853,442 equity shares) to public and list the company at leading stock exchanges. One of the oldest generic drug companies in the country, Alkem Lab never explored fund raising through equity market as the founders Samprada Singh and Basudeo Narayan Singh — doyens of Indian pharmaceuticals industry — didn't want to go public and there weren't any compelling reasons to raise money from public. The company, which established its first drug manufacturing unit in Taloja near Mumbai in 1978, focused strongly on anti-infective segment as it was one of the key requirements in the domestic market. This segment remained its core strength even today in the local market and most of its brands in this therapeutic area are still top selling products in India's anti-infection drug market
SHCIL plans to raise ̀ 750-900 crore through IPO Stock Holding Corporation of India Ltd (SHCIL), a custodian and depository service provider, is planning to raise ̀ 750-900 crore through an initial public offering (IPO), said a person familiar with the development. The firm has invited bids from merchant bankers to manage the proposed issue . The company plans to dilute up to 25% of its equity in the initial share sale. At ̀ 750-900 crore, Stock Holding Corporation would be valued at about ̀ 2000 to ̀ 2,200 crore. The proposed issue would be of fresh issue of equity shares with an option for offer for sale from some of the existing shareholders. The proceeds of the IPO will be used for the expansion of the business, the person said. Stock Holding Corp is planning to enter the non-banking financial services business. Stock Holding which was incorporated as a public limited company in 1986, was jointly promoted by leading Banks and Financial Institutions. Currently, SHCIL is a subsidiary of IFCI.
Indian microlender-turned-small finance bank Equitas plans IPOChennai-based microfinance institution Equitas Holdings Ltd, which recently received in-principle approval from the Reserve Bank of India (RBI) to convert itself into a small finance bank, will file draft initial public offering (IPO) papers in the next few days. Equitas Holdings will be the first of a number of small finance banks that may tap the primary market to raise funds and bring down foreign shareholding to meet a condition laid down by RBI. According to the banking regulator, foreign investors can hold only up to 49% in small finance banks. Eight of the 10 that got the nod to launch small finance banks were microlenders. Many have significant foreign holdings due to investments from private equity funds and multilateral institutions. In the case of Equitas, the proposed public offering will also raise growth capital and give existing investors an exit. The IPO will see the firm raising up to ̀ 2,000 crore. Of this, approximately ̀ 600 crore will be used by the company for investing in its forthcoming small finance bank, while the rest would be an offer for sale by its existing investors, said one of the three people mentioned above who spoke on condition of anonymity. ICICI Securities, HSBC, Axis Capital and Edelweiss Financial Services are managing the Equitas IPO
IPO TRACKER
Prabhat Dairy Dairy 1150.62 520.00 21-Sep-15 115.00 115.00 118.20 2.78
Sadbhav Infra. Infrastructure 3531.06 425.00 16-Sep-15 103.00 110.75 100.25 -2.67
Pennar Engg.Bld. Infrastructure 572.73 156.19 10-Sep-15 178.00 150.00 167.10 -6.12
Sh.Pushkar Chem. Chemical 241.76 70.00 10-Sep-15 65.00 60.00 80.00 23.08
Navkar Corporat. Logistics 2226.11 600.00 9-Sep-15 155.00 152.00 156.10 0.71
Company Sector M.Cap(In `Cr.) Issue Size(in `Cr.) List Date Issue Price List Price Last Price %Gain/Loss(from Issue price)
*
*Closing prices as on 15-10-2015®
15
FIXED DEPOSIT MONITOR
• Interest structure may be revised by company from time to time. Pls confirm Interest rates before submitting the application.
* For Application Greater Than Rs. Fifty Lakhs Or equal to Fifty Lakhs, Please Contact to Head Office.
* Email us at [email protected]
FIXED DEPOSIT COMPANIES
PERIOD MIN.ADDITIONAL RATE OF INTEREST (%)
S.NO (NBFC COMPANY -NAME)12M 18M 24M 36M 45M 48M 60M 84M INVESTMENT
1 ANSAL HOUSING & CONSTRUCTION LTD. 11.75 - 12.00 12.25 - - - - - CUM-20000/-,
NON CUM-40000/-
2 BAJAJ FINANCE LTD.(UPTO RS. 5 CR.) 9.10 9.20 9.25 9.25 - 9.25 9.25 - 0.25% FOR SR. CITIZEN, 0.10% FOR LOCATION WISE
EXISTING CUSTOMERUPTO RS. 1CRORE
3 CENT BANK HOME FINANCE LTD.(UPTO RS. 1 CR.)-INDIVIDUAL 8.75 - 8.75 8.75 - 8.85 8.85 8.90 0.25% EXTRA FOR SR. CITIZEN 5000/-
4 CENT BANK HOME FINANCE LTD.(UPTO RS. 1 CR.)-NON INDIVIDUAL 8.50 - 8.50 8.50 - 8.50 8.50 8.50 0.25% EXTRA FOR SR. CITIZEN 5000/-
5 DEWAN HOUSING FINANCE CORPORATION LTD 13M=9.25% 14M=9.25% 40M=9.35% 0.25% EXTRA FOR SR. CITIZEN,WIDOW, 13M=50000;
ARMED, PERSONNEL, EXISTING DHFL HOME 14M=10000;
BORROWERS, 0.25% EXTRA FOR DEPOSIT 50 40M=2000
LAC AND ABOVE
6 DEWAN HOUSING FINANCE CORPORATION LTD (AASHRAY) 9.00 - 9.25 9.25 - 9.25 - 9.25 10,000/-
7 GRUH FINANCE LTD. 8.25 13M=8.50 8.50 8.50 - 8.50 8.50 8.50 96-120M=8.50%; 0.25% FOR SR. CITIZEN & TRUST 1000/-
8 HDFC PREMIUM DEPOSIT FOR INDIVIUAL (UPTO RS. 2 CR.) 30M=8.35 22M=8.40 44M=8.40 - 0.25% FOR SR. CITIZEN 20000/-, 40000/-
IN MONTHLY
9 HDFC LTD FOR INDIVIDUAL (UPTO RS.2 CR.) 8.25 - 8.25 8.25 - 8.25 8.25 - 0.25% FOR SR. CITIZEN.
10 HDFC PREMIUM DEPOSIT FOR TRUST & INSTITUTE(UPTO RS. 2 CR.) 30M=8.25 22M=8.30 44M=8.30 - 0.25% FOR SR. CITIZEN 20000/-, 40000/-
IN MONTHLY
11 HDFC LTD FOR TRUST & INSTITUTE (UPTO RS.2 CR.) 8.15 - 8.15 8.15 - 8.15 8.15 - 0.25% FOR SR. CITIZEN.
12 HUDCO LTD.(IND & HUF) 8.25 - 8.25 8.25 - 8.15 8.15 8.00 0.25% FOR SR. CITIZEN 10000/-
13 HUDCO LTD.(TRUST/CO/INSTITUTION) 8.00 - 8.00 8.00 - 8.00 8.00 8.00 - 10000/-
14 J K TYRE & INDUSTRIES LTD. 9.00 - 9.25 9.50 - - - - 0.50% ADD. INTEREST TO SR. CITIZEN, 25000/-
EMPLOYEES, SHAREHOLDERS AND PERSON
INVESTING RS. 5 LACS AND ABOVE - MAX. 0.50%
15 J K LAKSHMI CEMENT LTD. 9.00 - 9.25 9.50 - - - - - 25000/-
16 KERALA TRANS DEVELOP FINANCE CORP LTD (FOR < RS. 5 CRORE) 9.75 - 9.75 9.75 - 9.50 9.50 - 0.25% EXTRA FOR SR. CITIZEN & 0.25% 10000/-
EXTRA IF APP AMOUNT IS RS. 25 LAC & ABOVE
17 LIC HOUSING FINANCE LTD.(UPTO RS. 5 CR.) 8.60 8.60 8.70 8.75 - - 9.00 - 0.25% FOR SR. CITIZEN IF APP ABOVE 10000/-
RS. 50,000/- & 0.10% IF APP UPTO RS. 50,000/-
18 M&M FINANCIAL SERVICES LTD (FOR BELOW RS. 1 CRORE) 8.45 8.45 8.45 8.45 - 8.45 8.45 - 0.25% FOR SR. CITIZEN 10000/-
19 OMAXE LTD. 11.50 - 12.00 12.50 - - - - EXISTING CLIENT-0.15% EXTRA FOR 1 YR & 50000/-
0.25% EXTRA FOR 2 YR
20 PRISM CEMENT LTD. 9.75 - 9.75 - - - - - - 10000/-
21 PNB HOUSING FINANCE LTD.(UPTO RS. 5 CR.) 8.25 - 8.25 8.25 - 8.25 8.25 8.25 0.25% EXTRA FOR SR. CITIZEN UPTO RS.1 CRORE 20000/-
22 PNB HOUSING FINANCE LTD.(UPTO RS. 5 CR.) 30M=8.35 22M=8.40 44M=8.40 - 0.25% FOR SR. CITIZEN
23 SRS LTD. 11.75 - 12.00 12.25 - - - - - 30000/-
24 SHRIRAM TRANSPORT FINANCE-UNNATI SCHEME 9.00 - 9.00 9.25 - 9.25 9.25 - 0.25% FOR SR. CITIZEN 5000/-
25 SHRIRAM CITY UNION SCHEME 9.00 - 9.00 9.25 - 9.25 9.25 - 0.25% FOR SR. CITIZEN 5000/-
(FOR TRUST ONLY)
16
®

INSURANCE
®
A unique first of a kind Dengue Care plan offers coverage for any
medical expenses incurred on inpatient or outpatient treatment for
dengue. You are not required to undergo any medicals at the time of
taking the cover.
�In-Patient Hospitalisation - Treatment arising from Dengue fever
where Insured Person has to stay in a Hospital for more than 24 hours.
�Pre-Hospitalisation - The medical expenses incurred due to illness
during 15 days immediately before hospitalization.
�Post-Hospitalisation - The medical expenses you incur in the 15 days
immediately after you are discharged from hospital.
�Shared Accommodation Benefit - If the Insured Person is
Hospitalized in Shared Accommodation in a Network Hospital,
exclusion for non payable items under Section III C v) of Policy
wordings will be waived off.
The following benefits are available to all Insured Persons during the
Policy Period if NS1 (nonstructural protein 1) is positive in result. Any
claims made under these benefits will be subject to Out-patient Sum
Insured.
�Outpatient Consultations - Outpatient consultation by a general
Medical Practitioner for treatment of Dengue fever.
�Diagnostic Tests - Outpatient diagnostic tests for Dengue fever taken
by the Insured Person from a diagnostic centre
�Pharmacy - Medicines purchased by the Insured Person from a
pharmacy, provided that such medicines have been prescribed for
treatment of Dengue Fever.
�Home Nursing - We will also reimburse the Medical Expenses for
necessary medical treatment taken by the Insured Person by our
empanelled medical practitioner at home for treatment of Dengue
fever.
Benefits at a glance:
Inpatient Benefits
Outpatient benefits
APOLLO HEALTH DENGUE CARE PLAN
Disclaimer: Insurance is the subject matter of solicitation. For more details on risk factors, terms and conditions please read sales brochure before conducting a sale.
17
Eligibility
�This policy covers persons in the age group 91 days to 65 years. The
maximum entry age is restricted upto 65 years. The Minimum entry
age for Adult is 18 years and maximum is 65 years. The minimum entry
age for child is 91 days and the maximum is 25 years
�No maximum cover ceasing age
�An individual and/or his family members namely spouse, dependent
children and parents are eligible for buying this cover.
�This cover will be offered on individual Sum Insured basis only.
�This is an annual policy.
�The premium for the policy will remain the same for the policy period
as mentioned in the policy schedule
�A maximum of 6 people can be added
18
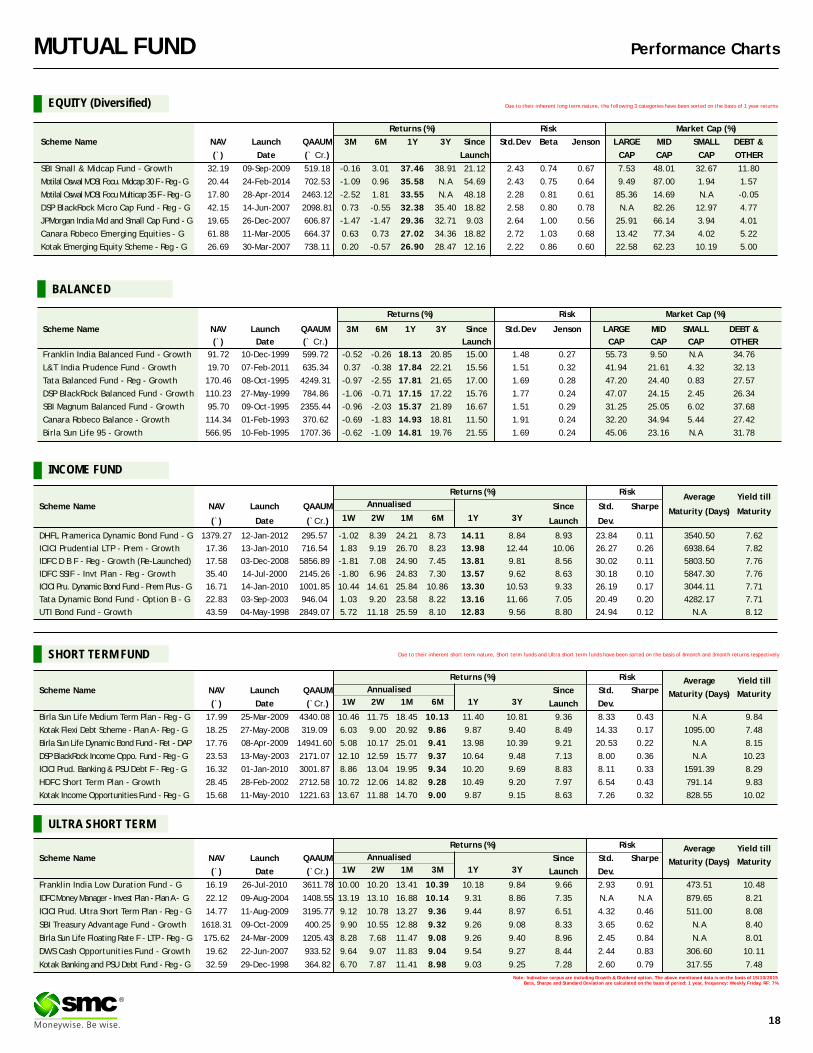
MUTUAL FUND Performance Charts
Returns (%) Risk Market Cap (%)
Scheme Name NAV Launch QAAUM 3M 6M 1Y 3Y Since Std.Dev Beta Jenson LARGE MID SMALL DEBT &
(`) Date (` Cr.) Launch CAP CAP CAP OTHER
SBI Small & Midcap Fund - Growth 32.19 09-Sep-2009 519.18 -0.16 3.01 37.46 38.91 21.12 2.43 0.74 0.67 7.53 48.01 32.67 11.80
Motilal Oswal MOSt Focu. Midcap 30 F - Reg - G 20.44 24-Feb-2014 702.53 -1.09 0.96 35.58 N.A 54.69 2.43 0.75 0.64 9.49 87.00 1.94 1.57
Motilal Oswal MOSt Focu Multicap 35 F - Reg - G 17.80 28-Apr-2014 2463.12 -2.52 1.81 33.55 N.A 48.18 2.28 0.81 0.61 85.36 14.69 N.A -0.05
DSP BlackRock Micro Cap Fund - Reg - G 42.15 14-Jun-2007 2098.81 0.73 -0.55 32.38 35.40 18.82 2.58 0.80 0.78 N.A 82.26 12.97 4.77
JPMorgan India Mid and Small Cap Fund - G 19.65 26-Dec-2007 606.87 -1.47 -1.47 29.36 32.71 9.03 2.64 1.00 0.56 25.91 66.14 3.94 4.01
Canara Robeco Emerging Equities - G 61.88 11-Mar-2005 664.37 0.63 0.73 27.02 34.36 18.82 2.72 1.03 0.68 13.42 77.34 4.02 5.22
Kotak Emerging Equity Scheme - Reg - G 26.69 30-Mar-2007 738.11 0.20 -0.57 26.90 28.47 12.16 2.22 0.86 0.60 22.58 62.23 10.19 5.00
EQUITY (Diversified)
INCOME FUND
Note: Indicative corpus are including Growth & Dividend option. The above mentioned data is on the basis of 15/10/2015Beta, Sharpe and Standard Deviation are calculated on the basis of period: 1 year, frequency: Weekly Friday, RF: 7%
ULTRA SHORT TERM
SHORT TERM FUND
Due to their inherent long term nature, the following 3 categories have been sorted on the basis of 1 year returns
Due to their inherent short term nature, Short term funds and Ultra short term funds have been sorted on the basis of 6month and 3month returns respectively
Returns (%) RiskAverage Yield till
Scheme Name NAV Launch QAAUM Since Std. SharpeMaturity (Days) Maturity
1W 2W 1M 6M 1Y 3Y(`) Date (`Cr.) Launch Dev.
DHFL Pramerica Dynamic Bond Fund - G 1379.27 12-Jan-2012 295.57 -1.02 8.39 24.21 8.73 14.11 8.84 8.93 23.84 0.11 3540.50 7.62
ICICI Prudential LTP - Prem - Growth 17.36 13-Jan-2010 716.54 1.83 9.19 26.70 8.23 13.98 12.44 10.06 26.27 0.26 6938.64 7.82
IDFC D B F - Reg - Growth (Re-Launched) 17.58 03-Dec-2008 5856.89 -1.81 7.08 24.90 7.45 13.81 9.81 8.56 30.02 0.11 5803.50 7.76
IDFC SSIF - Invt Plan - Reg - Growth 35.40 14-Jul-2000 2145.26 -1.80 6.96 24.83 7.30 13.57 9.62 8.63 30.18 0.10 5847.30 7.76
ICICI Pru. Dynamic Bond Fund - Prem Plus - G 16.71 14-Jan-2010 1001.85 10.44 14.61 25.84 10.86 13.30 10.53 9.33 26.19 0.17 3044.11 7.71
Tata Dynamic Bond Fund - Option B - G 22.83 03-Sep-2003 946.04 1.03 9.20 23.58 8.22 13.16 11.66 7.05 20.49 0.20 4282.17 7.71
UTI Bond Fund - Growth 43.59 04-May-1998 2849.07 5.72 11.18 25.59 8.10 12.83 9.56 8.80 24.94 0.12 N.A 8.12
Annualised
Returns (%) Risk Average Yield tillScheme Name NAV Launch QAAUM Since Std. Sharpe Maturity (Days) Maturity
1W 2W 1M 6M 1Y 3Y(`) Date (`Cr.) Launch Dev.
Birla Sun Life Medium Term Plan - Reg - G 17.99 25-Mar-2009 4340.08 10.46 11.75 18.45 10.13 11.40 10.81 9.36 8.33 0.43 N.A 9.84
Kotak Flexi Debt Scheme - Plan A - Reg - G 18.25 27-May-2008 319.09 6.03 9.00 20.92 9.86 9.87 9.40 8.49 14.33 0.17 1095.00 7.48
Birla Sun Life Dynamic Bond Fund - Ret - DAP 17.76 08-Apr-2009 14941.60 5.08 10.17 25.01 9.41 13.98 10.39 9.21 20.53 0.22 N.A 8.15
DSP BlackRock Income Oppo. Fund - Reg - G 23.53 13-May-2003 2171.07 12.10 12.59 15.77 9.37 10.64 9.48 7.13 8.00 0.36 N.A 10.23
ICICI Prud. Banking & PSU Debt F - Reg - G 16.32 01-Jan-2010 3001.87 8.86 13.04 19.95 9.34 10.20 9.69 8.83 8.11 0.33 1591.39 8.29
HDFC Short Term Plan - Growth 28.45 28-Feb-2002 2712.58 10.72 12.06 14.82 9.28 10.49 9.20 7.97 6.54 0.43 791.14 9.83
Kotak Income Opportunities Fund - Reg - G 15.68 11-May-2010 1221.63 13.67 11.88 14.70 9.00 9.87 9.15 8.63 7.26 0.32 828.55 10.02
Annualised
Returns (%) Risk Average Yield tillScheme Name NAV Launch QAAUM Since Std. Sharpe Maturity (Days) Maturity
1W 2W 1M 3M 1Y 3Y(`) Date (`Cr.) Launch Dev.
Franklin India Low Duration Fund - G 16.19 26-Jul-2010 3611.78 10.00 10.20 13.41 10.39 10.18 9.84 9.66 2.93 0.91 473.51 10.48
IDFC Money Manager - Invest Plan - Plan A - G 22.12 09-Aug-2004 1408.55 13.19 13.10 16.88 10.14 9.31 8.86 7.35 N.A N.A 879.65 8.21
ICICI Prud. Ultra Short Term Plan - Reg - G 14.77 11-Aug-2009 3195.77 9.12 10.78 13.27 9.36 9.44 8.97 6.51 4.32 0.46 511.00 8.08
SBI Treasury Advantage Fund - Growth 1618.31 09-Oct-2009 400.25 9.90 10.55 12.88 9.32 9.26 9.08 8.33 3.65 0.62 N.A 8.40
Birla Sun Life Floating Rate F - LTP - Reg - G 175.62 24-Mar-2009 1205.43 8.28 7.68 11.47 9.08 9.26 9.40 8.96 2.45 0.84 N.A 8.01
DWS Cash Opportunities Fund - Growth 19.62 22-Jun-2007 933.52 9.64 9.07 11.83 9.04 9.54 9.27 8.44 2.44 0.83 306.60 10.11
Kotak Banking and PSU Debt Fund - Reg - G 32.59 29-Dec-1998 364.82 6.70 7.87 11.41 8.98 9.03 9.25 7.28 2.60 0.79 317.55 7.48
Annualised
®
BALANCED
Returns (%) Risk Market Cap (%)
Scheme Name NAV Launch QAAUM 3M 6M 1Y 3Y Since Std.Dev Jenson LARGE MID SMALL DEBT &
(`) Date (` Cr.) Launch CAP CAP CAP OTHER
Franklin India Balanced Fund - Growth 91.72 10-Dec-1999 599.72 -0.52 -0.26 18.13 20.85 15.00 1.48 0.27 55.73 9.50 N.A 34.76
L&T India Prudence Fund - Growth 19.70 07-Feb-2011 635.34 0.37 -0.38 17.84 22.21 15.56 1.51 0.32 41.94 21.61 4.32 32.13
Tata Balanced Fund - Reg - Growth 170.46 08-Oct-1995 4249.31 -0.97 -2.55 17.81 21.65 17.00 1.69 0.28 47.20 24.40 0.83 27.57
DSP BlackRock Balanced Fund - Growth 110.23 27-May-1999 784.86 -1.06 -0.71 17.15 17.22 15.76 1.77 0.24 47.07 24.15 2.45 26.34
SBI Magnum Balanced Fund - Growth 95.70 09-Oct-1995 2355.44 -0.96 -2.03 15.37 21.89 16.67 1.51 0.29 31.25 25.05 6.02 37.68
Canara Robeco Balance - Growth 114.34 01-Feb-1993 370.62 -0.69 -1.83 14.93 18.81 11.50 1.91 0.24 32.20 34.94 5.44 27.42
Birla Sun Life 95 - Growth 566.95 10-Feb-1995 1707.36 -0.62 -1.09 14.81 19.76 21.55 1.69 0.24 45.06 23.16 N.A 31.78

SMC is participating in National Conference on 'Provident Fund in Equity Market'
organized by ASSOCHAM on 15th October 2015 at Mumbai
SMC Software team being awarded with Insight Excellence Award 2015 during
Talisma Awards held on 8th October 2015 at Mumbai.
SMC organising an Investor Awareness Seminar in association with NSDL on 9th October 2015 at Karnal,Haryana