Embed Size (px)
Citation preview

Wintertime Nordic Seas Cyclone Variability and Its Impact on Oceanic Volume Transports Into the Nordic Seas
Asgeir Sorteberg, Nils Gunnar Kvamsto •, and Oyvind Byrkjedal
Bjerknes Centre for Climate Research, University of Bergen, Bergen, Norway
The variability of the Nordic Seas wintertime storm tracks has been investigated using a Lagrangian approach. For the tracking algorithm, the NCEP/NCAR reanalysis has been used to identify individual wintertime storm tracks during the last 50 years. Both the number and intensity of the cyclones extending into the Nordic Seas exhibit strong interannual and decadal variability. The decadal vari- ability was especially pronounced from the mid-1970s to the mid-1990s. On aver- age over the 50-year period, both the cyclone intensity and number were highly correlated with the Arctic Oscillation/North Atlantic Oscillation (AO/NAO). The relationship with the two-point NAO Index broke down in the 1960s, indicating that the NAO Index should be used with caution as an index for describing the mean Nordic Seas storm track variability. In the absence of long observational time series, output from an OGCM was used to investigate the relationship between the Nordic Seas wintertime storm tracks and the ocean volume transports into and out of the Nordic Seas across the Greenland-Scotland Ridge. To the extent that the temporal variability of the modelled transports are realistic, vari- ability in the oceanic volume fluxes over the 50-year period shows a relatively strong co-variability with both the Nordic Seas mean cyclone intensity and the number of cyclones. As noted in several studies, the relationship between the atmospheric flow variability and the variability in the ocean transports was found to be stronger from the mid-1970s and onward. Decomposing the mean Nordic Seas storm track variability into frequency and time space shows that a possible reason for this increase in co-variability during the last 25 years might be related to nonlinear effects of the increased storm track variability and possibly to the increased persistence of the storm tracks.
1. INTRODUCTION
The Nordic Seas area is one of the few locations where
formation of dense and deep waters takes place. Deep water
1Also at Geophysical Institute, University of Bergen, Bergen, Norway.
The Nordic Seas: An Integrated Perspective Geophysical Monograph Series 158 Copyright 2005 by the American Geophysical Union 10.1029/158GM10
ventilation is an important component of the (Atlantic) thermohaline circulation and is also one of the controlling factors of the global sea surface temperature (SST) field of the present climate [Hartmann, 1994]. Locally, the open waters contribute to the anomalously warm climate that prevails in this region compared to the zonal mean [Seaget et al., 2002].
There are clear indications that the North Atlantic Ocean
SST varies significantly with the overlying atmosphere, and it has long been recognized that large-scale fluctuations in the North Atlantic Oscillation (NAO)/Arctic Oscillation (AO) and the North Atlantic SSTs are related [Bjerknes, 1964].
137

138 WINTERTIME NORDIC SEAS CYCLONE VARIABILITY
The leading mode of SST variability over the North Atlantic during winter consists of a well-known tripolar pattern [e.g. Deser and Blackmon, 1993; Kushnir, 1994]. The emergence of this pattern is consistent with the observed spatial form of the anomalous surface fluxes associated with the pattern [Cayan, 1992]. The strength of the correlation increases when the NAO Index leads the SST, indicating that SST is responding to atmospheric forcing on monthly time scales [Battisti et al., 1995; Delworth, 1996; Deser and Timlin, 1997].
Model studies have also revealed that atmospheric varia- tions influence the variability of, for instance, the Atlantic meridional overturning circulation (AMOC) [Bentsen et al., 2004]. Again, there is a pronounced relationship between NAO/AO and the leading mode of the AMOC variability [Bentsen et al., 2004]. Most of the studies investigating links between atmospheric and oceanic variability in this area rep- resent variability in the former by the NAO/AO. The relative importance of the role of different weather phenomena in the total atmospheric forcing is less investigated. This is because the NAO is a manifestation of variability on many time scales; in the following we will investigate more closely cyclone variability and its relationship to some aspects of the vari- ability of ocean volume flux in the North Atlantic. The syn- optic low-pressure systems exert both freshwater forcing (through precipitation) and wind-stress forcing on the ocean. It is the latter that is addressed in this study.
During the last two or three decades there has been a trend towards more frequent positive anomalies of the NAO/AO Index. Storm track activity in the Northern Hemisphere is connected to not only the NAO but also to the North Pacific Oscillation (PNA) [Lau, 1988; Trenberth et al., 1988; Rogers, 1990]. Positive anomalies of the NAO Index [Rogers, 1984; Barnston and Livezey, 1987; Kushnir 1994; Hurrell 1995; Hurrell and van Loon, 1997] are associated with a strengthening of the mid-latitude westerly flow over the North Atlantic. This strengthening manifests itself as an intensification and poleward deflection of the North Atlantic mid-latitudinal storm track. Serreze et al. [1993] found that the increase in number of positive NAO winters/years led to a twofold increase in the occurrence of cyclones during the period 1964-1993 in the Icelandic Low region. However, one should be aware that such an increase can be dependent on the field used to identify the cyclones and how they are counted [Hosla'ns and Hodges, 2002]. Whether the identified trends have been a result of anthropogenic climate change is being debated [Gillett et al., 2003, Kuzmina et al., 2005].
The purpose of this paper is twofold. First, a short descrip- tion of the wintertime cyclone climatology and variability in the northern North Atlantic is given. Second, the link between the upper ocean circulation variability in this area and the variability in the North Atlantic storm tracks is investigated.
One approach of diagnosing storm track activity is to determine statistics at a set of grid points such as the variance in a frequency band associated with what are considered to be synoptic time-scales [e.g. Blackmon, 1976; Blackmon et al., 1977]. Several properties of this approach have been given a thorough review by Chang et al. [2002]. Chang et al. [2002] and references therein also provide convincing evidence that the Atlantic storm track was weaker during the 1960s than in more recent decades. Furthermore, Chang and Fu [2002] have shown by means of Empirical Orthogonal Function (EOF) analysis a marked interdecadal variability in the storm track patterns. They found that the leading mode represented a simultaneous change in the intensity of the Atlantic and Pacific storm tracks. Some portion of this variability is associated with the AO and ENSO [Chang and Fu, 2002] variations, but when these portions are removed, a significant portion of interdecadal variability is left. The implications of such a large inter- decadal variability as well as the underlying mechanism remain open [Chang et al., 2002].
In assessing the storm track's importance for the ocean circulation in the Nordic Seas, we have investigated the rela- tionship between storm track statistics and ocean volume transports across the Greenland-Scotland Ridge (GSR). Due to the lack of long time series of observed ocean volume transports across the GSR, the output from a well-tested ocean model is used as a proxy for the ocean volume trans- ports since 1948.
In the following section, we provide a short description of the data and analysis methodology used. In section 3, we describe the climatological structure and variability of the number and intensity of the North Atlantic cyclones entering the Nordic Seas. Their relationship with the NAO/AO will be discussed in section 4, and in section 5 we investigate the relationship between the cyclones entering the Nordic Seas and the oceanic volume flow in and out of the Nordic Seas.
The results are summarized and discussed in section 6.
2. METHOD AND DATA
An algorithm for feature-tracking developed by Hodges [1994; 1995; 1996; 1999] has been used to construct storm tracks from the NCEP/NCAR reanalysis data provided by the NOAA-CIRES Climate Diagnostics Center [Kalnay et al., 1996; Kistler et al., 2001]. The 850-hPa relative vorticity is used instead of the more often used mean sea level pressure (MSLP) because the former is not an extrapolated field to any large extent and is less influenced by the background flow than are fields such as MSLP and geopotential height. This method also focuses on smaller scale synoptic activity than these other fields, which has the advantage that a higher number of storm trajectories can be identified.

SORTEBERG ET AL. 139
Relative vorticity at 850 hPa has been calculated from the 6-h wind components for the whole northern hemisphere for the wintertime (DJF) period 1948-2002. This field can be very noisy with frontal systems beginning to be resolved. Processing is therefore done at a spectral resolution of T42. The reduction in resolution associated with the T42 trunca-
tion provides some smoothing of the higher frequencies. In addition, planetary scales for total wave numbers n _< 7 are removed from the field by using a filtering method discussed by Anderson et al. [2003]. This spectral cutoff does not make any significant change in the results since the planetary scales are relatively weak in the vorticity fields relative to those in the anomalies. Local extremes are identified in the
related fields, and these are interpreted as the centres for neg- ative and positive vorticity anomalies.
The analyses are concentrated on the positive vorticity anomalies (cyclones), the feature points associated with low- pressure systems. The feature points for two consecutive time steps are linked together by using a nearest neighbour search. A cost-function based on track smoothness in terms of
changes in direction and speed [Hodges, 1995; 1996] is calculated for each possible ensemble of trajectories. The ensemble minimizing the cost-function is chosen to be the best fit and thereby restricts the feature to physical move- ment. Generalizing the technique to the spherical domain [Hodges, 1995] obviates the need to use projections, which may introduce systematic biases [Zolina and Gulev, 2002]. This allows for the analysis of global data or of large spheri- cal regions. Semi-stationary storms (less than 10 ø total dis- placement) and short-lived storms (lasting less than 2 days) are removed.
The calculation of the statistical diagnostic fields is performed by the use of spherical nonparametric estimators from the ensembles of feature tracks [Hodges, 1996]. We here focus our attention on the statistical fields track density and mean intensity. Track density is scaled to a number den- sity per month per unit area as in Hosla'ns and Hodges [2002], where a unit area is equivalent to a 5 ø spherical cap (,•106 km2). Mean intensity is computed from the size of the anomalies in relative vorticity for the feature points; the unit for this is 10 -5 s -•. Another statistical field used in the paper is the feature density, which is a measure of the occurrence of cyclones (both the number of cyclones and how long they stay in the area; thus slow-moving low-pressure systems are given more weight than the ones moving quickly through the area). A good alternative to this feature-tracking method is the use of bandpass filters. However, a limitation of bandpass filters is that although they highlight spatial patterns associ- ated with various time scales (synoptic in this case), these patterns are not always easily related to actual weather sys- tems [Anderson et al., 2003]. This occurs partly because a narrow band emphasizes only a particular time scale whereas
cyclones may have different time scales associated with their life cycles. Since one of the main aims of this study is to identify the link of low-pressure systems to the Nordic Sea volume inflow and outflow, the feature-tracking approach has been adopted.
Given the lack of long time series of ocean volume trans- ports, we are using a recent simulation with the Nansen Center version of Miami Isopycnic Coordinate Ocean Model (MICOM; Bleck et al., 1992], utilizing daily forcing from NCEP/NCAR atmospheric reanalysis as a proxy for the real transports. The MICOM version used here [Bentsen et al., 2004], fully coupled to a dynamic thermodynamic sea-ice module, was driven with the NCEP/NCAR reanalysis forcing fields for the period 1948-1999; model setup and integration followed the description of the synoptic hind-cast simula- tions of Furevik et al. [2002]. No relaxation is used for tem- perature, whereas a diagnosed weekly resolved annual repeated restoring flux is applied for the sea surface salinity. The model has 25 vertical layers with fixed potential densi- ties, and an uppermost mixed layer with temporally and spa- tially varying track density. The horizontal configuration is a local orthogonal grid mesh with one pole over North America and the other pole over the western part of Asia [Bentsen et al., 1999]; grid spacing is 30 to 40 km in the North Atlantic-Nordic Seas region. The model variability has been shown to be close to the variability of the hydrographical observations and observations/estimates of Nordic Sea
volume fluxes [Nilsen et al., 2003; Hdtz•n et al., this volume].
3. CLIMATOLOGICAL STRUCTURE OF THE NORTH
ATLANTIC CYCLONE ACTIVITY
Figure 1 a and b shows the climatological distribution of the North Atlantic number of wintertime (DJF) cyclones and their mean intensity during the period 1949-2002. The well- known band with large track density from Newfoundland across the North Atlantic and into northern Europe is one of the most pronounced features in the maps. This maximum is the North Atlantic storm track, which together with smaller minima and maxima on the northern and southern flanks, respectively, constitutes a gross pattern that is apparent in any chosen quantity to represent synoptic activity [Chang et al., 2002].
There are, however, differences between the many available diagnostics on a more detailed level [Gulev et al., 2001; Hosla'ns and Hodges, 2002]. Such differences arise because the different analysis methods and fields used emphasize dif- ferent characteristics of the storm tracks. The use of different
reanalyses has been shown to introduce only negligible dis- agreements since these datasets are very consistent in the lower troposphere of the Northern Hemisphere (NH) [Hodges et al., 2003]. Because of the many procedures for storm track

140 WINTERTIME NORDIC SEAS CYCLONE VARIABILITY
0 ø
0 ø
Figure 1. Mean wintertime (DJF) cyclone track density (a) and intensity (b) for the period 1949-2002 in number per month per 106 km 2 and 10 -s s -l, respectively. Climatology is derived from 6-h fields of relative vorticity in 850 hPa, based on the NCEP/NCAR reanalysis.
identification [Reitan, 1974; Zishka and Smith, 1980; I•tthaker and Horn, 1981; Bell and Bosart, 1989; Serreze et al., 1993; Lambert, 1996; Hoskins and Hodges, 2002], a quantitative comparison is difficult. However, Hosla'ns and Hodges [2002] have, in a review of storm track perspectives, employed the same procedure as we use here, but on fields from ERA- 15 (1979-1994). Their Figure 6b (track density of •850) agrees well with our corresponding Figure l a. A closer inspection of these figures reveals that four local maxima, located near Newfoundland, south of Greenland, east of the Baltic Sea, and in Siberia are apparent in both climatologies.
Interestingly, there are some differences with respect to the relative strength between the local maxima in the NCEP and ERA-15 reanalyses. In particular, the maximum south of Greenland is stronger than that near Newfoundland. In the case of NCEP, these two maxima have the opposite rank. A plausible explanation for this is that the most intense storm track activity has been shifted eastwards during the last part of the 1950-2000 period. An eastward shift in the North Atlantic storm track activity is also observed in Chang et al. [2002], who also show that this shift is associated with a general increase in storm track activity.

SORTEBERG ET AL. 141
The distribution of storm track mean intensity (Figure 1 b) has a large resemblance to the corresponding diagnostics in Hosla'ns and Hodges [2001] (their Figure 6e). This diagnostic seems to have a smoother, or larger-scale, character than the former. Also in this diagnostic we see a slight eastward shift in the North Atlantic maximum between the NCEP/NCAR
and ERA- 15 climatologies.
3.1. Nordic Sea Cyclone Variability
The variability in Nordic Sea cyclones and their impact on the volume transports have been investigated by constructing time series of different area-averaged cyclone parameters. The Nordic Seas area, over which we have taken the average, is here identified as 55 ø to 75øN and 40øE to 15øE (ocean points only). Other slightly smaller and larger areas were also tested
to investigate the robustness of the findings to the chosen area. Figure 2 shows the time series of wintertime (DJF) standard- ized (zero mean and unit standard deviation) anomalies for the different cyclone parameters from 1949 to 2002, the 5-year low-pass-filtered variability (using a third-order Butterworth filter), and the linear trend during the time period.
Dampening thermal and pressure anomalies by radiation loss and surface drag within a few weeks should keep atmospheric fluctuations close to zero correlated from year to year if the forcings remains unchanged. However, since the atmosphere is coupled to the ocean and the (natural and anthropogenic) exter- nal forcings are not constant, we might expect a lag-correlation and slightly reddened spectra of the cyclone parameters. If, in addition, the coupling to the ocean or changes in the external forcings involve oscillatory modes, we would expect some spectral peaks, which are inconsistent with a red/white
-3 1949 1953 1957 1961 1965 1969 1973 1977 1981 1985 1989 1993 1997 2001
I -- Mean Intensity J
2-
1
o
-1
-2-
1949 1953 1957 1961 1965 1969 1973 1977 1981 1985 1989 1993 1997 2001
Year
Figure 2. Wintertime (DJF) standardized (zero mean and unit standard deviation) anomalies of track density (a) and mean intensity (b) in the Nordic Sea (averages from 55 ø to 75øN and 40øW to 15øE, ocean points only). The thin solid line shows the basic time series, the dashed line is the 5-year low-pass-filtered time series using a third-order Butterworth filter, and the thick solid line gives the linear trend calculated using the least squares method. Values are given as deviations from the 1949-2002 mean in standard deviations (STD).

142 WINTERTIME NORDIC SEAS CYCLONE VARIABILITY
spectrum. A power spectrum of the Nordic Sea cyclone track density and intensity (not shown) indicates increased power on decadal (7-14-year) and interannual (2.5-year) time scales in both the intensity and the track density. However, the peaks are quite weak and broad, and none of them is significant at a 95% confidence level. Thus, the wintertime Nordic Sea cyclone intensity and track density variability are not significantly dif- ferent from that of a red-noise process. Most of the variance, however, is on the decadal (7-14-year) and interannual (2.5-year) time scales. The variance in the cyclone track density seems to be greater on the decadal scale, whereas the intensity seems to vary somewhat more in the higher (2.5-year) frequen- cies. The identification of variability on decadal scales is in line with the findings of Chang and Fu [2002]. In their investiga- tion of the NH wintertime upper troposphere storm tracks using
the NCEP/NCAR reanalysed data, they noted significant low- frequency, decadal-scale fluctuations both in the Atlantic and Pacific regions.
While the time series may contain dominant periodic signals, these signals can vary in both amplitude and frequency over long periods of time, making the power spectra assumption of stationarity of the time series invalid (thus the strength of the peaks can become weak). To investigate the cyclone variability on interannual to decadal timescales at different times, we used a wavelet analysis. The wavelet analysis can be seen as a series of spectral analysis using bandpass filters on the time series. A comprehensive description of wavelet analysis is given by Hubbard [1996] and Totfence and Compo [1998]. For this study a Mofiet wavelet is used. The wavelet analysis (Figure 3) points to the same peaks in the cyclone track density
a I I I I I I I I t I I I
ß • 4
8
16 - 1950 1955 1960 1965 1970 1975 1980 1985 1990 1995 2000
Time
b 11"', , , , , , , , , , ," 2
•' .
•4 .õ
8
16 ............... •-- ' • ' • 1950 1955 1960 1965 1970 1975 1980 1985 1990 1995 2000
Tim•
3
Figure 3. Wintertime (DJF) wavelet power spectrum for cyclone track density (a) and intensity (b) in the Nordic Seas area. Spectrums are calculated with a Mofiet wavelet using data from 1949 to 2002. The bold contours show the 95% significance regions, using a red-noise background spectrum with a 1-year lag correlation of 0.25 and 0.0 for the cyclone track density and intensity, respectively. The cone-of-influence, where the padding with zeros reduces the variance (hence statistical significance is low), is shown as dashed lines.
SORTEBERG ET AL. 143
and intensity spectra as in the spectrum analysis, with increased power on the interannual (2.5-year) and decadal (7-12-year) time scales (note that since the Mofiet wavelet is complex, the wavelet power will combine positive and negative peaks into a single broad peak). In addition the wavelet analysis indicates that the power on the interannual and decadal scale have a sig- nificant time-dependent variability. Although the decadal peak is 95% significant, compared with a red-noise spectrum having the same 1-year lag correlation as the original time series for the 1970-1990 period, the interannual peak is not significant, except for track density in the early 1950s. In the latter half of the time series the cyclone track density has indication of more power on slightly shorter time scales (7-10 years) compared with the first half of the time series where the power is more in the 10-14-year period.
The wavelet analysis indicates that the increased power on the decadal scale in the intensity appears simultaneously with the increased power on the decadal scale in the cyclone track density. This suggests that the two parameters might be linked on this time scale, while on shorter time scales the variability is less connected. Thus, at least on decadal time scales, decades with a large number of cyclones could often experience more intense cyclones. Several of the Nordic Sea cyclone parame- ters experienced a maximum in the late 1980s to early 1990s. Figure 3 indicates that this was partly due to the increased vari- ability on decadal time scales during this time. In more detail the increased variability of cyclone intensity and track density were seen in 1980-1990 (Figure 2), mainly due to increased power on the decadal time scale (some on the 5-year scale in the early 1990s) for intensity and on both the interannual and decadal time scales for track density. Interestingly, Chang and Fu [2002] noted a transition in the upper troposphere storm track intensity during the early 1970s. They found the same (but slightly weaker) signal in the radiosondes. Looking at the wavelet analysis for the Nordic Sea cyclone variability, we sus- pect the increased power on the decadal scale after 1970 may be linked to the reported transition.
4. RELATIONSHIP BETWEEN NAO/AO AND THE
NORDIC SEA CYCLONE PARAMETERS
The AO is a large-scale atmospheric mode of climate vari- ability characterized by the leading EOF in MSLP (20-90øN) [Thompson and Wallace, 1998; 2000). The AO is made from the MSLP without any filtering and encompasses meteoro- logical phenomena on different temporal and spatial scales that interact and co-vary to make up the leading EOF. The NAO, on the other hand, is originally a two-point index based on the difference in MSLP between the Atlantic Subtropical High (Azores, Lisbon, or Gibraltar) and the Subpolar Low (Iceland) [Jones et at., 1997]. The two indexes are highly correlated (--0.8) during wintertime. Bearing in mind that
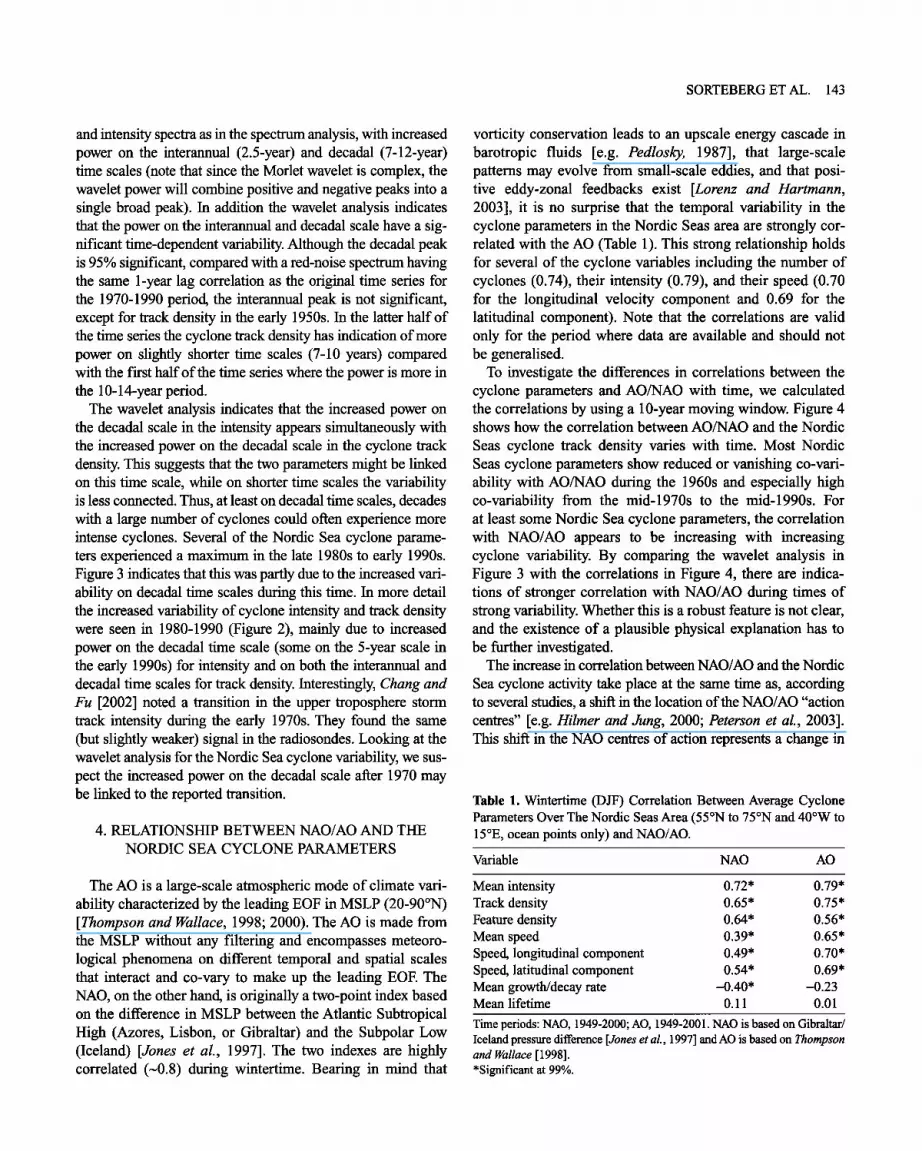
vorticity conservation leads to an upscale energy cascade in barotropic fluids [e.g. Pedlosky, 1987], that large-scale patterns may evolve from small-scale eddies, and that posi- tive eddy-zonal feedbacks exist [Lorenz and Hartmann, 2003], it is no surprise that the temporal variability in the cyclone parameters in the Nordic Seas area are strongly cor- related with the AO (Table 1). This strong relationship holds for several of the cyclone variables including the number of cyclones (0.74), their intensity (0.79), and their speed (0.70 for the longitudinal velocity component and 0.69 for the latitudinal component). Note that the correlations are valid only for the period where data are available and should not be generalised.
To investigate the differences in correlations between the cyclone parameters and AO/NAO with time, we calculated the correlations by using a 1 O-year moving window. Figure 4 shows how the correlation between AO/NAO and the Nordic
Seas cyclone track density varies with time. Most Nordic Seas cyclone parameters show reduced or vanishing co-vari- ability with AO/NAO during the 1960s and especially high co-variability from the mid-1970s to the mid-1990s. For at least some Nordic Sea cyclone parameters, the correlation with NAO/AO appears to be increasing with increasing cyclone variability. By comparing the wavelet analysis in Figure 3 with the correlations in Figure 4, there are indica- tions of stronger correlation with NAO/AO during times of strong variability. Whether this is a robust feature is not clear, and the existence of a plausible physical explanation has to be further investigated.
The increase in correlation between NAO/AO and the Nordic
Sea cyclone activity take place at the same time as, according to several studies, a shift in the location of the NAO/AO "action centres" [e.g. Hitmet and Jung, 2000; Peterson et at., 2003]. This shift in the NAO centres of action represents a change in
Table 1. Wintertime (DJF) Correlation Between Average Cyclone Parameters Over The Nordic Seas Area (55øN to 75øN and 40øW to 15øE, ocean points only) and NAO/AO.
Variable NAO AO
Mean intensity 0.72* 0.79* Track density 0.65* 0.75* Feature density 0.64' 0.56' Mean speed 0.39* 0.65* Speed, longitudinal component 0.49* 0.70* Speed, latitudinal component 0.54* 0.69* Mean growth/decay rate -0.40* -0.23 Mean lifetime 0.11 0.01
Time periods: NAO, 1949-2000; AO, 1949-2001. NAO is based on Gibraltar/ Iceland pressure difference [Jones et al., 1997] and AO is based on Thompson and Wallace [1998]. *Significant at 99%.

144 WINTERTIME NORDIC SEAS CYCLONE VARIABILITY
1
0.8
0.6
0.4
0.2
-0.2
I I
1953 1956 1959 1962 1965 1968 1971 1974 1977 1980 1983 1986 1989 1992 1995
Center year for correlation
0o8 -
0.6
0.4
0.2
-0.2 1953 1956 1959 1962 1965
I I i
1968 1971 1974 1977 1980 1983 1986 1989 1992 1995
Center year for correlation
Figure 4. Ten-year moving correlations between wintertime (DJF) Nordic Seas cyclone track density and AO (a) and NAO (b).
the areas having large MSLP variability and corresponds well with increased Nordic Seas wintertime storm track variability. Since the Nordic Seas cyclonic storm track variability consti- tutes an important part of the principal component-based NAO/AO pattern, a change in the variability of Nordic Sea cyclonic storm tracks may indeed be manifested as a change in the location of the centres of action in a the NAO/AO pattern. A more detailed description and discussion of this shit• in centres of action and its implications for the Nordic Sea ocean variability are given in Furevik and Nilsen (this issue).
Interestingly, AO in general seems to be slightly better cor- related with the cyclone statistics than is the two-point NAO Index. This slightly lower correlation between several of the
Nordic Seas cyclone parameters and NAO is mainly attribut- able to low correlations with NAO in the 1960s. It is not clear
if this is a result of the more hemispheric character of the AO Index or the fact that the two-point NAO Index is not as good as the principal component-based AO in picking up the gen- eral North Atlantic MSLP variability in this time period. Correlation between Nordic Sea cyclone statistics and a prin- cipal component-based NAO (www. cpc.noaa.gov) was also evaluated (not shown), which in general showed weaker cor- relations with the Nordic Sea cyclone variability but its behaviour in time was similar to that of the two-point NAO Index, indicating that the AO might be the most robust mea- sure of the Nordic Sea storm track variability.

SORTEBERG ET AL. 145
25øW
Figure 5. Composites of wintertime (DJF) mean anomalies in cyclone track density [number (month*5ø) -l] and anomalies in 10-m wind speed for years with DJF AO Index greater than 1 STD (9 years; a) or less than -1 STD (10 years; b).
Figure 5 displays the departure from climatology of the mean number of cyclones in wintertime (DJF) Nordic Seas for years in which the AO index exceeded +_1 standard devi- ation (STD). Also displayed are anomalies in the 10-m wind speed (NCEP/NCAR reanalysis). During years of high AO, the number of cyclones is increased in the whole Nordic Seas area, with a northeastward shift in the storm tracks (compare with the climatology in Figure 1 a).
The mean number of cyclones for years with AO above (below) 1 STD is on the order of 30-50% higher (20-30% lower) in the area northeast of Iceland. In addition to an increase in the number of cyclones, the mean intensity in the Nordic Seas is also increased (decreased) during years with a
high (low) AO Index [5-15% during years with AO above (below) 1 (-1) standard deviation]. In central Europe the reduction in number of cyclones is 25-35%, whereas the inten- sity is reduced by as much as 30-50% during years with AO above 1 STD. The mean wintertime wind anomalies strongly reflect the changes in the number of cyclones. During years of high AO, the increase in cyclones gives strong south-west- erly wind anomalies to the east of Iceland. Years of low AO show a similar, but opposite, pattern of strong northeasterly wind anomalies. East of Greenland are northerly wind anom- alies during high-AO years and southerly during low ones. Another striking feature is that in high-AO years, the cyclones in the Nordic Seas and especially northwest of
146 WINTERTIME NORDIC SEAS CYCLONE VARIABILITY
the British Islands have on average a stronger northward and eastward velocity component (not shown). Thus the speed of the low-pressure systems is higher, and more of the lows west of the British Islands move into the Nordic Sea area.
5. NORTH ATLANTIC CYCLONE VARIABILITY
AND OCEANIC VOLUME FLOW INTO
THE NORDIC SEA
Recent work has emphasized the relationship between atmospheric circulation and ocean volume transport across the GSR [Bacon, 1998; Furevik, 1998; Blindheim et al., 2000; Dickson et al., 2000; Nilsen et al., 2003; Orvik and Skagseth, 2003]. These studies have investigated the NAO, the wind stress, and the curl of the wind stress as measures of the atmospheric forcing on the ocean.
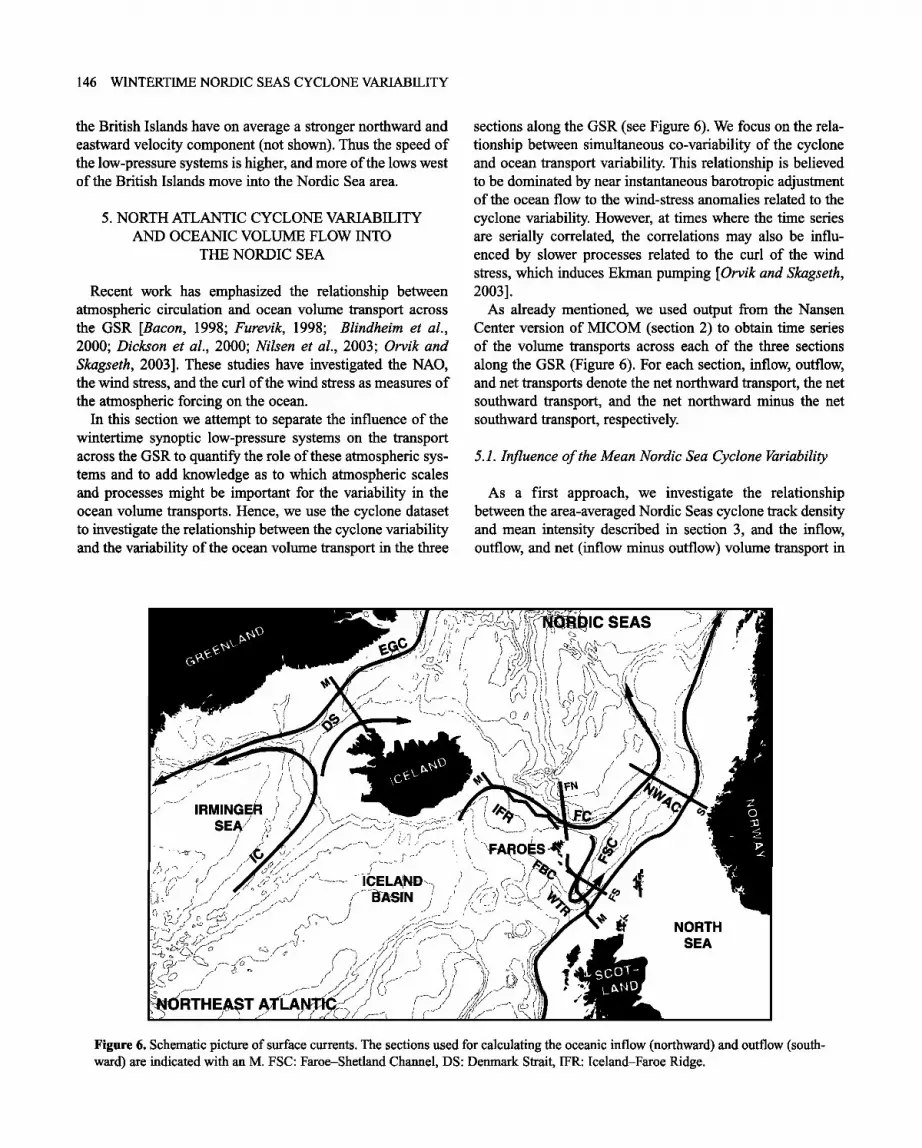
In this section we attempt to separate the influence of the wintertime synoptic low-pressure systems on the transport across the GSR to quantify the role of these atmospheric sys- tems and to add knowledge as to which atmospheric scales and processes might be important for the variability in the ocean volume transports. Hence, we use the cyclone dataset to investigate the relationship between the cyclone variability and the variability of the ocean volume transport in the three
sections along the GSR (see Figure 6). We focus on the rela- tionship between simultaneous co-variability of the cyclone and ocean transport variability. This relationship is believed to be dominated by near instantaneous barotropic adjustment of the ocean flow to the wind-stress anomalies related to the
cyclone variability. However, at times where the time series are serially correlated, the correlations may also be influ- enced by slower processes related to the curl of the wind stress, which induces Ekman pumping [Orvik and Skagseth, 20031.
As already mentioned, we used output from the Nansen Center version of MICOM (section 2) to obtain time series of the volume transports across each of the three sections along the GSR (Figure 6). For each section, inflow, outflow, and net transports denote the net northward transport, the net southward transport, and the net northward minus the net southward transport, respectively.
5.1. Influence of the Mean Nordic Sea Cyclone Variability
As a first approach, we investigate the relationship between the area-averaged Nordic Seas cyclone track density and mean intensity described in section 3, and the inflow, outflow, and net (inflow minus outflow) volume transport in
!
?., /:.,.- ///'"'
'i.
IC SEAS
•,71 .......'
............ ......:::':.::'...,,:(., .......................... : i: ............ '( i,:., •.....:i,::"?')5*
•1 .:'•
NORTH
SEA
Figure 6. Schematic picture of surface currents. The sections used for calculating the oceanic inflow (northward) and outflow (south- ward) are indicated with an M. FSC: Faroe-Shetland Channel, DS: Denmark Strait, IFR: Iceland-Faroe Ridge.

SORTEBERG ET AL. 147
the three GSR sections. Spearman rank correlations are used instead of the more conventional linear correlations because
of the sensitivity of the linear correlation to outliers. Also the assumption of a linear relationship between the ocean volume transports and the atmospheric variables describing the statistics of the low-pressure systems becomes less cru- cial when using the Spearman rank correlation. The Spearman rank correlations will identify any monotonic rela- tionships, not only the strictly linear ones [see Wilks, 1995]. The search for a monotonic rather than a linear relationship is also motivated by the fact that the wind effect on the ocean is given by the wind stress, which may not be linearly related to the cyclone parameters. The time series has been detrended before correlations are calculated to emphasize the co-variability on interannual to decadal scales.
Table 2 shows the Spearman rank correlations between the intensity and track density of wintertime Nordic Seas area cyclones versus the simulated wintertime (DJF) inflow, out- flow, and net volume flow. The interannual variations in the Denmark Strait and the Faroe-Shetland Channel seem most
influenced by the average Nordic Seas cyclone parameters, showing significant correlations both with the intensity and number of cyclones. Also added is the correlation with the cyclone feature density, which is a measure of the occurrence of cyclones (both the number of cyclones and how long they stay in the area); that is, slow-moving low-pressure systems are given more weight than the ones moving quickly through the area. Not surprisingly, the correlation with the feature density is slightly stronger than for the track density, which only counts the number of cyclones and not how long they
Table 2. Spearman Rank Correlations (Detrended Time Series) Between Parameters Describing the Mean Wintertime (DJF) Cyclone Activity in the Nordic Seas Area and Mean Wintertime (DJF) Nordic Sea Inflow, Outflow, and Net Flow as Provided by the MICOM Model for the Period 1949-1999.
Variable Iceland-Faroe Faroe-Shetland Denmark Strait
INFLOW
Mean intensity 0.12 0.39* -0.37* Track density -0.01 0.48* -0.55* Feature density -0.16 0.53* -0.62*
OUTFLOW
Mean intensity -0.23 -0.34** 0.53* Track density -0.28** -0.48* 0.53* Feature density -0.35** -0.51' 0.59*
NET FLOW
Mean intensity 0.26 0.38* -0.53* Track density 0.12 0.49* -0.58* Feature density 0.01 0.55* -0.64*
*Significant at 99%, **significant at 95%. Inflow and outflow denotes water masses flowing into (northward) and out (southward) of the Nordic Seas, respectively; net flow is the difference between the inflow and outflow.
stay in the area. Both the Denmark Strait and the Faroe- Shetland Channel show a slightly stronger co-variability with the number of cyclones than with cyclone intensity.
For the Denmark Strait the fact that the relationship between cyclone variability and both inflow (northward cur- rents of Atlantic water on the Icelandic side, predominantly at the surface) and outflow (southward currents located beneath the inflowing Atlantic water and at the surface towards Greenland) is fairly strong indicates close relationships with the atmospheric forcing. It is also interesting to note that the Faroe-Shetland outflow, which consists mainly of deep over- flow, correlates just as well as cyclone variability correlates with inflow, which is mainly in the upper ocean. There are at least two plausible explanations for the coupling between the atmospheric (surface) forcing and the outflows: The correla- tion may arise purely due to the relationship between the parts of the model outflow that are near the surface layer, or the deeper part of the outflow may directly or indirectly feed or integrate the atmospheric forcing. The first interpretation is valid for the upper polar waters in the Denmark Strait but is not obvious for the (on average) deep Faroe-Shetland outflow. The second interpretation is possible during times where there is some persistence (positive lag-correlation), or at least absence of negative lag-correlation, in the cyclone variability. The correlation coefficient then reflects both a fast (Ekman) response and the fact that the cyclone variability is serially correlated with the variability at previous seasons or years. If the latter is the case, we should expect a higher correlation between the Faroe-Shetland outflow and cyclone variability during years when there is stronger decadal cyclone variabil- ity. This is indeed the case; by calculating the correlation between the outflow and the Nordic Seas track density, we determined the correlation was -0.22 during the period with low decadal activity (1950-1970), increasing to-0.76 during the period with strong decadal activity (1975-1990).
Due to correlation between the intensity and number of cyclones (track density), the total effect of the variability in the mean Nordic Sea number of cyclones and cyclone inten- sity on the volume fluxes is not the sum of the variances explained by the intensity and track density individually. Thus, a simple way of indicating the total effect of intensity and track density on the volume fluxes is to use linear multi- ple regression. This estimate will give an approximation of the linear relationship between wintertime cyclones and the wintertime volume flux variability. We have used the method of least squares, where the mean of the errors is zero and the errors have zero correlation with each of the predictors. Adding more cyclone parameters, such as the mean speed of the cyclones or their lifespan, to the regression gave a marginally better fit to the MICOM-simulated volume trans- ports; for simplicity, however, we have used only the number of cyclones and their intensity in the regression calculation.

148 WINTERTIME NORDIC SEAS CYCLONE VARIABILITY
Thus the net volume fluxes are estimated as: Net variability in volume flux = a * variability in Nordic Sea cyclone inten- sity + b * variability in Nordic Sea cyclone track density, where a and b are the regression coefficients indicating how many Sv (1 Sv- 106 m3s -1) deviation from the mean flow results from 1 STD changes in the wintertime Nordic Sea cyclone intensity and track density, respectively. However, given the correlation between the cyclone track density and the intensity, any separate interpretation of the regression coefficients a and b should be done with care.
Figure 7 shows that a portion of the interannual variance in the net wintertime volume flow through the Denmark Strait and the Faroe-Shetland Channel is linearly related to the mean cyclone variability in the Nordic Sea area (39% and 28% of the variance co-vary, respectively). Thus, under the assumption that the relationship between the Nordic Sea cyclone variability and variability in ocean volume transport is linear, a 1 STD deviation in both the track density and intensity should give a change of 0.7-0.8 Sv in the net volume flow through the Denmark Strait and the Faroe-Shetland
a 2.5
2
r,,T,l • 1
• 0.5
Z 0 Z
i• --0.5 • --1
• --1.5 Z
--2
--2.5
DENMARK STRAIT
1949 1952 1955 1958 1961 1964 1967 1970 1973 1976 1979 1982 1985 1988 1991 1994 1997
YEAR
b 2.5
2
r.T.] • 1
• 0.5 Z 0 Z
i• -0.5 • -1
• -1.5 Z
-2
-2.5
FAROE-SHETLAND
- r=0.53 / - - • -
t, ,,, A , :i:,,,,A - /,,,/ ,,_ . ilt I11
, , I t 4 I /
\• / / II I,",; ', II I\1, ',, '
d - I TRANSPORT=0.20* INTENSITY+0.60* DENSITY
1949 1952 1955 1958 1961 1964 1967 1970 1973 1976 1979 1982 1985 1988 1991 1994 1997
YEAR
Figure 7. Wintertime (DJF) anomalies (detrended) of the net volme flow (STD) in the Denmark Strait (a) and the Faroe-Shetland Channel (b) from the MICOM model (solid) and the multiple linear regressions based on the DJF Nordic Seas cyclone track density and intensity (dashed). Note: Volme fluxes are aletrended before the regression is calculated. r denotes the linear correlation between the MICOM-simulated net volume transport and the regression estimate.
SORTEBERG ET AL. 149
Channel. On the other hand, the variability over the Iceland- Faroe Ridge seems to be more influenced by multi-decadal variations that are not reflected in the area-averaged Nordic Sea cyclone parameters.
5.2. The Appearance and Disappearance of Atmosphere- Ocean Relationships
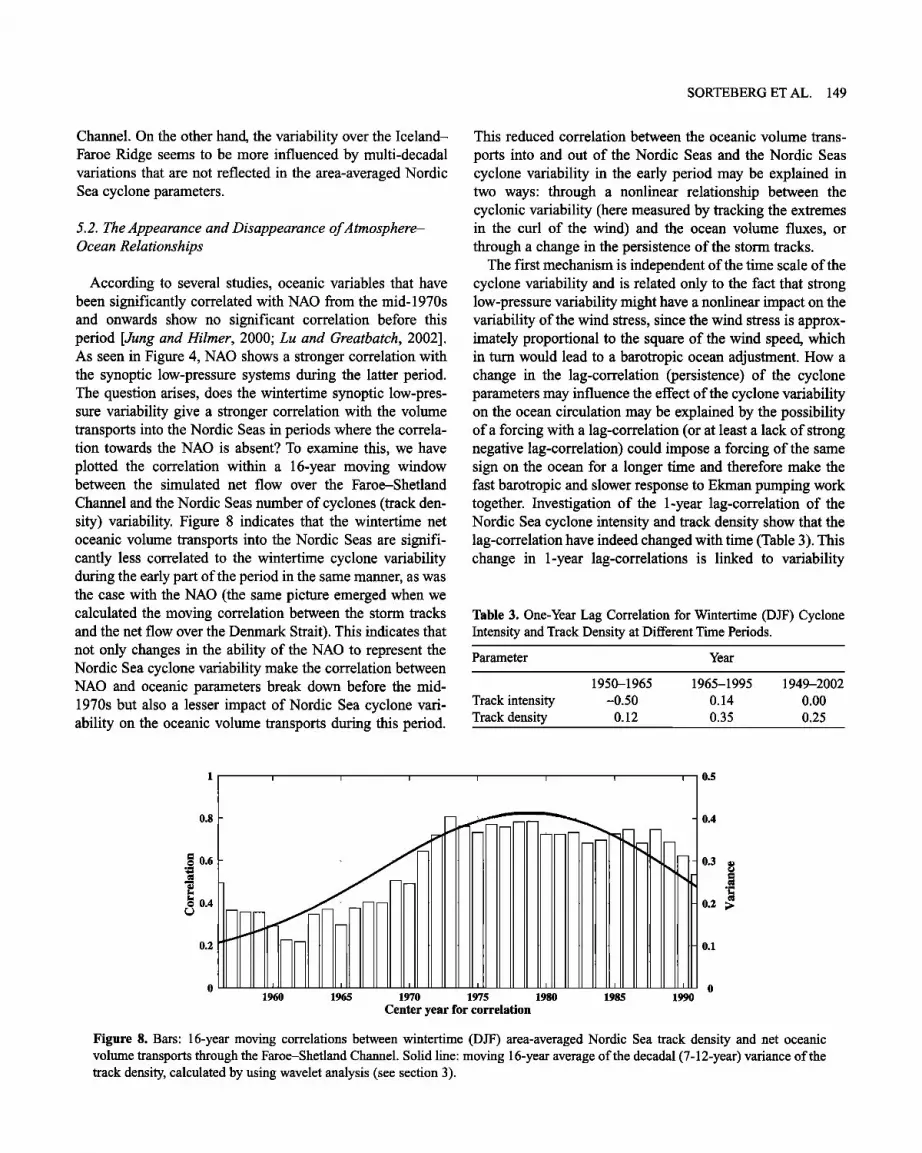
According to several studies, oceanic variables that have been significantly correlated with NAO from the mid-1970s and onwards show no significant correlation before this period [Jung and Hilmer, 2000; Lu and Greatbatch, 2002]. As seen in Figure 4, NAO shows a stronger correlation with the synoptic low-pressure systems during the latter period. The question arises, does the wintertime synoptic low-pres- sure variability give a stronger correlation with the volume transports into the Nordic Seas in periods where the correla- tion towards the NAO is absent? To examine this, we have plotted the correlation within a 16-year moving window between the simulated net flow over the Faroe-Shetland
Channel and the Nordic Seas number of cyclones (track den- sity) variability. Figure 8 indicates that the wintertime net oceanic volume transports into the Nordic Seas are signifi- cantly less correlated to the wintertime cyclone variability during the early part of the period in the same manner, as was the case with the NAO (the same picture emerged when we calculated the moving correlation between the storm tracks and the net flow over the Denmark Strait). This indicates that not only changes in the ability of the NAO to represent the Nordic Sea cyclone variability make the correlation between NAO and oceanic parameters break down before the mid- 1970s but also a lesser impact of Nordic Sea cyclone vari- ability on the oceanic volume transports during this period.
This reduced correlation between the oceanic volume trans-
ports into and out of the Nordic Seas and the Nordic Seas cyclone variability in the early period may be explained in two ways: through a nonlinear relationship between the cyclonic variability (here measured by tracking the extremes in the curl of the wind) and the ocean volume fluxes, or through a change in the persistence of the storm tracks.
The first mechanism is independent of the time scale of the cyclone variability and is related only to the fact that strong low-pressure variability might have a nonlinear impact on the variability of the wind stress, since the wind stress is approx- imately proportional to the square of the wind speed, which in turn would lead to a barotropic ocean adjustment. How a change in the lag-correlation (persistence) of the cyclone parameters may influence the effect of the cyclone variability on the ocean circulation may be explained by the possibility of a forcing with a lag-correlation (or at least a lack of strong negative lag-correlation) could impose a forcing of the same sign on the ocean for a longer time and therefore make the fast barotropic and slower response to Ekman pumping work together. Investigation of the 1-year lag-correlation of the Nordic Sea cyclone intensity and track density show that the lag-correlation have indeed changed with time (Table 3). This change in 1-year lag-correlations is linked to variability
Table 3. One-Year Lag Correlation for Wintertime (DJF) Cyclone Intensity and Track Density at Different Time Periods.
Parameter Year
1950-1965 1965-1995 1949-2002
Track intensity -0.50 0.14 0.00 Track density 0.12 0.35 0.25
1 [ [ [ [ [ ] [ 0.5
0.8
0.6
0.4
0.2
0 0 1960 1965 1970 1975 1980 1985 1990
Center year for correlation
- 0.4
0.3 •
0.2 ;•
0.1
Figure 8. Bars' 16-year moving correlations between wintertime (DJF) area-averaged Nordic Sea track density and net oceanic volume transports through the Faroe-Shetland Channel. Solid line: moving 16-year average of the decadal (7-12-year) variance of the track density, calculated by using wavelet analysis (see section 3).

150 WINTERTIME NORDIC SEAS CYCLONE VARIABILITY
in the variance on the interannual and decadal scales (see Figure 3). The tendency for a more positive lag-correlation in the mid-1970s to mid-1990s is due to the increased power on decadal scales (Figure 3), which counteracted the tendency for a negative 1-year lag-correlation imposed by the interan- nual variability. When there is strong variability both on the interannual and the decadal scales, the resulting lag- correlation is close to zero.
Figure 8 indicates that changes in co-variability between ocean volume transport and Nordic Seas cyclones is related to the strength of the decadal cyclone variability, the rela- tionship being strong (correlations of 0.7-0.8 and-0.7 to -0.8, with the net flow through the Faroe-Shetland Channel and Denmark Strait, respectively) in time periods with strong decadal variability. Thus, we cannot rule out the possibility that the persistence in the storm tracks may be a supplemen- tary effect of the nonlinear response to wind stress. One might speculate that the strong Nordic Seas cyclone activity in the 1970s to 1990s explains the reported strong correla- tions between NAO and oceanic variables in these decades as
well as the breakdown in correlation during earlier periods, when the Nordic Seas cyclone activity was weaker.
5.3. North Atlantic Cyclone Patterns During High- and Low-Volume Transports Into the Nordic Seas
In addition to the relationship between the wintertime mean Nordic Sea cyclone variability and the wintertime ocean volume transport determined in Table 2 and Figure 7, we wanted to get a spatial picture of the North Atlantic cyclone variability during years with strong anomalies in the oceanic transports across GSR. As investigated in section 5.2, the co-variability between the cyclone and oceanic volme flow variability seems highest during strong deviations in cyclone behaviour from the mean state. This justifies the use of composites (means over years with anomalies higher than 1 STD and lower than -1 STD) to display the spatial pattern of variability in the North Atlantic cyclones during years with high and low oceanic inflow and outflow through the different sections.
5.3.1. Relationships between North Atlantic cyclone variability and flow through the Denmark Strait and the Faroe-Shetland Channel. Figure 9 shows a composite of the number of cyclones (track density) during high and low inflow through the Denmark Strait. As indicated by the cor- relations (Table 2) and in the linear regression analysis (Figure 7), both the variability in inflow (Figure 9a and b) and in outflow (not shown) are related to the cyclone vari- ability in the Nordic seas. Positive anomalies exceeding 1 STD in the inflow (increased flow northward) are linked to a 10-30% reduction in the number of low-pressure systems in
the North Atlantic with the biggest reduction in the Icelandic area. The intensity of the low-pressure systems is reduced in the same areas (not shown). Due to this reduction in cyclone track density and intensity near Iceland, the area east of Greenland has southerly wind anomalies (i.e. reduced northerly winds). This could increase the inflow through the Denmark Strait into the Nordic Seas. The situation is oppo- site during low inflow, with increased cyclone number and intensity in the Icelandic area giving less inflow through the Denmark Strait. In addition, years with low inflow are asso- ciated with years with few cyclones in the Labrador Seas, which further increases the northerly wind anomalies east of Greenland. The composites of outflow anomalies depict the same type of pattern as the inflow composites. Interestingly, the composites for the Faroe-Shetland Channel inflow (Figure 10) and outflow (not shown) are similar to the com- posites for the Denmark Strait described above, the cyclone activity in the area close to Iceland being important for both the inflow and outflow. Thus the variability in the Nordic Sea wintertime cyclones may explain the strong anticorrelation found by Nilsen et al. [2003] between the net volume fluxes in the Denmark Strait and the Faroe-Shetland Channel
(-0.72 for the wintertime transports and -0.74 for the annual 3-year smoothed data, defining net as the difference between inflow and outflow from the Nordic Seas).
5.3.2. Relationships between North Atlantic cyclone vari- ability and flow through the Iceland-Faroe Ridge. Table 2 and Figure 7 indicate that the interannual variability in the wintertime volume flow across the Iceland-Faroe Ridge is only weakly connected to the area-averaged variability of wintertime cyclones in the Nordic Seas. However, as seen in Figures 11 and 12, the composites of high inflow and high and low outflow indicate that the anomalies in the Iceland-
Faroe Ridge volume transport might be related to the cyclone variability in the vicinity of the Nordic Seas that is not picked up by the average Nordic Sea cyclone variability investigated in section 5.1. Low inflow seems connected to high low- pressure activity in the Kategat (Figure 11) with an increase in the number of cyclones entering the Kategat of 20-30% and an increase in the intensity of 10% during years with a inflow anomalies lower than-1 STD. This induces north-
westerly wind anomalies (reduced southwesterly winds) in the Iceland-Faroe region, which may be responsible for the reduced inflow. On the other hand, increased outflow (Figure 12a) seems related to an increase in the number of cyclones in the area between northern Norway and Svalbard and fewer cyclones in the area west of British Islands (20% increase/reduction in the number of cyclones, respectively, for years where the Iceland-Faroe outflow deviates by 1 STD from the mean). Both of these changes will give northwest- erly wind anomalies in the Iceland-Faroe area. Low outflow

SORTEBERG ET AL. 151
Figure 9. Composites of wintertime (DJF) mean anomalies in number of cyclones (track density) and anomalies in 10-m wind speed are displayed for years in which the DJF Denmark Strait inflow is greater than 1 STD (9 years; a) or less than -1 STD (7 years; b).
(Figure 12b), on the other hand, seems more related to the increase in number of cyclones in the Icelandic area. This might explain the small but significant correlation of -0.28 (Table 2) between the mean Nordic Seas cyclone track density and the outflow.
As shown, there is no instant connection between the Iceland-Faroe Ridge inflow and the Nordic Seas cyclone activity (Table 2), so the area-averaged Nordic Seas cyclone variability cannot explain the strong negative correlation (-0.8) in the annual 3-year-smoothed net flow between the Faroe-Shetland Channel and the Iceland-Faroe Ridge reported in Nilsen et al. [2003]. However, a possible
contribution to this correlation might be the cyclonic activity in the Kategat area, which reduces the inflow across the Iceland-Faroe Ridge and pushes more water into the Faroe-Shetland branch. Such action would tend to anticorre-
late the wintertime inflow in the two branches (correlation of -0.49) as indicated in Nilsen et al. [2003].
6. SUMMARY AND CONCLUSIONS
A feature-tracking algorithm of wintertime storm tracks has been used to investigate the relationship between wintertime cyclones and ocean transports in the Nordic Seas for

152 WINTERTIME NORDIC SEAS CYCLONE VARIABILITY
a
Figure 10. Composites of wintertime (DJF) mean anomalies in number of cyclones (track density) and anomalies in 10-wind speed for years with DJF Faroe-Shetland inflow greater than 1 STD (10 years; a) or less than -1 STD (10 years; b).
the period 1949-2002. The number and intensity of the mean Nordic Sea cyclones show interannual (2.5-year) and decadal (7-12-year) fluctuations with pronounced peaks in the early 1970s, '80s, and '90s. Both the number and intensity of the Nordic Seas cyclone variability are linked to the NAO and AO, the correlation being slightly stronger with the AO due to a reduced NAO correlation in the 1960s. The strong rela- tionship between the Nordic Sea cyclones and AO/NAO con- firms that the Nordic Seas cyclone variability is a major part of both the AO and NAO pattern. However, the breakdown of the correlation with NAO in the 1960s indicates that the NAO
Index should be used with caution as an index for the win-
tertime Nordic Seas storm tracks. The NAO Index is best
seen as an index containing information of variability in sea- level pressure on all spatial scales ranging from planetary to synoptic scales and also including the effect of variability in high-pressure systems. We have noted that the eastward shift in the NAO centres of action coincides with the period of increased decadal variability of the Nordic Sea wintertime storm track variability, indicating a possible link between the two phenomena.
Due to the lack of long observational time series of oceanic volume transport across the GSR we used a simulation with the Nansen Center version of the ocean model MICOM
forced with daily atmospheric NCEP/NCAR reanalysis fields as a proxy for the real volume transports. Our results are

SORTEBERG ET AL. 153
,?.Sow
Figure 11. Composites of wintertime (DJF) mean anomalies in number of cyclones (track density) and anomalies in 10-m wind speed for years with DJF Iceland-Faroe inflow less than -1 STD (8 years).
therefore heavily dependent on the ability of this ocean model to reproduce the main features of the variability of the real volume transports. The wintertime variability in volume transports through the Faroe-Shetland Channel and the Denmark Strait was significantly correlated to the mean Nordic Seas cyclone variability (both number and intensity). This relationship with the wintertime cyclone variability, especially with the cyclones close to Iceland, might con- tribute to the strong anticorrelation between the annual net flow into the Nordic Seas through the Faroe-Shetland Channel and the Denmark Strait reported in Nilsen et al. [2003]. High (low) cyclone activity near Iceland induces strong southwesterly (northeasterly) wind anomalies in the Faroe-Shetland area simultaneously with strong northerly (southerly) wind anomalies in the Denmark Strait region.
The variability in the net flow across the Iceland-Faroe Ridge shows less influence of the mean Nordic Sea cyclone variability. However, years with low inflow over the Iceland- Faroe Ridge appear to be related to higher cyclone activity in the Kategat, giving northwesterly wind anomalies in the Iceland-Faroe region.
Nilsen et al. [2003] reported a strong anticorrelation between the annual net flow into the Nordic Seas in the Faroe-
Shetland Channel and over the Iceland-Faroe Ridge. The win- tertime cyclone activity in Kategat might have contributed to this when periods of strong cyclone activity in Kategat reduced the inflow across the Iceland-Faroe Ridge and pushed more water into the Faroe-Shetland branch. Apparently years with strong outflow (southward flow) over the Iceland-Faroe Ridge are associated with years having stronger than normal
low-pressure activity in the area between northern Norway and Svalbard and weaker than normal activity west of the British Islands, both of which will contribute to northwesterly wind anomalies in the Iceland-Faroe area.
As for NAO, the correlation between the mean Nordic Sea cyclone activity and oceanic volume transports in and out of the region was strongest from the mid-1970s into the 1990s. Two mechanisms have been proposed in this respect. The first is the increase in Nordic Seas cyclone variability during this period, which could lead to a nonlinear impact (the wind stress is approximately proportional to the square of the wind speed) of the cyclone variability on the oceanic volume transports. This could make the co-variability between the variability in the cyclones and the oceanic volume transports more apparent during years with strong cyclone variability. A second effect might be that stronger persistence in the storm track due to increased variability on decadal scales might impose a forcing of the same sign on the ocean for a longer time and therefore make the fast barotropic and slower baroclinic ocean adjust- ments work together. The analysis in section 5.2 and the result of Orvik and Skagseth [2003], who reported a lagged response of 15 months between the North Atlantic wind-stress curl at
about 55øN and the Norwegian Atlantic Current, indicate that this effect may be supplementary to the first one.
Note that the presented analysis considers only the sea- sonal co-variability of wintertime oceanic volume transport anomalies and the variability in wintertime synoptic low- pressure systems. An extension of this analysis will be to examine the ocean-atmosphere relationships in other sea- sons. Studies indicate that other relationships, including both

154 WINTERTIME NORDIC SEAS CYCLONE VARIABILITY
2.5øW
b
Figure 12. Composites of wintertime (DJF) mean anomalies in number of cyclones (track density) and anomalies in 10-m wind speed for years with DJF Iceland-Faroe outflow greater than 1 STD (8 years; a) or less than -1 STD (7 years; b).
the hydrological cycle and more large-scale ocean-atmos- phere interactions [e.g.; Blindheirn et al., 2000; Mork and Blindheirn, 2000; Nilsen et al., 2003; Visbeck et al., 2003], are important both for the strength of the mean volume trans- port and for the long-term variability. Some of these aspects are treated in Furevik and Nilsen (this issue).
Acknowledgments. The authors thank Dr. Kevin Hodges for providing the tracking algorithm; Dr. Jan Even Oye Nilsen for providing the ocean data, Figure 6, and valuable suggestions; and Professor Helge Drange and three anonymous reviewers for their insightful comments. This work was funded by the Norwegian Research Council under the SFF and ECOBE contracts. This is
publication No. A87 from the Bjerknes Centre for Climate Research.
REFERENCES
Anderson, D., K.I. Hodges, and B.J. Hoskins, Sensitivity of Feature- Based Analysis Methods of Storm Tracks to the Form of Background Field Removal. Monthly Weather Review, 131, 565-573, 2003.
Bacon, S, Decadal variability in the outflow from the Nordic Seas to the deep Atlantic Ocean. Nature, 394, 871-874, 1998.
Barnston, A.G., and R.E. Livezey, Classification, seasonality and persistence of low-frequency atmospheric circulation patterns. Monthly Weather Review, 115, 1083-1126, 1987.
Battisti, D.S., U.S. Bhatt, and M.A. Alexander, A modeling study of the interannual variability in the wintertime North Atlantic Ocean. Journal of Climate, 8, 3067-3083, 1995.

SORTEBERG ET AL. 155
Bell, G.D., and L.H. Bosart, A 15-year climatology of Northern Henisphere 500 mb closed cyclone and anticyclone centres. Monthly Weather Review, 117, 2142-2162, 1989.
Bentsen, M., Drange, H., Furevik, T, and Zhou, T, Variability of the Atlantic meridional overturning circulation in an isopycnic coor- dinate OGCM. Clim. Dyn., in press, (2004).
Bentsen, M., et al.: Coordinate transformation on a sphere using conformal mapping, Monthly Weather Review, 127, 2733-2740, 1999.
Bleck, R., C. Rooth, D. Hu, and L.T. Smith, Salinity-driven thermo- haline transients in a wind- and thermohaline-forced isopycnic coordinate model of the North Atlantic, Journal of Physical Oceanography, 22, 1486-1515, 1992.
Blackmon, M.L., A climatological spectral study of the 500 mb geopotential height of the Northern Hemisphere. Journal of Atmospheric Science, 33, 1607-1623, 1976.
Blackmon, M.L., J.M. Wallace, N.-C. Lau, and S. Mullen, An obser- vational study of the Northern Hemisphere wintertime circulation. Journal of Atmospheric Science, 34, 1040-1053, 1977.
Blindheim, J., Borovkov, V., Hansen, B., Maimberg, S.-A., Turrell, W., and Osterhus, S., Upper layer cooling and freshening in the Norwegian Sea in relation to atmospheric forcing. Deep-Sea Research, 47, 655-680, 2000.
Cayan, D., Latent and sensible heat-flux anomalies over the north- em oceans--The connection to monthly atmospheric circulation, Journal of Climate, 5,354-369, 1992.
Chang, E., and Y. Fu, Interdecadal variations in the Northern Hemisphere winter storm track intensity, Journal of Climate, 15, 642-658, 2002.
Chang, E., S. Lee, K.L. Swanson, Storm track dynamics, Journal of Climate, 15, 2163-2183, 2002.
Delworth, TL., North Atlantic interannual variability in a coupled ocean-atmosphere model. Journal of Climate, 9, 2356-2375, 1996.
Deser, C., and M. L. Blackmon, Surface climate variations over the North Atlantic Ocean during winter: 1900-1993. Journal of Climate, 6, 1743-1753, 1993.
Deser, C., and M.S. Timlin, Atmosphere-ocean interaction on weekly time scales in the North Atlantic and Pacific. Journal of Climate, 10, 393-408, 1997.
Dickson, R.R., T Osborne, J. Hurrell, J. Meincke, J. Blindheim, B. Aadlandsvik, T Vinje, G. Alekseev, and W. Maslowski, The Arctic response to the North Atlantic Oscillation. Journal of Climate, 13,2671-2696, 2000.
Furevik, T., On the Atlantic Flow in the Nordic Seas, bifurcation and variability. Ph.D. thesis. Geophysical Institute, University of Bergen, 1998.
Furevik, T., M. Bentsen, H. Drange, J.A. Johannessen, and A. Korablev, Temporal and spatial variability of the sea surface salinity in the Nordic Seas, Journal of Geophysical Research, 107, 2002.
Geng, Q., and M. Sugi, Variability of the North Atlantic Cyclone activity in winter analysed from NCEP-NCAR Reanalysis data. Journal of Climate, 14, 18, 3863-3873, 2001.
Gillett, N.P., Graf, H.F., and Osborn, T.J., Climate change and the NAO. In: The North Atlantic Oscillation. Ed. J.W. Hurrell. AGU
Geophysical Monograph Series, 134, ISBN 0-87590-994-9, pp. 193-210, 2003.
Gulev, S.K., O. Zolina, and S. Grigoriev. Extratropical cyclone vari- ability in the Northern Henisphere winter from the NCEP/NCAR reanalysis data, Climate Dynamics, 17, 795-809, 2001.
Hodges, K.I. A general method for tracking analysis and its appli- cation to meteorological data. Monthly Weather Review, 122, 2573-2586, 1994.
Hodges, K.I. Feature Tracking on the Unit Sphere. Monthly Weather Review, 123, 3458-3465, 1995.
Hodges, K.I. Spherical Nonparametric Estimators Applied to the UGAMP Model Integration for AMIP. Monthly Weather Review, 124, 2914-2932, 1996.
Hodges, K.I.: Adaptive Constraints for Feature Tracking. Monthly Weather Review, 127, 1362-1373, 1999.
Hodges K.I., B.J. Hoskins, J. Boyle, and C. Thorncroft A Comparison of Recent Reanalysis Datasets Using Objective Feature Tracking: Storm Tracks and Tropical Easterly Waves, Monthly Weather Review, 131, 2012-2037, 2003.
Hoskins, B.J., and K.I. Hodges New Perspectives on the Northern Hemisphere Winter Storm-Tracks, Journal of Atmospheric Science, 59, 1041-1061, 2002.
Hubbard, B.B. The World According to Wavelets: The Story of a Mathematical Technique in the Mala'ng. Ed. A.K. Peters. (ISBN: 1-56881-072-5), 1996.
Hurrell, J.W. Decadal trends in the North Atlantic Oscillation: regional temperatures and precipitation, Science, 269, 676-679, 1995.
Hurrell, J.W., and H. van Loon Decadal variations in climate asso- ciated with the North Atlantic Oscillation, Climate Change, 36, 301-326, 1997.
Jones, P., T. Jonsson, and D. Wheeler Extension to the North Atlantic Oscillation using early instrumental pressure observa- tions from Gibraktar and South-West Iceland. International
Journal of Climatology, 17, 1433-1450, 1997. Kalnay, E., et al. The NCEP/NCAR 40-year Reanalysis Project,
Bulletin of American Meteorological Society, 77, 437-471, 1996. Kistler, R., E. Kalnay, W. Collins, S. Saha, G. White, J. Woollen,
M. Chelliah, W. Ebisuzaki, M. Kanamitsu, V. Kousky, H. van den Dool, R. Jenne, and M. Fiorino The NCEP-NCAR 50-year reanalysis: Monthly means CD-ROM and documentation, Bulletin of American Meteorological Society, 82, 247-267, 2001.
Kushnir, Y. Interdecadal variations in the North Atlantic sea surface temperature and associated atmospheric conditions, Journal of Climate, 7, 142-157, 1994.
Kuzmina, S.I., L. Bengtsson, O.M. Johannessen, H. Drange, L.P. Bobylev, and M.W. Miles: The North Atlantic Oscillation and greenhouse-gas forcing, Geophysical Research Letters, in press, 2005.
Lambert, S. Intense extratropical Northern Hemisphere winter cyclone events, Journal of Geophysical Research, 101, 21319-21325, 1996.
Lau, N.-C. Variability of the observed midlatitude storm tracks in relation to low-frequency changes in the circulation pattern, Journal of Atmospheric Sciences, 45, 2718-2743, 1988.
Lorenz, D.J., and D.L. Hamann Eddy-Zonal Flow Feedback in the Northern Hemisphere winter. Journal of Climate, 16(8), 1212-1227, 2003.

156 WINTERTIME NORDIC SEAS CYCLONE VARIABILITY
Mork, K.A., and J. Blindheim: Variations in the Atlantic inflow to the Nordic Seas 1955-1995. Deep-Sea Research, I, 47, 1035-1057, 2000.
Orvik, K.A., and O. Skagseth: The impact of the wind stress curl on the North Atlantic inflow to the Norwegian Sea toward the Arctic. Geophysical Research Letters, 30, No. 17, 1884, 2003.
Nilsen, J.E.O., Y. Gao, H. Drange, T. Furevik, and M. Bentsen: Simulated North Atlantic-Nordic Seas water masses exchanges in an isopycnal coordinate OGCM. Geophysical Research Letters, 30, No. 10, 1536, 2003.
Pedlosky, J.: Geophysical Fluid Dynamics. Springer-Verlag, New York, 2nd ed., 1987.
Peterson, K.A., J. Lu, and R.J. Greatbatch, Evidence of nonlinear dynamics in the eastward shift of the NAO, Geophysical Research Letters, 30(2), 10.1029/2002GL015585, 2003.
Reitan, C.H.: Frequency of cyclones and cyclogenesis for North America, 1951-1970, Monthly Weather Review, 102, 861-868, 1974.
Rogers, J.C.: The association between the North Atlantic Oscillation and the South Atlantic Oscillation in the Northern Hemisphere. Monthly l•ather Review, 112, 1999-2115, 1984.
Rogers, J.C.: Patterns of Low Frequency Monthly Sea Level Pressure Variability (1988-1986) and Associated Wave Cyclone Frequencies, Journal of Climate, 3, 1364-1379, 1990.
Seager, R., D.S. Battisti, J. Yin, N. Gordon, N.H. Naik, A.C. Clement, and M.A. Cane: Is the Gulf Stream responsible for Europe's mild winters? Quarterly Journal of the Royal Meteorological Society, 128, 2563-2586, 2002.
Serreze, M.C., J.E. Box, R.G. Barry, and J.E. Walsh: Characteristics of Arctic synoptic activity, 1952-1989, Metrological andAtmospheric Physics, 51,147-164, 1993.
Thomson, D.J.: Spectrum estimation and harmonic analysis, Proc. IEEE, 70, 1055-1096, 1982.
Thompson, D.W.J., and J.M. Wallace: The Arctic Oscillation signa- ture in the wintertime geopotential height and temperature fields. Geophysical Research Letters, 25, 1297-1300, 1998.
Thompson, D.W.J., and M. Wallace: Annular Modes in the Extratropical Circulation. Part I: Month-to-Month Variability. Journal of Climate, 13, No. 5, 1000-1016, 2000.
Torrence, C., and G.P. Compo: A Practical Guide to Wavelet Analysis. Bulletin of American Meteorological Society, 79, 61-78, 1998.
Trenberth, K.E., G.W. Branstator, D. Karoly, A. Kumar, N.-C. Lau, and C. Ropelewski: Progress during TOGA in understanding and modeling global teleconnections associated with tropical sea surface temperatures, Journal of Geophysical Research, 103, 14291-14324, 1988.
Visbeck, M., E.P. Chassignet, R.G. Curry, T.L. Delworth, R.R. Dickson, and G. Krahmann: The ocean's response to the NAO. In: The North Atlantic Oscillation. (Ed. J. Hurrell) Geophysical Monograph Series, 134. Washington, DC: American Geophysical Union, 2003.
Witthaker, L.M., and L.H. Horn: Geographical and seasonal distri- bution of North American cyclogenesis, 1958-1977, Monthly Weather Review, 109, 2312-2322, 1981.
Wilks, D.S., 1995: Statistical Methods in the Atmospheric Sciences. International Geophysics Series, Vol. 59. Academic Press.
Zishka, K.M., and P.J. Smith: The climatology of cyclones and anti- cyclones over North America and surrounding ocean environ- ments for January and July 1950-1977, Monthly Weather Review, 108, 387-401, 1980.
Zolina, O., and S.K. Gulev: Improving the accuracy of mapping cyclone numbers and frequencies. Monthly Weather Review, 130, 748-759, 2002.
Oyvind Byrkjedal and Asgeir Sorteberg, Bjerknes Centre for Climate Research, University of Bergen, Allegaten 55, N-5007 Bergen, Norway. (oyvind.byrkjedal•bjerknes.uib.no; asgeir. sorteberg •bjerknes.uib.no)
Nils Gunnar Kvamsto, Geophysical Institute, University of Bergen, Allegaten 70, N-5007 Bergen, Norway. (nilsg•gfi.uib.no)


