Embed Size (px)
Citation preview

MARINE ECOLOGY PROGRESS SERIESMar Ecol Prog Ser
Vol. 393: 211–223, 2009doi: 10.3354/meps08103
Published October 30
INTRODUCTION
Global climate change is expected to alter both themean and variance of many meteorological andoceanographic parameters (Trenberth 2001, IPCC2007), including the phasing and intensity of upwellingin eastern boundary current marine ecosystems.Changes in the phasing of upwelling may influencehabitat suitability, primary productivity, and variousmid-level ecological interactions (Stenseth et al. 2002,Parmesan 2006), with ascending effects to the uppertrophic levels. The effects of changes in upwelling on
ecosystem dynamics may be greatest during thespring-summer upwelling season, but may also beinfluential during winter before the spring transition.
As an apparent consequence of climate change, avariety of plant and animal parameters, including lifehistory characteristics and demographic attributes,have shifted in a manner consistent with expectationsunder global climate warming. However, the vastmajority (>90%) of changes documented to date comefrom terrestrial ecosystems and species (Richardson &Poloczanska 2008). Very few of these studies examinedchanges in biological time series, other than variability
© Inter-Research 2009 · www.int-res.com*Email: [email protected]
Winter pre-conditioning of seabird phenologyin the California Current
Isaac D. Schroeder1,*, William J. Sydeman2, 3, Nandita Sarkar1,Sarah Ann Thompson2, Steven J. Bograd1, Franklin B. Schwing1
1NOAA, Southwest Fisheries Science Center, Environmental Research Division, 1352 Lighthouse Avenue, Pacific Grove, California 93950-2097, USA
2Farallon Institute for Advanced Ecosystem Research, PO Box 750756, Petaluma, California 94954, USA3Bodega Marine Laboratory, 2099 Westside Road, Bodega Bay, California 94923, USA
ABSTRACT: Climate change is predicted to affect the phasing and amplitude of upwelling in easternboundary current marine ecosystems. Effects may be strongest during the spring or summer‘upwelling season,’ but may also be influential during winter before the spring transition. We testedthe hypothesis that wintertime environmental forcing ‘pre-conditions’ the ecosystem and affects thetiming and success of breeding in 2 species of seabird, Cassin’s auklet Ptychoramphus aleuticus andcommon murre Uria aalge, reproducing in the central California Current. Time series of the meanand variance of egg-laying dates were correlated with regional winds and sea surface temperature,which were used as proxies for the forcing and oceanic response of coastal upwelling, respectively.Winter proxies of upwelling were the most significant determinants of seabird reproductive phenol-ogy, with anomalously strong upwelling in January to March leading to earlier dates of egg-laying inboth species. We hypothesized that anomalous (early) winter upwelling, even of weak magnitude orshort duration, could seed the region with sufficient nutrients to enhance productivity and prey avail-ability, leading to a healthier adult breeding population and an earlier start to the breeding season.The magnitude of the previous year’s November winds were also positively correlated with the vari-ance of egg-laying dates for the common murre, with upwelling-favorable winds leading to greatersynchrony in egg-laying. We conclude that winter environmental conditions are important determi-nants of ecosystem dynamics in the California Current, and that seabird phenology is a particularlyuseful ecosystem indicator.
KEY WORDS: Cassin’s auklet · Common murre · California current · Phenology · Upwelling · Winter ·Ecosystem indicator
Resale or republication not permitted without written consent of the publisher
Contribution to the Theme Section ‘Marine ecosystems, climate and phenology: impacts on top predators’ OPENPEN ACCESSCCESS

Mar Ecol Prog Ser 393: 211–223, 2009
in the average parameter state, and whether mean val-ues have shifted systematically through time. Phenol-ogy is defined as the timing of key events in plant oranimal life histories, for example, the average dates ofegg-laying in birds or bud burst in trees. Phenology isa very sensitive indicator of climate-driven ecosystemchanges (Beebee 1995, Forchhammer et al. 1998,Stenseth & Mysterud 2002, Parmesan & Yohe 2003,Root et al. 2003, Parmesan 2006). In marine ecosys-tems, phenological changes have been related to cli-mate variability and change for both lower (Mackas etal. 2001) and upper trophic level species (Abraham &Sydeman 2004).
A substantial component of the climate change liter-ature for marine ecosystems concerns marine birds(Durant et al. 2004). Studies from the northern andsouthern hemispheres have related seabird phenologyto oceanographic and atmospheric variability (Syde-man et al. 1991, 2006, Bertram et al. 2001, Abraham &Sydeman 2004, Frederiksen et al. 2004, Barbraud &Weimerskirch 2006, Reed et al. 2006, 2009, Byrd et al.2008, Wolf et al. 2009), but none of these studies exam-ined anything other than mean or median dates ofreproduction, and most studies have looked at‘oceanographic climate’ during the spring/summerbreeding periods for the birds. Indeed, investigatingwithin-season variability in winter, spring, and sum-mer, and in relation to the distribution of dates ofreproduction and reproductive success may be re-vealing. Moreover, few studies, with the exception ofAbraham & Sydeman (2004), examined early oceano-graphic or climatic parameters that may ‘pre-condi-tion’ ecosystems and influence the developing foodwebs upon which seabirds depend to obtain theresources for reproduction.
Seabirds have been proposed to be among the bestenvironmental and ecological indicators for coastalmarine ecosystems (Cairns 1987). Phenological attrib-utes of seabirds are clearly relevant to evaluating therole of seabirds as indicators of marine ecosystem andfood web dynamics. In particular, it has been arguedthat seabirds are reliable indicators because as toppredators they ‘integrate’ and ‘amplify’ environmentalvariability to produce interpretable signals in theirtime series. This assumption has rarely been testedcomprehensively (but see Wells et al. 2008).
In the present study, we evaluated the hypothesisthat seabirds integrate environmental variability, and,as a result, demonstrate interpretable signals in theirphenology that are significant in a climate change-ecosystem change context. We tested this hypothesis bycorrelating wind and sea surface temperature (SST)time series over a wide geographic area with egg-laying dates of 2 species of seabird in the CaliforniaCurrent large marine ecosystem along the US west
coast. Winds and SST were used as proxies for the forc-ing and oceanic response for coastal upwelling, respec-tively (Huyer 1983, Hickey 1998). We selected 2 speciesof birds, a planktivore (Cassin’s auklet) and a piscivore(common murre), to examine differential responses tovariation in the duration and phasing of upwelling. Weinvestigated ecosystem pre-conditioning and howseabirds integrate environmental variation by consider-ing how wind and SST influence phenology up to 6 to8 mo before the initiation of reproduction each year.
MATERIALS AND METHODS
Egg laying data for Cassin’s auklet Ptychoramphusaleuticus and common murre Uria aalge, hereinreferred to as auklet and murre, have been collectedby biologists of the Point Reyes Bird Observatory(PRBO) under contract with the US Fish and WildlifeService (USFWS) at Southeast Farallon Island (SEFI;37° 41’ 53.88’’ N, 123° 0’ 5.76’’ W; Fig. 1) since the early1970s. The Farallon National Wildlife Refuge, includ-ing SEFI and the North Farallon Islands, hosts one ofthe richest marine bird nesting colonies in the world,with at least 12 regularly breeding species (Sydemanet al. 2001). Auklets are planktivorous, feeding primar-ily on euphausiid crustaceans (Ainley et al. 1996, Abra-ham & Sydeman 2004, 2006) and have a foragingradius of ~60 km from the colony (Mills et al. 2007);they do not generally forage on inner shelf habitats(<50 m depth; Yen et al. 2005). In contrast, murres areomnivores and generally range within the 3000 m iso-bath, and ~100 km from the colony (Mills et al. 2007).Once murres finish molting they occupy nest sites onthe Farallones in October and November (Ainley &Boekelheide 1990). Auklets inhabit the Farallonesthroughout the year, but in September and Octoberthey tend to molt at sea (Manuwal 1974). Each year, avariable number of birds is profiled, and the dateswhen eggs are laid and hatched are recorded andfledgling survival is observed (see Appendix 1 for sum-mary statistics on reproductive timing). For both spe-cies, only the first egg-laying dates are considered inthe calculation of the mean and variance time series.Thus, we have a 35 yr time series of the mean and vari-ance of egg-laying dates for both auklets and murres.Hatching dates were not used, as the results werequantitatively similar to that of egg-laying dates, andwe were most interested in the climate-oceanographiccorrelates of the initiation of breeding dates, which isbest studied using egg-laying dates.
The environmental variables compared to theseabird phenology are based on satellite-derived SSTand meridional wind data, available from the NationalOceanic and Atmospheric Administration (NOAA)
212

Schroeder et al.: Seabird winter pre-conditioning
Coastwatch Program (http://coastwatch.pfel.noaa.gov/data.html). The SST data come from Pathfinder version5.0 day and night monthly composites, available fromJanuary 1985 to the present at a spatial resolution of4.4 km (Kilpatrick et al. 2001). The wind data are fromNOAA/NCDC blended monthly mean sea surfacewinds at 0.25° (~25 km) resolution (Zhang et al. 2006).The west coast of North America in the vicinity of theFarallon Islands is oriented in the north-south direc-tion, thus the ‘v’ component of the wind is alignedalong the north-south (meridional) direction and drivescoastal upwelling. Southward winds (–v) are upwellingfavorable, whereas northward winds (+v) cause down-welling.
Analyses have been performed over the time periodcommon to the biological and physical time series(1988 to 2006). Gaps in the SST data were filled by alinear interpolation on the monthly mean time series at
a particular grid location; for the months of Januarythrough March, only 8% of the total time series had>3 missing monthly values. Over 80% of the total timeseries had <5 missing months. Most gaps in the timeseries were only 1 mo in length, but some were up to5 mo, especially in the coastal area around Point Con-ception, California (34.5° N, 121° W). There were nogaps in the meridional wind time series.
Statistical analyses. Spearman’s rank correlationmethod (Kendall & Gibbons 1990) was used to relatethe physical and biological series, as this techniquedoes not assume normal distributions for the timeseries. The method calculates a correlation coefficient,C, and a probability, p, that the correlation is due tochance. The relationship between any 2 time seriesmay be simultaneous (lag 0), or one may lead or lag theother. We derived spatial correlation maps betweenthe monthly mean gridded satellite data for a particu-lar month (winds and SST) and the annual mean andvariance of egg-laying dates for each species. To exa-mine the cumulative effect of upwelling, averages ofconsecutive months were also considered. Only spatialcorrelation maps with large areas of significant corre-lations were used in the final interpretation of thebirds’ response to the physical oceanic conditions.Given the large number of tests performed, correla-tions with p < 0.01 were assumed to be significant.
RESULTS
Variability in egg-laying dates
The mean and variance of egg-laying dates for bothauklets and murres were related to annual reproduc-tive success (number of chicks fledged per breedingpair). For both species, egg-laying dates were in-versely related to breeding success (C = –0.33, p < 0.06for auklets and C = –0.39, p < 0.02 for murres). That is,an early mean egg-laying date resulted in a largernumber of viable fledglings per breeding pair. How-ever, the 2 species show different relationships be-tween egg-laying variances and reproductive success,especially since ~1990. Auklets were lower in trophiclevel, generally breeding earlier in the year, and hav-ing more variability in timing of egg-laying than mur-res. For auklets, variance in egg-laying correspondingto a longer breeding season, with younger birds typi-cally breeding later in the season; this could result in apositive relationship with breeding success if the birdsraise more than 1 clutch (‘double-brood’) in years ofextended reproduction (Abraham & Sydeman 2004).In contrast, reproductive success of murres was en-hanced when breeding synchrony was greatest (Birk-head 1977, Sydeman et al. 1991), with synchrony re-
213
Fig. 1. Southeast Farallon Islands (SEFI), showing the esti-mated foraging ranges for common murre and Cassin’s auklet.
The 300 m and 3000 m isobath are contoured

Mar Ecol Prog Ser 393: 211–223, 2009
flected by small variance in egg-laying dates (C =–0.51; p < 0.01).
The mean egg-laying dates for auklets and murresbetween 1972 and 2006 reveal substantial interannualvariability (Fig. 2a). From 1972 to 2006, there was apositive trend in the auklet mean egg-laying dates(slope = 0.40 d yr–1, p = 0.14) and a negative trend inthe murre mean egg-laying dates (slope = –0.24 d yr–1,p = .07). The planktivorous auklets initiated reproduc-tion before murres in all years except 1992. In strong ElNiño years (1983, 1992, 1998), the mean egg-layingdates for both species were significantly delayed; forauklets, the delay was upwards of 60 d, whereas formurres it was ~20 d. The mean egg-laying dates of thespecies were correlated (C = 0.55, p < 0.01). The vari-ance in egg-laying dates (Fig. 2b) changed over theobservation period. Until 1990, the variances of egg-laying dates for both species co-varied (C = 0.46, p <0.05), but the correlation was negative (C = –0.51, p <0.05) after 1990. During El Niño years, variance in egg-laying dates of auklets decreased, whereas for murresthe variance increased. The mean and variance of egg-laying dates for auklets were inversely correlated (C =–0.47, p < 0.01) — when breeding early the popula-tion showed greater variability. For murres, there wasno meaningful correlation between the mean andvariance.
Correlation maps between meridional winds andegg-laying dates
Correlation maps constructed from correlationsbetween meridional winds and mean egg-laying datesshowed significant correlations only for the months ofJanuary, February, and January-February combined(other months are not shown). The correlations werepositive and hold for both auklets (Fig. 3a) and murres(Fig. 3b), indicating that wintertime upwelling-favor-able winds correspond to earlier mean egg-layingdates for both species. The January correlations forboth species ranged between 0.58 and 0.76 for most ofthe region between 32°–44° N and 120°–128° W, en-compassing almost the entire US West Coast. For auk-lets, the spatial correlations break down north of 41° Nand in the area south of 36° N, shoreward of 123° W.For murres, the correlations break down primarily inthe southern part of the domain. In February, theregions of high correlation for both auklets and murreslie south of the Farallon Islands, having valuesbetween 0.58 and 0.70.
The correlation map with the largest area of signif-icant correlations was for the time series constructedby averaging the January and February meridionalwinds. The spatial extent of the correlation was simi-lar for both auklets and murres, with high correla-
214
Fig. 2. Ptychoramphus aleuticus and Uria aalge. Time series of (a) mean of egg-laying dates and (b) variances of egg-laying dates.For the time period 1988 to 2006 (years of available wind and sea surface temperature (SST) data), the 4 years of the smallest
(largest) values of auklet means and murre variances are marked with circles (triangles)

Schroeder et al.: Seabird winter pre-conditioning
tions throughout the domain, except for an increas-ing area of low or non-significant correlations northof approximately 40° N. It is interesting to note thatwhile correlation values were highest for auklets inthe composite of January-February winds, the Janu-ary winds alone provided the highest correlations formurres. The relationships for both species areslightly non-linear; a quadratic regression of winter-time January-February winds explained 60.61% ofthe variance in mean egg-laying dates of auklets(Fig. 4a) and 44.87% of the variance in egg-layingdates of murres (Fig. 4b).
A strong positive relationship occured between me-ridional winds and variance of murre egg-laying dates
(Fig. 5), but no such relationship existed for auklets. Apositive correlation indicates that northward (down-welling favorable) winds are related to higher variancein murre egg-laying dates. Notably, the correlationwas strongest in November of the previous year (e.g.the 1983 egg-laying variance was correlated to theNovember 1982 meridional winds), with a maximumcorrelation value of C = 0.94, centered at 42° N, 132° W,which decreases offshore to C = 0.59. This region ofhigh positive correlation is located well to the north-west of the Farallon Islands, but corresponds to thecenter of the North Pacific (subtropical) High, whichmodulates coastal upwelling in the California Current(Schwing et al. 2002).
215
Fig. 3. Ptychoramphus aleuticus and Uria aalge. Correlations between meridional wind and mean egg-laying dates for (a) aukletsand (b) murres. The spatial meridional wind data are the monthly means for January, February, and the average of January andFebruary. For this and all subsequent correlation maps, a black asterisk marks the location of southeast Farallon Islands (SEFI).
Only correlations with p < 0.01 are shown; areas in white are for non-significant correlations (p > 0.01)

Mar Ecol Prog Ser 393: 211–223, 2009
Correlation between SST and egg-laying dates
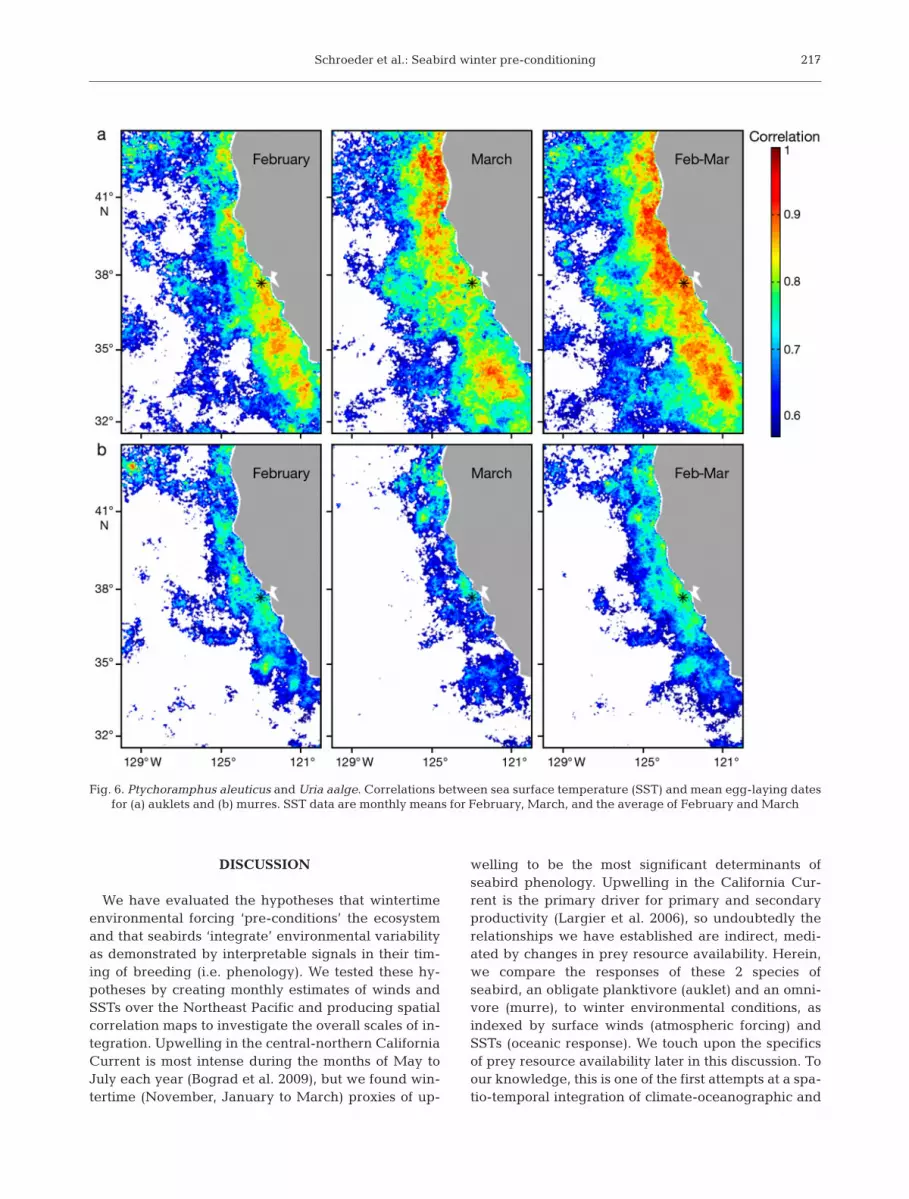
Correlation maps of SST and mean egg-laying datesfor February, March, and February-March showed thegreatest extent of significant positive correlations forboth auklets (Fig. 6a) and murres (Fig. 6b). Positive
correlations imply that both species lay their eggs ear-lier (later) when the regional SST is cool (warm). Thecorrelation maps of SST have a much higher spatialresolution (4.4 km) than the wind correlation maps (ap-proximately 25 km), and consequently appear grainier.Both auklets and murres had similar spatial correlationpatterns, with higher correlations along the coast anddecreasing correlations with increasing distance off-shore. However, the offshore extent, as well as themagnitude, of the correlation coefficients was muchhigher for auklets than murres in all 3 temporal aver-ages (February, March, and February-March).
In February, auklet correlation values were highest(C = 0.94) southward of the Farallon Islands, on thecontinental shelf. In March, the area of highest correla-tion (C = 0.97) was in the northern shelf area, around42° N. The SST averaged over February and Marchhad the highest spatial extent of significant correlation.The same spatial patterns were evident in the murre–SST correlation maps, though with generally lowercorrelations everywhere.
There were also significant correlations betweenSST and the variance of auklet egg-laying dates inFebruary (Fig. 7). These correlations were negative,ranging from –0.79 to –0.58, implying that colder SSTsare associated with longer time spans of egg-layingperiods. However, the spatial extent of the significantcorrelations was rather limited. No significant correla-tions were found between SST time series and vari-ance of murre egg-laying dates.
216
Fig. 4. Ptychoramphus aleuticus and Uria aalge. Bivariate plot between meridional wind and mean egg-laying dates for (a) auklet and (b) murre. Location of the January-February mean meridional wind data is 37.5° N, 125.5° W
Fig. 5. Uria aalge. Correlations between meridional windsand variances of egg-laying dates for murres. Wind data are
monthly means for November of the previous year
Schroeder et al.: Seabird winter pre-conditioning
DISCUSSION
We have evaluated the hypotheses that wintertimeenvironmental forcing ‘pre-conditions’ the ecosystemand that seabirds ‘integrate’ environmental variabilityas demonstrated by interpretable signals in their tim-ing of breeding (i.e. phenology). We tested these hy-potheses by creating monthly estimates of winds andSSTs over the Northeast Pacific and producing spatialcorrelation maps to investigate the overall scales of in-tegration. Upwelling in the central-northern CaliforniaCurrent is most intense during the months of May toJuly each year (Bograd et al. 2009), but we found win-tertime (November, January to March) proxies of up-
welling to be the most significant determinants ofseabird phenology. Upwelling in the California Cur-rent is the primary driver for primary and secondaryproductivity (Largier et al. 2006), so undoubtedly therelationships we have established are indirect, medi-ated by changes in prey resource availability. Herein,we compare the responses of these 2 species ofseabird, an obligate planktivore (auklet) and an omni-vore (murre), to winter environmental conditions, asindexed by surface winds (atmospheric forcing) andSSTs (oceanic response). We touch upon the specificsof prey resource availability later in this discussion. Toour knowledge, this is one of the first attempts at a spa-tio-temporal integration of climate-oceanographic and
217
Fig. 6. Ptychoramphus aleuticus and Uria aalge. Correlations between sea surface temperature (SST) and mean egg-laying dates for (a) auklets and (b) murres. SST data are monthly means for February, March, and the average of February and March

Mar Ecol Prog Ser 393: 211–223, 2009
phenological variables. Clearly such information iscritical to assessing the role of seabird phenology as anindicator of ecosystem dynamics, as has been recentlyproposed (Sydeman et al. 2008).
Ecosystem pre-conditioning
Previous studies have found relationships betweenwintertime oceanographic conditions and seabird ecol-ogy in the region (Abraham & Sydeman 2004, Miller &Sydeman 2004), but the temporal pattern of ecosystem‘pre-conditioning’ revealed by the present study isconsiderably earlier than expected. The cumulativeeffect of meridional winds on the mean egg-layingdates for both species was strongest in winter (Januaryand February). The spatial correlation maps revealedthe strongest correlations to the north and southwest ofthe Farallones, presumably reflective of atmosphericforcing conducive to upwelling (Fig. 3). From anornithological perspective, auklets and murres canproduce eggs within ~10 to 15 d after fertilization(Astheimer 1986). The fast egg production and thespring timing of the average egg-laying (29 March to 7May for auklets and 6 to 22 May for murres; Fig. 2a;Appendix 1) would suggest March/April environmen-
218
Fig. 7. Ptychoramphus aleuticus. Correlations between seasurface temperature (SST) and variances of egg-laying dates
for auklets. SST data are monthly means for February
Fig. 8. Ptychoramphus aleuticus. Anomalies of January-February winds and February-March sea surface temperatures (SSTs) for(a) the 4 years of the earliest auklet egg-laying means and (b) mean of the 4 years of latest auklet egg-laying means. For clarity,
arrows are plotted every 2.5°

Schroeder et al.: Seabird winter pre-conditioning
tal signals being the most influential to the timing ofbreeding. However, from an ecosystem and food webdevelopment perspective, the winter relationshipsmake sense. In the Point Arena region, upwelling isstrongly intermittent in winter (Bograd et al. 2009).However, it is this intermittent upwelling that appearsmost significant to the timing of seabird egg-laying.
We hypothesize that intermittent upwelling in win-ter stimulates and fuels food web development, whichultimately affects seabird body condition and egg-lay-ing dates. Estimates of the timing between upwellingand primary and secondary productivity are impor-tant in this regard. In the California Current systemnear Bodega Bay, upwelling followed by a relaxationof 3 to 7 d is most favorable for phytoplankton blooms(primary productivity; Wilkerson et al. 2006). For sec-ondary production, the results are highly speciesdependent and also variable by year. Timing of sea-bird breeding is known to be influenced by the nutri-tional status of egg-laying females (Perrins 1970). Far-allon auklets feed mostly on euphausiid crustaceans(‘krill’). Coastal communities of Euphausia pacificawere comprised only of larval forms in January (Dor-man et al. 2005). Our results show that upwelling dur-ing January and February is important to egg-layingof auklets and murres; therefore, it may be significantfor the growth of krill as well. The prey of murres dur-ing the breeding season consists mainly of pacifichake, northern anchovy, and juvenile rockfish (Millset al. 2007, Roth et al. 2008). Pacific hake spawn fromJanuary through March offshore of southern Califor-nia, and juveniles and adults migrate northward tocentral California in the spring (Ressler et al. 2007,Agostini et al. 2008). Northern anchovy spawn yearround, but late winter and early spring are peakspawning times (Parrish et al. 1986). Also, Januarythrough March is a very active period of fertilization/parturition for some species of rockfish in the Califor-nia Current (Eschevarria & Lenarz 1984). Reed et al.(2009) used estimates of juvenile rockfish to show arelationship with murre phenology, although the for-age fish data were obtained in May to June, after theegg-laying period of murres. Unfortunately, we lackdata on the seasonal variation in food web compo-nents to estimate all the time lags involved. However,other studies on Farallon seabird phenology (Abra-ham & Sydeman 2004, Reed et al. 2009, Wolf et al.2009) and seabird phenology elsewhere in the world(Frederiksen et al. 2004, Barbraud & Weimerskirch2006, Reed et al. 2006, Byrd et al. 2008) have inferred,rather than demonstrated, that environmental rela-tionships are due to variation in prey resources. Inshort, it seems that wintertime upwelling ‘pre-condi-tions’ the system and is important to the growth anddevelopment of many prey species that are likely
related to the foraging success, body condition, andtiming of breeding for these seabirds.
The seasonal cycle of water column structure in theCalifornia Current affects the biological utility ofcoastal upwelling. Surface stratification of the oceanoff central-northern California is weakest in winter(Pennington & Chavez 2000, Palacios et al. 2004) andcalculation of Brunt-Väisälä frequencies showed thelowest values in January-February at the M2 mooringlocated near Monterey Bay (data not shown). Thus theupwelling of nutrient-rich water in winter could occurwith winds that are weaker or of shorter duration thanthe winds that would be required for significant nutri-ent-favorable upwelling later in the season. Thusanomalous (i.e. early) winter upwelling, even of weakmagnitude or short duration, could seed the regionwith sufficient nutrients to enhance productivity andprey availability. This ‘pre-conditioning’ of the systemwould allow for a healthier adult breeding population,hence an earlier start to the breeding season.
To further illustrate these results, we have summa-rized wind patterns and SST for the 4 earliest (1989,2002, 1999, 2001) and 4 latest (1995, 1996, 1998, 1992)years for auklet egg-laying (Fig. 2a). January-Febru-ary meridional winds and February-March SSTs forthese early/late years were averaged and then sub-tracted from the climatological means to form anomalymaps representing conditions that are favorable orunfavorable for early egg-laying. The anomalouswind patterns for the early egg-laying years corre-spond to an anomalously strong Subtropical High pres-sure system, resulting in anticyclonic wind anomaliesand stronger coastal upwelling. The correspondingFebruary-March SST anomalies over the region arecooler than the climatology by up to 1.5°C (Fig. 8a). Incontrast, the January-February anomaly winds for the4 latest years of auklet egg-laying show stronglydownwelling favorable conditions along the entirecoast, and February-March SST anomalies warmer byup to 1.5°C (Fig. 8b).
Within-season patterns: variance
Measures of central tendency (mean and/or median)and variance structures are often correlated as they arehere (to some extent), but variance as a parameter pro-vides a novel view of phenology. From a breeding suc-cess perspective, greater variance for auklets does notnecessarily lead to better reproduction, but less vari-ance for murres results in better reproductive output.We found that November winds of the previous yearwere related to murre variance in egg-laying dates, butwe found no relationships for auklets. We do not under-stand why this difference exists between the species,
219

Mar Ecol Prog Ser 393: 211–223, 2009
although we assume November winds only have aneffect on the prey of murres. Moreover, we found thatmurre and auklet variances were positively correlatedbefore 1990 and negatively correlated thereafter. Asnoted in the ‘Results’, we surmise that greater variancefor auklets and less variance for murres is a positive re-sponse to favorable environmental conditions, whichmeans that it is the positive correlation between aukletand murre variance prior to 1990 that requires explana-tion. While we do not fully understand this relationship,before 1990 murre egg-laying dates advanced signifi-cantly (Sydeman 1999, Reed et al. 2009), and perhapsthis change in overall breeding date was related to achange in the variance structure of the data. For auk-lets, the number of years with high variances (>150)only occurred after 1989, whereas there is no such shiftto higher variances for the murres (Fig. 2b).
To illustrate the relationship between murre vari-ance in egg-laying and environmental conditions, weapplied the same process of looking at the average ofthe anomalous winds and SSTs for the 4 yr of smallestand largest variances. The 4 yr with the lowest vari-ances are 1999, 2004, 1995, and 1994; the 4 yr withthe highest variances are 2003, 1998, 1992, and 1989(Fig. 2b). The wind and SST patterns associated withthe largest/smallest variance years are very similar tothose for the earliest/latest auklet egg-laying years(Fig. 8); because of the similarity the figure is notshown. Years with the smallest variances have anticy-clonic November wind anomalies. The wind magni-tudes are very large north of 45° N, with anomaliesexceeding 4 m s–1 and directed from the northwest.The SST anomalies are cooler than the climatologicalmean over most of the region, with values between–0.5 to –1°C in the areas adjacent and to the north ofthe Farallones. The conditions for the highest vari-ances are cyclonic wind anomalies; the SST anomaliesover most of the region are warmer than the climatol-ogy. December SST anomalies of over 1.5°C arelocated just north of 45° N, with upwelling conditionsaround the Farallones with wind magnitudes ~1 m s–1
and SST anomalies of ~0.5°C.
Seabird phenology as an ecosystem indicator
Seabird phenology appears to be reflective of pro-cesses that determine ecosystem dynamics 3 to 5 moprior to egg-laying for these species. Further refine-ments in understanding the mechanisms of theresponse are necessary, but we have a reasonableoperational hypothesis, and have calibrated some ofthe functional relationships. Therefore, it seems appro-priate to suggest seabird phenology as an indicator ofwintertime ecosystem dynamics. Unlike for fish and
other species in the system, the breeding timing ofseabirds is relatively easy and inexpensive to measure.Indeed, it is hard to envision other taxa that could pro-vide phenological indices of ecosystem dynamics earlyin each year. These indices could be extremely impor-tant in assessing ecosystem ‘health’ and resilience, andcould be useful in a predictive context (Sydeman et al.2008). Seabird phenology could provide a biological‘spring transition’ index, which may be more meaning-ful to other biological organisms than a physicallybased index, such as changes in SST or sea level. Cou-pling both physical and biological indices of timingmay be particularly useful for understanding ecosys-tem productivity.
CONCLUSIONS
Based on this investigation, we conclude that winter-time conditions are important determinants of ecosys-tem dynamics in the California Current and that futureecosystem studies should focus on physical forcingprior to the ‘spring transition.’ In some cases, the‘spring transition’ may have been over-emphasized,when it is actually atmospheric–oceanographic inter-actions before the transition can be observed that aremost significant to ecosystem productivity. The wide-spread correlations of winds and SST in January andFebruary, and as early as November in the precedingyear, support the notion that wintertime ‘pre-condi-tioning’ of the system is important. We have suggestedthat winds during periods of weak stratification may bemechanistically related to effectual upwelling in thesystem during winter, but this is certainly an area forfuture research.
Acknowledgements. This paper was first presented at theTopic Session on ‘Phenology and climate change in the NorthPacific: Implications of variability in the timing of zooplanktonproduction to fish, seabirds, marine mammals and fisheries(humans)’ on 2 November 2007 at the 16th Annual Meeting ofPICES in Victoria, Canada. Data collected and maintained byPRBO in collaboration with the USFWS are available; forupdated information contact J. Jahncke ([email protected])and/or R. Bradley ([email protected]). We thank PRBO andUSFWS for data contributions to this project. The wind datawere acquired from NOAA’s National Climatic Data Center,via their website www.ncdc.noaa.gov/oa/rsad/blendedsea-winds.html. The SST Pathfinder version 5.0 SST data set wasproduced by NOAA | NESDIS | NODC and the University ofMiami. Funding for this analysis and write-up was providedby NOAA’s Fisheries and the Environment (FATE) programand the California Ocean Protection Council and CaliforniaSea Grant under grant R/OPCENV-07 entitled ‘Tackling Cli-mate Change and Ecological Complexity: Matches and Mis-matches in the Seasonal Cycle of California’s Marine Floraand Fauna’. This is Farallon Institute contribution no. 002, andcontribution no. 2467 of the Bodega Marine Laboratory.
220

Schroeder et al.: Seabird winter pre-conditioning
LITERATURE CITED
Abraham CL, Sydeman WJ (2004) Ocean climate, euphausi-ids and auklet nesting: inter-annual trends and variationin phenology, diet and growth of a planktivorous seabird,Ptychoramphus aleuticus. Mar Ecol Prog Ser 274:235–250
Abraham CL, Sydeman WJ (2006) Prey-switching by Cassin’sauklet Ptychoramphus aleuticus reveals seasonal climate-related cycles of Euphausia pacifica and Thysanoessaspinifera. Mar Ecol Prog Ser 313:271–283
Agostini V, Hendrix A, Hollowed A, Wilson C, Pierce S, Fran-cis R (2008) Climate-ocean variability and Pacific hake: ageostatistical modeling approach. J Mar Syst 71:237–248
Ainley DG, Boekelheide RJ (1990) Seabirds of the FarallonIslands. Stanford University Press, Palo Alto, CA
Ainley D, Spear L, Allen S (1996) Variation in the diet ofCassin’s auklet reveals spatial, seasonal, and decadaloccurrence patterns of euphausiids off California, USA.Mar Ecol Prog Ser 137:1–10
Astheimer LB (1986) Egg formation in Cassin’s Auklet. Auk103:682–693
Barbraud C, Weimerskirch H (2006) Antarctic birds breedlater in response to climate change. Proc Natl Acad SciUSA 103:6248–6251
Beebee TJC (1995) Amphibian breeding and climate. Nature374:219–220
Bertram D, Mackas DL, McKinnell S (2001) The seasonalcycle revisited; interannual variation and ecosystem con-sequences. Prog Oceanogr 49:283–307
Birkhead T (1977) The effect of habitat and density on breedingsuccess in the common guillemot. J Anim Ecol 46:751–764
Bograd S, Schroeder I, Sarkar N, Qiu X, Sydeman WJ,Schwing F (2009) Phenology of coastal upwelling in theCalifornia Current. Geophys Res Lett 36:L01602, doi:10.1029/2008GL035933
Byrd GV, Sydeman WJ, Renner HM, Minobe S (2008)Responses of piscivorous seabirds at the Pribilof Islands toocean climate. Deep-Sea Res II 55:1856–1867
Cairns DK (1987) Seabirds as indicators of marine food sup-plies. Biol Oceanogr 5:261–271
Dorman JG, Bollens SM, Slaughter AM (2005) Populationbiology of euphausiids off northern California and effectsof short time-scale wind events on Euphausia pacifica.Mar Ecol Prog Ser 288:183–198
Durant JM, Anker-Nilssen T, Hjermann DO, Stenseth NC(2004) Regime shifts in the breeding of an Atlantic puffinpopulation. Ecol Lett 7:388–394
Eschevarria T, Lenarz W (1984) Conversions between total,fork and standard lengths in 35 species of Sebastes fromCalifornia. Fish Bull (Wash DC) 82:249–251
Forchhammer MC, Post E, Strenseth NC (1998) Breedingphenology and climate? Nature 391:29–30
Frederiksen M, Wanless S, Harris MP, Rothery P, Wilson LJ(2004) The role of industrial fisheries and oceanographicchange in the decline of North Sea black-legged kitti-wakes. J Appl Ecol 41:1129–1139
Hickey BM (1998) Coastal oceanography of western NorthAmerica from the tip of Baja California to VancouverIsland, Vol 11. Wiley and Sons, New York
Huyer A (1983) Coastal upwelling in the California CurrentSystem. Prog Oceanogr 12:259–284
IPCC (Intergovernmental Panel on Climate Change) (2007)Climate change 2007: the physical science basis. In:Solomon S, Qin D, Manning M, Chen Z and others (eds)Contribution of Working Group I to the Fourth Assess-ment, IPCC, Cambridge University Press, Cambridge andNew York, NY
Kendall M, Gibbons JD (1990) Rank correlation methods.Edward Arnold, New York
Kilpatrick KA, Podesta GP, Evans G (2001) Overview of theNOAA/NASA advanced very high resolution radiometerPathfinder algorithm for sea surface temperature and asso-ciated matchup database. J Geophys Res 106:9179–9197
Largier JL, Lawrence CA, Roughan M, Kaplan DM and others(2006) WEST: A northern California study of the role ofwind-driven transport in the productivity of coastal plank-ton communities. Deep-Sea Res II 53:2833–2849
Mackas DL, Thomson RE, Galbraith M (2001) Changes in thezooplankton community of the British Columbia continen-tal margin, 1985–1999, and their covariation with oceano-graphic conditions. Can J Fish Aquat Sci 58:685–702
Manuwal DA (1974) The natural history of Cassin’s Auklet(Ptychoramphus aleuticus). Condor 76:421–431
Miller AK, Sydeman WJ (2004) Rockfish response to low-fre-quency ocean climate change as revealed by the diet of amarine bird over multiple time scales. Mar Ecol Prog Ser281:207–216
Mills KL, Laidig T, Ralston S, Sydeman WJ (2007) Diets of toppredators indicate pelagic juvenile rockfish (Sebastesspp.) abundance in the California Current System. FishOceanogr 16:273–283
Palacios D, Bograd S, Mendelssohn R, Schwing FB (2004)Long-term and seasonal trends in stratification in the Cal-ifornia Current, 1950–1993. J Geophys Res 109:C10016,doi:10.1029/2004JC002380
Parmesan C (2006) Ecological and evolutionary responsesto recent climate change. Annu Rev Ecol Evol Syst 37:637–669
Parmesan C, Yohe G (2003) A globally coherent fingerprint ofclimate change impacts across natural systems. Nature421:37–42
Parrish RH, Mallicoate D, Klingbeil R (1986) Age dependentfecundity, number of spawnings per year, sex ratio, andmaturation stages in northern anchovy, Engraulis mordax.Fish Bull (Wash DC) 84:503–517
Pennington JT, Chavez FP (2000) Seasonal fluctuations oftemperature, salinity, nitrate, chlorophyll and primaryproduction at station H3/M1 over 1989-1996 in MontereyBay, California. Deep-Sea Res II 47:947–973
Perrins CM (1970) The timing of birds’ breeding seasons. Ibis112:242–255
Reed TE, Wanless S, Harris MP, Frederiksen M, Kruuk LEB,Cunningham EJA (2006) Responding to environmentalchange: plastic responses vary little in a synchronousbreeder. Proc R Soc Lond B Biol Sci 273:2713–2719
Reed TE, Warzybok P, Wilson AJ, Bradley RW, Wanless S,Sydeman WJ (2009) Timing is everything: flexible phenol-ogy and shifting selection in a colonial seabird. J AnimEcol 78:376–387
Ressler PH, Holmes JA, Fleischer GW, Thomas RE, Cooke KC(2007) Pacific hake, Merluccius productus, autecology: atimely review. Mar Fish Rev 69:1–24
Richardson AJ, Poloczanska ES (2008) Ocean science: under-resourced, under threat. Science 320:1294–1295
Root TL, Price JT, Hall KR, Schneider SH, Rosenzweig C,Pounds JA (2003) Fingerprints of global warming on wildanimals and plants. Nature 421:57–60
Roth J, Nur N, Warzybok P, Sydeman WJ (2008) Annual preyconsumption of a dominant seabird, the common murre,in the California Current system. ICES J Mar Sci 65:1046–1056
Schwing FB, Murphree T, Green PM (2002) The NorthernOscillation Index (NOI): a new climate index for the north-east Pacific. Prog Oceanogr 53:115–139
221

Mar Ecol Prog Ser 393: 211–223, 2009
Stenseth NC, Mysterud A (2002) Climate, changing phenol-ogy, and other life history traits: nonlinearity and match-mismatch to the environment. Proc Natl Acad Sci USA 99:13379–13381
Stenseth NC, Mysterud A, Ottersen G, Hurrell JW, Chan KS,Lima M (2002) Ecological effects of climate fluctuations.Science 297:1292–1296
Sydeman WJ (1999) Climate change and the population biol-ogy of common murres and other seabirds of the Califor-nia Current marine ecosystem. PhD thesis, University ofCalifornia, Davis, CA
Sydeman WJ, Penniman JF, Penniman TM, Pyle P, Ainley DG(1991) Breeding performance in the western gull: effectsof parental age, timing of breeding and year in relation tofood availability. J Anim Ecol 60:135–149
Sydeman WJ, Hester MM, Thayer JA, Gress F, Martin P,Buffa J (2001) Climate change, reproductive performanceand diet composition of marine birds in the southern Cali-fornia Current system, 1969-1997. Prog Oceanogr 49:309–329
Sydeman WJ, Bradley RW, Warzybok P, Abraham CL andothers (2006) Planktivorous auklet Ptychoramphus aleuti-cus responses to ocean climate, 2005: unusual atmosphericblocking? Geophys Res Lett 33:L22S09, doi:10.1029/2006GL026736
Sydeman WJ, Abraham CL, Vernon Byrd G (2008) Seabird-sockeye salmon co-variation in the eastern Bering Sea:phenology as an ecosystem indicator and salmonid predic-tor? Deep-Sea Res II 55:1877–1882
Trenberth KE (2001) Climate variability and global warming.Science 293:48–49
Wells B, Field J, Thayer J, Grimes C and others (2008) Untan-gling the relationships among climate, prey and toppredators in an ocean ecosystem. Mar Ecol Prog Ser 364:15–29
Wilkerson FP, Lassiter AM, Dugdale RC, Marchi A, Hogue VE(2006) The phytoplankton bloom response to wind eventsand upwelled nutrients during the CoOP WEST study.Deep-Sea Res II 53:3023–3048
Wolf S, Sydeman WJ, Hipfner J, Abraham CL, Tershy B, CrollD (2009) Rangewide reproductive consequences of oceanclimate variability for the seabird, Cassin’s Auklet. Ecol-ogy 90(3):742–753
Yen PPW, Sydeman WJ, Morgan KH, Whitney FA (2005) Toppredator distribution and abundance across the easternGulf of Alaska: temporal variability and ocean habitat asso-ciations. Deep-Sea Res II 52:799–822
Zhang HM, Bates JJ, Reynolds RW (2006) Assessment of com-posite global sampling: sea surface wind speed. GeophysRes Lett 33:L17714, doi:10.1029/2006GL027086
222
Year Mean Median N Max Min SD Variance
Cassin’s auklet1972 100.38 97.5 64 135 75 12.12 147.121973 98.13 96 62 124 90 7.29 53.221974 86.78 85 65 122 69 9.33 87.141975 94.69 91 70 131 77 11.91 141.891976 89.75 90 73 122 78 7.23 52.321977 105.35 105 71 133 93 7.28 53.111978 113.87 112 77 143 103 7.60 57.821979 90.59 90 75 112 78 5.53 30.621980 113.12 114 77 128 101 5.05 25.571981 98.94 99 80 120 88 7.67 58.861982 97.41 95 80 130 71 10.54 111.181983 152.35 155 37 162 148 3.81 14.561984 102.00 102 77 127 87 8.39 70.391985 94.46 91 78 146 81 11.90 141.751986 108.38 106 42 141 96 7.17 51.501987 98.43 96 39 121 86 7.24 52.461988 87.06 85 17 95 80 3.56 12.681989 82.83 81 41 131 66 14.60 213.441990 97.50 96 40 121 81 8.33 69.481991 99.03 96 40 146 81 15.73 247.561992 164.65 167 17 172 157 3.58 12.861993 124.38 121 37 161 116 10.00 100.071994 107.22 101 37 146 96 11.80 139.451995 126.97 126 31 161 121 8.50 72.361996 132.42 132 36 157 117 8.22 67.671997 99.59 96 39 146 86 12.61 159.141998 157.67 156 15 166 151 4.49 20.231999 91.63 86 32 121 71 13.18 173.792000 101.18 98 33 123 93 6.59 43.46
Appendix 1. Ptychoramphus aleuticus and Uria aalge. Summary statistics calculated and used for analysis of Cassin’s auklet and common murre egg-laying dates

Schroeder et al.: Seabird winter pre-conditioning 223
Year Mean Median N Max Min SD Variance
2001 96.88 91 40 151 76 15.72 247.292002 83.50 81 36 106 71 8.49 72.142003 101.53 101 38 126 91 6.75 45.662004 107.36 104.5 42 142 97 8.51 72.432005 124.08 126 13 126 121 2.53 6.412006 106.16 106 32 111 101 2.97 8.84
Common murre1972 142.56 140 98 187 127 10.75 115.631973 141.00 139 130 161 130 7.45 55.591974 138.32 137 139 158 128 6.45 41.651975 138.17 136 137 162 130 6.55 42.991976 137.04 135 164 168 126 7.47 55.941977 137.69 137 108 160 126 7.42 55.071978 144.90 144 114 162 136 4.29 18.421979 129.20 130 135 161 116 5.47 29.991980 134.60 134 138 152 126 4.97 24.781981 128.55 128 135 160 117 6.25 39.171982 133.82 134 70 156 125 5.94 35.361983 161.08 162 45 181 143 8.70 75.761984 134.69 132 128 184 121 10.79 116.471985 129.27 128 110 166 118 7.62 58.141986 135.63 135 111 160 127 5.74 33.011987 130.17 130 114 156 118 5.06 25.661988 119.86 119 119 158 107 6.24 38.981989 123.01 121 126 162 107 9.35 87.421990 123.19 122 135 158 108 7.92 62.761991 126.65 126 125 146 110 4.60 21.221992 149.34 146 93 182 133 9.33 87.141993 130.53 128 112 169 119 8.31 69.091994 125.37 125 133 151 110 6.28 39.551995 134.04 134 142 162 123 6.03 36.471996 130.92 128 150 167 120 8.34 69.711997 125.96 125 143 157 115 6.62 43.831998 142.53 141 101 167 122 9.07 82.311999 126.17 125 102 164 114 8.54 73.072000 130.89 130 105 156 118 8.67 75.242001 127.16 127 130 157 113 6.37 40.642002 123.86 123 136 157 111 7.88 62.132003 130.84 128 147 164 116 8.92 79.652004 130.26 130 150 151 115 5.49 30.192005 143.94 144 168 177 131 6.48 42.012006 138.38 137 189 171 124 7.33 53.77
Appendix 1 (continued)
Submitted: February 13, 2009; Accepted: May 11, 2009 Proofs received from author(s): July 24, 2009


