Embed Size (px)
Citation preview

This article appeared in a journal published by Elsevier. The attachedcopy is furnished to the author for internal non-commercial researchand education use, including for instruction at the authors institution
and sharing with colleagues.
Other uses, including reproduction and distribution, or selling orlicensing copies, or posting to personal, institutional or third party
websites are prohibited.
In most cases authors are permitted to post their version of thearticle (e.g. in Word or Tex form) to their personal website orinstitutional repository. Authors requiring further information
regarding Elsevier’s archiving and manuscript policies areencouraged to visit:
http://www.elsevier.com/authorsrights

Author's personal copy
Windy Ridge: A neighborhood built to fail
Janni Sorensen a,1, Jose Gamez b,2, Melissa Currie c,*
a The Charlotte Action Research Project (CHARP), University of North Carolina at Charlotte, McEniry 423, 9201 University City Blvd, Charlotte,NC 28223-0001, USAbDesignþSociety Research Center, University of North Carolina at Charlotte, Center City Building 1003, 9201 University City Blvd, Charlotte,NC 28223-0001, USAcDepartment of Geography and Earth Sciences, University of North Carolina at Charlotte, Colvard 1057 B, 9201 University City Blvd, Charlotte,NC 28223-0001, USA
Keywords:CharlotteGrowth-machineHousingForeclosurePlanningMixed-methods
a b s t r a c t
This paper presents lessons learned from the development process of Windy Ridge, a subdivision inCharlotte, North Carolina, that drew national media attention as a community destined to be “The NextSlum” (Atlantic Monthly 2008). The development was aided by a city as growth machine environmentthat failed this and other neighborhoods through the lapse of proper planning oversight. Rather thanlaying the blame of high foreclosures at the feet of financial institutions that engaged in high-risk andpredatory lending practices, or homeowners who bought more home than they could afford, this paperlooks deeper to address both the social and physical decay of the neighborhood. Using a mixed-methodsresearch approach, we uncovered a variety of contributing and enabling factors that led to high fore-closure rates, rapid neighborhood decline, and disparate impacts on low-income populations. Weexamine public policy, civic culture, development and land-use regulations, and homeownership pat-terns through Windy Ridge’s political, spatial and economic geography. Because homes in Windy Ridgewere marketed to investors and in package deals, the neighborhood was highly vulnerable to financialcollapse as the Great Recession of the 2000s set in. This case study provides important implications forplanning and land development policy.
� 2014 Elsevier Ltd. All rights reserved.
Introduction
This paper explores the many factors surrounding the devel-opment of Windy Ridge, a single-family subdivision in Charlotte,North Carolina (see Fig. 1). Our examination revealed vulnerabil-ities that led us to conclude that it is a “neighborhood built to fail.”Windy Ridge, built between the years 2002 and 2004, enjoyed anauspicious beginning. And yet it was described in a March 2008Atlantic Monthly article as representative of “The Next Slum”
(Leinberger, 2010). A year later, Fast Company described WindyRidge as a soon-to-be ghost town, foreshadowing the potential“end of suburbia” (Cannell, 2009). How did a newly built commu-nity engender such foreboding descriptions? Using Windy Ridge asa case study, the process involved in land development is docu-mented and we reflect on the resulting neighborhood and its
surrounding environment. We also consider what various parties inthe community have contributed to cause the situation that existstoday. Further, by placing the development in the context of urbanplanning theory, we question some of the underlying values andassumptions that led to its problems. Thework presented here is, inpart, a way of reinforcing the roles of urban planners and designersas upholders of the public good, badly needed in a landscapewhereplanning intervention in the free market is often loose, at best.
When a community experiences high rates of foreclosure andblame is assigned, fingers typically point in one of two directions:to the financial institutions that engaged in high-risk and predatorylending practices; or to the homeowners themselves who areblamed for buying more home than they could afford. In contrast,we contend that a broader context must be evaluated in order tounderstand what led to the foreclosure crisis impacting starterhome communities e including public policy, civic culture, devel-opment and land-use regulations. In the following sections, wepresent the data and highlight emergent themes in our case studyanalysis. These themes include the political, economic, and spatialgeographies of Windy Ridge as revealed through the subdivisionapproval process, the built environment and geography of
* Corresponding author. Tel.: þ1 704-687-2442.E-mail addresses: [email protected] (J. Sorensen), [email protected]
(J. Gamez), [email protected] (M. Currie).1 Tel.: þ1 704 380 1838.2 Tel.: þ1 704 687 0117.
Contents lists available at ScienceDirect
Applied Geography
journal homepage: www.elsevier .com/locate/apgeog
http://dx.doi.org/10.1016/j.apgeog.2014.03.0050143-6228/� 2014 Elsevier Ltd. All rights reserved.
Applied Geography 51 (2014) 8e25
Author's personal copy
concentrated poverty in a suburban setting, the power and devel-opment culture in Charlotte, and a discussion of wicked planningproblems (Rittel & Webber, 1973) that arose as we attempted toassist Windy Ridge residents in addressing neighborhoodchallenges.
The city as growth machine: the political geography of Windy Ridge
Charlotte is among those cities in the Southeast hardest hit bythe foreclosure crisis and the Great Recession that began in themid- to late-2000s. Prior to the downturn, a thriving economy andcomfortable climate contributed to the city’s rapid growth andsuburbanization. In 1980, Charlotte’s population was 315,470; by2010, it had more than doubled to 756,912. Over the same timeperiod, the metropolitan statistical area grew from a population of855,538 to 1,759,531. This rapid growth propelled Charlotte tonational prominence as a financial powerhouse while contributingto a physical landscape characterized by sprawling, single-familysubdivisions on an increasingly wide suburban footprint. Char-lotte’s population increases plus suburban expansion were seen asa formula for success, and local planning policies in the 1980sseemed to have framed all growth as positive. In her January 7th,2011 editorial, Mary Newsom, then associate editor of The CharlotteObserver, described what seemed to be taken as a fundamental lawof economics in Charlotte e growth as good e so much so, thatzoning reviews for residential development were deemedunnecessary:
The city’s growth policies don’t require most subdivisions to getrezonings, just to meet the subdivision ordinance. That die wascast 30 years back, in the 1980s, when all undeveloped land inCharlotte and unincorporated Mecklenburg County was zoned
for single-family subdivisions, no rezoning needed, growth onautopilot (Newsom 2011).
Newsom’s observation brings to light how the planning anddevelopment process in Charlotte had been situated in a cultural andpolitical environment supportive of the private sector, and one thatseemingly embraced growth at all costs. In this context, Charlottecan be viewed as a “growth machine” following Molotch’s (1976)classic description of the various powerful interests that shapemunicipalities.Molotchmakes the connection between the desire tofoster growth and the putting aside of political interests: “The desirefor growth provides the key operative motivation toward consensusfor members of politically mobilized elites, however split they maybe on other issues, and that a common interest in growth is theoverriding commonality among important people in a given locale,”(p. 310). Growth itself is not a bad thing; in fact, it is a signof a healthyorganism. Accommodating an increasing population is a basic issuein planning, determining the siting, size and shape of new urbandevelopment. Maturing communities often experience revitaliza-tion brought on by newpopulations, while in other areas populationmay decrease, thus leaving underused infrastructure behind.
In its coverage of Charlotte’s hosting of the 2012 DemocraticNational Convention, The Atlantic Cities chronicled the dramaticchanges that had taken place in the city over the previous 20 years(Francis, 2012). The creation of Uptown Charlotte produced theBank of America Stadium, new professional football and basketballteams, a new light rail system, gleaming new towers for Bank ofAmerica’s Corporate Center, Duke Energy Center, Wachovia Bank’scorporate headquarters, art museums, plus the expansion of theCharlotte Douglas International Airport including a new hub for USAirways; all were added within the previous two decades. Much of
Fig. 1. Windy Ridge Vicinity Map. The subdivision is located in Northwest Charlotte, within Mecklenburg County.
J. Sorensen et al. / Applied Geography 51 (2014) 8e25 9
Author's personal copy
the flurry of redevelopment was due to the efforts of Hugh McColl,former president of Bank of America. The highly ambitious McCollwas driven to build a banking empire in Charlotte, and he had thevision and the resources to make things happen. McColl under-stood the difficulties of attracting top banking talent from metro-politan cities like London, New York or San Francisco. In order toachieve his lofty goals, McColl set about recreating Charlotte as amodern city able to compete on the scale to which these executiveswere accustomed. The city reaped the benefits as well, and Char-lotte flourished with new businesses, civic structures, improvedinfrastructure, and arts/entertainment venues. These improve-ments were accomplished through incentivized mortgages, sig-nificant infrastructure upgrades in Uptown by utility companiesand the city, and favorable rezoning (Smith & Graves, 2003). Thelarge-scale and coordinated revitalization was concentrated in theUptown area and it’s new wealthy suburbs, with the outer suburbslargely left to the traditional homebuilding industry. AlthoughSmith and Graves argue that by focusing growth in Uptown andnearby revitalized areas Charlotte did not follow Molotch’s growthmachine model, the sprawl that proliferated throughout theensuing housing bubble growth seems to contradict this position.
As early as 2000, the city as growth machine mentality hadtranslated into Charlotte’s ranking as the 15th largest new homemarket in the nation (Lunan, 2003). Organizations positionedtogether to propel the city’s growth (and in particular new con-struction), spurred on by local actors that included investors, de-velopers, and a consumerist public. Charlotte’s growth machinewasaided by the full-speed-ahead zoning framework already in place,while overwhelmed planning departments tried to keep up withthe constant flow of new development proposals. Newsom’sobservation is also reflected in those of local civic officials at thetime of this growth surge. John Belk, Charlotte’s former mayor, wasknown to boast, “Charlotte is a man-made town.” Tom Flynn,former Director of the City of Charlotte’s Economic DevelopmentOffice, also declared, “the business of Charlotte is business,” (Bacot,2008, p. 403) and this business culture pervaded local civic culture.Thus, a pro-business governance model supported an environmentthat fostered growth with minimal regulation. In fact, thisgovernment-as-business ethos is/was, in part, responsible for localgovernmental cooperation with major corporate sectors, such asthe local residential development and finance communities. Char-lotte’s civic culture contributed to a “liberal growth” policy climate(Bacot, 2008, p. 403), and a “rational” decision-making, i.e. plan-ning, environment inwhich publiceprivate partnerships were seenas essential to the public good (p. 405). Therefore, growth was seenas good for business and, by extension, good for Charlotteans. Inline with its mantra, “Charlotte’s business is business” and corpo-rate norms, a premium was placed on efficiency and effectivenessin Charlotte (Bacot, 2008). Within this civic and cultural valuesystem, overt considerations of equity and sustainability wereseemingly absent from the equation.
Many relating factors must be analyzed if one is to understandthe broader context of planning and development. Technicalexpertise and efficiency, both hallmarks of rational planningmodels, often privilege professional culture and norms; and thepro-business ethos of the city enabled the values of the privatemarketplace to become embedded within the public sector. Inmany ways, this form of publiceprivate value system legitimizedstatus-quo power structures, thus rendering a “value neutral”rational planning model as imbalanced. One result of this imbal-ance, as pointed out by Flyvbjerg (1991), is that “the greater thepower, the less the rationality” (p. 2) e meaning that rationalitygets left behind as those in power lose sight of the very ones theyare meant to serve. Local government is typically concerned withthe growth of its economy, and economic development often takes
priority over social development. Brooks (2002) writes,“.planning, as practiced in capitalist societies, is fundamentally aninstrument for maintaining the stability of the system and thepower of the state.Planners work to protect the system, to pre-serve the domination of capital over labor” (p. 40).
In Charlotte, each actor in the planning process has a specializedtask and it is not clear that any one individual has the opportunityto survey the big picture. Municipal land use planners are separatefrom urban designers, who do not seem to have a role in the pro-cess. For example, in Charlotte separate planners coordinate therezoning and subdivision processes (see http://charmeck.org/city/charlotte/planning/) in entirely separate departments: the Plan-ning Department and the Department of Neighborhood Servicesand Economic Development. These and other civic departmentsparticipated in the city as growth machine during the boom years bywhat appears to be the rubber-stamping of development plans.Attention may have been paid to complying with ordinances, butthe process lacked consideration for the quality of life of those whowould live within hurriedly approved developments.
This situation can be a source of conflict for planners, however,governed by a duty to the “public interest, or good,” (Bollens, 2005;Brooks, 2002; Sandercock & Dovey, 2002). Indeed, the first over-arching principle listed to which planners aspire is, “Our OverallResponsibility to the Public” (AICP Code, 2009). The Windy Ridgestory illustrates what happens when planning is reduced to asimple checklist e held hostage to ordinances that produce sprawland fuel the growth machine. Jane Jacobs’ distinction betweendevelopment and growth e in which development involves differ-entiation, not just the act of getting biggere is particularly relevanthere (see Steigerwald, 2001). Growth is not always good for allcitizens of a community in equal measure. This is clear in the case ofWindy Ridge, but this neighborhood is not alone. Planning theoriststell us that an awareness of the values shaping our actions (our ownand those of the political framework within which we plan) iscritical for moving toward a planning model that is ethical andequitable (Brooks, 2002). Paul Davidoff, who introduced theconcept of advocacy planning, asserts that the urban plannercannot be value-neutral. The planner’s values must be madeexplicit in the process and the course of action taken should affirmthem. Accordingly, the planner is “an advocate for what is deemedproper” (Brooks, 2002, p. 109) and should approach land use de-cisions from the perspective of the public good.
Location and isolation e the spatial geography of Windy Ridge
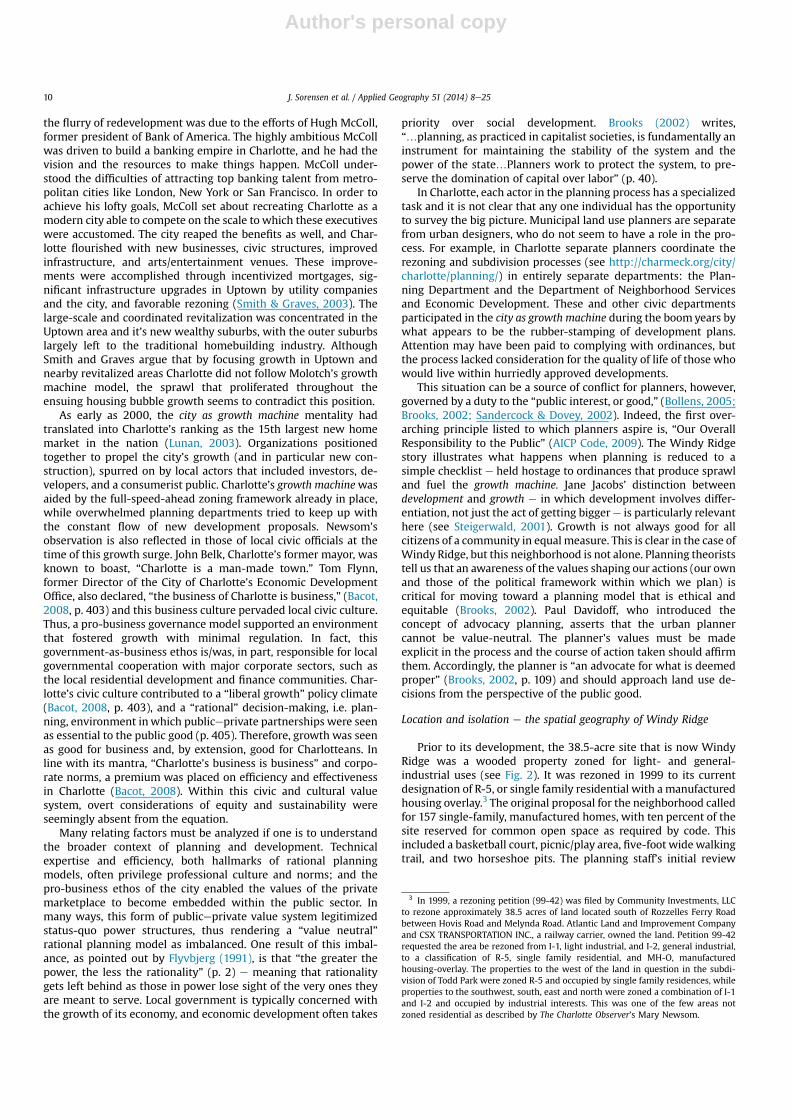
Prior to its development, the 38.5-acre site that is now WindyRidge was a wooded property zoned for light- and general-industrial uses (see Fig. 2). It was rezoned in 1999 to its currentdesignation of R-5, or single family residential with a manufacturedhousing overlay.3 The original proposal for the neighborhood calledfor 157 single-family, manufactured homes, with ten percent of thesite reserved for common open space as required by code. Thisincluded a basketball court, picnic/play area, five-foot widewalkingtrail, and two horseshoe pits. The planning staff’s initial review
3 In 1999, a rezoning petition (99-42) was filed by Community Investments, LLCto rezone approximately 38.5 acres of land located south of Rozzelles Ferry Roadbetween Hovis Road and Melynda Road. Atlantic Land and Improvement Companyand CSX TRANSPORTATION INC., a railway carrier, owned the land. Petition 99-42requested the area be rezoned from I-1, light industrial, and I-2, general industrial,to a classification of R-5, single family residential, and MH-O, manufacturedhousing-overlay. The properties to the west of the land in question in the subdi-vision of Todd Park were zoned R-5 and occupied by single family residences, whileproperties to the southwest, south, east and north were zoned a combination of I-1and I-2 and occupied by industrial interests. This was one of the few areas notzoned residential as described by The Charlotte Observer’s Mary Newsom.
J. Sorensen et al. / Applied Geography 51 (2014) 8e2510
Author's personal copy
concluded the proposed development was consistent with strategicarea plans in place at the time, and, therefore, was considered anappropriate use for the site.4 The only resistance to Windy Ridge’sdevelopment came from representatives of the nearby neighbor-hood Todd Park, who requested that the active recreation compo-nent be dropped from the common area. Residents expressedconcern that basketball courts and other recreational amenitieswould attract illegal and unwanted activities. This was not a typicalcase of NIMBYism,5 though, as Todd Park was/is a predominantlylow-income, minority neighborhood. It has been classified a“challenged” neighborhood by the City of Charlotte, defined as onesuffering from economic decline (City of Charlotte Quality of LifeStudy, 2008).
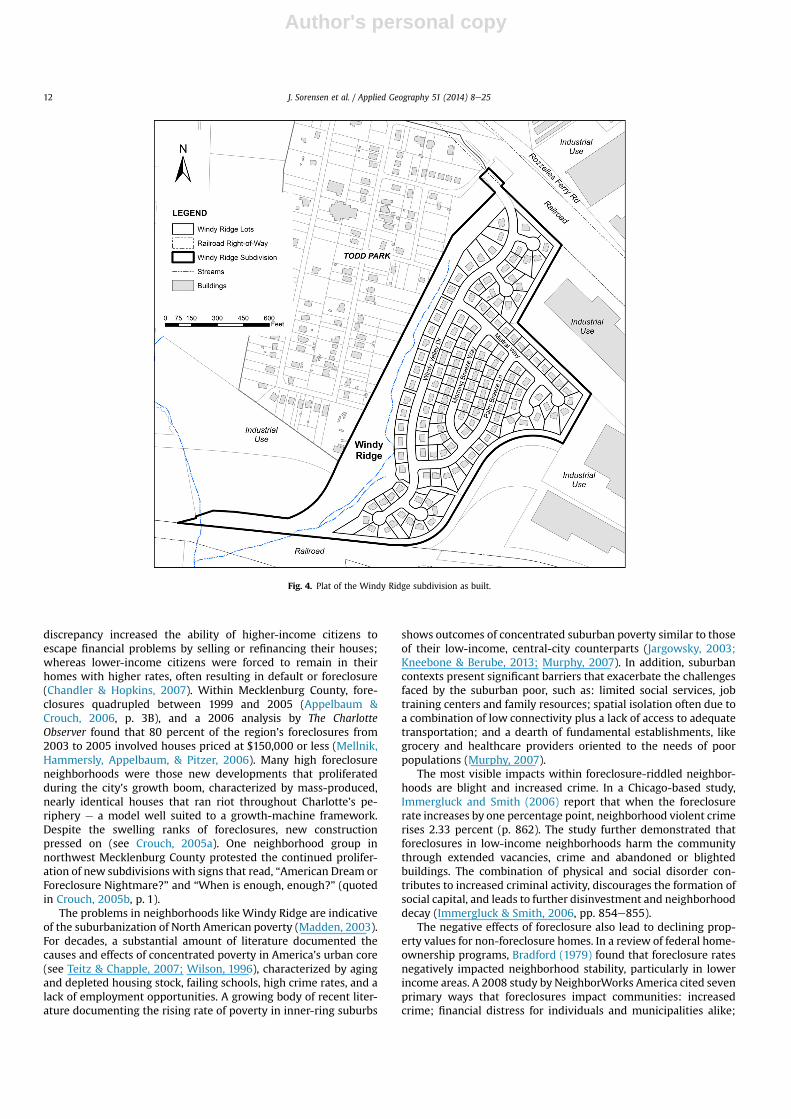
Subsequent to the public hearing, the Planning Commission’sZoning Committee approved the petition onMay 24,1999, with thefollowing modifications: the number of lots was reduced from 157to 151; the active recreation area was eliminated; and the commonopen space along the western property line was to remain undis-turbed. Despite the green light given by planning staff, the ZoningCommittee expressed concern that the type of development pro-posed inWindy Ridgewould likely become home to a large numberof children in need of active recreation. The committee, whichserves in an advisory capacity only, was hopeful that City Councilwould not approve the petition without restoring this componentof the plan. Additionally, one committee member recommendedthe incorporation of higher roof pitches so homes in the subdivisionwould not look like “trailers,” evidence of concern over theappearance of homes built for a low-income neighborhood. Therezoning was ultimately approved in 1999, and at this point, its fatewas sealed. Construction in Windy Ridge began in 2002 and wascompleted by 2004, with 133 single-family homes built (see Figs. 3
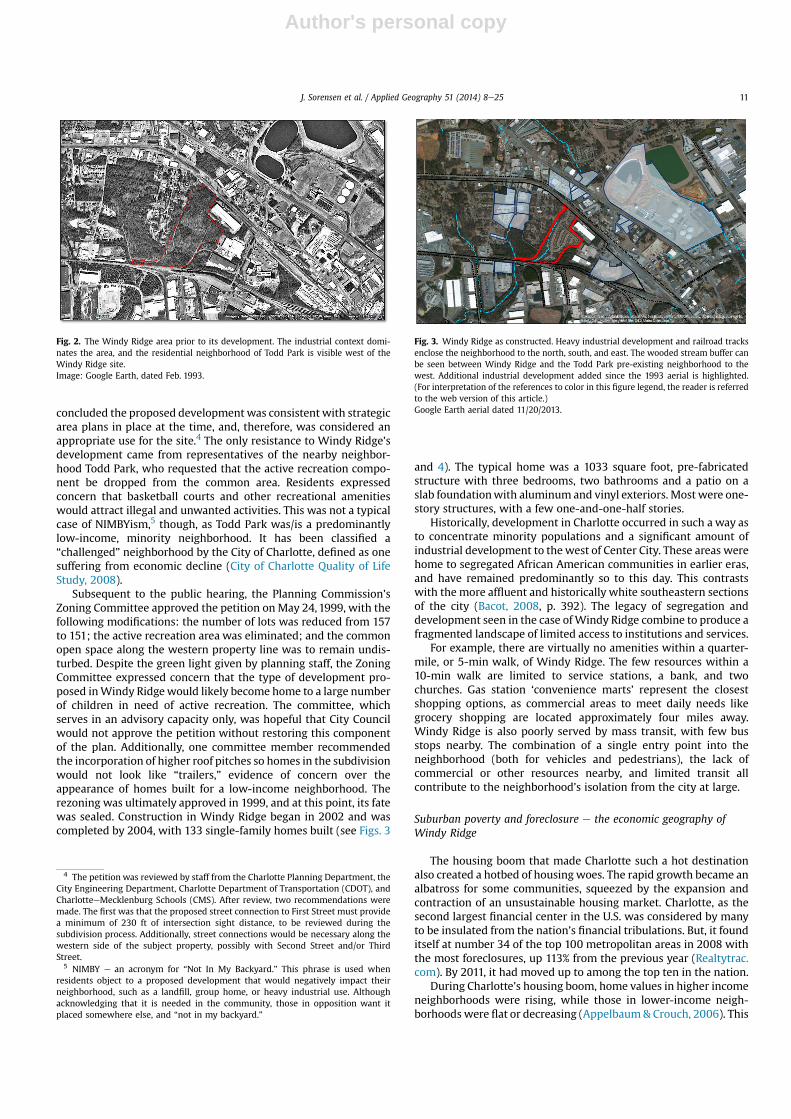
and 4). The typical home was a 1033 square foot, pre-fabricatedstructure with three bedrooms, two bathrooms and a patio on aslab foundationwith aluminum and vinyl exteriors. Most were one-story structures, with a few one-and-one-half stories.
Historically, development in Charlotte occurred in such a way asto concentrate minority populations and a significant amount ofindustrial development to the west of Center City. These areas werehome to segregated African American communities in earlier eras,and have remained predominantly so to this day. This contrastswith the more affluent and historically white southeastern sectionsof the city (Bacot, 2008, p. 392). The legacy of segregation anddevelopment seen in the case ofWindy Ridge combine to produce afragmented landscape of limited access to institutions and services.
For example, there are virtually no amenities within a quarter-mile, or 5-min walk, of Windy Ridge. The few resources within a10-min walk are limited to service stations, a bank, and twochurches. Gas station ‘convenience marts’ represent the closestshopping options, as commercial areas to meet daily needs likegrocery shopping are located approximately four miles away.Windy Ridge is also poorly served by mass transit, with few busstops nearby. The combination of a single entry point into theneighborhood (both for vehicles and pedestrians), the lack ofcommercial or other resources nearby, and limited transit allcontribute to the neighborhood’s isolation from the city at large.
Suburban poverty and foreclosure e the economic geography ofWindy Ridge
The housing boom that made Charlotte such a hot destinationalso created a hotbed of housing woes. The rapid growth became analbatross for some communities, squeezed by the expansion andcontraction of an unsustainable housing market. Charlotte, as thesecond largest financial center in the U.S. was considered by manyto be insulated from the nation’s financial tribulations. But, it founditself at number 34 of the top 100 metropolitan areas in 2008 withthe most foreclosures, up 113% from the previous year (Realtytrac.com). By 2011, it had moved up to among the top ten in the nation.
During Charlotte’s housing boom, home values in higher incomeneighborhoods were rising, while those in lower-income neigh-borhoods were flat or decreasing (Appelbaum& Crouch, 2006). This
Fig. 3. Windy Ridge as constructed. Heavy industrial development and railroad tracksenclose the neighborhood to the north, south, and east. The wooded stream buffer canbe seen between Windy Ridge and the Todd Park pre-existing neighborhood to thewest. Additional industrial development added since the 1993 aerial is highlighted.(For interpretation of the references to color in this figure legend, the reader is referredto the web version of this article.)Google Earth aerial dated 11/20/2013.
Fig. 2. The Windy Ridge area prior to its development. The industrial context domi-nates the area, and the residential neighborhood of Todd Park is visible west of theWindy Ridge site.Image: Google Earth, dated Feb. 1993.
4 The petition was reviewed by staff from the Charlotte Planning Department, theCity Engineering Department, Charlotte Department of Transportation (CDOT), andCharlotteeMecklenburg Schools (CMS). After review, two recommendations weremade. The first was that the proposed street connection to First Street must providea minimum of 230 ft of intersection sight distance, to be reviewed during thesubdivision process. Additionally, street connections would be necessary along thewestern side of the subject property, possibly with Second Street and/or ThirdStreet.
5 NIMBY e an acronym for “Not In My Backyard.” This phrase is used whenresidents object to a proposed development that would negatively impact theirneighborhood, such as a landfill, group home, or heavy industrial use. Althoughacknowledging that it is needed in the community, those in opposition want itplaced somewhere else, and “not in my backyard.”
J. Sorensen et al. / Applied Geography 51 (2014) 8e25 11
Author's personal copy
discrepancy increased the ability of higher-income citizens toescape financial problems by selling or refinancing their houses;whereas lower-income citizens were forced to remain in theirhomes with higher rates, often resulting in default or foreclosure(Chandler & Hopkins, 2007). Within Mecklenburg County, fore-closures quadrupled between 1999 and 2005 (Appelbaum &Crouch, 2006, p. 3B), and a 2006 analysis by The CharlotteObserver found that 80 percent of the region’s foreclosures from2003 to 2005 involved houses priced at $150,000 or less (Mellnik,Hammersly, Appelbaum, & Pitzer, 2006). Many high foreclosureneighborhoods were those new developments that proliferatedduring the city’s growth boom, characterized by mass-produced,nearly identical houses that ran riot throughout Charlotte’s pe-riphery e a model well suited to a growth-machine framework.Despite the swelling ranks of foreclosures, new constructionpressed on (see Crouch, 2005a). One neighborhood group innorthwest Mecklenburg County protested the continued prolifer-ation of new subdivisions with signs that read, “American Dream orForeclosure Nightmare?” and “When is enough, enough?” (quotedin Crouch, 2005b, p. 1).
The problems in neighborhoods like Windy Ridge are indicativeof the suburbanization of North American poverty (Madden, 2003).For decades, a substantial amount of literature documented thecauses and effects of concentrated poverty in America’s urban core(see Teitz & Chapple, 2007; Wilson, 1996), characterized by agingand depleted housing stock, failing schools, high crime rates, and alack of employment opportunities. A growing body of recent liter-ature documenting the rising rate of poverty in inner-ring suburbs
shows outcomes of concentrated suburban poverty similar to thoseof their low-income, central-city counterparts (Jargowsky, 2003;Kneebone & Berube, 2013; Murphy, 2007). In addition, suburbancontexts present significant barriers that exacerbate the challengesfaced by the suburban poor, such as: limited social services, jobtraining centers and family resources; spatial isolation often due toa combination of low connectivity plus a lack of access to adequatetransportation; and a dearth of fundamental establishments, likegrocery and healthcare providers oriented to the needs of poorpopulations (Murphy, 2007).
The most visible impacts within foreclosure-riddled neighbor-hoods are blight and increased crime. In a Chicago-based study,Immergluck and Smith (2006) report that when the foreclosurerate increases by one percentage point, neighborhood violent crimerises 2.33 percent (p. 862). The study further demonstrated thatforeclosures in low-income neighborhoods harm the communitythrough extended vacancies, crime and abandoned or blightedbuildings. The combination of physical and social disorder con-tributes to increased criminal activity, discourages the formation ofsocial capital, and leads to further disinvestment and neighborhooddecay (Immergluck & Smith, 2006, pp. 854e855).
The negative effects of foreclosure also lead to declining prop-erty values for non-foreclosure homes. In a review of federal home-ownership programs, Bradford (1979) found that foreclosure ratesnegatively impacted neighborhood stability, particularly in lowerincome areas. A 2008 study by NeighborWorks America cited sevenprimary ways that foreclosures impact communities: increasedcrime; financial distress for individuals and municipalities alike;
Fig. 4. Plat of the Windy Ridge subdivision as built.
J. Sorensen et al. / Applied Geography 51 (2014) 8e2512
Author's personal copy
youth experience stress and instability; displaced residents strug-gle to find shelter; neighborhoods are blighted by neglect; and poorand minority communities are impacted disproportionately(Vidmar, 2008). The Center for Responsible Lending (CRL, 2008)ranked North Carolina fourteenth in the nation with the highestimpacts from foreclosure spillover, with price declines valued at$851 million (or $920 million in 2014 dollars). Several studiesdocument the negative impacts that foreclosures have on neigh-boring property values, especially when clustered (see Agpar &Duda, 2005; Bianco, 2008; CRL, 2008; Crump et al., 2008;Immergluck, 2009). All of these impacts are manifest in WindyRidge, where the compounded effects of clustered foreclosures andthe recession had caused home values to drop by approximately 45percent in early 2011 (Portillo & Hammersly, 2011).
The spillover effects from foreclosure reach beyond the imme-diate neighborhood and other foreclosure hotspots. Municipalitiese whether cities, counties, or school districts e lose tax revenuefrom abandoned homes and declining property values. Other non-governmental agencies often invest considerable time and moneyinto failing neighborhoods, as Habitat for Humanity did in WindyRidge.6 In an examination of Federal Housing Administrationforeclosures, Moreno (1995) estimated average city costs of $27,000and neighborhood costs of $10,000 for each foreclosure. These costsequate to over $41,400 and $15,300 (respectively) in 2014 dollars,and are associatedwith things such as the demolition of abandonedor vandalized properties, and the increased costs for fire and policeservices (King, 2009). Cities have also employed a variety ofexpensive legal approaches to address foreclosure fallout(McKinney, 2010).
Most solutions proposed for the foreclosure crisis have beenstraightforward: tighten federal lending regulations and end thepractice of subprime mortgage lending. The case study we presentsuggests that the answer may not be so simple. Studies indicate thesingle-family home in the suburbs may quickly become a relic of aprevious era of lifestyle and household choice framed by the BabyBoom generation. Household family size has been on the decline inthe North American population, including married couples underage 45: the demographic most often associated with home buying.This is compounded by the fact that the post-foreclosure crisishousing market will soon be dominated by Baby Boomers enteringretirement e those sellers aged 65 and older e who compete toattract a smaller and diminishing pool of younger replacementbuyers (Lucy, 2010; Myers & Ryu, 2008). Whenweighed against themany alternatives in a buyer’s market, neighborhoods like WindyRidge will not fair well and revised lending regulations will notaddress this problem.
This raises the question of who will buy properties in WindyRidge and similar subdivisions? Many of Windy Ridge’s challengesare rooted in the neighborhood’s inability to attract long-term in-vestment, i.e. owner occupancy. Unfortunately, this points to oneaspect of the neighborhood’s location that traditional urban theoryhas yet to addressddevelopment wedged between a historicallyAfrican American, low-income neighborhood and an industrial site.Smith, Caris, and Wyly (2001) suggest that the flight of the middleclass leaves behind the lower class, and increasingly so in urban andsuburban areas. They also point to other urban changes such asneighborhood deterioration, the ‘graying’ of many suburban pop-ulations, and the NIMBY-isms aimed at rental markets, affordablehousing, and immigrant groups (pp. 523e524). In the case ofWindy Ridge, there is no previous population whose exodus can
account for its current dilemmas. By contrast, the homebuyersattracted to the neighborhood represent a troublesome trend ofabsentee owners who exhibit little or no concern for the quality oflife of their tenants e primarily those of the lowest incomebrackets. Many of the neighborhood’s renters are former publichousing residents relocated via Section 8 vouchers. In fact, weargue that Windy Ridge functions as de-facto public housing, butwithout any of the social services or support that would typicallyaccompany it. The convoluted interplay of circumstances at work inWindy Ridge made/make it unattractive to middle class home-buyers, illustrating the complex roles that class, capital and raceplay in the long-term stabilization of metropolitan areas.
Windy Ridge’s residents have been unwitting participants inwhat may be the collapse of not only the residential marketplace,but also, by some measures, the suburban development model it-self. William H. Lucy (2010) studied home-buying trends over the1990s and concluded that the neighborhoods with the strongestsigns of market resilience indicated a “quest for the newly built andthe older full of character, and a flight away from those in themiddle” (p. 61). He noted that many neighborhoods built betweenthe1950s and 1970s performed poorly in the marketplace, whilepre-1940s areas showed signs of improvement. Windy Ridge con-tradicts Lucy’s findings, however, and presents similar character-istics of the 1950se1970s auto-oriented subdivision. This is despitethe fact that it was built a half-century later, and further contributesto the neighborhood’s lack of contemporary appeal. “A majority ofhouse-only suburbswill struggle to attract new buyers,”wrote Lucy(p. 113). Although Lucy’s work more directly addresses middle- andupper-middle income residential markets, those seeking affordablehousing alternatives have similar needs and desires. Safe places towalk, easily accessed commercial resources, safe and reliable schooldistricts, and housing stock of quality: each of these factors isamplified for those with limited economic means. Windy Ridgefalls short when checked against such a list.
Many mid-century neighborhoods and commercial centers areaging poorly, especially those predominantly constructed alongauto-oriented corridors at the outer edges of suburban enclaves.The patchwork development pattern in these fringe areas allowedother uses (such as industrial or heavy commercial, airports ordistribution points), to emerge from the city fabric, furthercontributing to their isolation. The result has been a mixture ofneighborhood-islands strung together by auto-centric corridors,surrounded by commercial or industrial development and inter-spersed with pockets of undeveloped land. It is in these remainingpockets where, as in the case of Windy Ridge, new affordablehousing is often proposed.
The practice of “infilling” such spaces raises significant concerns.Undeveloped pockets of real estate are highly vulnerable to impactsfrom surrounding land uses, and when developed for residentialpurposes, issues of environmental and social justice are brought tobear. This is especially true in Windy Ridge, where the newly builtsubdivision was placed adjacent to many known environmentalhazards and LULUs (Locally Unwanted Land Uses) that pre-existedthe neighborhood. The intensive industrial uses and heavy railsurrounding the neighborhood puts residents at risk for exposureto numerous environmental hazards (see Fig. 5).
At Windy Ridge, there are four former superfund, or hazardouswaste disposal sites in close proximity, two of which are withinone-half mile.7 Interestingly, the formerly wooded area now hometoWindy Ridge once provided a buffer from surrounding industrial
6 Habitat for Humanity bought 10 homes in Windy Ridge in early 2009 usingfederal grant money for neighborhood stabilization. These homes were rehabili-tated and later matched with qualified homebuyers.
7 Windy Ridge’s other neighbors include Chemway Industrial Park and severalother heavy industrial sites. The property is bounded on the north, south andpartially the east by active heavy rail lines.
J. Sorensen et al. / Applied Geography 51 (2014) 8e25 13
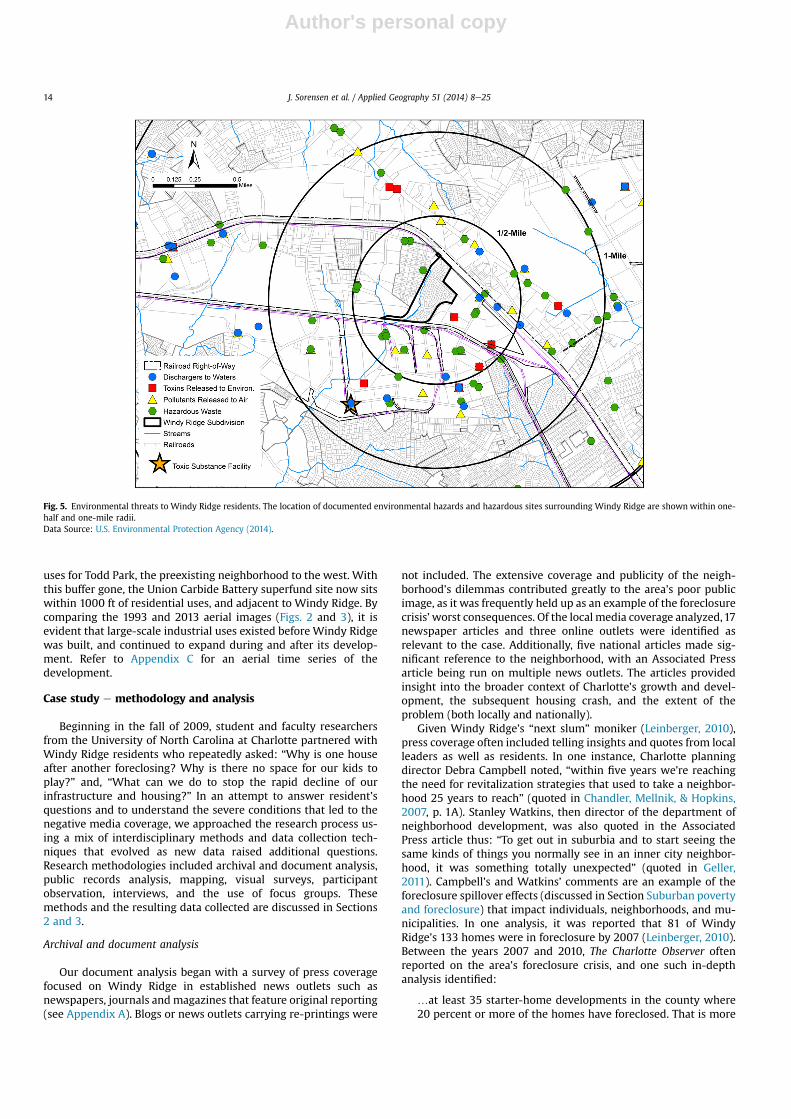
Author's personal copy
uses for Todd Park, the preexisting neighborhood to the west. Withthis buffer gone, the Union Carbide Battery superfund site now sitswithin 1000 ft of residential uses, and adjacent to Windy Ridge. Bycomparing the 1993 and 2013 aerial images (Figs. 2 and 3), it isevident that large-scale industrial uses existed before Windy Ridgewas built, and continued to expand during and after its develop-ment. Refer to Appendix C for an aerial time series of thedevelopment.
Case study e methodology and analysis
Beginning in the fall of 2009, student and faculty researchersfrom the University of North Carolina at Charlotte partnered withWindy Ridge residents who repeatedly asked: “Why is one houseafter another foreclosing? Why is there no space for our kids toplay?” and, “What can we do to stop the rapid decline of ourinfrastructure and housing?” In an attempt to answer resident’squestions and to understand the severe conditions that led to thenegative media coverage, we approached the research process us-ing a mix of interdisciplinary methods and data collection tech-niques that evolved as new data raised additional questions.Research methodologies included archival and document analysis,public records analysis, mapping, visual surveys, participantobservation, interviews, and the use of focus groups. Thesemethods and the resulting data collected are discussed in Sections2 and 3.
Archival and document analysis
Our document analysis began with a survey of press coveragefocused on Windy Ridge in established news outlets such asnewspapers, journals andmagazines that feature original reporting(see Appendix A). Blogs or news outlets carrying re-printings were
not included. The extensive coverage and publicity of the neigh-borhood’s dilemmas contributed greatly to the area’s poor publicimage, as it was frequently held up as an example of the foreclosurecrisis’worst consequences. Of the local media coverage analyzed,17newspaper articles and three online outlets were identified asrelevant to the case. Additionally, five national articles made sig-nificant reference to the neighborhood, with an Associated Pressarticle being run on multiple news outlets. The articles providedinsight into the broader context of Charlotte’s growth and devel-opment, the subsequent housing crash, and the extent of theproblem (both locally and nationally).
Given Windy Ridge’s “next slum” moniker (Leinberger, 2010),press coverage often included telling insights and quotes from localleaders as well as residents. In one instance, Charlotte planningdirector Debra Campbell noted, “within five years we’re reachingthe need for revitalization strategies that used to take a neighbor-hood 25 years to reach” (quoted in Chandler, Mellnik, & Hopkins,2007, p. 1A). Stanley Watkins, then director of the department ofneighborhood development, was also quoted in the AssociatedPress article thus: “To get out in suburbia and to start seeing thesame kinds of things you normally see in an inner city neighbor-hood, it was something totally unexpected” (quoted in Geller,2011). Campbell’s and Watkins’ comments are an example of theforeclosure spillover effects (discussed in Section Suburban povertyand foreclosure) that impact individuals, neighborhoods, and mu-nicipalities. In one analysis, it was reported that 81 of WindyRidge’s 133 homes were in foreclosure by 2007 (Leinberger, 2010).Between the years 2007 and 2010, The Charlotte Observer oftenreported on the area’s foreclosure crisis, and one such in-depthanalysis identified:
.at least 35 starter-home developments in the county where20 percent or more of the homes have foreclosed. That is more
Fig. 5. Environmental threats to Windy Ridge residents. The location of documented environmental hazards and hazardous sites surrounding Windy Ridge are shown within one-half and one-mile radii.Data Source: U.S. Environmental Protection Agency (2014).
J. Sorensen et al. / Applied Geography 51 (2014) 8e2514

Author's personal copy
than six times the national foreclosure rate. The troubledneighborhoods are concentrated west, north and east ofdowntown Charlotte, a crescent of deteriorating developmentthat is putting pressure on surrounding communities.(Applebaum, Munn, & Mellnik, 2009).
Fast Company journalist Michael Cannell also wrote, “Commu-nities like Elk Grove, (California) andWindy Ridge, (North Carolina)are slowly turning into ghost towns with overgrown lawns, vacantstrip malls and squatters camping in empty homes” (Cannell, 2009,p. 1).
A search of Charlotte’s public records for material documentingWindy Ridge’s development process included the original devel-opment proposal, planning documents, and minutes from publicmeetings. These documents traced the neighborhood’s history andthe process by which it was first proposed, and finally approved.The analysis, as discussed in Section Location and isolation,revealed the development context and how the process itself mayhave contributed to its circumstances.
Survey, focus group and interviews
While the process of data collection yielded valuable insights,many new questions arose that could only be addressed through aqualitative assessment aimed at capturing the experiences of resi-dents living in Windy Ridge. A brief summation of the qualitativedata collection methods follows.
Graduate researchers attended monthly neighborhood meet-ings beginning with the project’s inception in August 2009 throughthe summer of 2012. These monthly meetings provided a venue toobserve and interact with key stakeholders (such as residents, cityofficials, police, etc.). The Windy Ridge Community Survey wasadministered in July 2010 by UNCC graduate researchers, whereresidents responded verbally while the survey administer notedeach response (see Appendix B for survey instrument and summaryof responses).
Findings from the survey helped illuminate the challengesrelated to the formation of social capital and neighborhood capacitybuilding.When asked about their tenure in the neighborhood, mostrespondents had lived in the community only a few months, and ofall households, more than half reported having lived in WindyRidge for less than 20 months. Two-thirds of respondents wererenters, many using HUD Section 8 vouchers. Evictions and va-cancies were commonplace as banks repossessed properties, forc-ing tenants out. Residents frequently expressed a desire to moveout of the neighborhood as quickly as possible, viewing it as atemporary location until somewhere ‘better’ became available.When asked about friendships within the neighborhood, mostresponded they had very few and 40 percent stated that they hadno friends at all. The need for social relationships within thecommunity is evident, but efforts to secure its future have beenchallenging due to high turnover and short tenure rates in theneighborhood.
Some residents expressed dissatisfaction with the public busservice, stating that it was unreliable and its stops too far away.Concern for personal safety was raised when walking to and fromthe stop at night. One respondent, who rides the bus 16 or moretimes per month with her daughter and siblings, commented, “I amlate for school or work because the train blocks traffic,” and the busstops have “unsafe drop off and pick up points” (see Fig. 6).
Following the neighborhood survey, a focus group was held inAugust 2010 to better understand the lived experience of residents.Some of the major themes to emerge from the focus group were:disillusionment and dissatisfaction with life in the community;isolation, burglaries and break-ins; and concern about disengagedyouth. As one focus group participant put it, “I have seen WindyRidge go from beautiful to disaster” (Angela, 8-19-2010). And in thewords of Windy Ridge resident, Andre,
I look out for the kids that live in the neighborhood. They needsomewhere to go. something to do. I notice that they just runaround messing (in) somebody’s yard. you look at them runningup and down the streets. They’d be much better off, and wewouldn’t have to worry about the burglaries [if there were some-where for them to play]. Because, what are we looking at for themto be, when they’ve got nothing to do? (8-19-2010).
Residents also recalled witnessing the domino effect of fore-closures in their neighborhood beginning as early as 2005.Speaking in a focus group setting, Wigena recounted her experi-ence with neighborhood foreclosures:
. when I first came, that was 2005. there was a couple people,but only a few of us on the street and I noticed how it slowlyprogressed. And, then, a year or so later, the neighbors are gettingforeclosed on, and the other neighbors, and I’m like. “what isthis?!?” And then., bam! Back to back to back–and I’m like,“what’s going on?” And then I got foreclosed on! (8-19-2010).
The neighborhood survey also addressed Windy Ridge’s builtenvironment and these concerns are discussed in the followingsection.
Date Data collectionmethod
Participants
March 2010 Windshield surveys Student observations of neighborhoodJuly 2010 Door-to-door survey 102 participants, 7 declined, 27 vacantJuneeAug 2010 Mapping Studies 6 graduate researchersAug 2010 Focus Group 3 homeowners, 3 tenants, 1 landlordAug 2010 Focus Group 3 homeowners, 3 tenants, 1 landlord2009e2011 Informal interviews Residents and HOA members
Fig. 6. The isolation of Windy Ridge. Heavy industrial and train traffic block the soleentrance to Windy Ridge often. Homes in the neighborhood can be seen in thebackground, located in the center of the photo, and the entry road is obscured by thetractoretrailer.Image: Courtesy of UNCC-CHARP, Sept. 2013.
J. Sorensen et al. / Applied Geography 51 (2014) 8e25 15
Author's personal copy
Inventory of existing conditions
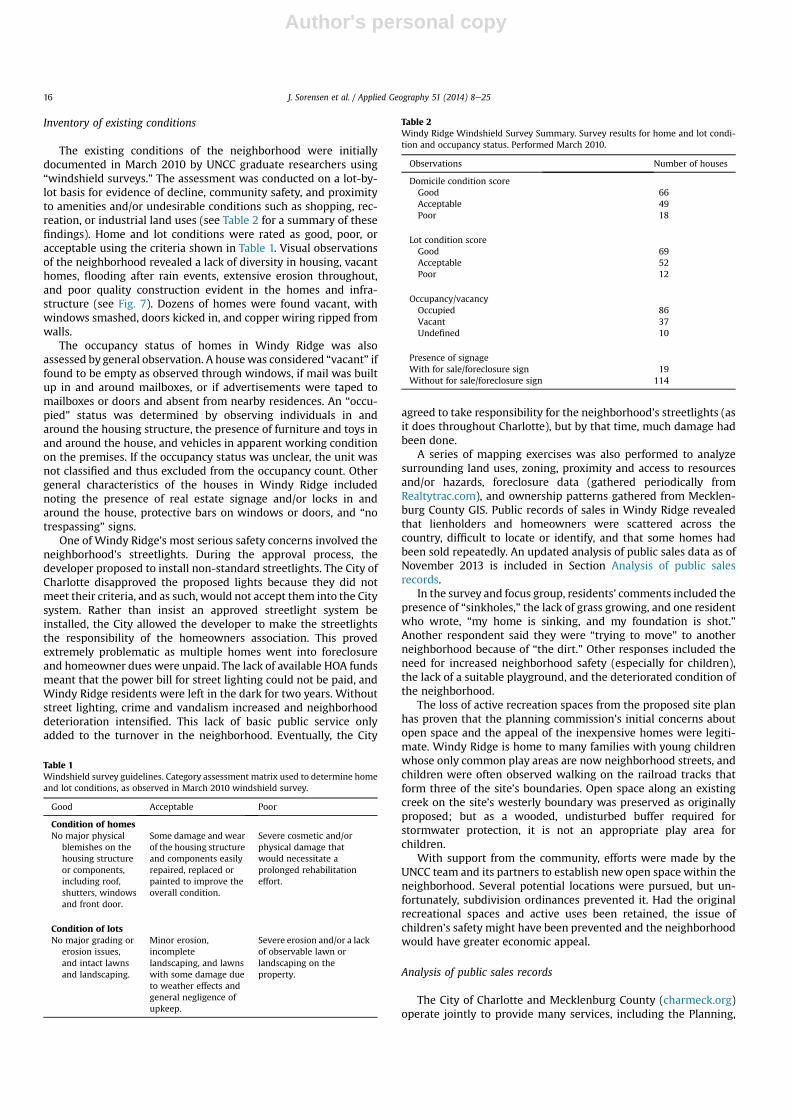
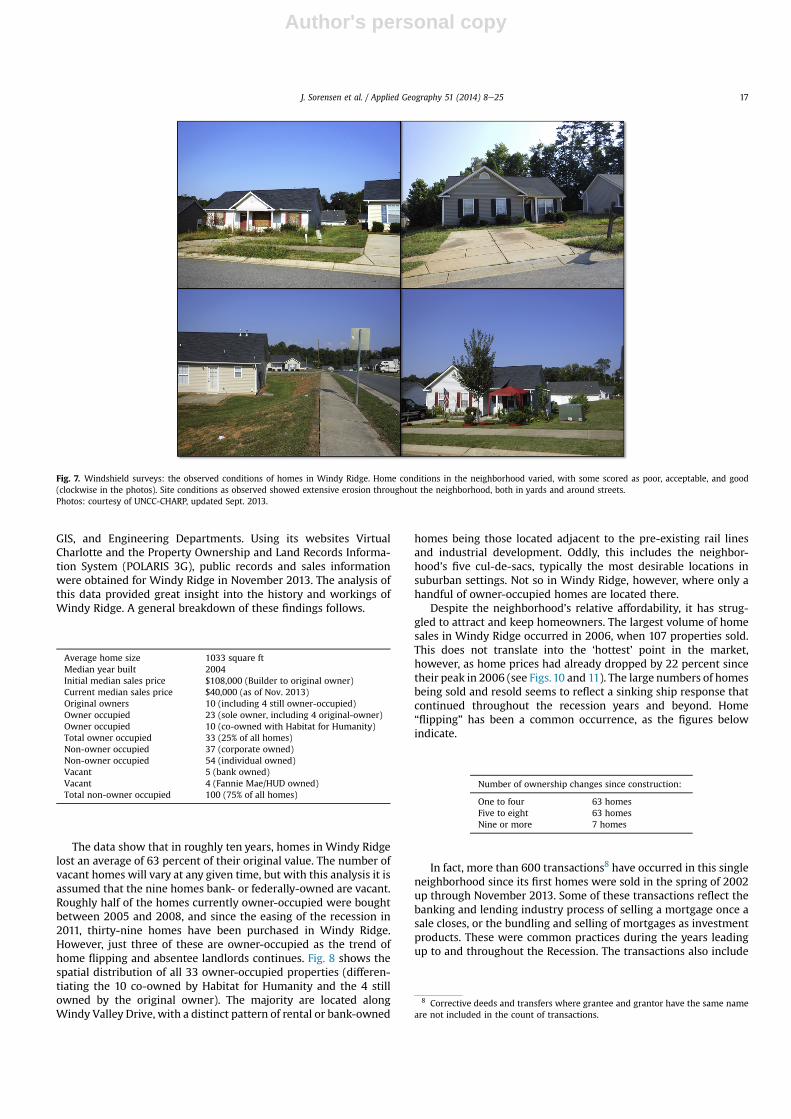
The existing conditions of the neighborhood were initiallydocumented in March 2010 by UNCC graduate researchers using“windshield surveys.” The assessment was conducted on a lot-by-lot basis for evidence of decline, community safety, and proximityto amenities and/or undesirable conditions such as shopping, rec-reation, or industrial land uses (see Table 2 for a summary of thesefindings). Home and lot conditions were rated as good, poor, oracceptable using the criteria shown in Table 1. Visual observationsof the neighborhood revealed a lack of diversity in housing, vacanthomes, flooding after rain events, extensive erosion throughout,and poor quality construction evident in the homes and infra-structure (see Fig. 7). Dozens of homes were found vacant, withwindows smashed, doors kicked in, and copper wiring ripped fromwalls.
The occupancy status of homes in Windy Ridge was alsoassessed by general observation. A housewas considered “vacant” iffound to be empty as observed through windows, if mail was builtup in and around mailboxes, or if advertisements were taped tomailboxes or doors and absent from nearby residences. An “occu-pied” status was determined by observing individuals in andaround the housing structure, the presence of furniture and toys inand around the house, and vehicles in apparent working conditionon the premises. If the occupancy status was unclear, the unit wasnot classified and thus excluded from the occupancy count. Othergeneral characteristics of the houses in Windy Ridge includednoting the presence of real estate signage and/or locks in andaround the house, protective bars on windows or doors, and “notrespassing” signs.
One of Windy Ridge’s most serious safety concerns involved theneighborhood’s streetlights. During the approval process, thedeveloper proposed to install non-standard streetlights. The City ofCharlotte disapproved the proposed lights because they did notmeet their criteria, and as such, would not accept them into the Citysystem. Rather than insist an approved streetlight system beinstalled, the City allowed the developer to make the streetlightsthe responsibility of the homeowners association. This provedextremely problematic as multiple homes went into foreclosureand homeowner dues were unpaid. The lack of available HOA fundsmeant that the power bill for street lighting could not be paid, andWindy Ridge residents were left in the dark for two years. Withoutstreet lighting, crime and vandalism increased and neighborhooddeterioration intensified. This lack of basic public service onlyadded to the turnover in the neighborhood. Eventually, the City
agreed to take responsibility for the neighborhood’s streetlights (asit does throughout Charlotte), but by that time, much damage hadbeen done.
A series of mapping exercises was also performed to analyzesurrounding land uses, zoning, proximity and access to resourcesand/or hazards, foreclosure data (gathered periodically fromRealtytrac.com), and ownership patterns gathered from Mecklen-burg County GIS. Public records of sales in Windy Ridge revealedthat lienholders and homeowners were scattered across thecountry, difficult to locate or identify, and that some homes hadbeen sold repeatedly. An updated analysis of public sales data as ofNovember 2013 is included in Section Analysis of public salesrecords.
In the survey and focus group, residents’ comments included thepresence of “sinkholes,” the lack of grass growing, and one residentwho wrote, “my home is sinking, and my foundation is shot.”Another respondent said they were “trying to move” to anotherneighborhood because of “the dirt.” Other responses included theneed for increased neighborhood safety (especially for children),the lack of a suitable playground, and the deteriorated condition ofthe neighborhood.
The loss of active recreation spaces from the proposed site planhas proven that the planning commission’s initial concerns aboutopen space and the appeal of the inexpensive homes were legiti-mate. Windy Ridge is home to many families with young childrenwhose only common play areas are now neighborhood streets, andchildren were often observed walking on the railroad tracks thatform three of the site’s boundaries. Open space along an existingcreek on the site’s westerly boundary was preserved as originallyproposed; but as a wooded, undisturbed buffer required forstormwater protection, it is not an appropriate play area forchildren.
With support from the community, efforts were made by theUNCC team and its partners to establish new open space within theneighborhood. Several potential locations were pursued, but un-fortunately, subdivision ordinances prevented it. Had the originalrecreational spaces and active uses been retained, the issue ofchildren’s safety might have been prevented and the neighborhoodwould have greater economic appeal.
Analysis of public sales records
The City of Charlotte and Mecklenburg County (charmeck.org)operate jointly to provide many services, including the Planning,
Table 1Windshield survey guidelines. Category assessment matrix used to determine homeand lot conditions, as observed in March 2010 windshield survey.
Good Acceptable Poor
Condition of homesNo major physical
blemishes on thehousing structureor components,including roof,shutters, windowsand front door.
Some damage and wearof the housing structureand components easilyrepaired, replaced orpainted to improve theoverall condition.
Severe cosmetic and/orphysical damage thatwould necessitate aprolonged rehabilitationeffort.
Condition of lotsNo major grading or
erosion issues,and intact lawnsand landscaping.
Minor erosion,incompletelandscaping, and lawnswith some damage dueto weather effects andgeneral negligence ofupkeep.
Severe erosion and/or a lackof observable lawn orlandscaping on theproperty.
Table 2Windy Ridge Windshield Survey Summary. Survey results for home and lot condi-tion and occupancy status. Performed March 2010.
Observations Number of houses
Domicile condition scoreGood 66Acceptable 49Poor 18
Lot condition scoreGood 69Acceptable 52Poor 12
Occupancy/vacancyOccupied 86Vacant 37Undefined 10
Presence of signageWith for sale/foreclosure sign 19Without for sale/foreclosure sign 114
J. Sorensen et al. / Applied Geography 51 (2014) 8e2516
Author's personal copy
GIS, and Engineering Departments. Using its websites VirtualCharlotte and the Property Ownership and Land Records Informa-tion System (POLARIS 3G), public records and sales informationwere obtained for Windy Ridge in November 2013. The analysis ofthis data provided great insight into the history and workings ofWindy Ridge. A general breakdown of these findings follows.
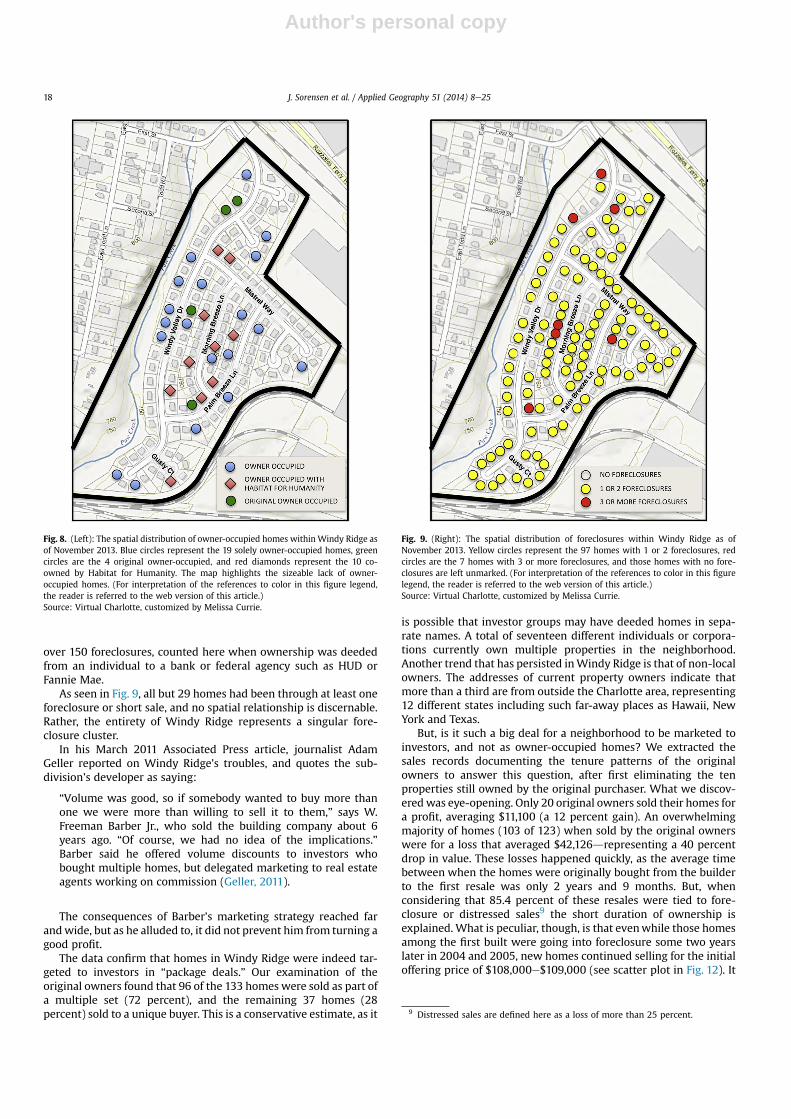
The data show that in roughly ten years, homes in Windy Ridgelost an average of 63 percent of their original value. The number ofvacant homes will vary at any given time, but with this analysis it isassumed that the nine homes bank- or federally-owned are vacant.Roughly half of the homes currently owner-occupied were boughtbetween 2005 and 2008, and since the easing of the recession in2011, thirty-nine homes have been purchased in Windy Ridge.However, just three of these are owner-occupied as the trend ofhome flipping and absentee landlords continues. Fig. 8 shows thespatial distribution of all 33 owner-occupied properties (differen-tiating the 10 co-owned by Habitat for Humanity and the 4 stillowned by the original owner). The majority are located alongWindy Valley Drive, with a distinct pattern of rental or bank-owned
homes being those located adjacent to the pre-existing rail linesand industrial development. Oddly, this includes the neighbor-hood’s five cul-de-sacs, typically the most desirable locations insuburban settings. Not so in Windy Ridge, however, where only ahandful of owner-occupied homes are located there.
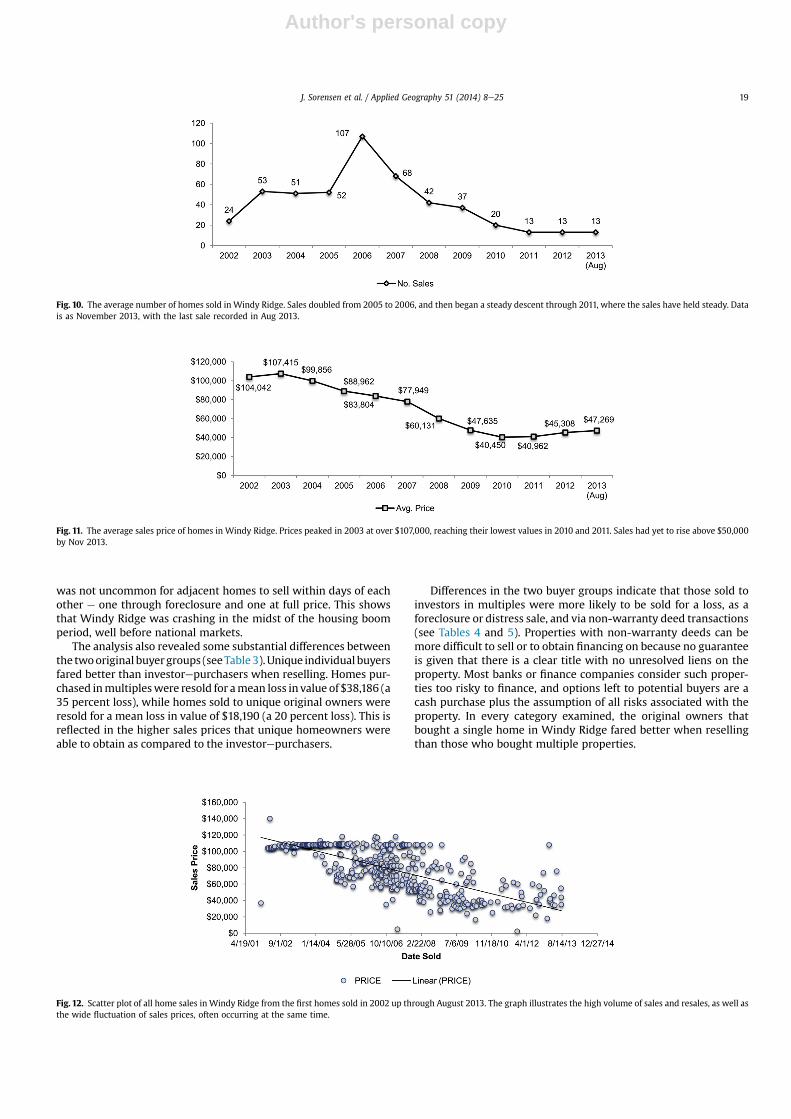
Despite the neighborhood’s relative affordability, it has strug-gled to attract and keep homeowners. The largest volume of homesales in Windy Ridge occurred in 2006, when 107 properties sold.This does not translate into the ‘hottest’ point in the market,however, as home prices had already dropped by 22 percent sincetheir peak in 2006 (see Figs.10 and 11). The large numbers of homesbeing sold and resold seems to reflect a sinking ship response thatcontinued throughout the recession years and beyond. Home“flipping” has been a common occurrence, as the figures belowindicate.
In fact, more than 600 transactions8 have occurred in this singleneighborhood since its first homes were sold in the spring of 2002up through November 2013. Some of these transactions reflect thebanking and lending industry process of selling a mortgage once asale closes, or the bundling and selling of mortgages as investmentproducts. These were common practices during the years leadingup to and throughout the Recession. The transactions also include
Fig. 7. Windshield surveys: the observed conditions of homes in Windy Ridge. Home conditions in the neighborhood varied, with some scored as poor, acceptable, and good(clockwise in the photos). Site conditions as observed showed extensive erosion throughout the neighborhood, both in yards and around streets.Photos: courtesy of UNCC-CHARP, updated Sept. 2013.
Average home size 1033 square ftMedian year built 2004Initial median sales price $108,000 (Builder to original owner)Current median sales price $40,000 (as of Nov. 2013)Original owners 10 (including 4 still owner-occupied)Owner occupied 23 (sole owner, including 4 original-owner)Owner occupied 10 (co-owned with Habitat for Humanity)Total owner occupied 33 (25% of all homes)Non-owner occupied 37 (corporate owned)Non-owner occupied 54 (individual owned)Vacant 5 (bank owned)Vacant 4 (Fannie Mae/HUD owned)Total non-owner occupied 100 (75% of all homes)
Number of ownership changes since construction:
One to four 63 homesFive to eight 63 homesNine or more 7 homes
8 Corrective deeds and transfers where grantee and grantor have the same nameare not included in the count of transactions.
J. Sorensen et al. / Applied Geography 51 (2014) 8e25 17
Author's personal copy
over 150 foreclosures, counted here when ownership was deededfrom an individual to a bank or federal agency such as HUD orFannie Mae.
As seen in Fig. 9, all but 29 homes had been through at least oneforeclosure or short sale, and no spatial relationship is discernable.Rather, the entirety of Windy Ridge represents a singular fore-closure cluster.
In his March 2011 Associated Press article, journalist AdamGeller reported on Windy Ridge’s troubles, and quotes the sub-division’s developer as saying:
“Volume was good, so if somebody wanted to buy more thanone we were more than willing to sell it to them,” says W.Freeman Barber Jr., who sold the building company about 6years ago. “Of course, we had no idea of the implications.”Barber said he offered volume discounts to investors whobought multiple homes, but delegated marketing to real estateagents working on commission (Geller, 2011).
The consequences of Barber’s marketing strategy reached farandwide, but as he alluded to, it did not prevent him from turning agood profit.
The data confirm that homes in Windy Ridge were indeed tar-geted to investors in “package deals.” Our examination of theoriginal owners found that 96 of the 133 homes were sold as part ofa multiple set (72 percent), and the remaining 37 homes (28percent) sold to a unique buyer. This is a conservative estimate, as it
is possible that investor groups may have deeded homes in sepa-rate names. A total of seventeen different individuals or corpora-tions currently own multiple properties in the neighborhood.Another trend that has persisted inWindy Ridge is that of non-localowners. The addresses of current property owners indicate thatmore than a third are from outside the Charlotte area, representing12 different states including such far-away places as Hawaii, NewYork and Texas.
But, is it such a big deal for a neighborhood to be marketed toinvestors, and not as owner-occupied homes? We extracted thesales records documenting the tenure patterns of the originalowners to answer this question, after first eliminating the tenproperties still owned by the original purchaser. What we discov-eredwas eye-opening. Only 20 original owners sold their homes fora profit, averaging $11,100 (a 12 percent gain). An overwhelmingmajority of homes (103 of 123) when sold by the original ownerswere for a loss that averaged $42,126drepresenting a 40 percentdrop in value. These losses happened quickly, as the average timebetween when the homes were originally bought from the builderto the first resale was only 2 years and 9 months. But, whenconsidering that 85.4 percent of these resales were tied to fore-closure or distressed sales9 the short duration of ownership isexplained. What is peculiar, though, is that evenwhile those homesamong the first built were going into foreclosure some two yearslater in 2004 and 2005, new homes continued selling for the initialoffering price of $108,000e$109,000 (see scatter plot in Fig. 12). It
Fig. 8. (Left): The spatial distribution of owner-occupied homes within Windy Ridge asof November 2013. Blue circles represent the 19 solely owner-occupied homes, greencircles are the 4 original owner-occupied, and red diamonds represent the 10 co-owned by Habitat for Humanity. The map highlights the sizeable lack of owner-occupied homes. (For interpretation of the references to color in this figure legend,the reader is referred to the web version of this article.)Source: Virtual Charlotte, customized by Melissa Currie.
Fig. 9. (Right): The spatial distribution of foreclosures within Windy Ridge as ofNovember 2013. Yellow circles represent the 97 homes with 1 or 2 foreclosures, redcircles are the 7 homes with 3 or more foreclosures, and those homes with no fore-closures are left unmarked. (For interpretation of the references to color in this figurelegend, the reader is referred to the web version of this article.)Source: Virtual Charlotte, customized by Melissa Currie.
9 Distressed sales are defined here as a loss of more than 25 percent.
J. Sorensen et al. / Applied Geography 51 (2014) 8e2518
Author's personal copy
was not uncommon for adjacent homes to sell within days of eachother e one through foreclosure and one at full price. This showsthat Windy Ridge was crashing in the midst of the housing boomperiod, well before national markets.
The analysis also revealed some substantial differences betweenthe twooriginal buyergroups (seeTable3).Unique individual buyersfared better than investorepurchasers when reselling. Homes pur-chased inmultipleswere resold for amean loss in value of $38,186 (a35 percent loss), while homes sold to unique original owners wereresold for a mean loss in value of $18,190 (a 20 percent loss). This isreflected in the higher sales prices that unique homeowners wereable to obtain as compared to the investorepurchasers.
Differences in the two buyer groups indicate that those sold toinvestors in multiples were more likely to be sold for a loss, as aforeclosure or distress sale, and via non-warranty deed transactions(see Tables 4 and 5). Properties with non-warranty deeds can bemore difficult to sell or to obtain financing on because no guaranteeis given that there is a clear title with no unresolved liens on theproperty. Most banks or finance companies consider such proper-ties too risky to finance, and options left to potential buyers are acash purchase plus the assumption of all risks associated with theproperty. In every category examined, the original owners thatbought a single home in Windy Ridge fared better when resellingthan those who bought multiple properties.
Fig. 11. The average sales price of homes in Windy Ridge. Prices peaked in 2003 at over $107,000, reaching their lowest values in 2010 and 2011. Sales had yet to rise above $50,000by Nov 2013.
Fig. 10. The average number of homes sold in Windy Ridge. Sales doubled from 2005 to 2006, and then began a steady descent through 2011, where the sales have held steady. Datais as November 2013, with the last sale recorded in Aug 2013.
Fig. 12. Scatter plot of all home sales in Windy Ridge from the first homes sold in 2002 up through August 2013. The graph illustrates the high volume of sales and resales, as well asthe wide fluctuation of sales prices, often occurring at the same time.
J. Sorensen et al. / Applied Geography 51 (2014) 8e25 19

Author's personal copy
To further understand the data, an independent samples t-testwas conducted (using SPSS version 21) to examine whether therewas a significant difference between those original owners whosesales were to foreclosure or distressed sale, and those with non-foreclosures. The test revealed a statistically significant differencebetween the unique and multiple buyer groups (t ¼ �3.43,df¼ 38.5, p< .05), the initial sales price (t¼�2.9, df¼ 31.4, p< .05),the sales price of the second sale (t ¼ 10.4, df ¼ 78, p < .001), theprice difference between the two sales (t¼ 11.6, df¼ 56.8, p< .001),and the length of time owned (t ¼ �2.7, df ¼ 121, p < .05). See thegroup statistics in Table 6.
The data also indicate that homes sold by original owners thatled to foreclosure or distressed sale were initially bought at ahigher mean price than those non-foreclosure resales. Homes inwhich the first resale was by foreclosure or distressed sale werealso owned for approximately one year longer than those resalesthat did not lead to foreclosures, and were sold for an averageloss of $41,000. The longer time owned is likely due to thelengthy process typical of a foreclosure or short-sale. The highfrequency of foreclosures in Windy Ridge was also known to havecreated problems due to confusion as to who actually owned a
particular property. Homeowners may have abandoned, or beenforced out of, homes long before deeds were recorded. Andbecause so many homes were sold in multiples, when an ownerfaced financial difficulties as the Recession set in, it would affectseveral homes in Windy Ridge, a situation repeated throughoutthe neighborhood in a domino effect that left home after homevacant.
Discussion
The usual argument for the cause of the foreclosure crisis pointsto larger, exogenous economic conditions. However, this case studyhas uncovered a variety of other contributing factors that led tohigh rates of foreclosure, rapid neighborhood decline, and disparateimpacts on low-income populations. Recent trends in urban resi-dential markets signal that neighborhoods likeWindy Ridge face anincreasingly troubled future. Lucy (2010), drawing upon thework ofRobert Fishman (2005), states that,
As residents sort themselves increasingly by the attraction of con-venience, accessible mixed use districts will induce more affluentresidents to choose residences in central cities and some suburbs,especially suburbs with transit connections to employment andentertainment (Lucy, 2010, p. 113).
What Lucy points to are the “favored quarters” that Christo-pher Leinberger (1995) described as urban areas that have
Table 3Descriptive statistics of the two buyer groups in Windy Ridge: unique buyers(n ¼ 37) and multiple purchase buyers (n ¼ 96). Ten homes are still owned by theoriginal owners and are therefore not included. Note: date format is year/month/day.
Descriptive statistics N Minimum Maximum Mean Std.deviation
Single sales to unique owner (n ¼ 37)Sale_1_price(first owner)
37 $1000 $109,000 $93,905.41 $25,974.30
Sale_1_date 37 1/11/27 7/3/19 4/2/08 N/ASale_2_price(2nd owner)
29 $0 $118,000 $79,241.38 $34,630.09
Sale_2_date 29 4/1/12 12/12/11 6/6/29 N/ATime_owned (in years) 29 0.50 7.36 2.40 1.85Difference (sale 1 tosale 2)
29 ($106,000) $22,000 ($18,189.66) $34,278.64
Percent_change (%) 29 �100.00 25.58 �19.97 37.69
Sales as part of multiple purchases (n ¼ 96)Sale_1_price(first owner)
96 $86,000 $140,000 $107,890.63 $4209.14
Sale_1_date 96 2/3/01 5/12/06 3/11/13 N/ASale_2_price(2nd owner)
94 $0 $118,000 $69,696.81 $29,673.06
Sale_2_date 94 4/3/18 12/1/19 6/10/16 N/ATime_owned (in years) 94 0.81 8.88 2.90 1.47Difference (sale 1 tosale 2)
94 ($140,000) $22,000 ($38,186.17) $30,812.21
Percent_change (%) 94 �100 25.58 �35.1155 28.14722
Table 4Descriptive statistics of the types of sales made by the original owner to the second,within the two buyer groups in Windy Ridge: Unique buyers (n ¼ 37) and multiplepurchase buyers (n ¼ 96). Ten homes are still owned by the original owners and aretherefore not included.
Single sales (n ¼ 37) Multiple sales (n ¼ 96)
Frequency Percent Frequency Percent
Non_warranty deed 20 54.1 71 74.0Sold for gain 9 24.3 11 11.5Sold for loss 20 54.1 83 86.5Non_foreclosure 16 43.2 13 13.5Sold as foreclosure 19 51.4 69 71.9Distressed sale 2 5.4 14 14.6Original owner 8 21.6 2 2.1
Table 5Cross tabulation for the types of sales made by the original owner to the second,within the two buyer groups in Windy Ridge: Unique buyers (n ¼ 37) and multiplepurchase buyers (n ¼ 96). Ten homes are still owned by the original owners and aretherefore not included.
Foreclosure � multiple_sale cross tabulation
Individual owner Multiple owner Total
Foreclosure No foreclosure 16 13 29Foreclosure 19 69 88Distressed sale 2 14 16
Total 37 96 133
Table 6Group statistics of the first resales made by the original owner to the second(0 ¼ non-foreclosure, 1 ¼ foreclosure or distressed sale) in Windy Ridge. Ten homesare still owned by the original owners and are therefore not included. Distressedsales are those with a loss of 25% or greater.
Group statistics Recode_foreclosure
N Mean Std.deviation
Std. errormean
Sale_1_price 0 29 $93,913.79 $23,414.00 $4347.871 104 $106,812.50 $10,825.89 $1061.57
Sale_2_price 0 19 $105,394.74 $10,620.45 $2436.501 104 $65,836.54 $29,611.35 $2903.63
Time_owned (days) 0 19 696.11 474.81 108.9291 104 1072.94 574.956 56.379
Sale_difference 0 19 $7605.26 $13,263.96 $3042.961 104 ($40,975.96) $29,390.85 $2882.01
Gain 0 19 0.84 0.375 0.0861 104 0.04 0.193 0.019
Percent_change % 0 19 8.7542 14.59 3.351 104 �38.91 27.56 2.70232
Multiple_sale 0 29 0.45 0.506 0.0941 104 0.8 0.403 0.04
Orig_owner 0 29 0.34 0.484 0.091 104 0 0 0
Recode_Foreclosure: 0 ¼ non foreclosure; 1 ¼ foreclosure or distressed sale (25%loss or greater)
J. Sorensen et al. / Applied Geography 51 (2014) 8e2520
Author's personal copy
remained attractive for middle and upper income demographicgroups. Areas that lack the desired attributes also tend to lacksignificant residential reinvestment. In the case of Windy Ridge,none of these ‘favored quarter’ criteria exist, and its now blightedlandscape will simply fail to appeal to a broad demographicwithout significant infrastructural and neighborhood design in-terventions. Community organizing, or grassroots planning, hasthe potential for fostering change (Hudson, 1979), and can helpbegin the difficult process of repairing the neighborhood. It is,however, problematic to suggest that residents of neighborhoodslike Windy Ridge, often characterized by transience and resourcedeficiencies, should organize in order to demand changes,including better access to public transportation, amenities, or themitigation of existing environmental hazards. The “tyranny ofeasy development decisions” (Lucy, 2010, p. 86) contributed to ametropolitan climate in Charlotte that made developments likeWindy Ridge possible. As a result, the city is now faced with anincreasingly difficult array of challenges as the neighborhoodattempts to climb out of the abyss of foreclosure and generalneighborhood decline.10
When discussing the public interest, we typically consider thedifferent stakeholders that in one way or another experience theimpacts of a development decision. In the end, few winnersemerged through the establishment of Windy Ridge. The originallandowner was able to sell property many would deem un-developable for other than industrial uses; the developer soldhomes for a profit; and a few investors made a profitable, albeitquestionable, investment. Those in the “losers” category are manyand varied. The already marginalized were disproportionallyimpacted, including residents of the adjacent Todd Park neighbor-hoodwho nowmust contendwithWindy Ridge’s legacy; the City isnow responsible for a neighborhood with declining tax value andincreasing costs; the police must spend a disproportionate amountof time in the neighborhood in an effort to stem criminal activities;the department of Neighborhood Services and Economic Devel-opment grapples with a neighborhood that must be continuallysupported if stability is to be achieved; and the federal governmenthas invested in the future of Windy Ridge through neighborhoodstabilization grants.
Conclusion and recommendations
There are two important issues thatmust be considered as a resultof this case study: the long-term viability ofWindy Ridge and similarsubdivisions, and the long-term viability of new neighborhoods thathave yet to be developed. This case study provides a detailed analysisandempirical evidenceof theconsequencesofpoor landusedecisionswithin a growthmachine environment.Windy Ridge is a clear case ofenvironmental (in)justice, in which a property surrounded by heavyindustrial uses and Superfund sites was allowed to be rezoned forresidential development targeted to lower income minorities. Wecannot know the outcome had the original proposal for rezoning thisproperty been for a middle- to upper-middle income neighborhood,but it is likely to have been denied.
The lessons learned through this case study are relevant tocommunities everywhere as we grapple with an ever-expanding
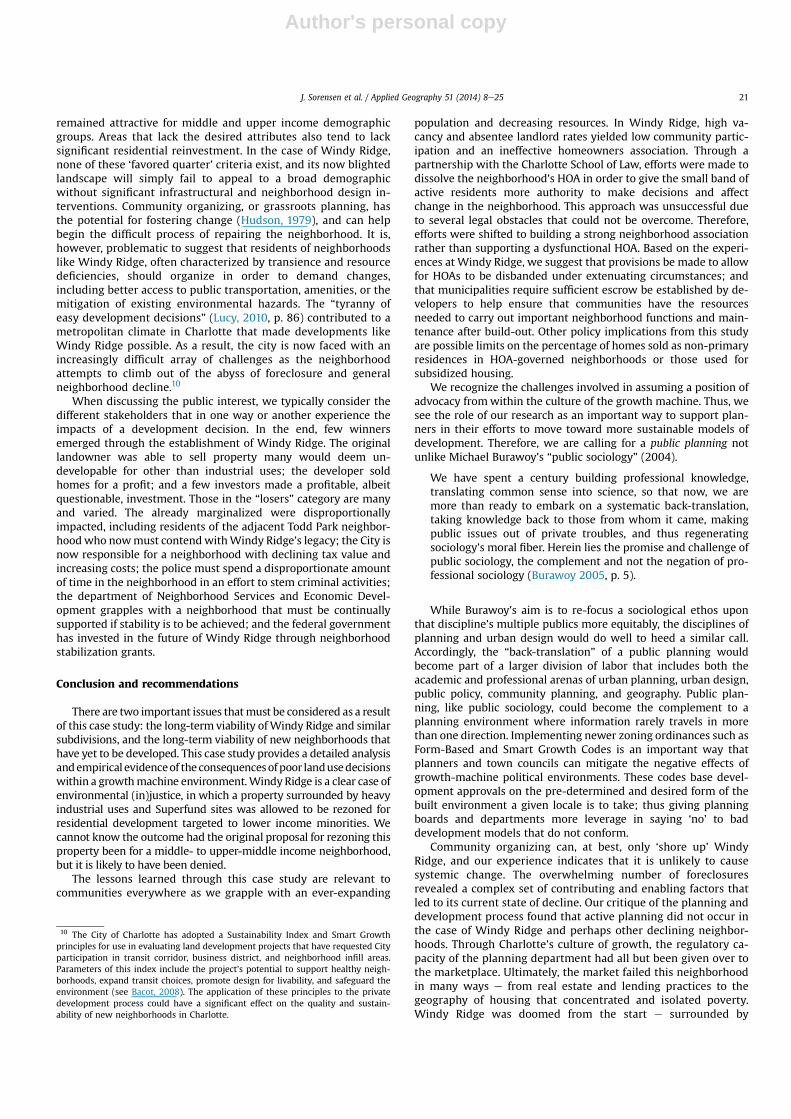
population and decreasing resources. In Windy Ridge, high va-cancy and absentee landlord rates yielded low community partic-ipation and an ineffective homeowners association. Through apartnership with the Charlotte School of Law, efforts were made todissolve the neighborhood’s HOA in order to give the small band ofactive residents more authority to make decisions and affectchange in the neighborhood. This approach was unsuccessful dueto several legal obstacles that could not be overcome. Therefore,efforts were shifted to building a strong neighborhood associationrather than supporting a dysfunctional HOA. Based on the experi-ences at Windy Ridge, we suggest that provisions be made to allowfor HOAs to be disbanded under extenuating circumstances; andthat municipalities require sufficient escrow be established by de-velopers to help ensure that communities have the resourcesneeded to carry out important neighborhood functions and main-tenance after build-out. Other policy implications from this studyare possible limits on the percentage of homes sold as non-primaryresidences in HOA-governed neighborhoods or those used forsubsidized housing.
We recognize the challenges involved in assuming a position ofadvocacy fromwithin the culture of the growth machine. Thus, wesee the role of our research as an important way to support plan-ners in their efforts to move toward more sustainable models ofdevelopment. Therefore, we are calling for a public planning notunlike Michael Burawoy’s “public sociology” (2004).
We have spent a century building professional knowledge,translating common sense into science, so that now, we aremore than ready to embark on a systematic back-translation,taking knowledge back to those from whom it came, makingpublic issues out of private troubles, and thus regeneratingsociology’s moral fiber. Herein lies the promise and challenge ofpublic sociology, the complement and not the negation of pro-fessional sociology (Burawoy 2005, p. 5).
While Burawoy’s aim is to re-focus a sociological ethos uponthat discipline’s multiple publics more equitably, the disciplines ofplanning and urban design would do well to heed a similar call.Accordingly, the “back-translation” of a public planning wouldbecome part of a larger division of labor that includes both theacademic and professional arenas of urban planning, urban design,public policy, community planning, and geography. Public plan-ning, like public sociology, could become the complement to aplanning environment where information rarely travels in morethan one direction. Implementing newer zoning ordinances such asForm-Based and Smart Growth Codes is an important way thatplanners and town councils can mitigate the negative effects ofgrowth-machine political environments. These codes base devel-opment approvals on the pre-determined and desired form of thebuilt environment a given locale is to take; thus giving planningboards and departments more leverage in saying ‘no’ to baddevelopment models that do not conform.
Community organizing can, at best, only ‘shore up’ WindyRidge, and our experience indicates that it is unlikely to causesystemic change. The overwhelming number of foreclosuresrevealed a complex set of contributing and enabling factors thatled to its current state of decline. Our critique of the planning anddevelopment process found that active planning did not occur inthe case of Windy Ridge and perhaps other declining neighbor-hoods. Through Charlotte’s culture of growth, the regulatory ca-pacity of the planning department had all but been given over tothe marketplace. Ultimately, the market failed this neighborhoodin many ways e from real estate and lending practices to thegeography of housing that concentrated and isolated poverty.Windy Ridge was doomed from the start e surrounded by
10 The City of Charlotte has adopted a Sustainability Index and Smart Growthprinciples for use in evaluating land development projects that have requested Cityparticipation in transit corridor, business district, and neighborhood infill areas.Parameters of this index include the project’s potential to support healthy neigh-borhoods, expand transit choices, promote design for livability, and safeguard theenvironment (see Bacot, 2008). The application of these principles to the privatedevelopment process could have a significant effect on the quality and sustain-ability of new neighborhoods in Charlotte.
J. Sorensen et al. / Applied Geography 51 (2014) 8e25 21

Author's personal copy
industrial and hazardous land uses, isolated from transportationand support services, poorly designed with few amenities tomaintain property values or to support healthy lifestyle choices,the municipal agencies responsible for oversight asleep at thewheel (or overpowered by lack of political support), and homeslargely purchased by absentee landlords. This, it seems, was aneighborhood built to fail.
Acknowledgment
The authors gratefully acknowledge the support of the Z. SmithReynolds Foundation in the undertaking of this research. We alsothank those residents who took the time to speak with the researchteam about their homes and neighborhood, and the guidanceprovided by the anonymous reviewers of this article.
Appendix A. News and media articles with major references to Windy Ridge.
Newspaper Title Author(s) Date
The CharlotteObserver
Charlotte City Staff to Gather Foreclosure Data RequestFollows Observer Report on Surge Since 1999
Appelbaum, B., and Crouch, M Jan. 26, 2006
Starter homes, sad endings: Part 2 of ‘Sold a Nightmare.’ Applebaum, B., L. Hammersly Munn & T.Mellnik
June 9, 2009
Foreclosure Aid Plan Outlined-Charlotte Wants toEducate Homeowners, Team with Nonprofit to HelpPeachtree Hills Funding will Likely be Diverted fromOther Sources, Official Says.
Barbour, C. April 28, 2008
Landlords Defaulting, and Renters Suffer. Carlock, C. and Kelly, F. July 14, 2008Suburban Decay Stuns City Leaders Council, Police Seekto Crack Down on Those who let Homes Decline.
Chandler, L. and Hopkins, S. Dec. 12, 2007
New Suburban in Fast Decay-Foreclosures in StarterNeighborhoods Lead to Vacancies and Crime Easy-Credit Loans Meant Overextended Homebuyers,Concentration Problems.
Chandler, L., Mellnik, T., and Hopkins, S. Dec. 9, 2007
Council OKs Homes Over Neighbors’ Fuss e ResidentsSay Already Foreclosures Hurt Area.
Crouch, M. Jan. 19, 2005
Starter Homes Face New Scrutiny-Neighbors ComplainLow-Cost Houses Drive Property Values Down.
Crouch, M. Jan. 19, 2005
Construction Rolls on in Foreclosures Zones-Bunchingof Starter Homes Fuels Concern Over Growth Policies.
Hopkins, S., Mellnik, T., Klemmer, S.,Wygand, M., Onge, P., and Chandler, L.
Dec. 16, 2007
Job Growth Sags, But New-Home Growth Soars-Building Permits Up 6% Over 2000 Pace as Interest RatesLure Buyers.
Lunan, C. Oct. 11, 2003
Foreclosures-Mapping Mecklenburg’s MortgageFailures.
Mellnik, T., Hammersly, L., Appelbaum,B., and Pitzer, W.
Jan. 15, 2006
Growth May not Always Mean Prosperity Newsom, Mary Jan. 7, 2011An Idea to Help Residents “Hang On”eNonprofitWantsto Buy Homes, Offer Them as Lease-Purchases.
Oliver, J., Wygand, M., and Mellnik, T. April 6, 2008
Agents: Tax Value’s Role in House Sale is Subtle. Portillo, E. and Hammersly, L. Feb. 21, 2011Habitat Finds Buying is Cheaper-Instead of BuildingHomes, Charlotte’s Agency is One of the First In the U.S.to Buy Vacant Foreclosed Houses and Fix Them.
Price, M. July 5, 2009
American Dream’s Flip Side: Big Bills-More CharlotteBlacks Buying Homes, But 1 in 8 Struggling GrowingNumbers Paying More Than Half of Income on Housing,New Report Says.
Rubin, R. June 24, 2004
Donovan: More ‘UD’ in HUD. Stodghill, R. April 4, 2010
Associated Press Neighborhood hit by mortgage crisis battles back. Geller, A. March 26, 2011UNC Charlotte
magazineForeclosure Fallout Patterson, L.A. Quarter 1 2011
Online publications Title Author(s) Date
Building ResilientRegions
The (Foreclosure) Tale of Two Developments: A Sense ofCommunity Makes One More Resilient
Institute of Governmental Studies TheUniversity of California Berkley
May 22, 2012
Habitat for Humanity Tests a New Model for Rebuildingafter Foreclosures in Charlotte
Institute of Governmental Studies TheUniversity of California Berkley
May 15, 2012
Atlantic Monthly The Next Slum? Leinberger, C. Mar-08Fast Company Suburbia R.I.P. Does the downturn spell the beginning of
the end for suburbia? Some Experts say yesterday’s cul-de-sac is tomorrow’s ghost town.
Cannell, M. March 11, 2009
Plan Charlotte Celebrating student ties to communities. Krewson, A. April 27, 2012Plan Charlotte Can Windy Ridge Finally Find Stability? McCann, J. Aug. 30, 2012
J. Sorensen et al. / Applied Geography 51 (2014) 8e2522
Author's personal copy
Appendix B. Windy Ridge neighborhood survey instrument.
Thank you for agreeing to participate in this survey. The goal of thissurvey is toprovideeachresidentofWindyRidge thechance toofferanopinion about life in the community. A research teamatUNCCharlotteplans to use the results of the anonymous survey to customizeneighborhood organization efforts throughout the next year.
The survey should take between 5 and 10min. At the conclusionof the survey, you will be offered the opportunity to participate in afocus group to discuss neighborhood issues in more detail. If youchoose to participate in the focus group, wewill ask for your phonenumber and email address to contact you with potential dates.
1. In what month and year did you move to Windy Ridge?2. Where did you live before moving to Windy Ridge?3. Why did you choose to move to Windy Ridge? Were there
other neighborhoods you considered?4. How satisfied are you with policing services in Windy Ridge
and why?5. What method of transportation do you most commonly use
to get around?6. Where do you do most of your grocery shopping?7. Do you ride the CATS bus? If so, how often? Are you satisfied
with its service?8. How many “friends” would you say you have in Windy
Ridge?9. Do you know that Windy Ridge has a neighborhood
association?10. Are you interested in becoming more involved with the
neighborhood association?11. Do you have any special talents or skills that you would be
willing to use to benefit the community?12. How safe do you feel in Windy Ridge?13. What factors contribute to or detract from your sense of
safety in the community?14. Do you think that having a public gathering space, such as a
park, playground, gazebo, or community garden would bebeneficial to the community? Why or why not?
Windy Ridge Neighborhood Survey e with resident responses
1. In what month and year did you move to Windy Ridge?
Most respondents had lived in the community only a few months.In fact, 53% of households reported living in Windy Ridge for less than20 months.
2. Where did you live before moving to Windy Ridge?
An overwhelmingmajority of respondents (88%) had lived in thegreater Charlotte area before moving to Windy Ridge.
3. Why did you choose to move toWindy Ridge? Were there otherneighborhoods you considered?
40% of respondents reported moving toWindy Ridge because ofits location near major highways. Other common reasons forchoosing the neighborhood were the size and structure of homes,as well as the inexpensive rents.
4. How satisfied are you with policing services inWindy Ridge andwhy?
Overall, residents were satisfied with policing services. 48% re-ported being “very satisfied,”while 34%were “somewhat satisfied.”
5. What method of transportation do you most commonly use toget around?
Most residents we interviewed (81%) used a personal vehicle astheir primary mode of transport.
6. Where do you do most of your grocery shopping?
60% of residents reported shopping at WalMart, Food Lion, orHarris Teeter, all of which are on Mount HollyeHuntersville Road,approximately a 10-min drive from the community.
7. Do you ride the CATS bus? If so, how often? Are you satisfiedwith its service?
67% of respondents reported that they do not ride the CATS buson a regular basis. Of the 33% who stated that they did ride the bus,most (72%) reported being either very or somewhat satisfied withits services.
8. How many “friends” would you say you have in Windy Ridge?
Respondents did not report having many friends in the com-munity. 40% stated that they had no friends at all in the neigh-borhood, while 50% could name less than 5 friends.
9. Do you know thatWindy Ridge has a neighborhood association?
90% of respondents were aware of the neighborhoodassociation.
10. Are you interested in becoming more involved with theneighborhood association?
Residents were split on their willingness to become involvedwith the association. While 38% stated that they were, another 34%stated that they were not, and 28% were unsure.
11. Do you have any special talents or skills that you would bewilling to use to benefit the community?
Residents reported a variety of skills and talents, most notably:clerical skills, childcare, cooking, and outdoor work.
12. How safe do you feel in Windy Ridge?
Residents reported feeling very safe in Windy Ridge, with 86%reporting feeling either “very safe” or “somewhat safe.”
13. What factors contribute to or detract from your sense ofsafety in the community?
A variety of factors contributed to residents’ personal sense ofsafety, including their personal reputations, watchful neighbors, po-lice presence, and overall low crime in the community. Interestingly,many of the same factors contributed to residents’ perceptions ofbeing unsafe, including lack of police presence, suspicious neighbors,and high levels of crime. This issue should be investigated further.
14. Do you think that having a public gathering space, such as apark, playground, gazebo or community garden would bebeneficial to the community? Why or why not?
Most residents (84%) support a public gathering spot. 98% ofthose stated that a park or playground for children would be ideal.
J. Sorensen et al. / Applied Geography 51 (2014) 8e25 23

Author's personal copy
Appendix C. Windy Ridge development time series.
References
Agpar, W., & Duda, M. (2005). The municipal cost of foreclosures: a Chicago case study.Homeownership Preservation foundation housing finance policy research papernumber 2005-1. Retrieved online from the Homeownership PreservationFoundation (Washington DC) December 3, 2010 http://www.hpfonline.org/content/pdf/Apgar_Duda_Study_Full_Version.pdf.
American Institute of Certified Planner’s Code of Ethics (AICP) (2009). Retrievedonline March 1, 2011 at http://www.planning.org/ethics/ethicscode.htm.
Appelbaum, B., & Crouch, M. (January 26, 2006). Charlotte city staff to gatherforeclosure data request follows observer report on surge since 1999. TheCharlotte Observer, 3B.
Applebaum, B., Hammersly Munn, L., & Mellnik, T. (2009). Starter homes, sadendings: part 2 of ‘Sold a nightmare.’. The Charlotte Observer. published June 9,2009.
Bacot, H. (2008). Civic culture as a policy premise: appraising Charlotte’s civicculture. Journal of Urban Affairs, 30(4), 389e417.
Bianco, K. (2008). The subprime lending crisis: causes and effects of the mortgagemeltdown. Retrieved online March 1, 2010 from Wolters Kluwer Law & Busi-ness’s website: http://www.business.cch.com/bankingfinance/focus/news/Subprime_WP_rev.pdf.
Bollens, S. A. (2005). Urban planning and intergroup conflict: confronting a frac-tured public interest. In B. Stiftel, & V. Watson (Eds.), Dialogues in urban andregional planning. New York: Routledge.
Bradford, C. (1979). Financing home ownership: the federal role in neighborhooddecline. Urban Affairs Quarterly, 14, 313e335.
Brooks, M. (2002). Planning theory for practitioners. Chicago: American PlanningAssociation.
Burawoy, M. (2005). 2004 Presidential address: for public sociology. American So-ciological Review, 70, 4e28.
Cannell, M. (2009). Suburbia R.I.P. fast company. Article retrieved online March 10,2010 from http://www.fastcompany.com/blog/michael-cannell/cannell/suburbia-rip.
Center for Responsible Lending (CRL). (August 2008). Updated projections of sub-prime foreclosures in the United States and their impact on home values andcommunities. CRL Issue Brief, Rev http://www.responsiblelending.org/
mortgage-lending/research-analysis/updated-foreclosure-and-spillover-brief-8-18.pdf Accessed 14.08.13.
Chandler, L., & Hopkins, S. (December 12, 2007). Suburban decay stuns city leaderscouncil, police seek to crack down on those who let homes decline. The Char-lotte Observer, 1A.
Chandler, L., Mellnik, T., & Hopkins, S. (2007, December 9). New suburban in fastdecay-foreclosures in starter neighborhoods lead to vacancies and crime easy-credit loans meant overextended homebuyers, concentration problems. TheCharlotte Observer, 1A.
City of Charlotte. (2008). Quality of life study. http://charmeck.org/QOL/Pages/Archive.aspx Accessed 01/2011.
Crouch, M. (2005a). Council OKs homes over neighbors’ fuss e residents say alreadyforeclosures hurt area. The Charlotte Observer, 3B.
Crouch, M. (2005b). Starter homes face new scrutiny-neighbors complain low-costhouses drive property values down. The Charlotte Observer, 3b.
Crump, J., Newman, K., Belsky, E. S., Ashton, P., Kaplan, D. H., Hammel, D. J., et al.(2008). Cities destroyed (again) for cash: forum on the U. S. foreclosure crisis.Urban Geography, 29, 745e784.
Fishman, R. (2005). The fifth migration. Journal of the American Planning Association,71(4), 357e366.
Flyvbjerg, B. (1991). Rationality and power. Democracy in practice. Chicago: TheUniversity of Chicago Press.
Francis, D. (Sept. 04, 2012). Anatomy of a boomtown: the real story behind the riseof Charlotte. The Atlantic Cities. http://www.theatlanticcities.com/jobs-and-economy/2012/09/anatomy-boomtown-real-story-behind-rise-charlotte/3129/Accessed 18.01.14.
Geller, A. (March 27, 2011). Trying to save a ‘neighborhood built to fail.’ NBCNEWS.com.http://www.nbcnews.com/id/42253202/ns/business-us_business/#.UvPw23m9ojE Accessed 06.02.14.
Hudson, B. (1979). Comparison of current planning theories: counterpartsand contradictions. Journal of American Planning Association, 45(4), 387e398.
Immergluck, D. (2009). Foreclosed: High risk lending, deregulation, and theundermining of America’s mortgage market. Ithaca: Cornell University Press.
Immergluck, D., & Smith, G. (2006). The impact of single-family mortgage fore-closures on neighborhood crime. Housing Studies, 21(6), 851e866.
Map C-1. Historical development of the Windy Ridge site. The aerial images show the neighborhood taking shape from 1993 to 2013. In the 2002 image, the complete clear cuttingof the site is visible, along with the eradication of a wetland area visible in the 1993 image. In all four images, active train traffic can be seen, despite the random nature of thesatellite images. Extensive erosion is visible in the 2010 and 2013 images, resulting from improper grading and the loss of the site’s topsoil during construction without sufficientreplacement.Source: Google Earth.
J. Sorensen et al. / Applied Geography 51 (2014) 8e2524

Author's personal copy
Jargowsky, P. A. (May 2003). Stunning progress, hidden problems: The dramatic declineof concentrated poverty in the 1990s. InThe living cities census series. The BrookingsInstitution, Center on Urban and Metropolitan Policy. Available online http://www.brookings.edu/w/media/research/files/reports/2003/5/demographics%20jargowsky/jargowskypoverty.
King, M. C. (Fall 2009). Recouping costs for repairing “Broken Windows”: the use ofpublic nuisance by cities to hold banks liable for the costs of mass foreclosures.Tort Trial & Insurance Practice Law Journal, 45(1), 15433234.
Kneebone, E., & Berube, A. (2013). Confronting suburban poverty in America. Wash-ington, DC: The Brookings Institution.
Leinberger, C. (1995). The changing location of development and investment op-portunities. Urban Land, 45(5), 31e36.
Leinberger, C. (March 2008). The next slum? The subprime crisis is just the tip ofthe iceberg. Fundamental changes in American life may turn today’s McMan-sions into tomorrow’s tenement. The Atlantic Magazine. Retrieved online onNovember 29, 2010 http://www.theatlantic.com/magazine/archive/2008/03/the-next-slum/6653/.
Lucy, W. H. (2010). Foreclosing the dream: How America’s housing crisis is reshaping ourcities and suburbs.Washington, DC: AmericanPlanningAssociation/Planners Press.
Lunan, C. (October 11, 2003). Job growth sags, but new-home growth soars-buildingpermits up 6% over 2000 pace as interest rates lure buyers. The CharlotteObserver, 1D.
Madden, J. F. (2003). The changing spatial concentration of income andpoverty among suburbs of large US metropolitan areas. Urban Studies,40(3), 481e503.
McKinney, S. A. (03/01/2010). The North Carolina banking institute symposium on theforeclosure crisis: Municipalities fight effects of foreclosure with litigation andneighborhood stabilization program grants (Vol. 14) (p. 257). North CarolinaBanking Institute.
Mellnik, T., Hammersly, L., Appelbaum, B., & Pitzer, W. (January 15, 2006). Fore-closures-mapping Mecklenburg’s mortgage failures. The Charlotte Observer, 9A.
Molotch, H. (1976). The city as a growth machine: toward a political economy ofplace. American Journal of Sociology, 82(2), 309e332.
Moreno, A. (1995). The cost-effectiveness of mortgage foreclosure prevention. Min-neapolis: Family Housing Fund.
Murphy, A. K. (2007). The suburban Ghetto: the legacy of Herbert Gans in under-standing the experience of poverty in recently impoverished American suburbs.City & Community, 6(1), 21e37.
Myers, D., & Ryu, S. (2008). Aging baby boomers and the generational housingbubble: foresight and mitigation of an epic transition. Journal of the AmericanPlanning Association, 74(1), 17e33.
Newsom, M. (January 7, 2011). Growth may not always mean prosperity. TheCharlotte Observer. http://www.charlotteobserver.com/2011/01/07/1963583/growth-may-not- always-mean-prosperity.html Accessed 28.01.11.
Portillo, E., & Hammersly, L. (February 21, 2011). Agents: tax value’s role in housesale is subtle. The Charlotte Observer. http://www.charlotteobserver.com/2011/02/11/2052585/buying-or-selling-tax-value-not.html Accessed 21.02.11.
Rittel, H., & Webber, M. (1973). Dilemmas in a general theory of planning. PolicySciences, 4, 155e169.
Sandercock, L., & Dovey, K. G. (2002). Pleasure, politics and the ‘public interest’:Melbourne’s riverscape revitalization. Journal of the American Planning Associ-ation, 68(2), 151e164.
Smith, H. A., & Graves, W. (2003). The corporate (re)construction of a newsouth city: great banks need great cities. Southeastern Geographer, 43(2),185e206.
Smith, N., Caris, P., & Wyly, E. (2001). The “Camden Syndrome” and the Menace ofsuburban decline: residential disinvestment and its discontents in Camden,New Jersey. Urban Affairs Review, 36(4), 497e531.
Steigerwald, B. (June 2001). City views: urban studies legend Jane Jacobs ongentrification, the new urbanism, and her legacy. Reason.
Teitz, M. B., & Chapple, K. (2007). The causes of inner-city poverty: eight hypothesesin search of reality. Cityscape, 3(3), 33e70.
U.S. Environmental Protection Agency EPA. (2014). EnviroMapper for envirofacts.http://www.epa.gov/emefdata/em4ef.home Accessed 05.02.14.
Vidmar, C. (2008). Sevenways foreclosure impacts communities. Retrieved onlineMarch2,2010 from NeighborWorks website http://www.nw.org/Network/neighborworksProgs/foreclosuresolutions/reports/documents/7ForeclosureImpacts.pdf.
Wilson, W. J. (1996). When work disappears: The world of the new urban poor.New York: Alfred A. Knopf.
J. Sorensen et al. / Applied Geography 51 (2014) 8e25 25