Embed Size (px)
Citation preview
arX
iv:a
stro
-ph/
0404
610v
1 3
0 A
pr 2
004
Astronomy & Astrophysics manuscript no. aa0035 February 2, 2008(DOI: will be inserted by hand later)
Wind clumping and the wind-wind collision zone in the
Wolf-Rayet binary γ2 Velorum ⋆
XMM-Newton observations at high and low state
H. Schild1, M. Gudel2, R. Mewe3, W. Schmutz4, A.J.J. Raassen3,5, M. Audard6, T. Dumm1, K.A. van derHucht3,5, M.A. Leutenegger6, and S.L. Skinner7
1 Institut fur Astronomie, ETH-Zentrum, CH 8092 Zurich, Switzerlande-mail: [email protected]
2 Paul Scherrer Institut, Wurenlingen & Villigen, CH 5232 Villigen PSI, Switzerlande-mail: [email protected]
3 SRON National Institute for Space Research, Sorbonnelaan 2, NL-3584 CA Utrecht, the Netherlandse-mail: [email protected]; [email protected]; [email protected]
4 Physikalisch-Meteorologisches Observatorium Davos, Dorfstrasse 33, CH 7260 Davos Dorf, Switzerlande-mail: [email protected]
5 Astronomical Institute ”Anton Pannekoek”, Kruislaan 403, NL-1098 SJ Amsterdam, the Netherlandse-mail: [email protected]
6 Columbia Astrophysics Laboratory, Columbia University, 550 West 120th Street, New York, NY10027, USAe-mail: [email protected]; [email protected]
7 Center for Astrophysics and Space Astronomy, University of Colorado, Campus Box 389, Boulder, CO 80309-0389, USAe-mail: [email protected]
version February 2, 2008. Received / Accepted
Abstract. We present XMM-Newton observations of γ2 Velorum (WR11, WC8+O7.5III, P = 78.53 d), a nearbyWolf-Ray binary system, at its X-ray high and low states. At high state, emission from a hot collisional plasmadominates from about 1 to 8 keV. At low state, photons between 1 and 4 keV are absorbed. The hot plasma isidentified with the shock zone between the winds of the primary Wolf-Rayet star and the secondary O giant. Theabsorption at low state is interpreted as photoelectric absorption in the Wolf-Rayet wind. This absorption allowsus to measure the absorbing column density and to derive a mass loss rate
.
M = 8×10⁻⁶ M⊙yr−1 for the WC8star. This mass loss rate, in conjunction with a previous Wolf-Rayet wind model, provides evidence for a clumpedWR wind. A clumping factor of 16 is required. The X-ray spectra below 1 keV (12 A) show no absorption and areessentially similar in both states. There is a rather clear separation in that emission from a plasma hotter than5MK is heavily absorbed in low state while the cooler plasma is not. This cool plasma must come from a muchmore extended region than the hot material. The Neon abundance in the X-ray emitting material is 2.5 timesthe solar value. The unexpected detection of C v (25.3 A) and C vi (31.6 A) radiative recombination continuaat both phases indicates the presence of a cool (∼ 40,000 K) recombination region located far out in the binarysystem.
Key words. binaries: spectroscopic — stars: early-type — stars: individual: γ2 Vel — stars: winds, outflows —stars: Wolf-Rayet — x-rays: individual: WR11, γ2 Velorum
1. Introduction
The massive Wolf-Rayet binary system γ2 Velorum(WR 11, WC8+O7.5III, P = 78.53d) is an astrophysical
Send offprint requests to: M. Gudel⋆ Based on observations obtained with XMM-Newton, an
ESA science mission with instruments and contributions di-rectly funded by ESA Member States and the USA (NASA).
laboratory in which many aspects of mass loss and wind-wind collision phenomena can be studied. The system isrelatively nearby, its Hipparcos distance is d = 258±35pc(van der Hucht et al. 1997; Schaerer et al. 1997). Bothstars in the binary have been recently investigated withsophisticated model atmospheres and their stellar param-eters are reasonably well known (De Marco & Schmutz1999, De Marco et al. 2000).
2 H. Schild et al.: XMM-Newton observations of γ2 Velorum (WC8+O7.5III)
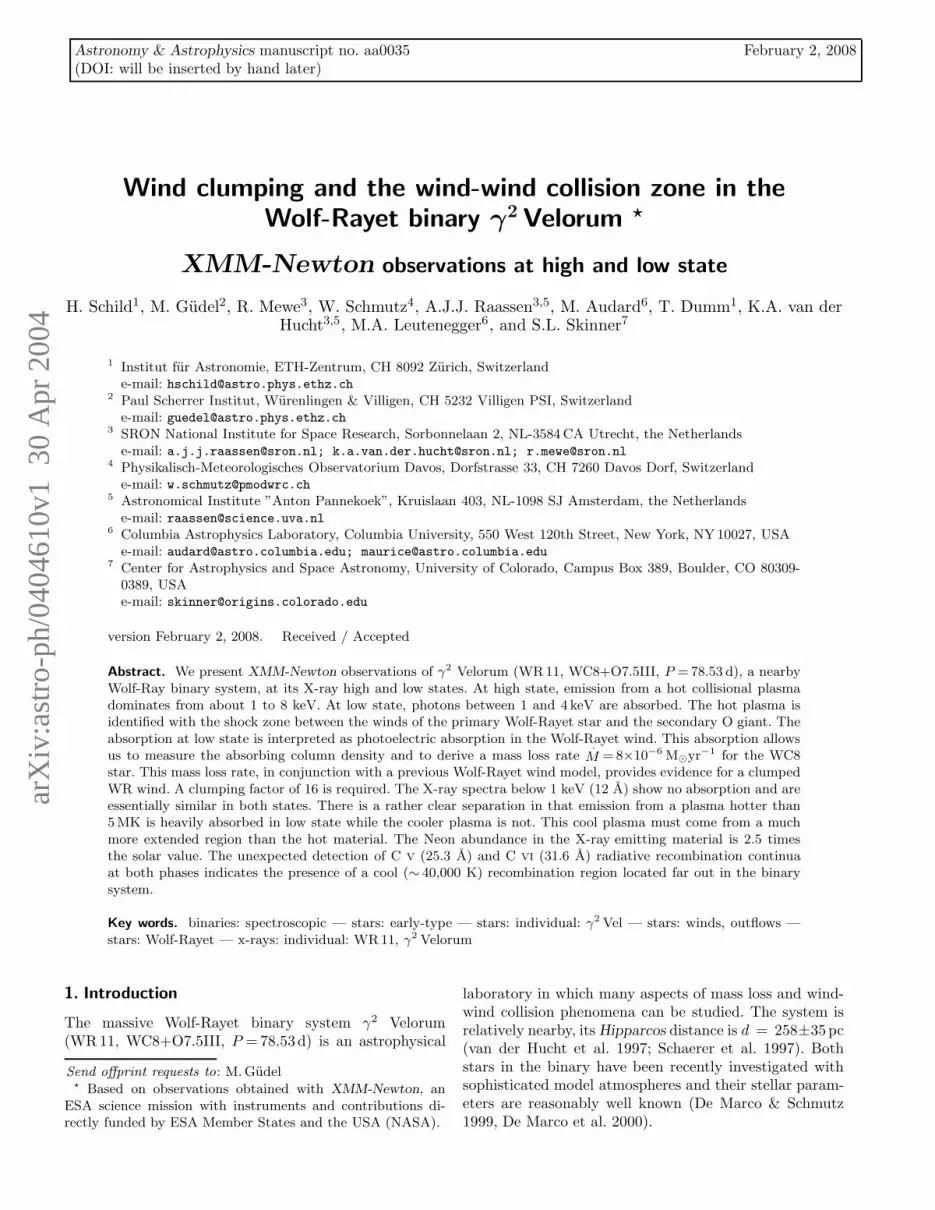
Fig. 1. Sketch of the γ2 Vel orbital configuration at thephases of our X-ray observations. The Wolf-Rayet star isat the center. Shape and orientation of the wind blowncavities around the O star are schematic only.
The binary orbit has been re-determined by Schmutzet al. (1997) who combined recent with earlier observa-tions (Niemela & Sahade 1980; Pike et al. 1983; Moffatet al. 1986; Stickland & Lloyd 1990). The orbit is mildlyeccentric and has an inclination of 63◦± 8◦ (De Marco& Schmutz 1999). Because of the high orbital inclination,any emitting structures are seen through changing absorp-tion columns as the stars revolve.
Since γ2 Vel is the nearest WR star, (see van der Hucht2001), it is relatively bright and well observable at anywavelength, in particular in the X-ray domain. It has beenobserved by all previous X-ray observatories, from theEinstein observatory (White & Long 1986; Pollock 1987)to ASCA (Stevens et al. 1996; Rauw et al. 2000), and,more recently, by Chandra (Skinner et al. 2001). Its X-rayobservational history has been reviewed by van der Hucht(2002) and Corcoran (2003).
With a series of ROSAT observations covering the bi-nary orbit of γ2 Vel, Willis et al. (1995) discovered thatthe X-ray emission is a factor of ∼ 4 enhanced during abrief time span when the O-type component is in front.They also showed that the steep increase takes place onlyin ROSAT ’s hard X-rays . They convincingly interpretedthe variable X-ray emission to arise from colliding stel-lar winds. The enhancement is explained by the viewinggeometry, when the collision zone can be seen througha rarefied cavity that builds around and behind the O-type component (see Fig. 1). At other phases the denseWR wind absorbs the X-rays from the collision zone. Thewind blown cavity is generally orientated away from theWC component but it is also somewhat warped becauseof the binary motion of the O star.
Here we present XMM-Newton observations of γ2 Vel,taken at two phases. The first phase is at the maximumX-ray flux, a few days after the O-type component passedin front of the WR star. The second phase is intermedi-ate between quadrature and superior conjunction. In thisconfiguration the O star is seen through a large portion ofthe extended WR atmosphere (Fig. 1).
After describing the observations and the most inter-esting spectral features we analyze the data in two differ-ent ways. First, we simply take the X-ray emitting zoneas a source of light with which the WR wind is irradiated.The observed absorption changes between different orbitalphases provide unique information about the structure ofthe WR wind. Secondly, we interpret the X-ray emissionat both phases by a spectral fitting procedure. This revealsnew insights into the geometric and thermal structure andthe elemental composition of the wind-wind collision zone.
2. Observations
The log of our XMM-Newton observations of γ2 Vel is pre-sented in Tab. 1. A description and a preliminary analy-sis of the observations are given by Dumm et al. (2003).Technical information on XMM-Newton and its X-ray in-strumentation can be found in den Herder et al. (2001),Jansen et al. (2001), Struder et al. (2001), and Turner etal. (2001).
Table 1. Log of our XMM-Newton observations of γ2 Vel.For a definition of the phase see text of Section 2.
high state low state high state low stateφ = 0.12 φ = 0.34 φ = 0.11 φ = 0.378-11-2000 26-11-2000 14-4-2001 5-5-2001
instr. exp. t. exp. t. exp. t. exp. t.(hr) (hr) (hr) (hr)
RGS1 4.29 5.80 8.72 16.81RGS2 4.51 5.80 8.72 16.81MOS1 3.76 5.74 8.56 16.64MOS2 3.83 5.77 8.56 16.64PN 2.78 4.16 7.83 15.14
Our observations were obtained at phases φ≃ 0.11and φ≃ 0.37. The phase φ is calculated according to theephemeris of Schmutz et al. (1997). With this ephemeris,periastron occurs at zero phase, the O-type component isin front shortly afterwards at φ = 0.03 and the WR isin front at phase 0.61. The observations were scheduledaccording to the X-ray light curve of Willis et al. (1995).The first phase covers the short maximum, whereas at thesecond phase the X-ray flux is low. The two observationsof November 2000 were both terminated prematurely be-cause of strong solar radiation and, therefore, the exposuretimes of the first two observations are considerably shorter
H. Schild et al.: XMM-Newton observations of γ2 Velorum (WC8+O7.5III) 3
low state
high state
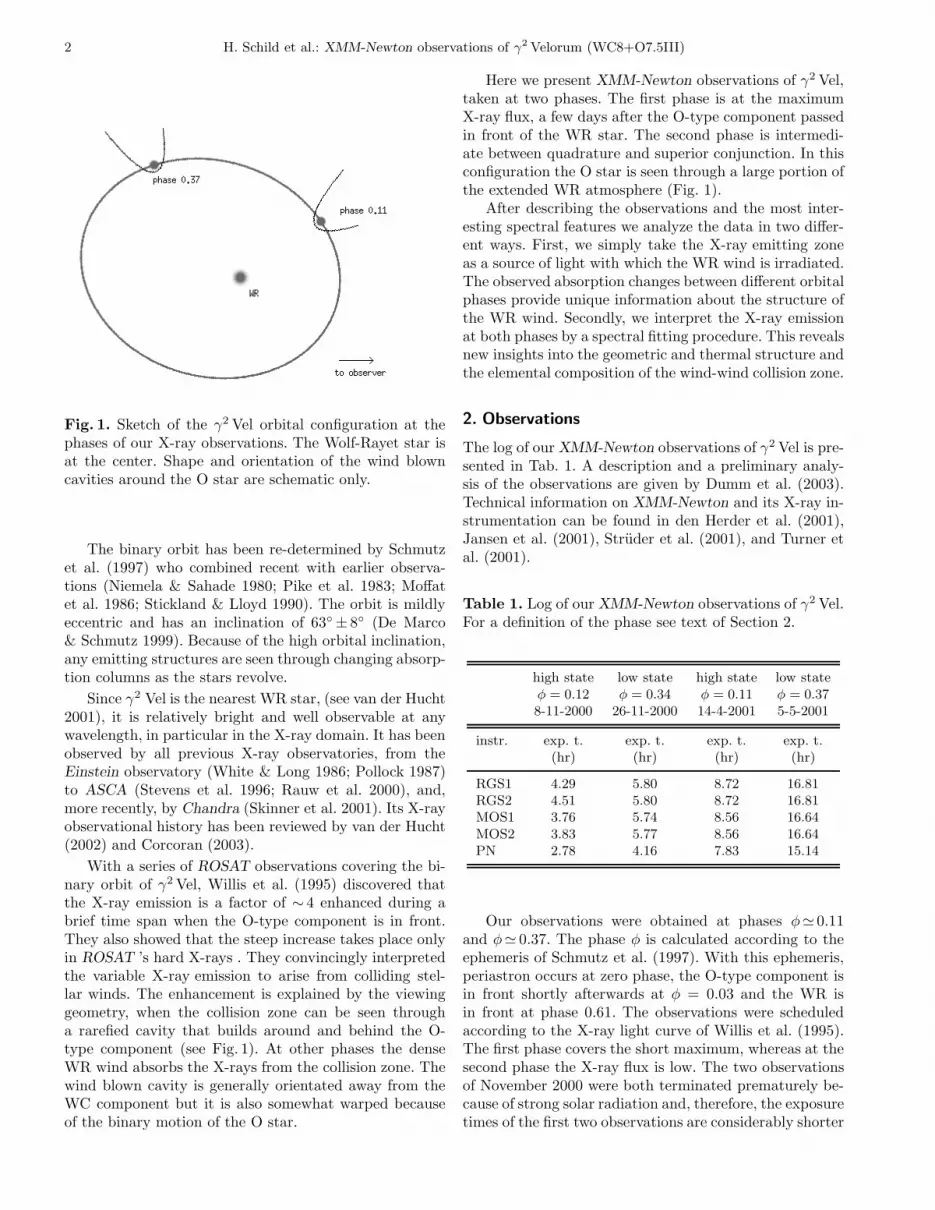
Fig. 2. First order background subtracted XMM-rgs
spectra of γ2 Vel, corrected for effective area. The spec-tra observed at high (φ=0.11) and low state (φ= 0.37)are plotted. The inset shows a blow-up of the φ=0.37observation.
than those of April and May 2001. Within the error barsthe observations at corresponding phases agree with eachother. Here we use only the second data set.
The spectra were obtained with the XMM-Newton
european photon imaging cameras (epic), mos andpn, and with the high-resolution reflection gratingspectrometers (rgs). The rgs have an energy coveragefrom 0.35 to 2.5 keV (5 to 37 A), and the epic can exploitthe full XMM range from 0.15 to 15keV (0.8 to 83 A).
The data have been reduced with standard proceduresusing the XMM-Newton science analysis system (sas),with the available calibration data. The epic responsematrices from the epic instrument team have been usedto fit the ccd spectra. The rgs1 and rgs2 spectra havebeen co-added. No correction for interstellar absorptionhas been applied.
3. Spectral features and variability
In this section we highlight and discuss selected featuresof the observed X-ray spectra. We apply simple analy-sis techniques in order to get some indications about theunderlying excitation, ionization and absorption mecha-nisms.
3.1. The emission lines
Our high-resolution (rgs) spectra are shown in Fig. 2.Line identifications and measured line fluxes are listed inTab. 2. The line fluxes given by Skinner et al. (2001) andtaken at phase 0.08 lie mostly between our high and lowline state line fluxes. This is consistent with the steep in-crease in X-ray intensity at early phases.
Table 2. Measured line fluxes (in 10−13 erg cm−2s−1) atEarth with 1σ errors in parenthesis.
ion E0 Eobsa λ0 flux
(keV) (keV) (A) high low
EPIC-MOS:Fexxv 6.701 6.669(10) 1.85 3.2(.3) 3.9(.2)
6.637Caxix 3.903 3.919(22) 3.2 1.1(.2) 0.66(.12)
3.861Arxvii 3.140 3.151(7) 4.0 2.0(.2) 0.41(.11)
3.104Sxvi 2.6229 2.653(14) 4.7 1.2(.3) 0.28(.16)
2.6196Sxv 2.4607 2.466(4) 5.0 6.0(.3) 0.61(.11)
2.44732.4306
Sixiii 2.1826 2.188(11) 5.7 1.2(.3) 0.05Sixiv 2.0062 2.019(4) 6.2 3.2(.3) 0.05(.04)
2.0043Sixiii 1.8650 1.877(4) 6.7 5.5(.3) 0.30(.07)
1.85391.8395 1.833(9) 2.7(.2)
Mgxii 1.4721 1.480(5) 8.42 1.6(.1) 0.11(.04)Mgxi 1.3523 1.349(3) 9.17 2.2(.2) 0.30(.04)
1.3431 9.231.3312 9.31
RGS:Sixiv 2.0062 2.00(1) 6.2 2.4(.9) –
2.0043Sixiii 1.8650 1.859(3) 6.7 10.1(1.2) 0.43(.27)
1.85391.8395
Mgxii 1.4721 1.474(2) 8.42 2.4(.4) –Mgxi 1.3523 1.3518(10) 9.17 2.2(.4) 0.13(-)
1.3431 1.3336(20) 9.23 1.6(.5) 0.09(.07)1.3312 9.31
Nex 1.2109 1.2120(14) 10.24 0.67(.18) 0.14(.06)Nex 1.0218 1.0258(16) 12.13 1.19(.20) 0.24(.08)Ne ix 0.9220 0.9223(6) 13.44 0.59(.18) 0.60(.11)
0.9148 0.9148(18) 13.55 0.24(.16) 0.16(.10)0.9050 0.9038(9) 13.70 0.19(.14) 0.34(.09)
Fexvii 0.8258 0.8279(23) 15.01 0.21(.08) 0.15(.06)Oviii 0.7746 0.7762(25) 16.01 – 0.07(.05)Fexvii 0.7392 0.7396(8) 16.78 0.14(.07) 0.10(.03)Fexvii 0.7271 0.7286(-) 17.05 0.11(.07) 0.07(.05)Fexvii 0.7251 0.7246(-) 17.10 – 0.12(.06)Oviii 0.6536 0.6543(20) 18.97 – 0.17(.05)Ovii 0.5739 0.5742(31) 21.60 – 0.12(.08)Ovii 0.5686 0.5678(-) 21.80 – 0.03(-)Ovii 0.5610 0.5600(17) 22.10 – 0.13(.06)Nvii 0.5003 0.5009(10) 24.78 – 0.24(.13)Cvi RRC 0.4900 0.4911(3) 25.30 0.30(.09) 0.40(.07)Cvi 0.4356 0.4357(10) 28.47 0.16(.11) 0.06(.03)Nvi 0.4198 0.4188(3) 29.53 0.14(.08) 0.07(.04)Cv RRC 0.3921 0.3927(8) 31.60 0.18(.13) 0.12(.06)Cvi 0.3675 0.3679(4) 33.74 0.31(.08) 0.35(.09)
a: From high (or low) state for Eobs > (or <) 1 keV, resp.

4 H. Schild et al.: XMM-Newton observations of γ2 Velorum (WC8+O7.5III)
23 24 25 26 27wavelength (A)
-1.0•10-4
-5.0•10-5
0
5.0•10-5
1.0•10-4
1.5•10-4
2.0•10-4
2.5•10-4
coun
ts s
-1 A
-1
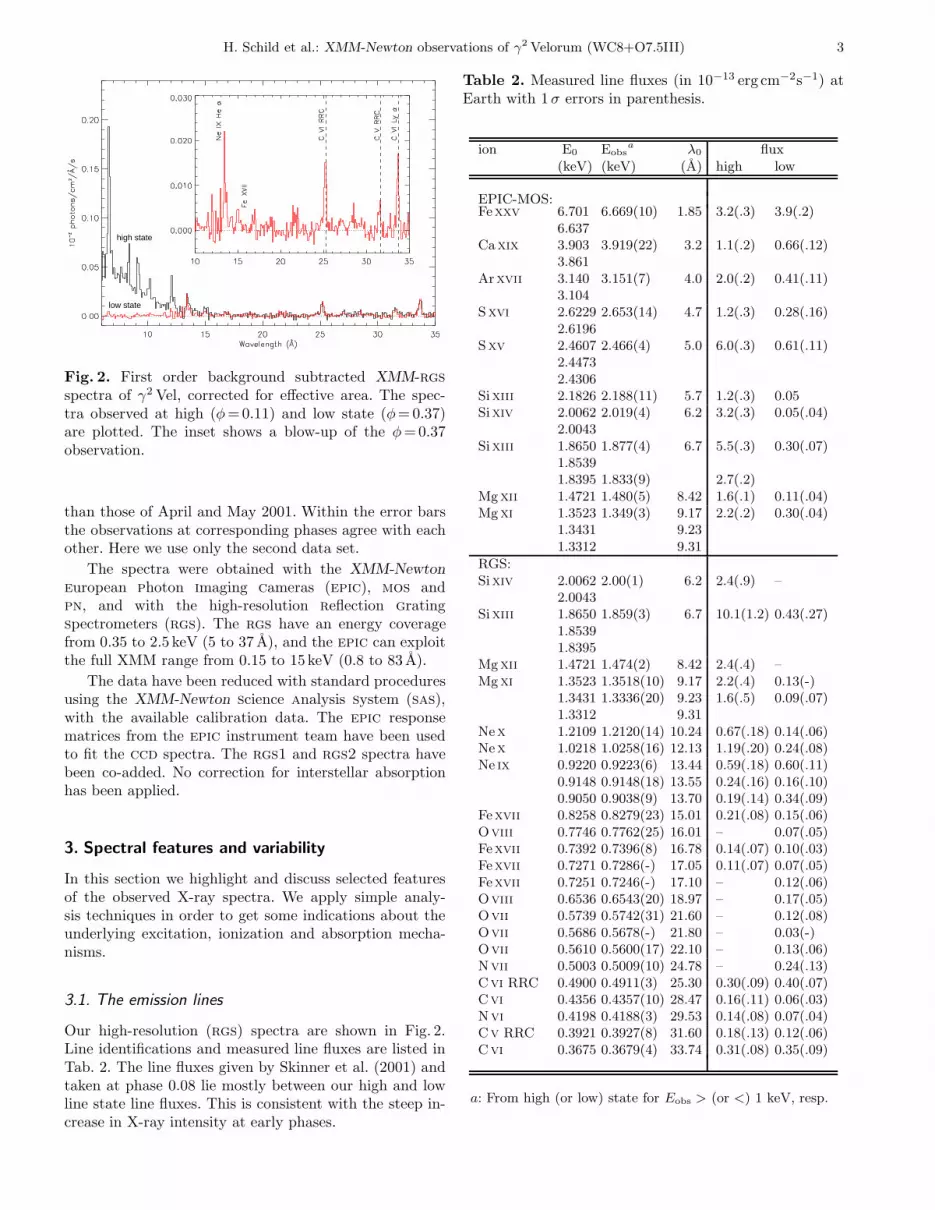
Fig. 3. Observed Cvi recombination continuum with thetheoretically calculated energy distribution folded withthe XMM-rgs response function. The profiles corre-spond to electron temperatures Te = 80 000K, 40 000K,and 20 000K (from wide to narrow).
3.1.1. Carbon recombination features
Surprisingly we find among these emissions the radiativerecombination continua (RRC) of Cvi and Cv at 25.3 Aand 31.6 A, respectively (Fig. 2). Also the Cvi Lyα lineis clearly detected. The intensity of this line with respectto the RRC is in agreement with it being formed by re-combination. The shape of the high energy tail of theRRC is a direct measure of the temperature of the re-combining electrons. In Fig. 3 we compare the observedCvi RRC with the theoretically calculated spectral distri-bution for different electron temperatures convolved withthe rgs response curve. The temperatures between about60 000K and 20 000K agree with the observed energy dis-tribution. This temperature is too low for collisional ion-ization and implies that radiation may be the dominatingionization process. A possible radiation source could bethe X-ray emission from the wind-wind collision zone.
3.1.2. Line width
The Ovii and Oviii emission lines in the low state spec-trum of γ2 Vel, and the Cvi Lyα (33.74 A) line in thehigh and low state spectra, show some measurable broad-ening. Fitting the Cvi line with an instrumental pro-file results in fwhm =1.8± 0.8×10⁻³ keV for both, lowand high state, corresponding to an expansion velocityof the order of 1300km s−1. Such velocities are compa-rable to those found in the Chandra-hetgs spectrum ofγ2 Vel for He- and H-like lines of Mg, Si, and S (Skinneret al. 2001), and are close to the terminal wind velocityv∞ = 1450kms−1 of the WC star, as found from infraredHe i lines by Eenens & Williams (1994).
Fig. 4. Ne ix triplet consisting of a resonance line (r),an intercombination line (i), and a forbidden line (f) forγ2 Vel (top and center) and for the O9.7Ib star ζ Ori (bot-tom), observed with XMM-rgs. Note the difference in theforbidden line.
3.1.3. The Ne ix lines
Figure 4 shows the resonance (r), intercombination (i)and forbidden (f) components of the He-like Ne ix tripletof γ2 Vel (WC8+O7.5III) and compares it with with thesame lines observed by XMM-Newton-rgs in the O-type

H. Schild et al.: XMM-Newton observations of γ2 Velorum (WC8+O7.5III) 5
system ζ Ori (O9.7Ib+ O8-9V+B2III, see Hummel et al.2000).
The forbidden line in γ2 Vel is much stronger than inO stars. In γ2 Vel the ratio R =f/i at low state is con-sistent with R0=3.1, the value expected when excitationsfrom the upper level of the forbidden line to the upperlevels of the intercombination line are negligible. This isin contrast to observations of single O-type stars (Schulzet al 2000, Kahn et al 2001, Waldron & Cassinelli 2001,Cassinelli et al 2001, Miller et al 2002, Raasen et al 2004),where R is smaller. In these O stars, the X-ray emittingplasma is formed relatively close to the star, and UV pho-toexcitation from the upper level of the forbidden to theupper levels of the intercombination line is responsible forthe observed ratio. The high R ratio observed in gammaVel implies that the Ne IX lines are formed far away fromthe O star, where the UV flux is low.
Our observation of the Ne ix triplet at high state(Fig. 4, central panel) is much noisier. Although the totalflux is approximately the same, the exposure time is abouthalf as long, and the statistics are correspondingly worse.The R ratio appears to be closer to about 1 in this case,as compared to R0=3.1, but it is not clear whether thisis statistically significant. Chandra HETG obervations ofgamma Vel at a similar phase find R > 2
3R0 for Ne ix
(Skinner et al. 2001).
A lower limit to the distance from the O star at whichthe Ne ix lines are formed can be calculated using the for-malism of Blumenthal, Drake & Tucker (1972). The de-pendence ofR/R0 on radius can be writtenR/R0 = 1/(1+ψ/ψc) where ψc = 7.73×10³s−1, ψ = ψ∗(1−
√
(1−(R∗
r )2)),
and ψ∗ = 106 s−1 is the photoexcitation rate at 1278 Aat the photosphere which is calculated with a TLUSTYmodel (see Lanz & Hubeny, 2003) with log g=3.75 andT=35000 . Taking R > 2
3R0, we find r > 11R∗, with R∗
the photospheric radius of the O star. The biggest uncer-tainties are the photospheric UV flux, which is a strongfunction of wavelength due to the many aborption linesnear this wavelength, and the f/i ratio itself.
It is clear that the Ne IX emission is not coming fromanywhere near the O star, and this essentially rules outthe possibility that it arises due to intrinsic X-ray emissionfrom the stellar wind of the O star.
We finally note that the deduced emission measure ofthe Ne ix lines is surprisingly small (Dumm et al. 2003)compared to the emission measure of the single O4I(n)fstar ζ Pup (Kahn et al. 2001).
3.2. Absorption at low state
Fig. 5 shows our XMM-epic spectra at the low and highstates. At very low and very high energies the spectraare identical, but at intermediate energies the low statespectrum shows a deep depression. At ∼ 2 keV the photonflux is reduced by more than an order of magnitude. Atlow state, a flux deficiency is detected between about 1 and4 keV. The emission lines also show a different absorption
Fig. 5. XMM-epic-mos data of γ2 Vel at low and highstate (full lines), observed in 2001. The dotted line is thehigh state spectrum absorbed by the column density pre-dicted by a smooth WR wind model. The dashed line isthe same with a column density reduced by a factor of 4(see text).
behaviour. Some lines are heavily absorbed while othersare not:
– The absorbed component: At phase φ=0.37, the hardemission lines are all reduced by a large factor with theexception of the Fexxv complex at 1.85 A. (Tab. 2).The lines of the highly ionized species of Ar, S, Si, andMg which are very strong at high state are barely de-tectable at low state. We therefore expect that theselines originate in the deeply embedded wind-wind col-lision zone.
– The unabsorbed component: There is no measurableline flux variations longward of 13 A. We detect herelines from the Fexvii, Ne ix, Oviii, Ovii, and Cvi
species. The radiative recombination continua (RRC)of Cvi 25.3 A and Cv at 31.6 A are also not absorbed.These practically unchanging emissions are formed fur-ther out in the binary system, such that any wind ma-terial between us and the emission region is transpar-ent. We note that the unabsorbed emissions originatefrom two different mechanisms, i.e., from collisionalexcitation and recombination.
4. Absorption by the Wolf-Rayet wind
4.1. The absorption column and mass loss rate
To interpret the absorption at phase 0.37, we adopt theview of Willis et al. (1995) and Stevens et al. (1996), inthat we assume that the high-energy X-rays emerge fromthe wind-wind collision zone. These X-rays are attenuatedby the surrounding material of the WR wind, except forthe phase where we view the collision zone through the

6 H. Schild et al.: XMM-Newton observations of γ2 Velorum (WC8+O7.5III)
cavity behind the O-type component (see Fig. 1). The at-tenuation of the X-rays during low phase is a direct mea-sure of the column density in the WR wind. The contri-bution of the O star wind and the shock zone to the totalabsorption column is small compared to the WR wind andwe neglect it.
We calculate the expected absorption at phase φ =0.37 by using a smooth WR wind model that was es-pecially developed for γ2 Vel (De Marco et al. 2000, isa
model). We approximate the position of the X-ray sourcewith the O star itself. The location of the stagnation pointis given by the wind momentum balance
λ =
√
.
MWR vWR.
MO vO= 5.9 (1)
This high λ ratio, obtained with the mass loss data ofDe Marco & Schmutz (1999) and De Marco et al. (2000)implies that the collision zone is indeed very close to theO-type component.
The low state spectrum is calculated by using the highstate spectrum as input and passing it through the ab-sorption column from the position of the O star to theobserver. We implicitely assume that the X-ray emissiondoes not vary with phase. This is not necessarily correctbecause theoretically, we might expect a X-ray luminositythat is inversely proportional to the instantaneous binaryseparation (Usov 1992). Since, however, we do not see anysignificant difference between high and low state above4.5 keV (< 2.7 A), we believe that the assumption of aconstant X-ray emission is reasonably well justified.
The WR atmosphere model includes helium, carbonand oxygen abundances and their ionization states. Neonis assumed to be doubly ionized and its abundance is setto Ne/He =4×10⁻³ (by number) as determined from ISO-sws spectroscopy (Dessart et al. 2000). The magnesiumand silicon abundances are set to 1/10th of the neon abun-dance, and for the sulfur abundance we adopt 1/20th ofthe neon abundance. Errors in these abundances only havea marginal effect on the overall appearance of the emergingspectrum. Analytical fits for the partial photo-ionizationcross sections given by Verner & Yakovlev (1995) are used.
In Fig. 5 we indicate by the dotted line the attenuationat phase φ= 0.37 predicted by this WR wind model. Theabsorption by this WR wind is substantially too high. If wetreat the column density as a free parameter and adjust itto fit the observed attenuation, we derive a column densityofNtot=5×1021 cm−2. This is a factor 4 smaller than whatit would be in the WR wind model.
From the observed colum density we can calculate adistance-independent mass loss rate of 8×10⁻⁶ M⊙/yr forthe WC8 star. The dominating error source in this value isuncertainties in the chemical composition, particularly inthe carbon and oxygen abundances because these elementsdominate the opacity in the wind. A further but probablyminor factor is the assumption of spherical symmetry inthe extended WR atmosphere.
4.2. Wolf-Rayet wind clumping
The fact that the mass loss rate of the WC8 star deter-mined through X-ray absorption is a factor of four lessthan what is predicted by a homogeneous atmosphericmodel deduced from spectral line fits is easily interpretedin terms of Wolf-Rayet wind clumping.
Clumping of a stellar wind can be described in a simpleway by the clumping factor f . This factor defines by howmuch the density nclumped is enhanced in a clump withrespect to the smooth density nsmooth
nclumped = f × nsmooth (2)
The interclump volume is assumed to be devoid of ma-terial. In order to keep the total amount of material thesame in the clumped and the smooth model, the clumpsonly fill a volume that is 1/f of the volume of the smoothmodel. The volume filling factor is thus the inverse of theclumping factor.
Vclumped =Vsmooth
f(3)
WR model atmospheres resulting from emission linefits can not easily disentangle the effects of mass loss andclumping. Locally, the intensity of a WR emission line isdetermined by n2, with n the local particle density. Thetotal line emission in a smooth model is
I ∝
∫
Vsmooth
n2smooth dV ∝
.
M2
(4)
.
M is the mass loss rate that follows from fitting themodel to the WR emission lines.
In the case of a clumped wind the line intensity be-comes
I ∝
∫
Vclumped
n2clumped dV (5)
=
∫
Vclumped
f2 n2smooth dV (6)
= f2
∫
Vsmooth
n2smooth
fdV (7)
∝ f×.
M2
(8)
The same line intensity can thus be produced by vari-ous combinations of the mass loss rate and the clumpingfactor.
Since f is larger than 1, a clumped wind always pro-duces stronger emission lines than a smooth wind with thesame amount of matter in it.
In the previous section we found from theX-ray absorption that the mass loss rate of the WRstar in γ2 Vel is only one fourth of the rate deduced froma smooth Wolf-Rayet wind model. In order to still fit theemission lines the clumping factor has to be
f = 16 (9)
H. Schild et al.: XMM-Newton observations of γ2 Velorum (WC8+O7.5III) 7
In this scheme, the volume filled by the clumps is thusonly 6%.
We note that this clumping factor follows fromour mass loss rate as determined from the observedX-ray absorption in conjunction with a Wolf-Rayet modelatmosphere that is based on UV, optical and IR emissionline fitting. The mass loss rate of the smooth model de-pends on the adopted distance d:
.
M ∝ d3/2. The model weuse is for d=258pc. If we adopt instead of the Hipparcos
distance the older value of d=450pc, the mass loss of thesmooth model would become 2.3 times larger. The massloss rate from the X-ray absorption, on the other hand, isnot affected by the distance. The X-ray deduced mass lossrate would in that case be about 9 times smaller than theone from the smooth model. The clumping would have tobe much more pronounced with a clumping factor as highas ∼ 80.
5. Synthesizing the X-ray emission
We now turn to the interpretation of the X-ray emission.In Sect. 3 we have already seen that the X-ray spectrumconsists of different components. In order to furtherdeepen the analysis we now develop synthesized spectra tomatch the full observed data at both low and high state.
5.1. The basic models
The spectra as discussed above obviously require syntheticmodels that should include hot thermal sources (predom-inantly for the emission between 1–10 keV) but also arecombination model (for the long-wavelength portion).The basic model components we use for the description ofall spectra are included in the SPEX software (Kaastraet al. 1996). For the hot thermal sources, we use opticallythin plasma models in collisional ionization equilibrium(cie models) as developed by Mewe et al. (1985, 1995).The underlying mekal data base is given as an extendedlist of fluxes of more than 5400 spectral lines. 1
The long-wavelength part of the spectrum is inter-preted with a model in which lines are formed by pureradiative recombination, e.g., C vi Lyα, β, γ lines at33.74 A, 28.47 A and 26.99 A, and the O vii lines at 21.6–22.1 A. The shape of the rrc at 25.3 A constrains thetemperature of the emitting gas to T ≃ 38 000± 7 500K(cf. Fig. 3). The rrc of C v at 31.6 A is also fitted by thismodel. Methodologically, this component is described bya temperature-jump model in spex for which we assumea relatively high starting temperature (e.g., 1 keV) anda steep temperature drop (of the order of a few 104 K),leaving the plasma in a purely recombining state.
In principle, each of the model components could haveits own set of abundances. Fortunately, however, we haverelatively good a priori knowledge of the composition ofthe two stellar winds, and we make the following plausibleassumptions.
1 http://www.sron.nl/divisions/hea/spex/version1.10/line/
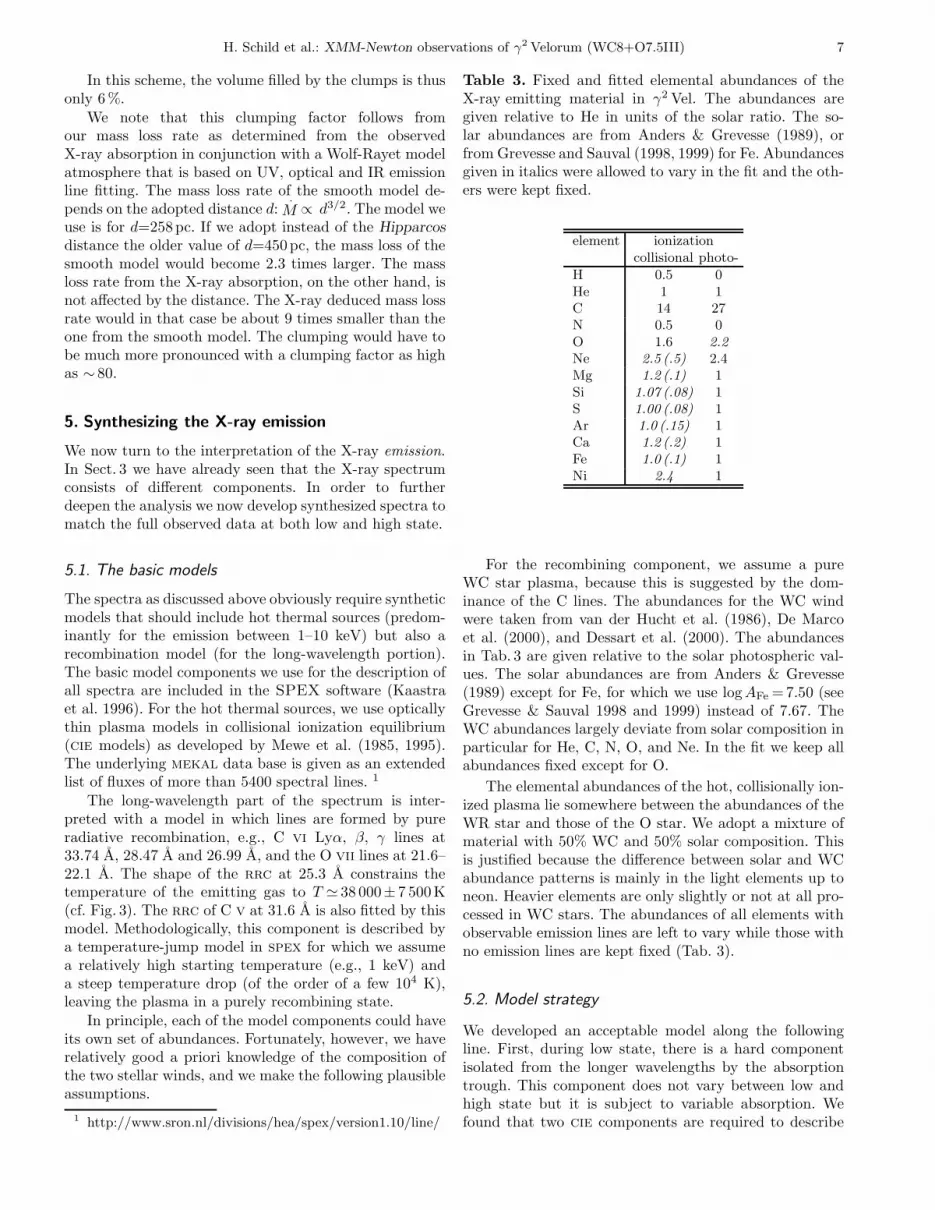
Table 3. Fixed and fitted elemental abundances of theX-ray emitting material in γ2 Vel. The abundances aregiven relative to He in units of the solar ratio. The so-lar abundances are from Anders & Grevesse (1989), orfrom Grevesse and Sauval (1998, 1999) for Fe. Abundancesgiven in italics were allowed to vary in the fit and the oth-ers were kept fixed.
element ionizationcollisional photo-
H 0.5 0He 1 1C 14 27N 0.5 0O 1.6 2.2Ne 2.5 (.5) 2.4Mg 1.2 (.1) 1Si 1.07 (.08) 1S 1.00 (.08) 1Ar 1.0 (.15) 1Ca 1.2 (.2) 1Fe 1.0 (.1) 1Ni 2.4 1
For the recombining component, we assume a pureWC star plasma, because this is suggested by the dom-inance of the C lines. The abundances for the WC windwere taken from van der Hucht et al. (1986), De Marcoet al. (2000), and Dessart et al. (2000). The abundancesin Tab. 3 are given relative to the solar photospheric val-ues. The solar abundances are from Anders & Grevesse(1989) except for Fe, for which we use logAFe =7.50 (seeGrevesse & Sauval 1998 and 1999) instead of 7.67. TheWC abundances largely deviate from solar composition inparticular for He, C, N, O, and Ne. In the fit we keep allabundances fixed except for O.
The elemental abundances of the hot, collisionally ion-ized plasma lie somewhere between the abundances of theWR star and those of the O star. We adopt a mixture ofmaterial with 50% WC and 50% solar composition. Thisis justified because the difference between solar and WCabundance patterns is mainly in the light elements up toneon. Heavier elements are only slightly or not at all pro-cessed in WC stars. The abundances of all elements withobservable emission lines are left to vary while those withno emission lines are kept fixed (Tab. 3).
5.2. Model strategy
We developed an acceptable model along the followingline. First, during low state, there is a hard componentisolated from the longer wavelengths by the absorptiontrough. This component does not vary between low andhigh state but it is subject to variable absorption. Wefound that two cie components are required to describe
8 H. Schild et al.: XMM-Newton observations of γ2 Velorum (WC8+O7.5III)
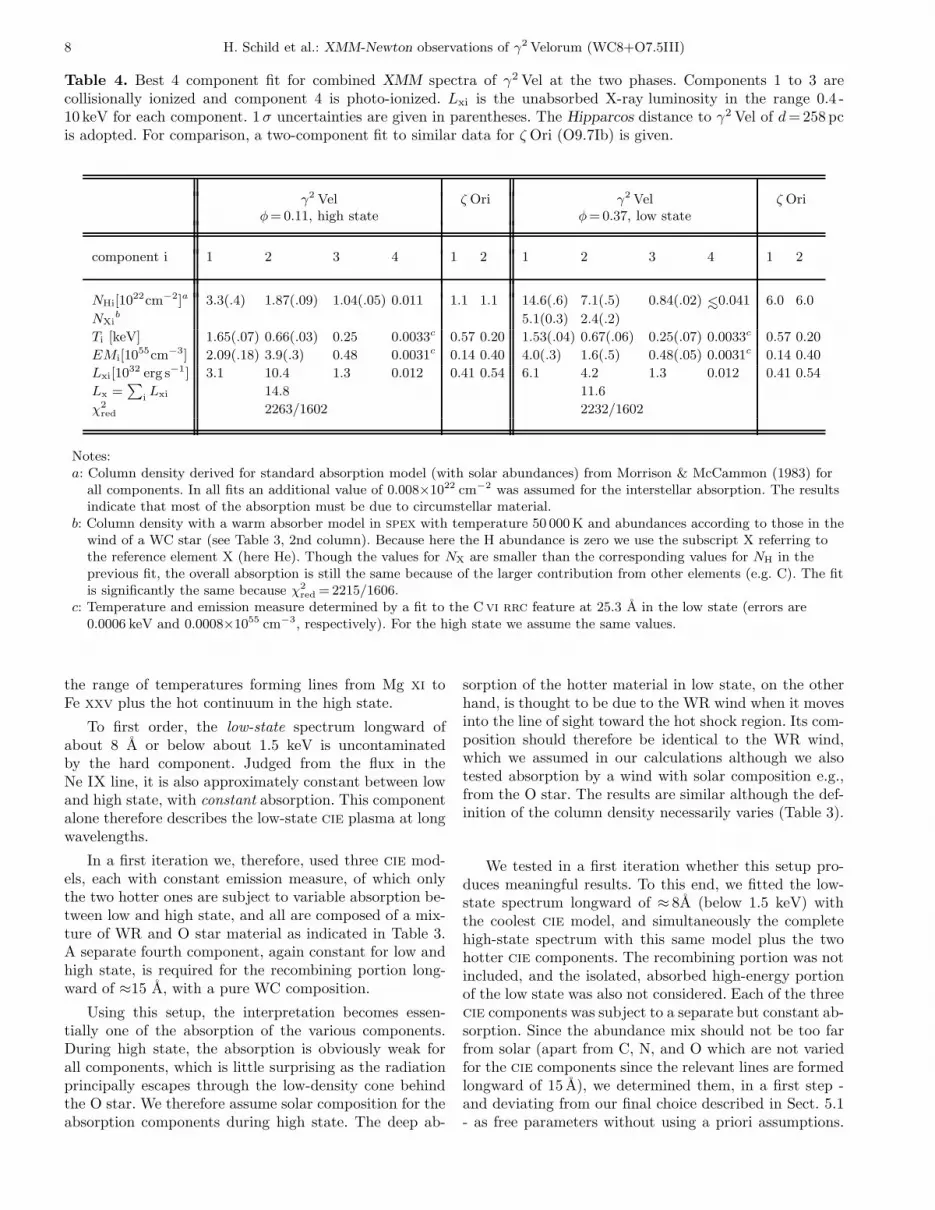
Table 4. Best 4 component fit for combined XMM spectra of γ2 Vel at the two phases. Components 1 to 3 arecollisionally ionized and component 4 is photo-ionized. Lxi is the unabsorbed X-ray luminosity in the range 0.4 -10 keV for each component. 1σ uncertainties are given in parentheses. The Hipparcos distance to γ2 Vel of d=258pcis adopted. For comparison, a two-component fit to similar data for ζ Ori (O9.7Ib) is given.
γ2 Vel ζ Ori γ2 Vel ζ Oriφ= 0.11, high state φ =0.37, low state
component i 1 2 3 4 1 2 1 2 3 4 1 2
NHi[1022cm−2]a 3.3(.4) 1.87(.09) 1.04(.05) 0.011 1.1 1.1 14.6(.6) 7.1(.5) 0.84(.02)
∼<0.041 6.0 6.0
NXib 5.1(0.3) 2.4(.2)
Ti [keV] 1.65(.07) 0.66(.03) 0.25 0.0033c 0.57 0.20 1.53(.04) 0.67(.06) 0.25(.07) 0.0033c 0.57 0.20
EMi[1055cm−3] 2.09(.18) 3.9(.3) 0.48 0.0031c 0.14 0.40 4.0(.3) 1.6(.5) 0.48(.05) 0.0031c 0.14 0.40
Lxi[1032 erg s−1] 3.1 10.4 1.3 0.012 0.41 0.54 6.1 4.2 1.3 0.012 0.41 0.54
Lx =∑
iLxi 14.8 11.6
χ2
red 2263/1602 2232/1602
Notes:a: Column density derived for standard absorption model (with solar abundances) from Morrison & McCammon (1983) for
all components. In all fits an additional value of 0.008×1022 cm−2 was assumed for the interstellar absorption. The resultsindicate that most of the absorption must be due to circumstellar material.
b: Column density with a warm absorber model in spex with temperature 50 000 K and abundances according to those in thewind of a WC star (see Table 3, 2nd column). Because here the H abundance is zero we use the subscript X referring tothe reference element X (here He). Though the values for NX are smaller than the corresponding values for NH in theprevious fit, the overall absorption is still the same because of the larger contribution from other elements (e.g. C). The fitis significantly the same because χ2
red = 2215/1606.c: Temperature and emission measure determined by a fit to the C vi rrc feature at 25.3 A in the low state (errors are
0.0006 keV and 0.0008×1055 cm−3, respectively). For the high state we assume the same values.
the range of temperatures forming lines from Mg xi toFe xxv plus the hot continuum in the high state.
To first order, the low-state spectrum longward ofabout 8 A or below about 1.5 keV is uncontaminatedby the hard component. Judged from the flux in theNe IX line, it is also approximately constant between lowand high state, with constant absorption. This componentalone therefore describes the low-state cie plasma at longwavelengths.
In a first iteration we, therefore, used three cie mod-els, each with constant emission measure, of which onlythe two hotter ones are subject to variable absorption be-tween low and high state, and all are composed of a mix-ture of WR and O star material as indicated in Table 3.A separate fourth component, again constant for low andhigh state, is required for the recombining portion long-ward of ≈15 A, with a pure WC composition.
Using this setup, the interpretation becomes essen-tially one of the absorption of the various components.During high state, the absorption is obviously weak forall components, which is little surprising as the radiationprincipally escapes through the low-density cone behindthe O star. We therefore assume solar composition for theabsorption components during high state. The deep ab-
sorption of the hotter material in low state, on the otherhand, is thought to be due to the WR wind when it movesinto the line of sight toward the hot shock region. Its com-position should therefore be identical to the WR wind,which we assumed in our calculations although we alsotested absorption by a wind with solar composition e.g.,from the O star. The results are similar although the def-inition of the column density necessarily varies (Table 3).
We tested in a first iteration whether this setup pro-duces meaningful results. To this end, we fitted the low-state spectrum longward of ≈ 8A (below 1.5 keV) withthe coolest cie model, and simultaneously the completehigh-state spectrum with this same model plus the twohotter cie components. The recombining portion was notincluded, and the isolated, absorbed high-energy portionof the low state was also not considered. Each of the threecie components was subject to a separate but constant ab-sorption. Since the abundance mix should not be too farfrom solar (apart from C, N, and O which are not variedfor the cie components since the relevant lines are formedlongward of 15 A), we determined them, in a first step -and deviating from our final choice described in Sect. 5.1- as free parameters without using a priori assumptions.
H. Schild et al.: XMM-Newton observations of γ2 Velorum (WC8+O7.5III) 9
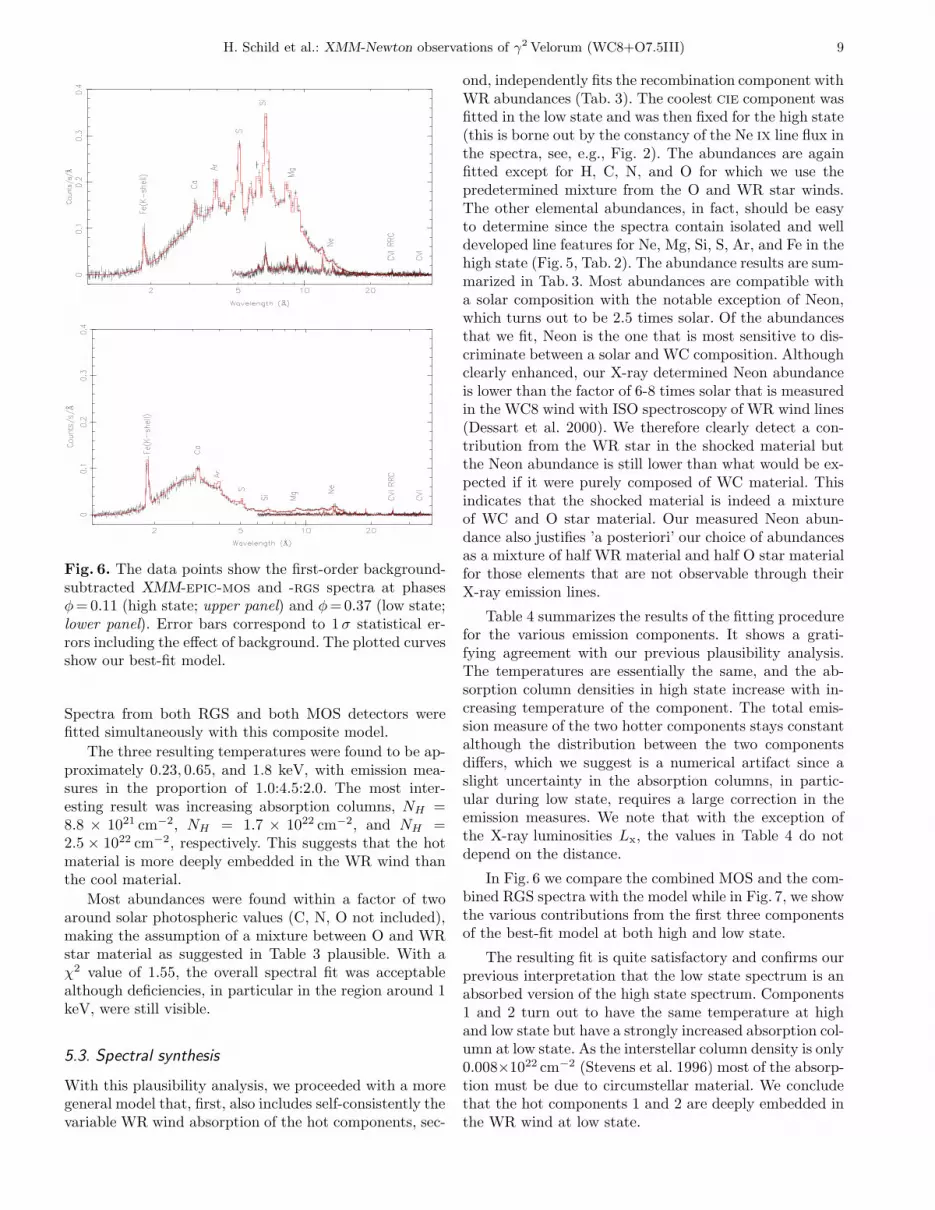
Fig. 6. The data points show the first-order background-subtracted XMM-epic-mos and -rgs spectra at phasesφ= 0.11 (high state; upper panel) and φ=0.37 (low state;lower panel). Error bars correspond to 1σ statistical er-rors including the effect of background. The plotted curvesshow our best-fit model.
Spectra from both RGS and both MOS detectors werefitted simultaneously with this composite model.
The three resulting temperatures were found to be ap-proximately 0.23, 0.65, and 1.8 keV, with emission mea-sures in the proportion of 1.0:4.5:2.0. The most inter-esting result was increasing absorption columns, NH =8.8 × 1021 cm−2, NH = 1.7 × 1022 cm−2, and NH =2.5 × 1022 cm−2, respectively. This suggests that the hotmaterial is more deeply embedded in the WR wind thanthe cool material.
Most abundances were found within a factor of twoaround solar photospheric values (C, N, O not included),making the assumption of a mixture between O and WRstar material as suggested in Table 3 plausible. With aχ2 value of 1.55, the overall spectral fit was acceptablealthough deficiencies, in particular in the region around 1keV, were still visible.
5.3. Spectral synthesis
With this plausibility analysis, we proceeded with a moregeneral model that, first, also includes self-consistently thevariable WR wind absorption of the hot components, sec-
ond, independently fits the recombination component withWR abundances (Tab. 3). The coolest cie component wasfitted in the low state and was then fixed for the high state(this is borne out by the constancy of the Ne ix line flux inthe spectra, see, e.g., Fig. 2). The abundances are againfitted except for H, C, N, and O for which we use thepredetermined mixture from the O and WR star winds.The other elemental abundances, in fact, should be easyto determine since the spectra contain isolated and welldeveloped line features for Ne, Mg, Si, S, Ar, and Fe in thehigh state (Fig. 5, Tab. 2). The abundance results are sum-marized in Tab. 3. Most abundances are compatible witha solar composition with the notable exception of Neon,which turns out to be 2.5 times solar. Of the abundancesthat we fit, Neon is the one that is most sensitive to dis-criminate between a solar and WC composition. Althoughclearly enhanced, our X-ray determined Neon abundanceis lower than the factor of 6-8 times solar that is measuredin the WC8 wind with ISO spectroscopy of WR wind lines(Dessart et al. 2000). We therefore clearly detect a con-tribution from the WR star in the shocked material butthe Neon abundance is still lower than what would be ex-pected if it were purely composed of WC material. Thisindicates that the shocked material is indeed a mixtureof WC and O star material. Our measured Neon abun-dance also justifies ’a posteriori’ our choice of abundancesas a mixture of half WR material and half O star materialfor those elements that are not observable through theirX-ray emission lines.
Table 4 summarizes the results of the fitting procedurefor the various emission components. It shows a grati-fying agreement with our previous plausibility analysis.The temperatures are essentially the same, and the ab-sorption column densities in high state increase with in-creasing temperature of the component. The total emis-sion measure of the two hotter components stays constantalthough the distribution between the two componentsdiffers, which we suggest is a numerical artifact since aslight uncertainty in the absorption columns, in partic-ular during low state, requires a large correction in theemission measures. We note that with the exception ofthe X-ray luminosities Lx, the values in Table 4 do notdepend on the distance.
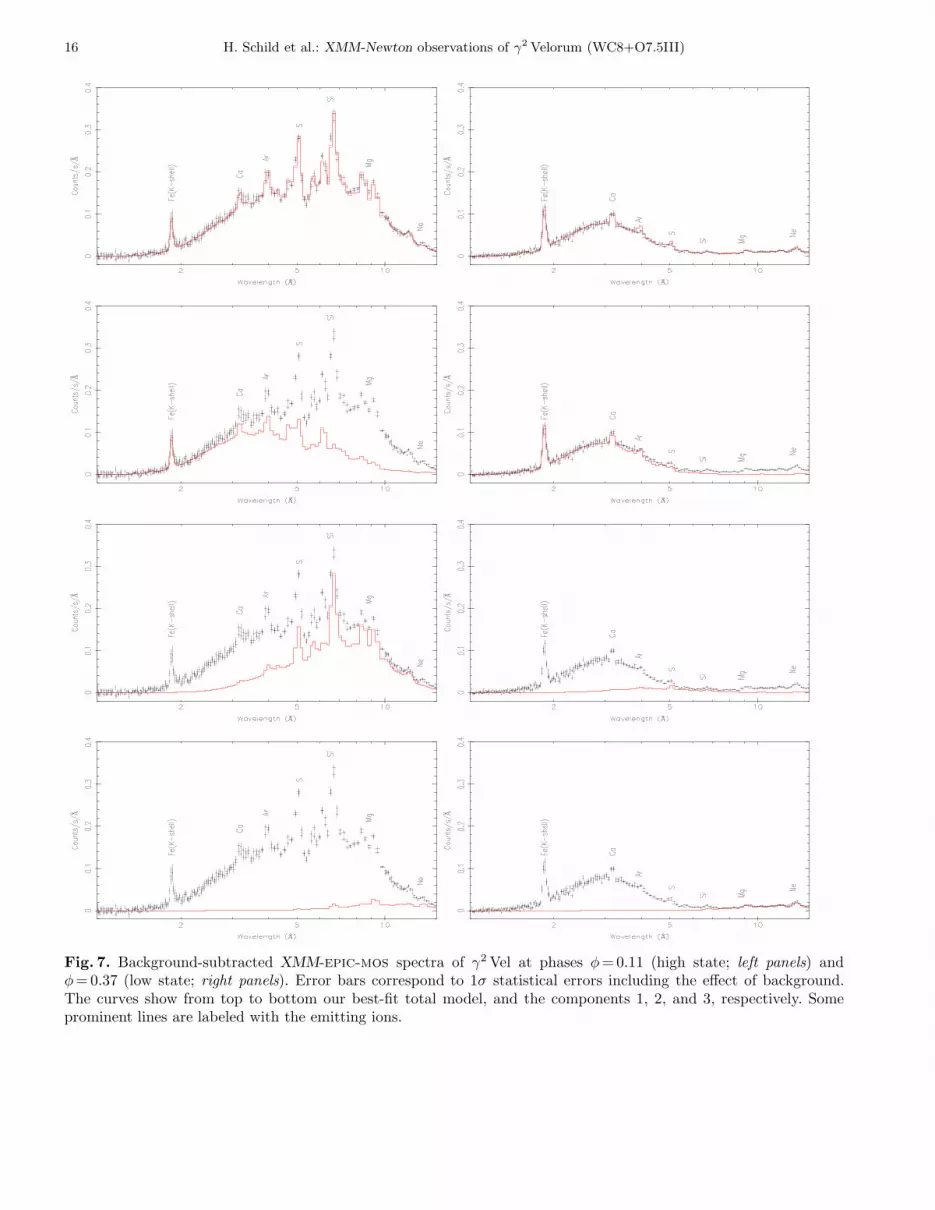
In Fig. 6 we compare the combined MOS and the com-bined RGS spectra with the model while in Fig. 7, we showthe various contributions from the first three componentsof the best-fit model at both high and low state.
The resulting fit is quite satisfactory and confirms ourprevious interpretation that the low state spectrum is anabsorbed version of the high state spectrum. Components1 and 2 turn out to have the same temperature at highand low state but have a strongly increased absorption col-umn at low state. As the interstellar column density is only0.008×1022 cm−2 (Stevens et al. 1996) most of the absorp-tion must be due to circumstellar material. We concludethat the hot components 1 and 2 are deeply embedded inthe WR wind at low state.
10 H. Schild et al.: XMM-Newton observations of γ2 Velorum (WC8+O7.5III)
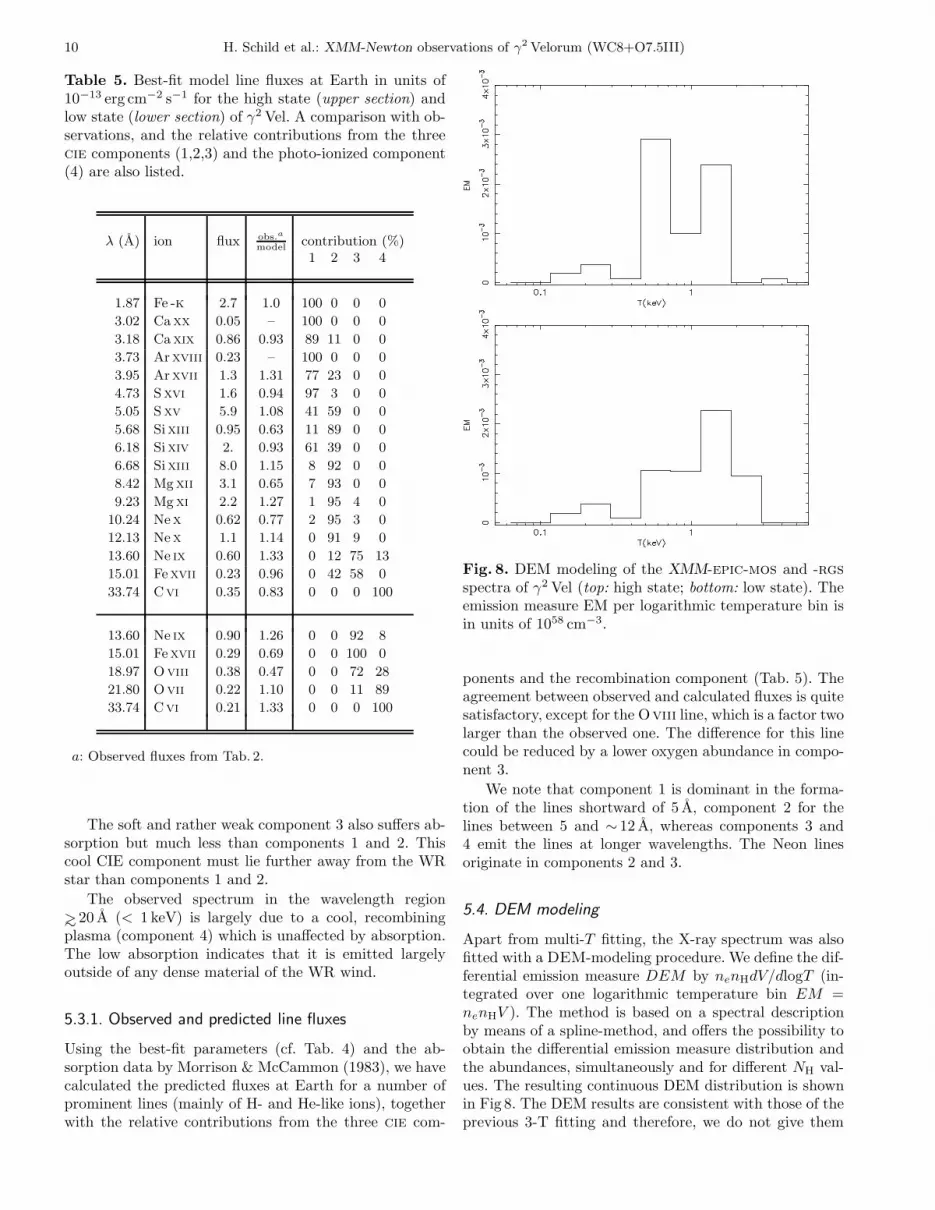
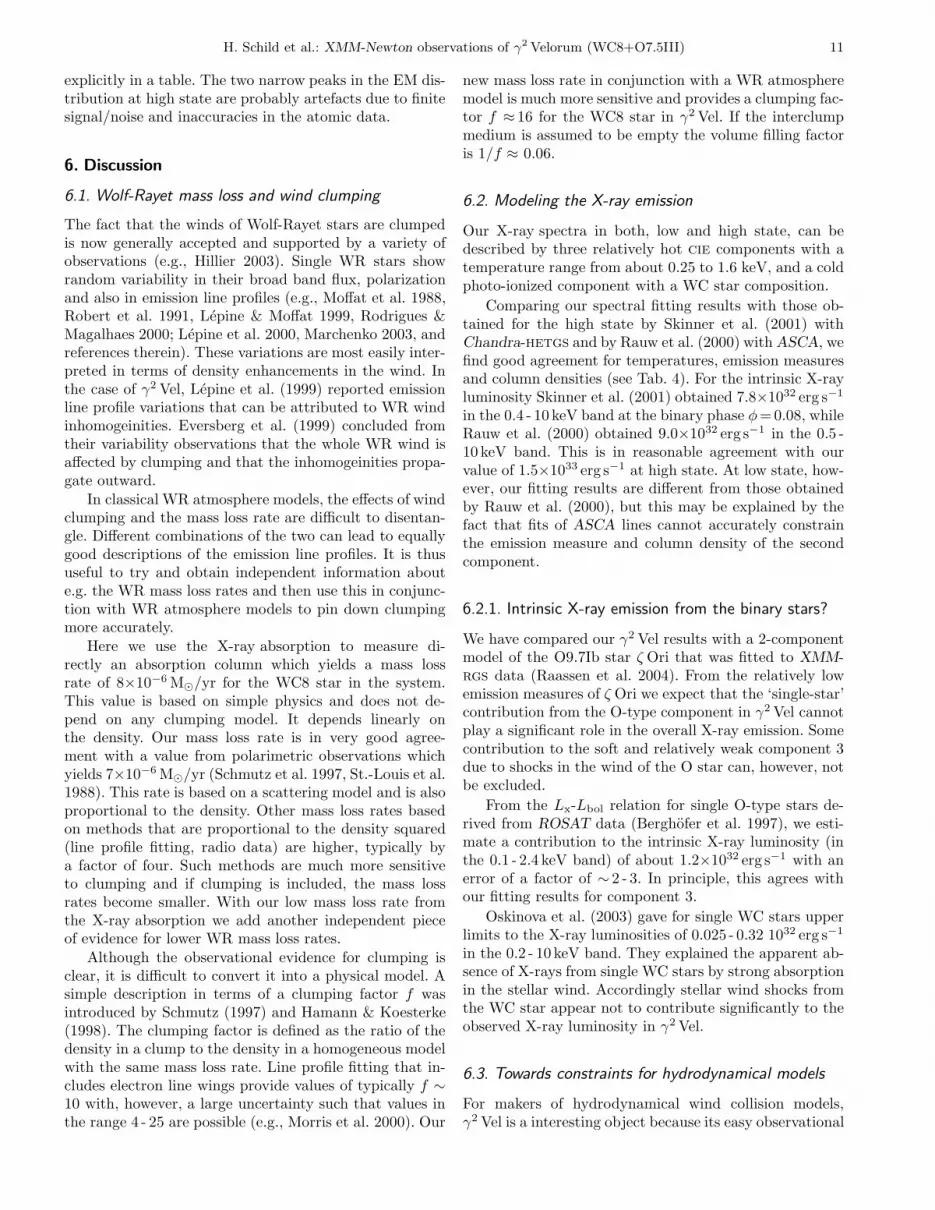
Table 5. Best-fit model line fluxes at Earth in units of10−13 erg cm−2 s−1 for the high state (upper section) andlow state (lower section) of γ2 Vel. A comparison with ob-servations, and the relative contributions from the threecie components (1,2,3) and the photo-ionized component(4) are also listed.
λ (A) ion flux obs.a
modelcontribution (%)1 2 3 4
1.87 Fe -k 2.7 1.0 100 0 0 0
3.02 Ca xx 0.05 – 100 0 0 0
3.18 Ca xix 0.86 0.93 89 11 0 0
3.73 Arxviii 0.23 – 100 0 0 0
3.95 Arxvii 1.3 1.31 77 23 0 0
4.73 Sxvi 1.6 0.94 97 3 0 0
5.05 Sxv 5.9 1.08 41 59 0 0
5.68 Sixiii 0.95 0.63 11 89 0 0
6.18 Sixiv 2. 0.93 61 39 0 0
6.68 Sixiii 8.0 1.15 8 92 0 0
8.42 Mg xii 3.1 0.65 7 93 0 0
9.23 Mg xi 2.2 1.27 1 95 4 0
10.24 Nex 0.62 0.77 2 95 3 0
12.13 Nex 1.1 1.14 0 91 9 0
13.60 Ne ix 0.60 1.33 0 12 75 13
15.01 Fexvii 0.23 0.96 0 42 58 0
33.74 Cvi 0.35 0.83 0 0 0 100
13.60 Ne ix 0.90 1.26 0 0 92 8
15.01 Fexvii 0.29 0.69 0 0 100 0
18.97 Oviii 0.38 0.47 0 0 72 28
21.80 Ovii 0.22 1.10 0 0 11 89
33.74 Cvi 0.21 1.33 0 0 0 100
a: Observed fluxes from Tab. 2.
The soft and rather weak component 3 also suffers ab-sorption but much less than components 1 and 2. Thiscool CIE component must lie further away from the WRstar than components 1 and 2.
The observed spectrum in the wavelength region
∼> 20 A (< 1 keV) is largely due to a cool, recombiningplasma (component 4) which is unaffected by absorption.The low absorption indicates that it is emitted largelyoutside of any dense material of the WR wind.
5.3.1. Observed and predicted line fluxes
Using the best-fit parameters (cf. Tab. 4) and the ab-sorption data by Morrison & McCammon (1983), we havecalculated the predicted fluxes at Earth for a number ofprominent lines (mainly of H- and He-like ions), togetherwith the relative contributions from the three cie com-
Fig. 8. DEM modeling of the XMM-epic-mos and -rgs
spectra of γ2 Vel (top: high state; bottom: low state). Theemission measure EM per logarithmic temperature bin isin units of 1058 cm−3.
ponents and the recombination component (Tab. 5). Theagreement between observed and calculated fluxes is quitesatisfactory, except for the Oviii line, which is a factor twolarger than the observed one. The difference for this linecould be reduced by a lower oxygen abundance in compo-nent 3.
We note that component 1 is dominant in the forma-tion of the lines shortward of 5 A, component 2 for thelines between 5 and ∼ 12 A, whereas components 3 and4 emit the lines at longer wavelengths. The Neon linesoriginate in components 2 and 3.
5.4. DEM modeling
Apart from multi-T fitting, the X-ray spectrum was alsofitted with a DEM-modeling procedure. We define the dif-ferential emission measure DEM by nenHdV/dlogT (in-tegrated over one logarithmic temperature bin EM =nenHV ). The method is based on a spectral descriptionby means of a spline-method, and offers the possibility toobtain the differential emission measure distribution andthe abundances, simultaneously and for different NH val-ues. The resulting continuous DEM distribution is shownin Fig 8. The DEM results are consistent with those of theprevious 3-T fitting and therefore, we do not give them
H. Schild et al.: XMM-Newton observations of γ2 Velorum (WC8+O7.5III) 11
explicitly in a table. The two narrow peaks in the EM dis-tribution at high state are probably artefacts due to finitesignal/noise and inaccuracies in the atomic data.
6. Discussion
6.1. Wolf-Rayet mass loss and wind clumping
The fact that the winds of Wolf-Rayet stars are clumpedis now generally accepted and supported by a variety ofobservations (e.g., Hillier 2003). Single WR stars showrandom variability in their broad band flux, polarizationand also in emission line profiles (e.g., Moffat et al. 1988,Robert et al. 1991, Lepine & Moffat 1999, Rodrigues &Magalhaes 2000; Lepine et al. 2000, Marchenko 2003, andreferences therein). These variations are most easily inter-preted in terms of density enhancements in the wind. Inthe case of γ2 Vel, Lepine et al. (1999) reported emissionline profile variations that can be attributed to WR windinhomogeinities. Eversberg et al. (1999) concluded fromtheir variability observations that the whole WR wind isaffected by clumping and that the inhomogeinities propa-gate outward.
In classical WR atmosphere models, the effects of windclumping and the mass loss rate are difficult to disentan-gle. Different combinations of the two can lead to equallygood descriptions of the emission line profiles. It is thususeful to try and obtain independent information aboute.g. the WR mass loss rates and then use this in conjunc-tion with WR atmosphere models to pin down clumpingmore accurately.
Here we use the X-ray absorption to measure di-rectly an absorption column which yields a mass lossrate of 8×10⁻⁶ M⊙/yr for the WC8 star in the system.This value is based on simple physics and does not de-pend on any clumping model. It depends linearly onthe density. Our mass loss rate is in very good agree-ment with a value from polarimetric observations whichyields 7×10⁻⁶ M⊙/yr (Schmutz et al. 1997, St.-Louis et al.1988). This rate is based on a scattering model and is alsoproportional to the density. Other mass loss rates basedon methods that are proportional to the density squared(line profile fitting, radio data) are higher, typically bya factor of four. Such methods are much more sensitiveto clumping and if clumping is included, the mass lossrates become smaller. With our low mass loss rate fromthe X-ray absorption we add another independent pieceof evidence for lower WR mass loss rates.
Although the observational evidence for clumping isclear, it is difficult to convert it into a physical model. Asimple description in terms of a clumping factor f wasintroduced by Schmutz (1997) and Hamann & Koesterke(1998). The clumping factor is defined as the ratio of thedensity in a clump to the density in a homogeneous modelwith the same mass loss rate. Line profile fitting that in-cludes electron line wings provide values of typically f ∼
10 with, however, a large uncertainty such that values inthe range 4 - 25 are possible (e.g., Morris et al. 2000). Our
new mass loss rate in conjunction with a WR atmospheremodel is much more sensitive and provides a clumping fac-tor f ≈ 16 for the WC8 star in γ2 Vel. If the interclumpmedium is assumed to be empty the volume filling factoris 1/f ≈ 0.06.
6.2. Modeling the X-ray emission
Our X-ray spectra in both, low and high state, can bedescribed by three relatively hot cie components with atemperature range from about 0.25 to 1.6 keV, and a coldphoto-ionized component with a WC star composition.
Comparing our spectral fitting results with those ob-tained for the high state by Skinner et al. (2001) withChandra-hetgs and by Rauw et al. (2000) with ASCA, wefind good agreement for temperatures, emission measuresand column densities (see Tab. 4). For the intrinsic X-rayluminosity Skinner et al. (2001) obtained 7.8×1032 erg s−1
in the 0.4 - 10 keV band at the binary phase φ=0.08, whileRauw et al. (2000) obtained 9.0×1032 erg s−1 in the 0.5 -10 keV band. This is in reasonable agreement with ourvalue of 1.5×1033 erg s−1 at high state. At low state, how-ever, our fitting results are different from those obtainedby Rauw et al. (2000), but this may be explained by thefact that fits of ASCA lines cannot accurately constrainthe emission measure and column density of the secondcomponent.
6.2.1. Intrinsic X-ray emission from the binary stars?
We have compared our γ2 Vel results with a 2-componentmodel of the O9.7Ib star ζ Ori that was fitted to XMM-rgs data (Raassen et al. 2004). From the relatively lowemission measures of ζ Ori we expect that the ‘single-star’contribution from the O-type component in γ2 Vel cannotplay a significant role in the overall X-ray emission. Somecontribution to the soft and relatively weak component 3due to shocks in the wind of the O star can, however, notbe excluded.
From the Lx-Lbol relation for single O-type stars de-rived from ROSAT data (Berghofer et al. 1997), we esti-mate a contribution to the intrinsic X-ray luminosity (inthe 0.1 - 2.4 keV band) of about 1.2×1032 erg s−1 with anerror of a factor of ∼ 2 - 3. In principle, this agrees withour fitting results for component 3.
Oskinova et al. (2003) gave for single WC stars upperlimits to the X-ray luminosities of 0.025 - 0.32 1032 erg s−1
in the 0.2 - 10 keV band. They explained the apparent ab-sence of X-rays from single WC stars by strong absorptionin the stellar wind. Accordingly stellar wind shocks fromthe WC star appear not to contribute significantly to theobserved X-ray luminosity in γ2 Vel.
6.3. Towards constraints for hydrodynamical models
For makers of hydrodynamical wind collision models,γ2 Vel is a interesting object because its easy observational
12 H. Schild et al.: XMM-Newton observations of γ2 Velorum (WC8+O7.5III)
access can potentially provide important constraints. Thebroadband X-ray light curve as observed with ROSAT
(Willis et al. 1995) has already yielded information aboutthe orientation and opening angle of the wind cavity be-hind the O star. A similar light-curve obtained with highspectral resolution will reveal the detailed geometric struc-ture of the wind-wind collision zone. Already our observa-tions taken at only two phases show that a low tempera-ture component exists that must be much more extendedthan expected. A tomographic survey, covering a completeorbit will reveal the distribution of the X-ray luminousmatter as well as the absorption column in various direc-tions.
An observational quantity that is of particular inter-est to model makers is the elemental abundances. Herewe report for the first time a neon abundance that is en-hanced compared to solar. This demonstrates that theshocked material is at least partly from the WC star.Theoretically, it is expected that the WC material domi-nates the X-ray emission.
In this context it may be useful to re-evaluate the cool-ing parameters that characterize the wind-wind collisionzones because orbital parameters and mass loss rates haverecently been revised. The cooling parameter χ (Stevens,Blondin & Pollock 1992) is given by the ratio of the cool-ing and the dynamical time scale
χ =tcool
tdyn
=D12 v
48
.
M−7
(10)
where.
M−7 is the mass loss rate in [10−7 M⊙yr−1], D12 isthe distance from the star center to the contact discontinu-ity in [1012 cm], and v8 is the wind velocity in [108 cm s−1].With the new lower mass loss rates for the clumped WRwind (which is similar to the one derived in this paper)and the O-type component from De Marco et al. (2000),the value of χ turns out to be ∼ 1 for the shocked WC ma-terial and ∼ 40 for the shocked O star material. In termsof this parameter, the shocked O-type star wind can beconsidered adiabatic, while for the shocked WC wind ra-diative cooling begins to be important.
For an adiabatic wind-wind collision, the ratio of theX-ray luminosities emitted by the shocked winds is
LWRx
LOx
≈ (vOvWR
)5/2 (11)
With the observed terminal wind velocities of the Oand the WC star of v∞ =2500 and 1450kms−1, respec-tively, this luminosity ratio is 3.3. The X-ray emission isexpected to be dominated by shocked WC material andshould reflect the abundance pattern of the WC star. If theobservations would show a significant contribution frommaterial with solar abundance (i.e. from the O star), thiscould be caused by a slower O star wind because e.g. the Ostar material can not reach the terminal velocity before itis entering the collision zone (e.g. Pittard & Stevens 1997and references therein).
6.4. On the interpretation of the Cvi and Cv
recombination features
The existence of narrow radiative recombination contin-uum features from hydrogen-like and helium-like carbonin the spectrum of γ2 Vel implies that highly ionized car-bon is in the presence of cold electrons, and is recombiningwith them.
The most obvious explanation for this is that somepart of the WR wind is being photoionized by the hardX-ray emission from the colliding wind shock.
The ionization parameter expected in the WR windcan be computed by approximating the X-ray emission asa point source at the wind collision point colinear with thetwo stars. If the wind is smooth,
ne =M
4πµmpr2v
The ionization parameter is
ξ =Lx
ner2x=
4πµmpv∞Lx
M(r
rx)2w(r) = ξmid(
r
rx)2w(r)
where rx is the distance from the colliding wind shockapex. We also make use of the notation v(r) = v∞w(r),where w(r) = (1 −
rRWR
)β is almost one at radii morethan a few RWR. The midplane is defined to be the planewhich is equidistant from the WR star and the shock. Atmidplane,
ξmid =4πµmpv∞Lx
M= 1.2 × 10⁻² erg cm−1 s−1
or log ξmid = −1.9 (taking Lx = 1033 erg s−1, µ = 2,M = 8 × 10⁻⁶ M⊙ yr−1, and v∞ = 1500 km s−1).
The ionization parameter in the WR wind shouldbe within a factor of 3 of ξmid throughout most ofthe volume. Close to the WR star it will be lowerdue to the higher densities, but we are not able tosee that region due to photoelectric absorption. Closeto the shock, the ionization parameter will be higher,but this is a relatively small amount of material. For amore detailed treatment of the geometrical dependence ofthe ionization parameter, see Hatchett & McCray (1977),Liedahl & Paerels (1996), and Sako et al. (1999). Thesedeal with the photoionized winds of high mass X-ray bi-naries, but the mathematical description is similar.
The value of ξ we calculate at the midplane for asmooth wind is three orders of magnitude smaller than thevalue required to completely strip carbon and allow us toobserve Cvi emission (log ξ = 1). In addition to this, weknow that the Cvi emission does not appear to be phasevariable, at least at the two phases we observed. Takentogether, this implies that if the recombination emissioncomes from the photoionized WR wind, it comes from farout, and in a very rarefied part. If this is the case, thenthe Cv and Cvi emission is coming from the interclumpmedium, which is highly rarefied compared to the densityexpected for a smooth wind. This is certainly plausibleconsidering the degree of clumping which is known to be
H. Schild et al.: XMM-Newton observations of γ2 Velorum (WC8+O7.5III) 13
present in WR winds in general, and the clumping we inferin the wind of γ2 Vel.
The other possible explanation is that the hot plasmacreated in the colliding wind shock stops cooling radia-tively at some point before carbon recombines (presum-ably the density is falling off pretty fast, and adiabaticcooling should become more important at some point),and the highly ionized carbon ions are either mixed withcool electrons in the WR wind further out in the flow,or the adiabatic cooling allows the electrons in the col-liding wind flow to become cool enough to reproduce theobserved effect when they do eventually recombine.
One other important piece of information comes fromthe rest of the spectrum. We see emission from Ne ix,Fexvii, Oviii and Ovii which we believe comes from ma-terial far out in the post-collision flow, mainly becausethese lines have the same strength at both phases ob-served, but also because the absorbing column must bevery low for us to see these lines at all. We would ex-pect to see some kind of emission from Cvi and Cv fromthis same material, because it must cool to the ambienttemperature of the wind eventually, unless the emissionoccurs at a radius where the WR wind is still opticallythick at about 30 A. Even if mechanisms other than ra-diative cooling are important, the fully stripped carbonatoms created in the colliding wind shock must recombineeventually, and when they do they must emit one X-rayphoton per atom per electron added. However, the con-tinuum optical depth (mainly from C iv in the cool WRwind) is higher for Cvi emission than for Ne ix, so it ispossible that Cvi emission in the post-shock flow wouldbe absorbed.
If we believe that the observed carbon emission is justfrom the cooler parts of the post-collision flow, we shouldask why we see different emission mechanisms at work inthe case of carbon as opposed to neon, iron and oxygen.The observed line ratios are Ne ix is consistent with whatone would expect in a hot, collisionally ionized plasma.The statistics for Fexvii and Fexviii and Ovii and Oviii
are relatively poor, and it is not impossible that Ovii andOviii RRCs are present in the spectrum and are merelyblended with the iron L-shell emission. Clearly at somepoint, the cooling of the post-shock flow switches fromprimarily radiative to primarily adiabatic, but it is notclear whether this can account for the recombining Cvi
and Cv.
7. Summary and Conclusions
High-resolution X-ray spectra obtained at different or-bital phases provide a wealth of information about γ2 Vel.Modeling the X-ray emission constrains the physical struc-ture of the wind-wind collision zone, whereas the absorp-tion observed at non-maximum phases gives indicationsabout the geometric distribution of the emitting as well asthe non-emitting material. Both, emission and absorptionare important and reveal different but linked aspects ofthe γ2 Vel system. It is indeed likely that a comprehensive
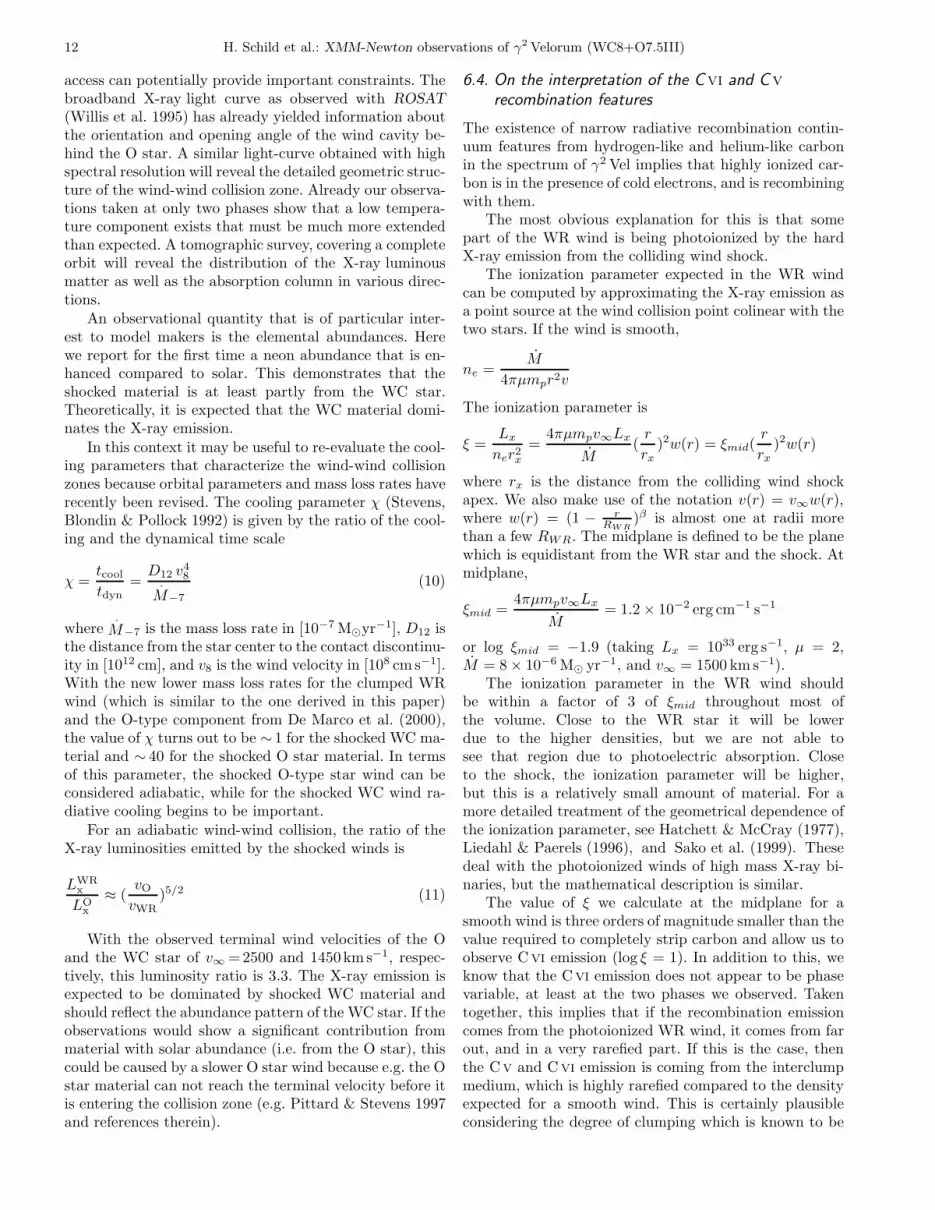
Fig. 9. Sketch of the γ2 Vel system (same as Fig. 1) withthe probable locations of our components 1 to 4. The Wolf-Rayet star is at the center.
tomographic analysis using X-ray spectra taken at manymore orbital phases will allow a detailed mapping of thecolliding wind region as well as of the ambient material.In particular, the hypothesis of a constant clumping factoraround the orbit could be tested.
7.1. WR mass loss and wind clumping
Phase dependent X-ray emission from γ2 Vel can be usedto analyze the Wolf-Rayet wind. In order to quantitativelyinterpret the absorption at low state, we apply a previ-ously published WR model atmosphere with a smoothdensity distribution (De Marco et al 2000). This modelatmosphere is the result from a fit to the broad WR emis-sion lines. The column density required by the observedX-ray absorption is a factor of 4 lower than what is pre-dicted by this model. The mass loss rate that matches theX-ray absorption is correspondingly smaller. We concludethat the WC8 star in γ2 Vel loses mass at a rate of only8×10−6 M⊙/yr.
The discrepancy between our directly measured massloss rate and the one required by the model atmospherecan be reconciled if the wind is clumped. In order to stillfit the WR emission line spectrum with the reduced massloss a clumping factor f = 16 is required.
7.2. Size of line emitting regions
The observed absorption behaviour also constrains the ge-ometry of the X-ray line emitting region. It is very inter-esting that in our spectra the separation between absorp-tion and no absorption is quite sharp. While the Ne ix linesremain unabsorbed the Nex lines are reduced by a factorof 5 (see Tab. 2). In terms of temperature this means that
14 H. Schild et al.: XMM-Newton observations of γ2 Velorum (WC8+O7.5III)
the plasma hotter than 5 MK is heavily absorbed at phase0.37 while the cooler plasma is not. This is also reflectedin our emission model in which the components 1 and 2with temperatures of 8 and 19 MK are strongly absorbedwhereas component 3 with a temperature of 3 MK is onlyweakly absorbed. We conclude that components 1 and 2are formed in the central part of the colliding winds whichis deeply embedded in the WR wind. The cool (3 MK)component is clearly detached from this hot region (seeFig. 9).
Furthermore, the Ne ix lines that predominantly comefrom this region are not affected by the UV radiation ofthe O star. They either are formed far away from the Ostar or they are shielded from that UV radiation by in-tervening material. In either case, the O star is not likelyto contribute much to them and we conclude that firstly,this component is associated with the colliding winds andsecondly that this region must be rather extended for itto still be well detectable at phase 0.37.
7.3. Neon abundance
A further interesting piece of evidence comes from theneon abundance we derive. Neon is considerably enrichedthrough nuclear processing in WC stars and therefore dif-fers significantly from solar abundance. Neon is in fact theonly element that emits copious line radiation from thecollisionally ionized region, and that allows to discrimi-nate between WC and solar composition. We find a clearNeon enhancement compared to solar which indicates thatWolf-Rayet material is present at least in components 2and 3.
It is noteworthy that much of what we learn aboutthe collision zone actually comes from the Ne ix and Nex
lines. Apart from discriminating between WC and solarabundance patterns they also provide a dividing line be-tween absorption and no absorption at phase 0.37. Theselines seem to hold the key for further progress and theirbehaviour at other phases should certainly be very inter-esting to follow.
7.4. X-ray emission variability
An interesting feature of our X-ray spectra is the high en-ergy end. The section above 4.5 keV is little affected byintrinsic absorption and interestingly there is no observ-able difference between the two phases. In particular thehighest temperatures in the wind-wind collision zone seemto be the same at both phases. This is remarkable becausethe binary separation has changed from 0.83 AU at phase0.12 to 1.27 AU at phase 0.37. From a simple 1/D law onewould expect a 50% flux reduction (see e.g., Stevens etal. 1992). This confirms the result of Rauw et al. (2000)that γ2 Vel does not follow a 1/D distance relation. TheX-ray flux and temperature from the hottest plasma asdetected by XMM-Newton is not affected by the orbitalseparation.
7.5. Recombining plasma
Apart from the shock excited components we also finda recombining plasma. The relation (if any) between thisfourth component to the shocked material is not clear. Therecombining plasma is highly ionized and is not absorbedat phase 0.37. It therefore comes from far out in the binarysystem. We also know that it is of very low temperature ofabout 40 000K and that it is of WC composition. Possiblythis plasma is due to photoionization through the X-raysfrom the wind-wind collision region. This radiation prop-agates through the rarefied and warped cavity behind theO star and irradiates the higher regions of the WR wind.There it may re-ionize some of the material.
Acknowledgements. We would like to thank R. Walder andH.M. Schmid for fruitful discussions. The SRON NationalInstitute for Space Research is supported financially by NWO.M.A. and M.G. acknowledge support from the Swiss NationalScience Foundation (fellowship 81EZ-67388 & grant 2000-058827). M.A. and M.A.L. acknowledge support by a grantfrom NASA to Columbia University for XMM-Newton missionsupport and data analysis.
References
Anders, E., & Grevesse, N. 1989, Geochimica et CosmochimicaActa, 53, 197
Berghofer, T.W., Schmitt, J.H.M.M., Danner, R., & Cassinelli,J.P. 1997, A&A (Letters), 322, 167
Blumenthal, G.R., Drake, G.W.F., Tucker, W.H. 1972, ApJ,172, 205
Cassinelli, J.P., Miller, N.A., Waldron, W.L., Macfarlane, J.J.,Cohen D.H. 2001, ApJ (Letters), 554 L55
Corcoran, M.F. 2003, in: K.A. van der Hucht, A. Herrero &C. Esteban (eds.), A Massive Star Odyssey, from MainSequence to Supernova, Proc. IAU Symp. No. 212 (SanFrancisco: ASP), p. 130
De Marco, O., & Schmutz, W. 1999, A&A, 345, 163De Marco, O., Schmutz, W., Crowther, P. A., Hillier, D. J.,
Dessart, L., de Koter, A., & Schweickhardt, J. 2000, A&A,358, 187
den Herder, J.W., Brinkman, A.C., Kahn, S.M., et al. 2001,A&A (Letters), 365, L7
Dessart, L., Crowther, P.A., Hillier, D.J., et al., 2000, MNRAS,315, 407
Dumm, T., Gudel, M., Schmutz, W., Audard, M., Schild,H., Leutenegger, M., van der Hucht, K.A., 2003, in NewVisions of the X-ray Universe in the XMM-Newton andChandra era, ESA SP-488, in press
Eenens, P.R.J., & Williams, P.M. 1994, MNRAS, 269, 1082Eversberg, T., Moffat, A.F.J., Marchenko, S.V. 1999, PASP,
111, 861Grevesse, N., & Sauval, A.J. 1998, in: C. Frohlich, M.C.E.
Huber, S.K. Solanki & R. von Steiger (eds.), SolarComposition and its Evolution – From Core to Corona,Space Sci. Rev., 85, 161
Grevesse, N., & Sauval, A.J. 1999, A&A, 347, 348Hamann, W.R., & Koesterke, L. 1998, A&A, 335, 1003Hatchett, S., & McCray, R. 1977, ApJ, 211, 552Hillier, D.J. 2003, in: K.A. van der Hucht, A. Herrero &
C. Esteban (eds.), A Massive Star Odyssey, from MainSequence to Supernova, Proc. IAU Symp. No. 212 (SanFrancisco: ASP), p. 70

H. Schild et al.: XMM-Newton observations of γ2 Velorum (WC8+O7.5III) 15
van der Hucht, K.A., Cassinelli, J.P., & Williams, P.M. 1986,A&A, 168, 111
van der Hucht, K.A., Schrijver, H., Stenholm, B., Lundstrom,I., Moffat, A.F.J., Marchenko, S.V., Seggewiss, W., SetiaGunawan, D.Y.A., Sutantyo, W., van den Heuvel, E.P.J.,de Cuyper, J.-P., & Gomez, A.E. 1997, New Astronomy, 2,245
van der Hucht, K.A. 2001, New Astronomy Reviews, 45, 135(VIIth WR Catalogue)
van der Hucht, K.A. 2002, in: F. Giovanelli & L. Sabau-Graziati(eds.), Multifrequency Behaviour of High Energy CosmicSources, Proc. Frascati Workshop 2001, Vulcano (Italia)21-26 May 2001, Mem. Soc. Astron. Italia73, No. 4, 822
Hummel, C.A., White, N.M., Elias, N.M., Hajian, A.R., &Nordgren, T.E. 2000, ApJL 540, L91
Jansen, F., Lumb, D.H., Altieri, B., et al. 2001, A&A (Letters),365, L1
Kaastra, J.S., Mewe, R., & Nieuwenhuijzen, H. 1996, in:K. Yamashita & T. Watanabe (eds.), UV and X-raySpectroscopy of Astrophysical and Laboratory Plasmas(Tokyo: Universal Academy Press, Inc.), p. 411 (spex)
Kahn, S.M., Leutenegger, M.A., Cottam, J., Rauw, G., Vreux,J.-M., den Boggende, A.J.F., Mewe, R., & Gudel, M. 2001,A&A (Letters), 365, L312
Lanz, T., Hubeny, I. 2003, ApJS146, 417Lepine, S., Moffat, A.F.J. 1999, ApJ, 514, 909Lepine, S., Eversberg, T., & Moffat, A.F.J. 1999, AJ, 117, 1441Lepine, S., Moffat, A.J.M, St-Louis, N., Marchenko, S.V.,
Dalton, M.J., Crowther, P.A., Smith, L.J., Willis, A.J.,Antokhin, I.I & Tovmassian, G.H. 2000, AJ, 120, 3201
Liedahl, D. A., & Paerels, F. B. S. 1996, ApJ, 468, L33Marchenko, S.V. 2003, in: K.A. van der Hucht, A. Herrero &
C. Esteban (eds.), A Massive Star Odyssey, from MainSequence to Supernova, Proc. IAU Symp. No. 212 (SanFrancisco: ASP), p. 296
Mewe, R., Gronenschild, E.H.B.M., & van den Oord, G.H.J.1985, A&AS, 62, 197 (mekal)
Mewe, R., Kaastra, J.S., & Liedahl, D.A. 1995, Legacy 6, 16(mekal)
Miller, N.A., Cassinelli, J.P., Waldron, W.L., Macfarlane, J.J.,Cohen, D.H. 2002, ApJ, 577 951
Moffat, A.F.J., Drissen, L, Lamontagne, R., Robert, C. 1988,ApJ, 334, 1038
Moffat, A.F.J., Paquin, G., Lamontagne, R., Vogt, N., &Barrera, L.H. 1986, AJ, 91, 1386
Morris, P.W., van der Hucht, K.A., Crowther, P.A., Hillier,D.J., Dessart, L., Williams, P.M., & Willis, A.J. 2000,A&A, 353, 624
Morrison, R., & McCammon, D. 1983, ApJ, 270, 119Niemela, V.S., & Sahade, J. 1980, ApJ, 238, 244Oskinova, L.M., Ignace, R., Hamann, W.-R., Pollock, A.M.T.,
& Brown, J.C. 2003, A&A, 402, 755Pike, C.D., Stickland, D.J., & Willis, A.J. 1983, Observatory,
103, 154Pittard, J.M., & Stevens, I.R. 1997, MNRAS, 292, 298Pollock, A.M.T. 1987, ApJ, 320, 283Raassen, A.J.J., Mewe, R., Pollock, A.M.T., van der Hucht,
K.A., Cassinelli, J.P., Miller, N.A., Gudel, M., Audard, M.,Leutenegger, M.A. 2004, in preparation
Rauw, G., Stevens, I.R., Pittard, J.M. & Corcoran, M.F. 2000,MNRAS, 316, 129
Robert, C., Moffat, A.F.J., & Seggewiss, W. 1991, in: K.A.van der Hucht & B. Hidayat (eds.), Wolf-Rayet Stars andInterrelations with Other Massive Stars in Galaxies, Proc.IAU Symp. No. 143 (Dordrecht: Kluwer), p. 147
Rodrigues, C.V., & Magalhaes, A.M. 2000, ApJ, 540, 412Sako, M., Liedahl, D.A., Kahn, S.M., & Paerels, F. 1999, ApJ,
525, 921Schaerer, D., Schmutz, W., & Grenon, M. 1997, ApJ, 484, 153Schmutz, W. 1997, A&A, 321, 268Schmutz, W., Schweickhardt, J., Stahl, O., Wolf, B., Dumm,
T., Gang, Th., Jankovics, I., Kaufer, A., Lehmann, H.,Mandel, H., Peitz, J., & Rivinius, Th. 1997, A&A, 328,219
Schulz, N. S., Canizares, C. R., Huenemoerder, D., Lee, J. C.2000, ApJ (Letters), 545 L135
Skinner, S.L., Gudel, M., Schmutz, W., & Stevens, I.R. 2001,ApJ (Letters), 558, L113
Stevens, I.R., Blondin, J.M., & Pollock, A.M.T. 1992, ApJ,386, 265
Stevens, I.R., Corcoran, M.F., Willis, A.J., Skinner, S.L.,Pollock, A.M.T., Nagase, F., & Koyama, K. 1996, MNRAS,283, 589
Stickland, D.J., & Lloyd, C. 1990, Observatory, 110, 1St.-Louis, N., Moffat, A.J.M., Drissen, L., Bastien, P., Robert,
C., 1988, ApJ, 330, 286Struder, L., Briel, U.G., Dennerl, K., et al. 2001, A&A
(Letters), 365, L18Turner, M.J.L., Abbey, A., Arnaud, M., et al. 2001, A&A
(Letters), 365, L27Usov, V.V. 1992, ApJ, 389, 635Verner, D.A., & Yakovlev D.G. 1995, A&AS, 109, 125Walborn, N.R. 1980 ApJS, 44, 535Waldron, W.L., Cassinelli, J.P. 2001, ApJ (Letters), 548 L45White, R.L., & Long, K.S. 1986, ApJ, 310, 832Willis, A.J., Schild, H., & Stevens, I.R. 1995, A&A, 298, 549
16 H. Schild et al.: XMM-Newton observations of γ2 Velorum (WC8+O7.5III)
Fig. 7. Background-subtracted XMM-epic-mos spectra of γ2 Vel at phases φ= 0.11 (high state; left panels) andφ= 0.37 (low state; right panels). Error bars correspond to 1σ statistical errors including the effect of background.The curves show from top to bottom our best-fit total model, and the components 1, 2, and 3, respectively. Someprominent lines are labeled with the emitting ions.


