Embed Size (px)
Citation preview

Wind and Wind Hazard Related Research at NIWA
Stuart Moore1, Richard Turner1, Mike Revell1, Stefan Reese1 and Stuart Webster2
1 National Institute of Water and Atmospheric Research, Wellington, NZ2 Met Office, Exeter, UK
• Belmont Hills Hillshape Multiplier ProjectHow good is AS/NZS 1170.2 at estimating winds in rugged terrain?
• EcoConnect – NIWA’s multi-hazard forecasting suite
• High Resolution Nesting – applications for cyclone forecasting
• Gerris – very high resolution CFD modelling
• Riskscape – an easy to use multi-hazard impact model for NZ
Outline
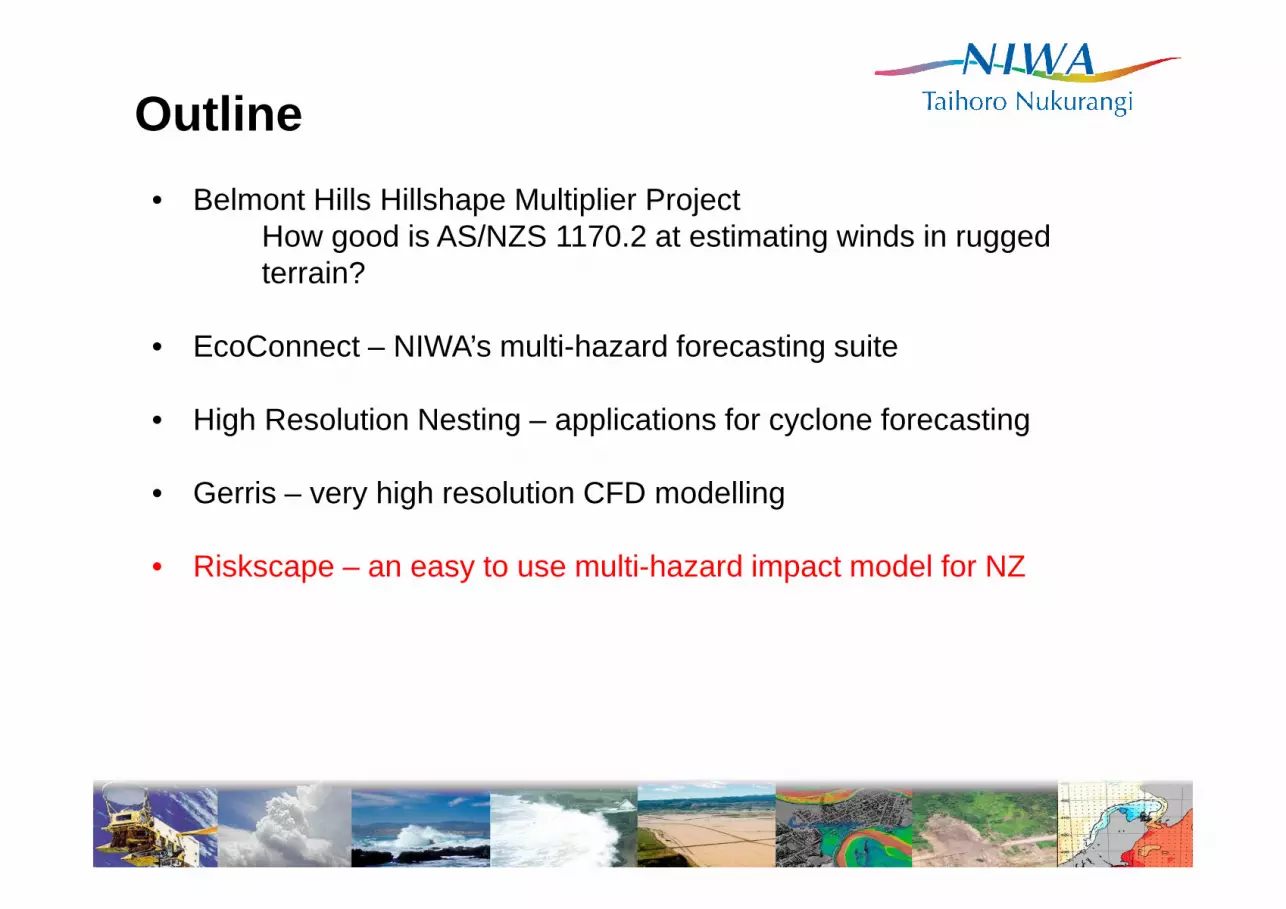
Hillshape Multiplier Project• Wind flow in New Zealand is strongly influenced by the hilly
terrain over which it passes, with both valleys and hill crests experiencing stronger, and in some instances much stronger, wind speeds than over flat terrain.
• Increased wind speeds are a potential hazard for towers and pylons used to support both infrastructure and communications equipment which are often located near or on hilltops.
• In New Zealand, at hilly locations far from any wind measurements, design winds are frequently estimated for such proposed structures by applying the AS/NZS 1170.2 loadings code – specifically the advice relating to the topographic multipliers.
• A relevant question is – “Is it up to the job?”.
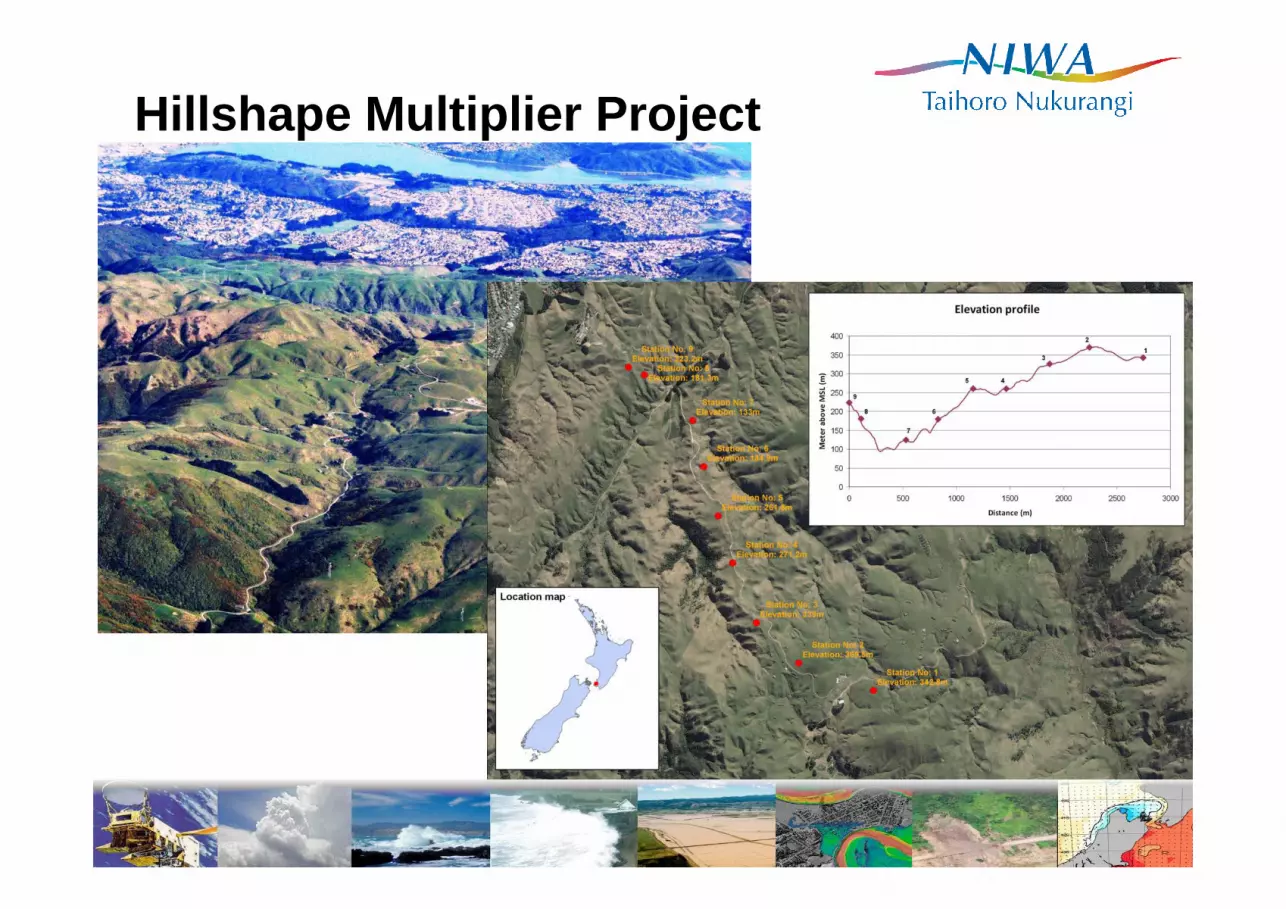
Hillshape Multiplier Project
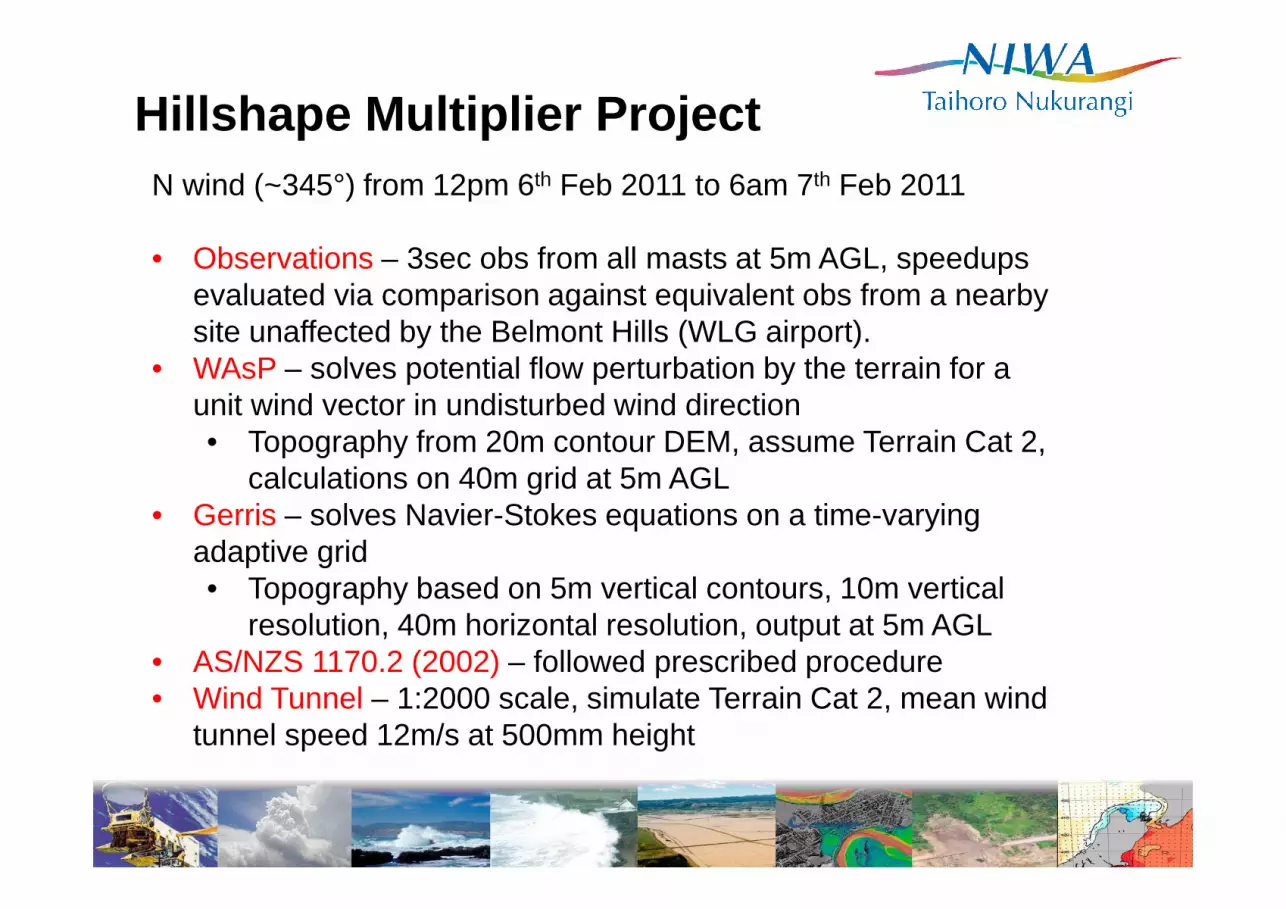
Hillshape Multiplier ProjectN wind (~345°) from 12pm 6th Feb 2011 to 6am 7th Feb 2011
• Observations – 3sec obs from all masts at 5m AGL, speedups evaluated via comparison against equivalent obs from a nearby site unaffected by the Belmont Hills (WLG airport).
• WAsP – solves potential flow perturbation by the terrain for a unit wind vector in undisturbed wind direction• Topography from 20m contour DEM, assume Terrain Cat 2,
calculations on 40m grid at 5m AGL• Gerris – solves Navier-Stokes equations on a time-varying
adaptive grid• Topography based on 5m vertical contours, 10m vertical
resolution, 40m horizontal resolution, output at 5m AGL• AS/NZS 1170.2 (2002) – followed prescribed procedure• Wind Tunnel – 1:2000 scale, simulate Terrain Cat 2, mean wind
tunnel speed 12m/s at 500mm height

Hillshape Multiplier Project
• Belmont Hills Hillshape Multiplier ProjectHow good is AS/NZS 1170.2 at estimating winds in rugged terrain?
• EcoConnect – NIWA’s multi-hazard forecasting suite
• High Resolution Nesting – applications for cyclone forecasting
• Gerris – very high resolution CFD modelling
• Riskscape – an easy to use multi-hazard impact model for NZ
Outline
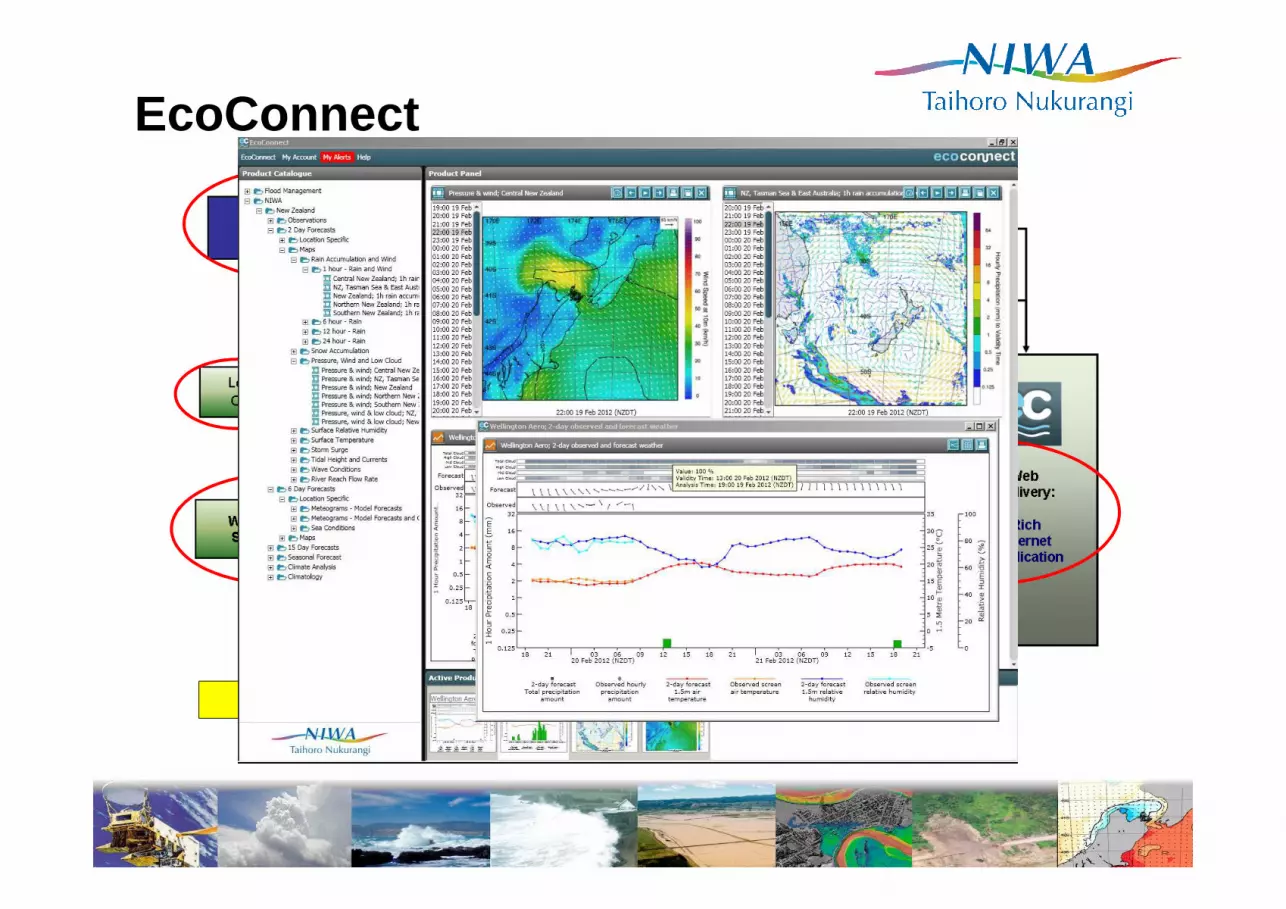
EcoConnect
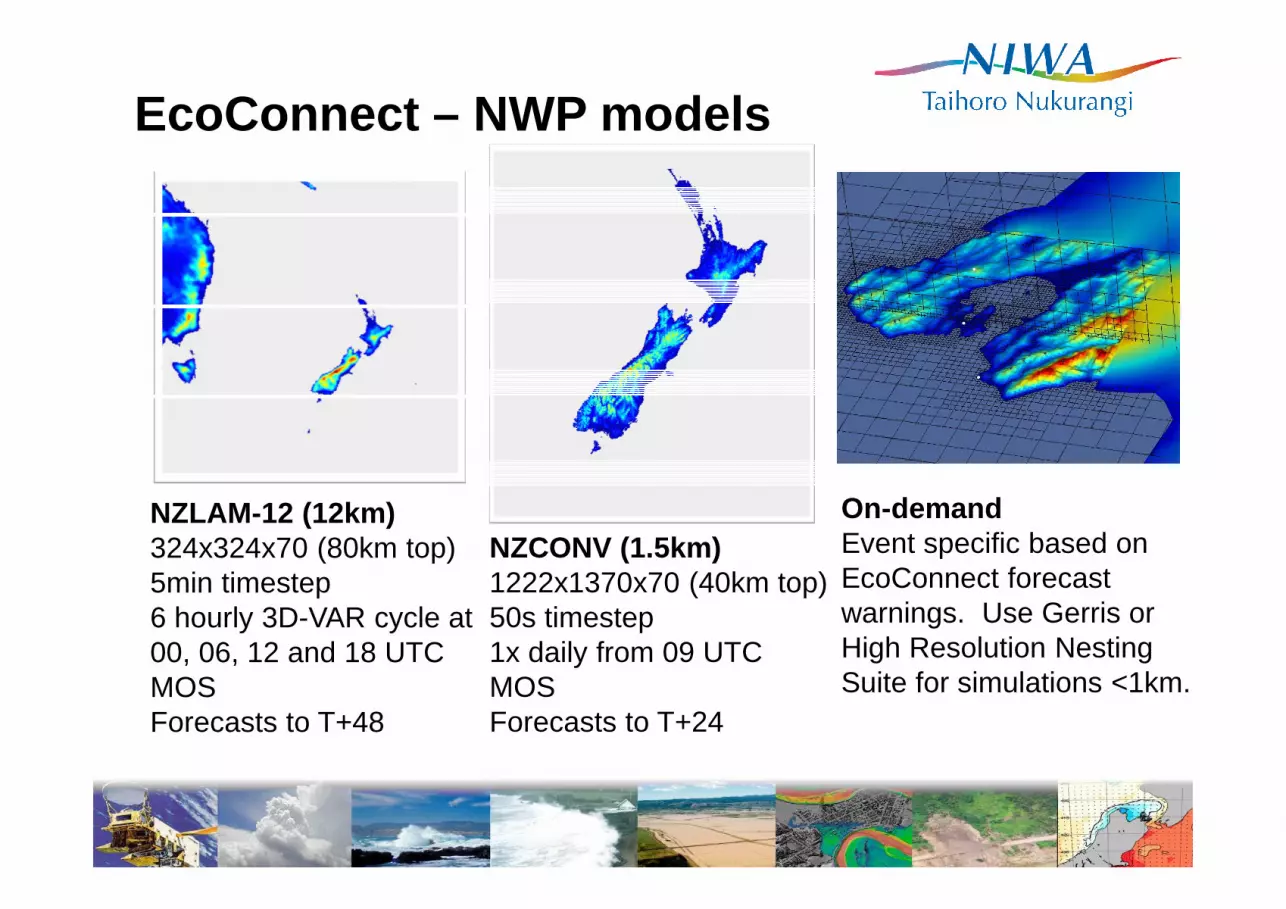
EcoConnect – NWP models
NZLAM-12 (12km)324x324x70 (80km top)5min timestep6 hourly 3D-VAR cycle at00, 06, 12 and 18 UTCMOSForecasts to T+48
NZCONV (1.5km)1222x1370x70 (40km top)50s timestep1x daily from 09 UTCMOSForecasts to T+24
On-demandEvent specific based onEcoConnect forecast warnings. Use Gerris orHigh Resolution NestingSuite for simulations <1km.
• Belmont Hills Hillshape Multiplier ProjectHow good is AS/NZS 1170.2 at estimating winds in rugged terrain?
• EcoConnect – NIWA’s multi-hazard forecasting suite
• High Resolution Nesting – applications for cyclone forecasting
• Gerris – very high resolution CFD modelling
• Riskscape – an easy to use multi-hazard impact model for NZ
Outline
High Resolution Nesting Suite
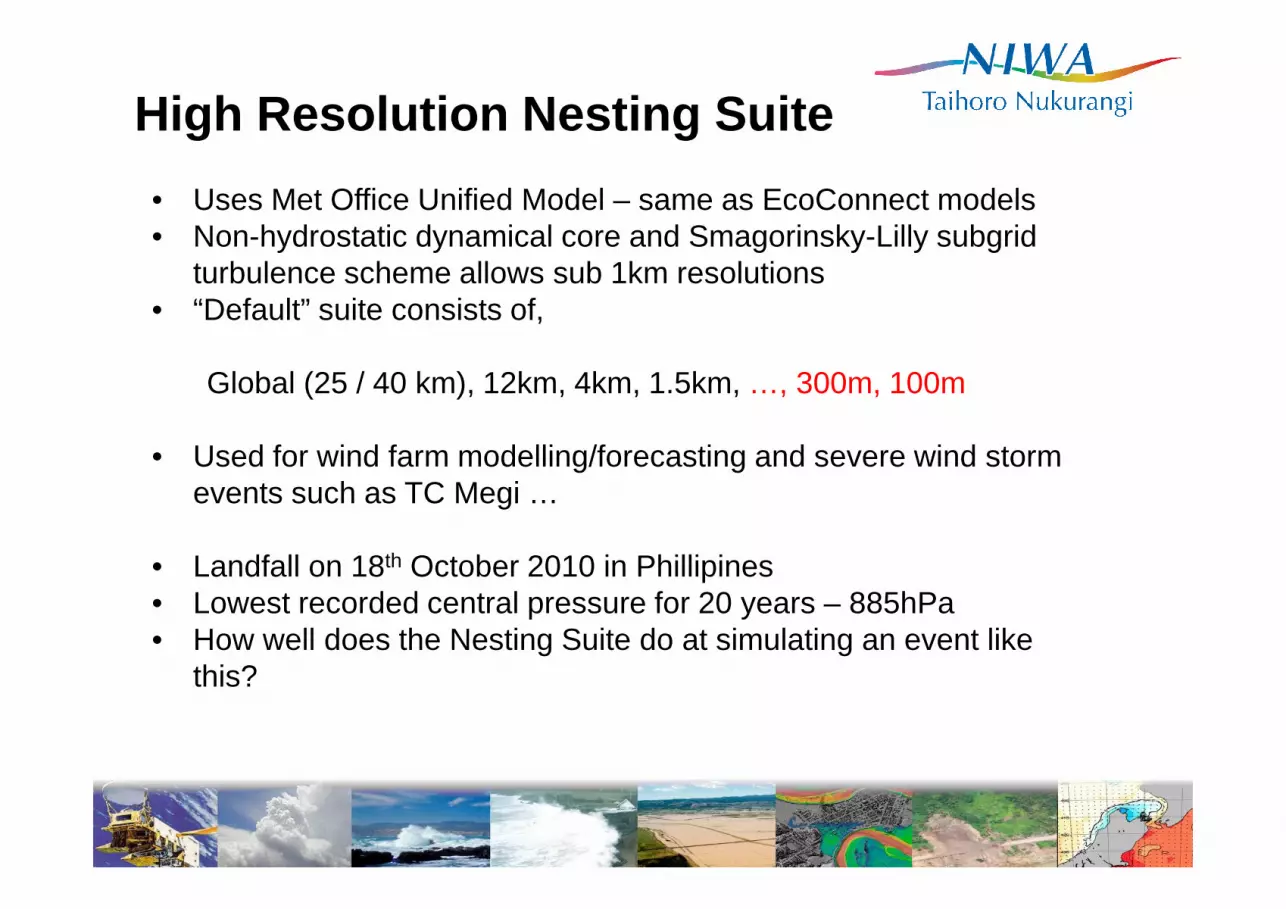
• Uses Met Office Unified Model – same as EcoConnect models• Non-hydrostatic dynamical core and Smagorinsky-Lilly subgrid
turbulence scheme allows sub 1km resolutions• “Default” suite consists of,
Global (25 / 40 km), 12km, 4km, 1.5km, …, 300m, 100m
• Used for wind farm modelling/forecasting and severe wind storm events such as TC Megi …
• Landfall on 18th October 2010 in Phillipines• Lowest recorded central pressure for 20 years – 885hPa• How well does the Nesting Suite do at simulating an event like
this?
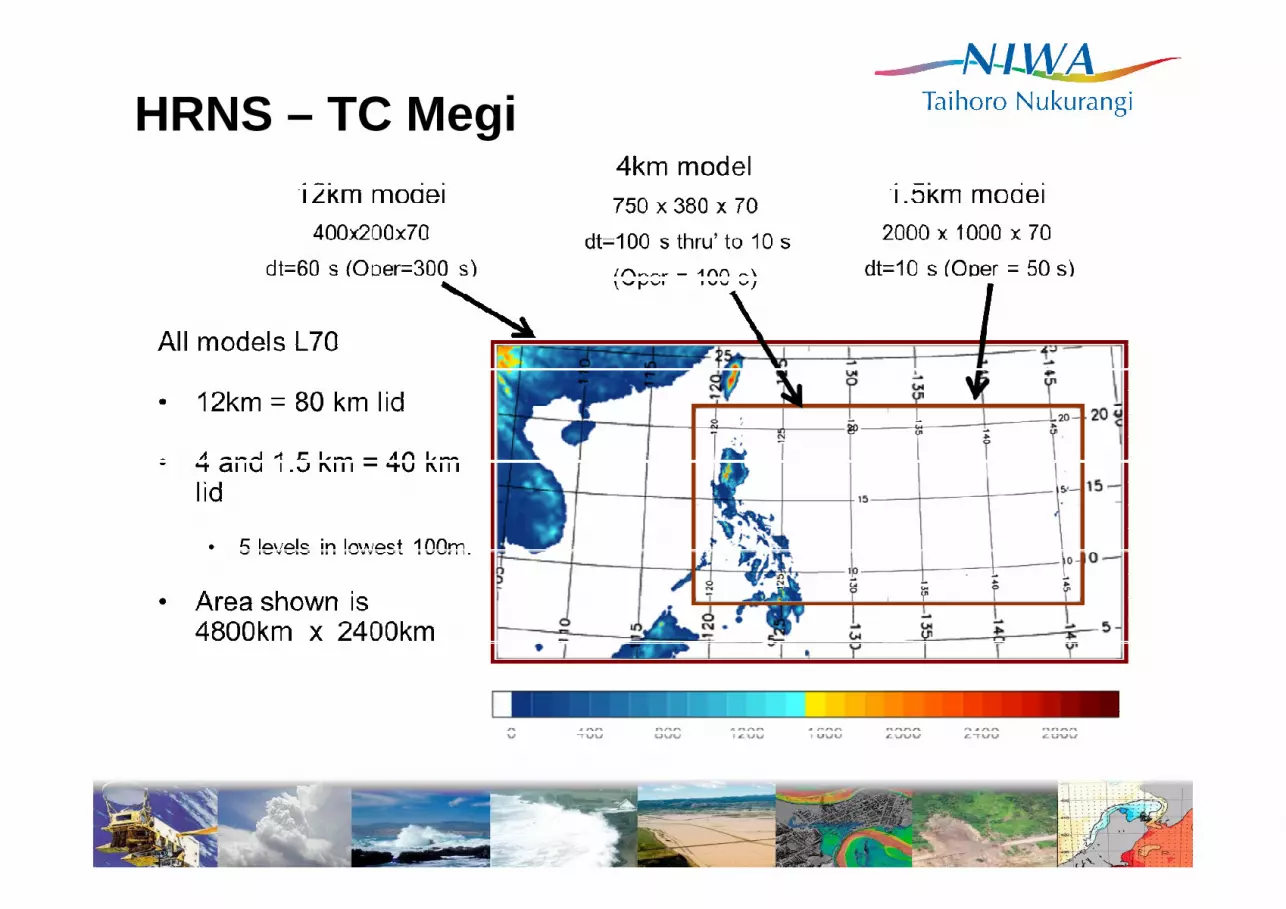
HRNS – TC Megi
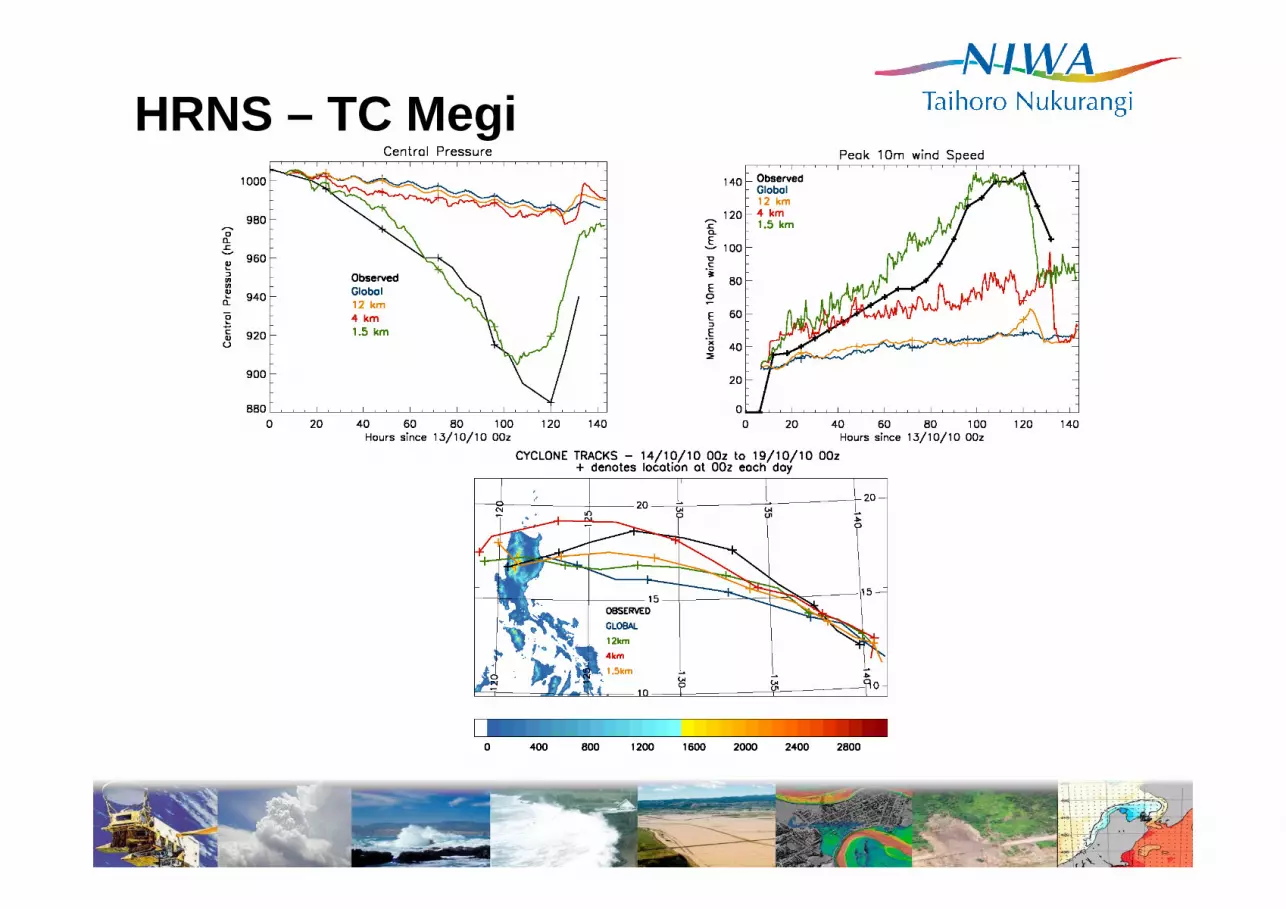
HRNS – TC Megi

This image cannot currently be displayed.
This image cannot currently be displayed.
15th 00z to 18th 12z• peak intensity after eye-wall instability event
• e.g. Only after that black wind vectors appear
•MSLP 905 hPa at 17th 06z• 18 hours before land fall• not resolving another eye-wall instability event?
Bottom plot:-• Colours = rainfall rate• White lines = MSLP• Arrows = 10 m winds
> 20 m/s= white > 50 m/s= black
• Belmont Hills Hillshape Multiplier ProjectHow good is AS/NZS 1170.2 at estimating winds in rugged terrain?
• EcoConnect – NIWA’s multi-hazard forecasting suite
• High Resolution Nesting – applications for cyclone forecasting
• Gerris – very high resolution CFD modelling
• Riskscape – an easy to use multi-hazard impact model for NZ
Outline
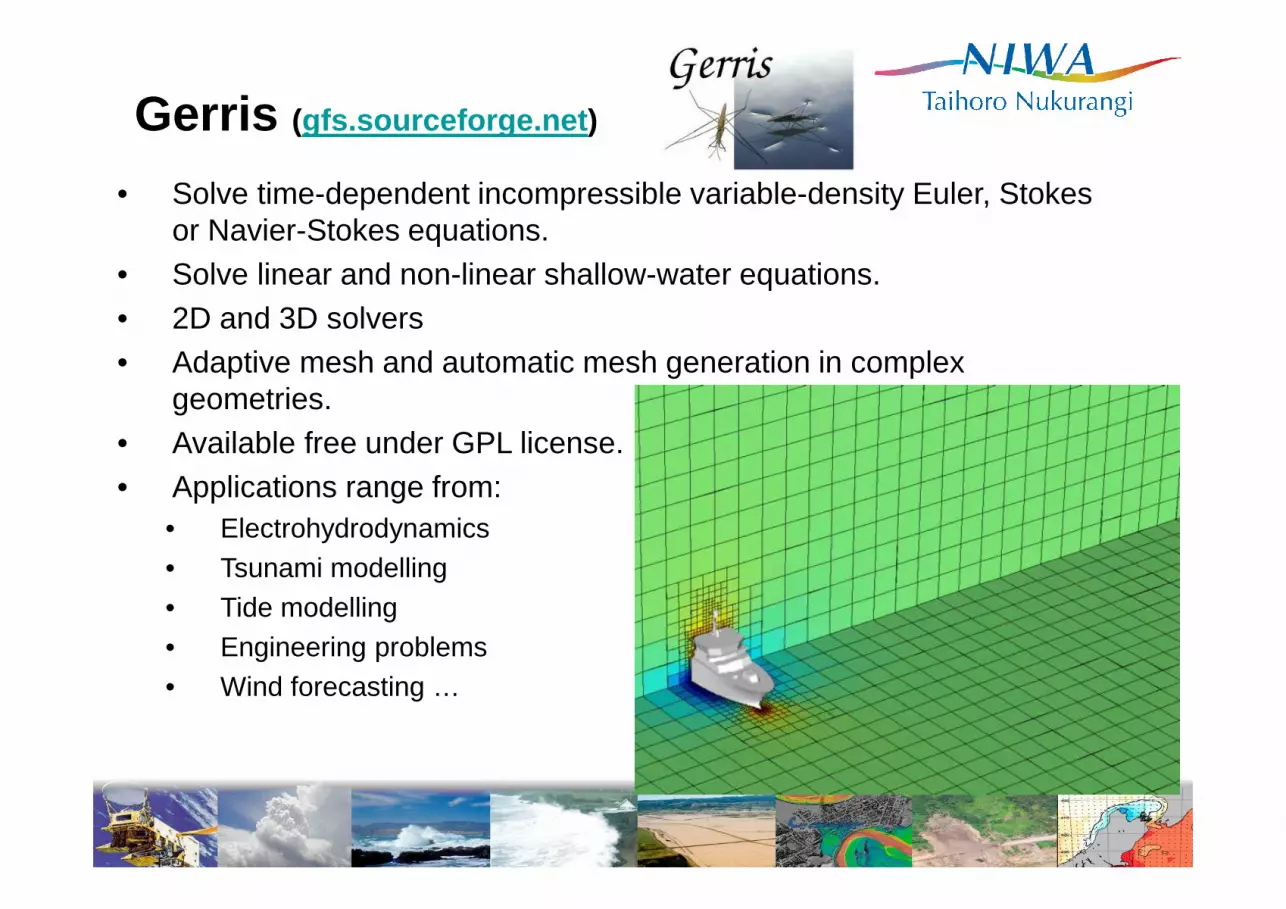
• Solve time-dependent incompressible variable-density Euler, Stokes or Navier-Stokes equations.
• Solve linear and non-linear shallow-water equations.• 2D and 3D solvers• Adaptive mesh and automatic mesh generation in complex
geometries.• Available free under GPL license.• Applications range from:
• Electrohydrodynamics• Tsunami modelling• Tide modelling• Engineering problems• Wind forecasting …
Gerris (gfs.sourceforge.net )
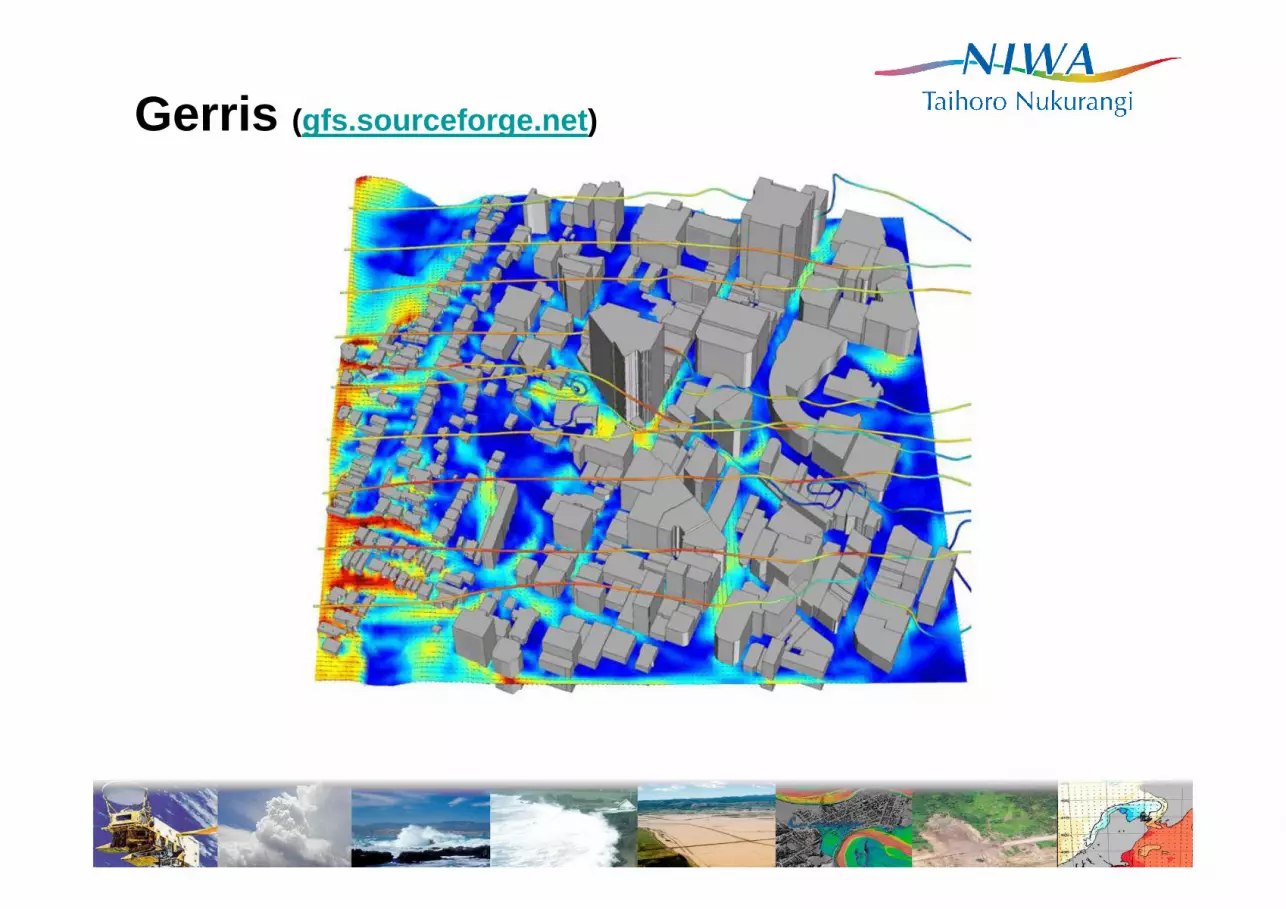
Gerris (gfs.sourceforge.net )
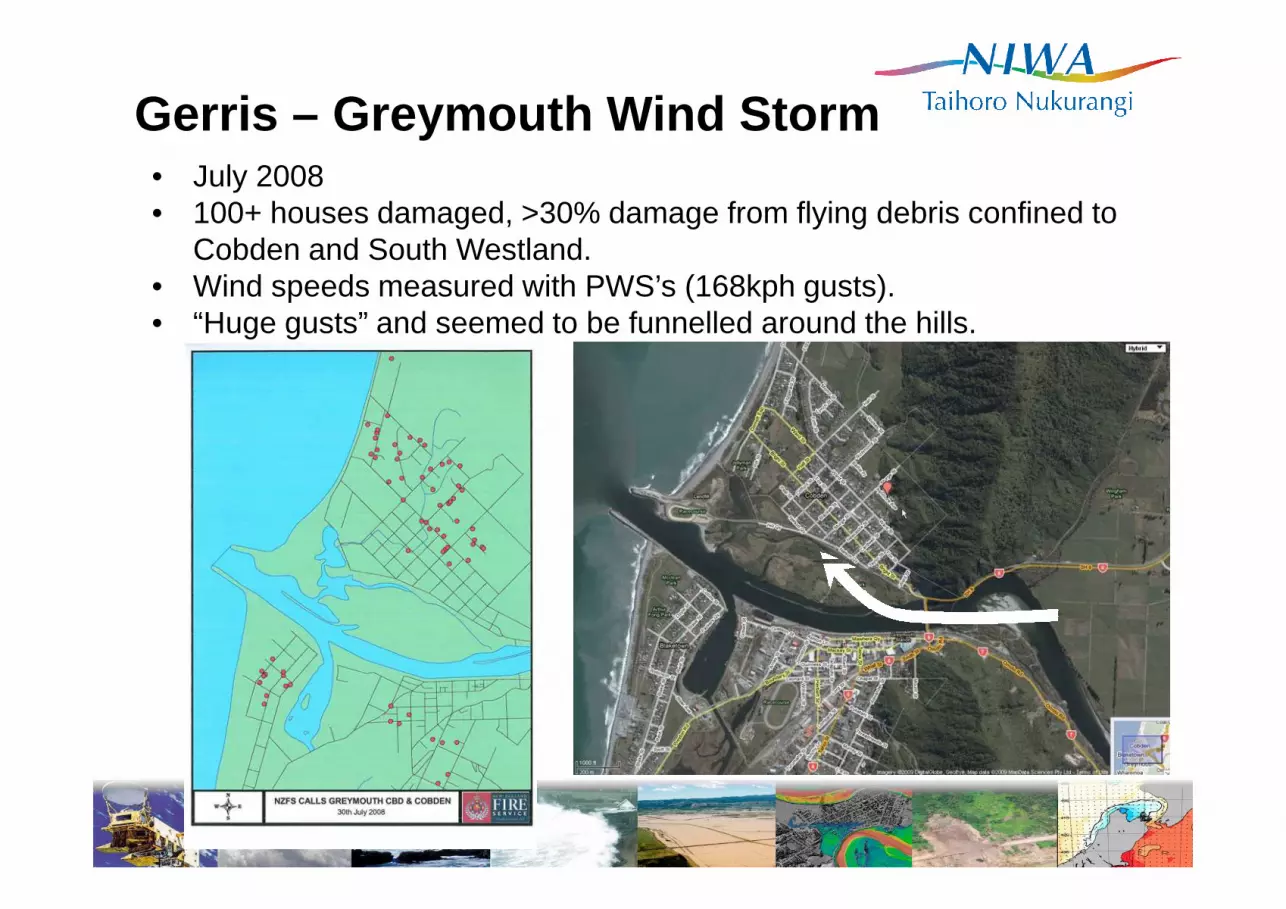
Gerris – Greymouth Wind Storm• July 2008• 100+ houses damaged, >30% damage from flying debris confined to
Cobden and South Westland.• Wind speeds measured with PWS’s (168kph gusts).• “Huge gusts” and seemed to be funnelled around the hills.

Idealised Southern Alps, 2000 m high
Coastal Range (40 km downstream, 1 km wide, 200 m high.
• ~15m/s easterly wind upstream• Reversal of wind with height led to trapping of waves and wave breaking• Up to x4 speed up due to shooting flow down lee slope of main divide• Additional speed up, 10-15%, due to flow through gap• Flow strongly modified by surface friction – requires much more resolution!

~40 km
20 kmFlow direction
Main divide Greymouth
(Blue -25m/s, Yellow +15m/s, Brown +60m/s).
• Belmont Hills Hillshape Multiplier ProjectHow good is AS/NZS 1170.2 at estimating winds in rugged terrain?
• EcoConnect – NIWA’s multi-hazard forecasting suite
• High Resolution Nesting – applications for cyclone forecasting
• Gerris – very high resolution CFD modelling
• Riskscape – an easy to use multi-hazard impact model for NZ
Outline
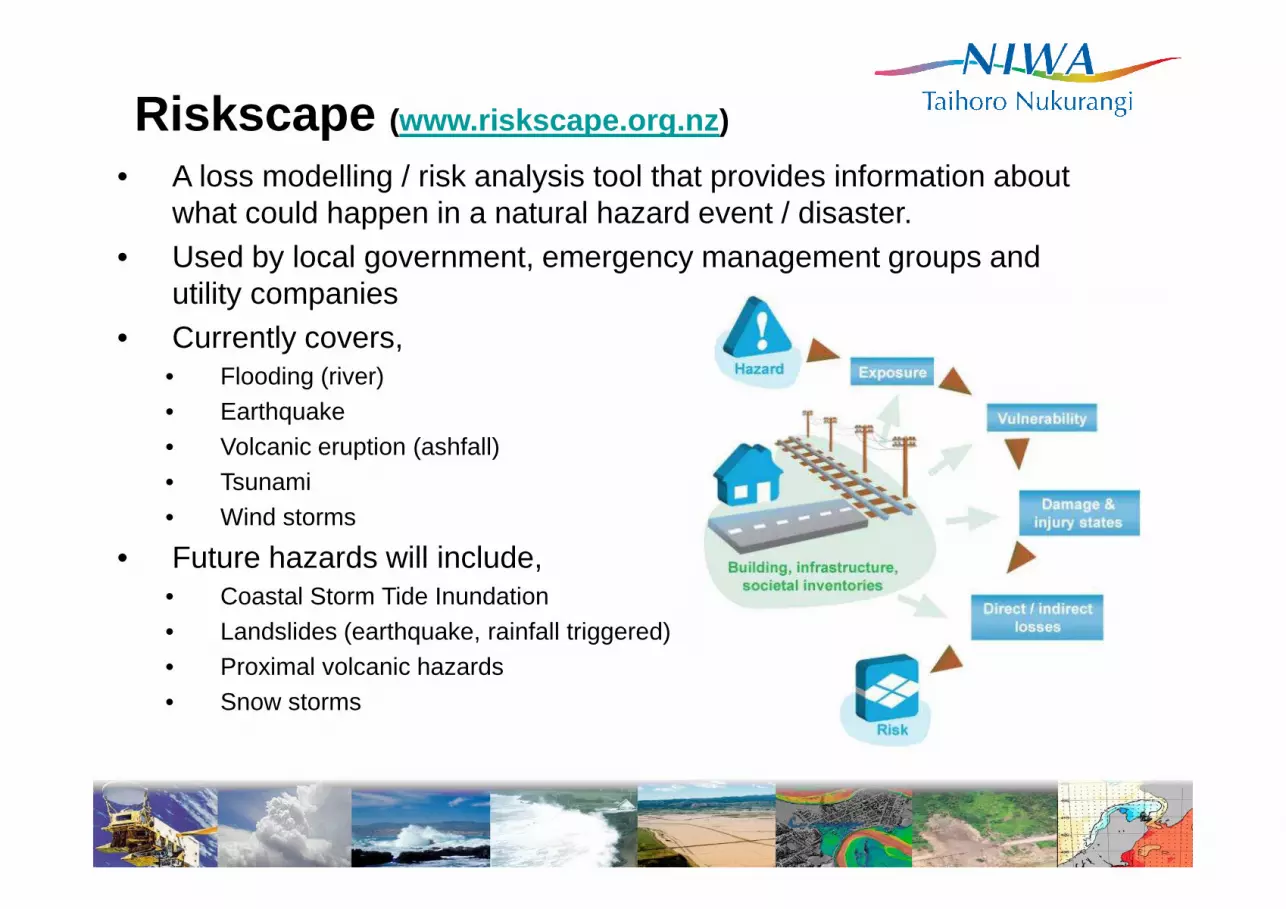
• A loss modelling / risk analysis tool that provides information about what could happen in a natural hazard event / disaster.
• Used by local government, emergency management groups and utility companies
• Currently covers,• Flooding (river)• Earthquake• Volcanic eruption (ashfall)• Tsunami• Wind storms
• Future hazards will include,• Coastal Storm Tide Inundation• Landslides (earthquake, rainfall triggered)• Proximal volcanic hazards• Snow storms
Riskscape (www.riskscape.org.nz )
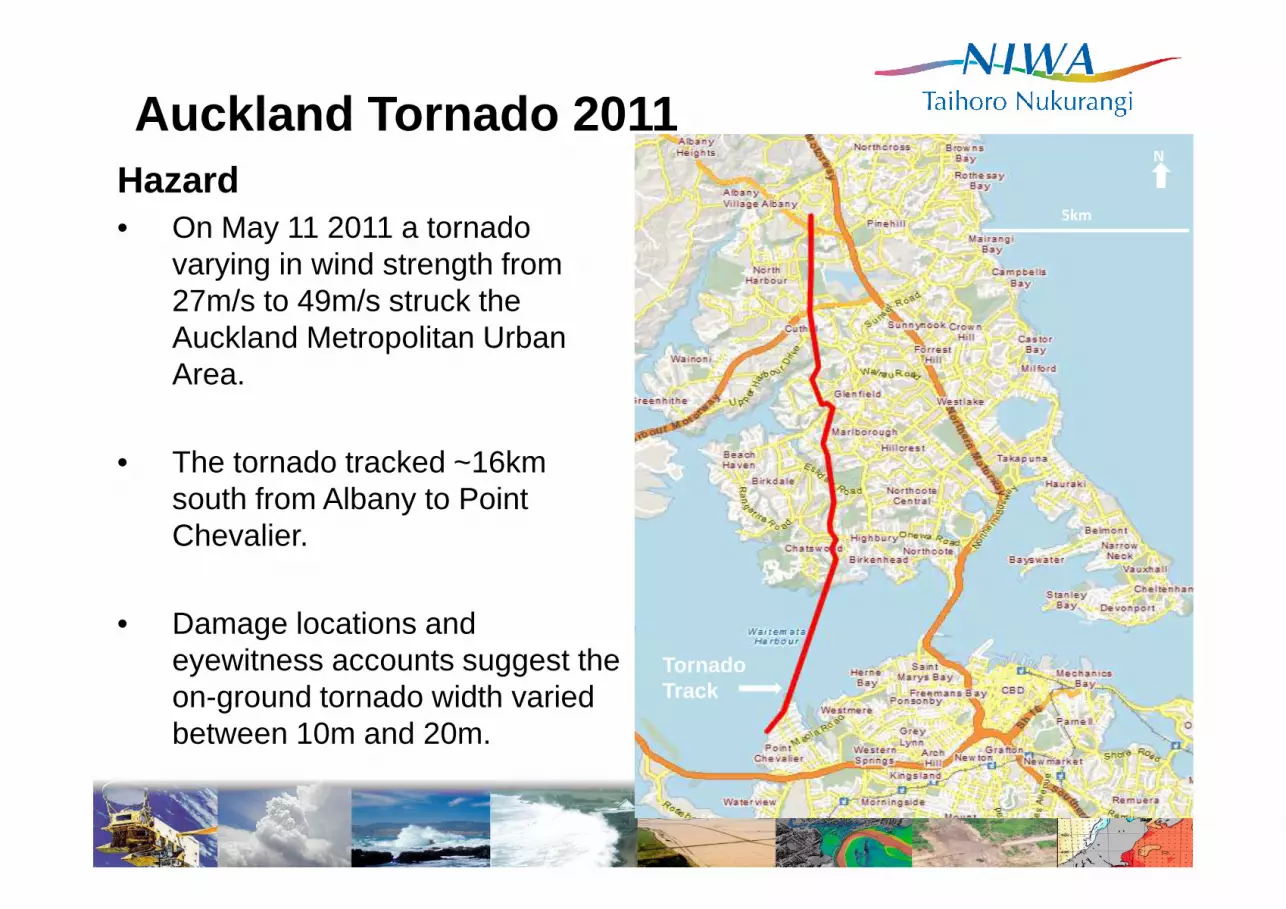
Hazard• On May 11 2011 a tornado
varying in wind strength from 27m/s to 49m/s struck the Auckland Metropolitan Urban Area.
• The tornado tracked ~16km south from Albany to Point Chevalier.
• Damage locations and eyewitness accounts suggest the on-ground tornado width varied between 10m and 20m.
Auckland Tornado 2011
5km
N
Tornado Track
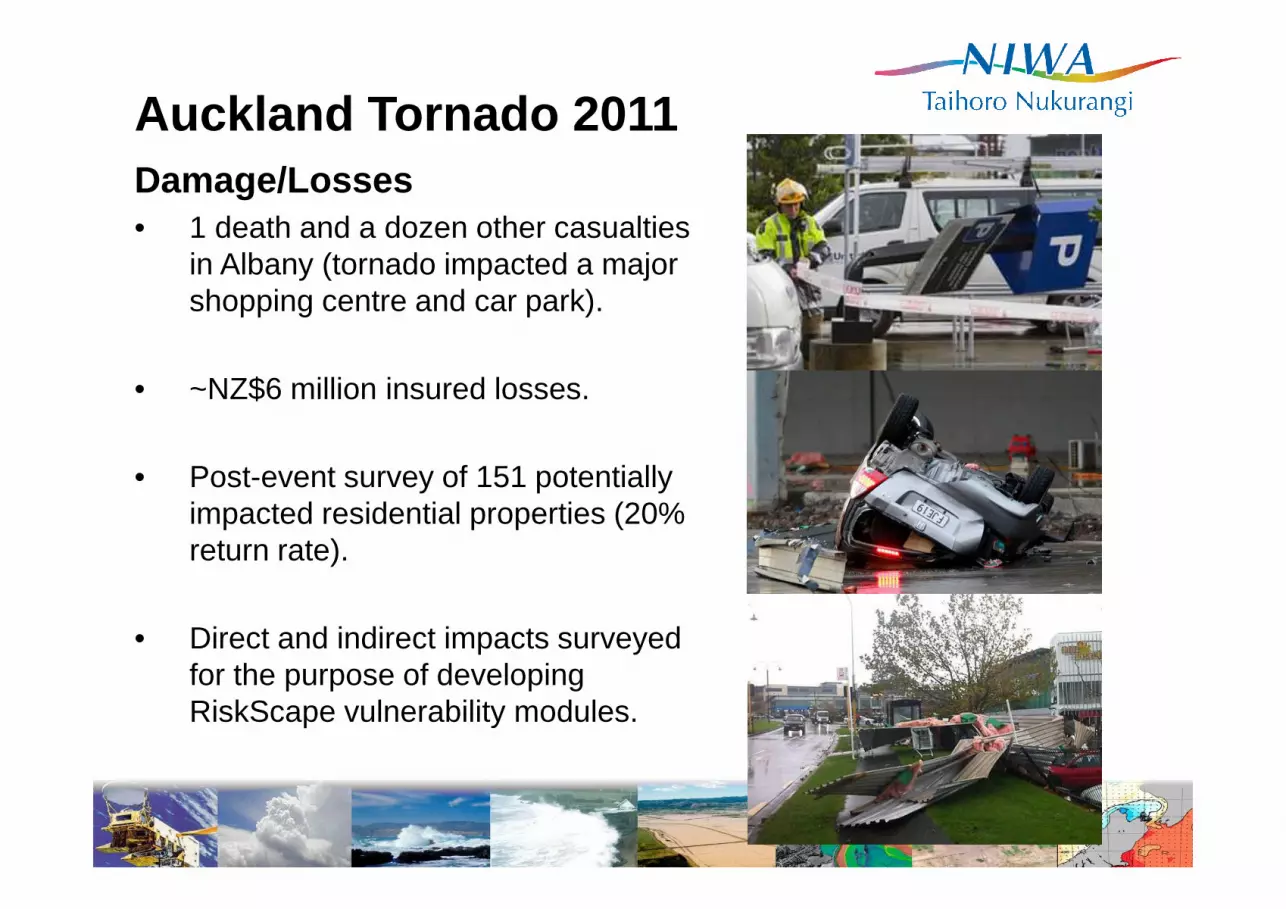
Auckland Tornado 2011Damage/Losses• 1 death and a dozen other casualties
in Albany (tornado impacted a major shopping centre and car park).
• ~NZ$6 million insured losses.
• Post-event survey of 151 potentially impacted residential properties (20% return rate).
• Direct and indirect impacts surveyed for the purpose of developing RiskScape vulnerability modules.

Auckland Tornado 2011
• Good correlation for all damage ratios derived for residential building structures (includes all building attributes) and wind velocity.
• Small survey size, mixed building materials and localised impacts limited identification of the relative vulnerability of building attributes to wind velocity.
• Building impact data extends datasets collected from previous tornado events (e.g. Taranaki 2007) used for developing RiskScape building fragility functions.
R² = 0.6422
0
5
10
15
20
25
0 20 40 60
Dam
age
Rat
io (
%)
Wind Velocity (m/s)
Auckland Tornado 2011 Residential Property Damage Ratios (all)
R² = 0.6675
0
5
10
15
20
25
30
0 20 40 60 80
Dam
age
Rat
io (
%)
Wind Velocity (m/s)
Residential Property Damage Ratios (all) from the Taranaki 2007 and Auckland 2011 Tornados
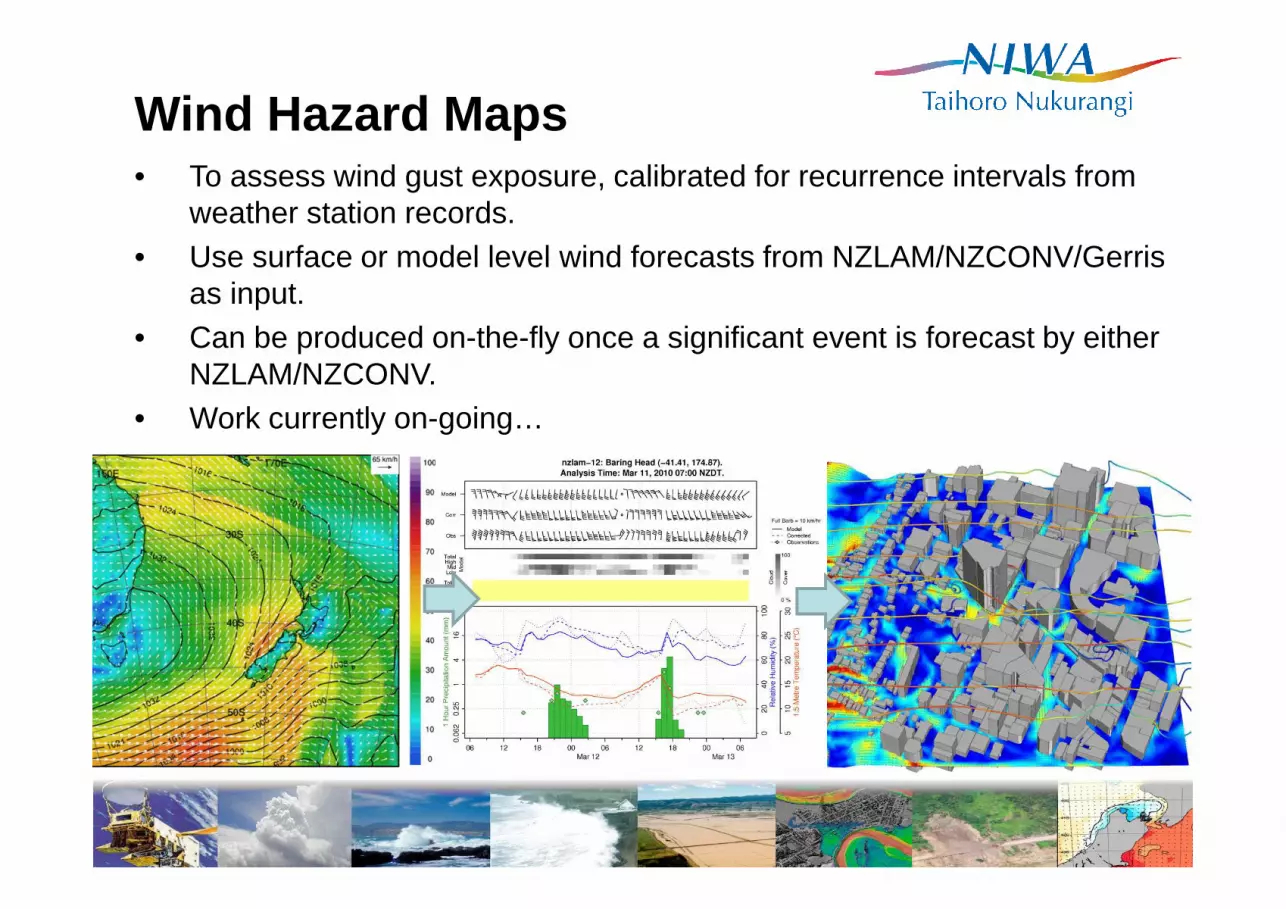
Wind Hazard Maps• To assess wind gust exposure, calibrated for recurrence intervals from
weather station records.• Use surface or model level wind forecasts from NZLAM/NZCONV/Gerris
as input.• Can be produced on-the-fly once a significant event is forecast by either
NZLAM/NZCONV.• Work currently on-going…


