Embed Size (px)
Citation preview

Foundations for Designing User-Centered Systems
Frank E. RitterGordon D. BaxterElizabeth F. Churchill
What System Designers Need to Know about People

Foundations for Designing User-CenteredSystems

Frank E. Ritter • Gordon D. BaxterElizabeth F. Churchill
Foundations for DesigningUser-Centered Systems
What System Designers Needto Know about People
123

Frank E. RitterCollege of ISTThe Pennsylvania State UniversityUniversity Park, PAUSA
Gordon D. BaxterSchool of Computer ScienceUniversity of St AndrewsSt Andrews, FifeUK
Elizabeth F. ChurchilleBay Research LabseBay Inc.San Jose, CAUSA
ISBN 978-1-4471-5133-3 ISBN 978-1-4471-5134-0 (eBook)DOI 10.1007/978-1-4471-5134-0Springer London Heidelberg New York Dordrecht
Library of Congress Control Number: 2013957359
� Springer-Verlag London 2014This work is subject to copyright. All rights are reserved by the Publisher, whether the whole or part ofthe material is concerned, specifically the rights of translation, reprinting, reuse of illustrations,recitation, broadcasting, reproduction on microfilms or in any other physical way, and transmission orinformation storage and retrieval, electronic adaptation, computer software, or by similar or dissimilarmethodology now known or hereafter developed. Exempted from this legal reservation are briefexcerpts in connection with reviews or scholarly analysis or material supplied specifically for thepurpose of being entered and executed on a computer system, for exclusive use by the purchaser of thework. Duplication of this publication or parts thereof is permitted only under the provisions ofthe Copyright Law of the Publisher’s location, in its current version, and permission for use mustalways be obtained from Springer. Permissions for use may be obtained through RightsLink at theCopyright Clearance Center. Violations are liable to prosecution under the respective Copyright Law.The use of general descriptive names, registered names, trademarks, service marks, etc. in thispublication does not imply, even in the absence of a specific statement, that such names are exemptfrom the relevant protective laws and regulations and therefore free for general use.While the advice and information in this book are believed to be true and accurate at the date ofpublication, neither the authors nor the editors nor the publisher can accept any legal responsibility forany errors or omissions that may be made. The publisher makes no warranty, express or implied, withrespect to the material contained herein.
Cover Image: Badrul Sarwar
Printed on acid-free paper
Springer is part of Springer Science+Business Media (www.springer.com)

Foreword
Our core Masters in Software Engineering course at the University of SouthernCalifornia is a 2-semester course in which students form into about 15–20 teams ofsix people to define, design, develop, and deploy working software systems forclients in the local South Los Angeles community. The clients range from ITstartups, neighborhood small businesses, local government and local communityservice organizations, to USC doctors, faculty members, librarians, administrators,and student organizations. The student developers come from many countries andcultures: mostly from the US, India, and China; but also from Europe, LatinAmerica, and other parts of Asia.
One concept that seems to be common among all of their cultures is a version ofthe Golden Rule: ‘‘Do unto others as you would have others do unto you.’’ One ofthe first things that we now teach the students is that this rule carries a dangerousassumption. How, we originally wondered, could such a universally accepted tenetbe dangerous? However, we found that it carries the assumption ‘‘Everyone is likeme,’’ and that many of the students would follow it to create programmer-friendlyuser interfaces, and say, for example, ‘‘Hard to use? What do you mean? Its tightsyntax minimizes keystrokes. It gives you the power of direct access to theoperating system. It doesn’t need to pinpoint errors because they’re obvious fromscanning the erroneous command.’’
We now teach them the Platinum Rule, ‘‘Do unto others as others would bedone unto,’’ emphasize development and exercise of user prototypes, and providereadings, user domain models, exercises, and win–win negotiation capabilities tohelp them learn how their clients would like to be done unto.
As we’ve evolved the course over the last 16 years, we’ve learned a lot aboutdevelopers and users the hard way, by trying things out and rethinking approachesthat didn’t work very well.
We could have avoided a great deal of this learning-the-hard-way if we’d hadaccess to the book that you’re holding now. Foundations for DesigningUser-Centered Systems: What System Designers Need to Know about People is awell-organized treasure trove of useful insights and case studies about the char-acteristics of users and how to develop systems that best fit their strengths andavoid their weak spots.
The book begins with some good motivation, context, underlying science, andconceptual frameworks for human-systems integration. It covers considerations of
v

users’ physiology (Chap. 3), senses (primarily vision and hearing) (Chap. 4), astrong coverage of users’ memory, attention, and learning aspects (Chap. 5), andseveral good chapters on how to improve human–computer interaction. Theseprovide useful information and guidance on human cognitive capabilities and theirimplications for considerations such as organizing text and menus, mental models(for problem solving and decision making), groupware and social processes, types ofusers and their design implications (age, gender, disabilities), error avoidance, taskanalysis, human-system evaluation considerations, and process models supportinghuman-systems integration, such as the incremental commitment spiral model.
Just to elaborate on one of these, the book is particularly strong in an area mostfrequently in need of improvement: groupware and social processes. Most com-puter systems have been developed to help individuals perform individual tasks,and tend to focus on improving individuals’ performance. A lot of groupware alsogets developed using such systems, so that the individual-focus gets supportedmore strongly than the group-focus.
An example of the consequences of this has been our series of win–winrequirements negotiation tools we’ve developed and used in our project coursementioned above. Our first three versions of the tools began by enabling stake-holders to enter and classify the win conditions they wanted from the project, afterwhich efforts were made to identify and resolve conflicts among the win condi-tions. This was often difficult after they had bought into the things they wanted.
Our fourth version of the negotiation toolset was built on top of a group-oriented support system (the Ventana/GroupSystems infrastructure). There, oncestakeholders entered a win condition, they did not stay in their own space, but werepresented with another entry window showing some win conditions entered by theother stakeholders. This often shifted their thinking to focus on understanding andaccommodating others’ win conditions (oh, they want this to run on Windows,Mac, and Unix platforms; we’d better not use any one-platform COTS (com-mercial off-the-shelf) products; maybe we should use a Java virtual machine ormake this a Web application; and do they have all three platforms for us to teston?). This opened our eyes to the differences between individual-focused andgroup-focused user interfaces, but it left us wondering how many other dimensionsof group-oriented user interfaces we needed to consider.
At that point, if we could have had Chaps. 8 and 9 of Foundations forDesigning User-Centered Systems, we would have been way ahead. It coversvarious cooperation settings (zero-sum, nonzero-sum, and behavioral games);techniques for promoting cooperation; social networking; critical influence factorsfor group performance (group size, group composition, social distance, spatialdistance, collaboration support, leadership capabilities, task attractiveness); typesof motivation to contribute to solutions; and social responsibility effects (demo-tivators to contribute to solutions).
The section on What Leads to Good Teamwork makes another distinctionbetween the knowledge, skills, and abilities (KSAs) traditionally used to measureindividual performance and those needed for group performance. ‘‘Knowledge’’focuses not only on technical and domain knowledge, but also on knowledge of
vi Foreword

team objectives and team-mate awareness. ‘‘Skills’’ focuses not only on analysisand synthesis skills, but also on shared situational awareness and conflict resolu-tion skills. The ‘‘A’’ does not represent Abilities but Attitudes, such as mutualtrust, team cohesion, and collective orientation. The chapter also has valuablesections on models of social processes and general implications for system design(e.g., structuring user measurement on contributions to mission effectiveness vs.user efficiency as a computer peripheral).
Other strengths of the book are its inclusion of stories, good and bad usagesnapshots, puzzles to stimulate learning and make it fun, and many references tohelpful sources of further information. A nice observation was ‘‘A year in thelaboratory can save an hour in the library.’’
As a bottom line, getting the user interface right can make a fundamentaldifference (just consider Apple Computer’s Fall 2011 quarterly sales of $46 billionand profits of $13 billion). This book may not make you the next Apple, butI believe that it can help make most people and organizations perceptibly better atunderstanding and satisfying user needs.
Barry BoehmTRW Professor of Software Engineering
Computer Science DepartmentUniversity of Southern California
Member, Committee on Human-System DesignNational Academy of Sciences’ National Research Council
Former Director of the Information Science and Technology Office, andDirector of the DDR&E Software and Computer Technology Office
DARPA
Fellow ACM, AIAA, IEEE, INCOSEMember U.S. National Academy of Engineering
Foreword vii

Preface
Many books on user centered design and HCI focus on the way people interactwith technology. This is an important issue, because people routinely interact withtechnology on a daily basis—personal computers, mobile phones, airplane cock-pits, or even more mundane things like electric kettles and toasters. Despiteeverything that we know about interaction, however, technology still does notalways support what we, as users, are trying to do, or behave in the way we expectit to. This can be exasperating for us: as users, as designers, and as developers.
In Foundations for Designing User-Centered Systems we help you to under-stand why people behave and interact with technology in the way they do. Byhelping you understand both how and why people behave in the way they do, andby helping you to develop a more systems oriented perspective, we provide youwith a framework that will enable you to develop technologies that are both usefuland usable. These technologies will also be more acceptable to users because theywill be better suited to the way users work in their normal environment.
Our Approach
The people who use technology must be considered to be part of the systems theyuse. Although people–‘‘users’’–are diverse, they also have many characteristics incommon. Not all of these characteristics are directly visible or available to systemdesigners without much closer investigation. By understanding the characteristicsof users, designers are better able to create safer, more usable, and more acceptablesystems.
We have designed Foundations for Designing User-Centered Systems toencourage you to ask critical and reflective questions throughout the design pro-cess about how your users will work with your technology. Whilst we provide keyfacts and characteristics about people as users, we have resisted creating a sourcebook filled with lists of endless facts about human characteristics. We have alsoavoided the temptation of promoting design by rules, so we do not provide lists ofguidelines that must be rigidly followed, or known problems that must be avoided.
ix

Our goal is to help you understand the process of designing interactive tech-nologies and to introduce you to a user-centered, systems oriented approach todesign. We present a detailed, theoretically grounded approach to understandingpeople: how they accomplish the things they do and how they work out what theyneed to do (their tasks) in particular situations.
We have tried to select the most important things you should know about people,based on our experience of working in industry and academia. Foundations forDesigning User-Centered Systems will help you develop a principled model ofusers, based on regularities of human behavior, which encapsulates this informationso that you can predict how users will behave in different situations. This model willincorporate aspects of how perception, action, cognition, and social processes allcontribute to human behavior.
We believe it is important to have the grounding for innovation as well as theability to evaluate existing systems. Our approach will give you a solid foundationfor dealing with a wide range of situations and provide you with the analyticalskills to design in innovative ways—including introducing you to computationaland cognitive models of how users think. We build on existing methods andtechniques, providing you with the basic knowledge that will let you invent yourown methods for design and evaluation based on the different settings that you findyourself in.
For Practitioners
As the book has developed, many of our colleagues and collaborators fromindustry have reiterated the importance of the issues that we address, and howmuch they support the idea of Foundations for Designing User-Centered Systems.They often find that they have to train their staff about users, their tasks, and thecontext in which they perform those tasks. To address this we provide an extensivetheoretical information about design-relevant user characteristics to make practi-tioners aware of the important issues. In addition, throughout the book we considerthe implications for system design, where we offer concrete examples of how theinformation we present can be applied.
For Teachers and Advanced Students
Our book provides enough material for a semester-long course on users, human–computer interaction, human factors, interface design, or human behavior mod-eling where users are an inherent part of the envisaged systems. While much more
x Preface

is known about users than we present here, we have intentionally limited ourselvesto what can be covered in a semester. We provide follow-up reading for those whowish to take things further at the end of each chapter. More resources on the topicswe cover are continually becoming available online and these could be used toextend our material to support longer or more advanced courses. You will also findsome useful resources on the Foundations for Designing User-Centered Systemsweb site (www.frankritter.com/fducs).
Preface xi

Acknowledgments
The book has evolved over time as we and our erstwhile colleague, DavidGilmore, have taught human–computer interaction, human factors, user interfacedesign, cognitive ergonomics, and cognitive modeling at the University ofNottingham, Penn State, the University of York (UK), and the University of StAndrews. Collating the material was made possible through the original web sitecreated by David as a way to help support students. The idea of turning it into abook emerged as the web site expanded, and as the material has been updated.
While any mistakes remain ours, we need to thank the many people who haveoffered feedback and encouragement along the way. In particular, we would like tothank the following people. Peter Lonsdale prepared a talk for a class that turnedinto lecture notes on the application of our approach to the web, and the students atPenn State (Andrew Freed) and at the University of Nottingham helped refinemany of the exercises. Dan Gao, Soo Yeon Lee, and B. S. Sowmyalatha (PSU/UP)provided great feedback on improving this text, constantly encouraging moreexamples. Alexander Daise, Mark Kozlowski, David Kaethner, Lars Guenther, andMarcel Richter (TU/Chemnitz) also offered many good suggestions on how toimprove the presentation.
Our colleagues (and where they used it to teach) provided useful feedbackbased on use. These include Mithu Bhattacharya (PSU/UP), Michael Qin(NSMRL, U. of Connecticut/WPI), Mark Ackerman (Michigan), Kuo-Chuan(Martin) Yeh (Penn State/World Campus), Marcela Borge (PSU/UP), Pat Clemson(PSU/Beaver), and Olivier Georgeon (PSU/UP).
We received comments from several people at PSU, notably Andrew Freed,C. Lee Giles, Alexander Ororbia II, James Wang, and Luke Zhang. Rob St. Amant(NCSU) and Magy Seif El-Nasr (Northeastern) provided useful comments toimprove the direction of this book. Simon Robbie (CMU, Apple) providedextensive suggestions throughout the book after a chance meeting at a pterodactylride. Jack Sparks (MCWL) read each chapter and the breadth and depth of hisbiting but not hurtful comments were encouraging. Lisa Dow (University of StAndrews), Ben Dyson (Ryerson University), David Grayson (Fluent Interaction),Chandra Harrison, Junya Morita (JAIST), Les Nelson (PARC), and MargaretRitter all provided encouragement and support as well as useful feedback onmultiple chapters as the book developed. General discussions with Bill Webber(Erlbaum) and Rajal Cohen (PSU) improved the presentation. We should also note
xiii

that books by John R. Anderson, Boff and Lincoln, Don Norman, and ChrisWickens and his colleagues have helped shape this work, and some of the waysthey organize topics are reflected here. Don Meeker (PSU) provided photos anduseful comments about the use of his photos.
Many people provided feedback on individual chapters which has greatlyhelped the book as well, including Jennifer Bittner (Indiana), Shawn Clark (PSU/UP), Georgious Christous (European University Cyprus), Ed Glantz (PSU/UP),David Golightly (University of Nottingham), Kate Hone (Brunel University), M.Cameron Jones (Google), Bill Kennedy (GMU), Russell Lock (LoughboroughUniversity), Faidon Loumakis (Fluent Interaction), Naomi Malone (UCF), SylvieNoel (Communications Research Centre Canada/Centre de recherches sur lescommunications Canada), Shamil Parbhoo (Fluent Interaction), Ling Rothrock(PSU/UP), Marco de Sa (Twitter), Joe Sanford (PSU/UP), Elaine Seery (ScienceEditing), Sarah Sharples (University of Nottingham), Tim Storer (University ofGlasgow), and Fiona Woodcock (Fluent Interaction).
Gordon Baxter’s work on the book was supported by funding from the UKEPSRC’s Large Scale Complex IT Systems project. Frank Ritter has drawn onmaterial developed with support from ONR and DTRA and applied this material totheir projects, having been influenced by these projects and having used thismaterial to help train researchers on those projects. A Senior Fulbright Fellowshipprovided support to teach this material at TU/Chemnitz, and the College of IST hasbeen supportive.
Finally, Beverley Ford, Ben Bishop, Jake Kirby, and a copyeditor at Springerhave been very helpful and encouraging. They helped us push this book over thefinish line with their kind words and support. Figures and pictures used withpermission by their authors. Unattributed figures are copyright by the authors andare available for use by instructors on an instructors’ web site.
Citations are done in Springer house style; references are done in APA format.
xiv Acknowledgments

Contents
Part I Introduction: Aims, Motivations, and Introductionto Human-Centered Design
1 Introducing User-Centered Systems Design . . . . . . . . . . . . . . . . . 31.1 Introduction . . . . . . . . . . . . . . . . . . . . . . . . . . . . . . . . . . . 31.2 Starting to Understand Users . . . . . . . . . . . . . . . . . . . . . . . 4
1.2.1 Designing Mappings Between Buttonsand Lights . . . . . . . . . . . . . . . . . . . . . . . . . . . . . 5
1.2.2 Designing Stove-Top Mappings . . . . . . . . . . . . . . 61.2.3 Designing Coins . . . . . . . . . . . . . . . . . . . . . . . . . 71.2.4 What Happens If You do not Take Proper
Account of Users, Tasks, and Context? . . . . . . . . . 101.3 The Benefits and Costs of Understanding Users . . . . . . . . . . 10
1.3.1 Benefit 1: More Usable Products . . . . . . . . . . . . . 111.3.2 Benefit 2: Financial Savings. . . . . . . . . . . . . . . . . 121.3.3 Benefit 3: Safer Systems . . . . . . . . . . . . . . . . . . . 131.3.4 Cost 1: Understanding the Users Does Not
Guarantee Success . . . . . . . . . . . . . . . . . . . . . . . 141.3.5 Cost 2: Knowing When to Stop Analyzing
the Users can be Difficult . . . . . . . . . . . . . . . . . . 141.4 Summarizing Design Relevant User Characteristics:
The ABCS Framework . . . . . . . . . . . . . . . . . . . . . . . . . . . 161.4.1 Anthropometrics Approach. . . . . . . . . . . . . . . . . . 171.4.2 Behavioral Aspects . . . . . . . . . . . . . . . . . . . . . . . 191.4.3 Cognition . . . . . . . . . . . . . . . . . . . . . . . . . . . . . . 201.4.4 Social Factors. . . . . . . . . . . . . . . . . . . . . . . . . . . 21
1.5 Simulating User Characteristics: Cognitive Architectures. . . . 231.6 Summary . . . . . . . . . . . . . . . . . . . . . . . . . . . . . . . . . . . . . 24
1.6.1 Structure of the Rest of the Book . . . . . . . . . . . . . 251.6.2 Future Work. . . . . . . . . . . . . . . . . . . . . . . . . . . . 26
1.7 Other Resources . . . . . . . . . . . . . . . . . . . . . . . . . . . . . . . . 261.8 Exercises . . . . . . . . . . . . . . . . . . . . . . . . . . . . . . . . . . . . . 28References . . . . . . . . . . . . . . . . . . . . . . . . . . . . . . . . . . . . . . . . . 29
xv

2 User-Centered Systems Design: A Brief History. . . . . . . . . . . . . . 332.1 Introduction . . . . . . . . . . . . . . . . . . . . . . . . . . . . . . . . . . . 332.2 Influential and Related Research Fields . . . . . . . . . . . . . . . . 34
2.2.1 Ergonomics and Human Factors . . . . . . . . . . . . . . 352.2.2 Socio-Technical Systems Design. . . . . . . . . . . . . . 402.2.3 Cognitive Modeling and Programmable
User Models. . . . . . . . . . . . . . . . . . . . . . . . . . . . 422.2.4 User-Centered and Human-Centered Design. . . . . . 432.2.5 User Experience . . . . . . . . . . . . . . . . . . . . . . . . . 442.2.6 Human–Computer Interaction . . . . . . . . . . . . . . . . 45
2.3 Standards, Principles, and Guidelines . . . . . . . . . . . . . . . . . 462.4 Summary . . . . . . . . . . . . . . . . . . . . . . . . . . . . . . . . . . . . . 502.5 Other Resources . . . . . . . . . . . . . . . . . . . . . . . . . . . . . . . . 512.6 Exercises . . . . . . . . . . . . . . . . . . . . . . . . . . . . . . . . . . . . . 52References . . . . . . . . . . . . . . . . . . . . . . . . . . . . . . . . . . . . . . . . . 53
Part II Design Relevant User Characteristics: The ABCS
3 Anthropometrics: Important Aspects of Users’ Bodies . . . . . . . . . 573.1 Introduction . . . . . . . . . . . . . . . . . . . . . . . . . . . . . . . . . . . 573.2 Physical Aspects of Interaction. . . . . . . . . . . . . . . . . . . . . . 59
3.2.1 Posture . . . . . . . . . . . . . . . . . . . . . . . . . . . . . . . 593.2.2 Load Bearing . . . . . . . . . . . . . . . . . . . . . . . . . . . 62
3.3 Interacting with Haptic Devices . . . . . . . . . . . . . . . . . . . . . 623.3.1 Physical Keyboards . . . . . . . . . . . . . . . . . . . . . . . 633.3.2 Touch Screens . . . . . . . . . . . . . . . . . . . . . . . . . . 653.3.3 Pointing Devices. . . . . . . . . . . . . . . . . . . . . . . . . 663.3.4 Mobile Phones . . . . . . . . . . . . . . . . . . . . . . . . . . 693.3.5 Video Games and Virtual Reality Systems. . . . . . . 703.3.6 Other Devices. . . . . . . . . . . . . . . . . . . . . . . . . . . 713.3.7 Advantages and Disadvantages
of Haptic Interfaces. . . . . . . . . . . . . . . . . . . . . . . 733.4 Implications for System Design . . . . . . . . . . . . . . . . . . . . . 743.5 Summary . . . . . . . . . . . . . . . . . . . . . . . . . . . . . . . . . . . . . 753.6 Other Resources . . . . . . . . . . . . . . . . . . . . . . . . . . . . . . . . 763.7 Exercises . . . . . . . . . . . . . . . . . . . . . . . . . . . . . . . . . . . . . 77References . . . . . . . . . . . . . . . . . . . . . . . . . . . . . . . . . . . . . . . . . 79
4 Behavior: Basic Psychology of the User . . . . . . . . . . . . . . . . . . . . 814.1 Introduction . . . . . . . . . . . . . . . . . . . . . . . . . . . . . . . . . . . 814.2 Behavioral Psychology Terminology . . . . . . . . . . . . . . . . . . 82
4.2.1 Thresholds and Just NoticeableDifferences (JNDs) . . . . . . . . . . . . . . . . . . . . . . . 82
xvi Contents

4.2.2 Habituation . . . . . . . . . . . . . . . . . . . . . . . . . . . . 834.2.3 Signal Detection Theory (SDT) . . . . . . . . . . . . . . 834.2.4 Implications for System Design . . . . . . . . . . . . . . 85
4.3 The Physiology of Vision . . . . . . . . . . . . . . . . . . . . . . . . . 864.3.1 Overview of Vision. . . . . . . . . . . . . . . . . . . . . . . 864.3.2 The Basic Structure of the Eye. . . . . . . . . . . . . . . 864.3.3 Using Eye-Tracking to Measure
Eye Movements . . . . . . . . . . . . . . . . . . . . . . . . . 884.3.4 Rods and Cones . . . . . . . . . . . . . . . . . . . . . . . . . 894.3.5 Implications for System Design . . . . . . . . . . . . . . 91
4.4 Low Level Visual Perception . . . . . . . . . . . . . . . . . . . . . . . 924.4.1 Vision and the Measurement of Light . . . . . . . . . . 924.4.2 Color Vision. . . . . . . . . . . . . . . . . . . . . . . . . . . . 944.4.3 Color Blindness . . . . . . . . . . . . . . . . . . . . . . . . . 954.4.4 Color Systems . . . . . . . . . . . . . . . . . . . . . . . . . . 964.4.5 Flicker . . . . . . . . . . . . . . . . . . . . . . . . . . . . . . . . 964.4.6 Pop-Out Effects . . . . . . . . . . . . . . . . . . . . . . . . . 974.4.7 Implications for System Design . . . . . . . . . . . . . . 100
4.5 Higher Level Visual Perception . . . . . . . . . . . . . . . . . . . . . 1004.5.1 Movement and Spatial Perception . . . . . . . . . . . . . 1014.5.2 Depth Cues . . . . . . . . . . . . . . . . . . . . . . . . . . . . 1014.5.3 Subitizing . . . . . . . . . . . . . . . . . . . . . . . . . . . . . 1024.5.4 Gestalt Principles of Grouping . . . . . . . . . . . . . . . 1034.5.5 Other Theories of High Level Visual Perception. . . 1034.5.6 Implications for System Design . . . . . . . . . . . . . . 105
4.6 The Auditory System . . . . . . . . . . . . . . . . . . . . . . . . . . . . 1064.6.1 Theoretical Description of Sound . . . . . . . . . . . . . 1064.6.2 Measuring Sound . . . . . . . . . . . . . . . . . . . . . . . . 1084.6.3 Localizing Sound . . . . . . . . . . . . . . . . . . . . . . . . 1104.6.4 Discriminating Sounds. . . . . . . . . . . . . . . . . . . . . 1114.6.5 Implications for System Design . . . . . . . . . . . . . . 111
4.7 Motivation . . . . . . . . . . . . . . . . . . . . . . . . . . . . . . . . . . . . 1124.7.1 Introduction . . . . . . . . . . . . . . . . . . . . . . . . . . . . 1124.7.2 Maslow’s Hierarchical Theory . . . . . . . . . . . . . . . 1134.7.3 Extrinsic and Intrinsic Motivation . . . . . . . . . . . . . 1134.7.4 Implications for System Design . . . . . . . . . . . . . . 116
4.8 Summary . . . . . . . . . . . . . . . . . . . . . . . . . . . . . . . . . . . . . 1174.9 Other Resources . . . . . . . . . . . . . . . . . . . . . . . . . . . . . . . . 1184.10 Exercises . . . . . . . . . . . . . . . . . . . . . . . . . . . . . . . . . . . . . 119References . . . . . . . . . . . . . . . . . . . . . . . . . . . . . . . . . . . . . . . . . 120
5 Cognition: Memory, Attention, and Learning . . . . . . . . . . . . . . . 1235.1 Introduction . . . . . . . . . . . . . . . . . . . . . . . . . . . . . . . . . . . 1235.2 Memory. . . . . . . . . . . . . . . . . . . . . . . . . . . . . . . . . . . . . . 124
Contents xvii

5.2.1 Types of Memory . . . . . . . . . . . . . . . . . . . . . . . . 1245.2.2 Mnemonics and Aids to Memory . . . . . . . . . . . . . 1315.2.3 PQ4R: A Way to Improve Reading
Comprehension . . . . . . . . . . . . . . . . . . . . . . . . . . 1335.2.4 Memory Biases. . . . . . . . . . . . . . . . . . . . . . . . . . 1335.2.5 Implications for System Design . . . . . . . . . . . . . . 136
5.3 Attention . . . . . . . . . . . . . . . . . . . . . . . . . . . . . . . . . . . . . 1375.3.1 Wickens’ Theory of Attentional Resources . . . . . . 1395.3.2 An Information Processing Model of Attention. . . . 1405.3.3 Divided Attention . . . . . . . . . . . . . . . . . . . . . . . . 1415.3.4 Slips of Action . . . . . . . . . . . . . . . . . . . . . . . . . . 1415.3.5 Interruptions . . . . . . . . . . . . . . . . . . . . . . . . . . . . 1425.3.6 Automation Deficit: Keeping the Human
in the Loop . . . . . . . . . . . . . . . . . . . . . . . . . . . . 1435.3.7 Implications for System Design . . . . . . . . . . . . . . 144
5.4 Learning and Skilled Behavior . . . . . . . . . . . . . . . . . . . . . . 1445.4.1 The Process of Learning . . . . . . . . . . . . . . . . . . . 1455.4.2 Improvements from Learning . . . . . . . . . . . . . . . . 1475.4.3 Types of Learning. . . . . . . . . . . . . . . . . . . . . . . . 1505.4.4 Skilled Behavior, Users in Complex
Environments . . . . . . . . . . . . . . . . . . . . . . . . . . . 1535.4.5 Expertise . . . . . . . . . . . . . . . . . . . . . . . . . . . . . . 1545.4.6 Transfer . . . . . . . . . . . . . . . . . . . . . . . . . . . . . . . 1555.4.7 Implications for System Design . . . . . . . . . . . . . . 155
5.5 Summary . . . . . . . . . . . . . . . . . . . . . . . . . . . . . . . . . . . . . 1585.6 Other Resources . . . . . . . . . . . . . . . . . . . . . . . . . . . . . . . . 1585.7 Exercises . . . . . . . . . . . . . . . . . . . . . . . . . . . . . . . . . . . . . 159References . . . . . . . . . . . . . . . . . . . . . . . . . . . . . . . . . . . . . . . . . 161
6 Cognition: Mental Representations, Problem Solving,and Decision Making . . . . . . . . . . . . . . . . . . . . . . . . . . . . . . . . . 1656.1 Introduction . . . . . . . . . . . . . . . . . . . . . . . . . . . . . . . . . . . 1656.2 Mental Representations . . . . . . . . . . . . . . . . . . . . . . . . . . . 166
6.2.1 Simple Representations . . . . . . . . . . . . . . . . . . . . 1676.2.2 User’s Mental Models . . . . . . . . . . . . . . . . . . . . . 1686.2.3 Feeling of Knowing and Confidence Judgments . . . 1716.2.4 Stimulus–Response Compatibility
for Mental Models . . . . . . . . . . . . . . . . . . . . . . . 1716.2.5 Implications for System Design . . . . . . . . . . . . . . 173
6.3 Problem Solving . . . . . . . . . . . . . . . . . . . . . . . . . . . . . . . . 1746.3.1 The Importance of Problem Solving . . . . . . . . . . . 1756.3.2 Examples of Problem Solving . . . . . . . . . . . . . . . 1756.3.3 Known Influences on Problem Solving . . . . . . . . . 1766.3.4 Ill-Structured Problems . . . . . . . . . . . . . . . . . . . . 1816.3.5 Summary of Problem Solving with Implications
for System Design . . . . . . . . . . . . . . . . . . . . . . . 183
xviii Contents

6.4 Decision Making . . . . . . . . . . . . . . . . . . . . . . . . . . . . . . . 1836.4.1 Decision Making is Often Not Rational . . . . . . . . . 1846.4.2 Simple Decisions: Hicks Law
and Speed–Accuracy Trade-Offs. . . . . . . . . . . . . . 1846.4.3 Stimulus–Response Compatibility for Decisions . . . 1856.4.4 Known Influences on Decision Making . . . . . . . . . 1876.4.5 Larger Scale Decision Making Process:
Expertise and RPDM. . . . . . . . . . . . . . . . . . . . . . 1916.4.6 Summary of Decision Making with Implications
for System Design . . . . . . . . . . . . . . . . . . . . . . . 1926.5 Summary . . . . . . . . . . . . . . . . . . . . . . . . . . . . . . . . . . . . . 1966.6 Other Resources . . . . . . . . . . . . . . . . . . . . . . . . . . . . . . . . 1976.7 Exercises . . . . . . . . . . . . . . . . . . . . . . . . . . . . . . . . . . . . . 198References . . . . . . . . . . . . . . . . . . . . . . . . . . . . . . . . . . . . . . . . . 198
7 Cognition: Human–Computer Communication . . . . . . . . . . . . . . 2017.1 Introduction . . . . . . . . . . . . . . . . . . . . . . . . . . . . . . . . . . . 2017.2 Language. . . . . . . . . . . . . . . . . . . . . . . . . . . . . . . . . . . . . 202
7.2.1 Symbols, Syntax, and Semantics . . . . . . . . . . . . . . 2027.2.2 Grice’s Maxims of Conversation. . . . . . . . . . . . . . 2037.2.3 Implications for System Design . . . . . . . . . . . . . . 204
7.3 How Users Read. . . . . . . . . . . . . . . . . . . . . . . . . . . . . . . . 2057.3.1 The Effects of Fonts . . . . . . . . . . . . . . . . . . . . . . 2077.3.2 Graphic Design to Help Reading and Scanning . . . 2087.3.3 Paper-Based Versus Screen-Based Reading . . . . . . 2087.3.4 Scanning Displays and Menus . . . . . . . . . . . . . . . 2107.3.5 Implications for System Design . . . . . . . . . . . . . . 211
7.4 Information Seeking Behavior . . . . . . . . . . . . . . . . . . . . . . 2127.4.1 Information . . . . . . . . . . . . . . . . . . . . . . . . . . . . 2127.4.2 Human Information Behavior . . . . . . . . . . . . . . . . 2127.4.3 Human Information Seeking Behavior . . . . . . . . . . 2137.4.4 Information Scent . . . . . . . . . . . . . . . . . . . . . . . . 2137.4.5 Implications for System Design . . . . . . . . . . . . . . 214
7.5 Designing Content . . . . . . . . . . . . . . . . . . . . . . . . . . . . . . 2147.5.1 Content Strategy . . . . . . . . . . . . . . . . . . . . . . . . . 2157.5.2 Information Architecture . . . . . . . . . . . . . . . . . . . 2157.5.3 Creating Content. . . . . . . . . . . . . . . . . . . . . . . . . 2167.5.4 Structuring Content . . . . . . . . . . . . . . . . . . . . . . . 2167.5.5 Delivering Content . . . . . . . . . . . . . . . . . . . . . . . 217
7.6 Implications for System Design . . . . . . . . . . . . . . . . . . . . . 2177.7 Summary . . . . . . . . . . . . . . . . . . . . . . . . . . . . . . . . . . . . . 2187.8 Other Resources . . . . . . . . . . . . . . . . . . . . . . . . . . . . . . . . 2197.9 Exercises . . . . . . . . . . . . . . . . . . . . . . . . . . . . . . . . . . . . . 220References . . . . . . . . . . . . . . . . . . . . . . . . . . . . . . . . . . . . . . . . . 221
Contents xix

8 Social: Social Cognition and Teamwork . . . . . . . . . . . . . . . . . . . 2258.1 Introduction . . . . . . . . . . . . . . . . . . . . . . . . . . . . . . . . . . . 2258.2 Social Effects on Decision Making . . . . . . . . . . . . . . . . . . . 228
8.2.1 Introduction . . . . . . . . . . . . . . . . . . . . . . . . . . . . 2288.2.2 Social Responsibility Effects . . . . . . . . . . . . . . . . 2288.2.3 Attributions and Attributional Style. . . . . . . . . . . . 2308.2.4 Majority and Minority Effects . . . . . . . . . . . . . . . 2338.2.5 Summary . . . . . . . . . . . . . . . . . . . . . . . . . . . . . . 234
8.3 Factors Affecting Team Performance . . . . . . . . . . . . . . . . . 2348.3.1 Introduction . . . . . . . . . . . . . . . . . . . . . . . . . . . . 2348.3.2 Team Size . . . . . . . . . . . . . . . . . . . . . . . . . . . . . 2358.3.3 Team Competencies . . . . . . . . . . . . . . . . . . . . . . 2368.3.4 Team Structure and Composition . . . . . . . . . . . . . 2378.3.5 Social Distance. . . . . . . . . . . . . . . . . . . . . . . . . . 2398.3.6 Spatial Distance . . . . . . . . . . . . . . . . . . . . . . . . . 2408.3.7 Mutual Support and Mutual Surveillance . . . . . . . . 2418.3.8 Authority Figures . . . . . . . . . . . . . . . . . . . . . . . . 2418.3.9 Task Attractiveness . . . . . . . . . . . . . . . . . . . . . . . 2428.3.10 Team Processes and Tasks . . . . . . . . . . . . . . . . . . 2438.3.11 Implications for System Design . . . . . . . . . . . . . . 2438.3.12 Summary . . . . . . . . . . . . . . . . . . . . . . . . . . . . . . 244
8.4 Factors Affecting Performance in Community Settings . . . . . 2448.5 Implications for System Design . . . . . . . . . . . . . . . . . . . . . 2458.6 Summary . . . . . . . . . . . . . . . . . . . . . . . . . . . . . . . . . . . . . 2478.7 Other Resources . . . . . . . . . . . . . . . . . . . . . . . . . . . . . . . . 2488.8 Exercises . . . . . . . . . . . . . . . . . . . . . . . . . . . . . . . . . . . . . 248References . . . . . . . . . . . . . . . . . . . . . . . . . . . . . . . . . . . . . . . . . 249
9 Social: Theories and Models . . . . . . . . . . . . . . . . . . . . . . . . . . . . 2539.1 Introduction . . . . . . . . . . . . . . . . . . . . . . . . . . . . . . . . . . . 2539.2 Analyzing How People Work Together . . . . . . . . . . . . . . . . 254
9.2.1 Introduction . . . . . . . . . . . . . . . . . . . . . . . . . . . . 2549.2.2 Informal, Pairwise Analyses . . . . . . . . . . . . . . . . . 2549.2.3 Exchange Costs and Benefits . . . . . . . . . . . . . . . . 2569.2.4 Networks . . . . . . . . . . . . . . . . . . . . . . . . . . . . . . 2609.2.5 Good Personal Social Networks Lead
to Better Work . . . . . . . . . . . . . . . . . . . . . . . . . . 2629.2.6 Summary . . . . . . . . . . . . . . . . . . . . . . . . . . . . . . 263
9.3 Higher Social Levels: Organizational and Cultural . . . . . . . . 2649.3.1 Organizational Effects . . . . . . . . . . . . . . . . . . . . . 2659.3.2 Cultural Effects . . . . . . . . . . . . . . . . . . . . . . . . . 2659.3.3 Summary . . . . . . . . . . . . . . . . . . . . . . . . . . . . . . 266
xx Contents

9.4 Models of Social Processes . . . . . . . . . . . . . . . . . . . . . . . . 2669.4.1 Introduction . . . . . . . . . . . . . . . . . . . . . . . . . . . . 2669.4.2 Descriptive Social Models . . . . . . . . . . . . . . . . . . 2679.4.3 Soft Systems Methodology. . . . . . . . . . . . . . . . . . 2699.4.4 Rich Pictures . . . . . . . . . . . . . . . . . . . . . . . . . . . 2709.4.5 Computational Models of Social Behavior . . . . . . . 2729.4.6 Summary . . . . . . . . . . . . . . . . . . . . . . . . . . . . . . 273
9.5 General Implications for System Design . . . . . . . . . . . . . . . 2739.6 Summary . . . . . . . . . . . . . . . . . . . . . . . . . . . . . . . . . . . . . 2759.7 Other Resources . . . . . . . . . . . . . . . . . . . . . . . . . . . . . . . . 2759.8 Exercises . . . . . . . . . . . . . . . . . . . . . . . . . . . . . . . . . . . . . 276References . . . . . . . . . . . . . . . . . . . . . . . . . . . . . . . . . . . . . . . . . 277
10 Errors: An Inherent Part of Human-System Performance . . . . . . 28110.1 Introduction to Errors . . . . . . . . . . . . . . . . . . . . . . . . . . . . 281
10.1.1 What is Error? . . . . . . . . . . . . . . . . . . . . . . . . . . 28210.1.2 The Fine Line Between Success and Failure . . . . . 28410.1.3 The Accident was Caused
by Human Error, Right? . . . . . . . . . . . . . . . . . . . 28510.2 Studying Error . . . . . . . . . . . . . . . . . . . . . . . . . . . . . . . . . 288
10.2.1 Laboratory-Based Experiments . . . . . . . . . . . . . . . 28910.2.2 Field-Based Observation . . . . . . . . . . . . . . . . . . . 29010.2.3 Archive Data . . . . . . . . . . . . . . . . . . . . . . . . . . . 29110.2.4 Selecting the Most Appropriate Data
Collection Method . . . . . . . . . . . . . . . . . . . . . . . 29110.3 Error Taxonomies . . . . . . . . . . . . . . . . . . . . . . . . . . . . . . . 292
10.3.1 The Technique for Human ErrorRate Prediction . . . . . . . . . . . . . . . . . . . . . . . . . . 292
10.3.2 Generic Error Modeling System . . . . . . . . . . . . . . 29310.3.3 The Cognitive Reliability and Error
Analysis Method. . . . . . . . . . . . . . . . . . . . . . . . . 29410.4 Analyzing Errors . . . . . . . . . . . . . . . . . . . . . . . . . . . . . . . 296
10.4.1 Event Trees . . . . . . . . . . . . . . . . . . . . . . . . . . . . 29610.4.2 Fault Trees. . . . . . . . . . . . . . . . . . . . . . . . . . . . . 29610.4.3 CREAM . . . . . . . . . . . . . . . . . . . . . . . . . . . . . . 29710.4.4 THEA . . . . . . . . . . . . . . . . . . . . . . . . . . . . . . . . 298
10.5 Implications for System Design . . . . . . . . . . . . . . . . . . . . . 30010.6 Summary . . . . . . . . . . . . . . . . . . . . . . . . . . . . . . . . . . . . . 30110.7 Other Resources . . . . . . . . . . . . . . . . . . . . . . . . . . . . . . . . 30210.8 Exercises . . . . . . . . . . . . . . . . . . . . . . . . . . . . . . . . . . . . . 303References . . . . . . . . . . . . . . . . . . . . . . . . . . . . . . . . . . . . . . . . . 303
Contents xxi

Part III Methods
11 Methodology I: Task Analysis . . . . . . . . . . . . . . . . . . . . . . . . . . . 30911.1 Introduction . . . . . . . . . . . . . . . . . . . . . . . . . . . . . . . . . . . 30911.2 The Uses of Task Analysis . . . . . . . . . . . . . . . . . . . . . . . . 311
11.2.1 Allocation of Function. . . . . . . . . . . . . . . . . . . . . 31111.2.2 Performance Assurance . . . . . . . . . . . . . . . . . . . . 31111.2.3 Task and Interface Design . . . . . . . . . . . . . . . . . . 313
11.3 Hierarchical Task Analysis . . . . . . . . . . . . . . . . . . . . . . . . 31411.3.1 HTA Components . . . . . . . . . . . . . . . . . . . . . . . . 31411.3.2 Example Application of HTA. . . . . . . . . . . . . . . . 31511.3.3 Summary . . . . . . . . . . . . . . . . . . . . . . . . . . . . . . 317
11.4 Cognitive Task Analysis . . . . . . . . . . . . . . . . . . . . . . . . . . 31711.4.1 CTA Components . . . . . . . . . . . . . . . . . . . . . . . . 31711.4.2 Example Application of CTA . . . . . . . . . . . . . . . . 31811.4.3 Summary . . . . . . . . . . . . . . . . . . . . . . . . . . . . . . 319
11.5 GOMS. . . . . . . . . . . . . . . . . . . . . . . . . . . . . . . . . . . . . . . 31911.5.1 GOMS Components . . . . . . . . . . . . . . . . . . . . . . 32011.5.2 Example Application of GOMS . . . . . . . . . . . . . . 32011.5.3 Summary . . . . . . . . . . . . . . . . . . . . . . . . . . . . . . 322
11.6 The Keystroke Level Model. . . . . . . . . . . . . . . . . . . . . . . . 32211.6.1 Description of KLM Components . . . . . . . . . . . . . 32411.6.2 Example Application of the KLM. . . . . . . . . . . . . 32511.6.3 Summary . . . . . . . . . . . . . . . . . . . . . . . . . . . . . . 325
11.7 Considerations When Choosing a TA Method . . . . . . . . . . . 32611.8 Summary . . . . . . . . . . . . . . . . . . . . . . . . . . . . . . . . . . . . . 32711.9 Other Resources . . . . . . . . . . . . . . . . . . . . . . . . . . . . . . . . 32911.10 Exercises . . . . . . . . . . . . . . . . . . . . . . . . . . . . . . . . . . . . . 330References . . . . . . . . . . . . . . . . . . . . . . . . . . . . . . . . . . . . . . . . . 331
12 Methodology II: Cognitive Dimensions and the Gulfs. . . . . . . . . . 33512.1 Introduction . . . . . . . . . . . . . . . . . . . . . . . . . . . . . . . . . . . 33512.2 The Cognitive Dimensions. . . . . . . . . . . . . . . . . . . . . . . . . 336
12.2.1 Hidden Dependencies . . . . . . . . . . . . . . . . . . . . . 33612.2.2 Viscosity . . . . . . . . . . . . . . . . . . . . . . . . . . . . . . 33812.2.3 Role-Expressiveness . . . . . . . . . . . . . . . . . . . . . . 33912.2.4 Premature Commitment . . . . . . . . . . . . . . . . . . . . 34012.2.5 Hard Mental Operations. . . . . . . . . . . . . . . . . . . . 341
12.3 Turning Cognitive Dimensions into a Methodology . . . . . . . 34212.4 What is Omitted by the Cognitive Dimensions? . . . . . . . . . . 34312.5 Norman’s Seven Stages of Action. . . . . . . . . . . . . . . . . . . . 343
12.5.1 The Gulfs of Evaluation and Execution . . . . . . . . . 34512.5.2 The Gulfs in Practice . . . . . . . . . . . . . . . . . . . . . 345
12.6 Implications of the Gulfs for Design . . . . . . . . . . . . . . . . . . 346
xxii Contents

12.7 Limitations of the Gulfs . . . . . . . . . . . . . . . . . . . . . . . . . . 34812.8 Summary . . . . . . . . . . . . . . . . . . . . . . . . . . . . . . . . . . . . . 35012.9 Other Resources . . . . . . . . . . . . . . . . . . . . . . . . . . . . . . . . 35012.10 Exercises . . . . . . . . . . . . . . . . . . . . . . . . . . . . . . . . . . . . . 351References . . . . . . . . . . . . . . . . . . . . . . . . . . . . . . . . . . . . . . . . . 351
13 Methodology III: Empirical Evaluation . . . . . . . . . . . . . . . . . . . . 35313.1 Introduction . . . . . . . . . . . . . . . . . . . . . . . . . . . . . . . . . . . 353
13.1.1 Why Do We Need User Testing? . . . . . . . . . . . . . 35413.1.2 When Do We Carry Out User Testing? . . . . . . . . . 355
13.2 Planning Your Evaluation Study. . . . . . . . . . . . . . . . . . . . . 35613.2.1 What Type of Data: Qualitative
or Quantitative? . . . . . . . . . . . . . . . . . . . . . . . . . 35613.2.2 Selecting a Hypothesis. . . . . . . . . . . . . . . . . . . . . 35613.2.3 Identifying the Dependent and Independent
Variables . . . . . . . . . . . . . . . . . . . . . . . . . . . . . . 35713.2.4 What Type of Evaluation: Formative
or Summative? . . . . . . . . . . . . . . . . . . . . . . . . . . 35713.2.5 Validity, Reliability, and Sensitivity . . . . . . . . . . . 358
13.3 Evaluation Methods . . . . . . . . . . . . . . . . . . . . . . . . . . . . . 36213.3.1 Usability Testing. . . . . . . . . . . . . . . . . . . . . . . . . 36213.3.2 Field Studies and Field Experiments . . . . . . . . . . . 36413.3.3 (Expert) Heuristic Evaluation . . . . . . . . . . . . . . . . 36413.3.4 Co-operative Evaluation. . . . . . . . . . . . . . . . . . . . 36613.3.5 A/B Testing . . . . . . . . . . . . . . . . . . . . . . . . . . . . 366
13.4 What to Evaluate? . . . . . . . . . . . . . . . . . . . . . . . . . . . . . . 36713.4.1 Pencil and Paper Prototypes . . . . . . . . . . . . . . . . . 36713.4.2 Computer-Based Prototypes . . . . . . . . . . . . . . . . . 36713.4.3 The Final System . . . . . . . . . . . . . . . . . . . . . . . . 368
13.5 Measuring Usability . . . . . . . . . . . . . . . . . . . . . . . . . . . . . 36813.5.1 Task Time . . . . . . . . . . . . . . . . . . . . . . . . . . . . . 36913.5.2 Errors . . . . . . . . . . . . . . . . . . . . . . . . . . . . . . . . 37013.5.3 Verbal Protocols . . . . . . . . . . . . . . . . . . . . . . . . . 37013.5.4 Video Protocols . . . . . . . . . . . . . . . . . . . . . . . . . 37113.5.5 Eye Movement Tracking . . . . . . . . . . . . . . . . . . . 37213.5.6 Questionnaires and Surveys . . . . . . . . . . . . . . . . . 37213.5.7 Interviews and Focus Groups . . . . . . . . . . . . . . . . 37313.5.8 Workload Measures. . . . . . . . . . . . . . . . . . . . . . . 37413.5.9 Patterns of Usage . . . . . . . . . . . . . . . . . . . . . . . . 37513.5.10 User Experience . . . . . . . . . . . . . . . . . . . . . . . . . 376
13.6 The Ethics of Evaluation . . . . . . . . . . . . . . . . . . . . . . . . . . 37613.7 Summary . . . . . . . . . . . . . . . . . . . . . . . . . . . . . . . . . . . . . 37713.8 Other Resources . . . . . . . . . . . . . . . . . . . . . . . . . . . . . . . . 37713.9 Exercises . . . . . . . . . . . . . . . . . . . . . . . . . . . . . . . . . . . . . 378References . . . . . . . . . . . . . . . . . . . . . . . . . . . . . . . . . . . . . . . . . 379
Contents xxiii

Part IV Summary
14 Summary: Putting It All Together . . . . . . . . . . . . . . . . . . . . . . . 38314.1 Introduction . . . . . . . . . . . . . . . . . . . . . . . . . . . . . . . . . . . 38314.2 Organizing What We Have Learnt About Users . . . . . . . . . . 384
14.2.1 Anthropometrics . . . . . . . . . . . . . . . . . . . . . . . . . 38414.2.2 Behavior . . . . . . . . . . . . . . . . . . . . . . . . . . . . . . 38514.2.3 Cognition . . . . . . . . . . . . . . . . . . . . . . . . . . . . . . 38614.2.4 Social . . . . . . . . . . . . . . . . . . . . . . . . . . . . . . . . 38814.2.5 The Role of Tasks and Environments . . . . . . . . . . 38814.2.6 Summary . . . . . . . . . . . . . . . . . . . . . . . . . . . . . . 389
14.3 Models of Users . . . . . . . . . . . . . . . . . . . . . . . . . . . . . . . . 38914.3.1 Unified Theories of Cognition . . . . . . . . . . . . . . . 39014.3.2 Types of User Models . . . . . . . . . . . . . . . . . . . . . 39114.3.3 Summary . . . . . . . . . . . . . . . . . . . . . . . . . . . . . . 396
14.4 Risk-Driven Incremental Commitment Model . . . . . . . . . . . 39714.4.1 Introduction . . . . . . . . . . . . . . . . . . . . . . . . . . . . 39714.4.2 Insight 1: The RD-ICM Provides a Way
to Organize User-Related Knowledgeand Ways of Knowing. . . . . . . . . . . . . . . . . . . . . 400
14.4.3 Insight 2: RD-ICM is Descriptive as Wellas Prescriptive . . . . . . . . . . . . . . . . . . . . . . . . . . 401
14.4.4 Extension 1: Designers are Stakeholders Too . . . . . 40314.4.5 Extension 2: Learning Within
and Between Projects . . . . . . . . . . . . . . . . . . . . . 40414.4.6 Summary . . . . . . . . . . . . . . . . . . . . . . . . . . . . . . 405
14.5 Building on the Foundations . . . . . . . . . . . . . . . . . . . . . . . 40614.6 Other Resources . . . . . . . . . . . . . . . . . . . . . . . . . . . . . . . . 40714.7 Exercises . . . . . . . . . . . . . . . . . . . . . . . . . . . . . . . . . . . . . 408References . . . . . . . . . . . . . . . . . . . . . . . . . . . . . . . . . . . . . . . . . 408
Appendix: The Kegworth Air Accident (1989) . . . . . . . . . . . . . . . . . . 411
Glossary . . . . . . . . . . . . . . . . . . . . . . . . . . . . . . . . . . . . . . . . . . . . . . 417
Index . . . . . . . . . . . . . . . . . . . . . . . . . . . . . . . . . . . . . . . . . . . . . . . . 429
xxiv Contents

Overview of Book
Foundations for Designing User-Centered Systems is organized into four parts, asshown in the Table of Contents. The first part has two chapters. Chapter 1 intro-duces the approach of understanding people (commonly referred to as ‘‘users’’),their tasks, and their context. It motivates when to study the user, includingexamples and some risks that arise when you do not. This chapter also notes someways to organize this knowledge, including risk-driven design and the use ofcognitive models.
Chapter 2 provides an overview of the fields that contribute to our approach todesigning user-centered systems. This chapter will help readers understand therelationship between different research communities and point to relevant litera-ture and to where further information can be found.
The second part of the book describes what we consider to be the core, designrelevant characteristics of users. These chapters build up the foundations fordescribing users using what we refer to as the ABCS framework: A foranthropometrics, B for behavior, C for cognition, and S for social aspects thatunderlie human activity. Chapter 3 describes important aspects of users’ bodies,anthropometrics, including how they sit at terminals, how they type, and how theytouch. Chapter 4 deals with the underpinnings of human behavior, describing thebasic senses used to interact, particularly sight and hearing, as well as why indi-viduals are motivated to behave in particular ways. Chapters 5–7 address cogni-tion. Chapter 5 describes the foundations of cognition, that of memory, attention,and learning, particularly the aspects that apply to system design. Chapter 6describes higher level cognitive capabilities related to system design, that ofmental representations influencing mental models, problem solving, and decisionmaking. Chapter 7 examines communication between users and technology. Theseaspects include some fundamental factors of language related to interfaces, howusers read, and typical information-seeking behaviors. Chapters 8 and 9 look atsocial aspects of users. Chapter 8 examines social effects on decision making andfactors affecting teamwork. Chapter 9 looks at larger scale, network effects, andprovides some models to summarize behavior in this area.
Chapter 10 introduces the study of errors—errors are often a good source ofinformation about human behavior when interacting with technologies. We canask several questions. What went wrong? Why did it go wrong? How can weprevent the same thing happening again? Chapter 10 provides some background
xxv

knowledge on errors, including error rates and how technological and humanfactors interact to cause system errors. The chapter also provides some tools forstudying and ameliorating the effects of errors.
The third part of the book provides some methods for studying users in systems.Chapter 11 introduces task analysis. We note several uses for task analysis andillustrate how it can be a very cost-effective method. Worked examples are pro-vided for each method.
Chapter 12 provides two additional methods for improving the design of sys-tems. These methods also help to summarize and apply what we know about users.Cognitive Dimensions (CDs) is a way to summarize how users interact withsystems. CDs also offer a framework for making predictions about potential errors;these predictions can provide the groundwork for directed usability tests and forformal or informal quality testing. The chapter also describes Norman’s Gulfs ofEvaluation and Execution. The Gulfs offer a framework for understanding whereusers need to be helped to understand and to interact with systems.
Chapter 13 describes empirical evaluation focusing on user studies. Thischapter describes how to start to run a usability study, and provides suggestionsabout what to do and what to measure.
Chapter 14 provides a summary of users and how to design user-centeredsystems. We first summarize the ABCS and then offer an introduction to usermodeling as a way to encapsulate the detailed knowledge we have about users as aquick way to generate predictions. We conclude by describing the Risk-DrivenIncremental Commitment model as a way to apply what we know about users tosystem design.
The Appendix describes an air accident that occurred several years ago, knownas the Kegworth accident because it took place near the small town of Kegworth inthe midlands of the UK. Although a simple diagnosis of pilot error was offered asthe cause of the accident, on closer analysis this accident resulted from multipleissues which transpired at a number of system levels. The Kegworth accident isused as an example in several places in the book to illustrate how many levels andaspects of a system can influence system performance—and to underscore thecomplexity of systems that are made up of people and of interactive andinteracting technologies. This complexity means we often cannot and should notcome up with simple assertions about errors, but rather look for weak points in theoverall system and deal with those weak points systematically and in a groundedway.
We believe knowing more about people will help you develop the kind ofgrounding you need. We also believe that developing a systems approach willprotect you from erring toward simple design assumptions and narrow solutions.
Each chapter includes an abstract, an introduction, and a summary to orient thereader and to increase understanding. We include consideration of what theimplications are for system design at the end of each major section. There are alsolists of other resources for those people who want to find out more.
xxvi Overview of Book

Endorsements
For all of us who have been ‘put on hold,’ recorded for quality purposes, beenforced to talk to a mindless, uncaring voice non-recognition system, or simplybeaten at the computer keyboard in sheer frustration, hope and help are at hand.For Ritter and his colleagues are injecting rational, user-centered design into suchsystems development. It is a timely contribution, devoutly to be wished. Their textis a shining example of their advocated principles. Readable, informative, easy touse, and innovative, this works puts into practice what it preaches. It should be onthe desk of everyone who looks to conceive, design, fabricate, and manufactureany modern technological system—no matter how hard, no matter how soft. Evenif only a proportion of designers and users read this book we will be so much betteroff. If it gets the circulation it deserves it could change our world—and that verymuch for the better. If not, technorage will only grow and the Luddites will onceagain become a viable social Party!
Peter HancockProvost Distinguished Research Professor
Pegasus Professor, and University Trustee ChairUniversity of Central Florida
As a software engineer, I’ve been advocating for the past 20 years that we willonly see real improvements in our software when we move away from atechnocentric view and adopt a wider perspective that takes into account whatusers really do. Too many software engineers consider this to be a ‘CHI issue’ andbelieve that they can focus on the technology and leave the ‘soft stuff’ to designersof the user experience.
Well, they are wrong. Not only is it the case that most companies don’t employspecialist UX designers, all too often these designers don’t understand theunderlying technological issues that have to be taken into account if our softwareis to work effectively, efficiently, and securely. The only way forward in my viewis for software engineering education to include education in the human, social,and organizational factors that influence the ways in which software is designedand used.
Up till now, this has been very difficult. Conventional texts on CHI have adifferent audience and, all too often, focus on current technology rather than
xxvii

underlying fundamentals. This book is different and it’s one we’ve been waitingfor. It explains in depth fundamental human capabilities, cognitive strengths, andcognitive limitations that influence the way that we choose, understand, and usesoftware systems. It explains how we communicate and how that affects the waysthat interfaces are used; it discusses collaborative working, factors that support andinhibit collaboration, and methods that can be used to understand how peoplework.
Most importantly, I think, it doesn’t just present these fundamentals in isolation.Every chapter in the book has a section discussing the implications for design sothat readers not only learn fundamentals but understand why these are importantand how they might influence their work. These bring unfamiliar material to lifefor software engineers and clearly demonstrate why this is important for practicalsystems design.
This is both a textbook and a reference book. It would be a great basis for acourse in human-centered software engineering but, as well as this, practicingengineers can access and learn from the individual chapters and the follow-upmaterial that is suggested. The lack of accessible and comprehensive material onhuman factors for software engineers has been an important barrier to morewidespread acceptance of a human-centered approach to systems design. Thisbook has broken down that barrier and I can thoroughly recommend it to allengineers.
Ian SommervilleProfessor of Computer Science
University of St Andrews, and Author of Software Engineering
This is the book I really needed when I developed a course on Applied CognitiveScience within our Master’s program in HCI with Ergonomics at UCL. At thetime, I had to improvise with a mix of texts on cognitive psychology, engineeringpsychology, and HCI. Foundations for Designing User-Centered Systems fills animportant gap in the space of texts for students and practitioners of HCI, focusing,as it does, on understanding people and their interactions (both social and withtechnology). Critically, it also draws out the implications of this understanding fordesign. It manages to cover all the key topics in this space while also beingengaging and, at times, quirky. A textbook that makes one smile and want to readmore is a textbook that works.
Ann BlandfordProfessor of Human–Computer Interaction
University College London
I really enjoyed the reading of this lively book that I believe can be appreciated bydifferent kinds of readers. A useful publication written with wit, helping the readerto discover the human capabilities and limitations, the patterns of user’s attentionand the fundamental principles to adopt at the early stages of system design.
xxviii Endorsements

The authors take into consideration not only the usefulness of the artifacts, but alsothe impact they have on safety. In fact, the main cause of accident nowadays inaviation is the loss of control of the aircraft, often induced by a poor human–machine interaction. This is due, mainly, by poorly conceived interfaces, as theresult of a lack of understanding of who the final user is. The overall problem liesin the very fact that the one who produces the artifacts is not the one using them.Eventually, after many years, the study of the human factors as a discipline at thecross-road between medicine, psychology and engineering is addressing the designof the interfaces.
As a human factor specialist, involved in flight operations, I think this bookshould become a ‘must’ even in the flight safety domain.
Antonio ChialastriSenior Captain and Independent Human Factors
Consultant in Aviation and Medicine, Italy
This broad ranging survey of user-centered design techniques provides an effectiveintroduction for designers into what people do, why and when they do it, and whatmotivates those behaviors.
If you ever wanted to know what a ‘steep learning curve’ actually looks like andhow the user will interact with your system at different points along this curve thenthis is the book for you!
Through well-illustrated examples, it considers a wide range of topics fromtraditional ergonomics, through user behavior, cognitive models, and socialfactors. Many of the examples take off the traditional ‘blinkers’ of user centreddesign and show how a human decision at the ‘sharp end’ may well have its rootsin a much wider and blunter context.
As a chief architect for large programs, this book has given me access to avariety of new techniques and an extended vocabulary that I look forward tointroducing my design teams to.
Richard HopkinsChief Architect and IBM Distinguished Engineer
Co-author of Eating the IT Elephant
The HCI profession emerged when psychologists teamed with developers. Designwas missing. Today, good teams have strong designers and technologists—butpsychological insight is often in short supply. This book fills that gap with a freshlook at established and new knowledge and approaches.
Jonathan GrudinPrincipal Researcher at Microsoft Research
ACM Fellow
Endorsements xxix

If you want to design or build interactive systems that are both useful and usable,Foundations for Designing User-Centered Systems is an excellent place to begin.
Philippe PalanqueHead of Interactive Critical Systems Group
Universite Paul Sabatier ToulouseCo-chair of CHI 2014
The ‘‘Who, What, When, Where and Why of Human-Systems Interaction’’—apractitioner’s primer for Systems Designers looking to advance human computersymbiosis in their designs. The book provides a straightforward, easy-to-readintroduction to the process of designing interactive technologies using human-centered approaches that avoid the cookie-cutter, simplistic recipes all toocommon in other publications. Also worth noting is that this guide not only coversfoundations for beginners, but also includes practical, real-word examples, as wellas emerging essential topics for the design of systems, for more advancedpractitioners. The reader will quickly discover that this book provides essential,innovative, and targeted tools for designers who are focused on enabling seamlessinteractions between humans and technologies. For anyone looking to advancehuman-computer-symbiosis, this book will not gather dust on your shelf!
Dylan Schmorrow, Ph.D.Chief Scientist, Soar Technology, Inc.
Anything that helps software developers think more about the mental states of theirusers and how that affects the utility and usability of their software is a good thing.Even if you don’t plan to become a human factors expert, you will find good ideasin this book to help make your applications more successful.
William A. WoodsResearch Scientist and Software Engineer
The foundations for designing user-centered systems really delivers on its title. Thebook succinctly captures the key anthropometric, behavioral, cognitive, and socialconcepts that are the foundations for designing user-centered systems. Further-more, the authors artfully imbedded human factors principles into the manner inwhich materials are presented, turning the book into a demonstration of goodpractices. I find the structure and layout of the book make it an excellentintroductory text for a course in HCI as well as a useful initial reference source.
Michael ‘‘Q’’ QinAdjunct professor, WPI
xxx Endorsements

Part IIntroduction: Aims, Motivations, and
Introduction to Human-Centered Design

Chapter 1Introducing User-CenteredSystems Design
Abstract If designers and developers want to design better technologies that areintended for human use they need to have a good understanding of the people whoare or who will be using their systems. Understanding people, their characteristics,capabilities, commonalities, and differences allows designers to create moreeffective, safer, efficient, and enjoyable systems. This book provides readers withresources for thinking about people—commonly called ‘‘users’’—their tasks andthe context in which they perform those tasks. Our intention is to enable you tomake more informed decisions when designing complex interactive systems. Thischapter thus introduces this argument through example design problems. We thenpresent the benefits and costs associated with understanding the user. Twoapproaches for understanding users are introduced. The first is a framework calledthe ABCS for understanding, in broad strokes, different aspects of users. Thesecond is user knowledge and action simulation for developing and testing howusers approach tasks in more detail. After reading this chapter you should be ableto appreciate why it is important to understand users, and the associated benefitsand costs of doing so.
1.1 Introduction
Most of us use interactive technologies every day—cell phones, TVs, alarmclocks, cars, vending machines, computers, cameras, microwaves, ovens, ticketmachines—the list is endless.
Technology can help us achieve what we desire to do or need to do, but it canalso hinder us. When we cannot get something done, when our expectations are notmet, or when technology is too hard to use, we get frustrated. When technologiesand systems are unpredictable, delays and unforeseen problems can occur.
This book is about designing technology and systems for use by people. Weoffer an introduction to what we know about why humans do what they do whenthey do it as users of technology. The book has one central premise:
F. E. Ritter et al., Foundations for Designing User-Centered Systems,DOI: 10.1007/978-1-4471-5134-0_1, � Springer-Verlag London 2014
3

Understanding people will help you build better interactive technologies andsystems.
When we say ‘‘understanding people’’ we mean:
• Knowing how to observe and document what people do
– Using appropriate methods to get credible results and differentiate anecdotesfrom reliable data
• Understanding why people do what they do
– Developing insights into people’s conscious and unconscious motivations fordoing things
• Understanding and predicting when people are likely do things
– Understanding people’s patterns of behavior
• Understanding how they choose to do things the way they do them
– Understanding what options people actually have and/or perceive they haveavailable to them, understanding the constraints they are under and assessingwhat the resources they have available to them.
We propose that systems should be designed in a user-centered way. Being user-centered means considering human characteristics and capabilities during systemdesign. It means explicitly asking: who is going to use the system/technology andwhy; what are they hoping to achieve in using the system/technology; how mucheffort are they willing to put into learning how to use the system/technology; whetherthey will be operating the system alone or with others…. Being user-centered meansknowing why, as well as how, users do what they do when they do it. We proposethat consideration of users’ basic human characteristics should be in place beforesystem development begins. Reflection and experimentation with potential users ofthe system should take place throughout the design and development process usingmethods like brainstorming, storyboarding, low to high fidelity prototyping, and, asthe system gets closer to full functionality, with more formal use testing.
This book assumes no previous knowledge; it is designed to be accessible to thosewithout a background in psychology or computer science; if you have already taken atraditional human–computer interaction (HCI) course, this material may be a quiteeasy read and help you organize your thoughts. If you have taken several psychologycourses, you are likely to recognize much, but perhaps not all, of the material here.
1.2 Starting to Understand Users
Many designers and developers make two fundamental errors. They assume thatunderstanding how a technology will be used can be derived from introspection:from imagining how it will be used. This assumption is based on a second
4 1 Introducing User-Centered Systems Design

error—that everyone is the same. We know the second assumption is not true fromsimply observing that the world is made up of very different people with differentmotivations, different backgrounds, and different skill sets.
To illustrate how our intuitions about people may be incorrect, and why it isalways worth testing your designed system with people who will use that system,we offer the following examples.
1.2.1 Designing Mappings Between Buttons and Lights
It is generally claimed that the better designs are those that offer simple, clearermappings between an action and a response. However, the question is: what is aclearer mapping? Consider Figs. 1.1 and 1.2 taken from a study by Payne (1995)on how well naive subjects could judge the quality of interface designs for asimple system. Payne’s experiment assessed what design people predicted wouldrank best to worst on a very simple interface, where a number of different map-pings between the controls and resulting system state were compared (what iscalled ‘‘stimulus-response compatibility’’ in the scientific literature). In the fol-lowing example, study participants were able to rank order the designs in Fig. 1.1from best to worst. They were asked two questions: (1) what is the mapping oflights to switches that gives the fastest response time? and (2) can you give aprediction of how long they will take on average?Sixty out of 70 subjects got the top ranked one correct. However, only four out of70 got the complete order correct. The results of the study suggest that, whenconfronted with anything but the most obvious choices, designers withouttraining may make poor design choices. Before going on, you may wish to trythis task yourself. The correct order is given in the exercises at the end of thischapter.
(a)
(d) (c)
(b) Fig. 1.1 a Rank order thequality of these switch tolight mappings. b Note howlong, on average, it will taketo push a button on eachpanel. (Adapted from Payne1995)
1.2 Starting to Understand Users 5

1.2.2 Designing Stove-Top Mappings
For our second example, take a look at the stove-top designs in Fig. 1.2. Which isthe best burner to control knob mapping? If you think you know the best mapping,can you provide a quantitative measure of how much better? If layout 1 has 100errors for a given amount of use, how many errors will the other two have?
For the examples in Fig. 1.2, only four out of 53 subjects selected the correctorder of layout to be layout 3 (76 errors per 1,200 trials), layout 2 (116 errors per1,200 trials), and then layout 1 (129 errors per 1,200 trials), and only 15 out of 53could correctly identify the best design.
Layout 1@
@
£
£
%
%
&
&
100
Ratio of Errors
Layout 2@
%
£
&
%
@
&
£
Ratio of Errors
Layout 3@
%
£
£
%
@
&
&
Ratio of Errors
Fig. 1.2 Rank order thequality of these stove burnerto knob pairings. If layout1 will give 100 errors, howmany errors will the otherpairings lead to? Adaptedfrom Chapanis andLindenbaum (1959)
6 1 Introducing User-Centered Systems Design

1.2.3 Designing Coins
For our third example, we would like to look at coins. Can you pick out which is aUS penny in Fig. 1.3 without looking at a real one?
Most Americans would think that they could recognize a US penny, but morethan half of Nickerson and Adams’ (1979) American subjects shown the pennies inFig. 1.3 could not pick out the penny from a set of 15 examples. The correctanswer is given at the end of this chapter in Exercise 1.2.
We all know well enough what a penny looks like—relative to the other coinswe might encounter—but not in any more detail than is necessary. With the set ofalternatives provided by Nickerson and Adams, the choice has to be based onrecalling specific features of a penny, which most people have never memorizedand have never needed to memorize. You can see similar effects in computerinterfaces where users cannot recall which commands are located on which menus(Exercise 1.2 explores this question further).
Although coinage systems may appear a long way removed from the design ofuser interfaces, they provide good examples of how and why we can benefit fromconsidering the users’ perspective in design to avoid system failure. France and the
Fig. 1.3 Possible views of a US penny. Without looking in your pocket choose the correct one.Taken from a study by Nickerson and Adams (1979). (Used with permission of Elsevier)
1.2 Starting to Understand Users 7

USA have both tried to introduce new coins (e.g., the Susan B. Anthony dollar) withlittle success, partly due to the lack of care in the design of the new coin. In contrast,when Britain got a new currency in 1971, switching to a system where one UK poundwas equal to 100 pennies, the introduction of the new coinage was a resoundingsuccess. It turned out that one reason for the success was a substantial body ofresearch on how people perceived the value of coins (e.g., Bruce et al. 1983) as wellas attention to how the different proposed coins might be made least confusing to theelderly or sight impaired. During the research it was recognized that many peopleneed to identify coins from touch alone (e.g., the coin in your pocket) and thatdesigning for the blind user actually meant designing for everyone. The cost of thisresearch was a very small component of the costs of introducing a new coinagesystem (e.g., all of the new vending machines to be developed), but it helped ensurethe success of the whole enterprise. Subsequent changes to the coins have alsofollowed these guidelines, with the two pound coin, for example, being the samebasic shape as the one pound coin, but larger and heavier.
In these examples we see one of the first universals of human behavior—peopleremember those details that they pay attention to but only in sufficient detail for thetasks they are performing. This is universal, but it does not enable us to predict fullywhat details someone will remember, because there are differences in how muchattention people have to spare, what tasks they are performing, and thus what detailsthey will remember. The first two problems in Figs. 1.1 and 1.2 are difficult becausethe differences in performance of the tasks are not particularly available to con-sciousness, and most people’s representation of how they think they perform thesetasks in this area do not reflect how people actually perform the task. The pennyquestion (and the menu question) represent the difference between recognition andrecall memory. Usually identifying a penny just requires being able to discriminatebetween it and other coins. With the set of alternatives provided by Nickerson andAdams, the choice has to be based on recalling the features of a penny, which mostpeople have never bothered to commit to memory (why would they?).
Another classic example is remembering your new cell phone number. It takes along time to learn it because you, personally, never need to use it (unless youmisplace your phone, in which case calling it is a good strategy for finding it!).However, if someone asks you for it, you either have to recall it or have to gothrough the menus on your phone to find it, eventually recognizing the steps thatenabled you to find the number.
This disconnection between how we think we behave and how users reallybehave is common and there are plenty of reasons for it. In most cases we are toobusy doing a task to properly observe how we are doing it. When we can observehow we are doing it, it is rare that we can correctly and completely infer why weare doing the task—the observation of behavior is separate from the generation ofit. Ericsson and Simon (1993) provide a full explanation of why it is hard forpeople to examine their own thinking processes. Their explanation includes thatwhen we recognize how we behave, we rarely make written notes and thus any
8 1 Introducing User-Centered Systems Design

memories of how we behaved are subject to the inherent frailties of humanmemory. We are also not very good at estimating time accurately and have troublekeeping track of successes and failures. Finally, there are some particular aspectsof our own behavior that are very hard to observe, such as basic perception, andsome that are hard to describe and reason about verbally, such as performing somespatial reasoning tasks.
Table 1.1 Summary of some of the causal factors in the Kegworth air accident and lessons tonote
• The Engine Instrument System (EIS) used digital displays. A survey of the airline’s pilots afterthe Kegworth accident showed that nearly two-thirds of them believed that the new EIS wasnot effective in drawing their attention to rapid changes in the engine parameters. If it had, theaccident might have been avoided. Thus, the design of the interface for the EIS did not presentdata in a format that could easily be perceived by the pilotsLesson: You need to understand how people look at the user interface to extract informationwhich they then use to make decisions and take actions
• Neither pilot could recall having seen any indication of the abnormally high vibration levels onthe EIS. The Captain noted that he rarely scanned the vibration gauges because he had foundthem to be unreliable in other aircraft in the past. Experts, such as pilots, have a highlydeveloped mental model of the world in which they normally operate, which helps them carryout their tasks. The Captain appears to have excluded the vibration gauges from his mentalmodel because he believed the readings were unreliableLesson: You need to understand how people create and use mental models to help them use asystem
• The B737-400 was a glass cockpit aircraft, in which the information is presented on digitaldisplays, rather than on analogue instruments and electro-mechanical displays. The airline(BMA) did not have a glass cockpit flight training simulator for the B737-400, so pilots couldonly gain experience through actually flying it (i.e., on the job). The only training the pilotswere given for the B737-400 was a 1-day audio-visual conversion courseLesson: You need to understand how people learn to use new and, particularly, complexsystems
• Three members of the cabin crew said they saw evidence of the fire in the #1 engine, but theydid not report this to the pilots. The flight crew believed that the problem was with the #2engine. This seems to have been a failure in what is called Crew Resource Management, aprocedure designed to ensure that all the members of a flight crew (pilots and cabin crew)communicate with one another and work together as a teamLesson: You need to understand how social issues, including communication, can affect howpeople use a system
• The B737-400 was fitted with a new type of engine. The engine was thoroughly tested on theground before being certified by the appropriate authorities. The engine was not tested eitherin an altitude test cell (which simulates the conditions of flying at high altitudes) or in flight,however. This scenario illustrates how decisions that are made at remote distances from theuser interface in a system can have an impact on the way that the users behave. Emergencyevents, like engine failures, are normally covered by checklists in the QRH (Quick ReferenceHandbook) that is used by all pilots to deal with known situationsLesson: You need to understand that decisions taken at a place and time that are greatlyremoved from where the system is used can affect the way the system will behave
1.2 Starting to Understand Users 9

1.2.4 What Happens If You do not Take Proper Accountof Users, Tasks, and Context?
The Kegworth Air Accident (see the Appendix for a detailed account) was, likemany air accidents, the result of several events. Many of these events happened ina short space of time, but some were more distant both in time and in space. Fromthe point when a problem was detected with one of the engines, to the point atwhich the plane crashed took less than 8 min. Table 1.1 lists some examples of thetypes of things that went awry and contributed to the accident and the lessons youshould note.
This book will help you to understand the underlying issues, and show how youcan analyze them. Once you understand that these issues arise at different levels,and how they can interact, you can start to take appropriate steps to make sure theyare prevented (or their effects are at least mitigated) when designing systems.
1.3 The Benefits and Costs of Understanding Users
Assuming that your users are just like you can be described as a fundamentalattribution error of design. This error is essentially the inverse of what is called thefundamental attribution error in social psychology (described in Chap. 8). In thefundamental attribution error you assume that people are not like you when, infact, they are.
In the fundamental attribution error of design, you assume that your users arelike you when, in fact, they are not! Users often can’t use the systems as well as thedesigners because they do not know as much. Sometimes the opposite is true.Users can to be quite resourceful and innovative, and will often use technology inways that the designer had never fully contemplated; for example, spreadsheetswere originally designed for use by accountants, but many people now use themfor processing all forms of tabular data. Similarly, the short messaging system(SMS) was originally designed to help engineers debug mobile phone communi-cation systems, but now it is widely used by everyone with a mobile phone as ameans of general communication.
If you understand your users and take appropriate account of them whendesigning your system, there are three main types of benefits (or payoffs) that canresult: more usable products (which can lead to wider adoption and more accel-erated adoption rates), cost savings, and safer systems. There are some caveats,however, which can be seen as costs: understanding and taking appropriateaccount of the user in your design does not necessarily guarantee success, andknowing how much you need to understand about your users is a hard question toanswer. We discuss all of these below.
10 1 Introducing User-Centered Systems Design
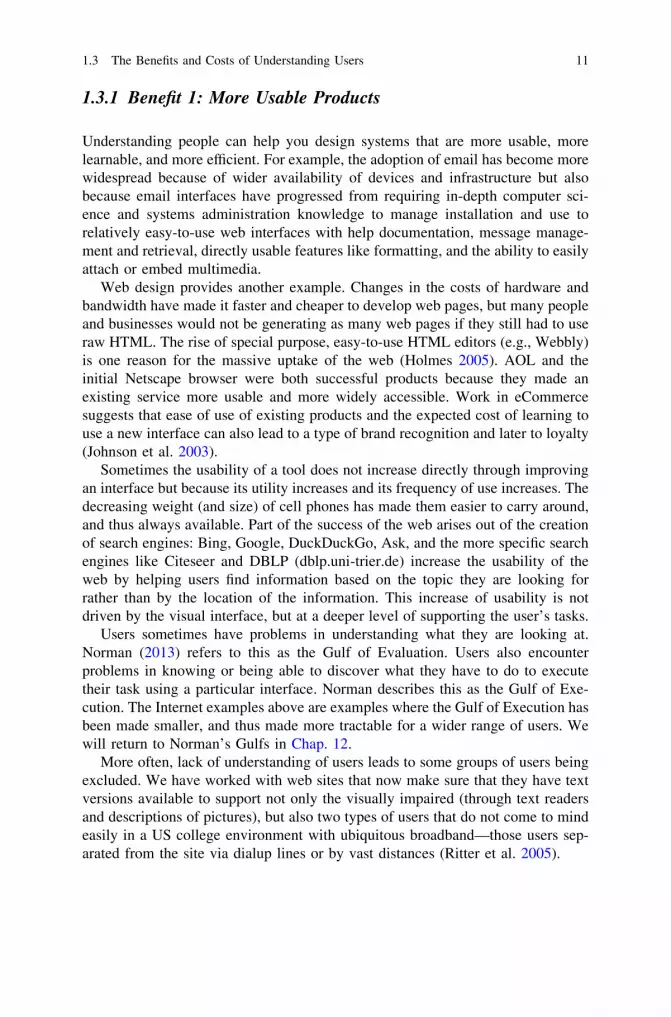
1.3.1 Benefit 1: More Usable Products
Understanding people can help you design systems that are more usable, morelearnable, and more efficient. For example, the adoption of email has become morewidespread because of wider availability of devices and infrastructure but alsobecause email interfaces have progressed from requiring in-depth computer sci-ence and systems administration knowledge to manage installation and use torelatively easy-to-use web interfaces with help documentation, message manage-ment and retrieval, directly usable features like formatting, and the ability to easilyattach or embed multimedia.
Web design provides another example. Changes in the costs of hardware andbandwidth have made it faster and cheaper to develop web pages, but many peopleand businesses would not be generating as many web pages if they still had to useraw HTML. The rise of special purpose, easy-to-use HTML editors (e.g., Webbly)is one reason for the massive uptake of the web (Holmes 2005). AOL and theinitial Netscape browser were both successful products because they made anexisting service more usable and more widely accessible. Work in eCommercesuggests that ease of use of existing products and the expected cost of learning touse a new interface can also lead to a type of brand recognition and later to loyalty(Johnson et al. 2003).
Sometimes the usability of a tool does not increase directly through improvingan interface but because its utility increases and its frequency of use increases. Thedecreasing weight (and size) of cell phones has made them easier to carry around,and thus always available. Part of the success of the web arises out of the creationof search engines: Bing, Google, DuckDuckGo, Ask, and the more specific searchengines like Citeseer and DBLP (dblp.uni-trier.de) increase the usability of theweb by helping users find information based on the topic they are looking forrather than by the location of the information. This increase of usability is notdriven by the visual interface, but at a deeper level of supporting the user’s tasks.
Users sometimes have problems in understanding what they are looking at.Norman (2013) refers to this as the Gulf of Evaluation. Users also encounterproblems in knowing or being able to discover what they have to do to executetheir task using a particular interface. Norman describes this as the Gulf of Exe-cution. The Internet examples above are examples where the Gulf of Execution hasbeen made smaller, and thus made more tractable for a wider range of users. Wewill return to Norman’s Gulfs in Chap. 12.
More often, lack of understanding of users leads to some groups of users beingexcluded. We have worked with web sites that now make sure that they have textversions available to support not only the visually impaired (through text readersand descriptions of pictures), but also two types of users that do not come to mindeasily in a US college environment with ubiquitous broadband—those users sep-arated from the site via dialup lines or by vast distances (Ritter et al. 2005).
1.3 The Benefits and Costs of Understanding Users 11

1.3.2 Benefit 2: Financial Savings
Designing to support users can save companies money, even of the order ofmillions of dollars. One case is Nynex, the New York telephone company, in theearly 1990s. The toll and assistance operators (TAO) are the people who help youwhen you dial ‘‘0’’. They help customers with collect calls, billing, and other morecomplex calls. In the early 1990s Nynex was considering upgrading their TAOworkstation. They had a room with about 100 of these operators; it was believedthat new graphical user workstations could improve productivity. The cost ofupgrading all the workstations was going to be about $500,000 (in 1990s dollars).The company engaged a team of applied psychologists to look at how much fasterthe new workstations would be. The results of a task analysis (using a form ofGOMS which is described in more detail in Chap. 11) suggested that the newworkstations would not be faster, but would, in fact, be 4% slower to operate. Thismay seem like a small difference, but a 4% reduction in productivity was going tocost Nynex $2.4 million a year—in addition to the cost of the workstations.
Nynex ran a study to discover how much faster the new workstations wouldreally be. After allowing time for the operators to learn to use the workstations, theoperators’ performance plateaued about where it was predicted—4% slower.NYNEX now claims that this study saved them $2.4 million per year. The userstudy paid for itself in the first week (see Gray et al. 1992, 1993 for more details).The slowdown in operator performance was not caused by the fact that the newworkstations simply required the user to take more steps to achieve the same goal.The reason was the new interface did not allow multi-tasking; the operators couldnot type while waiting for the caller to speak which they could with the old.Improved computer processor speed could not compensate for the loss in parallelactivity the users had with the previous design.
The NYNEX example reveals the benefits of considering people—in this casethe operators—even when there does not appear to be a problem. In manyinstances the main advantage of studying people using systems—that is, con-ducting ‘‘user studies’’—is to identify where people make errors, so that we canprevent them or mitigate their consequences in the final product. People often donot type what they want to type, and sometimes push buttons that they did notintend to push. Strangely enough, this problem can be more prevalent amongsthighly-skilled expert users, than amongst beginners. Errors that occur whensomeone knows the right thing to do, but accidentally does something different, arecommonly referred to as ‘slips’ to distinguish them from mistakes, where theaction is taken on the basis of an incorrect plan (Norman 1981; Reason 1990).
These slips can also occur on well-practiced interfaces that do not attempt tocatch such slips. These slips can also be very expensive. A local paper (CentreDaily Times, 15 Feb 2002, p. C38) reported that a financial services firm lost up to$100 million because it executed a sell order of 610,000 shares at 16 yen instead ofthe correct order of 16 shares at 610,000 yen (approximately 100 yen/US$).
12 1 Introducing User-Centered Systems Design

In a review of the application of user models to evaluate Army systems, Booherand Minninger (2003) report many instances where millions of dollars over thecourse of a device’s lifetime were saved by better interface design, throughreduced training, for example. They also highlight several cases where systemshad to be scrapped or modified at great expense because they were not usable.
Use of machines that have different modes can often mislead users into makingerrors. Photocopier machines that can be used to send faxes have a commonproblem. The default mode of these machines is to copy, but users may not realizethis. Users may type in the area code (say, the U.S. area code 415) as the startingpoint for sending a fax, but the copier interprets this as a request to make 415copies of the document that the user intended to send as a fax! More explicitdisplays and more intelligent systems might attempt to catch this type of error.Photocopies may be relatively cheap, but this type of problem with airline tickets,machine tools, or photographic films quickly become expensive.
1.3.3 Benefit 3: Safer Systems
Much of the work that has made airplanes the safest transportation per passengermile (Gigerenzer 2004) has gone into supporting pilots and air traffic controllers toavoid and, more importantly, catch and recover from errors. This has led to adrastic decrease in accidents previously ascribed to ‘pilot error’. As the cause ofthese accidents were typically attributed to well-trained and alert pilots, it is fairerto diagnose these errors as poor fits between the pilot’s capabilities and themachine at particular times and for particular sets of tasks. Improving this fit thusimproved airplane safety.
Medicine provides a rich source of examples too. For instance, interfaces thatallow users (e.g., nurses) to type in the digits of a drug dose are inherently moredangerous than those that force users to dial them in using a wheel for each digit(Pew and Mavor 2007). When typing, a repeated digit can increase the dosage by afactor of ten. This type of mistake is not possible with a dial-based interface.
Medical X-ray machines are powerful devices and often offer little margin forerror. In addition to their technical requirements, they can have usability problemsbecause their effects are not directly and immediately visible. In the case of radi-ation treatments for cancer, multiple professionals are involved in their use, fromthe oncologists and radiologists who specify the treatment, the technicians whoadminister it, to the physicists who maintain it. There are many examples of whereinterface design for treatment using X-ray machines and other medical deviceshave ignored the user’s capabilities, tasks, context, or some combination of these,and this has led to loss of life. Perhaps the most famous case is the Therac 25(Leveson and Turner 1993). Between 1985 and 1987 there were six known acci-dents involving massive radiation overdoses with the Therac. Notably, such acci-dents rarely arise from a single cause. The user interface was only one of several
1.3 The Benefits and Costs of Understanding Users 13

contributory factors. In addition to problems with the technology and safetyinterlocks, the system (including the technician) was poorly prepared to deal withtyping mistakes by the technician, and in many installations the level of feedbackfrom the Therac to the radiation technician was not sufficient to help them catch themistakes sooner.
1.3.4 Cost 1: Understanding the Users Does Not GuaranteeSuccess
Although improving the usability of a system can save lives, lead to productsuccess, and save money, usability is neither a necessary nor sufficient conditionfor success, nor is it a protection against loss of money or life. Systems with poorusability can still be successful for a variety of reasons. For example, they mayoffer a functionality that is unique and useful. The earliest versions of planes,computers, printing presses, and satellite phones were all difficult to use, butsuccessful because of their unique functionality.
Products that are well designed with the user in mind may still not be successful.Most or all aspects must be right for a product or system to succeed. Making theusability right does not make the time to market right, it does not make the priceappropriate, and other critical aspects such as reliability or marketing may fail.
The system also has to be acceptable to the users. The interface may be welldesigned on a local level, but if it clashes too much with existing practice (even ifthe new system is correct) it can quickly fall into disuse (e.g., see Baxter et al.2005). Similarly, if management does not appropriately support the transition tothe new system, it may also fall into disuse. Glashko and Tabas (2009) argue thatto understand success you need to understand the user, the business model, and thetechnology.
The lack of usability can be a sufficient reason for failure and this is sometimesoverlooked. For some systems, however, usability is not the biggest risk to suc-cess. Indeed there are many factors that contribute to success, and none of them ontheir own are necessary or sufficient to guarantee success. Pew and Mavor (2007)suggest taking a risk driven spiral-based approach to development to deal withthis; we describe this approach later in the book.
1.3.5 Cost 2: Knowing When to Stop Analyzing the Users canbe Difficult
Knowing when you should stop analyzing the users and start building your systemis a difficult problem to address. It is an ongoing issue for HCI (and system design
14 1 Introducing User-Centered Systems Design

in general) that should be able to demonstrate a worthwhile return on investment.Nielsen (1993), for example, argues that many usability-related design problemissues can be identified by studying a small numbers of users (about five to eight).The caveats are that the results of this approach are highly dependent on the typesof users involved and the particular interface. As yet there are no hard and fastrules that can be applied to all systems which will tell you when to stop the useranalysis and start building.
The traditional approach to systems deployment largely focused on making theusers fit the system. In other words, companies employed the right people (selectedusing psychometric testing, qualifications, and so on) and, where necessary,trained them as a way to bridge any remaining gaps between the system and theusers. This approach has become increasingly unacceptable as people havebecome better informed about technology and now expect to use it out of the box,In addition, there have been recent political changes which require that systems areaccessible to more people (e.g., the Americans with Disabilities Act), rendering theidea of fitting the user to the system less unacceptable.
It is now generally the case that you should design (or re-design) your system tomake it fit your users. We would strongly argue that you need to think right fromthe very start of the project about your users, the tasks they will perform using yoursystem, and the context in which your system will be used. In other words, whenyou are defining the system’s functional requirements, you should also be definingthe usability requirements.
The level of detail required here should be guided by the associated risksinvolved. If you only talk to developers as proxy users to determine usabilityrequirements, for example, there is a large risk that the delivered system will notbe acceptable to the real end users because the proxy users will not understandhow the real users will carry out their work using the system in a work contextthat may constrain how the system can be used. If your system will be used inextreme or safety critical environments (e.g., in space or aviation), for example,your users will be highly skilled practitioners making decisions and performingactions in a limited time frame, where the results may have life or deathimportance. These risks are increased if the designers are unlike the users (Casperand Murphy 2003 provides a nice case study). In these cases we recommend thatyou do some background work in the domain, looking at existing systems similarto the one you are designing and consulting appropriate resources such as books,as well meeting the users and seeing their context and tasks and running somestudies to test out your ideas and develop your understanding of the system’scontext.
For simple, straightforward systems developed for your own purposes (likemany systems that are used in research, for example), you may not need to worrytoo much about the design of the user interface. Even for very small numbers ofexpert users it may not be worthwhile spending large amounts of time and effort ondeveloping the user interface because the costs may well exceed the benefits.
1.3 The Benefits and Costs of Understanding Users 15

Often your population of users will be heterogeneous, and if you are not awareof this heterogeneity you could end up disenfranchising large sections of yourusers. We have worked with web sites that now incorporate text versions so thatthey can also support the visually impaired (through screen readers and descrip-tions of pictures), and users that access the web via low speed connections, such asdialup lines or from very remote locations (Ritter et al. 2005). Neither of thesetypes of users is likely to be the same as many designers.
Although there is no general solution to the question of when to stop analyzingthe user and start building the system, Pew and Mavor’s (2007) approach providesa subjective answer. In their risk driven approach, the risks to success arere-evaluated as the design process progresses. In some cases, progress with thetechnology is the largest risk to success; in others, not knowing the user and theirtasks will be the largest risk. So Pew and Mavor’s answer is that you should studythe user and their tasks until the risk of not knowing more about them is lower thanthe other risks to success. As noted above, we will return to describe this approachin more detail in the final chapter, Chap. 14.
1.4 Summarizing Design Relevant User Characteristics:The ABCS Framework
The purpose of this book is to help you to come up with principled opinions aboutwhat designs are most likely to be effective. We introduce the idea of designrelevant user characteristics. Attempts to define a complete list of human char-acteristics stretch from hundreds (e.g., Brown 1988) to thousands of pages (Boffand Lincoln 1988; Salvendy 1997). Table 1.2 offers some examples that are oftendiscussed, taken from Brown (1988).
To help organize design relevant human characteristics, we offer a frameworkthat we call the ABCS. The abbreviation represents four aspects of users that oftenneed to be examined when designing systems:
A Anthropometrics: the shape of the body and how it influences what isdesigned; consideration of the physical characteristics of intended users suchas what size they are, what muscle strength they have, and so on
B Behavior: perceptual and motivational characteristics, looking at what peoplecan perceive and why they do what they do
C Cognition: learning, attention, and other aspects of cognition and how theseprocesses influence design; users defined by how they think and what theyknow and what knowledge they can acquire
S Social factors: how groups of users behave, and how to support them throughdesign; users defined by where they are—their context broadly definedincluding their relationships to other people.
We now briefly explain each of these areas in more detail.
16 1 Introducing User-Centered Systems Design

1.4.1 Anthropometrics Approach
Anthropometrics is concerned with the physical aspects of the user and the system.For example, Fig. 1.4 shows an input glove. How do people use this? What aretheir natural movements in it, and do these movements change with a glove on?How long can they use it before becoming fatigued or hurt by it? The answers toquestions like these would involve resolving the issues in Table 1.3.
These physical aspects are often studied in the area of human factors andergonomics and applied to standard office equipment like desks and chairs. A lot isknown about how to improve the fit of the hardware to the user’s body, includingback, knees, waist, and arms (Pheasant and Haslegrave 2006). The optimal worksurface height, for example, varies by the individual concerned but also by the taskto be performed.
It is also important that we consider whether we need to design for individuals(e.g., desk setups need to be specifically tailored to avoid upper limb disorders), forthe average (e.g., seats in buses and trains are designed for averages), or forextremes (e.g., plane ejector seats). For example, Ted Williams, the famousAmerican baseball player and fighter aircraft pilot, reportedly crash-landed a planerather than eject so that he would be able to play baseball again after the Koreanwar—the design error was that ejector seats were designed for the average heightof a pilot, which left those in the upper 5–10% of the height range in danger ofdamaged or removed kneecaps if they ejected.1
In computer systems these problems include making sure that controls (knobs,dials, buttons, and so on) are of a size that can be manipulated by a wide range ofusers. Weight and button size are important for their usability and the perceivedusability for their marketing. For example, the release of many different sizes ofinteractive tablet computers into the market over recent years suggests the physicalsizes of these devices matter for different use scenarios. Early mobile phones were
Table 1.2 Human characteristics relevant for system design
• Physical characteristics, limitations, and disabilities• Perceptual abilities, strengths, and weaknesses• Frequency of product use• Past experience with same/similar product• Activity ‘‘mental set’’ (the attitude toward and level of motivation you have for the activity)• Tolerance for error• Patience and motivation for learning• Culture/language/population expectations and norms
1 http://www.tedwilliams.com/index.php?page=burnjet
1.4 Summarizing Design Relevant User Characteristics 17

the size of briefcases, and laptops weighed 30 pounds; these failed to be as popularas expected partly because they were not small enough.
These issues are equally important in the design of mobile devices. Weight andbutton size are important for their usability and the perceived usability for theirmarketing. These issues will be more important for reality-based interfaces, wherecomputing is embedded into objects such as passports, children’s toys, and objectsthat have RFID tags which allow them to be tracked. These interfaces include bothcomputational aspects as well as the physical nature of the objects and theopportunities and constraints that physical realization provides.
Fig. 1.4 An input glove.(Photo taken by and usedwith permission of GeorgiosChristou)
Table 1.3 Example usability issues arising from the anthropometric level
• Providing normative data on limb sizes, body weight/height, and so on• Providing descriptions of how sensitive touch is for input and output, particularly for the hands• Measurement of muscle strain (to assess length of time on a particular job)• Measurement of posture during particular tasks (to facilitate redesign of equipment)
18 1 Introducing User-Centered Systems Design
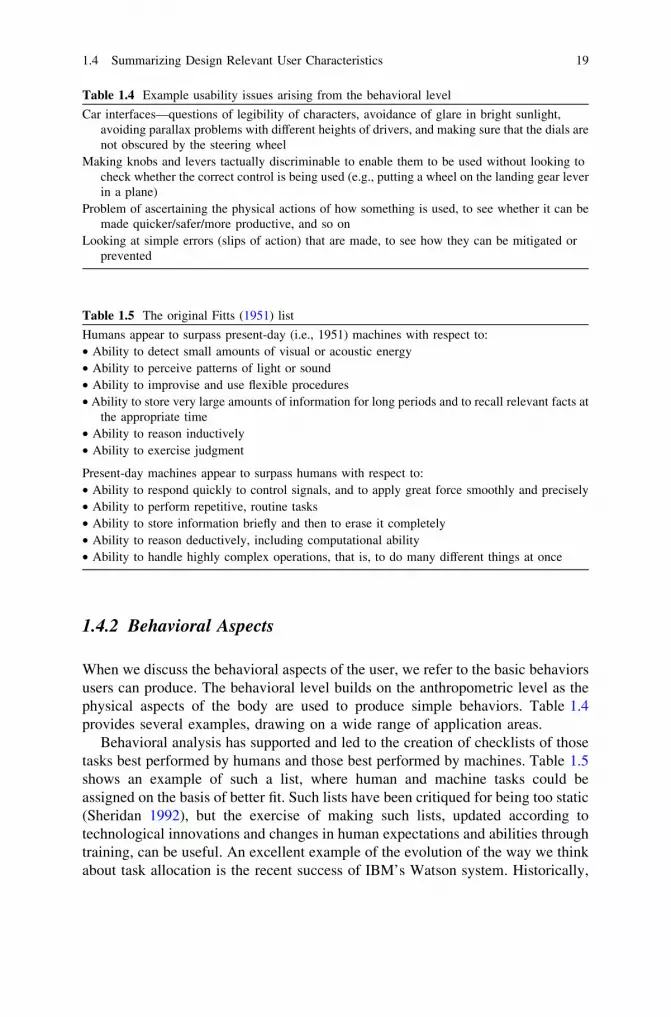
1.4.2 Behavioral Aspects
When we discuss the behavioral aspects of the user, we refer to the basic behaviorsusers can produce. The behavioral level builds on the anthropometric level as thephysical aspects of the body are used to produce simple behaviors. Table 1.4provides several examples, drawing on a wide range of application areas.
Behavioral analysis has supported and led to the creation of checklists of thosetasks best performed by humans and those best performed by machines. Table 1.5shows an example of such a list, where human and machine tasks could beassigned on the basis of better fit. Such lists have been critiqued for being too static(Sheridan 1992), but the exercise of making such lists, updated according totechnological innovations and changes in human expectations and abilities throughtraining, can be useful. An excellent example of the evolution of the way we thinkabout task allocation is the recent success of IBM’s Watson system. Historically,
Table 1.4 Example usability issues arising from the behavioral level
Car interfaces—questions of legibility of characters, avoidance of glare in bright sunlight,avoiding parallax problems with different heights of drivers, and making sure that the dials arenot obscured by the steering wheel
Making knobs and levers tactually discriminable to enable them to be used without looking tocheck whether the correct control is being used (e.g., putting a wheel on the landing gear leverin a plane)
Problem of ascertaining the physical actions of how something is used, to see whether it can bemade quicker/safer/more productive, and so on
Looking at simple errors (slips of action) that are made, to see how they can be mitigated orprevented
Table 1.5 The original Fitts (1951) list
Humans appear to surpass present-day (i.e., 1951) machines with respect to:• Ability to detect small amounts of visual or acoustic energy• Ability to perceive patterns of light or sound• Ability to improvise and use flexible procedures• Ability to store very large amounts of information for long periods and to recall relevant facts at
the appropriate time• Ability to reason inductively• Ability to exercise judgment
Present-day machines appear to surpass humans with respect to:• Ability to respond quickly to control signals, and to apply great force smoothly and precisely• Ability to perform repetitive, routine tasks• Ability to store information briefly and then to erase it completely• Ability to reason deductively, including computational ability• Ability to handle highly complex operations, that is, to do many different things at once
1.4 Summarizing Design Relevant User Characteristics 19

because humans reason creatively and inductively through association and usingmnemonics, they could easily beat computers on standard general knowledge tests.However, since the advent of the Internet, which represents a massive database ofgeneral knowledge that has been supplied through untold hours of human contentcontribution and improvements in computational processing power and searchalgorithms, it is possible for a machine, Watson, to beat a human at such tests.What we see in this example is that the notion of even what a machine is canchange over time. Therefore, when considering allocation of processing activitiesbetween humans and computational devices, we need to ensure we are using themost appropriate sense of the term machine.
We also include simple interaction at the behavioral level. For example,Norman (2013) has written about ‘‘forcing functions’’. These are aspects ofdevices that suggest particular uses or styles of interaction. In some cases, affor-dances force a particular style of interaction. One of Norman’s favorite examplesis door design. Doors with handles suggest that they should be pulled, while doorswithout handles suggest that they should be pushed. A forcing function would bewhere the door with the handle cannot be pushed, thus forcing that it be pulled.Violation of these affordances (doors that can only be pushed yet have handles)leads to confusion. Perceptual issues sit between the behavior and cognition. Forexample, PowerPoint presentations where the font is too small means peoplecannot read the content unless they move physically closer (Kosslyn 2007).
In addition to noting the basic foundations that explain how people behave, wealso have to consider why people behave in the way that they do. The motivationthat people have for performing particular tasks will vary, partly depending oninternal factors, but also partly on external factors (e.g., is it a work task, is it beingcarried out in an informal setting, and so on.)
1.4.3 Cognition
The cognitive level uses the previous two levels and builds upon them. On thislevel, how the user thinks about their task and the system is considered, as well asboth basic and higher level cognitive capabilities. These capabilities include avariety of memory systems that the user has available, as well how these memoriesare organized and how they are used by a central processor. Higher level con-structs include how attention and learning affect these structures and processes.Some example cognitive issues are shown in Table 1.6.
Work on the cognitive level will often involve observation of the tool/envi-ronment in use, asking the question of why and when is it used? This is necessarybecause users will vary more on this level of analysis than on the previous twolevels. On this level, people will vary based on previous experience, which caninclude training, formal education, previous use, personal style, and strategychoice.
20 1 Introducing User-Centered Systems Design

A better understanding of how users think and feel can be used to create betterdesigns. An improved system can come from understanding the mental effortinvolved in tasks in terms of the information processing mechanisms (architecture)that support our thinking, including constraints such as how many arbitrarysymbols users can remember. These issues may help us to understand how com-plex devices with high functionality (e.g., personal video recorders) can be mademore accessible to non-expert users by providing information, by guiding the user,and by not asking them to perform difficult tasks (like remembering more thantheir short-term memory can hold).
For example, consider the fairly common task of determining differencesbetween two or more items. Imagine you had two dials to read, each with adifferent number, and these numbers varied randomly. Your task is to press abutton when the difference between the two numbers exceeds 10. This task wouldrequire you to process the information from both dials, make a mental calculationand evaluate whether the difference exceeds 10. The existence of a third dial whichjust showed the difference would make your task easier and faster, removing theneed for the mental calculation (the cognitive effort).
1.4.4 Social Factors
The final level is the social level. How do users interact with other people inrelation to their task? In some cases this interaction will be to work on the taskjointly with others using the computer to support and mediate their communica-tion. In other cases, users will ask other users for help in understanding systems, orwill use the system for, or with others (such as bank tellers, loan officers, andairline pilots), or the interaction could be constrained by some regulatory authority(as in aviation and the nuclear power industry).
Table 1.6 Example cognitive level issues
How do users decide where to look for information?What information do users need to develop a strategy for performing a particular task? Do they
need absolute or relative values?How much experience do the users have with the task and with the interface?What is the user’s mental model of the interface and task (which will often differ from the
designer’s or the observer’s mental model of the same interface and task)?Is there so much noise and interruption that users cannot process information, for example, the
interruptions in the Kegworth aircraft crash?How can users tell if things are not going well? What feedback do they get? What strategies are
available to the user when the system goes wrong?How can we ensure that users do not lose their ability to perform the task manually as a result of
automation?How can word processors be made more accessible to novice users or casual users? How do these
factors change when the systems considered are more complex?
1.4 Summarizing Design Relevant User Characteristics 21
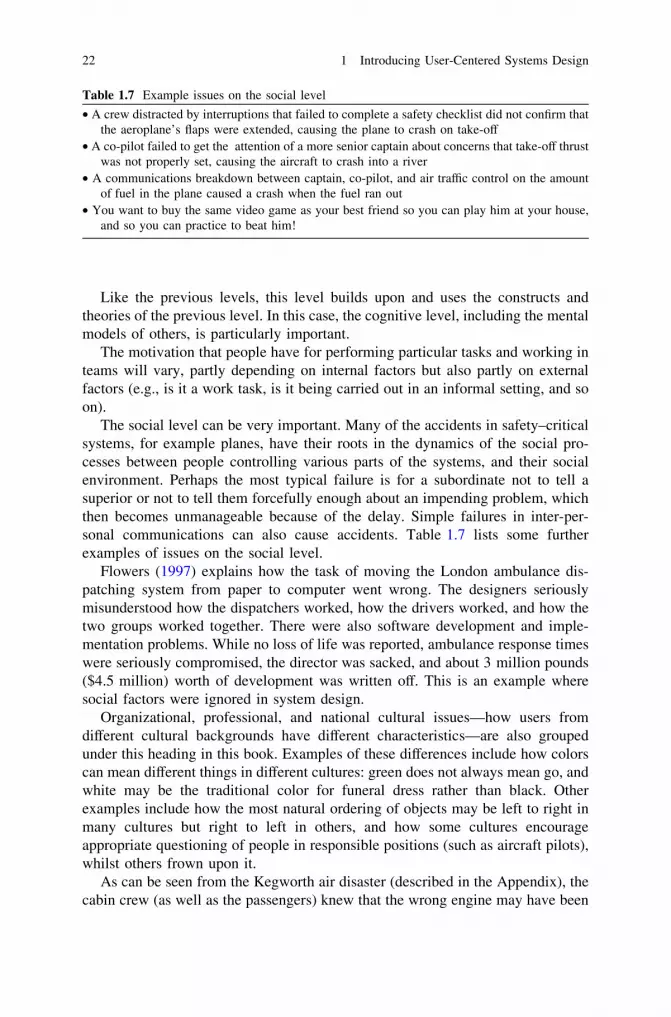
Like the previous levels, this level builds upon and uses the constructs andtheories of the previous level. In this case, the cognitive level, including the mentalmodels of others, is particularly important.
The motivation that people have for performing particular tasks and working inteams will vary, partly depending on internal factors but also partly on externalfactors (e.g., is it a work task, is it being carried out in an informal setting, and soon).
The social level can be very important. Many of the accidents in safety–criticalsystems, for example planes, have their roots in the dynamics of the social pro-cesses between people controlling various parts of the systems, and their socialenvironment. Perhaps the most typical failure is for a subordinate not to tell asuperior or not to tell them forcefully enough about an impending problem, whichthen becomes unmanageable because of the delay. Simple failures in inter-per-sonal communications can also cause accidents. Table 1.7 lists some furtherexamples of issues on the social level.
Flowers (1997) explains how the task of moving the London ambulance dis-patching system from paper to computer went wrong. The designers seriouslymisunderstood how the dispatchers worked, how the drivers worked, and how thetwo groups worked together. There were also software development and imple-mentation problems. While no loss of life was reported, ambulance response timeswere seriously compromised, the director was sacked, and about 3 million pounds($4.5 million) worth of development was written off. This is an example wheresocial factors were ignored in system design.
Organizational, professional, and national cultural issues—how users fromdifferent cultural backgrounds have different characteristics—are also groupedunder this heading in this book. Examples of these differences include how colorscan mean different things in different cultures: green does not always mean go, andwhite may be the traditional color for funeral dress rather than black. Otherexamples include how the most natural ordering of objects may be left to right inmany cultures but right to left in others, and how some cultures encourageappropriate questioning of people in responsible positions (such as aircraft pilots),whilst others frown upon it.
As can be seen from the Kegworth air disaster (described in the Appendix), thecabin crew (as well as the passengers) knew that the wrong engine may have been
Table 1.7 Example issues on the social level
• A crew distracted by interruptions that failed to complete a safety checklist did not confirm thatthe aeroplane’s flaps were extended, causing the plane to crash on take-off
• A co-pilot failed to get the attention of a more senior captain about concerns that take-off thrustwas not properly set, causing the aircraft to crash into a river
• A communications breakdown between captain, co-pilot, and air traffic control on the amountof fuel in the plane caused a crash when the fuel ran out
• You want to buy the same video game as your best friend so you can play him at your house,and so you can practice to beat him!
22 1 Introducing User-Centered Systems Design

turned off, but did not interrupt the pilots, possibly because of the high social statusaccorded to the pilots. This type of cultural issue, where someone knows some-thing that could help a team or a project and does not raise the issue, is a welldocumented problem. How to adjust appropriately the social dynamics to fixproblems like this remains an important and interesting problem.
Another example comes from a nuclear power plant in Europe. A reportingsystem was set up to allow staff to report incidents (near misses) so that thecompany could learn from them to try and prevent the same thing happening(Masson 1991). This was all working fine, and management and staff had settledinto using the system. Staff were happy to report incidents and were not blamedwhen the incidents did occur. The management then decided that they wouldchange the (negotiated) culture, in which the emphasis had been on reportingincidents, to one that focused on incidents as a measure of safety, and decided thatthe shift that reported the least incidents would be regarded as the safest shift andwould receive some reward.
The net effect was that staff stopped reporting incidents in a bid to make theirshift appear to be the safest. In the end a new incident reporting system had to bedeveloped, and all the data about the unreported incidents was lost because themanagement had unwittingly changed the culture from one that was designed touse reported problems as a way of learning and improving safety to one that waseffectively designed to reward the lack of reporting of problems.
1.5 Simulating User Characteristics: CognitiveArchitectures
One of the main aims of this book is to help you to develop a better understandingof why users do things the way they do. Understanding the way users think andbehave will help you design systems that support users. The ABCS framework,described above, provides one way of organizing this information about usercharacteristics. It is also possible to encapsulate relevant details in a model. Forexample, if one is interested specifically in human information processing, cog-nitive architectures provide a convenient way of modeling human informationprocessing under different conditions, because they include mechanisms that arespecifically designed for modeling human cognition.
Figure 1.5 is a schematic of the major components of a computer model of auser. The major components in this model are designed to mimic the majorcomponents of users. The top box, ACT-R, refers to a simplified form of the ACT-R cognitive architecture (Anderson and Lebiere 1998). (There are other archi-tectures, but they are similar for our purposes.) In this instance the architecture hasbeen combined with an extension that allows it to interact effectively with theexternal world. So the combined cognitive architecture takes the bitmap from acomputer screen and, in a process approximating vision, computes the objects andsome of their features in the image and puts the results into a perceptual buffer.
1.4 Summarizing Design Relevant User Characteristics 23

This perceptual buffer represents many of the aspects of the human vision system.Similar buffers should be created for hearing and the other senses.
At the center of the architecture is a reasoning system that can access informationin the perceptual buffer and access and modify information in the declarativememory and goal buffers. It uses the information in these buffers to guide itsprocessing, using a process that mimics human behavior. Output actions to theexternal world are put into a motor buffer, where motor routines generate the results.
This representation is somewhat generic and far from complete, but illustrates atheory of the major information processing components of the user. There are othertheories of how users process information, and even the ACT-R theory has changedover time. Work is ongoing to apply this approach to create models of users thatcan be used to test interfaces (e.g., Byrne 2001; Freed and Remington 2000; Ki-eras et al. 1997), to serve as intelligent colleagues (Weiland et al. 2002) andopponents in computer-based games and simulations (e.g., Jones et al. 1999; Lairdand van Lent 2001; Tambe et al. 1995), and to summarize our knowledge of humanbehavior (e.g., Anderson et al. 2004; Jones et al. 2000; Lovett et al. 2000).
1.6 Summary
This chapter has introduced the study of people who use artifacts (i.e., users),given you some definitions and useful terms, and provided an overview to organizeyour further reading. We have also highlighted some common (mistaken) pre-conceptions about what makes for good design and noted why studying users isimportant. In particular, we have introduced the concept of the fundamentalattribution error of design, where designers think that users are like themselves,which is very often not the case.
Computer Environment
ProductionRule System
GoalBuffer
DeclarativeBuffer
MotorBuffer
PerceptualBuffer
ACT-R
Simulated Eyes
and Hands Motor
Routines
Image Processing Routines
Fig. 1.5 A representation ofthe ACT-R cognitivearchitecture with the SegManextension to allow it tointeract with interfacesthrough computer bitmaps
24 1 Introducing User-Centered Systems Design

We believe that understanding users is fundamentally important and often leadsto more usable systems. There are costs as well as benefits associated withstudying and understanding users, however, and it is important to realize when youshould decide to stop analyzing the users and start building your system. A risk-based approach to development can help inform this decision. We explain thismore fully in the Chap. 14 that you might wish to preview.
The information about users’ design related capabilities can be organized usingthe ABCS framework to encapsulate people’s physical shape, how they perceive,how they think, and how they interact with other people. This simple abbreviationcan be used to remember the information and to guide your considerations duringsystem design. Chapters 3–10 cover these levels.
We also introduced the idea of cognitive architectures, which can be used todevelop models that simulate how people perceive, think, and act. Although weused the ACT-R architecture as an exemplar, other cognitive architectures couldalso be used to organize and apply knowledge about users. We take up thisapproach again in the Chap. 14.
1.6.1 Structure of the Rest of the Book
You can think of the book as being divided into four parts. The first two chaptersintroduce the notion of user centered design and examine the underlying history.
The second part of the book (Chaps. 3–10) examines specific characteristics ofthe user. Our perspective draws heavily on psychology. We focus on the sensoryand cognitive, information processing, aspects of the user, partly because this iswhere our expertise lies, but also because much interaction requires people tosense, understand, communicate, and learn. We limit our discussions to the topicsthat are most relevant to designers while also offering pointers to those people whowant to read more about these topics.
The third part of the book (Chaps. 11–13) introduces some methods that can beused to inform and evaluate design. This is an active area of application andresearch, and there are now so many different approaches that it would beimpossible to cover them all here.
The book concludes with a short summary (Chap. 14). This highlights how youcan organize what you have learned about users and notes some possible directionsthat are currently being explored to apply it.
On completing this book you will have acquired an understanding of humansand their behavior when interacting with complex, interactive systems. You willhave sufficient grounding to be better able to design systems that take appropriateaccount of your users, their tasks, and the context in which they perform thosetasks. You will be able to justify how (and why) a particular design is appropriatefrom a conceptual level down to a practical level, using the toolbox of methodsand techniques that we have placed at your disposal.
1.6 Summary 25

1.6.2 Future Work
You should now be aware that there is a lot to be learned about users. Whiletechnology can change rapidly basic user capabilities and characteristics changeslowly, if at all. It is important to be aware of critical user characteristics, theirrelative importance for a design, and their likelihood of change over time.
There is also much more that needs to be learned. As you read the rest of thisbook, you should become aware of the remaining problems, some of which arelisted in Table 1.8.
1.7 Other Resources
Here we note some further books and online resources.The books by Christopher Wickens (Wickens et al. 1998; Wickens and
Hollands 2000) provide more details than this book does. These books focus moreon human factors and physical engineering of workplace.
The books by Preece et al. (2002) and Dix, Finlay, Abowd, and Beale, bothtitled Human–Computer Interaction, and Interaction Design: Beyond Human–
Table 1.8 Some remaining problems in contemporary system design
• The size of systems and diversity of users and tasks are increasing. How are we to find,represent, and use this information?
• The complexity of the systems is increasing: users do not always get adequate feedback on whatis going on, and cannot see the internal state of the system. Norman (2013) provides furtherexamples. How are we to keep users informed without overwhelming them with information?
• The nuances of social and organization factors and the communication of these nuances throughcomputer supported communication are not fully understood and predictable. How candesigners get and use this information? How can it be represented?
• How can we improve the usability of designer’s tools to help them improve usability for users?• Studies of the user need to go beyond recommendations about the design of technology—can
we offer a conceptual basis for these recommendations? One approach is to create a unifiedtheory of how users behave, but this theory has not yet been fully created or made availablefor automatic application
• With further understanding come questions about lower and higher levels. Once we know howusers work in small groups we can see that larger groups also have influence as do previousgroups who used the system. What is this information and how do we include thisinformation?
• Esthetics and emotions are difficult factors to explain and quantify. Users, particularly users ofpersonal and home technologies, generally care about how the system looks and what pleasureit gives them, sometimes irrespective of how it works or how well it works. In these areas,then, esthetics is closely related to acceptability, and there is some evidence of a highcorrelation between esthetics and usability (e.g., Tractinsky 1997). The inter-relationshipbetween usability, functionality, emotional responses, and esthetics, however, still needs to beworked out
26 1 Introducing User-Centered Systems Design

Computer Interaction, 3rd Edition, by Sharp, Rogers, and Preece are all worth acloser look. These books include more on technology and on designing interfacetechnology rather than focusing in detail on the various aspects of the users thataffect interaction. Clayton Lewis and John Rieman’s shareware book: Task-Centered User Interface Design, hcibib.org/tcuid/ covers similar material butfocuses more on design and task analyses, and does not include as much psy-chology. It helps put the material in this book into perspective for design purposes.
Descriptions of design failures often make interesting reading, and their lessoncan sometimes be generalized to other systems. For large systems, Petroski’s(1985) book is one of the most popular. Petroski’s observation that engineering hasprogressed over the centuries by learning from failure also applies to interfacedesign. The ACM Committee on Computers and Public Policy’s Risks Digest atcatless.ncl.ac.uk/Risks/ provides numerous examples of where poor usability hasled to problems.
There are many online resources available on HCI and human factors. The HCIBibliography Project, hcibib.org, provides an online bibliography of papers injournals and conferences related to HCI. The Computer–Human Interaction Spe-cial Interest Group of the Association for Computing Machinery (ACM-SIGCHI)has a very useful web site at www.acm.org/sigchi/ They organize the CHI con-ference every year, as well as producing a magazine, interactions.
You can also examine the design and graphic design literature to understandesthetics better. There are books on the design of graphic information (e.g., Tufte1990), on the design of pages (e.g., White 2002), on the design of fonts, pagelayouts, graphics, and so on. If you are interested in this area, consider lookingthrough libraries (personal, institutional, and public), using search engines, andconsulting academic course catalogues, all of which can provide you with muchmore information.
Don Norman’s books, including the classic The design of everyday things2
(1988/2013), provide a useful set of examples of why design matters. At times theexamples may seem small, but in nearly every case their impact is magnified bythe number of people affected, the possible severity of the consequences, or theirclarity. Many people have been convinced of the importance of HCI as a result ofreading this book.
The importance of esthetics should not be underestimated, even though we donot cover it in any great detail here. Jordan (2000), for example, argues thatesthetics of devices will increase over time. When systems are equivalent, it maybe the case that their users differentiate between them on the basis of how pleasingtheir appearance is. Some researchers have found that pleasing interfaces workbetter (Helander and Tham 2003), and Norman (2006, 2009) argues this positionrepeatedly, including that esthetics and functionality should be considered equallyimportant.
2 Also published sometimes as The psychology of everyday things.3 A millisecond is a thousandth of a second, and is abbreviated ms.
1.7 Other Resources 27

1.8 Exercises
1.1 The correct ranked order for the buttons in Fig. 1.1 is as follows: (a)(411 ms3), (d) (469 ms), (b) and (c) (each 539 ms). The lights in D have asimple rule that users can follow– look to the diagonal. The lights in B and Chave two rules (or at least a more complex rule): if the lights are in themiddle, hit the button below; if the lights are on the end, hit the diagonalbutton. The extra conditions, or rules, take extra time to learn and extra time toperform. They would also lead to more errors.
Ask some of your friends and or family to choose the best designs inFigs. 1.1 and 1.2. How do they compare to your performance and to Payne’ssubjects? If you have access to interface designers, ask them. How does yourown stove compare to these mappings? What do your results mean forinterface design?
1.2 In Fig. 1.3 the correct coin is Penny A. The point is, most people do notmemorize the features of objects in detail, they memorize just enough torecognize and differentiate the coin from typical distracters, like other legalcoins, or to find the right menu item when it is in front of them. Try this simpletest for the penny with your friends, and also ask computer users to identifythe correct Word menu in Fig. 1.6.
1.3 Consider a mobile device (such as a smartphone or tablet). What difficultiesmight people encounter in using the device for the first time? What difficultiesmight people have in understanding how to use it and what to do with it? Howwould they go about learning how to use it?
File Home Insert Page Layout References Mailings Review View
Word File Edit View Insert Font Tools Table Window Work Help
FileHome Insert Page References Review View HelpLayout
File Edit View Insert Font Tools Window HelpHome Review
File Edit View Insert Font Tools Window HelpReview
[OS Icon]
[OS Icon]
FileHome Insert LayoutReviewView Table Work[OS Icon]
FileHome Insert Page Layout References Review ViewWord Help
Home Insert Page Layout References Mailings Review View Add-Ins
File Edit View Insert Format Tools Table Window Help
1
2
3
4
5
6
7
8
9
10 [OS Icon] File Edit Arrange StencilsFormat InspectorsView Window Help
Format
Fig. 1.6 Possible views of the top menu on MS Word. Without looking at Word, which of theten menus is the one you use?
3 A millisecond is a thousandth of a second, and is abbreviated ms.
28 1 Introducing User-Centered Systems Design

Write short notes (about one side of a page) on some of these issues youhave identified, classifying them as anthropometric, behavioral, cognitive, orsocial. Think about what design changes you might make to the device tomake it easier for novices to use.
1.4 Consider an airplane crash like Kegworth, the Asiana in San Francisco, oranother one where you can obtain some of the details. Classify the problemsthat led to the disaster with respect to the four levels introduced here. Sum-marize what level was the most important and could have stopped the disaster.
1.5 Select something you use every day that you think is well designed. Thinkabout why this is well designed. You may wish to consider esthetics, map-pings of actions to responses, how you learned to use it, and what kinds ofmistakes or errors you still make.
1.6 What are some other payoffs from studying the user? As ways to brainstorm,consider the types of outputs the various fields related to users would provide.As another hint, consider fields that study users or aspects of users, andconsider what they might want from interfaces or from interactions withinterfaces or systems.
References
Anderson, J. R., & Lebiere, C. (1998). The atomic components of thought. Mahwah, NJ: Erlbaum.Anderson, J. R., Bothell, D., Byrne, M. D., Douglass, S., Lebiere, C., & Qin, Y. (2004). An
integrated theory of the mind. Psychological Review, 111(4), 1036–1060.Baxter, G. D., Monk, A. F., Tan, K., Dear, P. R. F., & Newell, S. J. (2005). Using cognitive task
analysis to facilitate the integration of decision support systems into the neonatal intensivecare unit. Artificial Intelligence in Medicine, 35, 243–257.
Boff, K. R., & Lincoln, J. E. (Eds.). (1988). Engineering data compendium (User’s guide). Wright-Patterson Air Force Base, OH: Harry G. Armstrong Aerospace Medical Research Laboratory.
Booher, H. R., & Minninger, J. (2003). Human systems integration in army systems acquisition.In H. R. Booher (Ed.), Handbook of human systems integration (pp. 663–698). Hoboken, NJ:John Wiley.
Brown, C. M. L. (1988). Human-computer interface design guidelines. Norwood, NJ: Ablex.Bruce, V., Gilmore, D., Mason, L., & Mayhew, P. (1983). Factors affecting the perceived value of
coins. Journal of Economic Psychology, 4(4), 335–347.Byrne, M. D. (2001). ACT-R/PM and menu selection: Applying a cognitive architecture to HCI.
International Journal of Human-Computer Studies, 55(1), 41–84.Casper, J., & Murphy, R. (2003). Human-robot interactions during the robot-assisted urban search
and rescue response at the World Trade Center. IEEE Transactions on Systems, Man, andCybernetics Part B, 33(3), 367–385.
Chapanis, A., & Lindenbaum, L. E. (1959). A reaction time study of four control-displaylinkages. Human Factors, 1(4), 1–7.
Ericsson, K. A., & Simon, H. A. (1993). Protocol analysis: Verbal reports as data (2nd ed.).Cambridge, MA: MIT Press.
Fitts, P. M. (1951). Engineering psychology and equipment design. In S. S. Stevens (Ed.),Handbook of experimental psychology (pp. 1287–1340). New York, NY: John Wiley.
Flowers, S. (1997). Software failure: Management failure… Amazing stories and cautionarytales. New York, NY: Wiley.
1.8 Exercises 29

Freed, M., & Remington, R. (2000). Making human-machine system simulation a practicalengineering tool: An APEX overview. In Proceedings of the 3rd International Conference onCognitive Modelling (pp. 110–117). Veenendaal, The Netherlands: Universal Press.
Gigerenzer, G. (2004). Dread risk, september 11, and fatal traffic accidents. PsychologicalScience, 15(4), 286–287.
Glushko, R. J., & Tabas, L. (2009). Designing service systems by bridging the ‘‘front stage’’ and‘‘back stage’’. Information Systems and e-Business Management, 7(4), 407–427.
Gray, W. D., John, B. E., & Atwood, M. E. (1992). The precis of project Ernestine or an overviewof a validation of GOMS. In Proceedings of the CHI‘92 Conference on Human Factors inComputer Systems. New York, NY: ACM Press.
Gray, W. D., John, B. E., & Atwood, M. E. (1993). Project Ernestine: Validating a GOMSanalysis for predicting and explaining real-world task performance. Human-ComputerInteraction, 8(3), 237–309.
Helander, M. G., & Tham, M. P. (2003). Hedonomics: Affective human factors design.Ergonomics, 46(13/14), 1269–1272.
Holmes, N. (2005). The Internet, the Web, and the Chaos. IEEE Computer, 38(108), 106–107.Johnson, E. J., Bellman, S., & Lohse, G. L. (2003). Cognitive lock-in and the power law of
practice. Journal of Marketing, 67, 62–75.Jones, G., Ritter, F. E., & Wood, D. J. (2000). Using a cognitive architecture to examine what
develops. Psychological Science, 11(2), 93–100.Jones, R. M., Laird, J. E., Nielsen, P. E., Coulter, K. J., Kenny, P., & Koss, F. V. (1999).
Automated intelligent pilots for combat flight simulation. AI Magazine, 20(1), 27–41.Jordan, P. W. (2000). Designing pleasurable products. London: Taylor & Francis.Kieras, D. E., Wood, S. D., & Meyer, D. E. (1997). Predictive engineering models based on the
EPIC architecture for a multimodal high-performance human-computer interaction task.Transactions on Computer-Human Interaction, 4(3), 230–275.
Kosslyn, S. M. (2007). Clear and to the point: 8 psychological principles for creating compellingPowerpoint presentations. New York, NY: Oxford University Press.
Laird, J. E., & van Lent, M. (2001). Human-level AI’s killer application: Interactive computergames. AI Magazine, 22(2), 15–26.
Leveson, N. G., & Turner, C. S. (1993). An investigation of the Therac-25 accidents. IEEEComputer, 26(7), 18–41.
Lovett, M. C., Daily, L. Z., & Reder, L. M. (2000). A source activation theory of workingmemory: Cross-task prediction of performance in ACT-R. Journal of Cognitive SystemsResearch, 1, 99–118.
Masson, M. (1991). Understanding, reporting and preventing human fixation errors. In T. W. v. d.Schaaf, D. A. Lucas & A. Hale (Eds.), Near miss reporting as a safety tool (pp. 35–50).Oxford, UK: Butterworth-Heinemann.
Nickerson, R. S., & Adams, M. J. (1979). Long-term memory for a common object. CognitivePsychology, 11, 287–307.
Nielsen, J. (1993). Usability engineering. Chestnut Hill, MA: AP Professional Press.Norman, D. A. (1981). Categorization of action slips. Psychological Review, 88, 1–15.Norman, D. A. (2006). Emotional design: Why we love (or hate) everyday things. New York, NY:
Basic Books.Norman, D. A. (2009). The design of future things. New York, NY: Basic Books.Norman, D. A. (2013). The design of everyday things. NY: Basic Books.Payne, S. J. (1995). Naive judgments of stimulus-response compatibility. Human Factors, 37,
495–506.Petroski, H. (1985/1992). To engineer is human: The role of failure in successful design. New
York, NY: Vintage Books.Pew, R. W., & Mavor, A. S. (Eds.). (2007). Human-system integration in the system development
process: A new look. Washington, DC: National Academies Press. http://books.nap.edu/catalog.php?record_id=11893. Accessed 10 March 2014.
30 1 Introducing User-Centered Systems Design

Pheasant, S., & Haslegrave, C. M. (2006). Bodyspace: Anthropometry, ergonomics, and thedesign of work (3rd ed.). Boca Raton, FL: Taylor & Francis.
Preece, J., Rogers, Y., & Sharp, H. (2002). Interaction design. New York, NY: Wiley.Reason, J. (1990). Human error. Cambridge, UK: Cambridge University Press.Ritter, F. E., Freed, A. R., & Haskett, O. L. (2005). User information needs: The case of
university department web sites. ACM interactions, 12(5), 19–27. acs.ist.psu.edu/acs-lab/reports/ritterFH02.pdf
Salvendy, G. (Ed.). (1997). Handbook of human factors and ergonomics (2nd ed.). New York,NY: Wiley.
Sheridan, T. B. (1992). Telerobotics, automation, and human supervisory control. Cambridge,MA: MIT Press.
Tambe, M., Johnson, W. L., Jones, R. M., Koss, F., Laird, J. E., Rosenbloom, P. S., et al. (1995).Intelligent agents for interactive simulation environments. AI Magazine, 16(1), 15–40.
Tractinsky, N. (1997). Aesthetics and apparent usability: Empirically assessing cultural andmethodological issues. In CHI ‘97 (pp. 115–122). New York, NY: ACM. http://sigchi.org/chi97/proceedings/paper/nt.htm. Accessed 11 March 2014.
Tufte, E. R. (1990). Envisioning information. Cheshire, CT: Graphics Press.Weiland, W., Szczepkowski, M., Urban, G., Mitchell, T., Lyons, D., & Soles, R. (2002). Reusing
cognitive models: Leveraging SCOTT technology in an LCAC virtual training environment.In Proceedings of the 11th Computer Generated Forces Conference, 02-CGF-115. Orlando,FL: U. of Central Florida.
White, A. W. (2002). The elements of graphic design: Space, unity, page architecture, and type.New York, NY: Allworth Press.
Wickens, C. D., Gordon, S. E., & Liu, Y. (1998). An introduction to human factors engineering.New York, NY: Addison-Wesley.
Wickens, C. D., & Hollands, J. G. (2000). Engineering psychology and human performance (3rded.). Upper Saddle River, NJ: Prentice-Hall.
References 31

Chapter 2User-Centered Systems Design: A BriefHistory
Abstract The intention of this book is to help you think about design from auser-centered perspective. Our aim is to help you understand what questions to askwhen designing a technology or a system or when you are evaluating a design thatalready exists. We focus on physiological, cognitive, and social aspects of thehuman user, aspects that will affect how someone will use what you design. Thischapter introduces some historical background to the field of User CenteredSystem Design, and introduces current themes.
2.1 Introduction
It has long been recognized that we need to consider human capabilities andcharacteristics when designing technologies and systems. As Nickerson summa-rized in 1969, when the potential for computer-based technologies was first beingfully recognized: ‘‘the need for the future is not so much computer oriented peopleas for people oriented computers’’ (Nickerson 1969, p. 178 in the IEEE version).
Since then a number of fields have grown up, expitly concerned with how todesign effective technologies and systems that are intended for human use. User-Centered Systems Design (UCSD or HCSD or when the word ‘‘human’’ is usedinstead of ‘‘user’’), User Experience (UX), User-Centered Design (UCD), Inter-action Design (IxD) and Human–Computer Interaction (HCI) are areas of researchthat have taken up that call and are concerned with improving how people interactwith computers. Each of these has a slightly different focus and breadth, and eachencompasses many different approaches. What they all have in common is thatthey grow their methods and deliverables in response to changes in the techno-logical landscape.
In this chapter we offer an overview of the intellectual roots of these areas ofresearch and development. Early work focused on the learning and use of com-mand-line interfaces and on programming languages. Following the developmentof now familiar) WIMP interfaces (Windows, Icons, Menus, Pointer) and
F. E. Ritter et al., Foundations for Designing User-Centered Systems,DOI: 10.1007/978-1-4471-5134-0_2, � Springer-Verlag London 2014
33

Graphical User Interfaces (GUIs), the focus shifted to understanding how to designvisual layouts and the optimization of input devices. Developments in the tech-nology of the devices (e.g., mobile computing, embedded computation, and sensortechnologies), and in input methods (e.g., sound, vision, and gesture), have led to aproliferation of design and evaluation methods and a focus on the effects of contexton user’s experiences of devices, applications, and services. Further, as the uses oftechnology have been ever more democratized—computers are no longer onlyavailable to a few expert users—the effects of individual differences or diver-gences in use by different user populations have also been increasingly of interest(e.g., differences between children and adults, cultural differences in uptake anduse, gender differences in use). Research has also focused on much broader con-cerns, such as the effects of technology design and uptake in terms of social impactand cultural/global sustainability.
2.2 Influential and Related Research Fields
The intellectual roots of User-Centered Design (UCD, also sometimes calledUser-Centered System Design, UCSD) lie in several areas of basic and appliedresearch. These include:
• Cognitive and social psychology• Linguistics• Mathematics• Computer science• Engineering• Human factors and ergonomics• Socio-technical systems design• Scientific management• Work, industrial, and occupational psychology• Human relations• Organizational behavior.
User-centered systems designers also draw on basic research in anthropology,sociology, and information science, and in recent years there has been considerableoverlap with ideas flowing between UCD researchers and practitioners and thosein research areas such as user experience (UX), human–computer interaction,computer supported cooperative work, computer-mediated communication, andubiquitous/pervasive computing.
Figure 2.1 presents a simple summary of roots of UCD and how they arerelated. It is deliberately simplistic but should provide you with some insights intohow UCD came about.
34 2 User-Centered Systems Design: A Brief History

In this section we offer a brief introduction to the fields we consider to be mostinfluential to our approach in this text. These include various branches of humanfactors and ergonomics, user-centered design, and human–computer interaction.
2.2.1 Ergonomics and Human Factors
Derived from the Greek word ergon for work and nomos for natural laws, ergo-nomics draws on a number of research areas including anatomy, engineering,physiology, and psychology. The purpose of ergonomics and human factorsresearch and practice is to maximize the safety and healthiness of work environ-ments and work practices, and to ensure the usability of tools, devices, and arti-facts in general. More specifically, ergonomics and HF are concerned withproviding a good fit between people and their work or leisure environments. Thereare a number of sub-fields in ergonomics that have arisen as a result of theincreasing penetration of technology into everyday lives. We give a short overviewof each of these below. First, however, it is worth considering the notion of ‘‘fit.’’
Many of us are familiar with ergonomic assessments in the workplace; theseassessments are conducted to minimize the risk of hazards to health and to preventailments such as upper limb disorders. In the UK, however, human factors haveembraced the broader context of work practices, going beyond physical environ-ment considerations and biomechanics to include selection and training. Thus,fitting the person to the environment is the responsibility of selection and training,whilst ergonomists fit the environment to the person. Although in this book we arenot concerned with selection and training, it is worth noting that there is a com-plementary relationship between these activities–user groups may be selected or
Users
User- Cognition
Users - Body
Human FactorsCognitive Ergonomics
HCI
CHI
Psychology
Computer Interfaces
CS
SociologySocial Psychology
General Technology
Fig. 2.1 A pictorialsummary of some of thefields related to the user. Themajor fields are shown withsolid lines
2.2 Influential and Related Research Fields 35

required by the working environment and/or training and selection are employed tomodify the user population to provide the most advantageous fit between the userand the technology.
We can borrow from Rodger’s (cited in Holloway 1991) encapsulation in the1950s which was summarized as ‘‘fitting the man to the job and the job to theman’’1 (FMJ/FJM). This is broken down into:
Fitting the man to the job through
Occupational guidance
Personnel selection
Training and development
and fitting the job to the man through
Methods design
Equipment design
Negotiation of working conditions and (physical and social) rewards.
Although Rodger’s definition is limited, as it does not take into account theorganization in which the person works, we can see this useful encapsulation foroccupational psychology as extended by consideration of issues dealt with byhuman factors.
The concept of ‘fit’ is a useful one. For physical devices and designed envi-ronments, the term fit is used literally. For example, on amusement park rides thereare height restrictions—children have to wait till they are a certain height andweight before they are allowed on rides. However, the concept of fit is also usedwhen people need to conform the way they act and think to accommodate howtasks are laid out in interfaces. Sometimes this is appropriate, but sometimesalternative designs which modify themselves to accommodate human traits wouldbe more effective. For example, Figs. 2.2 and 2.3 show two example web sites thatinvite the user to fit themselves to the interfaces, suggesting they modify theirbehavior to the interfaces. In Fig. 2.2 the web site can recognize that users oftenput their email address in (e.g., [email protected]), but rather than remove the domainfor the user (@psu.edu), it instructs the user to do so. Figure 2.3 shows a low-costairline web site where the user is trying to find a cheap flight from Edinburgh toNaples in the run up to Christmas. The results on the 3 day view and 3 week viewtabs simply show there is nothing available. Even the Year view tab only shows thecheapest prices against the months when flights take place. The user then has toinfer from the results on the Year view tab that the last flights take place inOctober. The problem arises because the user is thinking in terms of flight dates—
1 We note that the language at the time used the word man to include both genders, a practicethat, appropriately, is no longer acceptable.
36 2 User-Centered Systems Design: A Brief History

they do not care about dates when there are no flights—but the web site only worksin terms of calendar dates.
2.2.1.1 Classical Ergonomics
Classical ergonomics has also been called interface ergonomics. The interfacereferred to is the person/machine interface of controls and displays, and theprinciple contribution of the designer is the improved design of dials and meters,control knobs, and panel layout. Notably people are usually referred to as users oroperators in this literature. The expert’s concerns can extend beyond the design ofchairs, benches, and machinery to specify at least partly the optimum physicalwork environment, including temperature, humidity, and location of worksurfaces.
This classical approach started with the design of military equipment, but nowconsiders the design of items and workspaces in civilian contexts. This approachoften takes a consultancy mode, with advice usually being delivered in the form ofprinciples, guidelines, and standards. This can cause problems for two reasons:(1) classical ergonomists are only called in at the end of development and asked toadvise on the final product, rather than being involved throughout the developmentprocess—this means that ill-thought out design decisions with poor rationale mayalready be ‘‘baked into’’ the design, and no easy fix (or no fix at all) is possible;and (2) guidelines and prescriptions for design activity are usually generic, andlack context specific details. We return to this issue in Sect. 2.3.
Fig. 2.2 An example interface that attempts to ‘‘fit the user to the machine’’. In the top entry fieldthe user is expected to remove the domain rather than have the system do that (many sites, includingGMail, will let users login with either user-name or user-name@domain, this one does not)
2.2 Influential and Related Research Fields 37

2.2.1.2 Error Ergonomics
Error ergonomics is the study and explanation of human error in systems. The zerodefects approach assumes that human error is the result of inadequate motivation, c.f.the examples of accidents and error attribution including the official report on Kegworthnoted in the Appendix. Reason (1997) describes this as the person model or personapproach. This approach tends to result in campaigns for safety procedure training andfor safety oriented materials. These drives attempt to raise awareness and incentives forthe workers. Even during the World War I, where the work force was highly motivated,error ergonomists discovered that fatigue was a major cause of errors.
Similarly, the error data store approach, which forms a part of methods likeTHERP (Technique for Human Error Rate Prediction, Swain & Guttman, 1983)assumes that human error is inevitable (this is discussed further in Chap. 10). Thisapproach produces data banks of error probabilities for a variety of tasks executedunder various conditions. It is therefore necessary to predict the incidence andconsequences of human errors in any given situation. The results inform the designof systems in a way that minimizes the occurrence and effects of errors.
Fig. 2.3 In this interface the airline presents flight information using calendar dates. On the leftis the 3 day view, in the center is a 3 week view, and on the right is a year view. Whereas the usermost likely wants to view flight dates (with a pointer to the last, or next available flight, e.g.,something like ‘‘there are no flights available for the period you have selected, the nearestavailable dates are October xx 2013 and April yy 2014’’). This interface offers hints andencourages the user to search repeatedly rather than do the search for the user
38 2 User-Centered Systems Design: A Brief History

2.2.1.3 Systems Ergonomics
This approach was developed in the USA in the 1950s, and takes a more holisticapproach to understanding users and systems as they work in concert. That is, theuser and the system are seen as a single interacting system that is placed within awork context. Within this approach, system design involves parallel developmentof hardware and personnel issues, with training and selection issues considered.The ergonomist acts as an integral member of the design team, working throughoutthe life cycle to inform the system design. Therefore, in addition to the physical,behavioral and cognitive considerations of the finished product itself, the humanfactors expert (or ‘‘ergonomist’’) is involved in: (1) determining the required taskfunctions (by activity and task analysis in conjunction with the consideration of thetask requirements) and allocating the functions between the user and the system(2) the design of personnel subsystems, and (3) the design of job descriptions andjob support materials (e.g., manuals and training schemes).
The approach differs from user-centered design as the designers and humanfactors experts still view the user as just one part of the system, whereas user-centered design focuses more on the user’s needs and perspective than those of thesystem, tasks, and activities per se. In computer system development, for example,a systems approach would consider the task from a logical, syntactic perspectiveand then the computer system implementation issues with a view to allocatingfunction between the user and the computer system. A user-centered approachwould consider the processing capabilities of the human user and analyze tasksfrom the perspective of the user.
2.2.1.4 Cognitive Ergonomics/Cognitive Systems Engineering
Since the mid-1960s and the development of integrated circuits and third gener-ation computer systems, research has been carried out in user-centered aspects ofdata processing, management information systems, information systems, andinformation technology. The 1970s saw a rapid increase in the use of computer-based technologies, resulting in the body of knowledge about user-centered designmethods in areas such as Office Information Systems, industrial process controlsystems, and transportation systems. The role of people changed from one ofdirectly controlling machinery and equipment to one in which they were inter-acting with computer based technology. In industrial systems this was character-ized by a change in the operator’s role from one of hands-on control to one ofmonitoring and supervisory control. This change from doing to thinking meant thatit became more important to understand the way that people perceived problems,made decisions, and took actions. This led to the development of the field ofcognitive ergonomics, which is nowadays more frequently described as cognitivesystems engineering (CSE), or just cognitive engineering.
Originally developed in the 1970s and early 1980s (Hollnagel and Woods1983), cognitive systems engineering has continued to evolve since that period
2.2 Influential and Related Research Fields 39

(Hollnagel and Woods 2005; Woods and Hollnagel 2006). Cognitive ergonomics isconcerned with human–machine systems. Here, machine is taken to represent anyartifact that is designed for a specific purpose. There are technological aspects tothese systems, which are investigated from the perspective of how they affectuse. These systems are always embedded in a socio-technical context becausepeople are involved in the design, construction, testing, and use of these systems.Although CSE practitioners regard all systems as socio-technical systems, theyusually draw a distinction between the technological system, in which the tech-nology plays the central role in determining what happens, and the organizationalsystem, in which people mainly determine what happens.
CSE is concerned with applicable, approximate models of how people perceive,process, attend to, and use information to achieve their goals. Aimed at designers,instructors, and users, CSE draws on many areas of psychology that are oftentaught separately, such as planning, language, problem solving, learning, memory,and perception. However, CSE addresses how such processes work together. It isdifferent to the direct application of cognitive psychology in that it does not look atcognitive processes in isolation, but at their integration and how they are involvedin particular activities or situations. CSE also differs from cognitive psychology infocusing on theories which can predict behavior in what have been called realworld settings, rather than laboratory settings, although results from laboratorysettings are considered informative. Real world settings may require a moredetailed treatment of, for example, individual differences, uncertainty, ad hocproblem solving, and so on, than many other branches of psychology. CSE alsoplaces greater emphasis on the co-agency of action between the user and themachine, but, again, this is a difference in emphasis and these fields overlap to agreat extent.
CSE is thus largely concerned with applications in complex dynamic domains,such as aviation, industrial process control, healthcare, and so on. It normally startsby attempting to understand the issue at hand, using observation to try to under-stand the patterns of work. It then uses this understanding to guide the search toidentify what would be useful to support the types of work that have beenobserved. These insights are then used as a basis for (innovative) design, in par-ticipation with others, to support the work, the processes of change, and optimizingthe process.
2.2.2 Socio-Technical Systems Design
The term socio-technical systems was originally coined by Emery and Trist (1960) todescribe systems that involve a complex interaction between humans, machines, andthe environmental aspects of the work system—something that is true of mostsystems in the workplace. The corollary of this definition is that all of these factors—people, machines, and context—need to be taken into account when developing
40 2 User-Centered Systems Design: A Brief History

socio-technical systems using so-called socio-technical system design (STSD)methods such as ETHICS (Effective Technical and Human Implementation ofComputer-based Systems; Mumford 1983, 1995). In reality, these methods are morelike guiding philosophies than design methods that are usually associated withsystems engineering (Mumford 2006). In other words, the STSD methods tend toprovide a process and a set of guiding principles (e.g., Cherns 1987; Clegg 2000)rather than a set of detailed steps that have to be followed.
From its inception in the period immediately after World War II, by what isnow called The Tavistock Institute, until the present day, there have been severalattempts at applying the ideas of STSD, although these have not always beensuccessful (e.g., see Mumford 2006 for a critical review of the history of STSDmethods). Early work in STSD focused mostly on manufacturing and productionindustries such as coal, textiles, and petrochemicals. The general aim was toinvestigate the organization of work and to see whether it could be made morehumanistic, incorporating aspects such as the quality of working life. In otherwords, the idea was a move away from the mechanistic view of work that isusually associated with Taylor’s principles of scientific management, which lar-gely relied on the specialization of work and the division of labor.
The heyday of STSD was probably the 1970s. This was a time when there werelabor shortages, and companies were keen to use all means available to keep theirexisting staff. This was also the period where more and more computer systemswere being introduced into the workplace. Apart from the usual cultural and socialreasons, companies could also see good business reasons for adopting socio-technical ideas. As just one of many such examples, Digital Equipment Corpo-ration (DEC) had a family of expert systems that were developed using STSD(e.g., see Mumford and MacDonald 1989) to support the configuration and loca-tion of DEC VAX computers that saved the company tens of millions of dollars ayear (Barker and O’Connor 1989).
There was a downturn in the use of STSD in the 1980s and 1990s as leanproduction techniques and business process re-engineering approaches dominatedsystem development. STSD is, however, still widely advocated in the field of healthinformatics for the development of health care applications (e.g., Whetton 2005).Many medical systems are still never used because they introduce ways of workingthat conflict with other aspects of the user’s job, or they require changes to pro-cedures that affect other people’s responsibilities. By focusing on the underlyingwork structure, STSD approaches facilitate the development of medical systemsthat are acceptable to the users (Berg 1999, 2001; Berg and Toussaint 2003).
Socio-technical ideas pervade a lot of thinking around information systems,although they may not always be explicitly referred to as such (Avgerou et al.2004). The ideas appear in areas such as participatory design methods, computersupported cooperative work (CSCW), and ethnographic approaches to design.Recently, Baxter and Sommerville (2011) have outlined the need for socio-tech-nical systems engineering, which integrates the ideas that have been developed inthese different areas.
2.2 Influential and Related Research Fields 41

2.2.3 Cognitive Modeling and Programmable User Models
A cognitive model is an approximation of how people reason. The goal of acognitive model is to explain scientifically very basic cognitive processes, explainhow these processes interact, account for errors and breakdowns in these pro-cesses, and derive predictions about how those reasoning processes will proceedunder different conditions.
Cognitive modeling is a method developed from early work in the late 1950swhen psychologists realized that computational processes may be a good analog ofhuman reasoning processes: like humans, computers take input in the form ofsymbols, require memory for information storage, and manipulate those symbolswith algorithms to produce output. It was therefore proposed not only that humanreasoning could be an inspiration for thinking about computational processes butalso that computers may be a good way for us to simulate human reasoning andtherefore derive deeper understandings of how humans think (Newell et al. 1960;Newell and Simon 1972).
Cognitive models in the late 1960s, the 1970s, and the 1980s focused on howpeople solved problems symbolically: humans take input in and form symbols,require memory for information storage, and use algorithms to manipulate thosesymbols to produce output. The models were usually limited to one task (or onetype of task) and usually simulated reasoning in terms of what was going on in theuser’s mind. They addressed human information processing but did not addresshow information is taken in from the external world, how actions are performed inthe world, and the ways in which real world settings impact the pace at whichthose processes take place. Each model was essentially a micro-theory of howsome part of behavior occurred, and it was independent of other micro-theories.Over time, the need to integrate the micro-theories increased, which led to the ideaof unified theories of cognition (UTCs; Newell 1990).
These theories are implemented as cognitive architectures available as com-puter simulations that constrain how models (based on task knowledge) can per-form tasks in psychologically plausible ways. So, for example, often when humansperform two tasks simultaneously, the performance on one is affected by theperformance on the other. Cognitive models are essentially programs written in aspecific language to run on particular cognitive architectures. The models canperform complex tasks including perception, learning, reasoning, problem solving,remembering, decision making, proprioception (how people manage their bodiesin space), and ambulation (how people move around physical spaces).
There has long been an overlap between cognitive modeling and human–computer interaction. Drawing on these developments in psychological theory andin simulation modeling, design researchers started investigating the possibility ofbuilding models of how people reason and problem solve when using complexinterfaces, so that predictions about the pros and cons of different interface andinformation representation choices could be tested prior to investing in anyinterface or interaction development (e.g., Pew and Mavor 2007). Models force the
42 2 User-Centered Systems Design: A Brief History

designer to consider psychological factors systematically and explicitly as theymake usability predictions. Examples of some influential approaches in the worldof human–computer interaction are the Model Human Processor (MHP), GOMS(which stands for Goals, Operators, Methods, and Selection rules), the KeystrokeLevel Model (KLM) (see Card et al. 1983), and Programmable User Models(PUMs: Young et al. 1989). We will discuss this further in Chap. 11 on task analysis.
In recent years we have become more and more familiar with concepts suchas Artificial Intelligence (AI) and Machine Learning (ML). These fields shareroots with these cognitive modeling efforts. It has also been more recentlyacknowledged that cognitive models can combine symbolic and sub-symbolicprocesses–such as neural net modeling, for example. These hybrid models allow usto consider the characteristics and constraints of the brain’s architecture of neuronsand how the neural underpinnings of cognition impact cognitive processes(Busemeyer and Dieterich 2010) on both a symbolic and sub-symbolic and also anemergence level.
In the first part of the book we introduce several ideas and theories about theway that people behave. These ideas and theories are all encapsulated in cognitivearchitectures like ACT- R (Anderson 1993, 2007; Anderson et al. 2004) and Soar(Laird 2012; Newell 1990). There are still active research communities for both ofthese architectures. We introduced ACT-R in Chap. 1 and return to use it to helpsummarize design relevant user characteristics in Chap. 14.
2.2.4 User-Centered and Human-Centered Design
Through the 1980s, user-centered design (UCD, Norman and Draper 1986) cameto the fore. User-centered design involves focusing on the user’s needs, carryingout an activity/task analysis as well as a general requirements analysis, carryingout early testing and evaluation, and designing iteratively. As in the systemsapproach, this has a broader focus than the other approaches, but here there is agreater emphasis on the user and less of a focus on formal methods for require-ments gathering and specification, and a move from linear, rigid design processesto a more flexible iterative design methodology.
A related movement, Human-Centered Design (HCD), expanded the focus fromthe user in interaction with the system to considering how human capabilities andcharacteristics are affected by the system beyond direct interaction with theinterface or system itself. Humans should be seen as the most important element ofinformation systems and should be designed in. The people context of informationsystems must be studied and understood. In more recent work, dimensions such asgender, race, class, and power are also being explicitly considered with respect topeople’s interactions with interactive technologies.
This sensibility surfaces in three ways. First, consideration is given to the factthat the introduction of a new system engenders changes in the organization of
2.2 Influential and Related Research Fields 43

peoples’ behaviors and activities—that is in how people do things. These behav-ioral changes also affect others. So, user needs and demands, situational effects,and technological requirements are considered in tandem. The boundaries betweenwhich issues are defined as technical and which are organizational or social areconsidered to be malleable, not fixed, and need to be negotiated. This kind ofapproach is also prevalent in socio-technical systems design, described above.
Second, human-centered design addresses the fact that more and more systemsare being built where users do not interact directly with the technology as ‘‘users.’’Examples may be telecare assistive technologies—bed sensors which are pro-grammed to track automatically when a person gets out of bed and to raise analarm if they are not back in bed within a programmed time limit.
Finally, human-centered design tends to look to the longer-term effects, as wellas the immediate, task-related issues that occur at human-system ‘‘touchpoint’’moments. New applications of technology should be seen as the development ofpermanent support systems and not one-off products that are complete onceimplemented and deployed. In other words, the way in which technological changealters the organization of activities, and what are likely ongoing interventions,need to be considered.
User-centered (and human-centered) design methods tend to emphasize userparticipation in the design process for ideation and evaluation of design options. Inthis book, we have adopted the user-centered perspective, but we do not focus onthe interaction with the interface; our intention is to broaden the scope of analysisto the user + technology system in the task context. Hence we have adopted theterm ‘‘user-centered system design’’.
2.2.5 User Experience
User experience has been described as ‘‘a person’s perceptions and responses thatresult from the use or anticipated use of a product, system, or service’’ (ISO 9241-210). According to this definition, user experience goes beyond interface design toaddress a person’s emotions, beliefs, preferences, perceptions, physical and psy-chological responses, behaviors, and accomplishments that occur before, during,and after use. Three factors that influence user experience are considered—thesystem, the user and their characteristics, and the context of use of the technologyor system. User experience is often used interchangeably with usability but there isclearly a different focus that is signaled: usability and usability engineering focuson task related aspects (getting the job done); user experience and experiencedesign focus on and foreground the users’ feelings, emotions, values, and theirimmediate and delayed responses.
44 2 User-Centered Systems Design: A Brief History

2.2.6 Human–Computer Interaction
Human–computer interaction (HCI) is the study of interaction between people(user) and computers. Although often confused with interface design, the remit ofHCI is considerably broader. Further, while HCI draws insights from the foun-dations of interfaces design (design sciences and graphics), the roots of HCI lie inthe social sciences.
The Association for Computing Machinery (ACM), the major professionalassociation for computer science, has a subgroup, a special interest group (SIG) onComputer–Human Interaction (full name SIGCHI). SIGCHI was fundamental increating, nurturing, and defining HCI as a field. There are a number of excellenttexts that summarize the history and current activities in HCI that are shownbelow. SIGCHI (Hewett et al. 1996) defined HCI as:
… a discipline concerned with the design, evaluation and implementation of interactivecomputing systems for human use and with the study of major phenomena surrounding them.
It is worth noting that HCI as a field is constantly changing in response totechnological innovations and consequent emerging user needs and demands, andthis response is also updated in the ACM’s recommended curriculum where HCI isa core area of computer science (http://www.acm.org//education/curricula/ComputerScience2008.pdf).
In 2006, Suzanne Bødker (2006) outlined three ‘‘waves’’ in the development ofHCI as a field. The first wave drew insights from cognitive theory and humanfactors predominantly (see also Bannon 1991). We believe this perspective is stillrelevant while the perspectives of the second and third waves broaden HCI’s remit,increasing its influence. The second wave that developed through the late 1980sinto the early 2000s focused on groups working with collections of applications,drawing on theories of ‘‘situated action,’’ ‘‘distributed cognition,’’ and ‘‘activitytheory.’’ Scholars wrestled with how to capture the effects of context on activity.Bødker suggests that at this point ‘‘rigid guidelines, formal methods, and sys-tematic testing’’ were no longer the central focus as HCI researchers and practi-tioners moved to ‘‘proactive methods such as a variety of participatory designworkshops, prototyping, and contextual inquiries…’’. Finally, the third wave ofHCI acknowledges that computers are increasingly being used in private andpublic spheres, moving out of workplace contexts and into everyday life for ‘‘non-work, non-purpose, and non-rational’’ uses. This third wave necessarily addressesthe ‘‘expansion of the cognitive’’ to include emotional and esthetic aspects ofexperience, but also the pragmatic and cultural-historical.
A recent report summarizes current and future teaching in HCI and documents someof the changes that have occurred in the field since its beginnings in the early 1980s(Churchill et al. 2013). It is also worth noting that the role and involvement of the HCI
2.2 Influential and Related Research Fields 45

expert varies in design. The nature and level of involvement depends on the ethos of thedesign setting (the relative importance of usability issues and the degree of focus onsupporting the user). We will deal with more HCI research in upcoming chapters.
2.3 Standards, Principles, and Guidelines
All of the disciplines mentioned above have a goal of answering specific researchquestions using experimental and observational methods. For example a researchproject may ask:
• Is this chair comfortable over an 8 h working day?• Can the user get their task done with this application?• Is the font used in this interface readable?• Have we made the most important information in this interface stand out?• Is this interface esthetically appealing to the user demographic I am interested
in?• Will the user get the information they need in a timely fashion if there is an
emergency?
It is not always possible to carry out this research to answer questions of thissort oneself, so researchers turn to lessons learned from previous studies that arecodified as standards, principles, and guidelines that can be applied to the problemsituations they encounter.
Formal standards are generated by experts. They are intended to capture theagreed-upon wisdom and best practices of the field. Once created, they offer acommon vocabulary for designers/developers and, ideally, result in systems thatare more consistent for users, more easily inter-operable, and easier to integrate. Inthe design world, standards tend to be concerned with human adaptability andhuman variability. They are prescriptions for safe, acceptable designs, detailing thelimits outside which the user may suffer from stress, and accidents may be caused.Standards are and can become part of the law. For example, British Standard BS5330 deals with the relationship between sound levels in the workplace and theincidence of hearing loss.
Principles are prescriptive and specify general theoretical ideas that can underpindesign decisions. They do not specify the limits of human capabilities like standardsdo and tend to be more general than guidelines. (Note that although we make thisdistinction between guidelines and principles, the ergonomics literature generallydoes not.) Ideally, such principles are encapsulations of theoretical insights that havebeen derived from extensive data gathering and testing. For example, Norman(1988, 2013) outlines a set of principles that designers should consider, e.g., makingthings visible and providing feedback. Norman’s principles are based on his theory ofaction and interaction (noted further in Chap. 12). In particular, he emphasizes thatthe state of the system should be visible, that feedback on user’s actions should be
46 2 User-Centered Systems Design: A Brief History

provided, and that the system should be consistent across its subsystems. Similarly,Hedge (2003) offers the principles shown in Table 2.1.
Guidelines are prescriptive and offer some general guidance for making designdecisions. They tend to be more specific than principles, but still relate existing theoryand knowledge to either new design or established design problems (e.g., Brown1988; Mosier and Smith 1986; or the Apple design guidelines, available online).Below we offer a number of principles and guidelines that we have found useful in ourown work. In designing and evaluating systems we ask questions about the design’sfunctionality, usability, learnability, efficiency, reliability, maintainability, and utilityor usefulness. These are all discussed below.
(1) Functionality, what something does, is often the first thing to be consideredwhile consideration of usability issues is sometimes tacked on at the end ofdevelopment. This can lead to poorly designed artifacts that are hard to use but thatoffer new functionality. Sometimes this is enough. Sometimes it is not. Often, withmore thoughtful design, one can have both (Pew and Mavor 2007).
(2) Usability is a complex concept that can be defined in several ways. Forexample, Ravden and Johnson (1989) specify the following as all relevant to anassessment of whether a system or technology is usable or not:
Visual clarityConsistencyInformative feedbackExplicitnessAppropriate functionalityFlexibility and controlError prevention and controlUser guidance and support.
Eason (1984) offers the following definition of usability: the ‘‘major indicator ofusability is whether a system or facility is used.’’ However, this is patently not thecase as many devices that are used are hard to use. More usefully, Eason notes thatusability is not determined by just one or two constituents, but is influenced by a
Table 2.1 Principles for design to avoid exasperating users (Hedge 2003)
• Clearly define the system goals and identify potential undesirable system states• Provide the user with appropriate procedural information at all times• Do not provide the user with false, misleading, or incomplete information at any time• Know thy user• Build redundancy into the system• Ensure that critical system conditions are recoverable• Provide multiple possibilities for workarounds• Ensure that critical systems personnel are fully trained• Provide system users with all of the necessary tools• Identify and eliminate system ‘‘Gotchas!’’
2.3 Standards, Principles, and Guidelines 47

number of factors. These factors do not simply and directly affect usability, butinteract with one another in sometimes complex ways. He focuses on three ele-ments in particular that need to be taken account of explicitly: system function-task match, task characteristics, and user characteristics. Eason argues that theseare independent variables that lead to changes in user reaction and scope of usethat could be restricted, partial, distant, or constant.
In 1991 the ETSI (European Telecommunications Standards Institute) proposedtwo kinds of usability dimensions, those linked to performance and those related toattitude, where performance is measured objectively and attitude represents sub-jective dimensions (see http://www.etsi.org).
Although Shackel (1991) maintains the distinction between performance andattitudinal dimensions, he defines four distinguishable and quantifiable dimensionswhich can assume varying degrees of importance in different systems: effective-ness, learnability, flexibility, and attitude. These dimensions are not mutuallyexclusive in the sense that measures of effectiveness, for example, can at the sametime also give some indication of system learnability. However, they provide agood starting point.
Finally, Booth (1989) says that usability is usefulness, effectiveness, ease ofuse, learnability, attitude, and likeability. A useful system is one that helps usersachieve their goals. This more pragmatic approach is also taken by the Interna-tional Standards Organisation (ISO) in their 9241 series of standards: ‘‘theusability of a product is the degree to which specific users can achieve specificgoals within a particular environment; effectively, efficiently, comfortably, and inan acceptable manner.’’
(3) Learnability is how easy the system is to learn. This is affected by a numberof factors: for example, how complex it is, how well the system behaviors aresignaled in the form of feedback, how consistently the system behaves, how modechanges which may lead to different kinds of behavior are signaled to the user, andso on. Learnability can also be affected by how well the system is documented,either formally (though instructions) or informally through the availability of otherusers who may be more expert and can help the novice learner.
Learnability is also affected by how similar the new system is to other systemsthat the users know, because there may be transfer of knowledge from previoussystem use. How similar it is to previous systems not known to the user can also beimportant because, if there are other users, they may be able to help novices withnew systems if the new systems are similar to previous systems, and existingconsultants and teachers may be available if the systems are similar.
(4) Efficiency of a system can be measured through the use of resources such asprocessor time, memory, network access, system facilities, disk space, and so on.Programmers tend to focus mostly on efficiency, because it ensures that systemswork fast and do not frustrate users by keeping them waiting. Note that this is acomputer not a human centric view of efficiency. It is a relative concept in that onesystem can be evaluated as more efficient than another in terms of some parametersuch as processor use, but there is no absolute scale on which to specify anoptimum efficiency with regard to people’s experience of a system when carrying
48 2 User-Centered Systems Design: A Brief History

out a task. Optimum efficiency from a human-centric perspective requires con-sideration of the task, the task-context, and the characteristics of the users. Oneneeds to consider the users’ knowledge level and disposition, including theirmotivation. It is also important not to confuse efficiency with speed of execution;speed may be important, or it may also be ultimately inefficient.
In the early days of computers, when programs were small and computer timewas relatively expensive, efficiency of computer time was considered to be ofparamount importance, and it probably was. With today’s faster machines,designers need to consider the effects of choices upon all resources and the con-sequences of different kinds of efficiency. For example, when considering Internetsites, slow download times are an efficiency issue caused by site/application designand connectivity bandwidth. Users can get frustrated if they are in a hurry tocomplete a transaction. However, the opposite also occurs—when a transaction istoo efficient, users can get disoriented and dissatisfied (e.g., one-click paymentswithout asking the user to review orders before placement). Thus efficiency mustbe calculated in terms of technical efficiency that matches user efficiency expec-tations for the task at hand.
(5) Reliability is concerned with the dynamic properties of the eventual systemand involves the designer making predictions about behavioral issues. We need toknow whether the system is going to be complete (in the sense that it will be ableto handle all combinations of events and system states), consistent (in that itsbehavior will be as expected and will be repeatable, regardless of the overallsystem loading at any time, and across components of the system), and robust(when faced with component failure or some similar conflict, for example, if theprinter used for logging data in a chemical process-control plant fails for somereason, the whole system should not crash, but should instead follow a policy ofgraceful degradation).
As systems get larger the problems of ensuring reliability escalate. For safetycritical systems where this factor is most important, various techniques have beendeveloped to help overcome limitations in design and implementation techniques.For example, in a system used in a fly-by-wire aircraft in which the controlsurfaces are managed by computer links rather than by direct hydraulic controls,the implementation will be by means of multiple computers, with a strong like-lihood that each will have been programmed by a separate development team andtested independently. Any operational request to the control system will then beprocessed in parallel by all the computers and only if they concur with therequested operation will it be carried out.
(6) Maintainability is how easy a system is to maintain and upgrade. Assystems get larger and more costly, the need for a life-long time in serviceincreases in parallel. To help achieve this, designs must allow for future modifi-cation. Designers need to provide future maintainers with mental models of thesystem and the design rationale so that future maintainers can gain a clearunderstanding of the system and how it is put together (Haynes et al. 2009).Development of modular designs helps, but larger systems present further prob-lems. While small systems can be modeled with a structural model (i.e., laying out
2.3 Standards, Principles, and Guidelines 49

the component parts of the system), as systems get larger it is important to developfunctional models that simulate what the component parts do themselves and ininteraction with each other.
(7) Utility/Usefulness is an important concept always to consider whendesigning systems. Is it ultimately useful for users and how long is its likelyusefulness? Is this something that will become an everyday system or an infre-quently used system? When it is used, how useful do users find it or are there otherworkaround that users would rather engage with? Usefulness can be measuredboth in terms of how often and in what way something is used, but can also bemeasured with subjective scales like ‘how much do you like this?’ People may findsomething useful because it makes them feel good about themselves rather thanbecause it is an efficient, reliable system with a highly usable interface from ourperspective as designers.
2.4 Summary
In this chapter we have provided an overview of research areas that have con-tributed to our understanding of user-centered design. User-centered design drawson multiple sources of knowledge to support creating systems that are based onusers’ abilities, capabilities, and task. What all these approaches have in commonis the perspective that when designing we need to consider variation and similarityin the contexts, people, and tasks that characterize different design situations andsettings. A one-size-fits-all approach seldom works to achieve the most productive,safe, and enjoyable design solution. We summarize this perspective by invitingyou to remember that design is about considering particular people doing par-ticular tasks in a particular context—our focus in this book is people doing tasksusing technologies, but this perspective can be more generally applied.
It is worth highlighting at this point that, in order to comply with ISO standard9241-210 (which now refers to Human-Centered Design, rather than User-Cen-tered), the following four activities are now requirements (previously they wererecommendations):
1. Understanding and specifying the context of use (including users, tasks,environments)
2. Specifying the user requirements in sufficient detail to drive the design3. Producing design solutions that meet these requirements4. Conducting user-centered evaluations of these design solutions and modifying
the design to take into account the results.
Our aim in this book is to provide you with the foundations that will help you tomeet these requirements. In the first part of the book we focus on the capabilities ofusers. We categorize these capabilities into anthropometric, behavioral, cognitive,and social aspects. Although we separate issues into these categories, we
50 2 User-Centered Systems Design: A Brief History
acknowledge that the boundaries between them are somewhat blurred: our bodiesaffect how we act, and our behaviors affect how we participate socially. Thus, allthese factors interact. A key skill for effective human-centered system design is tounderstand which factors are central or primary in any design situation and whichare peripheral or secondary.
In the latter part of the book we provide introductions to some methods that canbe used to guide design and evaluation. These include task analysis, evaluationmethods, and the notation of cognitive dimensions. These methods differ in termsof their preferred unit of analysis, the kinds of data collected, and the analyses thatare conducted. We finish the book by providing a framework that will allow you tointegrate your knowledge of the user with the methods in a systematic way.
2.5 Other Resources
There are a lot of helpful texts that can give you some background to the field ofuser-centered system design. Some of the texts that we have cited above areparticularly helpful. For more on the history of this field read this book:
Shachtman, T. (2002). Laboratory warriors: How Allied science and technology tipped thebalance in World War II. New York, NY: HarperCollins.
A classic text that laid many of the basics out for the field of user-centeredsystems design is Don Norman and Steve Draper’s 1986 text:
Norman, D. A., & Draper, S. W. (Eds) (1986). User centered system design: NewPerspectives on human–computer interaction. Hillsdale, NJ: Erlbaum.
Jack Carroll’s summary of Human Computer Interaction in the Encyclopedia ofHuman Computer Interaction is a great place to start if you want an overview:
Carroll, J. M. (2009). Human computer interaction (HCI). In Encyclopedia of Human–Computer Interaction. M. Soegaard & R. F. Dam (Eds.). Aarhus, Denmark: The Inter-action Design Foundation.
Two good textbook style overviews are:
Sharp, H., Rogers, Y., & Preece, J. (2011). Interaction design: Beyond human–computerinteraction (3rd ed.). Chichester, UK: John Wiley and Sons Ltd.
Shneiderman, B., & Plaisant, C. (2009). Designing the user interface: Strategies foreffective human–computer interaction (5th ed.). Reading, MA: Addison Wesley.
One of the best introductions to the practice, the how-to’s, of user-centered designis by Elizabeth Goodman, Mike Kuniavsky, and Andrea Moed. They cover basictechniques and methods that will help you design better interactions. They also offercase studies and examples that you can compare to your own design situations:
Goodman, E., Kuniavsky, M., & Moed, A. (2012). Observing the user experience:A practitioner’s guide to user research. San Francisco, CA: Morgan Kaufman
2.4 Summary 51
For more formal methods and models of interaction programming, read HaroldThimbleby’s text Press On:
Thimbleby, H. (2007). Press on—Principles of interaction programming. Cambridge,MA: MIT Press.
If you want to know more about field based and participatory requirementsgathering, a well known method is Contextual Design. This is described in this text:
Beyer, H., & Holtzblatt, K. (1997) Contextual design: Defining customer-centered sys-tems. San Francisco, CA: Morgan Kaufmann.
Finally, cognitive modeling can offer enormous gains when you are thinkingabout how users think. An excellent introduction to this area of research andapplication is:
Gray, W. D. (Ed.). (2007). Integrated models of cognitive systems. New York: OxfordUniversity Press.
2.6 Exercises
2.1 Consider a smartphone, either a specific one or a composite one, and considerthe human factors of using it. What are the issues that each field of HCI,human factors, and cognitive ergonomics address?
Write short notes (about one side of a page in total) noting the issues onthese three types of analyses.
2.2 Pick a company’s web site or a university department’s web site. Summarizein note form how each of the major fields noted in this chapter would analyzeit and its users. Note what would be the outputs and typical recommendations.Which approach would you prefer to apply to the web site you choose? Notethe relative value and the absolute value of each. That is, which gives the bestresults for the amount of inputs, and which gives the best value without regardto cost?
2.3 When you go home tonight, take a look at your kitchen. Look at all the displaysin the kitchen and summarize what information they contain and when youwould use that information. Look at the layout of the kitchen and think aboutwhether things are placed in the most convenient place to make your move-ments through the kitchen when you are cooking as efficiently as possible.Make your favorite snack and draw a picture of how you move through thekitchen. Note how the kitchen can be improved based on your analysis,including both no-cost and expensive changes. This exercise is designed tomake you think more deeply about the physical, cognitive, behavioral, andinformation issues that go into how optimized your kitchen is for you to use.
2.4 Analyze Hedge’s (2003) set of design principles in Table 2.1. These principlesarose out of installing a popular operating system.
52 2 User-Centered Systems Design: A Brief History
(1) For each principle, note the support it has in general, when it would betrue, and exceptions where it would not be true.
(2) Comment on the usefulness and usability of the principles as a set.(3) Compare these principles with another set of HCI design principles that
you find (and note and reference).
References
Anderson, J. R. (1993). Rules of the mind. Hillsdale, NJ: Erlbaum.Anderson, J. R. (2007). How can the human mind exist in the physical universe?. New York, NY:
Oxford University Press.Anderson, J. R., Bothell, D., Byrne, M. D., Douglass, S., Lebiere, C., & Qin, Y. (2004). An
integrated theory of the mind. Psychological Review, 111(4), 1036–1060.Avgerou, C., Ciborra, C., & Land, F. (2004). The social study of information and communication
technology. Oxford, UK: Oxford University Press.Bannon, L. (1991). From human factors to human actors: The role of psychology and human–
computer interaction studies in systems design. In J. Greenbaum & M. Kyng (Eds.), Design atwork: Cooperative design of computer systems (Vol. 25–44). Hillsdale, NJ: Erlbaum.
Barker, V. E., & O’Connor, D. E. (1989). Expert systems for configuration at Digital: XCON andbeyond. Communications of the ACM, 32(3), 298–318.
Baxter, G., & Sommerville, I. (2011). Socio-technical systems: From design methods toengineering. Interacting with Computers, 23(1), 4–17.
Berg, M. (1999). Patient care information systems and healthcare work: A sociotechnicalapproach. International Journal of Medical Informatics, 55(2), 87–101.
Berg, M. (2001). Implementing information systems in health care organizations: Myths andchallenges. International Journal of Medical Informatics, 64(2–3), 143–156.
Berg, M., & Toussaint, P. (2003). The mantra of modelling and the forgotten powers of paper: Asociotechnical view on the development of process-oriented ICT in health care. InternationalJournal of Medical Informatics, 69(2–3), 223–234.
Bødker, S. (2006). When second wave HCI meets third wave challenges. In A. Mørch,K. Morgan, T. Bratteteig, G. Ghosh, & D. Svanaes (Ed.), NordiCHI Nordic Conference onHuman-Computer Interaction October 14–18, (pp. 1–8). Oslo, Norway.
Booth, P. (1989). An introduction to human-computer interaction. Hove, UK: Erlbaum.Brown, C. M. L. (1988). Human-computer interface design guidelines. Norwood, NJ: Ablex.Busemeyer, J. R., & Dieterich, A. (2010). Cognitive modeling. Thousand Oaks, CA: Sage
Publications.Card, S. K., Moran, T., & Newell, A. (1983). The psychology of human-computer interaction.
Hillsdale, NJ: Erlbaum.Cherns, A. (1987). Principles of socio-technical design revisited. Human Relations, 40(3),
153–162.Churchill, E., Bowser, A., & Preece, J. (2013). Teaching and learning human-computer
interaction: Past, present, and future. Interactions, 20(2), 44–53.Clegg, C. (2000). Sociotechnical principles for system design. Applied Ergonomics, 31, 463–477.Eason, K. (1984). Towards the experimental study of usability. Behaviour and Information
Technology, 3(2), 133–143.Emery, F. E., & Trist, E. L. (1960). Socio-technical systems. In C. W. Churchman & M. Verhulst
(Eds.), Management science models and techniques (Vol. 2, pp. 83–97). Oxford, UK:Pergamon.
2.6 Exercises 53

Haynes, S. R., Cohen, M. A., & Ritter, F. E. (2009). Designs for explaining intelligent agents.International Journal of Human-Computer Studies, 67(1), 99–110.
Hedge, A. (2003). 10 principles to avoid XP-asperation. Ergonomics in Design, 11(3), 4–9.Hewett, T. T., Baecker, R., Card, S., Carey, T., Gasen, J., Mantei, M., et al. (1996). ACM SIGCHI
curricula for human-computer interaction. New York, NY: Association for ComputingMachinery. http://sigchi.org/cdg/index.html
Hollnagel, E., & Woods, D. D. (1983). Cognitive systems engineering: New wine in new bottles.International Journal of Man-Machine Studies, 18, 583–600.
Hollnagel, E., & Woods, D. D. (2005). Joint cognitive systems: Foundations of cognitive systemsengineering. Boca Raton, FL: CRC Press.
Holloway, W. (1991). Work psychology and organizational behaviour: Managing the individualat work Thousand Oaks. CA: Sage.
Laird, J. E. (2012). The Soar cognitive architecture. Cambridge, MA: MIT Press.Mosier, J. N., & Smith, S. L. (1986). Application of guidelines for designing user interface
software. Behaviour and Information Technology, 5, 39–46.Mumford, E. (1983). Designing human systems for new technology—The ETHICS method.
Retrieved March 10, 2014, from http://www.enid.u-net.com/C1book1.htmMumford, E. (1995). Effective systems design and requirements analysis: The ETHICS method.
Basingstoke, UK: Macmillan Press.Mumford, E. (2006). The story of socio-technical design: reflections in its successes, failures and
potential. Information Systems Journal, 16, 317–342.Mumford, E., & MacDonald, W. B. (1989). XSEL’s progress: The continuing journey of an
expert system. New York, NY: Wiley.Newell, A. (1990). Unified theories of cognition. Cambridge, MA: Harvard University Press.Newell, A., Shaw, J. C., & Simon, H. A. (1960). Report on a general problem-solving program
for a computer. In International Conference on Information Processing, (pp. 256–264).UNESCO: Paris.
Newell, A., & Simon, H. A. (1972). Human problem solving. Englewood Cliffs, NJ: Prentice-Hall.
Nickerson, R. (1969). Man-Computer interaction: A challenge for human factors research.Ergonomics, 12: 501–517. (Reprinted from IEEE Transactions on Man-Machine Systems,10(4), 164–180).
Norman, D. A., & Draper, S. W. (Eds.). (1986). User centred system design. Hillsdale, NJ:Erlbaum.
Norman, D. A. (1988). The psychology of everyday things. New York, NY: Basic Books.Norman, D. A. (2013). The design of everyday things. New York, NY: Basic Books.Pew, R. W., & Mavor, A. S. (Eds.). (2007). Human-system integration in the system development
process: A new look. Washington, DC: National Academies Press. http://books.nap.edu/catalog.php?record_id=11893. Accessed 10 March 2014.
Ravden, S., & Johnson, G. (1989). Evaluating usability of human-computer interfaces: Apractical method. Chichester, UK: Ellis Horwood.
Reason, J. (1997). Managing the risks of organizational accidents. Aldershot, UK: Ashgate.Shackel, B. (1991). Human factors for informatics usability book contents. In B. Shackel & S.
J. Richardson (Eds.), Usability—context, framework, definition, design and evaluation (pp.21–37). New York, NY: Cambridge University Press.
Swain, A. D., & Guttman, H. E. (1983). A handbook of human reliability analysis with emphasison nuclear power applications. Washington, DC: US Nuclear Regulatory Commission.
Whetton, S. (2005). Health informatics: A socio-technical perspective. South Melbourne,Australia: Oxford University Press.
Woods, D. D., & Hollnagel, E. (2006). Joint cognitive systems: Patterns in cognitive systemsengineering. Boca Raton, FL: CRC Press.
Young, R. M., Green, T. R. G., & Simon, T. (1989). Programmable user models for predictiveevaluation of interface designs. In Proceedings of CHI’89 Conference on Human Factors inComputing Systems, (pp. 15–19). ACM Press: New York, NY.
54 2 User-Centered Systems Design: A Brief History

Part IIDesign Relevant User Characteristics:
The ABCS

Chapter 3Anthropometrics: Important Aspectsof Users’ Bodies
Abstract This chapter addresses factors that arise from basic characteristics of thehuman body. While bodies vary in their size, shape, capabilities, and limitations,there are some common factors that are shared and some general guidance thatwe can apply to design better interfaces and systems. This is a broad topic: theinfluence of bodies on usability applies to all systems, and is illustrated withexamples from desktop, laptop, mobile, and handheld systems. After briefly pro-viding an overview of the issues involved, this chapter covers the importance ofthe physical setup for computers. We also introduce and discuss the importance oftouch and tactile feedback, better known as haptic perception. Haptic perceptionhas become increasingly important with the widespread uptake of touch screendevices and gaming interfaces. We illustrate the importance of haptic perceptionby considering how people interact with a wide range of devices and systems. Thechapter concludes with some implications of the need to consider anthropometricfactors when designing interactive systems.
3.1 Introduction
People have bodies. Human bodies have certain characteristics and capabilities:they take up space and are designed to move in certain ways. This means that theextent of our reach when static and our range of motion are limited. Human bodiesare designed for certain kinds of movement—we crawl, walk, run, and reach forthings. Thanks to a complex sensorimotor system, we can perceive and manipulateobjects, and to issue and sense tactile feedback. Human bodies also need certainforms of nourishment and can become fatigued. Understanding the characteristicsand capabilities of the human body can both inspire and constrain design options.
Obviously, users need their bodies to interact with interfaces. In some cases thepath from the user’s intention to the desired action appears effortless and error free.These situations encourage us to forget the situations where the user is tired, thetiming of the task is demanding, or the user has difficulty performing the required
F. E. Ritter et al., Foundations for Designing User-Centered Systems,DOI: 10.1007/978-1-4471-5134-0_3, � Springer-Verlag London 2014
57

physical actions. Designers of interfaces and of larger systems need to giveappropriate consideration to the user’s body in order to take advantage of itscapabilities and to mitigate against the limitations and constraints it imposes. Thesize of the cockpit in a Formula 1 racing car, for example, is limited for obviousreasons. This restricts the things that the driver can physically reach to control thecar. The steering wheel in Formula 1 cars (like that of the Caterham 2012 For-mula 1 car shown in Fig. 3.1) has therefore evolved into an interface that bringswithin easy reach all of the systems that drivers need to interact with.
People vary and their physical dimensions and capabilities also vary. Figure 3.2,for example, shows a suit designed to mimic the effects of age when worn byyounger people. The suit leads users to modify how they walk, how they lookaround the environment, and how they see. Similarly, the gloves and goggles inFig. 3.3 can be used to mimic the effects of arthritis and poor vision, which willaffect how people interact with computer technology.
The appearance or structure of a physical object can suggest how it should beused, or support a particular use. These physical affordances—after Gibson(1979)—are useful, because they make it easier for people to determine how to usethe object: handles on doors, for example, afford pulling. Some affordances build
Fig. 3.1 The steering wheelfrom the Caterham 2012Formula 1 car. The wheelcontains multiple controls toadjust traction, suspension,and aerodynamics(reproduced with permissionof Caterham F1 Team, UK)
Fig. 3.2 Outfits designed toreproduce the effects of ageon younger users (reproducedwith permission from NathanFried-Lipski and the MITAgeLab)
58 3 Anthropometrics: Important Aspects of Users’ Bodies

on existing knowledge—you learn to double click using a mouse button, forexample—but the most powerful and primitive affordances support direct inter-action with the object. Norman’s (1988, 2013) book provides many examples ofuseful affordances, as well as several that are confusing or even useless, such asputting a pull handle on a door that you have to push open!
The objects in computer interfaces that can be manipulated (clicked, dragged,rotated, and so on) by the user should also provide appropriate affordances. This iswhy buttons, for example, should look like they need to be pressed (or clicked on)even if they appear on a flat surface. Similarly, the use of a hand icon as a mousecursor in applications such as Adobe’s Acrobat Reader is designed to afford theaction of scrolling through a document on the display.
3.2 Physical Aspects of Interaction
There are two main anthropometric issues that need to be considered when designinginteractive systems. The first relates to how the users will interact with the system:will they be sitting (which is still most prevalent) or standing (which is becomingmore prevalent)? Note, however, that as computational artifacts are increasinglyembedded in our physical environment, the repertoire of possible body positions iscorrespondingly increasing. The second, which is becoming increasingly important,relates to how much weight the user can carry and support if the device or artifact isintended to be carried by the user, as with mobile and portable devices.
3.2.1 Posture
The posture adopted by users when they interact with systems is important. If usersadopt an incorrect posture or stay still too long, this can lead to performance
Fig. 3.3 Easy to create modified gloves (they have wooden popsicle sticks in the fingers) andgoggles (with paint on them) that give the user restricted hand mobility and restricted visionrespectively
3.1 Introduction 59

problems, such as reduced attention to the task over time, or an increase in thenumber of errors. It can also lead to health issues including eye-strain, back pain,and upper limb disorders (ULDs).
ULDs are quite common. Many people who use display screen equipmentsuffer from ULDs. ULDs include conditions such as repetitive strain injuries (RSI),cumulative trauma disorder, and occupational overuse syndrome. Although mostof these conditions are not indicative of any serious ill health, it makes sense to tryto avoid them as far as possible.
ULDs are aches, pains, tension, and disorders that involve any part of the armfrom the fingers to the shoulder, or the neck. They include problems with the softtissues, muscles, tendons, and ligaments, as well as with the circulatory and nervesupply to the limbs. ULDs are often caused or exacerbated by work and particu-larly repetitive work.
There are several risk factors that contribute to the chance of suffering fromULDs. These include task-related aspects, such as uncomfortable working pos-tures, continuous use of excessive force, and long tasks. Other risk factors includeorganizational aspects, such as a poor working environment (lack of temperatureregulation, poor lighting, and so on) and job demands, such as time pressures, anda lack of rest breaks or task rotation. There are suggestions that lack of control ofone’s time or task exacerbates the situation, encourages reporting of the problem,or helps accelerate the process. In addition, some people are more susceptible tosome of these risks than other people. It is now a legal requirement in mostcountries to make sure that workstations are appropriately set up for people whoregularly use such equipment for extended periods of time, as shown in Fig. 3.4. Itis important to make sure that the keyboard is placed appropriately with respect tothe hands and the wrists, that the display is positioned correctly, that the display isappropriately illuminated, and that the angle of the head, neck, back, hips, and feetwhen using the workstation are considered.
The recommended sitting posture is to be more upright and avoid pressure onwrists, hands, and elbows. Posture will naturally change across tasks, however,with some people leaning forward to type on a touch screen device, for example,but leaning back to read from the screen of the same device. English and Andre(1999) identified several postures that should generally be avoided; some of the at-risk postures observed during web browsing are shown in Fig. 3.5.
There are situations where people deliberately choose to ignore the risks,however. Hand-held game consoles, for example, include information about thepotential risks of extended use in their instruction manuals. In spite of this, somepeople persist in playing games for excessive periods of time without a break, andoften hunched over the console.
It is most important to be aware of the risks and to take appropriate steps tomitigate the effects of these risks. The UK’s Health and Safety Executive devel-oped the Assessment of Repetitive Tasks (ART) tool to help in this area. ART isdesigned to assist health and safety inspectors in assessing those repetitive tasks
60 3 Anthropometrics: Important Aspects of Users’ Bodies

Feet flat on foor or supported
0o
15o
30 o
Position display about arm's length and with line of sight shown
Dis
play
squ
are
to li
ne o
f vis
ion
and
to a
void
gla
re
Arms and legs 90o
from your spine
Go
od
ch
air
wit
ho
ut
pre
ssu
re p
oin
ts o
n
bac
k o
f th
igh
s an
d lu
mb
ar s
up
po
rt
Avoid glare,direct and indirect
Support wrists when not typing
Wrists in line with forearm (not bent)
Shoulders relaxed
Do not hold phone with shoulder
No lip on chair
18-24 inches
Fig. 3.4 Useful information about how to arrange a computer display and work area to avoidwrist and upper limb disorders (ULDs). Contains public sector information published by theHealth and Safety Executive and licensed under the Open Government Licence v1.0
Fig. 3.5 Postures to be avoided when web browsing. Placement of non-mousing (e.g., left)elbow on chair armrest or workstation desk, results in direct contact pressure (reproduced withpermission from English and Andre 1999)
3.2 Physical Aspects of Interaction 61

that involve the use of upper limbs. It focuses on the common risk factors thatcontribute to the development of upper limb disorders in situations that involverepetitive work. The tool is freely available from the Health and Safety Execu-tive’s website (http://www.hse.gov.uk/msd/art-tool.htm).
3.2.2 Load Bearing
More and more people are using portable and mobile devices (phones, tablets, andso on). With these devices the user often has to support the weight of the display(and hence the interface) during interaction. Normally the user will have to carrythe device around with them too. The net result is that the user must be able tosupport both the weight of the device when using it and the weight of the devicewhilst carrying it around for extended periods of time.
At this point, all we can encourage you to do is to note what the device weighs,to study existing standards and similar devices, and to observe and talk to users.Simply asking users to complete a survey about the device is unlikely to generatemuch useful data, because they may not be able to judge weights abstractly or toconsider their desire to carry an object without knowing and understanding itsfunctionality. It probably makes more sense to give the devices to the users andobserve how they explore and use them. If the device is for regular, routine use,you should observe them over a realistic period of time that includes the variety ofenvironments in which the device will be used. The technology and functionality israpidly changing in this area, which may change what users think is an acceptableweight to carry.
3.3 Interacting with Haptic Devices
Touch is usually regarded as the third most important sense after vision andhearing (which are both covered in the next chapter). What most people refer to asthe sense of touch, however, is really a combination of two senses: the skin (orcutaneous sense) and kinesthesis (Loomis and Lederman 1986). The cutaneoussense is responsible for creating the feeling that the outer surface of the humanbody has been stimulated, which it does using receptors in the skin together withthe associated nervous system. Kinesthesis (or the kinesthetic sense) generates anawareness of static and dynamic body posture based on information coming fromthe muscles, joints, and skin (afferent information), along with a copy of the signalsent to the motor system (an efferent copy). The efference copy is used to helpdistinguish between information coming from within the body and informationcoming from outside the body, and helps to explain why you do not laugh whenyou tickle yourself (there is a match between the afferent information and theefference copy)!
62 3 Anthropometrics: Important Aspects of Users’ Bodies
The mechanisms for the two senses are separate, but functionally they are muchmore difficult to separate, and they usually operate in tandem. For this reason, thetwo senses are associated with three types of tactual perception:
• Tactile perception, which is solely mediated by changes in cutaneous stimula-tion. Tactile perception always occurs within the context of a particular staticposture, and may depend on that posture.
• Kinesthetic perception, which is (mostly) mediated by variations in kinestheticstimulation. This includes situations where the cutaneous sense only indicatescontact with the stimulus, and does not provide any spatial or textural infor-mation about the stimulus.
• Haptic perception, which is the most common type of tactual perception. Itinvolves using information from the cutaneous sense and kinesthesis to under-stand and interpret objects and events in the environment.
In the rest of this section, when we refer to touch, we will be referring to hapticperception, unless otherwise specified. Most devices that are used to provide input tocomputer-based systems make use of haptic perception. In general, however, mosthaptic devices only support interaction using the hands or fingers, even though userscould (theoretically, at least) use any part of their body. There is, however, agrowing number of devices that support input using the feet, such as the highlysophisticated da Vinci surgical system1 which has been successfully used in cancersurgery. The feet are also used to move around in virtual reality systems. The mouthand other parts of the body tend to be supported somewhat less, but they can becritical in interfaces for people with disabilities who cannot use their limbs, andincreasingly for the military in unusual situations or circumstances.
In this section we will focus our discussions on how people use hands andfingers to interact with systems. These discussions will consider the most commontypes of haptic devices that support interaction with computer-based systems. Thefuture may include other devices, such as pens (e.g., Tian et al. 2008), multi-touchinterfaces on a wider variety of objects (e.g., Jiang et al. 2012), or gestures, butthese could be analyzed in a similar way.
3.3.1 Physical Keyboards
Physical keyboards—we use the term here to distinguish them from the softkeyboards that are used on touch screen devices—have a haptic interface. The feelof the key clicks provides you with haptic feedback about whether a keypress hasbeen detected (and hence whether the corresponding character will appear on theassociated display screen). Sometimes people will complain about the feel of aparticular keyboard. Usually they are referring to the position and shape of the
1 http://www.intuitivesurgical.com/products/davinci_surgical_system/
3.3 Interacting with Haptic Devices 63

keys but they may also be describing a keyboard that requires too much or too littlepressure to operate the keys. You may also hear users talk about a soggy feel to thekey action, which means that they cannot clearly tell whether a particular key hasbeen pressed or not, based on the key’s motion.
Typing is still the most common way of entering data into computer-basedsystems (including mobile devices). It is thus useful to briefly consider typing inmore detail and to identify some of the regularities of behavior in this area. Cardet al. (1980, 1983) provide a good overview of the general issues of human typing,whilst Salthouse (1986) focuses on transcription typing.
Users’ typing speeds range from a few words per minute (wpm) to over100 wpm, although there is often a trade-off between speed and accuracy. It issometimes said, for example, that expert typists achieve speeds of 90 wpm with90% accuracy. The differences in speed are primarily due to practice—those thattype more tend to get faster at it, using two hands rather than single-finger or hunt-and-peck typing styles.
Typical typing speeds tend to occupy relatively narrow ranges for differentcategories of typist: novices can generally type at least 10 wpm; good journeymanprogrammers are closer to 30–60 wpm; and users whose jobs includes largeamounts of typing are more likely to achieve rates above 60 wpm. We canextrapolate from these numbers to find keystroke times of about 750 ms perkeystroke for slow typists ranging down to 125 ms per keystroke for fast typists.These numbers are useful for predicting reaction times and for working out howfast the computer has to respond.
Many users can type some keys faster than others. For example, the ‘‘n’’ key(average typing time 221 ms) takes longer to type than the space bar (155 ms), asshown in Fig. 3.6 (Card et al. 1983, p. 62). This result suggests that when youdesign interfaces you should consider associating keys that are faster to type withactions that have to be performed frequently. There are exceptions to this rule,however, which include situations where you deliberately want to slow down theuser so that they have time to consider the effect of their actions (such as in safetycritical systems), and where memorability is important.
Keyboard users make errors. Salthouse’s (1986) review of transcription typistsreports error rates in the range 1–3.2%, noting four types of observable errors: (1)substitution of letters (‘‘work’’ for ‘‘word’’), (2) intrusions (‘‘worrd’’ for ‘‘word’’),(3) omissions (‘‘wod’’ for ‘‘word’’), and (4) transpositions (‘‘wodr’’ for ‘‘word’’).These categories are not exclusive, and sometimes may be mistaken for each other.Only about half (40–70%) of these errors are caught by the typist and can accountfor 35% of expert typists’ time (Landauer 1987b, p. 151).
The Typist model (John 1996) summarizes many of the behavior regularities oftyping noted above. Typist can be used to explain how typing occurs and howerrors arise. Its structure and behavior can also be examined to identify whereinterfaces for typing could be improved, and where changes would not make adifference. In transcription typing, for example, providing the typists with anadditional paragraph of material to be typed is not useful because transcriptiontypists do not look that far ahead.
64 3 Anthropometrics: Important Aspects of Users’ Bodies

3.3.2 Touch Screens
Probably the best-known and most widely used devices that support haptic inputare touch screens. These are now commonplace on many mobile devices (smart-phones, tablet computers, and so on) and in information and ticket sales kiosks.Feedback for these devices is mostly provided through visual and audio channels.Figure 3.7 shows two examples of touch screen applications, one of which is static(an e-voting system), and the other highly portable (a handheld GPS satellitenavigation system).
Touch screen displays are electronically more complicated than normal dis-plays because they use either pressure or electrical conductance to determinewhere the screen is being touched. If the interface is well designed, it will be veryclear to the user what actions they have performed on the screen (selection,scrolling, and so on), and the interface will be easy to use, and easy to learn to use.There are many examples of videos online, for example, that show young childrenfiguring out how to use touch screen devices without any instruction.
The end of the finger is of the order of ten times the size of the normalarrowhead cursor that you see on most systems. You will need to take this, andindividual variations in finger size, into account when designing touch screeninterfaces to avoid fat finger problems. These occur when people touch more thanone button at a time, or accidentally touch the wrong button. It has been calculatedthat about 9% of clicks on adverts on mobile devices are accidental!2 So, if youneed to accommodate many buttons on a small touch screen, you will need to havea deeper understanding of how the technology works and the ways in which usersuse small buttons.
213 188 186 149 162 128 149 136 149 136 164 140 164 140 155 129 151 124 131 156
180 140 196 147 222 138 201 135 201 135 175 120 175 120 162 133 194 141
162 241 238 153 197 153 197 160 157 132 157 132 249 164 235 159
155
Key
SameHand
AlternateHand
All keystrokes average: 155 ms
Q W E R T Y U I O P
AS D F G H J K L
XZ C V B N M , .
Space Bar
Fig. 3.6 The time (in milliseconds) to type different keys on the keyboard based on155,000 keystrokes. Times taken from Kinkead (1975) cited in Card et al. (1983). Same handtimes are for keys typed with the same hand; alternate hand is for keys typed after a key typed bythe other hand
2 http://econsultancy.com/uk/blog/10649-mobile-s-biggest-ad-challenge-fat-fingers
3.3 Interacting with Haptic Devices 65

Even when touch screen technology is both usable and acceptable to the users,there can be other risks that mitigate against its use in some situations. The touchscreen voting system shown on the left side of Fig. 3.7, for example, was removedwithin a year of being introduced because it could not produce a voter-verifiablepaper audit trail. In other words, there was no way for a voter to tell that their votehad been properly recorded rather than discarded after they had pressed theappropriate buttons. The public and public officials believed that the risk ofpotential corruption—the voter gets feedback from the device saying the vote hasbeen cast, but the vote never gets processed to include it in the count—made thesystem unacceptable.
3.3.3 Pointing Devices
People still widely use mice as a way of interacting with systems and applications,although usage may decline as the uptake of touch screen technology continues torise. Although the mouse is still the most common form of pointing device, thereare others, such as trackpads, graphic tablets, tracker balls, and light pens.Recently released devices, such as Google Glass, are increasingly exploring thepros and cons of gaze as a means of pointing. However, for the time being, thedominant mode of interaction with desktop computers is still the mouse.
The movement of on-screen cursors using pointing devices generally followsFitts’ (1954) law. In its most general form, Fitts’ law states that the time to point toan object is related to the distance from the object and inversely related to the sizeof the object, as shown in Fig. 3.8.
There are several variants of Fitts’ law. The simplest is shown in Eq. (3.1):
time ¼ intercept constant þ slope constant � log2ð2� d=wÞ ð3:1Þ
Card et al. (1983) variant shown in Eq. (3.2) is slightly easier to use:
time ¼ 70 ms � log2 d=wþ 0:5ð Þ ð3:2Þ
Fig. 3.7 A touch screen usedto provide voting without apaper trail (left), and a GPSnavigation system (right)
66 3 Anthropometrics: Important Aspects of Users’ Bodies

The argument to the log2 function in these equations is a measure of the difficultyof the move, measured in bits of information (Shannon 1948). It is sometimes calledthe index of difficulty. As shown in Fig. 3.8, the target distance, d, is measured fromthe point where the movement starts, X, and the target size, w, is the width of thetarget. If the movement was from above or below the target, the target size would bebased on the height of the target (MacKenzie and Buxton 1992). The interceptconstant and slope constant vary across tasks and across input modalities. Typicalvalues for the intercept constant are about 100 ms. The slope constant varies fromabout 20 ms for very good input devices like using fingers directly, to 105 ms forusing arms directly as well as for mice.
Fitts’ law is less accurate where the size of the object, or the distance that has tobe moved, are very large, for example, where the user’s mouse reaches the edge ofthe desk before the mouse pointer has reached the edge of the screen, so the userhas to pick up the mouse and move it back across the desk before the pointer canbe moved any further. Some versions predict a negative reaction time for large orclose objects (where d/w is 0, for example), and time to move to distant objectstends to be underestimated. Also note that the units are arbitrary, as it is the ratio ofthe target size to target distance that is used. Fitts’ law is, however, a fairly robustlaw, and has been usefully applied to many interfaces because it makes goodsuggestions for interface design.
There are at least two implications for designing user interfaces that arise out ofFitts’ Law. The first is that larger objects lead to faster pointing times than smallerobjects. The second is that shorter distances also lead to faster reaction times.Indeed, the fastest time is to move a very small distance towards an infinitely largetarget. Moving the cursor to the screen’s edge (with effectively an infinite targetsize) is much faster than moving the cursor to a bounded (finite) box that is morecentrally located. So, menu bars at the very top of the screen are much faster toaccess than menu bars that are offset from the edge. These implications have to betraded off against other factors though, such as the size of the other objects in adisplay, the size of the display itself, sequencing of tasks, and how often theobjects and commands are used.
Fig. 3.8 Description of thevariables in Fitts’ Law. X iswhere the user starts to pointfrom, d is the distance to thetarget, and w is the width ofthe target
3.3 Interacting with Haptic Devices 67

Figure 3.9 shows several example menu bars. The top menu (starting with theApple and Word) will be the fastest because it is next to the screen edge. Beingnext to the edge makes the target size very large. The other menus below that willbe slower to access. The icons on the far left (the dashed box with a pointer, thegrid, the circular line, picture, etc.) will, however, be relatively fast to point to,because they are on an edge, if the user is approaching them from the center of thewindow. However, they are not because they are offset from the edge by Word.
Figure 3.10 shows Word 2010’s menu in Windows in which the menu items(File, Home, etc.) are offset from the top edge. The time to switch to a menu baritem in Fig. 3.9 is (assuming from the middle of the screen) limited by the constanttime and time to click because the target size is infinite, so the user can move themouse without regard to the target. So, about 100 ms + 1,100 ms or 1,200 ms. Thetime to switch to a menu bar item in Fig. 3.10 is about 100 ms + 100 ms 9 log2
(8 cm/1 cm) or 1,500 ms. In other words, at least 25% longer.Figure 3.11 shows the Eclipse integrated development environment (IDE),
including some aspects for writing user models. In this interface the menus are alsooffset from the top of the window, which might not even be flush with the top ofthe display. Selecting buttons and panels will thus be slower and more error pronewith this menu.
Fitts’ law yields some more sophisticated suggestions when combined withHick’s law, which predicts how long it takes to choose one item from a list ofseveral options (Landauer 1987a). When combined, these two laws suggest that
Fig. 3.9 A screen shot of an application (Word11 for Macintosh) with several menus
Fig. 3.10 Word 2010 for Window’s menu bar with offset from display edge
68 3 Anthropometrics: Important Aspects of Users’ Bodies
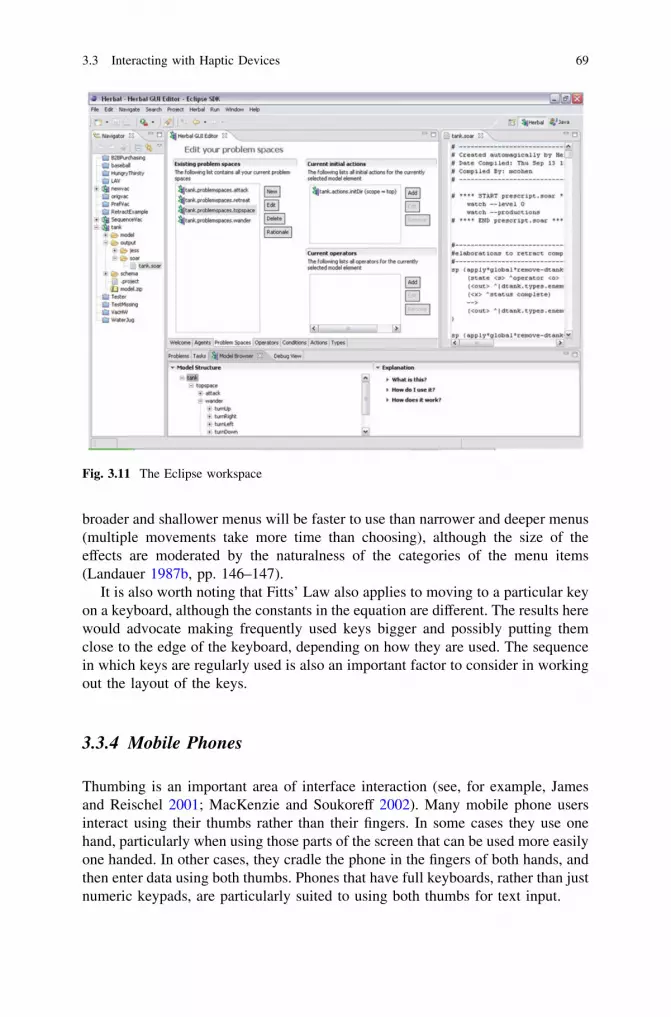
broader and shallower menus will be faster to use than narrower and deeper menus(multiple movements take more time than choosing), although the size of theeffects are moderated by the naturalness of the categories of the menu items(Landauer 1987b, pp. 146–147).
It is also worth noting that Fitts’ Law also applies to moving to a particular keyon a keyboard, although the constants in the equation are different. The results herewould advocate making frequently used keys bigger and possibly putting themclose to the edge of the keyboard, depending on how they are used. The sequencein which keys are regularly used is also an important factor to consider in workingout the layout of the keys.
3.3.4 Mobile Phones
Thumbing is an important area of interface interaction (see, for example, Jamesand Reischel 2001; MacKenzie and Soukoreff 2002). Many mobile phone usersinteract using their thumbs rather than their fingers. In some cases they use onehand, particularly when using those parts of the screen that can be used more easilyone handed. In other cases, they cradle the phone in the fingers of both hands, andthen enter data using both thumbs. Phones that have full keyboards, rather than justnumeric keypads, are particularly suited to using both thumbs for text input.
Fig. 3.11 The Eclipse workspace
3.3 Interacting with Haptic Devices 69

The use of thumbing is an important reminder that users will often use devicesin ways other than those intended by the designers. Probably the most widespreadexample of this is the sending of SMS messages, a task that is performed by mostpeople who own a mobile phone. SMS messages were originally included as adebugging feature to help telephone engineers; it is one of the things that HCIdesigners missed.
We noted earlier that people’s bodies change as they get older. Deterioration ineyesight, for example, can make it harder to read small buttons. This is one of thereasons why some people prefer phones that have bigger buttons, like the oneshown in Fig. 3.12. Although the larger buttons mean that there is less space toinclude other features, it should make the existing features easier to access and use.It should also be noted that there is a delicate balance to be struck here betweenmaking the buttons easier to see on the one hand, and stigmatizing the user assomeone who is old or has poor eyesight on the other.
3.3.5 Video Games and Virtual Reality Systems
In video games that use a vibrating controller, the physical motion of the controller(which vibrates as well as buzzing) is used as a primary source of (haptic) feed-back. In car driving games, for example, the vibration may indicate that the car hasleft the road surface (see also Fogtmann et al. 2008 and Bau and Poupyrev 2012for two examples of their use). Video games are becoming increasingly sophis-ticated in this area.
Haptic feedback in virtual reality systems provides a useful way to help the userfeel immersed in the virtual environment. In some cases it is easier to commu-nicate particular types of information in virtual environments, such as the forcesthat exist between objects and those that are needed to manipulate objects. Forcehas also been used, for example, in virtual surgery to represent different parts ofthe body, and to illustrate the forces involved in manipulating atoms within amolecule when designing drugs (e.g., Zonta et al. 2009).
One way of providing haptic interaction is through a force feedback glove,which is instrumented and has force feedback pads in the fingers. The user wearsthe glove, and as they move their hand and fingers in the glove, the movements areapplied to modify the relevant objects in the interface. If an object in the interfaceis not movable, or requires a significant force to move it, this is fed back to the userby providing a greater force on feedback pads and hence onto the user’s fingers.Data gloves are often perceived as being quite cumbersome, however, which is anissue that is now starting to be addressed through the development of devices thatsupport gesture-based interaction such as Microsoft’s Digits3 which utilizes awrist-worn gloveless sensor.
3 http://research.microsoft.com/apps/video/dl.aspx?id=173838
70 3 Anthropometrics: Important Aspects of Users’ Bodies

In immersive environments users still receive most of their feedback on theiractions and movements through the visual channel. Where there is a mismatchbetween the visual scene and the inner ear’s movement, however, this can lead tonausea. Full motion simulators attempt to provide some of this information byproviding initiating cues to the motion. How to provide this information to a userremains a technical problem that is informed by knowledge about the user.
3.3.6 Other Devices
Other devices have introduced some other novel methods of interaction. Apple’siPod, for example, incorporated the idea of using a dial which, when rotated,produces behavior similar to that of a scroll bar, as shown in Fig. 3.13. When itwas introduced this was quite novel, and many users liked it.
Fig. 3.12 An example phoneinterface (Jitterbug Plus)designed with larger buttonsand a simpler interface.Taken from www.greatcall.com (used with permission)
3.3 Interacting with Haptic Devices 71

Another music player, the Samsung TicToc mp3 player (Fig. 3.14), takes adifferent approach to interaction. The TicToc has only one button, and feedback isobtained through a combination of three LEDs, which backlight the three icons onthe body of the player, and speech. You press and hold the button (located on theend of the player) to turn the TicToc on. This causes all three LEDs to illuminate,and the player tells you how much battery capacity is left and then starts playingautomatically. To increase the volume, you hold the player with the ‘‘+’’ iconuppermost and press the button several times until you get the desired level. Toreduce the volume you turn the player the other way up and repeat the process. Ifyou want to turn the player off you press and hold the button. Again, all the lightsilluminate before the player switches off.
Moving between tracks is relatively straightforward: you hold the player hor-izontally, and press the button once to skip to the next track, or twice if you want toskip to the previous track. If you want to skip to the next album, you press it three
Fig. 3.13 Apple iPod,showing the novel (at thetime) circular dial control
Fig. 3.14 The SamsungTicToc music player
72 3 Anthropometrics: Important Aspects of Users’ Bodies

times. The novel interaction involves shaking the device. If you shake it once ittells you the artist name followed by the name of the track that is currently playing(as long as you have added the music using the TicToc program). You also shakethe player (three times) if you want to change the mode, which cycles throughNormal, Shuffle, Fast (tempo), and Slow (tempo): it then tells you which mode youhave switched to.
The Samsung TicToc may not be to everyone’s tastes, but the interactionmethods can actually be quite useful. If you listen to music when you go outexercising, for example, you can operate the TicToc without having to stop andlook at the interface to locate the correct button, and read the display, as you wouldwith other digital music players.
3.3.7 Advantages and Disadvantages of Haptic Interfaces
Touch-based interfaces are important for a wide range of users and will be par-ticularly important for users without sight as the technology to provide hapticinterfaces improves. Explorations include: a computer mouse that can providetactile feedback via a series of electric motors (Göbel et al. 1995); computers thatlet users feel the texture of, for example, a fabric on their screens (Dillon et al.2001); and mobile phones made with latex that enable people to communicate bytouch as well as speech (Park et al. 2013). Table 3.1 notes the range of applicationsthat are possible, and illustrates the range of users and tasks that can takeadvantage of haptic interfaces.
Tactile feedback is already used by many interfaces to convey importantinformation about the status of a system, particularly that a given operation hasbeen accomplished. For example, using a switch is confusing if there is no obvioustactile or audible sensation that it has been operated. If there is no obvious visualor auditory indication of the switch being operated, then touch is the next mostlikely means of providing that feedback. Keyboards are designed to provide thistype of feedback.
Kaczmarek and Bach-y-Rita’s (1995) list of advantages to using touch(Table 3.1), can be extended further:
(1) Users have a lot of skin. Several parts of it are sensitive enough to provide auseful communication media.
(2) Skin has several functional similarities to the eye, including the ability to mapfrom a two-dimensional display of the environment to the user’s skin, and tointegrate the signal over time.
(3) Representations learned visually can be recognized tactilely.(4) The inputs required can be quite low and easily achievable with current
technology. In particular, the fingertips are very sensitive to changes inpressure.
3.3 Interacting with Haptic Devices 73

(5) Touch provides another input modality. This is useful as primary modality forusers without sight. For sighted users, communication through touch does notinterfere materially with motor or other sensory functions.
(6) For telepresence, such as virtual reality applications, tactile feedback is veryimportant for obtaining the sense of immersion.
Many of the barriers to using haptic interfaces such as cost, power require-ments, safety, and usefulness have now been overcome. This explains why thereare now so pervasive in smartphones and tablet computers.
3.4 Implications for System Design
System performance is a result of particular users doing particular tasks (using aparticular technology) in a particular context. When you are thinking aboutdesigning interactive systems, you will need to consider all of these aspectstogether.
Your users may have limited vision or even no vision at all. This can be apermanent physical characteristic: they may be blind, for example. It may also be aconstraint of the task environment, for example when operating motor transport atnight or in foggy weather conditions. Currently, interfaces that make use ofauditory information are most important to people with visual impairment, buthaptic interfaces are becoming more important as the technology improves, andthe associated costs fall.
Table 3.1 Types of users and tasks that can use a haptic interface
Users with poor visionTeleoperators in areas where vision is not possible or not clear, such as muddy sea floors or areas
with high radiation or poor lightDrivers (cars, buses, tractors, miners) at nightAircraft pilots and car drivers in fogUsers with poor or temporarily degraded sense of touchAstronauts (and others, such as first responders) wearing glovesPeople with insensate feet or hands (a common complication of diabetes) or who have reduced
sensitivity due to ageTeleoperators who would like more feedback about what is in their gripper
Users who need an additional input channel or need touch as the input channelCellular phone users in situations where audio ringing is not acceptableSurgeons who need to know the elasticity and shape of organs during virtual surgeryGame players who could feel that they are being hit or are bumping a wall
Expanded from Kaczmarek and Bach-y-Rita (1995)
74 3 Anthropometrics: Important Aspects of Users’ Bodies

If your users will include older people, you may need to give consideration tothe type of technology that you will use. As people get older, or if they havediabetes, their skin loses its sensitivity. This means that if you are going to use atouch screen interface it may need to utilize resistive technology rather thancapacitive technology.
If the user’s task has to be carried out remotely, or requires wearing gloves(ranging from those used outdoors to those used in space), then you may want toaugment visual (and auditory) feedback with haptic feedback. Teleoperators, forexample, often like to have feedback about what they are holding in their grippers,and surgeons performing operations remotely need to know about the shape andelasticity of the organs that they are dealing with.
One aspect of haptics which we have not considered here, but which can beimportant, is the feel of a device and the materials it is made from, its esthetics. Asmooth, shaped surface, for example, may help to lead to a positive emotionalexperience of using a particular device. This is one of the reasons why miceevolved from relatively square devices to something that is now much morerounded and better suited to the shape of the hand when using it.
If your system will be installed in an environment where there is limited space,this may determine how the users can interact with the system. It is always worthgoing to look at the installation location beforehand. One of the authors wasinvolved in putting in a system that normally used a mouse. The system was to beinstalled alongside another system which meant that there was very limiteddesktop space available. As a result, a trackerball interface was used instead of themouse because it requires less space to operate.
If your system includes manual controls, it is important to provide hapticfeedback to indicate that these controls have been operated. This is particularlytrue when there is no obvious visual or auditory feedback when a button has beenpressed or a switch has been activated, for example.
If you are developing a mobile application or system, you will need to thinkabout all the contexts in which it may be used. If it can be used in a situation wherevisual and auditory feedback are not allowed, for example, then you may want togive the device a haptic interaction capability. Most mobile phones, for example,provide a silent mode in which the phone vibrates rather than rings.
3.5 Summary
This chapter has introduced the fact that at least some aspects of users’ bodies areinvolved in interacting with devices and systems. Although the fields of humanfactors and ergonomics routinely consider this aspect of work, it tends to be lessexplicitly represented in HCI. Users’ bodies provide capabilities and constraints on
3.4 Implications for System Design 75

what tasks they can perform, the loads that they can support and carry, and howquickly and accurately they can provide input to a system. Using this informationcan help us make effective choices about which input modality to use, and how todesign menus and dialog boxes.
Human capabilities and constraints vary between users, and within users theyvary across time and across context. The best interfaces are those that take all ofthese differences into consideration so that they can support as wide a range ofuse—people, technology, and context—as possible.
3.6 Other Resources
There are many texts that are available for deepening understanding of designrelevant aspects of the body. Although not explicitly focused on the human bodynor on technology, we strongly recommend Don Norman’s excellent text, ThePsychology of Everyday Things, to get you into a way of thinking about peopleinteracting with designed objects of all kinds. An extremely readable text, we thinkyou will find many examples that relate to your everyday world (many related toanthropometrics) and that will get you thinking about design from a differentperspective.
Norman, D. A. (1988). The psychology of everyday things. NY: Basic Books. (2013 ed.The design of everyday things)
Further information on the range of users’ bodies and how they move can befound in engineering handbooks. We recommend looking at:
Boff, K. R., Kaufman, L., and Thomas, J. P. (1986). Handbook of perception and humanperformance (Vol. I, II, and III). New York: John Wiley & Sons.
Industrial engineering explores this area in much more depth, and knows abouthow best to support users that stand, squat, and assume a variety of other postures.Wickens et al. (1998, Chaps. 10 and 11) provide a useful introduction to thesetopics.
The International Standards Organization (ISO, you may see this acronym on avariety of technical measures and standards) has been developing standards forusability for several years. The most relevant series here is ISO 9241, Ergonomicsof Human System Interaction (http://en.wikipedia.org/wiki/ISO_9241).
It is also worth thinking about new forms of interaction beyond the currentkeyboard layout. There are a number of research projects addressing new forms ofinput beyond the keyboard. This edited special issue gives some pointers to futurethinking research work:
Schmidt, A., and Churchill, E. F. (2012). Interaction beyond the keyboard, IEEEComputer, 45(4). 21–24.
76 3 Anthropometrics: Important Aspects of Users’ Bodies

3.7 Exercises
3.1 Consider a smartphone, either a specific one or a composite, general one.Attempt to come up with a trade-off function between a set of features (whichyou create) and weight. Describe how to choose a reasonable point on thatcurve. Is your smartphone more like a phone, tablet, or laptop?
3.2 Choose an existing interface and make five suggestions how touch couldchange or improve its usability. Interfaces where this is easy to do includeCAD/CAM systems and data mining systems. Interfaces that are more difficultinclude online learning environments and simple web sites.
3.3 Describe five systems where anthropometrics make a difference. To get youstarted, consider small systems for playing music, and also consider how thesesystems can be integrated with other capabilities (e.g., cellular phones).
3.4 Write a short report on the quality of your own desk and work area. Compareit with an ergonomically suggested design as well as with what is available inthe place where you use a computer for study or work purposes.
3.5 Compute the constants for Fitts’ law based on a thumb. This can be done bycreating a set of targets for the thumb and measuring the time for the thumb tomove to those targets. In the case where video analysis is not available, auseful approach is to have the thumb move to the target multiple times andthen move back, or to type in a series of actions and then use linear regressionto compute the best predicted time per action. The resulting constants andtimes can then be compared with other constants for pointing approaches.
3.6 Compute the time it would take to select an Eclipse menu item from theapplication’s top menu in Fig. 3.11, like ‘‘Refactor,’’ and a menu from thewindow’s panels, like ‘‘Target.java.’’ You should compute this for the middleof the screen (as shown) and from the actual location of the mouse pointer.
3.7 Given a 1500 diagonal touch screen, how many buttons could you put on it?
(a) Note your assumptions.(b) Describe how many buttons you could fit on the screen.(c) Note any lessons you found while doing this task.
3.8 On a Penn State online course system, similar to many online course systems,the web page shown on the top of Fig. 3.15 appears. If you click on the linknext to the pointer (Template for the Team Contract), the page on the bottomcomes up. This page notes that if you do not move the mouse over the targetphrase (blank_team_contract.doc) in 5 s, the file will automatically download(presumably to your default download directory). It is often much better todownload into your course directory, so you have to quickly move your mouseover the target phrase.
Comment on what would be a reasonable default time to move the mouseusing Fitts’ law. Is 5 s a reasonable time, or could it be much less, or should itbe more?
3.7 Exercises 77
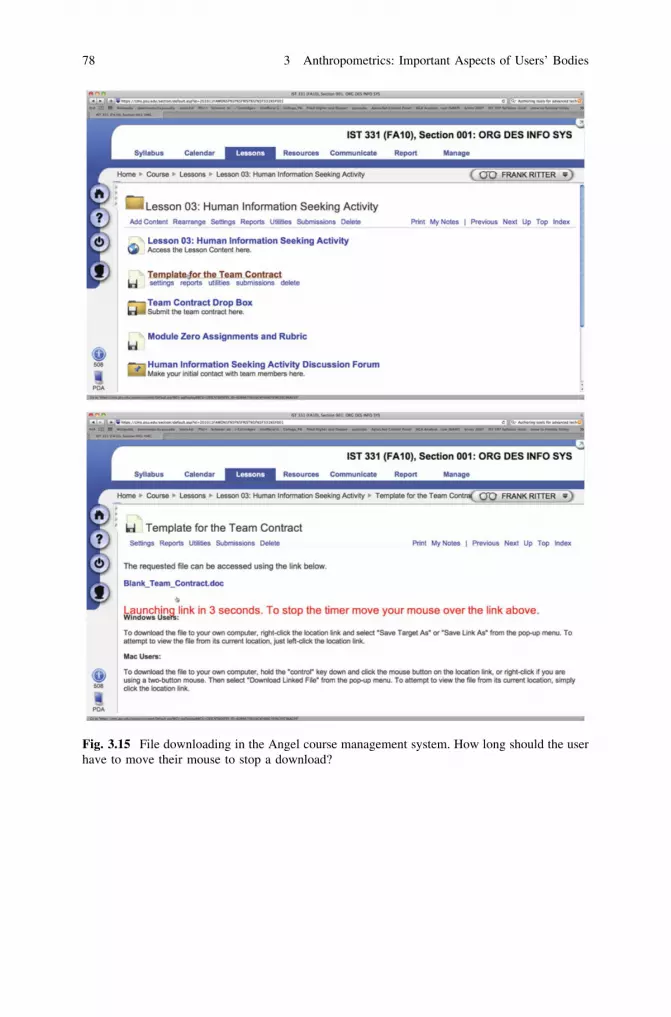
Fig. 3.15 File downloading in the Angel course management system. How long should the userhave to move their mouse to stop a download?
78 3 Anthropometrics: Important Aspects of Users’ Bodies

References
Bau, O., & Poupyrev, I. (2012). REVEL: Tactile feedback technology for augmented reality.ACM Transactions on Graphics, 31(4), Article 89, 1–11.
Card, S. K., Moran, T. P., & Newell, A. (1980). The keystroke-level model for user performancetime with interactive systems. Communications of the ACM, 23(7), 396–410.
Card, S. K., Moran, T., & Newell, A. (1983). The psychology of human-computer interaction.Hillsdale, NJ: Erlbaum.
Dillon, P., Moody, W., Bartlett, R., Scully, P., Morgan, R., & James, C. L. (2001). Sensing thefabric: To simulate sensation through sensory evaluation and in response to standardacceptable properties of specific materials when viewed as a digital image. In Haptic human-computer interaction, First international workshop (pp. 205–218). Berlin: Springer.
English, J., & Andre, A. D. (1999). Posture and web browsing: An observational study. InProceedings of the 43rd annual meeting of the Human Factors and Ergonomics Society(pp. 945–949). Santa Monica, CA: Human Factors and Ergonomics Society.
Fitts, P. M. (1954). The information capacity of the human motor system in controlling amplitudeof movement. Journal of Experimental Psychology, 47(6), 381–391.
Fogtmann, M. H., Fristch, J., & Kortbek, K. J. (2008). Kinesthetic interaction—Revealing thebodily potential in interaction design. In OZCHI’08: Proceedings of the 20th Australasianconference on computer–human interaction: Designing for habitus and habitat (pp. 89–96).New York, NY: ACM Press.
Gibson, J. J. (1979). The ecological approach to visual perception. Boston, MA: Houghton Mifflin.Göbel, M., Luczak, H., Springer, J., Hedicke, V., & Rötting, M. (1995). Tactile feedback applied
to computer mice. International Journal of Human-Computer Interaction, 7(1), 1–24.James, C. L., & Reischel, K. M. (2001). Text input for mobile devices: Comparing model
prediction to actual performance. In CHI ‘01 Proceedings of the SIGCHI conference onhuman factors in computing systems (pp. 365–371). New York, NY: ACM.
Jiang, Y., Tian, F., Zhang, X., Liu, W., Dai, G., & Wang, H. (2012). Unistroke gestures on multi-touch interaction: Supporting flexible touches with key stroke extraction. In ACM conferenceon Intelligent User Interfaces (IUI) (pp. 61–70). New York, NY: ACM.
John, B. E. (1996). TYPIST: A theory of performance in skilled typing. Human-ComputerInteraction, 11(4), 321–355.
Kaczmarek, K. A., & Bach-y-Rita, P. (1995). Tactile displays. In W. Barfield & T. A. Furness III(Eds.), Virtual environments and advanced interface design (pp. 349–414). Oxford: OxfordUniversity Press.
Kinkead, R. (1975). Typing speed, keying rates, and optimal keyboard layouts. In Proceedings ofthe Human Factors Society 19th annual meeting (pp. 159–161). Santa Monica, CA: HumanFactors Society.
Landauer, T. K. (1987a). Relations between cognitive psychology and computer systems design.In J. M. Carroll (Ed.), lnterfacing thought: Cognitive aspects of human- computer interaction(pp. 1–25). Cambridge, MA: MIT Press.
Landauer, T. K. (1987b). Relations between cognitive psychology and computer systems design.In J. Preece & L. Keller (Eds.), Human-computer interaction (pp. 141–159). EnglewoodCliffs, NJ: Prentice-Hall.
Loomis, J. M., & Lederman, S. J. (1986). Tactual perception. In K. Boff, L. Kaufman, &J. Thomas (Eds.), Handbook of perception and human performance (Vol. II, pp. 31-31–31-41).New York, NY: Wiley.
MacKenzie, I. S., & Buxton, W. A. S. (1992). Extending Fitts’ law to two-dimensional tasks. InProceedings of ACM CHI 1992 conference on human factors in computing systems (pp.219–226).
MacKenzie, I. S., & Soukoreff, R. W. (2002). Text entry for mobile computing: Models andmethods, theory and practice. Human-Computer Interaction, 17, 147–198.
Norman, D. A. (1988). The psychology of everyday things. New York: Basic Books.
References 79

Norman, D. A. (2013). The design of everyday things. New York: Basic Books.Park, Y. W., Baek, K. M., & Nam, T. J. (2013). The roles of touch during phone conversations:
Long-distance couples’ use of POKE in their homes. In Proceedings of the 2013 ACM annualconference on human factors in computing systems, (pp. 1679–1688). New York, NY: ACM.
Salthouse, T. A. (1986). Perceptual, cognitive, and motoric aspects of transcription typing.Psychological Bulletin, 3(3), 303–319.
Shannon, C. E. (1948). A mathematical theory of communication. Bell System Technical Journal,27, 379–423; 623–656.
Tian, F., Xu, L., Wang, H., Zhang, X., Liu, Y., Setlur, V., et al. (2008). Tilt Menu: Using the 3Dorientation information of pen devices to extend the selection capability of pen-based user. InACM SIGCHI annual conference (CHI) 2008, (pp. 1371–1380). New York, NY: ACM.
Wickens, C. D., Gordon, S. E., & Liu, Y. (1998). An introduction to human factors engineering.New York, NY: Addison-Wesley.
Zonta, N., Grimstead, I. J., Avis, N. J., & Brancale, A. (2009). Accessible haptic technology fordrug design applications. Journal of Molecular Modeling, 15(2), 193–196.
80 3 Anthropometrics: Important Aspects of Users’ Bodies

Chapter 4Behavior: Basic Psychology of the User
Abstract This chapter examines what are described as user behavioral charac-teristics. These are characteristics that are related to perception in broad terms. Thechapter starts by defining some behavioral terms and concepts that are used in thisand subsequent chapters. We then describe in detail several aspects of the twomain perceptual systems that are involved in interacting with computer-basedsystems: vision and hearing. For each of these aspects we consider some of theimplications they have for system design. We finish by introducing the topic ofmotivation to help explain why individual users may behave in a particular waywhen carrying out a task.
4.1 Introduction
When we refer to behavioral characteristics we are really talking about things thatare linked to sensation and perception, in general terms. We know that people havefive basic senses: sight, hearing, touch, smell, and taste. Sensation occurs when thesense organs (eyes, ears, and so on) are stimulated, and they generate some form ofcoding of the stimuli. Perception occurs when this coded information is furtherinterpreted using knowledge of the current context (physical, physiological, psy-chological, and so on) to add meaning. The process of perception is subjective:simply presenting designed stimuli in such a way that they will be sensed accu-rately does not necessarily mean that they will be perceived in the way that thedesigner intended.
Sight, hearing, and smell all sense stimuli that appear at some distance from thebody. In other words they detect distant (distal) stimuli. Touch and taste, however,rely on contact being made with the stimuli. This means that the stimuli have to bevery close to the body, which is why they are described as proximal stimuli.
We need to think about the user’s behavioral characteristics when designingsystems because we want to make sure that the system fits the user. A well-designedsystem will take into account the user’s ability to detect changes in an interface, forexample, and we can use this information to inform the design of screen layouts to
F. E. Ritter et al., Foundations for Designing User-Centered Systems,DOI: 10.1007/978-1-4471-5134-0_4, � Springer-Verlag London 2014
81

help the user make the most of that ability. It is also important to remember that theseabilities will vary across users, tasks, and contexts. If your system will be deployed ina brightly lit office, for example, then reflected light and glare are likely to affect theuser’s ability to read what is displayed on the screen.
In most computer-based systems we tend to privilege vision and hearing overthe other senses, although the rapid uptake of smartphones and tablet computershas increased the importance of considering touch (described in Chap. 3). Often itis important to consider how the different sensory modalities can be used togetherto provide further useful information to the user. In dark, or dimly lit conditions,for example, using different shaped knobs and switches can be used to exploit thesense of touch to impart information to the user. Similarly, if a user has impairedvision, we may want to present information in such a way that it can be exploitedby other senses, such as touch and hearing.
Once we have an understanding of how people sense and perceive things, andhow the different senses work together, we can start to think about broader designquestions such as:
• What is the best way to present information to the user?• Can the user detect the information that we are presenting to them?• If we are presenting a lot of information to the user, should we be presenting it
using more than one sensory channel (e.g., visual and auditory channels areoften both used for alarm information).
Next, we introduce some basic concepts from behavioral psychology that willhelp you to understand and interpret the rest of the chapter. We then provide quitedetailed descriptions of the visual and auditory perceptual systems. There aremany aspects of the visual and auditory systems that need to be considered whendesigning systems. For this reason, we consider the implications for system designat the end of each of the sections in this chapter. Note that we omit the senses ofsmell and taste here because their use is almost exclusively limited to systems thatare dedicated to tasks that only involve detecting particular smells and tastes.
4.2 Behavioral Psychology Terminology
Within psychology many terms have been developed to describe different aspects ofbehavior, extending far beyond perception. Here we introduce some terms that mayhelp you when thinking about the user and usability with respect to perception.
4.2.1 Thresholds and Just Noticeable Differences (JNDs)
Each sense has a threshold for detecting stimuli. Sounds that are too quiet or visualstimuli that are too faint cannot be sensed. Table 4.1 gives some representative
82 4 Behavior: Basic Psychology of the User
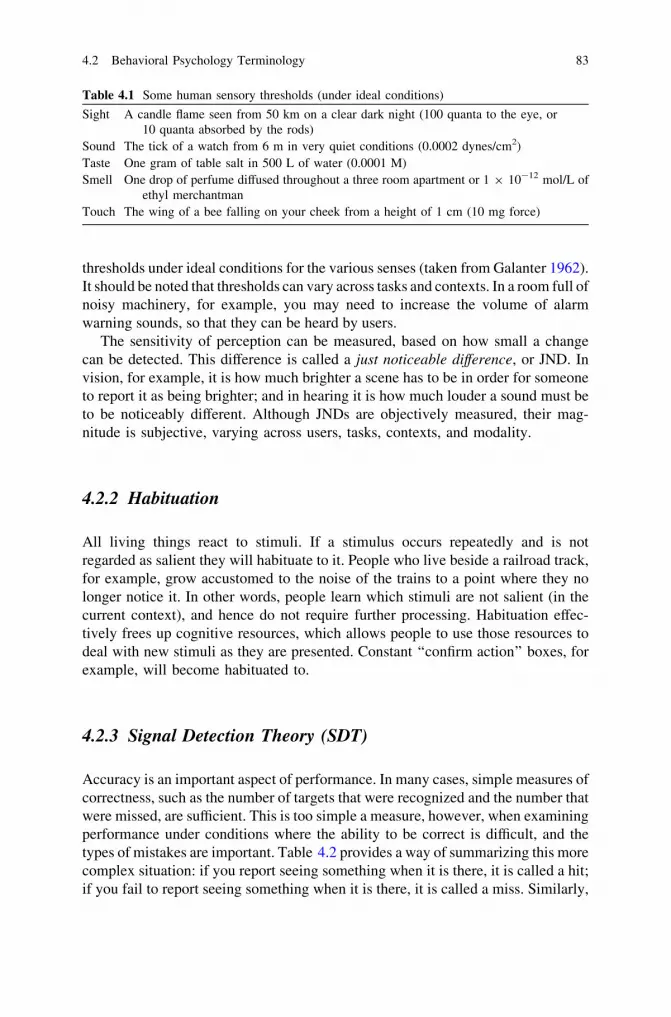
thresholds under ideal conditions for the various senses (taken from Galanter 1962).It should be noted that thresholds can vary across tasks and contexts. In a room full ofnoisy machinery, for example, you may need to increase the volume of alarmwarning sounds, so that they can be heard by users.
The sensitivity of perception can be measured, based on how small a changecan be detected. This difference is called a just noticeable difference, or JND. Invision, for example, it is how much brighter a scene has to be in order for someoneto report it as being brighter; and in hearing it is how much louder a sound must beto be noticeably different. Although JNDs are objectively measured, their mag-nitude is subjective, varying across users, tasks, contexts, and modality.
4.2.2 Habituation
All living things react to stimuli. If a stimulus occurs repeatedly and is notregarded as salient they will habituate to it. People who live beside a railroad track,for example, grow accustomed to the noise of the trains to a point where they nolonger notice it. In other words, people learn which stimuli are not salient (in thecurrent context), and hence do not require further processing. Habituation effec-tively frees up cognitive resources, which allows people to use those resources todeal with new stimuli as they are presented. Constant ‘‘confirm action’’ boxes, forexample, will become habituated to.
4.2.3 Signal Detection Theory (SDT)
Accuracy is an important aspect of performance. In many cases, simple measures ofcorrectness, such as the number of targets that were recognized and the number thatwere missed, are sufficient. This is too simple a measure, however, when examiningperformance under conditions where the ability to be correct is difficult, and thetypes of mistakes are important. Table 4.2 provides a way of summarizing this morecomplex situation: if you report seeing something when it is there, it is called a hit;if you fail to report seeing something when it is there, it is called a miss. Similarly,
Table 4.1 Some human sensory thresholds (under ideal conditions)
Sight A candle flame seen from 50 km on a clear dark night (100 quanta to the eye, or10 quanta absorbed by the rods)
Sound The tick of a watch from 6 m in very quiet conditions (0.0002 dynes/cm2)Taste One gram of table salt in 500 L of water (0.0001 M)Smell One drop of perfume diffused throughout a three room apartment or 1 9 10-12 mol/L of
ethyl merchantmanTouch The wing of a bee falling on your cheek from a height of 1 cm (10 mg force)
4.2 Behavioral Psychology Terminology 83

reporting seeing nothing where there is nothing there is called a correct rejection,whilst reporting seeing something when it is not there is called a false alarm.
Human visual behavior often includes searching, scanning, and monitoring.Vigilance tasks, which are a subset of these tasks, usually involve an extended timeperiod between the signals that the user is supposed to recognize. While it shouldbe possible to moderate the performance of these tasks based on the dimensionsused in the table, it is often useful to analyze these situations using SignalDetection Theory (SDT) (Swets 1973; Swets et al. 1961; also see Wickens et al.2014 or Wickens 2002).
SDT was developed to explain the task of identifying enemy planes on hard toread radar displays. It has been applied to a wide range of classification anddecision making tasks. Swets (1973), for example, used SDT to summarize howwell doctors could classify cancer tumors from X-ray films. It can also be appliedwithin computer games to explain the potential problems when players search forenemies or resources.
Figure 4.1 shows how the key parameters in SDT relate to the ability to dis-tinguish the object of interest (signal) from distracting items (noise). The set ofsignals is assumed to be normally distributed about a point some distance awayfrom 0, whilst the set of noise is normally distributed around 0 (indicating no validsignal strength). d’ represents the distance between the mean of the noise and themean of the signal, and is an inherent property of an observer and stimuli.Observers set a threshold (here, beta, b, some authors call this lambda, k, or yetanother Greek character) as a parameter that is inherent in the observer. Obser-vations above the threshold are classified by the observer as signal and observa-tions below are classified as noise. Thus, the parts of the signal above the thresholdare hits and the parts of the noise distribution are false alarms (FA). Observationsbelow the threshold are either correct rejections (CRs) if they are noise or misses ifthey were part of the signal.
Observers can often adjust the threshold to take account of the relative costs ofthe four responses in Table 4.2. The cost of false alarms and misses will influencewhere the threshold is set. Where misses are costly, the threshold will be to the left,classifying more signal and more noise as positive responses. Where false alarmsare expensive compared to misses, the threshold will be moved to the right,eliminating more of the noise but also part of the signal.
Signal detection theory is often described in terms of sensitivity and bias. Thesensitivity (which is the same as d’) refers to the separation between the signal andnoise distributions. Where the separation is small, and the two distributions
Table 4.2 Types ofresponses to a signal
Response Signal present
Yes No
Yes Hit False alarm (FA)No Miss Correct rejection (CR)
84 4 Behavior: Basic Psychology of the User
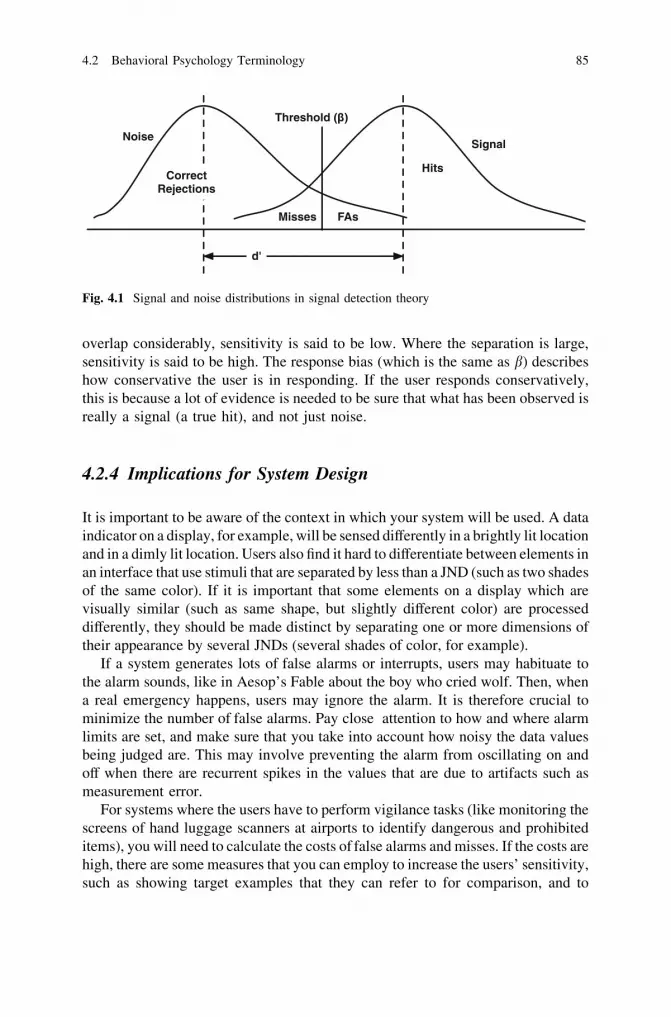
overlap considerably, sensitivity is said to be low. Where the separation is large,sensitivity is said to be high. The response bias (which is the same as b) describeshow conservative the user is in responding. If the user responds conservatively,this is because a lot of evidence is needed to be sure that what has been observed isreally a signal (a true hit), and not just noise.
4.2.4 Implications for System Design
It is important to be aware of the context in which your system will be used. A dataindicator on a display, for example, will be sensed differently in a brightly lit locationand in a dimly lit location. Users also find it hard to differentiate between elements inan interface that use stimuli that are separated by less than a JND (such as two shadesof the same color). If it is important that some elements on a display which arevisually similar (such as same shape, but slightly different color) are processeddifferently, they should be made distinct by separating one or more dimensions oftheir appearance by several JNDs (several shades of color, for example).
If a system generates lots of false alarms or interrupts, users may habituate tothe alarm sounds, like in Aesop’s Fable about the boy who cried wolf. Then, whena real emergency happens, users may ignore the alarm. It is therefore crucial tominimize the number of false alarms. Pay close attention to how and where alarmlimits are set, and make sure that you take into account how noisy the data valuesbeing judged are. This may involve preventing the alarm from oscillating on andoff when there are recurrent spikes in the values that are due to artifacts such asmeasurement error.
For systems where the users have to perform vigilance tasks (like monitoring thescreens of hand luggage scanners at airports to identify dangerous and prohibiteditems), you will need to calculate the costs of false alarms and misses. If the costs arehigh, there are some measures that you can employ to increase the users’ sensitivity,such as showing target examples that they can refer to for comparison, and to
Threshold ( )
NoiseSignal
FAs
Hits
Misses
d'
CorrectRejections
Fig. 4.1 Signal and noise distributions in signal detection theory
4.2 Behavioral Psychology Terminology 85

change their response bias, such as making clear to them the costs of false alarmsand misses (see Wickens et al. 2014 and Wickens 2002 for more complete lists).
4.3 The Physiology of Vision
In the next few sections we examine the details of vision. We start by offering a high-level description of the physical structure of the eye. This should help you under-stand the basic idea of how vision works and what some of its important limitationsare. Unlike a camera snapshot, for example, the eye does not capture everything in ascene equally, but selectively picks out salient objects and features from the currentcontext, and focuses on them so they can be processed in more detail.
4.3.1 Overview of Vision
For normally sighted people, vision is by far the most widely used sense. Vision isimportant in everyday work because it allows us to use interfaces like those shownin Fig. 4.2. Understanding the basics of how human vision works, including itsstrengths and weaknesses, will help you to design systems that more closely matchyour user’s visual capabilities.
4.3.2 The Basic Structure of the Eye
Figure 4.3 shows the basic structure of the eye. The important physiologicalfeatures that you need to be aware of are the lens, the retina, the rod and cone cells(the sensory receptors in the eye which respond to different light waves), the fovea,and the optic nerve.
When you look at an object, an image of it is projected onto the eye. The anglethat is subtended by that object at the eye is described as the visual angle. Theability to discriminate between two objects that are close together is described asvisual acuity. This is usually expressed in terms of the minimum visual angle thatcan be resolved, for which the standard is normally a gap subtending 1 min of arc(1/60 of a degree). Acuity is usually expressed as a fraction which expresses theratio of the standard distance used in eye-tests (20 ft or 6 m) to the distance atwhich a gap subtends 1 min of arc. So when you hear someone described as having20/20 (or 6/6) vision, the numbers refer to their visual acuity.
The light coming from an object is focused by the lens and projected onto theretina at the back of the eye. Muscles attached to the sides of the lens contract inorder to thicken the lens and bend the light more to achieve a clear focus when the
86 4 Behavior: Basic Psychology of the User

stimulus is near. These muscles relax when the object is further away. This processof contracting and relaxing is called accommodation. As people age, the lensstiffens, which makes it harder for the muscles to affect its curvature as much, soglasses are prescribed to compensate for the reduced level of accommodation.
The fovea constitutes a small part of the retina, about 1–2� of visual arc, whichapproximately equates to the angle covered by your thumbnail when viewed atarm’s length. The receptor systems that permit visual acuity are concentrated onlyin the fovea, so we need to fixate on an object to have a clear image of it.Surrounding the fovea is the parafovea, which has a lower level of visual acuitythan the fovea.
You can demonstrate the existence of the fovea to yourself by staring at a dot inthe center of a page. Only the area immediately surrounding it will appear in clearfocus, so to clearly perceive a scene of any size the eyes must move around. Thesesemi-conscious movements are called saccades and take approximately 200 ms to
Fig. 4.2 An interface that has to be recognized quickly and accurately
Optic Nerve To the brain
Lens
Pupil
R
R
PF
FBSF
PF
Fig. 4.3 Basic structure of the eye (not to scale). The retina is the area (roughly circular) from Rto R. The parafovea is from PF to PF. The fovea is from F to F. The blind spot is at BS, where theoptic nerve leaves the eye and blood comes in
4.3 The Physiology of Vision 87
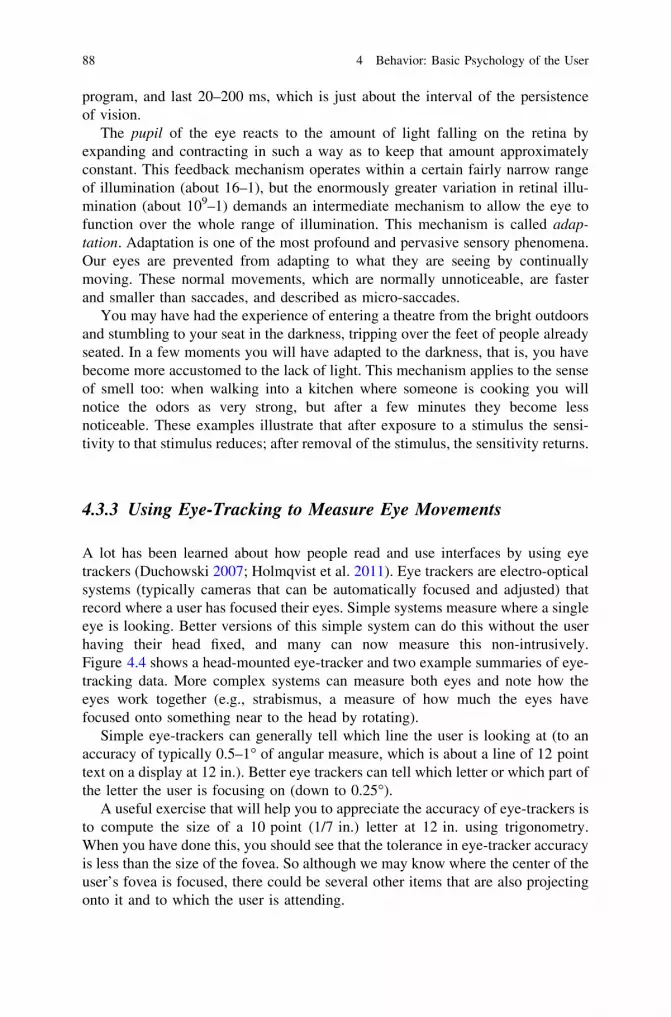
program, and last 20–200 ms, which is just about the interval of the persistenceof vision.
The pupil of the eye reacts to the amount of light falling on the retina byexpanding and contracting in such a way as to keep that amount approximatelyconstant. This feedback mechanism operates within a certain fairly narrow rangeof illumination (about 16–1), but the enormously greater variation in retinal illu-mination (about 109–1) demands an intermediate mechanism to allow the eye tofunction over the whole range of illumination. This mechanism is called adap-tation. Adaptation is one of the most profound and pervasive sensory phenomena.Our eyes are prevented from adapting to what they are seeing by continuallymoving. These normal movements, which are normally unnoticeable, are fasterand smaller than saccades, and described as micro-saccades.
You may have had the experience of entering a theatre from the bright outdoorsand stumbling to your seat in the darkness, tripping over the feet of people alreadyseated. In a few moments you will have adapted to the darkness, that is, you havebecome more accustomed to the lack of light. This mechanism applies to the senseof smell too: when walking into a kitchen where someone is cooking you willnotice the odors as very strong, but after a few minutes they become lessnoticeable. These examples illustrate that after exposure to a stimulus the sensi-tivity to that stimulus reduces; after removal of the stimulus, the sensitivity returns.
4.3.3 Using Eye-Tracking to Measure Eye Movements
A lot has been learned about how people read and use interfaces by using eyetrackers (Duchowski 2007; Holmqvist et al. 2011). Eye trackers are electro-opticalsystems (typically cameras that can be automatically focused and adjusted) thatrecord where a user has focused their eyes. Simple systems measure where a singleeye is looking. Better versions of this simple system can do this without the userhaving their head fixed, and many can now measure this non-intrusively.Figure 4.4 shows a head-mounted eye-tracker and two example summaries of eye-tracking data. More complex systems can measure both eyes and note how theeyes work together (e.g., strabismus, a measure of how much the eyes havefocused onto something near to the head by rotating).
Simple eye-trackers can generally tell which line the user is looking at (to anaccuracy of typically 0.5–1� of angular measure, which is about a line of 12 pointtext on a display at 12 in.). Better eye trackers can tell which letter or which part ofthe letter the user is focusing on (down to 0.25�).
A useful exercise that will help you to appreciate the accuracy of eye-trackers isto compute the size of a 10 point (1/7 in.) letter at 12 in. using trigonometry.When you have done this, you should see that the tolerance in eye-tracker accuracyis less than the size of the fovea. So although we may know where the center of theuser’s fovea is focused, there could be several other items that are also projectingonto it and to which the user is attending.
88 4 Behavior: Basic Psychology of the User

In addition to being widely used in psycholinguistics to understand how peopleread text, eye-tracking is increasingly being used in other fields such as HCI andadvertising (Moore and Churchill 2011; Navalpakkam and Churchill in press;Nielsen and Pernice 2010). The availability of relatively cheap, non-intrusivetrackers has seen them being used more widely in exploring how people process thetext on web pages. With the use of appropriate software you can quickly identify thehot spots on a page, which are areas that the users look at for most of the time.
4.3.4 Rods and Cones
The retina at the back of the eyeball is composed of two basic types of cells—rodsand cones—organized in layers. The rods and cones sense light, and mark the startof the transition from sensation to perception with light energy being convertedinto electrical energy.
According to duplicity theory, the differences between the rods and cones resultin two different receptor systems in the eye: one that is best suited to daylight, andone best suited to twilight or moonlight. There are 6 million cones, mostly locatedin the fovea. These function in daylight conditions and are responsible for colorvision. The 120 million rods are distributed across the retina beyond the fovea.
Fig. 4.4 A head-mounted eye-tracker and an example analysis showing the order that a userlooked at the interface (top) and how long they looked at each part (bottom) (photo by Ritter, usedwith permission of the analyst pictured; analyses courtesy of Maik Friedrich 2008)
4.3 The Physiology of Vision 89

They are much more sensitive to light than the cones and are active in darkconditions; in bright conditions they become overloaded. The distributions of rodsand cones overlap in the parafovea. The rods are mostly located beyond theparafovea, in the periphery of the retina, and are very sensitive to movement.
The visual receptors respond to light waves. The term light is used to describeelectromagnetic energy in the visible range of wavelengths approximately400–700 nm (see Fig. 4.5). The wavelengths that we see are determined by thephysics of the eye and the chemistry of the photoreceptor pigments in the eye.Electromagnetic energy with wavelengths below the visible spectrum includesultraviolet rays, X-rays, and gamma rays; electromagnetic energy with wavelengthsabove the visible spectrum includes infrared rays, microwaves, and radio waves.
Our sensitivity to spectral radiation is not constant across the electromagneticspectrum. Instead, we sample it through a pair of filters. The first filter is provided bythe spectral sensitivity of the rods, which have a maximum sensitivity around500 nm (498 in Fig. 4.5). The second is provided by the pooled responses of the threetypes of cones (the leftmost and two rightmost curves in Fig. 4.5) and has maximumsensitivity around 555 nm. Below 380 nm (infrared) and above 700 nm (ultraviolet)we are effectively blind to electromagnetic waves. Therefore, there is a wide range ofinformation that meets our eyes which falls outside our window of visibility.
Although we sense infrared energy as heat, other wavelengths outside thevisible spectrum are imperceptible without the aid of devices such as radios orinfrared goggles. Ultraviolet energy is destructive to living tissue, so it is filteredout by the yellow pigment in the lens of the eye. People who have had their lensesremoved because of cataracts, however, can see ultraviolet energy as light. Ratherthan experiencing it as a new color sensation, which would require another type ofcone, they see it as the same color that people with normal vision would see violet.
Fig. 4.5 Diagram of sensitivity in nanometers (nm) of rods and cones (reprinted with permissionfrom Bowmaker and Dartnall 1980)
90 4 Behavior: Basic Psychology of the User

When you switch from looking at colored objects in bright light to looking atthe same objects in dim light, all other things being equal you will notice that oneobject now seems brighter than the other. If you look at a blue flower and a redflower, for example, first in daylight and then at dusk, you will notice that underlow illumination both appear faded, but the blue seems brighter than the red.Likewise, a piece of green paper and a piece of red paper which are matched forbrightness in good light will not be matched in dim light. This effect is called thePurkinje Shift, and is based on the fact that long wavelength colors such as redappear duller under low illumination than shorter wavelength colors (such as blue).The effect occurs because of the shift from high illumination vision (cones) to lowillumination vision (rods) under different light conditions. The rods are relativelymore sensitive to light in the blue region than the cones, hence the apparent greaterbrightness of the blue flower in dim light. These relationships can be seen inspectral sensitivity curves that illustrate that maximum sensitivity goes from red toblue green (i.e., to shorter wavelengths) when we shift from bright to dim light andfrom the cones to the rods.
One final point about rods and cones: there is one part of the retina where thereare no receptors (rods or cones) present. This is where the optic nerve leaves theretina. When the image of an object falls on this blind spot, nothing is seen. Youcan use Fig. 4.6 to help you find your own blind spot. The blind spot is in adifferent place for each eye.
4.3.5 Implications for System Design
If your system is going to be deployed in an area where users experience largestep changes in lighting conditions on entering that area (from light to dark or viceversa) you will need to take account of the fact that their eyes will need time toadapt to the new lighting conditions. You could consider having gradual changesin lighting levels as they enter the area, for example.
People will often use a relatively large dialog box positioned in the center of thescreen to get the user’s attention for something that is important. This dialog box isusually large enough to project an image onto the retina that fills a significantportion of the fovea. It would be equally possible to capture the user’s attention bymake an item on the display screen move, or make it flash or blink, as long as
Blindspot 1 2 3 4 5 6 7 8 9 ba c
Fig. 4.6 Cover your right eye and focus directly on a digit with your left eye. Then move thepage away from your head. At about a foot the word blind spot will disappear. The location of theblind spot and screen sizes will vary, so you may have to try different focus points
4.3 The Physiology of Vision 91

the item is located in a position that projects onto the periphery of the retina.In this way the movement or flashing gets detected by the rods in the eye. There isa negative implication here too: if your user is carrying out an important task thatrequires high levels of concentration using the display screen, you should try toavoid having items on the screen move or flash, particularly if they would projectonto the periphery of the user’s eye.
If you are designing a system that has to be operated in light sensitive condi-tions, such as a photography dark room or a radar operations room, you need toconsider how you can help the users see so that they can carry out their tasks in thedimly lit conditions. Usually in these situations, red light is used to illuminatethe rooms, albeit at quite low levels. The rods are relatively less sensitive to light atthe red end of the visible spectrum, which means that the rods start dark adaptingeven though there is still some light available.
In most cases people using technology work at arm’s length from their displayscreen. This means that the blind spot is usually not a problem, because the brainprocesses the images from both eyes together to perceive what is on the screen. Ifyou have a system which requires the user to be much closer to the screen, andthey are not detecting some items that are important, you should consider inves-tigating whether those items are in fact located in their blind spot.
4.4 Low Level Visual Perception
Here we consider the low level details of vision. These range from how light isdetected, through various aspects associated with color, to flicker and pop-out effects.Several of these aspects of low-level vision have implications for system design.
4.4.1 Vision and the Measurement of Light
There are two important ways in which light gets from an object to the eye:incident light (light falling on an object) and reflected light (light reflected from anobject). Incident light is referred to as illuminance whereas reflected light is termedluminance. White surfaces typically have reflectances of 80% and black surfacesaround 10%.
Luminance is measured in candelas per square meter (cd/m2). As the luminanceof an object increases, so does the eye’s visual acuity or ability to discern smalldetails. The pupil’s diameter decreases and therefore increases the depth of focus inthe same way as a standard camera lens when the aperture is adjusted. An increase inluminance of an object or display will also make the eye more sensitive to flicker.
Contrast describes the relationship between light emitted from an object andlight emitted from the surrounding background. It is defined as the difference
92 4 Behavior: Basic Psychology of the User

between the luminance of the object and its background divided by the luminanceof the background, as shown in Eq. (4.1).
Object Luminance� Background luminanceð Þ=Background Luminance ð4:1Þ
The contrast will be positive if the object is emitting more light than thebackground and negative if the background is emitting more light than the object.Objects can therefore be described as having positive or negative contrast.
Brightness is a subjective response to light. There is no real means of measuringabsolute levels of brightness but, in general, a high luminance from an objectimplies a high brightness. It is possible to experience odd effects at high-to-lowbrightness boundaries, as shown in the left part of Fig. 4.7, which is called aHermann grid. Designers should be wary of creating effects like the Hermann grid(in the center of Fig. 4.7) because they can be distracting. Adding color or shadingcan remove this effect. Indeed, the design of folders on most modern desktopsavoids this by increasing the spacing of the icons both vertically and horizontally,but this choice costs display space.
Related to the Hermann grid are the concepts of figure and ground: figure refersto the objects that are to be attended to; ground refers to the background objects. InFig. 4.7 the boxes and files are the figure and the white background is the ground.When the objects are placed too close together, however, the perceived gray fillthat results can become more prominent and appear to be part of the figure. It isimportant to consider keeping objects that are figure prominent, and maintaining auseful ground.
The interpretation of Fig. 4.8 is based on figure and ground. If the white isperceived as the figure, it appears to be a vase or a goblet; if the black is the figure,it appears to be two heads.
The objects that you want the users to see or distinguish need to be appropri-ately sized. In good viewing conditions a minimal perceptible visual angle of about15 min of arc should be maintained and in poor viewing conditions this should beincreased to 21 min. These correspond to a 4.3-mm object and a 6.1-mm object,respectively, viewed from 1 m.
The full field of view for a stationary forward looking eye covers about 208�horizontally (although it is blocked by the head and the nose at certain points), andabout 120� vertically. This only refers to light falling on the eye, and does not
File1 File2
File5 File6
File3 File4
File7 File8
File9 File10
File13 File14
File11 File12
File15 File16
File1 File2
File5 File6
File3 File4
File7 File8
File9 File10
File13 File14
File1 1 File12
File15 File16
Fig. 4.7 A Hermann grid on the far left. In the center a similar effect in a file system. Addingshading and color removes the effect on the right
4.4 Low Level Visual Perception 93

necessarily mean that something will be seen when the signals are further pro-cessed. The field of view is an important factor in determining the size of aparticular display screen or the layout of displays and control equipment.
4.4.2 Color Vision
Color is the result of perception, and is not an intrinsic part of an object. Thecorollary of this is that, under different lighting or contrast conditions, the apparentcolor of an object will change. There are some terms that you should be aware ofwhen thinking about color vision.
Lightness is a measure on the black–white dimension of how close to white thecolor is (100% is white, or bright). The amount of color that there is in the light isdescribed by its saturation, which refers to the purity of the sensation as opposedto grayness: the higher the saturation, the higher the purity of color. Hue is pri-marily dependent on wavelength; it is closest to the way that the term color is usedin everyday language.
If the wavelength of visible light is varied over its range (400–700 nm), withconstant luminance and saturation, a person with normal color vision can distin-guish about 1,200 differences in color. If luminance and saturation are also varied,approximately 8,000 differences in color can be distinguished. When the viewingis carried out in isolation by a person with normal color vision, however, only 8–10
Fig. 4.8 A Rubin vase thatcan be interpreted as a vase ortwo heads facing each other
94 4 Behavior: Basic Psychology of the User

different colors can be identified accurately without training. If you need more than8–10 distinct colors you may need to use texture or text to provide features toassist the user in discriminating between them.
People’s sensitivity to color is not uniform across their field of view. The eye isnot sensitive to color at the periphery of vision. Accurate discrimination of color isonly possible to around 60� from the straight ahead position (with the head and theeyes stationary) and the limit of color awareness (as opposed to discrimination) isapproximately 90� from the straight ahead position. The eye is best suited to theperception of yellow-green light, and color is only well perceived in foveal(central) vision. It is least sensitive to red, green, and yellow light at the peripheryof color vision where it is most sensitive to blue light. This variation in sensitivityarises from the way that the rods and cones are distributed in the fovea.
Perceptions of a particular color are affected by prolonged exposure to othercolors—this is because different cones are responsive to different dimensions ofcolor (e.g., red–green or yellow–blue). Looking at red light, for example, causesthe red cones to become adapted, so the red light reduces in salience. This is oftenseen in color after effects, or afterimages. There are also several visual illusionsyou may have seen where you first stare at a picture or a display until the colorsapparently disappear, and then when you look at another picture or a blank piece ofpaper the complementary colors appear.
Color constancy refers to the situation in which we attempt to perceive colors asbeing the same even when they are different. Our clothes do not change color whenwe go indoors, for example. The wavelengths hitting the retina may have changed,however, and the reflected light will be different, although we will still perceivethe colors to be the same. Vegetables and meat in supermarkets are one of the mostcompelling examples of constancy not working—stores tend to be lit so thatobjects give off particular wavelengths—when you get home with differentlighting the colors are substantially duller.
4.4.3 Color Blindness
It is important to be aware of color blindness (or, more strictly color visiondeficiency) because around 7% of Western men and 0.5% of Western women arered–green color deficient. In other words they are bichromats, because they canonly distinguish two primary colors (typically they cannot tell red from green).Other cues, such as brightness, can be used to help distinguish red from green.
Most of us can discriminate between all three primary colors (red, green, andblue), and are known as trichromats because we have three types of cones forseeing color. Quadchromats appear to have better color discrimination underdifferent lighting conditions, but see the same colors. Many animals are mono-chromats: they cannot distinguish any colors because they have only one set ofcones (or just rods). They hence perceive the world in monochrome.
4.4 Low Level Visual Perception 95

4.4.4 Color Systems
There are many theories of how we perceive color (Sekuler and Blake 2005).There are a lot of technical details and tools available which allow us to makequite strong predictions about color perception. For our purposes, the mostimportant thing to remember is the high level distinction between the two waysthat we perceive color: additive and subtractive.
Computer displays use projected light (for the most part) and printed paper usesreflected light. Projected light uses a different set of primary colors, the additivecolors of red, green, and blue (often referred to as RGB), while reflected light usethe subtractive colors: cyan, magenta, and yellow (with black as the key color,which is why they are often referred to as CMYK). The additive colors start fromblack, no light, and then add colors to get other colors, and then, when all areadded, white is produced. The subtractive colors remove colors from white,effectively reducing the amount of light that is reflected, and ending up at black.Thus, with current technology it is hard to get a pure black color on a displayscreen (at least some of the lights tend to stay on), although it is possible to getcloser to pure black using subtractive colors.
The colors from printed materials cannot completely match the colors from ascreen because of the way the two different color systems work. There are sometools available that can help you make the two match more closely, however, butin the end the choice of how closely you make them match may be down topersonal preference.
4.4.5 Flicker
People are sensitive to flickering lights. The flicker can be made imperceptible,however, by using rates that exceed the flicker fusion rate. In the early days of themovies, cinema films ran at a frame rate below the flicker fusion rate, which is whyany movements appear jerky and you can still detect the flicker (which explainswhy they were often referred to as the flicks). In modern cinema, the flickerproblems is overcome by typically showing films at 24 frames per second, with theimage being presented twice per frame on two-blade shutter projectors, and threetimes per frame on three-blade shutter projectors.
It should be noted, however, that lights which flicker at a rate of 7–10 cycles persecond1 can trigger epileptic fits in some people. Series 500 of the ISO 9241standard on ergonomics of human–computer interaction is a guideline thataddresses this issue for display screen equipment, and you sometimes hearwarnings about flickering lights and images before they appear during a television
1 You will also see this measure in Hertz: 1 Hz is 1 cycle per second.
96 4 Behavior: Basic Psychology of the User

program. The effect of flicker in system design is decreasing as the refresh rate ofmost displays are so fast that flicker is becoming less of a problem.
4.4.6 Pop-Out Effects
One of the most useful applications of vision to interface design is to takeadvantage of how the eye searches. One of the most useful effects is that certainstimuli ‘pop out’ from other stimuli. Figure 4.9 shows that with a bunch of Cs, Tspop-out, and Os do not pop-out. Similar effects can be found for color, and a fewother features (Treisman and Gelade 1980).
Figure 4.10 shows an application of this and a few other effects. First, you havesome object recognition that occurs—a car and building and perhaps some signsare recognized. Then you have some automatic processes occur, you are expert atreading so words appear as well, and these pop-out to a certain extent. You alsohave the ability to read words, and these appear. Expertise and previous experiencealso counts. If you have not heard of French Connection—UK (FCUK), yourautomatic processes may read it as something else. This result is not a true pop-outeffect, but it is a related phenomenon, the word completion effect.
Providing multiple encoding of search items also helps in a visual search(Garner 1974). In Fig. 4.11 targets are encoded in several ways using multiplefeatures. Highlighting visual targets using just two discriminating features oftenhelps users find them, particularly if the encoding is not taught to users but is justinherent in the interface.
Some feature differences will pop-out to users (Treisman and Gelade 1980).Differences in color, when there is not much color, and straight line segments in aset of smooth curves will both pop-out. Partially open circles will not pop-outwhen mixed with circles and slight changes in size will not pop-out. Figure 4.11
C C C C C C C C C C C C C C C C C C C C
C C C C C C C C C C C C O C C C C C C C
C C C C C T C C C C C C C C C C C C C C
C C C C C C C C C C C C C C C C C C C C
C T C C C C C C C C C C C C C C O C C C
C C C C C C C C C C C C C C C C C C C C
Fig. 4.9 The left half of the figure shows a bunch of Cs and Ts. The right half shows a bunch ofCs and Os. You should be able to see that the Ts pop-out from the Cs whereas the Os do not
4.4 Low Level Visual Perception 97

has the targets modified with some differences that will pop-out and some dif-ferences that will not pop-out.
Pop-out effects can be used to highlight spelling mistakes (as shown inFig. 4.12), to highlight a target file within a folder, and to highlight target words onweb pages during a search.
Fig. 4.10 Sign for French Connection-UK, taken in Bath, England. Note the effects of automaticprocessing, the word completion effect, on multiple sets of letters in this picture
C C C C C C C C C C C C C C C C C C C C
C C C C C C C C C C C C C C C C C C C C
C C C C C C C C C C
C C C C C C C C C C C C C C C C C C C C
C C C C C C C C C C C C C C C C O C C C
C C C C C C C C C C C C C C C C C C C C
C C C C C Z C C C C
Fig. 4.11 A picture showing a bunch of Cs and a Z and an O with the Z and O in bold,highlighted, slightly larger to provide three features that can pop-out. The Z has more featuresdifferent so it will pop-out more easily. The O without the shading would be harder to find
98 4 Behavior: Basic Psychology of the User

Fig. 4.12 Example uses of visual encoding to highlight spelling mistakes. On the left, a mailsystem underlines and makes the misspelled word appear in red; on the right, Microsoft Wordputs a wavy red line under the word
Fig. 4.13 The use of color and luminance on aircraft displays facilitates the finding of particularinformation (this will be less apparent in b/w versions of this figure!)
4.4 Low Level Visual Perception 99

4.4.7 Implications for System Design
It has long been a rule of thumb that you should use color sparingly on displayscreens. In other words, you just use color to emphasize the things that areimportant. If your system has displays that rely on widespread use of color, andthere is meaning associated with the different colors, you should check to makesure that the exposure to the dominant color on the screen is not adverselyaffecting the perception of some of the other (possibly more important) colors.
When you do use color to encode items on a display, you need to make sure thatthe users can perceive the colors that you are using. Figure 4.13, for example,shows how color can be used to help users find information. The artificial horizondisplay above the throttle levers has blue sky and brown ground. The centerdisplays have green and yellow and orange text to help separate information. Ifyou are designing safety critical systems or interfaces used by a wide range ofusers, you should consider using redundant information to help people with red-green color vision deficiency distinguish between these two colors on the screen.
If you are developing a system which must produce color print-outs, and thecolors and the differences between colors are important, you will have to take intoaccount the fact that the colors on the screen and on the print-out will appearsomewhat different. You will therefore need to find a way to make the two rep-resentations match as closely as possible, which may involve using third partysoftware. This process may be further complicated by the fact that different makesof color printer can produce print-outs of the same screen image that look different.
Nowadays the flicker rate of most display screens is high enough for the flickerto be imperceptible. There is some evidence, however, that the flicker rate canaffect how people read, because it changes the size of the saccadic eye movementsthat take place during reading (e.g., see Kennedy and Baccino 1995). If you aredeveloping a system which requires people to read large amounts of text from thedisplay, you may want to make sure that you choose display screen hardware thathas a flicker rate that minimizes the amount of interference on reading.
If you are designing a system where you need the user to focus on one (or more)particular items on a densely populated screen, you should consider whether youcan make those items pop-out from the display by appropriately changing some ofthe items’ features. There is a potential downside of working with densely pop-ulated displays too, in that there may be some items which pop-out of the displaywhen you do not want them to. In these cases you would have to consider how youcould make those items appear more similar to the surrounding items.
4.5 Higher Level Visual Perception
In addition to how low level aspects of the eye influence perception, there areseveral higher level aspects of vision that influence cognition. Several of the
100 4 Behavior: Basic Psychology of the User
results here have different interpretations, as to whether they are the result ofvision or the result of cognition. A comprehensive theory of the user wouldincorporate this interaction between vision and cognition. Being aware of thehigher level perceptual issues can help you design better interfaces.
4.5.1 Movement and Spatial Perception
Movement can be detected either by moving ourselves (even though the imagefalls on the same part of the retina) or by staying still whilst the image movesacross the retina. The processing of the stimuli related to body movements andvisual stimuli are combined because we can track a still object with our eyes whilemoving our bodies and yet be sure that it is still.
Above a certain speed of movement the eye can spontaneously track a movingobject. Ask someone to slowly wave a small light (about as bright as a lit match)around in a darkened room and follow it with your eyes. The movement of thelight will be seen even though no image is moving across the retina (because youreyes will keep it constantly on the retina). The periphery of the retina is the areamost sensitive to movement, but it is very difficult to identify an object at theextreme periphery of the field of view. The detection of a moving object in theperiphery of the eye is what usually initiates the movement of the eye in pursuit ofthat object so that it can be brought into focus on the fovea. Movement may also beperceived as afterimages when both the eye and the retinal image are stationary(this effect is due to adaptation of the motion detectors in the eye). Thus, the eyeand the brain combine their results to get this apparent motion.
4.5.2 Depth Cues
Spatial perception is determined from the muscular activity of the two eyes anddiscrepancies between the two images that are formed. When we want to display a3D image on a screen, we have to represent the 3D image using just twodimensions, although better 3D displays continue to appear. We can simulatedepth perception using the discrepancy between the two images, as well as theperceptual depth cues listed in Table 4.3.
In the real world, motion parallax may be one of the most important cues thatenable us to perceive distance and depth. It occurs when we move our heads fromside to side and we see objects displaced at different rates. Objects that are furtheraway appear to move more slowly than objects that are closer. In screen design,the trick is to move the viewpoint of the ‘‘camera’’ so that the image on the screenmoves according to the principles of motion parallax. This is not used in most non-game interfaces, although virtual reality systems provide it, and video gamesprovide it through motion of objects.
4.5 Higher Level Visual Perception 101

4.5.3 Subitizing
Figure 4.14 shows that the curve for counting objects presented visually in a psy-chology experiment (not that appear one at a time like train cars or a haptic situ-ation like counting coins in your pocket) has a bend on it at about between 3 and 4.Up to three objects, you recognize the number effectively, with about 50 ms dif-ference per object, above four and certainly at five, you have to count the objects, sothe time to respond increases by about 250–300 ms/object. The first part of thecurve is called subitizing, and is thought to be an effect of the architecture of theperceptual system.
Given the effect of subitizing, if you are passing sets of information to a user, orgiving them things to count, understand that smaller numbers are much faster torecognize and count than larger numbers. In a related effect, if you are counting
Table 4.3 Perceptual depth cues
Size The larger of two otherwise identical objects appears to be closer thanthe smaller one
Interposition If one object partially occludes a second object then the blocked objectis perceived to be behind and beyond the blocking object
Contrast, clarity andbrightness
Sharper and more distinct objects appear to be nearer, and duller objectsappear to be farther away
Shadow Shadows cast by an object provide some cues about the relative positionof objects
Texture As the apparent distance increases, the texture of a detailed surfacebecomes less grainy
Motion parallax When moving one’s head from side to side the objects one sees aredisplaced at different rates
Stereoscopic depth Two images of the same object from slightly different angles arepresented separately to each eye. Perceived depth is induced throughthe fusion of the two images. This is often used in virtual reality
Fig. 4.14 The time to countobjects as the number ofobjects varies from one toeight. Counts from one tothree are substantially fasterper item than for five andgreater (reprinted withpermission from Peterson andSimon 2000)
102 4 Behavior: Basic Psychology of the User

based on a fixed number of objects you can track, then you cannot expect users tofollow more than three or four objects on the screen.
4.5.4 Gestalt Principles of Grouping
The Gestalt principles of visual grouping (listed in Table 4.4) can be used toexplain how groups of objects are interpreted. The principles were developed as arebellion against the simplistic notion that perception could be structurally ana-lyzed into its component parts, and that complex ideas were the result of associ-ating together simpler ones. This simplistic view dominated psychology in the latenineteenth and early twentieth centuries. The Gestalt principles allow that thewhole can be more than just the sum of the parts.
Gestaltists focused on the fact that there are important aspects of form andstructure. We see the world as composed of discrete objects of various sizes thatare seen against a background comprised of textured surfaces. The spatial andtemporal relationships between elements are as important as the absolute size,location, or nature of the elements themselves, and a sensation-based account ofperception fails to capture this. Some of the principles of visual grouping areillustrated in Fig. 4.15.
4.5.5 Other Theories of High Level Visual Perception
There are several other views of visual perception apart from the psycho-physi-ological one we have described. These views tend to deal more with perception-as-phenomenological-experience or perception-in-information-processing rather than
Table 4.4 The Gestalt principles of visual grouping
Proximity Elements that are close together appear as groups rather than as a randomcluster of elements
Similarity Elements with the same shape or color are seen as belonging togetherCommon fate Elements which appear to move together are grouped togetherGood continuation,
continuityElements that can be grouped into lines or shapes will be
Closure Missing parts of the figure are filled into complete it, so that it appears asa whole
Symmetry Regions bounded by symmetrical borders tend to be perceived ascoherent figures
Figure-ground The geometric organization that is perceived is the one with the best,simplest, and most stable shape. For example, four dots arranged as ifthey were at the corners of a square will be perceived as a squarerather than a triangle plus an extra dot
4.5 Higher Level Visual Perception 103

perception-as-registering-and-coding-sensation. They include the Constructivist,the Ecological, and the Active Vision approaches.
In the Constructivist approach, seeing is regarded as an active process in whichour view of the world is constructed from a combination of information in theenvironment and previously stored knowledge. So, what we get from our eyes isnot a 2D visual representation of the world like a photograph. Instead, the visualsystem constructs a model of the world by transforming, enhancing, distorting,seeking, and discarding information. In doing so, the visual system provides uswith a much more constant view of the world than if we were simply to ‘‘see’’ theimages produced on our retinas. So, when we move about (e.g., walk down astreet), buildings appear stationary and people appear to be approximately thesame size and shape—despite the fact that their actual relative images on the retina
Proximity groups the left hand dots
Similarity makes the left hand dots belong together more
Good continuation makes the line of dots appear to continue through the rectangle
Closure makes the circle appear whole
Surrounded by a box, the dots look more like a group
Symmetry and equal size make the dots look more like a group (and helps the
illustrations and captions group in this figure)
Orientation makes the dots on the left look more like a group
Fig. 4.15 Several illustrations of the Gestalt principles of visual grouping
104 4 Behavior: Basic Psychology of the User

may be quite different. In the same way, our ability to perceive objects displayedon computer screens, for example, whether they are text or graphics, 2D or 3Drepresentations, is a result of our prior knowledge or our expectations as to whatshould appear as well as what lands on our retinas.
In the Ecological approach (e.g., Gibson 1979), the process of seeing is greatlyinfluenced by what uses (affordances) the object perceptions suggest. Thisapproach, which is also called direct perception, stems from work with aircraftpilots. It takes as its starting point not a retinal image that is passively sensed, butthe ambient optical array that the observer samples. Perception and actions areseen as tightly interlocking and mutually constraining.
In the Active Vision approach, Findlay and his colleagues (e.g., Findlay andGilchrist 2003) build on the Ecological approach, but emphasize the role ofcognition in controlling vision. This view opposes the idea of just taking scenesand analyzing them, and instead incorporates the notion of interacting with scenes.In interacting, the eye (and brain) chooses where to look next based on what hasbeen focused on before and what was seen in those locations.
4.5.6 Implications for System Design
If you are designing a system where the three-dimensional positioning of items onthe display is important, you will need to decide which perceptual depth cues youshould use. The final choice is likely to depend on the context in which the displayscreen will be used, as different lighting conditions can affect the way that thedisplayed image is perceived, so if you only use narrow and quite pale shadows,for example, these may not be very obvious in brightly lit conditions.
For critical systems, if the user has to undertake a task which involvesresponding to the number of target items that appear on the display screen, youwill need to consider how to display those target items. If the number of items isvery low, the users will be able to react very quickly. If the number is very large,however, you may need to think about organizing them in some way (using theGestalt principles, perhaps), or even splitting them across displays to optimize theresponse time.
At present, most display screens offer one level of resolution, such that all itemson the display are presented with that resolution irrespective of their importance. Ifyou are designing a system which requires an increased level of detail for itemsthat are currently being used (perceived) then you may want to consider thepossibility of using gaze-contingent multi-resolution displays (Reingold et al.2003). These displays maximize the resolution at the part of the screen where theuser is currently looking. This approach can provide a much more detailed imagefor a given bandwidth because more pixels (and information) are allocated to whatthe user is currently looking at, rather than effectively wasting pixels by providingan unnecessary level of detail for items that the user is not currently looking at.
4.5 Higher Level Visual Perception 105

When people are designing displays which involve items that need to begrouped together they often include them within some form of container (usually abox). The Gestalt principles suggest, however, that careful placement of the itemswill also be sufficient to determine how they are perceived by the user. The lawsalso suggest that careful attention needs to be paid to how you lay out items on adisplay, because you can, unwittingly, end up with unrelated items being perceivedas being related simply because of their relative placement.
4.6 The Auditory System
For normally sighted and hearing people, hearing is the most important sense aftervision in any interaction. Most people can hear sound in the frequency range20 Hz up to 20,000 Hz, but both the upper and lower frequency limits tend todeteriorate with age and health. Hearing is more sensitive within the range1,000–4,000 Hz, which in musical terms corresponds approximately to the top twooctaves of the piano keyboard, and represents much of the range of the humanvoice.
Thus, the stimulus for audition is any vibration that will set the ossicles (smallbones) of the ear in motion between about 20 and 20,000 Hz. Ordinarily, thismeans vibrations of the air but vibrations transmitted through other bones (par-ticularly the skull) also contribute to auditory sensation. (Having a tooth extractedor drilled will almost convince you that the jaw was designed to transmit vibra-tions to the ear in the most efficient manner possible!) There are now headsetsavailable that use direct bone conduction as a way to transmit sound in noisyenvironments.
4.6.1 Theoretical Description of Sound
It is convenient to consider the stimulus for sound to be made up of successivecompressions and rarefactions (expansions) of air that follow a waveform overtime. An example is shown in Fig. 4.16.
Waveforms like that in Fig. 4.16 can be summarized as being made up of sinewaves (they look a lot like the first part of the waveform in Fig. 4.16 but aresmoother and follow the sine function used in trigonometry). There are at least tworeasons for using the sine function. The first is that they are easy to create; a pure toneproduced by an electronic oscillator or a tuning fork follows a sine wave. The secondand more important reason is that theoretically a wave of any shape can be analyzedinto component sine waves. This is known as Fourier analysis. Figure 4.17 providesa simple example. Work with sine waves thus provides a standard for comparisonacross different types of sounds.
106 4 Behavior: Basic Psychology of the User
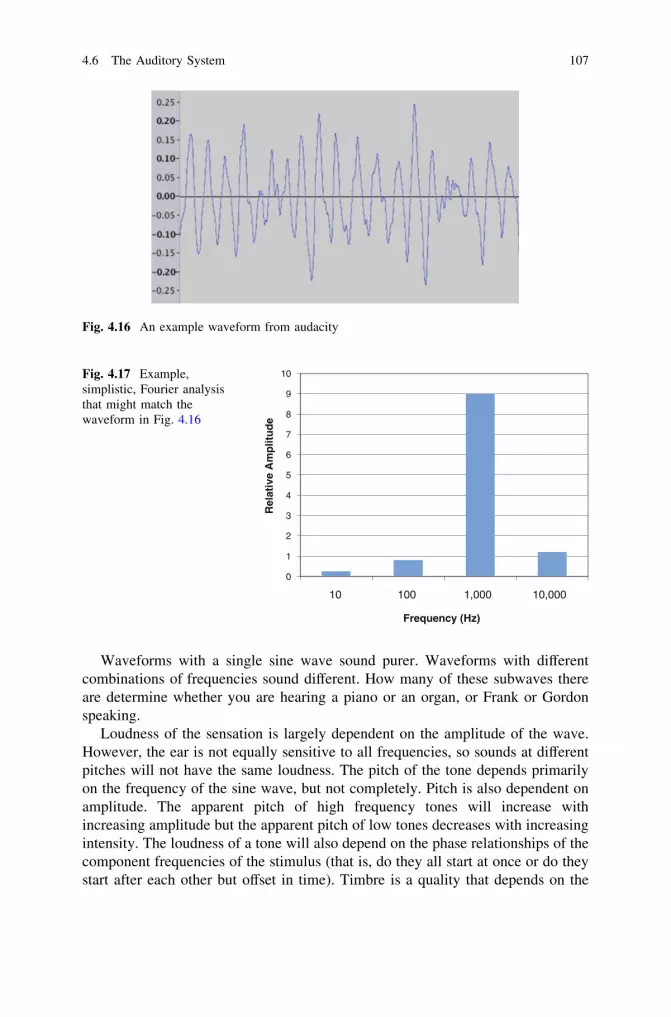
Waveforms with a single sine wave sound purer. Waveforms with differentcombinations of frequencies sound different. How many of these subwaves thereare determine whether you are hearing a piano or an organ, or Frank or Gordonspeaking.
Loudness of the sensation is largely dependent on the amplitude of the wave.However, the ear is not equally sensitive to all frequencies, so sounds at differentpitches will not have the same loudness. The pitch of the tone depends primarilyon the frequency of the sine wave, but not completely. Pitch is also dependent onamplitude. The apparent pitch of high frequency tones will increase withincreasing amplitude but the apparent pitch of low tones decreases with increasingintensity. The loudness of a tone will also depend on the phase relationships of thecomponent frequencies of the stimulus (that is, do they all start at once or do theystart after each other but offset in time). Timbre is a quality that depends on the
Fig. 4.16 An example waveform from audacity
0
1
2
3
4
5
6
7
8
9
10
10 100 1,000 10,000
Frequency (Hz)
Rel
ativ
e A
mp
litu
de
Fig. 4.17 Example,simplistic, Fourier analysisthat might match thewaveform in Fig. 4.16
4.6 The Auditory System 107

purity of the tone; is it made up of one single sine wave frequency or a broadmixture of frequencies? A tuning fork has a relatively pure tone and therefore littletimbre. On the other hand, a piano or other musical instrument has timbre becauseof the other frequencies present in its sounds. Different timbres are often assigneddifferent meanings by users, which may be important for your design.
Low tones of equal loudness appear to occupy more space and thus are said tohave more volume than high tones. On the other hand, high tones have a greaterdensity than low tones of equal loudness. The volume and density of tones are eacha joint function of intensity and frequency of the tones. However, they seem to beas real as pitch and loudness which have simpler bases. In other words, listenershave no difficulty making reliable judgments of volume or density of tones thatdiffer in frequency and intensity.
Hearing can be likened to carrying out a type of Fourier analysis of the auditorystimulus, separating a complex wave into its sine wave components. There aresome situations where this analogy breaks down, such as when two stimuli ofapproximately equal intensity and frequency are simultaneously presented to theear. Instead of hearing both tones, as a linear Fourier analysis would allow, a singletone is heard which varies in loudness in a periodic manner. You may have heardthis when two people sing together or two instruments are played together. Theeffect can be pleasant or unpleasant depending on the frequency of the beats.
The basis of beats is the following. If you have a pure tone of 256 Hz and anotherof 257 Hz, each one would produce a steady pitch that would be difficult to dis-tinguish from the other. When the two are played together the compressions andrarefactions (expansions) of the air produced by the two tones will at some point bein phase (synchronized) and the two tones will add together. However, because thefrequency of one is slightly greater than the other, they will get out of phase after awhile and their effects will cancel each other out. As this process repeats, they willgo in and out of phase as many times per second as the difference between the tonesin cycles per second. In this example, it would be once per second and so you willhear one beat per second. This provides a very accurate way of measuring thedifference between two tones, far better than the ear could discriminate if the twotones were presented separately. This fact is used to good effect by piano tuners.They tune one note until it no longer beats with the standard tuning fork. Then theother notes are tuned until their harmonics do not beat with the first note.
4.6.2 Measuring Sound
Sound intensity is normally measured using the deciBel scale. This is a relativelogarithmic scale where 10 decibels (dB) = 1 log unit ratio of energy, or a Bel(name after Alexander Graham Bell). To give some practical examples, thethreshold of hearing is 0 dB, a whisper registers 20 dB, and normal conversationregisters between 50 and 70 dB.
108 4 Behavior: Basic Psychology of the User

The intensities of various common sounds are shown in Fig. 4.18. The sensi-tivity to both frequency and loudness varies from person to person. Generally,though, the ear is insensitive to frequency changes below about 20 dB (i.e., belowa whisper). Once levels get above 90 dB (as shown by the line in the table),prolonged exposure can lead to permanent hearing loss. This level is often sur-passed by some industrial jobs, and by the iPods and MP3 players of those peoplewho have the volume control turned up excessively high.
This scale does not describe perceived loudness well. Increasing an auditorystimulus by equal ratios does not produce equal increments in sensation. It isobvious that the difference in loudness between a whisper and a normal conver-sation is less than the difference between a normal conversation and a subwaytrain. What is said, the context, and background noise also influence perceivedloudness. However, the ratio of the energy in a whisper to that in a conversation isabout the same as the ratio in conversation to that of the noise of a subway train.This explains why a 100-W stereo is much louder than a 1-W pocket radio, and a200-W stereo is not much louder than a 100-W stereo. The corollary of this is thatwhen measuring loudness, asking people to directly estimate apparent intensity of
Fig. 4.18 Example sound levels (in decibels). a [140] Rock band (amplified) at close range;b [120] Loud thunder or fireworks; c [100] Jet plane at 500 ft; d [100] Subway train at 20 ft; [90](not shown) Potential for permanent hearing loss; e [80] Busy street corner; f [60] Normalconversation; g [40] Typical room; h [20] Whisper; [0] (not shown) Threshold of hearing
4.6 The Auditory System 109
loudness (known as magnitude estimation) is often the best way to quantifysounds, at least for interface design.
4.6.3 Localizing Sound
People are generally poor at using spatial cues to successfully localize sounds(Catchpole et al. 2004; Kubovy and van Valkenburg 2001). The idea that locali-zation is based on inter-aural time differences at low frequencies and inter-auralintensity differences at high frequencies is called the ‘duplex’ theory and datesback to Lord Rayleigh (1907), a pioneer in perception. This does not hold forcomplex sounds.
We can identify the location of a sound from the time taken for waves to reachthe ears, coupled with information from head and shoulder movements. Soundreaching the far ear will be delayed in time and will be less intense relative to thatreaching the nearer ear. Thus, there are two possible cues as to the location of thesound source. Owing to the physical nature of the sounds, these cues are notequally effective at all frequencies.
Low frequency sounds have a wave length that is long compared with the sizeof the head, and this ‘‘bends’’ the sound around the head very well. This process isknown as diffraction, and the result is that little or no shadow is cast by the head.On the other hand, at high frequencies where the wavelength is short compared tothe dimension of the head, little diffraction occurs. A ‘‘shadow’’ almost like thatproduced by a beam of light occurs.
Inter-aural (between-ear) differences in intensity are negligible at low fre-quencies, but may be as large as 20 dB at high frequencies. This is easily illus-trated by placing a small transistor radio close to one ear. If that ear is then blockedwith a finger, only the sound bending around the head and entering the other earwill be heard. The sound will be much less ‘‘tinny’’ because high frequencies willhave been attenuated more than low; the head effectively acts like a low pass filter(allowing only low frequency sounds). Inter-aural intensity differences are thusmore important at high frequencies than at low ones.
If a tone is delayed at one ear relative to the other, there will be phase differencesbetween the two ears (the peaks of the waves will arrive at different times). If nerveimpulses occur at a particular phase of the stimulation waveform, the relative timingof the nerve impulses at the two ears will be related to the location of the soundsource. This is used to locate ‘‘wide’’ sounds. However, for sounds whose wave-lengths are comparable with, or less than, the distance between the two ears therewill be ambiguity. The maximum path difference between the two ears is about23 cm, which corresponds to a time delay of about 690 ls. Ambiguities occur whenthe half wavelength of the sound is about 23 cm, i.e., when the frequency of thesound is about 750 Hz. A sinusoid of this frequency lying to one side of the headproduces waveforms at the two ears that are in opposite phase (phase difference
110 4 Behavior: Basic Psychology of the User

between the two ears of 180�). From the observer’s point of view, the location of thesound source is now ambiguous, because the waveform at the right ear might beeither a half-cycle behind that at the left ear or a half-cycle ahead. Head movementsor movement of the sound source may resolve this ambiguity, so that there is noabrupt upper limit in our ability to use phase differences between the two ears.However, when the wavelength of the sound is less than the path difference betweenthe two ears, the ambiguities increase; the same phase difference could be producedby a number of different source locations.
There are two different mechanisms for sound localization: one operates best athigh frequencies and the other at low frequencies. For middle frequencies neithermechanism operates efficiently, and errors are at a maximum. Stevens andNewman (1936) investigated localization of single bursts with smooth onsets andoffsets for observers on the roof of a building so that reflection was minimized.The listeners had to report the direction of the source in the horizontal plane, to thenearest 15�. Although left–right confusions were rare, low frequency sounds infront were often indistinguishable from their mirror location behind. If these front–back confusions were discounted, then the error rate was low at very low and veryhigh frequencies and showed a maximum for mid-range frequencies (around3,000 Hz). Intensity differences are more important at high frequencies, and phasedifferences provide usable cues for frequencies below about 1,500 Hz.
4.6.4 Discriminating Sounds
Our abilities in discriminating sound depend upon whether we mean absolute dis-crimination or relative discrimination (this applies to vision too). Absolute dis-crimination is quite poor (e.g., systems should not rely on remembering a tone orsound), but relative discrimination is very good. With sounds we can remember nomore than five to seven items for absolute discrimination unless we can attachmeaning to them, such as pitch labels. Also, as we vary more of the dimensions of thestimulus (increasing its complexity), so we increase our ability to discriminate (up to150 sounds—varying in frequency, rhythm, location, duration, volume, etc.).
4.6.5 Implications for System Design
There are two ways in which sounds are used in current systems. The first is toprovide voice output. The second is to provide audible alerts, such as telephonering tones, and audible alarms.
Voice outputs generally require more processing than plain sounds. They canconvey much more information, however, and they are particularly important forpeople with impaired vision. Blind users, for example, use voice output withscreen readers so they can process the text shown on a display screen.
4.6 The Auditory System 111

In general it is said that automated female voice output is easier to understand.If you are designing a system that requires voice output, the rule of thumb isusually to prefer a clear, slightly high, female voice if you can only choose one. Ifyou have a system that produces multiple voices in the same task context, how-ever, you will need to think more deeply about your choices. First, and foremost,however, you will need to choose voices that are easily discernible from eachother. If your system has a sophisticated speaker system, you may also be able toseparate the voices spatially.
You will also need to take account of the geographical context in which yoursystem will be used. If your system is being deployed in the UK, for example,users may prefer the system to use a voice that has a British accent. Personalpreferences can play a role too, so you may want to allow your user to select whichvoice output should be used. Indeed, many motor vehicle satellite navigation(satnav) systems now allow you to choose the voice that will be used to offer youverbal directions on how to reach your travel destination.
Like sight, hearing generally diminishes with age. If you are designing a systemfor a population that will include older users, you will need to take the possiblereduced hearing levels into account when selecting voices and sounds to use asoutput. Some mobile phones by default include ring tones that can compensate forhearing loss in older people.
Audible alarms are supposed to be designed to alert the user to abnormal orundesirable situations. In many cases the audible alert is used in addition to avisual alert. If you want to quickly attract your user’s attention in an emergencysituation, the easiest way is to use square-ended, sudden onset waveforms such asklaxons or bells to provide audible alarms. The problem is that they evoke a startlereaction, and if the sound is at high volume it can even cause panic. The design ofaudible alerts requires great skill because you want to make sure that your usersprocess the meaning of the alert rather than focusing on trying to stop the loud,incessant noise. The alarm sound needs to be distinctive so that users can recog-nize it and recall its meaning. If you are trying to convey urgency, you shouldavoid high intensity sounds, and instead consider the speed of the alarm sound: atri-tone alarm, for example, which doubles in speed, will suddenly sound veryurgent.
4.7 Motivation
4.7.1 Introduction
Now that you know some of the basics about how humans behave, it is alsoimportant to be aware of why they behave in particular ways. Generally there aretwo reasons why people act in a particular way. The first is governed by the central
112 4 Behavior: Basic Psychology of the User

nervous system: if someone blows a puff of air into your eyes, for example, youautomatically blink. We have no conscious control over these sorts of actions.
The second reason is where people make a deliberate decision to perform aparticular act. One of the influencing factors that determines not only their action,but how well they perform it is their motivation: motivation is something that drivesbehavior. It cannot be used as a singular explanation for why people do things,however, because behavior is also influenced by needs, incentives, expectations,and the presence of conflicting motivations, as well as unconscious factors.
Motivation is usually considered from three aspects: the physiological, thebehavioral, and the psycho-social. Here we provide a brief introductory overview,so that you can start to understand why an individual user behaves in a particularway. This may be particularly useful if you are designing gaming software, forexample, where you want to keep the user engaged by providing the appropriatemotivation for them to carry on playing. We will return to the topic of motivationin Chap. 8 to discuss how it plays out in team settings.
4.7.2 Maslow’s Hierarchical Theory
Perhaps the best known theory of motivation is Abraham Maslow’s (1943)Hierarchy of Needs. The simplest way to visualize the hierarchy is as a pyramid asshown in Fig. 4.19, although Maslow never presented a figure.
At the bottom of the pyramid are the basic, physiological human needs likebreathing, food, sleep, and excretion. These are fundamental to human existence.Above that, in order, are safety, love and belonging, and esteem, with self-actu-alization at the very top. Each level requires that the level below it be mostlysatisfied. Maslow also believed in what he called metamotivation—the motivationof people for continual personal improvement.
People are orienting towards, and try to satisfy, more than one of these levels atthe same time. It is likely that motivations that appear lower in the pyramid willdominate those that appear at a higher level (e.g., eating when you are hungry orgoing to the bathroom when you feel the need would likely win out over doingsomething to improve your self-esteem). Whilst there have been many theories ofmotivation proposed since Maslow’s, his basic ideas remain popular.
4.7.3 Extrinsic and Intrinsic Motivation
The basic needs—those towards the bottom of Fig. 4.19—are met for designersand many users, so the higher level needs are the focus of attention from ourperspective. In his book, Drive, Pink (2009) presents a summary of motivational
4.7 Motivation 113
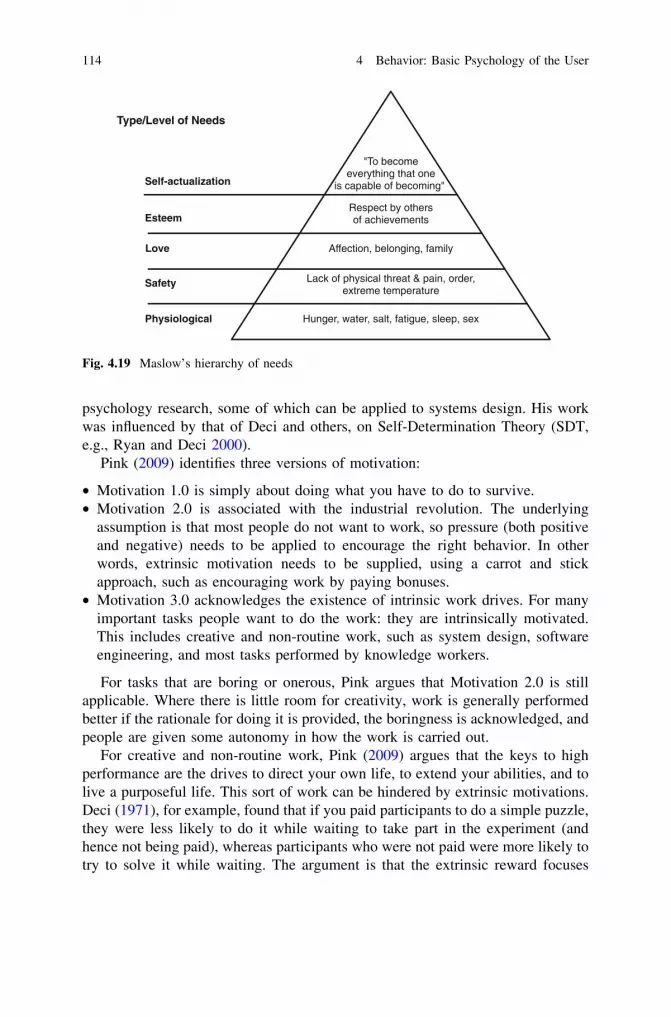
psychology research, some of which can be applied to systems design. His workwas influenced by that of Deci and others, on Self-Determination Theory (SDT,e.g., Ryan and Deci 2000).
Pink (2009) identifies three versions of motivation:
• Motivation 1.0 is simply about doing what you have to do to survive.• Motivation 2.0 is associated with the industrial revolution. The underlying
assumption is that most people do not want to work, so pressure (both positiveand negative) needs to be applied to encourage the right behavior. In otherwords, extrinsic motivation needs to be supplied, using a carrot and stickapproach, such as encouraging work by paying bonuses.
• Motivation 3.0 acknowledges the existence of intrinsic work drives. For manyimportant tasks people want to do the work: they are intrinsically motivated.This includes creative and non-routine work, such as system design, softwareengineering, and most tasks performed by knowledge workers.
For tasks that are boring or onerous, Pink argues that Motivation 2.0 is stillapplicable. Where there is little room for creativity, work is generally performedbetter if the rationale for doing it is provided, the boringness is acknowledged, andpeople are given some autonomy in how the work is carried out.
For creative and non-routine work, Pink (2009) argues that the keys to highperformance are the drives to direct your own life, to extend your abilities, and tolive a purposeful life. This sort of work can be hindered by extrinsic motivations.Deci (1971), for example, found that if you paid participants to do a simple puzzle,they were less likely to do it while waiting to take part in the experiment (andhence not being paid), whereas participants who were not paid were more likely totry to solve it while waiting. The argument is that the extrinsic reward focuses
Type/Level of Needs
Esteem
Safety
Physiological
Love
Self-actualization
Hunger, water, salt, fatigue, sleep, sex
"To become everything that one
is capable of becoming"
Respect by others of achievements
Affection, belonging, family
Lack of physical threat & pain, order, extreme temperature
Fig. 4.19 Maslow’s hierarchy of needs
114 4 Behavior: Basic Psychology of the User

attention on that reward, which facilitates the behavior that the reward encourages,and generally damps other related behavior. Extrinsic rewards may work up to apoint, but beyond that, performance can start to decrease. Similarly, if people arefocused on the extrinsic reward and it is then withdrawn, this can also lead to areduction in performance.
The problem lies in achieving the right balance between extrinsic and intrinsicrewards. Pink suggests one way is to increase basic payments and reduce or eveneliminate bonus payments. His claim is that people will continue to increaseperformance if they are intrinsically motivated. In other words, they do the taskbecause they like doing it, or they feel a sense of altruism when they do it (TomsShoes in California, for example, donates a pair of shoes to needy children forevery pair that it sells), or they are given autonomy in what they do (Google, forexample, allows employees to spend 20% of their work hours on something new).
Based on his analysis of studies from psychology and behavioral economics,Pink identifies three elements of intrinsic motivation:
• Autonomy—the ability to choose what to work on, how to work on it, who towork with, and when to work on it. If you allow people to make these sorts ofdecisions they become more productive. Pink argues that autonomy leads toengagement, and engagement leads to mastery. It is not possible for every typeof situation, however, so some of the attributes are less mutable than others. Ifsomeone is operating a safety critical system in a nuclear power plant, forexample, you really do want them to follow the rules about how they work.
• Mastery—the desire to understand a process or task and to get better at per-forming it. Achieving mastery is most enjoyable when the task provides the rightlevel of challenge: too easy and it can become boring; too hard and it can createanxiety. The balancing of knowledge to work requirements is what Vygotsky(e.g., Chaiklin 2003) calls appropriate scaffolding or the Zone of ProximalDevelopment, and Csíkszentmihályi (1990) calls flow. It is not always easy tooperationalize these concepts, particularly in social settings, such as a classroomwith multiple learners. The desire to achieve mastery can be a powerful drive,although it is not universal. Users who want to become experts will want tounderstand the task and develop the skills needed to do it well. This drive can alsobe exploited for boring and difficult tasks as long as the user understands the needfor repeated drill exercises, or how the difficult tasks fit into the whole task.
• Purpose—this is really the desire to improve things; most people are at leastpartly purpose-driven. Under Pink’s Motivation 2.0 the purpose is related to theextrinsic motivation. In Motivation 3.0, however, the purpose is related tointrinsic motivation: people know why the task is important, and may even do itfree of charge. Emphasizing the goal of the task and its purpose can drasticallyinfluence performance. Working for the good of the company, your town, yournation, or the planet in this way can be more motivating than working formoney.
4.7 Motivation 115

4.7.4 Implications for System Design
How much you need to consider motivation during system design will depend onthree things: your particular users, the particular tasks they are doing, and theparticular context in which they are working. It is probably best to consider thesein reverse order, and think about the context first. If the context is a work setting,then there may be little or nothing that you can do to provide any motivation foryour users to do their tasks over and above the motivation they already get fromtheir company. If it is a leisure setting, however, then you will need to look at waysof engaging users in doing their tasks. You could offer virtual monetary rewards,for example, or badges of achievement to show that they had attained a particularlevel of proficiency at performing the task. Figure 4.20 summarizes this approach.
In terms of the particular tasks they are performing, there are more ways inwhich you can contribute in work settings. Given what you know about how visualperception and aural perception work, you can now start to think about how tomake important items stand out on a crowded screen (using pop-out effects), forexample, and how to design audible alarms that can be used to quickly identify aproblem (by making them distinctive). In this way you can help your users toimprove their task performance, and help them to achieve mastery.
In leisure settings your approach to dealing with the user’s tasks may be moreperverse, in that you do not want to make it too easy for your users to achievemastery. You want to make them engage with the game, for example, and spendtime and effort to attain any rewards, such as being able to progress to the nextlevel of attainment, on the way to achieving mastery.
Is the task
mostlyroutine?
Yes
No
Can you make the task more
challenging, less routine, or tied to a higher purpose?
Yes
* Focus on healthy environment and fair pay.
* Foster autonomy, mastery, and purpose.
* Avoid if-then rewards* Consider unexpected rewards
that offer praise and feedback, * Provide useful information rather
than control.
No
Use rewards, but:1. Provide reason for task2. Acknowledge it is boring3. Allow multiple strategies
Do so, and....
Fig. 4.20 When and how to use rewards based on theories in Pink (2009)
116 4 Behavior: Basic Psychology of the User

Finally, you need to think carefully about your users. People are different: someare driven mostly by extrinsic rewards (particularly money), whereas others maydo things for intrinsic rewards, such as the enjoyment or satisfaction they get fromdoing them.
4.8 Summary
This chapter has provided a more detailed theory of what information users getfrom their primary perceptual systems. Nearly all users interact through vision andsound, and a deeper understanding of how users get information from these sensesprovides numerous suggestions for how to improve systems.
Many designers start out with a theory that the eye is like a camera—and so it isin some ways, having a lens and a surface on which the image is registered (theretina). However, as with many metaphors and analogies, the use of the camerametaphor is problematic, and is often called ‘naive realism’. It is an inadequatetheory of perception.
There are some critical differences between cameras and photography and theeye and visual perception. These differences mean that there is not a simple one-to-one correspondence between the context of a scene and what we perceive. Themost important point is that light sensitivity varies across the whole of the retina. Itis best in the center of the retina, the fovea, and worst at the edges. The eye thushas to move (saccade) over the visual scene all the time to see the details. Usershave to actively do this, and if they do not know where to look or do not know howto interpret an object, they will not see what the designer intends.
If you want to view the eye as a camera, you have to view the eye as a very oddcamera. It has a more variable speed film (or sensor) to support wide changes inlight than you can buy. It has a poor focusing system (it has to be on the retina tobe well developed), and poor quality film over much of the remaining negative(rods). The user has to move the camera to see details. If you view it this way, youprobably have a reasonable model of the eye in mind, but a very odd camera.
Hearing is more straightforward. The differences between how the ear worksand folk psychology are less drastic. The ear is a little bit more sensitive than mostmight believe, and can distinguish a wide variety of sounds, but without attentionor training some sounds will not be distinguished.
In the future you will see (a) improved displays and (b) more attention given tothe integration of types of perception and action. In the first area, of improveddisplays, you will see continued improvement in the quality of displays. Soundappears to stop improving around 44 kHz sample rates; above that, increasing thequality of the sound is not very noticeable—CDs do not sound a lot different fromMP3 files, or so many consumers believe. A similar effect will be found as displaysget better, in that the eye can still see more than a display can show. When adisplay provides the details that the fovea can see across its whole surface, or when
4.7 Motivation 117

the display adapts to provide more details where the fovea is, the quality will reacha maximum.
In the second area, users integrate their senses—motion, sound, and vision.Current displays are not well integrated with users’ movements. This integrationwill be important for virtual reality (VR). Head-mounted displays move with theuser, and most do not compensate for this motion. The users feel their motion withtheir inner ear, and do not see this motion in the display (or, in some cases, seemovement but do not feel it with their inner ear). Over periods of time, sometimeseven short periods of times, this non-correspondence between eye and ear can leadto nausea. This mismatch can also appear when an interface is stationary and theuser is inside a moving vehicle. Examples include reading books in cars as well asusing displays in cars, trucks, and ships. The results are not directly dangerous butthey are debilitating and dangerous if the display is necessary for the vehicle.Work is ongoing to understand and ameliorate these effects.
Finally, you will need to think about how to motivate your users to do the tasksthey need to do. This will involve balancing their individual needs and aspirationswith an appropriate combination of extrinsic and intrinsic rewards if you want toget the best out of them.
4.9 Other Resources
For further descriptions of human perception and performance, it is worth con-sulting this text:
Boff, K. R. and Lincoln, J. E. (1988). Engineering data compendium: Human perceptionand performance. Wright-Patterson Air Force Base, OH: Harry G. Armstrong AerospaceMedical Research Laboratory. This set of three volumes covers the breadth of what wasknown about these areas of human behavior at that time. It remains useful because of itsbreadth.
There are several texts that will tell you more about visual perception. Two werecommend are:
Bruce, V., Green, P. R., and Georgeson, M. A. (2003). Visual perception: Physiology,psychology and ecology. Hove, UK: Psychology Press.
Sekuler, R. and Blake, R. (2005). Perception. (5th ed). New York, NY: McGraw-Hill.
An excellent introduction to eye movements and their relationship to attentionif offered by Goldberg and colleagues:
Goldberg, J. H. and Kotval, X. P. (1999). Computer interface evaluation using eyemovements: methods and constructs, International Journal of Industrial Ergonomics, 24,631–645. This provides comparative assessment of measures of eye movement locationsand scan paths used for evaluation of interface quality.
118 4 Behavior: Basic Psychology of the User

You can also get a broad overview of eye gaze and its relationship to attentionby looking at Navalpakkam and Churchill’s chapter available in a general textbookon HCI methods edited by Olson and Kellogg:
Navalpakkam, V., and Churchill, E. F. (in press). Eyetracking: A brief introduction. In J.S. Olson & W. Kellogg (Eds.), Ways of knowing, HCI methods. Heidelberg, Germany:Springer.
To learn more about auditory perception, hearing, look at this text:
Moore, B. C. J. (2013). An introduction to the psychology of hearing. (6th. Ed). Bingley,England: Emerald Group Publishing.
Also, a readable text by ex-leader of the band Talking Heads, David Byrne is‘‘How Music Works’’. It includes a very interesting, and very readable guide to theway that music (as an example of sound) works for the listener. It describes howboth analog and digital technology affect the way that we hear sounds, in additionto the context in which the sounds are played.
Byrne, D. (2012). How Music Works. Edinburgh, UK: Canongate Books.
To better understand how these basic perceptual capabilities affect how wethink, it is worth looking at John Anderson’s book on cognitive psychology.
Anderson, J. R. (2009). Cognitive psychology and its implications (7th ed.). New York,NY: Worth Publishers. This book includes information about where perception andcognition interact.
The Poynter Institute (http://www.poynter.org) has online tutorials to helpdesigners understand the complexities of color and its use in print and onlinejournalism. These tutorials include page design exercises, which let you experi-ment with the use of color in magazines, newspapers, and web sites. See alsoColor, Contrast and Dimension in News Design, https://www.newsu.org/courses/color-news-design (requires free registration).
Clayton Lewis and John Rieman’s shareware book: Task-Centered UserInterface Design, hcibib.org/tcuid, includes discussions about how to visuallydesign an interface to support users. They are familiar with vision, visual cogni-tion, and the application of this knowledge to interface design. Their view helpsextend how to apply this knowledge to interface design.
4.10 Exercises
4.1 To study the effects of color on perception you should generate 15–20 stimulifor people to look at on a smartphone. These all have to be items that theyhave to process in some way, so they could be short paragraphs to read, words
4.9 Other Resources 119

to say out loud or to categorize, or objects to name. The items should beprepared in both black and white and color.
Have a group of users do the task with both the black and white and colorobjects. Record the time it takes them to do the tasks and how many errorsthey make. You may have to vary the size of the objects to get these measuresto vary.
In addition to reporting what you find, you should indicate what the find-ings mean about displays and the use of color.
4.2 Choose six icons from popular or not so popular software packages. Alsochoose six menu items that are words (e.g., Format: Frame, File: Save, Insert:Date, Message: Reply, View: Master Document, Tools: Goal Seek, Edit:Copy) or choose icons from an online training system or training system suchas Rosetta Stone.
Ask six to ten people to tell you what they think each icon and each menuitem will do or represents. Summarize your results in a table as well as a set ofsuggestions for how to design interfaces. If you have access to a differentpopulation of users, people from different cultures, physical abilities, or ages,run the study on that population as well and compare their responses to yourclassmates.
4.3 Explain how signal detection theory can be used to analyze web site readingand searching. Based on this analysis, provide three suggestions for yourfavorite search engine or web site that includes search.
4.4 Redraw the signal detection curve in a big format. Either make the curves big,or put the signal and noise on separate lines to that they are easy to work with.Label the parts of the curves that make up hits, misses, false alarms, andcorrect rejections.
Redraw the curves with the signal being smaller. How does this affect thesetting of the threshold, or how does it influence how to set the threshold for agiven ratio of hits to false alarms?
4.5 Choose an online, social web site, such as Facebook, YouTube, or Yelp. Sketchseveral tasks that can be done by users with the site. Describe the intrinsic andextrinsic motivation(s) for users to perform those tasks. Do the same for anonline course site, and for an online game. Note some insights that arise.
References
Bowmaker, J. K., & Dartnall, H. J. A. (1980). Visual pigments of rods and cones in a humanretina. Journal of Physiology, 298, 501–511.
Catchpole, K., McKeown, J. D., & Withington, D. J. (2004). Localizable auditory warning pulses.Ergonomics, 47(7), 748–771.
Chaiklin, S. (2003). The zone of proximal development in Vygotsky’s analysis of learning andinstruction. In A. Kozulin, B. Gindis, V. Ageyev, & S. Miller (Eds.), Vygotsky’s educationaltheory and practice in cultural context (pp. 39–64). Cambridge: Cambridge University.
Csíkszentmihályi, M. (1990). Flow: The psychology of optimal experience. New York, NY:Harper and Row.
120 4 Behavior: Basic Psychology of the User

Deci, E. L. (1971). Effects of externally mediated rewards on intrinsic motivation. Journal ofPersonality and Social Psychology, 18(1), 105–115.
Duchowski, A. T. (2007). Eye tracking methodology: Theory and practice. London: Springer.Findlay, J. M., & Gilchrist, I. D. (2003). Active vision: The psychology of looking and seeing.
Oxford: Oxford University Press.Friedrich, M. B. (2008). Implementierung von schematischen Denkstrategien in einer höheren
Programmiersprache: Erweitern und Testen der vorhandenen Resultate durch Erfassen vonzusätzlichen Daten und das Erstellen von weiteren Strategien (Implementing diagrammaticreasoning strategies in a high level language: Extending and testing the existing model resultsby gathering additional data and creating additional strategies). Faculty of InformationSystems and Applied Computer Science, University of Bamberg, Germany.
Galanter, E. (1962). Contemporary psychophysics. In R. Brown, E. Galanter, E. H. Hess, & G.Mandler (Eds.), New directions in psychology (pp. 87–156). New York: Holt, Rinehart &Winston.
Garner, W. R. (1974). The processing of information and structure. Potomac, MD: Erlbaum.Gibson, J. J. (1979). The ecological approach to visual perception. Boston: Houghton Mifflin.Holmqvist, K., Nyström, M., Andersson, R., Dewhurst, R., Jarodzka, H., & van de Weijer, J.
(2011). Eye tracking: A comprehensive guide to methods and measures. New York, NY:Oxford University Press.
Kennedy, A., & Baccino, T. (1995). The effects of screen refresh rate on editing operations usinga computer mouse pointing device. The Quarterly Journal of Experimental Psychology,48A(1), 55–71.
Kubovy, M., & van Valkenburg, D. (2001). Auditory and visual objects. Cognition, 80, 97–126.Maslow, A. H. (1943). A theory of human motivation. Psychological Review, 50(4), 370–396.Moore, R. J., & Churchill, E. F. (2011). Computer interaction analysis: Toward an empirical
approach to understanding user practice and eye gaze in GUI-based interaction. ComputerSupported Cooperative Work, 20(6), 497–528.
Navalpakkam, V., & Churchill, E. F. (in press). Eyetracking: A brief introduction. In J. S. Olson& W. Kellogg (Eds.), Ways of knowing, HCI methods. Heidelberg: Springer.
Nielsen, J., & Pernice, K. (2010). Eyetracking web usability. Berkeley, CA: New Riders.Peterson, S. A., & Simon, T. J. (2000). Computational evidence for the subitizing phenomenon as
an emergent property of the human cognitive architecture. Cognitive Science, 24(1), 93–122.Pink, D. H. (2009). Drive. New York, NY: Riverhead Books.Reingold, E. M., Loschky, L. C., McConkie, G. W., & Stampe, D. M. (2003). Gaze-contingent
multiresolution displays: An integrative review. Human Factors, 45(2), 307–328.Ryan, R. M., & Deci, E. L. (2000). Self-determination theory and the facilitation of intrinsic
motivation, social development, and well-being. American Psychologist, 55, 68–78.Sekuler, R., & Blake, R. (2005). Perception (5th ed.). New York, NY: McGraw-Hill.Stevens, S. S., & Newman, E. B. (1936). The localization of actual sources of sound. American
Journal of Psychology, 48, 297–306.Strutt, J. W. (Lord Rayleigh, Third Baron of Rayleigh) (1907). On our perception of sound
direction. Philosophical Magazine, 13, 214–232.Swets, J. A. (1973). The relative operating characteristic in psychology. Science, 182, 990–1000.Swets, J. A., Tanner, W. P., & Birdsall, T. G. (1961). Decision processes in perception.
Psychological Review, 68, 301–340.Treisman, A. M., & Gelade, G. (1980). A feature integration theory of attention. Cognitive
Psychology, 12, 97–136.Wickens, C. D., Hollands, J. G., Banbury, S., & Parasuraman, R. (2014). Engineering psychology
and human performance (4th ed.). Boston, MA: Pearson.Wickens, T. D. (2002). Elementary signal detection theory. Oxford: Oxford University Press.
References 121

Chapter 5Cognition: Memory, Attention,and Learning
Abstract Memory, attention, learning are intertwined in the user’s cognitiveprocessing. These are the basic mechanisms of the user’s cognitive architectureand thus provide the basis for cognition. Users have several types of memory thatare important for computer use. Attention can be seen as the set of items beingprocessed at the same time and how they are being processed. If there are moreitems stored in memory or the items in memory are better organized these effectswill improve performance and provide the appearance of more attention. Usersalso learn constantly. The effects of learning lead to more items being stored inmemory and allow the user to attend to more aspects of a task.
5.1 Introduction
Memory and attention both play an important role in interaction. Complementingthese two facilities is the user’s ability to learn things in a variety of ways.Together, these three concepts form the basics of the information processingmechanisms of a user’s cognitive architecture. We consider the three conceptstogether here because of their interdependencies, focusing on the most importantaspects with respect to computer users, rather than covering everything that isknown about them.
It is worth noting at this point that the term memory is used in three differentways. The first refers to the mental function of retaining information aboutthings—stimuli, events, images, ideas, and so on—when those things are no longerpresent. The second refers to the hypothesized storage system in the brain wherethis information is stored. The third refers to the information that is stored itself. Inorder to avoid ambiguities we refer to storage of items in and retrieval (or recall) ofitems from memory when we want the first meaning; we refer to memory when wewant the second meaning; and we refer to items (or information) in memory whenwe want the third meaning.
F. E. Ritter et al., Foundations for Designing User-Centered Systems,DOI: 10.1007/978-1-4471-5134-0_5, � Springer-Verlag London 2014
123

Users’ initial perceptions of an interface will be influenced by how they storeand process information in short-term memory, and by how the information intheir long-term memory helps them interpret that interface. The way people use asystem will be greatly influenced by how well they can retrieve commands andlocations of objects from memory. Similarly, their feelings of success with asystem will be influenced by their biases in retrieving information about pastsuccesses and failures with the system.
Attention refers to the selective aspects of perception which function so that atany instant a user focuses on particular features of the environment to the relativeexclusion of others. It plays a central role in interaction, where it often is notpossible to interact with all aspects of the interface at the same time. Someinterfaces require less attention from the user and this can be a good thing if itallows them to perform more than one task at a time efficiently.
User performance improves through learning. Learning is the most importantprocess for adapting the user to the machine. There are several ways of describinglearning, but for users the most important aspects of learning are probably learningfacts and learning skills (or procedures) to perform tasks, but there is also learningto recognize images and perceptual-motor behavior.
5.2 Memory
Memory is one of the most studied areas in psychology. Understanding memorywill help you as a designer to make it easier for users to memorize and laterremember what they want or need to know. We begin by dealing with the structureof memory, which should enable you to follow the rest of the chapter more easily(this approach of providing a way to organize what you will learn is itself a resultof memory research).
5.2.1 Types of Memory
Memory can be categorized in several ways. We will first look at memory basedon where it is stored. Then we will examine memories by their content, includingmemories about a particular time and place (episodic), about object types(semantic), about facts (declarative), and about how to do a task (procedural).While there are other ways to conceptually organize memory, for system design,the set of categories we present here will give you a broad overview of the issues.
5.2.1.1 Iconic Memory
We can start our discussion of memory with perceptual-based information, spe-cifically images. Perception, while fleeting, is not completely temporary. There is
124 5 Cognition: Memory, Attention, and Learning

an image left when you close your eyes or after an image you have been looking athas disappeared. This is called iconic memory.
Visual iconic memory holds only a few items. Some suggest a limit of two orthree items (Zhang and Simon 1985); others suggest a few more. These items alsodecay (disappear) at a fairly fast rate. Sperling (1961) had subjects view a screen ofnumbers and then asked them to retrieve items after the items were no longerdisplayed. He determined that items exist in a temporary memory store for about500 ms, with an exponential decay rate. If items are not processed, about half ofthe records of these items disappear in each half second.
Items can be put into short-term or long-term memory by processing them.However, as this takes time, the other items can decay and be lost from iconicmemory. Thus items that appear on an interface for a short time have to be noticedand processed to be remembered.
5.2.1.2 Short-Term Memory
Short-term memory (STM) is a temporary memory store. Work by Atkinson andShiffrin (1968) helped establish STM as a common concept in memory research. Itcan be considered analogous to the registers in a computer. Cognition writesinformation into short-term memory but, unlike the computer, the contents decaywith time. You might start out across the room knowing the phone number youwant to dial, or start to bring up a browser to type in a URL, but by the time youget there, physically or metaphorically, you may have forgotten the number orURL. This type of loss is one of the first ways that people get introduced to short-term memory.
George Miller, in a famous study (Miller 1956) found that, for unrelatedobjects, users could remember around seven meaningful items (plus or minus two).The estimate of the rate of loss of these items varies somewhat based on who isstudied and what they are trying to remember. Some authors have found that halfthe information disappears in about 5 s if it is not rehearsed (practiced).
Short-term memory is often used to store lists or sets of items to work with.There are several interesting and immediate effects of memory of lists that areworth knowing about. The first effect, called primacy, is that items that appear atthe start of a list are more easily retrieved from memory.
The second is that distinctive items in a list are better retrieved (the VonRestorff effect). For example, if they are printed in red ink or a bell goes off whenyou read them, or they are in some other way distinct or important, they will bebetter retrieved. The improvement in memorability requires distinctiveness—highlighting a whole text and putting a box around it does not help becausenothing stands out. Similarly, writing everything in red does not help, but writingonly one word in ten in red will help. This effect is also illustrated later in thischapter by discussing Nepal and encoding.
The third is that items in a list that make more sense, IBM, PDQ and XYZ, arebetter retrieved than items that do not have associations for everybody, such as
5.2 Memory 125

SCE, ORD and PIA. If the user can group items into a meaningful item, to chunkit, the subitems are easier to recover because just the chunk has to be retrieved.These associations or chunks vary across people. We include a few examples inTable 5.1, including an item that would only make sense to a computing system.
Finally, the last items presented in a list are better retrieved as well (the recencyeffect). The primacy effect and the recency effect can be combined to create aserial position curve, as shown in Fig. 5.1.
These regularities suggest that you cannot increase your short-term memory bytrying harder, but you can by presenting items in a particular order. Knowing morecan also help. In air travel, for example, if you know that ORD is the airport codefor O’Hare Airport, FRA is Frankfurt Airport (am der Main), and PIA is PeoriaInternational Airport, then you only have to retrieve three codes rather than nineletters if you are presented with FRAORDPIA. This process was used in earlyphone systems in the US where regions were given names from the associatednumbers, for example, as immortalized in the song ‘‘Pennsylvania 6-5000’’, whichwould have been 726-5000 (and would not have been as catchy).
Later theories, such as that embodied in the ACT-R theory (Anderson 1993,2007), propose that short-term memory is just activated long-term memory. Asprocessing occurs, objects are moved directly from perception into long-termmemory. The observed effects for items in short-term memory are just the effects
Table 5.1 Abbreviations that are more memorable in one culture than another. (Note thatGerman capitalizes differently compared to English)
For German For English
MfG = Mit freundlichen Grüßenwith kind regards
ABC = American or AustralianBroadcasting Company
CDU = Christliche demokratische Uniona large German political party
PDQ = Pretty darn quick
SPD = Sozial demokratische Partei Deutschlands.Another German political party
ASAP = As soon as possible
DRK = Deutsches Rotes Kreuz.rescue service/ambulance/Red Cross
PIA = Peoria International Airport
ZDF = Zweites Deutsches Fernsehen. TV Station TLAs = Three Letter Abbreviationsor Acronyms
GmbH = Gesellschaft mit beschraenkterHaftung (Society with limited liability,i.e., a limited company)
CMU = Concrete Masonry Unit
For neither culture: http://us.support.tomtom.com/cgi-bin/tomtom_us.cfg/php/enduser/std_adp.php?p_faqid=2053&p_created=1092921663&p_sid=lXplZnAj&prod_lvl1=141&prod_lvl2=2030&cat_lvl1=2356&p_accessibility=&p_redirect=&p_lva=&p_sp=cF9zcmNoPSZwX3NvcnRfYnk9JnBfZ3JpZHNvcnQ9JnBfcm93X2NudD01NCw1NCZwX3Byb2RzPTE0MSwxODMsMTk1NCwyMDMwJnBfY2F0cz0yMzU2JnBfcHY9MS4xNDE7Mi4xODM7Mi4xOTU0OzIuMjAzMCZwX2N2PTEuMjM1NiZwX3NlYXJjaF90eXBlPWFuc3dlcnMuc2VhcmNoX2ZubCZwX3BhZ2U9MQ**&p_li=&p_topview=1
126 5 Cognition: Memory, Attention, and Learning

you see with less strong long-term memories. The number of items held in long-term memory that can be worked with at once is working memory, which we covernext.
5.2.1.3 Working Memory
Working memory is considered a more dynamic concept than STM. It ishypothesized as a temporary memory store (an audio or semantic scratchpad) withassociated mechanisms for rehearsing, refreshing, and using the stored informa-tion. It also includes a mechanism of central or executive attention that regulatesthe contents of that memory store based on performing a task. This view is basedon the models and definitions of Baddeley (1976, 1986). Working memory is seenless as a scratch pad than short-term memory, but it is viewed more within thecontext of the processing that will use it, and how the scratch pad and processinginteract. This view of working memory suggests that increases in working memorycan have numerous effects, ranging from more directed attention to better per-formance in general (Engle 2002).
These items in working memory are often rehearsed in what is called a pho-nological loop, where the material to be stored is repeated rapidly to oneself. Thisloop can hold about 2 s of verbal information. The direct implications are thatitems that are faster to pronounce take up less space. This has been found fornumbers in different languages—languages with long names (in syllables) fornumbers lead to fewer objects that can be retrieved. ‘‘Seven,’’ which is two syl-lables long, for example, will take up more space than ‘‘one.’’ Running throughthis loop only holds information; it does not alone increase memory for the items.
Working memory for a task is influenced by several factors. Focusing on asingle task directly improves the amount of working memory available for thattask. There also appear to be individual differences in working memory, with somepeople having more working memory than others (Daneman and Carpenter 1980;Lovett et al. 2000). Talking while doing a task provides some additional memory(not more traditional working memory, but more memory through the acousticalloop, which is repeating information verbally to yourself and hearing it, tempo-rarily increasing your effective working memory), and in addition to slowing downperformance can lead to more insights (Ericsson and Simon 1993). Further worksuggests that extreme amounts of practice can lead to a type of increase in workingmemory (Ericsson and Kintsch 1995).
Presentation Order
Am
ount
Rem
embe
redFig. 5.1 The Serial Position
curve. The primacy effect isthat earlier items are betterremembered and the recencyeffect is that items morerecently encountered arebetter remembered
5.2 Memory 127

5.2.1.4 Long-Term Memory
Long-term memory (LTM) contains items that that you have permanently enco-ded. If items are processed enough they are put into long-term memory. Examplesof different types of items that are typically held in long term memory include yourname, the name of your dog, and how to start up your computer.
Items can be put into long-term memory from short-term memory. These itemscan be objects, associations, or procedures for doing a task. Studies in this areamake various suggestions about the amount of time required to move items fromshort-term memory into long-term memory.
Encoding is the storing of items in memory so that they can later be retrieved.Items are put into long-term memory by processing them. More meaningful pro-cessing at encoding, such as using rehearsal, seems to make it possible to retrieveitems more reliably over a longer period of time (Tulving 2002).
Declarative knowledge, like knowing the capital of Nepal, requires attention toput the items into long-term memory. This task is easier if the items are alreadyknown. Being able to retrieve the name of the capital of Nepal from memorywould be harder if you did not know that Nepal was a country in South America.This fact may help you to be able to recall the role of encoding better.1
Procedural skills, such as typing, can get put into long-term memory withoutattention to this process (through implicit learning), but are usually best done withattention and deliberate practice. Procedural skills initially will require attention toperform; with practice they can require less attention, like driving or typing. Theamount of processing you have to do can also influence how well these memoriesget created, which we will cover shortly.
Retention is the interval between encoding and retrieval. Activities duringretention can cause forgetting, such as processing similar items; interruptions; andso on. Length of retention interval is important, too, which is covered in the sectionon learning.
Retrieval depends upon the information available to cue recall. What isretrieved depends on having information on hand—a request—to start a retrieval.Retrieval is usually better (within about 10% in accuracy or response time) themore similar recall circumstances are to the internal and external encoding cir-cumstances (even down to temperature, lighting, mood, etc.).
We can remember much more information when it is meaningful and when itsmeaning is processed at encoding time. Later discovery of its meaning does notespecially help when trying to retrieve it. Failure to process meaningful infor-mation also makes it harder to later retrieve that information. Ability to recall isthus affected by success at each step—encoding, retention, and retrieval.
1 This perverse statement is explained in a later section. Most students remember this part of thebook.
128 5 Cognition: Memory, Attention, and Learning
There is some debate about how long items in long-term memory are stored. Sometheories propose that items decay to the point that they are no longer retrievable, andother theories propose that the items are still there, but no longer retrievable becausethey are no longer unique enough to be retrievable. The implications of these twodifferent approaches may be basically the same for system design.
5.2.1.5 Declarative Versus Procedural Memory
Descriptions of memory often divide memory into two types to illustrate differenteffects. Perhaps the most common is the difference between declarative and pro-cedural memory, which is used to categorize their contents based on how they areused.
The contents of declarative memory are facts or statements about the world,such as ‘‘The hippy is in the park,’’ ‘‘the star is above the square,’’ and ‘‘Colleen’shair is auburn.’’ Retrieval of items from declarative memory is improved bypractice, and the items are intentionally generated for sharing and verbalizing. Onestudy estimated that it takes about 6 s of processing to encode an item for sub-sequent retrieval (Simon 1974), although the time required is context dependent:more complex items may take longer.
Declarative memory is used to store and retrieve information such as simpleuser instructions, user passwords, and to understand materials in interfaces.
The contents of procedural memory are acts, or sequences of steps that describehow to do particular tasks. These items can be viewed as a type of programminglanguage for cognition. Examples of items that would be stored in proceduralmemory include how to type, how to ride a bicycle, and many aspects of how toprogram or use an interface.
Items in procedural memory are generally more robust against decay, andretrieval is often less context sensitive than items in declarative memory (Jensenand Healy 1998). Like declarative memory, retrieval and application gets fasterwith practice.
The ACT-R theory (a unified theory of cognition, or ‘‘UTC,’’ realized as acomputer program, and explained earlier in the introduction and used in theconcluding chapter) uses these two types of memory explicitly, both procedural(rules) and declarative (chunks). The Soar theory (another UTC) representsdeclarative information as the result of a procedure to retrieve information frommemory, and is thus a type of procedural memory.
5.2.1.6 Implicit Versus Explicit Memory
Memories can also be categorized as explicit or implicit: items stored in explicitmemory are reportable, whereas items in implicit memory are not. Most declar-ative information is explicit in that it can be reported, whereas most proceduralinformation is implicit in that the precise details are not reportable.
5.2 Memory 129

Some procedural information, such as how to use the Emacs text editor, akeystroke driven editor, starts out fairly explicit in that the user can describe whatthey are doing and why. Over time procedural information, or skills learnedthrough trial and error without explicit, declarative reflection, can become implicit.In this case, the user can recognize objects, can have a way of performing a taskbut without being able to note why or how, and in some cases cannot even be ableto recognize that they can do the task well. If the information remains in explicitmemory users can perform tasks more robustly and, because they can describe howto do the tasks, they can help others more readily.
Users can be encouraged to store information in explicit memory by helpingthem develop a mental model of a task, and by providing them with time to reflecton their learning. Information gets put into implicit memory when the user workswithout a domain theory and learns through trial and error.
Work with the 8-puzzle (see Fig. 5.2) has illustrated this effect in interfaces. Inthis puzzle there are eight tiles and nine spaces. The task is to arrange the tiles innumerical order (left to right, top to bottom). The interface in Fig. 5.2a requiresusers to note the tiles that had to be moved and where to move them to, as a way ofencouraging users to plan and think ahead. It also provided them with an explicitrepresentation of steps for their reflection. Users that saw the interface thatrequired only clicking on the tile to move it into the adjacent blank space(Fig. 5.2b) needed less explicit input and appeared to encourage behavior that ledto less information being stored in memory.
In the first interface subjects reflected on their moves and developed an explicitrepresentation of the problem. They took fewer moves to perform the task than thosewho used the second, direct manipulation, interface (although they took more time).
1 32
8
4
7
5
6
Click on the tile to move into the empty space.
1 32
8
4
7
5
6
Type in the tile to move [1-8]: ____
Type in direction to move [N/S/E/W]: ____
(a) (b)
Fig. 5.2 Two types of interfaces for the 8 puzzle that lead to different types of learning.a Interface leading to more explicit representation. b Interface leading to more implicitrepresentation
130 5 Cognition: Memory, Attention, and Learning

The subjects in the second interface were less able to describe how to solve thepuzzle, but were slightly faster at solving it (Golightly et al. 1999; O’Hara andPayne 1998). This effect, of increased response time leading to fewer, morethoughtful, commands has been seen before (in a study by Forgie cited in Nickerson1969, p. 171).
These results raise interesting questions about interface design. If learning is animportant feature of the system, then interfaces that encourage reflection andlearning about the domain may be more suitable, even though it takes more time todo the task. Tutoring systems that support the development of more explicit rep-resentations, for example, will help learners be able to explain and later teach howto do a task.
5.2.1.7 Prospective Memory
Prospective memory is also important for users. It is a form of memory thatinvolves remembering to do something at the appropriate time based on eitherevents or absolute times. The storage of information for future activities (both inthe short- and long-term) is prone to failure and appears limited. There have beentools for centuries to help with retrieving these items from memory (strings tiedaround fingers), but there are also now computational-based tools to supportprospective memory, such as time schedulers, calendars, and To Do lists, partic-ularly on smartphones.
5.2.2 Mnemonics and Aids to Memory
There are several ways of improving memory performance—both storage andretrieval—which exploit the way that memory is arranged and operates. The use ofmnemonics, for example, is a technique that helps to increase the amount orquality of information, or the speed at which it is retrieved.
One of the first mnemonics is the method of loci (in Latin, ‘places’). In thismnemonic, a speaker (typically) would store in memory something familiar tothem, like a set of locations in their house. They would then associate the itemsthat they later wanted to with these locations. Retrieving a set of items in this wayis much more robust than trying to recall each item individually without anyassociated, structured context. Users are not particularly likely to use this method,but you might when giving a talk, by placing the major points you want to makeone per room in a familiar house. Expert memory demonstrations often use eitherthis technique, or a similar one based on making up a story using the objects. Onenotable subject increased their memory span to 80 digits over a course of 230 h ofpractice by using athletics running times to group the digits (Ericsson et al. 1980).
Another popular mnemonic is to have a phrase to cue the retrieval of a set ofthings. For example, ‘‘Active Penguins Seek the Nearest Deep Pool’’ is a mne-monic for the seven layers of the Open Systems Interconnection (OSI) model of
5.2 Memory 131

networks, and ‘‘Richard Of York Gave Battle In Vain’’ is a mnemonic for thecolors of the rainbow in sequence.
Probably the most useful aid to recalling items for users is recognition. Rec-ognition memory is more robust than recall memory. It is easier to recognizesomething that you have previously seen than it is to recall what it was that yousaw. Many interfaces take advantage of recognition memory by putting objects oractions in a place where they can be recognized instead of requiring the user torecall them. Dialogue boxes and explicit links in web pages are the most overtform of this. Menus hide the cues one level or more, but the same process is atwork.
The trade-off here is that for experts the recognition process and its applicationin an interface is often much slower than the recall process. For example, lookingfor and then recognizing objects on a menu to perform a file manipulation task istypically slower than recalling and using keystroke commands to do the same task.More expert users, or those doing a task quite often, will be able to use recallmemory, and most likely will want to for greater efficiency. The use of recognitionmemory appears to require offering the user multiple, related items from which theuser has to recognize (and select) the one they want. This represents a design trade-off, which will be best addressed if you know your user’s tasks as well as theavailable technologies. A simple solution is to provide shortcuts of some kind, andprovide the user with access to them as they use the interface, almost turning theinterface into a tutor of itself.
Anomalous or interesting things are better retrieved from memory. As notedearlier, the learning of declarative information is influenced by the content. Forexample, Nepal is not in South America, so if you knew this when you werereading a previous section of this chapter, you are likely to recall that section betterbecause it stood out. This von Restorff effect was originally seen when looking atlearning lists of words. If a bell was rung when a word was presented, that wordwas subsequently better recalled. This effect applies in general to things that aredistinctive. For example, a word in red will be easier to recall if it appears in a listof words in black. (Putting all the words in red will not work nor will highlightingall of a section to memorize; the point is for objects to stand out from similaritems, so highlighting the entire book does not work!)
Finally, practice and repetition of the target task helps. This is another exampleof the Von Restorff effect. You should now be able to recall it better because youhave seen it and, more importantly, processed it more often. Practice and repetitionhelp to increase the amount of information stored for later retrieval from memory,but only if attention is paid to the stimuli and the stimuli are elaborated. A basicand early theory in memory research was about levels of processing. Greaterprocessing of stimuli leads to better subsequent retrieval of those stimuli. Countingthe number of vowels in a piece of text does not lead to very good retention of thattext. Reading the text leads to better retention, and arguing with the text or anotherreader helps even more; rewriting in your own words is even better. This is onereason that teachers ask you about what you have read and encourage you toprocess it actively.
132 5 Cognition: Memory, Attention, and Learning

These aids to improving memory performance are presented more formally instudy guides. Another method, PQ4R, is described below.
5.2.3 PQ4R: A Way to Improve Reading Comprehension
A common question about memory is how to apply what we know about it tolearning. One approach to integrate what we know about memory and learning intoa study method is the PQ4R method (preview, question, read, reflect, recite,review). In this method, the learner first previews the material. This helps withdistributing the learning, and it also starts to form a structure for learning, a type ofelaboration (Thomas and Robinson 1972).
The next step is to generate questions that the reading should answer. These cancome from the preview, and from your goals and previous knowledge.
The four Rs come quickly then. The reading is done with the preview andquestions in mind. This should be a more situated experience in that the point ofthe reading and scope of the reading are clearer.
After reading, the material is reflected upon. This is canonically done by writingup a short summary and explicitly writing out answers to the questions from thesecond set.
Then the material is recited, that is, spoken out loud. This helps form differentmemories (verbal ones), and also adds to the distributed learning approach that hasbeen set up.
Finally, all the materials are later reviewed, or studied. This allows another passand also allows any questions arising during the break to be answered.
This book is designed to help support the use of PQ4R and similar learningmethods that emphasize multiple passes and reflection during learning. On thebook level, it does this by providing a detailed table of contents that can help withpreviews, introductory chapters that note why you may be interested in thismaterial, and chapters providing structures (the ABCS, cognitive architectures)that can be used to organize the material. On the chapter level, it provides abstractsfor each chapter that can serve as previews, and questions at the end of eachchapter than can be used to guide learning.
You may see this sort of behavior exhibited by users when they get multiplechances to learn in the same interface using multimodal output, or when theinstructions on how to use the material provide help with these stages by providingan overview, for example.
5.2.4 Memory Biases
There are other aspects of memory that need to be considered when working withand designing for users. Poor decision making, for example, is often influenced as
5.2 Memory 133

much by the way memory retrieval supports decision making as by how thechoices themselves are made. The inherent biases associated with memory canoften affect how well it operates.
5.2.4.1 Interference
The retrieval of items from memory can either be hindered or helped by otheritems in memory. If two items are very similar they can be confused for one other.For example, if you spend a long time knowing someone’s name incorrectly, oryou type in a command incorrectly a few times, it can take much longer to correctthis error. This type of interference has been proposed as one of the primaryaspects that makes learning arithmetic difficult (Siegler 1988). The intelligenttutoring systems based on ACT-R, therefore, do not allow the user to practiceincorrect knowledge (Anderson et al. 1989). This is likely to be one of the waysthat they can help students learn the same material in one-third of the typical time(Corbett and Anderson 1990). Interface designers should thus be mindful of errorsand how interfaces help users to not remember them!
5.2.4.2 Retrieval Biases
Items presented towards the beginning of a sequence (primacy) or towards the endof a sequence (recency) are more successfully retrieved from memory. When itcomes to reasoning about a situation or a set of activities, the items retrieved tosupport reasoning will be biased in those two directions. The use of an externalmemory aid and formal analysis can help.
The von Restorff effect will also apply. Information that is stored in a contextthat is distinctive will be easier to retrieve. The relative amounts or numbers ofitems retrieved will thus not support appropriate reasoning, as the items will not beretrieved in proportion to their occurrence in the world.
5.2.4.3 Encoding Effects
The content of an item that is to be stored in memory can be influenced by itsencoding. The location of the item, the location of the user, sights, smells, sounds,and mental state can all be included in the way the item is encoded for storage.Examples of this include certain smells bringing back childhood memories, andcertain people only recognized well in certain contexts. For example, we find itmuch harder to recognize students outside the classroom environment in which wemet them.
Users will have these same effects. The information that they can retrieve forcomputer systems may in some cases be tied to aspects of the interface that you didnot intend or may not even have control over. The particular terminal or computer
134 5 Cognition: Memory, Attention, and Learning

they use, their home page, or where they put a manual on a bookshelf may allbecome part of their knowledge about how to use a system because these aspectscan influence the retrieval of items from memory. This also suggests that, for morerobust recall of items from memory, users should be supported in building up avariety of retrieval cues and have a chance to practice (i.e., rehearse) these items ina variety of situations before they have to retrieve them in earnest.
5.2.4.4 Priming
Priming refers to how presenting objects before their use, sometimes quite briefly,facilitates their use and the use of items related to them. Typically, primes arepresented for short periods of time, under a second, but it applies to all timeperiods. For example, anything about Nepal or South America would be morerecognized by readers of this text because they have been used previously.
This approach can be used to facilitate the retrieval of items from memory.When presented with a list of words to remember, such as ‘‘bed rest awake tireddream wake snooze blanket doze slumber snore nap peace yawn drowsy,’’ manysubjects will report that ‘‘sleep’’ was included as well. This effect can be explainedby noting that many, if not all, of these words prime the word ‘‘sleep.’’ When it istime to recall the words, the word ‘‘sleep’’ is also very active, and this is (falsely)used as a cue that it appeared in the list as well. The book by Intons-Peterson andBest (1998) explores this and related topics of distortions in memory.
Users will find it easier to retrieve items from memory that have been recentlyused. This is a possible mechanism to explain why consistency within a system orbetween a manual and a system is important. Names of items in the manual will bemore quickly identified in the interface if the same name is used. Related conceptswill also be helped, but to a lesser extent.
This effect also can lead to retrieving information to support previously heldbeliefs, rather than generating new ones. It is important then to provide users withexternal memory aids to help in the retention and analyses of situations.
5.2.4.5 The Loftus Effect
The Loftus effect (e.g., Loftus 1975), also known as the misinformation effect,describes how people take on knowledge implicitly from questions. Askingsomeone a question often leads them to assume and later learn the facts implicit inthe question. Asking someone ‘‘What color hat was the suspect wearing?’’ willlead many people to infer and later recall (without understanding that they justinferred and did not see) that the suspect was indeed wearing a hat. In one of theiroriginal studies Loftus and her colleagues asked subjects if they recalled meetingBugs Bunny at Disney World as a child (Loftus 2003). Depending on the condi-tion, about a third could erroneously recall this (Bugs is with Warner Brothers, notDisney!). Instructions and manuals can suggest capabilities not generally
5.2 Memory 135
available, or could help support users by noting the interconnected nature of mostsystems. Multiple choice exams can, with their questions, remind you of com-ponents of the answer. For example, a question that asked you ‘‘Which of thefollowing is a type of memory?’’ implies that there are several types. This type oftest could help create false memories.
If used directly, this effect can help users. Queries to users that provide contextto the question or even a default action can help users.
5.2.5 Implications for System Design
What we already know about human memory provides numerous implications forimproving the lot of the user. Users will be able to learn interfaces that are similarto other interfaces or other knowledge structures more easily than completely newinterfaces. Users are limited in the amount of new information that they canperceive, comprehend, and learn. A fairly direct implication is to use words thatusers know, and use the words consistently to strengthen the chances of latersuccessfully retrieving these words from memory.
It has long been known that retrieving names from memory is faster thannaming objects. This suggests that, instead of displaying icons, we might be betterserved by displaying words (Chilton 1996). The approach, of using names insteadof icons would also help the visually impaired, who rely on software to translatecomputer interfaces into verbal representations. Raskin (2000, Sect. 6.3), providesfurther interesting examples and arguments encouraging the use of words insteadof icons. Figure 5.3 shows icons used for translation during international travel, aswell as some icons from interfaces that are more difficult to interpret.
Our understanding of memory can and should influence password choice. Thisknowledge can inform more than ‘‘experience and common sense,’’ which issometimes used. Users will want to choose passwords that are hard to guess, andsystems may enforce this. However, many passwords that are hard to guess arearbitrary (that is, not meaningful to users) strings of letters, digits, and punctuation,such as ‘‘ouibou94!3’’). Thus, some strong passwords are hard to recall when usersneed them. There have been surveys on what passwords people use when they arenot given any guidance (the results are pretty scary from a security standpoint).What needs to happen more is helping users generate mnemonics for rememberingthe passwords, rather than writing them down on paper or installing them in acomputer-based passport (unless you trust the computer company selling thepassport, which many state attorney generals do not). The issue of recallable yetstrong passwords is one of the topics routinely dealt with under the auspices of thetopic of usability of security. Some analysts have argued for word-based pass-words, such as ‘islandcarekeyboard’, which is long and thus hard to guess, buteasier to recall as each chunk is several letters rather than a single letter.
There are several poorly understood but important questions relating to the useof memory with respect to system design:
136 5 Cognition: Memory, Attention, and Learning

• The impact of interruptions. Many work environments include numerousinterruptions. The effect of these on the way that items are stored in, andretrieved from, memory is just starting to be studied. What work exists suggeststo us that the length of interruption is less important than the similarity ofmaterial processed.
• Other memory tasks. Most of the memory literature concerns simply learning alist and then recalling it sometime later. Many work-related memorial tasksinvolve retaining some piece of information for a short time, then replacing itwith some similar piece of information (‘keeping track’ tasks). These have notbeen studied very often.
• Support for memory. Most of the literature is studies of processes and archi-tectures of memory—but our interest is in preventing the need for memory andproviding support for tasks requiring the use of memory. This is an active areafor design.
5.3 Attention
Everyone knows what attention is. It is the taking possession by the mind in clear andvivid form, of one out of what seem several simultaneously possible objects or trains ofthought…It implies withdrawal from some things in order to deal effectively with others,and is a condition which has a real opposite in the confused, dazed, scatterbrained state.
William James
Fig. 5.3 The top figure is taken from a Kwikpoint travel guide designed to help communicate ina foreign language (you point at what you mean), used with permission. Icons on the bottom aretaken from Word 2011 (The icons in Fig. 5.3b mean, from right to left: view field codes, zoom100%, online layout, page layout, and automatic change. Word is improving in that you can nowmouse over the icons to learn their names.)
5.2 Memory 137

Designing systems to attract, manage, and maintain attention is important.Figure 5.4 shows a user with a task that requires attention (driving), who is alsoattempting to perform an additional task (talking on a cell phone). If you wouldlike a short demonstration of attention, go to http://www.youtube.com/watch?v=-AffEV6QlyY, which takes advantage of your ability to pay attention. It takessome time to understand, and you should not be too easily shocked.
Attention refers to the selective aspects of perception which function so that atany instant a user focuses on particular features of the environment to the relative(but not complete) exclusion of others. There are several useful metaphors fordescribing attention. It can be seen as a set of buffers that hold information forprocessing. It is directly related to that processing as well.
You might imagine attention as the area and process of central cognition, suchas work being done on a table. Tasks that take less attention need less of the tableor less of the time of the person working at the table. Many processes in humancognition are thus closely tied to the concept of attention as a space for cognition,and various parts of a processor can support attention.
Figure 5.5 shows two common and important uses of attention. Both situationsinvolve aspects of motor control and cognition, and require monitoring the situ-ation and taking corrective action. In both cases performance suffers when thetasks are not given sufficient attention.
There are also other aspects of human behavior that are not based on focal orconscious attention. We can still do some information processing without con-sciously attending to information—how else would we know to shift our attention
Fig. 5.4 This picture shows someone (circled) doing more tasks than their system (both vehicleand head) were designed for—driving in a crowded urban environment and talking on a hand-held cell phone. The phone in this position takes both verbal and motor attention, and it causes anadditional planning load to operate the car one-handed, and leads to poor situation awareness(i.e., they did not see the person on the street who took this picture). Also note the Gestalt effectof the can and tree!
138 5 Cognition: Memory, Attention, and Learning
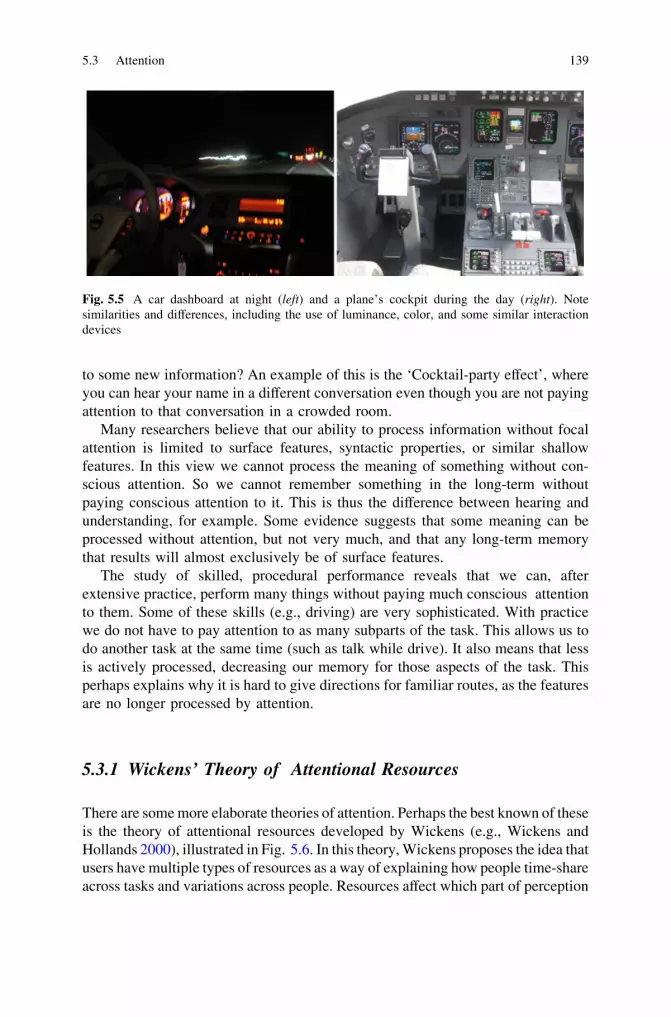
to some new information? An example of this is the ‘Cocktail-party effect’, whereyou can hear your name in a different conversation even though you are not payingattention to that conversation in a crowded room.
Many researchers believe that our ability to process information without focalattention is limited to surface features, syntactic properties, or similar shallowfeatures. In this view we cannot process the meaning of something without con-scious attention. So we cannot remember something in the long-term withoutpaying conscious attention to it. This is thus the difference between hearing andunderstanding, for example. Some evidence suggests that some meaning can beprocessed without attention, but not very much, and that any long-term memorythat results will almost exclusively be of surface features.
The study of skilled, procedural performance reveals that we can, afterextensive practice, perform many things without paying much conscious attentionto them. Some of these skills (e.g., driving) are very sophisticated. With practicewe do not have to pay attention to as many subparts of the task. This allows us todo another task at the same time (such as talk while drive). It also means that lessis actively processed, decreasing our memory for those aspects of the task. Thisperhaps explains why it is hard to give directions for familiar routes, as the featuresare no longer processed by attention.
5.3.1 Wickens’ Theory of Attentional Resources
There are some more elaborate theories of attention. Perhaps the best known of theseis the theory of attentional resources developed by Wickens (e.g., Wickens andHollands 2000), illustrated in Fig. 5.6. In this theory, Wickens proposes the idea thatusers have multiple types of resources as a way of explaining how people time-shareacross tasks and variations across people. Resources affect which part of perception
Fig. 5.5 A car dashboard at night (left) and a plane’s cockpit during the day (right). Notesimilarities and differences, including the use of luminance, color, and some similar interactiondevices
5.3 Attention 139

is used (visual or auditory), response type (choice of response type, and execution ofthat response, spatial or verbal), and the stages of processing (perception, cognition,and responding). These define resources for processing and holding information,with some tasks using more of one type of resource than another.
Most of the evidence to support Wickens’ model of attentional resources comesfrom studies of dual task performance. Evidence for two different types ofresources, for example, can be found by varying the difficulty of responding to onetask and looking at performance on a concurrent (more) perceptual task. Theperformance on the perceptual task is (more or less) constant, even though moreresources are needed for the responding task.
5.3.2 An Information Processing Model of Attention
The ACT-R theory (Anderson and Lebiere 1998) incorporates a model of attentionthat summarizes one of the common theories in this area, that of attention as aspotlight in the mental world which is directed at what is being thought about.Attention in ACT-R is represented as activation of concepts in its declarativememories. People with more attention have more activation available (Lovett et al.2000). This activation of memory creates the spotlight that focuses on the mentalobjects that are being used in processing. These objects may include semanticmemories and episodic memories, as well as current goals and processes.
If more activation is available, this allows more objects to be manipulated at thesame time. This saves time re-retrieving them from memory and allows larger,more complex objects to be created and used. Each of the objects has an associatedstrength. Objects that are more familiar have a higher associated strength and, as aresult, need less activation to be matched against procedural knowledge than lessfamiliar objects.
Stages
Perception Cognition Responding
Spatial
Verbal
Response
type
Visual
AuditoryMo
dal
itie
s
Fig. 5.6 The conceptualcomponents of Wicken’smodel of the user’sprocessing, modality, andplaces for attention
140 5 Cognition: Memory, Attention, and Learning

Objects in the various perceptual input buffers, such as vision and hearing, needto be brought into memory in central cognition by a transfer process. Movingobjects into central cognition does not happen automatically, but has to doneintentionally. The amount of time the new memories are processed and how theyare processed will determine how strong the resulting memories are.
5.3.3 Divided Attention
Users who are attempting to do two tasks at the same time will have to move moreinformation around. They will start doing one task, and during processing on thattask they will have to notice when it is time to swap tasks and work on the secondtask. In other words, they will need to divide their focus of attention between thetasks they are performing.
How the two tasks interact will depend on several things. Users will performbetter if they can spend larger blocks of time on each task. Users that are morepracticed with each task will be able to switch more smoothly and will be able toactivate the necessary memories to assist in doing the new task faster. Practicingdoing the tasks together will also lead to better overall performance. In this case,the user might be learning how to interleave subtasks.
Attention is influenced by both the frequency of access and type of use of items,so dual tasks that use different perceptual buffers will interfere less with eachother. People can learn to drive and talk at the same time in normal weatherconditions, because driving does not use a lot of audio cues. That leads to the twotasks not using the same perceptual buffers very much. At least one theory in thisarea, EPIC, proposes that the only bottlenecks in performance are perception andaction (Kieras et al. 1997; Meyer and Kieras 1997).
Pairs of dual tasks, such as reading email and web browsing, based on a computerinterface will almost certainly interfere with each other to some extent. The user willbe using the same resources, including perception, aspects of cognition, and output,typically vision, memory, and motor output, for each task. The perceptual buffer willhave to be refocused or directed to a different part of the screen. These factors willmake it harder to do each of the tasks when the other is present.
5.3.4 Slips of Action
Attention and skilled behavior have a critical role in the occurrence of slips ofaction, where people have the right intention but perform the wrong action(Norman 1981; Reason 1990). People essentially work in one of two modes:
1. Using open loop control: behavior is based on anticipation and feedforwardrather than feedback, so there is little or no need for them to monitor the result oftheir actions. Other activities can be performed at the same time—automatizeddriving and game play and typing are examples.
5.3 Attention 141

2. Using closed loop control: performance is mediated using feedback on anyactions carried out, so conscious monitoring of behavior is required. Only oneactivity can be carried out at one time. Learning how to drive, deliberatewalking on a rock field, editing a manuscript are examples, or learning how toplay a game by mapping commands to a controller.
Very few tasks can be performed completely using open loop control. Slips ofaction typically occur when open loop control is being used instead of closed loopcontrol, such as:
• When users overlook information that affects behavior. For example, users thatdo not note the mode of a word-processor or the location of the insertion pointand input and modify text in ways that they did not intend.
• When users continue performing a familiar activity even though they intendedto do something different. For example, clicking on the ‘‘Yes’’ button inresponse to the prompt ‘‘Do you really want to delete this file?’’
• When users fail to correctly discriminate between relevant objects in theworld—performing an action on unintended objects. For example, trying toclick on an image icon on a web-based form.
Although it is not clear that we can design to always pre-empt these slips, wecan predict the kinds of circumstances when they occur. We can also recognize thepower of open loop behavior that can foil ‘‘Do you really want to…?’’ dialogues.We will return to discuss slips of action and other types of erroneous behavior inChap. 10.
5.3.5 Interruptions
Interruptions are becoming increasingly common in interfaces as systems becomemore advanced and can be given tasks to perform asynchronously. There are alsoother causes of interruptions, including colleagues, phones, and email systems thatbeep when you have new messages.
In many ways interruptions can be seen as a secondary task, and hence the workin this area is effectively a subset of the work on dual task performance, where theuser is trying to do two tasks at once. Interruptions are effectively the secondarytask, which is much less important, generally not regarded as part of the user’smain task, and is not under control of the user.
Interruptions do appear to cause real decrements in performance (Bailey andKonstan 2001; McFarlane 1999) and users do not like them because they lead tochanges in affect (Bailey and Konstan 2001). McFarlane (1997) has attempted tocreate a taxonomy of interruption types and their implications for design. Hisresults indicate that the choice of how to deal with interruptions will depend on theimportance and types of the main task and of the interruption. Dealing with
142 5 Cognition: Memory, Attention, and Learning
interruptions immediately disrupts the main task more than taking the interruptionbetween subtasks. Dealing with interruptions at scheduled times leads to betterperformance on the main task, but poorer performance on the interruptions.Intermediate strategies offered different trade-offs (McFarlane 1999).
Sometimes interruptions are useful. It has been hypothesized that interruptionsare useful for solving hard problems (where there is a so-called incubation effect).This effect has been noticed by programmers who get stuck on a problem—comingback to a hard problem later sometimes makes the problem easier. Being inter-rupted for minutes, hours, or days in these tasks allow the user to forget theirmistakes and mis-starts, or to receive suggestions from the environment. Kaplan(1989) found that at least part of the incubation effect came from cues in theenvironment. One problem he gave subjects was ‘‘What goes up a chimney downbut not down a chimney up?’’ Subjects who were called and asked by Kaplan if hehad left an umbrella in their office were much more likely to solve the problem, butdid not attribute the cause to his call.
As you consider the larger context of your users’ tasks, you should keep in mindthe possible effects of interruptions. Some interfaces will be less sensitive to theeffects of interruptions. We are just starting to be able to predict and measure theseeffects.
5.3.6 Automation Deficit: Keeping the Human in the Loop
If you want to get funny looks, while you are driving a car, ask your passenger‘‘Do you ever wake up and find out you are driving and wonder where you aregoing and where the other cars are?’’ Some find this humorous, and others, if theydo not know you well, may be startled. This is similar to what happens whensomeone has to resume or take over a task at short notice when the systemrelinquishes control because it does not know what to do. This happens to peoplesuch as aircraft pilots and power plant operators who find themselves out of theloop, i.e., not being kept up to date by the systems about what it is doing. The userwill then allocate their attention to dealing with the task, but they have to spendtime and effort trying to understand the current situation before they can diagnosethe problem and resolve it.
Generally, the way to avoid this problem is to include more status informationto keep the user continually informed before the situation requires their input. Thisallows one to develop and maintain a mental model of that situation and how it isunfolding, so that users can decide when they may need to take action.
This whole argument about the need to keep the human involved in the controlloop was first summarized by Bainbridge (1983), and it remains as an issue today(Baxter et al. 2012). Woods and Patterson (2001) explain some of the effects onusers if the technology does not keep them kept informed about what it is doing.
5.3 Attention 143

5.3.7 Implications for System Design
Interfaces can help users do more than one task. Figure 5.7 shows a workplacewhere the user is doing multiple subtasks related to listening remotely to a talk(watching the talk, reading the talk slides, looking at the map of where the talk is,timing the talk, reading a paper about the talk, waiting for a snack). Typically, thisis by helping them do each of the tasks more easily and by requiring less attentionto do each of the tasks. More recent work is attempting to find the times and waysto interrupt the user at more appropriate moments.
Knowing how attention and perception work can help create better indicators ofthe arrival of another task, such as a beep or flash, or a change in its priority.Knowing about attention also helps with design because you know that attention isnot limitless, and is sometimes missing. How and when to best interrupt a task andhow to best support various sets of dual tasks remain open problems.
It is possible to increase the user’s attention by including multiple modes ofinput and output. For example, when users need more attention, adding voice inputand voice output as interaction modalities to supplant a visual display can provideusers with the ability to watch their performance in a flight simulator. That way,they are receiving feedback on it at the same time (Ritter and Feurzeig 1988).
In applied settings, where attention is paid to multiple processes, some that are timecritical, it can be important to pay attention to a process before it becomes necessary tocontrol the process. The section on automation deficit explained this more fully.
5.4 Learning and Skilled Behavior
Learning is where performance changes with practice, typically getting faster,becoming less demanding, and generating fewer errors. Learning is important forusers. They learn in several ways, including learning new information and new
Fig. 5.7 This system shownhere included an instantmessenger (iChat) text andvideo chat, a proprietaryvideo conferencing tool,slides of the talk online andprinted, as well as paper-based reminders and notes. Inthis task, however, thesubtasks were integrated: towatch the man in the suit talkand ask him questions
144 5 Cognition: Memory, Attention, and Learning

skills. Learning is the primary way for them to improve the strength of theirmemories. As they retrieve something more often, their memory strengths improveas well. Thus, retrieving a password is faster and more robust after 2 trials than 1,and after 100 trials than 99 (all else being equal), but with ever decreasingimprovements with practice.
Users also use learning to help with attention. As they learn more, they canrecognize situations and generate responses faster. This gives them more time topay attention to a task or to a secondary distracting task.
Users can also learn to adjust their behavior to fit to the interface. If theinterface does not describe an action the way the user would, the user typically hasto learn the new name, which they can and will do. If the interface has steps orsubsteps to an action, the user has to learn these as well. If objects are not wherethe user expects, the user has to learn their location. The good news is that learningcan often happen without much distress to the user, but woe to the interface thatrequires the user to learn everything!
We will present here a theory of how users learn. This theory has many impli-cations, including how users’ behavior changes with learning, what extreme practicelooks like, and what this can mean for interface design. For more information onlearning, see Anderson (1982, 1995, 2004) and Lindsay and Norman (1977).
5.4.1 The Process of Learning
A description of the general process of learning (and types of task performance)has arisen in several areas, including behavioral psychology (Fitts 1964), cognitiveergonomics (Rasmussen 1983), and cognitive psychology (Anderson 1982). Thesetheories all start with the learner acquiring declarative information about thedomain. At this stage, problem solving is very difficult. The concepts are notalways connected to each other. The learning might be seen as learning how tolearn more about the task. What has been learned at this point might not be enoughto be able to do the task yet. Basic declarative knowledge of the task is learned atthis stage, such as the initial problem-solving state and the actions available forproblem solving. Problem solving, when it is possible, requires considerable effort,and is not always correct. Problem solvers might not have much confidence in theirperformance. Anderson calls this the cognitive stage. Rasmussen calls this type ofbehavior knowledge based, as shown at the top of Fig. 5.8.
When learners are at this first stage, behavior occurs at the most fundamentallevel, when there are no direct rules to inform the user what to do. Expert users mayhave to resort to this stage in emergencies or novel situations, such as when birds getingested into an aircraft engine, or when trying to change Unix permissions onshared files. These conditions require deliberate thought and reasoning about thestate of the situation or system based on the user’s knowledge (i.e., mental model) ofthe system, and then about what action to perform next. As you might expect, workproceeds slowly because each step has to be deliberated over from first principles.
5.4 Learning and Skilled Behavior 145

With learning and practice, the user progresses to the associative stage, or rule-based stage (as shown in the middle of Fig. 5.8). The learner can solve problemsmore routinely and with less effort. The declarative knowledge has been compiledinto procedures relevant to the task domain that can be performed directly. At thisstage users may often be able to just recognize what needs to be done. For users ofcomplex systems, behavior becomes a conscious activity and is based on familiarrules, either dictated or acquired, such as changing lanes when driving a car, orformatting a paragraph in a Word document using styles.
The final stage, called skills or tuning, tunes the knowledge that is applied. Atthis point the user still gets faster at a task, but the improvements are much smaller,as they are smaller adjustments. New declarative information is rarely learned, butsmall adjustments to rule priorities happen. At this point users consider them-selves, if not experts, to be real users. Rasmussen calls this level of performanceskill-based. Anderson calls it the autonomous stage.
At the skill-based level, performance is much more automatic, as shown at thebottom of Fig. 5.8. Skill-based performance usually occurs when users are per-forming routine functions in their normal operating environment. Much of theirbehavior is no longer available to conscious thought, or available for verbalizationetc. Users not only perform the task faster, they may also appear to have moreattention to provide to other tasks. Examples include changing gear in a car with amanual shift gearbox, and cutting and pasting text.
These stages of learning have been noticed in several areas of formal reasoning.Formal reasoning involves problems with known goals (like solve for x), andequations or rules that can transform representations (such as adding 2 to each sideof an equation). Formal reasoning is used in areas such as physics problem solving(Larkin 1981; Larkin et al. 1980a, b), geometrical proofs and solving algebraicproblems.
Analysis and identification
Analysis of means and planning
Evaluation and choice of goal and task
Knowledge-based control(model-based)
Rule-based control(know-how)
Skill-based control(automatic)
Symbo
ls
Sensory information(multiple channels)
Signals
Feature formation
Goals and needs
Recognition of cues Association cue / task Stored rules for activities
Movements
Automated sensorimotor movements and routines
(signs)
Seeing changes
Looking for cues
Reading symbols
Fig. 5.8 A schematic of Rasmussen’s theory of performance. (Adapted from Rasmussen 1983)
146 5 Cognition: Memory, Attention, and Learning

In these types of problems the problem solvers (and computer models) start withdomain knowledge and the goals for which they are trying to find answers. Noviceswork backward from the goal. In the case of physics problem solving, the task is toderive a value of a variable (like final speed) given some known variables (likemass, initial speed, and force) and some equations (like Force = Mass 9 Accel-eration). Novices tend to work back from what they are trying to solve for finalspeed, chaining inference rules together until they find known variables. If theyneed to compute the final speed then they look for an equation that computes speed.Then they look for more equations to find the variables in the first equation, untilthey bottom out with known variables. This is known as backward chaining orbottom-up reasoning.
As the reasoning terminates in the answer, how to apply the rules in a forwardsense, without search, is learned. More expert behavior is a mix of theseapproaches. With even more practice experts can reason in a forward sense. ‘‘If Ihave speed and time then I have acceleration, then if I have acceleration Ihave…..’’ The answer in this case is found more quickly and with less effort. Thisis known as forward chaining or top-down reasoning.
This type of reasoning difference is seen in computer repair and trouble-shooting, software usage, and other domains where formal reasoning can beapplied. Better interfaces will support the novice by providing the appropriatedomain knowledge needed to learn the inferences, and support the novice andexpert by providing the state information to reason from.
Learning can also occur in the opposite direction, from (implicit) skills back toknowledge about these skills, but this learning is less well understood. Implicitlearning can occur when the user is working at the skill level, with knowledgeeventually being derived on the cognitive level through the observation of one’sown behavior. This type of learning, which is an active area of research in psy-chology, often leads to or arises from strategy changes.
Whichever way the user learns, some key phenomena survive:
• The ability to recognize correct/incorrect items comes before the ability togenerate correct items.
• Knowledge is not acquired in an all-or-nothing way. Novices go through a stageof fragile knowledge, trusting that what has been acquired is correct, whereassometimes it may be incorrect.
• Experts acquire a rich repertoire of representations of their knowledge. It is notonly that experts know more than novices; what they know is much betterorganized, understood to a greater depth, and more readily available.
5.4.2 Improvements from Learning
Perhaps the biggest regularity of human behavior in general and users in particularis that the changes due to learning leads to them getting faster at performing a taskthe more they do it. Similar curves showing decreases in performance times have
5.4 Learning and Skilled Behavior 147

been seen in tasks ranging from pushing buttons, reading unusual fonts or invertedtext, doing arithmetic, typing, using a computer, generating factory schedules, allthe way up to writing books (Ohlsson 1992). These improvement curves are alsofound when large groups work together, for example, building cars.
There are huge improvements initially, although users rarely report satisfactionwith these improvements. The improvements decrease with time, however, fol-lowing a monotonically decreasing curve. This is shown in Fig. 5.9 for the Seibeltask, a task where you are presented with a pattern of ten lights and you push thebuttons for the lights that are on. Each point represents the average for doing 1,000patterns. Notice that with extended practice, performance continues to improve,but by smaller and smaller increments. Over a wide variety of tasks and over morethan seven orders of magnitude (hundreds of thousands of trials), people get fasterat tasks.
With data with changes this wide and with small changes becoming importantlater in the curve it becomes difficult to see the improvements. This is why the dataare plotted using logarithmic axes: the difference between two points is based ontheir logarithms, as shown in Fig. 5.9. Typically, on these log–log plots, learningcurves follow pretty much a straight line.
The mathematical representation of this curve is currently somewhat disputed.Some believe that the learning curve is an exponential curve, and others think it isa power equation (thus, called the power law of learning) of the form shown inEq. (5.1):
Time of a trial ¼ Constant1 ðNumber of trialþ PPÞ�a þ Constant2 ð5:1Þ
where Constant1 is the base time that decreases with practice, PP is previouspractice on the task, a (alpha) is a small number typically from 0.1 to 0.5, andConstant2 is the limitation of the machinery or external environment (reviewed inNewell 1990, Chap. 1; see also Anderson 1995, Chap. 6).
(a) (b)
Fig. 5.9 Time to perform a simple task (pushing a combination of buttons) on a linear plot(a) and log–log plot (b) as well as a power law fit to the data shown as the solid line on each plot(adapted from Seibel 1963, and previously used in Ritter and Schooler 2001, reproduced herewith permission)
148 5 Cognition: Memory, Attention, and Learning

PP is either estimated, measured directly, or ignored. In most cases it is ignoredbecause the task is unique enough to the learner. In other cases, such as taking up afamiliar task, the equation does not fit as well.
Constant2, the minimum time due to the limitations of the environment, iscomputed from equations describing the world or using physical equipment. Forexample, you might measure how long it takes a ball to fall to the ground with acamera if the task involves catching a falling ball, or you might record how fast aninterface can accept keystrokes when driven by a computer program.
a is thus found typically by plotting the data on a log–log plot, and fitting astraight line. This fitting is typically done by fitting a linear equation (which has aknown closed form solution) to the log of the trials and the log of the time. Themore accurate but more computationally expensive approach is to fit the powerlaw equation including the constants that are appropriate using an iterativealgorithm.
Having an equation to predict learning is important for several reasons. Forscience, it helps summarize learning, and comparison of the constants is a usefulway to characterize tasks. It also has practical applications. For engineering,design, and manufacturing, it predicts how fast users will become with practice.These equations are used in manufacturing to predict factory output andprofitability.
Others believe that the match to a power law is an artifact of averaging the datafrom multiple people and multiple series, and that the curve is best described as anexponential when the data is examined in its purest form (Heathcote et al. 2000).Both cases have basically the same implications for users with limited lifetimesand physical equipment, but have different implications for the details of how theunderlying cognitive architecture is implemented.
The improvement in performance time itself does not appear to delineate thestages of learning noted earlier. This may be because the first stage of learning,where performance might be quite difficult, has to reach a nearly complete levelbefore the task can even be performed. There are hints of this in Fig. 5.9b, wherethe initial slope is fairly shallow in the log–log plot, perhaps more shallow thanwould be expected. In complex tasks, the transition of rule learning and rule tuningwithin task might lead to steady improvement, and be masked by the large numberof rules and sub-tasks. Looking at individual users working on well-measuredtasks may allow these stages to be seen. When this has been done, strategy changescan be seen (Delaney et al. 1998).
In addition to time reducing with practice, several other aspects of performanceimprove as well (Rabbitt and Banerji 1989). Errors decrease with practice. Thevariance in the time to do a task also decreases. That is, with practice the range ofexpected times decreases. Some think that this decrease in variability is what leadsmost to the speedup because the minimum time to perform a task generally doesnot decrease with practice (although there are clearly notable exceptions to this, forexample, for tasks that cannot be completed by novices).
There appear to be two places where learning does not get faster. Users cannotget faster when the machinery they are working with cannot keep up with them.
5.4 Learning and Skilled Behavior 149

This was first noted when cigar rollers improved up to a point and then stopped. Itwas found that the users were rolling faster than the machine could pass materialsto them (Snoddy 1926).
The second place where users do not get faster is when they change strategies.As a user picks up a new strategy, they will often experience a slowdown, movingback on the practice curve for that strategy. However, with practice, performanceon this curve with a lower intercept improves, usually to be much better than theprevious strategy (Delaneyet al. 1998). Figure 5.10 illustrates this effect.
If your system supports multiple learning strategies, you should considerhelping the user transition between them. In text editors, for example, there areseveral ways to find a particular text string, including scrolling and searching line-by-line, scrolling and searching by paragraph, and using the inbuilt search func-tion. In one survey (Card et al. 1983), most users were not using the most efficientstrategy (searching), but moving line-by-line. Experts use searching, which can be100 times faster than scrolling.
5.4.3 Types of Learning
Learning can be described in several ways. It can be organized by the types ofmemories that are created or practiced. One common way to distinguish types oflearning is as declarative and procedural. Another common way is as implicit andexplicit. The distinctions between these classifications are still being argued over,
0 200 400 600 800 1000
020
40
60
80
100
Trials
Per
form
ance
Tim
e
Fig. 5.10 The learning curvefor a series of betterstrategies, showing the initialslow down and then savingsdue to switching strategies
150 5 Cognition: Memory, Attention, and Learning

but they represent useful and interesting differences about users that help withinterface design.
Declarative learning is learning facts (declarations). The ‘‘power button is onthe keyboard’’ and ‘‘the computer manager’s office is in 004A’’ are two examples.Declarative learning can be separated into two subtypes of recognition and recall.Recognition memories are easier to build than recall memories. That’s whymultiple choice tests seem easier—you just have to recognize the answer. Thiscorresponds to the first stage of declarative learning.
Procedural learning is learning how to do procedures. Using an interface, andplaying a computer game are examples of this. Procedural memories are probablymore complex than declarative memories in that they generally support the skillbeing performed in a wide variety of environments and slightly different situations,which thus represent more knowledge. These memories have to come after thedeclarative representations are available to create them.
These two types of learning have different regularities associated with them.Declarative learning can, by definition, be described and reported. Proceduralmemories cannot be directly reported (Ericsson and Simon 1993). You cannotdirectly describe the knowledge you use to ride a bike. You can, however, accu-rately report the declarative knowledge that you use to generate your procedures(like keep your weight balanced) and what is in your working memory as you aredoing the task (there is a parked car ahead). You can also watch yourself do a taskand attempt to describe much of what you were paying attention to as you did it.What you think you were paying attention to when doing the task will, however,be dependent on your mental model of the task and how demanding the task is.This approach is called introspection.
There are fundamental problems with introspecting like this. While introspec-tion can lead to useful and helpful insights, it does not lead to complete and validtheories of human thinking (Ericsson and Simon 1993). Just as you can’t programa computer to write out the instructions as it does them (the instruction to write outreplaces the instruction it copies), you can’t think about thinking very accuratelywhile thinking. Mainstream psychology has rejected introspection as a true rep-resentation of how people think, but you may find it useful for inspiration for ideasthat can be later validated by other approaches. In our experience it is sometimesuseful inspiration, but it is sometimes just way off because of our biases about howwe would like to think we think.
As an example of this, users think that they cannot learn new key bindingsbetween keys and commands (e.g.,\Ctrl-s[to search vs.\Ctrl-f[to search). Whenkey bindings in an editor were changed on users on the second day of a study aboutlearning to use a text editor, for the first hour or two the users felt much, much slower.They were slower than they were at the end of the first day, but faster than when theystarted. They regained their skill level by the end of the second day (Singley andAnderson 1989). This study illustrates three important things about users. The first isthat they are always learning. The second is that introspection often leads to incorrectconclusions. They rather disliked the new interface, but they adapted more quicklythan they thought they did. The third is that the users were able to transfer much of
5.4 Learning and Skilled Behavior 151

what they had learned from the old interface to the new interface. Only the keybindings changed; the underlying approach and the command structures did not, sothe users were able to apply most of what they had learned. Another similar exampleis that users seem to prefer mice over light pens, even though the light pens werefaster to use (Charness et al. 2004).
Another way to represent learning is with the implicit/explicit distinction.Implicit learning seems to be automatic, is based on practice, is not improved byreflection, and produces knowledge that cannot be verbalized. This might beroughly equivalent to the rule tuning stage. If the rules are created based on asimple domain theory, but a more complex domain exists, then additional learningcan occur.
Explicit learning proceeds with full consciousness in a hypothesis testing way;it produces knowledge that can be verbalized. This is examined in more detail in alater section on problem solving.
These distinctions become important when teaching users how to use aninterface. Some information is reported to them as declarative knowledge to belearned (where things are, who other users are, and what are the objects), and someinformation consists of procedural skills such as how to do a task.
Learning can be massed or distributed. Massed refers to learning that occurs at asingle time, for example, cramming for a test. Distributed learning occurs withbreaks in time between the learning episodes. Figure 5.11 shows how much betterdistributed learning can be. Distributed learning takes less total time (sometimesone-third of the time), and the retention is better, sometimes 50% better. Anythingyou can do to assist your users to learn in a distributed fashion will help theirlearning. Some interfaces now put up hints, which appears to be a way to supportdistributed learning.
0
1
10
0 1,000 2,000 3,000 4,000 5,000 6,000 7,000 8,000 9,000 10,000
Mem
ory
Str
engt
h (a
rbitr
ary
units
)
Time (arbitrary units)
Massed
Distributed
Fig. 5.11 Massed versusdistributed practice in relationto time to learn a list. Givenexponential decay, which isoften assumed for memory,the solid line shows a givenamount of practice as oneblock, and the dashed lineshows the same amountspread out over a longerperiod. The distributedpractice has higher activationafter the second practice, andwill for the remainder of thecurve
152 5 Cognition: Memory, Attention, and Learning
Finally, we should note again that learning is rarely complete. It is easy to thinkthat if you have learned to operate a system your learning about that system iscomplete. This needn’t be so; many users can sometimes perform very compe-tently with very little knowledge, and other systems, such as UNIX and the Emacseditor are complex enough that once competent, users can continue to learn newways to use them and new components for several years.
5.4.4 Skilled Behavior, Users in Complex Environments
Real human skills are a complex mixture of these levels of learned behavior. Inmost cases, routine users will work with an open-loop behavior at the skilled level.That is, they will be able to perform most tasks in a routine way using existing,well-used knowledge and not check all of their steps. Their behavior will be open-loop, that is, they will not check all of their work. They will not close the loop bychecking that things worked correctly because in most cases they no longer needto. If they do make mistakes, they will be able to recognize them quickly. Theywill continue to get faster with practice, but the improvement will be minor. Therewill also be some closed-loop behaviors for tasks that are less well practiced, andin these behaviors users will be more careful and check their work.
For example, airplane pilots often operate at all three levels. Some aspects oftheir behavior are automatic; for others they refer to rules and procedures, whilstfor others, particularly in non-routine emergencies, they reason on the basis oftheir knowledge about the plane and learn. (In routine emergencies they will usechecklists.)
Rasmussen’s (1983) argument is that good design needs to support all threelevels of operation, not just one. We can also note a social human factor here. Ifthere are multiple operators, they may operate at different levels at different timesbecause at the knowledge level they may have different knowledge, which maygive rise to conflict or to strength, depending on how these differences in approachare resolved.
The knowledge level implies a certain amount of planning activity, but you willfind there are those who believe that people do not engage in planning—arguingthat behavior is situated in a context (e.g., Suchman 1983). In other words, theyargue that we perceive the situation and decide what to do then, not on the basis ofsome pre-formed plan.
Two responses can be made to this.
• One can do both—have a plan and allow the situation to change it (e.g., per-forming actions in a different order from that planned).
• Planning seems best related to Rasmussen’s knowledge-level, whereas situatedaction is ‘rule-level’ behavior. Again, these are not exclusive options—somepeople in some skills may function exclusively at one level, whilst others mayswitch between levels at high speed.
5.4 Learning and Skilled Behavior 153

Learning will also influence perception. It was not immediately apparent to thephotographer from the photograph in Fig. 5.12 what was wrong with this scene(although it looked ‘odd’), but it would be apparent fairly quickly to a boat captain.This is a simple example of where knowledge or learning, can influence otherprocesses, such as vision.
5.4.5 Expertise
With extended practice, users become experts at their task. Generally, to becomeworld class, it takes about 10 years of practice as well as some deliberate reflectionand declarative learning, either from extensive self-tutoring or from a coach(Ericsson 1996; Hayes 1981; Simon and Chase 1973; Simonton 1996). There areexceptions, but these researchers argue that exceptions are truly rare. Less time isrequired to attain local or national prominence in a particular field, or where a taskor technology is new. While practice is a usual and necessary condition, simplepractice is not enough to guarantee an expert level of performance: coaching anddeliberate practice are needed (Ericsson 1996).
This level of performance is interesting to people because it shows how goodperformance can be. When the practice is on a socially important task, such asflying planes or programming, it can also be quite rewarding to the practitioners.
Some theories suggest that with practice the user gains more than just speed inthe task. In some instances they appear to have greater memory for, and can paymore attention to the task at hand (Ericsson and Kintsch 1995). In all cases, theyhave more knowledge and better anticipation of what will happen in the task, andin nearly all cases they have more accurate perception for and of the task details.
Fig. 5.12 A scene from afishing port in Massachusettswhere knowledge caninfluence perception (There isa boat that has sunk next tothe dock. Only its mast isvisible next to the boat on theright. The book’s web siteprovides a more detailedpicture showing the missingboat.)
154 5 Cognition: Memory, Attention, and Learning

5.4.6 Transfer
Transfer of learning is important. After a skill has been learned, the goal is often toreuse or apply the knowledge to a new situation. If no transfer occurred, then everysituation would be a new situation. If transfer was perfect, then few situationswould be novel. Studies have shown that transfer is usually far from perfect, that itcan be underestimated, and that it is possible to predict transfer effects.
Perhaps the earliest study on transfer had subjects read a story about how a kingwished to invade a town, but his army was too big to come through a single gate inthe town. So he split his troops up into smaller parties. Subjects then read about theuse of lasers to attack cancer, but the problem was that the light was too intense todirectly fire through the tissue at the cancer. What to do?
A surprising number did not think to use multiple lasers, which is what thetransfer of knowledge would suggest. This lack of obvious (to the experimenter)transfer effect has been repeated many times. Problem solvers have troubletransferring knowledge or strategies where there are structural but not surfacesimilarities. Thus, users do not always transfer useful information.
The second study to keep in mind is that of perverse Emacs. Singley andAnderson (1989) trained users for several hours with a powerful text editor calledEmacs. Then, on day 2, some subjects were trained on Perverse Emacs, which wasjust like Emacs, but the keystroke commands were different. Subjects, we canimagine, did not like this at all, but at the end of the day, their performance wasindistinguishable from the people who had used Emacs in day 1 and day 2. Thus,transfer can occur, but users do not always see it, and they do not like it whentransfer leads to small mistakes (as would have often happened in the first hour forthe users of Perverse Emacs). Thus, changing key bindings is likely to lead tofrustration, but might not hurt users in the long run.
Finally, there are some tools to measure potential transfer. Kieras and Polson(1985) created a simple language to express how to do a task, and many taskanalysis techniques can be used in a similar way. Each instruction in the language,such as how to push a button, takes time to learn. Thus, the number of differencesbetween instruction sets indicate how much knowledge can be transferred and howmuch must be learned. Analyses of popular operating systems suggest that thereare real differences between them, with one being a subset of the other (and onethus being easier to learn).
5.4.7 Implications for System Design
All users will learn and get faster at doing a task as they repeatedly do it. This is animportant way that users fit themselves to a task, covering up errors in design orcompensating for trade-offs made in interface design that do not favor the user.
5.4 Learning and Skilled Behavior 155

Interfaces that are initially too slow will become faster, but will require training(to learn the task) and practice (to get faster), and may not end up fast enough.Time to perform a task can be roughly predicted by comparison with other tasks orafter several initial trials to get the slope of the learning curve (this approach isused in industry to predict manufacturing times). There are theories that shouldprovide this information in the future when the theories become more tractable(Anderson 2007; Christou et al. 2009).
Theories also note what should be provided to users at different stages of theirlearning (Kim et al. 2013; Ohlsson 2008). Users must have some declarativeinformation about a task before they can perform it. This means that interfaces andtheir associated system, including manuals, online help, web sites, and other users,should provide the new user with enough information to perform the task or atleast to start to explore the environment. More generally, you should aim tosupport user task performance and learning at all levels, from knowledge-based toskill-based.
How procedural and declarative memory are used will depend on how they arerepresented. If the user has a more general representation and declarativeknowledge associated with it, through practice the user can create proceduralmemories (Kim et al. 2013). The procedural knowledge can transfer to newproblems more easily. Interfaces and systems (including instructional materials)that support more general representations and more task-oriented representations(vs. tool specific representations) will allow users to transfer their knowledge bothin and out of the interface more readily.
The learning curve that can be created by observing learners can provideinsights to system design directly. The start of the curve shows how difficult theinterface is for novices. The amount of time to initially perform the task might beseen to be too high or at an acceptable level. Figure 5.13a shows a relativelyshallow curve where novices are not so different from experts in performance.Figure 5.13b shows a curve where novices would be less happy, but which mightbe appropriate for a game. The slope of the curve can also provide insights. If thecurve is very steep, and the system will be used often, the initial task times mightnot be an issue. If the interface is to be used only a few times, then the slope needsto get the user’s task time to an acceptable level within that time frame. It can bethe case that 150 s is an acceptable time, or it can be that 50 s is not and even thetop curve is not fast enough—it will depend on the context.
Some users like to learn. This is probably most often seen in games, which havetheir explicit goal to teach the user some procedural skill (like driving a racingcar), or some declarative knowledge (like the way round a dungeon). Most otherusers prefer not to learn, but will if the task is important enough.
If the users are likely to encounter situations where they may not have enoughexpertise to deal with the situation easily (e.g., plane malfunctions), you shouldconsider providing them with instructions at that point (e.g., how to land when outof fuel). These instructions will not always help, but they often can. In computersystems these problems are often now being found on the Internet (e.g., how torepair a bad disk, how to clear a stuck keyboard).
156 5 Cognition: Memory, Attention, and Learning

Systems that allow users to recognize actions they want to do will be easierinitially to use than those that require users to recall commands. There is a trade-off, however, when the novices become experts. The experts will be able to recallthe keystrokes or command names and will not wish to wade through the choices.For example, Linux experts like to use keystrokes in the command shell, whilenovices on Windows prefer a graphical user interface.
Systems that encourage users to reflect on how to perform the task may lead todifferent types of learning. Where the learning is incidental and not tied to edu-cational intent or systems, this may not matter. On the other hand, tutoring systemsshould be careful that what users learn is what is intended. For example, theinterface should not encourage users to just try key presses or button clicks to seewhat happens, which can lead to implicit learning that is tied to the representationof the interface and not to the domain.
Learning in such a situation has been seen in solving the 8-puzzle. Figure 5.2shows such a puzzle. When users could directly click on the interface to indicate thetile to move, they took a larger number of moves and could verbalize theirknowledge less well than users that had to work harder to interact with the interface,such as clicking on the tile and the direction to move, or using a speech interface.
0
50
100
150
200
250
0 1 2 3 4 5 6 7 8 9 10 11 12 13 14 15 16 17 18 19 20
Tim
e o
f ea
ch t
rial
(se
c)
Trials
0
50
100
150
200
250
0 1 2 3 4 5 6 7 8 9 10 11 12 13 14 15 16 17 18 19 20
Tim
e o
f ea
ch t
rial
(se
c)
Trials
(a)
(b)
Fig. 5.13 Two learning curves with approximately the same final speed. a A relatively shallowlearning curve. b A relatively steep learning curve
5.4 Learning and Skilled Behavior 157

The experimenters hypothesized that the increased cost of typing in the direction tomove the tile lead users to think more and learn at a higher level. When users couldjust click, they created simple rules and learned implicitly (Golightly et al. 1999).
5.5 Summary
Memory, attention, and learning make up some of the core aspects of cognition ofusers. These are well studied and well understood areas in psychology, and theirresults are increasingly able to be packaged and applied to interface design.
There remain interesting areas for basic and applied research in these areas astechnology creates new opportunities. These areas include multi-tasking, pro-spective memory aids, how to help users learn from systems, how to avoid biasesin memory, how to help users manage things they need to remember (like pass-words), and how to direct the user’s attention appropriately across both short timespans (e.g., an hour) and long time spans (e.g., years of learning and working witha system like Unix). Knowledge of the details of these aspects of human behaviorallow better interfaces to be built.
5.6 Other Resources
If you would like to learn more about the areas covered in this chapter, it is wellworth reading the book by Alan Baddeley from 2004 on book on human memory.Baddeley is one of the pioneers of human memory research as we understand ittoday. This text renders his portfolio of scientific research accessible to a generalaudience, offering insights that will change the way you think about your ownmemory and attention:
Baddeley, A. (2004). Your memory: A user’s guide. Buffalo, NY: Firefly Books.
You may well have heard of the magic number 7 about human memory before.If you’d like to read a paper that shows how this number was demonstrated toapply to human memory, it is worth seeing if you can get a copy of Miller’s classicpaper, published in a key psychology journal, Psychological Review. We note,however, that while this finding is still cited in the popular press as a well-knownfeature of human memory, subsequent studies have added more nuance to theobservation–familiarity with the domain, modality (visual, auditory), and memoryenhancement tactics can contribute to how many items are remembered:
Miller, G. A. (1956). The magic number seven, plus or minus two: Some limits on ourcapacity for processing information. Psychological Review, 63, 81–97.
158 5 Cognition: Memory, Attention, and Learning

John Anderson’s texts on cognitive psychology provide an excellent intro-duction also. These are more directed at beginning scholars wishing to dive deeperinto this area:
Anderson, J. R. (1999). Learning and memory (2nd ed.). New York, NY: John Wiley andSons.
Anderson, J. R. (2009). Cognitive psychology and its implications (7th ed.). New York,NY: Worth Publishers.
An excellent introduction to cognitive modeling is Allen Newell’s UnifiedTheories of Cognition. Although written a while ago, the text offers a niceintroduction to the thinking that launched this field of research, and to a particularcognitive modeling environment that we mention in passing, Soar:
Newell, A. (1990). Unified Theories of Cognition. Cambridge, MA: Harvard UniversityPress.
Elizabeth Styles’ text on attention, perception, and memory offers a very goodstarting point and highlights how they are interdependent and interact:
Styles, E. H. (2005). Attention, perception and memory: An integrated introduction. Hove,UK: Psychology Press.
For an accessible book on how reflection and memory affect performance in abusiness setting, read Tom Demarco’s Slack:
Demarco, T. (2001). Slack: Getting past burnout, busywork, and the myth of total effi-ciency. New York, NY: Broadway Books.
There are also many online demonstrations and resources in this area on sites suchas The Exploratorium (http://www.exploratorium.edu/memory) and the EPsych site(http://epsych.msstate.edu).
5.7 Exercises
5.1 Find a user of a smartphone. It may have to be someone from outside yourclass. Ask them to note as many of the menu items on the smartphone as theycan, and the structure of these menus. Have them do it without access to theirphone.
Compare what they remember with the phone itself. It will be useful to dothis for several people and compare the results. What does this tell you aboutphone usage and users’ memory?
5.2 Find an online tutorial, perhaps from this class or another class, or an onlinetutorial to teach you Lisp or Java. Using an informal representation, breakdown what you learn from a sample lesson into these concepts: math, theory
5.6 Other Resources 159
of programming, programming constructs, language syntax, programminginterface, online tutorial interface.
What are the results, and what do they suggest for the design of onlinetutorials?
5.3 With respect to a web site for a university department (or your company’s),create a list of tasks and information that a user of a university department’sweb site would be able to retrieve from memory and a similar list that usersmight not initially be able to recall, but would recognize. An example of thefirst could include the main phone number, and an example of the secondcould include special resources or accomplishments of the department.
5.4 Recall of memories is more difficult than recognition. As an example of this,write down the 50 US states. You can adapt this task to your own country, forexample, listing the UK counties, the Bundesländer of Germany, or thenumber of member states in the European Union.
This effect also works for computer interfaces. You could attempt to namethe menu bar items for a menu driven interface that you use often.
5.5 Usability of security remains an ongoing active research area. Memoryinfluences the use of computer security. There are several ways that this canhappen. One way is in the choice and memorizing strategies for passwords.Read https://www.cs.cmu.edu/*help/security/choosing_passwords.html orfind a similar study on how people choose passwords. If you have time, writedown your previous passwords, or ask people you know to fill out a smallsurvey on what type of password they have, or have had. What do the resultssay about human memory and about computer interface design for passwords?
5.6 The first step of this exercise is to prepare a task for users to perform. This taskshould take people about 2 min on their first attempt, and they should besuccessful nearly all of the time. Students have used such tasks as card sorting,shoe tying, word processing, paper airplane construction, typing a paragraph,and web navigation. You should prepare instructions, as you will be havingsomeone else perform the task. If the task is longer than 2 min it gets hard torun the necessary number of trials. If it is less than 2 min it may get hard totime as the users get faster. Anywhere from 70 s to 210 s is likely to workeasily, and greater or lesser amounts will work to a certain extent. Online tasksmay be more appropriate for your course, but what’s interesting is that it doesnot matter what task you choose or whether it is online or not.
To get a good look at the learning curve, you should run 2–5 users on yourtask, and the subjects should each perform the task at least 15 times. Because ofthe logarithmic scale, 100 times is twice as good as 10, a 1000 times is threetimes as good. You may choose to run 5 subjects on the task 15 times (at most, 5subjects 9 2 min 9 15 times = 150 min, so you may want to have help), oryou might choose to run 2 users over a longer series of trials.
You should record the time taken to perform the task each time, and notewhether the user made any minor errors, significant errors, or catastrophic
160 5 Cognition: Memory, Attention, and Learning

errors. Some of these suggest that something besides normal learning wasgoing on, or that a trial was in some way unusual.
When you graph your results, you should see a power curve or exponentialcurve. Both linear and log–log plots are interesting ways to plot this data.
You should comment on how your results fit the predictions in this book,other resources, and what your results mean for your task and for related tasks.
References
Anderson, J. R. (1982). Acquisition of cognitive skill. Psychological Review, 89, 369–406.Anderson, J. R. (1993). Rules of the mind. Hillsdale, NJ: Erlbaum.Anderson, J. R. (1995). Learning and memory. New York, NY: Wiley.Anderson, J. R. (2004). Cognitive psychology and its implications (5th ed.). New York, NY:
Worth Publishers.Anderson, J. R. (2007). How can the human mind exist in the physical universe?. New York, NY:
Oxford University Press.Anderson, J. R., Conrad, F. G., & Corbett, A. T. (1989). Skill acquisition and the LISP tutor.
Cognitive Science, 13(4), 467–505.Anderson, J. R., & Lebiere, C. (1998). The atomic components of thought. Mahwah, NJ: Erlbaum.Atkinson, R. C., & Shiffrin, R. M. (1968). Human memory: A proposed system and its control
processes. In K. W. Spence & J. T. Spence (Eds.), The psychology of learning and motivation(Vol. 2). New York, NY: Academic Press.
Baddeley, A. D. (1976). The psychology of memory. New York: Basic Books.Baddeley, A. D. (1986). Working memory. Oxford, UK: Oxford University Press.Bailey, B. P., & Konstan, J. A. (2001). The effects of interruptions on task performance:
Annoyance, and anxiety in the user interface. In Interact, 2001 (pp. 593–601).Bainbridge, L. (1983). Ironies of automation. Automatica, 19(6), 770–775.Baxter, G., Rooksby, J., Whang, Y., & Kahajeh-Hosseine, A. (2012). The ironies of automation…
still going strong at 30? In Proceedings of ECCE 2012 Conference (pp. 65–71). Edinburgh,North Britain.
Card, S. K., Moran, T., & Newell, A. (1983). The psychology of human-computer interaction.Hillsdale, NJ: Erlbaum.
Charness, N., Holley, P., Feddon, J., & Jastrzembski, T. (2004). Light pen use and practiceminimize age and hand performance differences in pointing tasks. Human Factors, 46(3),373–384.
Chilton, E. (1996). What was the subject of Titchner’s doctoral thesis? SigCHI Bulletin, 28(2),96.
Christou, G., Ritter, F. E., & Jacob, R. J. K. (2009). Knowledge-based usability evaluation forreality-based interaction. In G. Christou, E. L.-C. Law, W. Green & K. Hornbaek (Eds.),Challenges in the evaluation of usability and user experience in reality-based interaction(workshop proceedings). At CHI 2009 Conference on Human Factors in Computing Systems,Boston, MA, 2009. CHI 2009 Workshop: Challenges in Evaluating Usability and UserExperience in Reality Based Interaction (pp. 36–39). Toulouse, France: IRIT Press.
Corbett, A. T., & Anderson, J. R. (1990). The effect of feedback control on learning to programwith the LISP tutor. In Proceedings of the 12th Annual Conference of the Cognitive ScienceSociety (pp. 796–803). Erlbaum: Hillsdale, NJ.
Daneman, M., & Carpenter, P. A. (1980). Individual differences in working memory and reading.Journal of Verbal Learning and Verbal Behavior, 19, 450–466.
5.7 Exercises 161

Delaney, P. F., Reder, L. M., Staszewski, J. J., & Ritter, F. E. (1998). The strategy specific natureof improvement: The power law applies by strategy within task. Psychological Science, 9(1),1–8.
Engle, R. W. (2002). Working memory capacity as executive attention. Current Directions inPsychological Science, 11(1), 19–23.
Ericsson, K. A. (Ed.). (1996). The road to excellence: The acquisition of expert performance inthe arts and sciences. Mahwah, NJ: Erlbaum.
Ericsson, K. A., Chase, W. G., & Faloon, S. (1980). Acquisition of a memory skill. Science, 208,1181–1182.
Ericsson, K. A., & Kintsch, W. (1995). Long-term working memory. Psychological Review, 102,211–245.
Ericsson, K. A., & Simon, H. A. (1993). Protocol analysis: Verbal reports as data (2nd ed.).Cambridge, MA: MIT Press.
Fitts, P. M. (1964). Perceptual-motor skill learning. In A. W. Melton (Ed.), Categories of humanlearning (pp. 243–285). New York, NY: Academic Press.
Golightly, D., Hone, K. S., & Ritter, F. E. (1999). Speech interaction can support problemsolving. In Human-Computer Interaction—Interact ‘99 (pp. 149–155). IOS Press.
Hayes, J. R. (1981). The complete problem solver. Philadelphia: The Franklin Institute Press.Heathcote, A., Brown, S., & Mewhort, D. J. K. (2000). The power law repealed: The case for an
exponential law of practice. Psychonomic Bulletin & Review, 7(2), 185–207.Intons-Peterson, M. J., & Best, D. L. (1998). Introduction and brief history of memory distortions
and their prevention. In M. J. Intons-Peterson & D. L. Best (Eds.), Memory distortions andtheir prevention. Mahwah, NJ: Erlbaum.
Jensen, M. B., & Healy, A. F. (1998). Retention of procedural and declarative information fromthe Colorado Driver’s Manual. In M. J. Intons-Peterson & D. L. Best (Eds.), Memorydistortions and their prevention (pp. 113–124). Mahwah, NJ: Erlbaum.
Kaplan, C. (1989). Hatching a Theory of Incubation: Does putting a problem aside really help? Ifso, why?, Carnegie-Mellon University, University Microfilms International, Catalog#9238813.
Kieras, D. E., & Polson, P. G. (1985). An approach to the formal analysis of user complexity.International Journal of Man-Machine Studies, 22, 365–394.
Kieras, D. E., Wood, S. D., & Meyer, D. E. (1997). Predictive engineering models based on theEPIC architecture for a multimodal high-performance human-computer interaction task.Transactions on Computer-Human Interaction, 4(3), 230–275.
Kim, J. W., Ritter, F. E., & Koubek, R. J. (2013). An integrated theory for improved skillacquisition and retention in the three stages of learning. Theoretical Issues in ErgonomicsScience, 14(1), 22–37.
Larkin, J. H. (1981). Enriching formal knowledge: A model for learning to solve textbook physicsproblems. In J. R. Anderson (Ed.), Cognitive skills and their acquisition (pp. 311–334).Hillsdale, NJ: Erlbaum.
Larkin, J. H., McDermott, J., Simon, D. P., & Simon, H. A. (1980a). Expert and noviceperformance in solving physics problems. Science, 208, 1335–1342.
Larkin, J. H., McDermott, J., Simon, D. P., & Simon, H. A. (1980b). Models of competence insolving physics problems. Cognitive Science, 4, 317–345.
Lindsay, P. H., & Norman, D. A. (1977). Human information processing (2nd). San Diego, CA:Harcourt Brace Jovanovich.
Loftus, E. F. (1975). Leading questions and the eyewitness report. Cognitive Psychology, 7,560–572.
Loftus, E. F. (2003). Our changeable memories: Legal and practical implications. Nature ReviewsNeuroscience, 4, 231–234.
Lovett, M. C., Daily, L. Z., & Reder, L. M. (2000). A source activation theory of workingmemory: Cross-task prediction of performance in ACT-R. Journal of Cognitive SystemsResearch, 1, 99–118.
162 5 Cognition: Memory, Attention, and Learning

McFarlane, D. C. (1997). Interruption of people in human-computer interaction: A generalunifying definition of human interruption and taxonomy (Tech Report No. NRL/FR/5510–97-9870): Naval Research Laboratory. (also at infoweb.nrl.navy.mil/htbin/webcat).
McFarlane, D. C. (1999). Coordinating the interruption of people in human-computer interaction.In INTERACT ‘99 (pp. 295–303). IOS Press.
Meyer, D. E., & Kieras, D. E. (1997). A computational theory of executive cognitive processesand multiple-task performance: Part 1. Basic mechanisms. Psychological Review, 104(1),3–65.
Miller, G. A. (1956). The magic number seven, plus or minus two: Some limits on our capacityfor processing information. Psychological Review, 63, 81–97.
Newell, A. (1990). Unified theories of cognition. Cambridge, MA: Harvard University Press.Nickerson, R. (1969). Man-Computer interaction: A challenge for human factors research.
Ergonomics, 12 (pp. 501–517). (Reprinted in 1969 in IEEE Transactions on Man-MachineSystems, 10(4), 164–180).
Norman, D. A. (1981). Categorization of action slips. Psychological Review, 88, 1–15.O’Hara, K., & Payne, S. J. (1998). Effects of operator implementation cost on performance of
problem solving and learning. Cognitive Psychology, 35, 34–70.Ohlsson, S. (1992). The learning curve for writing books: Evidence from Professor Asimov.
Psychological Science, 3(6), 380–382.Ohlsson, S. (2008). Computational models of skill acquisition. In R. Sun (Ed.), The Cambridge
handbook of computational psychology (pp. 359–395). Cambridge: Cambridge UniversityPress.
Rabbitt, P., & Banerji, N. (1989). How does very prolonged practice improve decision speed?Journal of Experimental Psychology: General, 118, 338–345.
Raskin, J. (2000). The humane interface. Boston, MA: Addison-Wesley.Rasmussen, J. (1983). Skills, rules, knowledge: Signals, signs and symbols and other distinctions
in human performance models. IEEE Transactions: Systems, Man, & Cybernetics, SMC-13,257–267.
Reason, J. (1990). Human error. Cambridge, UK: Cambridge University Press.Ritter, F. E., & Feurzeig, W. (1988). Teaching real-time tactical thinking. In J. Psotka, L.
D. Massey, & S. A. Mutter (Eds.), Intelligent tutoring systems: Lessons learned (pp.285–301). Hillsdale, NJ: Erlbaum.
Ritter, F. E., & Schooler, L. J. (2001). The learning curve. In W. Kintch, N. Smelser, & P. Baltes(Eds.), International encyclopedia of the social and behavioral sciences (Vol. 13,pp. 8602–8605). Amsterdam: Pergamon.
Seibel, R. (1963). Discrimination reaction time for a 1,023-alternative task. Journal ofExperimental Psychology, 66(3), 215–226.
Siegler, R. S. (1988). Strategy choice procedures and the development of multiplication skill.Journal of Experimental Psychology: General, 117(3), 258–275.
Simon, H. A. (1974). How big is a chunk? Science, 183, 482–488.Simon, H. A., & Chase, W. G. (1973). Skill in chess. American Scientist, 61(393–403), FIND.Simonton, D. K. (1996). Creative expertise: A life-span developmental perspective. In K.
A. Ericsson (Ed.), The road to excellence: The acquisition of expert performance in the artsand sciences (pp. 227–253). Mahwah, NJ: Erlbaum.
Singley, M. K., & Anderson, J. R. (1989). The transfer of cognitive skill. Cambridge, MA:Harvard University Press.
Snoddy, G. S. (1926). Learning and stability. Journal of Applied Psychology, 10, 1–36.Sperling, G. A. (1961). The information available in brief visual presentations. Psychological
Monographs, 74(whole No. 498).Suchman, L. (1983). Office procedures as practical action: Models of work and system design.
ACM Transactions on Office Information Systems, 1, 320–328.Thomas, E. L., & Robinson, H. A. (1972). Improving reading in every class: A sourcebook for
teachers. Boston, MA: Allyn & Bacon.
References 163

Tulving, E. (2002). Episodic memory: From mind to brain. Annual Review of Psychology, 53,1–25.
Wickens, C. D., & Hollands, J. G. (2000). Engineering psychology and human performance (3rded.). Prentice-Hall: Upper Saddle River, NJ.
Woods, D. D., & Patterson, E. E. (2001). How unexpected events produce an escalation ofcognitive and coordinative demands. In P. A. Hancock & P. A. Desmond (Eds.), Stress,workload, and fatigue (pp. 290–302). Mahwah, NJ: Erlbaum.
Zhang, G., & Simon, H. A. (1985). STM capacity for Chinese words and idioms: Chunking andacoustical loop hypotheses. Memory and Cognition, 13(3), 193–201.
164 5 Cognition: Memory, Attention, and Learning

Chapter 6Cognition: Mental Representations,Problem Solving, and Decision Making
Abstract There are several higher level structures built upon the basic structuresof memory, attention, and learning in the user’s cognitive architecture. Theserepresentations and behaviors include mental models, problem solving, anddecision making. These structures and processes form the basics of higher levelcognition when interacting with technology, and describe some of the ways thatusers represent systems and interfaces, and how users interact with and use sys-tems. Mental models are used to understand systems and to interact with systems.When the user’s mental models are inaccurate, systems are hard to use. Problemsolving is used when it is not clear what to do next. Problem solving uses mentalmodels, forms a basis for learning, and can be supported in a variety of ways.Decision making is a more punctuated form of problem solving, made about andwith systems. It is not always as clear or accurate as one would like (or expect),and there are ways to support and improve it. There are some surprises in each ofthese areas where folk psychology concepts and theories are inaccurate.
6.1 Introduction
When people interact with artifacts, even for the first time, they usually have someidea of what to do. If it is a piece of electrical equipment, they may first look forthe on/off switch, for example, and then press that. The way that people interactwith artifacts is governed by their mental representation of that artifact. Thesemental models develop over time: as people use the artifact more and more, theylearn more about how it works and refine their mental model accordingly. Themental models can be either structural (based on the structure of the artifact interms of its components) or functional (based on the behavior of the artifact).
As the complexity of artifacts increases, it becomes harder to develop acomplete, accurate structural mental model of them. If you are someone whodrives a car but takes it to someone else for maintenance, for example, the chancesare that you have a relatively simple functional mental model of how the car
F. E. Ritter et al., Foundations for Designing User-Centered Systems,DOI: 10.1007/978-1-4471-5134-0_6, � Springer-Verlag London 2014
165

operates—when you turn the key, you expect the engine to start, and so on. Thismodel will allow you to carry out limited troubleshooting if the car does notbehave as you expect it to. If you are a car mechanic, however, you will have amuch more developed structural model of how the car works, which will allowyou to diagnose and remedy any problems.
Designers have a functional mental model of how users behave. These modelsmay be naïve and contain several inaccuracies because they have created andrefined these models based on their own experiences of how they themselvesbehave, rather than based on their experiences of how their users really behave.One of the main purposes of this book is to help designers to develop a moresophisticated and more accurate model of users. You should, at this point in thebook, know that, while not all users are the same, they are similar in many ways.Users differ in terms of the knowledge they possess, their capabilities, and theirattributes. They also share common structures in how they receive and processinformation, and interact with the world. Understanding how these differences andsimilarities influence their behaviors will help you to design systems that are bettersuited to a wider range of users.
You should have learned by this point in the book that users behave unusuallywhen they find themselves in novel or rarely encountered situations. This isbecause their mental models are not fully developed for those situations. In thesesituations, users often have to go back to basics, and use their mental model tocarry out some problem solving. The way that they problem solve has associatedbiases, weaknesses, and strengths that you may be able to deal with in your design.
As part of the problem solving process, users will often make decisions aboutwhat actions to take next. Decision making, like problem solving, has associatedbiases, weaknesses, and strengths that can be used to inform system design.
Problem solving and decision making are probably the most widely observableand, arguably, the most important behaviors of users. Many fields of research studythese topics, including psychology, economics, and statistics. Here we focus onhow people make judgments and decisions, and how to support these processes insystem design.
6.2 Mental Representations
Users can make use of several types of representations when they are problemsolving or using an interface to perform a task. For example, users can understandan electronic circuit as a series of propositions (the secondary accumulator isconnected to the laser bank), as a diagram (shown in Fig. 6.1), or implicitly as aseries of steps to make the circuit work, such as ‘‘First flip switch 1, and if thatdoes not work…’’ (Bibby and Payne 1996). Each of the representations has dif-ferent strengths and weaknesses. The propositions may be easier to learn, theschematic allows some types of problem solving, and the rules require lessknowledge to be learned or stored for later use.
166 6 Cognition: Mental Representations, Problem Solving, and Decision Making

6.2.1 Simple Representations
Representations can be classified in many ways. Two types of simple represen-tations that occur repeatedly include semantic/propositional representations andvisual/spatial representations.
Consider the information in Table 6.1, and attempt to memorize it. Thenconsider the information in Fig. 6.2. The information represented is the same inboth places, but the representations give rise to different behavior and supportdifferent types of tasks.
The information about the sets of letters in Table 6.1 and Fig. 6.2 is probablybetter represented as a series rather than as a set of propositions—it is moresuccinct, easier to learn, and for most tasks it is easier to manipulate. Thecanonical series ABCD is particularly easy to memorize: it probably already existsas a series in your head. The other series is more difficult, but is probably easier toremember and use as a series than as a set of propositions.
The best representation for the workshop expenses will vary. For most tasks,users will be better off with the numbers themselves. The graphical representationon the left in Fig. 6.2 (created using the default settings of a common spreadsheetprogram) is less clear than the bespoke graph on the right in the same figure. Therelative values can be quickly judged, but the absolute numbers will be more dif-ficult to obtain. Both graphs are less useful than a table of numbers for many tasks.
Sometimes users will use propositional representations. Sometimes they willuse a more visual representation. Interfaces should support the representation thatusers have, as well as be mindful of supporting the representation that will be mosthelpful for a task. It is the job of the designer to find the representations that bestsupport the task, and those that users already have, and to balance the design tosupport these representations.
ENERGYBOOSTER
ONE
MAINACCUMULATOR
POWERSOURCE
SECONDARYACCUMULATOR
TWO
SECONDARYACCUMULATOR
ONE
ENERGYBOOSTER
TWO
LASERBANK
Off On
EB1 EB2
SA1
SA2
MA
SA
Fig. 6.1 A type of circuit schematic (based on Ritter and Bibby 2008)
6.2 Mental Representations 167

6.2.2 User’s Mental Models
The mental models that people use in performing tasks affect how they perceiveand interact with the world. There are several different meanings of the termmental model, however, and the different ways in which it is used can be confusing(e.g., Gentner and Stevens 1983; Johnson-Laird 1983; Moray 1996, 1999; Norman1983; Wilson and Rutherford 1989). For our purposes we think of mental modelsas a representation of some part of the world that can include the structures of theworld (the ontology of the relevant objects), how they interact, and how the usercan interact with them.
As an example, work out how many windows there are in the place where youlive. The way that most people arrive at an answer is by referring to a structuralmental model of their home. They then imagine walking around their model of the
Table 6.1 Some propositional representations
Letters example—canonicalA is to the left of CC is to the left of DB is to the immediate right of A
Letters example—non-canonicalM is to the left of YY is to the left of SR is to the immediate right of M
Workshop expensesGross income was $3,500. Expenses for coffee breaks were $1,218; copying was $400, andAV rental was $1,200. Net profit was $882
Puzzle sequenceA series of numbers is 8 5 4 9 1 3 2 7 6What comes next?
0
500
1,000
1,500
2,000
2,500
3,000
3,500
Gross income
Coffee breaks
Copying AV rental Net profit0
500
1000
1500
2000
2500
3000
3500
Costs
Gross income Coffee breaks Copying AV rental Net profit
Series1
Letters example—canonical: A B C DLetters example—non-canonical: M R Y S
Workshop expenses:
Fig. 6.2 Some graphical representations of the material in Table 6.1
168 6 Cognition: Mental Representations, Problem Solving, and Decision Making
home and looking around the rooms at the walls to see where the windows arelocated.
If you had to come up with a mental model of a printer, though, it may be moreof a functional model. So it would include the notion that you feed paper into it,that the paper gets images and text written onto it, and that the paper comes out ofthe printer into some sort of hopper. The mental model might not specify what thesomething is that produces the images and text, but could include furtherknowledge about the paper path. Figure 6.1 is another example of possible mentalmodel, this time of a Klingon laser bank.
If the user’s mental model accurately matches the device, the user can better usethe mental model to perform their tasks, to troubleshoot the device, and to teachothers about the task and device. If their mental model is inaccurate, however, theuser will make poorer choices about what actions to take, may not be as happy, andmay be less productive.
The complexity of the mental model will vary by user, by system, and bycontext. If the structure of the system is relatively simple, we can think of themodel as an isometric model, in which every feature of the artifact is representedby a corresponding feature in the model. As the structure increases, however,people try to manage the complexity by grouping together related features fromthe real artifact and representing them using a single point in the model. This iswhat is called a homomorphic model. For more complex systems, and systems ofsystems (e.g., the Internet, the Space Shuttle, power grids, and so on), these mentalmodels are also more likely to be functional, based on the way that the systembehaves in particular circumstances, rather than structural.
Understanding users’ mental models is important for system designers (Carrolland Olson 1987; Revell and Stanton 2012). The model the user brings to the taskwill influence how they use the system, what strategies they will most likelyemploy, and what errors they are likely to make. It is, therefore, important todesign the system in such a way that the user can develop an accurate mentalmodel of it.
While this is not a computer example, the design of Philadelphia airport‘sConcourse A violates most people’s mental model and illustrates the role ofmental models in using a system. A diagram of it is shown in Fig. 6.3. Userscoming in on the left expect to see Gate A2 between A1 and A3. They might knowthat gates are sometimes numbered odd/even by side of concourse, but, in thiscase, the nearest gate on the other side is not even visible from most areas aroundA1. There are numerous informal signs taped up at A1 noting where A2 is thathave been created by the airline ground staff, who clearly get asked where A2 isquite often. There are several ways to fix this. The numbers could run A1, A2 andwrap from A6 on the top to A7 and A8, or A2 and A4 could be A12 and A14.
Figure 6.4 shows another example of how mental models can lead to ambig-uous and even misleading interfaces. The interface designer has created a defaultof ‘Best’, but it is not clear whether this is the faster 89 speed or the more careful19 speed. Which is best? (One of us always selects a slow speed.)
6.2 Mental Representations 169

Therefore, when you design a system you need to have an accurate mentalmodel of how people will use it. This requires understanding how people will useit, the tasks they will perform using the system, and their normal working context.The developer’s mental model of the system is often different from the user’smental model of the system (this book is intended to help designers build a bettermental model of users in their own heads). Systems should describe things usingconventions that are consonant with the users’ mental models, for example, or beprepared to change either the users’ mental models or the designer’s. Making thesystem compliant with the user’s mental model will almost certainly help reducethe time it takes to perform tasks, reduce learning time, and improve the accept-ability of the system.
An important area of consideration for you and your users’ mental model isprocessing speed and the complexity of the task. Computer programs and algo-rithms have a time to process an object that may be based on the number of objects(e.g., simply filing objects, or coloring them), or it may be based on their
Fig. 6.3 Diagram of the Philadelphia airport concourse where the user’s mental model does notsupport finding Gates A2 and A4
Fig. 6.4 Setting the speed for writing a CD. Which is best? Slow and careful, or faster butslightly more likely to throw an error? Taken from Toast 10 Titanium
170 6 Cognition: Mental Representations, Problem Solving, and Decision Making
relationship to other objects (e.g., sorting them, or looking for relationships). Whenthe process is based on the number of objects, the algorithm is linear. When theprocess for each item is based on the number of other objects as well, the algorithmis nonlinear (e.g., based on the square of the number of objects which represents thenumber of possible comparisons). Sometimes there are algorithms that are not toobad with increasing numbers of objects, and other times the costs quickly expandbeyond the capabilities of even modern computers. This area is addressed byalgorithm complexity, and your users will not understand it well.
Further illustrative examples of problems in interfaces caused by a mismatchfrom the designer’s view of the task and the user’s mental model (such as doorsthat open the wrong way, and buttons that are hard to find) can be found in bookssuch as Norman (1988, 2013) and on web sites of interface bloopers.
6.2.3 Feeling of Knowing and Confidence Judgments
Users will vary in how confident they are in their representations. So they will askthemselves questions about objects such as ‘‘Is this a clickable region?,’’ aboutprocesses such as ‘‘Is this the right way to do it?,’’ and results such as ‘‘Is this theright answer?.’’
The way that confidence judgments are analyzed varies across contexts andresearch domains. Computer science and artificial intelligence (AI), for example,have tried to provide algorithms for computing a confidence level based on theavailable evidence. Psychology has studied feeling of knowing, about wordretrieval, strategy selection, and how close you are to the answer. Business hasstudied confidence in decision making. In each of these cases, the measures ofconfidence form another part of a mental representation.
Users will base their feeling of knowing on a wide range of information. Thisincludes having successfully used the answer before, being familiar with thedomain, social expectations from the person asking (do you know the way to….?),and social comparison (others would know the answer, so I probably should alsoknow it). Good interfaces will help users develop appropriate levels of confidencein their representations and decisions. Often, this means providing information tosupport learning, including feedback on task performance, and also providinginformation to build a mental model. If users do not get feedback, their calibrationabout how well they are doing will be poor to non-existent; this applies acrossmany professions and businesses (Dawes 1994).
6.2.4 Stimulus–Response Compatibility for Mental Models
One aspect of mental models that can be applied to interface design is the idea ofstimulus–response (S–R or SR) compatibility. This aspect of behavior is that the
6.2 Mental Representations 171

stimulus and the response should be compatible. This is typically seen as havingphysical aspects of an interface (e.g., buttons) and displays (e.g., GUIs) match theworld that they are representing. So the buttons to call an elevator to go up shouldbe above the buttons that are used to call an elevator to go down. Systems wheremappings like these are supported are faster to use and can lead to fewer errors.
Payne’s (1995) work, reported in Chap. 1, provides several examples of howS-R can influence the usability of interfaces. The better designs (shown in Chap. 1and explained further in the exercises) show that better S-R reduces errors by about70% compared to a poor mapping, and that response times can be up to 30%higher with a poor mapping.
Another way to describe this aspect of behavior is making the task/actionmappings appropriate. That is, the task the user is trying to perform should be easyto map to an action to perform. This is taken up in Chap. 12 as the Gulf ofExecution.
The effect of S–R compatibility can also play out in computer interface menusand interfaces. If the user is searching for a widget, then an interface that explicitlylabels something as a widget is a clearer interface than one that calls the widgetsthingamajigs. Figure 6.5 shows an example where the phrase ‘‘Frequent flyernumber’’ was replaced with ‘‘SkyMiles’’ (a type of frequent flyer number). Making
Fig. 6.5 An airport check-in kiosk. The phrase ‘‘Add SkyMiles,’’ on the bottom, refers to theirfrequent flyer program account number which, if the interface is rarely used, can (and did) requirethe user to do extra work by asking an agent what SkyMiles is, and how to enter a frequent flyernumber
172 6 Cognition: Mental Representations, Problem Solving, and Decision Making

improvements like this to interfaces requires knowing the terms that the users willbe using, which may require substantial work when the users are distant, andcreating designs that can support multiple terms when different types of userssearch using different terms. In Fig. 6.5 changing ‘‘SkyMiles’’ to ‘‘SkyMiles fre-quent flyer number’’ would be appropriate.
A related example of using multiple names for the same object leading toconfusion happens with air travel from Dulles Airport. Its name is Dulles Inter-national Airport, and its code is IAD. It is located in the Washington, DC areaabout 25 miles west of Washington, DC; however, it is actually in Sterling, Vir-ginia, near the town of Dulles, VA. In other words, there are several ways that youcould search to find the airport. Some users may use all of these terms, but somewill not recognize some of them. This variety of naming conventions in the realworld can make interface design complex. One way of simplifying things is to usemultiple levels of naming. LON, for example, is the city code used to represent allthe London airports. This helps users who are trying to fly to any London airportwhen searching for tickets, although they will not be able to fly into an airport withthe code LON, and will have to select the specific destination airport, such asHeathrow (LHR), Gatwick (LGW), or Stansted (STN).
6.2.5 Implications for System Design
When designing systems, you need to think about the users (what types of users,the range of skill levels and attributes they may have, and so on), how they willcarry out work using the system, and the context in which they will use the system.If you can talk with and observe users, this may provide you with a chance to learnhow they represent themselves, their tasks, and the system.
Mental models will often provide you with guidance about how to improve theusability of the system by matching the mental models the users have aboutthemselves, their tasks, and the system (Krug 2005). Knowing about the users andtheir mental models will also help identify where you need to support them todevelop an accurate mental model of the system. The areas where support isneeded may not be obvious to you as a designer if you already understand—have amental model appropriate to your purposes—the system, but your users are likelyto have a different mental model of the system (based on beliefs, knowledge,capabilities, and attributes). Their models will differ between users and over time,so your design needs to take this into account.
For example, photo manipulation software will have to teach the novice userabout the concepts used to describe photos and manipulations to them. Cell phonesmay have to disambiguate cleanly what method is being used to make a call(phone or voice over IP), and what network the phone is connecting to (a phonecompany or a local wireless).
6.2 Mental Representations 173

6.3 Problem Solving
Figure 6.6 shows a set of puzzles. Solving the problem of how to complete thepuzzles can be great fun. This general notion of problem solving also applies whenusers try to perform tasks using systems in a particular context.
Problem solving essentially involves working out how to get from the currentstate of affairs to the goal that you are trying to achieve by taking appropriateactions. More formally, this can be described as applying operators to states toreach a goal. Problem solving is often studied by looking at how people solvepuzzles, because the movement from one state to the next, and eventually to thegoal, can be directly observed.
In the Tower of Hanoi, shown in Fig. 6.7, the goal is to move all the disks fromthe left hand post to the right hand post. There are several constraints. The diskscan only be moved one at a time. The discs have to go on a post, and a disc cannotbe placed on top of a smaller disk.
The first decision is therefore where to move the smallest disk? It can be movedto the middle or to the right post. The second decision is which disk to move, thesmallest (probably not, but you could), and if you move the second smallest disk,there is only one post you can move it to. You continue in this way until all of thediscs in the tower have been moved to another post. Although there are severalways to think about how to solve this puzzle, and several ways to solve it, there isonly one correct minimal path.
The Tower of Hanoi has been used for a long time as a useful illustration ofproblem solving. Because it is a relatively simple, clear, but non-trivial problem, ithas been used to study problem solving. There is a clear starting state and a cleargoal state; the operations (operators) that can be applied are fairly evident and easy
Fig. 6.6 A set of puzzlesfrom a ‘‘Sunday box’’,designed for play (Copyright� 2006 James Dalgety,Hordern-Dalgety Collection.http://puzzlemuseum.com.Used with permission)
174 6 Cognition: Mental Representations, Problem Solving, and Decision Making

to perform, and the constraints are relatively clear. It is easy to see the state of thedisks, and it is basically easy to judge how close you are to the goal state. It takeseffort to solve the puzzle, but people can generally solve it, particularly for three orfour disks.
6.3.1 The Importance of Problem Solving
Problem solving occurs when users do not know what to do next. This happenswhen they are learning. Novice users will learn a lot, and expert users will learn innovel and unusual situations. When an expert sees a new type of fault or a novelcombination of faults they will normally have to resort to problem solving. Theyhave to function at Rasmussen’s (1983) knowledge level, using knowledge in aproblem solving manner, using strategies such as trial and error, for example. Inthe Tower of Hanoi, the user does not know the full sequence of moves, so theywill have to do some problem solving. Some users will reason about the problemin their head, and consider what moves are possible and where this will take them.Other users will start by moving disks; it is a little easier to study how these usersproblem solve because their behavior is more visible. In both cases, their initialbehavior will be slow and effortful. As they learn to do the task, however, theirperformance becomes faster.
6.3.2 Examples of Problem Solving
When you are installing software, you might know the goal state, and you mighteven think you know the starting state, but get into trouble because you don’t have
Fig. 6.7 The Tower of Hanoi puzzle. In this picture, two towers of disks are shown here, butonly one tower is normally used. The goal is to move a tower, disk-by-disk, to the far peg. Thetower on the left would be easier to work with because the disks are easier to tell apart than thedisks on the right, and because there are fewer disks (five vs. six). An example tower to play withis on the book’s web site
6.3 Problem Solving 175

an accurate view of the actual starting state (you may have an old version installed)and you might not know the actual constraints on the installation process (e.g., youcannot install a new version correctly if the old version is still on the computer).Software can help with this, for example, noting the constraints for you.
In many hardware configurations for PCs there are hidden constraints: somedisks require particular drives and graphics cards may require specific pieces ofsoftware as well. These constraints are often hidden, and sometimes can only befound through applying expensive operators, that is, configuring the hardware andthen testing.
Problem solving is effortful and time consuming. In aviation they try to min-imize the amount of problem solving that flight crews have to perform by pro-viding a Quick Reference Handbook (QRH). This is essentially a set of procedures(checklists) that can be used to deal with known situations, both common and rare.In this way the pilots can operate at Rasmussen’s rule-based level. In extremesituations, however, they may have to resort to problem solving. In the Sioux Cityair accident (NTSB 1990), for example, the aircraft lost all of its hydraulicssystems whilst in the air, which basically meant that it could not be steered in thenormal manner. The likelihood of such an event was so remote that there was noprocedure to deal with it in the QRH, and even the aircraft manufacturer did nothave a way to steer the aircraft. Fortunately there was another pilot on the aircraftwho, together with the flight crew, worked out a way to steer the aircraft and get itdown onto the ground.
6.3.3 Known Influences on Problem Solving
There are several known effects and influences on problem solving. These includeways that people like to problem solve and known ways that they are inefficient atproblem solving. Knowing these effects can help build better interfaces andsystems.
6.3.3.1 Based on Mental Models
Problem solving and decision making are thoroughly rooted in our worldknowledge and world experiences. In trying to understand unfamiliar machines orunfamiliar behavior of common machines we try to construct a mental model(imagined world) in which we understand the device. This model enables us tooperate the machine without having to recall what to do from memory. Thecorrespondence between the imagined world and the real world is not important aslong as the operations make sense in the imagined world, our mental model.
Mental models are thus used to perform Means-Ends Analysis (MEA) whenproblem solving. This approach to problem solving examines the current state ofthe device and notices differences between it and the solution. Systems that
176 6 Cognition: Mental Representations, Problem Solving, and Decision Making

support this type of analysis can help users. If a disk is full, the user will want tocreate a less full disk. What are the large files that can be deleted, or what are thefiles that are rarely used or that were temporary? Displays of this informationprovide the way for users to understand and apply operators to solve their problem.
Metaphors for design exploit this process by prompting an appropriate mentalmodel of the device. However, one needs to be careful. This type of problemsolving fails when the mental model is wrong. Novice writers, for example, look atpapers and notice that the paper is not long enough, and simply attempt to addmore pages (this is not how good papers or textbooks are written).
6.3.3.2 Avoids Apparent Backtracking
Early work on problem solving found that problem solvers do not like to moveaway from the goal. This is sometimes called backtracking. This was found withproblems like the Missionaries and Cannibals problem and the Goat, Cabbage, andWolf problem, but occurs in many problems, and can include, for example,installing software that has to be then uninstalled to move on. These problems areshown in Table 6.2. In these problems you have to make some moves that appearto take you away from the goal. In each of these problems this means carryingsomething that you have already taken across the river back to the starting side.
Problem solvers have particular difficulty finding and doing this move, pre-sumably because it looks like going away from the goal. These changes can bedifferentiated from simple undoing progress from a dead end.
So, if you are building a system, you should be careful how you represent thegoal and the state of the system. If an action is required that might look like it’sgoing away from the goal, you might support the user by providing a display thatshows that the move is in the right direction, or you might emphasize it in otherways or with other instructional materials. Or, if you are trying to make a gamemore difficult, you might require backtracking.
6.3.3.3 Functional Fixedness, Einstellung, and Insight Problems
Sometimes the ways we view objects and problems is biased by previous expe-rience. This leads to viewing objects and how to view problems not being done aswell as they could be. Functional fixedness and Einstellung are two examples ofthis type of effect.
Functional fixedness is where a person becomes fixated on a particular use of anobject. Figure 6.8 provides an example. In this task, solving it requires not fixatingon a common usage of the objects, and using them in a very reasonable but harderto think of way.
Einstellung is related to Functional Fixedness but refers to the situation where aperson gets fixated on a strategy to solve a problem. The most famous example issolving a puzzle using water jugs (Luchins 1942). In this task, people were given a
6.3 Problem Solving 177

series of problems using water jugs. In these problems, there were three jugs and atarget amount of water to get. For example, one problem was to get 3 gallons using1-, 4-, and 5-gallon buckets (fill the 4-gallon, empty into the 1-gallon, and be leftwith 3 gallons in the 4-gallon bucket). Over several trials they learned a strategythat worked (such as fill the first bucket, empty into the second bucket, fill the firstbucket, empty into the third bucket, pour the second and third buckets together).When given a new problem that was solvable with a more efficient strategy (suchas using 1-, 5-, and 7-gallon buckets, get 2 gallons by filling the 7-gallon, andemptying into the 5-gallon to get 2 gallons), they would continue to use the lessefficient strategy (more pours), or if given a problem that required a differentstrategy, they would first try the old, unworkable strategy.
Functional fixedness and Einstellung both arise when people do not make fulluse of their knowledge, but are influenced too much by previous successes. As youdesign systems you should be mindful of what previous knowledge and mental
Table 6.2 Puzzles that require backtracking to solve
Goat, cabbage, and wolfYou have a goat, a cabbage, and a wolf that you have to carry across a river. Your boat can only
hold you and one other object. If you leave the goat with cabbage, it will eat the cabbage. Ifyou leave the wolf with the goat, it will eat the goat. How do you ferry them across the riverwithout anything getting eaten?
Missionaries and cannibalsThere are three missionaries and three cannibals that have to cross a river. Their boat can only
hold two people. If there are more cannibals on a side of a river than missionaries, thecannibals will eat the missionaries. How do they ferry themselves across the river withoutanyone getting eaten?
Fig. 6.8 You are in a room and have two strings to tie together (imagine you are MacGyver, aUS TV personality who has to solve odd problems using odd things). You have a hammer, sometacks, a candle, and a box of matches. The two strings are too far apart for you to reach both ofthem when they are hanging down, but close enough to tie together if you have each in a hand.How do you tie them together?
178 6 Cognition: Mental Representations, Problem Solving, and Decision Making

models they have encountered (functional fixedness) and what previous strategiesthey have used (Einstellung). Simply being aware that these effects can arisemeans that you can design systems that avoid them.
Insight problems are problems where novel behavior or understanding isrequired. Figure 6.9 shows a typical example. Most problem solvers have troublesolving this problem the first time. Solving it requires a singular insight, in thiscase, that you can and have to go outside the implied box the dots make up.Similarly, the problem in Fig. 6.8 is often presented as an insight problem becausethe way problem solving proceeds is that you are frustrated for a while until you‘see’ the answer. While using Gimp to edit photos, for example, one of us hassolved several insight problems.
Insight problem solving can be seen as having several stages (Sternberg andDavidson 1995):
Impasse: a point reached by an individual where they run out of ideas of operatorsor strategies to try that might solve the problem.
Fixation: an individual repeats the same type of solution again and again, evenwhen they sees that it does not seem to lead to a solution; they become fixated on asolution.
Incubation: a pause or gap between attempts to solve a problem can sometimes appearto aid the finding of a solution, as if one is clearing one’s mind of faulty ideas, or, as hasbeen found, cues in the environment can help suggest solutions (Kaplan 1989).
The ‘Aha’ experience: the solutions to some insight problems can seem to appearfrom nowhere, like a Eureka moment.
Unless you are providing puzzles to your user as part of a game, you generallydo not want to provide them with insight problems. Insight problems are hard tosolve, are characterized by a relatively long solution time per number of steps, and
Fig. 6.9 Connect all the dotswith four line segmentswithout picking up yourpencil
6.3 Problem Solving 179

unless you have an unusual set of users, they will not enjoy solving insightproblems (although see the breakout box on ‘‘Need for cognition’’).
6.3.3.4 Post-completion Errors
The post-completion error (Byrne and Bovair 1997) is an interesting and importanteffect between memory and problem solving. This error arises when the goal forthe task has been completed but the goals for the subtasks have not. For example,when you go to an old fashioned ATM machine, you will get your money beforeyou get your card when making a withdrawal. You are there to get the money, notto get your card back. Once you have your money, you may walk away, leavingyour card behind. Newer machines return your card before dispensing your money.Figure 6.10 shows another answer, a machine that does not retain the card.
Other examples of post-completion errors are available from email: when youwrite the email but do not send it, or when you mention an attachment but do notattach it. This error can also be seen in programming, where you allocate thememory for an array but do not release it when you have finished using it.
Post-completion errors provide a few suggestions for design. They suggest thatthe system should discourage the user from believing that they have completed thetask until all the important subparts are done, and to put the most important goallast where technology and the situation permit.
Fig. 6.10 An ATM machine that helps avoid the post-completion error because it does not retainthe card. Another way is to return the card before giving money
180 6 Cognition: Mental Representations, Problem Solving, and Decision Making

6.3.3.5 Breakout Box: Need for Cognition
Many users do not want to do problem solving. They would prefer to perform thetask directly. However, some users like to do problem solving; they like to think.These are people who do crosswords, solve Sudoku puzzles in meetings, like tobuild things, or debug systems. Cacioppo and Petty (1982), as well as previousresearchers, describe this difference as a difference in the ‘‘need for cognition.’’Users with a great need for cognition agree with statements like:
I really enjoy a task that involves coming up with new solutions to problems.
I would prefer a task that is intellectual, difficult, and important to one that is somewhatimportant but does not require much thought.
I would prefer complex to simple problems.
Thus, users with a higher need for cognition will more likely find poor inter-faces a challenge rather than impossible. As you develop your system, you mightconsider how interested your users are in problem solving with it. While theliterature on individual differences suggest that the need for cognition varies byindividuals, it might also vary by task: for games, you can encourage moreproblem solving; for entertainment and informal use, there may be some problemsolving involved; for high stake interfaces, such as health, transportation, orfinancial systems, most users will not want to solve problems.
The need for cognition has also been used to study how people are persuadedand form opinions. Those with a high need for cognition focus on the argumentsput forward. Those with a low need for cognition focus more on peripheral cues,such as body language, social status of the speaker, and fluency of the speaker.Your users may also be the judges of your system in the same way; and you maywish to make sure your system appeals to both types of users.
6.3.4 Ill-Structured Problems
Some problems appear harder than others. An important group of problems aremore difficult because they are ill-structured. That is, they are not clearly defined.Writing, for example, is ill-structured. When you are writing the goal state is notclear—it is not clear when you are done. It is also less clear when writing what allthe operators are (unless you examine everything on a character by characterbasis—then the problem is completely intractable!). Many aspects of design canalso be seen as ill-structured problems. For example, when is the new phone ornew interface finished being designed? These problems are also called ill-definedor messy problems. They often occur in the real world, and a major step forward isto make them more defined.
Ill-structured problems can be ill-structured in several ways. They can havepoorly defined operators or the operators can be unknown to the problem solver.
6.3 Problem Solving 181

The Chinese Ring puzzles in Fig. 6.11 are like this. The puzzle on the top has therings as actual rings, the puzzle on the bottom has a knob as a ring. The task is easyonce you figure out what moves are possible and how close you are to the goal ofremoving the rings. A problem where you don’t know or can’t easily see the stateof the system is also ill-defined. Most versions of the Chinese Ring puzzle also aredifficult because you can’t tell what the state is very easily; this is particularly truefor the top puzzle in Fig. 6.11.
Ill-structured problems can be difficult because you do not know what the goalis or how close you are to the goal. Knowing how close you are to a solution is aproblem for both of these Chinese puzzle versions. Tetris is pretty well structured;Rubik’s cube is well structured, but users have trouble judging the state because itis so complex. Installing software can become very ill structured quickly if theerror messages are not clear. Learning where you are in Rubik’s cube or whatsoftware is not installed and is causing the error both improve problem solving.
Designers can help users with ill-structured problems in several ways. It iseasier for users if the operators are clear. Thus, menus or lists of actions they cantake help define the problem space. This list can also indicate what the constraintsare on choosing operators. Having a clearly defined goal and good guidancetowards the goal are also helpful. These distinctions can be modified or invertedfor games and creative pursuits. Making problems less clear can make them moreinteresting and make the process of solving them a more creative experience.
Fig. 6.11 The Chinese Ring puzzle. Top: classic version, provided by the Puzzle Museum (usedwith permission) of a classic version. Bottom: plastic version with the same search space, andslightly different state description and different operators (the knobs turn on a piece of plastic thatslides in a track)
182 6 Cognition: Mental Representations, Problem Solving, and Decision Making
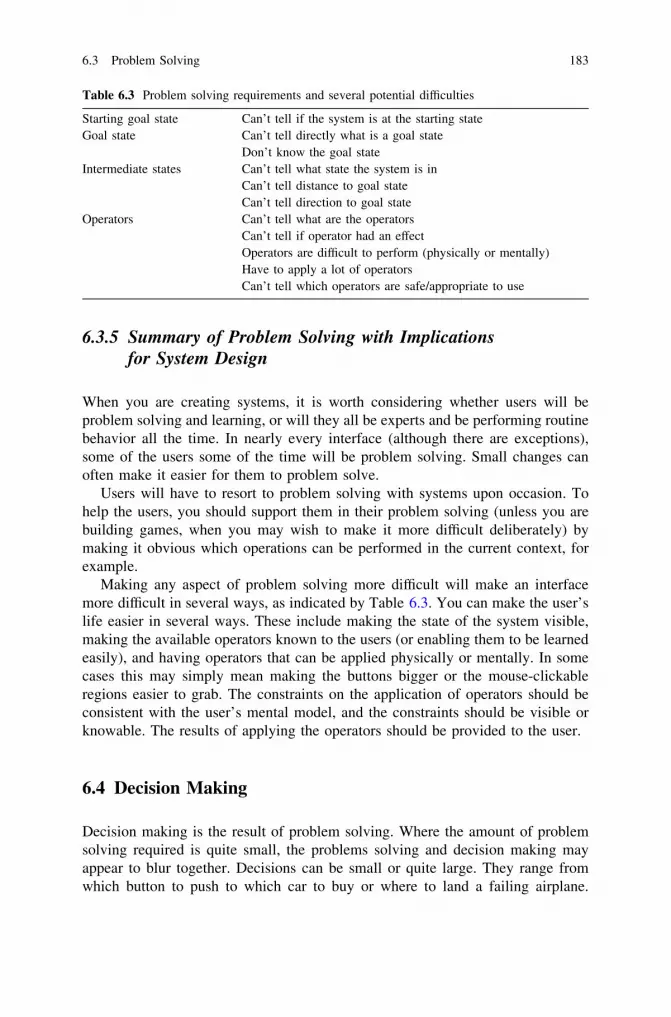
6.3.5 Summary of Problem Solving with Implicationsfor System Design
When you are creating systems, it is worth considering whether users will beproblem solving and learning, or will they all be experts and be performing routinebehavior all the time. In nearly every interface (although there are exceptions),some of the users some of the time will be problem solving. Small changes canoften make it easier for them to problem solve.
Users will have to resort to problem solving with systems upon occasion. Tohelp the users, you should support them in their problem solving (unless you arebuilding games, when you may wish to make it more difficult deliberately) bymaking it obvious which operations can be performed in the current context, forexample.
Making any aspect of problem solving more difficult will make an interfacemore difficult in several ways, as indicated by Table 6.3. You can make the user’slife easier in several ways. These include making the state of the system visible,making the available operators known to the users (or enabling them to be learnedeasily), and having operators that can be applied physically or mentally. In somecases this may simply mean making the buttons bigger or the mouse-clickableregions easier to grab. The constraints on the application of operators should beconsistent with the user’s mental model, and the constraints should be visible orknowable. The results of applying the operators should be provided to the user.
6.4 Decision Making
Decision making is the result of problem solving. Where the amount of problemsolving required is quite small, the problems solving and decision making mayappear to blur together. Decisions can be small or quite large. They range fromwhich button to push to which car to buy or where to land a failing airplane.
Table 6.3 Problem solving requirements and several potential difficulties
Starting goal state Can’t tell if the system is at the starting stateGoal state Can’t tell directly what is a goal state
Don’t know the goal stateIntermediate states Can’t tell what state the system is in
Can’t tell distance to goal stateCan’t tell direction to goal state
Operators Can’t tell what are the operatorsCan’t tell if operator had an effectOperators are difficult to perform (physically or mentally)Have to apply a lot of operatorsCan’t tell which operators are safe/appropriate to use
6.3 Problem Solving 183

They can be quite simple and isolated, or they can occur within a string ofdecisions, perhaps while problem solving.
Decision making is studied by a wide range of disciplines, partly because thereare many kinds of decisions, and partly because they affect all areas of humanbehavior. Interesting work on decisions are found in psychology (e.g., Gigerenzeret al. 1999; Kahneman et al. 1982; Evans 1990), business (e.g., Simon 1997),advertising (e.g., Ries and Trout 1986/2000), human factors (e.g., Cacciabue et al.1992; Hoffman et al. 1998; Lehto 1997), HCI/marketing (e.g., Fogg 2003), andeconomics (e.g., Levitt and Dubner 2005). Here we focus on some of the gener-alities that are applicable to designing systems.
6.4.1 Decision Making is Often Not Rational
One of the fundamental truths in this area, and the first to note, is that often themost rational choices to an outside observer or experimenter are not chosen.People making decisions do not always take account of a lot of potentially relevantinformation when making decisions, and their decision making processes havegeneral, knowable biases. That is, there are systematic ways that decisions arebadly made.
Simon (1997) argues that, rather than trying to find the optimal answer, peopletypically satisfice. So, for example, if users were trying to find the cheapest price forsomething online they would choose a good enough price given the constraints ofdoing better which may involve looking at the price across 10 sites, rather than 500.In some sense, they are factoring in the price of further searching and the extra timeneeded to find a better price.
There are other problems with the way that people make decisions as comparedto the way computers typically make decisions. These problems can often berelated back to the cognitive processing capabilities introduced in earlier chapters.The rest of this chapter describes some of these systematic limitations, startingwith simple decisions (Kahneman 2013).
6.4.2 Simple Decisions: Hicks Law and Speed–AccuracyTrade-Offs
As noted earlier, signal detection theory provides a simple way to categorizedecisions in terms of their likelihood of being correct. It is also important, how-ever, to know how long it takes to make a decision.
Pressing the corresponding button when a particular light illuminates involves asimple decision. It takes around 150–400 ms, depending on factors such as thestrength of the light and the distance to the button. These numbers are useful insystem design, because factors such as the time to press the brake pedal in a car
184 6 Cognition: Mental Representations, Problem Solving, and Decision Making

determines the safe following distance in driving, and the time to press a buttondetermines useful speeds for agents in video games.
The time to push a particular button also depends on the complexity of thedecision. Adding more lights and buttons, for example, will make the task moredifficult and will thus increase the time to perform the task.
Hick’s Law (or sometimes the Hick–Hyman Law) describes the time to makethe decision in relation to the number of choices. When there are many choices thetime to make a decision may be very long (e.g., deciding which car to purchase),but for simple light sets the relationship is as shown in Eq. (6.1), where the time tomake a choice is related to the product of the number of available choices and aconstant, b, which represents the time to make the choice and accommodateschanges related to the task details. So, increasing the number of choices increasesthe response time, but in a logarithmic way, which means the rate of increase isslower than it would be if the relationship was linear.
Time ¼ b log2 n þ 1ð Þ ð6:1Þ
The equation can be extended to take account of non-equally likely choices,such as menus which include items that are rarely selected. If the choices get toolarge, however, or the user has to look through every item in the menu, they mayhave to scroll down the menu, and the relationship will become more linear with alarger constant cost per item. Where the user is a consumer, in an eCommercesituation, for example, they may not make a choice at all (Schwartz 2004).
It has been argued that the law arises from a series of choices that subdivide thelist in two with each decision. Having algorithmic explanations is useful because ithelps apply this theory to other situations and to situate it in larger tasks.
Hick’s Law and signal detection theory (from Chap. 4) both suggest thaterrors and time can be traded off against each other: the so-called speed–accuracytrade-off. For any given task, the user’s performance will often range betweenvery careful and slow, to very fast but less accurate. Psychology researchersstudy both relatively accurate and relatively fast behavior, trying to find the bendin the curve shown in Fig. 6.12.
When creating systems you may thus want to let users know how fast they areand how many errors they are making to let them adjust their performance (andhence change their position along the curve). For the purposes of design, though,you may want to know the time required to perform the task and what theacceptable error rates are so that you can help the user to meet these criteria.
6.4.3 Stimulus–Response Compatibility for Decisions
Stimulus-response compatibility, introduced earlier in this chapter, notes thatresponses that match stimuli are faster and more reliable. This is also true formapping between a task and an action, and these two concepts are closely related.The classic example, perhaps, is that elevator buttons for the higher floors in a
6.4 Decision Making 185

building should be positioned above the buttons for the lower floors. Figure 6.13shows another problem in an elevator control panel. It has good S-R compatibilityfor the door opening and closing buttons (the open is near to the door, the close isnearer the wall). The layout of the buttons for the floors are done in a British stylethat may also be familiar in Canada (ground floor is where you enter, and the firstfloor is the floor above that), but the rooms are numbered in such a way that labelshave to be attached to the panel to explain to users where they are (e.g., 200s areon the 3rd floor). This might also be the result of a cultural mismatch between anAmerican company and a Canadian hotel, but, given the numbering scheme, onecan only wonder.
TimeE
rror
s
Low speed, Low Errors
High speed, High Errors
Fig. 6.12 The speedaccuracy trade-off
Fig. 6.13 An elevator thathas both good and bad SRfeatures. The open button iscloser to the doors (which areto the left, not shown), but therooms do not map easily tothe buttons, 100-level roomsare on floor 2, which does notmatch many of the mostdirect mental models, such as100-numbered rooms beingon floor 1, or floor 3 beingabove 2
186 6 Cognition: Mental Representations, Problem Solving, and Decision Making

An old tale from Dick Pew (and documented in Norman’s 1988 POET book) isthat in a nuclear power plant the controls to raise and lower the rods were not clear,so the operators put beer taps on them to differentiate between them—with Loe-wenbrau on one (low) and Heineken on the other (high). This may be an urbanmyth, but it provides another clear illustration of what we mean by stimulus–response compatibility.
Probably the most powerful version of compatibility is the spatial compatibilitythat exists in the elevator example (and in Payne’s example in Fig. 1.1). This effectcan influence computer interfaces in many other places that use spatial and met-aphorical content (e.g., that use relationships like up, down, left, right, higher,lower, more, less). Designs that violate this compatibility are likely to lead to agreater number of errors and take longer to use.
Two major operating systems have both included actions that violate thisprinciple and rightly have been criticized for doing so. The Macintosh operatingsystem originally had users drag the floppy disc icon onto the trash can icon inorder to eject the disc: users just wanted their disc back, they did not want to throwit into the trash can. Also, both Windows and the Macintosh operating systemshave users press the start button to shut down the operating system.
Finally, Fig. 6.14 gives an example of poor semantic mapping. OK normallymeans something is good. Cancel normally means stop doing something. In thisexample, OK means to cancel the email and cancel means do not cancel the email.A better design would be to have buttons that said ‘cancel email’ and ‘continuewith email’.
6.4.4 Known Influences on Decision Making
There are often differences between what people decide to do, and what an outsideobserver thinks that they rationally should decide to do. These differences are oftenpredictable based on known biases and difficulties in reasoning. There areexplanations for some of these effects showing how different assumptions by theuser can lead to these effects. In other cases, these effects appear to be biasesbetween otherwise equivalent choices, and sometimes they represent powerfultendencies that are not helpful most of the time.
Understanding people’s biases—both your own and your users’—is importantwhen designing software. It is important, albeit difficult, to counteract these biaseswhen making decisions. Generally, these biases lead you to overestimate howgood you are at something, and how much control you have over situations. Youshould design your system in such a way that it helps your users reason moreaccurately by highlighting information that they would otherwise naturally over-look or discount. The inherent biases described below are unique and have dif-ferent causes, although in real-world settings several may apply at once, and evencombine to make reasoning more complicated.
6.4 Decision Making 187
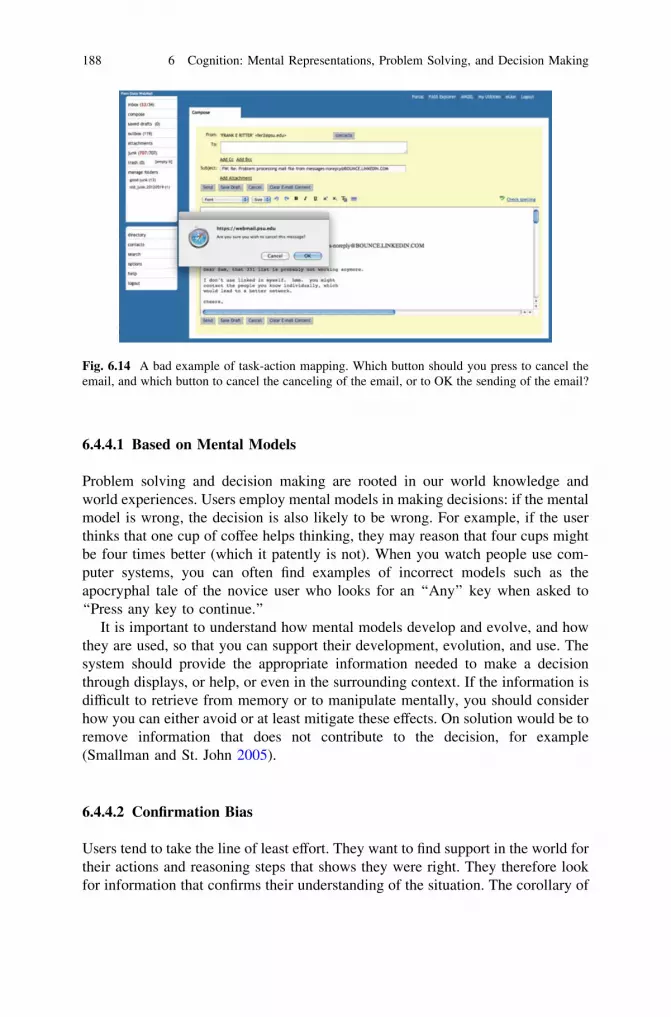
6.4.4.1 Based on Mental Models
Problem solving and decision making are rooted in our world knowledge andworld experiences. Users employ mental models in making decisions: if the mentalmodel is wrong, the decision is also likely to be wrong. For example, if the userthinks that one cup of coffee helps thinking, they may reason that four cups mightbe four times better (which it patently is not). When you watch people use com-puter systems, you can often find examples of incorrect models such as theapocryphal tale of the novice user who looks for an ‘‘Any’’ key when asked to‘‘Press any key to continue.’’
It is important to understand how mental models develop and evolve, and howthey are used, so that you can support their development, evolution, and use. Thesystem should provide the appropriate information needed to make a decisionthrough displays, or help, or even in the surrounding context. If the information isdifficult to retrieve from memory or to manipulate mentally, you should considerhow you can either avoid or at least mitigate these effects. On solution would be toremove information that does not contribute to the decision, for example(Smallman and St. John 2005).
6.4.4.2 Confirmation Bias
Users tend to take the line of least effort. They want to find support in the world fortheir actions and reasoning steps that shows they were right. They therefore lookfor information that confirms their understanding of the situation. The corollary of
Fig. 6.14 A bad example of task-action mapping. Which button should you press to cancel theemail, and which button to cancel the canceling of the email, or to OK the sending of the email?
188 6 Cognition: Mental Representations, Problem Solving, and Decision Making
this is that they have greater difficulty seeing things that conflict with theirunderstanding of the world. This confirmation bias is pervasive.
Confirmation bias is related to noticing the lack of objects or stimuli. We allseem to have difficulty seeing negative instances. That is, we have trouble noticingwhen something is not there that should be there. In software testing, for example,this can happen when a file is not written, or in project management it can happenwhen an email does not come from a colleague about a project update.
6.4.4.3 Regression to the Mean/Sample Sizes
Users tend to over-generalize. Given a single instance of a concept, they willassume that all such instances will have the same characteristics. This leads themto make assumptions that are unsupportable and which may turn out to be false.
An argument can be presented as to why restaurants are not as good the secondtime round. On the first visit to what you perceive as a good restaurant, they mayhave been having a very good day, or you may have been very hungry, whichmade the food taste better. Thus, the results were a bit uncharacteristically good.On your second visit, they may be having an average day, or you were not ashungry. These factors will lead to more average ratings.
These regression effects can be found with music on iPods by a band you aretrying; they will occur when users use an application to do a task where the tasktypes may vary, and in other situations where are you repeatedly evaluatingsomething.
6.4.4.4 Availability Bias (Representativeness)
Users have an easier time remembering the first few items and the last few items ina list, as we noted when discussing memory. The primacy and recency effectsapply across users. People will also remember some items such as those that standout for a particular reason, such as being particularly anomalous, like an elephantin a list of candy bars.
When users are asked to reason about and make decisions, they typicallyretrieve and use memories that are easy to retrieve. These memories are notnecessarily representative nor do they cover the distribution of memories.
It is true that users judge people and things fairly quickly. This applies ininterviews and when opening a new gadget. These judgments are based on rela-tively little information, and will take longer to reverse if they are unfavorable orincorrect. These are the first memories.
People also retrieve memories based on their experiences rather than the factsof the world. For example, if you ask people in America which of each of thefollowing pairs of countries is larger by population: Ireland or Indonesia, Canadaor Vietnam, Bangladesh or South Korea, and Iraq or Iran, you will often get
6.4 Decision Making 189

astounding answers. The actual population sizes differ by a factor of at least two inall of these pairs.
6.4.4.5 Framing Effects
The way that outcomes are presented (framed) has a powerful influence on howusers choose between alternatives. The framing effect (Tverksy and Kahneman1981, 1986) notes that decision makers are quite sensitive to the decision’s frameof reference. Consider the choices shown in Table 6.4. Which would you choose?The most common answers are given in Exercise 6.2.
Where the outcomes are noted in positive terms, lives are saved, money gained,and so on—people making decisions are risk aversive. They appear to act as if theywish to lock in their savings, choosing an outcome with certainty.
Where the outcomes are noted in negative terms, lives are lost, money lost, andso on—people making decisions are risk seeking. They make decisions based ontrying to avoid the loss.
The choices in Table 6.4 have the same expected statistical values, but how youand your users will choose solutions will depend in some part on how the infor-mation is presented.
For example, in an experiment, Kahneman gave students mugs in class. Whenthey were asked to sell them back, they wanted $7.12 for them. When they just gotto look at the mugs, and could either collect a mug or get paid, they valued themug at $3.50. This process had the same outcomes, mug or money, but the peopleholding the mug valued it much higher than the people who could get the mug,showing that how information is presented and the order in which it is presentedcan influence cognition.
This effect of order on having and valuing also plays out for users and softwareand software features. Losing a feature is seen by users as much more costly thannot adding a feature. When a subscription to an online service is dropped it islikely to be valued higher than when adding it. This is useful to know for
Table 6.4 Example problems illustrating the framing problem
Assume that you are preparing a new manufacturing process that will cost $600,000 to create.Two alternatives have been created to help save money implementing this system. Assumethat the exact scientific estimates of the alternatives are as followsProgram A: $200,000 will be savedProgram B: there is a 1/3 chance to save $600,000 will be saved, and a 2/3 chance that nomoney will be saved
Imagine that the Programs A and B are not available, but only C and D areProgram C: $400,000 will still have to be spentProgram D: There is a one in three chance that no money will have to be spent, and a two inthree chance that the original estimate will have to be spent
190 6 Cognition: Mental Representations, Problem Solving, and Decision Making

marketing and for maintenance, although you are still likely to value the mug inhand more than the mug next to you.
6.4.4.6 Learning and Feedback
Dawes (1994) argues that decision making cannot improve without feedback. Inhis book, House of cards, he presents numerous examples of professionals some ofwhom do and some who do not get feedback about their decisions. Those thatreceive feedback have a chance of improving and usually do. Those that do not getfeedback do not improve, although they do become more confident with practice,as they presumably get faster at it. He examines a wide range of tasks, but par-ticularly takes psychotherapists to task, as very often in the past they providedtreatment without receiving feedback on the outcomes of their treatments.
So, if you would like your users to improve their performance and to learn, youneed to provide feedback. A failure to do so may only allow them to increase theirconfidence in their ability to do the task without increasing performance.
6.4.5 Larger Scale Decision Making Process: Expertiseand RPDM
Decision making in the real world is also influenced by learning, mental models,and expertise. Work by Simon and his colleagues looked at how expertise influ-enced decision making. They showed that, in some cases, expertise led to fasterdecisions, but essentially the same decisions; for example, young business majorswould make the same decisions for a business case, but would take longer (Simon1997).
They also studied how people played chess as an analogue for other decisionmaking tasks (Chase and Simon 1973; Gobet and Simon 1996b; Simon and Chase1973). They found good chess players would consider more reorganization of thepositions and better possible moves than would novices, who would have to domore problem solving. This expertise would also allow good players to rememberpositions more readily because they were not remembering all the pieces indi-vidually, but recognizing groups of pieces as patterns in a way similar to howABC, 747, and HFE (and others noted in Table 5.1) might be considered as singleobjects instead of three separate characters (Gobet and Simon 1996a).
This approach has been implemented in computational models, includingprograms that solve problems (Ritter and Bibby 2008) and play chess (Gobet et al.1997). These models start out with effortful problem solving or problem solving-like behavior that, with practice, becomes faster and uses recognition to drive itsbehavior. Sometimes the strategy does not change with improved learning (it isjust faster), and sometimes the ability to recognize what to do changes how the
6.4 Decision Making 191

models perform the task (Ritter et al. 1998), mirroring how behavior changes withexpertise in the task (Larkin et al. 1980).
Within human factors a body of work has developed that looks at decisionmaking in the wild—naturalistic decision making—like fire-fighting, and searchand rescue. Work on recognition-primed decision making (RPDM, Klein 1997),argues that experts do not do problem solving, but that they recognize the situationwhich directly leads them to the correct actions to take. This approach is consistentwith previous work in psychology, and with Rasmussen’s work on levels ofexpertise (Rasmussen 1983).
The work on naturalistic decision making encourages designers to provideinformation to users to help them make decisions. They should also provide theinformation in a way that supports recognition of the correct decisions, andexplicitly acknowledges that experts may move more quickly to a solution usingcues that relate the current situation to previously encountered situations.
6.4.6 Summary of Decision Making with Implicationsfor System Design
Many decision-support systems try to support the process of formalizing theinformation contributing to the solution/decision. However, human problemsolving is not always based on logic and rationality in terms of using the infor-mation to the full. This makes good decision support systems helpful, but difficultto design because often the problem is not with the quality of the informationbeing presented to users.
Users do not make decisions the way you might think they will in several ways.They will take more time the more choices they have. With good design, thesechoices can help them and the choices can be made relatively quickly. With morechoices, or worse design, the time to choose might become large. Users will beable to make more accurate and rapid choices if the choices (as described) matchtheir mental models and the names of the tasks they are attempting to perform. So,provide time, reduce choices where appropriate, and have the choices match themental model and terms that the user has.
The decisions users make will be based on their mental models, and they willoften have different mental models than you. The cognitive architecture they canbring to solve the problem will limit their ability to make rational choices. Theywill often make choices consistent with previous choices because these choicesconfirm their previous choices. They will base their decisions on what they canretrieve from memory, and what they can retrieve first and easiest from memory isnot always the most useful information for making their decisions. So, if yourusers often have to modify their behavior, you might wish to make repetitivebehavior less easy. If they choices are likely to be consistent, then options like‘‘Apply to all?’’ are helpful.
192 6 Cognition: Mental Representations, Problem Solving, and Decision Making

How they will make their decision will be influenced by their context and howthe choices are framed. Decisions based on gains will be slightly risk-aversive;decisions to avoid a loss will lead to choosing riskier options. So be careful howyou frame the options, either as a gain or a loss.
If the users do not get feedback about their choices, their choice quality willremain the same, but they will become more confident in their choices. If they doget feedback, they can learn how to make decisions more accurately and quickerusing a variety of knowledge sources including recognizing a situation as beinglike a previous situation, and also recalling a useful answer. So, provide feedbackin your systems when you can.
Finally, their choices can be situated within a large context, including geog-raphy and social relationships. Good designers will learn about these factors in avariety of ways. Good designs will take these multiple factors into account, andattempt to minimize the biases that will hurt the users, and take advantage ofbiases that can help users. The breakout box on biases in reasoning provides a setof examples applied to a simple task, and the breakout box on incompetenceprovides both serious and humorous insights into limitations of human reasoning.So when you can get context, use it to frame your interface’s interactions.
6.4.6.1 Breakout Box: Biases in Reasoning
We can illustrate how biases affect reasoning using the classic Wason (1960)selection task. This is an example of an abstract deductive reasoning task thatshould be solved using rules of logic:
Every card (shown in Fig. 6.15) has a letter on one side and a number on the other. Givena set of four cards as shown below, which cards would you need to turn over in order toprove or disprove the rule that ‘‘If a card has a vowel on one side, then it has an evennumber on the other side.’’
Most people opt for the A card and the 4 card. Selecting only the A and the 4card only gathers evidence to prove the rule, however, and is an example ofconfirmation bias. In other words, often people only look for evidence that sup-ports (or confirms) their hypothesis. In this case, the hypothesis is the rule that theywere given. The correct solution, however, is that the A card and the 7 card shouldbe turned over. If the A card has an even number on the other side that is evidenceto support the rule; if it has an odd number it disproves the rule. The 7 card has tobe turned over because if it has a vowel on the other side, this also disproves therule. The 4 card does not have to be turned over because if there is a vowel on theother side, the rule is satisfied and if there is a consonant then the rule would notapply.
The way this and many problems are framed, however, has a major influence onpeople’s performance. If the problem is made less abstract by using real objectsthat people are more likely to encounter in their daily lives, more people give thecorrect answer. Johnson-Laird et al. (1972), for example, framed the problem in a
6.4 Decision Making 193

more concrete way, using sealed/unsealed envelopes (so the flap was open/closed)which had stamps of different denominations on the other side. They then askedparticipants to prove or disprove the rule: ‘‘if an envelope is sealed then it has a 5pstamp on the other side.’’ With a more concrete representation, 22 out of 24 peoplegave the correct answer. Making problems more concrete generally makes themeasier.
For a more detailed psychological description of the issues surrounding per-formance on various versions of the Wason reasoning task see, for example,Quinlan and Dyson (2008).
6.4.6.2 Breakout Box: Why Don’t Users Do What They Should?
At this point in your reading you may have realized that users do not always dowhat they should, that they do not always act in their own interests. It is one thingto make mistakes, slips, and errors (covered in the chapter on errors, and whichyou can infer from the memory chapter); it is another to hold quite wrong beliefscontinuously contradicted by the world, and to continue to perform poorly basedon these beliefs. Why does this happen?
Academics use other phrases, such as why smart people can be so foolish(Sternberg 2004) and how people cannot recognize their own incompetence(Dunning et al. 2003). Generally, this area can be examined as a type of meta-cognition—do you know what you know and can you judge your performance inquantitative ways (how good is it?) and qualitative ways (how is it good and howcan it be improved?).
Sternberg (2004) notes five factors that can lead to foolishness—poor decisionmaking and problem solving in leaders. These are as follows: (a) Unrealisticoptimism, assuming things will work out or strategies will work. (b) Egocentrism,focusing on your own goals rather than a broader set of goals. Sternberg notescases where focusing on short-term goals hurts long-term goals, and where notlooking after others leads to significant problems arising for the leader. (c) A senseof omniscience, assuming you know all you need to know to make the decision.(d) A sense of omnipotence, assuming that you are competent in one domain andthus in all, and that the plans you put into action will work. (e) A sense of
A D 4 7
Fig. 6.15 Which cards doyou need to turn over toverify that if a card has avowel on one side then it hasan even number on the otherside? (Cards have a letter onone side and a number on theother)
194 6 Cognition: Mental Representations, Problem Solving, and Decision Making

invulnerability, that plans cannot go badly wrong given the support you have.These biases in reasoning, however, are well known and occur in nearly everyone.They offer one set of reasons to explain why people are foolish at times.
When they study, students can be affected by these factors, and thus users whostudy manuals or are learning how to use software or systems would be equallyvulnerable. Typically, students think they have learned more than they havethrough studying (Dunning et al. 2003; Winne and Jamieson-Noel 2002). Thismiscalibration can be based on judgments of the wrong measures. For example,some students measure the ease of reading the material. The real test is different,however. The real test is not how fast you can read the material, but how well canyou recall it and apply it. Thus, students who stop studying when they can repeatthe material or who write about the material will be better calibrated than studentswho make this judgment on factors not related to the test.
Figure 6.16 shows example results. Subjects who just took a sophomore psy-chology exam were asked how well they thought they had done. The subjects weregrouped by quartiles by their exam score. The subjects who performed worstthought their scores were just above average (far left). The third quartile wasrelatively well calibrated in that their predictions matched their performance. Thetop quartile thought their performance would be a bit lower, showing modestyamong the top performers.
Another problem is that the poor performers simply do not know any better.They lack the knowledge to judge that their performance is inadequate. Dunninget al. (2003) call it a double curse:
The skills needed to produce correct responses are virtually identical to those needed toevaluate the accuracy of one’s responses. The skills needed to produce logically soundarguments, for instance, are the same skills that are necessary to recognize when a logi-cally sound argument has been made. Thus, if people lack the skills to produce correctanswers, they are also cursed with an inability to know when their answers, or anyoneelse’s, are right or wrong. They cannot recognize their responses as mistaken, or otherpeople’s responses as superior to their own. In short, incompetence means that peoplecannot successfully complete the task of metacognition, which, among its many meanings,refers to the ability to evaluate responses as correct or incorrect.
Fig. 6.16 Perceivedpercentile rankings formastery of course materialand test performance as afunction of actualperformance rank. Copiedfrom Dunning et al. (2003)with permission
6.4 Decision Making 195

Thus, it is a rare and unhappy individual who knows that their answers areinadequate. For example, the knowledge to judge whether a sentence is gram-matical, a word is correctly spelled, a diagram is well drawn, or program wellwritten will be highly correlated with the ability to generate the correct behavior.So people who generate ungrammatical sentences or perform poorly on these othertasks are likely to be unable to know that they are ungrammatical.
What does this mean for users and designing for users? It means, on average,users will think that they know more than they do. They will be overconfidentwhen performing tasks, and they will not always use the right cues to judge theirknowledge.
Good design can help provide more feedback on performance, and could alsoprovide education along the way about how to correct problems. Noting that‘‘Error 23 occurred’’ does not help. Noting that ‘‘Removing disks without un-mounting them can lead to disk errors’’ is a step in the right direction because itprovides a way for users to learn from their errors through feedback.
6.5 Summary
This chapter has given you a broad understanding of how users think by providinghigh level descriptions of user behavior. Mental models, problem solving, anddecision making all depend on the simple architectural mechanisms introduced inearlier chapters. When users interact with technology they depend on the highlevel cognition we have described. By understanding the capabilities and limita-tions of high level cognition you should be better equipped to understand some ofthe ways that users can represent systems and interfaces and how they interact withand use them.
Mental models are used to understand systems and to interact with systems.When the user’s mental models are inaccurate, systems are hard to use. Designerscan attempt to understand users’ initial mental models. Designers can then eitherdesign to support users with those models, or they can help educate users toacquire more appropriate mental models.
Users problem solve when it is not clear what they should do next. Problemsolving uses mental models, forms a basis for learning, and can be supported in avariety of ways. Systems that provide appropriate information to users can helpwith problem solving. When users are found to problem solve, it may be appro-priate to modify the interface to support behavior to make it include less problemsolving, to provide feedback to support problem solving such as distance to thegoal, or to perform the task for the user.
Decision making is a more punctuated form of problem solving, made aboutand with systems. It is not always as accurate as outside observers would expect itto be. There are ways to support and improve decision making. Short-term, thereare biases to avoid encouraging in the interface. Long term, providing feedbackabout past decisions and their accuracy can help users.
196 6 Cognition: Mental Representations, Problem Solving, and Decision Making

There are surprises for designers in each of these area, where folk psychologyconcepts and theories are inaccurate. The most general result and the one with thelargest import is that, in each of these areas, users are likely to have different mentalmodels, different problem solving strategies, and make decisions in different waysthan system designers, so designers should study the users when these aspects ofbehavior are important. There is a rich literature on each of these areas in psychologyand other areas. When you start to design interfaces that touch on other aspects ofthese areas, you should have enough background to go and learn more.
6.6 Other Resources
A classic text on human reasoning using mental models is Philip Johnson-Laird’sbook, Mental Models:
Johnson-Laird, P. N. (1989). Mental models. Cambridge, MA: The MIT Press.
You will find much material online that details some of the reasoning biases wehave discussed in this chapter, but it is also worth reading some of the originaltexts, especially those by Kahneman and Tversky:
Kahneman, D. Slovic, P. and Tversky, A. eds. (1982). Judgment under uncertainty:Heuristics and biases. Cambridge, UK: Cambridge University Press.
A different approach to thinking about mental models is to think about the roleof language in creating how we see the world. An interesting book to read for thisapproach is George Lakoff and Mark Johnson’s 2008 book Metaphors We Live By.
Lakoff, G. and Johnson, M. (2008). Metaphors we live by. Chicago, IL: University ofChicago Press.
Hayes’ (1981) book inspired parts of this book. It provides a good source forthinking about applied cognitive psychology and problem solving:
Hayes, J. R. (1981). The complete problem solver. Philadelphia, PA: The Franklin InstitutePress.
Another classic text is the 1972 book by Allen Newell and Herb Simon, and isworth reading for historical context as well as for their ideas about human problemsolving specifically:
Newell, A. and Simon, H. A. (1972). Human problem solving. Englewood Cliffs, NJ:Prentice-Hall.
The journal Psychological Science in the Public Interest publishes papers abouthow results in psychology have public policy implications. The series is worthreading because it examines important topics. It is available online, free, as PDFfiles. For example, a review paper by Dunning et al. (2004) summarizes why usersare often poorly calibrated in their decision making and provides more examples
6.5 Summary 197

and results. They have also published reviews on how to promote trust, how toimprove learning in schools, and terrorism.
6.7 Exercises
6.1 Using a smartphone, explore it to find an ill-structured problem. This could bean application or function that has the features of an ill-structured problem.Discuss how you could improve this application, or note why the user wouldwant it to be an ill-structured problem.
6.2 Find another ‘‘bias’’ in human problem solving or in decision making withparticular attention paid to business problems. You might find implications inan earlier chapter, or you might find useful information in a book or journal ondecision making in business. Compare this known bias in reasoning to the listshown here. Consider which are the more important biases.
6.3 Consider a web site that you know of medium complexity, such as yourdepartment’s web site. Draw a map of it from memory (or, to be fairer, havesome other people draw a map of it). Then, compare the maps with a mapdrawn from the web site. Compare the user’s maps with the actual site, anddraw conclusions about mental models.
6.4 Have some friends choose between the choices in Table 6.4. If your friendsare like Tversky and Kahneman’s subjects (Kahneman et al. 1982), they willprefer program A over program B (72–28%) and program C over program D(22–78%).
References
Bibby, P. A., & Payne, S. J. (1996). Instruction and practice in learning to use a device. CognitiveScience, 20(4), 539–578.
Byrne, M. D., & Bovair, S. (1997). A working memory model of a common procedural error.Cognitive Science, 21(1), 31–61.
Cacciabue, P. C., Decortis, F., Drozdowicz, B., Masson, M., & Nordvik, J. (1992). COSIMO: Acognitive simulation model of human decision making and behavior in accident managementof complex plants. IEEE Transactions on Systems, Man, and Cybernetics, 22(5), 1058–1074.
Cacioppo, J. T., & Petty, R. E. (1982). The need for cognition. Journal of Personality and SocialPsychology, 42(1), 116–131.
Carroll, J. M., & Olson, J. (Eds.). (1987). Mental models in human-computer interaction:Research issues about what the user of software knows. Washington, DC: National AcademyPress.
Chase, W. G., & Simon, H. A. (1973). Perception in chess. Cognitive Psychology, 4, 55–81.Dawes, R. M. (1994). House of cards: Psychology and psychotherapy built on myth. New York,
NY: The Free Press.Dunning, D., Heath, C., & Suls, J. M. (2004). Flawed self-assessment: Implications for health,
education, and the workplace. Psychological Science in the Public Interest, 5(3), 69–106.Dunning, D., Johnson, K., Ehrlinger, J., & Kruger, J. (2003). Why people fail to recognize their
own incompetence. Current Directions in Psychological Science, 12(3), 83–87.
198 6 Cognition: Mental Representations, Problem Solving, and Decision Making

Evans, J. St. B. T. (1990). Biases in human reasoning. Hove, UK: Lawrence Erlbaum.Fogg, B. J. (2003). Persuasive technology: Using computers to change what we think and do. San
Francisco, CA: Morgan Kaufmann.Gentner, D., & Stevens, A. L. (Eds.). (1983). Mental models. Hillsdale, NJ: Erlbaum.Gigerenzer, G., Todd, P. M., & the ABC Research Group (1999). Simple heuristics that make us
smart. New York, NY: Oxford University Press.Gobet, F., Richman, H., Staszewski, J., & Simon, H. A. (1997). Goals, representations, and
strategies in a concept attainment task: The EPAM model. The Psychology of Learning andMotivation, 37, 265–290.
Gobet, F., & Simon, H. A. (1996a). Templates in chess memory: A mechanism for recallingseveral boards. Cognitive Psychology, 31, 1–40.
Gobet, F., & Simon, H. A. (1996b). The roles of recognition processes and look-ahead search intime-constrained expert problem solving: Evidence from grandmaster level chess. Psycho-logical Science, 7, 52–55.
Hayes, J. R. (1981). The complete problem solver. Philadelphia: The Franklin Institute Press.Hoffman, R. R., Crandall, B., & Shadbolt, N. R. (1998). Use of the critical decision method to
elicit expert knowledge: A case study in the methodology of cognitive task analysis. HumanFactors, 40, 254–276.
Johnson-Laird, P. N. (1983). Mental models. Cambridge: Cambridge University Press.Johnson-Laird, P. N., Legrenzi, P., & Sonio Legrenzi, M. (1972). Reasoning and a sense of
reality. British Journal of Psychology, 63, 395–400.Kahneman, D. (2013). Thinking, fast and slow. New York, NY: Farrar, Straus and Giroux.Kahneman, D., Slovic, P., & Tversky, A. (Eds.). (1982). Judgment under uncertainty: Heuristics
and biases. Cambridge: Cambridge, UK.Kaplan, C. (1989). Hatching a theory of incubation: Does putting a problem aside really help? If
so, why?, Carnegie-Mellon University, University Microfilms International, Catalog#9238813.
Klein, G. A. (1997). Recognition-primed decision making: Looking back, looking forward.Hillsdale, NJ: Erlbaum.
Krug, S. (2005). Don’t make me think: A common sense approach to web usability (2nd ed.).Berkeley, CA: New Riders Press.
Larkin, J. H., McDermott, J., Simon, D. P., & Simon, H. A. (1980). Expert and noviceperformance in solving physics problems. Science, 208, 1335–1342.
Lehto, M. R. (1997). Decision making. In G. Salvendy (Ed.), Handbook of human factors andergonomics (pp. 1201–1248). New York, NY: Wiley.
Levitt, S., & Dubner, S. J. (2005). Freakonomics: A rogue economist explores the hidden side ofeverything. New York, NY: William Morrow/HarperCollins.
Luchins, A. S. (1942). Mechanization in problem solving: The effect of Einstellung.Psychological Monographs, 54(6), 1–95.
Moray, N. (1996). A taxonomy and theory of mental models. In Proceedings of the HumanFactors and Ergonomics Society 40th Annual Meeting (Vol. 1, pp. 164–168).
Moray, N. (1999). Mental models in theory and practice. In D. Gopher & A. Koriat (Eds.),Attention and performance XVII: Cognitive regulation of performance: Interaction of theoryand application (pp. 223–258). Cambridge, MA: MIT Press.
Norman, D. A. (1983). Design rules based on analysis of human error. Communications of theACM, 26(4), 254–258.
Norman, D. A. (1988). The psychology of everyday things. New York, NY: Basic Books.Norman, D. A. (2013). The design of everyday things. New York, NY: Basic Books.NTSB. (1990). Aircraft accident report. United Airlines flight 232. Mc Donnell Douglas DC-10-
10. Sioux Gateway airport. Sioux City, Iowa, July 19, 1989. Washington DC: NationalTransportation Safety Board.
Payne, S. J. (1995). Naive judgments of stimulus-response compatibility. Human Factors, 37,495–506.
Quinlan, P., & Dyson, B. (2008). Cognitive psychology. Harlow, UK: Pearson.
References 199

Rasmussen, J. (1983). Skills, rules, knowledge: Signals, signs and symbols and other distinctionsin human performance models. IEEE Transactions: Systems, Man, and Cybernetics, SMC-13,257–267.
Revell, K. M. A., & Stanton, N. A. (2012). Models of models: Filtering and bias rings indepiction of knowledge structures and their implications for design. Ergonomics, 55(9),1073–1092.
Ries, A., & Trout, J. (1986/2000). Positioning: The battle for your mind. New York, NY:McGraw-Hill International.
Ritter, F. E., & Bibby, P. A. (2008). Modeling how, when, and what learning happens in adiagrammatic reasoning task. Cognitive Science, 32, 862–892.
Ritter, F. E., Jones, R. M., & Baxter, G. D. (1998). Reusable models and graphical interfaces:Realising the potential of a unified theory of cognition. In U. Schmid, J. Krems, & F.Wysotzki (Eds.), Mind modeling—a cognitive science approach to reasoning, learning anddiscovery (pp. 83–109). Lengerich, Germany: Pabst Scientific Publishing.
Schwartz, B. (2004). The paradox of choice: Why more is less. New York, NY: Harper Perennial.Simon, H. A. (1997). Administrative behavior (4th ed.). New York, NY: The Free Press.Simon, H. A., & Chase, W. G. (1973). Skill in chess. American Scientist, 61, 393–403.Smallman, H. S., & St. John, M. (2005). Naïve realism: Misplaced faith in the utility of realistic
displays. Ergonomics in Design, 13(Summer), 6–13.Sternberg, R. J. (2004). Why smart people can be so foolish. European Psychologist, 9(3),
145–150.Sternberg, R. J., & Davidson, J. E. (1995). The nature of insight. Cambridge, MA: MIT Press.Tverksy, A., & Kahneman, D. (1981). The framing of decisions and the psychology of choice.
Science, 211, 453–458.Tverksy, A., & Kahneman, D. (1986). Rational choice and the framing of decisions. Journal of
Business, 59, 251–278.Wason, P. C. (1960). On the failure to eliminate hypotheses in a conceptual task. Quarterly
Journal of Experimental Psychology, 12, 129–140.Wilson, J. R., & Rutherford, A. (1989). Mental models: Theory and application in human factors.
Human Factors, 31, 617–634.Winne, P. H., & Jamieson-Noel, D. (2002). Exploring students’ calibration of self reports about
study tactics and achievement. Contemporary Educational Psychology, 27(4), 551–572.
200 6 Cognition: Mental Representations, Problem Solving, and Decision Making

Chapter 7Cognition: Human–ComputerCommunication
Abstract This chapter addresses even higher level processes than the previouschapter. It discusses ways that users communicate with computers and othertechnological systems. The chapter starts by considering the role of language incommunication and how the ideas can be applied to interface design. It then looksat factors that affect how users read both offline and online, and discusses the taskof reading of menus. After considering the topic of information seeking behaviorand the more general concept of how content is structured, this chapter looks atthe broader implications for designing an interface that appropriately supportshuman–computer communication.
7.1 Introduction
Communication is a rich and complex area. When users communicate with eachother and work together they need to coordinate their processes and manage thecontent that they are using. They rely on establishing a shared understanding or‘‘common ground’’, (Clark and Brennan 1991), based on knowledge, beliefs, andassumptions shared between the two people in the conversation. To stay coordi-nated, both parties must make sure that they maintain their common ground inorder to collaborate effectively.
In a similar way, when users work with computers, they also need to commu-nicate with the computer to get the computer to do what they want it to do. This maybe as simple as entering some data, then pressing a key or button, and waiting for aresult. As they wait for the results, though, it is useful to know what the computer isdoing (how much of the task it has completed, for example). Results should also bedelivered in an appropriate and comprehensible format. When designing a systemyou need to be aware of this communication process, and the fact that it is importantto keep the user aware of what the computer is doing, and this maintain commonground between the user and the computer. Although common ground may not beexplicitly observable, it will still exist and evolve as communication happens.
F. E. Ritter et al., Foundations for Designing User-Centered Systems,DOI: 10.1007/978-1-4471-5134-0_7, � Springer-Verlag London 2014
201

We focus here on the most important aspects of human–computer communi-cation. First, we provide a very brief overview of language. After discussing howto organize information, we then address the topic of reading—one of the mostcommon tasks for users—before discussing menu scanning, which is really astylized form of reading. We next consider information searching, which can alsobe regarded as a type of communication. Information searching can also be seen asa high level type of problem solving, because it is normally highly dependent onlanguage; this is why we have included it in this chapter. Finally, we consider howcontent is organized in a more general way.
7.2 Language
There is some debate over what constitutes language. Some people argue thatanimals use language to communicate. Others, however, argue that humans are theonly species that have language. What makes human language unique is thatspeakers can generate an infinite set of utterances from a finite set of languageelements. Language allows us to refer to other objects symbolically, and tocommunicate concrete and abstract ideas.
There are many sciences that study language, including psychology, linguistics,communication science, and computer science. We focus here on some of the resultsthat are most directly related to providing and supporting human–computer com-munication. These results provide direct suggestions for how to construct interfaces,and will help ground further learning about language. First we introduce some basicconcepts before describing Grice’s maxims, which provide a way to view language.
7.2.1 Symbols, Syntax, and Semantics
Three high-level language concepts that are particularly useful are symbolism,syntax, and semantics. A symbol is a token or object that can be used to representanother object, token, or relationship. Words are symbolic in that they representother things. Language uses symbols, as do nearly all interfaces. Keyboards usecharacters, dialogue boxes and menus use words. The Theremin, shown sche-matically in Fig. 7.1, is an early example of an electronic musical instrument. It isa relatively rare example of a system that does not use symbols because it playscontinuous notes with continuous volume.1 To generate notes the Theremin sensesthe positions of the user’s hands and uses that information to create sounds. Mousemovements might also not involve symbols, but their clicks generate symbols.
1 If you want to know what one sounds like, listen to ‘‘Good Vibrations’’ by the Beach Boys.You might also recognize its sound in sci-fi movies.
202 7 Cognition: Human–Computer Communication

Language relies on both syntax and semantics, as do interfaces. Syntax refers tohow words are organized to create meaning. The order in which objects are chosenand the order of interaction are both questions of syntax. Is it better to select anobject (a noun) and then an action to apply to it (a verb)? Or is it better to select anaction and then the object? Some systems use the noun–verb syntax, whilst othersuse the verb–noun syntax. The Macintosh OS has you select a file and then chooseto compress it or duplicate it. Eudora and Gmail, two commonly used emailinterfaces, have you select that you wish to attach a file to an email, and thenchoose the file.
Semantics refers to the meaning of words and symbols. How symbols are used inan interface is a question of semantics. The choice of type of symbols to use in aninterface—usually words or icons—depends on their semantics. This is often a verydifficult choice to make. The meaning that users ascribe to a particular word or theword that they first associate with an action is not uniform. Furnas et al. (1987), forexample, found that there was a wide variability in the words users choose whenasked to name actions: the users agreed on the same term for an action less than 20%of the time. The results suggest that designers should not just use the first word theythink of, and that they should also support the use of aliases to help match the user’sterms. (See Glushko 2013 and Kernighan and Plauger 1978 for more concretesuggestions.)
7.2.2 Grice’s Maxims of Conversation
People routinely use language to converse and interact. Grice (1975) proposed thatthe way that they interact with one another can be described by the co-operativeprinciple:
Volume Pitch
Hand Hand
Fig. 7.1 A diagram of a Theremin. Users play it by moving one hand closer to or farther awayfrom the volume control and the other hand closer to or farther away from the pitch control. Thedistance is measured through capacitance. There are no fixed volumes or pitches, unlike mostother instruments. It is sometimes used to make eerie sounds in science fiction movies
7.2 Language 203
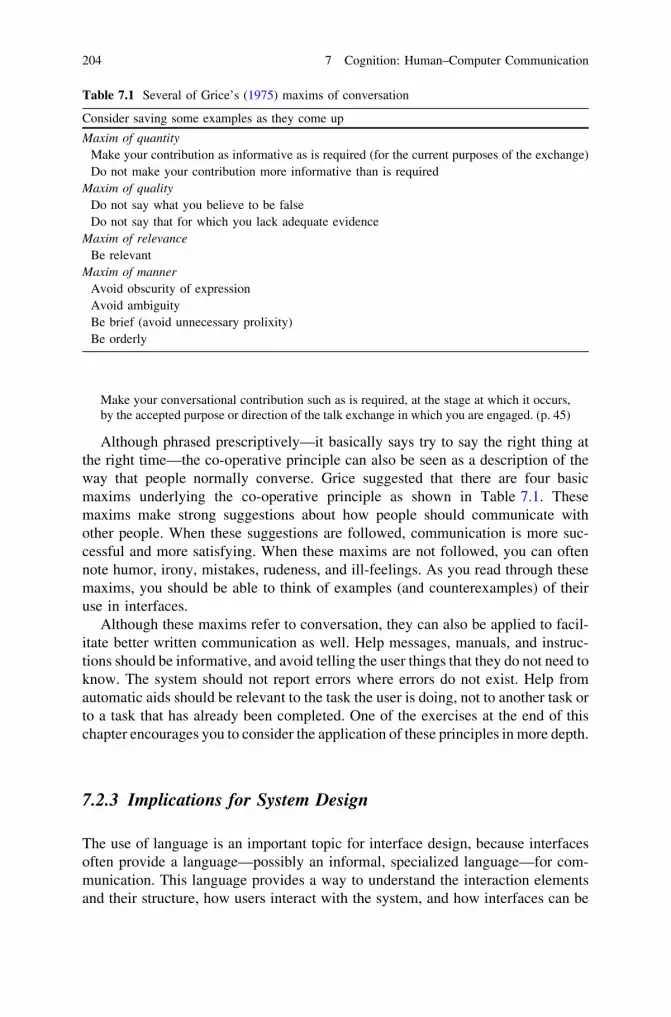
Make your conversational contribution such as is required, at the stage at which it occurs,by the accepted purpose or direction of the talk exchange in which you are engaged. (p. 45)
Although phrased prescriptively—it basically says try to say the right thing atthe right time—the co-operative principle can also be seen as a description of theway that people normally converse. Grice suggested that there are four basicmaxims underlying the co-operative principle as shown in Table 7.1. Thesemaxims make strong suggestions about how people should communicate withother people. When these suggestions are followed, communication is more suc-cessful and more satisfying. When these maxims are not followed, you can oftennote humor, irony, mistakes, rudeness, and ill-feelings. As you read through thesemaxims, you should be able to think of examples (and counterexamples) of theiruse in interfaces.
Although these maxims refer to conversation, they can also be applied to facil-itate better written communication as well. Help messages, manuals, and instruc-tions should be informative, and avoid telling the user things that they do not need toknow. The system should not report errors where errors do not exist. Help fromautomatic aids should be relevant to the task the user is doing, not to another task orto a task that has already been completed. One of the exercises at the end of thischapter encourages you to consider the application of these principles in more depth.
7.2.3 Implications for System Design
The use of language is an important topic for interface design, because interfacesoften provide a language—possibly an informal, specialized language—for com-munication. This language provides a way to understand the interaction elementsand their structure, how users interact with the system, and how interfaces can be
Table 7.1 Several of Grice’s (1975) maxims of conversation
Consider saving some examples as they come up
Maxim of quantityMake your contribution as informative as is required (for the current purposes of the exchange)Do not make your contribution more informative than is required
Maxim of qualityDo not say what you believe to be falseDo not say that for which you lack adequate evidence
Maxim of relevanceBe relevant
Maxim of mannerAvoid obscurity of expressionAvoid ambiguityBe brief (avoid unnecessary prolixity)Be orderly
204 7 Cognition: Human–Computer Communication

related to other knowledge structures. By considering the interaction between thehuman and the computer as a sort of conversation, you can use Grice’s maxims tohelp optimize the interaction.
7.3 How Users Read
One of the most common activities users do is reading. They read pre-printedmatter such as manuals and the documents that they print out. Increasinglymaterial is read on devices screens like monitors, laptops, tablets and smartphones.Understanding how users read will help you design interfaces that are better suitedto the way people read and work.
We know enough about how people read (e.g., Just and Carpenter 1987; Raynerand Pollatsek 1989) to be able to develop computational models of the process (Justand Thibadeau 1984). The research in this area has identified several regularities ofreading behavior that are useful for designing interfaces where written text is used.For example, we know that people typically read at a rate of about 150–230 wordsper minute when reading for comprehension, and that this rate varies with materialand task. At this rate, it should take 2–3 min to read an A4 or 8.500 9 1100 page of text.
Perhaps the three most important regularities of reading behavior, though, are theword length effect, the word frequency effect, and the difference in time betweenpicture naming and reading. The word length effect arises out of the fact that longerwords simply take longer to read (e.g., Rayner et al. 2011). Words like ‘‘mouse’’ and‘‘polo’’ are faster to read (everything else being equal) than ‘‘keyboard’’ and‘‘autocratic’’ because they are shorter.
The word frequency effect arises because words that are commonly used arefaster to read than words that are less commonly used (e.g., Liversedge et al. 2011;Rayner 1998). This effect can be seen as being related to the learning curve. Theword frequency effect and the word length effect are independent, so they bothapply to the same word. So, for example, while the word ‘‘polo’’ is short, it is alsorelatively rarely used and hence will take longer to read than other more frequentlyused words of the same length. It will, however, be read more quickly than equallyrare words that are longer.
Reading takes less time than picture naming (Chilton 1996). This explains whyunfamiliar icons, which are accessed through picture naming, take longer toprocess than words that are used in the same place. Using icons instead of wordsfor simple searching makes things slower. There is a trade-off, however, againstgenerality and esthetics. An icon, once learned, is easier to recognize than a wordirrespective of one’s native language and literacy level. Icons are often created tobe rectangular in shape, for example, and having consistent, regular shaped objectscan make for a better, clearer design.
There are other effects as well that influence reading speed. Several knownfactors that make reading more difficult are noted in Table 7.2, and some of theseeffects are illustrated in Tables 7.3 and 7.4.
7.2 Language 205

Table 7.2 Factors that make reading more difficult
Complex (such as Gothic fonts) or uncommon fonts, such as novelty fonts (wild west-like). Theyare harder to read if they are unfamiliar or perceptually complex
Fonts that have more detail than the display can provide, e.g., a small, serifed font on a mobiledevice. They are harder to read if necessary details are not visible
Long lines that make it difficult for the eye to jump back to the beginning of the next line. Theyare harder to read because the eye has trouble jumping that far that precisely
Small line spacing (spacing between lines). This also makes it more difficult for the reader’s eyeto find the beginning of the next line. They are harder to read because the target line to jumpto is smaller
Smaller fonts. They are harder to read because they are harder to perceive, and often come withlong lines and small line spacing
Poor spacing between words. This makes reading harder because the eye cannot see words asbeing distinct, and when it has to jump back the targets are not as clear
Incorrect spelling. This is harder to read because the reader may use the wrong word, or takelonger to recognize the correct word
Fully justified text (that is, even on the right and left edges versus natural spacing, flush on the leftbut with a ragged right margin). This is harder to read because it causes uneven and too largespaces between words
The use of all upper case letters. These are harder to read because the reader will have lesspractice recognizing the letters and words, and it will also influence line spacing
Ambiguous and distal references, and pronouns (the use of ‘it’ and ‘that’, vs nouns and propernouns). These are harder to read because the referent to the pronoun must be found and usedcorrectly
Abstract words (vs concrete words). These are harder to read because the words are less commonand require more processing to understand
Poor grammar. This is harder to read because the concepts’ relations may not be well specifiedNegative and double negative concepts (which can be particularly difficult to understand). These
are harder to read because more processing is required to understand them
Table 7.3 Hard to read text. The following text contains examples of the factors that makereading more difficult as listed in Table 7.2
6 DOZEN, 12, AND SIX HALVES OF YEARS AGO OUR OWN PARENT'S GENETIC ORGINITORS PRODUCED HEREFORTH ON THIS COLLECTION OF TECTONIC PLATES A NOT OLD SOCIAL-POLITICAL ORGANIZATION, CO-NCEIVED IN LIBERTY AND AIMED TOWARD THE FACT TAHT ALL HUMANOIDS ARE CREATED EQUIVALENT. AT THIS POINT IN TIME WE ARE MORE THAN STARTED IN A PH-ENOMENAL CONFLAGRATION, TESTING AND VALIDATING WHETHER THE FACT THAT THAT OR-GANIZATION OR ANY ORGANIZATION SO CONCEIVED AND SEW DEDICATED CAN WILL NOT FAIL SOON. WE ARE MET ON AGREAT SPATIAL-TEMPORAL LOCATION OF THAT SPECIFIC LACK OF AMICABLE RELATIONS BETWEEN TO SOCIAL-CULTURAL-PO-LITICAL ENTITIES. WE HAVE COME IN ORDER TO DEDICATE A PROPER SUBSET OF THAT SPATIAL-TEMPORAL LOCATION AS A FINAL RESTING-LOCATION FOUR THOSE WHO HERE GAVE THAT, THAT IT MIGHT PROGRESS. IT IS ALTOGETHER APPROPRIATE AND PROPER THAT WE SHOULD DO SOMETHING LIKE THIS. BUT IN A LARGER DE-NOTATION, WE CAN NOT APPORTION, WE CANNOT MEMORIALISE, WE CANNOT HALLOW THIS.
THEY, LIVING AND DEAD WHO STRUGGLED HERE HAVE BLESSED IT FAR ABOVE OUR OWN IMPOVERISHED POWER FOR
ADDITON OR SUBBSTRACTION FROM THEIR OUVRE. THE TEMPORAL REALM WILL LITTLE NOTE NOR LONG REM-EMBER
WHAT OUR OWN OPIONS PRESENTED HERE, BUT IT CAN NEVER FORGET WHAT THEY DIDIN THIS SPATIAL-TEMPORAL
LOCATION. IT IS FOR US THE NOT YET DEAD RATHER TO BE DED-ICATED HERE TO THE UNFINISHED WORK WHICH
THEY WHO FOUGHT HERE HAVE THUS FAR SO NOBLY ADVANCED. IT IS RATHER FOR US TO BE HERE DE-DICATED TO
THE NOT SMALL TASK REMAINING BEFORE US--THAT FROM THESE HONORED PEOPLE WE TAKE INCREASED CARE AND
CONCERN TO THAT CAUSE FOR WHICH THEY GAVE THE LAST FULL MEASURE OF DEVOTION--THAT WE HERE HIGHLY
RESOLVE THAT THESE DEAD MEN SHALL NOT HAVE DIED IN VAIN, THAT THIS AREA UNDER GOD SHALL HAVE A NEW
BIRTH OF FREEDOM, AND THAT SOCIAL ORGANI ZATIONS RELATED TO POLITICAL STATES OF, BY, AND FOR US ALL
SHALL NOT SEASE TO EXIST ON THIS RO-TATING CELSTIAL ORB.
206 7 Cognition: Human–Computer Communication

7.3.1 The Effects of Fonts
Reading also interacts with the choice of fonts. Figure 7.2 shows a menu from aweb site (it is the links section on the left hand side of the page, a common design),where every item is in a different font, and one item even has different colors foreach letter. While there may sometimes be good esthetic reasons for using severaldifferent fonts, that we do not think apply in this case, here it makes it harder toread the text in the interface. A good rule of is to use no more than three differentfonts. If you are planning to use several different fonts, you should make sure thatyou have a very good reason for doing so.
As another example of the significant effect of the use of fonts, Fig. 7.3 shows theClearview (also referred to as Clearview Hwy) font (www.clearviewhwy.com).This font was designed to aid readability and legibility for older drivers and hasbeen evaluated (Garvey et al. 1998). The design addressed each attribute of let-terforms including stroke width, letter shape, the resulting inside and outside of eachletterform, and the proportional relationship of capital letter to lower case as well asletter spacing to optimize readability when viewed at a distance. It illustrates howthe readability of fonts can differ. Research at Penn State has shown that theimproved font is 20% easier to read, which means that drivers at 60 mph (miles perhour) can read the road signs 1–2 s earlier, which gives them more time to makedecisions or to read more of the sign. Another major effect—not shown here—isthat the font also works better at night, when the light used to read signs comes fromreflected headlights, which changes the contrast between the letters and background(Garvey et al. 1998). Note, however, that the font works less well on negativecontrast road signs (dark text on a light background).
Table 7.4 Easier to read text. This is semantically the same text as in Table 7.3 but with most ofthe features that cause reading difficulties eliminated, and with the paragraphs indented
Fourscore and seven years ago our fathers brought forth on this continent a new nation, conceivedin liberty and dedicated to the proposition that all men are created equal. Now we are engagedin a great civil war, testing whether that nation or any nation so conceived and so dedicatedcan long endure
We are met on a great battlefield of that war. We have come to dedicate a portion of that field as afinal resting-place for those who here gave their lives that that nation might live. It isaltogether fitting and proper that we should do this. But in a larger sense, we cannot dedicate,we cannot consecrate, we cannot hallow this ground. The brave men, living and dead whostruggled here have consecrated it far above our poor power to add or detract
The world will little note nor long remember what we say here, but it can never forget what theydid here. It is for us the living rather to be dedicated here to the unfinished work which theywho fought here have thus far so nobly advanced. It is rather for us to be here dedicated to thegreat task remaining before us–that from these honored dead we take increased devotion tothat cause for which they gave the last full measure of devotion–that we here highly resolvethat these dead shall not have died in vain, that this nation under God shall have a new birth offreedom, and that government of the people, by the people, for the people shall not perishfrom the earth. —A. Lincoln, 1864
7.3 How Users Read 207

7.3.2 Graphic Design to Help Reading and Scanning
The graphic design of textual material has evolved to support readers and the tasksthey perform. Readers not only read—they also annotate, reread, search using thetable of contents, headings, and the index, and refer to the references cited forfurther information. Specific graphic design elements have been created to supportthese activities, such as margins, headings, and citations. More information isavailable from graphic design books (Parker 2006; White 2002). If you aredesigning something for readers, like a book, or a brochure, or even technicalreports, you should become a student of the tools, designs, and processes in thisarea as well as understanding how reading occurs in a variety of formats such asbrochures and screens.
7.3.3 Paper-Based Versus Screen-Based Reading
Reading text on paper is not identical to reading the same text from a screen. Thereare some important differences that you need to be aware of because they canaffect reading speeds and comprehension. Figure 7.4 shows an example ofextensive material to read from the screen.
Fig. 7.2 An example use ofmultiple fonts that makes themenu structure harder to read.(taken from www.woodburyskiarea.com/winter,February 2012)
208 7 Cognition: Human–Computer Communication

Fig. 7.3 The previous standard font, Highway Gothic (left) and in the ClearviewHwy font(right). These signs are on I-78, near Allentown, PA. The Clearview has larger holes in letters likee and o, and slightly more readable serifs on letters like l and t. The text is particularly morereadable at night when illuminated by headlights. (Photos � Don Meeker and used withpermission)
Fig. 7.4 A screen shot from Feb. 2008 that would be difficult to read because of font size andline width. Indeed, if passengers did read this screen, it would greatly slow the check-in process,which runs counter to the purpose of the kiosk, which is to make check-in faster (as opposed tosafer or more pleasurable). This page also shows a change in the service as a system movesonline. The original system, human check-in, did not pass as much information to users—butperhaps it did not need to
7.3 How Users Read 209
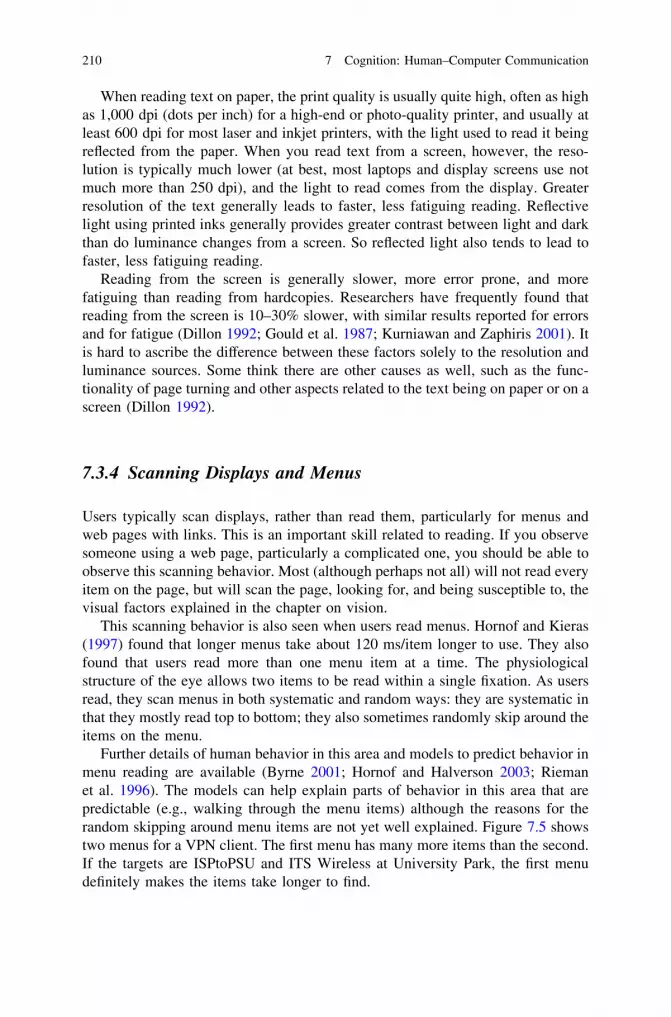
When reading text on paper, the print quality is usually quite high, often as highas 1,000 dpi (dots per inch) for a high-end or photo-quality printer, and usually atleast 600 dpi for most laser and inkjet printers, with the light used to read it beingreflected from the paper. When you read text from a screen, however, the reso-lution is typically much lower (at best, most laptops and display screens use notmuch more than 250 dpi), and the light to read comes from the display. Greaterresolution of the text generally leads to faster, less fatiguing reading. Reflectivelight using printed inks generally provides greater contrast between light and darkthan do luminance changes from a screen. So reflected light also tends to lead tofaster, less fatiguing reading.
Reading from the screen is generally slower, more error prone, and morefatiguing than reading from hardcopies. Researchers have frequently found thatreading from the screen is 10–30% slower, with similar results reported for errorsand for fatigue (Dillon 1992; Gould et al. 1987; Kurniawan and Zaphiris 2001). Itis hard to ascribe the difference between these factors solely to the resolution andluminance sources. Some think there are other causes as well, such as the func-tionality of page turning and other aspects related to the text being on paper or on ascreen (Dillon 1992).
7.3.4 Scanning Displays and Menus
Users typically scan displays, rather than read them, particularly for menus andweb pages with links. This is an important skill related to reading. If you observesomeone using a web page, particularly a complicated one, you should be able toobserve this scanning behavior. Most (although perhaps not all) will not read everyitem on the page, but will scan the page, looking for, and being susceptible to, thevisual factors explained in the chapter on vision.
This scanning behavior is also seen when users read menus. Hornof and Kieras(1997) found that longer menus take about 120 ms/item longer to use. They alsofound that users read more than one menu item at a time. The physiologicalstructure of the eye allows two items to be read within a single fixation. As usersread, they scan menus in both systematic and random ways: they are systematic inthat they mostly read top to bottom; they also sometimes randomly skip around theitems on the menu.
Further details of human behavior in this area and models to predict behavior inmenu reading are available (Byrne 2001; Hornof and Halverson 2003; Riemanet al. 1996). The models can help explain parts of behavior in this area that arepredictable (e.g., walking through the menu items) although the reasons for therandom skipping around menu items are not yet well explained. Figure 7.5 showstwo menus for a VPN client. The first menu has many more items than the second.If the targets are ISPtoPSU and ITS Wireless at University Park, the first menudefinitely makes the items take longer to find.
210 7 Cognition: Human–Computer Communication

7.3.5 Implications for System Design
When you design menus, you need to understand how vision works and how usersscan menus, so that you can use this knowledge to help guide their vision to find theitems they are looking for. When you create a menu, include items that are nec-essary, and be wary about creating menus that are too long. Submenus should bestructured around how the user represents the world (their mental model) or howexperts represent the world. You can find out how their world is structured by askingthem or using a card sorting method (noted in Exercise 7.2). Menus structured inthese ways are more likely to be useful than those which reflect the company’sorganization, for example. Long menus will be skimmed, but short menus withsubmenus will require the user to take more actions to find the same item. The finalchoice in these design cases requires understanding the social context and moredetailed knowledge about how often the tasks are performed. You can favor morecommon tasks using a variety of designs including split menus (Sears andShneiderman 1994).
When choosing menu items and button labels, or writing text to be displayed ona screen, it is important to consider the factors that influence readability and,hence, usability. These factors range from choices related to fonts (typeface, size,and so on) through to words (which words and how they should be laid out) andthe context in which they will appear. There are inherent trade-offs between thesedifferent factors, and the results from research will tell you which is faster. Theywill not tell you, however, if the changes are worth the accompanying differencesin estheticsor in the information, style, and tone.
Fig. 7.5 The original menu for selecting a VPN client at Penn State, and a revised versioncreated by Ritter for his own use. The version on the left encourages scanning; the version on theright is more easily read. Simon Robbie notes (personal communication) that hierarchical menuscould be particularly useful here. (Screenshot taken June 2009)
7.3 How Users Read 211

7.4 Information Seeking Behavior
The other main area where human–computer communication has made significantcontributions is where users are seeking information. This can be regarded as aninformation retrieval problem—finding the information—but we consider humaninformation behavior to be slightly broader. Here we focus mostly on the ubiquitoustask of searching for information on the web, but the concepts we discuss can begeneralized to other tasks, such as searching for information on a hard drive (whichroutinely have capacities of over 1 TB nowadays) and in help systems and intranets.
7.4.1 Information
Information appears to many to be an elusive concept that is hard to define but, likethe Supreme Court justice said, ‘‘…we know it when we see it.’’ In general, though,information can be thought of as organized data. The extension of this is thatknowledge and, ultimately, wisdom can be considered as organized information. It isalso important to take into consideration the need for an entity to process theinformation, and the context, which can influence how the information is interpreted.
7.4.2 Human Information Behavior
Human information behavior is working with information. The ways that peoplework with information depends on several factors including the context in whichthey interact with information, which is sometime described as an informationjourney (Blandford and Attfield 2010).
Broadly defined, human information behavior includes problem solving, but amore typical task is searching for information. Human information behavior thusincludes how users process, use, and produce information. How users interact toget information, and their strategies and tactics for handling information cantherefore also be seen as human information behavior. So, for example, the contentof this book could have been cast as a summary of human information behavior ifit had been designed for a different target audience.
We know that users have inherent capabilities and limitations, and these con-strain human information behavior. How users can process information is deter-mined by their cognitive, perceptual, and motor capabilities, that is, theirinformation processing architecture. There are other, external constraints too, suchas the tools that they use to access and process the information: their databases,their interfaces, networks, and other forms of information delivery, presentation,and output capabilities. By some measures, the largest information processor in
212 7 Cognition: Human–Computer Communication

many buildings is a large photocopier/printer, which can produce literally reams2
of information. The photocopier/printer’s output is important because the results—the information—are processed more deeply by people than most computers willprocess the information passed through them.
7.4.3 Human Information Seeking Behavior
Human information seeking behavior can be viewed in several ways. One way toapproach it is to ask ‘‘how do users search for information, particularly on theInternet?’’ Spink and her colleagues in information science have studied this areaextensively (e.g., Spink and Cole 2001). They found that users seek informationoften, and from multiple sources. Different types of users search for different typesof information, which is not so surprising, but they also seek it in different ways,look in different places, and trust the sources in different ways. Trends in whatusers search for can be identified, typically by studying user logs (Jansen andSpink 2006). Important trends have been found in this way, such as a shift towardsmore eCommerce queries and a rise in non-English queries over the period1997–2001 (Spink et al. 2002). Work in this area has also examined how differenttypes of groups use information (Barnes et al. 1996). The results have been used tomake prescriptive statements about how to help groups.
Observational studies have examined how users search, including how manyerrors they make, how well they use the search tools (such as using the connectors‘and’ and ‘or’), and how many searches they do in parallel (Jansen and Spink2006; Spink et al. 2002). Some researchers have argued that users do not searchvery deeply (Nielsen 1997), and others, with more detailed studies have found thatsome users will search quite deeply (Byrne et al. 1999). Byrne et al.’s researchinvolved analyzing the tasks users were performing, and how web browsing fittedinto those tasks. They found that the task influenced how long and how deeplyusers searched. In particular, medical information, work-related, and certain hobbysearches can go quite deep over hours or days, and some searches are shallow. Tosupport a wide range of users it is therefore important to understand them and thetasks they are performing, because different users will have different capabilitiesand needs when searching for information at different times.
7.4.4 Information Scent
The concept of information scent (Pirolli 1997, 2007) can also be exploited inhelping users find the information they are looking for. Information scent is what
2 A ream is 500 sheets of paper. Most photocopy and printing paper is sold in reams; thus thesaying, reams of material.
7.4 Information Seeking Behavior 213

leads a user to spend more time exploring a web page (or menu item) to find whatthey are looking for because the content, metaphorically, ‘smells’ like the thingthey are looking for. The idea is to make sure that objects and links appear tosmell like what they contain and to not smell like what they do not. In thisway, the user should be able to detect more readily when they are looking in theright area.
This metaphor of information scent makes several suggestions for design. Thus,obtuse words or phrases on menus mask the scent; descriptions that are too generaldiffuse the scent; descriptions that mislead users have the wrong scent; content thatis hard to find because, perhaps, it is at the bottom of a page, are hard to smell.
7.4.5 Implications for System Design
Understanding information and the ways that users search for and use informationis important if you want to help users carry out their tasks. Research in this areahas provided a perspective that focuses on the material that users are using andlooking for, and gives us another way to think about users and to support design.
If you can understand what users are looking for, it should help you understandhow you can support them in the task of finding it. This can be done through betterinterface design to display the information in a way that allows the users tounderstand it, which includes providing details about objects to help users find theinformation they are looking for directly or by providing information scent trailsthrough increasingly more specific scents.
It is also worth briefly mentioning Search Engine Optimization (SEO) at thispoint. The algorithms that underpin the major Web search engines keep evolving,but the way that they generally work is quite well known. Web content writersshould be aware of how they work, because they can construct their content insuch a way that it promotes their page in the search results. The number of linksinto a page, and keywords, for example, are just two factors that have been used toincrease the ranking of web pages.
7.5 Designing Content
As the web has grown and web pages have proliferated, designers have come torealize the full importance of content and the way it is structured and delivered.With so much information now available, users can be overwhelmed, and under-standably are unwilling to expend significant time and energy trawling throughhundreds of pages of content to find information. The way that content is written,structured, and delivered is therefore critical to the success of a system. The type ofcontent you will have, and how it should be structured, will be determined by yourcontent strategy and information architecture.
214 7 Cognition: Human–Computer Communication

7.5.1 Content Strategy
A content strategy is a theory of what and how to create, update, and mergecontent in a system such as a web site. Halvorson (2010) suggests that there areseveral basic needs to take into account when developing a content strategy if youwant it to be successful:
• The need to do less, not more. Content should support key objectives or help userscomplete the task they are trying to do, or both. It is also obviously cheaper andeasier to write less content, which makes it easier to maintain and faster to use.
• The need to understand the existing content, and its provenance. You may needto do a content audit to address this.
• The need to be a good listener. Responsibility for content is not just down to thecontent creators, and customers are often the people who are best placed tounderstand what content they want or need.
• The need to have someone who is responsible for delivering content. A newspaperhas an editorial executive who makes the final decisions about what goes into aparticular edition of a newspaper; a web site should have someone in a similar role.
• The need to start asking questions. Always be prepared to ask ‘‘why?’’ whensomebody says ‘‘we have to include this,’’ ‘‘we need to do that,’’ and so on.
These needs should be incorporated into—and help drive—the three steps (orphases) within your content strategy:
1. Auditing the existing content and documenting it.2. Analyzing the different aspects within an organization that affect the content.3. Creating the strategy for the creation, delivery, and governance of content.
The web and content are inextricably intertwined. If you want to deliver contentthat is both usable and useful, you should make use of the wide range of availableprocesses, tools, and resources that have been designed to help make it easier tocreate content.
7.5.2 Information Architecture
The term Information Architecture (IA) is used to describe how online informationis structured to support usability by both creators and users. As such, informationarchitecture is one of the components that is included as part of user experiencedesign. It is information architecture that occupies the intersection of content,context, and users (Morville and Rosenfeld 2007).
Developing an IA is not simply a matter of drawing container boxes aroundcollections of related information and then moving them around. This process,sometimes called wire framing, is, however, often a large part of the developmentof an IA. Developing an IA does not just involve generating static content, but alsoincludes developing the dynamic paths through a web site, for example.
7.5 Designing Content 215

When developing the IA, it is important to consider the information at severallevels of abstraction. At the lowest level, this may be as simple as the way thatitems are ordered on a page. At the highest level it could involve how to organizethe content appropriately to support the user’s tasks. At a strategic level it couldinvolve making decisions about how articles and metadata are placed into acontent management system.
7.5.3 Creating Content
Getting the content strategy and information architecture correct are both impor-tant, but it is equally important to make sure that your content is usable too.Writing for printed material is a skill in itself, but creating content for web pages isalso an important skill in its own right and one which often involves more than justwriting text. The way that users read web pages is usually not the same as the waythat they read printed pages (unless they are reading an online text article fromstart to finish).
In most cases, web content is written for a general-purpose audience, whichmeans that it should be readable and understandable by a large proportion of thepopulation. The usual guide rule is that you should try to write text that requires areading age of around 12 years, and that can be understood by students in theeighth grade in the US (this equates to an age range of about 12–14 years). Thereadability of text can be assessed using the Flesch reading ease score (Flesch1948): generally, you should be aiming for a score of 60–70. Comprehensibility isassessed using the Flesch–Kincaid grade level score (Kincaid et al. 1975), and hereyou should generally be aiming for a score of 7.0–8.0. Many word processorsinclude tools that will let you calculate both of these scores, and there are severalonline calculators that can be used too.
These scores should be used as guidance, not as requirements that have to bepursued at all costs. The scores provide a relatively simple but useful assessmentof the clarity and directness of the language that is used in the text.
7.5.4 Structuring Content
We know that users organize and associate concepts using something like a graphstructure (e.g., Collins and Quillian 1969; Klahr, Chase, and Lovelace 1983;Woods 1975). This led to the suggestion that knowledge should therefore bepresented to users as a hypergraph structure because if it goes into the eyes like agraph (like hypertext or the web) then it can simply be put into correspondinggraph structure inside the user’s head. This example of a homeopathic fallacy—that ‘‘like causes like’’—may have arisen from a misinterpretation of VannevarBush’s (1945, reprinted in numerous places) view of how information is organizedby people and machines.
216 7 Cognition: Human–Computer Communication

The fallacy has been debunked (McKendree et al. 1995). The user cannot simplylift material from the page and dump it straight into their memory without someprocessing. The material to be learned has to go through the serial processes ofreading, understanding, and creating memories using the processes and capabilitiesnoted in Chap. 6. The material that has to be read should be presented in a serialway so that it can be appropriately processed. Hypertext can be useful if the learneris expert enough to use self-directed learning, but, if the learner is a novice and doesnot fully understand what is supposed to be learned, it is better to provide them withappropriate guidance (Scheiter and Gerjets 2007; Swaak and de Jong 2007).
When preparing material to be read it is important to take into consideration theusers’ capabilities. These capabilities will differ, depending on the users’ level ofexpertise, which will influence how they perceive things, and their mental modelof the situation, for example. The material therefore needs to be structured toaccommodate both users’ capabilities and their previous knowledge.
7.5.5 Delivering Content
The medium that will be used to deliver content to users has to be carefullyconsidered. The way the content of a message posted on Twitter (a ‘‘tweet’’)(which has a maximum length of 140 characters) is designed, for example, will bedifferent from the way that the content for a podcast is designed, even if they areboth presenting the same message. It is important to think about attributes such asthe temperature of the medium, which relates to how actively the medium drawsusers in (McLuhan and Fiore 1967). Books, for example, are seen as cold, becausethey require lots of effort to use them; radio (and email), however, are hot.
Where and how content is read will influence how readers interpret the mes-sage. Material seen on a small screen on a mobile device, for example, may bereceived and understood differently from material on a larger screen or on paperprototypes and printouts. Advances in HTML and CSS have facilitated what iscalled responsive design of web pages where only one set of web-based contentneeds to created, rather than having to design separate content (and structure) fordesktops, tablets, and mobile devices (e.g., see Kadlec 2013). The content isautomatically re-displayed in the most appropriate format based on the size of thedevice that is being used to read it.
7.6 Implications for System Design
When you design a system you need to consider the context in which it will beused. You will need to understand the terminology and language that your usersuse to communicate and talk about their tasks. The language that describes howyour users interact with your systems should be appropriate to the context and
7.5 Designing Content 217
culture in which the system is used. This will make it easier for your users to carryout their tasks, and hence make the system more acceptable to them. More gen-erally, you should try to use simple, direct, and clear language.
If your interface requires your users to read text, particularly large amounts oftext, you need to take into consideration the factors that affect how users read. Youshould avoid using several fonts, for example, as this can adversely affect readingspeed, and may also detract from the overall user experience. You should also layout the text in a way that helps the user to comprehend it, making appropriate useof headings, subheadings, and white space between paragraphs, for example. Ifyou are designing web pages, then you will need to be aware of how people scanweb pages, rather than read them in depth, so that you can position your text sothat they will see it.
Irrespective of whether your display shows only text, only graphics (includingicons), or some combination of the two, it should be clear and apparent to yourusers what all of the items mean. This also applies to menu items where, onceagain, you should use terms and language that are relevant to your users, theirtasks, and the context in which they are carrying out those tasks.
If your users need to seek information, you need to help them find the infor-mation they are looking for in an efficient and effective manner. Using informationscent can help them to find out fairly quickly whether they are looking in the rightarea, so you should make similar information have the same sort of ‘‘smell’’ as theinformation they are looking for. When you return the information to them, youshould present it in a way that makes it easy for them to interpret, understand, andlearn. In other words, it needs to be appropriately structured, for example, usingtables and charts to present numeric information.
For web sites in particular, the way that you write, structure, and deliver contentare all major contributors to the success of a system. Managing content is an ongoingtask, so you will need to maintain the content after you have written it, to make surethat it stays up to date and grows and evolves along with your users. It is thereforeimportant to define a content strategy and information architecture up front to helpyou manage and deliver the content in a systematic way. You also need to thinkabout how your users will access that content. If they will be using a range of devices(smartphones, tablets, desktops, and so on) you should seriously consider using aresponsive web design approach which automatically resizes the content based onthe size of the user’s display screen. In this way you can help to ensure that yourusers get a similar experience when accessing your system from different devices.
7.7 Summary
This chapter covers some key issues regarding communication between usersand systems. There is much more that could be said about the related top-ics of computer-mediated communication, non-verbal communication, and
218 7 Cognition: Human–Computer Communication

computer-supported cooperative work (CSCW). We have, however, providedsome practical suggestions about how to support communication between usersand systems.
The most common way that people communicate with each other and withtechnology is through language. By considering language, concepts such asGrices’ maxims can be applied to help you optimize the way that users interactwith your system.
Most systems require the user to do some reading from the screen. The readingprocess will be affected by factors such as the legibility of the text, which isinfluenced by the font size and the way the text is laid out. The quality of reso-lution of the text is also important: printed text usually has a much higher reso-lution than text displayed on a screen. In addition, users tend to scan rather thanread text on a display screen, particularly if they are looking at menus or webpages containing hyperlinks.
One of the other main tasks that users do is seek information. The way they dothis is based on their preliminary understanding of the information they are lookingfor, and how it is organized. How they will understand the information that theyfind depends on their previous knowledge and experience, and may be affected bythe contexts in which the information is being sought and used.
When it comes to interacting with the web, the structure and delivery of contentis critical. Content is an active element that has to be designed, developed, andmaintained over time, which requires the setting up of a content strategy. The waythe content is organized will be determined by your information architecture.When you create content you need to make sure that it will be intelligible (as wellas legible) to your readers, and to structure it in such a way that the user canunderstand and learn what it means. Finally, the medium through which thecontent is delivered is increasingly important, as more and more people access thesame content using a wide range of devices.
7.8 Other Resources
Users read material on the screen as part of systems, so learning how to write is apart of interface design. Strunk and White’s very famous Elements of Style is wellworth looking at for this topic. This book provides advice about how to presentinformation to readers in a format that they can most easily digest:
Strunk, W., & White, E. B. (1979). The elements of style. NY, NY: Macmillan
Another skill worth picking up is how to structure documents. For this, Parker’sLooking good in print is a good text. The advice is not specific to any word processoror page layout tool. It discusses the use of color, layout, white space, fonts, and otheraspects of design. It is easy to read. It is a very gentle introduction to graphic design.While based on print, some of the guidance will apply to online materials:
7.7 Summary 219

Parker, R. C. (2006). Looking good in print. Scottsdale, AZ: Paraglyph Press
For further details on how to apply information foraging theory, see Nielsen’sAlertbox on this: http://www.useit.com/alertbox/20030630.html
For more on information seeking more generally, a key figure is Carol Kuhlthau.A 2005 online article gives a nice overview and introduces some useful concepts:
Kuhlthau, C. C. (2005). Towards collaboration between information seeking and infor-mation retrieval. Information Research 10(2). 10–2.
Finally, a short magazine article by Churchill addresses some challenges indesigning for human search behavior:
Churchill, E. F. (2008). Ps and Qs of candied herbs and happy babies: Seeking andsearching on your own terms. Interactions. 15(6). 46–49.
7.9 Exercises
7.1. (a) Time how long it takes four people to read out loud (or silently)Tables 7.3 and 7.4. Time how long it takes four more people to read them onscreen (a tablet, smartphone, computer, or all of them) vs on paper. (b) Whatare the differences? (There should be differences). Consider having the fourpeople read the text in the tables in each of the four ways (two levels of fontdifficulty 9 two types of display, or 2 9 2). (c) Why would you want to havedifferent people do each task, and how could you correct for having the sameperson do it each way?
7.2. Card sorting is a useful method for finding out how people organize the world.In this simple method, you give people a set of objects noted one per card. Theycan be words or pictures. The people then sort the cards into piles. The numberand size of piles can either be left to the sorters or, if there is a design constraintthat will have to be applied, into a restricted set of piles or sizes.
As an application of this method, examine a large application like Word,Pages, GIMP, Excel, or Numbers. (a) Draw a graph or a table showing thecomplete menu structure. Ask two people to look at the menu items on cards(not on a menu) and organize the cards into groups. (b) What are average ortypical groupings? (c) Do these groupings match the application, or arethere differences between the personal groupings and menu structure? (d)What does this tell you about the mental models of the designers and ofthe users?
7.3. Create a web site or a document. Create five versions of it using different fonttypes and sizes. Ask ten people to rate the documents on four differentdimensions. You can choose dimensions, such as ease of use, trustworthiness,fun. Record how long they take to read several of the pages out loud (so youknow they are reading them). You will need to present them in differentorders to balance the effect of learning over multiple trials. Examine the time
220 7 Cognition: Human–Computer Communication

to read with respect to the measures to see if there are any correlations thatpredict readability as measured by reading time.
7.4. Find a source of interfaces and of jokes (cartoons or written jokes). Find anexample joke or cartoon where one of Grice’s maxims is violated. Find aninterface where the same maxim is violated. You can also use interfaces notedin this book. Note how the interfaces could be repaired.
References
Barnes, D. M., Spink, A. H., & Yeatts, D. E. (1996). Effective information systems for high-performing self-managed teams. In Information Seeking in Context: Proceedings of anInternational Conference on Research in Information Needs, Seeking and Use in DifferentContexts (pp.163–178). Taylor Graham: Tampere, Finland.
Blandford, A., & Attfield, S. (2010). Interacting with information. Synthesis lectures on human-centered informatics. San Rafael, CA: Morgan & Claypool.
Bush, V. (1945). As we may think. The Atlantic Monthly, 176(1), 101–108.Byrne, M. D. (2001). ACT-R/PM and menu selection: Applying a cognitive architecture to HCI.
International Journal of Human-Computer Studies, 55(1), 41–84.Byrne, M. D., John, B. E., Wehrle, N. S., & Crow, D. C. (1999). The tangled web we wove: A
taskonomy of WWW use. In Proceedings of the CHI‘99 Conference on Human Factors inComputer Systems (pp. 544–551). ACM: New York, NY.
Chilton, E. (1996). What was the subject of Titchner’s doctoral thesis? SigCHI Bulletin, 28(2), 96.Clark, H. H., & Brennan, S. E. (1991). Grounding in communication. In L. B. Resnick, J.
M. Levine, & S. D. Teasley (Eds.), Perspectives on socially shared cognition (pp. 127–149).Washington, DC: American Psychological Association.
Collins, A. M., & Quillian, M. R. (1969). Retrieval time from semantic memory. Journal ofVerbal Learning and Verbal Behavior, 8, 240–247.
Dillon, A. (1992). Reading from paper versus screens: A critical review of the empiricalliterature. Ergonomics, 35(10), 1297–1326.
Flesch, R. (1948). A new readability yardstick. Journal of Applied Psychology, 32, 221–233.Furnas, G. W., Landauer, T. K., Gomez, L. M., & Dumais, S. T. (1987). The vocabulary problem
in human-system communication. Communications of the ACM, 30(Nov.) (pp. 964–971).Garvey, P. M., Pietrucha, M. T., & Meeker., D. T. (1998). Development of a new road sign
alphabet. Ergonomics in Design, 6(3), 7–11.Glushko, R. J. (2013). The discipline of organizing. Cambridge, MA: MIT.Grice, H. P. (1975). Logic and conversation. In P. Cole & J. L. Morgan (Eds.), Syntax and
semantics III: Speech acts. New York, NY: Academic Press.Gould, J. D., Alfaro, L., Barnes, V., Finn, R., Grischkowsky, N., & Minuto, A. (1987). Reading is
slower from CRT displays than from paper: Attempts to isolate a single variable explanation.Human Factors, 29, 269–299.
Halvorson, K. (2010). Content strategy for the Web. Berkley, CA: New Riders.Hornof, A. J., & Halverson, T. (2003). Cognitive strategies and eye movements for searching
hierarchical computer displays. In Proceedings of CHI 2003: Conference on Human Factorsin Computing Systems (pp. 249–256). ACM: New York, NY.
Hornof, A. J., & Kieras, D. E. (1997). Cognitive modeling reveals menu search is both randomand systematic. In Proceedings of the CHI‘97 Conference on Human Factors in ComputerSystems (pp. 107–114). ACM: New York, NY.
Jansen, B. J., & Spink, A. H. (2006). How are we searching the World Wide Web? A comparisonof nine large search engine transaction logs. Information Processing and Management, 42(4),248–263.
7.9 Exercises 221

Just, M. A., & Carpenter, P. A. (1987). The psychology of reading and language comprehension.Newton, MA: Allyn & Bacon.
Just, M. A., & Thibadeau, R. A. (1984). Developing a computer model of reading times. InD. E. Kieras & M. A. Just (Eds.), New methods in reading comprehension research(pp. 349–364). Hillsdale, NJ: Erlbaum.
Kadlec, T. (2013). Implementing responsive design: Building sites for an anywhere, everywhereweb. Berkeley, CA: New Riders.
Kernighan, B. W., & Plauger, P. J. (1978). The elements of programming style (2nd ed.). NewYork, NY: McGraw-Hill.
Kincaid, J. P., Fishburne Jr, R. P., Rogers, R. L., & Chissom, B. S. (1975). Derivation of newreadability formulas (Automated Readability Index, Fog Count and Flesch Reading EaseFormula) for Navy enlisted personnel. Research Branch Report 8–75, Millington, TN: NavalTechnical Training, U. S. Naval Air Station, Memphis, TN.
Klahr, D., Chase, W. G., & Lovelace, E. A. (1983). Structure and process in alphabetic retrieval.Journal of Experimental Psychology, 9(3), 462–477.
Kurniawan, S. H., & Zaphiris, P. (2001). Reading online or on paper: Which is faster?. InAbridged proceedings of HCI International 2001, Poster sessions (pp. 220–222). Mahwah,NJ: Erlbaum
Liversedge, S. P., Gilchrist, I. D., & Everling, S. (2011). The Oxford handbook of eye movements.Oxford, UK: Oxford University Press.
McKendree, J., Reader, W., & Hammond, N. (1995). The ‘‘Homeopathic Fallacy’’ in learningfrom hypertext. Communications of the ACM, 2(3), 74–82.
McLuhan, M., & Fiore, Q. (1967). The medium is the massage: An inventory of effects: 1st Ed.:Bantam Books, Random House; reissued by Gingko Press, 2001.
Morville, P., & Rosenfeld, L. (2007). Information architecture for the World Wide Web (3rd ed.).Sebastopol, CA: O’Reilly.
Nielsen, J. (1997). How users read on the Web. http://www.useit.com/alertbox/9710a.html.Retrieved from 10 March 2014.
Parker, R. C. (2006). Looking good in print. Scottsdale, AZ: Paraglyph Press.Pirolli, P. (1997). Computational models of information scent-following in a very large browsable
text collection. In Proceedings of the SIGCHI Conference on Human Factors in ComputingSystems (pp. 3–10). ACM: New York, NY.
Pirolli, P. L. T. (2007). Information foraging theory: Adaptive interaction with information.Oxford: New York, NY.
Rayner, K. (1998). Eye movements in reading and information processing: 20 years of research.Psychological Bulletin, 124(3), 372–422.
Rayner, K., & Pollatsek, A. (1989). The psychology of reading. Englewood Cliffs, NJ: PrenticeHall.
Rayner, K., Slattery, T. J., Drieghe, D., & Liversedge, S. P. (2011). Eye movements and wordskipping during reading: Effects of word length and predictability. Journal of ExperimentalPsychology: Human Perception and Performance, 37(2), 514–528.
Rieman, J., Young, R. M., & Howes, A. (1996). A dual-space model of iteratively deepeningexploratory learning. International Journal of Human-Computer Studies, 44, 743–775.
Scheiter, K., & Gerjets, K. (2007). Making your own order: Order effects in system- and user-controlled settings for learning and problem solving. In F. E. Ritter, J. Nerb, T. M. O’Shea, &E. Lehtinen (Eds.), In order to learn: How the sequences of topics affect learning (pp.181–194). Oxford: New York, NY.
Sears, A., & Shneiderman, B. (1994). Split Menus: Effectively using selection frequency toorganize menus. ACM Transactions on Computer-Human Interaction, 1(1), 27–51.
Spink, A., & Cole, C. (2001). Information and poverty: Information-seeking channels used byAfrican American low-income households. Library & Information Science Research, 23,45–65.
222 7 Cognition: Human–Computer Communication

Spink, A., Ozmutlu, H. C., & Ozmutlu, S. (2002a). Multitasking information seeking andsearching processes. Journal of the American Society for Information Sciences andTechnology, 53(8), 639–652.
Spink, A. H., Jansen, B. J., Wolfram, D., & Saracevic, T. (2002b). From e-sex to e-commerce:Web search changes. IEEE Computer,35(3), 133–135.
Swaak, J., & de Jong, T. (2007). Order or no order: System versus learner control in sequencingsimulation-based scientific discovery. In F. E. Ritter, J. Nerb, T. M. O’Shea, & E. Lehtinen(Eds.), In order to learn: How the sequences of topics affect learning (pp. 181–194). NewYork, NY: Oxford.
White, A. W. (2002). The elements of graphic design: Space, unity, page architecture, and type.New York, NY: Allworth Press.
Woods, W. (1975). What’s in a Link: Foundations for Semantic Networks. In D. G. Bobrow &A. Collins (Eds.), Representation and Understanding. New York, NY: Academic Press.Reprinted in Brachman, R., & Levesque, H. (1985). Readings in Knowledge Representation.San Mateo: Morgan Kaufmann. Also reprinted in Collins, A., & Smith, E. E. (1988). Readingsin Cognitive Science. San Mateo: Morgan Kaufmann.
References 223

Chapter 8Social: Social Cognition and Teamwork
Abstract Most work is carried out by people working as part of a team. Evenwhere work is carried out by one person it is likely to be in connection if not incollaboration with other people. This could be in a formal organization that hasstandard operating procedures or as part of a larger system, or it could be part of aninformal group of loosely organized collaborators. Social processes—how peopleinteract with each other—are important; they affect how systems interfaces areused. Any system that supports more than one person needs to take these phe-nomena into account along with the various factors that define the social context inwhich users especially user working in teams will make decisions take actionsincluding extrinsic intrinsic motivation. In this chapter we introduce some con-cepts that have proven to be important for system adoption use.
8.1 Introduction
Much early work in HCI focused on single users because at that time most taskswere performed by individuals working on independent computers. However, evenin the 1970s, as increased computer use came to the workplace, there was rec-ognition that we need to consider social aspects of system use:
We believe that the engineer who deals with human performance should avoid two faultsthat have made the ‘‘efficiency expert’’ one of the most hated in industry: (1) the neglect ofpersonal and of social variables, and (2) the use of people as means to ends they do notshare and do not determine. If a person is to design tasks for others, he has the respon-sibility to attempt to see the tasks and their implications in a wider context and to attemptto ensure that they are life-enhancing. This is not easy to do, nor are the criteria clear cut.It requires that the designer himself close feedback loops with reality at several levels, notonly at the level of specific performance criteria of the given system or of the human taskwhich are part of it, but also at the level of his own personal values (Sheridan and Ferrell1974, pp. 18–19).
As distributed, networked computing systems have become the norm, team orgroup working has become routine, and the importance of social processes hasrisen (see, for example, Hinds and Kiesler 2002). We now have a much better
F. E. Ritter et al., Foundations for Designing User-Centered Systems,DOI: 10.1007/978-1-4471-5134-0_8, � Springer-Verlag London 2014
225
understanding of how the context in which the technological system is used sig-nificantly affects how it is used. Workplace systems are socio-technical systems(see Chap. 2); that is, technical systems that are designed for and shaped by peopleoperating in social contexts. This means it is important to consider the interactionsand interdependencies between the social and technical aspects of any system thatis being developed or modified: How is it being used? How does it affect (trans-form, facilitate, impede) social processes?
Social psychology and other disciplines draw a distinction between individualsacting alone, dyads (two people interacting), groups, teams, and communities. Inthe context of work tasks, dyads, groups, and teams tend to share more clearlydefined goals. Here we use the term team to refer to a particular, formally definedand workplace oriented type of group. Whilst what applies to groups generallyapplies to teams, what applies to teams does not always apply to groups.
A team comprises two or more individuals who have to carry out work (a set ofrelated tasks) in pursuit of some common (specified) goal. Team performance, likeindividual performance, is still based on the notion of particular people doingparticular tasks in a particular context. It is, however, complicated by the need tocommunicate and co-ordinate actions and decision making, and by having to con-sider the effects of the way that the team may be distributed in both space and time.
When thinking about teams, it is important to remember that what counts as ateam depends on where you draw the boundaries when conducting your analysis(Hollnagel 2007). In aviation, for example, if you draw your boundary at theaircraft cockpit level you might consider the pilots to be a team. If, however, youextend the boundary to cover the whole of the (interior of the) aircraft, then theteam would include the flight attendants. You can keep extending the boundaryoutwards, which would bring more people into the team: ground crew; air trafficcontrol; and so on.
Social processes related to and mediated by technology also occur in other largesystems of systems such as medicine, entertainment, defense, and increasingly ineducation. For example, in air transportation, many people—passengers, pilots,ground crew, and so on—come together (see Fig. 8.1). Where a number of socialgroups come together, as in this case, a large socio-technical system—a system ofsystems—is formed smaller socio-technical systems each of which has their ownsocial rules and regulations, and often includes different technical systems. Peoplefrequently end up as the points at which these systems overlap. For example, thinkabout the check-in agent at an airport who has to work with baggage handlingsystems to ensure your luggage gets on to the right plane. Here, the agent whoprints and attaches the tag to your bag is the boundary point between the check-insystem and the baggage handling system, and the tag determines how the bagmoves into the baggage handling system.
Working as a team can bring problems of co-ordination and communication.The aviation industry recognized this and developed the concept of cockpitresource management (Wiener et al. 1993) as a way of dealing with the issues on
226 8 Social: Social Cognition and Teamwork

the flight deck. The concept was subsequently extended to cover the whole of theon-board flight crew, and was renamed crew resource management (Kanki et al.2010). When teams are in the same location, or co-located a great advantage isoverhearing what others are doing, even if they are not collaborating actively atthat moment. This allows people to be aware of where others are in a task. There isa body of work looking at what happens in control rooms, for example, whereteams of operators work together (e.g., Heath and Luff 2000).
Although teams may be co-located, teams nowadays are often distributed inspace and time, even when working for the same organization. Teams may also bespread across different time zones and across different cultures. A lot of work hasbeen done to understand the benefits and problems of distributed work and tele-commuting (see, for example, Hinds and Kiesler 2002; Ellison 2004). Researchhas also focused on the ways in which different technologies affect communicationand coordination. Technologies that mediate communication between people indifferent locations are differentially suited to different kinds of tasks (Churchill andBly 2000). Teams can also change dynamically, as they adapt to the situation athand. In hospitals, for example, there is often a doctor that is on call. These doctorsare usually only called up when the local team cannot resolve the case they arecurrently dealing with. This may result in the doctor acting as a remote teammember to help diagnose and fix the situation, or it may result in the doctorphysically attending in order to provide expertise and advice in situ.
In the rest of this chapter we look at the impact of social factors on perfor-mance. We begin by examining at the impact of the social context on decisionmaking. We then go on to consider the factors that define the social context inwhich teams operate. It is worth noting at this juncture that team performanceinvolves more than just the sum of the performances of the individual teammembers.
Fig. 8.1 The modern air transportation system includes many kinds of technology, includingcomputer systems, and many types of users, ranging from passengers to pilots to support staff andincluding air traffic control
8.1 Introduction 227

8.2 Social Effects on Decision Making
8.2.1 Introduction
Social psychology suggests that sometimes groups do not make better decisions thanindividuals. It is certainly true that groups often come to different decisions thanindividuals, and that groups are influenced by social factors. This section looks atsome of the social influences on decision making, including the diffusion of socialresponsibility, the attribution of effects, and how groups make decisions differently.
8.2.2 Social Responsibility Effects
There are two effects related to decision making in social settings. The first ofthese is called diffusion of social responsibility. If a request for assistance isdirected at a single person, that person must choose whether to respond or not.When many people are held jointly responsible for dealing with a situation,however, the responsibility diffuses across people: one person may choose not todo anything in the belief that someone else will. Figure 8.2 illustrates a version ofthis. It shows a fairly obvious typographical error in a local paper. While it can beargued that it is not the readers’ responsibility to report typos to a newspaper,many readers take great delight in doing so. In this case, both the paper and thefans ignored this glaring mistake for weeks.
The second effect is pluralistic ignorance. When you are in a situation, you willoften base your interpretation of the situation on how other people interpret it. Isthat person ill or just acting strangely? Are they sleeping by the side of the road orhave they had a heart attack? As Darley and Latané (reported in Abelson et al.2004, p. 224) noted, ‘‘emergencies do not come with signs on them saying thatthey are emergencies.’’ The observer has to interpret the event before responding.If others are ignoring the apparently anomalous behavior or interpreting it in oneway, then it provides evidence to suggest that you should too.
Both of these effects apply in an early study designed to investigate how peoplechoose to help. Darley and Batson (1973) had theological seminary (i.e., religiousprofessional) students prepare a talk and then walk individually to the nextbuilding where they were supposed to give their talk to a panel. Some studentsprepared a talk on the tale of the Good Samaritan (a biblical story about a man whostopped and helped an injured man) and some prepared a talk on a topic that didnot involve helping others. Some of the students were told to hurry to the nextbuilding because they were late, some were told they were somewhat late, andsome had more time to make the trip. On the way to the next building each studentpassed a person slumped in a doorway. Unknown to the students, this person was aconfederate of the experimenter. Data was collected on who stopped to help thisperson, and how much help they offered.
228 8 Social: Social Cognition and Teamwork

The students who had the most time to get to the next building helped the most(63%); those in the greatest hurry helped the least (10%). The students who weresomewhat late helped 45% of the time. Ironically, the amount of help they gavewas not influenced by whether the student was going to give a talk on the GoodSamaritan or not. This work starts to examine who chooses to participate, andshows that it not only depends on the individual, but also on the context.
You can often see these effects in email. Some time ago we saw an email thatwas sent out about the potential closing down of an academic society. ‘‘Unless thisvote [to amend the constitution] is successful, the committee will [have] noalternative [sic] to dismantling the Society, prior to closing it down.’’ The emailcalled upon the members of the society to vote for a new set of bylaws. It wastargeted at the group (of society members) as a whole rather than individualswithin the group. (The society continued, but it took several more emails.)
Fig. 8.2 This figure, whichappeared in a pre-game(American football)newspaper program, ran for3 weeks (with differentopponents appropriatelyinserted), with the labels‘‘When Penn State has theBall’’ for its defensive teamand for its offensive team
8.2 Social Effects on Decision Making 229

Remember that the diffusion of social responsibility requires that others areinvolved—a person is less likely to take responsibility for action or inaction whenthey think someone else will take the action. Size of the group is critical, and itmust be the case that no one person is singled out as responsible. So, not allsituations involving many participants will result in social responsibility diffusion.For such diffusion to occur, the relationship of the individuals in the group to therequestor—whether they are individually likely to be held accountable or not—iskey. Your supervisor asking you to put information on a web site to help others ismore compelling than a company president asking everyone to participate in aknowledge repository.
You do not always get diffusion of social responsibility. In a demo run as part ofan HCI class we have repeatedly failed to achieve this effect. In this demo the classteaching assistant emails the students (some individually, and some in groups of 2,4, 8, 16, or 32 students) asking them to bring along an example book to the nextclass. The numbers of students who bring in a book is about the same for thosestudents who are emailed individually as it is for those who are emailed in groups.If there was diffusion of responsibility, there would be more books brought alongby those who received the individual email than those who received a group email,Subsequent class discussions usually note that most of the students feel that thisrequest is not individual, that the teaching assistant will know them individually,and that the lecturer will be able to tell whether or not they brought along a book.Sometimes students also report that the bland wording in the request is somewhatunusual, which leads them to suspect that there is an ulterior motive behind therequest.
If you want to avoid diffusion of social responsibility, you should target par-ticular individuals. It helps to use first names in emails, use individual commu-nication, and to clearly note any possible consequences. In the case of bulletinboards and online forums, people asking for help have to be specific (which ispossible with technical problems) and have to address individuals if possible. Inthe case of online forums this is difficult and thus it may be better in many cases tofind help locally.
Note that diffusion of responsibility and pluralistic ignorance are not inevitable,and can be avoided or prevented. Keltner and Marsh (2006–2007) suggest makingthe need clear, so that there is no pluralistic ignorance about the need for help, andto direct the request at specific individuals, so that the responsibility does not getdiffused.
8.2.3 Attributions and Attributional Style
Understanding why other people do things is called attribution. Attribution iscentral to how we understand social situations. When we examine how peoplemake these attributions, we can start to identify some regularities:
230 8 Social: Social Cognition and Teamwork

• Self versus others: attributions about ourselves are usually different from ourattributions about others behaving in exactly the same way. We give ourselvescredit for success based on our internal capabilities, but blame the environmentor others for our failures. On the other hand, when making attributions aboutothers, we are more likely to attribute their success to their environment, andtheir failures to their personal deficiencies. Even university presidents do this(Birnbaum 1988, p. 215), attributing their own successes to hard work and theirfailures to outside events.
• If something bad occurs to someone else, we will seek explanations that attri-bute cause to a circumstance that creates the most distance from our own cir-cumstances. The explanation is simple: we like to distance ourselves from thethought that the same thing could happen to us.
Attribution theory is an important area of research in social psychology. Joneset al. (1972) noted the tendency of people to attribute their actions to externalsituational causes, whilst external observers attributed the same actions to causesthat were internal to the person carrying out the actions (the actor). They calledthis tendency the actor-observer divergence. The term fundamental attributionerror was later introduced to describe how observers underestimate the impact ofsituational forces and overestimate the importance of internal dispositional factors(Ross et al. 1977).
One of the fundamental errors in design is for the designer to attribute their ownfeelings, needs, knowledge, goals, and so on, to users. In other words, for thedesigners to believe that other people, including their potential users, are exactlylike them, and behave in exactly the same way. Good designers differentiate whatthey want, need, and can do from what their users want, need, and can do. Fromthe user’s perspective, the technology may not always behave as expected. In thesesituations, systems need to be designed to be transparent, to be effectively de-bugged, and thus to help the users make the appropriate attributions: is this anissue with the system or the device or did I do something wrong? Error messagesshould not be worded ambiguously, but should allow the user to attribute causesappropriately and learn from the error.
Related to the notion of attribution is the concept of cognitivedissonance.Cognitive dissonance occurs when a person holds two or more beliefs that are inconflict at one time as in when people do not get what they want. People willrationalize their choice by devaluing the one that is not chosen or that becomesunavailable. It is similar to the moral in Aesop’s fable about the fox and the sourgrapes. The fox reasoned that the grapes that he could not reach were sour, andhence not worth getting. People sometimes adopt a similar line of reasoning whenthey do not get the rewards they were expecting (such as a promotion to a newpost) by convincing themselves that they are currently in the best position.Similarly, when people do things for little reward, when they explain why they didthat activity, it can increase their perceived value of it. This explains why it can bebetter to give small rewards where the impact can last longer.
8.2 Social Effects on Decision Making 231
8.2.3.1 Breakout Box: Ways Email Has Gone Awry
How can we apply attribution theory to system design? Email is an example wheremost people are using the same type of system, but other people appear to behavedifferently from us and differently from how we would like them to.
Ritter has personally seen the following ways that email has been lost, misfiled,misdirected, or lost. Are these errors? In some ways they are. Are they the fault ofthe user or of the system or the system designer? It seems to vary. In all cases, thesender might want a response.
This list (selected from more) can also be explained with reference to attri-bution. Do the reasons you do not reply to email vary from why you think othersdo not reply (starting with whether they got the email!)? Many users assume thatemail is perfect, that the receiver received it, and that lack of response is due to thereceiver not being willing to respond. This list illustrates that this is not always thecase. Further discussion is available in the chapter on errors.
1. Date is off on the sending computer (by up to 5 years), so does not appear withtoday’s email (mail to Ritter).
2. Simple typo in ‘‘To’’ address (mail to Saor-bugs, not Soar-bugs).3. Extra letter(s) typed as an answer to another application, e.g., mail to ‘‘yesyen’’
instead of to ‘‘yen’’ (Ritter).4. Complex typo, e.g., in ‘‘To’’ address, mail sent to research group’s name, not to
research group’s email alias (Ritter).5. ‘‘From’’ country (!) was on spam list (so not read by recipient) and not read by
cc person (Ritter was cc).6. Typo in domain (Ritter).7. Local (university, government, hotel) mail server ate it and left no residue
(Ritter, Spink).8. No known reason, found months later where it should be (Ritter).9. Reader meant to respond, but never got back to it or was waiting for ‘the right
time to send a really good and clear reply’ (Ritter, too many times).10. Admin assistant reading manager’s email deleted it accidentally (multi-read-
ers of account, anonymous).11. Admin assistant reading manager’s email deleted it, perhaps on purpose
(multi-readers of account, anonymous).12. Email came in batch of 500 messages after a break (Ritter, others).13. Reader or mailer accidentally deleted incoming mailbox (anonymous!).14. Filter misfiled it (Schooler, Ritter).15. Email sent to Ritter (and from Ritter, more recently) where sender‘s machine
filled in remainder as @\localhost[. Ritter replied with ritter@\localhost[.Both bounced.
16. RAID disk failure takes out department for 3 days (anonymous in UK).17. ‘‘When I can’t give someone the answer I want to give them, I don’t give them
an answer’’ (a publisher).
232 8 Social: Social Cognition and Teamwork
18. User was going through a life-changing event, such as moving, pneumonia,their own death, having a baby, losing a baby, loss of a relative, or several ofthese at the same time.
19. User wrote email and, instead of sending it, filed it as if it was the email beingreplied to. (Ritter, September 2006; to Ritter, 2009).
20. Print out of email was printed and deleted, and was then stapled to the back ofanother document printed before it. (Ritter, multiple times).
21. Auto expansion from first name (e.g., Jacob) instead of from last name (e.g.,Jacob).
22. Email sent from local conference hotel run by major research university neverarrived or bounced.
23. Emails included as attachments in the middle of the body of a message (ratherthan in the header or at the end of the body).
24. Email software and anything in between (e.g., router, ISP, recipient) changessecurity level. (Ritter, Feb. 2009, and earlier).
25. Students told/reminded to read their student email account (with clunkyinterface) by an email sent to that address.
26. User replied to questions by answering them on the same line, not a separateline as the quoted questions. The reader only saw their original questions.
27. Migration to MS Outlook server did not migrate all emails.
8.2.4 Majority and Minority Effects
The way that individuals behave when they are part of a group usually differsfrom how they would behave on their own. There is a strong tendency to beinfluenced by what the group says or does. If the majority of members of a groupexpress a single opinion, it is much less likely that one individual will hold onto adifferent opinion, even if they know that they are correct. This effect derives fromthe desire in a group to maintain harmony or conformity, and minimizes conflict.This can result in incorrect or deviant decision making. This has been raised as aconcern for juries, for example, where what is called group think can occur(McCauley 1989).
These issues have been studied with experiments using a group where some ofthe group members were confederates of the experimenter, that is, people whowere not really subjects in the study. With a stooge majority (i.e., in a room full ofexperimenters pretending to be other subjects in the study), individuals readilycapitulated to the majority view, even when they were fully aware of the rightanswer. With a stooge minority, where the group in the experiment had a minorityof confederates who held an incorrect opinion, many individuals do capitulateoccasionally to their view.
Another way in which this can play out is with what is called choice shift. Twogood examples of this are the risky shift, where a group makes a riskier decisionthan an individual. Wallach et al. (1964) proposed that greater risk-taking results
8.2 Social Effects on Decision Making 233

from diffusion of responsibility. Here, emotional bonds decrease anxiety and therisk is perceived as shared. Collins and Guetzkow (1964) suggested that high-risk-takers are more confident and hence may persuade others to take greater risks. Thiscan result in those who tend toward less risky behavior becoming more risky; socialpressure (I do not want to let my colleagues down) translates to moving to a riskierposition. Familiarity and increased knowledge of a situation also leads people tofeel that situations are less risky; more people may equate to more knowledge anddeeper exploration of the issues, so perceived risk is diminished (Bateson 1966).
However, sometimes the opposite can occur; this is called cautious shift (Stoner1968). Here the group moves to a more conservative, less risky position.
8.2.5 Summary
The effects of the social context on decisions are strong in situations that havesocial components. These effects arise when there are other parties to the decisionand when there are other parties making the decision.
Social effects occur in individuals when they are part of a team but also occur inindividuals in social situations where there are no organized teams such as chatrooms and forums. Some of these effects can be anticipated and can be marshaledto help systems, and some can be avoided with forethought.
There are further influences of decision making that arise from social effects. Itis these social effects that keep life interesting. If you are interested, see the sectionon Other Resources.
8.3 Factors Affecting Team Performance
8.3.1 Introduction
It is important to understand the factors that underpin good teamwork so that youcan facilitate and support teams with any system you design or develop. A team’sperformance, and whether it achieves its desired goals, will depend on collabo-ration and communication between the team members. Teamwork is based uponmultiple components, including the team’s set of competencies—that is, knowl-edge, skills, and attitudes (or KSAs). The relationship between the KSAs andteamwork is shown in Fig. 8.3.
Your system design should provide the appropriate levels and types of supportto encourage team members to participate in team performance. Participation canrange from simply making a comment on a bulletin board that can be seen by othermembers of a group, to interactively working with other people as part of a team tocarry out a task. There are several situational factors that affect how users interactsocially with others.
234 8 Social: Social Cognition and Teamwork

Table 8.1 notes several factors that influence team performance based on areview of modeling teamwork (Morgan et al. 2010). The importance of each of thefactors will depend on the task itself, and the context in which it is performed.Note that although we refer to team, these factors also apply to groups.
An example of a team is shown in Fig. 8.4. Much of the research in this areahas been carried out in critical dynamic domains, such as aviation or defense,where good teamwork has high payoffs (and, more importantly, poor teamworkcan lead to great losses). In addition to the way that teams are made up, and howthe individual members work together, team performance is also affected by theavailability of resources to carry out the task at hand. These includes physicalresources like space, computers, networks, and databases, as well as intellectualand administrative support above and below the team in the organization (seeBooher and Minninger 2003; Brooks 1975 for overviews of resourcing issues).
Achieving good teamwork is difficult. The situation is complicated because of theneed to consider the interaction of multiple people, each with different backgrounds(knowledge, culture, and so on), which will influence their behavior. It is alsoimportant to take appropriate account of task-related factors, because the taskstructure, for example, may not readily map onto the team’s structure. Here we drawon and extend Kozlowski and Ilgen’s (2006) review to highlight areas of importance.
8.3.2 Team Size
The size of a team affects performance. If the team is small and its size is constant,it may be possible for communication and collaboration to take place directlybetween members. The group’s size has a strong effect on intra-group interaction,as well as inter-group perceptions. Group size seems not only to influence the
Fig. 8.3 A theory of the components of teamwork (based on a diagram by Salas et al. 2005)
8.3 Factors Affecting Team Performance 235

effectiveness of communication between group members (Cartwright 1968; Hare1952) and its tendency towards hierarchy (Bales et al. 1951) but also the rela-tionship dynamics existing within and between groups (Bales and Borgatta 1955;Benenson et al. 2000; Shalit 1988).
As the size of the team grows, it changes the dynamics of interaction betweenmembers, and may make it harder for individual members to participate in teamworking. In such a situation you need to consider other factors that can be used tofacilitate member participation. If the team is too large for effective participation,you may wish to encourage (or even mandate) the use of smaller teams.
8.3.3 Team Competencies
Good teams are usually made up of good team members. If the team membershave good levels of KSAs, this will usually be positively reflected in team per-formance. It also helps if the goals of the team members are aligned with those ofthe organization in general, and with the task goals in particular. A multidisci-plinary team can benefit greatly from skill sharing between different team mem-bers, and a team can also be made stronger through appropriate education andtraining of the team and its members. It is worth noting that there are some taskswhere team performance is determined by the performance of the worst team
Table 8.1 Factors that influence team performance by defining the social context of themembers
Factor Brief definition
Team size The number of members in a teamTeam competencies An abstraction of the number of unique qualities possessed by
the members of a teamTeam structure and composition The way that the members of the team are structurally
organized, e.g., as a hierarchy, and how they relate to oneanother
Social distance The perceived distance between the goals and motivations ofany two team members
Spatial distance The geophysical distance between any two members of ateam; this also has implications for temporal distance–thatis, differences in time zone
Mutual support and surveillance Mechanisms for maintaining shared norms and coherence byminimizing the expression of the diverse characteristics ofteam members
Presence or absence oflegitimate authority figures
A measure of the perception of a leader’s authority andlegitimacy by a team member; authority can be leaders ormonitors
Task attractiveness A measure of the alignment of the leader’s task with the teammembers’ internal motivations
Team processes and tasks The relationship between the teams and the tasks that theyhave to perform
236 8 Social: Social Cognition and Teamwork

member, such as in an obstacle course, and there are other tasks where coordi-nation is far more important than raw speed or talent (e.g., McNeese 2000), and yetother tasks where the best performances of individuals matter (e.g., gymnastics).Industrial and organizational psychology is an area that will provide moreknowledge about how to improve teams through selection.
Olson and Olson (2000) suggest that collaboration readiness and technologyreadiness are also important factors for teams interacting using technology. Theformer relates to the willingness and ability of team members to collaborate. Thelatter relates the technological know-how about the tools that will be used, includingtools that support synchronous (real-time) and asynchronous communication (andcollaboration) such as Skype, Twitter, Instant Messaging, video chat, and textSMS—notably, the suitability of the tool itself, the match of its affordances to thecommunication needs of the group, and the tasks (Bly and Churchill 1999).
8.3.4 Team Structure and Composition
As the size of the team increases, some sort of structure will be needed to managecommunication and collaboration between members. This often takes the form of a
Fig. 8.4 Teams areimportant for manyprocesses. Here, two pilotsare working together as ateam to prepare a plane forflight, and, not shown,interacting with groundcontrol and ATC
8.3 Factors Affecting Team Performance 237

hierarchy. For larger teams (and where the size of the team can increase overtime), it may become necessary to provide system support for communication andcollaboration. This can be done through facilities for sharing information, or forallowing close grained collaboration with version histories to enable task aware-ness (e.g., Churchill et al. 2000) or by enabling team members to maintain a moregeneral current awareness of what other team members are doing, as in theexample of the control room operators mentioned above (Heath and Luff 2000).This latter kind of awareness is sometimes called shared situation awareness.
The optimal structure will depend on the team members, their relationships, thesocial context, and the task. In the ideal case, the team is balanced to the task, withappropriate KSAs to perform the task and the team coordination tasks. For com-plex, unpredictable tasks, or for situations where there is a broad range of tasks,flexible structures are better. For static tasks, static structures can help the teams tobe more efficient. Thus in assembly line work, where tasks do not vary, structurestend to be more rigid. In academic research, and in creative pursuits such asdesign, where the tasks vary quite a bit, teams will have more varied and morevariable structures. In Fig. 8.3 this would influence the factors of adaptability and,to a certain extent, the communication and team leadership.
Within the field of system design, Brooks (1975), has famously explored theissue of team structure. He argues that having a single system design architect isthe best approach. He also notes that adding more people to a project can slowdown development at certain times. There are two main reasons for this: first, youneed to spend time and effort bringing the new people up to speed, and second, youoften also increase the communication overhead (based on size and structure).
In addition to the structure, the composition of the team is also important: youneed to have people who are capable of working together. Several researchers(Kozlowski and Ilgen 2006; Salas et al. 2002) note that teams work better whenthey leverage the knowledge of the team members, are cohesive and confident,allocate resources appropriately, coordinate well, and learn over time.
There is significant evidence that differences between group members nega-tively affect group performance (Byrne 1971; McGrath 1984; Newcomb 1961).This literature generally describes the level of group performance as a function ofthe organization’s level of social integration, or the degree to which groupmembers are psychologically linked or attracted towards interacting with oneanother in pursuit of common objectives (O’Reilly et al. 1989). Social integrationconstitutes a goal-driven process arising out of the daily interactions of teammembers, mediated by both the length of contact between members and theirrespective organizational roles.
Promoting interaction between team members also helps. Birnbaum (1988,p. 94) and others, have noted that people who interact with each other in groupstend to like each other. The interaction and liking are related, in that liking leads tomore interaction, which leads to more liking.
The importance of diversity among team members is questioned by some,however. Mannix and Neale (2005), for example, have argued that the effect ofdiversity of team members is not as clear cut as some people say. They note that
238 8 Social: Social Cognition and Teamwork
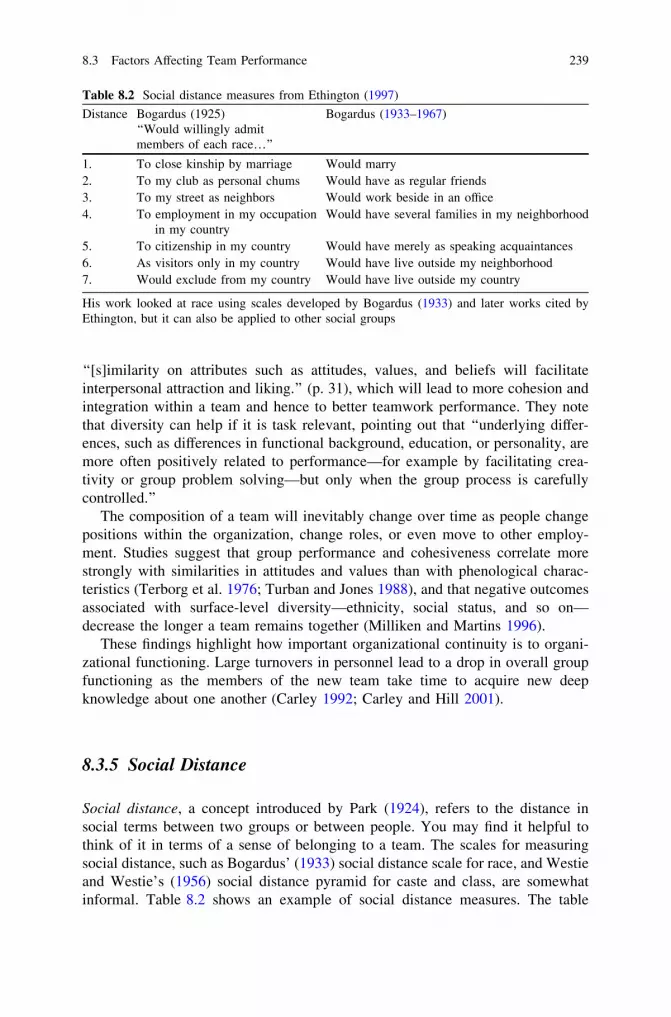
‘‘[s]imilarity on attributes such as attitudes, values, and beliefs will facilitateinterpersonal attraction and liking.’’ (p. 31), which will lead to more cohesion andintegration within a team and hence to better teamwork performance. They notethat diversity can help if it is task relevant, pointing out that ‘‘underlying differ-ences, such as differences in functional background, education, or personality, aremore often positively related to performance—for example by facilitating crea-tivity or group problem solving—but only when the group process is carefullycontrolled.’’
The composition of a team will inevitably change over time as people changepositions within the organization, change roles, or even move to other employ-ment. Studies suggest that group performance and cohesiveness correlate morestrongly with similarities in attitudes and values than with phenological charac-teristics (Terborg et al. 1976; Turban and Jones 1988), and that negative outcomesassociated with surface-level diversity—ethnicity, social status, and so on—decrease the longer a team remains together (Milliken and Martins 1996).
These findings highlight how important organizational continuity is to organi-zational functioning. Large turnovers in personnel lead to a drop in overall groupfunctioning as the members of the new team take time to acquire new deepknowledge about one another (Carley 1992; Carley and Hill 2001).
8.3.5 Social Distance
Social distance, a concept introduced by Park (1924), refers to the distance insocial terms between two groups or between people. You may find it helpful tothink of it in terms of a sense of belonging to a team. The scales for measuringsocial distance, such as Bogardus’ (1933) social distance scale for race, and Westieand Westie’s (1956) social distance pyramid for caste and class, are somewhatinformal. Table 8.2 shows an example of social distance measures. The table
Table 8.2 Social distance measures from Ethington (1997)
Distance Bogardus (1925) Bogardus (1933–1967)‘‘Would willingly admitmembers of each race…’’
1. To close kinship by marriage Would marry2. To my club as personal chums Would have as regular friends3. To my street as neighbors Would work beside in an office4. To employment in my occupation
in my countryWould have several families in my neighborhood
5. To citizenship in my country Would have merely as speaking acquaintances6. As visitors only in my country Would have live outside my neighborhood7. Would exclude from my country Would have live outside my country
His work looked at race using scales developed by Bogardus (1933) and later works cited byEthington, but it can also be applied to other social groups
8.3 Factors Affecting Team Performance 239
shows that there are problems in these measures (i.e., units are unclear), that it isnot an easy measure to create, and that even discussions about social distance canhelp us understand ourselves and users better.
More recently, social distance has come to be regarded as a continuum ratherthan discrete levels, stretching from an in-group bias—people just like me—to anout-group bias—people not at all like me (Eveland et al. 1999; Perloff 1993).Developments in network theory (see Chap. 9) also suggest that social distance isa function of the ties between group members rather than just their individualcharacteristics (Ethington 1997; Granovetter 1973; Wetherell et al. 1994). Nev-ertheless, the concept of a social distance continuum is a useful way of capturingthe influence of culture, particularly as it relates to the development of out-groupbiases. It is worth noting that many people draw a distinction between socialdistance and psychological distance (Ginges and Eyal 2009), arguing that there aresalient differences between the interactions of individuals who may belong toparticular groups (psychological distance), and group-level interactions, wheregroup identity is primary (social distance).
Smaller social distances are generally preferable because they make it easier forteam members to both receive support from, and give support to each other,thereby making participation in the group more likely. Conversely, larger socialdistances increase the likelihood of team members acting against other teammembers or other groups.
8.3.6 Spatial Distance
Organizations are increasingly using teams that are distributed geographically andtemporally. One part of the team can work on a task and, at the end of their day,pass it to a group in another time zone who are just starting their working day.Getting people to perform successfully in this way requires careful planning,because geographic distances between group members mediate the development offamiliarity (Ethington 1997), and thus affect group cohesiveness. Notions offamiliarity, in turn, act reciprocally to help create communities of practice (SeelyBrown and Duguid 1991). Distortions to the perception of space, however, canalso distort both the sense of accountability and attachment to others (Grossman1996).
Spatial relationships influence decisions to participate. If group members areclose to us this encourages participation in local activities. The scale of importancevaries by task, but in collaboration by researchers, for example, 30 m is animportant distance, above which much less collaboration happens (Kraut et al.1990). Increasing distance will also decrease participation because increaseddistance weakens our relationship to others. There are both short distance(10–100 m) and large distance (time zone) effects. This may change as ways ofconnecting change and network bandwidth increases.
240 8 Social: Social Cognition and Teamwork

8.3.7 Mutual Support and Mutual Surveillance
In addition to issues of social and spatial distance, the nature of the relationshipsbetween team members influences team performance. In particular, peer-to-peerand subordinate–superior relationships, which we discuss here, are important(Harrison et al. 1998; Terborg et al. 1976; Turban and Jones 1988). If theserelationships change, this can lead to significant and divergent outcomes in teamperformance (e.g., Grossman 1996).
Team membership offers several benefits. These include a sense of identity andbelonging (group norms), guidelines for dealing with ambiguous situations,structuring of chaotic situations, and helping predict the actions of others (e.g.,Chekroun and Brauer 2002; Cialdini et al. 1990; Smith and Mackie 1995). Fur-thermore, social support can help to moderate the effects of stress by bufferingmembers from negative events (e.g., Caplan 1974; Cobb 1976; Epley 1974). Therelationship between social support and stress reduction is complex: Sandler andLakey (1982) found that the benefits of group support varied across individuals inrelation to the coping mechanisms used to deal with adverse situations.
On a peer-to-peer level, teams can help regulate behavior. Viewed through thelens of appraisal theory (e.g., Cannon 1932; Festinger 1954; Lazarus and Folkman1984), for example, group support facilitates participation. Appraisal theory pro-poses that you judge a task looking at what resources the task requires and whatresources you have. If the task requires more than you have, it is a threatening task.If not, it is a challenging task. If you are part of a team, you have more resources,so being in a team will make the task more likely to be seen as challenging ratherthan threatening.
Where behavior is deviant, however, Chekroun and Brauer (2002) found that ifthe deviation could be clearly attributed to particular individuals, other teammembers offered larger and more rapid responses of disapproval of those acts.Contrary to expectations, larger deviations are typically met first with attempts tomediate actor behavior rather than expulsion (Festinger 1954; Liska 1997), asmembers try to eliminate the discrepancy. As the discrepancy narrows, the pressurefor uniformity appears to increase and becomes even greater when either the rele-vance or the value of group membership increases (Festinger 1954). Simultaneously,however, the impulse to individuate oneself and, for many people, to increase one’srelative status ensures a constant state of comparative surveillance, particularly forgroups operating in risky situations for prolonged periods (Dinter 1985).
8.3.8 Authority Figures
Team leaders are often expected to exert authority as part of their role. Leadership,authority, and compliance have been extensively studied, most famously byStanley Milgram (1963). In Milgram’s study, participants gave increasingly
8.3 Factors Affecting Team Performance 241

powerful electrical shocks to volunteer learners, based on commands from theexperimenter (an authority figure)—notably, shocks were not in fact delivered butstudy participants believed they were. The power wielded by the experimenter inthis study was not physically coercive or economic, but rather symbolic, in thatthey were an authority figure in a study. Milgram noted that the goal (theadvancement of knowledge) and the location (Yale) influenced participants toacquiesce more readily to the experimenter’s demands (Milgram 1963, p. 377). Inthe Milgram study and subsequent obedience studies (e.g., Haney et al. 1973),belief in the legitimacy and power of the leader led to the leader being grantedactual power over the participant.
The effects of authority are moderated by other factors, such as physicalproximity. If the team leaders are physically located close to the team, they havemore influence on team members. Distant leaders have less authority.
Authority can be expressed in several different ways online, for example, by anemail address (e.g., [email protected]), by having someone send an email onyour behalf (e.g., this is an email for a vice president sent by an admin assistant),by privileges or special tools in a game, and by login names (e.g., admin, web-master, or [email protected]). How authority is implemented, used, and abusedonline is still not fully understood, however.
8.3.9 Task Attractiveness
The task that a team has to perform and, hence, its goals influence the behavior ofthe team. Frank’s (1944) and Milgram’s (1963) studies both note that obedience ofauthority depends on having legitimate goals that are related to the organization’smission. More legitimate goals lead to greater participation in systems. In addition,people often indicate in interviews and surveys that goals are a motivating factor intheir behavior (Collins 2008; Frank 1944). Representing social goals poses achallenge, in that they emerge at the interface between cognitive and socialactivity, and hence tend to be more abstract. It can therefore be difficult to evaluatehow successfully they have been achieved.
Over time, legitimate goals tend to make group members more compliant,whereas illegitimate goals erode the ability of leaders to influence their subordi-nates. Making the goals clear, and the payoff for achieving them direct andimmediate, are just some ways to make tasks more appealing. Online systems,including computer games, can be designed to take advantage of this. Carma(http://www.car.ma), for example, is an online car ride sharing site where the goalis attractive to users for multiple reasons. The Carma app runs on a smartphoneand connects to a server. When you want to travel somewhere, you note where youwant to be picked up and how much you are willing to pay. As you drive, or beforeyou drive, you check to see if anyone is looking for a ride.
The success of Carma’s system appears to be more dependent on social factorsthan on technology. If there are not enough drivers and passengers, there will not
242 8 Social: Social Cognition and Teamwork

be enough matches to make its use worthwhile for either driver or passenger. In thepast, these rides were arranged informally (e.g., by word of mouth) and usingbulletin boards. So the group size, location, and destination will all have an effect.Group size is likely to be a negative factor in rural areas where the group and thepopulation density are both likely to be smaller. On the other hand, group cohe-siveness may be greater, as the group members may know each other and beheaded to the same destinations. The risks in developing this system do not appearto be technological, but more related to social engineering.
8.3.10 Team Processes and Tasks
It is important to understand the tasks the group is trying to perform. There may bedifferent ways to do the task, and there may be different tasks that can be chosen.Within a volunteer organization, for example, some groups will perform better onactivism tasks and some groups will perform better on outreach and education tasks.
The way that tasks are divided between the team members and how the teammembers communicate will affect team performance. Olson and Olson (2000,2008) note the importance of the coupling of work, that is, how closely teammembers have to work together. For technical work and in discussions of risk, forexample, the collaborators frequently need to be co-located so that they cancommunicate fully, whereas in other situations, such as open source softwaredevelopment, remote coupling may be possible.
It is therefore important to adapt the processes to the team and to the tasks.Common ground is a shared set of knowledge, expectations, and understandingabout the people on the team and the task. Establishing common ground is animportant factor in team performance (Clark and Wilkes-Gibbs 1986; Olson andOlson 2000) and should therefore be encouraged by systems and system designers.
You may also need to think about people’s motivation for doing the task in thefirst place. Pink (2009) argues that boring and repetitive work still requiresextrinsic motivation (Pink describes this as Motivation 2.0) to get people to do thetasks, and this was covered in Chap. 4. In those situations where people want to dothe work, however, Pink argues that they are intrinsically motivated to do the tasks(he calls this Motivation 3.0). Pink suggests that Motivation 3.0 applies to creativework and leisure, most of design (including design of software, systems andinterfaces), many engineering tasks, and most knowledge work.
8.3.11 Implications for System Design
These factors make numerous suggestions about how to design systems, and thissection can only note a few for some common systems. For distributed users, likethose on YouTube, these factors suggest that it is possible to encourage
8.3 Factors Affecting Team Performance 243

participation by helping the site seem smaller, perhaps by creating local regionslike in Yelp where you search by a town or area. It is directly helpful to havefriends identify each other on the site for mutual support; even to make moderateposts might need encouragement, and attempts to provide appropriate distancebetween people, both increasing it by calling someone Dr. Ritter, and decreasing itby calling him Frank. Allowing people to moderate interaction in online forums(moderators) as legitimate authority figures will help encourage pro-socialbehavior. Finally, making the goal attractive and noting the goal, payoffs, andvalue will help people choose to interact.
For collaboration at a distance, as an aspect of system design that will not goaway, these factors remain very important too. Each of these factors will help suchgroups work together. Not directly mentioned, but influenced by all these factors,is trust, and space and time are important factors, being able to meet face to face,in the same place at the same time will, according to these theories, encourageparticipation, as does the trust across interactions.
8.3.12 Summary
Successful team performance depends on the social context in which the team willoperate. This social context is defined by a wide range of factors. The relativeweights of these factors and how they should be balanced will vary across systemsand settings. Where differences exist between theories in this area they often arisefrom different assumptions about the teams, their contexts, and the things that canbe changed. In general, teams (1) that are more cohesive, (2) who have workedtogether longer, and (3) who share more values, will perform better and be morelikely to achieve their collective goals. When you design your system you shouldtry to support the factors that enable cohesion and the sharing of values. Youshould also consider whether there are ways in which you can support new teammembers to bring them up to speed as quickly as possible.
8.4 Factors Affecting Performance in Community Settings
Having considered the factors that affect performance (and behavior) in teamsettings, it is also important to take a brief look at what happens in less structuredsettings. There are an increasing number of communities developing (more or less)organically online. Sites such as Yelp, lastminute.com, YouTube, Tripadvisor, andEpicurious now support self-reported consumer ratings, and some comprise onlyuser-generated content. In addition, there is an increasing number of open sourcecommunities in a wide range of areas: for software development (e.g., Linux), forknowledge (e.g., Wikipedia), for stock photography (e.g., Open Stock Photogra-phy), and for music (e.g., Open Source Music).
244 8 Social: Social Cognition and Teamwork

Pink (2009) notes that many organizations still use extrinsic motivation theory,and argues that this approach frequently violates what psychological science istelling us. He suggests that what motivates people to participate without paymentin these activities and communities is intrinsic motivation, noting that it is moreimportant than extrinsic motivation for many tasks. It is not the perfect panacea,however, and he provides several counter examples of tasks where intrinsicmotivation either fails or is not possible.
In community settings, many people get involved in their own time, and withoutany form of payment. In many ways, although they comprise a community, theirmotivation is invariably individualistic. These people are intrinsically motivated bythe drives of autonomy, mastery, and purpose, as noted in Chap. 4. The tasks thatthey are doing are intrinsically rewarding, so people should not be given extrinsicrewards for doing them. The intrinsic drives need to be supported through providingfeedback (positive and negative to help with mastery), and now-that rewards whichonly occasionally happen. These should not be monetary in order to minimize thelikelihood of discouraging or discounting the user’s intrinsic motivations to performthe task. The rewards might provide further autonomy, notes, and recognition aboutmastery, or emphasize the purpose that was served. Alternatively, make anyextrinsic rewards a token: many $1 payments for patents get framed and saved, forexample, in recognition of a job well done.
8.5 Implications for System Design
Teamwork is highly dependent on communication and collaboration. The teamwill often need to share information, for example, so that team members can use itto make individual and collective decisions. It is therefore important that yoursystem supports both communication—of both information and outcomes—andcollaboration. This may require the use of tools and technologies that are not aninherent part of your designed system, such as video communication. We usedSkype as well as email during the writing of this book, for example, to allow thethree authors in three different time zones to communicate and share ideas bothsynchronously and asynchronously.
Group decision making aids typically incorporate features to reduce bad effectsand increase good effects of group decision making. These features often include abrain storming session, and anonymizing users counter the effects of hierarchy(organizational power) so that more ideas can be generated without the leaderexplicitly or implicitly affecting what people are willing to say.
As we have noted throughout the chapters in this book, most systems nowadaysare socio-technical systems. In other words, there is a social system that needs to beconsidered because the technology and the social system will be interdependent andinteract. If you do not spend time and effort understanding the existing social system,you run the risk of adversely affecting it. For example, if staff have to spend moretime on maintaining and interacting directly with the new technology rather than on
8.4 Factors Affecting Performance in Community Settings 245

the tasks they need to perform, or on communicating plans and results, this will havea detrimental effect on the work processes and outcomes. Ultimately, staff maysimply stop using the new technology because it gets in the way of them doing theirjob.
You should try to design your system in such a way that it minimizes thepossibility of diffusion of social responsibility. Things that enable diffusion includegetting aggregate rather than individual inputs, allowing people to be anonymous,and setting goals where no specific person is invited to contribute. Techniques thatare widely used to help avoid diffusion of responsibility include providing rep-resentations of the people involved that can be seen by other users, by allowingreputations to be built according to system usage and expertise, and by making anyrequests for assistance appear more directed to individuals than to a group.
The attribution of causality suggests that responsibility can be moderated.Partly this has to be done by the user, but the breakout box on email suggests thatemail systems might be more apologetic and clear about what went wrong, andemail systems are getting better about noting how and why mail was not delivered.This knowledge can help the sender understand why the receiver might or mightnot receive an email. Similar effects and results can be imagined for phone calls,text messages, and IMs.
If you are designing a very large system, of the scale of Yelp, for example, youmay want to encourage participation by helping the users perceive the system asbeing smaller than it really is. To avoid overwhelming the user, Yelp does this bycreating local regions where you search by town or area. It can also be helpful tohave friendly faces available in the system to provide mutual support, and toprovide moderators (in areas like online forums) as legitimate authority figures tohelp encourage pro-social behavior. You may also need to think about how youprovide the appropriate social distance between people using the system (e.g.,increasing it by using formal titles, such as Dr. Smith, or reducing it by using firstnames such as John, or even nicknames).
You will need to think about how and why people are motivated to use yoursystem to carry out their particular tasks. Do they use it because they have to (arethey paid to use it to do their job, for example)? Or do they use it because theywant to use it (the classic example here being social networking systems)? Is theirmotivation extrinsic or intrinsic? That is, are they self-motivated because of theirown interest, or because they will get a reward from an external source for doingit? Even in the case of developing a social networking system, there may be a needfor extrinsic motivation to make sure that people keep the system active by pro-viding new content, although the rewards for doing this may not be financial. Youcould highlight how the system increases their mastery, gives them autonomy, andincreases the importance of doing the task. The balance between motivations maynot always be clear cut. Some learning tasks, for example, will require a coachwho sets tasks (which may be necessary, but are not necessarily intrinsicallyrewarding) for people to complete as part of their learning experience. Any rewardstructure for task performance needs to be appropriately aligned to teams and toindividuals. If the rewards are targeted at individuals, and individual performance,
246 8 Social: Social Cognition and Teamwork

for example, then the likelihood is that the team members will behave asindividuals.
In addition to the team level issues, you may also need to think about orga-nizational issues (sometimes referred to as the blunt end of a system, as noted inChap. 10). If an organization has procedures in place for how a particular job hasto be done, for example, then you will need to think about whether these proce-dures will have to be changed. If the procedures are imposed by a regulatoryauthority (as in nuclear power, for example) then you may not be able to changethose procedures, so you will have to design your system to support those pro-cedures. There can also be cultural effects (on several levels), so there may be atradition for doing a task in a particular way, which is an effect of organizationalculture; we cover this in Chap. 9.
8.6 Summary
Social factors are important. They affect the ways that teams operate, and henceaffect system performance. If you are designing systems that will be operated byteams of people, you will need to understand that the ways that teams behavecannot simply be described by generalizing from individual behavior. Care needsto be exercised when generalizing from studies of different types of teams, or fromteams doing different tasks in different contexts.
You need to use the results from studies of how teams work intelligently.Teams and their tasks will vary widely. The results probably rely on more factorsthan are reported, and the type of tasks and types of group members will influencethe results but are often assumed to apply to all groups or all tasks. So we shouldbe cautious when generalizing or overgeneralizing from existing results. Theresults about how teams work may only apply to that type of team with that type oftask, rather than all teams (larger and smaller, with different types of people)competing or working in different environments and doing more or less similartasks. This reflects Clark’s (1973) concern about overgeneralization in languageresearch. He noted that it was difficult, and even inappropriate to generalize from afew nouns and verbs to all nouns and verbs—they come from different languages,take different parts of speech as helpers, have different frequencies, and can beradically different in many dimensions—as well as for teams and tasks..
In addition to understanding how teams make decisions and take actions, thefactors that influence team performance are important. In particular, the socialcontext of the team your system will support needs to be understood. Often thiscontext will not be static, but will change over time, so you need to understandhow and when the various factors that define the social context can change.
There are many examples of how a failure to give appropriate consideration tothe social aspects of systems has led to accidents. Casey (1998) notes severalincluding disasters with the Space Shuttle program because they ignored social andpolitical aspects (Starbuck and Farjoun 2005; Vaughan 1997).
8.5 Implications for System Design 247

8.7 Other Resources
There are a number of general texts about social factors in collaboration andteamwork that are worth reading if you wish to know more about this area. Wehave cited some in the main body of the chapter (e.g., Ellison 2004; Hinds andKiesler 2002; Olson and Olson 2008) but there are many more. See, for example,Intellectual teamwork: social and technological foundations of cooperative workedited by Galegher, Kraut, and Egido (1990, Hillsdale, NJ: Erlbaum).
There is an extensive literature under the titles ‘‘computer-supported coopera-tive work’’ (CSCW) and ‘‘computer mediated communication’’ (CMC) wheremany of the topics we have covered are elaborated in more detail. Conference andjournal publications in this area will provide more information and more currentinformation. There are also a number of initiatives in trying to build systems thatare smart about how people collaborate, employing computational agents to brokerwork task accomplishment in teams. See, for example, chapters in Ye and Chur-chill (eds.) (2003). Agent supported cooperative work. Boston, MA: Kluwer.
If you are interested in how to design teams, rather than just how to designsystems to support team performance, Vicente (1999) presents a useful approach.He argues for laying out all the tasks that the team will do, effectively a taskanalysis writ large. Then you group the tasks so that there are natural breaksbetween sets of tasks, taking into account communication and how tasks interact.He argues that this leads to better team performance because the tasks are morenaturally divided.
Work by Judy and Gary Olson are particularly relevant here. They have studiedhow computer-supported communication changes how teams work, and providesome design advice about how to support teams in such projects:
Olson, G. M., & Olson, J. S. (2007). Groupware and computer supported cooperativework. In J. J. Jacko & A. Sears (Eds.), Handbook of human-computer interaction (2ndEd.). Mahwah, NJ: Erlbaum.
Olson, G. M., & Olson, J. S. (2003). Mitigating the effects of distance on collaborativeintellectual work. Economics of Innovation and New Technologies, 12, 27–42.
8.8 Exercises
8.1 Look through the list of the ways that email has gone awry, See how manyexamples you can find of (a) diffusion of social responsibility, (b) pluralisticignorance, (c) attribution errors, and (d) majority/minority effects.
8.2 Imagine you are working on a project where the team is distributed acrossthree locations, all in different time zones. You have been asked to identifyvideoconferencing tools that can be used to carry out monthly progressmeetings and to select the best one for the job. List the factors that you woulduse to inform your decision, and explain why they are important.
248 8 Social: Social Cognition and Teamwork

8.3 You are managing a soccer team, where daily training routines are partlydetermined by the combination of the players’ individual circumstances. Theplayers are asked to record their weight, calorie intake, and exercises eachmorning using an app on their smartphone. Explain how you would motivatethe players to provide this data every day before setting off for the trainingground.
8.4 Choose an online, social web site, such as Facebook, YouTube, or Yelp.Sketch several tasks that can be done by users with the site. Describe theintrinsic and extrinsic motivation(s) for users to perform those tasks. Do thesame for an online course site, and for an online game. Note at least fourinsights that arise from doing this analysis.
8.5 Consider the organization where you currently work (or are a student). Try toidentify at least two people within that organization who are simultaneouslymembers of several teams, and explain where the boundaries occur thatdelineate those teams.
8.6 Find a game that is designed to help someone learn a complex skill, such asWorld of Warcraft. Examine what components of that game are trainingindividual skills and what are training social skills. Also, note if the game hascollaborative or competitive or educational elements across learners.
8.7 Consider how forming, storming, norming, and performing can be donewithout technology and with technology for group class projects. Considerhow these processes are done and could be done better in the workplace.
8.8 Generate a job description with at least eight activities for an office job wheretelecommuting occurs (e.g., sales, professor, management, software engineer,student). Discuss how technology might replace or support doing each taskand note how many of these tasks can and cannot be performed remotely andwhat social activities are included. Using this analysis, provide suggestions forteleworkers.
References
Abelson, R. P., Frey, K. P., & Gregg, A. P. (2004). Experiments with people: Revelations fromsocial psychology. Mahwah, NJ: Erlbaum.
Bales, R. F., & Borgatta, E. F. (1955). Size of group as a factor in the interaction profile. In A.P. Hare, E. F. Borgatta, & R. F. Bales (Eds.), Small groups: Studies in social interaction (pp.495–512). Toronto: Random House.
Bales, R. F., Strodtbeck, F. L., Mills, T. M., & Roseborough, M. E. (1951). Channels ofcommunication in small groups. American Sociological Review, 16, 461–468.
Bateson, N. (1966). Familiarization, group discussion and risk taking. Journal of ExperimentalSocial Psychology, 2, 119–129.
Benenson, J. F., Gordon, A. J., & Roy, R. (2000). Children’s evaluative appraisals of competitionin tetrads versus dyads. Small Group Research, 31(6), 635–652.
Birnbaum, R. (1988). How colleges work. San Francisco: Jossey-Bass.Bly, S., & Churchill, E. F. (1999). Design through matchmaking: Technology in search of users.
Interactions, 6(2), 23–31.Bogardus, E. S. (1933). A social distance scale. Sociology and Social Research, 17, 265–271.
8.8 Exercises 249

Bogardus, E. S. (1967). A forty year racial distance study. Los Angeles: University of SouthernCalifornia.
Booher, H. R., & Minninger, J. (2003). Human systems integration in army systems acquisition.In H. R. Booher (Ed.), Handbook of human systems integration (pp. 663–698). Hoboken, NJ:Wiley.
Brooks, F. P. (1975). The mythical man-month: Essays on software engineering. Reading, MA:Addison-Wesley.
Byrne, D. (1971). The attraction paradigm. New York, NY: Academic Press.Cannon, W. B. (1932). The wisdom of the body. New York, NY: Norton.Caplan, G. (1974). Support systems and community mental health: Lectures on concept
development. New York: Behavioral Publications.Carley, K. M. (1992). Organizational learning and personnel turnover. Organizational Science,
3(1), 20–46.Carley, K. M., & Hill, V. (2001). Structural change and learning within organizations. In A. Lomi
& E. R. Larsen (Eds.), Dynamics of organizations: Computational modeling and organiza-tional theories (pp. Ch. 2. pp. 63–92). Live Oak: MIT Press/AAAI Press.
Cartwright, D. (1968). The nature of group cohesiveness. In D. Cartwright & A. Zander (Eds.),Group dynamics: Research and theory (pp. 91–118). New York, NY: Harper & Row.
Casey, S. M. (1998). Set phasers on stun: And other true tales of design, technology, and humanerror. Santa Barbara, CA: Aegean.
Chekroun, P., & Brauer, M. (2002). The bystander effect and social control behavior: The effectof the presence of others on people’s reactions to norm violations. European Journal of SocialPsychology, 32(6), 853–867.
Churchill, E. F., & Bly, S. (2000). Culture vultures: Considering culture and communication invirtual environments. SIG Group Bulletin, 21(1), 6–11.
Churchill, E. F., Trevor, J., Bly, S., Nelson, L., & Cubranic, D. (2000). Anchored conversations.Chatting in the context of a document. In CHI 2000 Conference Proceedings (pp. 454–461).New York, NY: ACM Press.
Cialdini, R. B., Reno, R. R., & Kallgren, C. A. (1990). Focus theory of normative conduct:Recycling the concept of norms to reduce littering in public places. Journal of Personality andSocial Psychology, 58(6), 1015–1026.
Clark, H. H. (1973). The language-as-fixed-effect fallacy: A critique of language statistics inpsychological research. Journal of Verbal Learning and Verbal Behavior, 12, 335–359.
Clark, H. H., & Wilkes-Gibbs, D. (1986). Referring as a collaborative process. Cognition, 22,1–39.
Cobb, S. (1976). Social support as a moderator of life stress. Psychosomatic Medicine,38(5),300–314.
Collins, B. E., & Guetzkow, H. (1964). A social psychology of group processes for decision-making. New York, NY: Wiley.
Collins, R. (2008). Violence: A micro-sociological theory. Princeton, NJ: Princeton UniversityPress.
Darley, J. M., & Batson, C. D. (1973). ‘‘From Jerusalem to Jericho’’: A study of situational anddispositional variables in helping behavior. Journal of Personality and Social Psychology, 27,100–108.
Dinter, E. (1985). Hero or coward: Pressures facing the soldier in battle. Totowa, NJ: Frank Cassand Company Limited.
Ellison, N. B. (2004). Telework and social change: How technology is reshaping the boundariesbetween home and work. Westport, CT: Praeger.
Epley, S. W. (1974). Reduction of the behavioral effects of aversive stimulation by the presenceof companions. Psychological Bulletin, 81(5), 271–283.
Ethington, P. J. (1997). The intellectual construction of ‘‘social distance’’: Toward a recovery ofGeorg Simmel’s social geometry. Cybergeo: European Journal of Geography, 30. http://cybergeo.revues.org/index227.html
250 8 Social: Social Cognition and Teamwork

Eveland, W, Jr, Nathanson, A. I., Detenber, B. H., & McLeod, D. M. (1999). Rethinking thesocial distance corollary: Perceived likelihood of exposure and the third-person perception.Communication Research, 26(3), 275–302.
Festinger, L. (1954). A theory of social comparison processes. Human Relations, 7(2), 117–140.Frank, J. D. (1944). Experimental studies of personal pressure and resistance: I. Experimental
production of resistance. Journal of General Psychology, 30, 23–41.Ginges, J., & Eyal, S. (2009). Psychological distance, group size and intergroup relations. In
Proceedings of the 32nd International Society of Political Psychology (pp. 51–65). Dublin,Ireland: ISSP.
Granovetter, M. (1973). The strength of weak ties. American Journal of Sociology, 78,1360–1380.
Grossman, D. (1996). On killing: The psychological cost of learning to kill in war and society.New York: Back Bay Books, Little Brown and Company.
Haney, C., Banks, W. C., & Zimbardo, P. G. (1973). Study of prisoners and guards in a simulatedprison. Washington, DC: Office of Naval Research (ONR).
Hare, A. P. (1952). A study of interaction and consensus in different sized groups. AmericanSociological Review, 17, 261–267.
Harrison, D. A., Price, K. H., & Bell, M. P. (1998). Beyond relational demography: Time and theeffects of surface and deep level diversity on work group cohesion. The Academy ofManagement Journal, 41(1), 96–107.
Heath, C., & Luff, P. (2000). Technology in action. Cambridge, UK: Cambridge University Press.Hinds, P., & Kiesler, S. (Eds.). (2002). Distributed work. Cambridge, MA: MIT Press.Hollnagel, E. (2007). Flight decks and free flight: Where are the system boundaries? Applied
Ergonomics, 38(4), 409–416.Jones, E. E., Kanouse, D. E., Kelley, H. H., Nisbett, R. E., Valins, S., & Weiner, B. (1971/1972).
Attribution: Perceiving the causes of behavior. New York: General Learning Press.Kanki, B., Helmreich, R. L., & Arca, J. (Eds.). (2010). Crew resource management (2nd ed.).
London, UK: Academic Press.Keltner, D., & Marsh, J. (2006–2007). We are all bystanders. Greater Good, 3(2). http://
greatergood.berkeley.edu/greatergood/archive/2006fallwinter/keltnermarsh.htmlKozlowski, S. W. J., & Ilgen, D. R. (2006). Enhancing the effectiveness of work groups and
teams. Psychological Science in the Public Interest, 7(3), 77–124.Kraut, R. E., Egido, C., & Galegher, J. (1990). Patterns of contact and communication in
scientific research collaborations In J. Galegher, R. E. Kraut, & C. Egido (Eds.), Intellectualteamwork: Social and technological foundations of cooperative work (pp. 149–171).Hillsdale, NJ: Erlbaum.
Lazarus, R. S., & Folkman, S. (1984). Stress, appraisal and coping. New York: SpringerPublishing.
Liska, A. E. (1997). Modeling the relationships between macro forms of social control. AnnualReview of Sociology, 23(1), 39–61.
Mannix, E., & Neale, M. A. (2005). What differences make a difference? The promise and realityof diverse teams in organizations. Psychological Science in the Public Interest, 6(2), 31–55.
McCauley, C. (1989). The nature of social influence in groupthink: Compliance andinternalization. Journal of Personality and Social Psychology, 57, 250–260.
McGrath, J. E. (1984). Groups: Interaction and process. Englewood Cliffs, NJ: Prentice-Hall.McNeese, M. D. (2000). Socio-cognitive factors in the acquisition and transfer of knowledge.
Cognition, Technology and Work, 2, 164–177.Milgram, S. (1963). Behavioral study of obedience. Journal of Abnormal and Social Psychology,
67(4), 371–378.Milliken, F. J., & Martins, L. L. (1996). Searching for common threads: Understanding the
multiple effects of diversity in organizational groups. Academy of Management Journal, 25,598–606.
References 251

Morgan, J. H., Morgan, G. P., & Ritter, F. E. (2010). A preliminary model of participation forsmall groups. Computational and Mathematical Organization Science, 16, 246–270.
Newcomb, T. M. (1961). The acquaintance process. New York: Holt, Rinehart, & Winston.O’Reilly, C. A, I. I. I., Caldwell, D. F., & Barnett, W. P. (1989). Work group demography, social
integration, and turnover. Administrative Science Quarterly, 34, 21–37.Olson, G. M., & Olson, J. S. (2000). Distance matters. Human–Computer Interaction, 15,
139–179.Olson, G. M., & Olson, J. S. (2008). Computer-supported cooperative work. New York: Wiley.Park, R. E. (1924). The concept of social distance as applied to the study of racial attitudes and
racial relations. Journal of Applied Sociology, 8, 339–344.Perloff, R. M. (1993). Third-person effect research 1983–1992: A review and synthesis.
International Journal of Public Opinion Research, 5, 167–184.Pink, D. H. (2009). Drive. New York: Riverhead Books.Ross, L., Amabile, T. M., & Steinmetz, J. L. (1977). Social roles, social control, and biases in
social-perception processes. Journal of Personality and Social Psychology, 35, 485–494.Salas, E., Priest, H. A., & Burke, C. S. (2005). Teamwork and team performance measurement. In
J. Wilson & N. Corlett (Eds.), Evaluation of human work (3rd ed., pp. 793–808). Boca Raton,FL: CRC Press.
Salas, E., Wilson, K. A., Burke, C. S., & Bowers, C. A. (2002). Myths about crew resourcetraining. Ergonomics in Design, 10(4), 21–24.
Sandler, I. R., & Lakey, B. (1982). Locus of control as a stress moderator: The role of controlperceptions and social support. American Community Journal of Psychology, 10(1), 65–80.
Seely Brown, J., & Duguid, P. (1991). Organizational learning and communities-of-practice:Toward a unified view of working, learning and innovation. Organization Science, 2(1),40–57.
Shalit, B. (1988). The psychology of conflict and combat. New York: Praeger Publishers.Sheridan, T. B., & Ferrell, W. R. (1974). Man–machine systems: Information, control, and
decision models of human performance. Cambridge, MA: MIT Press.Smith, E. R., & Mackie, D. M. (1995). Social psychology. New York: Worth Publishers.Starbuck, W. H., & Farjoun, M. (Eds.). (2005). Organization at the limit: Lessons from the
Columbia disaster. Malden, MA: Blackwell Publishing.Stoner, J. A. F. (1968). Risky and cautious shifts in group decisions: The influence of widely held
values. Journal of Experimental Social Psychology, 4, 442–459.Terborg, J. R., Castore, C., & DeNinno, J. A. (1976). A longitudinal field investigation of the
impact of group composition on group performance and cohesion. Journal of Personality andSocial Psychology, 34, 782–790.
Turban, D. B., & Jones, A. P. (1988). Supervisor-subordinate similarity: Types, effects, andmechanisms. Journal of Applied Psychology, 73, 228–234.
Vaughan, D. (1997). The Challenger launch decision: Risky technology, culture, and deviance atNASAw. Chicago: University of Chicago Press.
Vicente, K. (1999). Cognitive work analysis. Mahwah, NJ: Erlbaum.Wallach, M. A., Kogan, N., & Bem, D. J. (1964). Diffusion of responsibility and level of risk
taking in groups. Journal of Abnormal and Social Psychology, 68, 263–274.Westie, F. R., & Westie, M. L. (1956). The social-distance pyramid: Relationships between caste
and class. American Journal of Sociology, 63, 190–196.Wetherell, C., Plakans, A., & Wellman, B. (1994). Networks, neighborhoods, and communities:
Approaches to the study of the community question. Urban Affairs Quarterly, 14(3), 363–390.Wiener, E., Kanki, B., & Helmreich, R. L. (Eds.). (1993). Cockpit Resource Management.
London, UK: Academic Press.
252 8 Social: Social Cognition and Teamwork

Chapter 9Social: Theories and Models
Abstract In the previous chapter we introduced concepts related to teams andteamwork. This chapter provides concepts for analyzing, interpreting, and modelinghow teams work. We turn to models of social communication and coordination thathave gained prominence as we think about people in technical and social networksand at higher levels of organization. This chapter introduces some of the manyconcepts, theories, and results related to social processes that can influence systemdesign, and also notes how to model social processes for use as theories and forapplications.
9.1 Introduction
As distributed, networked computing systems have become increasingly part ofour everyday lives, new models for understanding group and team communicationhave arisen. Kang (2000, p. 1150) has noted that for the Internet, at least, the killerapp is other people. It is certainly the case that our understanding of human–humaninteraction has evolved since the introduction of rich media connections. In partthis is due to the fact that so many new forms of interaction have arisen since thedevelopment of the Internet. Thirty years ago, the idea that we would be able tovideoconference in real time with colleagues and friends on the other side of theplanet from a mobile phone was considered science fiction. Now it is a frequent ifnot commonplace occurrence.
In addition to making use of these innovations, we are also able to mine andanalyze behavioral data at fine-grained levels of detail. All transactions online canbe recorded and studied for interaction patterns at various levels of abstraction.Studies have combined observational and logged, transaction and activity data tolook at email use in organizations (e.g., Desanctis and Monge 1998) and acrossnational and cultural boundaries (Rutkowski et al. 2002), to study the use of text-based virtual environments for work coordination and collaboration (Churchill andBly 1999), to consider how graphical virtual environments enable collaborative
F. E. Ritter et al., Foundations for Designing User-Centered Systems,DOI: 10.1007/978-1-4471-5134-0_9, � Springer-Verlag London 2014
253

activity (Fig. 9.1; also see Churchill et al. 2001), to address how real-time ren-dering and manipulation of data visualizations affect mediated collaborations(Snowdon et al. 2003), and to understand more deeply the impact of networkedmobile devices on ongoing work and recreational practices (e.g., Brown et al.2001). Research is turning to consideration of how tools like LinkedIn, Facebook,and Twitter play into organizational information sharing (e.g., Zhao and Rosson2009), and how enterprises are using their own internal bookmark sharing tools tofoster deeper collaboration between their staff (e.g., Millen et al. 2006).
Figure 9.2 reminds us that social aspects of systems, like other aspects ofinterfaces noted earlier, do not guarantee success. They are just another factor toconsider—another cause of risks, or another way to ameliorate risks in systems.
In this chapter we complement content in Chap. 8, introducing concepts, the-ory, and data related to social aspects of face-to-face and mediated communicationand collaboration in our current world of pervasive, networked connectivity.
9.2 Analyzing How People Work Together
9.2.1 Introduction
As discussed in Chap. 8, people work together in different ways. Ideally you wantthem to collaborate and cooperate to carry out any shared tasks that they may have.When designing a system this means that you want to support collaboration andcooperation where it is appropriate, and avoid having people spend time inter-acting with the system when they should be more concerned with carrying out thetask at hand. It is, therefore, important to understand how people collaborate andcooperate.
There are several ways in which social interactions can be analyzed. Here weconsider three types of analysis that are quite widely used. The first type is fairlyinformal and is often used to analyze pairwise interactions, as happens in con-versation, for example. The second analyzes interactions in terms of costs andbenefits, and is sometimes described as a payoff approach. The third involvesapplying network theory to emphasize the inter-relationships between actorsacross interactions.
9.2.2 Informal, Pairwise Analyses
The simplest way of analyzing social interactions is fairly informal. It simply notesresults and regularities that appear in social behavior. This is a type of frameworkin that it provides some common terms across analyses, and some basicassumptions, but does not provide or require that the results across analyses fit
254 9 Social: Theories and Models

together, and it is not organized on a higher level. This level of analysis is oftenused to look at how pairs of actors interact in a local manner, for example, duringconversation and turn-taking in conversation. The framework varies widelybetween researchers, and is not extensively covered here because it varies sowidely and is difficult to build a model from. However, it is often used, andprovides some insights to help build systems.
Fig. 9.1 View of an author’s avatar in second life watching another avatar give a talk to a liveaudience that was also broadcast into second life. This set-up, which was used to support remoteviewing at a workshop on social modeling, shows how social interactions can occursimultaneously at multiple levels
Fig. 9.2 Including socialaspects in your computerapplication (i.e., Zune),however, does not guaranteesuccess compared to systemswith less social aspects.(Photo taken at Circuit City inFebruary 2009, as CircuitCity was having a going-out-of-business sale)
9.2 Analyzing How People Work Together 255

When people work together on a one-to-one basis (in dyads or pairs), the waythey communicate can be understood using techniques such as conversationanalysis and linguistic analyses of the creation of a shared model or commonground (e.g., Clark and Brennan 1991a, b; Gottman et al. 2005; Sacks 1992; tenHave 1999). The notion of common ground also applies to communication amonglarger groups.
If you analyze how people talk to one another you will quickly see that it is rarefor them to speak in full sentences and to always wait politely for the other personto finish before starting to speak themselves. The overall aim of this level ofanalysis is usually to generate a shared mutual understanding of the situation athand. This can provide insights of how to support computer-supported commu-nication (see, for example, Brennan 1998). For example, if the length of a pause inconversation is 1s, then if there are lags in the network approaching 1s, some userswill start talking too soon (Ruhleder and Jordan 1999). If the task is computer-based (or at least requires information from the system), you will need to under-stand what sort of information is needed and used, and present it in such a way thatit helps to facilitate a shared mental model of the situation between those com-municating. Conversational analysis and the concept of common ground also areuseful for analyzing larger groups.
9.2.3 Exchange Costs and Benefits
The second type of analysis involves looking at the costs and benefits of socialinteractions, a so-called payoff approach. In this approach, each interaction hasassociated with it a cost, a benefit (sometimes called a payoff), or both. Work ingame theory will often lump costs and benefits together and call them payoffs. Thisapproach has been used in many fields, but it is probably most closely associatedwith economics where it is extensively used (e.g., Levitt and Dubner 2005).
There are situations where people who are supposed to work together to achievea particular goal, or perform a particular task, do not do so. Instead, they may pursueindividual goals and decide what is best for themselves on the basis of the costs andbenefits involved. In many cases, the payoffs are not financial rewards, but can bethings like improved social status, for example, which is how companies enticepeople to provide useful content for their internal social networking applications.
The problems that can arise when people pursue individual goals (and payoffs)are highlighted by the classical Prisoner’s Dilemma (PD) problem (Axelrod 1984).The central dilemma is whether to think about the costs and payoffs altruistically(as they affect the pair jointly), or as they affect each prisoner individually. Youcan see the costs and payoffs by drawing a matrix for all of the actors involved,like that shown in Table 9.1 for a Prisoner’s Dilemma problem with two prisoners.
In the Prisoner’s Dilemma, two prisoners have been caught doing somethingillegal, and can either plead not guilty or plead guilty giving state’s evidence
256 9 Social: Theories and Models

against the other. These two decisions or strategies are usually called cooperate(with the other prisoner) or defect (on the other prisoner). The payoff if the twoprisoners cooperate with each other and plead not-guilty is that they both go toprison for 1 year. If one prisoner defects and testifies against the other, they walkfree but the other prisoner serves 10 years. If both prisoners defect, they share thefull blame and get 8 years each.
Where there are costs and benefits involved in carrying out shared tasks, thecosts should be kept as low as possible (not necessarily minimized), and thebenefits should be kept as high as possible (not necessarily maximized). In anytrade-off the benefits should be designed to outweigh the costs. If you think ofonline file sharing and email, for example, these have both radically reduced thecosts of sharing information, sometimes with unanticipated effects, such as toomuch sharing.
Using a payoff matrix approach can be helpful in representing tasks wheresocial interaction is involved, even if there is no dilemma involved. Thus a matrixcan be used to show the payoff for asking questions in class, for responding toemails, and so on. The payoff matrix approach can be applied to situations thatinvolved more than two strategies, more payoffs, and more players, although itbecomes harder to draw the matrix as the numbers involved increase. You shouldalso note that the players do not need to have equivalent payoffs: for example, thepayoffs for teachers and for students in a class are different.
Note that some matrices do not have a single best choice (when there is a stablechoice that maximizes the payoff for both parties, it is known as a Nash equilib-rium point). If you have played Paper Rock Scissors, you know that paper coversrock, that rock breaks scissors, and that scissors cuts paper—there is not a choicethat beats all the others. Similarly, if you play video games, you can create payoffmatrices for different pieces playing against each other, for example, in Commandand Conquer, for tanks vs tanks, tanks vs infantry, and tanks vs planes, etc. In eachcase, there may not be a dominant decision or choice that is better than all others.
Axelrod (1984) studied what happens when the PD game is played multipletimes, also called an iterated Prisoner’s Dilemma game. When the game is playedrepeatedly there is a chance for cooperation to emerge. If you defect early, yourcolleague may stop trusting you. If you cooperate longer, some opponents may notdefect. If the game is ongoing, the promise of cooperation with a positive payoff
Table 9.1 A typical prisoner’s dilemma payoff matrix
Prisoner 1 Prisoner 2
Cooperate(with prisoner 1)
Defect(on prisoner 1)
Cooperate (with prisoner 2) Both prisoners get 1 yearin jail
10 years for prisoner 1Prisoner 2 goes free
Defect (on prisoner 2) 10 years for prisoner 2Prisoner 1 goes free
Both prisoners get 8 years in jail
9.2 Analyzing How People Work Together 257

for cooperation can lead to the best behavior for both participants. Overall,Axelrod found that a very good—and perhaps the best—strategy was to play tit-for-tat, which involves starting by cooperating, then if an opponent defects, youdefect once, and then cooperate again.
There are several practical suggestions for improving social situations arisingout of Axelrod’s work. These suggestions, some of which are noted in Table 9.2,can be applied to system design, and you can see them play out on eBay, onYouTube, and in Second Life. These suggestions apply to teamwork across a widerange of domains. When they are applied across companies, however, they cangive rise to cartels and price fixing.
One thing that you will need to consider when designing systems that supportteamworking is that it will often take time for people to learn how to worktogether. In other words, the strategies that they start with may change over time asthey learn how each other operates, and how they can work together to perform thetask at hand. In repeated iterations of the Prisoner’s Dilemma game, for example,Axelrod (1984) found that people can move towards a strategy of mutual coop-eration over time. So you should try to support cooperation, and Axelrod suggestedfive ways in which this can be achieved, as shown in Table 9.3.
These suggestions apply to many situations, including classrooms, work envi-ronments (including knowledge sharing tools), web site maintenance, onlineauction sites, and public discussion forums.
To enlarge the shadow of the future you need to have people look beyond thecurrent iteration of the task. They need to see that there is a bigger picture in thatthere may be higher level, longer term goals that need to be achieved, and that this
Table 9.2 Suggestions for how to do well in iterated PD games (Axelrod 1984)
1. Do not be envious: if you are envious in a situation where the payoffs are not symmetrical—theother player gains more when you both cooperate—you may be tempted to defect, but indoing so you may hurt yourself as well as the other player
2. Do not be the first to defect: this will allow you the chance to make a series of cooperative turns3. Reciprocate both cooperation and defection: if the other person is choosing to defect and to
cooperate, modifying your strategies reminds them of the potential payoff, and encouragesthem to choose a long-term strategy
4. Do not be too clever: you may be tempted to defect more often to take a little payoff now andthen. This may be possible in some games against some players, but Axelrod showed that thisstrategy rarely ever works. In the real world, it appears to work sometimes, but often it does not
Table 9.3 Suggestions for how to promote cooperation between actors (Axelrod 1984)
1. Enlarge the shadow of the future2. Change the payoffs3. Teach people to care about each other4. Teach reciprocity5. Improve recognition abilities
258 9 Social: Theories and Models

task will be repeated, usually by the same people. This should help to change theperspective of the team members from one that may be initially oriented towardscompetition to one that supports cooperation.
The second suggestion, change the payoffs, is perhaps the easiest to influence.In the case of online communities this can be done by noting which peoplecontribute the most. The form of the payoffs needs to be carefully worked out.They need not necessarily be financial. In social networks, prestige and recognition(which raise an individual’s perceived status) are often valued more highly asrewards than monetary incentives.
To teach people to care about each other requires including other people’spayoffs in your own matrix. This may be purely altruistic, when team memberscare about other team members. In some cases, such as the prisoner’s dilemma,other people’s payoffs may influence your own payoff (positively or negatively).
The fourth suggestion is to teach reciprocity. Participants should be taught touse tit-for-tat strategies. In social situations some people will always adopt astraight cooperation strategy, whilst others will adopt a defection strategy. Havingsome participants play tit-for-tat (reciprocity) and change strategy based on whatothers do helps to police the environment and protect those who cannot or will notfollow a more aggressive strategy.
Finally, the need to improve recognition abilities relates to the issue of trust. Mostweb sites with forums require you to register to make comments. When you buyonline you want to know who you are interacting with. Companies, both real andonline, tell you how long they have existed, how to find and contact them, and whatorganizations they belong to (like chambers of commerce). By making themselvesmore recognizable (and establishing their credentials), others can tell who they areworking with, and can expect to find them again if they return later to the same place.
Note that cooperation is not necessarily always a good thing. In regulation, ruleenforcement, and auditing situations, for example, you do not want the inspectorsto have a long-term relationship with the party being inspected. Long-term rela-tionships in these cases lead to cooperation, not enforcement.
You should also be aware that supporting teamwork with team goals may leadto social loafing. This is where team members get a payoff based on the team’soverall performance, rather than on their individual performance. Some teammembers may decide that this means that they can achieve their payoff withoutpulling their weight and contributing as much as the other members.
All these suggestions can be used to improve social interactions in large,complex systems where social factors are at play. Consider as an example eBay.On an individual level it implements many or all of these suggestions: eBay doesnot publish the profits of individuals (it cannot, but it would not). It does notdefect; it cooperates and prosecutes (or drops sellers). It does not have a complexset of rules. On the level of its community, it encourages through its page designfuture sales. It takes steps to make the payoffs better with cooperation betweenbuyer and seller and with eBay. We do not know whether it teaches about caring
9.2 Analyzing How People Work Together 259

about one another, but eBay itself will help teach reciprocity—if you violate theirrules they will remove you from the system. And, finally, it certainly cares aboutand works towards improving the ability to recognize buyers and sellers, serving asa type of recognition for sellers.
9.2.4 Networks
Another way to analyze social interactions is by using network theory (see, forexample, Rainie et al. 2012; Watts 2003). This approach emphasizes how theactors are associated across multiple interactions, including how well connectedthey are, and who they are connected to.
People are linked to other people in many different ways. They can have familyconnections, or they may be work colleagues, for example. These relationships area type of social capital. They can be represented using networks, which can bedrawn graphically, showing people as nodes, and the relationships as links. Anexample of a network is shown in Fig. 9.3. Node 13 is the least well connected;node 14 has the most connections; nodes 6, 7, and 14 have the strongestconnections. A more complex example is included as Sect. 9.2.5. The way thatnetworks function can have some implications for the system that you aredesigning.
Leadership in networks. It is often useful to be aware of which nodes in anetwork are the most important, because all the nodes may not be equallyimportant. If you know which nodes link groups within the network, you can makeuse of them to beneficial effect. This is what advertisers attempt to do when theyplan campaigns. If they target the nodes (people, locations, etc.) which link groupstogether, this can lead to campaigns going viral, rather than just being of interest toa local group in a network. A more complex example is included in the breakoutbox explaining how connections influence work in an electronics firm.
The distance between two nodes can be calculated by identifying all the othernodes you need to pass through to get from the start node to the end node, and thenadding up all the pairwise path lengths (between the adjacent nodes). If the twonodes are important (to the operation of the network, or the organization, and soon), then you may want to make sure there is more than one way to get from thestart node to the end node, so that you can cope with failures of nodes or links. Itturns out that the number of links that you need to get from one person to anothercan be quite small. This so-called small world problem is the basis for the film TheSix Degrees of Kevin Bacon. Essentially, you know somebody who knowssomebody who… who knows somebody who knows Kevin Bacon.
The small world phenomena. Perhaps the most common idea is based onconnectivity between nodes, that is, what is the shortest path between two nodes?How many people would a letter from one person to another have to pass through,or how many introductions would you have to have to meet Brad Pitt? In acompany or even the world, what is the longest path between any two people?
260 9 Social: Theories and Models

Mathematically, this problem is well defined. The answer is the maximumlength of a path between every pair of nodes in a network. A more completeanswer is the distribution of path lengths, that is, what are all the paths lengths forthe network. Some networks, linearly connected, would have the longest average.These would be like telegraph stations in the old west. Networks that are com-pletely connected, where every node knows every other node, like a grade schoolclassroom, would have a maximum length of 1. Unconnected nodes would haveeither an undefined answer or infinity as their path length. If you were looking atthis in a more applied context, you might also examine the cost of the links (e.g.,the distance between people, and how much information can pass between them).
This question has been studied a few times, and the answers are less clear forpeople in more interesting situations. Milgram (1967) performed the first experi-ment. In this experiment he handed out a folder to be sent to someone the initiatingagent did not know. He recorded how many people the folder passed throughbefore it reached the target. The results were reported as between two and ten, withfive as the median. The study, while intriguing, is deeply flawed. Most of thefolders were not successfully returned, but we do not really know why. It could bethat the world is large, or that the subjects were not motivated or the task was toohard. The minimum was not six, but ten, and it was a distribution. Numerousattempts have been made to duplicate this work. Later work with the real world(e.g., Travers and Milgram 1969) and with email (e.g., Dodds et al. 2003) has hadthe same problems, that of not having every package delivered (sometimes around1%). On the other hand, work with closed worlds—for example, how well sci-entific authors are connected—does not find a minimum, because there are lots ofunconnected nodes that only publish one paper. The averages, however, seem tosuggest that those that are connected are not so far apart.
What does this mean for system design? It suggests that providing referrals canbe worthwhile but not guaranteed. It suggests that most—but probably not all—people are well connected, that pairs of people who are long strings of connectionsapart are somewhat rare. It remains an interesting theory and empirical problem thatis difficult to study completely because of the difficulty in obtaining complete data.
The Dunbar number. Some people may only have a single connection (theywould have to have at least one connection to be part of a network), whilst othersmay have lots of connections. The maximum number of connections, or the largestdegree that a node can have in a social network, is called the Dunbar number
7
14
6
13Fig. 9.3 An example smallnetwork. Nodes are agents.Solid lines are solidconnections. Dashed lines areweaker connections
9.2 Analyzing How People Work Together 261

(Dunbar 1992). He related the maximum productive group size to the size of theneocortex in primates, and in reference to strong social relationships, not distant ordistal ones. The number is related to the question ‘‘how much time do you have tomaintain close social ties’’? Some of his ideas do not fully apply to the onlineworld, and some of the data he presents seem anecdotal. Further writers andresearchers have had a hard time coming to grips with the question; for example, ithas been speculated that the scientific subspecialties can’t be more than 150 sci-entists because of this effect (but this then implies that either the scientists have noother friends, or that they can handle exactly twice as many as other people!). Howdo you measure relationship strength? What counts as a strong relationship? Doesimproved communication media improve the ability to have a larger number ofties? Nevertheless, it remains a useful question, and has implications for systemdesign, and limits are being applied in some systems.
What is perhaps most important from a system design point of view is the activeconnections. In other words, the connections that are used rather than dormant. Ifyou think about Facebook, for example, some people will boast about having, say,352 Facebook friends, but when you analyze how many people they really interactwith, the number is much smaller, by a factor of between 10 and 100. If all of theFacebook friend connections were active, it would be a full time job for anindividual just to monitor their friend’s ongoing activity.
The concept of the Dunbar number provides suggestions of how many socialconnections systems should support. For example, how many email aliases shouldyou support in an email program, or how many names can be on an email alias?What are optimal sized online groups? Can a classroom of 150 students (online orin a building) be a group, or can it only be a group of groups?
9.2.5 Good Personal Social Networks Lead to Better Work1
Burt (2004) examined how well the managers in an electronics company wereconnected to other parts of the company. This work serves as a good example of whatimplications there are for and from networks for designing teams and systems tosupport them, as well as how social networks influence systems. Burt computed howconnectedness correlated with objective measures of job performance (i.e., salaryand promotions) and how well connectedness correlated with subjective measures ofperformance (i.e., job evaluations and evaluations of their ideas by supervisors).
This is a type of network analysis, in that Burt examined how the managerswere connected to groups in the company, and to whom. A summary is shown inFig. 9.4. He also used the term structural holes, which occur when two groups thatshould be connected are not. For example, if two groups working on related,
1 Umer Farooq brought this work to our attention as part of a talk by Peter Pirolli. We thankUmer and Peter for their help.
262 9 Social: Theories and Models

but different, topics should know about each other’s work, but do not, then astructural hole is said to exist. Management works hard to avoid such a lack ofconnections, but there are often more holes than management can know about andfill. (Informal connections, family connections, and company sports teams areways that such holes are sometimes filled). Figure 9.4 shows a structural holebetween groups A and C—there is no direct connection between the two groups.
Burt’s results showed the importance of social networks in work settings.Managers that were better connected (had less network constraints on havingpeople to talk with) had greater compensation, better evaluations, more promo-tions, and better ideas as judged by their peers. Some of these results are shown inFig. 9.5, which shows that being better connected (lower network constraints) ledto higher salaries and better ratings of ideas by a neutral party. Overall, beingbetter connected led to better performance in this type of job.
This work makes several suggestions. It shows the utility of social networkanalyses. It suggests that good workers will attempt to be well connected, and thatmanagers should attempt to fill in the gaps between groups.
9.2.6 Summary
This section has laid out several ways to organize social behavior, severalframeworks for organizing the information in this chapter and from later
Group A
Robert
1
32
Michael
5
4
Group C
Group B
7
8
9
10
11
12
6
13
Fig. 9.4 A picture of a network of relationships. The people are the represented by the nodes,and the relationships by the links between nodes (based on data from Burt 2004, Fig. 1,simplified)
9.2 Analyzing How People Work Together 263

readings. These frameworks use a high level of abstraction. They provide youwith a way to organize what you learn. It is also worth noting that theseframeworks need not be mutually exclusive. There are systems where multipleframeworks provide useful insights, and in any analysis of a large system both anexchange cost and a network view (or multiple network views) will beapplicable.
One example of the application of these theoretical approaches to keep in mindregarding the network representation is that a network’s value for communicationis approximately equal to the square of the number of people in the network. Atelephone system, or a social web site, with two people has only one connection.With 4 people there are 12 potential connections, and with 10 people, 90 potentialconnections. This is typically called a network effect, and applies when networksare used for communication or social interaction.
9.3 Higher Social Levels: Organizational and Cultural
There are higher social levels than small groups. These higher levels are focusedless on the user and more on the user’s context. They can influence what happensat the interface between the user and the technology, however, so we describethem, albeit briefly.
-4
-3
-2
-1
0
1
2
3
4
5
10 30 50 70 90
Inverse Connectedness to Others (computed variable)
c
1.0
1.5
2.0
2.5
3.0
3.5
10 20 30 40 50 60 70 80 90 100
Inverse Connectedness to Others
(a) (b)
Ma
na
ge
me
nt
Eva
lua
tio
n o
f Id
ea
s
Sa
lary
Re
lati
ve to
Pe
ers
Fig. 9.5 Network constraint is a measure of how large, how close, and relative ranks of amanager’s connections. Low constraint indicates a well-connected manager. a Salary versusinverse network size shows that better connected managers had higher salaries, andb Ratings of ideas versus inverse network size shows that when two senior managers wereasked to rate ideas the better connected managers had more highly rated ideas (based onBurt 2004, Fig. 4 and 5, but drawn with a spreadsheet available on the book website toexplore this topic)
264 9 Social: Theories and Models

9.3.1 Organizational Effects
Users working in teams are often part of organizations. These organizations willinfluence the team climate and provide both resources and obligations to teams.There is a separate area of research that studies how organizations work, asopposed to teams (e.g., Simon 1997).
The network structures used to describe teams can be applied again to anorganization, and indeed the figures of networks are typically scaled not for smallteams but for organizations.
The comments about small teams also apply to organizations in many ways.Organizations are better if they are made up of better people and if these peoplehave the knowledge, skills, and abilities to perform their tasks. They work better iftheir structure is adapted to the task, and so on.
As for teams, work is on going to provide computer support for organizations,perhaps even more so than for teams. It is clear that this computer support—if it isdone mindlessly or without enough knowledge of the task, task distribution, andpeople—does not always help (e.g., see examples in Landauer 1995, or notedearlier in the book). However, there remain great possibilities for supporting teamswith technology.
The way organizations work is usually heavily based on procedures that describethe way things should be done. This can be called a normative (or prescriptive)view. These procedures are invariably different from reality, which can be called adescriptive view. Many organizations have suffered disastrous effects from com-puterization of processes because the official procedures were computerized with-out recognizing that the reality was different. Often the users are not themselvesfully aware of the differences, and these can be quite extensive, and even when theyare aware they may be reluctant to tell a manager or a consultant who will bereporting back to management about the shortcuts and common procedure viola-tions. The breach of procedures may only be that procedures are written as thoughthey are performed by one person when they are, in fact, shared amongst a numberof team members—or they may be written down as though they occur at one timewithout interruption when, in fact, they are always interleaved with numerous othersimilar tasks and problem solving. It might also be the case, and you can see this foryourself, that the forms and procedures ask for extensive information, and this isroutinely not requested, not used, or does not have to be provided.
9.3.2 Cultural Effects
System behavior is the result of people interacting with technology in a context.That context includes the physical environment, as well as aspects such as theorganizational structure, the culture of that organization, and possibly even
9.3 Higher Social Levels: Organizational and Cultural 265

national cultural factors. When you are designing systems you need to study theenvironment in which the system will be deployed to make sure that it will beacceptable to the users and to reduce the risk that any assumptions or misunder-standings will lead to an unusable or unsafe system. There are numerous examplesof lessons learned in this area (e.g., Olson and Olson 2003–2004).
There is no magic bullet for avoiding these risks. There are several steps youcan take. You can study the culture and laws by visiting the environment thesystem will be in, something that is advocated by techniques such as contextualdesign (Beyer and Holtzblatt 1999). You can read about the culture or have yourown team members visit and work in the culture. You can include members of theculture in your design team. These members will not be perfect representatives,but will help avoid some problems and decrease the risk of system problems. Youcan also include time to pilot test and get feedback from users in that culture usinga spiral design process (Boehm and Hansen 2001; Pew and Mavor 2007).
9.3.3 Summary
This section reminds us that, in addition to the users and their teams, there arehigher social levels that will influence system design. These levels are important,but vary much more than users and even teams. As you start to design systems youshould also consider that differences between your understanding and the actuallevels can pose a risk to the success of your system.
You should study these levels for a system to the point where you understandwhether they pose risks and, if they do, reduce the risks through appropriateactions. Some of these may be done by changing the organization (difficult, butworthwhile where appropriate), or by changing the system to reflect the organi-zation, laws, and cultural reality.
9.4 Models of Social Processes
9.4.1 Introduction
Models of social processes can serve as more concrete theories and they also‘‘have enormous potential to resolve the problem of system-team design’’(Kozlowski and Ilgen 2006). There is a range of models of social processes thatcan be created using existing tools and methods. These range from less formalrepresentations that are not computer-supported that can help system design on theground to computer-supported models of social processes that help provide policyguidance for governments (Fan and Yen 2004). This section introduces the rangeof these models by providing examples at several levels.
266 9 Social: Theories and Models
As theories, these models provide a way to summarize behavior. That is, theyprovide a way to organize the results we have obtained about how people behavein groups into a single representation. The results can be used in system design andalso as agents in video games and simulations. As theories they also providesuggestions about what we do not know and what we would like to know. As asimple example, some of these models work with small groups, but not with largegroups. This difference suggests questions about how small and large groups workin different ways.
We start here with descriptive theories that describe in declarative terms thestructures and relationships of groups. A more complex model is a model thatdescribes not only the structures but also how the structures are created and howthey interact. We also describe two approaches to creating these models, the SoftSystems Methodology and Rich Pictures.
9.4.2 Descriptive Social Models
Descriptive models provide a description of the components of interest. These canbe grouped into static and dynamic models. Both of these have been seen earlier inthis chapter in the descriptions of networks.
9.4.2.1 Ethnographic Descriptions of Social Processes
Ethnography is studying the users in their environments, including the physicallocation and objects, who and what they interact with and how, why, and when,and what they think their interactions mean. Ethnography provides a way tosummarize and discover how social factors interact with systems. This approachthus provides a way to reduce risks to systems because it helps the designerunderstand the context of how the system will be used. It is also really important toconduct observations of people in their normal settings because it reminds us thatnot all users are like us. Notably, many Internet companies have experiencedfailures in developing social experiences because they have not taken their users’perspectives into account (Churchill 2010). Ethnographic studies can be started byreading about the culture of your users (e.g., military biographies if your users arein the military, about astronauts if they are astronauts, and about insurance claimadjusters if they are insurance claim adjusters). This work can also involvewatching users do their work, or even participating in it (e.g., Coleman 1974studied ditch digging, restaurants, and garbage men; Suchman 1983 studied officework; see also Crabtree 2003; Plowman et al. 1995; Viller and Sommerville 2000).The take-away message here is that you need to study the social situation more thefurther it is from your own background.
9.4 Models of Social Processes 267

9.4.2.2 Communities of Practice
Another way is to view a set of people working with the same topic or task andtheir social connections as a community of practice (e.g., Wenger 1998). Thesecommunities can be seen in informal, recreational situations, such as party fishingboats (personal observation), to formal work situations such as in Japaneseindustry (Nonaka and Takeuchi 1995), and the wide range in between. Work onknowledge management and knowledge management systems has similar lessonson how groups work to help each other.
This view of a community of practice encourages viewing the users as acommunity rather than as a set of individuals. Thus, individual users might have aproblem, but the community may, as a group, have solved the problem.
This view suggests that it is important to encourage users to communicate andto provide them with ways for them to interact over time, and to provide ways toacknowledge contributions and expertise. This approach is increasingly being usedto help users help each other to solve a wide range of needs (e.g., Carroll et al.2006; El Helou et al. 2008). Further comments and suggestions on how to applythis approach are in the references and in the literature on communities of practiceand on knowledge management systems.
9.4.2.3 Static Models of Social Processes
Some of the most influential, interesting, and easily approachable models appear tobe network models of social processes. The earliest work in this area noted howeveryone was ‘‘connected to everyone else by only six degrees’’ (Travers andMilgram 1969). That is, for every pair of people in the world, only five friendshipswere necessary to connect them. This work has been perhaps discredited now (withthe answer that we do not actually know how well connected people are, but itmight be that close for most but not all people), but the idea of how people areconnected into a network remains a useful concept. It has been used to explain, forexample, why Silicon Valley is successful, because there are multiple connectionsbetween people (Castilla et al. 2000). It has also been used to analyze the con-nectivity within groups (Carley 1996).
These models are useful for system design in that they encourage you to keep inmind the connections between people, and to support connections and appropriateconnections.
9.4.2.4 Dynamic Models of Social Processes
A more complex view of groups examines how the connections are formed andused, and the processes within the groups. These descriptive theories provideinsights into how groups work and how to support them.
268 9 Social: Theories and Models

A view of the stages that groups go through by Tuckman (1965) and then pickedup by everyone (partly because it is useful and we think partly because the stageshave fun names) notes that groups go through forming (orientation/testing/depen-dence), storming (conflict), norming (group cohesion), and performing (functionalrole-relatedness). This type of stage theory of group formation helps with defininggroup behavior, but more importantly makes predictions about how to help groupswork better together. For example, it would be useful for teachers, managers, andgroup members to encourage activities that help groups transition through the earlystages more productively and quickly. There are multiple ways to help groups form,from helping people meet to helping the groups know their tasks. Norming, forexample, can be assisted by providing standards and behavior to compare.
9.4.3 Soft Systems Methodology
Soft Systems Methodology (SSM, Checkland 1981; Checkland and Scholes, 1999)has its roots in systems engineering, and builds on ideas from action research. Itwas developed as a move away from thinking about systems in hard engineeringterms. So, instead of talking about social systems and technical systems, SSMtreats purposeful action as a system: logically linked activities are connectedtogether as a whole, and the emergent property of the whole is its purposefulness.
SSM is based around a cycle of four activities:
1. The problematic situation that requires action to improve it is identified2. Models of purposeful activity that are judged to be relevant to the identified
situation are developed. Each of these models is built on the particularworldview of the different stakeholders
3. The models are used for structuring discussions about the problematic situation.The goal is to find changes that are desirable and culturally feasible in thatsituation
4. The actions that are needed to improve the situation are defined and, perhaps,implemented.
Systems development usually starts with activity 1, although the other activitieswill often be carried out in parallel, and these can feed back into the other activitiesin the process. The discussions in activity 3, for example, may lead to an improvedunderstanding of some of the more subtle aspects of the problematic situation(activity 1), which may lead to changes in the set of models developed in activity 2.
One of the key features of SSM is its focus on developing an understanding ofthe problem (SSM uses the term problematic situation, which is more general).This understanding takes into account the roles, responsibilities, and concerns ofthe stakeholders that are associated with the particular problem. The understandingof the problem provides the basis for the solution, which again takes into accountstakeholders’ differing viewpoints. SSM explicitly acknowledges that the final
9.4 Models of Social Processes 269

solution is based on attempting to accommodate the views (and needs) of thevarious stakeholders.
SSM is essentially an analytical approach, mostly focusing on organizationalaspects of the system. It does not purport to support systems design. AlthoughSSM does not deal explicitly with the technical system, it is possible to transforman activity model into an information model, by considering the sorts of infor-mation that are: (1) required to perform the activity and (2) generated by theactivity. In this way an information system can be developed that supports thepurposeful activity. SSM has also been used in the evaluation of existing infor-mation systems (Checkland and Poulter 2006).
9.4.4 Rich Pictures
Before designing any system, it is important to understand the environment (orcontext) in which that system will be embedded. There are several aspects to theenvironment that are critical to the system being acceptable to the end users. Someof these may seem trivial, such as the need for an available power supply tooperate the system, and the need for space to house the required technology. Justwalking around the working context can help you to identify the physical aspectsof the environment that need to be considered.
In addition to the physical aspects, there are social aspects too, which are oftenmore subtle, and much harder to identify. Most work nowadays is a social activity,carried out by teams of people with a range of skills, who have to communicateand collaborate to make systems work, and to deliver services. There are somemethods available to help you understand and take appropriate account of the workcontext when designing a system. One of the best known of these is Checkland’s(1981) Rich Pictures, which are part of the Soft Systems Methodology describedabove. An example Rich Picture for the work context in a hospital neonatalintensive care unit is shown in Fig. 9.6 (Baxter et al. 2005). Rich pictures havebeen used to help analyze pubs, a web design consulting firm, and a cold storagewarehouse (Monk and Howard 1998).
The rich pictures are generated from semi-structured interviews that are carriedout with representatives of each of the groups of system stakeholders. Intervieweesare asked about their roles, responsibilities, and concerns. One typical way ofidentifying these is to ask the interviewee to talk you through what they would doin a typical day (or shift). That way, they tell you about the sort of jobs that they doand the people they have to work with, so you can go on to probe the issuesfurther. The roles, responsibilities, and concerns are typically represented insimple pictures that show how the groups of stakeholders are linked.
The rich pictures are annotated with text as appropriate, and supplemented byextended textual descriptions of how work is carried out. When you have created adraft of the rich pictures, you take them back to each of the interviewees to makesure that you have correctly captured what they told you.
270 9 Social: Theories and Models

The problem with many design methods, however, including Rich Pictures, isthat they require a lot of time and effort to carry them out properly. Nielsen (1993),Monk (1998), and Lewis and his colleagues (Blackmon et al. 2002; Lewis andReiman 1998) have all proposed a range of lightweight or discounted methods thatcan inform design in a timely manner, without a massive investment in time, effort,and other resources. These lightweight methods are simplified versions of thelarger methods.
Lightweight rich pictures provide a useful way of showing the roles andresponsibilities of the various system stakeholders along with any concerns theymay have about the work system. To get a complete picture of the social and workcontexts, it is useful to supplement rich pictures with background reading and,where possible, informal visits and meetings to the place where the system will bedeployed; this is sometimes referred to as bootstrapping into the domain.
As befits most pragmatic methods, lightweight rich pictures should be thoughtof as a framework rather than as a set of rules that have to be rigidly followed andapplied. When carrying out a case study of a neonatal intensive care unit, forexample, Baxter and his colleagues (Baxter et al. 2005) found that staff did notreport any concerns. The rich pictures for the work context were drawn as twoseparate diagrams, highlighting the two most important aspects of the work con-text: communication and the use of written records. Both of these are socialactivities, and carrying out a rich picture analysis made it much quicker to see theimportance of communication. Because communication is very much a socialactivity, and was central to the operation of the unit, it was important that theproposed new system did not detract from the existing levels of communication orblock any communication channels.
CLINICAL SERVICES MANAGER
LEAD NURSE
WARD CLERKS
PORTERSPARENTS
PATIENTS
SENIOR NURSESNURSES
PHARMACIST
CONSULTANTSREGISTRARS
JNR DOCTORS (SHOs)
Outside world: labs, other depts., specialist staff, other hospitals etc.
OUTREACH NURSES
Communication Frequency:High MediumLow
Fig. 9.6 A Rich picture forthe work context in a hospitalneonatal intensive care unit(adapted from Baxter et al.2005)
9.4 Models of Social Processes 271

9.4.5 Computational Models of Social Behavior
As social models get more complex, it becomes necessary to use computers toimplement them and their predictions. Analytic models simulate the social pro-cesses but without modeling the individual transactions in detail. Process modelsmodel the information processing that is performed and they will typically alsomodel the interactions between agents.
9.4.5.1 Analytic Models
Analytic models provide a description of a social process. They may includeequations for how often people meet, or how often and what they communicate.These equations are used to simulate how the social process unfolds.
As an example, a group of researchers modeled the transmission of a possibleinfluenza pandemic (Halloran et al. 2008). It can be viewed as a social model (aswell as a epidemiological model) because it primarily models social interactionsbetween people at schools, work, home, and neighborhoods. It uses equations tomodel how often people interact, how often a disease would be transmitted, andthe impact of medical interventions to stop the transmission of the disease.Importantly, these simulations explore how well public health interventions wouldbe followed and what would be the impact of these interventions on the spread ofthe disease. The authors argue that the results are not accurate enough to bepredictions, but are useful for framing the discussion of how to handle pandemics,and which interventions to consider. For example, closing schools is one that isboth easy to follow and greatly helps reduce the spread of disease. These simu-lations do not cover the details, but they present a broad description of a largesocial system. The Halloran et al. (2008) work modeled the population of greaterChicago of 8.6 million people. This is one of the largest social simulation modelswe know.
9.4.5.2 Process Models
As social processes are being better formulated, there has been an increase inmodeling them using information processing models. These models simulatesmaller groups, ranging from 2 to 100 people.
Current examples include work on optimizing the structures of groups toincrease performance (e.g., Levchuk et al. 2002), creating models for use as col-leagues and adversaries (Jones et al. 1999; Tambe et al. 1995; Zachary et al. 2001),and fundamental work on understanding how changes in group processes andindividual behavior lead to changes in group performance (e.g., Carley 1996). Thisis an exciting emerging field, and further examples are available from conferences
272 9 Social: Theories and Models
in AI and in organizational process, and in the Journal of Mathematical Sociologyand Computational and Mathematical Organization Theory. Search engines canprovide further references.
9.4.6 Summary
These approaches to modeling social processes offer different advantages anddisadvantages. The analytic models can represent large systems, over millions ofentities. They can be used to provide useful suggestions for public policy. On theother hand, their details get applied millions of times and their assumptions canbecome very important but at the same time hard to know.
The process models work harder to get the details right on a more fine-grainedlevel but have difficulty scaling. Process models can be used to provide usefulsuggestions on smaller scale systems, but they cannot provide as many suggestionson large scale systems because they cannot simulate very large systems becausethey require so much computational power. They are useful, however, in simu-lations and games because they can live in an environment.
9.5 General Implications for System Design
Whenever you design a new system, it will almost invariably be a socio-technicalsystem (the main exceptions are some deeply embedded systems that speak only toother pieces of technology). In other words, there will be a social system involved.You will need to take account of that social system, because the technology andthe social system will be interdependent and interact. If you do not spend time andeffort understanding the existing social system, you run the risk of adverselyaffecting it—if staff have to spend more time on interacting with the new tech-nology that takes away time from communication or learning, for example—andcan end up in the situation where staff will simply stop using the new technologybecause it gets in the way of them doing their job.
Many of the implications for system design require you to think about theimpact of the system that you are designing. In some cases there will be aspects ofinteraction that you can build into your system, but in others it will be a case ofmaking sure that what you have designed does not take anything away from whatalready exists (or if it does, it improves the overall socio-technical system). Themodeling tools and techniques described in Sect. 9.8 should help.
The first thing you need to consider is how people work together in the envi-ronment where your system will be deployed. If you are putting a global system inplace, along the lines of YouTube for example, which has distributed users, youmay want to create local regions within the system that will help to encourage useand participation. You will also need to think about creating the most appropriate
9.4 Models of Social Processes 273
social distances between people, either increasing it, through the use of formaltitles (e.g., Dr. Ritter), or reducing it by just using first names (e.g., Frank) ornicknames (Killer-ace).
The way that people interact will be affected by the goals, costs, and payoffs(benefits) involved, so you should make them clear and attractive. If goals areshared, then you need to think about how people make decisions about those goals,and the actions that need to be taken to achieve those goals. If the decisions areshared, then you have to think about how you will share information between thepeople involved. Although the team may self-support and self-regulate, you shouldconsider the need for an authority figure to moderate behavior, where appropriate.Remember that the make-up of the team is likely to change over time, so you needto consider how to deal with experienced people leaving the team and new peoplejoining the team, which will affect overall system performance.
You will need to think about how and why people are motivated to use yoursystem. Do they use it because they have to (are they paid to use it to do their job,for example)? Or do they use it because they want to use it (the classic examplehere being social networking systems). Even in the case of developing a socialnetworking system, there may be a need for extrinsic motivation to make sure thatpeople keep the system active by providing new content, although the rewards fordoing this may not be financial. You could highlight how the system increasestheir mastery, gives them autonomy, and increases the importance of doing thetask. The balance between motivations may not always be clear cut, so somelearning tasks, for example, will require a coach who sets tasks (which may benecessary, but are not necessarily intrinsically rewarding) for people to completeas part of their learning experience.
If your system will support many users working together as a team, you willneed to be aware of the potential diffusion of responsibility and how you can guardagainst this. One way of doing so is to make sure that any requests are directed atspecific people rather than general groups. You can also make the requester appearmore human by associating personal images or details with their request, becausepeople are more likely to respond to real requests from real people!
The factors that influence team performance may be relatively well known, butit may not always be possible to ensure that all the factors are optimal. As notedabove, teams that are (1) more cohesive, (2) who have worked together longer, and(3) who share more values will perform better. You need to be able to supportteams with these attributes, but also help teams that do not have all of the attributesto achieve them. Reducing social distance may help to make the team morecohesive, and sharing information can lead to the sharing of values.
In addition to the team level issues, you will also need to think about organiza-tional issues. If an organization has procedures in place for how a particular job hasto be done, for example, then you will need to think about whether these procedureswill have to be changed. If the procedures are imposed by a regulatory authority(as in nuclear power, for example) then you may not be able to change thoseprocedures, so you will have to design your system to support those procedures.
274 9 Social: Theories and Models

There can also be cultural effects (on several levels), so there may be a tradition fordoing a task in a particular way, which is an effect of organizational culture.
The main message to take away is that all systems are deployed in an envi-ronment that includes social elements that you need to take into account. If youignore them, you increase the risk of your system being unacceptable, because it isless likely that it will fit in with their way of working. The other important thing toremember is that the social environment is likely to change, so you should at leastbe aware of this, and design your system to take account of this, where possible.
9.6 Summary
We hope that this chapter has convinced you that social aspects of users areimportant. We and many designers certainly did not think so 20 years ago when alot of systems were created. Increasingly, the individual aspects are either wellsupported or in some cases less important, so social aspects are becoming moreimportant, or at least can be paid attention to.
Social factors appear to be complex, and currently it appears to be difficult tocombine them a priori. Social factors include the group members (which arecomplex), their organization (which can be complex), their mutual and individualtasks (which can be complex), and the task distributions (how often each task hasto be performed). This makes the social factors not reducible to a single number orsummary because the construct is a group, a set of individuals and their rela-tionships to each other, and their ability to perform a range of tasks that might notbe equivalent. These factors are also moderated by the task environment, includingother groups and other members of the team’s family, culture, and nation.
Designers will need to keep in mind during design the social aspects of thesystem, sometimes on a par with the technical system. There are more exampleswhere ignoring social aspects of systems lead to risks that can cause systems tofail. Casey (1998) notes several, and Goolsby (2005) starts her paper with anexample of a system that failed immediately because it ignored social and politicalaspects.
9.7 Other Resources
Cheyne and Ritter (2001) argue that there are right ways and wrong ways tocontact people on the Internet. Their position has been upheld by most responsibleorganizations, but is consistently being violated by less responsible organizations(e.g., spammers). They offer an application of some of the theories in this area tohow to make announcements using email, bulletin boards, and through searchengines, rather than unsolicited direct email, which pushes the cost on the receiver.
9.5 General Implications for System Design 275

For more on networked sociality see Rainie et al. (2012). Networked. The newsocial operating system. Cambridge, MA: MIT Press.
A short article by Churchill cautions us to remember as designers we may notbe like the users we are designing for, and to think carefully when designing socialsystems. This is of course a general point, but when it comes to social commu-nication tools, it is particularly important.
Churchill (2010). The (anti) social net. interactions. 17(5). 22–25.
Generally, the question of how to support teams using technology is considered byhuman factors and computer-supported cooperative work (CSCW). Conferencesand journals in this area will provide more information and more current infor-mation. An early collection of readings is still useful: Baecker (1993).
For more on collaborative virtual environments, Churchill, Snowdon, andMunro’s book contains articles on the topic:
E. F. Churchill, D. Snowdon and A. Munro (Eds). (2001). Collaborative virtual envi-ronments. Digital places and spaces for interaction. London, UK: Springer Verlag.
There are several places where work on computational models of socialbehavior can be found. In addition to the Journal of Mathematical Sociology, thereis a society focused on this, NAACSOS—The North American Association forComputational Social and Organizational Science (www.dis.anl.gov/naacsos).Their conference is associated with the Computational and Mathematical Orga-nization Theory Conference (CASOS) (www.casos.ece.cmu.edu). The NationalResearch Council, an independent agency that gives independent scientific adviceto the government, has written a report that lays out a summary of work that canand should be done: (Committee on Organizational Modeling from Individuals toSocieties 2007).
9.8 Exercises
9.1 Spam regularly appears in our email and now battles for our attention and ourresources alongside legitimate emails. In some cases the spam is non-trivial inthat the author is serious, genuine, and locatable. The rest are often removedautomatically using spam filters.
(a) Use the frameworks from informal groups, transaction costs, and net-works, to explain the incentives and impact of spam. Generate anequation to compute the transaction costs of spam. Generate an equationto compute how many email addresses are visible on the Internet.
(b) Discuss, using costs and benefits, how much it would cost to ask peopleto donate to charity on your campus using email, and the wisdom andpractical matters of this approach. (You might be able to use informationfrom Cheyne and Ritter 2001).
276 9 Social: Theories and Models

9.2 Second Life is a web site/application that puts you into a virtual world. It has aset of commands for moving around the environment and manipulatingobjects in it. It has an interface for following yourself and for recording orallyas well as textually. If you have read any of Gibson’s (1988) or Vinge’s (2006)books, it may seem familiar in that it realizes some of the important aspects ofthese virtual worlds including social interaction, and Second Life may evenhave been inspired by these books.
Discuss Second Life with respect to the ABCS, particularly the socialaspects. Note where it is better than (first) life and where it is worse. Try tosummarize when and where it will be important.
9.3 Examine eBay or another online site with social aspects using the represen-tations and frameworks in this chapter. Choose a framework from this chapter,e.g., network analysis. Map the concepts onto the social web site. Notewhether there are any concepts missing on the web site, and also whether thereare any concepts in the web site that are missing in the theory.
References
Axelrod, R. (1984). The evolution of cooperation. New York, NY: Basic Books.Baxter, G. D., Monk, A. F., Tan, K., Dear, P. R. F., & Newell, S. J. (2005). Using cognitive task
analysis to facilitate the integration of decision support systems into the neonatal intensivecare unit. Artificial Intelligence in Medicine, 35, 243–257.
Baecker, R. M. (Ed.). (1993). Readings in groupware and computer-supported cooperative work:Assisting human–human collaboration. San Mateo, CA: Morgan Kaufmann.
Beyer, H., & Holtzblatt, K. (1999). Contextual design. interactions, 6(1), 32–42.Blackmon, M. H., Polson, P. G., Kitajima, M., & Lewis, C. (2002). Cognitive walk through for
the Web. In Proceedings of CHI’02 Conference on Human Factors in Computing Systems,463-470. ACM: New York, NY.
Boehm, B., & Hansen, W. (2001). The spiral model as a tool for evolutionary acquisition.Crosstalk: The Journal of Defense Software Engineering, 14(5), 4–11.
Brennan, S. E. (1998). The grounding problem in conversations with and through computers. InS. R. Fussell & R. J. Kreuz (Eds.), Social and cognitive psychological approaches tointerpersonal communication (pp. 201–225). Hillsdale, NJ: Erlbaum.
Brown, B., Green, N., & Harper, R. (2001). Wireless world: Social and interactional aspects ofwireless technology. London, UK: Springer-Verlag.
Burt, R. S. (2004). Structural holes and good ideas. American Journal of Sociology, 110(2),349–399.
Carley, K. M. (1996). A comparison of artificial and human organizations. Journal of EconomicBehavior & Organization, 31, 175–191.
Carroll, J. M., Rosson, M. B., Convertino, G., & Ganoe, C. H. (2006). Awareness and teamworkin computer-supported collaborations. Interacting with Computers, 18(1), 21–46.
Casey, S. M. (1998). Set phasers on stun: And other true tales of design, technology, and humanerror. Santa Barbara, CA: Aegean.
Castilla, E. J., Hwang, H., Granovetter, E., & Granovetter, M. (2000). Social networks in SiliconValley. In C.-M. Lee, W. F. Miller, M. G. Hancock & H. S. Rowen (Eds.), The Silicon Valleyedge (pp. 218–247). Stanford, CA: Stanford University Press.
Checkland, P. (1981). Systems thinking, systems practice. Chichester, UK: Wiley.Checkland, P., & Scholes, J. (1999). Soft systems in action (2nd ed.). Chichester, UK: Wiley.
9.8 Exercises 277

Checkland, P., & Poulter, J. (2006). Learning for action: A short definitive account of soft systemsmethodology and its use for practitioners, teachers and students. Chichester, UK: Wiley.
Cheyne, T., & Ritter, F. E. (2001). Targeting respondents on the Internet successfully andresponsibly. Communications of the ACM, 44(4), 94–98.
Churchill, E. F. (2010). The (Anti) Social Net. interactions, 17(5), 22–25.Churchill, E. F., & Bly, S. (1999). Virtual environments at work: Ongoing use of MUDs in the
workplace. In Proceedings of the International Joint Conference on Work ActivitiesCoordination and Collaboration, 99–108. ACM: New York, NY.
Churchill, E. F., Snowdon, D., & Munro, A. (Eds.). (2001). Collaborative virtual environments.Digital places and spaces for interaction. London, UK: Springer Verlag.
Clark, H. H., & Brennan, S. E. (1991a). Grounding in communication. In L. B. Resnick, J.M. Levine, & S. D. Teasley (Eds.), Perspectives on socially shared cognition (pp. 127–149).Washington, DC: American Psychological Association.
Clark, H. H., & Brennan, S. E. (1991b). Perspectives on socially shared cognition. In L.B. Resnick & J. M. Levine (Eds.), Washington. DC: American Psychological Association.
Coleman, J. R. (1974). Blue-Collar journal: A college president’s sabbatical. Philadelphia, PA:Lippincott Williams & Wilkins.
Committee on Organizational Modeling from Individuals to Societies, & G. L. Zacharias, J.MacMillan, and Susan B. Van Hemel (Eds). (2007). Behavioral modeling and simulation:From individuals to societies. Washington, DC: National Academies Press. http://www.nap.edu/catalog/12169.html.
Crabtree, A. (2003). Designing collaborative systems: A practical guide to ethnography. London,UK: Springer.
Desanctis, G., & Monge, P. (1998). Communication processes for virtual organizations. Journalof Computer-Mediated Communication, 3(4), [online file].
Dodds, P. S., Muhamad, R., & Watts, D. J. (2003). An experimental study of search in globalsocial networks. Science, 301(5634), 827–829.
Dunbar, R. I. M. (1992). Neocortex size as a constraint on group size in primates. Journal ofHuman Evolution, 22(6), 469–493.
El Helou, S., Tzagarakis, M., Gillet, D., Karacapilidis, N., & Yu Man, C. (2008). Participatorydesign for awareness features: Enhancing interaction in communities of practice. InProceedings of the 6th International Conference on Networked Learning, 523–530.Networked Learning Conference Office, Lancaster University: Lancaster, LANCS.
Fan, X., & Yen, J. (2004). Modeling and simulating human teamwork behaviors using intelligentagents. Physics of Life Reviews, 1(3), 173–201.
Gibson, W. (1988). Mona Lisa overdrive. New York, NY: Bantam Books.Goolsby, R. (2005). Ethics and defense agency funding: Some considerations. Social Networks,
27, 95–106.Gottman, J. M., Murray, J. D., Swanson, C., Tyson, R., & Swanson, K. R. (2005). The
mathematics of marriage: Dynamic nonlinear models. Cambridge, MA: MIT Press.Halloran, M. E., Ferguson, N. M., Eubank, S., Longini, I. M. J., Cummings, D. A., Lewis, B.,
et al. (2008). Modeling targeted layered containment of an influenza pandemic in the UnitedStates. Proceedings of the National Academy of Sciences, 105(12), 4639–4644.
Jones, R. M., Laird, J. E., Nielsen, P. E., Coulter, K. J., Kenny, P., & Koss, F. V. (1999).Automated intelligent pilots for combat flight simulation. AI Magazine, 20(1), 27–41.
Kang, J. (2000). Cyber-race. Harvard Law Review, 113, 1130–1208.Kozlowski, S. W. J., & Ilgen, D. R. (2006). Enhancing the effectiveness of work groups and
teams. Psychological Science in the Public Interest, 7(3), 77–124.Landauer, T. K. (1995). The trouble with computers: Usefulness, usability and productivity.
Cambridge, MA: MIT Press.Levchuk, G. M., Levchuk, Y. N., Luo, J., Pattipati, K. R., & Kleinman, D. L. (2002). Normative
design of organizations—Part I: Mission planning. IEEE Transactions on Systems, Man, andCybernetics—Part A: Systems and Humans, 32(3), 346–359.
278 9 Social: Theories and Models

Levitt, S., & Dubner, S. J. (2005). Freakonomics: A rogue economist explores the hidden side ofeverything New York. NY: William Morrow/HarperCollins.
Lewis, C., & Reiman, J. (1998). Task-centered user interface design. hcibib.org/tcuid/.Milgram, S. (1967). The Small-World Problem. Psychology Today, 1, 61–67.Millen, D. R., Feinberg, J., & Kerr, B. (2006). Dogear: Social bookmarking in the enterprise. In
Proceedings of the SIGCHI Conference on Human Factors in Computing Systems, 111–120.ACM: New York, NY.
Monk, A., & Howard, S. (1998). The rich picture: A tool for reasoning about work context.interactions [sic], 5(2), 21–30.
Monk, A. F. (1998). Lightweight techniques to encourage innovative user interface design. InL. Wood (Ed.), User interface design: Bridging the gap between user requirements anddesign (pp. 109–129). Boca Raton, FL: CRC Press.
Nielsen, J. (1993). Usability engineering. Chestnut Hill, MA: AP Professional Press.Nonaka, I., & Takeuchi, H. (1995). The knowledge creating company: How Japanese companies
create the dynamics of innovation. New York, NY: Oxford University Press.Olson, J. S., & Olson, G. M. (2003–2004). Culture surprises in remote software development
teams. ACM. Queue, 1(9), 52–59.Pew, R. W., & Mavor, A. S. (Eds.). (2007). Human-system integration in the system development
process: A new look. Washington, DC: National Academies Press. http://books.nap.edu/catalog.php?record_id=11893. Accessed 10 March 2014.
Plowman, L., Rogers, Y., & Ramage, M. (1995). What are workplace studies for? In Proceedingsof the Fourth European Conference on Computer-Supported Cooperative Work ECSCW’95,309–324. Kluwer: Dordrecht, The Netherlands.
Rainie, H., Rainie, L., & Wellman, B. (2012). Networked. The new social operating system.Cambridge, MA: MIT Press.
Ruhleder, K., & Jordan, B. (1999). Meaning-making across remote sites: How delays intransmission affect interaction. In Proceedings of the Sixth European Conference onComputer Supported Cooperative Work (ECSCW’99), 411–429. Kluwer: Norwell, MA.
Rutkowski, A. F., Vogel, D. R., Van Genuchten, M., Bemelmans, T. M., & Favier, M. (2002). E-collaboration: The reality of virtuality. IEEE Transactions on Professional Communication,45(4), 219–230.
Sacks, H. (1992). Lectures on Conversation, Volumes I and II. Edited by G. Jefferson withIntroduction by E.A. Schegloff. Oxford, UK: Blackwell.
Simon, H. A. (1997). Administrative behavior (4th ed.). New York, NY: The Free Press.Snowdon, D., Churchill, E. F., & Frecon, E. (Eds.). (2003). Inhabited information spaces: Living
with your data. London, UK: Springer Verlag.Suchman, L. (1983). Office procedures as practical action: Models of work and system design.
ACM Transactions on Office Information Systems, 1(4), 320–328.Tambe, M., Johnson, W. L., Jones, R. M., Koss, F., Laird, J. E., Rosenbloom, P. S., et al. (1995).
Intelligent agents for interactive simulation environments. AI Magazine, 16(1), 15–40.ten Have, P. (1999). Doing conversation analysis. London: Sage Publications.Travers, J., & Milgram, S. (1969). An experimental study of the small world problem.
Sociometry, 32(4), 425–443.Tuckman, B. W. (1965). Developmental sequence in small groups. Psychological Bulletin, 63,
384–399.Viller, S., & Sommerville, I. (2000). Ethnographically informed analysis for software engineers.
International Journal of Human-Computer Studies, 53(1), 169–196.Vinge, V. (2006). Rainbows End. New York, NY: Tor Books.Watts, D. (2003). Six degrees: The science of a connected age. New York, NY: W. W. Norton.Wenger, E. (1998). Communities of Practice: Learning, meaning, and identity. Cambridge, UK:
Cambridge University Press.Zachary, W., Santarelli, T., Lyons, D., Bergondy, M., & Johnston, J. (2001). Using a community
of intelligent synthetic entities to support operational team training. In Proceedings of the
References 279

Tenth Conference on Computer Generated Forces and Behavioral Representation, 215–224.Institute for Simulation and Training, University of Central Florida: Orlando, FL.
Zhao, D., & Rosson, M. B. (2009). How and why people Twitter: The role that micro-bloggingplays in informal communication at work. In Proceedings of the ACM 2009 InternationalConference on Supporting Group Work, 243–252. ACM: New York, NY.
280 9 Social: Theories and Models

Chapter 10Errors: An Inherent Partof Human-System Performance
Abstract In this chapter we consider how errors contribute to accidents, large andsmall, and what we can do about them. We discuss the problem of post-hocanalyses, the types of human error that can occur, and how to design systems insuch a way that the errors can be appropriately managed. The examples illustratehow user’s characteristics in terms of psycho-physiology, fatigue, cognitive pro-cessing, and social situations can all contribute to failures. We especially note theimportance of Norman’s (and others’) main guideline about needing to design forerror.
10.1 Introduction to Errors
In this chapter we provide an introduction to the topic of what is often calledhuman error. As Reason (1990) notes, ‘‘human error is a very large subject, quiteas extensive as that covered by the term human performance,’’ so we can onlyreally provide a selective overview of some of the major issues.
We have deliberately separated the discussion of errors into a separate chapter.This is because errors are an inherent part of system performance. In other words,they often arise as a combination of factors at the anthropomorphic, behavioral,cognitive, and social levels in the ABCS framework. If you look again at theexample of the Kegworth air accident (see the Appendix), you should be able toappreciate this more fully at this point in the book.
Our purpose here is to highlight the need to think about your users in context,and to determine what kinds of factors can give rise to erroneous performance. Byhighlighting the relationship between system performance and error, we hope toshow you why it is important to think about designing for error (Norman 1988,2013). One way of designing for error is to identify the situations that can lead toerroneous performance, and then put in place appropriate mechanisms to eitherprevent the errors, or at least mitigate the adverse consequences arising from thoseerrors.
F. E. Ritter et al., Foundations for Designing User-Centered Systems,DOI: 10.1007/978-1-4471-5134-0_10, � Springer-Verlag London 2014
281

We will illustrate our points using examples taken from a range of incidents andaccidents, large and small. In doing so, we hope to show how errors do not justarise because of any inherent error-proneness or maliciousness of the users.Instead, errors are usually the result of an interaction of several contributingfactors (people, technological, and contextual). Once we accept this state of affairswe can begin to move away from the need to find someone to blame, and start tolearn from erroneous performance as a way of improving future systemperformance.
10.1.1 What is Error?
Errors are generally regarded as precursors to accidents. The error triggers a set ofevents—often referred to as a chain or sequence, although it is not always a linearset of events—ultimately leading to an outcome that has serious consequencesinvolving significant loss of life, money, or machinery. Causal analyses of acci-dents usually highlight the fact that there were many contributory factors. Thereare obviously exceptions, where a single catastrophic failure leads directly to anaccident, but generally accidents involve a series of several individually minorevents. This process is sometimes described as a domino effect, or represented bythe Reason’s (1990) Swiss cheese model in which there are holes in the variouslayers of the system, and an accident only occurs when the holes line up across allthe layers.
A similar idea is encapsulated in Randell’s (2000) fault-error-failure model thatcomes from the field of dependability. A failure is defined as something that occurswhen the service that is delivered is judged to have deviated from its specification.An error is taken to be the part of the system state that may lead to a subsequentfailure, and the adjudged cause of the error is defined as a fault.
It is very important to note that identifying whether something is a fault, error,or failure involves making judgments. The fault-error-failure triples can link up sothat you effectively end up with a chain of triples. This is possible because a failureat one level in the system may constitute a fault at another level. This does notmean that errors inevitably lead to failures, however. The link between an errorand a failure can be broken either by chance or by taking appropriate design stepsto contain the errors and their effects.
Those errors that have immediate (or near-immediate) effects on system per-formance are sometimes called active errors (Reason 1990). This is to distinguishthem from latent errors, which can lie dormant within a system for some con-siderable time without having any adverse effect on system performance. Thecommission that investigated the nuclear accident at Three Mile Island, forexample, found that an error that had occurred during maintenance (and hence waslatent in the system) led to the emergency feed water system being unavailable(Kemeny (chairman) 1979). Similarly, the vulnerability of the O-ring seals on theChallenger Space Shuttle was known about beforehand and hence latent in the
282 10 Errors: An Inherent Part of Human-System Performance

system (Vaughan 1997). The vulnerability was only exploited after the decisionwas made to launch the shuttle in very cold weather.
The general approach used to study errors focuses on how to understand errorsso that we can take appropriate steps to manage them before things get out of hand.When, rather than if, things go wrong, the aim is to learn from what happened tohelp prevent a repeat performance.
Immediately after a major accident of any kind the press coverage almostinvariably attributes the cause of the accident to human error. The problem is thatthe term human error is ambiguous and has three subtly different meanings(Hollnagel 1998), which are often confused by the press. It is therefore worthspelling out these different meanings, using examples from the field of aviation:
1. Human error is the cause of the event or action. An example of this would be ifan aircraft deviated from its assigned flight altitude to a different flight altitude(either higher or lower than the one that the flight crew had been given by AirTraffic Control) due to the actions of the flight crew.
2. Human error is the event or action itself. An example of this would be if anaircraft pilot did not change the altimeter setting when they were supposed to.Note that in this case the action is really a deliberate non-action.
3. Human error is the consequence of the event or action. An example of thiswould be if an aircraft collided with another aircraft because the pilot started totaxi before receiving clearance to taxi by air traffic control.
The differences between the meanings are quite subtle, but it is important toensure that you understand them. In most cases the press combines the first twomeanings, even though they may not intend that the primary attribution of blameshould fall on the human.
The interpretation of human error is further complicated by the fact that anaction can only be judged as erroneous in hindsight (Woods et al. 1994). Peoplewill generally do what they think is the right thing in that particular context at theright time. So an action can only be judged as being erroneous after the fact, basedon:
• A comparison with some expected level of performance• A degradation in performance• The person who performed the act having been unable to choose to act in a way
that would not have been considered as erroneous.
There is one exception to this notion of erroneous actions being judgmentsmade in hindsight: violations. If a person deliberately decides to do the wrongthing—to sabotage the system, for example—then this can be determined at thepoint when the action occurs, rather than afterwards. In some cases, however, itmay be necessary to violate the established rules or procedures to keep a systemin a safe state, or to get it out of an unsafe one. The Federal Aviation Authority(FAA) in the US acknowledges this type of violation—sometimes calledsafe violations—and explicitly allows them under its regulations in certainsituations.
10.1 Introduction to Errors 283

Erroneous actions, then, can be seen generally as the result of one of two things:
1. Performing the right action in the wrong circumstances. This is what Reason(1990) calls a mistake, or a failure in planning.
2. Performing the wrong action in the right circumstances. This is often referred toas a slip (Norman 1981; Reason 1990), or failure in action execution.
In either case the action could have been deemed correct if the circumstanceshad been slightly different. This helps to explain Rasmussen’s (1988) descriptionof erroneous actions as being the results of carrying unsuccessful experiments inunfriendly environments.
It is also important to take into account different perceptions when trying tointerpret what people mean by error. Rasmussen et al. (1994) suggest that thefollowing perspectives can be identified:
• Common sense: to explain an unusual event• The lawyer: to find somebody to blame and/or punish• The therapist: to improve human performance• The scientist: to understand human behavior• The reliability analyst: to evaluate human performance• The designer: to improve system configuration.
As interactive system designers, our perspective tends to be mostly a combi-nation of the scientist’s and the designer’s perspectives. The two are somewhatrelated, because by understanding the human behavior, we can provide appropriatesupport to prevent errors happening or to mitigate the consequences of any errorsthat may not be preventable. In most cases this will be by changing the design ofthe system.
10.1.2 The Fine Line Between Success and Failure
As long as there have been people, there have been errors. Getting things right isnot always easy, and often requires knowledge and skills that have to be acquiredover an extended period of time: you cannot become an expert overnight. One ofthe ways in which people learn is through practice, by reflecting on their perfor-mance, using feedback, and then trying to do it better next time. This approach isnicely illustrated in the works of Henry Petroski (e.g., Petroski 1985/1992, 1994,2006), who has shown how the development of engineering has progressed overthe centuries by learning from past errors.
The study of errors has fascinated psychologists for over a century. It receivedrenewed impetus from the end of the 1970s with major events like the Three MileIsland disaster in 1979, the runway collision at Tenerife in 1977, and a range ofcatastrophes in medical care (e.g., Bogner 2004), when the gauntlet was picked upby the human factors and ergonomics community. The focus of study has changedsomewhat, however, and there is now recognition that it is important to think about
284 10 Errors: An Inherent Part of Human-System Performance
success as much as failure because there is often only a fine line dividing the two,and there are many more instances of success than of failure (e.g., Hollnagel et al.2006). This changed emphasis is a reflection of Ernst Mach’s (1905) prescientview that ‘‘Knowledge and error flow from the same mental sources, only successcan tell one from the other……the same mental functions, operating under thesame rules, in one case lead to knowledge, and in another, to error….’’. Althoughcouched in slightly different terms, it is a view that others have concurred with andreiterated, such as Reason (1990, p.1):
Not only must more effective methods of predicting and reducing dangerous errors emergefrom a better understanding of mental processes, it has also become increasingly apparentthat such theorizing, if it is to provide an adequate picture of cognitive control processes,must explain not only correct performance but also the more predictable varieties ofhuman fallibility. Far from being rooted in irrational or maladaptive tendencies, theserecurrent error forms have their origins in fundamentally useful psychological processes.
The consequences of errors have also increased over the years. Or perhaps thatshould be the consequences are perceived to have increased. The mass media thesedays are often very quick to report on air accidents, for example, where a singleaccident may give rise to hundreds of casualties. The fact that more people getkilled on the roads, however, goes largely unreported, mostly because each fatalroad accident often only involves a few deaths (Gigerenzer 2004).
10.1.3 The Accident was Caused by Human Error, Right?
Most accidents could naively be attributed to human error because the systems thatfail, leading to the accident, are designed by humans. This is an over-simplisticview, however, and would lead to an equally simplistic solution, i.e., that removingthe human would remove a major source of failures, and hence eliminate manyaccidents. The idea of humans being accident prone in a volitional way (i.e., oftheir own free will) dominated early thinking in human error research.
The cause of an accident is often attributed to human error (pilot error, drivererror, operator error, and so on). This is a judgment that is built on severalunderlying assumptions that, at best, usually only represent a partial view of thetrue situation. There are many examples of such a view. Arnstein (1997), forexample, found that the number of problems that could be attributed to humanerror in anesthetics ranged from 64 to 83%, whilst in aviation the range was40–88%. Johnson and Holloway (2007) also noted the tendency to over-emphasizehuman error as the reported cause in transportation accidents for the years1996–2003. Whilst it was still found to be the main attributed cause, the levelswere somewhat lower at 37% for the US National Transportation Safety Board(NTSB), and 50% for the Canadian TSB.
One of the main reasons that accidents end up being attributed to human error isbecause of the limitations of causal analysis. It is difficult to continue the analysisthrough the human when we do not have direct access to what was going on in the
10.1 Introduction to Errors 285

operators’ heads when the accident happened. So once the human is reached in thesequence of attributable causes, the analysis frequently gets terminated, and we areleft with human error as the result.
As we have noted several times, system performance is the result of peopleinteracting with technology in a particular context (organizational and physicalenvironment). The importance of context should never be underestimated. Veryoften, when we look at accidents we find that the users were working in a contextconstrained by time pressures and limited resources.
Nowadays, there is a greater awareness of the influence of the context in whichwork takes place, and the fact that human attentional resources are limited (seeChap. 5). Many events that previously were typically attributed to humans beingaccident prone would now be analyzed and categorized differently.
In aviation, for example, where multitasking is an inherent part of flying aplane, distractions are recognized as being a particular problem. Dismukes et al.(1998) noted that nearly half the reported NTSB accidents attributed to crew errorinvolved lapses of attention associated with interruptions, distractions, or anexcessive preoccupation with one task to the exclusion of another that had to beperformed within a similar time frame. The vast majority (90%) of competingactivities that distracted or preoccupied pilots fell into four categories: commu-nication; head-down work; searching for other traffic in good weather (visualmeteorological conditions or VMC); or responding to abnormal situations. Flightcrews have to work as a team, but this has to be done in such a way that it does notdetract from the individual tasks that have to be performed as the followingexcerpt from incident report #360761 from NASA’s Aviation Safety ReportingSystem (ASRS) illustrates:
Copilot was a new hire and new in type: first line flight out of training IOE. Copilot washand-flying the aircraft on CIVET arrival to LAX. I was talking to him about the arrivaland overloaded him. As we approached 12,000 feet (our next assigned altitude) he did notlevel off even under direction from me. We descended 400 feet before he could recover. Idid not realize that the speed brakes were extended, which contributed to the slow altituderecovery.
Here the Pilot Not Flying (PNF) was trying to help the co-pilot (the Pilot Flyingor PF), which led to problems on two levels. First, the combination of flying theplane and trying to heed the PNF’s advice simply overloaded the PF. Second, thefact that the PNF was focused on making sure that he gave the PF appropriateassistance meant that he was distracted from his task of monitoring the ongoingstatus of the plane. Both flight crew members were trying to do the right thing, butthey did not have enough resources to accomplish everything they needed to do.The distractions in this case were at least partly self-created; such distractionsoften lead to incidents in many domains (Baxter 2000). This incident would tra-ditionally have been attributed to pilot error, but a closer examination of thecontext suggests that this is an over-simplification.
We noted earlier that there is a fine line between success and failure. In theaviation incident described above, where the plane descended too far, it seems
286 10 Errors: An Inherent Part of Human-System Performance

obvious that there were time pressures involved. The PF knew that he had torespond relatively quickly whilst still listening to the PNF’s advice. Perhaps if thePF had been more experienced, and the PNF had not felt the need to talk the PFthrough the arrival route, neither of them would have been distracted from the taskat hand: the PF would have been more likely to level off at the appropriate altitude,and the PNF more likely to detect any anomalies in the plane’s status.
The air accident at Kegworth in the UK (Air Accidents Investigation Branch1989), described in the Appendix offers another example of a failure that wasofficially attributed to pilot (human) error. One of the problems was the fact thatwhen the crew shut down the good engine, this coincided with a reduction invibration, and a cessation of the smoke and fumes from the faulty engine. This ledthe crew to believe that they had taken the correct action, which can be at leastpartly attributed to the use of a flawed mental model (Besnard et al. 2004).
It is also important to ensure that appropriate account is taken of the physio-logical limitations of users as well as their psychological limitations. A simpleexample is the original design of packaging for medication tablets (and some otherpotentially hazardous household items such as domestic bleach). It used to be quiteeasy for a young child to unscrew the cap from a medicine bottle and then eat thecontents because they looked like sweets. The solution was the child-proof safetycap. Although children could not open them in tests, older people also found itdifficult to open the cap, particularly if they suffered from arthritis. In complexsituations, such as flying an airplane (and particularly smaller ones), the issuesinvolved may be more subtle. Here it is important that the pilot is not asked to dothings like move their head in one direction whilst the aircraft is moving inanother, because this can lead to severe disorientation.
The design limitations of the system also need to be taken into account. Whatoften happens is that there is a general expectation that the human operator shouldcompensate for any inadequacies in system design. Usually training is used tobridge the gap, but sometimes users are simply left to work it out for themselves.
The technique of Crew—originally Cockpit—Resource Management (CRM)was developed (Wiener et al. 1993) to anticipate some potential problems that canarise from the interactions between people, technology, and context within avia-tion. CRM aims to minimize the potential for failures in interpersonal commu-nications at crucial times during a flight, for example, which can lead to realaccidents such as:
• A plane crashing on take-off because the distracted crew failed to complete asafety checklist that would have confirmed that the aircraft’s flaps had not beenextended.
• A plane crashing into a river when the co-pilot failed to get the attention of theCaptain about concerns that the take-off thrust had not been properly set. Theco-pilot felt that he could not tell his superior what to do.
• A plane crashing when it ran out of fuel due to a communications breakdownbetween the Captain, the co-pilot, and air traffic control about the amount of fuelonboard.
10.1 Introduction to Errors 287

It is only when you start to give deeper consideration to the circumstances inwhich the error occurred that you really appreciate how hard it is to decide who (orwhat) is really to blame. If a doctor makes a medication error after having workedfor 24 h continuously, for example, can we really blame the doctor? We know thatfatigue adversely affects cognitive performance, yet the system still put the doctorin a situation where they were likely to suffer from fatigue. Similarly, we knowthat the way that system controls are laid out can either help or hinder perfor-mance. If a design is inappropriate, can we really blame the users?
In fact, the actions that are performed at the lowest level (usually where the userinteracts with the technology) are only a small part of the picture. This level ofinteraction is often referred to as the sharp end of the system. Actions at the sharpend are often influenced by what happens at the so-called blunt end of the system,as shown in Fig. 10.1. The idea of a sharp end and a blunt end comes from Woodset al. (1994). This figure illustrates that final users are often seen as causes at whereusers meet the task, but that there is a lot of structure behind them that influencesthe situation as well; structure that is harder to change but that has a large amountof influence.
Decisions and actions taken at the regulatory level can affect what the operatorsdo. In the USA, for example, the FAA’s regulations state that pilots must not performdeliberate violations, unless the violation is needed to put the aircraft into a safestate. Similarly, standard operational procedures (which are generally defined at theorganizational level) usually define what the operators can (or cannot) do.
10.2 Studying Error
The issue of data collection is fundamental to the study of human error. If we couldreliably predict exactly when an error was going to occur, it would be a simplematter to warn the person or people involved so that they could avoid it.
Regulatory
Organizational
Teams
Operators/Users
Technology
Blunt End
Sharp End
Fig. 10.1 The influence ofthe blunt end on the sharp endof an incident
288 10 Errors: An Inherent Part of Human-System Performance

Alternatively, we could design the system so that it would prevent the erroroccurring, or at least mitigate the consequences of the error.
There is a standard set of questions that applies to the collection of humanperformance data:
• Why gather data?• What sort of data to gather?• Where (and when) to gather data?• How much data to gather?• How to gather data?
These questions provide a basic framework for the discussion of the variousissues involved. The issues interact and overlap, so it is not possible to answer eachof the questions in isolation.
It is worth re-emphasizing at this point that erroneous behavior is an inherentpart of human performance, i.e., there is a close link between knowledge and error(Mach 1905). The corollary of this is that knowledge or data relating to correctperformance are also needed to make an informed judgment regarding eachpotential instance of state misinterpretation.
Here we only address the question of how to gather data, focusing on complexdomains where the system can change dynamically without human intervention(such as aircraft, cars, and power plants). There are three basic data collectionmethods that can be used: laboratory-based experiments; field-based observation;and archive data. Each has its own set of strengths and weaknesses, as discussedbelow. The final choice of method depends on the particular situation at hand.
10.2.1 Laboratory-Based Experiments
The first method is the standard behavioral science method of using laboratory-based experiments. The main advantage of this method is that it allows for theindependent variables associated with a particular phenomenon to be experimen-tally controlled. By varying one (or more) independent variables, the effect on thedependent variable can be observed.
The main drawback is the lack of face validity between laboratory-basedexperiments and the real world situation. This lack of validity makes it inappropriateat best, and impossible at worst, to generalize from the results obtained in thelaboratory to the situation in the real world. The use of laboratory-based experimentslargely ignores the current consensus of opinion on the importance of context inshaping human performance (Hollnagel 1993a; Hutchins 1995; Nardi 1996).
It is a long and difficult task to develop and conduct laboratory experiments thatwould meet all the requirements of a situation that would definitely lead to ahuman error. This is partly because of the problems of availability and selection ofappropriate experimental subjects. The subjects would need lengthy experience of
10.2 Studying Error 289

operating the system being used. Whilst it might be possible to use operators fromthe relevant domain, their experience is liable to be biased towards the particularsystem they normally work with (as opposed to your new system). The practicalityof getting access to operators for the length of time needed to conduct theexperiments also mitigates against using this approach. In addition, if subjects canidentify the purpose of the experiment they may behave more cautiously, to guardagainst performing erroneous actions.
It can also be difficult to choose an appropriate experimental task and setting.Complex systems often require operators to perform multiple tasks, sometimessimultaneously. The difficulty is to find a complex system (or an appropriatesimulation) that can be readily deployed under laboratory conditions. The systemwould also need to be familiar to the subjects to fulfill the criterion regardingexpertise. Unfortunately, laboratories that have their own high fidelity simulations,such as Halden’s nuclear power plant simulator (Hollnagel et al. 1996) are still theexception rather than the rule.
10.2.2 Field-Based Observation
The second method is to carry out longitudinal observation of experienced oper-ators. The main advantage of this method is that it guarantees the ecologicalvalidity of the data. In general, observation is a valid technique, particularly if theaim is to investigate human reliability per se. In light of Mach’s (1905) observationabout the relationship between knowledge and error, there is a lot to be learnedabout operator performance under abnormal system operating conditions fromobserving performance under normal operating conditions.
Observational research tends to focus on one specific aspect of operatorbehavior, however, rather than on operator behavior per se. The observationalmethod, therefore, has a number of drawbacks. The first is the relatively lowfrequency of occurrence of human error. Although there may be a deterministicelement to the occurrence of human error, it is very difficult to predict preciselywhen a set of events or actions giving rise to an observable error will occur. Sothere is no guarantee that human error will occur, even during extended periods ofobservation.
The second drawback is the high costs associated with extended observationand the subsequent data analysis. Even if it could be guaranteed that human errorwould occur once in every 24 h period, for example, then gathering enough datafor 100 errors would require 2,400 h of recordings. Because analysis of recordeddata takes an order (or two) of magnitude longer than the recording, the time togather and to analyze such a large amount of data quickly becomes prohibitive.
The third drawback is the inherent adaptability of human behavior. One of thecharacteristics of experienced operators is their ability to detect and recover frompotential erroneous actions. In other words, recovery is performed beforeunwanted consequences arise. Unless verbal reports are also recorded, which can
290 10 Errors: An Inherent Part of Human-System Performance

be used to try and identify these recoveries, it can be difficult to detect where arecovery has taken place.
The fourth drawback is that the presence of an outside observer may affect theoperator’s behavior. In particular, operators may be more careful than usual if theyknow their performance will be recorded for subsequent analysis. This may reducethe frequency of occurrence of human error, thereby requiring even longer periodsof observation to gather enough data.
10.2.3 Archive Data
The third method is to use existing available data. Archive accident and incidentreports, for example, have been successfully used within human error research(e.g., Pew et al. 1981; Rasmussen 1980; Wagenaar and Groeneweg 1987; Woods1984). As with the other data collection methods, there are several pros and cons tousing archive data (Chappell 1994).
The first advantage of archive data is that the data are real in that they aretypically provided by participants in the incident. The second is that there are largenumbers of observations available (in contrast to accident data). The third is thatthe data have high ecological validity because it relates to real incidents thatoccurred under normal operating conditions. Finally, the cost of collecting the datais generally low, because the data already exist.
The main disadvantage of using archive data is that they usually have not beengathered for the specific purpose of the investigation at hand. The data thereforeoften have to be re-ordered and possibly re-represented before it can be appro-priately analyzed. The second disadvantage is that the detail in the reports may nothave been validated. The third is that the data may be subject to reporter biases, interms of who reports, and the information that gets reported which may be biasedby selective retrieval and rational reconstruction (Ericsson and Simon 1993).
10.2.4 Selecting the Most Appropriate Data CollectionMethod
The aim of each of the methods described above is to generate data that can beused to develop theories and models of human performance. Over the last20 years, since the earliest work there has been a shift towards an increased use ofreal world data (e.g., Hutchins 1995), especially when studying expert perfor-mance in dynamic environments. The ideal method, however, would combine thecontextual richness of real world situations with some of the experimental controlof laboratory conditions. The work on the HEAP (Hollnagel et al. 1996) comesclose to this ideal. The HEAP involved observing teams of operators running ahigh fidelity nuclear power plant simulator. Even with the HEAP work, however,
10.2 Studying Error 291

there were problems. The operators either knew or could guess the purpose of thestudy. As a result they had a higher than normal expectation that an abnormalsituation would arise during a simulator session. The sessions were also usuallylimited to 1 h rather than the duration of a normal shift.
If you are designing an interface for a nuclear power plant control system, forexample, you may regard ecological validity as being of paramount importance,and therefore decide against the use of laboratory experiments. Similarly, the hitand miss nature of using field observation for relatively infrequent events mitigatesagainst its use, except perhaps in longitudinal studies or where unusual resourcesare available. Archive data, on the other hand, naturally have high ecologicalvalidity—a judicious choice of data source should make it possible to gain accessto the hundreds of instances of human error required for analysis (Baxter 2000).
Ultimately your choice of method will depend on the weights you give to thepros and cons of the individual methods. In addition, however, you should makesure that you take into account the availability and access to the resources you willneed to carry out your study.
10.3 Error Taxonomies
Most scientific study is underpinned by a well-defined classification system ortaxonomy of the relevant phenomena. The taxonomy provides a frame of referencefor the study, and enables other researchers to evaluate the results of that study.Although several human error taxonomies have been developed, there is no uni-versal taxonomy that serves all the various purposes of error research (Senders andMoray 1991). Below we consider three well known examples.
The critical factor in generating a taxonomy of erroneous behavior is the choiceof level of abstraction to use for categorization. Determining an appropriate levelof abstraction requires that the purpose of the research be clearly defined. A usefulrule of thumb is to model behavior at a level that allows remedies to be generatedto facilitate the avoidance of a repetition of the same type of error in similarcircumstances in the future.
10.3.1 The Technique for Human Error Rate Prediction
The taxonomy used in the Technique for Human Error Rate Prediction (THERP,Swain and Guttman 1983) is based around the commonly used notions of errors ofomission and commission. In this taxonomy, actions can either be:
• Correct.• Errors of omission: actions that are omitted. It may be difficult, however, to
determine whether an action has been omitted or has just been delayed for a longtime.
292 10 Errors: An Inherent Part of Human-System Performance

• Errors of commission: actions that are performed inadequately, out of sequence,or at the wrong time (too early/late); or are qualitatively incorrect (too much/toolittle/wrong direction).
• Extraneous actions: actions that would not normally be expected at that par-ticular time and place.
In THERP the probabilities of the different errors occurring are conditioned byperformance shaping factors (PSFs). The PSFs are intended to take some accountof the context in which the error occurs, to improve the accuracy of the individualerror probability estimates. They are usually divided into external PSFs (such assituational characteristics), stressor PSFs (such as psychological stressors), andinternal PSFs (such as organismic factors like previous training).
10.3.2 Generic Error Modeling System
Rasmussen’s (1976) SRK model of behavior (see Chap. 5) has been used as thebasis for several taxonomies that describe human performance in the operation ofcomplex control systems, including Reason’s (1990) Generic Error ModellingSystem (GEMS). Reason distinguishes between three types of errors: slips, lapses,and mistakes (see also Norman 1981). Slips (execution failures) occur when theperson has the right intention but performs the wrong action. Lapses (memorystorage failures) occur between the formulation of an intention and the executionof some action. Mistakes (intention failures) occur when the person initiates thewrong plan of action for the task at hand. Within the GEMS taxonomy, errors canbe associated with planning, with storage, or with execution of actions (seeTable 10.1).
Skill-based errors (slips and lapses) are normally attributable to monitoringfailures. In particular, they are often linked to a lack of attention, whether delib-erate or unintentional.
The rule- and knowledge-based errors (mistakes) are usually associated withproblem solving activities. At the rule-based level, mistakes can arise when goodrules are misapplied, or bad rules are applied. At the knowledge-based level,mistakes usually arise due to a lack of expertise, because people do not have all theknowledge required to perform the task at hand. Figure 10.2 shows the relation-ship between the different types of errors in GEMS and a typical stage model ofhuman information processing.
Table 10.1 GEMStaxonomy
Planning Knowledge-based mistakesRule-based mistakes
Storage Skill-based lapsesExecution Skill-based slips
10.3 Error Taxonomies 293
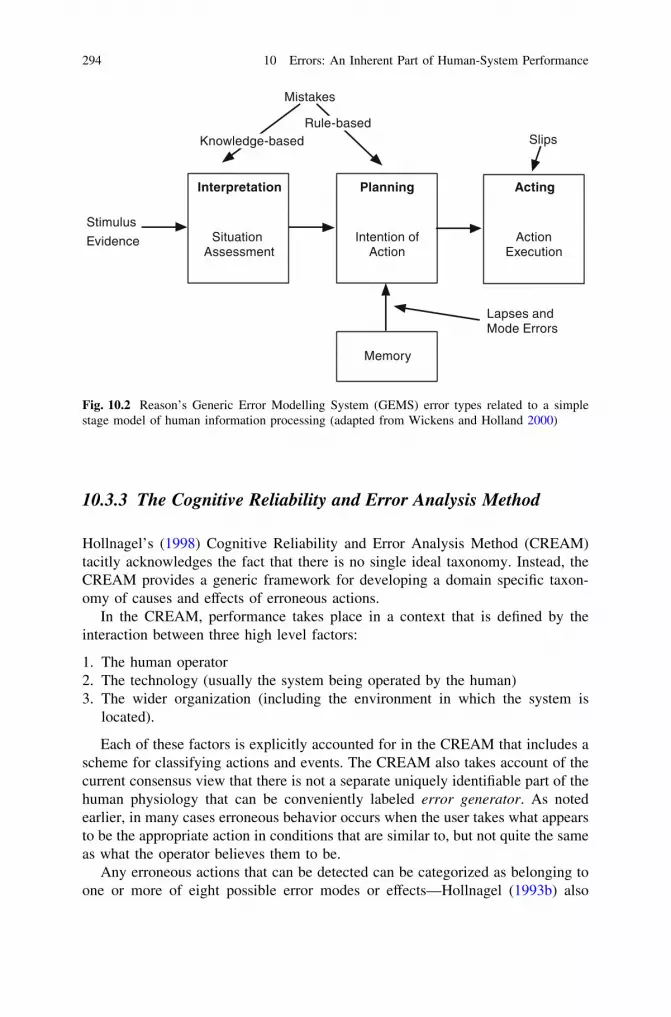
10.3.3 The Cognitive Reliability and Error Analysis Method
Hollnagel’s (1998) Cognitive Reliability and Error Analysis Method (CREAM)tacitly acknowledges the fact that there is no single ideal taxonomy. Instead, theCREAM provides a generic framework for developing a domain specific taxon-omy of causes and effects of erroneous actions.
In the CREAM, performance takes place in a context that is defined by theinteraction between three high level factors:
1. The human operator2. The technology (usually the system being operated by the human)3. The wider organization (including the environment in which the system is
located).
Each of these factors is explicitly accounted for in the CREAM that includes ascheme for classifying actions and events. The CREAM also takes account of thecurrent consensus view that there is not a separate uniquely identifiable part of thehuman physiology that can be conveniently labeled error generator. As notedearlier, in many cases erroneous behavior occurs when the user takes what appearsto be the appropriate action in conditions that are similar to, but not quite the sameas what the operator believes them to be.
Any erroneous actions that can be detected can be categorized as belonging toone or more of eight possible error modes or effects—Hollnagel (1993b) also
Stimulus
Evidence
Mistakes
Slips
ActionExecution
Planning
Intention ofAction
Situation Assessment
Interpretation
Memory
Lapses andMode Errors
Acting
Knowledge-basedRule-based
Fig. 10.2 Reason’s Generic Error Modelling System (GEMS) error types related to a simplestage model of human information processing (adapted from Wickens and Holland 2000)
294 10 Errors: An Inherent Part of Human-System Performance

refers to these as the logical phenotypes of human error—each of which canmanifest itself in several ways (shown in italics):
• Timing: the action is too early/too late/omitted.• Duration: the action is too long/too short.• Force: the action uses too much/too little force.• Distance: the action is carried on too far/too short.• Speed: the action is too fast/too slow.• Direction: the action is performed in the wrong direction or involves the wrong
type of movement.• Object: the action was carried out on a proximal object/similar object/unrelated
object rather than the required object.• Sequence: in a sequence of actions there was an omission/skip forward/skip
backward/repetition/reversal or the wrong action was performed.
In addition, the CREAM makes provision for the inclusion of correct actions.Hollnagel (1998) suggests that a category labeled no erroneous action should beincorporated, either by adding it to each of the classification groups or by keepingit as a separate group.
The category of error mode to which a particular instance of an erroneousaction belongs may not always be immediately obvious. In such cases, the par-ticular situation at hand has to be carefully considered before any judgment can bemade. This need for considered judgments is critical to the field of human errorresearch, because the labeling of a particular action as being erroneous is invari-ably a judgment made in hindsight (Woods et al. 1994).
The other part of the CREAM taxonomy is made up of the possible causes, orgenotypes. These are divided into three main categories as shown in Table 10.2.There is one category for each of the main factors that contribute to systemperformance: people, technology, and context (described as organization-related inthe CREAM).
Table 10.2 The CREAMgenotypes of human error
Person-related ObservationInterpretationPlanningTemporaryPermanent
Organization-related CommunicationTrainingAmbient conditionsWorking conditions
Technology-related Equipment failureProceduresTemporary interface problemsPermanent interface problems
10.3 Error Taxonomies 295

10.4 Analyzing Errors
There are many techniques available for analyzing errors, and any of them willusually provide some useful insights to help you understand what happened. Herewe briefly discuss four techniques. Two have been widely used for several years inthe safety systems engineering community. The others are more recent, and areless widely used, but offer interesting (and useful) perspectives for analyzingerrors. Irrespective of which technique you choose (including those not coveredhere), you should make sure that it can be applied systematically.
10.4.1 Event Trees
Event trees are a bottom-up (inductive) technique for analyzing errors. They showthe sequences of events that lead to all the possible outcomes. The trees are basedon simple binary logic: at each node in the tree there are two possible branchesbased on whether an event does or does not happen (or whether a component failedor did not fail). The trees start with an initiating event, and are generated by thinkingof all the possible consequences at each node in the tree. Each of the events can beassigned a probability (the sum of the probabilities for each of the two branches fora single node must add up to 1). The probability of all the identified outcomes canbe calculated by multiplying together (ANDing) all the event probabilities along thepath that leads from the initiating event to the outcome.
Figure 10.3 shows a quantified event tree for the case where a fire breaks out inan office block. The initiating event (shown at the left of the tree) is the fact thatthe fire starts, and the estimated frequency of this occurrence is one per year. Thelikelihood of the various resultant events (outcomes) is calculated by multiplyingthe appropriate probabilities together. The probability of multiple fatalities for thisscenario, for example, is 0.015 (i.e., 0.1 9 0.3 9 0.5).
10.4.2 Fault Trees
Fault trees are similar to event trees, although they are generated in a top down(deductive) manner, starting with the outcome and working backwards in time totry to find all the things that could have caused that particular outcome. Fault treesdo not have to be binary trees, and an outcome can be determined by ANDing andORing together a set of causal factors, as appropriate. Fault trees are normally onlyconcerned with immediate effects, rather than the creation of latent conditions thatcan lie dormant within a system until some particular trigger activates them.
Fault trees can be either qualitative or quantified. To quantify a fault tree, aprobability of occurrence is allocated to each of the lowest level leaf nodes in the
296 10 Errors: An Inherent Part of Human-System Performance

tree. Fault trees can also be modified to include recovery actions; the resultant treesare usually called recovery trees (van der Schaaf 1991).
Figure 10.4 shows an example of a quantified fault tree for accidents at aparticular road junction. The legend at the left of the figure describes the proba-bilities used in the figure. Cars driving too fast at this road junction, for example,occur frequently, so it is given a probability of 0.1.
10.4.3 CREAM
The CREAM can be used both for the retrospective analysis of accidents and theprospective analysis of possible errors in a system that is being designed. In bothcases, the method that is followed is essentially the same.
Here we will only focus on the simple retrospective use of the CREAM (asshown in Fig. 10.5). The process starts with the description of the initiating event(which could be an accident or incident). This description needs to provide enoughdetail to form the basis for the analysis. From this description it should be possibleto identify the error mode(s) (or phenotypes) associated with the event. The nextstep is to try and identify the possible antecedents for that error mode, using the setof tables of antecedents and consequents that lie at the heart of the CREAM method.If a specific antecedent is found, or there are no general antecedents for the errormode, then the analysis is complete. If a general antecedent is found then the nextstep is to find the general consequent associated with that antecedent. If none can befound, the analysis terminates, otherwise we use the general consequent as a spe-cific consequent, and go through the loop again, this time trying to find a matching
Y
Y
Y
N
N
NP = 0.1
P = 0.9
P = 0.7
P = 0.3
P = 0.5
P = 0.5
Fire Starts
Frequency = 1/yr
Initiating Event
Fire Spreads Quickly?
Sprinkler Fails To Work?
People Cannot Escape?
Resultant Event
Scenario
Multiple Fatalities
Loss / Damage
Fire Controlled
Fire Contained
1
2
3
4
Fig. 10.3 Example quantification of event tree for a building protected by a sprinkler system(reproduced with permission from the Institution for Engineering and Technology)
10.4 Analyzing Errors 297

antecedent for the specific consequent (rather than the error mode). As the processcontinues, a structure that looks like a tree of antecedents and consequents is builtup. Note that these are really the possible antecedents and possible consequents.Some of them may be ruled out by what really happened during the event.
Using the CREAM to analyze errors can become quite involved, and is beyondthe scope of this book. Hollnagel’s (1998) book includes a good example of ananalysis of a railway accident that occurred in New York in 1995 which is worthlooking at, for those who are interested. Although the CREAM has not beenwidely adopted—partly because of a lack of tool support1—it does offer a niceillustration of how taking a different view of errors can generate new insights.
10.4.4 THEA
The Technique for Human Error Assessment (Pocock et al. 2001) assumes, like theCREAM, that the context in which actions are performed is one of the majorinfluences on human performance. Like the CREAM, THEA is an iterative
Crash atT-junction
Top Event p = .001
AND
Car on main road
p = .01
Car on side road fails to stop
OR
Car on side road did not stop
Car on side road could not stop
ORp = .12 ORp = .011
Driving too fast
Driver too ill
Driver's vision
blocked
p = .01p = .1 p = .01
Roadtoo
slippery
Carbrakesfailed
Car tyres worn
p = .001p = .01 p = .0001
1 in 10
1 in 100
1 in 1,000
1 in 10,000
1 in 100,000
1 in 1M
Frequent
Probable
Occasional
Remote
Improbable
Extremely Remote
p = .131
Fig. 10.4 A quantified fault tree showing the likelihood of a crash occurring at a given roadjunction (reproduced with permission from the Institution for Engineering and Technology)
1 Although there is a browser based tool at http://www.ews.uiuc.edu/*serwy/cream/.
298 10 Errors: An Inherent Part of Human-System Performance

process, although the iterations take place at a higher level, i.e., the level of thedesign of the system or device.
The THEA process (see Fig. 10.6) starts with a description of the system interms of its functional behavior, its interface, and how it communicates with othersystems. This description is accompanied by a corresponding description of thework performed by the system. This comprises one (or more) descriptive sce-narios, particularly focusing on the potential vulnerabilities of the system, and adescription of the sorts of tasks that will be performed in terms of goals, actions,and plans.
The system description and work descriptions are used to structure the scenario.Any appropriate method that can be used to decompose goals, such as hierarchicaltask analysis (described in Chap. 11), can be used.
Once you have a structured scenario, you can do the error analysis. The analysisis based on a set of questions and a model of human information processing.Although the THEA reference guide uses Norman’s (1988/2013) cyclic model ofinteraction, the process is model independent.
The final step is to consider the probability of the occurrence of the identifiederrors, and then make suggestions about changes to the design to deal with them.The process then iterates until some stopping point is determined, which willusually be down to the judgment of the designer.
As with the CREAM, THEA’s uptake has been somewhat limited but, like theCREAM, it also shows how a systematic approach to analyzing errors can be usedto inform design. Those who want more information should consult the THEAreference guide. THEA was originally designed to analyze situations involving asingle person using a single artifact, whereas nowadays most work is performed by
Descriptionof initiating
event(e.g., accident)
Determineerror mode
(generalconsequent)
Add specific consequent
Specificantecedent
No generalantecedent
Generalantecedent
Anymatch?
Match withgeneral
consequent
Analysiscomplete
No
Yes
Fig. 10.5 CREAM. The basic CREAM analysis process (redrawn by the authors)
10.4 Analyzing Errors 299

teams of people. THEA was therefore adapted and extended to create a newmethod, CHLOE. CHLOE takes into account how people collaborate to get workdone, and has been used to analyze errors in Air Traffic Control (Miguel andWright 2003).
10.5 Implications for System Design
We need to consider how people interact with technology in a particular contextwhen designing systems. Each of the components (people, technology, and con-text) can give rise to errors, so we need to design systems to take account of this,and try either to prevent the errors or at least to mitigate their consequences. It isalso vital that we consider the interdependencies between people, technology, andcontext, because these can also give rise to errors.
We know that most systems can be described as socio-technical systems, in thatthey have social (people-related) components and technological components.Unfortunately, however, many designers think this means that the system can bedecomposed into a social subsystem and a technical subsystem. In reality, such anatomistic decomposition is inappropriate, because of the interactions and inter-dependencies between the system’s social and technical components. If theseinteractions and interdependencies are ignored, the emergent system behaviors(including errors) that they give rise to may be overlooked. Many system devel-opers who claim that they use a socio-technical approach often decompose thesystem into social and technical subsystems, and focus most of their attention onthe technical subsystem.
Allied to the decomposition into human and technical components is a tech-nique called function allocation. When designing a system, you will need to
AnalyseScenario
(e.g., HTA)
SystemDescription
Work Description
ErrorAnalysis
(using human IP model)
Suggestedchanges
(requirements & design)
Fig. 10.6 The THEA process
300 10 Errors: An Inherent Part of Human-System Performance

identify the list of functions that the system has to perform. These functions arethen allocated to either the human or the machine using a static approach that isoften based on Fitts’ (1951) list, which is also referred to as the MABA-MABA(Men Are Better At–Machines Are Better At) approach. The problem with thisapproach is that designers often allocate all the tasks that they know how toautomate to the technology, and then leave the human to carry out all the others. Ifwe want to allocate functions effectively we need to consider the processingcharacteristics of both the humans and the technology so that we can reduce thechances of errors whilst performing a particular function.
If your system requires a lot of functions to be carried out in the same timeframe, you may overload the operator (and the technology), thereby increasing thechances of an error occurring. In this case you may want to consider whether youcan allocate functions dynamically, allowing tasks to be shed, and reallocated asworkloads change. So, if operators get really busy, it should be possible for themto hand off tasks to the automation to reduce their workload, thereby improvingoverall system performance, and vice versa.
One of the ironies of automation (Bainbridge 1987) is that the more complexsocio-technical systems become, the more we rely on people to intervene to fixthem when errors occur. You will therefore often hear people talking about theneed to keep people in the loop. It is important that the users are kept aware ofwhat the system is doing, by providing them with feedback about the system’sstate. They can use this to detect errors, and to update their own mental model ofhow the system is working. It is also important that users are given the opportunityto practice their skills, so they do not forget how to carry out particular tasks,especially those that they perform infrequently. This is one of the reasons whyaircraft pilots have to undergo recurrent training, and are expected to hand fly theiraircraft on a fairly regular basis.
10.6 Summary
Human error is a complex subject, for several reasons:
• Confusion over the term itself, which gets used to describe the action, the causeof that action, and the consequence of that action too.
• The same factors govern the expression of both expertise and error.• Some of the contributors are latent, and lie hidden, waiting for other triggering
or potentiating factors.• Errors are judgments made in hindsight and require some measure of expected
human performance for comparison.• Human performance involves a distributed system of people interacting with
technology at the sharp end and organizational elements at the blunt end.• Decisions made at the blunt end of the system can constrain the way that work is
carried out at the sharp end.
10.5 Implications for System Design 301

• The way technology is deployed shapes human performance, creating thepotential for new forms of error and failure.
Errors will happen. You may be able to get some idea of the sorts of errors thatmay occur with your system by looking at archive data, where it exists. Alter-natively, you may be able to collect data by running experiments using yoursystem or an appropriate simulator.
You can take appropriate account of potential errors by carefully consideringthe type of system that you are designing, the people who will use it, and thecontext in which they will operate it. There are several methods that will help youanalyze your system for potential errors, including Event Trees, Fault Trees, theCREAM, and THEA, even at design time.
10.7 Other Resources
It is worth looking at Sidney Dekker’s books to get a fuller understanding of thenew (some would say more enlightened) view of human error. Ten QuestionsAbout Human Error (Dekker 2005) is an easy and entertaining read, whilst alsobeing thought provoking. In it he addresses the issue of human error by posing thefollowing questions, and then going on to explain and to answer them at length:
1. Was it mechanical failure or human error?2. Why do safe systems fail?3. Why are doctors more dangerous than gun owners?4. Don’t errors exist?5. If you lose situation awareness, what replaces it?6. Why do operators become complacent?7. Why don’t they follow procedures?8. Can we automate error out of the system?9. Will the system be safe?
10. Should we hold people accountable for their mistakes?
You should be able to start to answer at least some of these questions foryourself at this point.
The problems of dealing with blame, and how to establish a just (i.e., fair) culture,form the content of Dekker’s book, Just Culture (Dekker 2007). In it he givesseveral examples of the sorts of problems that can occur when trying to make surethat justice (in the widest sense of the word, rather than just the legalistic view) isserved. The main focus of the book is on trying to balance safety and accountabilityso that people who make honest mistakes are not necessarily held to be culpable. Hedispels the simplistic idea about needing to punish those that cross the line, byshowing that who gets to draw the line, and where they get to draw it, are majordeterminants in deciding whether someone will be regarded as culpable or not.
302 10 Errors: An Inherent Part of Human-System Performance

10.8 Exercises
10.1 Redraw Fig. 10.3, the event tree, for errors when entering a purchase on asmartphone or other mobile device. You can make (and may need to make)assumptions about the application and about people. Note these assumptions,and note briefly what studies or references you would need to read to find outmore accurate answers.
10.2 Interact through several transactions with an online commerce site, such asabebooks.com, or an online library, or other online service that deliversinformation. Keep a log of errors you make using a keystroke logger, anobserver, or video. Analyze these errors for frequency and type using twodifferent taxonomies.
10.3 What are the error rates while typing? When you read a finished document,it looks like there are none. In this exercise, gather some data on error rateswhile typing. You can do this in several ways. You could ask people to typewithout looking at what they are typing. This would give an uncorrectederror rate. You could show them a paper to type, and check how many lettersare different between the source and their typing (using the Unix ‘diff’ tool,or using Word’s compare documents). You could also set up a web page andsee how many times a user clicks on the correct link when asked. In youranalyses you should consider what errors are more common, and what maylead to increased errors.
10.4 In 2009 a man drove his $1 million Bugatti Veyron car into a lake. He blamedit on dropping his cell phone. Extend the fault tree in Fig. 10.4 to include theeffect of cell phones on accidents. To do this, you will have to note where cellphones will interact with driving, and you will have to attempt to providequantitative measures of how often events happen with a cell phone.
References
Air Accidents Investigation Branch. (1989). Report on the accident to Boeing 737-400- G-OBMEnear Kegworth, Leicestershire. Retrieved 8 March 2014, from http://www.aaib.gov.uk/publications/formal_reports/4_1990_g_obme.cfm
Arnstein, F. (1997). Catalogue of human error. British Journal of Anaesthesia, 79, 645–656.Bainbridge, L. (1987). Ironies of automation. In J. Rasmussen, K. Duncan, & J. Leplat (Eds.),
New technology and human error (pp. 271–283). Chicester: John Wiley.Baxter, G. D. (2000). State misinterpretation in flight crew behaviour: An incident-based
analysis. Unpublished PhD Thesis, University of Nottingham.Besnard, D., Greathead, D., & Baxter, G. (2004). When mental models go wrong. Co-occurrences
in dynamic, critical systems. International Journal of Human-Computer Studies, 60(60),117–128.
Bogner, M. S. (Ed.). (2004). Misadventures in health care. Mahwah, NJ: Erlbaum.Chappell, S. L. (1994). Using voluntary incident reports for human factors evaluations. In N.
Johnston, N. McDonald, & R. Fuller (Eds.), Aviation psychology in practice (pp. 149–169).Aldershot, UK: Avebury.
10.8 Exercises 303

Dekker, S. (2005). Ten questions about human error: A new view of human factors and systemsafety. Mahwah, NJ: Erlbaum.
Dekker, S. (2007). Just culture: Balancing safety and accountability. Aldershot, Hampshire,England: Ashgate Publishing.
Dismukes, K., Young, G., & Sumwalt, R. (1998). Cockpit interruptions and distractions:Effective management requires a careful balancing act. ASRS Directline, 10, 4–9.
Ericsson, K. A., & Simon, H. A. (1993). Protocol analysis: Verbal reports as data (2nd ed.).Cambridge, MA: MIT Press.
Fitts, P. M. (1951). Human engineering for an effective air navigation and traffic control system.Washington, DC: National Research Council.
Gigerenzer, G. (2004). Dread risk, September 11, and fatal traffic accidents. PsychologicalScience, 15(4), 286–287.
Hollnagel, E. (1993a). Human reliability analysis: Context and control. London: Academic Press.Hollnagel, E. (1993b). The phenotypes of erroneous actions. International Journal of Man-
Machine Studies, 39, 1–32.Hollnagel, E. (1998). Cognitive reliability and error assessment method. Oxford, UK: Elsevier
Science.Hollnagel, E., Drøivoldsmo, A., & Kirwan, B. (1996). Practical insights from studies of operator
diagnosis. In Proceedings of ECCE-8. Eighth European Conference on Cognitive Ergonomics(pp. 133–137). Granada, 8–12 Sept, 1996. Rocquencourt, France: European Association ofCognitive Ergonomics.
Hollnagel, E., Woods, D. D., & Leveson, N. (Eds.). (2006). Resilience engineering: Concepts andprecepts. Aldershot, UK: Ashton Press.
Hutchins, E. (1995). Cognition in the wild. Cambridge, MA: MIT Press.Johnson, C. W., & Holloway, C. M. (2007). A longitudinal analysis of the causal factors in major
maritime accidents in the USA and Canada (1996–2006). In The Safety of Systems: Proceedingsof the 15th Safety-Critical Systems Symposium (pp. 85–104). London, UK: Springer.
Kemeny (chairman), J. G. (1979). The need for change: The Legacy of TMI. Washington, DC:The President’s Commission on the accident at TMI.
Mach, E. (1905). Knowledge and error (English Trans., D. Reidel, 1976). Dordrecht,Netherlands: Reidel.
Miguel, A., & Wright, P. (2003). CHLOE: A technique for analysing collaborative systems. InProceedings of 9th Conference on Cognitive Science Approaches to Process Control (pp.53–60). New York, NY: ACM Press.
Nardi, B. A. (1996). Context and consciousness: Activity theory and human-computerinteraction. Cambridge, MA: MIT Press.
Norman, D. A. (1981). Categorization of action slips. Psychological Review, 88, 1–15.Norman, D. A. (1988). The psychology of everyday things. New York, NY: Basic Books.Norman, D. A. (2013). The design of everyday things. New York, NY: Basic Books.Petroski, H. (1985/1992). To engineer is human: The role of failure in successful design. New
York, NY: Vintage Books.Petroski, H. (1994). Design paradigms: Case histories of error and judgment in engineering.
Cambridge, UK: Cambridge University Press.Petroski, H. (2006). Success through failure: The paradox of design. Princeton, NJ: Princeton
University Press.Pew, R. W., Miller, D. C., & Feeher, C. E. (1981). Evaluation of proposed control room
improvements through analysis of critical operator decisions (EPRI-NP-1982). Cambridge,MA: Bolt, Beranek & Newman.
Pocock, S., Harrison, M., Wright, P., & Johnson, P. (2001). THEA: A technique for human errorassessment early in design. In Proceedings of Human-Computer Interaction: INTERACT’01(pp. 247–254). Amsterdam, The Netherlands: IOS Press.
Randell, B. (2000). Facing up to faults. The Computer Journal, 43, 95–106.
304 10 Errors: An Inherent Part of Human-System Performance

Rasmussen, J. (1976). Outlines of a hybrid model of the process operator. In T. G. Sheridan &G. Johannsen (Eds.), Monitoring behavior and supervisory control (pp. 371–383). New York,NY: Plenum.
Rasmussen, J. (1980). What can be learned from human error reports? In K. Duncan,M. Gruneberg, & D. Wallis (Eds.), Changes in working life (pp. 97–113). Chichester, UK:Wiley.
Rasmussen, J. (1988). Human error mechanisms in complex work environments. ReliabilityEngineering and System Safety, 22, 155–167.
Rasmussen, J., Pejtersen, A.-M., & Goodstein, L. P. (1994). Cognitive systems engineering.Chichester, UK: Wiley.
Reason, J. (1990). Human error. Cambridge, UK: Cambridge University Press.Senders, J. W., & Moray, N. P. (1991). Human error: Cause, prediction, and reduction. Hillsdale,
NJ: Erlbaum.Swain, A. D., & Guttman, H. E. (1983). A handbook of human reliability analysis with emphasis
on nuclear power applications. Washington, DC: US Nuclear Regulatory Commission.van der Schaaf, T. W. (1991). A framework for designing near miss management systems. In
T. W. v. d. Schaaf, D. A. Lucas & A. Hale (Eds.), Near miss reporting as a safety tool(pp. 27–35). Oxford, UK: Butterworth-Heinemann.
Vaughan, D. (1997). The Challenger launch decision. Chicago, IL: University of Chicago Press.Wagenaar, W. A., & Groeneweg, J. (1987). Accidents at sea: Multiple causes and impossible
consequences. International Journal of Man-Machine Studies, 27, 587–598.Wickens, C. D., & Hollands, J. G. (2000). Engineering psychology and human performance
(3rd ed.). Upper Saddle River, NJ: Prentice-Hall.Wiener, E., Kanki, B., & Helmreich, R. L. (Eds.). (1993). Cockpit resource management.
London, UK: Academic Press.Woods, D. D. (1984). Some results on operator performance in emergency events. Institution of
Chemical Engineers Symposium Series (Vol. 90, pp. 21–31).Woods, D. D., Johannesen, L. J., Cook, R. I., & Sarter, N. B. (1994). Behind human error:
Cognitive systems, computers, and hindsight. Wright-Patterson Air Force Base, OH:CSERIAC.
References 305

Part IIIMethods

Chapter 11Methodology I: Task Analysis
Abstract Task analysis (TA) is a useful tool for describing and understandinghow people perform particular tasks. Task analyses can be used for several pur-poses ranging from describing behavior to helping decide how to allocate tasks to ateam. There are several methods of TA that can be used to describe the user’s tasksat different levels of abstraction. We describe some of the most commonly usedmethods and illustrate the use of TA with some example applications of TA. TA iswidely used but when using TA there are considerations to keep in mind such asthe fact that many approaches require an initial interface or specification, and thatmany do not include context multiple users or ranges of users. These consider-ations help describe where and when TA can be successfully applied and whereTA will be extended in the future.
11.1 Introduction
You should by now be familiar with the idea that when we are designing user-centered systems we are thinking about particular people doing particular tasks ina particular context. So far in this book we have looked in some detail at people-related aspects, and at some of the context-related aspects. In this chapter we focusmore on task-related issues.
To understand what people do when they perform a task we use a techniquecalled task analysis (TA). TA provides a way to describe the users’ tasks andsubtasks, the structure and hierarchy of these tasks, and the knowledge theyalready have or need to acquire to perform the tasks. Using these descriptions itbecomes possible to predict how long users will take to learn a task, and how longthey will take to perform a task. In this chapter we will mostly focus on the sorts oftasks that are nowadays carried out using some form of computer-based system.
TA can be used in most stages of system development. Before carrying out aTA, however, Diaper (2004) suggests that you first identify the stages of
F. E. Ritter et al., Foundations for Designing User-Centered Systems,DOI: 10.1007/978-1-4471-5134-0_11, � Springer-Verlag London 2014
309

development when TA will be used, and then ask four interrelated questions foreach of the identified stages:
1. What knowledge do you want the TA to provide? Frequently this is not an easyquestion to answer and your answer may need to be refined as you start to learnmore and uncover interesting issues.
2. What format should the output of the TA take? The output from a TA may notmap directly onto software engineering representations, so the contribution of aTA may sometimes be indirect, e.g., building models of the world through TAcan improve the models that are used in software engineering.
3. What data can be collected? Data can be collected using several methods suchas observing performance, interviews, document analysis, training programanalysis, and analysis of existing systems.
4. Which method should be used? The choice should be based on knowledgeabout the input data and the desired output data, rather than familiarity with aparticular method.
The results of a TA can be prescriptive or descriptive, depending on the aims ofthe analyst. Prescriptive analyses show how the user should carry out the task, andhence are associated with normative behavior. Prescriptive analyses can be used tohelp create safety procedures, and standard operating procedures, which prescribehow the user should carry out particular tasks. In contrast, descriptive analysesshow how users really carry out the task, and are hence associated with actualbehavior. Descriptive analyses are usually more situation specific than prescriptiveanalyses. It is important to be able to distinguish between the two, however. Aprescriptive analysis of car driving, for example, would not include anything aboutdriving above the speed limit; a descriptive analysis would be more likely toinclude details about people driving faster than the speed limit (perhaps only forparticular sections of the road network).
When thinking about the different types of TA that are available, it is importantto remember that there may be some slight differences in the way they use termssuch as goals, tasks, and actions. In general, goals are achieved by carrying outtasks. These tasks are usually performed as a series of actions on some object.
In the rest of the chapter we first provide some examples of how task analysiscan be used before describing four approaches to TA. The different approachesshould be seen as complementary, as each has its own particular strengths andweaknesses. Although the approaches are similar in several respects, such as theneed to apply them systematically, they also differ in many respects, such as thetypes of development activities they can support, and the level of detail that theycan provide. For each of the different TA approaches we provide examples of howthey can be used, and note some of their strengths and weaknesses. We finish bynoting some of the limitations of TA.
310 11 Methodology I: Task Analysis

11.2 The Uses of Task Analysis
TA can be used for many different purposes. Kirwan and Ainsworth (1992), forexample, identify six areas where TA can be applied, which are noted inTable 11.1.
It should be noted that these areas are not all independent and sometimesoverlap. Here we focus our discussions on the last three items, because these arethe ones that are most closely associated with the process of designing user-centered systems.
11.2.1 Allocation of Function
The traditional way of allocating functions to users has been to use a Fitts’ (1951)list approach, based on whether the associated tasks are better carried out bypeople or by computers. In the original formulation there was often only oneperson, and one machine to think about. Nowadays, however, there may be severalpeople, working together as a team, and several computer-based systems to con-sider. A task analysis helps you identify the knowledge that is needed to carry outthe functions, and so can be used to inform how the functions are allocated. At thehighest level it also lets you lay out a list of all the tasks that will need to beallocated. As part of Cognitive Work Analysis, Vicente (1999) has developed anapproach to take large descriptions of tasks and use the complete set of tasksacross a team of users to allocate sets of tasks to users that make sense to the usersbased on the large set rather than traditional job descriptions or existing interfaces.
11.2.2 Performance Assurance
The way that systems are used often changes over time. This is due partly to theway the system evolves, partly to the way people learn to use the system over time,and partly to changes in the context in which the system is deployed. The net effectis that there will often be a change in the tasks that the user carries out. It is
Table 11.1 Areas where TAcan be applied, adapted fromKirwan and Ainsworth (1992)
1. Person specification2. Staffing and job organization3. Skills and knowledge acquisition4. Allocation of function5. Performance assurance6. Task and interface design
11.2 The Uses of Task Analysis 311

therefore important to continually check that the system still supports the user incarrying out those tasks that have changed. When there are large numbers of tasks,this can be both particularly daunting and important.
For example, university department web sites have a large number of tasks orinformation content types that users look for. Figure 11.1 notes the mismatch thathas happened on some sites. The list for a department or college consists of over100 types of information (Ritter et al. 2002). Sites can use that list to investigatewhether a site supports all the anticipated information needs of their users. Ritterand colleagues’ list has been used to make specific suggestions about how thesesites should be updated, including putting up more information, and distributingthe updating across members of the college because it is too much for a singleperson to update.
Another use of TA is to find out more about how a task is done. When youcompare the way that people are supposed to perform tasks, and the way theyactually carry them out, there are often several noticeable differences. Creating aTA can help you to understand what the user is doing because you have a betterunderstanding of the task, and often discussion based on a TA with users to updatethe TA provides further insights into why they are behaving in a particular way, forexample, because of their particular knowledge or the context in which theyperform the task.
Campus slideshow
Letter from the president
Alumni in the news
Pressreleases
Statement of the university's philosophy
Virtual tour
Picture of president
Welcome fromthe president
Promotionsfor alumni
events
Mascot pictures
Things on the front page of a university website
Things users look for on the web site
Full name of the
university
List of faculty phonenumbers and emails
Campusaddresses
Academiccalendar
Parkinginformation
DepartmentsCourse lists
Campus police phone number
Campus mapby location
Campus mapby building name
How to obtaintranscripts
Faculty publications
Fig. 11.1 The potential mismatch between university department web sites built without athoughtful task analysis and what users want from university department web sites. Inspired by acartoon from xkcd.com
312 11 Methodology I: Task Analysis
11.2.3 Task and Interface Design
TA can be used in several ways to guide task and interface design as listed below.
1. To predict user task performance. These predictions of time, errors, or work-load can be used to compute whether an interface can be used to perform atime-sensitive task (e.g., interact with a video game), or how many copies of aninterface are needed to support a number of users (e.g., the minimum and theoptimal number of ATMs or ticket machines in an airport), or when a systemneeds to be speeded up to keep pace with the user. This approach has been andis being used to guide the requirements of how many sailors are needed to run aship (Chipman and Kieras 2004).
2. To suggest where users will make mistakes. Furthermore, we can take twotypes of task analysis and look at their relationship—for example, is the rela-tionship between goals/subgoals and the chronology of actions simple orcomplex? Are similar tasks similar? Are common safe tasks easy to do andexpensive or dangerous tasks harder to do? Where there is a complex rela-tionship between the users’ goal structure and the interface’s action structure,then an interface may be hard to use and may lead to more errors than it shouldor could. This approach has been applied to tasks in aviation. Models are builtof how ATC interacts with pilots (Freed and Remington 1998) or how groundcontrol navigates planes (Byrne and Kirlik 2005). The results suggest ways toavoid errors and ways to mitigate the effects of errors.
3. To understand the relationship between old and new versions of a system.Given a task analysis of how people currently do a task, or would conceive ofdoing the task, we can ask how much that process and knowledge overlaps withthe formal analysis of how it should be done in the new system. Increasedsimilarity of how to use both systems can help with efficiency of learning, use,and comfort, and can lead to greater acceptance of the new system. The originalwork in this area (Bovair et al. 1990; Kieras and Polson 1985) noted theknowledge to use an initial editor, and then compared that to the knowledge touse a new editor. The results provide several suggestions, including: thatignoring old knowledge is easy; that modifying existing knowledge is, ofcourse, slower; and that learning new knowledge slows the user down the most.
4. To compare different designs. A task analysis of two interfaces can predictwhich interface will be faster and easier to use, as long as the two designs arereasonably distinctive. In most cases, however, the comparisons are accurateand useful. Gray et al. (1992), for example, used TA to compare the interfacefor a new system that was to be used by telephone toll operators—the peoplewho used to respond when you dialed 0—against the old system’s interface.The new interface was predicted to be slower, and an empirical test confirmedthis. It also showed that the effect of the difference in performance would costthe telephone company about $2 million per year.TA has been used to investigate the design of menus using real and simulatedcell phones (St. Amant et al. 2004, 2007). In this project a user model was
11.2 The Uses of Task Analysis 313
created to perform a set of five tasks using a particular cell phone. The taskswere to adjust the ringer volume, access the tip calculator, view all contacts,view the date, and access the web browser. The resulting model was used topredict how long it would take to perform the five tasks with a cell phone andits initial menu structure. When compared with data from five practiced usersthe predictions turned out to be fairly accurate, but also showed where there wasroom for improvement in the design of the menus. The model suggested thatreordering the menus to put the most often used menu items first would saveabout 30% of the total interaction time.
5. To create user manuals. The results of the TA show in detail the steps that areinvolved in carrying out a task. User manuals can be created by translating thisinto text and elaborating, where appropriate. Basing the manual on a taskanalysis helps to make the manual more accurate, and more acceptable to theusers, particularly if the TA was used to analyze how users really did the tasks.
Closely related to the idea of user manuals is the notion of training people to dothe task. In safety critical systems, for example, you want all the users to do thesame task in (more or less) the same way. A TA can be used as the basis fordeveloping standard operating procedures (which are used in domains other thansafety critical systems too). In addition, because the TA shows the knowledge thatis required to carry out particular tasks, it becomes possible to compare what theusers know with what they need to know. Where any gaps are identified, thissuggests where training could be useful to increase the users’ knowledge to theappropriate levels.
11.3 Hierarchical Task Analysis
Hierarchical Task Analysis (HTA) is probably the most widely used method inhuman factors and ergonomics. An initial HTA is often a precursor to the use ofother methods, largely because it provides details about task activity. The preciselevel of detail depends on the depth of the analysis, which is determined by theoriginal purpose of the analysis. Like most methods of task analysis, HTA takes adecompositional approach.
11.3.1 HTA Components
HTA involves decomposing goals into subgoals (Annett 2005), although it is oftendescribed in terms of decomposing tasks into subtasks. The order and structure ofthese goals and subgoals is represented visually. The analysis is usually presentedeither as a hierarchical graph structure, or in a tabular textual format. Each goal(and subsequent subgoals) will be accompanied by a plan. These plans, which
314 11 Methodology I: Task Analysis

describe how goals and subgoals are achieved, cover aspects such as the (possiblyconditional) sequencing of subgoals, the need for concurrency, and how cuedactions can direct performance.
11.3.2 Example Application of HTA
Table 11.2 shows a simple HTA for making an online purchase. It is not complete,but illustrates the major steps, and would be useful when talking about how toperform the task, and how to help users perform the task. It is complete enoughthat it could be used to start a design. The plan at the bottom of the table is anexample, high-level plan. The plan—plans are usually numbered, with plan 0being the plan associated with the top level goal—suggests that 1 must be com-pleted before 2. There would also be plans for the subgoals, and sub-subgoals asnecessary. There might also be other plans for different users and uses.
Examining the HTA in Table 11.2, we can start to identify some suggestionsfor design. If you wanted to provide your users with the option of browsing thelisting before logging in, for example, you would have to change the plan to allowtask 2 to happen before task 1, as well as afterwards, so the revised plan wouldlook something like:
Plan 0: 1 or 2, then 2 as needed, then 1 if needed, then 3.
Figure 11.2 shows the HTA (this time drawn as a graph) for getting a file from aweb-based email system. A plan for downloading the first file would include all thesub-tasks (1.1–1.4). A plan to download a second file could skip sub-tasks 1.1 and 1.2.
The analysis in Fig. 11.2 can also suggest changes to the design of the waythat the task is performed. Sub-task 1.2.2, for example, could be made moregeneral, allowing that users might move and click, and that CR might beaccepted as a way to move between fields. Further, it may be possible to skipsome sub-tasks in particular circumstances. If the browser remembers the user’sdetails then sub-task 1.2 could be skipped. Similarly, if the mail client downloadsthe files automatically (like many mail clients), sub-task 1.4 can be skipped. Thedetails about skipping sub-tasks would normally be described in the associatedplans.
Performing an HTA can be a time-consuming process involving manychoices. Although it yields a useful representational description, the techniquedoes not specify how to go about gathering the task information that you wish torepresent.
There is no hard and fast rule about the lowest level at which you shouldterminate the analysis. In general you should consider stopping at a natural level,where further analysis would not contribute any more to your understanding of thesituation. Usually it is fairly obvious when to do this. More formally, you canconsider using the so-called stopping rule. For this you need to assess the prob-ability, P, of inadequate performance and the cost, C, of inadequate performance if
11.3 Hierarchical Task Analysis 315

Table 11.2 An example hierarchical task analysis for making an online purchase
0 Perform online purchase1. Login
1.1. Select login screen1.2. Enter ID1.3. Enter password
2. Choose object2.1. Browse listing2.2. Select item
3. Pay3.1. Choose pay screen3.2. Select payment method3.3. Enter payment method details
Plan 0: 1, then 2 as many times as needed, then 3
Login to Webmail
Type name
Type "Tab"
Bring upbrowser
Scroll to email
Downloadfile
Move mouse
Clickon file
Select download location
Downloademail file
Enter name
Enterpassword
Clickmouse
Move mouse
Hand tomouse
Movehand
1.
.4.1.3.1.2.1.1.1
1.4.1. 1.4.2 1.4.31.2.1. 1.2.2. 1.2.3.
1.2.1.1
To download an email file,do steps 1.1, 1.2, 1.3, and 1.4
Fig. 11.2 Hierarchical task analysis of downloading an email attachment. (Further subtasksshown as three small boxes.)
316 11 Methodology I: Task Analysis

you did not expand the hierarchy down a level. You then multiply these together toget the stopping value: if this is acceptable, then you terminate the analysis(Kirwan and Ainsworth 1992).
11.3.3 Summary
The main advantage of HTA is that, when carried out correctly by a skilledanalyst, it can provide useful information to inform design relatively quickly. Itdoes not require the interface or the interface details to be fully specified, so it canbe used during the early stages of system development. Once created, the analysiscan be extended, using appropriate methods to provide further details on thecognitive aspects of the task. HTA’s main disadvantage is that the way in which itsresults are usually presented do not map readily onto the representations used bysoftware engineers. Either the task analyst or the system developer will probablyhave to carry out further work to translate the results of the HTA into somethingthat can be used during development.
11.4 Cognitive Task Analysis
As the nature of work in many domains moved from mostly manual control tomostly monitoring and supervisory control—sometimes described as a changefrom doing to thinking—it became increasingly important to take account of thecognitive aspects of work. Rather than pulling levers, opening and closing valves,the users now spent most of their time tracking the behaviour of a computer-basedsystem on a display screen, making decisions and interacting with the system usingthe relevant input devices (e.g., in aviation many aircraft now employ a joystickdevice rather than a control yoke to help fly it).
Cognitive Task Analysis (CTA; e.g., see Schraagen et al. 2000 for an overview)extends more traditional task analysis techniques to facilitate the collection ofinformation about the mental processes that underpin observable task performance.It should be noted that this does not mean that CTA and HTA are mutuallyexclusive: normally they should be used to complement one another.
11.4.1 CTA Components
A CTA will usually comprise the application of a set of methods (e.g., Seamsteret al. 1997 discuss a range of methods that can be used in the aviation domain).One of the first steps in carrying out a CTA is therefore to choose the methods andtools that are appropriate to the particular situation that is being studied. Themethods that can be used include:
11.3 Hierarchical Task Analysis 317

1. Interviews2. Concept (or card) sorting3. Verbal reports4. Cognitive walkthroughs5. GOMS (described in more detail below).
The choice of methods is influenced by factors such as the objectives of theCTA, the available resources, the types of tasks involved, and the skills of theperson doing the CTA.
Once the data for a CTA has been collected, the results from the variousmethods have to be compiled and interpreted. The results of the CTA shouldprovide details about the cognitive aspects of how tasks are performed, as well asdetails of the information and knowledge needed to perform those tasks and howthat information and knowledge are used.
11.4.2 Example Application of CTA
Baxter et al. (2005) carried out a case study of work in a neonatal intensive careunit where a new decision support system (Fuzzy Logic Respiratory Neonatal CareExpert, FLORENCE) was being developed. FLORENCE was intended to helpclinical staff make decisions about changes to the mechanical ventilator that isused to treat respiratory distress syndrome (RDS) in premature babies. It wasimportant that the introduction of FLORENCE did not adversely affect thedependability of the delivery of care in the unit, and that it was acceptable to users.A CTA was therefore carried out using lightweight rich pictures analysis (Monk1998), the critical decision method (CDM; Klein et al. 1989), and observation.
Task analysis methods, in general, pay little attention to the context in whichthe tasks are carried out; rich pictures analysis provides a way to take account ofthat context, although it is quite novel for it to be included as part of a CTA. In thiscase study, a rich pictures analysis was carried out to capture details about thecontext in which FLORENCE was to be deployed. Data was collected using semi-structured interviews to identify the roles, responsibilities, and concerns of eightmembers of staff working in the unit, including the staff that provide adminis-trative support in the unit. The analysis also showed how staff communicate andinteract with members of staff who work in other parts of the hospital, such as thetest laboratories. The importance of communication within the unit was alsoidentified, since it forms the basis for clinical care of the babies. Furthermore, thecentral role of the various patient records was highlighted: FLORENCE wouldhave to find some way to produce appropriate records.
The CDM was used to analyze how clinical staff make decisions about anychanges that need to be made to the settings of the mechanical ventilators used totreat the babies. It is critical that these decisions are correct and timely, otherwisethey can seriously adversely affect the babies’ health. The basic steps of the CDM
318 11 Methodology I: Task Analysis

were followed for the incidents selected by each of the eight participants, and acritical cue inventory—highlighting the cues that clinical staff paid attention to—and situation assessment records—which describe how the incident unfolded interms of cues, goals, expectations, and decisions—were developed for each inci-dent. These highlighted aspects such as the importance of having a distinctivealarm for FLORENCE because the unit already has several alarms sounding on afairly regular basis, and the hierarchy of decision making which flattens whendealing with acute incidents.
Finally, observation was used to capture details of how clinical staff workin situ to treat babies with RDS. RDS is self-regulating, and usually lasts around72 h. The treatment of two babies was recorded using timed note taking—the unitis a high stress situation, so video recording was not a viable option—over a 2-hperiod. The first baby was moved off the unit after 1 day; the second baby wasobserved on three consecutive days all at the same time of day. The results showedhow often staff interacted with the equipment around the babies’ cots under normalconditions and when an alarm sounded.
The results of the CTA were analyzed and used to inform the development ofFLORENCE. These included decisions about the interface (e.g., the need forinstructions about changes to ventilator settings to be precise and unambiguous,such as ‘‘increase PIP by 2–16’’), as well as training (e.g., staff need to learn howto prioritize their response to FLORENCE’s alarm) and more general physicalergonomics concerns (e.g., space is needed around the baby’s cot to accommodatethe PC running FLORENCE).
11.4.3 Summary
As its name suggests, CTA is particularly suited to analyzing the cognitive pro-cesses and products that people use when performing tasks. It is not so good atdealing with the work context in which performance takes place (although usingrich pictures analysis does provide at least a partial solution, e.g., see Baxter et al.2005). Carrying out a CTA can be quite time consuming, particularly when theselected methods require access to experts. CTA also requires that the analyst(s)are competent in carrying out a range of methods. Furthermore, it requires a highlevel of skill to be able to interpret the results of several methods in a holistic wayso that they can be presented to the system developers.
11.5 GOMS
GOMS is an acronym for Goals, Operations, Methods, and Selection rules (Cardet al. 1980, 1983). It is a method that can be used as part of a CTA, but we includeit in its own right because of its close relationship with the field of HCI.
11.4 Cognitive Task Analysis 319

The focus of GOMS is on specifying the details of error-free, expert behavior,and using the resulting specification to predict learnability, usability, and taskexecution times, allowing that there may be multiple strategies available forsimilar tasks. GOMS tends to be used when designing interactive technology likephones and GPS systems, where milliseconds can matter, where consistency in theusers’ knowledge and in the interface matters, and where operators may be expertbut not trained to do things in a single way.
The four GOMS techniques:
• GOMS: sometimes referred to as CMN-GOMS, using its authors’ initials todistinguish it from the generic name
• NGOMSL: Natural GOMS Language• CPM-GOMS: Cognitive Perceptual Motor GOMS, which supports concurrent
actions• The Keystroke Level Model (KLM) which is described in more detail below
are sometimes described as a family (John and Kieras 1996a). They vary in howeasy they are to apply and use.
11.5.1 GOMS Components
The components of GOMS are listed in Table 11.3. With GOMS models, thecognitive structure is represented in the concept of starting from Goals, and alsofrom the explicit use of Selection rules to indicate how Methods—comprising sub-goals and Operators—are chosen to accomplish those Goals.
11.5.2 Example Application of GOMS
Table 11.4 provides an example GOMS model for editing text. This model con-sists of two parts. The main task (which comes second in the table) is to performall the edits. This is a cyclical task, and represents starting with a marked upmanuscript and then performing the edits marked on the paper (or highlighted inthe electronic file). Each of the edits are unit tasks which define a single edit. A fullmodel would have multiple types of unit tasks for editing. The first part of themodel notes a declarative memory chunk about the Cut command, a unit task,including how to find it and what the keystroke accelerator is. A more completemodel would have further unit tasks defined.
The method for editing a document is shown as a looping algorithm of workingthrough a set of tasks to edit a document. This algorithm represents how peoplework through editing a document with changes to be made in the document,stopping when there are no more edits. This remains a relatively common task, for
320 11 Methodology I: Task Analysis

Table 11.3 The components of GOMS
Goals are the desired states of affairs. They are brought about by the application of methods andoperators
Operators are elementary perceptual, motor, or cognitive actions. Intended either to change theworld (a normal key-press) or to change our knowledge about the world (e.g., reading). Inpractice, operators are really those subgoals whose methods of solution we have decided notto analyze any further. The choice of appropriate operators is critical to a GOMS analysis.Some critics note that there are no clear guidelines for doing so, although it is often a fairlystraightforward decision
Methods describe procedures for achieving goals. They contain a sequence of subgoals and/oroperators, with conditions potentially attached to each part of the method. These conditionsrelate to the current task environment (e.g., repeat until no tasks left)
Selection rules augment the basic control structure of the model. Where multiple methods areavailable the selection rules indicate how to choose between the methods. These include, forexample, when scrolling a document: if you want to scroll a long distance, use the searchfunction; if you want to scroll a short distance, use the scroll bar; and if you want to scroll avery short distance, use the arrow keys
Table 11.4 Example GOMS model for text editing (reprinted from St. Amantet al. 2005). This model is written using NGOMSL notation
LTM [long term memory] item: Cut Command [a unit task] Name is Cut. Containing Menu is Edit. Menu Item Label is Cut.
Accelerator Key is “Control-X”.[[There would be more types of commands here in a complete model.]]
Method for goal: Edit Document Step. Store First under <current task name>. Step. Check for done. Decide: If <current task name> is None, Then Delete <current task>; Delete <current task name>; Return with goal accomplished. Step. Get task item whose Name is <current task name> and store under <current task>. Step. Accomplish goal: Perform Unit task. Step. Store Next of <current task> under <current task name>; Goto Check for done.
11.5 GOMS 321

example, how an author right now is working through this chapter making changesto improve the text and how students revise lab reports.
The loop has several types of substeps. These steps can store state (e.g., whatthe current task is); they can perform conditionals (if); and they can subgoal(Perform unit task). Within the unit tasks (not fully shown), information can beobtained from the display and mental and physical actions performed. GOMSmanuals provide a full list of the actions (e.g., Kieras 1999) and when to includemental operators to retrieve task structure, but in practice these lists can beextended to include unusual devices such as joysticks or different types of manualcontrols (such as different knobs or toggle switches). The analysis in Table 11.4does not include all the details of all the subtasks that can be performed, and not allthe details of how to do a unit task.
Table 11.5 shows a model for dialing a cell phone. In this example the tasks areslightly smaller and the interaction and memory aspects are more prominent.
11.5.3 Summary
GOMS models sometimes appear structurally quite similar to other hierarchicaltask analyses of goals/subgoals. The main difference is that GOMS has formalizedits components to a greater level of detail. It is assumed that the methods areknown before the GOMS analysis is carried out, and that they are not developedduring task performance. The particular strengths of GOMS lie in assessing how tomake interfaces easier to use by comparing alternative models, or methods, for aparticular task.
Many people question the utility of GOMS analyses, arguing that there is nosuch thing as error-free, expert performance. This limitation can be somewhatameliorated by incorporating the error correction strategies in the analysis.Probably the biggest limitation of GOMS, however, is that the interface has to beimplemented or at least described in enough detail to be able to identify the actionsfor a particular task. There is also a lack of a clear specification of what can beused in Selection rules—there is an implication that it should be the current taskcontext, but real behavior, for example, undoubtedly allows choices to be based onprevious selections. It is also difficult to do a vanilla GOMS analysis when mul-titasking or task interleaving is involved. CPM-GOMS was developed to addressthis, but at the expense of making it more difficult to create models.
11.6 The Keystroke Level Model
A simplified version of GOMS is the keystroke level model (KLM) of Card et al.(1983). Like GOMS, it is a method that can be used as part of a CTA, but we includeit here in its own right because of its close relationship with the field of HCI.
322 11 Methodology I: Task Analysis

The KLM is usually applied where there is just one person interacting with acomputer-based system. It is a fast and approximate way to compute how longusers will take to perform a unit task. A unit task is essentially a small cognitivelymanageable task. Large tasks can be decomposed into several unit tasks, although
Table 11.5 Example GOMS model, written using NGOMSL notation, for telephonedialing taken from St. Amant et al. (2005)
Task item: T1 [[ tasks will go from T1 to T11 to dial (814) 865-3528 ]] Name is T1. Digit is "8". Next is T2.
Visual object: first digit Content is "8".
Task item: T2 Name is T2. Digit is "1". Next is T3.
Visual object: second digit Content is "8".
. . . Task item: T11
Name is T11. Digit is "8". Next is NONE.
Visual object: second digit Content is "1".
Method for goal: Dial Number Step. Store T1 under <current task name>. Step Check for done.
Decide: If <current task name> is T11, Then Delete <current task>; Delete <current task name>; Return with goal accomplished.
Step. Get task item whose Name is <current task name> and store under <current task>.
Step. Accomplish goal: Dial Digit. Step. Store Next of <current task> under <current task name>. Goto Check for done.
Method for goal: Dial Digit Step. Look for object whose Content is Digit of <current task>
and store under <target>. Step. Point to <target>; Delete <target>. Step. Click mouse button. Step. Verify "Correct digit pressed". Step. Return with goal accomplished.
11.6 The Keystroke Level Model 323

not all tasks will have a unit task substructure. The time to do the whole task iscalculated by simply adding up the calculated times for all the component unittasks. It should be noted that you also need to include the time it takes to acquirethe task, i.e., the time it takes for the user to work out what to do. The KLM doesnot provide a way of calculating this but Card et al. (1980) suggest that the timeneeded for each unit task when manipulating a manuscript is 2–3 s if theinstructions are written down, 5–30 s if it is a routine design situation, and evenlonger for creative composition situations.
To calculate the time for a unit action involves analyzing the operations intotheir elemental perceptual, motor, and cognitive actions (e.g., keystrokes). Thenby adding together the times for these individual actions it can be possible to maketime predictions for expert, error-free performance of that task.
11.6.1 Description of KLM Components
The execution of a unit-task requires operators of (basically) four types:
1. Keystrokes (K): unit time based on typing speeds (0.08–1.2 s/keystroke, mouseclick, or button press)
2. Pointing (P): moving mouse to target (clicking is a keystroke) (approximately1.1 s, but Fitts’ law can also be used)
3. Homing (H(mouse) or H(keyboard)): moving hand to/from mouse and key-board (approximately 0.4 s)
4. Drawing (D): dragging mouse in straight-line segments (0.9 n + 0.16 l where n= number of segments and l = length of segments).
To these should be added some number of mental operators (M or Mop, 1.35 s).Well practiced tasks with a simpler structure will require less mental operators.Getting the number of mental operators correct is a difficulty in using this method,but if it is done consistently across applications it is less of a problem. Finally, thesystem’s response time (Sys), if it limits the user’s task performance, also has to beincluded. This can be estimated, or, again, if the estimate can be assumed to beconsistent across interfaces, is less important than you might fear.
The number of mental operators is computed using a set of rules—basicallybetween all operators, except those linked through knowledge or skill (e.g., thekeystrokes in a single word, or a set such as point and click a mouse).
Where there are selection rules governing the choice of methods then it is up tothe analyst to decide whether to go for best or worst case time predictions.
The time to perform these operators as noted above can be done in an approxi-mate style. There are several ways to improve the predictions of KLM models.
(1) Keystroke times vary. Card et al. (1983) include tables that provide differenttimes for different keystrokes. These tables do not differentiate different typistspeeds, but do show that different keys take different times. This suggests that
324 11 Methodology I: Task Analysis

interfaces should choose keys that are fast (and presumably easy to type). Thissuggestion includes choosing words that use both hands for touch typists andavoiding punctuation characters (which are slower to press).
(2) The gross predictions of mouse moves and drags can be made more accurateby using Fitts’ law to make predictions based on the target size and distance.When the initial location of the mouse is not known, it can be approximated.
(3) The system response time can be computed using tools to analyze key presstimes. The response times are still important in devices such as ATMs, and insystems which may be required to present the same data simultaneously ondifferent continents, within a multinational company, for example.
11.6.2 Example Application of the KLM
Table 11.6 shows an example KLM analysis worked out for a simple text editingtask of cutting a phrase (Step 1), inserting it (Step 2), changing the case of twoletters (Steps 3 and 4), and taking up the next task (Step 5). The analysis suggeststhat the time to perform this task is not so long (24 s). Thus, if this edit takeslonger, it is not the interface that is restraining the user’s progress, it is thecognition to come up with the letters or to think about other changes. It is thewriting, essentially, to come up with the changes that takes so long!
11.6.3 Summary
Although closely related to GOMS, note how keystroke-level analysis is closer totime-and-motion (chronological) analysis than goal/subgoal analysis. It assumes asimple world: concentration on one task at a time, a fully specified interface, no
Table 11.6 Example application of the KLM to a simple editing task
Method1. Delete 3rd clause. H[mouse] K[mouse down] P K[mouse up] M K[D]2. Insert it in front of 1st clause. P M K[l] K[ESC]3. Replace ‘‘: o’’ with ‘‘O’’. P M 2 K[SHIFT R] H[keyboard] 2 K[O ESC]4. Replace ‘‘T’’ by ‘‘: t’’. H[mouse] K[mouse down] M K[R] H[keyboard] 4 K[: SPACE t ESC]5. Delete 3rd clause. H[mouse] P K[mouse] M K[D]6. Insert it in front of 2nd clause. K M K[l] K[ESC]7. Find next task. M K[F]Time PredictionsTexecute = [23 tK + 4 tP + 5 tH] + 7 tM= 22 (0.15) + 4 (1.1) + 5 (0.4)] + 7(1.35)= 19.15 s
Note that in this example the same average time is used for each keystroke
11.6 The Keystroke Level Model 325

interleaving of goals, no interruptions, a single method, error-free, expert perfor-mance, and so on. Indeed, KLMs can be developed without worrying about goalsand selection rules. These limitations make the KLM easier to use, but they alsohighlight the types of tasks that cannot easily be modeled using the KLM andwhere it will not give accurate results.
Quite a considerable effort has gone into trying to make KLMs more usable—particularly by building computer tools to apply them (Beard et al. 1996; Nicholsand Ritter 1995; Williams 2000) and to extend them to new types of interfacessuch as mobile GPS systems (Pettitt et al. 2007). These tools provide a languagefor defining KLM and GOMS models and computing the task time based on theanalyses, although sometimes it may be just as easy to use a spreadsheet.
11.7 Considerations When Choosing a TA Method
There are some general issues that you need to be aware of when deciding whetherto carry out a TA to inform system design, as they will influence how successfulthe TA is. Superficially it appears quite an easy technique to use, but to carry out aTA that produces useful results that can inform system design is an acquired skill.It requires skills in collecting the appropriate data or task specifications, analyzingthat material, and then interpreting it.
It may seem obvious, but to perform a TA, you need to have access to a detailedenough task description. This can either be written (documentation) or capturedthrough interviews and observation. If you are using interviews and observation,you need to make sure that you can get access to the appropriate people in a timelymanner. For new or unimplemented interfaces you can often base your analyses onexisting interfaces and extrapolations. If you are analyzing an unbuilt interface youshould note your assumptions very clearly.
Different types of TA place emphasis on different aspects of task performance.You need to be aware of this. If you are interested in the work context, forexample, then HTA will help; if you are more interested in the cognitive aspects ofthe task, you will be better off using some form of CTA. The different methods arenot mutually exclusive.
In general, TA cannot easily simultaneously represent users with differentlevels of knowledge, skills, and abilities. Novice users and the way a task islearned, for example, are not well represented by most of these techniques. TAtechniques, when applied sympathetically, can help support novice users, but thishas to be done by the analyst. Most methods can deal with some aspects of tasklearning, such as how much knowledge has to be learned in order to do the task. Tomodel the time course of learning you may need to develop a more detailedcognitive model (e.g., see Paik et al. 2010; Ritter and Bibby 2008).
Most methods of TA are strongly goal-oriented. These methods cannot gen-erally be applied to situations that have little structure or only very abstract goals,such as play, conversation, and team building. All TA should be done with an
326 11 Methodology I: Task Analysis

understanding of the general context in relation to work and activities. Methodslike activity theory address these issues (e.g., see Bertelsen and Bødker 2003 for anintroductory review). Activity theory is a very high level method that analyses thetypes of user activities, generally using a very informal representation. It uses thesedescriptions to suggest how to design the context in which the activities take place.For example, identifying children’s activities (play activities, painting, blockstacking, and doll-house play, for example), would inform the design of a kin-dergarten room. Similar analyses make strong suggestions about the design ofresearch labs (collaboration spaces, mailing rooms, teaching rooms) and interfaceswhere goals are less important than activities such as drawing, designing, inter-acting, team-building, exploring, or enjoying.
Most TA methods do not note and are not sensitive to context, includingphysical context such as lighting and heating, social norms such as doing whathelps others in the environment, and not using others space or resources. It isespecially common in work places to discover that the physical or social contextproduces changes in the way people do tasks from how they would ideally dothem, or from the way they are supposed to do them. Casey (1998, 2006) providesnumerous examples where not understanding the context on task analyses and ondesign led to problems, such as where other people are when the user is doing atask (not in the path of the rocket!), or the effect of weather on how to do tasks andwhich tasks to do on a ship.
11.8 Summary
Task analysis in all its various guises is a very useful technique, and usually fairlyeasy to perform when designing systems, which may help explain why it is sowidely used. The results of a task analysis can be used to help designers createeasier to use interfaces by highlighting the structure of tasks, and the time it takesto perform tasks, as well as making it easier to compare alternative methods forcarrying out those tasks. Task analysis can also be used to represent the trade-offsin designs, helping designers to make informed decisions. TA can also be useddirectly to improve interfaces, and Table 11.7 notes a few common ways in whichTA can help improve interfaces.
There are many different uses for task analysis, and the method that you choosewill depend to some extent on how you intend to use the results. Choosing any oneis better than none, that you should choose one that is easy for you to use becauseyou are a user as well. The choice will also be affected by the context in which youwill use the method, the limitations, and possibly the experience of the analyst(s)(several of the methods work at similar levels of abstraction, so they can be usedsomewhat interchangeably).
Using task analyses to guide system design has a good return on investment(RoI), ranging from 7 to 20 to 100 in one survey (Booher and Minninger 2003) to1,000 in another more focused HCI study (Nielsen and Phillips 1993). Given the
11.7 Considerations When Choosing a TA Method 327

multiple ways that task analyses can be used and the savings they suggest, thesenumbers are quite plausible.
The various forms of task analysis can be ordered by how much detail theyinclude. A preliminary classification can be into declarative and procedural rep-resentations. The declarative representations merely denote the actions or tasks theusers will perform. The simplest of these are HTA and CTA. The KLM is aslightly more complex example of this because it attributes time to each action.
Procedural task descriptions, such as advanced versions of GOMS (John andKieras 1996b) and models in cognitive architectures (noted in the final chapter),can include enough procedural knowledge of how to perform the task such thatthey can also perform the task in some way, perhaps with a simplified version ofthe interface. Declarative representations of behavior, like the KLM, for example,will note that the result of a mathematical task is ‘‘a number,’’ whereas a fullyprocedural task analysis will be able to compute the actual number. This chapterdiscusses several examples of each type. There is a wide range of approaches, anddescriptions of them are available in surveys (Adams et al. 2012; Beevis 1999;Schraagen et al. 2000), as well as in manuals and tutorials on these other TAapproaches.
As you use TA in a wider range of situations, you should become more skilledin applying it. For specific situations you may want to look at some of the morespecialized forms of task analysis. For example, if you have many novice users,you might create a situation where the user has to read the documentation to findthe commands, which means that your design should ensure that the knowledge ofhow to use the interface is findable or transmitted to the novice through instruc-tions, conventions, and other design elements. When you need to do more complexanalyses, for example, where error recovery or multi-tasking is important, you mayneed to consult further material to find the most appropriate technique, as well asinvestigate supplementary techniques such as knowledge elicitation (e.g., Ericssonand Simon 1993; Kirwan and Ainsworth 1992; Schraagen et al. 2000; Shadbolt2005; Shadbolt and Burton 1995).
Table 11.7 Ways to use TA to improve interfaces
1. Modify the interface to support all the tasks in the TA2. Modify the interface to not support tasks not required by the task analysis3. Modify the interface to do steps for the user where choices are not required4. Modify the interface to use fewer actions5. Modify the interface to use a simpler task structure6. Modify the interface to provide more regular knowledge/interactions to perform related tasks7. Modify the interface to not require holding state variables in the task analysis or user’s head8. Modify the interface to make common tasks faster9. Modify the interface to make expensive tasks slower/harder to initiate
10. Teach any alternative methods through and in the interface
328 11 Methodology I: Task Analysis

The results of a task analysis on their own will not tell you whether a particularsystem or interface is acceptable or not. It just shows how well the system orinterface will work for particular tasks for particular people (in a particular con-text). Decisions about modifications to the system or interface will often requireconsideration of other factors, such as the resources that are available for furtherdevelopment, other systems or interfaces (to cater for consistency and interoper-ability, for example), and assumptions about the target users. Task analysis cannotsuggest whether novices should be served preferentially by the system, or whetherexperts should be supported in an interface design, but TA can help compute thecosts and represent the trade-offs involved in making such decisions.
11.9 Other Resources
The Handbook of task analysis for human-computer interaction, edited by DanDiaper and Neville Stanton (2003), although 10 years old, still provides a fairlycomprehensive overview of TA. It makes a useful reference book, rather thanbeing something that you should read from cover to cover. A more general, butstill useful overview of the many types of TA and their application is Kirwan andAinsworth’s A Guide to Task Analysis (1992) even though it is now over 20 yearsold.
Clayton Lewis and John Rieman’s shareware book, Task-Centered UserInterface Design (1994), www.hcibib.org/tcuid/ provides a useful expansion of thematerial in this chapter, particularly on the role of task analysis in system design.
Shepherd’s book, Hierarchical Task Analysis (2004), provides a detailed dis-cussion of HTA. It illustrates how it can be applied to a wide range of tasks, andhow the results can generate a wide range of benefits.
For a practical guide to using CTA it is worth looking at Working Minds: Apractitioner’s guide to Cognitive Task Analysis by Crandall et al. (2006). Fordetails about the sorts of methods that can be used in a CTA, it is worth consultingApplied Cognitive Task Analysis in aviation by Thomas Seamster et al. (1997), andHuman factors methods by Neville Stanton et al. (2005).
David Kieras has papers, manuals, and tools covering the KLM, GOMS, andtask analyses available via his web site: www.ai.eecs.umich.edu/people/kieras/kieras.html. You can also find several KLM calculators online. With these yousimply enter the KLM operators that are used to do the task, and the total time isautomatically calculated for you.
Kim Vicente’s book Cognitive Work Analysis (1999) describes a broader,integrated framework which includes models of the work domain, control tasks,strategies social-organizational factors, and worker competencies. This frameworkbuilds on the body of work called cognitive (systems) engineering which focuseson the analysis, design, and evaluation of complex socio-technical systems.
The book’s web site has additional information on task analysis including sometools.
11.8 Summary 329

11.10 Exercises
11.1 Create a table showing each type of task analysis. Note (a) the focus of theapproach (work, the task, what the user knows, etc.); (b) what they are typi-cally used for, for example, what predictions they can provide; (c) an examplesnippet of analysis; (d) how time intensive you believe they will be (easy to do,hard to do); and (e) the advantages and disadvantages of each type.
11.2 Choose an existing interface and list the tasks it can or should be used for.Perform a task analysis. From this task analysis make five suggestions how itcould be improved. Interfaces to consider include word processors, spread-sheets, online libraries, and email clients.
11.3 Write a short report on tasks you or a study partner do at your desk, and thequality of the desk and work area to support those tasks. Compare it with thenon-work related tasks that you do indulge in (e.g., play with a pencil, line upyour toy cars, doodle, drink coffee) at your desk. Make suggestions forimproving the workspace in question. Then, do the same thing for yourcomputer display.
11.4 List ten ways that the KLM or GOMS methods could be made more accurate.You should be able to do this using this book. For example, the section onreading makes several suggestions for making these models more accuratewith respect to adjusting for users’ reading speed and the material being read.
11.5 Consider a smartphone or tablet computer, either a specific one or a com-posite one. Devise a trade-off function between a set of features (which youspecify) and weight. Describe how to choose a reasonable point on thatcurve. Use a task analysis that provides estimates of task time to representthis design trade-off.
11.6 Use a task analysis methodology to examine two related online systems, suchas bookstores. You should choose three to five important tasks, and explainwhy these are important tasks for this analysis. How do their assumptionsdiffer as represented in the task analysis? For example, does one assume thatyou log in before browsing, or does one assume that you read recommen-dations before purchasing?
11.7 Use a task analysis methodology that you choose to calculate how long ittakes to perform the following tasks using a spreadsheet program, using acalculator, and using your cell phone: (a) a tip on a $13.28 restaurant bill;(b) your salary raise as a percentage from $8.50 to $8.85/h (c) your hourlyrate if you work 40 h per week and 48 weeks per year and make $45,000 peryear, and (d) your hourly rate from the previous problem, but starting fromscratch, if you had a 3% raise. Comment on at what point in time you shouldswitch between these three tools.
11.8 Use a task analysis methodology to calculate how long it takes to select and todelete an automatic signature to your email, using your signature rather thanthe one in Sect. 11.8. Is it faster to insert the signature manually when youneed it, or to included it automatically and delete it when you do not need it?
330 11 Methodology I: Task Analysis

Draw a curve representing the time to use both strategies as the frequencyof need to sign an email changes from 0 to 100% in 10% increments.
11.9 In 2003 the University of Denver (noted in the Chronicle of Higher Edu-cation, 19 December, p. A35) decided to require all applicants to be inter-viewed by college officials. The question on the interviewers’ minds,according to the assistant vice chancellor for enrollment management, is‘‘Will the kid graduate?’’ The retention rate has gone from 82 to 86%because (or despite) the college starting using the system 2 years ago.
(a) Based on your experience as a college student, come up with a taskanalysis of what you have to do to be (i) successful in college and(ii) graduate. Include multiple strategies and allow tasks you need toterminate or avoid. (This integrates results from several chapters.) Dokeep in mind that GPA is an important but surely not the only measure ofsuccess in college, and you might note other successes besidesgraduation.
(b) Discuss how you would interview someone to find out whether they cando these tasks.
(c) Can you provide any alternative hypotheses about why retention mighthave gone up besides the interview process?
References
Adams, A. E., Rogers, W. A., & Fisk, A. D. (2012). Choosing the right task analysis tool.Ergonomics in Design: The Quarterly of Human Factors Applications, 20(4), 4–10.
Annett, J. (2005). Hierarchical task analysis (HTA). In N. Stanton, A. Hedge, K. Brookhuis, E.Salas & H. Hendrick (Eds.), Handbook of human factors and ergonomics methods (pp. 33-31–33-37). Boca Raton, FL: CRC Press.
Baxter, G. D., Monk, A. F., Tan, K., Dear, P. R. F., & Newell, S. J. (2005). Using cognitive taskanalysis to facilitate the integration of decision support systems into the neonatal intensivecare unit. Artificial Intelligence in Medicine, 35, 243–257.
Beard, D. V., Smith, D. K., & Denelsbeck, K. M. (1996). Quick and dirty GOMS: A case study ofcomputed tomography interpretation. Human-Computer Interaction, 11, 157–180.
Beevis, D. (Ed.). (1999). Analysis techniques for human-machine systems design: A reportproduced under the auspices of NATO Defence Research Group Panel 8. Wright-PattersonAir Force Base, OH: Crew Systems Ergonomics/Human Systems Technology InformationAnalysis Center.
Bertelsen, O. W., & Bødker, S. (2003). Activity theory. In J. M. Carroll (Ed.), HCI models,theories and frameworks: Toward a multi-disciplinary science. San Francisco, CA: MorganKaufmann.
Booher, H. R., & Minninger, J. (2003). Human systems integration in Army systems acquisition.In H. R. Booher (Ed.), Handbook of human systems integration (pp. 663–698). Hoboken, NJ:Wiley.
Bovair, S., Kieras, D. E., & Polson, P. G. (1990). The acquisition and performance of text-editingskill: A cognitive complexity analysis. Human-Computer Interaction, 5, 1–48.
Byrne, M. D., & Kirlik, A. (2005). Using computational cognitive modeling to diagnose possiblesources of aviation error. International Journal of Aviation Psychology, 15(2), 135–155.
11.10 Exercises 331

Card, S. K., Moran, T. P., & Newell, A. (1980). The keystroke-level model for user performancetime with interactive systems. Communications of the ACM, 23(7), 396–410.
Card, S. K., Moran, T. P., & Newell, A. (1983). The psychology of human-computer interaction.Hillsdale, NJ: Erlbaum.
Casey, S. M. (1998). Set phasers on stun: And other true tales of design, technology, and humanerror. Santa Barbara, CA: Aegean.
Casey, S. M. (2006). The Atomic Chef: And other true tales of design, technology, and humanerror. Santa Barbara, CA: Aegean.
Chipman, S. F., & Kieras, D. E. (2004). Operator centered design of ship systems. In Engineeringthe Total Ship Symposium. NIST, Gaithersburg, MD. American Society of Naval Engineers.Retrieved March 10, 2014, from http://handle.dtic.mil/100.2/ADA422107
Crandall, B., Klein, G., & Hoffman, R. R. (2006). Working minds: A practitioner’s guide tocognitive task analysis. Cambridge, MA: MIT Press.
Diaper, D. (2004). Understanding task analysis. In D. Diaper & N. Stanton (Eds.), The handbookof task analysis for human-computer interaction (pp. 5–47). Mahwah, NJ: LEA.
Ericsson, K. A., & Simon, H. A. (1993). Protocol analysis: Verbal reports as data (2nd ed.).Cambridge, MA: MIT Press.
Fitts, P. M. (1951). Human engineering for an effective air navigation and traffic control system.Washington, DC: National Research Council.
Freed, M., & Remington, R. (1998). A conceptual framework for predicting error in complexhuman-machine environments. In Proceedings of the 20th Annual Conference of theCognitive Science Society (pp. 356–361). Mahwah, NJ: Erlbaum.
Gray, W. D., John, B. E., & Atwood, M. E. (1992). The precis of project ernestine or an overviewof a validation of GOMS. In Proceedings of the CHI‘92 Conference on Human Factors inComputer Systems. New York, NY: ACM Press.
John, B. E., & Kieras, D. E. (1996a). The GOMS family of user interface analysis techniques:Comparison and contrast. ACM Transactions on Computer-Human Interaction, 3(4),320–351.
John, B. E., & Kieras, D. E. (1996b). Using GOMS for user interface design and evaluation:Which technique? ACM Transactions on Computer-Human Interaction, 3(4), 287–319.
Kieras, D. E. (1999). A guide to GOMS model usability evaluation using GOMSL and GLEAN3:AI Lab, University of Michigan. Available from www.ftp.eecs.umich.edu/people/kieras
Kieras, D. E., & Polson, P. G. (1985). An approach to the formal analysis of user complexity.International Journal of Man-Machine Studies, 22, 365–394.
Kirwan, B., & Ainsworth, L. K. (1992). A guide to task analysis. London, UK: Taylor & Francis.Klein, G., Calderwood, R., & MacGregor, D. (1989). Critical decision method for eliciting
knowledge. IEEE Transactions on Systems, Man, and Cybernetics, 19, 462–472.Monk, A. F. (1998). Lightweight techniques to encourage innovative user interface design. In L.
Wood (Ed.), User interface design: Bridging the gap between user requirements and design(pp. 109–129). Boca Raton, FL: CRC Press.
Nichols, S., & Ritter, F. E. (1995). A theoretically motivated tool for automatically generatingcommand aliases. In Proceedings of the CHI‘95 Conference on Human Factors in ComputerSystems (pp. 393–400). New York, NY: ACM.
Nielsen, J., & Phillips, V. L. (1993). Estimating the relative usability of two interfaces: Heuristic,formal, and empirical methods compared. In Proceedings of InterCHI ‘93 (pp. 214–221).New York, NY: ACM.
Paik, J., Kim, J. W., Ritter, F. E., Morgan, J. H., Haynes, S. R., & Cohen, M. A. (2010). Buildinglarge learning models with Herbal. In D. D. Salvucci & G. Gunzelmann (Eds.), Proceedingsof ICCM: 2010- Tenth International Conference on Cognitive Modeling (pp. 187–191).
Pettitt, M., Burnett, G., & Stevens, A. (2007). An extended keystroke level model (KLM) forpredicting the visual demand of in-vehicle information systems. In Proceedings of theSIGCHI Conference on Human Factors in Computing Systems (pp. 1515–1524). ACM.
Ritter, F. E., & Bibby, P. A. (2008). Modeling how, when, and what learning happens in adiagrammatic reasoning task. Cognitive Science, 32, 862–892.
332 11 Methodology I: Task Analysis

Ritter, F. E., Freed, A. R., & Haskett, O. L. (2002). Discovering user information needs: The caseof university department websites (Tech. Report No. 2002-3): Applied Cognitive Science Lab,School of Information Sciences and Technology, Penn State. www.acs.ist.psu.edu/acs-lab/reports/ritterFH02.pdf
Schraagen, J. M., Chipman, S. F., & Shalin, V. L. (Eds.). (2000). Cognitive task analysis.Mahwah, NJ: Erlbaum.
Seamster, T. L., Redding, R. E., & Kaempf, G. L. (1997). Applied cognitive task analysis inaviation. Aldershot, UK: Avebury Aviation.
Shadbolt, N. R. (2005). Eliciting expertise. In J. R. Wilson & E. Corlett (Eds.), Evaluation ofhuman work (3rd Edition, pp. 185–218). London: Taylor and Francis.
Shadbolt, N. R., & Burton, A. M. (1995). Knowledge elicitation: A systematic approach. InJ. R. Wilson & E. N. Corlett (Eds.), Evaluation of human work: A practical ergonomicsmethodology (pp. 406–440). London: Taylor and Francis.
St. Amant, R., Freed, A. R., & Ritter, F. E. (2005). Specifying ACT-R models of user interactionwith a GOMS language. Cognitive Systems Research, 6(1), 71–88.
St. Amant, R., Horton, T. E., & Ritter, F. E. (2004). Model-based evaluation of cell phone menuinteraction. In Proceedings of the CHI‘04 Conference on Human Factors in ComputerSystems (pp. 343–350). New York, NY: ACM.
St. Amant, R., Horton, T. E., & Ritter, F. E. (2007). Model-based evaluation of expert cell phonemenu interaction. ACM Transactions on Computer-Human Interaction, 14(1), 24.
Vicente, K. (1999). Cognitive work analysis. Mahwah, NJ: Erlbaum.
References 333

Chapter 12Methodology II: Cognitive Dimensionsand the Gulfs
Abstract This chapter introduces two useful high-level approaches that summa-rize a wide range of aspects of users: how users interact with artifacts and howusers perform tasks. A type of analysis, Cognitive Dimension/dimensions, pro-vides a way to represent common and important aspects of interface design. Thedimensions are used to describe and then evaluate interfaces. Norman has a similardescription of user behavior based on how hard it is to understand the state of theinterface (the Gulf of Understanding) and how hard it is to perform an action in aninterface (the Gulf of Execution). Both approaches are useful techniques forthinking about, planning, and performing interface design.
12.1 Introduction
So far we have presented several methods and techniques for analyzing Human-System Interaction, including task analysis as a general tool, and GOMS and theKLM as more detailed formal approaches for use prior to user testing. Most of themethods we have presented are applied at a low level of abstraction. In contrast,the Cognitive Dimensions (of Notations), usually just referred to as CognitiveDimensions or CDs (e.g., Blackwell and Green 2003; Green 1989), was developedas a mechanism for discussing and analyzing systems at a higher level ofabstraction.
The CDs are based on the assumption that it is useful to have a language fordiscussing design. One way of trying to understand design is to describe the objectthat is being designed, and the trade-offs that the designer faces using a smallnumber of fundamental dimensions. These dimensions can then provide a commonlanguage (sometimes called an ontology) for discussing usability problems, as wellas a means of comparing aspects of interface and system design, and for com-paring whole designs. Thus, the CDs can be seen as a way of providing a commonontology for naming aspects of design as well as for naming design trade-offs.
F. E. Ritter et al., Foundations for Designing User-Centered Systems,DOI: 10.1007/978-1-4471-5134-0_12, � Springer-Verlag London 2014
335

The goal of the CDs is to provide a fairly small, representative set of labeleddimensions that describe critical ways in which interfaces, systems, and envi-ronments can vary from the perspective of usability. Once the dimensions havebeen labeled the designers can more easily discuss alternative designs.
In this chapter we will outline some of the dimensions and illustrate them withexamples. The complete set of dimensions, however, does not yet exist—this isstill a research issue and the set of dimensions for a given design is probably tied tothe context of the design. Research in this area is proceeding in two directions:trying to find ways of formalizing and measuring the dimensions currently pro-posed, and trying to explore the completeness and redundancy of the current set ofdimensions.
We will also describe an alternative viewpoint on dimensions, based on thework of Norman (1988, 2013). Norman’s dimensions describe how users interactwith devices, focusing on the relationship between actions and intentions, andbetween the results of actions and the way they are interpreted.
12.2 The Cognitive Dimensions
Table 12.1 notes the (current) set of 14 Cognitive Dimensions. Research into theCDs is ongoing, so the list should not be regarded as finalized or complete. TheCDs can be extended to make them more appropriate to your own situation.
Below we describe the first five CDs in more detail. Our main purpose here is toillustrate what the CDs are, and how they can be used.
12.2.1 Hidden Dependencies
Dependencies are the number and direction of relationships between objects. Forexample, spreadsheets show you formulae in one direction only, that is, whichcells are used to compute the value in a cell, but not which cells use a given cell’svalue; similarly, variable declarations in programming languages like Java orPascal show you which variable type a structure is made from, but not the otherway around; and the Microsoft Word Styles dialogue box (Fig. 12.1) shows youthe parent of a style but not its children.
In all of these examples there are two hidden (or invisible) types of dependency:ancestors and children. Only the parents are visible, and finding the ancestorsinvolves following a chain of parents. Working in the opposite direction, findingthe children involves checking every entity for its parent, which creates a highmemory and work load. Another example of the problem of hidden dependenciesoccurs in variable initialization and use: in many procedural and production sys-tem languages you need to use a combination of tools and deep knowledge to findout what the dependencies are.
336 12 Methodology II: Cognitive Dimensions and the Gulfs

The implications of considering hidden dependencies are that all dependenciesthat may be relevant to the user’s tasks should be represented. Or, as a minimum,tools should be provided which enable them to be represented. This is consistentwith the notion we saw earlier in the book of recognition being easier than recall.For example, spreadsheets would be easier to use (for certain tasks anyway) if theycould show forward relationships (e.g., this cell’s value is used in all these otherplaces). Recognizing this fact (the need for visibility) is quite separate fromdesigning a solution to the problem—one option would be to use color coding(e.g., child cells could be shown in the same color; ancestor cells could be shown
Table 12.1 The Cognitive Dimensions
1. Hidden dependencies: how visible the relationships between components are2. Viscosity: how easy it is to change objects in the interface3. Role-expressiveness: how clear the mapping of the objects are to their functions4. Premature commitment: how soon the user has to decide something5. Hard mental operations: how hard are the mental operations to use the interface6. Secondary notation: the ability to add extra semantics7. Abstraction: how abstract the operations and system are8. Error-proneness susceptibility: how easy it is to err9. Consistency: how uniform the system is (in various ways, including action mapping)
10. Visibility: whether required information is accessible without work by the user11. Progressive evaluation: whether you can stop in the middle of creating some notation and
check what you have done so far12. Provisionality: whether you can sketch out ideas without being too exact13. Diffuseness: how verbose the language is14. Closeness of mapping: how close the representation in the interface (also called notation) is to
the end results being described
Fig. 12.1 The Word Style editor (left) shows the parent of the ref style, but cannot show thechildren of the Normal style. The spreadsheet (right) shows what cells the formula is dependenton (and can show those that appear as the line on the graph), but does not show where a given cellis used
12.2 The Cognitive Dimensions 337

in ever paler shades of the same color). Some spreadsheets now provide thecapability to show child cells, thus making the dependencies less hidden.
A much richer form of hidden dependency occurs in many modern operatingsystems, where several files are both generated and used. Applications other thanthose that created them may be dependent upon these files, such as a pictorialfigure in a spreadsheet file, a graphics file used in a report, or a preferences filestored somewhere away from its application and labeled with the name of thecompany or user rather than the application. These dependencies are not visible—deleting files from system and user preferences directories therefore becomes ahazardous task. The corollary is that people’s file stores get filled up with old,unused files and you cannot easily tell whether or not they are used. The normalsolution, albeit one that strictly ignores the problem rather than solves it, is tonever delete any files from these directories. The reason this works as a solution isthat storage space is so cheap!
12.2.2 Viscosity
A viscous system is one that is resistant to change—even small changes canrequire substantial effort. A classic example would be a word-processed documentin which the numbers used in the figure captions, such as ‘‘Fig. 12.1,’’ have beentyped explicitly by hand (rather than using the word processor’s built in numberingfacilities). If you decide to introduce another figure before this in the document,then all the existing figure numbers need to be changed manually too. Whilst thismay not be too difficult for the figures themselves, ensuring that all the referencesto the figures in the text are updated to match the updated numbering can requiresignificant effort. If you introduce several figures in this way, one at a time, youmay decide to skip doing the updating of the numbering every time, and in the endmay forget to do it at all. TeX and LaTeX avoid this problem by doing it auto-matically, and Word also provides tools for doing this, although these tools aresomewhat viscous and error prone.
In some circumstances viscosity can be beneficial for users. If things are hard tochange this encourages reflective action and explicit learning. Learning in somepuzzles (noted in Chap. 6) is more explicit if the user has to work harder to makemoves in the puzzle. Deleting files is also made somewhat more viscous by manyoperating system interfaces (‘‘Are you sure you want to delete this file?’’). Incontrast, if things are easy to change this encourages tinkering, which leads toimplicit learning. When it is very easy to make small changes this can often lead tomany small, unnecessary changes being made.
On the other hand, visualprogramming languages, one of the original analysesthat led to the CD approach, can have changes that are difficult to implement andchange. For example, it is most productive in most cases to vary fonts uniformlyand to have them vary by several points. It is not as productive to have them vary
338 12 Methodology II: Cognitive Dimensions and the Gulfs

by only one point. If you want to modify the fonts in a PowerPoint presentation byone point, then you have to use more detailed tools and it takes longer. You can doit, but it is more viscous. As another example, iTunes makes it relatively easy toadd a new playlist or to modify a playlist. It makes it more difficult (viscous) toerase songs.
Two types of viscosity can be differentiated:
• Repetitive viscosity—where what appears to be a single goal has to be carriedout as lots of small, repetitive actions. For example, if you want to change in adocument every number followed by a tab into the same numbers followed by aspace, this has to be done by hand in Word because, while the number can befound, it cannot be included in the replace, thus increasing the viscosity ofediting Word documents. Similar effects can be found in many systems whenrenaming files within a graphical user interface.
• Knock-on viscosity—where what appears to be a single goal requires severalmore small changes to restore consistency (e.g., adding a sentence at thebeginning of a document and having to redo all the work involved in ensuringthat appropriate page breaks occur).
Solutions to the problems of inappropriate amounts of viscosity can involveeither redesigning the system or providing tools to help manage the difficulties.The latter is more likely to be useful where viscosity may be desirable, as a way ofpromoting reflective action and encouraging learning. In some cases there may bea trade-off, however, and making some actions less viscous may lead to othersbecoming more viscous. It is also worth noting that it can be useful to deliberatelymake some actions viscous, e.g., if there are safety critical elements, or an actionmay be dangerous if carried out incorrectly, or they are expensive in time ormoney. On the other hand, simple, routine actions should normally be made asnon-viscous as possible.
12.2.3 Role-Expressiveness
Role-expressiveness describes the extent to which a system reveals the goals of thesystem’s author/designer to the reader/user. It should be easy, for example, for areader to see what each component in a program does, and how each componentrelates to the whole. This need to infer the other agent’s goals and plans isimportant, as we noted earlier in Chap. 7, with particular reference to how Grice’smaxims describe successful communication.
One obvious example of role-expressiveness is that the buttons on an interfaceshould be clearly recognizable as buttons that the user can press. In some inter-faces, however, role-expressiveness is poor because interface objects that areclickable are not easily recognizable as being clickable—‘‘But how was I meant to
12.2 The Cognitive Dimensions 339

know that it would do something if I clicked there?’’ This effect is particularlyfound on those web pages where banners and logos are designed as clickableimages, but users more commonly (and more naturally based on their experience)perceive them as just being graphical images.
A piece of program code with well-chosen variable names can be very role-expressive. The goals of the programmer in each statement can be made readilyapparent to the reader if the functions and variables are given names that clearlyindicate their purpose.1
The Microsoft Excel spreadsheet application also supports role expressiveness.When you add a formula to a particular cell, for example, it color codes the cellsthat are referenced by that formula. Note that the color coding only happens as theformula is created, and disappears when you calculate the result of evaluating thatformula.
Classic problems of role-expressiveness occur where two similar looking fea-tures achieve different functions or where two different looking functions achievesimilar effects. That is, where the role-expressiveness for two similar lookingobjects is different, or where the function of two different looking objects appearsthe same. For example, the Border and shadings functions in some older versionsof Microsoft Word can be accessed using the top level menu but also appear inthree other places in the interface, with different sets of functions available to theuser in each place with differing effects. This can confuse users who fail to dis-tinguish between paragraph borders and table cell borders because Word displaysthem in apparently unpredictable ways.
There may sometimes be a conflict between role-expressiveness and consis-tency. Designing a system to be role-expressive will usually mean using a richervocabulary with less (apparent) uniformity. A good way to resolve this conflict isto carry out a clear and effective analysis of the users’ tasks and the importance oflearning versus other measures of usability rather than focusing solely on con-sistency (Grudin 1989). Role expressiveness might also be poor on purpose toencourage exploration. This may occur in games or educational software andhardware (Yeh et al. 2010).
12.2.4 Premature Commitment
The point at which users have to commit to taking a particular action varies acrossenvironments and systems. For example, when you go into a café you sometimesfind that you have to select which cutlery you need before you have seen what foodis on offer that day. Until you know this you will not know whether you will need a
1 Jonah Gregory (personal communication, 2008) notes that programmer’s comments can behelpful in these situations, and we agree. However, comments can also be a nightmare becausethey often do not get updated when the code changes. So, there are design decisions about whento update and how to update such documentation.
340 12 Methodology II: Cognitive Dimensions and the Gulfs
soup spoon or a dessert spoon (or both). Similarly, many database systems requirethat you plan and commit to particular record structures and size limits beforeentering any data or actually using the system. Until you know how the system willbe used, however, it is often difficult to finalize these decisions.
These limitations are examples of Premature Commitment. Computer pro-gramming environments often require premature commitment such as declarationof variables before working out how they will be used, and developing the systemin sequential order. Like many of the CDs, premature commitment will interactwith other dimensions. Premature commitment can contribute to viscosity, forexample, because the effect of the commitment is to make future changes veryhard to make.
The solution to the problem of premature commitment is usually to allow (andprovide support for) users to perform tasks in many orders (e.g., outlining tools inmany word processors allow the user to develop the outline and write the text inany order). This support comes at a cost, however. Allowing users more freedomoften makes the system more complex to design and to build, and may contributeto errors in program code. Paying attention to this trade-off, however, is com-pletely consistent with the Risk-Driven Incremental Commitment Model that wewill discuss in Chap. 14.
12.2.5 Hard Mental Operations
The final CD that we will examine here is the number of hard mental operationsinvolved, which will vary across systems. In GOMS, KLM modeling, and severalother task analysis methods, the mental operations are all assumed to be equiva-lent, for convenience’s sake. Psychology and human factors work show us thatsome kinds of problems (and operations) are substantially harder for users toperform, and that users thus prefer easier mental operations (although harder doesnot necessarily mean slower).
The issue of hard mental operations can be illustrated by the isomorph of theTowers of Hanoi problem, in which monsters manipulate balls according to aformal monster protocol for swapping balls. The subjects in Kotovsky and Simon’s(1990) study had monsters either follow a complex protocol to swap balls aroundbased on which size monster could hold which size ball, or a protocol that requiredmonsters to change size to swap balls around. Subjects found the latter protocol tobe much more difficult, possibly because we tend to think of size as a relativelyconstant aspect of an object, so having to mentally change the size of an object ismore strenuous and error prone than applying simple rules to behavior. Similareffects have also been found in mentally rotating objects, with larger objects beingrotated more slowly.
As another example, multiple negative facts can be very hard to disentangle(e.g., the packet that was not lost, was not put out on the Ethernet). The concepts ofpointers and indirection in C and other programming languages also prove very
12.2 The Cognitive Dimensions 341
difficult—most people can usually handle one level of indirection, but multiplelevels of pointers tend to be more difficult to follow. Another type of hard mentaloperation is boundary problems, for example, counting fence posts—If you have aten-foot fence to put up, and fence pieces are one foot long, how many posts doyou require? In this situation, the boundaries of an object have to be explicitly andcarefully represented and manipulated. If you thought there should be 10 posts,you have left out the first post, because there needs to be 11 (you can see this muchmore easily if you actually draw the fence).
An important thing to remember about these kinds of hard mental operations isthat they can be easy to implement computationally, but can be especially trou-blesome for users. Again, these problems can be solved at several levels, includingeither by avoiding the problem by understanding the relative difficulty of opera-tions, or by providing tools to assist in these operations (e.g., graphic displays ofindirection in C programs) and providing representations designed to be sharedbetween types of system implementers.
12.3 Turning Cognitive Dimensions into a Methodology
The CDs can be used as a method for informing design during the early or middlestages of development (e.g., Cohen et al. 2012). The designer can ask questionsbased on the appropriate dimensions for the system, such as:
1. Are there hidden dependencies and one-way links in the structure?2. Is the system viscous, or can users and designers reconstruct structures easily
and fluidly?3. Is the order of generation and action the same as the order in which users will
want to do things and have the appropriate information? Are there multiple,appropriate orders of behavior and strategies supported?
4. Is the system role-expressive? Are the functions of the components obvious anddiscriminable?
5. Does the system require any hard mental operations?6. Are there conceptual gaps between the user and the system? (Blandford et al.
2008)
The answers to these questions are shared among the design team. They canthen be used to moderate the design of the system, or may lead to other designactivities such as studying the relative costs of mental operations or other tasks thathelp reduce the risks associated with the design.
Designers might wish to order the dimensions they use, and they may also wishto add other dimensions. A new dimension could be added, for example, to con-sider the role of cognitive load (Sweller 1988) describing how much the user has toknow, do, and learn at any given point in a task.
The CDs have been used to develop extensions to the Microsoft Excelspreadsheet that integrate user defined functions into the worksheet grid (Peyton
342 12 Methodology II: Cognitive Dimensions and the Gulfs

Jones et al. 2003). This was done by initially focusing on the cognitive require-ments of the user, using the CDs and the Attention Investment model ofabstraction use (Blackwell 2002). The Cognitive Dimensions approach has alsobeen used to understand issues that arise for programmers when solving complexsystems integration problems and with contemporary, mash-upprogrammingpractices with APIs (application programming interfaces) (see Jones et al. 2010 foran example).
12.4 What is Omitted by the Cognitive Dimensions?
The CDs do have some limitations. This approach does not offer a complete way tocreate an interface design, and it may not always be applicable. Those aspects of asystem that are of particular interest may not be covered by the dimensions noted,for example.
Even for the existing CDs, there are areas where they could be expanded. Thecurrent list includes error proneness, for example, but does not directly address thequality of feedback and support for error recovery. The CDs also focus on usabilityissues, and do not currently address issues related to user acceptability—does thesystem fit in with the way users do the task or want to do the task, and so on.
The CDs are an attempt to provide a way for designers to discuss issues relatedto usability. If we had a rich enough vocabulary to adequately describe the sourcesof poor usability, then the problems could be solved simply by reducing oreliminating each of these sources. The real benefit of the CDs is as a tool that canhighlight the trade-offs inherent in interface design in a way that can be easilyunderstood by designers.
As their name suggests, the CDs focus on the cognitive aspects of interfaces.They do not address design trade-offs related to the other aspects of users that wehave introduced—anthropometric, behavioral, and social aspects—in any greatdepth. The CDs approach, however, suggests that a similar approach to under-standing design trade-offs could be used for these other aspects of usability. Thephysical dimensions of a device will typically be related to the features that can beprovided, for example, iPods versus iPads. Similarly, other aspects can be put intothis framework. For example, social aspects could be included such as how the sizeof a social network will influence the usability of devices designed for commu-nicating with others.
12.5 Norman’s Seven Stages of Action
In his book The Design of Everyday Things, Norman (1988, 2013) describes theprocess of how users interact with systems to achieve their goals as a series ofactivities (see Table 12.2). This process is an approximate theory of action: all of
12.3 Turning Cognitive Dimensions into a Methodology 343

the stages may not always be used, and they may not always be applied in the sameorder. The stages are done in a cycle (thus, the last stage, Evaluate, also occursbefore the first stage, Establish the goal). The process does, however, capture theessential aspects of how users perform tasks, and is therefore useful for analyzingand guiding the design of systems. The process should be seen as cyclic rather thana single shot linear sequence of activities. Activities may also overlap, and therecan be feedback loops between activities.
There may be not be a direct correspondence between the user’s psychologi-cally expressed goals and the physical controls and variables that have to be usedto carry out the task to achieve those goals. In many cases the goals and intentionsare highly context dependent, and often opportunistic rather than planned. Thegoals and intentions may also be rather vague or ill-defined. Generally the user willset up some goal that they want to accomplish, and then formulate an intention tocarry out some actions to ensure that the goal is achieved. Goals and intentions arepsychological concepts—they exist in the mind of the user and relate directly tothe user’s needs and concerns. In most cases, however, the actions have to beperformed on a physical artifact or system, manipulating some physical mecha-nisms to produce changes in the physical variables and the state of the system orenvironment. The user must, therefore, turn psychological intentions into actionsthat can be physically carried out upon the system or environment. The user thenhas to look for the effects of those actions, and interpret those effects in terms ofthe psychological goals to decide what to do next.
You do not want your users to have to resort to effortful problem solving just tointerpret the effects of any actions. If they do, this usually means that they have notfound the interface easy to use. This situation should normally only occur whensomething goes wrong with the system, or where the purpose of the interface is todeliberately force the user to resort to problem solving, such as in a game. Pro-viding some level of built in redundancy will help users when they have to performproblem solving. You could provide them with multiple email accounts, forexample, in case one is down, or provide multiple ways to get email, e.g., POP andwebmail; similarly, you could provide multiple ways to print with multipleprinters. These are usefully redundant rather than just duplicates.
When you design systems you should think about how to support users in waysthat help them to achieve their goals, and reduce the need for them to resort toproblem solving. You can provide users with some means to access commands, forexample, using keystrokes, menus, buttons, and so on, as a way of helping them
Table 12.2 Stages of user activities
• Establish the goal• Form the intention to take some action• Specify the action sequence• Execute the action• Perceive the system state• Interpret the system state• Evaluate the system state with respect to the goals and intentions
344 12 Methodology II: Cognitive Dimensions and the Gulfs

perform their tasks to achieve their goals. You should also try to anticipate potentialproblems, and understand how your users will use problem solving to resolve them.By doing so you should be able to identify redundancies that you can build into thesystem to allow (and help) users to work around the problem until it can be fixed.
12.5.1 The Gulfs of Evaluation and Execution
In Norman’s seven stages of action he explicitly talks about the need to map betweenpsychological and physical concepts. Often there is not a direct correspondencebetween the two. If we think about behavior in terms of Neisser’s (1976) perceive-decide-act cycle we can identify two areas where the mapping occurs.
When the user perceives the state of the system (or more generally, the envi-ronment) this will be in terms of physical concepts (usually variables and values)that the user will have to translate into a form that is compatible with their mentalmodel of how the system operates. Norman describes the gap between the physicalconcepts and the psychological concepts as the Gulf of Evaluation (see Fig. 12.2).The user will normally have to do some (cognitive) work to bridge this Gulf. If theuser cannot interpret the effects in terms of the original goals and intentions, thismay mean that they have to resort to problem solving to determine whether theeffects of their actions indicate that the goal has been achieved.
When the user formulates a goal, this usually leads to the intention to performsome actions to attain that goal. The user then has to translate these psychologicalconcepts into physical concepts, which are usually actions that can be executed onthe system (or, more generally, the environment). Norman describes the gapbetween the (psychological) goals and intentions and the physical actions as theGulf of Execution (see Fig. 12.2). If the user cannot readily work out how totranslate the goals and intentions into the available actions that can be performedon the system, they may end up not knowing what to do, or how to do it. In suchcases they will often have to resort to problem solving to determine what actions totake and how to execute them.
When designing systems you should normally try to minimize the size of theGulfs of execution and evaluation. Often it may not be possible to eliminate themcompletely, but you should try to make it obvious what the user needs to do tobridge the Gulfs.
12.5.2 The Gulfs in Practice
A couple of examples should help to illustrate the two Gulfs more clearly, and showhow serious the effect of large Gulfs can be. In the Kegworth air crash (see Appendix)and in many other air disasters a large Gulf of Evaluation can be identified. The truestate of the aircraft was not very clear from the instruments in the cockpit, and there
12.5 Norman’s Seven Stages of Action 345

was little directly observable feedback about the effects of the pilots’ actions. Therewere also some apparent discrepancies between the pilots’ mental model of the stateof the aircraft and the state of the physical aircraft, and the instrumentation in thecockpit did not make it easy to identify and rectify these discrepancies. In theKegworth disaster the air traffic control operatorsasked a lot of questions. Thesequestions may also have contributed to the Gulf of Evaluation for the pilots becausethey would have taken time away from understanding their situation.
The situation in the Kegworth disaster was further exacerbated by coincidentaleffects that led the pilots to falsely believe that they had attained some goals(Besnard et al. 2004). There was an identifiable Gulf of Execution in that theactions that the pilots took did not have the effects they thought they would. Whilethey had removed the vibration by shutting down one of the engines, they had notshut down the failing engine.
As you look at other interfaces, you will encounter further examples wheredetails and feedback on the state of the system can be difficult to interpret, andwhere it can be difficult to work out what actions are available and how to executethem. These sorts of problems provide an indication of where the usability of thesystem can be increased by improving the interface.
12.6 Implications of the Gulfs for Design
Norman uses the Gulfs to highlight the central importance of visibility in design.Good design involves making sure that information that is crucial to task evalu-ation and performance are made clearly visible to the user. In this way you can
Gulf of Execution
Gulf of Evaluation?
?
Fig. 12.2 Norman’s Gulf ofEvaluation and Gulf ofExecution
346 12 Methodology II: Cognitive Dimensions and the Gulfs

reduce the size of the Gulf of Execution and the Gulf of Evaluation. Table 12.3provides some general guidance on how you can try to narrow the Gulfs duringdesign.
Visibility is not an adequate guideline on its own, however, and making toomuch information visible can be a bad thing. Norman uses the example of awasher/drier that had multiple controls and several symbols displayed on the frontof it. There was no easy way to discern what each control did and what all thesymbols meant without looking at the instructions or undergoing extensivetraining. (This example assumes that the designer was not trying to drive the userto the manual to learn these symbols, a type of controlled viscosity.)
There is often a design trade-off between presenting too much information andoverloading controls to allow them to perform several different actions usingmodes. In moded systems, the way that you interpret the displays and feedbackdepends on which mode the system is currently in. This can be problematic,particularly if it is not immediately obvious which mode the system is in.
The visibility guideline, like most guidelines, needs to be adapted to the user’sparticular situation. You should think of it in terms of:
‘‘Visibility of the appropriate information for carrying out relevant tasks,’’ or
‘‘So viel wie nötig, so wenig wie möglich.’’ ? ‘‘as much as necessary, as little aspossible,’’ is a neat way of phrasing it, taken from a German aphorism.
What counts as appropriate information will vary across tasks, and sometimesacross users, and even across contexts of use (e.g., same driver, same task, dif-ferent road conditions).
When you think about visibility you should make sure that you give appropriateconsideration to feedback, consistency, and the user’s mental model of the system.These factors can all be used to help reduce the size of the Gulfs. Feedback isobviously important in helping to reduce the Gulf of Evaluation, because it showsthe effect of performing a particular action.
Users often rely on consistency within and across systems and applications.They expect interface layouts to be consistent, for example, with particular con-trols always being located in the same place and always behaving in the same way.This can be particularly important when it comes to new systems, because userswill often try to apply their knowledge of other interfaces to the new interface.Consistency is important because it will help the users to help themselves.
We know that users rely on mental models to help them perform tasks. Thesemental models develop over time, so your design should facilitate the developmentof appropriate mental models, and support the use of those mental models bymaking the appropriate information visible to users at the right time and in theright place.
In many cases you want it to be easy to use the system you are designing, sothat you can get to the point where people can use it with little or no consciouscontrol. In other words, they will be operating at a point close to Rasmussen’s(1983) skill-based level of behavior.In critical systems, however, you often wantpeople to pay close attention to the actions that they are taking, and for behavior to
12.6 Implications of the Gulfs for Design 347

be more deliberate (closer to Rasmussen’s rule-based level of behavior). Makinginteraction harder can be useful for safety critical systems (e.g., nuclear power,aviation, and so on), security critical systems, and more generally as a way ofpreventing inappropriate, costly, and illegal actions in any interface. If you want tomake the Gulfs wider, you should apply the inverse of these principles; some arenoted in Table 12.4. Figure 12.3, for example, shows a picture of an electricaloutlet designed, one can only presume, to be difficult for travelers to use.
At this point it should be clear to you that you are not simply designing to makethe system fit the user in isolation. At the same time, you need to consider how tomold the task environment to fit the user. In other words, you need to fit theenvironment to the tasks, goals, knowledge, and expectations of the user.
12.7 Limitations of the Gulfs
While Norman’s approach has been very useful as a metaphor and approach forimproving interface design over the years, it has some limitations that should benoted. The most obvious limitation is that it is intentionally simplistic. The sug-gestions that it makes are context independent. The sizes of the Gulfs are notmeasurable, and this makes it difficult to apply this approach to choose betweenalternative designs.
Table 12.3 Design principles derived from Norman’s analysis to make the Gulfs narrowerwhere appropriate
1. Use both the knowledge in the world and the knowledge in the head. Provide information in theenvironment to help the user determine the system state and to perform actions, such asexplicit displays of system state, and affordances on the system controls
2. Simplify the structure of tasks. Require less of the user by automating subtasks, or usingdisplays to describe information without being asked, or provide common actions moredirectly. However, do not reduce this below their natural level of abstraction
3. Make the relevant objects and feedback on actions visible. Bridge the Gulf of Evaluation.Make the state of the system easier to interpret
4. Make the available actions visible. Bridge the Gulf of Execution. Make the actions the user can(and should) perform easier to see and to do
5. Get the mappings correct from objects to actions. Make the actions that the user can applynatural
6. Exploit the power of constraints, both natural and artificial, to support bridging each Gulf.Make interpretations of the state and of possible actions easier by removing actions that arenot possible in the current state and reducing the complexity of the display for objects that arenot active or available
7. Design for error. Users will make errors, so you should expect them and be aware of theireffects. Where errors cannot be prevented, try to mitigate their effects. Help the user see errorsand provide support for correcting them
8. When all else fails, standardize. If the user does not know what to do, allow them to apply theirknowledge of existing standards and interfaces
348 12 Methodology II: Cognitive Dimensions and the Gulfs

To fully understand the Gulfs, designers need to understand perceptual andcognitive psychology fairly well (which is partly why we have included lots ofinformation on cognition and perception in this book). To apply this approach thedesigner has to be able to accurately judge the Gulf of Evaluation, which impliesunderstanding how the user perceives and interacts with the display. It also
Fig. 12.3 An electricaloutlet (circled) on a columndesigned to be difficult touse?
Table 12.4 Design principles derived from Norman’s analysis to make the Gulfs wider whereappropriate
1. Hide components: Make things invisible to help make the visible easier to see, and what shouldbe hard to find (because it is uncommon or unhelpful or dangerous), is hard to find
2. Avoid natural mappings for the execution side of the action cycle, so that the relationship of thecontrols to the things being controlled are inappropriate
3. Make the unavailable action physically impossible or difficult to do4. Require precise timing and difficult physical manipulation5. Do not give any feedback6. Use unnatural mappings for the evaluation side of the action cycle, so that the system state is
difficult to interpret
12.7 Limitations of the Gulfs 349
assumes that the designer either understands motor output fairly well, or that thedetails of motor output do not matter. When the interface is either simple, or hasbeen poorly designed, it will be relatively easy to make judgments about where itcan be improved. For more complex interfaces, where there are realistic designtrade-offs that need to be made, it will be more difficult to make these judgmentsaccurately and for a wide range of users.
12.8 Summary
The Cognitive Dimensions and the Gulfs of Evaluation and Execution both pro-vide a less formal and much lighter weight approach than task analyses and usermodeling techniques. They provide useful heuristics about interface design, and away to describe interface trade-offs, but they cannot always be used to compute thequality of alternative designs.
The Cognitive Dimensions provide a way to discuss particular aspects ofinterface design. They are not a complete method, but do provide a useful way tocarry out an early sanity check on a particular interface design. It is useful to havesuch techniques that can be used early on and with little effort.
The Gulfs of Evaluation and Execution remind us how users interact with asystem. Nearly all users have some common tasks related to interaction, includingevaluating the system state and executing actions. Bridging these gaps (Gulfs) willmean creating the system to support these two fundamental aspects of task per-formance. Thinking about the Gulfs can yield practical suggestions for improvingdesigns, such as making things more visible but avoiding clutter.
12.9 Other Resources
There are many resources related to Blackwell and Green’s Cognitive Dimensionsavailable at their web site. These include papers, reports, and tools.
http://www.cl.cam.ac.uk/*afb21/CognitiveDimensions/
Don Norman’s book The Design of Everyday Things (originally published asThePsychologyof Everyday Things) includes several examples of the Gulfs ofEvaluation and Execution arising out of poor design. These include a fridgefreezer, doors on buildings, and a slide projector where how to evaluate or how touse the devices were not clear. He also discusses how the designs could beimproved to reduce or eliminate the Gulfs:
Norman, D. A. (1988). The psychology of everyday things. NY: Basic Books. (2013 ed.,The design of everyday things).
350 12 Methodology II: Cognitive Dimensions and the Gulfs

Norman’s (2009) text is also worth reading. This book covers technologies likeself driving cars, and applies the basic philosophy laid out in the earlier Design ofEveryday Things:
Norman, Donald A. The design of future things. Basic Books, 2009.
12.10 Exercises
12.1 Consider a smartphone, either a specific one or a composite one. Attempt tocome up with a set of trade-offs based on Cognitive Dimensions. Describehow to choose a reasonable point in these trade-offs.
12.2 Choose an existing interface, find five similar interfaces, and note how they arerelated as different positions on Cognitive Dimensions. For example, there arepuzzle interfaces where you directly manipulate pieces and others where youtype in the piece number. These differ in viscosity and hard mental operations.The more viscous interface encourages more hard mental operations andlearning. Find similar trade-offs within a single type of interface.
12.3 Look at your work desk, and consider where you can note three trade-offs oreffects in its design with respect to the Cognitive Dimensions. For example,some desks have printouts pasted to walls near the desk. These can be seen toreduce the viscosity of the information on them.
12.3 Discuss how an online training system and a safety critical system canencourage different behaviors (e.g., learning, avoiding errors) by usingCognitive Dimensions.
12.5 Consider ways that the Word, PowerPoint, or other help system can help reducethe Gulf of Evaluation, and the Gulf of Execution. For example, try to createmultiple lines in an Excel file, or to create a string (like ‘‘1 2’’ or ‘‘p \ .05’’)where the 1 and 2 and the ‘‘p’’ and ‘‘5’’ always stay on the same line.
12.6 Create six design dimensions related to anthropometric, behavioral, andsocial trade-offs. Provide an argument in each case as to why these arefundamental dimensions. The dimensions should cross the areas (i.e., notehow they are related), or you should note why you think they are notrelatable onto a single dimension
References
Besnard, D., Greathead, D., & Baxter, G. (2004). When mental models go wrong. Co-occurrencesin dynamic, critical systems. International Journal of Human-Computer Studies, 60, 117–128.
Blackwell, A. (2002). First steps in programming: A rationale for attention investment models. InProceedings of the IEEE Symposium on Human-Centric Computing Languages andEnvironments, 2–10. Arlington, VA: IEEE Press.
12.9 Other Resources 351

Blackwell, A., & Green, T. (2003). Notational systems—The cognitive dimensions of notationsframework. In J. M. Carroll (Ed.), HCI models, theories, and frameworks (pp. 103–133). SanFrancisco: Morgan Kaufmann.
Blandford, A., Green, T. R. G., Furniss, D., & Makri, S. (2008). Evaluating system utility andconceptual fit using CASSM. International Journal of Human-Computer Studies, 66,393–409.
Cohen, M. A., Ritter, F. E., & Haynes, S. R. (2012). Discovering and analyzing usabilitydimensions of concern. ACM Transactions on CHI, 19(2), Article 9. 18 pages.
Green, T. R. G. (1989). Cognitive dimensions of notations. In People and Computers V (pp.443–460). Cambridge, UK: Cambridge University Press.
Grudin, J. (1989). The case against user interface consistency. Communications of theACM, 32(10), 1164–1173.
Jones, M. C., Churchill, E. F., & Nelson, L. (2010). Mashed layers and muddled models:Debugging mashup applications. In A. Cypher, M. Dontcheva, T. Lau & J. Nichols (Eds.), NoCode Required: Giving Users Tools to Transform the Web: Burlington, MA: MorganKaufman.
Kotovsky, K., & Simon, H. A. (1990). What makes some problems really hard: Explorations inthe problem space of difficulty. Cognitive Psychology, 22, 143–183.
Neisser, U. (1976). Cognition and reality. San Francisco, CA: W. H. Freeman.Norman, D. A. (1988). The psychology of everyday things. NY: Basic Books.Norman, D. A. (2009). The design of future things. NY: Basic BooksNorman, D. A. (2013). The design of everyday things. NY: Basic Books.Peyton Jones, S., Blackwell, A., & Burnett, M. (2003). A user-centred approach to functions in
Excel. In ICFP’03: Proceedings of the eighth ACM SIGPLAN International Conference onFunctional Programming (pp. 165–176). ACM Press: New York, NY.
Rasmussen, J. (1983). Skills, rules, knowledge: Signals, signs and symbols and other distinctionsin human performance models. IEEE Transactions: Systems, Man, and Cybernetics, SMC-13,257–267.
Sweller, J. (1988). Cognitive load during problem solving: Effects on learning. Cognitive Science,12, 257–285.
Yeh, K.-C., Gregory, J. P., & Ritter, F. E. (2010). One laptop per child: Polishing up the XOlaptop user experience. Ergonomics in Design, 18(3), 8–13.
352 12 Methodology II: Cognitive Dimensions and the Gulfs
Chapter 13Methodology III: Empirical Evaluation
Abstract Evaluation is an essential part of development. There are several goodreasons for carrying out user testing in particular. A successful evaluation requirescareful planning. Here we describe the issues that you need to take into accountand discuss several effective methods that can be used to collect data. User testingreduces the risk that you will deliver a system to your users that is unusable and istherefore ineffective. We also touch briefly on the need make sure that anyevaluation that you carry out is conducted according to appropriate ethicalguidelines.
13.1 Introduction
Evaluation should be a routine and regular part of system development. Attitudesto evaluation continue to vary widely, however, with many people still mistakenlybelieving that testing only happens at the end of development. The main problemwith such an approach is that if development overruns while the delivery deadlineremains fixed, it is usually testing that gets cut (because it is the last thing tohappen). The net result is that the delivered system ends up being tested inade-quately and, as a result, does not work as expected.
There are two statements that are worth remembering when it comes to eval-uation. The first is ‘‘Test early, test often.’’ The second is ‘‘Quick and dirty is betterthan nothing.’’ Any evaluation program should deliver something informative forthe system design and development. Testing can be expensive, but need not be.Lightweight methods that offer a proportionately larger return on investment arealso available (Monk 1998; Nielsen 1993).
It is also worth remembering that when software engineers, in particular, talkabout evaluation they will often refer to V & V, or verification and validation.Verification is about making sure that you are building the product right, and it is aprocess that is often carried out within the developer company. In contrast, vali-dation is about making sure that you are building the right product, and usually
F. E. Ritter et al., Foundations for Designing User-Centered Systems,DOI: 10.1007/978-1-4471-5134-0_13, � Springer-Verlag London 2014
353

involves some sort of acceptance test with the customer to make sure that therequirements have been met. You should make sure that you have the distinctionbetween these two clear in your own head.
In this chapter we provide an introduction to the topic of evaluation and themethods that can be used to collect data. For a much fuller discussion about whichanalytical methods to use, you should consult an appropriate textbook such asLazar et al.’s (2010) book Research methods in human–computer interaction. Wedo not go into the details of the methods you need to use to analyze your data. Theway that you analyze the data is important, but is highly dependent on the type ofdata that you collect, and the overall purpose of the evaluation. More informationabout how to analyze your data can be found in statistics books, such as Howell(2010) or, for qualitative data Miles et al. (2013) and Todd (2004).
13.1.1 Why Do We Need User Testing?
If we could always guarantee that systems would be built correctly, based on acomplete and accurate analysis of user requirements, then there would not (the-oretically, at least) be a need for user testing. There are several reasons why wecannot give such guarantees, however. Perhaps the most pertinent one here is whathas been called the envisioned world problem (Carroll and Rosson 1992; Woodsand Dekker 2000), which is based on the fact that the world will inevitably changebetween the time when the user requirements are analyzed and the time when thefinal system is delivered. Often the changes are in ways that cannot be (fully)controlled by the users. So, when the requirements analysis is carried out, the usersare effectively being asked to define what the system will need to do to workacceptably in some future context which they cannot fully predict or envision.
There are still some system developers who believe that as long as a systemdoes what they consider to be the right thing, then that is enough. Their attitude isthat if the users cannot make the system work, it is due to the users’ lack ofknowledge or ability, rather than being due to some fault of the developers. Thefundamental problem with this view is that if the delivered system does not fit withthe way that users normally carry out their work, there is a risk that it may not beaccepted (e.g., see Berg 1997). The acid test of acceptability often comes when theusers have to try to use the new system in their normal working environment.
The purpose of user testing is not to understand users but to evaluate howparticular users can carry out particular tasks (using your system) in a particularcontext. There are still some designers who mistakenly believe that they knowexactly how users carry out their work. In practice, however, when you observeusers you see that they are often very creative, and use systems in ways that werenever conceived of by their designers. The use of spreadsheets to format text or tomake art, the use of thumbs to press cell phone buttons, and the use of social mediabroadcast tools like Twitter to organize political activities are just a few examplesof creative use that were never imagined by their designers.
354 13 Methodology III: Empirical Evaluation

We know a lot about users, and their capabilities and limitations. We havecovered much of this in the first part of this book and considered the implicationsfor system design. Given what we know about the human visual system (Chap. 4),we can deduce that a 3-point font is likely to be too small to read. User testing isnot necessary here; the decision can be derived from first principles. User testingmay still be essential, however, for other system related questions—for example,to provide evidence that the right design choices and assumptions have been madewhen theories and assumptions make different suggestions, and that the systemwill work in its intended context.
Comprehensive user testing can be expensive and time consuming, but thatdoes not mean that user testing should be ignored. As noted above, there areseveral discount or lightweight methods that can be used (Monk 1998; Nielsen1993) to identify potential problems more cheaply, and at an earlier stage ofdevelopment.
13.1.2 When Do We Carry Out User Testing?
Everybody makes mistakes—in the most general sense of the term—from time totime. This includes developers who may base their design decisions on insufficientor incorrect information at any stage of the development process—for exampleduring analysis, design, and/or implementation. The consequences of these mis-takes may not always be immediately apparent, but may surface much later.Carrying out evaluations helps to identify potential problems so that they can beappropriately rectified before the system gets delivered.
The ultimate goal of user testing is to make sure that the users can get thedelivered system to do what they want it to do. In addition to helping to show thata system meets its requirements and is acceptable to the users, testing can also helpto identify flaws in the development process. User testing is therefore often aneffective way of providing designers with timely feedback at a relatively earlystage during ongoing iterative development. Evaluating cheap, simple prototypesearly in the development cycle can help to avoid potentially costly mistakes at alater stage in the lifecycle.
It is worth noting one of the practicalities of design that has implications forevaluation. It may not always be possible for designers to consult users during allstages of development. Instead, they work with a customer representative to comeup with a system that will be acceptable to the users. Sometimes, however, thecustomer representative is not one of the target users, so they may not fullyunderstand the subtleties of how the users really carry out their work using thesystem. It is therefore better to try to make sure that you can involve real usersduring evaluation.
Many developers still neither really understand what their users do, nor whythey do what they do. Design and development are often carried out in isolationfrom the end users—agile methods can help address this limitation—with the
13.1 Introduction 355

result that the delivered system is not acceptable, because it does not fit in with theway that the users work. User testing during the early stages of development canhighlight potential problems: making developers watch users wrestle with theirproduct in an effort to make it do what they want is often a real eye-opener.
At least some part of systems development is based on the use of guidelines andprinciples. There are many guidelines and principles available, and they are mostlygeneric, which can make selecting the relevant ones for a specific project a majortask. If you do use guidelines and principles, user testing can help to highlight themore subtle aspects of the system’s context that need to be taken into accountduring development, thereby providing evidence to support your particular choice.
13.2 Planning Your Evaluation Study
Collecting data is not difficult. Collecting the right data—data that is pertinent tothe questions that are being posed—is not so straightforward. Collecting theappropriate data to answer strategically relevant questions requires careful plan-ning. Here we identify some of the main issues that can help to improve thechances of your evaluation study being a success. Many of the issues that wehighlight are central to good experimental design.
13.2.1 What Type of Data: Qualitative or Quantitative?
One of the first things you will need to consider is the type of data that you willcollect. The general rule of thumb is that you should think about collecting data tohelp you understand the thing (system, product, application, and so on) before youcollect data to more precisely measure it. Typically the first type of data to collectis qualitative data, in other words, statements or general behavior, rather thanprecise numbers. Quantitative measures (e.g., times, number of clicks) can be usedto verify assumptions with some degree of confidence over the intended populationof users.
13.2.2 Selecting a Hypothesis
Creating hypotheses for your evaluation study helps to frame the study but also tokeep it focused and grounded. A hypothesis is a proposition of what you believe tobe the case (e.g., that a change you have made will cause a change in user behaviorin some way) and will check with data. The null hypothesis (H0) normally statesthat there is no difference between the things you are testing, e.g., there is nodifference between the usability of application A and of application B. The
356 13 Methodology III: Empirical Evaluation

alternative hypothesis (H1) and the null hypothesis are mutually exclusive, so inour case it would be that there is a difference between the usability of applicationA and of application B. The multi-dimensional nature of usability means thatexperiments are often set up with several pairs of hypotheses, one for eachdimension of usability. Some user studies might have multiple hypotheses to betested.
13.2.3 Identifying the Dependent and Independent Variables
An independent variable is a factor that is independent of user behavior, and whichcan be varied by the person carrying out the evaluation (or the experiment, moregenerally). The dependent variable is the thing that depends on the user’s behavior,or on the changes in the independent variable(s). Within user centered design, thesorts of things that would often be considered as independent variables include thetype of input device (e.g., touch screen or keyboard), or different web pagedesigns. The dependent variables are often more limited, however, to those thingsthat are generally taken to measure the usability of a system (e.g., efficiency,effectiveness, satisfaction, ease of learning, and workload).
13.2.4 What Type of Evaluation: Formative or Summative?
There are two basic types of user-based evaluation: formative and summative.Each of these has a different purpose, and takes place at a different stage ofdevelopment, as described below. They each help to remove different types ofuncertainty, and to reduce the risk that the system will not be usable, or will beunacceptable to the end users.
Formative evaluation can take place at any point during development. It is usedto help designers refine and form their designs. The focus of formative evaluationis to identify problems and potential solutions. In this type of evaluation thedesired result is an indication of any problems that there may be in using thesystem, possibly with some indication of their frequency of occurrence. Thedesigners can then use these frequencies to help rate the severity of the problemsso a decision can be made about which problems should be fixed first.
Summative evaluation is concerned with assessing the success of the finishedsystem or product, summarizing its overall impact and effectiveness. It is oftenused to test for any fixes that may be needed before the system is released, and toassess future releases. The end result may be some sort of usability score, andindividual organizations may have their own particular threshold values foracceptability. One useful metric is to require that novice users of a new system areable to demonstrate performance levels that are some predetermined percentage ofexpert levels on the same system. The performance levels are measured using a set
13.2 Planning Your Evaluation Study 357

of predefined benchmark tasks. Defining a set of appropriate summative measuresremains a difficult problem to solve, however, because systems, unlike manymanufactured goods, cannot be assessed against tight specifications and tolerances.
13.2.5 Validity, Reliability, and Sensitivity
When it comes to designing an evaluation study, you want to make sure that youare evaluating the right thing, that you can measure the effects that you are lookingfor, and that the results can be generalized to other situations. To achieve thesegoals, you will need to think about the issues of validity, reliability, and sensitivity.This is true irrespective of whether you are collecting qualitative or quantitativedata.
13.2.5.1 Validity
Validity refers to whether the measure that you are using is really measuring whatit is supposed to be measuring. Reliability, on the other hand, refers to the con-sistency of a measure across different conditions. Note that it is possible to use ameasure that has validity, but is not reliable, and vice versa. You should be aimingfor high degrees of validity and reliability.
In addition to validity and reliability, you will also need to consider the sen-sitivity of the measure that you are using: does it react sufficiently well to changesto the independent variable. Validity, reliability, and sensitivity will all differ,depending on the context in which you are doing the evaluation.
There are several types of validity that you will need to think about. Here theyare classified into two basic types:
• Instrument validity which relates to the instruments or measures that you willuse in your evaluation. There are three subtypes: construct validity, contentvalidity, and face validity.
• Experimental validity which relates the generalizability of the results. There arethree subtypes: internal validity, external validity, and ecological validity.
We discuss each of these in more detail below as well as explaining the trade-offs that you may need to make when deciding on which type of experimentalvalidity is important to your evaluation study.
Construct validity refers to the extent that your instrument or measure reallydoes measure what you think it does. Probably the simplest example is to thinkabout an IQ test as a whole, and how much it actually measures intelligence.Supporting evidence usually comes from both theory and testing, and can includestatistical analysis of how responses and test items are related. If you think aboutusability, and how you measure that, things start to get a bit trickier because thereare several different dimensions to the concept of usability. In other words, you
358 13 Methodology III: Empirical Evaluation

cannot directly assess the usability of an artifact using a single measure. In thiscase you first have to operationalize the concept of usability, and then measure thedifferent dimensions separately to assess efficiency, effectiveness, satisfaction, andso on. So although you are not measuring usability directly, by measuring theseparate dimensions you are improving your construct validity. At this stage youwill also need to think about the content validity.
Content validity refers to whether the content of a measure or instrumentcorresponds to the content of the construct that the test was designed to cover.Again, if we think about an IQ test, its content validity is determined by whetherthe items in the test cover all the different areas of intelligence that are discussed inthe literature. For a usability survey, you would systematically examine the itemsin the survey to make sure that you had covered all of the relevant aspects ofusability for the artifact that you are evaluating. So you might have items about thedisplay layouts, the content, and so on. Often the way that content validity isevaluated is by having domain experts compare the test items against the speci-fication for the thing that is being tested.
Face validity (also called surface validity) refers to whether a test appears tomeasure a certain criterion. It is closely related to content validity. The maindifference is that you assess content validity by using a systematic review, whereasyou assess face validity by having people make judgments about the test simplybased on the surface appearance of the test. You could assess face validity, forexample, by asking somebody (it does not have to be an expert) what they thinkthe test is measuring. Sometimes you may get more honest answers if you havelower face validity, because the people doing the test are focused more on the taskthan what they think is being tested. It is also worth noting that you should not relyon face validity alone, because even so-called experts can get it wrong (consider,for example, the way they used to test whether someone was a witch or not in theMiddle Ages).
Note that a test may have poor face validity but good construct validity. A gamein which you shoot a gun at letters might not appear to measure spelling ability, forexample, unless the letters pop up in a pattern that is based on correct spelling.Similarly, a tank simulation game might have poor surface validity for a navaltask. However, both of these situations might have good construct validity in thatthe mental representations or the perceptual goals and cues are accurately repre-sented (Smallman and St. John 2005). So you may have to consider how to tradeoff face validity against construct validity (and content validity) when designingyour evaluation study.
Internal validity refers to how well conclusions can be drawn about cause-effect(causal) relationships based on the study design, including the measures used, andthe situation in which the study was carried out. Internal validity is generallyhighest for tightly controlled studies which investigate the effect of an independentvariable on a dependent variable, often run in a laboratory setting. To get goodinternal validity you need to make sure you control for other effects that couldhave an impact on the results you obtain. These include:
13.2 Planning Your Evaluation Study 359

• Maturation of the participants: if their condition changes over the duration of thestudy, e.g., they become more tired.
• The types of participants: it is often impossible to use randomly selected par-ticipants, so you need to make sure that you do not end up with unbalancedgroups of participants (e.g., all males, or all people aged over 50 in one of thegroups).
• Testing effects: if you give participants in the study the same test at two differenttimes, they may find it easier the second time because they already know thequestions.
These potential confounding effects are well known. In many cases there arewell documented solutions too which can be found in books on experimentalpsychology methods such as those by Calfe (1985), Ray (2008), and Campbell andStanley (1963).
External validity relates to how far the results of the study can be generalized toother populations (such as different user groups), other places, and other times.One of the main factors that needs to be considered is the choice of participantsused in the study. If all your participants are university students, for example, howcan you be sure that the findings will apply to people who are aged over 60? To getgood external validity you need to be aware of other effects that could have animpact on the results that you obtain, and provide some way of alleviating them.These effects include:
• Awareness of anticipated results: if participants can guess what they think theoutcome of the study should be, they may adapt their behavior to what theythink you expect them to do.
• The Hawthorne effect: people’s performance can change simply as a function ofbeing watched or recorded.
• Order effects: if you test people on artifact A first and then artifact B, there maybe some carryover effect which means that their results with artifact B are betterthan they would otherwise have been.
• Treatment interaction effects: it may be the case that the participants in yourstudy are motivated differently, and the way they are allocated to groups fortesting means that you have one group that is more highly motivated than theother, which hence performs at a higher level.
Again, these potential confounding effects and solutions to the problems causedby them can be found in the literature mentioned above.
One way to increase external validity is to make sure that you use a wide rangeof users, stimuli, and contexts. The downside is that this will increase costs (timeand money) and make it more difficult to detect real differences. Care is alsoneeded to make sure that you do not reduce reliability (which is discussed below).
Ecological validity refers to the extent to which your results can be applied toreal world settings. You should be able to see that it is closely related to externalvalidity. For an evaluation study to have high ecological validity, the methods,materials, and setting of the study must approximate the real-life situation that is
360 13 Methodology III: Empirical Evaluation

being investigated. If you wanted to conduct an evaluation of the usability of anapplication that is used in an office environment, for example, you would need tomake sure that your setting resembled that of a normal office, where telephonecalls and conversations (work and non-work related) are both constant sources ofinterruptions to task performance. The downside of having high ecological validityis that you cannot control all the possible independent variables that may affect thething you are trying to measure.
At first glance there appears to be a conflict between internal and external (andecological) validity. The main reason for carrying out evaluations in a laboratorysetting is so that you can control for all interfering variables. Although this willincrease your internal validity you lose external and ecological validity becauseyou are using an artificial context for collecting data, and your results may notgeneralize to the real world—you may lose external and/or ecological validity. Ifyou are carrying out an evaluation in a real world setting, however—usingobservation, for example—you will have high external (and ecological) validitybut your internal validity will be reduced. Whether this is a problem or not dependson your research strategy. If you are following an inductive research strategy, thenit is a problem because you will be concerned with the generalization of results; ifyou are following a deductive strategy, to test a theory, for example, then it is not aproblem, because you are only concerned with threats to internal validity.
13.2.5.2 Reliability
Reliability refers to the ability of a measure to produce consistent results when thesame things are measured under different conditions. Usually this is used in thecontext of test–retest reliability. In other words, if you conducted the same test againunder the same conditions, but on a different day or with a similar set of participants,for example, you should get the same results if the measure is reliable. Reliability isalso used in the context of assessing coding schemes, particularly when you need toencode the responses that you collect from users. If a coding scheme is reliable, thenwhen you give the scheme and the data to another person, they should code the samedata items in the same way. The level of agreement between the people who do thecoding is what is called the inter-rater reliability, and you can measure this sta-tistically (Cohen’s Kappa test is often used to calculate the results).
13.2.5.3 Sensitivity
Even if the selected measure is both valid and reliable, it may not be sensitiveenough to produce discernible effects that can easily be measured. The chosenmeasure may not change very much when you change the independent variables,for example. In this case it may be necessary to use a large number of participants.To achieve results that are statistically significant, however, you will still need tomake sure that the measure has high reliability; otherwise your results will still beopen to question.
13.2 Planning Your Evaluation Study 361

13.3 Evaluation Methods
Evaluation methods are generally divided into four categories: usability testing,field studies, expert (heuristic) evaluation, and A/B testing. One of the funda-mental notions behind expert evaluation is that a small number of experts can beused to quickly identify a large number of the problems with the system. Youshould think carefully before using these methods because they are not ideallysuited to all types of system. Each of the evaluation methods has its own strengthsand weaknesses, and they are often used in combination with each other.
13.3.1 Usability Testing
The term usability testing is usually restricted to describing the evaluation of theusability of a system under controlled (laboratory) conditions. Quite often usabilitytesting is carried out in dedicated laboratories that have been specially designed forthe purpose. Fluent Studios, for example, is a usability laboratory based in centralLondon. It consists of two purpose-built usability rooms, equipped with highdefinition audio-visual technology. These rooms are shown in Fig. 13.1.
Different organizations will set up their usability testing facility in differentways. Generally, one room is set up for testing whilst the other is configured as anobservation room, which allows the developers, testers, and other interestedstakeholders to see what the users are doing without disturbing them through theirpresence in the same room. The rooms are physically separated rather than beingconnected by a one-way mirror. Any action that takes place in the testing room isprojected into the observation room. There are several advantages to using pro-jection rather than a one-way mirror:
Fig. 13.1 A user working with a system being tested (left) and the observation room wheredesigners and analysts can watch the study going on (right). (Copyright � Fluent Interaction Ltd,www.fluent-interaction.co.uk, reproduced with permission)
362 13 Methodology III: Empirical Evaluation

• Observers feel less intrusive• Observers can talk in the observation room• Observers can move around, allowing brainstorming activities• Participants are less aware of being watched (because there is no large mirror in
the room, and sound contamination is reduced)• A visual area larger than the participant’s screen can be used to observe what
they are doing• There is greater flexibility in the way the observation room can be configured• Costs are reduced• It is easier to use• The volume of what the participant is saying can be controlled within the
observation room.
Fluent Studios’ laboratory is used to conduct usability tests in a creativeenvironment. Whilst one-to-one testing is carried out with users in the testingroom, it is regarded as very important to get the observers involved as well. So,often when a new design or prototype is being tested, the tests will be designed totry and identify usability issues early on in the testing, so that they can be resolvedat the earliest opportunity.
Usually the first step in testing is to develop a set of task scenarios that capturethe critical characteristics of the tasks that are likely to be carried out using thesystem (Carroll 2000). These scenarios are usually descriptions of real-world tasksthat users can be expected to understand, but the scenario does not describe how thetask is done using this system. They are typically expressed as problems that theuser would normally be expected to solve using the system as part of their work.
For example, consider the following scenario:
You are a system administrator for a software system that schedules and allocatesresources ranging from company pool cars to meeting rooms. Unfortunately one of themeeting rooms has unexpectedly been designated to be refurbished, which will take2 months beginning in July. Your task is to notify those people who have booked the roomfor July and August and to provide alternative resources.
You should be able to see that this scenario contains a goal, information aboutthat goal, and information about the context in which the task takes place. It doesnot, however, contain instructions about how to use the system to achieve thedesired goal.
The focus of the scenarios determines the shape of the evaluation: everydayusage scenarios, for example, will capture information about everyday usage of thesystem. Similarly, for critical systems (safety critical, mission critical, businesscritical, and so on) the scenarios would be designed to focus on critical (butunusual) incidents. Ideally a more comprehensive evaluation could be carried outusing both types of scenarios.
An illustration of the benefits of usability testing occurred when new designs fora national educational site were being tested in Fluent Studios. Some usabilityproblems were quickly observed with the method of global navigation: the firstfour users who were tested all struggled to find the site’s home page. Between
13.3 Evaluation Methods 363

testing sessions a new page header was developed, and tests with the next fourparticipants demonstrated that the introduction of the new design had resolved theproblem. This rapid development methodology is used to test designs in an agileway, which makes the most effective use of the testing time allocated to a project.
13.3.2 Field Studies and Field Experiments
Field studies, as the name implies, are evaluations that are carried out in the field,that is, in real world settings. Field studies are often carried out to discover moreabout the context of use of a technology that is to be designed or is being designed.Studying activities in the ‘‘real’’ world can be challenging. If you just think aboutthe things that happen every day in an office environment you should start to getthe picture. In an office, users may be carrying out some task using the computer.They can break off from their work at any point, though, such as when they areinterrupted by the telephone ringing, if a colleague stops by to discuss something(work or otherwise), or if their boss calls them into a meeting. So carrying out thetask is not simply a matter of planning what to do, then just getting on and doing itstep by step in sequence, from start to finish: people will often have to juggleseveral, possibly unrelated, and often unscheduled, activities at once. The bigadvantage of field studies is that they show you how people really work. Oneobvious design implication of the fractured nature of work is that you should makeit relatively easy for people to pick up where they left off after an interruption. Themain disadvantage of field studies is that it is often very difficult to exerciseexperimental control over what happens, so it is harder to focus on the relation-ships between some of the task variables, and to have results that are both generaland applicable to other settings or times.
Field experiments are trials of technologies in real world settings. This is oftenwhen a fully functional prototype can be deployed into a real world setting and, asdesigners and developers, we want to see how users will interact with the tech-nology. Such field experiments tend to be for non-safety–critical systems, such asrecreational and social Internet sites. Often there is some latitude for changing thetechnology, but most of the functionality is set. In this instance, the evaluation willlikely involve many different methods: collecting usage data, conducting obser-vations of the technology in use, interviewing and surveying users, small con-trolled experiments, and so on (for an example of a technology that was fielded andevaluated see Churchill et al. 2003).
13.3.3 (Expert) Heuristic Evaluation
Heuristic evaluation (Nielsen and Molich 1990) is a relatively informal way ofanalyzing the usability of an interface design. A small select number of people—ideally interface design experts, and preferably domain experts too—are asked to
364 13 Methodology III: Empirical Evaluation

make judgments, based on a set of guidelines or principles together with their ownknowledge, about a particular design. The individual results are then aggregatedtogether. In this way it is possible to overcome the inherent inaccuracy of indi-vidual evaluations.
In the ideal world all of the evaluators would use the same (standard) set ofcriteria for judging what is good or bad. In reality, most people tend to rely onintuition and common sense, partly because most usability guidelines tend to beexcessively large, often having many tens or even hundreds of rules (e.g., Brown1988; Mosier and Smith 1986). Molich and Nielsen (1990), however, suggestedthat a relatively simple set of guidelines can be used as the basis for evaluation.Initially they used nine guidelines, but over the years, these have been refined andthe number increased to ten, as shown in Table 13.1.
Each expert works their way through the user interface design individuallynoting compliance with the heuristics. Note that the user interface may just be apaper-based prototype, because the experts are not being asked to carry out tasksusing the system. Problems that are detected can either be written down orrecorded verbally (e.g., by taking verbal protocols). The individual results are thenaggregated to highlight the detected problems.
Typically, only three to five experts are required to carry out a heuristic eval-uation and generate useful results. Many people have taken this to be a hard andfast rule for all types of evaluation, however, which can be a serious mistake. Therequisite number, to a large extent, depends on the diversity of the eventual userpopulation. So, for example, if you were designing an on-line population census,then it would not make sense to just use three to five users, since such a smallsample is very unlikely to be truly representative of the diversity inherent in anation’s general population.
Table 13.1 Heuristic basis for user interface evaluation (adapted from http://www.nngroup.com/articles/ten-usability-heuristics)
1. The current system status should always be readily visible to the user2. There should be a match between the system and the user’s world: the system should speak
the user’s language3. The user should have the control and freedom to undo and redo functions that they
mistakenly perform4. The interface should exhibit consistency and standards so that the same terms always mean
the same thing5. Errors should be prevented where possible6. Use recognition rather than recall in order to minimize the mental workload of the users7. The system should have flexibility and efficiency of use across a range of users, e.g., through
keyboard short-cuts for advanced users8. The system should be esthetic and follow a minimalist design, i.e., do not clutter up the
interface with irrelevant information9. Users should be helped to manage errors: not all errors can be prevented so make it easier for
the users to recognize, diagnose, and recover10. Help and documentation should be readily available and structured for ease of use
13.3 Evaluation Methods 365

It should be noted that many of the problems that are identified by heuristicevaluation may not affect the usability of the system. In addition, the results areoften only presented in negative terms, focusing on what is bad about the design,instead of also highlighting the things that are good.
13.3.4 Co-operative Evaluation
Co-operative evaluation is another type of expert evaluation method. It wasdeveloped at the University of York (UK), and is related to Scandinavian designpractices (Monk et al. 1993; Müller et al. 1997). As the name suggests, theevaluation is carried out co-operatively, with the user effectively becoming part ofthe evaluation team. The method is based on the notion that any user difficultiescan be highlighted by two simple tactics:
1. Identifying the use of inefficient strategies by the user (e.g., copy-paste-delete,rather than cut and paste).
2. Identifying occasions when the user talks about the interface, rather than theirtasks. These are called breakdowns, based on the notion that good tools shouldbe transparent, so the user should be talking about the task rather than thetechnology.
The user is asked to talk aloud as they carry out a series of tasks, and can beprompted with questions. It is a formative evaluation technique, in that it is used togather information about the design as it is being formed. The method cantherefore be used with a working prototype or with the real system.
13.3.5 A/B Testing
A recent trend is to do live testing of multiple interfaces. This is called A/B testingor bucket testing. In this approach a web service exposes different users to differentinterfaces and/or interactions. This can be seen at Google, for example, who wasone of the first Internet sites to use this method extensively to guide their interfaceand interaction design decisions. In bucket tests, interfaces can vary in subtleways, such as color changes, or may differ substantially, including manipulationsof key functionality. User actions such as clicks (measured as CTR or clickthrough rates) are studied to see the impact on user behavior, if any, of thechanges.
There are many advantages to these kinds of studies—not least that a test can berun at scale and while maintaining ongoing business, and that feedback is fast. Ofcourse, this approach requires building the test interfaces, and having the platformon which to partition users into conditions and deliver the experiences.
366 13 Methodology III: Empirical Evaluation

13.4 What to Evaluate?
In general, the sooner evaluation is done during development, the sooner you willget feedback, and the more likely it is that the delivered product will be bothusable and acceptable to users. There is a trade-off here between the need forevaluation and how closely related the current version is to the final version. If aniterative development life cycle approach is used, this means that evaluationshould be carried out as part of each iteration. Obviously, the earlier in develop-ment that evaluation takes place, the less developed the system that is beingevaluated will be. The way that evaluation is often carried out during developmentis using some sort of prototype, until eventually the full system can be evaluated.The prototype usually starts out as something with low fidelity (possibly just oneor more sketches), and increases in fidelity as the project progresses.
13.4.1 Pencil and Paper Prototypes
At the earliest stages of development, pencil and paper mockups of the interfacecan be shown to the users, who are then asked how they would carry out particulartasks. This technique, which is often described as storyboarding should ideally becarried out with real users, although other designers, and even hostile users, couldbe employed.
Using pencil and paper sketches is cheap, and can be used very early in design.At this stage, ideas are usually still being explored, so the evaluations are usuallyformative. The data collected are normally qualitative rather than quantitative,with the results being used to inform the design of the artifact.
13.4.2 Computer-Based Prototypes
The next level of sophistication involves building a computer-based prototype.There are now several tools around that can be used for prototyping at severallevels, from pencil and paper style sketches to interactive working prototypes.
At the earliest stages of computer-based prototyping you can employ Wizard of Oztechniques, where the user will interact with a prototype (computer-based) interface.The full functionality of the rest of the system is usually not available at this point, soa human acts behind the scenes to process user input and actions and provide therequired responses (like the Wizard of Oz did in the film!). This technique has beenused very effectively for evaluating the potential of speech-based systems.
The level of sophistication of the prototype should naturally increase asdevelopment progresses, and the prototype becomes closer to the finished product.How it develops will depend mostly on which basic method of prototyping youuse: evolutionary or revolutionary. In evolutionary prototyping, the original
13.4 What to Evaluate? 367

prototype is refined after each iteration of the development cycle: the prototypeevolves towards the deliverable version. This is the sort of approach that is used indeveloping web sites, where they use wireframes to lay out the basic initial design,which then gets filled in and refined as the design evolves. In revolutionary pro-totyping, the current prototype is thrown away at the end of each iteration of thedevelopment cycle, and a new prototype is developed.
In addition to helping identify design issues, prototypes can also be used to helpusers to articulate requirements. People often find it much easier to talk aboutsomething concrete, referring to the prototype, than to talk about somethingabstract, where they have to imagine what the application or product should do.
Prototypes vary in cost, depending upon the sophistication of the prototype andthe length of the evaluation period (laboratory-based user testing vs field studies).They do tend to give good results and are suitable for many stages of the designprocess, for both formative and summative evaluations.
13.4.3 The Final System
Evaluations of the final system will often be performed in house first, possiblyusing laboratory-based testing. If there is latitude for some redesign, systems maybe deployed and field experiments conducted, but this only tends to be the case forsystems that are not safety–critical, as noted above. For enterprise, and safety- andsecurity-critical systems, it is more usually the case that the system is evaluated infull before it gets delivered to the customer. The final system will usually besubjected to a formal acceptance test, normally on the customer’s premises, wherethe customer will sign to say that the system has successfully passed the agreedtests. You should note that web sites are very rarely tested at the customer’s site(largely because they will normally be used from elsewhere).
Once a system is delivered and has been accepted by the customer, it is unlikelythat any further formal evaluation will take place. The picture is slightly differentfor web sites, however, where the delivered system will normally reside in adynamic environment, so the iterative development may continue, albeit withiterations that have a longer duration. In both cases, data on patterns of usage maybe collected, along with information about problems logged with customer sup-port, as noted above, and this can be used to inform future development projectsand refinements to existing systems and products.
13.5 Measuring Usability
There are several dimensions to usability, so there are several measures, bothqualitative and quantitative, that can be used to indicate how usable a particularartifact is. Most people will be familiar with task time as the de facto standard for
368 13 Methodology III: Empirical Evaluation

measuring efficiency and productivity, and hence giving an indication of usability.There are several others too, though, and they are usually concerned with eitherperformance (quantitative measures) or process (qualitative measures). There isalso the concept of user experience, related to how much satisfaction the userobtains from the system. Here we briefly describe the measures that you are mostlikely to encounter. Often you will use several complementary methods to mea-sure usability, such as a combination of task performance times, and a usabilitysurvey.
13.5.1 Task Time
Task performance time is widely used as a measure of efficiency within the fieldsof HCI and human factors and ergonomics. The task is usually one of three: asmall cognitively manageable task, often referred to as a unit task (Card et al.1983); a standard, predefined benchmark task (that you use to assess efficiency forsimilar artifacts); or a task scenario (as described above).
It is easy to determine task time using a stop watch, for example, or using timestamps if you are recording task performance. Time is a measure that is widelyunderstood, and is easy to analyze statistically. Time is generally used as ameasure in summative evaluations of the final system. Where the performancetime is relatively insensitive, however, it can be costly to carry out evaluations,because you will have to run the test many times to be able to draw solid statisticalconclusions from the results.
Remember that usability is not only concerned with how easy something is touse, but also how easy it is to learn to use. Task times can also be used todetermine how long it takes to learn to use a system. Normally some thresholdlevel of performance is defined in advance, and the length of time it takesto reach that threshold is measured. Alternatively, the length of time it takesto recover from observable errors can be measured: you would expect to seethis time reduce as people learn how to do the task and how to manage theerrors.
One of the main problems of using time measures is that they are not easilycompared unless all the contextual elements (tasks, level of expertise, lightingconditions, and so on) are kept constant. The corollary of this is that if you want tocompare times when you cannot fully control the contextual effects, you have toconvert the data into a more stable metric, i.e., one that is not so easily affected bychanges in these elements. One way of doing this, which was proposed by Whitesideet al. (1985), is to calculate a score in the range 1–100 as shown in Eq. (13.1):
Score ¼ 1=Tð Þ � P � C ð13:1Þ
where T = time, C = constant based on fastest expert time, and P = percentageof task completed.
13.5 Measuring Usability 369

13.5.2 Errors
Errors can be measured quantitatively (by simply counting them) or qualitatively (bynoting the different types of error). Whilst time is best suited to summative evalu-ations, error measures can be used in both summative and formative evaluations.
As we have already seen in Chap. 10, however, errors are not easy to define,and they can be hard to count too. This is particularly true when observing expertbehavior. One of the key aspects of expert performance is that they often detectand recover their own errors before the effects of the error become apparent tooutside observers. So if you watch an expert perform a task, you may not evenrealize that they have made an error.
We can distinguish many types of errors—slips, mistakes, violations, mode errors(e.g., problems with grayed out menu items), discrimination errors (e.g., selecting thewrong menu item because of ambiguous labels), and so on. The types of errors willvary depending on which taxonomy of errors you use (see Chap. 10 for examples).
13.5.3 Verbal Protocols
Verbal protocols can be a useful way of understanding the issues that confrontusers as they try to tackle particular problems using some artifact. Some care isneeded when reading about verbal protocols, because many people use the termstalk aloud and think aloud interchangeably. Strictly speaking you usually wantpeople to produce talk aloud reports, reflecting the things that are in their shortterm memory as they do the task; if they generate think aloud reports, this suggeststhat they are processing things more deeply and (possibly) rationalizing theirdecisions and actions before they verbalize them.
The two main types of verbal protocols are concurrent, which are taken whilstthe person performs the task, and retrospective, where the person describes whatthey did after completing the task. In concurrent verbal protocols, the user is askedto talk about information as it comes to mind, to ‘‘say out loud everything that yousay to yourself’’ (Ericsson and Simon 1980, 1993). The user should not bereflecting upon their own behavior and providing explanations of causality. Whilethis kind of reflective behavior (referred to as introspection) may provide someuseful insights, these insights are not considered valid data because they are easilyinfluenced by other aspects, such as expected task performance, social pressure,and the user’s (often incorrect) theories of how their own mind works. Talkingaloud about content is generally regarded as being more objective than thinkingaloud, which usually involves introspecting about the process.
Providing concurrent protocols can be hard for users, but they are more reliablethan other types of verbal protocol. When you take concurrent verbal protocols,you should ask the user to practice providing a concurrent verbal protocol whilstcarrying out a simple task, such as an arithmetic addition or counting the windowsin their childhood home (Ericsson and Simon 1993, appendix).
370 13 Methodology III: Empirical Evaluation

You may find it easier to collect concurrent protocols by having two users worktogether on a task. The natural dialogue that takes place (assuming that dialogueoccurs or is required for the task) will encapsulate the information they are using todo the task. Another possible variation is to use expert commentary. Here oneexpert describes what the user is doing as they perform the task.
Retrospective protocols can also be used, and these are taken after the task hasbeen performed. They tend to be more useful when people can watch a video orpictorial record—we discuss visual protocols in the next section—of their per-formance to help them remember what they did. This helps them to recognize theiractions, rather than just having to recall them from memory. Although subjectsmay find it easier to provide retrospective verbal protocols, they can lead people toprovide post hoc rationalizations of actions that they now perceive to be incorrector that they performed instinctively.
Another way that you can interrogate what users are doing is by using pop-upmenus (Feurzeig and Ritter 1988). This idea has not been fully tested, however,and does not have the same level of theoretical support as concurrent verbalprotocols. The obvious criticism is that the pop-up menu interrupts the task, andmay break the user’s flow of activity because it draws their attention away fromthe task. A similar but more intrusive approach is to freeze the task and ask usersabout what they are doing at that particular point in time. This latter technique hasbeen used in measuring situation awareness (Endsley 1995).
13.5.4 Video Protocols
Video protocols (also called visual protocols) involve making a video recording ofusers as they carry out some prescribed task. The recording is often made usingmultiple cameras positioned to capture different aspects of performance, such aswhat is currently shown on the screen, the position of the user’s hands, and a moregeneral view that shows both the user and the system together. Sometimes therecordings are made directly from the monitor. Although video protocols providevery rich data, the fact that they are being video recorded does make some usersfeel under pressure, and can lead to unnatural behavior.
The main problem with video protocols is that analyzing them can be very hardand is very time-consuming. Typically, analysis can take anywhere between 10and 100 times as long as the duration of the recording.
As noted above, video protocols can be shown to users to help in the collectionof retrospective verbal protocols. This technique is sometimes called auto-con-frontation, because the users are shown the video recording and asked to explaintheir behavior.
Video protocols can be shown to developers to let them see the sorts ofproblems that real users encounter with their system. It is arguably better, though,to let the developers watch users try to use their product in a usability laboratory inreal time. Both of these methods are generally much more effective than simply
13.5 Measuring Usability 371

providing the developers with a written report of qualitative and quantitativeperformance data. They can also be used when the developers are remote from thesite where the evaluation is taking place, as long as suitable network connectionsare available to transmit the recordings.
13.5.5 Eye Movement Tracking
In the last 10 years an increasing number of people have begun to collect data oneye movements to analyze how people use web pages (e.g., Nielsen and Pernice2010; and see Navalpakkam and Churchill in press, for a more general review ofeye-tracking). The current eye-tracking equipment is much easier to use, muchcheaper, and much less invasive than earlier generations of eye-trackers whichrequired you to have your head clamped in place, and required frequent re-cali-bration. They also generated large amounts of data that required significant effortto analyze and interpret, whereas there are now several good software packagesavailable that will help you make sense of the data. You should recall that wediscussed eye-tracking in Chap. 4.
Eye movement data is particularly useful as a way of generating heat mapswhich show the hot spots on a web page. These are the parts of a web page thatusers spend most of their time looking at, either by gazing at it for a long period oftime, or visiting it for several shorter periods of time. In general, users havepredetermined expectations about where they expect certain items such as menus,navigation bars, back/next buttons, and so on to appear on a web page. This leadsthem to automatically look for those items in the expected places first. If they arenot where they are expected to be, you start to see scan patterns in the eyemovements as the eyes jump around trying to find the required element.
There are some drawbacks to using eye movement data, which mean that youoften need to complement it by using an additional method. The two maindrawbacks are that the data do not tell you why users fixated on a particular pointon the page and that the data do not tell you what items on the page the participantmissed or did not notice.
13.5.6 Questionnaires and Surveys
If you want to discover opinions about something, often the best way is to askpeople. Subjective measures are frequently used to assess attitudes towards a newpiece of technology—feelings of control, frustration, etc. Sometimes just askingpeople for their opinions is the only way of gathering this data. Note, however, thatsometimes surveys can measure opinions but not actions; early work has shown thatwhat people do and what they say they will do can vary up to 100% (LaPiere 1934).Surveys are more valid when the attitudes are more stable, relevant, and salient to
372 13 Methodology III: Empirical Evaluation

the behavior, and there are less situational pressures on the behavior (Hock 2002,pp 281–288). Questionnaires and surveys allow you to gather large amounts of datain a relatively short period of time, as long as you distribute them appropriately.
Designing questionnaires and surveys is an art in itself, as great care needs to beexercised to make sure that any potential biases are avoided. It is also important tomake sure that the questionnaires are well structured and tested, as this helps toensure the validity of the resulting data. For this reason, it is almost invariably agood idea to carry out a pilot study on a small sample of users, and then refine thequestionnaires appropriately. Having a pilot study is also very useful for deter-mining how long it will take to complete the survey. As a rule of thumb, mostpeople are relatively happy with filling in surveys that take 10–15 min to com-plete, without any reward.
The questions need to be carefully designed, because you will not have a chanceto explain them to respondents. So they need to be clear, unambiguous, and easy tounderstand. It is also important that you do not ask leading questions that reflectany biases that you may have. You also need to think about the answers that yourequire. In some cases it may be a simple ‘‘Yes/No/Don’t Know,’’ or it may be‘‘select one (or more) options’’ from a possible list. In other cases (and quite oftenin usability surveys) you will be trying to gauge people’s opinions about some-thing, in which case you are more likely to use rating scales, such as a five-pointLikert scale, where you will ask respondents how much they agree with a particularstatement, such as ‘‘I found it easy to locate the home page button.’’ In this case theresponse scale would normally be from Strongly Disagree to Strongly Agree.
Distribution of questionnaires and surveys requires careful thought. Usabilitysurveys are frequently handed out on paper to participants as part of a usabilitystudy (often at the end). There are some standard usability rating scales that youcould use or adapt for your own purposes, such as the System Usability Scale(SUS, Brooke 1996). More generally, however, you may want to use electronicsurveys, in which case you need to think about how you will attract people fromyour target audience to complete the survey.
Note that if you intend to use follow-up surveys at the end of a test, you need tobe aware of what is called the media equation (Reeves and Nass 1996). This refersto the fact that if you give people the survey on the same machine as the one onwhich you give them the test, they rate things more highly than if they completethe survey on a different machine! They treat the machine they used as an agentthat needs to be treated socially.
13.5.7 Interviews and Focus Groups
Interviews can take three different forms: structured, unstructured, and semi-structured. Whichever type you decide to use, it is often a good idea to recordthem, with the written consent of the interviewees. It is also a good idea to makesome written notes. These will help add extra context to help interpret the content
13.5 Measuring Usability 373

that has been recorded, and will also act as a back-up in case recording fails forsome reason.
Structured interviews are based around a fixed set of questions that the inter-viewees must answer. These questions are often closed, i.e., the user is expected toanswer the question and no more. Typically these questions have ‘‘Yes/No’’ typeanswers.
Unstructured interviews are generally more informal, and are a bit more like achat with the users. So you may start off with a small number of issues (perhaps asfew as one or two) that you want to discuss with the users, and then the directionyou take for the rest of the interview is determined by what they say.
Semi-structured interviews fall somewhere between structured and unstructuredinterviews. Usually you will have a short standard list of questions, which may beopen, and then you direct the interview based on what the users say in response tothe questions you ask. Unstructured and semi-structured interviews tend to beslightly harder to carry out because they will often require the interviewer to thinkon their feet during the interview. Their big advantage, however, is that they canuncover issues that may not previously have been thought of.
Whilst interviews tend to be carried out on a one-to-one basis, it can be usefulto have group discussions, which are often carried out as focus groups. Usually afocus group is carried out with a small group of up to about ten users or stake-holders. The basic aim is to get the focus group members to express their opinionsin a relatively friendly environment. To conduct a focus group successfully youneed to have a list of issues or questions for discussion, and to have an experiencedfacilitator who can make sure that everybody gets a chance to air their opinions.The sessions can produce lots of useful data, so it is often best to record them aswell as making notes (it may help to have separate people taking notes andfacilitating the discussions).
13.5.8 Workload Measures
Workload measures attempt to describe how much mental effort the user expendsin performing a particular task. They are generally used more often to evaluatecritical systems rather than web sites per se. The measures are hard to devise, butcan be useful in many contexts. The most common approach is to periodically askusers to state (or rate) what they think their current workload is, although this canbe quite disruptive of performance and hence affect their perceived workload.
The NASA-TLX (Task Load indeX) workload measurement instrument (Hartand Staveland 1988) is probably the most commonly used method. NASA-TLXcan be administered on paper or on-line. The NASA TLX is a multi-dimensionalrating procedure that provides an overall workload score based on a weightedaverage of ratings on six workload dimensions: mental demands, physicaldemands, temporal demands, own performance, effort, and frustration (NASA,1987).
374 13 Methodology III: Empirical Evaluation

During the standard NASA-TLX procedure users carry out pairwise compari-sons of the six dimensions. In each of the 15 (5 ? 4 ? 3 ? 2 ? 1) comparisons,users select the dimension that contributed more to workload. Each dimensionreceives one point for each comparison where it was greater. The relative weightfor each dimension is then given by the sum of those points, divided by 15 tonormalize it.
Probably the most accurate approach for measuring workload is to use a sec-ondary task that the user must perform as and when they can (e.g., responding tovisual or auditory signals). For example, at random intervals the user has to pushan ‘A’ when the number that pops up on the screen is odd and a ‘B’ when thenumber is even. The time and correctness of the response is a measure of how hardthe user is working.
We sometimes find that while two systems give comparable performanceresults on the primary task, performance on the secondary task may be verydifferent., This suggests that one interface is more demanding than the other, i.e.,where performance on the secondary task is worse, this indicates that the user isexpending more mental effort on the primary task.
13.5.9 Patterns of Usage
Rather than looking at performance on unit or benchmark tasks in a laboratorysetting, you can place prototype versions of your system in real work settings andobserve actual patterns of use, either directly or through videotape. Often you willfind that certain features, including those that have been requested by users, arevery rarely used, e.g., style sheets in Word.
You could also consider instrumenting the user interface or using a generalkeystroke logger (e.g., Kukreja et al. 2006) to collect (timed) logs of the key-strokes, and other interactions that the user performs. This data gets logged in whatare sometimes called dribble files. These files can quickly become excessivelylarge, however, and thus be hard to analyze. They can be used as a way to identifyerrors, error recovery, and patterns of use. Note that if you will be collecting datain this way, you will need ethical approval, which we talk about below.
If you are evaluating a system that has been released into the marketplace, youcan also get some information on patterns of usage by looking at the logs of callsto customer/technical support services. Note that this data only measures problemsthat have been reported, rather than all of the problems. Users are often veryflexible and adaptable and will develop ways of making the system do what theywant it to do, such as workarounds, rather than spend extra time and effort on theend of a phone line trying to contact technical support to report the problem.
Customer support activity data can be both politically and commercially sen-sitive—it may allow competitors to see where the problems are with a particularproduct. Such data can be very valuable, however, because it does give a goodindication of where the real problems may lie.
13.5 Measuring Usability 375

13.5.10 User Experience
Finally, there is the concept of user experience (Tullis and Albert 2008). Inaddition to these mostly quantitative measures, there is the qualitative experienceof using the system that is being tested. This is an important concept, and is relatedto several concepts that can sometimes be hard to define, and even harder tomeasure. Many organizations now rate a high level of user experience (explainedin Chap. 2) as being a major determinant in the success of a system or product.
One of the factors that will influence user experience is task importance. Ifthe task is important to the user and the system gets the task done, then, it willbe a successful system. Early systems, e.g., TVs, phones, portable phones, PDAs,Blackberries, were all hard to use and the times taken to use them were rela-tively high compared to today’s standards. However, they were successfulbecause they provided a better experience or supported a task that was notsupported before. Over time and extended use, other measures and aspectsbecame important.
13.6 The Ethics of Evaluation
Studies that involve users interacting with technological products now routinelyneed to be vetted to ensure that participants are treated appropriately. This meansthat ethical clearance (or approval) is required from the appropriate authoritativebody. In most countries this will normally be done by an ethics committee, whilstin the US it will be carried out by an institutional review board (IRB). They willreview the study to determine that the relevant guidelines are being followed. Themain things they check are whether vulnerable people will be involved, whetherparticipants are aware of what they are committing to in the study, and that anycollected data is stored appropriately. Usually the latter involves anonymizing dataso that they cannot be linked to the participant. These requirements vary based onfunding, use, publication, and teaching, so take advice if you have not done thisbefore.
As a matter of routine you should produce information sheets for participants,describing the study and explaining that they can withdraw from the study at anypoint. You should also take informed written consent, having them sign a consentform that says that they have read and understood the information sheet, that theyare willing to take part, and that they understand that they can withdraw at anypoint. You should also think about how you will debrief at the end of a testingsession: you could either give them a debrief sheet, explaining the purpose of thestudy in more detail, or simply verbally debrief them. You may also want to askthem not to discuss the study with others, because it could influence their behaviorif they were subsequently in the study. Further details on this process are available(Ritter et al. 2013; Ritter et al. 2009).
376 13 Methodology III: Empirical Evaluation

13.7 Summary
There is a lot more to evaluation than many people imagine. Carrying out anevaluation requires careful thought and planning before you begin testing. In thischapter we have highlighted the sorts of issues you need to think about duringplanning. Most development is carried out using an iterative cycle in which aformative evaluation is carried out during each cycle. The information that comesout of the evaluation can then be used to inform development during the next cycleof development. It is therefore important that you clearly understand what sort ofdata you should collect, and why. You also need to think about whom you willcollect the data from, and the environment in which you will collect them.
Once you have the basic plan, you can start to think in more detail about howyou will collect the data (and how you will analyze them, although we have notcovered that issue here). There are many methods that you could use, and yourfinal choice may be determined by factors such as how much time is available,what resources are available, and how many (potential) users are accessible to takepart in the tests. We have briefly discussed several evaluation methods that areavailable, and touched)on the importance of making sure that you are aware of theneed to treat the participants in your evaluation in a way that is ethical.
Evaluation is important because it produces feedback on development as it isprogressing. If you can get real users to take part in your evaluations, theirfeedback will help make sure that the system is more likely to be usable andacceptable when it is delivered. In other words, it will reduce the risks that the finalsystem will be a failure when it is delivered.
13.8 Other Resources
There is a web site devoted to the subject of evaluating adaptive systems: EASy-Hub (which stands for Evaluation of Adaptive Systems Hub) is available at http://www.easy-hub.org.
If you are designing a usability laboratory, Jacob Nielsen edited a special issueof the BIT journal about how to create and use usability laboratories. Although it isnow somewhat dated, it still contains several useful nuggets of information:
Nielsen, J. (Ed.). (1994). Special issue: Usability Laboratories. Behaviour & InformationTechnology 13(1–2).
If you are not experienced working with studies with human participants, usefulguides include:
Ritter, F. E., Kim, J. W., Morgan, J. H., & Carlson, R. A. (2013). Running behavioralstudies with human participants: A practical guide. Thousand Oaks, CA: Sage.
Shadbolt, N. R., & Burton, A. M. (1995). Knowledge elicitation: A systematic approach.
13.7 Summary 377

In J. R. Wilson & E. N. Corlett (Eds.), Evaluation of human work: A practical ergonomicsmethodology (pp. 406–440). London: Taylor and Francis.
Stanton, N.A. & Young, M. (1999). A guide to methodology in ergonomics: Designing forhuman use. London, UK: Taylor & Francis.
One of the best introductions to user focused evaluations is by ElizabethGoodman, Mike Kuniavsky, and Andrea Moed (also recommended in Chap. 2).They cover basic techniques and methods that will help you design better inter-actions. They also offer case studies and examples that you can compare to yourown design situations:
Goodman, E., Kuniavsky, M., & Moed, A. (2012). Observing the user experience: Apractitioner’s guide to user research. San Francisco, CA: Morgan Kaufman
Another highly recommended text is Kim Goodwin’s Designing for the DigitalAge, published in 2011:
Goodwin, Kim. (2011) Designing for the digital age: How to create human-centeredproducts and services. Wiley.
Finally, it is worth reading Gilbert Cockton’s ‘‘Usability Evaluation’’ publishedonline by the Interaction Design Foundation.
http://interaction-design.org/encyclopedia/usability_evaluation.html
13.9 Exercises
13.1 Design a usability test for comparing two makes of mobile device (such as asmartphone), using at least two of the ways of measuring usability describedabove. You should include details of how many participants you would use,and an explanation of why you chose your selected ways of measuringusability.
13.2 Design a study to evaluate the usability of an advanced photocopier/printer,using at least two of the ways of measuring usability that were describedabove. You should include details of how many participants you would use,and an explanation of why you chose your selected ways of measuringusability.
13.3 Design a usability test for evaluating the web site of an on-line retailer,using at least two of the ways of measuring usability that were describedabove. You should include details of how many participants you would use,and an explanation of why you chose your selected ways of measuringusability.
13.4 Summarize the evaluations in Exercises 13.1–13.3, comparing and con-trasting how the devices being evaluated influence the number of participantsand the choice of evaluation methods.
378 13 Methodology III: Empirical Evaluation

References
Berg, M. (1997). Rationalizing medical work: Decision support techniques and medicalpractices. Cambridge, MA: MIT Press.
Brooke, J. (1996). SUS: A ‘quick and dirty’ usability scale. In P. W. Jordan, B. Thomas,B. A. Weerdmeester, & I. L. McClelland (Eds.), Usability evaluation in industry (pp.189–194). London: Taylor & Francis.
Brown, C. M. L. (1988). Human-computer interface design guidelines. Norwood, NJ: Ablex.Calfee, R. C. (1985). Experimental methods in psychology. New York, NY: Holt, Rinehart and
Winston.Campbell, D. T., & Stanley, J. C. (1963). Experimental and quasi-experimental designs for
research. Boston, MA: Houghton Mifflin.Card, S. K., Moran, T., & Newell, A. (1983). The psychology of human-computer interaction.
Hillsdale, NJ: Erlbaum.Carroll, J. M. (2000). Making use: Scenario-based design of human-computer interactions.
Cambridge, MA: MIT Press.Carroll, J. M., & Rosson, M. B. (1992). Getting around the task-artifact cycle: How to make
claims and design by scenario. ACM Transactions on Information Systems, 10, 181–212.Churchill, E. F., Nelson, L., Denoue, L., Murphy, P., & Helfman, J. I. (2003). The Plasma poster
network: Social hypermedia on public display. In K. O’Hara, M. Perry, E. Churchill, &D. Russell (Eds.), Social and interactional aspects of shared display technologies. London:Kluwer Academic Publishers.
Endsley, M. R. (1995). Toward a theory of situation awareness in dynamic systems. HumanFactors, 37(1), 32–64.
Ericsson, K. A., & Simon, H. A. (1980). Protocol analysis: Verbal reports as data. PsychologicalReview, 87, 215–251.
Ericsson, K. A., & Simon, H. A. (1993). Protocol analysis: Verbal reports as data (2nd ed.).Cambridge, MA: MIT Press.
Feurzeig, W., & Ritter, F. (1988). Understanding reflective problem solving. In J. Psotka,L. D. Massey, & S. A. Mutter (Eds.), Intelligent tutoring systems: Lessons learned. Hillsdale,NJ: Erlbaum.
Goodman, E., Kuniavsky, M., & Moed, A. (2012). Observing the user experience: Apractitioner’s guide to user research (2nd ed.). Waltham, MA: Morgan Kaufmann.
Hart, S. G., & Staveland, L. E. (1988). Development of the NASA-TLX (Task Load Index):Results of empirical and theoretical research. In P. A. Hancock & N. Meshkati (Eds.), Humanmental workload (pp. 139–185). Amsterdam: North Holland.
Hock, R. R. (2002). Forty studies that changed psychology. Upper Saddle River, NJ: PrenticeHall.
Howell, D. C. (2010). Statistical methods for psychology (7th ed.). Belmont, CA: Wadsworth.Kukreja, U., Stevenson, W. E., & Ritter, F. E. (2006). RUI—recording user input from interfaces
under Windows and Mac OS X. Behavior Research Methods, 38(4), 656–659.LaPiere, R. T. (1934). Attitude versus action. Social Forces, 13, 230–237.Lazar, J., Feng, J. H., & Hochheiser, H. (2010). Research methods in human-computer
interaction. New York, NY: Wiley.Miles, M. B., Huberman, A. M., & Saldaña, J. (2013). Qualitative data analysis: A methods
sourcebook. Thousand Oaks, CA: Sage.Molich, R., & Nielsen, J. (1990). Improving a human-computer dialogue. Communications of the
ACM, 33(3), 338–348.Monk, A., Wright, P., Haber, J., & Davenport, L. (1993). Apendix 1—cooperative evaluation: A
run-time guide. In Improving your human-computer interface: A practical technique. NewYork: Prentice-Hall.
References 379

Monk, A. F. (1998). Lightweight techniques to encourage innovative user interface design. InL. Wood (Ed.), User interface design: Bridging the gap between user requirements anddesign (pp. 109–129). Boca Raton, FL: CRC Press.
Mosier, J. N., & Smith, S. L. (1986). Application of guidelines for designing user interfacesoftware. Behaviour and Information Technology, 5, 39–46.
Müller, M. J., Haslwanter, J. H., & Dayton, T. (1997). Participatory practices in the softwarelifecycle. In M. G. Helander, T. K. Landauer, & P. V. Prabhu (Eds.), Handbook of human-computer interaction (2nd ed., pp. 255–297). Amsterdam, NL: Elsevier.
NASA. (1987). NASA Task Load Index (TLX) V 1.0. Users Manual. Retrieved 10 March 2014,from http://humansystems.arc.nasa.gov/groups/TLX/downloads/TLX_comp_manual.pdf.
Navalpakkam, V., & Churchill, E. F. (in press). Eyetracking: A brief introduction. In J. S. Olson& W. Kellogg (Eds.), Ways of knowing, HCI methods. Heidelberg, Germany: Springer.
Nielsen, J. (1993). Usability engineering. Chestnut Hill, MA: AP Professional Press.Nielsen, J., & Molich, R. (1990). Heuristic evaluation of user interfaces. In Proceedings of CHI
90 (pp. 249–256). New York: ACM.Nielsen, J., & Pernice, K. (2010). Eyetracking web usability. Berkeley, CA: New Riders.Ray, W. J. (2008). Methods toward a science of behavior and experience (9th ed.). Belmont, CA:
Wadsworth Publishing.Reeves, B., & Nass, C. (1996). The media equation: How people treat computers, television, and
new media like real people and places. New York: NY Cambridge University Press.Ritter, F. E., Kim, J. W., & Morgan, J. H. (2009). Running behavioral experiments with human
participants: A practical guide (Tech. Report No. 2009-1). Applied Cognitive Science Lab:The Pennsylvania State University, College of Information Sciences and Technology.
Ritter, F. E., Kim, J. W., Morgan, J. H., & Carlson, R. A. (2013). Running behavioral studies withhuman participants: A practical guide. Thousand Oaks, CA: Sage.
Smallman, H. S., & St. John, M. (2005). Naïve realism: Misplaced faith in the utility of realisticdisplays. Ergonomics in Design, 13(Summer), 6–13.
Todd, Z. (Ed.). (2004). Mixing methods in psychology: The integration of qualitative andquantitative methods in theory and practice. Abingdon, UK: Psychology Press.
Tullis, T., & Albert, B. (2008). Measuring the user experience. Burlington, MA: MorganKaufmann.
Whiteside, J., Jones, S., Levy, P. S., & Wixon, D. (1985). User performance with command,menu, and iconic interfaces. In Proceedings of CHI’85 Human Factors in Computing Systems(185–191). New York: ACM.
Woods, D. D., & Dekker, S. W. A. (2000). Anticipating the effects of technological change: Anew era of dynamics for human factors. Theoretical Issues in Ergonomic Science, 1(3),272–282.
380 13 Methodology III: Empirical Evaluation

Part IVSummary

Chapter 14Summary: Putting It All Together
Abstract This chapter recaps some of the many things that you have learned aboutusers in terms of their anthropometric, behavioral, cognitive, and social aspects.You have been provided with a lot of information, so we describe a number ofdifferent possible ways you can organize it. One way to organize and apply theinformation is with user models. These models span the range from implicitdescriptive models, such as guidelines, through to explicit information processingmodels, which can be executed to produce behavior and predict performance.Another way is to organize the information based on how to use it. So we finish bylooking at one system development process model—the Risk-Driven IncrementalCommitment Model—as an example of how you can integrate knowledge aboutusers into the system development life cycle. Failure to consider the users and theirtasks during development leads to increased system development risk.
14.1 Introduction
Human centered-design is about putting humans at the center of system design. Ifwe want to design systems that are both useful and usable, we need to understandhumans—users, in particular—and this is not a trivial undertaking. If we do nottake appropriate account of the users there is an increased risk that the project willbe a failure: the users could refuse to accept the system if it does not fit into andsupport the way they work, or the users may end up wrestling with the systemtrying to make it behave as they expect it to, possibly with fatal consequences(e.g., Baxter et al. 2007), or it could just not be fully adopted by users.
Developing systems is an inherently interdisciplinary practice. The knowledgethat we have presented here should make software and system engineers at leastaware of the sorts of issues that human factors engineers routinely discuss. In thisbook we have tried to highlight the capabilities and limitations of humans but,really, we have just scratched the surface. We are not expecting software engineersto become human factors experts as a result of reading this book. We hope,
F. E. Ritter et al., Foundations for Designing User-Centered Systems,DOI: 10.1007/978-1-4471-5134-0_14, � Springer-Verlag London 2014
383

however, that it will enable them to communicate with human factors engineers,and develop a shared understanding of the issues as they affect system develop-ment and use.
We conclude our discussions with a brief summary of what we have presentedin this book. You will want to organize it yourself in some meaningful way to beable to make effective use of all the information about users that we have pre-sented. How you decide to organize it will partly depend on how you intend to useit. You might find the metaphors in Chap. 12, those of the Gulfs and CognitiveDimensions, to be useful. There are also methods and techniques that can help you.A few of these have been implemented as computer programs that are fairly easyto use, and encapsulate summaries of user behavior that can be applied in a rangeof ways. These models are just one way of applying what we know about humansto system design; they can also be used to help teach designers and developersabout users as a sharable representation.
We finish by describing how you can take forward what you have learned here andincorporate it into system development. We would contend that you should alwaysapply this knowledge, because a lack of knowledge about users nearly always con-stitutes a risk to system development. We illustrate this argument using an extendedversion of the Risk-Driven Incremental Commitment Model (Pew and Mavor2007).
14.2 Organizing What We Have Learnt About Users
If your aim is to build systems that are both useful and usable then the best wayforward in many cases is to focus on particular people doing particular tasks inparticular contexts. The knowledge that we have provided you will help. Whethera system can be described as usable or not depends on factors such as the shapeand size of the users (anthropometric factors), external body functioning andsimple sensory-motor concerns and motivation (behavioral factors), internalmental functioning (cognitive factors), and external mental functioning (social andorganizational factors). It therefore makes sense to consider organizing yourknowledge about these different factors in terms of the types of user characteristicsthat we introduced early in the book: Anthropometric; Behavioral; Cognitive; andSocial—the ABCS. You should be aware that there are other factors too, which wehave not addressed in this summary such as legal liability, and physiologicalfactors which will often also be important.
14.2.1 Anthropometrics
Users vary. One obvious way they can vary is in physical size, as Chap. 3 noted.Different people of the same age and gender may have different heights anddifferent weights, for example. Users also change over time as they develop and
384 14 Summary: Putting It All Together

age. The physical attributes of the user will affect how they use a particularartifact, so you need to consider aspects such as whether they can reach thecontrols, whether they can operate the levers, whether they can push buttons, andso on.
The way that people use artifacts can also affect the well-being of the user.Upper limb disorders, for example, can arise from having to carry out the sametask repeatedly over extended periods of time, and from the user failing to adoptthe correct posture.
Anthropometrics is an important consideration in interfaces where touch) playsa central role. Probably the most obvious and widespread examples are smart-phones and tablet computers. In addition, it is important when thinking aboutkeyboards: conventional keyboards are still widely used with most personalcomputers, and many people use their thumbs to type on the keypads of some cellphones, for example.
14.2.2 Behavior
The user’s behavioral characteristics are mostly related to perception, and the mostimportant of these are vision and audition, as noted in Chap. 4. Users will alsodiffer in terms of their perceptual capabilities. As people get older, for example,their vision and hearing often diminish and there are people who have permanentlyimpaired vision or hearing.
When you are designing systems it is therefore important to realize that all userswill not always behave in exactly the same way. Their performance will varyacross a range of behavior which is approximately normally distributed, as shownon the left in Fig. 14.1. In those situations where the distribution cannot be twotailed, such as where reaction times (which cannot be negative!) are being mea-sured, performance more closely approximates a gamma distribution, as shown onthe right in Fig. 14.1.
Understanding the way that people perceive things is important, because thisunderstanding can be used to create artifacts that more closely match the way thatusers behave. Knowing about red–green color deficiency, for example, is impor-tant because it will influence the way that colored items are used in an interface. Ata higher level, knowing the Gestalt laws that describe the way people perceivegroups of objects (Chap. 4) can be used to help you work out the layout of objectsin an interface.
When it comes to designing audio outputs, knowing the way that hearing workscan help you determine what sort of sounds to use for alarms, for example. Wealso know that people are poor at localizing sound, but it is easier to localize highpitch sounds than low pitch ones, and that speech conveys more information thansounds.
All users, from novices to experts, make errors and in some cases make thesame errors as noted in Chap. 10. One of the main differences between novices and
14.2 Organizing What We Have Learnt About Users 385

experts is that expert users can often (but not always) detect and correct errorsbefore any adverse consequences arise. When you design systems, you need toremember that all users will make errors. Some of these errors will be preventable,but others may not. You will therefore need to decide which errors you willprevent (using risk assessment, for example). For the other errors, you will need toinclude support to help the user spot errors and, in particular, to support the abilityto correct errors, ideally before any adverse consequences arise.
Where the users have physical limitations, however, or there are contextuallimitations (low lightinglevels, for example), these limitations will constrain whatthe users can and cannot do.
14.2.3 Cognition
Users’ cognition is limited, at both the tactical level (e.g., limited workingmemoryand some difficulties in storing and retrieving items from memory) and atthe strategic level (e.g., how to decide which are the important and long termissues), as noted in Chaps. 5–7. In some cases, the effects of these limitations canbe ameliorated through learning, or through social processes, particularly whereskills are pooled to perform particular tasks.
Attracting, managing, and maintaining the user’s attention are all important.Users have limited attentional resources. This means that in busy contexts, wherelots of things are happening or several tasks have to be performed simultaneously,they are unlikely to be able to attend to all of them. In other words, they will find itdifficult to consciously control how they perform all the tasks. With practice, userscan learn to perform some tasks with little or no conscious control (i.e., with little
Time to Push a Button
Dis
trib
utio
n of
Rea
ctio
n T
imes
Dis
trib
utio
n of
Pro
blem
s A
ttem
pted
Number of Problems Attempted
Fig. 14.1 A normal curve (left) [Strictly speaking, number of problems cannot go below 0 either,but for most practical examples, this distribution will be well represented by a normal curve when0 is more than three standard deviations from the mean (the peak).] and a gamma curve (right)showing typical distributions for tasks attempted and response times for a task. These curvesillustrate that users will have a distribution of behavior, and not always perform a task or haveknowledge in a single way
386 14 Summary: Putting It All Together
or no attention). The classic example that is usually quoted is that of riding a bike:when you first start out, you try to think of lots of things at once—keeping yourbalance, remembering to pedal, keeping the handlebars straight, being aware of thetraffic around you, and so on—but as you learn how to do the task, you will focusmore on just keeping the bike going in a straight line, and maintaining awarenessof the traffic around you. We know that people learn in various ways, so youshould design your system in such a way that it facilitates learning.
It is important to know your users, and to understand the language that they use.By doing so, you will be able to develop systems that they can more readilyunderstand and use. The interaction between the user and their computer-basedsystem can be considered as a form of conversation, which means that it can beoptimized using Grice’s maxims (Chap. 7). It is particularly important to knowsomething about how people read and the ways that they seek out information(mostly through searching), because these are two of the most common useractivities. You should design systems that present information in ways that theusers can easily read, understand, and find. This means that you need to thinkabout presentation (font choices, for example) as well as content issues.
Users have mental models of how things work, and the way they interact withan artifact is usually based on the (most) relevant mental model. These modelsdevelop over time as the user’s knowledge and experience of using the artifactincreases. As a system designer you should try to help the user to develop the rightmodel of how your system operates. The mental model will help the users decidewhich action to take next. When they cannot see which action to perform, they willnormally engage in problem solving behavior, which may involve reasoning fromfirst principles, using trial and error, for example. On the basis of their problemsolving, users will then make decisions. Decision making is usually sub-optimalbecause people do not take into account all of the relevant information that isavailable to them, and because their decision making processes are often biased inknown ways. As a designer you can try to help users by making relevant infor-mation salient and by counteracting the known biases where possible.
The use of mental models also applies to users themselves. Across the range ofbehavior types, there are very few aspects of their behavior that users know aboutintrinsically. They can see their size, and this they know something about. Yetwhen it comes to choosing a chair, they have to sit in it to know if it fits. Manyusers do not sit in the best posture, and so we might note that many users do notknow all that they could about themselves anthropometrically.
Many users do not know about their fovea, and most other aspects of perceptionare not available to consciousness—it is impenetrable. The results of vision areavailable when objects are attended to, but the parts that are not attended to areignored or filled in. For example, most users will not know much about the blindspot on their retina, let alone see it. Most of perception is impenetrable. So, whatthey know about perception is mostly folk psychology.
Users (and untrained designers) think they know how they think. This is oftenmisguided. While they are thinking about how they think, they are busy thinking.Imagine creating a computer that stored every action it took—but how can it do
14.2 Organizing What We Have Learnt About Users 387

this? It would have to record actions while it was doing them. Users are basicallylike this as well. It is very hard to remember what you are doing when you are busydoing it. Ericsson and Simon (1993) laid out a fairly good theory of when users cantalk aloud about what they are doing. It is even more difficult to talk about whatyou have done and be completely accurate. That said, sometimes the only data wecan afford to gather is how users think they think, and sometimes users will choosesystems based on such judgments, so we will often have to work with thesejudgements. You might wish to be more skeptical in the future about users’ (anduntrained designers’) reports about how they do a task or whether they learn or not.
14.2.4 Social
Most tasks are carried out by teams of people interacting with one another.Sometimes they will be working directly with co-located people, but in other casesthey may be working distally as a team. Individual users have limitations on howwell they work together in teams: some people are natural leaders, whilst some arenatural followers.
Chapters 8 and 9 note social factors that influence users, including distributedresponsibility, and social influence on teams. For example, users (and systemdevelopers) will often misjudge social relationships. They will often send out oneblanket email to ten people asking for one of them to volunteer, rather thansending out ten individual emails. The sorts of variations in performance that yousee across users can sometimes be attributed to the context they are working in, aswell as their own capabilities and limitations. If you put the same user in the sametask and physical situation but vary the environmental conditions by increasing thetemperature, or reducing the lightinglevels, for example, this may affect theirperformance.
14.2.5 The Role of Tasks and Environments
Knowing users’ tasks will help design systems to perform these tasks in numerousways as presented in Chap. 11. There are a wide range of uses and applications,and of ways to represent users’ tasks and activities. Good designers can chooseappropriately based on what is needed for a given design project.
Users’ tasks are not always directly understandable by designers using theirown intuitions, but there are ways to find what tasks users do and what tasks theywant to do. However, there will still be surprises because it is difficult to knoweverything, particularly for new tasks and unexpected uses.
It is also important to understand the environment in which users perform theirtasks. Usability studies help to provide a way to understand the tasks, the users, theenvironments, and how they interact.
388 14 Summary: Putting It All Together

14.2.6 Summary
Users can be viewed as having some aspects that are more uniform and some thatare more unique. There are some communalities across levels that we can pointout:
1. The ABCS note some of these aspects where users have shared communalitiesin how they think, interact with the world, and interact with each other; in someways users are alike. So, when designing systems, you should not despair thatall users are different.
2. There are also differences between users. There are simple differences in simplecapabilities, such as different input and output speeds and capabilities. In morecomplex capabilities, like how to do a task and mental models of systems, userscan vary widely based on previous experience and practice. In cases of goalsand cultural beliefs they can vary the most. So, when designing, you need tokeep in mind that, for some aspects of design, users can differ.
3. Users have limited capabilities. Across the chapters, limitations on how fastusers can move, how fast and how they can think, and their abilities to produceperfect, error-free performance were noted. Most importantly, user limitationscan be avoided by better design that does not make incorrect assumptions aboutusers. Many of the bad web site design contests and bad and dangerousinterface galleries are filled with designs that assumed something incorrectabout the users’ abilities or interests. So, when designing, you need to designfor what people can do.
4. Users do not always know themselves. You can ask them, but they willsometimes not provide very accurate descriptions. Designers are also a type ofuser, and they suffer the same limitations about knowing users and themselves.So, when designing, do ask them but also think more broadly about users andtheir context. In addition, try to study the user as a domain. Have a theory ofhow they perform tasks, test this theory with data, and expand the theory as youlearn and read more.
5. Systems can be helped in a variety of ways because of users. Users can learn,can then find new strategies, and can help each other. So, when you design,keep these less obvious changes in mind.
14.3 Models of Users
For the purpose of engineering design, it would be useful to model the human partof the overall system in a more formalized way, in the same way that engineeringdesign specifications can be used to present a relatively clear and precise model forimplementation. The model of the user would serve as a shared representation thatcould be used to support system design. From the human factors engineer’s point
14.2 Organizing What We Have Learnt About Users 389

of view, a user model captures the capabilities and limitations on user perfor-mance; from the software engineer’s point of view, it would be used to illustratehow the system could perform when operated by real users.
Models of users therefore serve as a summary repository of our knowledge ofusers. It is important that this knowledge be captured in one place because it canlead to emergent behaviors where there are interactions between the differentcharacteristics of users. The behavior of the models should be constrained in thesame sorts of ways that human behavior is constrained (memory limitations, andso on).
We have seen throughout this book that humans are less predictable, consistent,and deterministic than computers. Defining a general, formal model of the human(as part of the broader socio-technical system) is not currently possible. Instead, anumber of fragmentary and incomplete models of human information processingbehavior have been proposed by cognitive psychologists and reinforced byempirical exploration. These models can be used to make predictions but do notprovide details about how the system should be designed. Although the models aregood at generating first-order effects, at lower levels of analysis their limitationsand inconsistencies become apparent. The models are therefore useful at pre-dicting gross behavior, such as error-free, expert behavior on unit tasks.
The most accurate, detailed models have generally been developed for thoseaspects of human performance that are easiest to test. Thus, models of the char-acteristics of the senses are well established (particularly vision and hearing),whereas there are very few models of some of the more intricate aspects ofcognition that can only be indirectly observed and are less well understood.
14.3.1 Unified Theories of Cognition
There have been several attempts to integrate all that we know about humanbehavior into a single, unified theory of cognition (Newell 1990). The latestattempts have been realized as cognitive architectures, although they might bemore properly described as human performance architectures because they dealwith more than just the cognitive aspects of human performance. These cognitivearchitectures typically take the form of a computer programming language withspecial capabilities and limitations representing a (small) subset of the knowncapabilities and limitations of humans. Progress has been relatively slow, but thecognitive architecture developers are working towards providing a single coherenttheory that ultimately accounts for—and predicts—human performance on alltasks.
A unified theory of cognition effectively forms a single repository of usefuluser-related information. This can be used in three main ways:
1. To help you remember theories and facts about users. You can use the schematicof the Model Human Processor (MHP, described below), ACT-R (also described
390 14 Summary: Putting It All Together

below), or Soar (Laird 2012), for example, to work your way through theirhypothesized modules to understand how behavior will be generated. At thislevel of abstraction, there is a fair amount of agreement between the theories inthat they all include modules for input, memory, cognition, and output.
2. To summarize user behavior. In time, architectures may be used more oftenduring design as a way to conveniently capture theories of user behavior, and asa teaching aid to help designers understand users (Pew and Mavor 2007).
3. To apply what we know about users. In some cases, the models only offer fairlycrude approximations of users, but they have been useful for populating computergames and military simulations. In other cases, they are being used to test inter-faces and make predictions for designs (for a review, see any of these reports:Booher and Minninger 2003; Pew and Mavor 1998, 2007; Ritter et al. 2003).
14.3.2 Types of User Models
There are now more than 100 cognitive (and user) architectures if you includevariants and different versions (Morrison 2003; Pew and Mavor1998; Ritter et al.2003). They can be categorized into four types:
1. Implicit descriptive models. When you look at a car, for example, you canimagine some of the assumptions the designers have made about the driver.These assumptions are captured in an implicit model of the driver in whichvision takes place in the top part of the body, and another part of the bodyoperates the controls on the floor.
2. Explicit declarative models. These models describe the components or astructure in a system, but neither describe the mechanisms nor perform the task.
3. Explicit process models. The mechanisms and the way they operate aredescribed, but the models, while perhaps supported by software, do not processinformation.
4. Explicit information processing models. These models include a full informa-tion processing architecture that produces behavior, and can predict perfor-mance times and the information processing steps that will be performed andtheir results.
14.3.2.1 Implicit Descriptive Models
Implicit user models appear in many systems, and some people would claim thatall systems include a model of the user. For example, chairs assume a height of theuser, and many file systems assume users can read and write English. Takentogether, the set of assumptions used by the designer to create an artifact is animplicit model of the user, but it may be a particularly impoverished, incomplete,or incorrect model. There are certainly several tools and approaches that include
14.3 Models of Users 391

models of users where the model is clear enough to talk about, but is not explicitlyrepresented and may not be visible (or even known) to most people. Guidelinesand web accessibility tools, for example, show that models can be useful evenwhen they are not explicit, examinable, or even very modifiable.
Guidelines attempt to describe how to build a system to support users. Theguidelines reflect an implicit model of the user (which may be more explicitlyspecified by the guideline developers). Guidelines that give advice about visuallayout, for example, may assume that the users have normal (20/20) vision which,clearly, all users do not.
It would be difficult for designers to use these models and to manually applytests against the guidelines. Where the guidelines have been encapsulated insoftware tools they are relatively easy to apply. Some of these tools only indicatecompliance (or otherwise) with the guidelines, however, and do not explain whyparticular features are undesirable.
Where guidelines are implemented in software, for example, to test theaccessibility of a web site, an implicit user model is employed to evaluate theinterface against those guidelines. Tools like Bobby and Truwex (search online orsee the book’s web site), for example, assess the accessibility of web sites againstthe Web Content Accessibility Guidelines (WCAG, www.w3.org/WAI/intro/wcag.php). For a more extensive discussion of automated tools for evaluatinginterfaces see Ivory and Hearst’s (2001) review that divides the tools into variouscategories and assesses their potential impact.
14.3.2.2 Explicit Descriptive Models
Explicit descriptive models describe the process and mechanisms that make upuser behavior. These models include task analysis. Examples include models builtwith the KLM and with GOMS (Chap. 11) because they simply describe thebehavior (a trace of the behavior) without describing in detail the inner workingsof how the behavior is implemented in cognitive and other mechanisms.
These models can be very useful in system development. Examples of tools tohelp create such models include Interacting Cognitive Subsystems (ICS, Barnard1987) and the Improved Performance Research Integration Tool (IMPRINT,Booher and Minninger 2003). IMPRINT has probably had the largest impact. Itdescribes the tasks that users have to perform and how long each task should take.The resulting model is then used to predict how performance is degraded byfatigue and how many users are required to perform the set of tasks.
There are also tools that try to replicate the time course of the interaction,sometimes interacting with a simulation of the external world. The GOMS Lan-guage Evaluation and Analysis tool (GLEAN), for example, encapsulates theGOMS task analysis methodology (Kieras 1999; Kieras et al. 1995) in a way thatmakes it easier to use and apply GOMS models. This approach really sits halfwaybetween descriptive models and process models that perform the task by pro-cessing information.
392 14 Summary: Putting It All Together

14.3.2.3 Explicit Process Models: Model Human Processor
Card et al. (1980, 1983) believed applying information processing psychologyshould be based on task analysis, calculation, and approximation. Their ModelHuman Processor (MHP) offers an early, simple, integrated description of psy-chological knowledge about error-free human performance relevant to HCI andsystem design. It was one of the first attempts to get away from the proliferationof descriptions developed to account for different psychological observations, andto provide a unified description of users. It started to create a quantitativemethodology including average times. The MHP was an oversimplification, but itdid provide a kind of prototype model that could be used as the basis fordiscussions.
The MHP was made up of a set of memories and processors, together with aset of principles, including the ‘‘principles of operation,’’ which describe how thecomponents functioned together. There were three interacting subsystems: theperceptual system, the motor system, and the cognitive system, each of whichhad their own memories and processors. These are shown schematicallyin Fig. 14.2. A detailed description of how the MHP would perform a taskis achieved using either a KLM analysis or a GOMS analysis, described inChap. 11. Examples of MHP analyses are shown in Table 14.1, and two more areon the book’s web site.
Long term memory essentially does not decay (d = ?) and has infinitecapacity (l = ?). Working memory has a visual store and an auditory store.Memories in both stores decay, but at different rates, and the sizes are different.Working memory outside the stores has a capacity limitation. The perceptualprocessor consists of sensors and associated buffer memories, the most importantbeing a Visual Image Store, and an Auditory Image Store to hold the output ofthe sensory system while it is being symbolically coded. The cognitive pro-cessor receives symbolically coded information from the sensory image storeinto its working memory, and uses information previously stored in long-termmemory to decide how to respond. The motor processor carries out the selectedresponse.
Time predictions are generated by analyzing a task into the constituent oper-ations that are executed by the subsystems. Then average times are associated withthese operations based on the selected band of performance: Fastman, Slowman,and Middleman, which allows predictions to be made along the central andextreme points of the behavioral continuum of fast to slow users.
The MHP assumes highly idealized behavior (e.g., a single strategy to solve atask), and has trouble representing errors. The latter is important. Errors in textediting, for example, have been shown to account for 35% of expert performancetime and 80% of the variability in that time (Landauer 1987, p. 151). Although therepresentations of the perceptual, cognitive, and motor subsystems were weak, theMHP did demonstrate the feasibility of the general idea and inspired later work oninformation processing cognitive architectures realized as computer programs,such as Soar (Newell 1990) and ACT-R (Anderson 2007).
14.3 Models of Users 393

14.3.2.4 Explicit Information Processing Models: ACT-R
There is now a range of cognitive architectures that take as input a descriptive taskanalysis that looks a lot like a computer program, and then simulate the cognitiveaspects of task performance, often with limitations simulated from vision andmotor performance. One of the most widely used architectures is ACT-R; othersinclude EPIC (Kieras et al. 1997) and Soar (Laird 2012; Ritter 2003; Ritter andBibby 2008).
Fig. 14.2 A diagram of the model human processor (adapted from Card et al. 1983). d indicates ahalf-life decay rate; l is a capacity; j is the modality of the storage; s is the time to do something
394 14 Summary: Putting It All Together
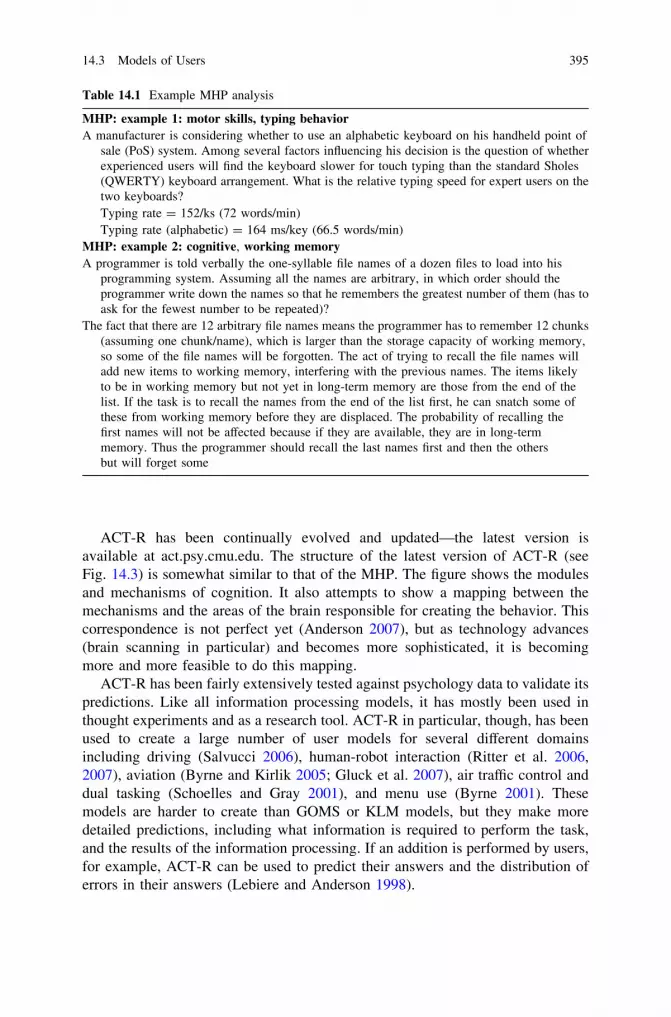
ACT-R has been continually evolved and updated—the latest version isavailable at act.psy.cmu.edu. The structure of the latest version of ACT-R (seeFig. 14.3) is somewhat similar to that of the MHP. The figure shows the modulesand mechanisms of cognition. It also attempts to show a mapping between themechanisms and the areas of the brain responsible for creating the behavior. Thiscorrespondence is not perfect yet (Anderson 2007), but as technology advances(brain scanning in particular) and becomes more sophisticated, it is becomingmore and more feasible to do this mapping.
ACT-R has been fairly extensively tested against psychology data to validate itspredictions. Like all information processing models, it has mostly been used inthought experiments and as a research tool. ACT-R in particular, though, has beenused to create a large number of user models for several different domainsincluding driving (Salvucci 2006), human-robot interaction (Ritter et al. 2006,2007), aviation (Byrne and Kirlik 2005; Gluck et al. 2007), air traffic control anddual tasking (Schoelles and Gray 2001), and menu use (Byrne 2001). Thesemodels are harder to create than GOMS or KLM models, but they make moredetailed predictions, including what information is required to perform the task,and the results of the information processing. If an addition is performed by users,for example, ACT-R can be used to predict their answers and the distribution oferrors in their answers (Lebiere and Anderson 1998).
Table 14.1 Example MHP analysis
MHP: example 1: motor skills, typing behaviorA manufacturer is considering whether to use an alphabetic keyboard on his handheld point of
sale (PoS) system. Among several factors influencing his decision is the question of whetherexperienced users will find the keyboard slower for touch typing than the standard Sholes(QWERTY) keyboard arrangement. What is the relative typing speed for expert users on thetwo keyboards?Typing rate = 152/ks (72 words/min)Typing rate (alphabetic) = 164 ms/key (66.5 words/min)
MHP: example 2: cognitive, working memoryA programmer is told verbally the one-syllable file names of a dozen files to load into his
programming system. Assuming all the names are arbitrary, in which order should theprogrammer write down the names so that he remembers the greatest number of them (has toask for the fewest number to be repeated)?
The fact that there are 12 arbitrary file names means the programmer has to remember 12 chunks(assuming one chunk/name), which is larger than the storage capacity of working memory,so some of the file names will be forgotten. The act of trying to recall the file names willadd new items to working memory, interfering with the previous names. The items likelyto be in working memory but not yet in long-term memory are those from the end of thelist. If the task is to recall the names from the end of the list first, he can snatch some ofthese from working memory before they are displaced. The probability of recalling thefirst names will not be affected because if they are available, they are in long-termmemory. Thus the programmer should recall the last names first and then the othersbut will forget some
14.3 Models of Users 395

14.3.3 Summary
What is the purpose of user models? One use is that they can provide a way tocreate a shared representation of the user between interface designers, systemdesigners, and others working on system development (Pew and Mavor 2007).They can also be used as summaries of knowledge (Newell 1990), and are thususeful to people learning about users. These models are also useful in video gamesand other simulations where the more advanced types can serve as surrogate users,opponents, and teammates (Pew and Mavor 1998; Ritter et al. 2003).
User models provide frameworks, ways of seeing designs and targetingpotential problems, and integrating psychological principles because the user’sknowledge and capabilities are represented explicitly.
Which type of user model you choose depends on what part of the design youare working on and what you want from the model. For example, task analysis as asimple version of a user model is very lightweight and very useful, particularly forsimple web site design. A more complex and formal model is useful as thecomplexity and impact of the system increase. For testing large numbers ofinterfaces (e.g., a web site), or for testing a site often or repeatedly, an automatictool is useful. For high impact interfaces (e.g., aviation, automotive interfaces dueto the large number of users, or space station interfaces), more complete andcomplex models are useful because they are more accurate, but currently come at avery high price.
The choice of which model to use can be based on what you want to learn abouthow users interact with your system. This can be seen as a way to reduce systemdevelopment risks, and your choice of model can be based on the questions of
Intentional System(not modeled)
Declarative Memory(Temporal/Hippocampus)
Retrieval (VLPFC)Goal (DLPFC)
Visual (Parietal) Manual (Motor)
Matching (Striatum)
Selection (Pallidum)
Execution (Thalmus)
Environment
Visual System(loosely modeled)
Effector System for Hands (loosely modeled)
Mo
du
les
Bu
ffer
s
Pro
du
ctio
ns
(Bas
al G
ang
lia)
Fig. 14.3 The schematicblock diagram of ACT-R 6.Taken from Anderson (2007)and used with permission
396 14 Summary: Putting It All Together

what risks do you want to reduce, will the system be fast enough to use? Fastenough to learn? Will the error rate be too high? Using risk reduction in systemdesign is taken up in the next section.
14.4 Risk-Driven Incremental Commitment Model
14.4.1 Introduction
There is now widespread acceptance of the fact that most systems developmentfollows an iterative cycle, often represented by the spiral model (Boehm andHansen 2001). It is only relatively recently, however, that human factors issueshave been explicitly incorporated into the latest version of the spiral model(Boehm and Lane 2006) by the (US) Committee on Human-System DesignSupport for Changing Technology (Pew and Mavor2007). The revised model—theRisk Driven Incremental Commitment Model (RD-ICM)—encourages incremen-tal development of systems in an ongoing spiral process comprising requirementsspecification, technical exploration, and stakeholder commitment. The process isshown in Fig. 14.4, where movement around the spiral represents time andcommitment and work on the project.
The spiral is also sometimes shown linearly, as in Fig. 14.4, for discussionpurposes. At each stage, the system development is assessed for risks to thesystem’s success. The process is then targeted at reducing these risks. Where therisks are technical (e.g., Can we build it? Can we build it for that price?), technicalwork is performed to reduce the risk through increased understanding of thetechnical issues and how to deal with them. Other risks can arise from historicalevents, which are harder to reduce; and from financial matters, which can often bereduced by setting up contracts at a known price.
The RD-ICM has several key features:
1. Systems should be developed through a process that considers and satisfices theneeds of stakeholders (it finds a reasonable solution that keeps in mind the costsof finding a (better) solution). This step is addressed by the Exploration andValuation stages shown in Fig. 14.4.
2. Development is incremental and performed iteratively. These related aspectsare shown in Fig. 14.4 by the multiple loops representing the increasing amountof resources committed to design and implementation, and in Fig. 14.5 by thefive stages (Exploration, Valuation, Architecting, Development, and Opera-tion). These stages are incremental because movement from one stage to thenext depends upon a successful review to go to the next stage.
3. Development occurs concurrently, that is, multiple steps may be performedsimultaneously—some people thus refer to this model as an IncrementalConcurrent Commitment model. One part of the system may be implementedwhile another part is being tested. This is not immediately clear from Figs. 14.4
14.3 Models of Users 397

or 14.5, but can be seen more clearly in Fig. 14.6. This figure shows how theamount of effort put into a given activity varies through the life of a system fora hypothetical example system. Some peaks occur on some activities when theirphase is active (e.g., development), and some activities peak near the reviews(i.e., the Evaluation, Valuation, Architecting, Construction, and OperationsCommitment Reviews). The level of activity will also vary within a phase, asiterations are done within that phase.
4. The process explicitly takes account of risks during system development anddeployment. The level of risk is assessed at reviews between stages (shownholistically in Fig. 14.4 and explicitly in Fig. 14.5). Risk is used to manage theproject—the level of effort and level of detail of work are driven by the level ofrisk (Boehm 2008 provides some nice additional information and examples).Where there is no risk to system development, there is no need for any effort toreduce risk. For example, if the system being developed is similar to an existingproduct, there may be no reason to explore further how to support users or howto manufacture that system.
1
2
3
4
5
6
STAKEHOLDERCOMMITMENTREVIEW POINTS:
Opportunities toproceed, skipphases, backtrack,or terminate
Exploration Commitment Review
Valuation Commitment Review
Architecture Commitment Review
Development Commitment Review
Operations1 and Development2Commitment Review
Operations2 and Development3Commitment Review
Cumulative Level of Understanding, Cost, Time, Product, andProcess Detail (Risk-Driven)
ConcurrentEngineering ofProducts andProcesses
2345
ARCHITECTINGARCHITECTING
VALUATION
DEVELOPMENT
1
OPERATION2
16
OPERATION
ARCHITECTING
EXPLORATION
Fig. 14.4 The RD-ICM model as a spiral. Reprinted from Pew and Mavor (2007) withpermission from the National Academy of Sciences, courtesy of the National Academies Press
398 14 Summary: Putting It All Together

Pew and Mavor (2007, pp. 91–133) provide three examples of using the Risk-Driven Spiral Model method to develop specific systems. These examples aretaken from different domains and are different sizes. Their Chap. 5 (http://www.nap.edu/openbook.php?record_id=11893&page=91) covers the developmentof an unmanned aerial system (i.e., an unmanned aerial vehicle, a UAV) for themilitary, a port security screening system for homeland security, and an intrave-nous infusion pump for use in hospitals. Each example covers different aspects ofthe process, so together they provide fairly broad coverage of the approach.
The model is relatively complex, so we advocate that another way to under-stand it is through the viewpoint of concurrent activities. The standard way ofpresenting the model is as a spiral (as shown in Fig. 14.4), although the spiral canbe unwound and the task activity levels can be represented in a linear fashion(Fig. 14.5), which makes it easier to recognize the concurrent phases of devel-opment, as well as concurrent activities that are out of phase and aspects likestakeholder commitment review points where the risks are assessed.
.AelpmaxE Simple Enterprise
)PRE(gninnalPecruoseR based application
Activities
General/DoD Milestones
Example B. Complex, but feasible product development
Example C. Stakeholders agree that more convergence of objectives is necessary
Example D. A superior product enters the market
Too high, unaddressable
High, butaddressable
Acceptable
NegligibleRisk? Risk? Risk? Risk? Risk?
Negligible
Acceptable Acceptable Acceptable ...
AcceptableAcceptable
Risk? Risk? Risk? Risk? Risk?
Acceptable Acceptable Acceptable ...
AcceptableAcceptable
Risk? Risk? Risk? Risk? Risk?
Acceptable Acceptable Acceptable ...
AcceptableAcceptable
Risk? Risk? Risk? Risk? Risk?
Too high, unaddressable
High, butaddressable
Discontinue
ICMLife-cycle Phases
Explor
ation
Valuat
ion
Archit
ectin
g
Develo
pmen
t 1
Archit
ectin
g 2
Opera
tion 1
D
evelo
pmen
t 2
Archit
ectin
g 3
...
Explor
ation
Comm
itmen
t
Review Valu
ation
Comm
itmen
t
Review Arc
hitec
ture
Comm
itmen
t
Review Dev
elopm
ent
Comm
itmen
t
Review Ope
ratio
ns
Comm
itmen
t
Review Ope
ratio
ns
Comm
itmen
t
Review
ECR VCR/CD ACR/A DCR/BOCR 1 /C1DCR 2 /B2
OCR 2 /C2DCR 3 /B3
Fig. 14.5 The RD-ICM laid out linearly. This figure also shows the role of risk in systemdevelopment, showing how different risk patterns yield different processes. Reprinted from Pewand Mavor (2007) with permission from the National Academy of Sciences, courtesy of theNational Academies Press
14.4 Risk-Driven Incremental Commitment Model 399

14.4.2 Insight 1: The RD-ICM Provides a Way to OrganizeUser-Related Knowledge and Ways of Knowing
Experiences teaching and applying the RD-ICM to system design have led to a fewinsights and extensions. These are related to learning: learning through using thisapproach how to organize methods to reduce risks, learning by system
ACTIVITIES
Initial Elab#1
Elab#2
Const#1
Const#2
Tran#1
Tran#2
Inception Elaboration Construction Transition
Business Modeling
System Scoping/Requirements
Understanding Needs/ Stakeholder Requirements
Envisioning
Evaluation
c. Hardware
b. Human
Architecting and Designing a. System
d. Software
Maintenance
Operations
Development
Iterations within Phases
Act
ivit
y L
evel
s
ECR
VCR
ACR
CCR
OCR
Planning
Fig. 14.6 The role of concurrency in system development, showing how different tasks may beperformed concurrently and how activity levels rise and fall over the course of a project. It issimilar to Fig. 2.3 in Pew and Mavor (2007) and incorporates ideas from Boehm’s other work(e.g., Boehm 2008)
400 14 Summary: Putting It All Together

development managers that there are sometimes risks related to humans using theirsystems, learning that designers are stakeholders too, and learning by designers aslessons from one design are applied to later designs.
Pew and Mavor (2007) report that the RD-ICM approach provides a useful wayto organize usability methods. We have found that this approach also provides auseful framework for teaching this material. The three main areas that involve HISactivities are identified as:
1. Defining the opportunities and context of system use.2. Defining system requirements and design.3. Evaluation of the system.
There are several methods that can be used to reduce risk in these three areas.All of the HCI methodologies (not just the examples presented in the Pew andMavor book) can be organized with respect to how much they can contribute toeach stage of system development.
The RD-ICM has been very useful in discussing the relative merits of meth-odologies, and when to use each of the methodologies or techniques. Figure 14.7highlights several examples of methods that are applicable across several stages ofsystem development, as shown by the horizontal lines under each of the methodnames. The figure could be further extended by weighting the lines to emphasizewhere individual methods are more appropriate to a particular stage of develop-ment. If all the methods were included, the figure would also show that methods(and thus practitioners) could be grouped by usefulness at particular stages ofdevelopment: some methods are best suited to the early valuation stage, forexample, and some to evaluation.
14.4.3 Insight 2: RD-ICM is Descriptive as Wellas Prescriptive
The RD-ICM formalizes to some extent what many people accept as perceivedwisdom, i.e., that many system developers already recognize that several devel-opment processes are risk driven (or at least risk aware), incremental, and con-current. Indeed, we believe that most system development processes are riskdriven, and that systems developers are aware of the risks and adjust theirdevelopment processes to reduce or mitigate the effects of the identified risks. Wealso believe that some parts of system development are often carried out in par-allel. Furthermore, we believe that there is buy-in from at least some of the systemstakeholders in nearly all projects. The RD-ICM is therefore not merely a nor-mative model, prescribing what system developers should do, but instead capturesand describes the practice of systems development. If the RD-ICM was describedto systems developers, we believe many of them would claim that they alreadyfollow a similar process.
14.4 Risk-Driven Incremental Commitment Model 401

There are two major areas of risk, however, that system developers and man-agers seem to be less aware of:
• The risks that arise from not giving appropriate consideration to all of thesystem stakeholders
• The risks that arise from not considering humans as part of the system.
Developers and managers are probably not effectively addressing these risksbecause they believe the risks have low probability or only lead to very minorconsequences, perhaps because they lack formal training in these areas.1 Webelieve that the developers and managers more fundamentally do not recognize thepotential threat to the system’s success from these two major areas of risk. Thus,we can either educate the managers, or provide other ways to highlight risksoutside their expertise. It may be useful to bring in outside experts to evaluate therisks. The corollary of this is that it is probably worthwhile to include outsideexperts in the evaluation of all risks. They are likely to have greater awareness of awider range of risks across a wider range of contexts, and to be more objectivewith respect to the project, so they will help to make the evaluation morecomprehensive.
Irrespective of whether you are following some version of the Spiral Model(such as the ICM or RD-ICM) or any other life cycle model (waterfall, V-model,and so on), it is important that all stakeholders are considered. It is also important
Fig. 14.7 Figure 7.1 from Pew and Mavor (2007) revised to show the approximate range of useof several methodologies across the development process. Reprinted with permission from theNational Academy of Sciences, courtesy of the National Academies Press
1 Engineers will see engineering risks, accountants accounting risks, and human factorsengineers HF risks.
402 14 Summary: Putting It All Together

that they are considered from the start of the project. In other words, before we getto thinking about design issues.
There are several illustrations of why it is important to include consideration ofusers at the earliest stages of system development. Figures 1.1 through 1.4 inChap. 1, for example, all showed that there are fundamental aspects of humanbehavior that designers are often unaware of. Some would argue that the conse-quences of these failures are irritating rather than severe, but the range and impactof the risks are exemplified in summary reviews such as those by Booher andMinninger (2003) and Casey (1998, 2006), in the regularly updated Risks Digest,2
and in publicly reported incidents like that involving the USS Vincennes, where acivilian airliner was shot down by a US Navy ship because the airliner was thoughtto be a fighter plane. The examples in all of these reviews help to raise thevisibility of the risks that need to be considered during development.
This approach is therefore not just prescriptive but also descriptive. Failuresarise from not knowing risks. To fix this, we need to educate designers abouthuman-centered risks and how to avoid them. This book can be seen as a directstep to address this problem.
14.4.4 Extension 1: Designers are Stakeholders Too
One of the insights that arose from teaching the RD-ICM is that a description ofthe development process reinforces the fact that designers are stakeholders too (seeSteele et al. 2011 for one example). The success of designers is at least partiallylinked to the success of the project, and their needs and capabilities will influencethe development process.
Designers are therefore stakeholders too, and, just like users, they have capa-bilities and limitations that can affect the outcome of a project. They have creativeskills and experience of how to turn requirements into deliverable systems. Morefundamentally, they will also have experience of the feasibility of whether aparticular set of requirements can reasonably be turned into a deliverable system.In one sense, designers are users too, because they often rely on automated tools tohelp them to carry out and manage system development. If they are not supportedor lack resources, including time, they will produce problems like that shown inFig. 14.8.
If designers are stakeholders then there needs to be time allocated to solicitingtheir input, and to making sure that they are equipped with the appropriate skillsand tools to do the design. This may mean that they need to be educated about thecapabilities and limitations of users, for example, and to be provided with toolsthat can allow them to create design representations that they can share with otherstakeholders as well as the users.
2 http://catless.ncl.ac.uk/Risks
14.4 Risk-Driven Incremental Commitment Model 403

When designers (and implementers) push back against the discussion andmanagement of risks related to human–system integration, this may be becausethey do not fully appreciate the risks in this area. Explicitly including designers asstakeholders should focus on helping them become more cognizant of the issuesand context involved that is outside their training. Giving them this broadercontext should ultimately lead to better integration and greater risk reduction,including the reduction of system implementation related risks.
14.4.5 Extension 2: Learning Within and Between Projects
Given the multidisciplinary nature of system development, and the importance ofinvolving all the stakeholders, it is obvious that communication is important. Thevarious disciplines that need to talk to each other during system development allhave their own history and culture, which includes their own terminology. One ofthe easiest ways of facilitating communication is through the use of representationsthat help to make ideas and concepts more tangible. Pew and Mavor (2007)explicitly recognized this in their call for research on shared representation andintegration across the design process. In some ways this can be regarded as anextension to the idea of software design patterns which provide generic templatesor descriptions of solutions to problems that can be applied in different situations(e.g., Gemma et al. 1995).
One of the major results from using simulation in CAD/CAM is that the lessonslearned about one design can be applied to subsequent designs as well as to thecurrent design. For example, in printed circuit boards, traces (printed wire paths)can be positioned too closely together. Tools like Spice (Thorpe 1992) help tohighlight effects such as cross talk between the traces and short circuits that can becaused by the manufacturing process. After these design lessons are learned on thefirst design, they can be used to steer subsequent designs away from the problemrather than forcing the designer to start from scratch each time, modifying their
Fig. 14.8 The question was,‘‘How did Robinson Crusoemeet Friday?’’ Theduplication of the answer intothe extra information fieldsuggests that the interface didnot support a systemdesigner, and that the resultswere not tested
404 14 Summary: Putting It All Together

designs based on a new analysis of the problems. Similar effects of transfer willhappen after computing Fitts’ Law a few times or comparing mouse movementtimes to keystroke times.
To facilitate learning, shared representations need to be made available withinprojects, across the system development team and across the different stages of thedesign process for a single project. We extend this, though, to re-using repre-sentations across multiple projects. This may mean that the shareable represen-tations have to be able to reflect different levels of abstraction (based on theirdependency on their context of use) so that they can be learned from and re-used.The corollary of this is that those people developing the shared representations arelikely to need to document the shared representations with information aboutcontext.
In addition to sharing representations within projects, it may be possible to re-use these representations across projects. This would increase the value of theserepresentations, and achieve the re-use that is called for by Pew and Mavor (2007).This would also broaden the audience for the shared representations to includemanagers and developers on future projects who may be able to learn aboutpotential risks and which stakeholders to consult.
14.4.6 Summary
The RD-ICM model is just one way of creating systems that are useful and safe. Itinvolves identifying the stakeholders—including the designers—and coming upwith a system through satisficing their different requirements, finding the bestsolution matching their constraints, including the cost to find better solutions as aconstraint. If stakeholders’ needs are not adequately supported, they may notparticipate in the system development process fully, and may either obstruct theprocess or even refuse to accept the final system. An advantageous side effect ofusing the RD-ICM is that it can provide new ways of summarizing HCI methodsand, more broadly, Human-System Integration (HSI) as an integral part of designand development.
In the vast majority of systems, a failure to consider the users as stakeholders,and a lack of understanding of the abilities, capabilities, and limitations of userswill constitute a risk to system development and use. The main exceptions arewhere the system being developed is not novel, so the risks in these areas are likelyto have been considered and dealt with on other projects. Where there are risks,however, work has to be done to manage them appropriately, given the availableresources, and to balance all of the identified risks (user related risks will need tobe balanced against technical risks, for example).
Managers and developers are usually familiar with the technical risks associ-ated with software and hardware. To make them more aware of user-related risks,they are likely to require some level of education and training about the capa-bilities and limitations of users. This education and training should take them to a
14.4 Risk-Driven Incremental Commitment Model 405

level where they feel comfortable discussing these sorts of issues with people fromthe other disciplines involved in systems development.
Shared representations are an important part of the development process, butthey can be expensive to produce. It is therefore important to find ways to makethem more valuable through reuse, for example. One way of doing this is byapplying lessons from one design to subsequent designs on related projects.
On the surface, the RD-ICM may appear to encapsulate a relatively complextheory of how systems should be created. It attempts to capture best practice andwhat many developers already do, highlighting that development is not a simple,linear, one-size-fits-all process. There are enough facets to the RD-ICM that itappears to have the same sort of level of complexity as a programming language oreven a cognitive architecture. Although learningto use the RD-ICM approach takestime and effort, the fact that it takes explicit account of human factors currentlymakes it possibly the best model to use for development.
14.5 Building on the Foundations
At this point you should know much more about users than you did when youstarted reading this book. We hope that we have convinced you of the importanceof understanding users and that, as a result, you are now more sensitive to the waysthat users think and behave.
There is a lot to learn, and while we have presented you with a lot of infor-mation, we continue to learn more about users as new technologies emerge andgive rise to new ways of working. Even with the new technologies and new waysof working, it is important to think of them in terms of particular users doingparticular tasks in a particular context. The information we have presented in thisbook should allow you to start to do that in a principled way, enabling you todesign usable systems and to justify why you have designed them in a particularway. The Implications for system design sections should help here. Note, however,that in this book we have only really scratched the surface of what there is to learnabout people, tasks, and contexts. If you want to find out more about any of thetopics we mention, the lists of Other resources should provide a good startingpoint. Cynics might say that ‘‘Keep in mind that a year in the lab can save you anhour’s reading. That is, spending a little time looking at previous work can save alot of time needlessly duplicating known results.
One implicit lesson that we hope you have learned is that developing systemsdraws on multiple disciplines. We are not expecting software designers to becomefully fledged psychologists, but we hope that our book sensitizes softwaredesigners to the psychological issues (about users) that need to be considered. Wealso hope that it provides a foundation for useful dialog across disciplines duringsystem design.
You should also have tools for finding out information when the information isnot yet published. The short exercises at the end of most chapters on gathering data
406 14 Summary: Putting It All Together

and Chap. 13 on usability studies should provide you with a way to find out moreabout particular users, particular tasks, or particular aspects of a task. There areimportant topics not included here because of space, such as emotions, and theseyou are now well equipped to learn on your own, or through further formal study
As you start to use and apply your knowledge of users to systems development,you are likely to find that it leads you to raise several questions. When you addressthese questions to human factors engineers, you will often find that their answer is‘‘It depends.’’ If this book has achieved nothing else, it should at least have helpedyou to appreciate why ‘‘it depends’’: system performance is all about particularpeople doing particular tasks in particular contexts, and those people are all dif-ferent individuals, they have different skills and abilities, and they may work indifferent physical, social, and organizational contexts.
The importance of appropriately integrating what we know about users intosystem design is becoming increasingly widespread. The revised version of Boehmand Hansen’s (2001) incremental commitment model of system development, forexample, includes explicit consideration of users (Pew and Mavor2007). The newmodel provides a principled way for deciding when you need to know more aboutyour users. It explicitly acknowledges that not knowing enough about your users isa risk to the successful completion of a system development project. If this lack ofknowledge about your users (their tasks and the context in which they work) posesa significant risk, then you need to invest more time and effort in addressing thoseissues until the risk is reduced to an acceptable level.
We have now shown you what sort of things you will need to know about yourusers, and how to go about finding out that information. In doing so, we haveprovided you with the foundations for designing user-centered systems.
14.6 Other Resources
Pew (2007) has written a history of models in this area. In it he provides asummary as well as a description of the relationships between the various familiesof models.
Salvucci has some nice models of how people drive (Salvucci2006), and sometools for predicting how secondary tasks will impair driving (Salvucci et al. 2005).Byrne and Kirlik (2005) have provided similar lessons in aviation.
We have previously laid out a vision of future work that is needed to helpdesigners create models routinely (Ritter et al. 2003). It is available online andnotes about 20 projects that remain to be done with computational models of users.
Pew and Mavor’s (2007) book is available on line, and you can purchase it orregister and download it. Their book provides useful pointers to a range ofmethodologies for reducing the risks to system success that are caused by notunderstanding users or their tasks. It could be and has been used to teach a separateclass on HCI methodologies. There was also a special issue of the Journal ofCognitive Engineeringand Decision Making related to the topic published in 2008.
14.5 Building on the Foundations 407

A short, easy to read technical report is available online that lays out a tax-onomy of system development risks and a method to perform a risk analysis:
Carr, M., Konda, S., Monarch, I., Ulrich, C., & Walker, C. (1993). Taxonomy-Based RiskIdentification (Tech. Report No. CMU/SEI-93-TR-6, ADA266992). Pittsburgh, PA:Software Engineering Institute, Carnegie-Mellon University.
14.7 Exercises
14.1 Consider a smartphone, either a specific one or a composite one, or a simplecell phone. Note all the limitations that will preclude users from performingwell with it. Organize these by the ABCS framework.
14.2 Choose an existing interface. Note the tasks that users will want to use it for.Note the types of users and their characteristics. Run two small studiesexamining how well your theory of use fits the data. These studies could beto find out what tasks users really do, how well they do it (time and errors,and strategies), or characteristics of the users.
14.3 Choose an interface or system to create, such as a new application for asmartphone, such as a game, or book reader. Note what risks there are indeveloping such a system, with particular attention paid to the technical risksand those related to the user. Prioritize them. If you had 100 h, how wouldyou allocate that time to reduce these risks?
14.4 Go back and read the Appendix on the Kegworth air accident again. Read thesupplementary material referenced (e.g., the AAIB report) or other reportsyou can find. Identify four more factors (events, processes, or mistakes) thatcan be considered as causes of the accident. Describe how these things couldhave been avoided or ameliorated. Address the question of whether it was‘pilot error’ that caused that plane to crash.
References
Anderson, J. R. (2007). How can the human mind exist in the physical universe? New York, NY:Oxford University Press.
Barnard P. J. (1987). Cognitive resources and the learning of human-computer dialogues. InJ. M. Carroll (Ed.), Interfacing thought: Cognitive aspects of human–computer interaction(pp. 112–158). Cambridge, MA: MIT Press.
Baxter, G., Besnard, D., & Riley, D. (2007). Cognitive mismatches in the cockpit: Will they everbe a thing of the past? Applied Ergonomics, 38, 417–423.
Boehm, B. (2008). Making a difference in the software century. IEEE Computer,41(3), 32–38.Boehm, B., & Hansen, W. (2001). The spiral model as a tool for evolutionary acquisition.
Crosstalk: The Journal of Defense Software Engineering, 14(5), 4–11.Boehm, B., & Lane, J. (2006). 21st century processes for acquiring 21st century systems of
systems. Crosstalk, 19(5), 4–9.
408 14 Summary: Putting It All Together

Booher, H. R., & Minninger, J. (2003). Human systems integration in Army systems acquisition.In H. R. Booher (Ed.), Handbook of human systems integration (pp. 663–698). Hoboken, NJ:John Wiley.
Byrne, M. D. (2001). ACT-R/PM and menu selection: Applying a cognitive architecture to HCI.International Journal of Human–Computer Studies, 55(1), 41–84.
Byrne, M. D., & Kirlik, A. (2005). Using computational cognitive modeling to diagnose possiblesources of aviation error. International Journal of Aviation Psychology, 15(2), 135–155.
Card, S. K., Moran, T. P., & Newell, A. (1980). The keystroke-level model for user performancetime with interactive systems. Communications of the ACM, 23(7), 396–410.
Card, S. K., Moran, T., & Newell, A. (1983). The psychology of human–computer interaction.Hillsdale, NJ: Erlbaum.
Casey, S. M. (1998). Set phasers on stun: And other true tales of design, technology, and humanerror. Santa Barbara, CA: Aegean.
Casey, S. M. (2006). The atomic chef: And other true tales of design, technology, and humanerror. Santa Barbara, CA: Aegean.
Ericsson, K. A., & Simon, H. A. (1993). Protocol analysis: Verbal reports as data (2nd ed.).Cambridge, MA: MIT Press.
Gemma, E., Helm, R., Johnson, R., & Vlissides, J. (1995). Design patterns: Elements of reusableobject-oriented software. Boston, MA: Addison-Wesley.
Gluck, K. A., Ball, J. T., & Krusmark, M. A. (2007). Cognitive control in a computational modelof the predator pilot. In W. D. Gray (Ed.), Integrated models of cognitive systems (pp. 13–28).New York: Oxford University Press.
Ivory, M. Y., & Hearst, M. A. (2001). The state of the art in automating usability evaluation ofuser interfaces. ACM Computing Surveys, 33(4), 470–516.
Kieras, D. E. (1999). A guide to GOMS model usability evaluation using GOMSL and GLEAN3.AI Lab, University of Michigan. Retrieved 10 March 2014 from http://web.eecs.umich.edu/*kieras/docs/GOMS
Kieras, D. E., Wood, S. D., Abotel, K., & Hornof, A. (1995). GLEAN: A computer-based tool forrapid GOMS model usability evaluation of user interface designs. In Proceedings of the ACMSymposium on User Interface Software and Technology (UIST’95) (pp. 91–100). New York,NY: ACM.
Kieras, D. E., Wood, S. D., & Meyer, D. E. (1997). Predictive engineering models based on theEPIC architecture for a multimodal high-performance human-computer interaction task.Transactions on Computer–Human Interaction, 4(3), 230–275.
Laird, J. E. (2012). The soar cognitive architecture. Cambridge, MA: MIT Press.Landauer, T. K. (1987). Relations between cognitive psychology and computer systems design.
In J. Preece & L. Keller (Eds.), Human–computer interaction (pp. 141–159). EnglewoodCliffs, NJ: Prentice-Hall.
Lebiere, C., & Anderson, J. R. (1998). Cognitive arithmetic. In J. R. Anderson & C. Lebière(Eds.), The atomic components of thought (pp. 297–342). Mahwah, NJ: Erlbaum.
Morrison, J. E. (2003). A review of computer-based human behavior representations and theirrelation to military simulations (IDA Paper P-3845). Alexandria, VA: Institute for DefenseAnalyses.
Newell, A. (1990). Unified theories of cognition. Cambridge, MA: Harvard University Press.Pew, R. W. (2007). Some history of human performance modeling. In W. Gray (Ed.), Integrated
models of cognitive systems (pp. 29–44). New York, NY: Oxford University Press.Pew, R. W., & Mavor, A. S. (Eds.). (1998). Modeling human and organizational behavior:
Application to military simulations. Washington, DC: National Academies Press. Retrievedfrom 10 March 2014 http://books.nap.edu/catalog/6173.html
Pew, R. W., & Mavor, A. S. (Eds.). (2007). Human-system integration in the system developmentprocess: A new look. Washington, DC: National Academies Press. Retrieved March, 2014from http://books.nap.edu/catalog.php?record_id=11893
Ritter, F. E. (2003). Soar. In L. Nadel (Ed.), Encyclopedia of cognitive science (Vol. 4,pp. 60–65). London: Nature Publishing Group.
References 409

Ritter, F. E., & Bibby, P. A. (2008). Modeling how, when, and what learning happens in adiagrammatic reasoning task. Cognitive Science, 32, 862–892.
Ritter, F. E., Shadbolt, N. R., Elliman, D., Young, R. M., Gobet, F., & Baxter, G. D. (2003).Techniques for modeling human performance in synthetic environments: A supplementaryreview. Wright-Patterson Air Force Base, OH: Human Systems Information Analysis Center(HSIAC).
Ritter, F. E., Van Rooy, D., St. Amant, R., & Simpson, K. (2006). Providing user models directaccess to interfaces: An exploratory study of a simple interface with implications for HRI andHCI. IEEE Transactions on System, Man, and Cybernetics, Part A: Systems and Humans,36(3), 592–601.
Ritter, F. E., Kukreja, U., & St. Amant, R. (2007). Including a model of visual processing with acognitive architecture to model a simple teleoperation task. Journal of Cognitive Engineeringand Decision Making, 1(2), 121–147.
Salvucci, D. D. (2006). Modeling driver behavior in a cognitive architecture. Human Factors,48,362–380.
Salvucci, D. D., Zuber, M., Beregovaia, E., & Markley, D. (2005). Distract-R: Rapid prototypingand evaluation of in-vehicle interfaces. In Human Factors in Computing Systems: CHI 2005Conference Proceedings (pp. 581–589). New York, NY: ACM Press.
Schoelles, M. J., & Gray, W. D. (2001). Argus: A suite of tools for research in complex cognition.Behavior Research Methods, Instruments, & Computers, 33(2), 130–140.
Steele, M., Dow, L., & Baxter, G. (2011). Promoting public awareness of the links betweenlifestyle and cancer: A controlled study of the usability of health information leaflets.International Journal of Medical Informatics, 80, e214–e229.
Thorpe, T. W. (1992). Computerized circuit analysis with SPICE: A complete guide to SPICE,with applications. New York, NY: Wiley.
410 14 Summary: Putting It All Together

AppendixThe Kegworth Air Accident (1989)
Introduction
The Kegworth air accident is used to illustrate several points in this book. Wechose this particular accident because it is well known and has been widelyanalyzed over the years (e.g., see Besnard et al. 2004). The full accident report isvery comprehensive, and covers all aspects of the accident as well as the humanfactors issues. It is available from the web site of the UK’s Air AccidentsInvestigation Branch (AAIB).1 The AAIB are responsible for investigatingaccidents that occur within UK air space.
Description of the Accident
On 8 January 1989 a British Midland Airways (BMA) Boeing 737-400 planecrashed into the embankment of the UK’s M1 motorway close to the village ofKegworth in the East Midlands, during a flight from London Heathrow to Belfast.Of the 126 people on board, 47 lost their lives.
Both members of the flight crew were highly experienced. The Captain hadlogged over 13,000 flying hours, whilst the First Officer had logged over 3,200.Both pilots were rated for the B737-200, -300, and -400 series aircraft. They had acombined experience of 76 flight hours in the Boeing 737-400 series aircraft.Furthermore, they had not been trained on the new plane’s controls, but had onlyreceived a 1-day audio–visual conversion course on the B737-400, which has aglass cockpit, i.e., the information is presented on digital displays rather than thevast array of analogue instruments and electro-mechanical displays that appearedin the cockpit of its predecessor, the B737-300. In addition, the B737-400 serieswas fitted with a newer variant of an engine which could generate slightly morethrust. The engine had been certified by the appropriate authorities afterundergoing testing.
During the flight, a fan blade broke off in the #1 engine. This resulted in anincrease in vibration above what is considered normal, and which was strong
1 http://www.aaib.gov.uk/sites/aaib/publications/formal_reports/4_1990_g_obme.cfm
F. E. Ritter et al., Foundations for Designing User-Centered Systems,DOI: 10.1007/978-1-4471-5134-0, � Springer-Verlag London 2014
411

enough to be felt by the crew. This happened shortly after 20:05 h. At the sametime as the increase in vibration was felt, smoke and fumes were drawn into theaircraft through the air conditioning system. In their analysis of the problem, theflight crew mistakenly identified the right hand (#2) engine as being at fault andtherefore reduced its power accordingly.
An analysis of the data from the cockpit voice recorder (CVR) showed thatthere had been a slight hesitancy in determining which of the engines was at fault.When the Captain (the senior officer on the flight deck) asked the First Officerwhich engine was faulty, he replied ‘It’s the le… it’s the right one.’ As aconsequence, the power to the right hand (#2) engine was throttled back and theengine was eventually shut down.
The actions taken on the right hand engine coincided (as it later turned out) witha reduction in vibration, and the smoke and fumes emerging from the left (faulty)engine also stopped. The flight crew therefore decided, erroneously (again, as itlater turned out), that the correct engine had been shut down. They decided to putin motion the plan to make an emergency landing at East Midlands Airport, whichinvolved talking to Air Traffic Control (ATC) to make sure they could get theappropriate clearances to land. Although the left engine continued to show a higherthan normal level of vibration for several minutes, the crew did not notice this atthe time.
When the crew began their descent towards the airport they reduced the powerto the left engine. This led to a further reduction in the vibration in that engine tothe point where it was not much higher than what would normally be expected.About 10 min later the crew decided to increase the power to the left engine oncemore, in order to maintain the aircraft’s altitude in the final stages of descent. Thevibration levels increased once more to very high levels, power was lost in engine#1, and a fire warning sounded. At this point the crew tried to restart the #2 enginebut did not manage to achieve this before the aircraft crashed into the ground 0.5nautical miles short of the runway shortly after 20:12 h.
An Analysis of Possible Contributory Factors
It is often very difficult to single out the exact causes of an accident after the fact.Where lives and machinery are lost, the best attempts involve a reconstruction ofevents based on the available evidence. In the case of aircraft accidents, thisincludes the information captured by the Flight Data Recorder, and the CVR.These are what you often hear referred to as ‘‘the Black Box’’ although they areusually a highly visible shade of orange!
In the Kegworth accident, the crash was ultimately attributed to the way that theflight crew managed a mechanical incident in the left (#1) engine. The eventsunfolded very quickly: from the vibration being detected to the crash took less than7 min 30 s. As is often the case, there were several contributory events thathappened which contributed to the accident. These occurred at different levels
412 Appendix: The Kegworth Air Accident (1989)

within the system. We pick out examples of several types of these below. Ratherthan providing an exhaustive analysis (which you can find by reading the accidentreport in full, and consulting the many papers that have been published about theaccident), our intention is to illustrate the points of particular interest. We start at alevel that is some distance away from the point at which people are interactingwith technology, as a way of highlighting the importance of understanding thewider context in which people make decisions and take actions. When you havefinished reading the book, you should be able to come back to the accidentdescription above and identify further examples (this is Exercise 14.4).
Regulatory Level Issues
The B737-400 was fitted with a new type of engine. As with all aircraft engines, ithad to undergo extensive testing before it could be certified for operational use.The engine in this case was a variant of an existing engine (which is commonpractice in the aero-engine industry), and it was thoroughly tested on the groundbefore being certified by the FAA (and ratified by the CAA). The engine was not,however, tested either in an altitude test cell (which simulates the conditions offlying at high altitudes) or in flight. If it had been so tested, this may havehighlighted the fact that there was a flaw in the design which led to a turbine bladefailure under certain patterns of vibration. This scenario illustrates how decisionsthat are made at remote distance from the user interface in a system can have animpact on the way that the users behave. If the engine had still been certified, andboth the airline and the flight crew had known that this was a potential (even ifvery rare) problem, they could have included a checklist to deal with it in theQuick Reference Handbook (QRH) that is used by all pilots to deal with knownsituations, such as smoke in the cockpit.
Organizational Level Issues
The B737-400 was what is known as a glass cockpit aircraft, in which theinformation is presented on digital displays rather than the vast array of analogueinstruments and electro-mechanical displays that appeared in the cockpit of itspredecessor, the B737-300. The airline (BMA) did not have a glass cockpit flighttraining simulator for the B737-400, so pilots could only gain experience in usingthe new glass cockpit when they were actually flying it (i.e., on the job). The onlytraining the pilots were given about the B737-400 was a 1-day audio–visualconversion course.
ATC offered the pilots two places to land. On company instructions, they chose toland at East Midlands airport, which was on their flight path, and the closest airport.This reduced the amount of time that they had available to reflect fully on thedecisions and actions taken so far to deal with the engine problems. While the pilots
Appendix: The Kegworth Air Accident (1989) 413

were trying to get ready for descent and landing, they were also in receipt of regularcommunications from ATC, had to talk to the operating company (BMA), keep thepassengers informed of the situation, and complete the appropriate checklist inpreparation for landing with one engine. The problem was made worse by the factthat the First Officer struggled to reprogram the Flight Management System (FMS)successfully with the details needed for landing at East Midlands airport. The waythey had to use the FMS was unusual and rarely practiced. This is another area wherethe lack of appropriate recurrent training contributed to the accident.
Flight Crew Level Issues
During the flight the pilots announced to the crew and passengers that there hadbeen some trouble with the right engine but it had now been shut down. Whilesome passengers could see the evidence of an engine fire, they did not inform thepilots that they had shut down the wrong engine. This appears to be an example ofthe problem of social distance, where the passengers perceive the pilots as beinghighly trained professionals, so they must know what they are doing, which meansthat the passengers do not feel in a position to correct them. The smell of smokehad dissipated by the time the announcement was made, too, which may also havehad an influence on the passengers’ thinking.
Three members of the cabin crew also reported having seen evidence of the firein the #1 engine but they did not report this to the pilots. This seems to have been afailure in what is called Crew Resource Management, a procedure designed toensure that all the members of a flight crew (pilots and cabin crew) communicatewith one another and work together as a team. So the cabin crew should not havefelt that there was a large social distance between them and the pilots, and shouldhave not felt intimidated about telling the pilots about what they had seen eventhough it appeared to contradict what the pilots had said. This could have beenattributed to a lack of CRM training.
Cockpit Level Issues
The first indication that there was a problem with the engines came when the flightcrew felt excessive vibrations in the aircraft and detected smoke in the cockpit.When both pilots were interviewed after the accident, neither could recall havingseen any indication of the abnormally high vibration levels on the EngineInstrument System (EIS). The Captain noted that he rarely scanned the vibrationgauges because he had found them to be unreliable in other aircraft in the past.Experts, like pilots, have a highly developed mental model of the world in whichthey normally operate, and this helps them to perform the tasks they are supposedto. In pilots, this mental model will help guide where they need to look to findappropriate information about the current state of the aircraft. In this case, the
414 Appendix: The Kegworth Air Accident (1989)

Captain appears to have eliminated the vibration gauges from his mental model,because he has found that they do not provide any useful information (becausethey are unreliable). If the captain had looked closely at the EIS, he may haveobserved information about the engines that would have changed how the flightcrew dealt with the engine problems.
Technology Issues
The EIS which was fitted to the B737-400 used digital rather than analogue displays.A subsequent survey showed that nearly two-thirds of BMA pilots believed that thenew EIS was not effective in drawing their attention to rapid changes in the engineparameters, and nearly three-quarters preferred the old EIS. Thus, the systemdesigners of the EIS and the training could be deemed to have contributed to theaccident. It appears that the pilots of BMA (at least) were not involved in carryingout any evaluation of the new EIS before they had to use it in flight.
External Issues
When the aircraft was in sight of the airport, the #1 engine finally failed completely.There was not enough time to restart the #2 engine, and the aircraft ended up landingon the M1 (one of the UK’s main motorways). This road had had noise abatementembankments (small hills) put up to shelter the surrounding land from motorwaynoise. This caused the plane to bounce, and probably compounded the crash.
Summary
The formal accident investigation attributed the cause of the accident to pilot error.As you look through the description of what happened, and the list of contributoryevents, you should start to appreciate that maybe it was a series of mistakes, errors,and bad luck from a wide range of people who were part of the broad system.During a normal flight there are several things happening at the same time atdifferent levels within the air transport system, and the flight crew has to deal withmany of them. In the vast majority of cases, all the tasks are performedsuccessfully, and the flight arrives safely at its destination and in a timely manner.It is often only when things go wrong, however, that you really begin to understandjust how complicated getting a plane full of passengers from its original airport toits destination can be.
Reference
Besnard, D., Greathead, D., & Baxter, G. (2004). When mental models go wrong.Co-occurrences in dynamic, critical systems. International Journal of Human-Computer Studies,60(60), 117–128.
Appendix: The Kegworth Air Accident (1989) 415

Glossary
ABCS Anthropometric, Behavior, Cognition, and Social factors: the high-levelconstructs which are useful for organizing the knowledge about people that isrelevant to system design.
ACT-R A cognitive architecture used to model human cognition.
Aesthetics Relates to the characteristics of an object or system that make itpleasurable to use. Sometimes called Esthetics.
Affordance The intrinsic property of an object that suggests actions that can beperformed with it, e.g., a handle affords grasping and pulling.
Anthropometrics The study of the shape of the body and how it influences whatis designed. It takes into consideration the physical characteristics of intendedusers such their size and their muscular strength.
Attention A term that refers to the selective nature of perception which functionsin such a way that at any given time a person focuses on some feature(s) of theenvironment to the exclusion of others.
Attribution theory Describes the tendency of people to attribute their ownactions to external situational causes, whereas external observers attribute thesame actions to causes that are internal to the person carrying out the actions.
Availability bias Arises because users tend to recall those items that are easier torecall even when they may not be most representative of a particular situation.
Blunt end The part of the system that is furthest away from where the userinteracts with the technology. Normally refers to the level at which regulationsand laws are applied. Often used in contrast to the sharp end.
Closed loop behavior A pattern of behavior in which users take some actions,and look for feedback on those actions before deciding how to proceed. Alsoreferred to as feedback control.
Cognitive architecture A framework that supports the modeling of humaninformation processing under different conditions. Cognitive architecturesinclude mechanisms designed to help model human cognition.
F. E. Ritter et al., Foundations for Designing User-Centered Systems,DOI: 10.1007/978-1-4471-5134-0, � Springer-Verlag London 2014
417

Cognitive dimensions (of notation) A common ontology used to name specificaspects of design as well as the associated design trade-offs.
Cognitive dissonance Cognitive dissonance occurs when a person holds two ormore beliefs that are in conflict at one time, as in when people do not get whatthey want.
Cognitive modeling Using computer programs to simulate human behavior,usually within the framework of a cognitive architecture.
Cognitive task analysis (CTA) An extension of traditional task analysis tech-niques to facilitate the collection of information about the mental processes thatunderpin observable task performance. Usually comprises several methods.
Computer supported co-operative work (CSCW) The study of how peoplework together using technology.
Cones A type of light receptor cell located on the retina. Cones are sensitive tocolor. See also Rods.
Confirmation bias Arises because users tend to look for information that con-firms their understanding of a particular situation, and hence have difficultyseeing things that conflict with their understanding of the world.
Content strategy Content strategy relates to the planning for the creation, pub-lication, and governance of content that are both useful and usable. It coverswhich content to publish as well as why. Mostly used when referring to the web,but applies to all media, platforms, and devices.
Co-operative principle Basically refers to trying to say the right thing at the righttime—the co-operative principle can also be seen as a description of the waythat people normally conduct conversations. See also Grice’s maxims.
CREAM (Cognitive reliability and error analysis method) Method for itera-tively modeling and analyzing erroneous performance in a prospective or ret-rospective manner. The CREAM assumes that the context is a major influenceon human performance. See also THEA.
Decibel A logarithmic measure of sound pressure: a tenfold increase in soundpressure (e.g., 10–20 dB) sounds twice as loud.
Declarative memory A hypothesized store which holds facts or statement aboutthe world, e.g., the earth is flat.
Designers People who design systems or technology.
Diffusion of social responsibility When a group of people are held jointlyresponsible for dealing with a particular situation, the responsibility diffusesacross people: several people may decide not to do anything in the belief thatsomeone else in the group will.
418 Glossary

Distributed learning Learning that occurs when practice is distributed over timein such a way that there are gaps between practice sessions.
Efficiency A system property that can be measured through its use of resourcessuch as processor time, memory, network access, system facilities, disk space,and so on.
Einstellung Einstellung is related to Functional Fixedness but refers to the situ-ation where a person gets fixated on a strategy to solve a problem.
Ergonomics The field that is concerned with providing a good fit between peopleand their work or leisure environments. Often used interchangeably with humanfactors.
Error The part of the system state that may lead to a subsequent failure.
Esthetics Relates to the characteristics of an object or system that make it plea-surable to use.
Event tree An inductive method for analyzing errors using a graphical binary treerepresentation.
Explicit memory A hypothesized store of items that can be explicitly reported.Most declarative information can be explicitly reported. Often used in contrastto Implicit memory.
Extrinsic motivation Motivation that arises from factors outside the individual,such as being paid to do something.
Eye-tracking A method for recording where the user’s eyes are looking using adedicated device (an eye-tracker).
Failure Something that occurs when the service that is delivered by a system orcomponent is judged to have deviated from its specification.
Fault The adjudged cause of an error within a system.
Fault tree A deductive method for analyzing the causal factors that contribute toan error or accident, using a graphical tree representation.
Feeling of knowing Refers to the feelings an individual has about their knowl-edge on a particular topic, and particularly whether or not that knowledge existswithin memory. It normally relates to making judgments either prior torecalling the target item, or after failing to recall it. The focus is on whether anindividual feels that they know the answer, rather than what the answer actuallyis. Often used in the context of metacognition.
Field experiments Field experiments are trials of technologies in real worldsettings.
Field studies Evaluations that are carried out in the field, that is, in real worldsettings.
Glossary 419
Figure and ground Figure is the term used to refer to the objects being focusedon; ground is the rest of the perceptual field.
Fitts’ law A method used to predict the time it takes to move a pointer to a target.
Flesch reading ease score A calculated value that reflects the readability of aselected piece of text.
Forcing function A mechanism for physically constraining actions to prevent theuser from proceeding to the next step in task performance. To start most cars,for example, you are forced to put the key into the ignition.
Formative evaluation A type of evaluation that is used to help designers refineand form their designs. The focus of formative evaluation is to identify prob-lems and potential solutions.
Fovea A small area of the retina (covering about 2� of visual arc). This is the areaof clearest vision.
Framing effects Refers to the fact that the way that potential outcomes of aparticular situation are presented (framed) has a powerful influence on howusers choose between alternatives.
Functional fixedness Functional fixedness occurs when a person becomes fixatedon a particular use of an object.
Functionality What the system does. Usually specified by the functionalrequirements.
Fundamental attribution error The belief that our own behavior can beattributed to extrinsic factors in the environment, and that the behavior of othersis attributable to their intrinsic properties (e.g., they are a bad person).
Fundamental attribution error of design The belief, held by designers, thatusers act and behave in the same way as designers when using technology.
Generic error modeling system (GEMS) An approach to modeling errors basedon interpretation, planning, memory, and acting.
Gestalt principles of visual grouping Can be used to explain how groups ofobjects are interpreted. The principles were developed as a rebellion against thesimplistic notion that perception could be structurally analyzed into its com-ponent parts, and that complex ideas were the result of associating togethersimpler ones.
GOMS (Goals, operators, methods, and selection rules) A method of taskanalysis that can be used to describe the details of error-free, expert task per-formance using Goals, Operators (actions), Methods (procedures), and Selec-tion rules (to choose between methods).
420 Glossary

Grice’s maxims The four basic maxims underlying the co-operative principle.These maxims make strong suggestions about how people should communicatewith other people. When these suggestions are followed, communication ismore successful and more satisfying.
GUI (Graphical user interface) A user interface that is made up of graphicalobjects, such as icons.
Gulf of evaluation The gap between the concepts used in the physical system andthe user’s psychological representation of those concepts.
Gulf of execution The gap between the user’s (psychological) goals and inten-tions and the physical actions they need to take to achieve those goals.
Habituation Becoming so used to a stimulus that it becomes unnoticeable. (Thisis very similar to desensitization.)
Haptic devices Devices which utilize touch and tactile feedback. Most hapticdevices only support interaction using the hands or fingers, even though userscould use any part of their body. There is a growing number of devices thatsupport input using the feet.
Hard mental operations One of the cognitive dimensions. It relates to the factthat users find some kinds of operations harder to perform than others, so theyprefer easier mental operations.
HCI (Human–computer interaction) The study of how people interact withtechnology. The abbreviation is also sometimes used to refer to Human–Computer Interface.
Heuristic evaluation A relatively informal way of analyzing the usability of aninterface design in which a small select number of people are asked to judge thedesign based on a set of guidelines or principles together with their ownknowledge.
Hicks law An equation that is used to describe the time to make a decision basedon the number of available choices. Also called the Hick–Hyman Law.
Hidden dependencies One of the cognitive dimensions. They show how visiblethe relationships between design components are, describing the number anddirection of those relationships.
Hierarchical task analysis (HTA) A method for analyzing in detail how tasksare performed by decomposing goals into subgoals. It is often described interms of decomposing tasks into sub-tasks.
Human factors The field that is concerned with providing a good fit betweenpeople and their work or leisure environments. Often used interchangeably withErgonomics.
Glossary 421

Human-centered design (HCD) An expansion of the User-Centered Designapproach which extends the focus from the user’s interaction with the system toconsidering how human capabilities and characteristics are affected by thesystem beyond direct interaction with the interface or system itself.
Iconic memory A store where perceptual images are held for a short period oftime. Visual iconic memory, for example, holds only a few items and thesedecay fairly quickly.
Ill-structured problem Some problems are more difficult than others becausethey are ill-structured, that is, they are not clearly defined in terms of states,goals, and actions that are available. Also called ill-defined or messy problems.
Implicit memory A hypothesized store of items that cannot be explicitly repor-ted. Most procedural information cannot be explicitly reported. Often used incontrast to Explicit memory.
Information Information can be thought of as organized data.
Information architecture A term used to describe how on-line information isstructured to support usability by both its creators and its users.
Information scent Information scent is what leads a user to spend more timeexploring a web page (or menu item) to find what they are looking for becausethe content effectively smells like the thing they are looking for. The idea is tomake sure that objects and links appear to smell like the content they containand do not smell like content that they do not contain.
Insight problems A class of problems where novel behavior or understanding isrequired to solve them. Sometimes called ‘‘Aha’’ problems.
Interaction design (IxD) An approach to designing interactive products andsystems to support the way that people interact and communicate.
Intrinsic motivation The motivation to do something that arises directly from aperson’s inherent needs and desires.
Introspection The examination of your own mental experiences. It can be asource of insight but has been proven to be unreliable in general.
Just noticeable difference (JND) The smallest change in a perceptual stimulusthat is noticeable by a user.
Keystroke level model (KLM) A simplified version of GOMS. It provides aquick and approximate way to calculate how long users will take to perform acognitively manageable (unit) task.
Kinesthesis Kinesthesis (or the kinesthetic sense) generates an awareness of staticand dynamic body posture based on information coming from the muscles,joints, and skin, along with a copy of the signal sent to the motor system.
422 Glossary

KSA (knowledge, skills, and attitudes) Individual (or team) competencies thatinfluence behavior.
Learnability How easy it is to learn to use the system.
Learning curve A graphical representation of performance that is assumed toreflect the learning that has occurred through practice. The shape of the curvereflects how response time changes with practice on a task. The curve is oftendescribed by a power law function and sometimes as an exponential function.
Loftus effect Refers to the fact that when people are presented with misleadinginformation between the encoding of another piece of information and its laterrecall, the recall of the original information is altered by misleading informa-tion. Often referred to as the (Loftus) misinformation effect.
Long term memory An unlimited capacity store for items that have been pro-cessed or interpreted and permanently encoded.
Maintainability How easy a system is to maintain and upgrade over its lifetime.
Massed learning Learning that occurs when the practice is relatively or com-pletely located within a single time period.
Mental model A user’s mental model is a representation of some part of theworld that can include the structures of the world (the ontology of the relevantobjects), how they interact, and how the user can interact with them.
Metacognition Literally cognition about cognition. It includes knowledge aboutwhen and how to use specific strategies for problem solving and learning. Seealso Feeling of knowing.
Millisecond (ms) Abbreviated ms, this is one thousandth of a second.
Mistake A failure in planning. Refers to an action that was performed correctlybut in the wrong circumstances.
Mnemonic Mnemonics are techniques that help to increase the amount or qualityof information that can be stored, or the speed at which can it be retrieved.
Model human processor (MHP) One of the first simple integrated descriptionsof psychological knowledge relating to error-free human performance in HCI.
Need for cognition Refers to the fact that some users like to think, and seek outopportunities to think, problem solve, and learn.
Normative behavior A term used to describe what people should do, rather thanwhat they really do.
Open loop behavior A pattern of behavior in which users anticipate what willhappen next in a particular situation, and take actions on that basis. There islittle or no need to monitor the results of the actions. Also described as feed-forward control.
Glossary 423

Operators Generally used to refer to users who work in industrial settings such asnuclear power stations and chemical plants.
Parafovea The area of the retina that immediately surrounds the fovea. It pro-vides a lower level of visual acuity than the fovea.
Periphery The area of the retina beyond the parafovea. Visual acuity is at itslowest in the periphery and vision is only in black and white.
Pop-out (effect) Refers to the effect that some stimuli appear to ‘pop out’ of avisual field based on color, size, shape, or other unique and easy to distinguishfeatures.
Post-completion errors Errors that arise when the main goal for a task has beenaccomplished, but the goals of the subtasks have not.
Power law of learning A mathematical description of how learning takes placeover time. Usually represented by an equation of the form RT = aP-b ? c,where RT is the response time for a particular trial, P, and a, b, and c are allconstants.
PQ4R A method of studying designed to help readers retain more from what theyread. It stands for Preview, Question, Read, Reflect, Recite, Review.
Premature commitment One of the cognitive dimensions. It relates to the situ-ation where design decisions have to be made before all of the requiredinformation is available.
Primacy effect Refers to the fact that the items presented at the start of a list ofitems to be learned are subsequently better recalled than items in the middle ofthe list in a free (unprimed) recall situation.
Priming Used with respect to learning to refer to the presentation of a particularexperience which makes the responder more sensitive or responsive to a widerange of stimuli.Used with respect to memory to refer to the triggering of therecall of related items, e.g., ‘‘yellow’’ would prime the recall of ‘‘banana,’’‘‘custard,’’ and other items that are yellow in color.
Problem solving Problem solving essentially involves working out how to getfrom the current state of affairs to the goal that you are trying to achieve bytaking appropriate actions. More formally, this can be described as applyingoperators to states to reach a goal.
Procedural memory A hypothesized store which holds procedures that encap-sulate how to do a particular task, such as how to move a knight in chess.
Programmable user models (PUMs) A psychologically constrained architecturewhich an interface designer programs to simulate a user performing a range oftasks with a proposed interface.
424 Glossary

Recency effect Refers to the fact that the items presented at the end of a list ofitems to be learned are subsequently better recalled than items in the middle ofthe list in a free (unprimed) recall situation.
Recognition-primed decision making (RPDM) An approach to decision makingwhich suggests that experts do not do problem solving, but that they recognizethe particular situation (through perception) which directly leads them to makedecisions about the correct actions to take.
Reliability When referring to evaluation, reliability describes the ability of aparticular measure to produce consistent results when the same things aremeasured under different conditions. Often used in the context of test–retestreliability.When referring to systems, it refers to a dynamic property of theeventual system which relates to the ability of the system to function understated conditions for a specified period of time.
Repetitive strain injury (RSI) A condition arising from upper limb disorders.
Retrieval biases Describes the inherent biases within people that affect what theyrecall from memory. They include primary effects, recency effects, and the vonRestorff effect.
Rich pictures A component part of Soft Systems Methodology. Used to representgraphically the work context based on the roles, responsibilities, and concernsof the system stakeholders.
Risk-driven incremental commitment model A revised version of the spiralmodel which encourages incremental development of systems in an ongoingspiral process comprising requirements specification, technical exploration, andstakeholder commitment. At each stage the system development is assessed forrisks to the success of the overall system.
Rods A type of light receptor cell located on the retina. Rods are very sensitive tomotion. See also Cones.
Role-expressiveness One of the cognitive dimensions. It describes the extent towhich a system reveals the goals of the system designer to the user.
Satisficing A method that finds a reasonable solution taking into consideration thecosts of finding a (better, more optimal) solution.
Search engine optimization The process of increasing the visibility of a webpage or web site in a search engine’s organic (unpaid) search results.
Sensitivity A term used to describe how much a particular measure will change asother factors change.
Serial position curve A graphical representation of how the position of an item ina list affects its recall from memory. Often used to help show primacy andrecency effects.
Glossary 425

Sharp end The part of the system where the user interacts with the technology.Sometimes used in contrast to the blunt end.
Short term memory (STM) A relatively limited capacity store for items thathave received a limited amount of processing or interpretation. STM issomewhat analogous to the registers in a computer.
Signal detection theory (SDT) A mathematical theory of the detection ofphysical signals based on the assumption that sensitivity to a signal depends onits intensity, the amount of noise, the user’s motivation, and the criterion set forregistering responses to the signal. Sometimes referred to as the Theory ofSignal Detection (TSD).
Slip A failure in the execution of an action. Refers to performing the wrong actionin the right circumstances.
Social capital A concept that highlights the value of social relations and the roleof cooperation and confidence in establishing trusts and norms to get collectiveresults.
Socio-technical systems Systems that involve a complex interaction betweenhumans, machines, and the environmental aspects of the work system. (Now-adays this description applies to most enterprise systems.)
Soft systems methodology Essentially an analytical approach, mostly focusingon organizational aspects of the system. It does not purport to support systemsdesign.
Spiral model A model of the system development lifecycle, which uses an iter-ative development process.
S–R (Stimulus–response) compatibility Refers to the fact the response should becompatible with the stimulus that causes it. This is typically exploited in theway that physical aspects of an interface (e.g., buttons) and displays (e.g.,GUIs) are mapped onto the world that they are representing. It also explainswhy the call buttons for elevators are situated with the ‘‘up’’ button above the‘‘down’’ one.
Stimulus–response mapping The mapping between the stimulus that the userssee to the responses that they produce. Mappings that are simple and similar toprevious mappings lead to faster, less error-prone interactions.
Subitizing The ability to determine directly the number of objects the user islooking at without counting them. This only works for small numbers ofobjects.
Summative evaluation A type of evaluation used to assess the success of thefinished system or product, summarizing its overall impact and effectiveness.
426 Glossary
Task-action mapping Describes the relationship between the domain of the taskand the domain of actions. Ideally there should be a simple and direct mappingbetween the two.
THEA (Technique for human error assessment) Method for analyzing erro-neous performance using an iterative process. Like the CREAM it assumes thatthe context is a major influence on performance.
THERP (Technique for human error rate prediction) An approach to mod-eling errors in human performance. The probability of errors occurring isconditioned by performance shaping factors as a way of taking into account thecontext in which the error happens.
Threshold The smallest energy level in a stimulus that can be detected by a user.
Tower of Hanoi A task used to study problem solving. It has three pegs or posts,and disks, typically three to eight, but in theory there could be any number ofdisks.
Transfer (of learning) Where learning on one task has an effect (either positiveor negative) on a task that is performed later.
Upper limb disorders (ULD) Aches, pains, tension, and disorders that involveany part of the arm from fingers to shoulder or neck. They include problemswith the soft tissues, muscles, tendons, and ligaments, as well as with thecirculatory and nerve supply to the limbs. Often caused or exacerbated by workand, particularly, repetitive work. They lead to conditions such as repetitivestrain injuries.
Usability A multi-faceted concept used to represent how easy a system is to use,how easy it is to learn to use, how safe it is, how effective (and efficient) it is,and how satisfying it is to use.
Usability testing A term usually restricted to describe the evaluation of theusability of a system under controlled (laboratory) conditions.
User experience (UX) The user’s perceptions and responses that result from theuse or anticipated use of a product, system or service. Some people regard UXas representing a broader view than usability.
User-centered design (UCD) An approach that focuses on the user’s needs,carrying out an activity/task analysis as well as general requirements analysis,performing early testing and evaluation and designing iteratively.
Users Generally refers to people who use artifacts (systems, devices, and so on).There are several types of user, including operators, pilots, and drivers.
Validity A term used to refer to whether the particular measure that you are usingis really measuring what it is supposed to be measuring. There are several typesof validity.
Glossary 427

Viscosity One of the cognitive dimensions. It reflects how hard it is to changesomething within a system.
von Restorff effect Refers to the fact that a single item that is made distinctive ina list of otherwise similar items will be easier to learn and subsequently recall.
WIMP (windows, icons, menus, and pointer) A shorthand description for a typeof graphical user interface, using the elements that appear in that interface.Sometimes used interchangeably with GUI, but, strictly speaking, not all GUIsare WIMPs.
Working memory A hypothesized temporary store (an audio or semanticscratchpad) with associated mechanisms for rehearsing, refreshing, and usingthe stored information. It also includes a mechanism of central or executiveattention that regulates the contents of that store based on performing a task.
428 Glossary

Index
Symbolsb Beta, threshold, from signal detection theory,
84, 85H theta, k lambda, 84
AAbbreviations, 126ABCS, v, xxv, xxvi, 3, 16, 23, 24, 277, 281,
386–391, 410Accessibility, 394Accident, 9, 13, 21, 46, 176, 281–283, 286,
287, 413–417Accountability, 240, 303Acoustical loop, 127Activity theory, 45, 326ACT-R, 23, 24, 43, 126, 134, 140, 392,
395–397Acuity, 86, 87, 92Adaptability, 46, 238, 290Aesthetic, 419. See also EstheticsAffordances, 19, 58, 59, 237, 347Aids to memory, 131, 336, 370, 371, 392, 393,
395, 397Aircraft, 9, 10, 13, 14, 18, 21, 22, 28, 49, 84,
111, 145, 153, 154, 160, 169, 176,226, 283, 286–288, 301, 345, 405,413–417
AirportDulles, 173London, 173Philadelphia, 169, 170
Air traffic controller(s) and control (ATC), 13,22, 226, 283, 287
Alarm, 44, 83–85, 112, 116, 319, 387Alerts, 111, 112Allocation of function, 39, 311Americans with Disabilities Act, 15Anthropometrics, 16, 18, 28, 50, 59, 76, 77,
343, 351, 386, 387, 389
implications for system design, 17, 57, 82,85, 91, 98, 111, 115, 136, 144, 155,173
Apple design guidelines, 46Arms, 18, 60, 67, 92Arthritis, 58, 287Assessment, 35, 47, 118, 217, 319, 388Assessment of Repetitive Tasks
(ART) tool, 60Association for Computing Machinery
(ACM), 45Astronauts, 74, 267Attention, 8, 9, 20, 22, 60, 85, 91, 113, 118,
123, 124, 137–141, 144, 146, 275,276, 286, 287, 301, 318, 341, 343,371, 388, 410
divided, 141implications for system design, 85, 144Wickens theory of attentional resources, 139
Attributions and attributional style, 230, 231Attribution theory, 10, 38, 228, 230–232, 246Audio, 362, 387Audio–visual, 9, 362, 411, 413Audition/auditory, 74, 75, 82, 106, 109, 119,
158Auditory system, 82, 106Authority figures, 236, 244, 246Automatic usability inspection, 11Automation, 21, 301Automation deficit, 143, 144Automobiles, see Car interfaces, drivingAvailability bias, 189Avatar, 255Awareness, 38, 62, 95, 238, 286, 360, 389
BBacktracking, 177Behavioral approach, 204, 211, 214, 218, 246,
343, 408
F. E. Ritter et al., Foundations for Designing User-Centered Systems,DOI: 10.1007/978-1-4471-5134-0, � Springer-Verlag London 2014
429

implications for system design, 85Better products, 11Biases, 84, 85, 124, 134, 151, 158, 166, 177,
188, 189, 193, 197, 198, 290, 291,373, 389
Biases in reasoning, 193, 195Blind, 8, 75, 90, 111Blind spot, 389Blunt end, 288, 302Bobby (web site testing tool), 394Breakout boxes, 181, 193–196Brightness, 91, 93, 95, 102Button, 5, 18, 20, 59, 65, 68, 70, 72, 75, 148,
151, 157, 171, 183–188, 201, 323,339, 344, 354
CCalibrated, 171, 195, 198, 372Camera, eye like, 86, 88, 101, 117, 371Capabilities, 4, 13, 20, 33, 39, 46, 50, 57, 58,
76, 119, 171, 184, 196, 231, 385,387, 390–392, 405, 407
Car interfaces, 19, 289Categories, 50, 64, 69, 119, 124, 129, 185,
286, 292, 294, 362, 393Caterham Formula 1 team, 58Cause–effect, 359CD writer, 170Cell phone, 3, 8, 11, 138, 173, 303, 314, 354,
387Channels, 74, 82, 272Checklists, 9, 8, 22, 175CHI conference, 27Choice shift in decision making, 226Circuit schematic, 167Citeseer, 11Classical ergonomics/interface ergonomics, 37Classification, 28, 84, 150, 167, 292, 294, 328Clearview Hwy font, 206Closed loop behavior, 142, 153CMN-GOMS, see KLM GOMSCockpits, 9, 58, 226, 287, 345Cockpit resource management, 226, 287,
415–417Cocktail-party effect, 139Cognitive, 16, 20, 21, 23, 24, 28, 39, 40, 42,
83, 100, 105, 125, 138, 145, 149,159, 181, 213, 231, 242, 281, 288,294, 311, 317, 320, 324, 325, 328,329, 336, 343, 349, 350, 386, 388,393, 395, 397
approach, 350architecture, 23, 24, 42, 149, 193, 392,
395, 408
dimensions, 51, 335–343hard mental operations, 337, 341, 342hidden dependencies, 336, 337premature commitment, 337, 340role-expressiveness, 337, 339turning cognitive dimensions into a
methodology, 342viscosity, 337, 338what is omitted, 343
Cognitive dissonance, 231Cognitive ergonomics/ systems engineering,
39, 145Cognitive modeling, 42, 52, 159, 326Cognitive reliability and error analysis method
(CREAM), 294, 295, 297–300, 302Cognitive systems engineering (CSE), 39, 40,
410Cognitive task analysis (CTA), 317–319,
329components, 317example application, 318
Cognitive walkthroughs, 318Coins, 7, 8, 101Collision, 284Color
blindness, 95perception of, 95, 100systems, 95, 96vision, 94, 95
Command-line, 33Commands, 7, 124, 131–132, 142, 151, 155,
157, 242, 277, 320, 321, 328, 344Common ground, 201, 243, 256Communicate, 9, 21, 22, 25, 26, 70, 72, 74,
201, 202, 204, 212, 218, 219, 226,234, 237, 245, 246, 248, 253, 256,262, 268, 270, 271, 287, 299, 318,386, 406
Communities, 43, 226, 240, 259, 268, 296Communities of practice, 268Competent/competencies, 153, 195, 234, 319,
329Complexity, 198, 347, 398, 408Comprehend, 133, 136, 205, 208, 209, 217,
218Computational model, 192, 204, 272–273, 276Computational models of social behavior, 272,
276Computer-based prototypes, 367Computer–Human Interaction, 45Computer–Human Interaction Special Interest
Group of the Association for Com-puting Machinery (ACM-SIGCHI),27
Computer-mediated communication, 34, 219
430 Index

Computer-supported co-operative work(CSCW), 41, 219, 276, 248
Concurrency in system development, 402Concurrent, 140, 370, 371, 401, 403Cones [eye], 89, 91, 95, 207, 211, 217, 372Confidence judgments, 171. See also Feeling
of knowingConfirmation bias, 189, 193Confuse, 8, 20, 45, 48, 73, 111, 134, 173, 283,
301, 340Conscious, 4, 139, 146, 348Consciousness, 8, 152, 389Considerations when choosing a TA method,
326Consistency, 47, 135, 320, 329, 337, 339, 340,
348, 358, 365Construct validity, 358, 359Content
strategy, 315, 316validity, 359
Context, 15, 25, 34, 40, 44, 45, 63, 85, 105,115, 119, 127, 134, 136, 169, 193,198, 211, 212, 218, 220, 225, 226,235, 236, 244, 247, 264, 266, 267,270, 281, 282, 286, 287, 291, 293,299, 300, 309, 318, 319, 326, 327,336, 349, 356, 360, 361, 363, 369,374, 386, 388, 403, 404, 407–409
Contextual design, 266Contrast, 92–94, 102, 207, 209Controls, 5, 18, 37, 75, 187, 288, 322, 344,
347, 348, 387Conversations, 108, 109, 139, 201, 203, 254,
256, 326, 361, 389Co-operative
evaluation, 335, 366principle, 203, 204
Co-pilot, 286, 287. See also PilotCorrect rejections, 84, 120Cost savings, 110CPM-GOMS, 320, 322Creating content, 216CRM, see Cockpit resource managementCrosstalk journal, 406CTA, see Cognitive task analysisCultural effects, 265, 275Culture, 17, 22, 34, 45, 187, 218, 227, 235,
240, 247, 253, 264, 265, 267, 275,303, 391, 406
Dd’ (dprime), 84Danger, 13, 85, 118, 285, 302, 313, 339, 348,
391
da Vinci surgical system, 63DBLP, 11Decibels (dB), 108Decision making, 9, 37, 122, 42, 133, 165,
176, 184, 188, 190–193, 197, 198,206, 216, 225–228, 228, 233, 234,245, 247, 274, 317, 389, 410
attributions and attributional style, 230,231
implications for system design, 192known influences on, 176, 188majority and minority effects, 233often not rational, 184social effects on, 228social responsibility effects, 228
Decision-support, 192, 318Declarative memory/knowledge, 23, 128, 129,
140, 146, 151, 156, 267, 320, 328,393
Delivering content, 215, 218Dependability, 282, 318Depth cues, 101, 102, 105Descriptive behavior, 196Descriptive social models, 267Design, 4, 6, 7, 9, 10, 12, 15, 16, 18, 24–28,
33–35, 37, 38, 42, 44, 45, 47, 49,57, 76, 124, 132, 136, 142, 144,149, 155, 160, 167, 169, 171, 173,179, 181, 183, 185, 187, 188, 192,196, 197, 201, 204, 206, 211, 218,231, 258, 261, 273, 287, 300, 313,326, 335, 342, 344, 346, 349, 355,359, 365, 368, 389, 391, 395, 406
Design of content, 215–218content strategy, 215creating content, 216delivering content, 218information architecture, 216structuring content, 217
Design patterns, 406Designer, 3–5, 8, 10, 11, 22, 24, 33, 34, 37, 42,
46, 47, 49, 57, 58, 65, 67, 74, 81,93, 105, 112, 134, 166, 182, 192,196, 309
Designers are stakeholders too, 405Development, 4, 22, 33, 37, 39, 44, 46, 49, 60,
169, 188, 216, 238, 240, 244, 269,301, 309, 317, 329, 348, 353–357,364, 367, 377, 386, 390, 398–400,402, 403, 405–407, 409
Devices, 10, 13, 19, 20, 28, 36, 59, 62, 63, 65,66, 70, 75
cell phone, 314, 330X-ray machine, 13other, 72
Index 431

Diabetes, 74, 75Diagnose, 13, 143, 166, 227, 365Dialogues, 132, 142, 202, 371Differences, individual, 34, 40, 127, 181Diffusion of social responsibility, 228, 230,
246Digital Equipment Corporation (DEC), 41Disabilities, 17, 63Disasters, 22, 28, 247, 284, 345, 346Discriminate, 8, 86, 94, 95, 97, 111, 142, 370Discriminating sounds, 111Distinctive, 112, 125, 313, 319Distinguish, 12, 62, 63, 150, 282, 310, 320,
370Distracted, 22, 98, 145, 286, 287Distributed learning/practice, 133, 152Diversity, 26, 236, 238, 239, 366Divided attention, 141Driving, 70, 128, 139, 141, 146, 185, 310, 409Dulles airport, 173Dunbar number, 261, 262
EEar, 106–108, 110, 117E-commerce, 213Eclipse, 68, 77Ecological validity, 290–292, 358, 360, 361Effectiveness, 48, 357, 359Effective technical and human implementation
of computer-based systems (ETH-ICS), 41
Efficiency, 47–49, 225, 313, 365, 369of a system, 48, 357
Efficient, 3, 10, 48–50, 52, 150, 178, 219Effort, 4, 15, 20, 143, 145–147, 175–176, 189,
192, 218, 238, 326, 338, 344, 356,372, 374–376, 400, 409
Einstellung effects, 177Ejector seats, 18Elbows, 10, 36, 142Elderly, 8, 58, 59Email, 10, 36, 142, 180, 188, 189, 218, 229,
232, 242, 246, 257, 261, 262, 276why it has gone awry, 232
Emergencies, 228, 413–417Emergent, 269, 301, 392Emotions/feelings, 44, 373Empirical, 313, 261, 392
evaluation, 353Encoding effects, memory, 128, 134Engineering, 225, 353, 385Enjoyable, 3, 50Entertainment, 181, 226EPIC cognitive architecture, 396
Episodic memory, 140Ergonomics, 17, 34, 35, 38, 46, 96, 284, 314,
319Errors, 204, 208, 281–285, 288, 290, 292–297,
299, 320, 322, 324, 325, 341, 343,347, 365, 369, 370, 375, 387, 388,391, 392, 395, 397, 410
analyzing, 296, 300archive data, 291ergonomics, 38event trees, 296fault trees, 296field-based observation, 290implications for design, 142, 300introduction to, 3, 281keystroke rate, 324laboratory-based experiments, 289latent, 282omisions, 292post-completion, 180, 181reduction, 287selecting the most appropriate data col-
lection method, 289–291studying, 12, 288–292taxonomies, 292typing, 13, 64, 158, 160, 303, 395, 397usability measure, 320, 370what is, 282
Esthetics, 26–28, 45, 46, 75, 365, 205, 207,212, 419
Ethics, effective technical and human imple-mentation of computer-based sys-tems, 41
Ethics of evaluation, 376Ethnography, 41, 267Evaluate, 12, 21, 25, 34, 43–45, 50, 51, 196,
242, 262, 263, 270, 284, 292, 329,337, 344–346, 348, 350, 354, 356,358, 361, 362, 365–367, 369, 374,376, 404
Evaluation methodsco-operative evaluation, 335, 366heuristic (expert) evaluation, 365, 366usability testing field studies and field
experiments, 362, 364Evaluation study, 356, 358, 360Event tree, 296E-voting system, 65Exchange costs and benefits, 256Experiments, 4, 5, 46, 101, 114, 119, 155, 158,
184, 228, 233, 242, 261, 289, 357,364, 397
Expert, 12, 15, 20, 34, 37, 39, 45, 48, 64, 97,131, 132, 145, 147, 154, 175, 211,217, 246, 284, 290, 293, 301, 319,
432 Index

324, 329, 359, 362, 365, 366, 371,387
Expert (heuristic) evaluation, 362, 365, 366Explicit memory, 129, 130Exploration, 7, 25, 62, 66, 72, 76, 89, 135, 156,
198, 214, 234, 272, 336, 340, 392,399, 400
External validity, 358, 360Extrinsic motivation, 114, 115, 120, 243, 245,
246, 274Eyes, 74, 86–93, 95, 97, 100, 101, 105, 117,
118, 207, 211, 217, 356, 372smooth pursuit movements, 101, 226
Eye movements, 372Eye-strain, 60Eye-tests, 86Eye-tracker, 88, 89, 372Eyewitness, see Loftus effect
FFace validity, 289, 359Factors affecting team performance, 234
authority figures, 235implications for design, 243mutual support and mutual surveillance,
235, 240social distance, 235, 240spatial distance, 235, 240task attractiveness, 235team competencies, 153team processes and tasks, 269team size, 236, 236team structure and composition, 235, 237
Failure, 7–9, 14, 21, 26, 49, 124, 128, 131,191, 231, 247, 260, 282, 284, 286,293, 385, 407
False alarms, 84–86, 120Fatigue, 38, 208, 288Fault–error–failure model, 282Faults, 175, 225, 282, 296, 354Fault trees, 296, 303Feedback, 13, 21, 26, 46, 48, 57, 63, 65, 66,
70, 72–75, 88, 141, 144, 343, 346,348, 355, 377
Feedforward, 141Feeling of knowing (FoK), 124, 171Field-based observation, 290Field experiments, 364, 368Field of view, 93, 94, 101Field studies, 362, 364Figure and ground, 93, 103Filter, 90, 110, 276Final system, what to evaluate, 367
Fingers, 64, 65, 110, 60, 63, 67, 69, 70, 131Fingertips, 74Fire, 9, 155, 192, 296Fire-fighting, 192Fitting the man to the job and the job to the
man (FMJ/FJM), 36Fitts’ law, 324, 325, 407Fitts list, 19, 311Fixated, 177, 179, 372Fixation (eye), 211Flesch–Kincaid reading index, 217Flexibility, 47, 48, 363, 365Flicker, 92, 96, 100Flight, 9, 36, 38, 144, 176, 226, 227, 283, 286,
413–417Focus, 25, 33, 34, 43, 44, 48, 91, 101, 166,
184, 202, 214, 225, 227, 270, 289,299, 336, 340, 343, 366
Fonts, 20, 27, 148, 206, 207, 210, 218, 221,335, 389
Foolishness, 195Forcing function, 19, 20Forgetting, 57, 128, 143, 208, 301, 338Formative evaluation, 357, 370, 377Formula 1, 58Fourier transform, 106, 108Fovea, 87, 88, 95, 389Framing effects (in decision making), 190Frequency, 11, 106–108, 110, 111, 331, 141,
205, 247, 290, 296, 357Frustration, 155, 373, 375Functional fixedness, 177, 178Functionality, 4, 14, 15, 20, 26, 27, 47, 49, 62,
74, 165, 168, 177, 208, 364, 366,367
Function allocation, 301Fundamental attribution error, 10, 24, 231
of design, 10, 231
GGames, 22, 60, 74, 101, 116, 120, 141, 142,
151, 177, 180, 242, 249, 256–258,313, 344, 359, 398, 410
Gaze, 66, 105, 118Generalities of human behavior, 386–391Generic Error Modeling System
(GEMS), 293, 294Geographic, 112, 240Geometric, 112, 146, 193Gestalt principles of visual grouping, 103–105,
138, 387Glare, 19, 82Glasses, 87
Index 433

Gloves, force feedback, 70Goal, 12, 23, 46, 147, 155, 156, 174, 175, 177,
180–182, 197, 226, 231, 236, 242,244, 246, 256, 258, 269, 274, 299,310, 314, 319, 320, 326, 336, 339,340, 344–346, 358, 363
Goal-driven, 238Goal-oriented, 326Goggles, 58, 90Golden rule, vGOMS (goals, operators, methods and selec-
tion rules), 12, 43, 318, 319, 322,328, 335, 394, 395
components, 320example application, 320
GOMSL, 320GPS, 65, 320, 326Graphic design to help reading and scanning,
27, 205Graphical user interfaces (GUIs),
33, 34, 339Graphics, 27, 45, 104, 176, 218, 338Grice’s maxims of conversation, 203–205,
219, 221, 339, 389Ground and figure, see Figure and groundGroups, 45, 119, 126, 131, 181, 214, 221, 225,
226, 228, 229, 233, 236, 238–240,242, 247, 253, 260, 262, 264, 268,272, 275, 360, 374, 387
Groupthink, 233GUI, see Graphical user interfaceGuidelines, 8, 37, 45, 46, 241, 321, 347, 356,
365, 376, 394Gulf of evaluation, 11, 345–351Gulf of execution, 11, 172, 345–351Gulfs in practice, 345Gulfs of evaluation and execution
implications for design, 346–349in practice, 345limitations of, 349
HHabituate, 62, 83, 85Haptic, 57, 63, 70, 72, 75, 101
devices, 72interfaces, advantages and disadvantages
of, 72Hard mental operations (cognitive
dimensions), 336, 337, 341–343,351
Harmonics, 108Hawthorne effect, 360, 390Hazards, 35, 287, 338
Human–computer interaction (HCI), 14, 27,45, 52, 70, 89, 230, 327, 354, 369,403, 407, 410
HCI bibliography project, hcibib.org, 27Head-mounted, 88, 117Health and safety executive (UK), 60, 61Hearing, 23, 46, 62, 64, 81, 82, 86, 106, 108,
112, 117, 127, 139, 141, 227, 301,387
Heuristic evaluation, 365, 366Heuristics, 350, 365Hick–Hyman Law/Hicks law, 68, 182Hidden dependencies (cognitive dimensions),
335–337, 342Hierarchical task analysis (HTA), 299,
314–317, 329components, 314example application, 315
Higher level visual perception, 100implications for system design, 105
Hindsight, 283, 295, 302Hits, 27, 83, 85, 292Hospitals, 227, 270, 318, 410How to encourage cooperation, 258Hue, 94Human-centered, 43, 50, 378, 405Human-centered design (HCD), 43Human-centered systems design
(HCSD), 33Human–computer interface(s)
(HCI), 4, 14, 27, 33, 45, 52, 89, 184,225, 230, 327, 369, 395, 410
Human error rate prediction, 38, 292Human error, see ErrorHuman factors, 17, 26, 27, 34, 35, 39, 45, 52,
76, 192, 276, 284, 314, 341, 369,385, 408, 409
Human–Human communication, 34, 201Human information behavior, 213Human–information seeking behavior, 213
implications for system design, 214Human–information systems, 23Human–machine systems, 40Human–robot interation, 397Human–system integration, 407
IIconic memory, 125Icons, 33, 59, 72, 93, 120, 142, 188, 203,
205, 218Identifying the dependent and independent
variables, 357Ill-structured problems, 181, 182
434 Index
Illuminate, 72, 88, 91, 92, 210Images, 86, 91, 96, 101, 105, 125, 274, 340,
395Immersion, 70, 74Immersive reality, 71Impaired, 11, 75, 82, 111, 136, 387Implications for system design, 82, 92, 142,
183, 192, 204, 211, 214, 218, 273,300, 387
social and organizational aspects, 82, 92Implicit memory, 129, 130IMPRINT, 394Incidents, 319, 364, 409Incompetence, 193, 194, 196Incubation in problem solving, 143Index of difficulty, 67Indicator, 47, 85Individual differences, 34, 40, 127, 181Informatics, 41Information
architecture, 215, 216, 220processing model of attention, 140scent, 214, 219seeking behavior, 201, 212–215
Information, 212Infrared, 90Input glove, 16Insight problems, 179, 180Instruction, 133, 135, 156, 204, 319, 324, 328,
347, 363implications for, 133, 135, 136
Instructional, 156, 177Instrument validity, 358Intelligence, 13, 24, 43, 134, 171, 358Interaction design (I9D), 33, 366, 378Interface
design, 12, 13, 26, 28, 45, 97, 119, 131,155, 160, 171, 173, 204, 214, 220,311, 313, 329, 343, 365
ergonomics, 37Interference in memory, 124Internal validity, 358, 359, 361International Standards Organization (ISO),
44, 48, 76, 98Inter-rater reliability, 361Interruptions, 21, 22, 137, 142, 143, 144, 286,
325, 361, 364Interviews, 310, 318, 326Interviews and focus groups, 190, 242, 270,
374Intrinsic motivation, 325, 343, 345
implications for system design, 115, 116Introspection, 4, 151, 370Intuitions, 365, 390
iPod, 72, 109, 189, 343Ironies of automation, 301
JJoysticks, 317, 322Judgments, see Decision makingJust noticeable differences (JNDs), 82, 83, 85
KKegworth air disaster, 9–10, 22, 281, 345, 346,
413–417Key bindings, 151, 152, 155Keyboards/keypads, 60, 63, 64, 69, 74, 77,
151, 324, 365, 387, 397Key, see KeystrokeKeystoke logger, 303, 375Keystroke level model (KLM), 43, 320, 322
description of components, 324example application, 325
Keystrokes, 64, 130, 132, 149, 155, 157, 322,324
Keystroke shortcuts, 132, 325Kinesthetic information, 62, 63Kiosks, 65, 172, 210Kitchen, 52Klaxons, 112Knees, 18Kneecaps, 18Knobs, 6, 18, 19, 37, 182, 322Knowledge
declarative, 128, 146, 328procedural, 140, 328skills and attitudes (KSA), 234, 265
Knowledge-based, 153, 156, 234, 293, 326Knowledge-level, 153
LLaboratory-based experiments, 289, 368Language, 17, 33, 40, 42, 127, 129, 155, 181,
197, 201–204, 219, 326, 335–338,341, 389, 392, 394, 408
implications for system design, 33, 127,156, 204
Lapses, 286, 293Laptops, 18, 57, 208Latent errors, 282Leadership, 195, 238, 242, 245, 260, 390Learnability, 47, 48, 320Learner, 48, 131, 133, 145, 217, 242Learning, 202, 217, 220, 246, 258, 264, 273,
274, 283, 284, 290, 309, 311, 326,
Index 435

326, 338–340, 351, 369, 388, 389,391, 398, 402, 403, 407, 408
implications for interface design, 155–158implications for system design, 204, 214,
244, 402, 408, 409improvements from, 147–150process of, 145–147Rasmussen’s theory of knowledge, 284,
293, 348stages of, 399transfer of, 407types of, 130, 150, 151, 157
Learning and skilled behavior, 144–157Learning curve, 148–152, 205Learning within and between projects, 406,
407Legal, 303, 386Legibility, 206, 219Levers, 317, 387Lights, 327, 369, 388, 390Light waves, 206, 208, 290Likeability, 48Likelihood, 240, 245, 247, 296Limb, 387Line between success and failure, 284, 286Linguistics, 202, 256Listening, 202, 287Lists, 322, 408Load bearing, 62Localizing sound, 387Loftus effect, 135–136London airport, 173London ambulance dispatching system, 22Long-term memory (LTM), 158, 321, 395, 397Loudness, 370Low-level visual perception, 92, 100, 103
implications for system design, 98–100Luminance, 208
MMABA–MABA, 301Maintenance, 201, 219, 238, 262, 367, 388,
389Majority and minority effects, 233Man–computer, 354Man–machine, 40Massed learning, massed practice, 11, 13, 152Mastery, 245, 246, 274Means (average), 357Means-ends analysis (MEA), 176Meaning-making, 202, 203, 283Measurement of light, 92Measuring usability, 359, 369, 379
errors, 370eye movement tracking, 372interviews and focus groups, 374patterns of usage, 375questionnaires and surveys, 373task time, 369user experience, 376verbal protocols, 370video protocols, 371workload measures, 374, 375
Medicine, 214, 272, 287Memorability, 64, 125Memorable, 126Memories, 8, 20, 124, 127–129, 133, 134, 136,
140, 141, 145, 151, 156, 190, 217,388, 395
Memorize, 7, 28, 124, 167Memory
aids, 135, 395biases, 133declarative, 129encoding effects, 134episodic, 124, 140iconic, 124implications for system design, 156interference in, 134priming, 135procedural, 129, 151prospective, 131recognition, 132, 151representation, 136retention, 331retrieval, 124, 125, 128, 134, 135, 160,
189, 193retrospective, 131short term, 20, 124–128types of, 124
Mental model, 21, 165, 166, 169–171, 173,176, 183, 188, 192, 196, 197, 217,256, 287, 301, 345, 349, 348, 489
Mental models, of users, 348, 389Mental representation, 166
implications for design, 173simple representations, 167
Menu bar, 67, 68, 160Menus, 7, 8, 28, 33, 68, 77, 159, 172, 182, 185Metacognition, 194, 196Metaphor, 138, 177, 187Method of loci, 131Micro-saccades, 88Misinterpretation, 135, 217, 289Mismatch, 71, 171, 187Misses, 84, 85Mistake, 12, 13, 28, 143, 153, 155, 194
436 Index

Misunderstanding, 22Mnemonics, 19, 131, 132, 136Mobile phone, 18, 69, 72, 75Modalities, 67, 74, 76, 144, 158Mode, 12, 37, 75Model human processor (MHP), 43, 392,
395–397Modeling, 23, 42, 43, 52, 159Models, 9, 12, 14, 21, 23, 24, 38, 42, 43, 49,
51, 64, 68, 131, 140, 165, 166,168–171, 173, 176, 178, 192, 196,272, 376
of social processes, 266–269of users, 23, 391–399
Monitoring, 39, 138, 141, 142Monochromats, 95Monochrome, 95Motivation, 4, 5, 17, 21Motor, 16, 23, 62, 74, 75, 138, 141Mouse, 59, 66–68, 72, 75, 77Mouth, 63Movement perception, 87, 101Movements, 16, 52, 57, 66–71, 146, 174, 295,
372MS word, 28Multimodal, 133Multi-tasking, 12, 158Multi-touch, 63Muscle, 16, 17Music, 72, 108, 189Mutual support and mutual surveillance, 235,
240Mythical man-month, 235, 238Myths, 159, 187
NNASA’s Aviation Safety Reporting System
(ASRS), 286NASA-TLX (task load index), 375Nash equilibrium point, 257Naturalistic, 192Navigation, 65, 364, 372Near misses, 22Need for cognition, 180, 181, 295Negotiation toolset, viNeonatal, 270, 271, 318Nepal, 125, 128, 132, 135Networks, 48, 132, 173, 213, 235, 253, 260,
261, 262, 264, 343leadership in, 260
Networks lead to better work, 262NGOMSL, 320Norm, 236, 241, 327
Normal curve, 388Norman’s seven stages of action, 343–345Normative behavior/norms, 265, 310Novice, 21, 28, 48, 64, 147, 156, 157, 173,
175, 177, 188, 191, 217, 326, 328,329, 357, 387
NYNEX, 11–12
OObserver, 184, 188, 228, 231, 291, 303, 363,
370Old, 12, 70, 75, 176, 180, 187, 261, 287, 338,
340. See also ElderlyOmissions
error of, 64, 295Open loop behavior/control, 141, 142Operate, 9, 12, 63, 64, 62, 75, 131, 152, 153,
166, 176, 227, 244, 247, 302, 345,389, 393
Operators, 11, 12, 37, 43, 143, 153, 174, 176,177, 181–183, 187, 227, 238, 286,288, 290, 291, 301, 313, 320, 321,324, 329, 346
Optical, 86, 87, 91, 105Optimization, 18, 34, 37, 48, 184, 204, 206,
219, 238, 262, 274Organization, 22, 26, 34, 36, 40, 41, 43, 44, 60,
76, 211, 216, 225, 227, 235–240,243, 249, 259, 253, 265, 274–276,302, 311, 357, 362, 376, 386, 409
Organizational and cultural levels, 264Organizational effects, 265Organizing what we have learnt about users,
386Overview of vision, 86
PPaper-based reading, vs. screen-based reading,
208Parafovea, 87, 90Parallax, 19, 101Participants, 230, 242, 258, 259, 319, 360, 361,
373, 376, 377, 379Participation in an activity, 240Participation outside work settings, 116, 253
implications for system design, 136Passwords, 129, 136, 145, 160Patterns of usage, 368, 375, 376Payoffs, 235, 242, 254, 256, 257,
259, 274Peer-to-peer, 241Pencil and paper prototypes, 367
Index 437
Penny, knowledge in the head vs. in the world,7, 8, 28, 347
Perceive-decide-act cycle, 345Perception, 44, 95, 124, 236, 284Perceptual-motor, 124, 213, 320, 324Performance assurance, 311Performance shaping factors (PSFs), 293Periphery [eye], 50, 90, 91, 95, 101, 181Philadelphia airport, 169, 170Phones, 8, 14, 65, 70, 74, 77, 112, 159, 173,
182, 198, 219, 221, 242, 246, 253,303, 320, 376, 387
Photoreceptor, 90Physical, 17, 18, 20, 36, 52, 58, 63, 110, 120,
149, 171, 235, 267, 270, 286, 319,322, 327, 343–345, 375, 386, 409
Physical aspects of interaction, 59Physical keyboard, 63Physiology, 33, 81, 103, 113, 211, 281, 287,
294, 386Physiology of vision, 86
implications for system design, 91Pilots, 9, 13, 21, 22, 74, 153, 176, 226, 266,
283, 286, 287, 313, 346, 373, 410Planning, 138, 146, 153, 195, 246, 284,
293–295, 299, 315, 339, 377Planning your evaluation study, 356–362Platinum rule, vPlay, 18, 22, 60, 74, 84, 108, 113, 141, 142,
151, 174, 191–192, 249, 257–259,326, 327
Pleasurable, 26, 27Pluralistic ignorance, 228, 230, 248Pointing devices, 66Policy, 26, 29, 198, 266, 273Pop-out effects, 92, 97–100, 116Post-completion error, 180, 181Postures, 60, 76, 17, 59, 60, 63, 387, 389Power law of learning, 148, 149Poynter Institute, 119PQ4R, 133Practice, see LearningPractitioners, 15, 34, 45, 154, 403Predictability, 8, 26, 38, 40, 67, 142, 143, 149,
155, 156, 188, 211, 241, 285, 288,290, 313, 320, 385, 392, 394, 397
Prediction, 5, 38, 269, 272, 292, 313, 314, 324,392, 395, 397
Preferences, 44, 96, 112, 338Premature babies, see NeonatalPremature commitment (cognitive
dimensions), 341Prescriptions/prescriptive, 37, 46, 214, 265,
310, 405Primacy and recency, 189
Primacy effect, 125–127, 134Priming, of memory, 134Principles, 37, 41, 46, 103, 105, 145, 204, 348,
355, 356, 365, 389, 395, 398Prisoner’s dilemma (PD), 256–260
how to do well, 258suggestions for how to promote coopera-
tion, 258Problem solving, 40, 42, 145, 146, 152, 165,
166, 174–177, 180, 181, 183, 184,192, 196–198, 202, 213, 239, 265,293, 344, 345, 389
examples of, 175implications for system design, 192known influences on, 176the importance of, 175
Procedural memory, 129Procedures, 9, 19, 38, 41, 129, 151, 176, 265,
375Process of learning, 145Programmable User Models (PUMs), 43Programmer, 48, 143, 340, 343, 397Programming, 33, 48, 51, 129, 143, 160, 336,
338, 341, 392, 408Project lifecycle, 355, 404Propositional representation, 167Proprioception, 42Prospective memory, 131, 158Prototype, 4, 45, 101, 363, 364, 366–368,
395Proximal, 81, 115Psycholinguistics, 89Psychological science in the public interest,
198Psychology, 4, 10, 26, 34–36, 40, 76, 82, 103,
115, 117, 119, 145, 151, 158, 159,166, 184, 192, 197, 202, 226, 228,237, 349, 360, 389, 395, 397
Psychology/design of everyday things, 27, 350Psychometric, 15Psycho-physiology, 103, 281Psychotherapy, 2818 puzzle, 130, 157
QQuestionnaires and surveys, 373
RRadiation, see X-rayRarefaction, 106, 108Rasmussen’s theory of knowledge, 284, 293,
348Ratings, 373, 375
438 Index

Rationality, 184, 192, 193, 291RD-ICM, risk-driven incremental commitment
(concurrent) model, 399–408Reaction time, 64, 67, 387Readability measures, 207, 217Reading, 4, 20, 25, 60, 70, 72, 88, 97, 100,
125, 155, 158, 160, 197, 201, 204,206–209, 216–218, 220, 221, 266,302, 330, 389, 393, 410
factors affecting, 205implications for system design, 136paper-based reading, vs. screen-based
reading, 208scanning, 27
Reading from the screen, 208, 219Reading index, 217Reasoning, 8, 23, 42, 134, 145–147, 389Recall, 7–9, 112, 128, 132, 135, 136, 157, 160Recallable, 136Recency effect, 126Recency of memory, 134Receptor, 62, 86, 87, 89, 91Recognition memory, 132Recognition-primed decision making
(RPDM), 191, 192Red–green color differences, 91, 95Redundancy, 47, 100, 336, 344Regression to the mean, 189Regulatory, 21, 247, 274, 288, 415Rehearse, 135Reliability, 4, 14, 47, 49, 50, 108, 186, 284,
290, 294, 358, 361, 371of user testing, 355
Remember/remembering, 8, 20, 50, 111, 125,128, 135, 158, 159, 189, 192, 208,226, 274, 276, 310, 353, 369, 371,388, 389, 392
Reminders, 70, 136, 350Repetition of stimuli, 132Repetitive strain injury (RSI), 60Representation in memory, 151Requirements, 43, 44, 50, 115, 289, 313, 343,
354, 368, 399, 405, 407Respiratory distress syndrome (RDS), 318Retention, memory, 331Retina, 87–89, 95, 101, 104Retrieval biases, 134Retrieval from memory, 125, 132, 134, 189,
193Retrospective memory, 297, 370, 371Rich pictures, 267, 270–272, 318, 319Risk-aversive, 193Risk-driven incremental commitment (con-
current) model, 341, 385, 399
descriptive as well as prescriptive, 404designers are stakeholders too, 405learning within and between projects, 406provides a way to organize user related
knowledge and ways of knowing,403
Risks, 14–16, 60, 66, 190, 234, 245, 266, 342,385, 399, 400, 403, 409
Risk-taking, 234Road, 70, 206, 228, 310Robot-assisted surgery, see da VinciRods [eye], 83, 89, 91, 95Role-expressiveness (cognitive dimensions),
337, 339, 340Role of tasks and environments, 390Rubin vase, 94Rule-based behavior/rule-level, 153Rules, 14, 27, 115, 145, 147, 149, 153, 158,
166, 193, 226, 259, 283, 321, 322,341, 365
SSaccades, 87Safer systems, 10, 13Safety, 13, 15, 22, 35, 38, 49, 60, 64, 100, 115,
287, 296, 303, 310, 314, 339Safety-critical systems, 21, 364Salience, 83, 86, 95Sample size effects, 189Samsung TicToc mp3 player, 72Satisfaction, 116, 148, 357, 359, 369Satisficing, 407Scanning, 118, 202, 206, 209, 211, 212, 218,
219Scanning displays and menus, 209Scenario-based, 299, 363, 364, 415Scenarios, 9, 296, 299, 363, 369Screen layouts, 81Screens, 65, 72, 85, 98, 100, 104, 105, 206,
208, 210, 218–220, 317, 363, 371,375
Screenshot, 187, 212Scrolling, 59, 65, 72, 150, 185, 321Searching, 11, 19, 27, 40, 84, 97, 120, 147,
150, 151, 172, 173, 184, 192, 202,205, 206, 212–215, 231, 273, 276,321, 327, 389
Search engine optimization (SEO), 215Seats, 88Second Life, 258, 277Seeing, 83, 84, 88, 95, 103, 105, 138, 146, 289Seeking, 104, 131, 190, 201, 212, 213, 219,
220, 231, 389
Index 439
Selecting a hypothesis, 356Selecting the most appropriate data collection
method for error study, 289, 291Self-determination theory (SDT), 113Semantics, 127, 140, 188, 202, 203, 208Semi-structured interviews, 270, 318, 374Sensation, 74, 81, 89, 94, 107Senses, 19, 23, 25, 48, 49, 57, 60, 62, 63, 74,
81–83, 88, 90, 106, 114, 117, 176,195, 202, 208, 239–241, 284, 303,311, 355, 365, 366, 372, 386, 405
Sensitivity, 74, 83, 84, 88, 90, 91, 94, 108,117, 358, 361
of user testing, 361Sensors, 34, 395Sensory threshold, 83Sensory-motor, 386Serial position curve, 126Serifs, 210Shapes, 103, 104, 205Shared representations, 407, 408Sharp end, 288, 302Shortcuts, keystroke, 132Short-term memory (STM), 125Sight, see VisionSignal, 62, 74, 84, 85, 375Signal detection theory (SDT), 82–85, 120,
185Simple decisions, see Hicks law and speed-
accuracy trade-offsSimulating humans, x, 23Simulation, 42, 267, 272, 273, 290, 359, 393,
394, 398, 406Simulator, 9, 290–292, 303Situation awareness (SA), vii, 138, 202, 238,
302, 371Skill-based/skilled, 12, 15, 141, 146, 153,
293, 348Skilled behavior in complex environments,
153Slack, 284, 293Slip, 284, 293, 370Slips of actions, 19, 141, 142Small world phenomena, 260Smartphones, 77, 242, 249Smell, 81, 82, 88, 134, 214, 219Smooth pursuit eye movements, 101Soar, 43, 129, 159, 232, 393, 395, 397Soccer, 249Social and organizational aspects, implica-
tions for system design, 204Social capital, 260Social distance, 236, 239, 240, 246, 274Social effects on decision making, xv, 228Social issues, 9
Social networks lead to better work, 262Social responsibility effects, vi, 228Social theories and models, 253
cultural effects, 275exchange costs and benefits, 256good personal social networks lead to
better work, 262implications for system design, 273informal, pairwise analyses, 254networks, 260organizational and cultural levels, 264organizational effects, 265
Sociology, 273, 276Socio-technical system design (STSD) meth-
ods, 41, 226, 273, 301Socio-technical systems, 329Soft systems methodology (SSM), 267, 269,
270Sound, 19, 34, 46, 82, 83, 85, 106, 108,
110–112, 117, 134, 203, 363, 387localizing, 110, 387measuring, 108, 109, 239theoretical description of, 106implications for system design, 111, 204
Sounds discriminating, 111Spam, 232, 275, 277Spatial distance, 236, 241Spatial perception, 101Special interest group (SIG) on computer–
human interaction (SIGCHI), 45Specification, 282, 320, 322, 358, 359, 391Spectrum, 90–92Speech, 72, 157, 247, 368, 387Speed-accuracy trade-offs, 185Spelling mistakes, 97Spiral model, see RD-ICMS–R (Stimulus–response) compatibility, see
Stimulus-response compatibilityStages of learning, 146, 149Stakeholders, vi, 269–271, 362, 399–407, 427Standard, 37, 46, 50, 62, 76, 96, 106, 108, 269,
347, 365, 376Stereoscopic vision, 102Stimuli, 5, 63, 81–83, 85, 97, 101, 108, 119,
132, 171, 186, 360Stimulus–response compatibility, 5, 171–173,
186, 187for decisions, 186for mental models, 171
Stimulus–response mapping, 427Storage, 42, 123, 131, 270, 293, 338, 397Store, 19, 38, 124, 125, 127, 129–131, 321,
323, 395Stories, vii, 155, 228Storyboarding, 4, 367
440 Index

Stove-top mappings, 6Strategy, 8, 21, 147, 149, 150, 171, 178, 192,
215, 216, 258, 259, 361, 395Stress/stressors, 46, 241, 293Structured, 131, 182, 201, 211, 215–217, 219,
244, 299, 374Structure of the eye, 86, 211Structuring content, 217Styles, 19, 20, 51, 64, 146, 159, 187Subgoals, 313–316, 321, 323, 325, 422Subitizing, 102Sub-tasks, 149, 315, 422Summaries of users, 23, 385Summative evaluation, 357, 368, 369, 427Supervisory control, 39Supporting participation outside work
settings, 375Surface fidelity, 290, 367Surgery, 70, 74, 75Surprises, 165, 197Surveillance, 240, 241Survey, 9, 62, 150, 160Switches and lights, 5Symbol, 20, 42, 202, 242Syntax, 39, 139System fidelity, 4Systems ergonomics, 39System usability scale (SUS), 373
TTactics, 158, 213, 366Tactile, 57, 63, 72, 74Talking, 127, 138, 256, 286, 366, 371, 414Task-action mapping, 187Task analysis (TA), 12, 248, 309, 311,
313–314considerations when choosing a method,
326uses of task analysis, 12, 311–314where to apply, 310
Task and interface design, 26, 311, 313Task attractiveness, 236Task-centered user interface design, 26, 119,
329Task time, 156, 326, 330, 369Taste, 82, 189Taxonomies, 142, 292–293, 303Team-building, 327Team competencies, 236Team processes and tasks, 236Teams, 12, 49, 113, 225–227, 234Team size, 236Team structure and composition, 236
Teamwork, 234–235, 239, 248, 253, 258Technique for human error assessment
(THEA), 299, 428Technique for human error rate prediction
(THERP), 38Ted Williams, 18Telephone, 11, 70, 111, 264, 313, 323, 361,
364Telepresence, 74Tests, 136, 151Text-based virtual environments, 253Text-editing, 321, 325Texture, 72, 94, 102Theremin, 202, 203Three letter acronyms, TLAs, 126Three Mile Island accident, 282, 284Threshold, 357, 369
sensory, 83Thumbs, 77, 98, 111Time-and-motion, 325Time-constrained, 286Time-sensitive, 313Tolerances, 17, 88, 358Tones, 106–108, 110, 111Touch-based, 65, 72Touch screen, 65Touch, see HapticTouch-typing, 397Tower of Hanoi, 174Tracker ball, 75Trade-offs, 64, 77, 132, 143, 155, 157, 186,
205, 212, 257, 327, 329, 330, 335,339, 341, 343, 347, 350, 351, 367
Training, 5, 9, 19, 35–36, 39, 117, 120, 155,286–287, 293, 295, 301, 314, 319,347, 404, 407
Transfer, of knowledge, 48, 155Troubleshooting, 147, 166, 169Trust, 136, 147, 213, 244Type of data: qualitative or quantitative, 195,
354, 356Type of evaluation: formative or summative,
357Types of memory, 123, 124, 129, 150Types of user models, 393Typing, 13, 64, 141, 303, 324, 367–368, 397Typing errors, 303Typist model, 64
UUltraviolet, 90Unified theories of cognition, 42, 159University department web sites, 52, 160, 312
Index 441

Unsafe, 266, 283Unusable, 266, 353Upper limb disorders (ULD), 18, 35, 60, 61,
387Usability, 11, 14, 18, 26, 43–44, 47–48, 57, 76,
136, 160, 172–173, 211, 216, 320,336, 343, 357–358, 362–366, 369,372–373, 378, 390, 403, 409
usability, testing, 362User experience (UX), 33, 44, 216, 218, 369,
376User manuals, 60, 314User testing, 335, 353–355, 368
identifying the dependent and independentvariables, 357
planning your evaluation study, 356selecting a hypothesis, 356type of evaluation: formative or summa-
tive, 357when to carry out, 355why needed, 354
User-based evaluation, 357User-centered design (UCD), 33–35, 39, 43,
50–51Users, 1–412Users’ bodies, see AnthropometricsUsers, how they read, 216User, senses of the user, 81–121User’s mental models, 165, 168, 196Users, why don’t users do what they should,
194Uses of task analysis, 12, 311–314
allocation of function, 311performance assurance, 311task and interface design, 313
VValidation, 353Validity, 289, 291, 353, 358
construct, 358content, 359ecological, 360external, 360face, 359instrument, 358internal, 359of user testing, 358–361
Verbal protocol, 365, 370, 372Verification and validation, 353Video games, 70. See also GamesVideo protocol, 70, 185, 371Vigilance, 84, 85Violations, 265, 283, 370
Virtual reality systems 3.3.5, 63, 70Viscosity (cognitive dimensions), 337–338,
341Visibility, 337, 346–347, 405Vision, 23, 34, 62, 75, 211, 286, 338, 355, 371,
375, 387, 392–393, 395implications for system design, 91
Vocabulary tutor, 340, 343Voice, 106, 111, 112, 144, 173, 414Voice output(s), 144Von Restorff effect, 125, 132, 134
WWarnings, 288Wason reasoning task, 194Waterfall model, 404Waveform/waves, 86, 90, 106–108, 110, 112Wave-length, 90, 91, 94, 95, 110Ways email has gone awry, 232Webbly, 11Web content usability guidelines, 394Websites, 37, 38, 78, 277, 312, 329What is omitted by the cognitive dimensions,
343What to evaluate, 367When not to study the user, see Risk driven
spiral modelWhy don’t users do what they should, 194Wickens theory of attentional resources, 139WIMP interfaces (windows, interfaces, menus,
pointer), 33Windows in childhood home, 371Windows (OS), 68, 371Windows in childhood home, 371Win–win requirements negotiation tools, viWizard of Oz (WoO) technique, 367Workarounds, 47, 50, 376Workers, 38, 263, 329Working memory, 127, 151, 388, 395Workload, 301Workload measures, 374Workspaces, 37, 330Workstation, 12, 60Writing, the importance of, 125, 211
XX-ray machine, 13
YYellow–blue color, 95Yellow–green light, 95
442 Index


