Embed Size (px)
Citation preview
ETH Library
What drives dividend smoothingA meta regression analysis of theLintner model
Journal Article
Author(s)Fernau Erik Hirsch Stefan
Publication date2019-01
Permanent linkhttpsdoiorg103929ethz-b-000308554
Rights licenseCreative Commons Attribution-NonCommercial-NoDerivatives 40 International
Originally published inInternational Review of Financial Analysis 61 httpsdoiorg101016jirfa201811011
This page was generated automatically upon download from the ETH Zurich Research CollectionFor more information please consult the Terms of use
Postprint This is the accepted version of a paper published in the International Review of Financial Analysis This paper has been peer-reviewed but does not include the final publisher proof-corrections or journal pagination Citation for the original published paper
Fernau E amp Hirsch S (2019) What drives dividend smoothing A meta regression analysis of the Lintner model International Review of Financial Analysis 61 255-273 httpsdoiorg101016jirfa201811011 Access to the published version may require subscription NB When citing this work cite the original published paper
2
What drives dividend smoothing A meta regression analysis of the
Lintner model
Erik Fernaua Stefan Hirschbc
a University of Mannheim Finance Area L 9 1-2 68161 Mannheim Germany tel +49 621 181
1526 fax +49 621 181 1518 e-mail fernauuni-mannheimde
b Technical University of Munich TUM School of Management Munich Germany tel +49 8161
71 5180 e-mail stefanhirschtumde
c ETH Zurich Agricultural Economics and Policy Group Switzerland
September 2018
3
What drives dividend smoothing A meta regression analysis of the
Lintner model
September 2018
ABSTRACT
We revisit the view of dividend smoothing as one of the most robust findings in the empirical
corporate finance literature by employing meta-regression analysis (MRA) Using 99 empirical
studies that employ Lintner`s dividend payout model we investigate the heterogeneity in reported
dividend smoothing effects We find evidence for (i) a mediocre degree of dividend smoothing
across the analyzed literature (ii) bi-directional publication bias -ie a tendency to preferably report
positive and statistically significant smoothing as well as dividend smoothing coefficients close to
zero (ie high speed of adjustment coefficients) and (iii) several drivers for the heterogeneity in
reported smoothing coefficients such as the set of control variables or estimation technique Our
MRA can provide guidance for investorsrsquo expectations and future research on dividend smoothing
JEL Classification C83 G32 G35
Keywords Meta regression analysis dividend smoothing Lintner model publication bias
4
1 Introduction
The analysis of firms` cash disbursal to shareholders is a fundamental field of study within financial
economics Conducting a survey of 28 companies in the US Lintner (1956) drew two key conclusions
about corporate payout policy (i) firms strongly base their current dividend on the previous dividend
(ldquodividend smoothingrdquo) and (ii) firms have a long-term target payout ratio and partially adjust their
dividend towards it where a stronger adjustment reflects a higher speed of adjustment Whereas the
emergence of stock repurchases as an alternative payout method (Grullon and Michaely 2002) is a
major challenge for the assumption of a long-term payout ratio based on dividends only the prior
literature has rarely challenged the assumption of dividend smoothing
Although the existence of dividend smoothing is regarded as a robust finding in the empirical literature
subsequent to Lintnerrsquos (1956) seminal study its degree varies widely across the vast amount of
empirical research Factors such as the considered time period (Brav et al 2005) the investigated
country (Chemmanur et al 2010) or the consideration of firm characteristics in the estimation of
dividend payouts (Leary and Michaely 2011) are potential drivers of these heterogeneous findings
However the literature lacks a detailed understanding about the drivers of the variation in reported
dividend smoothing coefficients Added together diverse empirical results as well as contradicting
theoretical assumptions on dividend payout policies and smoothing effects indicate the need for a
holistic quantitative overview of previous findings
We therefore use a meta regression analysis (MRA) framework based on the MRA guidelines of
Stanley et al (2013) to provide a summarizing picture of this core topic of empirical corporate finance
literature Our MRA comprises 99 empirical studies on dividend smoothing that differ in study design
characteristics such as the analyzed firms region time period or the employed econometric technique
5
Our study adds to the literature in several ways (i) we assess whether previous results on dividend
smoothing are affected by publication bias ie a tendency to favor statistically significant results or
findings that support a specific economic theory (Stanley 2005) (ii) we summarize reported smoothing
effects and derive a proxy for the lsquotruersquo effect after correction for potential publication bias and (iii) we
evaluate the modifications that have been made relative to Lintnerrsquos (1956) seminal study and identify
the study characteristics that impact reported smoothing effects The MRA results therefore offer a
nuanced view on the different dividend smoothing effects reported in the literature and can provide
helpful hints for future research on this important topic
MRA refers to a meta-study where regression analysis is performed on previous regression results
related to a specific research topic (Stanley and Jarrell 1989) MRA hence is an approach to summarize
existing empirical results on a specific economic phenomenon taking into account factors related to the
underlying study design such as the analyzed region country time period or the employed
econometric technique that drive heterogeneity in results (Nelson and Kennedy 2009) According to
Stanley (2001) there is consensus that MRA offers significant advantages compared to classical meta-
analysis approaches such as narrative literature reviews Initiated by Card and Kruegerrsquos (1995)
seminal analysis on the relationship between minimum wages and employment MRA has been applied
to a wide range of economic research areas1 (eg Jarrell and Stanley 1990 Longhi et al 2005 Card et
al 2010 Feld et al 2013 Bakucs et al 2014 Oczkowski and Doucouliagos 2014 Post and Byron
2015 Valickova et al 2015 Wang and Shailer 2015 Zigraiova and Havranek 2016 Demena and van
Bergeijk 2017)
1 The application of MRA has its roots in natural science (eg DerSimonian and Laird 1986)
6
Different empirical results may either reflect sampling errors or bias mistakes in the analysis (Trotman
and Wood 1991) or reveal true differences in the analyzed population (Wang and Shailer 2015)
MRA enables to identify those issues thus providing a quantitative overview across previous findings
that allows to identify proxies for rsquotruersquo dividend smoothing effects as well as publication biases
Moreover MRA provides a setting to identify study characteristics such as the analyzed country time
span or employed data sets and econometric estimators that drive heterogeneity in reported results
(Nelson and Kennedy 2009 Hirsch 2018) The MRA is particularly useful for the analysis of dividend
smoothing as (i) all studies are based on the work of Lintner (1956) as a common model which implies
that reported coefficients have a uniform interpretation across primary studies and (ii) the empirical
results are mostly based on independent samples ensuring large heterogeneity in the meta data
(Oczkowski and Doucouliagos 2014) While previous summarizing insights on smoothing effects have
mainly been derived on a subjective perception of a few key studies MRA can draw a detailed picture
on the reasons for the heterogeneous results found in the literature and allows to track the impact of all
methodological refinements that have been made relative to Lintnerrsquos (1956) seminal study
Our results reveal a mediocre degree of dividend smoothing across the analyzed literature and provide
evidence for bi-directional publication bias In particular we detect a preference to either report
positive and statistically significant dividend smoothing coefficients or low dividend smoothing close
to zero which indicates a high speed of adjustment of dividends towards a target payment Moreover
we find that reported dividend smoothing effects are severely affected by study design characteristics
In line with several theoretical models such as agency signaling or tax models controlling for firm
characteristics in the estimation of dividend smoothing can play an important role in explaining
heterogeneous dividend smoothing effects We find that studies controlling for ownership report
7
significantly higher dividend smoothing while the consideration of debt and size among the set of
control variables does not significantly influence dividend smoothing coefficients2 Moreover our
results suggest that there is no strong evidence for country specific differences in dividend smoothing
In contrast to several studies arguing in favor of higher dividend smoothing in the US ndashwithout
conducting a systematical empirical literature review (eg Dewenter and Warther 1998 Chemmanur et
al 2010)ndash we do not find a higher degree of dividend smoothing for the US compared to studies
investigating the EU (excluding the UK) the UK or developing countries The emergence of stock
repurchases is often regarded as a reason for a higher dividend smoothing in recent years The
availability of an alternative payout channel may allow firms to keep their dividend constant even in
case of unexpected earnings changes However our results do not support the conclusion that dividend
smoothing has increased subsequent to the availability of stock repurchases as an alternative payout
method The MRA also reveals significant differences of firms from the financial sector and other
industries Thus our MRA provides investors with an estimate of the degree of dividend smoothing
that can be expected depending on the market and the industry they invest in Studies that rely on cash
flows instead of published earnings as profit measure report significant higher dividend smoothing
coefficients Finally our results confirm that applying GMM as the theoretically consistent
econometric estimator for dividend smoothing can avoid an upward bias in the estimation of smoothing
coefficients
2 Note that the MRA does not reveal the direct impact of additional control variables (eg size or debt) on dividend
smoothing In contrast the MRA reveals the impact that omissioninclusion of these variables in the primary literature
has on the resulting dividend smoothing coefficient
8
The remainder of this paper proceeds as follows Section 2 reviews the theoretical and empirical
literature on dividend payout policies with a particular focus on Lintner`s model In section 3 we
present the MRA data generation and some descriptive statistics Section 4 presents the MRA design
and estimation results while section 5 concludes
2 Lintner model and further developments
The modern economic foundation of payout policy dates back to the seminal study by Modigliani and
Miller (1958) Their irrelevance theorem does not only indicate the conditions under which payout
policy is relevant for firm value such as taxes (Miller and Scholes 1978) agency costs (Jensen 1986)
or dividend signaling models (Bhattarchya 1979 Miller and Rock 1985) It also stands in sharp
contrast to a vast amount of literature that documents several drivers of payout policy Dividend
smoothing is one of the most robust findings in the empirical corporate finance literature and was first
reported in Lintnerrsquos study (1956) Based on his survey evidence Lintner (1956) captures the idea of
dividend smoothing and the existence of a long-term target payout of a firm i based on the following
model
tititiiiti uDDD 1 )( +minus+=∆ minusλα (1)
tiiti ErD = (2)
where tiD ∆ corresponds to the change in dividend payments relative to the dividend payments in the
previous period ( 1 minustiD ) tiD is the target dividend payment assumed to be equal to a fraction ir of
current after tax-earnings ( tiE ) iλ reflects the speed of adjustment towards the target payment and
9
tiu is an error term A coefficient of 0 lt iλ lt 1 indicates that firms adjust their dividends partially
towards the target in a given period iλ = 0 (1) corresponds to no (full) adjustment3 Finally Lintner
(1956) assumes a positive constant ( iα ) reflecting managersrsquo reluctance to cut dividends
Inserting (2) into (1) and rearranging yields the following equation
titiitiiiiti uDErD 1 )1( +minus++= minusλλα (3)
If we set iii br =λ and ii d=minus λ1 we end up with the following equation which we refer to as
the lsquoclassical Lintner modelrsquo (Andres et al 2009 Andres et al 2015 Fama 1974 Skinner 2008)
titiitiiiti uDdEbD 1 +++= minusα (4)
where iid λ1 minus= can be interpreted as the degree of dividend smoothing High values of id imply
that managers strongly base current dividend payments on previous payments4
Lintner (1956) tests this model using a sample of 28 US companies for the period 1947-1953 using
OLS as estimation method He finds a speed of adjustment of about 13 corresponding to a smoothing
coefficient of 23 and a constant of 035 In accordance with Lintnerrsquos prediction several other earlier
3 Empirically the speed of adjustment is not restricted to fall into the interval [0 1] In a robustness check we exclude
dividend smoothing coefficients outside this interval This applies to 99 observations The results are robust to this
alternative sample
4 In the empirical implementation of (4) a constant speed of adjustment (λ) and target payout ratio (r) across analyzed firms
is assumed
10
studies such as Fama and Babiak (1968) and Watts (1973) also find smoothing coefficients close to 23
and a small but positive constant
Until today the partial adjustment model specified by (4) is still widely used in empirical studies
dealing with dividend payouts (eg Michaely and Roberts 2012 Andres et al 2015) However these
studies differ heavily with respect to the analyzed time span the investigated country the econometric
technique or modifications of (4) leading to large heterogeneity in reported dividend smoothing
parameters
Following Lintner (1956) researchers started to adjust the classical model (equation (4)) by
incorporating theoretical considerations as well as empirical phenomena more properly Whereas
empirical aspects concern the choice of the earnings measure or the appropriate estimation technique
theoretical considerations are primarily concerned with the extension of (4) by the correct set of control
variables In the following we provide an overview of the most important modifications relative to the
original work of Lintner (1956)
Fama and Babiak (1968) argue that target dividend payments are based on a fixed ratio of current
earnings but assume that earnings are determined by the following process
titiiti vEE 1 )1( ++= minusδ (5)
with tiv representing a serially uncorrelated error term They further assume that dividends are fully
adjusted to the expected change in earnings 1 minustii Eδ but partially adjusted to the earnings
surprise )( 1 minusminus tiiti EE δ Using this assumption plugging (2) and (5) in (1) yields5
5 Some authors (eg Dharan 1988 Hines 1996) include further lags of either the earnings or the dividend parameter
11
[ ] titiiititiitiiiiti uErDEErcD 111 )( ++minusminus+=∆ minusminusminus δδα (6)
Rearranging and setting ii dc =minus1 iii rcb = and )1( iiii crf minus= δ leads to the following
equation
titiitiitiiiti uEfEbDdD 11 ++++= minusminusα (7)
Lintnerrsquos (1956) findings are based on accounting profits as a measure of earnings An important strand
of the literature though relates dividend payments to the mitigation of free-cash-flow problems (eg
Allen et al 2000 Easterbrook 1984 Jensen 1986) Firms might be more inclined to adjust their
dividend payments due to changes in cash flows For this reason many authors rely on cash-flows
instead of or in addition to accounting profits when modelling dividend payouts (eg Andres et al
2009 Renneboog and Szilagyi 2015)
A further refinement relative to Lintner (1956) concerns an econometric issue The classical Lintner
model and its extensions include the lagged dependent variable among the set of independent variables
In this case using OLS yields upward biased coefficient estimates ( d ) of the lagged dependent variable
(Hsiao 1986) The within-group estimator in turn which has been used by many authors in subsequent
studies leads to a downward biased coefficient (Nickell 1981 Baltagi 2008) A growing number of
studies (eg Naceur et al 2006 Pindado et al 2012 Andres et al 2015) hence rely on Arellano and
Bondrsquos (1991) GMM-in-differences or Arellano and Boverrsquos (1995)Blundell and Bondrsquos (1998)
12
GMM-in-systems estimators6 These approaches yield unbiased coefficient estimates ( d ) of the lagged
dependent variable (Baltagi 2008)
The substantial rise in the volume of stock repurchases in and outside the US marks a major challenge
for the concept of a long-term dividend payout In recent studies Skinner (2008) Brav et al (2005)
and Leary and Michaely (2011) report evidence questioning that firms base their payout on a target
dividend ratio Whereas stock repurchases gained in importance in the US from 1980 onwards they
emerged as an alternative payout method in many non-US countries at the end of the 1990s (Manconi
et al 2017)7 The availability of a different payout method suggest that firms might use stock
repurchases to disburse temporary earnings (Jagannathan et al 2000) leading to higher dividend
smoothing Andres et al (2015) Brav et al (2005) and Choe (1990) find evidence in line with this
prediction
In addition institutional differences across countries such as the taxation of dividends and capital gains
or the frequency of dividend payments might be another reason for heterogeneous results in dividend
smoothing Andres et al (2009) McDonald et al (1975) and Short et al (2002) find dividend
smoothing coefficients that are different from the US analyzing samples of German French and UK
firms respectively Chemmanur et al (2010) compare the dividend policies of firms in the US and
Hong Kong and relate the finding of a more flexible dividend payout in Hong Kong to differences in
6 Arellano and Bover (1995) and Blundell and Bond (1998) show that GMM-in-systems is superior to GMM-in-differences
when applied to samples with a short time series dimension
7 The basis for stock repurchases in the EU is the Second Council Directive of December 13th 1976 (7791EEC)
However as EU countries still had to translate the directive into national law the volume in stock repurchases did not
reach meaningful levels in any EU country before the end of the 1990s
13
the equity ownership and tax regime across the two countries As the tax status of investors as well as
their equity ownership might also differ within countries Chemmanur et alrsquos (2010) finding can also
be interpreted as consistent with different firm characteristics as drivers for the heterogeneity in
dividend smoothing
Leary and Michaely (2011) provide a thorough overview of potential firm-specific characteristics that
are important to consider when estimating the degree of dividend smoothing As we show in our meta-
analysis firm size ownership structure as well as leverage are among the most commonly used firm
characteristics that have been used as control variables in Lintner-type partial adjustment models The
inclusion of these variables is in line with agency models (eg Easterbrook 1984 Jensen 1986)
signaling models (eg Bhattarchya 1979 Miller and Rock 1985) or tax-based models (eg Miller and
Scholes 1978 Allen et al 2000) The MRA can reveal the impact of their inclusionomission in
equations (4) and (7) on the resulting degree of dividend smoothing
Finally several studies have excluded financial firms from their analysis due to different regulatory
requirements for these firms In addition the evidence of DeAngelo et al (2004) suggests substantial
differences in payout policies across industries We therefore consider industry sectors as another
potential driver of heterogeneity in smoothing effects
3 Meta regression data amp descriptive statistics
In section 31 we describe the process of identifying the studies included in our MRA Subsequently
we provide some descriptive statistics with respect to relevant study design characteristics in section
32
14
31 SAMPLE SELECTION
First we performed a literature search based on the MRA guidelines of Stanley et al (2013) to identify
all potentially relevant unpublished and published empirical studies on dividend smoothing We
performed an initial search with all reasonable combinations of the following key terms ldquodividendsrdquo
ldquopayoutsrdquo ldquoLintner modelrdquo ldquodividend smoothingrdquo rdquotarget payoutrdquo and ldquospeed of adjustmentrdquo The
following databases have been employed for the literature search Econstor Google Scholar SSRN
Jstor Wiley Business Source Premier EBSCOhost NBER Econ papers We then checked the
reference lists of the identified studies by means of snowballing techniques to identify studies that have
not been detected by the initial key term search (Longhi et al 2005) This resulted in an initial set of
407 published and unpublished research papers We then checked whether those studies are based on
an empirical estimation of Lintner`s model or an extension of the latter As MRA requires a uniform
interpretation across the included coefficients we excluded 6 studies that used logarithms of dividends
andor earnings For the same reason 10 studies that estimated dividend smoothing individually for
each firm and afterwards report mean values are dropped from the sample8 In addition we ensured
that articles by ldquopredatoryrdquo publishers according to ldquoBeall`s List of Predatory Journals and Publishersrdquo
are not considered9 Finally we further excluded studies which are an earlier working paper version of
a subsequently published paper However whenever two versions exist we compared the working
paper version to the published version More specifically we extracted 28 unpublished smoothing
coefficients from two working papers which have been excluded from the published version
8 If only means of firm-level smoothing coefficients are reported this also implies that precision measures for individual
estimates are not available
9 This led to the exclusion of 3 articles For more information on this list see httpsbeallslistweeblycom
15
Comparing the results of unpublished working papers to those of published articles allows to assess the
presence of publication bias caused by what is known as the file-drawer problem This phenomenon
arises if authors or editors prefer statistically significant results that support a particular theory
(Valickova et al 2015) However as most articles are working papers before being eventually
published it remains unclear whether recent working papers will remain unpublished gray literature or
if they are published in their current form (Hirsch 2018) Therefore similar to Hirsch (2018) we only
consider working papers that have been finalized more than five years ago (ie pre 2012) as ldquotruerdquo
unpublished working papers that potentially suffer from the file-drawer problem10
A more common option to test for publication bias is to analyze the relationship between reported
coefficients and their estimation precision We therefore excluded studies that fail to report a precision
measure for individual estimates such as standard errors p-values or t-values11 Moreover as will
become apparent below the availability of precision measures is crucial for the correct econometric
implementation of the MRA Some studies focus on the estimation of the speed of adjustment
coefficient ( λ ) according to eq (1) while others are interested in determining dividend smoothing
( d ) (eq (4) and (7)) We therefore converted all speed of adjustment coefficients to smoothing
coefficients according to λ1ˆ minus=d
10 As the literature provides little guidance on a specific time frame we also classify papers that have been finalized more
than three years ago as ldquotruerdquo unpublished papers as a robustness check Note that it can also be the case that articles are
not published due to quality issues with respect to method applied writing style etc If rational authors nevertheless
already adopt the strategy to produce ldquodesirablerdquo results in the earlier stages of research as they prepare for journal
publication including working papers in the MRA does not help to detect publication bias (Rusnak et al 2013)
11 Lintner (1956) is one example for a study that we had to exclude due to missing information on estimation precision
16
To control our sample for unreasonable observations eg caused by reporting errors in the underlying
studies we performed multivariate outlier screening using the lsquobaconrsquo algorithm proposed by Billor et
al (2000) which identifies outliers based on Mahalanobis distances (Weber 2010) The application of
the bacon algorithm led to the exclusion of 19 unreasonable observations12 This led to a final sample
of 99 studies and 979 dividend smoothing coefficients ( d ) the main coefficient of interest in our
empirical analysis 86 studies report several coefficients which are the result of estimations for
subsamples or estimations based on different econometric approaches13 It is important to note that our
final dataset comprises a diverse set of dividend smoothing estimates where each of the 979 identified
coefficients refers to a unique combination of underlying dataset model specification regional focus
or time period analyzed
Table A1 in the appendix provides a chronological overview of the final set of 99 studies on dividend
smoothing It can be observed that the literature search has identified a comprehensive dataset
including studies from 1957 to 2016 Moreover mean and median values of smoothing coefficients per
12 Eg two studies reported implausible standard errors In both cases for the same underlying sample of firms and only
slightly different model specifications significantly different standard errors for the smoothing coefficient that diverged
by a factor of gt1000 were reported
13 Examples are Persson (2013) who reports coefficients for different industry sectors or Foerster and Sapp (2006) who split
their sample into three different time frames However some reported results referring to subsamples within studies had
to be excluded from our analysis as they cannot be captured by the MRA due to the fact that they only appear once
Examples are Athari et al (2016) who report separate results related to a subsample of islamic banks Persson (2013)
who reports results for subsamples of firms with different market caps (small mid large) or Ameer (2007) who reports
results for subsamples related to high and low growth firms
17
study are reported in the right columns and provide a first indication that dividend smoothing varies
significantly across literature
32 DESCRIPTIVE STATISTICS
Table 1 summarizes the variables included in the MRA It can be observed that the mean smoothing
coefficient across included studies is 0562 indicating the presence of a mediocre and slightly lower
degree of dividend smoothing in comparison to Lintnerrsquos (1956) findings The included explanatory
variables have been selected based on two criteria (i) the MRA shall cover the development from the
classical Lintner model (equation 4) to more recent extensions and specifications as described in
section 2 and (ii) cover to the largest possible extend the study design characteristics used to generate
the dividend smoothing coefficients
Table 1 reveals that 112 of identified smoothing coefficients originate from working papers that are
at least five years old 470 of the coefficients relate to a mean year of the analyzed sample after
1998 The year 1998 has been selected as a threshold since a large number of countries included in our
dataset exhibits meaningful levels of stock repurchases as an additional payout channel from the end of
the 1990s onwards Baltagi (2008) shows that estimating partial adjustment models such as (4) and (7)
with OLS leads to upward biased smoothing coefficients Nevertheless only 147 of the 979
coefficients have been generated by applying the unbiased GMM estimator while the remainder has
either been estimated using OLS (553) the fixed effects (within) estimator (157) or by means of
other methods (143)14 As pointed out above the GMM estimator can be differentiated into the
difference- and system-approach with the system-estimator being superior when applied to panels with 14 Examples for other methods are Probit Tobit Logit or Random Effects estimations
18
a small time series dimension However as the majority of studies do not report which of the GMM
approaches has been used we do not further differentiate between GMM-in-systems and GMM-in-
differences in our MRA In addition as the underlying literature is based on relatively long panels with
an average time series dimension of 125 years there are likely no significant differences in the results
generated with the two approaches
As regards extensions of the classical Lintner model specified by (4) it can be observed that 420 of
reported coefficients are generated based on the classical version while the remainder of coefficients
has been estimated based on extensions that include further explanatory variables such as firm size
debt and ownership While firm size (139) debt (104) and ownership (166) represent the core
of additional explanatory variables 419 of the identified coefficients relate to estimations that
include other firm-specific explanatory variables such as liquidity or growth opportunities15 Due to the
heterogeneity of those variables across literature they can only be considered as a joint set of lsquootherrsquo
explanatory variables Another deviation from the original work of Lintner (1956) refers to the use of
cash-flows as earnings measure which applies to 113 of estimated smoothing coefficients Finally
Table 1 indicates that the literature on dividend smoothing has also focused on a wide set of countries
and industries As regards countries we have identified a general pattern of focus on the US (114)
the UK (83) other EU countries (174) and developing countries (344) while the remainder of
coefficients (277) relate to a set of other countries which due to its diversity has to be captured by
means of a single dummy variable16 To account for studies focusing on different industries we
15 See eg Leary and Michaely (2011) for an overview of potential firm-specific determinants of dividend smoothing
16 Countries which cannot be categorized into independent categories (eg Canada China or Russia) are assigned to the
group ldquoother countriesrdquo We refer to the definition of the World Bank to classify developing countries
19
distinguish between firms from the service and consumer goods sector (15) financial firms (150)
and manufacturing firms (61) while the remaining coefficients are not based on a specific industry
[Insert Table 1 about here]
4 Meta regression analysis
In section 41 we first provide a descriptive analysis of reported estimates that allows to derive
preliminary hints regarding the presence of publication bias by means of a funnel plot Moreover a
proxy for the rsquotruersquo smoothing value is derived Section 42 then describes the MRA framework used
whereas section 43 focuses on econometric issues that need to be considered Finally section 44
presents and discusses the MRA results
41 DESCRIPTIVE ANALYSIS OF THE lsquoTRUErsquo-EFFECT AND PUBLICATION BIAS
Before estimating MRA models we conduct a preliminary analysis of the dividend smoothing
coefficient and of publication bias Publication bias is the consequence of a favor for statistically
significant results by authors or journal editors Stanley (2005 2008) suggests that the degree of this
bias can be proxied by the correlation of estimates and their standard errors If publication bias is
present a significant correlation between estimated coefficients and their standard errors which leads
to statistical significance should prevail (Oczkowski and Doucouliagos 2014) To graphically illustrate
this relationship Stanley and Doucouliagos (2010) propose to plot estimated coefficients against their
precision where precision is measured by the inverse of coefficientsrsquo standard errors (Oczkowski and
Doucouliagos 2014 Zigraiova and Havranek 2016) If the underlying literature is not affected by
publication bias the estimated smoothing coefficients with high standard errors in the lower part of the
20
plot shall be characterized by high but symmetrical variation around a proxy for the lsquotruersquo dividend
smoothing coefficient while estimates with low standard errors in the upper part of the plot should be
characterized by low variation around the proxy for the lsquotruersquo value Thus without publication bias the
plot should take the form of a symmetric inverted funnel In turn skewness of the funnel indicates
favor for a specific direction of results and is therefore a hint for publication bias In order to construct
the funnel plot we follow Stanley (2005) and first derive a proxy for the lsquotruersquo smoothing coefficient by
averaging the top 10 of most precisely estimated smoothing coefficients leading to a value of 0728
We then plot estimated coefficients and their precision around this proxy for the lsquotruersquo value The
resulting funnel plot is shown in Figure 1 The funnel plot appears widely spread and indicates
skewness towards positive smoothing coefficients close to one as well as high speed of adjustment
coefficients (ie low dividend smoothing coefficient close to zero) This indicates bi-directional
publication bias towards high dividend smoothing and a high speed of adjustment (ie low smoothing)
To assess the degree of excess variation we follow Stanley (2005) and calculate the following statistic
for all j=1 hellip 979 coefficient estimates where corresponds to the
reported dividend smoothing estimates the corresponding standard errors and d represents the
true effect based on the top 10 of the most precisely estimated smoothing coefficients In case a
publication bias is absent one would expect that should exceed 196 for only 5 of coefficient
estimates Using this statistic we find that exceeds 196 in 604 of the cases indicating a strong
excess variation This casts doubt on the assumption of a single underlying lsquotruersquo effect and points
toward the presence of publication bias towards two directions Authors might favor positive and high
dividend smoothing coefficients ( close to one) as well as positive and low dividend smoothing
coefficients corresponding to a high speed of adjustment ( close to zero)
21
[Insert Figure 1 about here]
Funnel plots though assume a single lsquotruersquo effect for different regions sectors time periods or
estimation techniques Hence possible publication bias within country or industry subsamples of
reported smoothing coefficients cannot be detected with this method (Hirsch 2018 Doucouliagos et
al 2005 Stanley 2005 2008) In the following we therefore conduct MRA which provides a more
objective analysis than funnel plots17
42 META REGRESSION MODEL
While the funnel analysis performed in section 41 can provide first indications regarding the
smoothing effect and publication bias its main disadvantage lies in the assumption that only a single
lsquotruersquo effect exists
We therefore perform several MRA`s based on different estimation strategies Compared to funnel
graphs which can only reveal the degree of publication bias across the entire sample of smoothing
coefficients MRA enables to more precisely analyze possible publication bias by accounting for
different subgroups in the sample (eg defined by time countries or industries) It is likely that those
subgroups are affected by publication bias to varying degrees MRA also allows to account for
heterogeneity in reported coefficients driven by the underlying study design ie the applied
17 To further illustrate the distribution of dividend smoothing coefficients Figures A1 and A2 in the appendix show the
frequency distribution and the Kernel density In addition we also captured the distribution of dividend smoothing
coefficients based on median values of reported dividend smoothing coefficients and median precision per study
Figures A3-A5 in the appendix show the respective funnel plot frequency distribution as well as Kernel density based
on median values
22
econometric estimator or the inclusion of additional independent variables when estimating dividend
smoothing (Doucouliagos et al 2005 Stanley 2005 2008)
Following Stanley (2005 2008) we implement several specifications of the following model
jn
njnjj xdsed εβββ +++= sum)ˆ(ˆ10 (8)
where the dependent variable reflects the j=1hellip 979 identified dividend smoothing coefficients jd
The standard error of each coefficient ( )ˆ( jdse ) is included as independent variable together with a
vector sumn
njn xβ of those variables reported in Table 1 that relate to structural characteristics of the
underlying studies The respective coefficients ( nβ ) therefore capture the variance in reported
smoothing coefficients caused by those characteristics Finally jε is an iid error term
The inclusion of the standard error of estimated coefficients as an independent variable serves as a
basis for testing for publication bias If publication bias prevails across the analyzed literature a
significant correlation between estimated coefficients and their standard errors should prevail
(Oczkowski and Doucouliagos 2014) Thus authors will likely prefer those results where the quotient
of the estimated coefficient and its standard error is equal or larger than two implying significance at
the 5-level or lower In contrast if publication bias is not present estimated coefficients are distributed
randomly around the lsquotruersquo value and there should be no significant correlation with standard errors
Testing 0ˆ 10 =βH can therefore be considered as a test for publication bias
23
As indicated by the funnel plot in Figure 1 the research on dividend smoothing might be biased
towards findings of high smoothing or a high speed of adjustment In this case we expect a different
impact of over the domain of high dividend smoothing and low dividend smoothing coefficients
(high speed of adjustment) Whereas authors focusing on dividend smoothing might prefer high
dividend smoothing coefficients authors with a focus on speed of adjustment might prefer lower
dividend smoothing coefficients Hence to test for bi-directional publication bias we use 05 as cutoff
for coefficient estimates of indicating a focus on high dividend smoothing parameter ( or
high speed of adjustment parameters ( This yields the following specification (eg Bom and
Ligthart 2009)
(9)
where
le
=otherwise
difD j
050ˆ1
1 and
gt
=otherwise
difD j
050ˆ1
2
Based on this specification 0ˆ 20 =βH is a test towards a publication bias in favor of low dividend
smoothing coefficients (ie high speed of adjustment) 0ˆ 30 =βH in turn serves as our test for a
publication bias towards high dividend smoothing coefficients
Stanley and Doucouliagos (2012) suggest to also consider specifications where the standard error is
introduced non-linearly Non-linearity allows for a more flexible relationship between coefficients and
standard errors over the domain of standard errors where publication bias will be less severe for
24
estimates with low standard errors We therefore also consider a specification of (9) where the standard
error is introduced in a quadratic way
(10)
where
le
=otherwise
difD j
050ˆ1
1 and
gt
=otherwise
difD j
050ˆ1
2
Finally in each specification the intercept 0β reflects the mean value of dividend smoothing corrected
for publication bias given that the impact of all study design characteristics included in is set to zero
The presence of a dividend smoothing effect can hence be tested by 0ˆ 01 =βH and rejecting this
hypothesis points towards the existence of an effect According to Stanley (2005 2008) the test of a
non-significant MRA intercept is also known as precision effect test (PET)
43 ECONOMETRIC IMPLEMENTATION
Various econometric approaches are necessary to account for problems caused by the fact that the
dependent variable of (8) to (10) is composed of estimated regression coefficients )ˆ( jd (Stanley et al
2013) These regression coefficients are derived by means of separate empirical studies implying
heterogeneous variances that potentially cause heteroscedasticity in the error terms of (8) to (10)
(Nelson and Kennedy 2009) We therefore use weighted least squares (WLS) for the estimation of (8)
to (10) As Stanley (2005) and Oczkowski and Doucouliagos (2014) point out 2)ˆ(1 jdse can serve as
25
an adequate weight as it captures the heterogeneous variances of the coefficients and thus generates
heteroscedasticity corrected standard errors18
Another econometric issue arises from the fact that most of the studies included in our MRA (86)
provide more than one estimate This implies that the meta-data is composed of clusters of estimates
with similar error structures Nelson and Kennedy (2009) point out that such within-cluster error
correlation leads to biases in the standard errors of (8) to (10) To correct for within study-cluster
correlation we follow Oczkowski and Doucouliagos (2014) and employ several techniques to derive
unbiased standard errors In particular we first estimate (8) to (10) using WLS with heteroscedasticity
robust standard errors as our base model We then correct for within-study error correlation by
estimating WLS models with study-cluster robust and bootstrapped clustered standard errors More
specifically we use the wild bootstrap method which is particularly suited when study clusters are of
significantly different sizes (Cameron et al 2008 MacKinnon and Webb 2017) Moreover as Table
A1 indicates clusters in our sample are of significantly different sizes According to MacKinnon and
Webb (2017) the wild bootstrap may yield reliable inferences in this case
Although panel estimators such as fixed and random effects are suitable to capture the clustered (ie
panel) structure of our data it is known that WLS with study-cluster robust standard errors is the more
reasonable approach to estimate MRA models (Hirsch 2018) Stanley and Doucouliagos (2013 2015)
demonstrate that WLS outperforms the random- and fixed effects estimator especially when the meta-
data is affected by publication bias Moreover the fixed and random effects estimators are based on a
set of adverse characteristics (Baltagi 2008) First coefficient clusters in our sample are of 18 Note that the sample size can also serve as an indicator for estimation precision of coefficients as it is proportional to the
inverse of the standard error (Stanley 2005)
26
considerably different sizes with a large number of clusters that contain a single observation only19
Nelson and Kennedy (2009) point out that employing the fixed effects estimator to such panels is
disadvantageous as studies with a single observation will be eliminated from the estimation procedure
Second application of the fixed effects estimator leads to inefficient estimates of (8) to (10) as study-
specific fixed effects significantly decrease the degrees of freedom (Baltagi 2008 Nelson and
Kennedy 2009) Third to generate unbiased coefficients of (8) to (10) the random effects estimator
requires zero correlation between the random effect and the explanatory variables (ie the standard
errors as well as the variables in ) (Baltagi 2008 Stanley and Doucouliagos 2013 2015) Due to
these disadvantages and the predominance of WLS in MRA models we consider the WLS estimations
with study-cluster robust standard errors of (8) (9) and (10) as our main results while results with
wild-bootstrapped standard errors shall serve as robustness checks
44 META REGRESSION RESULTS
To get an initial impression of publication bias we follow the procedure used in prior MRAs (Card and
Krueger 1995 Hirsch 2018 Stanley and Doucouliagos 2012) and first estimate equations (8) to (10)
without including the set of explanatory variables x The results are reported in Table 2 In the
interpretation we focus on the WLS estimations of (8) to (10) with study-cluster robust standard errors
as our main results (columns 4-6) The constant of each model indicates mean dividend smoothing
19 We observe 13 studies that report just one coefficient The maximum number of coefficients that a single study reports
amounts to 57 The average number of coefficients reported in the included studies is 989 A standard deviation of
1104 shows that the coefficient clusters in our sample are of considerably different size
27
corrected for publication bias Columns 4-6 reveal that this value is between 0707 and 0755 and thus
close to the average of the 10 most precise measures derived as the proxy for lsquotruersquo smoothing above
(0728) The test for a significant impact of the constant ie the PET test (Stanley 2005 2008) indicates
for all specifications the presence of a significant smoothing effect
[Insert Table 2 about here]
As rejecting 0ˆ10 == βH points towards skewness of the funnel plot (Figure 1) this test is also known
as the funnel asymmetry test (FAT) (Stanley 2005 2008) The models that account for the standard
error as independent variable in a linear way confirm the initial tendency of a publication bias revealed
by the funnel plot The results reveal a negative and significant relationship with the exception of an
insignificant (and still) negative effect when wild-bootstrapped standard errors are used The negative
sign indicates that there might be either a tendency towards reporting low dividend smoothing
coefficients (high speed of adjustment coefficients) However as indicated above the funnel plot points
to the existence of bi-directional publication bias We address this issue through equations (9) and (10)
by considering different impacts of the standard error depending on the magnitude of the estimated
dividend smoothing coefficient The results are in favor of publication biases towards high and low
dividend smoothing effects respectively We find a significant and negative impact of the (squared)
standard error for dividend smoothing coefficients smaller or equal to 05 which is higher in magnitude
than the positive impact of the standard error for dividend smoothing coefficients larger than 05 In
addition the coefficient of the standard error for high dividend smoothing coefficients is significant in
two out of six specifications whereas the coefficient for low dividend smoothing coefficients is
negatively significant in five out of six specifications
28
[Insert Table 3 about here]
As already noted a possible publication bias within subsamples related to countries industries or other
study design characteristics can only be detected by controlling for these factors in a multivariate
MRA Table 3 reports the results of various specifications of the multivariate regression models (8) to
(10) Panel A contains the results based on equation (8) Panel B refers to the results based on equations
(9) and (10) (standard error interacted with dummies for low and high dividend smoothing
coefficients) The base category (captured in the constant) refers to the degree of dividend smoothing
generated by OLS estimations of the classical Lintner model corrected for publication bias and using
pre-1998 data Note that the regression coefficients are to be interpreted accordingly ie a specific
coefficient indicates how the related characteristic addssubtracts dividend smoothing with respect to
this base group In line with the univariate results the results show a negative impact when we account
for the standard error in a linear manner (equation (8)) However the coefficient for the standard error
is not significant when we focus on the WLS estimations of (8)) with study-cluster robust standard
errors as our main results Compared to our univariate analysis we find even stronger support for a bi-
directional publication bias All coefficients for the standard error are statistically significant and have
the expected sign Thus when study design characteristics are considered our results corroborate the
finding towards the presence of publication bias in favor of statistically significant smoothing
coefficients as well as speed of adjustment coefficients (ie low smoothing coefficients)20
Surprisingly the working paper dummy is found to be statistically significant and positive which
20 In unreported robustness checks we use the mean and median of all 979 dividend smoothing coefficients as different
cutoffs to distinguish between studies focusing on high and low dividend smoothing (speed of adjustment) The results
are robust to this specification Results of all robustness checks are available upon request
29
indicates that working papers reports significantly higher dividend smoothing coefficients Rusnak et
al (2013) argue that working papers already take into account the publication process and therefore do
not differ much from published papers with respect to a tendency of reporting significant coefficient
estimates This implies that working papers which are older than 5 years report significantly higher
dividend smoothing coefficients and likely do not suffer from the file drawer problem21
Moreover the multivariate MRA reveals several important findings with respect to the study design
factors affecting the heterogeneity in reported dividend smoothing coefficients As the base category
we use the classical Lintner model (equation 4) estimated using OLS and pre-1998 US data published
in an academic journal The constants of our main results ndashWLS with cluster robust standard errors
reported in column 2 in Panel A and columns 3-4 in Panel Bndash reveal a significant degree of dividend
smoothing for the base category ranging from 0657 to 0678 This degree is in line with Lintner (1956)
who finds a very similar smoothing coefficient of 23 for the US
Several studies (eg Choe 1990 Brav et al 2005 Andres et al 2015) find evidence that the degree of
dividend smoothing has increased in recent years possibly due to the emergence of stock repurchases as
an additional method to disburse temporary earnings If anything our results indicate a slight evidence
for lower dividend smoothing in more recent years (the respective coefficient of the variable capturing
whether the mean sample period is gt1998 is statistically significant in three cases and always
negative)22 We also find no evidence that the length of the analyzed time series impacts the degree of
dividend smoothing (the coefficient has the expected negative sign but is only significant in two 21 The results are robust to an alternative time frame of three years
22 As a robustness check we classify studies as rdquopost-1998ldquo if their sample period begins in 1999 or later The results are
robust to this alternative specification
30
regression models and insignificant in our main regression models with cluster robust standard errors)
In contrast extensions of the classical Lintner model controlling for ownership find significantly higher
dividend smoothing This lends to support of agency conflicts as a primary driver of dividend
smoothing (Leary and Michaely 2011) Agency models as presented by Jensen (1986) and Easterbrook
(1984) underline the importance of dividend smoothing as a disciplining device for managers to raise
external finance from capital markets Our results underline the importance of ownership as moderator
for agency conflicts between managers and shareholders and determinant of dividend smoothing
Whether studies control for size debt or other firm characteristics does not have a significant impact
on resulting dividend smoothing coefficients Moreover we find evidence that modifications of the
classical Lintner model using cash flow instead of earnings measures detect significantly higher
smoothing effects Based on these results firms adjust dividends faster to changes in earnings than to
changes in cash-flows
Our results provide evidence that the use of the econometric technique has a significant impact on
estimated dividend smoothing coefficients We find that the GMM estimator reduces the upward bias
in dividend smoothing that emerges if (8) to (10) are estimated using OLS Similarly using fixed
effects (within) estimation leads to significant lower smoothing coefficients compared to the base
category OLS Note that applying fixed effects estimation to autoregressive processes such as (8) to
(10) leads to a downward biased estimate of dividend smoothing23
23 As the category lsquoother estimatorsrsquo comprises multiple different estimation techniques such as probit logit or random
effects as a robustness check we have excluded all observations related to this category Even after excluding these
observations we do not find significant differences in reported dividend smoothing coefficients across estimation
techniques
31
The presence of dividend smoothing is particularly well documented for firms in the US Several
studies suggest that dividend smoothing is higher in the US than in other countries For instance
Andres et al (2009) document a more flexible dividend payout for German firms whereas Chemmanur
et al (2010) and Dewenter and Warther (1998) document lower dividend smoothing for firms in Hong
Kong and Japan In contrast to this our results do not suggest significant differences in smoothing
effects across different countries In a robustness check we follow a broader classification of countries
by La Porta et al (1998 2000) La Porta et al (1998 2000) relate investor protection financing
conditions and payout policy to the legal origin of countries and distinguish between common law and
civil law counties Using this classification we find lower dividend smoothing for Scandinavian civil
law countries relative to German civil law French civil law and common law countries However we
do not find systematic differences in dividend smoothing between common and civil law countries or
within common law countries such as the UK and the US Overall our results lend support to dividend
smoothing as a global rather than country-specific phenomenon
Finally the results do not reveal that studies with a focus on firms that operate in the service and
consumer goods sector generate significantly different dividend smoothing coefficients while
significant higher dividend smoothing effects can be detected for firms operating in the financial
sector24 Variance Inflation Factors indicate that multicollinearity among the set of explanatory
variables (x) is not present Model diagnostics reveal the overall significance of our specifications and
24 As firms from the financial sector are subject to different regulatory requirements we consider only those studies that
explicitly exclude firms from the financial sector in a robustness check Based on the remaining 29 studies with 397
observations we do not find significant differences in the drivers dividend smoothing coefficients relative to the whole
sample
32
adjusted R2 values amount to 478 up to 608 The fact that R2 is significantly higher for the
specifications that consider bi-directional publication bias ((9) and (10)) compared to equation (8)
reveals the superiority of the former specifications
As our study design controls for many different factors that may have an impact on the reported
dividend smoothing parameter and theory provides us with little guidance on the factors that should be
included in a meta-regression analysis we also investigate the main drivers of the dividend smoothing
parameters by Bayesian model averaging (BMA) (Raftery et al 1997) BMA provides averages for
posterior mean values and standard errors after running all combinations of a predefined set of
explanatory variables (in our case 220 combinations) We follow the procedure in Zigraiova and
Havranek (2016) and run a reduced model using all variables with a posterior inclusion probability
larger than 05 identified by BMA as explanatory variables The results reported in Table A2 of the
appendix corroborate our earlier findings and identify the choice of the earnings measure the
econometric technique used as well as the publication status as the main drivers of the heterogeneity of
reported dividend smoothing coefficients
Finally to assess the robustness of the results with respect to the weighting strategy used and the
handling of extreme values we estimated several further model specifications First we followed
Zigraiova and Havranek (2016) and present results from specifications weighted by the inverse of the
number of estimates reported per study This gives the same importance to each study in the estimation
by mitigating the effect of articles contributing a large number of coefficients Second for the whole
sample (without exclusion of unreasonable values using the bacon algorithm) we estimate robust 05-
quantile (median) regressions The results are reported in Tables A3 and A4 and undermine our main
findings regarding the direction of publication bias and the importance of the econometric estimator
33
applied There are some differences that are mainly related to the variables capturing the analyzed
country or industry for which the robustness checks tend to produce a higher number of significant
results However these variables have not been identified as explanatory variables with a high PIP in
the BMA and thus do not alter our conclusions regarding the main drivers of reported dividend
smoothing coefficients
5 Conclusion
Our MRA sheds light on the reasons for heterogeneous results reported in the empirical literature on
dividend smoothing using a large set of 99 empirical studies and 979 dividend smoothing coefficients
that relate to different time periods countries industries and econometric methods The MRA reveals
that the variability in reported smoothing coefficients is driven by publication bias towards high
dividend smoothing or high speed of adjustment coefficients We find that peer-reviewed publications
based on an OLS estimation of the classical Lintner model corrected for publication bias and using
pre-1998 US data report on average a significant degree of dividend smoothing ranging from 0657 to
0678
Analyzing post-1998 data does not reveal higher dividend smoothing in more recent years This is in
line with the findings of Leary and Michaely (2011) for the US who find that stock repurchases as an
additional payout channel in recent years cannot explain the heterogeneity in reported dividend
smoothing coefficients However we detect a large number of other factors that explain the variability
in dividend smoothing coefficients Our results suggest that accounting for ownership structure among
the set of control variables is important when explaining different degrees of dividend smoothing We
find that the inclusion of ownership characteristics significantly increases estimated smoothing
34
coefficients Moreover we find significant differences in results across the estimation techniques used
Studies using GMM estimation techniques or fixed effects estimators find a considerably lower degree
of dividend smoothing (-0219 and -0205) compared to studies employing OLS estimators Differences
in dividend smoothing do not seem to be driven by the country
Overall the results of our MRA provide a summarizing picture of the large amount of literature on
dividend smoothing and allow to derive average smoothing effects for different regions sectors time
periods or estimation techniques Under the assumption that lsquobest practicersquo in dividend smoothing
estimation requires the inclusion of all relevant firm specific control variables and the GMM estimation
technique our MRA predicts (using earnings as profit measure) average smoothing effects of 0536 for
firms that do not operate in the financial sector
The MRA results provide important insights for future research on this topic Dividend smoothing
estimates differ significantly depending on the inclusion of ownership as a driver of estimated dividend
smoothing effects Researchers should therefore consider the inclusion of ownership characteristics
when estimating dividend smoothing In case ownership characteristics are not available due to data
limitations researchers should discuss the consequences of the corresponding omitted variable bias
Our results provide support for significant differences in reported dividend smoothing effects for
different estimation techniques As the upward (downward) bias of the OLS (fixed effects) estimator is
well-known for AR(1)-type regressions in future studies researchers should carefully consider the
choice of the estimation technique In line with previous literature future research should interpret
results under careful consideration of the specifics of the analyzed industries Based on our analysis it
is of particular relevance whether the study focuses on non-financial firms only
35
Previous studies consider dividend smoothing as a general phenomenon that has increased in recent
years In contrast to this prevailing opinion our MRA does not provide evidence for a general recent
trend of higher dividend smoothing Thus analyzing the development of dividend smoothing over time
and under consideration of different country settings might be a fruitful area for future research (Farre-
Mensa et al 2014) In general future research should consider the fact that study design characteristics
can have an important impact on dividend smoothing effects and the results should hence be interpreted
accordingly
Our results are also important from an investor perspective Whereas Leary and Michaely (2011) find
evidence that dividend smoothing is used to cope with free-cash flow problems dividend smoothing
might be an agency problem in itself (Lambrecht and Myers 2012) Depending on the two different
views our results based on dividend smoothing allow investors to assess the severity of agency
conflicts that they can expect depending on the industry they would like to invest in Thus investors
should take into account that study design characteristics have an important impact on the resulting
dividend smoothing effects and should build their expectation regarding returns accordingly
36
References
Abdullah NMH Ahmad Z Roslan S (2012) The Influence of Ownership Structure on the Firms
Dividend Policy Based Lintner Model International Review of Business Research Papers 8(6) 71-88
Adelegan O (2003) An Empirical Analysis of the Relationship between Cash Flow and Dividend
Changes in Nigeria RampD Management 15(1) 35-49 Ahmed H Javid AY (2008) Dynamics and determinants of dividend policy in Pakistan (evidence
from Karachi stock exchange non-financial listed firms) MPRA Paper No 37342 Ahmed H Javid AY (2009) Dynamics and Determinants of Dividend Policy in Pakistan (Evidence
from Karachi Stock Exchange Non-Financial Listed Firms) International Research Journal of Finance and Economics 25(3) 148-171
Aivazian VA Booth L Cleary S (2006) Dividend Smoothing and Debt Ratings Journal of
Financial and Quantitative Analysis 41(2) 439-453 Al-Ajmi J (2010) Modelling the dividend policy of banks in Gulf Cooperation Council countries
Applied Economics Letters 17(14) 1423-1428 Al-attar AM Al-Shattarat HK Yusuf AN (2015) The effects of contextual factors on
disaggregated earnings in explaining dividend changes in Jordanian firms International Journal of Commerce and Management 25(2) 218-239
Allen F Bernardo A Welch I (2000) A theory of dividends based on tax clientele Journal of
Finance 55(6) 2499-2536 Al-Malkawi H-A Bhatt M I Magableh S (2014) On the dividend smoothing signaling and the
global financial crisis Economic Modelling 42 159-165 Al-Najjar B (2009) Dividend behaviour and smoothing new evidence from Jordanian panel data
Studies in Economics and Finance 26(3) 182-197 Al-Najjar B Belghitar Y (2012) The information content of cash flows Economic Issues 17(2) 57-
70 Al-Yahyaee KH Pham TM Walter TS (2010) Dividend stability in a unique environment
Managerial Finance 36(10) 903-916 Al-Yahyaee KH Pham TM Walter TS (2011) Dividend smoothing when firms distribute most
of their earnings as dividends Applied Financial Economics 21(16) 1175-1183
37
Alzahrani M Lasfer M (2009) The Impact of Taxation on Dividends A Cross-Country Analysis
Working paper King Fahd University of Petroleum amp Minerals Dhahran Ameer R (2007) Dividend Payout of the Property Firms in Malaysia Pacific Rim Property Research
Journal 13(4) 451-472 Ameer R (2008) Product market competition regulation and dividend payout policy of Malaysian
Banks Journal of Financial Regulation and Compliance 16(4) 318-334 Andres C Betzer A Goergen M Renneboog L (2009) Dividend policy of German firms A panel
data analysis of partial adjustment models Journal of Empirical Finance 16(2) 175-187 Andres C Betzer A van den Bongard I Goergen M (2014) Dividend Policy Corporate Control
and the Tax Status of the Controlling Shareholder Working paper Schumpeter School of Business and Economics Bergische Universitaumlt Wuppertal
Andres C Doumet M Fernau E Theissen E (2015) The Lintner model revisited Dividends
versus total payouts Journal of Banking and Finance 55 56-69 Arellano M Bond S (1991) Some tests of specification for panel data Monte Carlo evidence and an
application to employment equations Review of Economic Studies 58 (2) 277-297 Arellano M Bover O (1995) Another look at the instrumental variable estimation of error-
components models Journal of Econometrics 68 29ndash51 Arko AC Abor J Adjasi CKD Amidu M (2014) What influence dividend decisions of firms in
Sub-Saharan African Journal of Accounting in Emerging Economies 4(1) 57-78 Athari SA Adaoglu C Bektas E (2016) Investor protection and dividend policy The case of
Islamic and conventional banks Emerging Markets Review 27 100-117 Baba N Ueno Y (2008) Are stock repurchases more flexible than dividends The case of Japanese
firms Applied Financial Economics Letters 4(5) 315-318 Baiyao Z (2011) Dividend Policy in Mainland China and USA Bachelor thesis Hong Kong Baptist
University Baker HK Chang B Dutta S Saadi S (2013) Canadian corporate payout policy International
Journal of Managerial Finance 9(3) 164-184 Bakucs Z Falkowski J Fertouml I (2014) Does Market Structure Influence Price Transmission in the
Agro-food Sector A Meta-analysis Perspective Journal of Agricultural Economics 65(1) 1-25
38
Baltagi BH (2008) Econometric Analysis of Panel Data Chichester UK John Wiley amp Sons Bawa KS Kaur P (2012) Empirical validity of Dividend Policy Models in The Indian
Manufacturing MSMEs International Journal of Multidisciplinary Management Studies 2(1) 18-39 Banks S Cheffins B Goergen M (2009) Dividends and politics European Journal of Political
Economy 25(2) 208-224 Behm U Zimmermann H (1993) The empirical relationship between dividends and earnings in
Germany Zeitschrift fuumlr Wirtschafts- und Sozialwissenschaften 113(2) 225-254 Benavides J Berggrun L Perafan H (2016) Dividend payout policies Evidence from Latin
America Finance Research Letters 17 197-210 Benhamouda Z (2007) UK corporate share repurchases an empirical analysis of corporate motives
and payout policies Durham theses Durham University Available at Durham E-Theses Online httpethesesduracuk2137
Benzinho J (2004) The dividend policy of the Portuguese corporations Evidence from Euronext
Lisbon Working paper ISCAC Coimbra Business School Bhattarchya S (1979) Imperfect Information Dividend Policy and The Bird in the Hand Fallacy
The Bell Journal of Economics 10(1) 259-270 Billor N Hadi AS Velleman PF (2000) BACON blocked adaptive computationally efficient
outlier nominators Computational Statistics amp Data Analysis 34 279-298 Blundell R Bond S (1998) Initial conditions and moment restrictionsin dynamic panel data models
Journal of Econometrics 87 115-143 Bodla BS Pal K Sura JS (2007) Examining Application of Lintners Dividend Model in Indian
Banking Industry ICFAI Journal of Bank Management 6(4) 40-59 Bom PRD Ligthart JE (2009) How productive is public capital A meta-regression analysis
Working Paper 09-12 International Studies Program Georgia State University Boţoc C Pirtea M (2014) Dividend Payout-Policy Drivers Evidence from Emerging Countries
Emerging Markets Finance and Trade 50(4) 95-112 Brav A Graham JR Harvey CR Michaely R (2005) Payout policy in the 21st century Journal
of Financial Economics 77(3) 483-527 Bremberger F Cambini C Gugler K Rondi L (2016) Dividend Policy in Regulated Network
Industries Evidence from the EU Economic Inquiry 54(1) 408ndash432
39
Brittain JA (1964) The Tax Structure and Corporate Dividend Policy American Economic Review
54(3) 272-287 Cameron AC Gelbach JB Miller DL (2008) Bootstrap-based Improvements for Inference with
Clustered Errors Review of Economics and Statistics 90(3) 414-427 Card D Krueger AB (1995) Time-Series Minimum-Wage Studies A Meta-Analysis American
Economic Review 85(2) 238-243 Card D Kluve J Weber A (2010) Active Labour Market Policy Evaluations A Meta- Analysis
Economic Journal 120 (548) 452-477 Chan KF Powell JG Shi J Smith T (2016) Dividend persistence and dividend behavior
Accounting and Finance doi 101111acfi12208 Chemmanur TJ He J Hu G Liu YH (2010) Is dividend smoothing universal New insights
from a comparative study of dividend policies in Hong Kong and the US Journal of Corporate Finance 16(4) 413-430
Chen X Sinha A K (2016) Large Shareholders and Dividends Game Theoretic Analysis of
Shareholder Power Working paper California State University Bradley University Choe H (1990) Intertemporal and Cross-sectional Variation of Corporate Dividend Policy PhD
Dissertation University of Chicago Correia da Silva L Goergen M Renneboog L Dividend policy of German firms A dynamic panel
data analysis of partial adjustment models Working paper Cardiff University Oxford Economic Research Associates Tilburg University
Dai Q (2007) Influence of a Tax Reform on Dividend Clienteles Working paper Binghamton
University Darling PG (1957) The Influence of Expectations and Liquidity on Dividend Policy Journal of
Political Economy 65(3) 209-224 DeAngelo H De Angelo L Skinner D (2004) Are dividends disappearing Dividend concentration
and the consolidation of earnings Journal of Financial Economics 72(3) 425-456 DeAngelo H De Angelo L Skinner D (2008) Corporate Payout Policy Foundations and Trends in
Finance 3(2-3) 95-287
40
DeAngelo H DeAngelo L (2000) Controlling stockholders and the disciplinary role of corporate payout policy - a study of the Times Mirror company Journal of Financial Economics 56(2) 153-207
Demena BA van Bergeijk PAG (2017) A Meta-Analysis of FDI and Productivity Spillovers in
Developing Countries Journal of Economic Surveys 31(2) 546-571 DerSimonian R Laird N (1986) Meta-analysis in clinical trials Controlled Clinical Trials 7(3) 177-
188 Desai MA Foley CF Hines Jr JR (2001) Repatriation Taxes and Dividend Distortions National
Tax Journal 54(4) 829-851 Dewenter KL Warther VA (1998) Dividends Asymmetric Information and Agency Conflicts
Evidence from a Comparison of the Dividend Policies of Japanese and US Firms Journal of Finance 53(3) 879ndash904
Dharan BG (1988) The Association between Corporate Dividends and Current Cost Disclosure
Journal of Business Finance amp Accounting 15(2) 215-230 Doucouliagos H Laroche P Stanley TD (2005) Publication Bias in Union-Productivity Research
Relations industrielles Industrial Relations 60(2) 320-347 Easterbrook FH (1984) Two Agency-Cost Explanations of Dividends American Economic Review
74(4) 650-659 Esteban JMD Peacuterez OLdF (2001) Dividend Policy of European Banks Working paper
Universidad de Burgos Fama EF (1974) The Empirical Relationships between the Dividend and Investment Decisions of
Firms American Economic Review 64(3) 304-318 Fama EF Babiak H (1968) Dividend Policy An Empirical Analysis Journal of the American
Statistical Association 63(324) 1132-1161 Farre-Mensa J Michaely R Schmalz M (2014) Payout Policy Annual Review of Financial
Economics 6 75-134 Feld LP Heckemeyer JH Overesch M (2013) Capital structure choice and company taxation A
meta-study Journal of Banking amp Finance 37(8) 2850ndash2866 Feldstein MS (1970) Corporate Taxation and Dividend Behaviour Review of Economic Studies
37(1) 57-72
41
Foerster SR Sapp SG (2006) The changing role of dividends a firm-level study from the nineteenth to the twenty-first Century Canadian Journal of Economics 39(4) 1316-1344
Garrett I Priestley R (2000) Dividend Behavior and Dividend Signaling Journal of Financial and
Quantitative Analysis 35(2) 173-189 Goncharov I Triest S v (2011) Do fair value adjustments influence dividend policy Accounting
and Business Research 41(1) 51-68 Grullon G Michaely R (2002) Dividends Share Repurchases and the Substitution Hypothesis
Journal of Finance 57(4) 1649-1684 Gugler K (2003) Corporate governance dividend payout policy and the interrelation between
dividends RampD and capital investment Journal of Banking and Finance 27 1297-1321 Gugler K Yurtoglu BB (2003) Corporate governance and dividend payout policy in Germany
European Economic Review 47(4) 731-758 Gunathilaka C (2014) What Drives the Payout Policy Evidence from Sri Lanka A Dynamic Panel
Data Analysis Wayamba Journal of Management 3(2) 1-16 Haddad AE Al Shattarat WK Al-Hamadeen RM (2008) Partial-Adjustment-Models of Dividend
Policy Behaviour for Industrial Jordanian Firms Corporate Ownership amp Control 5(4) 356-372 Haleem F Javid AY (2011) Modeling Dividend Behavior in Pakistan Information Management
and Business Review 3(6) 289-301 Hayunga DK Stephens CP (2009) Dividend behaviour of US equity REITs Journal of Property
26(2) 105-123 Hines Jr JR Desai MH Foley CF (2007) Dividend Policy Inside the Multinational Firm
Financial Management 36(1) 5-26 Hines JR Jr (1996) Dividends and Profits - Some Unsubtle Foreign Influences Journal of Finance
51(2) 661-689 Hirsch S (2018) Successful in the long run A meta-regression analysis of persistent firm profits
Journal of Economic Surveys 32(1) 23-49 Hsiao C (1986) Analysis of Panel Data Cambridge University Press Cambridge Hussain J (2011) Corporate dividends decisions evidence from Saudi Arabia Journal of Risk
Finance 12(1) 41-56
42
Hutagalung S Yahya MH Kamarudin F Osman Z (2013) The Dividend Payout Policy ndash A Study on Malaysian Financial Institutions Pertanika J Soc Sci amp Hum 21(S) 127-148
Jagannathan M Stephens CP Weisbach M (2000) Financial flexibility and the choice between
dividends and stock repurchases Journal of Financial Economics 57(3) 355-384 Jarrell SB Stanley TD (1990) A Meta-Analysis of the Union-Nonunion Wage Gap Industrial amp
Labor Relations Review 44 54-67 Jensen MC (1986) Agency Costs of Free Cash Flow Corporate Finance and Takeovers American
Economic Review 76(2) 323-329 Kamat MS Kamat MM (2012) An Application of Partial Adjustment Equation in Determining
Payout Behavior using an Extended Instrumental Variable Approach Working paper VVMs Shree Damodar College Goa University
Kamat MS Kamat MM (2013) Economic reforms determinants and stability of dividends in a
dynamic setting Journal of Asia Business Studies 7(1) 5-30 Kanoja S Bhatia BS (2013) Dividend Decisions and Payout Policy An Empirical Analysis of
Listed Indian Companies Working paper University of Delhi Karathanassis GA Chrysanthopoulou ECh (2005) The relationship Between Ownership Structure
and Corporate Dividend Policy ndash Evidence from the Athens Stock Exchange Working paper Athens University of Economics and Business
Khan T (2006) Company Dividends and Ownership Structure Evidence from UK Panel Data The Economic Journal 116(510) C172-C189 Kim J Jeon Y (2015) Dividend Policy and Corporate Social Responsibility A Comparative
Analysis of Multinational Enterprise Subsidiaries and Domestic Firms in Korea Emerging Markets Finance and Trade 51(2) 306-319
Kinfe T (2011) Determinants of Dividend payout An Empirical Study on Bank Industry in Ethiopia
Master thesis Addis Ababa University School of Business and Public Administration Department of Accounting and Finance School of Graduate Studies
Korkeamaki T Liljeblom E Pasternack D (2010) Tax reform and payout policy Do shareholder
clienteles or payout policy adjust Journal of Corporate Finance 16(4) 572-587 Kumar J (2003) Ownership Structure and Dividend Payout Policy in India Working paper Indira
Gandhi Institute of Development Research
43
Kumar R Kumar Jha P (2012) Determinants of Corporate Dividend Policy in India - A Study of Listed IT Companies at BSE Working paper Faculty of Management Studies BHU
La Porta R Lopez-de-Silanes F Shleifer A Vishny RW (1998) Law and Finance Journal of
Political Economy 106(6) 1133-1155 La Porta R Lopez-de-Silanes F Shleifer A Vishny RW (2000) Agency Problems and Dividend
Policies around the World Journal of Finance 55(1) 1-33 Lambrecht BM Myers S C (2012) A Lintner model of payouts and managerial rents Journal of
Finance 67(5) 1761ndash1810 Leary MT Michaely R (2011) Determinants of Dividend Smoothing Empirical Evidence Review
of Financial Studies 24(10) 3197-3249 Lintner J (1956) Distribution of incomes of corporations among dividends retained earnings and
taxes American Economic Review 46(2) 97-113 Longhi S Nijkamp P Poot J (2005) A Meta-Analysis Assessment of the Effect of Immigartion on
Wages Journal of Economic Surveys 19(3) 451-477 Manconi A Peyer U Vermaelen T (2017) Are Buybacks Good for Long-Term Shareholder Value
Evidence from Buybacks around the World European Corporate Governance Institute (ECGI) - Finance Working Paper No 4362014 INSEAD Working Paper No 2013101FIN
McDonald JG Jacquillat B Nussenbaum M (1975) Dividend Investment and Financing
Decisions Empirical Evidence on French Firms Journal of Financial and Quantitative Analysis 10(5) 741-755
McDonald R Soderstrom N (1986) Dividend and Share Changes Is There a Financing Hierarchy
NBER working paper series Working Paper No 2029 MacKinnon JG Webb MD (2017) Wild Bootstrap Inference for Wildly Different Cluster Sizes
Journal of Applied Econometrics 32(2) 233-254 Michaely R Roberts MR (2012) Corporate Dividend Policies Lessons from Private Firms Review
of Financial Studies 25(3) 711-746 Miller MH Rock K (1985) Dividend Policy under Asymmetric Information Journal of Finance
40(4) 1031-1051 Miller M Scholes M (1978) Dividends and Taxes Journal of Financial Economics 6(4) 333-364
44
Modigliani F Miller M (1958) The Cost of Capital Corporation Finance and the Theory of Investment American Economic Review 48(3) 261ndash297
Mohsin HM Ashraf MS (2011) Monetary policy restriction and dividend behavior of Pakistani
firms an empirical analysis MPRA Paper No 34052 Mollah Sabur A (2009) Testing Partial Adjustment Dividend Behavioral Models in Emerging
Markets Evidence from Pre and Post Market Reforms in Bangladesh Global Journal of Business Research 3(1) 1-14
Mookerjee R (1992) An empirical investigation of corporate dividend pay-out behaviour in an
emerging market Applied Financial Economics 2(4) 243-246 Mueller DC (1967) The Firm Decision Process An Econometric Investigation The Quarterly
Journal of Economics 81(1) 58-87 Naceur S Goaied M Belanes A (2006) On the Determinants and Dynamics of Dividend Policy
International Review of Finance 6(1-2) 1-23 Naceur S Goaied M Belanes A (2016) A Re-examination of Dividend Policy A Dynamic Panel
Data Analysis Working paper ESSEC Tunis IHEC Carthage Nakamura A (1985) Rational Expectations and the Firms Dividend Behavior Review of Economics
and Statistics 67(4) 606-615 Nakamura M (1989) Asymmetry in the Dividend Behavior of US and Japanese Firms Managerial
and Decision Economics 10(4) 261-274 Nelson JP Kennedy PE (2009) The Use (and Abuse) of Meta-Analysis in Environmental and
Natural Resource Economics An Assessment Environmental and Resource Economics 42(3) 345-377
Nickell S (1981) Biases in Dynamic Models with Fixed Effects Econometrica 49(6) 1417-1426
Oczkowski E Doucouliagos H (2014) Wine Prices and Quality Ratings a Meta-Regression Analysis American Journal of Agricultural Economics 97(1) 103-121
Omet G (2004) Dividend Policy Behaviour in the Jordanian Capital Market International Journal of
Business 9(3) 287-300 Pal K Goyal P (2007) Leading Determinants of Dividend Policy A Case Study of the Indian
Banking Industry Decision 34(2) 88-112
45
Pandey IM Bhat R (2007) Dividend behavior of Indian companies under monetary policy Managerial Finance 33(1) 14-25
Pandey IM (2003) Corporate Dividend Policy and Behaviour The Malaysian Evidence Asian
Academy of Management Journal 8(1) 17ndash32 Perez-Gonzalez F (2003) Large Shareholders and Dividends Evidence from US Tax Reforms
Working paper Columbia University Persson R (2013) Dividend policy behavior An analysis of firms listed at Stockholm Stock
Exchange Bachelor thesis Uppsala University Department of Economics EKONOMIKUM - Centre for Economic Sciences
Pindado J Requejo I Torre C de la (2012) Do Family Firms Use Dividend Policy as a Governance
Mechanism Evidence from the Euro zone Corporate Governance An International Review 20(5) 413-431
Post C Byron K (2015) Women on boards and firm financial performance A meta-analysis
Academy of Management Journal 58(5) 1546-1571 Powell JG Shi J Smith T (2004) Dividend persistence and return predictability Working paper
School of Finance and Applied Statistics Faculty of Economics and Commerce The Australian National University Canberra
Raftery AE Madigan D Hoeting JA (1997) Bayesian model averaging for linear regression
models Journal of the American Statistical Association 92 179ndash191 Rahman N (2002) Ownership structure and dividend smoothing cross-country evidence Working
paper University of Chicago Graduate School of Business Raza S H Zahaar M Hafeez M (2009) The Ownership Structure and Dividend Payout Policy in
Pakistan Evidence from KSE-100 index Non-financial Firms Pakistan Journal of Education 26(1) 173-188
Renneboog L Szilagyi PG (2015) How Relevant is Dividend Policy under Low Shareholder
Protection Journal of International Financial Markets Institutions and Money Advance online publication DOI 101016jintfin201501006
Renneboog L Trojanowski G (2007) Control structures and payout policy Managerial Finance
27(3) 180-194 Rusnak M Havranek T Horvath R (2013) How to Solve the Price Puzzle A Meta‐Analysis
Journal of Money Credit and Banking 45(1) 37-70
46
Sembenelli A (1993) Signalling Financial Hierarchy and Agency Theory as Explanations for Dividend Behavior Evidence from Italian Firm Data Managerial and Decision 14(1) 37-45
Shinozaki S Uchida K (2015) Ownership structure and dividend smoothing International evidence
Working paper Faculty of Economics Kyushu University Short H Zhang H Keasey K (2002) The link between dividend policy and institutional ownership
Journal of Corporate Finance 8(2) 105-122 Simegen M (2013) Determinants of Dividend Policy of Banks in Ethiopia Master thesis Addis
Ababa University College of Accounting and Finance School of Graduate Studies Skinner D (2008) The evolving relation between earnings dividends and stock repurchases Journal
of Financial Economics 87(3) 582-609 Stanley TD (2001) Wheat from Chaff Meta-Analysis as Quantitative Literature Review Journal of
Economic Perspectives 15(3) 131-150 Stanley TD (2005) Beyond Publication Bias Journal of Economic Surveys 19(3) 309-345 Stanley TD (2008) Meta-Regression Methods for Detecting and Estimating Empirical Effects in the
Presence of Publication Selection Oxford Bulletin of Economics and Statistics 70(1) 103-127 Stanley TD Doucouliagos H (2010) Picture This A Simple Graph That Reveals Much Ado About
Research Journal of Economic Surveys 24(1) 170-191 Stanley TD Doucouliagos H (2012) Meta-regression Analysis in Economics and Business Oxford
UK Routledge Stanley TD Doucouliagos H (2013) Better than Random Weighted Least Squares Meta
Regression Analysis University of Australia School of Accounting Economics and Finance Economics Series Working Paper SWP 20132
Stanley TD Doucouliagos H (2015) Neither fixed nor random weighted least squares meta-
analysis Statistics in Medicine 34 2116-2127 Stanley TD Jarrell B (1989) Meta-Regression Analysis A Quantitative Method of Literature
Journal of Economic Surveys 3(2) 161-170 Stanley TD Doucouliagos H Giles M Heckemeyer JH Johnston RJ Laroche P Nelson JP
Paldam M Poot J Pugh G Rosenberger RS Rost K (2013) Meta-Analysis of Economics Research Reporting Guidelines Journal of Economic Surveys 27(2) 390-394
47
Sudhahar M Saroja T (2010) Determinants of Dividend Policy in Indian Banks An Empirical Analysis Journal of Bank Management 9(3) 63-75
Sura JS Pal K Bodla BS (2006) Factors Influencing Dividend Policy Decisions in Banking
Sector An Indian Evidence Amity Business Review 7(2) 64-75 Tran QT Nguyen TTH (2014) Dividend Policy Behavior in Emerging Stock Markets Evidence
from Vietnamese Stock Market International Journal of Financial Research 5(4) 85-89 Trojanowski G (2004) Ownership structure and payout policy in the UK Working paper University of Exeter Business School Trotman KT Wood R (1991) A Meta-Analysis of Studies on Internal Control Judgements Journal
of Accounting Research 29(1) 180-192 Turnovsky SJ (1967) The Allocation of Corporate Profits between Dividends and Retained Earnings
Review of Economics and Statistics 49(4) 583-589 Valickova P Havranek T Horvath R (2015) Financial Development and Economic Growth A
Meta-Analysis Journal of Economic Surveys 29(3) 506-526 Vasiliou D Eriotis N (2002) The Determinants of Dividend policy some Greek data European
Journal of Management and Public Policy 1(2) 46-56 Wang K Shailer G (2015) Ownership concentration and firm performance in emerging markets a
meta-analysis Journal of Economic Surveys 29(2) 199-229 Wang X Manry D Wandler S (2011) The impact of government ownership on dividend policy in
China Advances in Accounting incorporating Advances in International Accounting 27(2) 366-372
Watts R (1973) The Information Content of Dividends Journal of Business 46(2) 191-211 Weber S (2010) bacon An effective way to detect outliers in multivariate data using Stata (and
Mata) The Stata Journal 10(3) 331-338 Younis D Javid AY (2014) Market Imperfections and Dividend Policy Decisions of Manufacturing
Sector of Pakistan PIDE Working Papers 201499 Zameer H Rasool S Iqbal S Arshad U (2013) Determinants of Dividend Policy A Case of
Banking Sector in Pakistan Middle-East Journal of Scientific Research 18(3) 410-424 Zigraiova D Havranek T (2016) Bank Competition and Financial Stability Much Ado about
Nothing Journal of Economic Surveys 30(5) 944-981
48
Tables and Figures
Figure 1 Funnel plot for the dividend smoothing coefficients
Note The dividend smoothing is measured on the x-axis while the y-axis represents precision calculated as the inverse
standard error The vertical line at 0728 indicates the ldquotruerdquo dividend smoothing as the mean of the 10 most precise
smoothing coefficients
49
Table 1 Summary statistics of meta data
Variable label Definition Mean Standard deviation
Dependent Variable
Dividend smoothing (d)
Dividend smoothing coefficient 0562 0325
Precision
Standard error (se)
Standard error of the dividend smoothing coefficient 0093 0102
Study design characteristics
Working Paper The study is a working paper older than 5 years = 1 0 otherwise
0112 0316
Post 1998 The mean year of estimation period gt1998 = 1 0 otherwise 0470 0499 No of years Length of the analyzed time series dimension 12526 11524 Debt Ownership Size Other Lintner classical
Estimation controls for firm debt = 1 0 otherwise Estimation controls for ownership = 1 0 otherwise Estimation controls for firm size =1 0 otherwise Estimation controls for other firm factors =1 0 otherwise Estimation does not include variables in addition to contemporaneous earnings and lagged dividends as independent variables =1 0 otherwise
0104 0166 0139 0419 0420
0306 0373 0346 0494 0494
Cash flow The estimation uses a cash flow measure =1 0 if earnings measure
0113 0317
OLS The estimation is based on OLS =1 0 otherwise 0553 0497
GMM The estimation is based on GMM=1 0 otherwise 0147 0354
Fixed effects The estimation is based on fixed effects = 1 0 otherwise 0157 0364 Other estimators The estimation is based on other methods = 1 0 otherwise 0143 0350 Service and Consumer Goods Financial firms Industry firms
Study analyzes serviceconsumer goods firms =1 0 otherwise Study analyzes financial firms =1 0 otherwise Study analyzes industry sector firms =1 0 otherwise
0015
0150 0061
0123
0357 0240
EU Developing US UK Other countries
Study analyzes a country or several countries from the EU =1 0 otherwise
Study analyzes a developing country or several developing countries =1 0 otherwise Study analyzes the US =1 0 otherwise Study analyzes the UK =1 0 otherwise Study focuses on other countries =1 0 otherwise
0174
0344
0114 0083 0277
0379
0475
0318 0276 0447
Note We use the following reference categories in the MRA classical Lintner model for pre 1998 US data estimated with OLS
50
Table 2 WLS FAT-PET meta-regression analysis results
Variable Robust se
(1)
Robust se
(2)
Robust se
(3)
Study cluster
robust se (4)
Study cluster
robust se (5)
Study cluster
robust se (6)
Wild bootstrap
se clustered by study
(7)
Wild bootstrap
se clustered by study
(8)
Wild bootstrap
se clustered by study
(9)
Constant 0755 (2035)
0732 (2147)
0707 (2481)
0755 (712)
0732 (760)
0707 (777)
0755 [0000]
0732 [0000]
0707 [0000]
SE -3613 (-482) - -3613
(-200) -3613 [0216] -
SE (smoothingle05) -1130 (-1724) -1130
(-481) -1130 [0002]
SE (smoothinggt05) 2526 (264) 2526
(148) 2526 [0246]
SEsup2 (smoothingle05) - -17412 (-385) - -17412
(-261) - -17412 [0148]
SEsup2(smoothinggt05) 4746 (237) 4746
(087) 4746 [0596]
F 2327 2273 1270 398 2273 558 p(F) 0000 0000 0000 0049 0000 0005 R2 0043 0284 0018 0042 0284 0018 0043 0284 0018 Adj R2 0042 0283 0016 Observations 979 979 979 979 979 979 978 978 978
Notes Dependent variable is dividend smoothing coefficient t-values in parentheses p values in brackets significance at the 1
5 10 level Squared standard errors of adjustment coefficients are used as weights
51
Table 3 WLS estimation results of models (8) (9) and (10)
Panel A
Variable
Robust se
(1)
Cluster robust se by study
(2)
Wild bootstrap se clustered by
study (3)
Constant
0678 (823)
0678 (414)
0678 [0072]
se
-1536 (-244)
-1536 (-162)
-1536 [0172]
Working paper 0157 (220)
0157 (193)
0157 [0284]
Post 1998
-0085 (-165)
-0085 (-129)
-0085 [-0372]
No of years
-0004 (-160)
-0004 (-092)
-0004 [0594]
Debt
-0035 (-039)
-0035 (-035)
-0035 [-0830]
Ownership
0077 (245)
0077 (206)
0077 [0000]
Size
0025 (0037)
0025 (0024)
0025 [0868]
Other
0024 (083)
0024 (072)
0024 [0484]
Cash Flow
0371 (548)
0371 (367)
0371 [0010]
GMM
-0219 (-319)
-0219 (-232)
-0219 [0078]
Fixed effects
-0205 (-322)
-0205 (-275)
-0205 [0036]
Other estimators -0083 (-106)
-0083 (-089)
-0083 [0610]
Service amp consumer goods -0381 (-160)
-0381 (-154)
-0381 [0452]
Financial firms
0250 (285)
0250 (249)
0250 [0052]
Industry firms
0078 (109)
0078 (097)
0078 [0422]
EU
-0092 (-113)
-0092 (-060)
-0092 [-0696]
Developing
0050 (064)
0050 (041)
0050 [0786]
UK
0058 (066)
0058 (043)
0058 [0722]
Other countries 0086 (095)
0086 (068)
0086 [0714]
F 7502 1977 1977 p(F) 0000 0000 Rsup2 0473 0473 0473 Adj Rsup2 0462
Observations 979 979 979 Notes All variables are as defined as in table 1 Dependent variable is dividend smoothing coefficient This panel contains specifications with the standard error of the estimated dividend smoothing as independent variable In Panel B the (squared) standard error is interacted with a dummy variable equal to 1 for dividend smoothing coefficients higher or lower or equal than 05 respectively t-values in parentheses p values in brackets significance at the 1 5 10 level Squared standard errors of adjustment coefficients are used as weights Reference category classical Lintner model for pre 1998 US data estimated with OLS
52
Panel B
Variable
Robust se
(1)
Robust se
(2)
Cluster
robust se by study
(3)
Cluster
robust se by study
(4)
Wild bootstrap se clustered by
study (5)
Wild bootstrap se clustered by
study (6)
Constant
0675 (925)
0657 (812)
0675 (478)
0657 (400)
0675 [0042]
0657 [0072]
SE (smoothingle05)
-7499 (-1307)
-7499 (-673)
-7499 [0002]
SE (smoothinggt05) 3591 (375)
3591 (257)
3591 [0004]
SEsup2 (smoothingle05) -11997 (-382)
-11997 (-344)
-11997 [0086]
SEsup2(smoothinggt05) 8195 (384)
8195 (246)
8195 [0022]
Working paper 0160 (270)
0161 (235)
0160 (245)
0161 (203)
0160 [0164]
0161 [0276]
Post 1998
-0081 (-191)
-0094 (-185)
-0081 (-151)
-0094 (-142)
-0081 [0258]
-0094 [0344]
No of years
-0006 (-240)
-0004 (-174)
-0006 (-144)
-0004 (-099)
-0006 [0386]
-0004 [0578]
Debt
-0019 (-027)
-0028 (-030)
-0019 (-024)
-0028 (-027)
-0019 [0938]
-0028 [0888]
Ownership
0082 (303)
0080 (255)
0082 (266)
0080 (210)
0082 [0000]
0080 [0000]
Size
0018 (033)
0029 (041)
0018 (023)
0029 (041)
0018 [0922]
0029 [0874]
Other
0017 (071)
0015 (049)
0017 (064)
0015 (042)
0017 [0610]
0015 [0710]
Cash Flow
0272 (431)
0350 (494)
0272 (295)
0350 (316)
0272 [0154]
0350 [0104]
GMM
-0092 (-136)
-0193 (-283)
-0092 (-106)
-0193 (-206)
-0092 [0468]
-0193 [0120]
Fixed effects
-0111 (-191)
-0187 (-298)
-0111 (-169)
-0187 (-256)
-0111 [0190]
-0187 [0062]
Other estimators -0017 (-025)
-0067 (-087)
-0017 (-025)
-0067 (-073)
-0017 [0902]
-0067 [-0640]
Service amp consumer goods -0281 (-140)
-0412 (-188)
-0281 (-145)
-0412 (-184)
-0281 [0434]
-0412 [0390]
Financial firms
0209 (271)
0235 (259)
0209 (251)
0235 (226)
0209 [0038]
0235 [0082]
Industry firms
-0011 (-020)
0026 (034)
-0011 (-017)
0026 (028)
-0011 [-0916]
0026 [0776]
EU
-0131 (-184)
-0135 (-167)
-0131 (-109)
-0135 (-089)
-0131 [-0476]
-0135 [0570]
Developing
-0001 (-001)
0037 (048)
-0001 (-001)
0037 (030)
-0001 [-0986]
0037 [0810]
UK
0032 (039)
0065 (075)
0032 (027)
0065 (048)
0032 [0890]
0065 [0722]
Other countries 0061 (078)
0093 (104)
0061 (059)
0093 (073)
0061 [0740]
0093 [0630]
F 9332 3475 9332 1588 p(F) 0000 0000 0000 0000 Rsup2 0608 0478 0478 0478 0608 0478 Adj Rsup2 0600 0467
Observations 979 979 979 979 979 979
53
Appendix
Table A1 Overview of studies estimating dividend smoothing coefficients
Authors Countries Time span No of firms No of estimates Method Mean
)ˆ(d Median
)ˆ(d Darling (1957) US 1921-1954 34 2 OLS 0495 0495
Brittain (1964) US 1920-1960 41 4 OLS 0716 0776
Mueller (1967) US 1957-1960 67 5 OLS amp other method 0877 0837 Turnovsky (1967) US 1948-1962 15 3 OLS 0594 0590 Feldstein (1970) UK 1953-1964 12 18 OLS amp other method 0567 0603 Mcdonald amp Nussenbaum (1975) France 1967-1968 2 7 OLS 0791 0802 Nakamura (1985)
Japan US
1964-1981 18 24 OLS 0680 0756
Mcdonald amp Soderstrom (1986) US 1965-1984 20 1 Fixed effects 0840 0840 Dharan (1988) US 1981-1983 3 6 OLS 0933 0947 Nakamura (1989) US 1960-1982 23 48 OLS 0701 0779 Mookerjee (1992) India 1950-1981 32 8 Other method 0255 0240 Behm amp Zimmermann (1993) Germany 1962-1988 32 8 OLS 0813 0812 Sembenelli (1993) Italy 1962-1988 27 6 OLS amp GMM 0703 0733 Hines (1996) US 1984-1989 6 5 OLS 0596 0569 DeAngelo amp DeAngelo (2000) US 1958-1979 22 4 Other method 0268 0270 Garrett amp Priestley (2000) US 1876-1997 122 3 Other method 0691 0670 Desai et al (2001) US 1982-1997 16 24 OLS Fixed effects amp
other method 0282 0279
Esteban amp Peacuterez (2001) 22 European countries
1991-1998 8 1 GMM 0342 0342
Rahman (2002) 28 1992-1999 8 57 OLS 0900 0945
54
countries Short et al (2002) UK 1988-1992 5 3 OLS 0556 0622 Vasiliou amp Eriotis (2002) Greece 1996-2001 6 4 OLS amp Fixed effects 0530 0530 Adelegan (2003) Nigeria 1984-1997 14 5 OLS 1358 1405 Gugler amp Yurtoglu (2003) Germany 1992-1998 7 6 Fixed effects 0400 0414 Kumar (2003) India 1994-2000 7 28 OLS amp Fixed effects 0500 0729 Pandey (2003) Malaysia 1993-2000 8 7 Fixed effects 0391 0432 Perez-Gonzalez (2003) US 1980-1999 20 2 Fixed effects 0503 0503 Benzinho (2004) Portugal 1990-2002 34 1 Other method 0352 0352 Correia da Silva et al (2004) Germany 1984-1993 10 24 OLS Fixed effects
GMM amp other method 0641 0684
Omet (2004) Jordania 1985-1999 15 3 OLS Fixed effects amp other method
0631 0681
Powell et al (2004) US 1927-1996 70 2 OLS 0788 0788 Trojanowski (2004) UK 1992-1998 7 11 GMM 0253 0270 Karathanassis amp Chrysanthopoulou (2005) Greece 1996-1998 3 32 Fixed effects amp other
method 0265 0266
Aivazian et al (2006) US 1981-1999 19 1 Fixed effects 0089 0089 Foerster amp Sapp (2006) Canada 1871-2003 133 4 OLS 0787 0785 Khan (2006) UK 1985-1997 330 6 OLS amp GMM 0674 0677 Naceur et al (2006) Tunisia 1996-2002 7 24 OLS Fixed effects
GMM amp other method 0334 0264
Sura et al (2006) India 2003-2004 2 43 OLS 0475 0503 Ameer (2007) Malaysia 1995-2005 11 3 OLS 0633 0595 Benhamouda (2007) UK 2000-2004 5 20 OLS amp Fixed effects 0127 0031 Bodla et al (2007) India 1996-2006 11 32 OLS 0485 0506 Dai (2007) Norway 1989-1998 10 5 Other method 0763 0764 Hines et al (2007) US 1982-2002 21 29 OLS Fixed effects amp
other method 0241 0239
Pal amp Goyal (2007) India 1997-1998 2 9 OLS 0920 0852 Pandey amp Bhat (2007) India 1989-1997 9 8 GMM 0259 0258
55
Renneboog amp Trojanowski (2007) UK 1992-1998 7 6 GMM 0313 0305 Ahmed amp Javid (2008) Pakistan 2001-2006 6 16 OLS Fixed effects
GMM amp other method 0549 0705
Ameer (2008) Malaysia 1995-2005 11 7 OLS 0525 0576 Baba amp Ueno (2008) Japan 1990-2003 14 1 GMM 0657 0657 Haddad et al (2008) Jordania 1996-2002 7 6 OLS amp GMM 0409 0373 Ahmed amp Javid (2009) Pakistan 2001-2006 6 12 OLS Fixed effects
GMM amp other method 0532 0500
Al-Najjar (2009) Jordania 1994-2003 10 3 OLS Fixed effects amp other method
0495 0561
Alzahrani amp Lasfer (2009) 24 OECD countries
2000-2007 8 12 Fixed effects amp GMM 0240 0236
Andres et al (2009) Germany 1984-2005 22 20 OLS Fixed effects amp GMM
0683 0697
Hayunga amp Stephens (2009) UK 1992-2003 12 9 OLS amp other method 0663 0621 Mollah (2009) Bnagladesh 1988-2003 16 15 OLS 0730 0741 Raza et al (2009) Pakistan 2001-2006 6 1 OLS 0771 0771 Al-Ajmi (2010) Qatar 1997-2006 10 14 OLS 0873 0808 Al-Yahyaee et al (2010) Oman 1989-2004 16 1 Other method 0747 0747 Chemmanur et al (2010)
Hong Kong US
1984-2002 19 8 OLS 0623 0513
Korkeamaki et al (2010) Finland 2003-2006 4 10 OLS Fixed effects amp other method
0072 0110
Sudhahar amp Saroja (2010) India 1997-2007 11 3 OLS 0680 0715 Al-Yahyaee et al (2011) Oman 1989-2004 16 1 Other method 0059 0059 Baiyao (2011) US 1991-2007 17 1 OLS 0450 0450 Goncharov amp Triest (2011) Russia 2003-2006 4 7 OLS 0546 0377 Haleem amp Javid (2011) Pakistan 2007-2009 3 21 OLS 0898 0803 Hussain (2011) Saudia
Arabia 1990-2006 17 9 Fixed effects amp other
method 0546 0377
Kinfe (2011) Ethiopia 2006-2010 5 1 OLS 0191 0191 Mohsin amp Ashraf (2011) Pakistan 2001-2009 9 3 Fixed effects amp GMM amp
other method 0568 0626
56
Wang et al (2011) China 1998-2008 11 13 OLS amp other method 0448 0450 Abdullah et al (2012) Malaysia 2009-2010 2 1 OLS 0889 0889 Al-Najjar amp Belghitar (2012) UK 1991-2007 17 8 Fixed effects amp GMM amp
other method 0552 0568
Bawa amp Kaur (2012) India 2006-2006 1 24 OLS amp Fixed effects 0898 0847 Kamat amp Kamat (2012) India 1971-2007 37 9 GMM 0476 0401 Kumar amp Kumar Jha (2012) India 2007-2011 5 3 OLS 0039 0077 Baker et al (2013) Canada 1988-1999 12 2 OLS 0550 0550 Hutagalung et al (2013) Malaysia 2001-2010 10 1 Fixed effects 0856 0856 Kamat amp Kamat (2013) India 1975-1992 18 3 GMM 0534 0571 Kanoja amp Bhatia (2013) India 2007-2012 6 5 OLS 0587 0682 Persson (2013) Sweden 2005-2011 7 6 Fixed effects 0378 0225 Simegen (2013) Ethiopia 2002-2011 10 2 Fixed effects 0203 0203 Zameer et al (2013) Pakistan 2003-2009 7 1 OLS 0699 0699 Al-Malkawi et al (2014) Oman 2001-2010 10 2 Other method 0744 0744 Andres et al (2014) Germany 1984-2005 22 19 OLS amp GMM 0592 0501 Arko et al (2014) Sub-
Saharan African countries
1997-2007 11 9 OLS 0677 0662
Boţoc amp Pirtea (2014) 16 emerging countries
2003-2011 9 16 OLS amp GMM 0474 0487
Gunathilaka (2014) Sri Lanka 2006-2010 5 7 GMM 0273 0350 Tran amp Nguyen (2014) Vietnam 2006-2011 6 2 Fixed effects 0122 0122 Younis amp Javid (2014) Pakistan 2003-2011 9 6 Fixed effects amp other
method 0512 0570
Al-Attar et al (2015) Jordania 2006-2011 6 7 OLS 0506 0487 Andres et al (2015) Germany 1988-2008 21 3 OLS Fixed effects amp
GMM 0716 0681
Kim amp Jeon (2015) Korea 2000-2010 11 8 OLS Fixed effects amp other method
0614 0722
57
Renneboog amp Szilagyi (2015) Netherlands 1996-2004 9 8 GMM 0996 0825 Shinozaki amp Uchida (2015) 44
countries 2003-2013 11 1 Fixed effects 0788 0788
Athari et al (2016) 7 Arabian countries
2003-2012 10 4 GMM 0404 0407
Benavides et al (2016) Argentina 1995-2013 19 45 OLS 0650 0660 Brazil Chile Columbia Mexico Peru Bremberger et al (2016) 14 EU
countries 1986-2010 25 11 OLS Fixed effects amp
GMM 0510 0506
Chan et al (2016) US 1927-2013 87 2 OLS 0742 0742 Chen amp Sinha (2016) US 1996-2001 6 4 OLS 0739 0738 Naceur et al (2016) Tunisia 1996-2002 7 14 OLS Fixed effects
GMM amp other method 0160 0165
Source Authors literature search
58
Figure A1 Frequency distribution of dividend smoothing coefficients
050
100
150
Freq
uenc
y
-1 0 1 2 3Smoothing coefficient
Note The dividend smoothing is measured on the x-axis while the y-axis represents the frequency of dividend smoothing coefficients within the respective interval
Figure A2 Kernel density of dividend smoothing coefficients
05
11
5D
ensi
ty
-1 0 1 2 3Smoothing coefficient
e e de s y es a e
Note The dividend smoothing is measured on the x-axis while the y-axis represents the density of dividend smoothing coefficients estimated by Kernel density estimation
59
Figure A3 Funnel plot for the dividend smoothing coefficients (median)
0
20
40
60
80
100
120
140
160
0 05 1 15
Note The dividend smoothing is measured on the x-axis while the y-axis represents precision calculated as the inverse standard error The vertical line at 0671 indicates the ldquotruerdquo dividend smoothing as the mean of the 10 most precise smoothing coefficients The plot is based on median values of the dividend smoothing coefficients and precision per study
Figure A4 Frequency distribution of dividend smoothing coefficients (median)
Figure A5 Kernel density of dividend smoothing coefficients (median)
010
2030
Freq
uenc
y
0 5 1 15Smoothing coefficient
05
11
52
Den
sity
0 5 1 15Smoothing coefficient
y
Note Figure A4 (left-hand side) The dividend smoothing is measured on the x-axis while the y-axis represents the frequency of dividend smoothing coefficients within the respective interval The figure is based on median values of the dividend smoothing coefficients and precision per study
Note Figure A5 (right-hand side) The dividend smoothing is measured on the x-axis while the y-axis represents the density of dividend smoothing coefficients estimated by Kernel density estimation The figure is based on median values of the dividend smoothing coefficients and precision per study
60
Table A2 Bayesian averaging of models (8) (9) and (10)
Variable Post mean (Post SE) PIP
Robust se
Post mean (Post SE) PIP
Robust se Post mean
(Post SE) PIP
Robust se
Constant
0682 (1998)
100 0705 (1408)
0583 (2555)
100 0579 (818)
0641 (2016)
100 0654 (1153)
SE
-0264 (-181)
084 -2379 (-430)
SE (smoothingle05)
-1150 (-1441)
100 -7390 (-1027)
SE (smoothinggt05) 1701 (1591)
100 3568 (351)
SEsup2 (smoothingle05) -0678 (-708)
100 -12513 (-385)
SEsup2(smoothinggt05) 3941 (1259)
100 5238 (217)
Working paper 0043 (089)
050
0102 (402)
100 0239 (337)
0110 (328)
098 0271 (487)
Post 1998
-0087 (-331)
099 -0077 (-197)
-0119 (-646)
100 -0088 (-186)
-0101 (-447)
100 -0064 (-114)
No of years
0000 (007)
004
0000 (004)
004 0000 (029)
011
Debt
-0000 (-004)
003
0000 (011)
004 -0002 (-004)
003
Ownership
0000 (000)
003
0006 (038)
038 0000 (004)
003
Size
0001 (014)
005
0000 (003)
003 0000 (004)
004
Other
-0000 (-005)
003
-0004 (-036)
015 -0001 (-015)
005
Cash Flow
0168 (551)
100 0370 (525)
0095 (376)
099 0219 (303)
0125 (447)
100 0329 (433)
GMM
-0241 (-838)
100 -0269 (-533)
-0136 (-617)
100 -0159 (-260)
-0223 (-872)
100 -0220 (-354)
Fixed effects
-0379 (-1322)
100 -0256 (-421)
-0239 (-1078)
100 -0121 (-185)
-0349 (-1368)
100 -0232 (-334)
Other estimators -0146 (-497)
100 -0149 (-232)
-0089 (-383)
099 0005 (007)
-0137 (-520)
100 -0099 (-117)
Service amp consumer goods 0128 (108)
061 -0415 (-152)
0004 (019)
006 0004 (018)
006
Financial firms
-0067 (-145)
075 0276 (340)
-0004 (-031)
012 -0035 (-090)
051 0271 (310)
Industry firms
0208 (498)
100 0007 (013)
0021 (058)
030 0084 (148)
076 0032 (051)
EU
0014 (044)
020
0009 (040)
018 0013 (042)
019
Developing
0045 (094)
055 0048 (105)
0064 (216)
090 0067 (099)
0035 (081)
047
UK
-0003 (-017)
008
0001 (006)
004 -0004 (-021)
009
Other countries 0056 (106)
061 0167 (315)
0080 (273)
095 0087 (106)
0030 (070)
039
n 979 979 979 979 979 979 Notes All variables are as defined as in table 1 Dependent variable is dividend smoothing coefficient t-values in parentheses p values in brackets All models estimated with robust standard errors significance at the 1 5 10 level Squared standard errors of adjustment coefficients are used as weights PIP refers to the posterior inclusion probability of the variables estimated by Bayesian modeling averaging Reference category classical Lintner model for pre 1998 US data estimated with OLS
61
Table A3 WLS FAT-PET meta-regression robustness checks
Variable Robust 05-quantile estimation WLS coefficients per study
Constant 0659 (2955)
0573 (4779)
0564 (3030)
0663 (4468)
0581 (2492)
0566 (4244)
SE -0628 (-359) -0752
(-557)
SE (smoothingle05) -1960 (-1336) -1381
(-403)
SE (smoothinggt05) 1585 (1172) 1497
(762)
SEsup2 (smoothingle05) -4534 (-152) -0636
(-351)
SEsup2(smoothinggt05) 5283 (801) 4899
(980) F 3100 9802 5561 p(F) 0000 0000 0000 R2 0020 0262 0090 0065 0390 0149 n 998 998 998 979 979 979
Note Dependent variable is dividend smoothing coefficient All models estimated with robust standard errors t-values in parentheses p values in brackets significance at the 1 5 10 level
62
Table A4 robustness checks of models (8) (9) and (10)
Variable Robust 05-quantile estimation WLS coefficients per study
Constant
0702 (2093)
0555 (1704)
0569 (1761)
0565 (1378)
0460 (1198)
0436 (1153)
SE -0619 (-692) -0663
(-692)
SE (smoothingle05) -1404
(-1274) -0979 (-405)
SE (smoothinggt05) 1397 (846) 1672
(764)
SEsup2 (smoothingle05) -2258 (-093) -0526
(-425) SEsup2(smoothinggt05) 3791
(547) 4682 (808)
Working paper 0078 (267)
0075 (221)
0112 (367)
0106 (357)
0157 (548)
0175 (607)
Post 1998
-0134 (-710)
-0151 (-1021)
-0156 (-893)
-0112 (-379)
-0125 (-517)
-0126 (-441)
No of years
0001 (234)
0001 (244)
0002 (268)
-0000 (-014)
0002 (150)
0003 (314)
Debt
-0027 (-069)
0038 (120)
-0045 (-143)
-0088 (-230)
-0042 (-135)
-0061 (-178)
Ownership
-0042 (-115)
0001 (003)
-0040 (-165)
0032 (136)
0072 (377)
0041 (182)
Size
0014 (039)
0009 (052)
0023 (071)
0026 (068)
0024 (079)
0030 (086)
Other
-0008 (-038)
-0034 (-219)
-0010 (-061)
0026 (112)
-0012 (-069)
0011 (051)
Cash Flow
0071 (258)
0041 (183)
0077 (459)
0136 (305)
0065 (175)
0098 (226)
GMM
-0281 (-1026)
-0170 (-942)
-0258 (-1160)
-0238 (-794)
-0169 (-678)
-0230 (-847)
Fixed effects
-0450 (-1807)
-0256 (-1139)
-0366 (-1847)
-0402 (-1410)
-0279 (-1161)
-0366 (-1332)
Other estimators -0159 (-536)
-0097 (-600)
-0147 (-704)
-0138 (-548)
-0085 (-433)
-0114 (-504)
Service amp consumer goods 0166 (211)
0050 (084)
0079 (066)
0524 (397)
0274 (268)
0327 (293)
Financial firms
-0037 (-120)
-0033 (-141)
-0053 (-184)
-0073 (-187)
-0058 (-177)
-0110 (-300)
Industry firms
0163 (579)
0065 (250)
0122 (776)
0313 (620)
0075 (221)
0098 (290)
EU
0079 (214)
0117 (361)
0107 (387)
0159 (452)
0103 (353)
0151 (444)
Developing
0116 (371)
0169 (607)
0171 (595)
0214 (511)
0176 (537)
0224 (564)
UK
0002 (005)
0079 (221)
0084 (248)
0072 (179)
0072 (217)
0084 (217)
Other countries 0111 (371)
0187 (607)
0162 (601)
0191 (505)
0178 (572)
0202 (567)
F 5135 7186 5798 p(F) 0000 0000 0000 Rsup2 0251 0389 0297 0417 0627 0489 n 998 998 998 979 979 979
Notes All variables are as defined as in table 1 Dependent variable is dividend smoothing coefficient All models estimated with robust standard errors t-values in parentheses p values in brackets significance at the 1 5 10 level Squared standard errors of adjustment coefficients are used as weights Reference category classical Lintner model for pre 1998 US data estimated with OLS
2
What drives dividend smoothing A meta regression analysis of the
Lintner model
Erik Fernaua Stefan Hirschbc
a University of Mannheim Finance Area L 9 1-2 68161 Mannheim Germany tel +49 621 181
1526 fax +49 621 181 1518 e-mail fernauuni-mannheimde
b Technical University of Munich TUM School of Management Munich Germany tel +49 8161
71 5180 e-mail stefanhirschtumde
c ETH Zurich Agricultural Economics and Policy Group Switzerland
September 2018
3
What drives dividend smoothing A meta regression analysis of the
Lintner model
September 2018
ABSTRACT
We revisit the view of dividend smoothing as one of the most robust findings in the empirical
corporate finance literature by employing meta-regression analysis (MRA) Using 99 empirical
studies that employ Lintner`s dividend payout model we investigate the heterogeneity in reported
dividend smoothing effects We find evidence for (i) a mediocre degree of dividend smoothing
across the analyzed literature (ii) bi-directional publication bias -ie a tendency to preferably report
positive and statistically significant smoothing as well as dividend smoothing coefficients close to
zero (ie high speed of adjustment coefficients) and (iii) several drivers for the heterogeneity in
reported smoothing coefficients such as the set of control variables or estimation technique Our
MRA can provide guidance for investorsrsquo expectations and future research on dividend smoothing
JEL Classification C83 G32 G35
Keywords Meta regression analysis dividend smoothing Lintner model publication bias
4
1 Introduction
The analysis of firms` cash disbursal to shareholders is a fundamental field of study within financial
economics Conducting a survey of 28 companies in the US Lintner (1956) drew two key conclusions
about corporate payout policy (i) firms strongly base their current dividend on the previous dividend
(ldquodividend smoothingrdquo) and (ii) firms have a long-term target payout ratio and partially adjust their
dividend towards it where a stronger adjustment reflects a higher speed of adjustment Whereas the
emergence of stock repurchases as an alternative payout method (Grullon and Michaely 2002) is a
major challenge for the assumption of a long-term payout ratio based on dividends only the prior
literature has rarely challenged the assumption of dividend smoothing
Although the existence of dividend smoothing is regarded as a robust finding in the empirical literature
subsequent to Lintnerrsquos (1956) seminal study its degree varies widely across the vast amount of
empirical research Factors such as the considered time period (Brav et al 2005) the investigated
country (Chemmanur et al 2010) or the consideration of firm characteristics in the estimation of
dividend payouts (Leary and Michaely 2011) are potential drivers of these heterogeneous findings
However the literature lacks a detailed understanding about the drivers of the variation in reported
dividend smoothing coefficients Added together diverse empirical results as well as contradicting
theoretical assumptions on dividend payout policies and smoothing effects indicate the need for a
holistic quantitative overview of previous findings
We therefore use a meta regression analysis (MRA) framework based on the MRA guidelines of
Stanley et al (2013) to provide a summarizing picture of this core topic of empirical corporate finance
literature Our MRA comprises 99 empirical studies on dividend smoothing that differ in study design
characteristics such as the analyzed firms region time period or the employed econometric technique
5
Our study adds to the literature in several ways (i) we assess whether previous results on dividend
smoothing are affected by publication bias ie a tendency to favor statistically significant results or
findings that support a specific economic theory (Stanley 2005) (ii) we summarize reported smoothing
effects and derive a proxy for the lsquotruersquo effect after correction for potential publication bias and (iii) we
evaluate the modifications that have been made relative to Lintnerrsquos (1956) seminal study and identify
the study characteristics that impact reported smoothing effects The MRA results therefore offer a
nuanced view on the different dividend smoothing effects reported in the literature and can provide
helpful hints for future research on this important topic
MRA refers to a meta-study where regression analysis is performed on previous regression results
related to a specific research topic (Stanley and Jarrell 1989) MRA hence is an approach to summarize
existing empirical results on a specific economic phenomenon taking into account factors related to the
underlying study design such as the analyzed region country time period or the employed
econometric technique that drive heterogeneity in results (Nelson and Kennedy 2009) According to
Stanley (2001) there is consensus that MRA offers significant advantages compared to classical meta-
analysis approaches such as narrative literature reviews Initiated by Card and Kruegerrsquos (1995)
seminal analysis on the relationship between minimum wages and employment MRA has been applied
to a wide range of economic research areas1 (eg Jarrell and Stanley 1990 Longhi et al 2005 Card et
al 2010 Feld et al 2013 Bakucs et al 2014 Oczkowski and Doucouliagos 2014 Post and Byron
2015 Valickova et al 2015 Wang and Shailer 2015 Zigraiova and Havranek 2016 Demena and van
Bergeijk 2017)
1 The application of MRA has its roots in natural science (eg DerSimonian and Laird 1986)
6
Different empirical results may either reflect sampling errors or bias mistakes in the analysis (Trotman
and Wood 1991) or reveal true differences in the analyzed population (Wang and Shailer 2015)
MRA enables to identify those issues thus providing a quantitative overview across previous findings
that allows to identify proxies for rsquotruersquo dividend smoothing effects as well as publication biases
Moreover MRA provides a setting to identify study characteristics such as the analyzed country time
span or employed data sets and econometric estimators that drive heterogeneity in reported results
(Nelson and Kennedy 2009 Hirsch 2018) The MRA is particularly useful for the analysis of dividend
smoothing as (i) all studies are based on the work of Lintner (1956) as a common model which implies
that reported coefficients have a uniform interpretation across primary studies and (ii) the empirical
results are mostly based on independent samples ensuring large heterogeneity in the meta data
(Oczkowski and Doucouliagos 2014) While previous summarizing insights on smoothing effects have
mainly been derived on a subjective perception of a few key studies MRA can draw a detailed picture
on the reasons for the heterogeneous results found in the literature and allows to track the impact of all
methodological refinements that have been made relative to Lintnerrsquos (1956) seminal study
Our results reveal a mediocre degree of dividend smoothing across the analyzed literature and provide
evidence for bi-directional publication bias In particular we detect a preference to either report
positive and statistically significant dividend smoothing coefficients or low dividend smoothing close
to zero which indicates a high speed of adjustment of dividends towards a target payment Moreover
we find that reported dividend smoothing effects are severely affected by study design characteristics
In line with several theoretical models such as agency signaling or tax models controlling for firm
characteristics in the estimation of dividend smoothing can play an important role in explaining
heterogeneous dividend smoothing effects We find that studies controlling for ownership report
7
significantly higher dividend smoothing while the consideration of debt and size among the set of
control variables does not significantly influence dividend smoothing coefficients2 Moreover our
results suggest that there is no strong evidence for country specific differences in dividend smoothing
In contrast to several studies arguing in favor of higher dividend smoothing in the US ndashwithout
conducting a systematical empirical literature review (eg Dewenter and Warther 1998 Chemmanur et
al 2010)ndash we do not find a higher degree of dividend smoothing for the US compared to studies
investigating the EU (excluding the UK) the UK or developing countries The emergence of stock
repurchases is often regarded as a reason for a higher dividend smoothing in recent years The
availability of an alternative payout channel may allow firms to keep their dividend constant even in
case of unexpected earnings changes However our results do not support the conclusion that dividend
smoothing has increased subsequent to the availability of stock repurchases as an alternative payout
method The MRA also reveals significant differences of firms from the financial sector and other
industries Thus our MRA provides investors with an estimate of the degree of dividend smoothing
that can be expected depending on the market and the industry they invest in Studies that rely on cash
flows instead of published earnings as profit measure report significant higher dividend smoothing
coefficients Finally our results confirm that applying GMM as the theoretically consistent
econometric estimator for dividend smoothing can avoid an upward bias in the estimation of smoothing
coefficients
2 Note that the MRA does not reveal the direct impact of additional control variables (eg size or debt) on dividend
smoothing In contrast the MRA reveals the impact that omissioninclusion of these variables in the primary literature
has on the resulting dividend smoothing coefficient
8
The remainder of this paper proceeds as follows Section 2 reviews the theoretical and empirical
literature on dividend payout policies with a particular focus on Lintner`s model In section 3 we
present the MRA data generation and some descriptive statistics Section 4 presents the MRA design
and estimation results while section 5 concludes
2 Lintner model and further developments
The modern economic foundation of payout policy dates back to the seminal study by Modigliani and
Miller (1958) Their irrelevance theorem does not only indicate the conditions under which payout
policy is relevant for firm value such as taxes (Miller and Scholes 1978) agency costs (Jensen 1986)
or dividend signaling models (Bhattarchya 1979 Miller and Rock 1985) It also stands in sharp
contrast to a vast amount of literature that documents several drivers of payout policy Dividend
smoothing is one of the most robust findings in the empirical corporate finance literature and was first
reported in Lintnerrsquos study (1956) Based on his survey evidence Lintner (1956) captures the idea of
dividend smoothing and the existence of a long-term target payout of a firm i based on the following
model
tititiiiti uDDD 1 )( +minus+=∆ minusλα (1)
tiiti ErD = (2)
where tiD ∆ corresponds to the change in dividend payments relative to the dividend payments in the
previous period ( 1 minustiD ) tiD is the target dividend payment assumed to be equal to a fraction ir of
current after tax-earnings ( tiE ) iλ reflects the speed of adjustment towards the target payment and
9
tiu is an error term A coefficient of 0 lt iλ lt 1 indicates that firms adjust their dividends partially
towards the target in a given period iλ = 0 (1) corresponds to no (full) adjustment3 Finally Lintner
(1956) assumes a positive constant ( iα ) reflecting managersrsquo reluctance to cut dividends
Inserting (2) into (1) and rearranging yields the following equation
titiitiiiiti uDErD 1 )1( +minus++= minusλλα (3)
If we set iii br =λ and ii d=minus λ1 we end up with the following equation which we refer to as
the lsquoclassical Lintner modelrsquo (Andres et al 2009 Andres et al 2015 Fama 1974 Skinner 2008)
titiitiiiti uDdEbD 1 +++= minusα (4)
where iid λ1 minus= can be interpreted as the degree of dividend smoothing High values of id imply
that managers strongly base current dividend payments on previous payments4
Lintner (1956) tests this model using a sample of 28 US companies for the period 1947-1953 using
OLS as estimation method He finds a speed of adjustment of about 13 corresponding to a smoothing
coefficient of 23 and a constant of 035 In accordance with Lintnerrsquos prediction several other earlier
3 Empirically the speed of adjustment is not restricted to fall into the interval [0 1] In a robustness check we exclude
dividend smoothing coefficients outside this interval This applies to 99 observations The results are robust to this
alternative sample
4 In the empirical implementation of (4) a constant speed of adjustment (λ) and target payout ratio (r) across analyzed firms
is assumed
10
studies such as Fama and Babiak (1968) and Watts (1973) also find smoothing coefficients close to 23
and a small but positive constant
Until today the partial adjustment model specified by (4) is still widely used in empirical studies
dealing with dividend payouts (eg Michaely and Roberts 2012 Andres et al 2015) However these
studies differ heavily with respect to the analyzed time span the investigated country the econometric
technique or modifications of (4) leading to large heterogeneity in reported dividend smoothing
parameters
Following Lintner (1956) researchers started to adjust the classical model (equation (4)) by
incorporating theoretical considerations as well as empirical phenomena more properly Whereas
empirical aspects concern the choice of the earnings measure or the appropriate estimation technique
theoretical considerations are primarily concerned with the extension of (4) by the correct set of control
variables In the following we provide an overview of the most important modifications relative to the
original work of Lintner (1956)
Fama and Babiak (1968) argue that target dividend payments are based on a fixed ratio of current
earnings but assume that earnings are determined by the following process
titiiti vEE 1 )1( ++= minusδ (5)
with tiv representing a serially uncorrelated error term They further assume that dividends are fully
adjusted to the expected change in earnings 1 minustii Eδ but partially adjusted to the earnings
surprise )( 1 minusminus tiiti EE δ Using this assumption plugging (2) and (5) in (1) yields5
5 Some authors (eg Dharan 1988 Hines 1996) include further lags of either the earnings or the dividend parameter
11
[ ] titiiititiitiiiiti uErDEErcD 111 )( ++minusminus+=∆ minusminusminus δδα (6)
Rearranging and setting ii dc =minus1 iii rcb = and )1( iiii crf minus= δ leads to the following
equation
titiitiitiiiti uEfEbDdD 11 ++++= minusminusα (7)
Lintnerrsquos (1956) findings are based on accounting profits as a measure of earnings An important strand
of the literature though relates dividend payments to the mitigation of free-cash-flow problems (eg
Allen et al 2000 Easterbrook 1984 Jensen 1986) Firms might be more inclined to adjust their
dividend payments due to changes in cash flows For this reason many authors rely on cash-flows
instead of or in addition to accounting profits when modelling dividend payouts (eg Andres et al
2009 Renneboog and Szilagyi 2015)
A further refinement relative to Lintner (1956) concerns an econometric issue The classical Lintner
model and its extensions include the lagged dependent variable among the set of independent variables
In this case using OLS yields upward biased coefficient estimates ( d ) of the lagged dependent variable
(Hsiao 1986) The within-group estimator in turn which has been used by many authors in subsequent
studies leads to a downward biased coefficient (Nickell 1981 Baltagi 2008) A growing number of
studies (eg Naceur et al 2006 Pindado et al 2012 Andres et al 2015) hence rely on Arellano and
Bondrsquos (1991) GMM-in-differences or Arellano and Boverrsquos (1995)Blundell and Bondrsquos (1998)
12
GMM-in-systems estimators6 These approaches yield unbiased coefficient estimates ( d ) of the lagged
dependent variable (Baltagi 2008)
The substantial rise in the volume of stock repurchases in and outside the US marks a major challenge
for the concept of a long-term dividend payout In recent studies Skinner (2008) Brav et al (2005)
and Leary and Michaely (2011) report evidence questioning that firms base their payout on a target
dividend ratio Whereas stock repurchases gained in importance in the US from 1980 onwards they
emerged as an alternative payout method in many non-US countries at the end of the 1990s (Manconi
et al 2017)7 The availability of a different payout method suggest that firms might use stock
repurchases to disburse temporary earnings (Jagannathan et al 2000) leading to higher dividend
smoothing Andres et al (2015) Brav et al (2005) and Choe (1990) find evidence in line with this
prediction
In addition institutional differences across countries such as the taxation of dividends and capital gains
or the frequency of dividend payments might be another reason for heterogeneous results in dividend
smoothing Andres et al (2009) McDonald et al (1975) and Short et al (2002) find dividend
smoothing coefficients that are different from the US analyzing samples of German French and UK
firms respectively Chemmanur et al (2010) compare the dividend policies of firms in the US and
Hong Kong and relate the finding of a more flexible dividend payout in Hong Kong to differences in
6 Arellano and Bover (1995) and Blundell and Bond (1998) show that GMM-in-systems is superior to GMM-in-differences
when applied to samples with a short time series dimension
7 The basis for stock repurchases in the EU is the Second Council Directive of December 13th 1976 (7791EEC)
However as EU countries still had to translate the directive into national law the volume in stock repurchases did not
reach meaningful levels in any EU country before the end of the 1990s
13
the equity ownership and tax regime across the two countries As the tax status of investors as well as
their equity ownership might also differ within countries Chemmanur et alrsquos (2010) finding can also
be interpreted as consistent with different firm characteristics as drivers for the heterogeneity in
dividend smoothing
Leary and Michaely (2011) provide a thorough overview of potential firm-specific characteristics that
are important to consider when estimating the degree of dividend smoothing As we show in our meta-
analysis firm size ownership structure as well as leverage are among the most commonly used firm
characteristics that have been used as control variables in Lintner-type partial adjustment models The
inclusion of these variables is in line with agency models (eg Easterbrook 1984 Jensen 1986)
signaling models (eg Bhattarchya 1979 Miller and Rock 1985) or tax-based models (eg Miller and
Scholes 1978 Allen et al 2000) The MRA can reveal the impact of their inclusionomission in
equations (4) and (7) on the resulting degree of dividend smoothing
Finally several studies have excluded financial firms from their analysis due to different regulatory
requirements for these firms In addition the evidence of DeAngelo et al (2004) suggests substantial
differences in payout policies across industries We therefore consider industry sectors as another
potential driver of heterogeneity in smoothing effects
3 Meta regression data amp descriptive statistics
In section 31 we describe the process of identifying the studies included in our MRA Subsequently
we provide some descriptive statistics with respect to relevant study design characteristics in section
32
14
31 SAMPLE SELECTION
First we performed a literature search based on the MRA guidelines of Stanley et al (2013) to identify
all potentially relevant unpublished and published empirical studies on dividend smoothing We
performed an initial search with all reasonable combinations of the following key terms ldquodividendsrdquo
ldquopayoutsrdquo ldquoLintner modelrdquo ldquodividend smoothingrdquo rdquotarget payoutrdquo and ldquospeed of adjustmentrdquo The
following databases have been employed for the literature search Econstor Google Scholar SSRN
Jstor Wiley Business Source Premier EBSCOhost NBER Econ papers We then checked the
reference lists of the identified studies by means of snowballing techniques to identify studies that have
not been detected by the initial key term search (Longhi et al 2005) This resulted in an initial set of
407 published and unpublished research papers We then checked whether those studies are based on
an empirical estimation of Lintner`s model or an extension of the latter As MRA requires a uniform
interpretation across the included coefficients we excluded 6 studies that used logarithms of dividends
andor earnings For the same reason 10 studies that estimated dividend smoothing individually for
each firm and afterwards report mean values are dropped from the sample8 In addition we ensured
that articles by ldquopredatoryrdquo publishers according to ldquoBeall`s List of Predatory Journals and Publishersrdquo
are not considered9 Finally we further excluded studies which are an earlier working paper version of
a subsequently published paper However whenever two versions exist we compared the working
paper version to the published version More specifically we extracted 28 unpublished smoothing
coefficients from two working papers which have been excluded from the published version
8 If only means of firm-level smoothing coefficients are reported this also implies that precision measures for individual
estimates are not available
9 This led to the exclusion of 3 articles For more information on this list see httpsbeallslistweeblycom
15
Comparing the results of unpublished working papers to those of published articles allows to assess the
presence of publication bias caused by what is known as the file-drawer problem This phenomenon
arises if authors or editors prefer statistically significant results that support a particular theory
(Valickova et al 2015) However as most articles are working papers before being eventually
published it remains unclear whether recent working papers will remain unpublished gray literature or
if they are published in their current form (Hirsch 2018) Therefore similar to Hirsch (2018) we only
consider working papers that have been finalized more than five years ago (ie pre 2012) as ldquotruerdquo
unpublished working papers that potentially suffer from the file-drawer problem10
A more common option to test for publication bias is to analyze the relationship between reported
coefficients and their estimation precision We therefore excluded studies that fail to report a precision
measure for individual estimates such as standard errors p-values or t-values11 Moreover as will
become apparent below the availability of precision measures is crucial for the correct econometric
implementation of the MRA Some studies focus on the estimation of the speed of adjustment
coefficient ( λ ) according to eq (1) while others are interested in determining dividend smoothing
( d ) (eq (4) and (7)) We therefore converted all speed of adjustment coefficients to smoothing
coefficients according to λ1ˆ minus=d
10 As the literature provides little guidance on a specific time frame we also classify papers that have been finalized more
than three years ago as ldquotruerdquo unpublished papers as a robustness check Note that it can also be the case that articles are
not published due to quality issues with respect to method applied writing style etc If rational authors nevertheless
already adopt the strategy to produce ldquodesirablerdquo results in the earlier stages of research as they prepare for journal
publication including working papers in the MRA does not help to detect publication bias (Rusnak et al 2013)
11 Lintner (1956) is one example for a study that we had to exclude due to missing information on estimation precision
16
To control our sample for unreasonable observations eg caused by reporting errors in the underlying
studies we performed multivariate outlier screening using the lsquobaconrsquo algorithm proposed by Billor et
al (2000) which identifies outliers based on Mahalanobis distances (Weber 2010) The application of
the bacon algorithm led to the exclusion of 19 unreasonable observations12 This led to a final sample
of 99 studies and 979 dividend smoothing coefficients ( d ) the main coefficient of interest in our
empirical analysis 86 studies report several coefficients which are the result of estimations for
subsamples or estimations based on different econometric approaches13 It is important to note that our
final dataset comprises a diverse set of dividend smoothing estimates where each of the 979 identified
coefficients refers to a unique combination of underlying dataset model specification regional focus
or time period analyzed
Table A1 in the appendix provides a chronological overview of the final set of 99 studies on dividend
smoothing It can be observed that the literature search has identified a comprehensive dataset
including studies from 1957 to 2016 Moreover mean and median values of smoothing coefficients per
12 Eg two studies reported implausible standard errors In both cases for the same underlying sample of firms and only
slightly different model specifications significantly different standard errors for the smoothing coefficient that diverged
by a factor of gt1000 were reported
13 Examples are Persson (2013) who reports coefficients for different industry sectors or Foerster and Sapp (2006) who split
their sample into three different time frames However some reported results referring to subsamples within studies had
to be excluded from our analysis as they cannot be captured by the MRA due to the fact that they only appear once
Examples are Athari et al (2016) who report separate results related to a subsample of islamic banks Persson (2013)
who reports results for subsamples of firms with different market caps (small mid large) or Ameer (2007) who reports
results for subsamples related to high and low growth firms
17
study are reported in the right columns and provide a first indication that dividend smoothing varies
significantly across literature
32 DESCRIPTIVE STATISTICS
Table 1 summarizes the variables included in the MRA It can be observed that the mean smoothing
coefficient across included studies is 0562 indicating the presence of a mediocre and slightly lower
degree of dividend smoothing in comparison to Lintnerrsquos (1956) findings The included explanatory
variables have been selected based on two criteria (i) the MRA shall cover the development from the
classical Lintner model (equation 4) to more recent extensions and specifications as described in
section 2 and (ii) cover to the largest possible extend the study design characteristics used to generate
the dividend smoothing coefficients
Table 1 reveals that 112 of identified smoothing coefficients originate from working papers that are
at least five years old 470 of the coefficients relate to a mean year of the analyzed sample after
1998 The year 1998 has been selected as a threshold since a large number of countries included in our
dataset exhibits meaningful levels of stock repurchases as an additional payout channel from the end of
the 1990s onwards Baltagi (2008) shows that estimating partial adjustment models such as (4) and (7)
with OLS leads to upward biased smoothing coefficients Nevertheless only 147 of the 979
coefficients have been generated by applying the unbiased GMM estimator while the remainder has
either been estimated using OLS (553) the fixed effects (within) estimator (157) or by means of
other methods (143)14 As pointed out above the GMM estimator can be differentiated into the
difference- and system-approach with the system-estimator being superior when applied to panels with 14 Examples for other methods are Probit Tobit Logit or Random Effects estimations
18
a small time series dimension However as the majority of studies do not report which of the GMM
approaches has been used we do not further differentiate between GMM-in-systems and GMM-in-
differences in our MRA In addition as the underlying literature is based on relatively long panels with
an average time series dimension of 125 years there are likely no significant differences in the results
generated with the two approaches
As regards extensions of the classical Lintner model specified by (4) it can be observed that 420 of
reported coefficients are generated based on the classical version while the remainder of coefficients
has been estimated based on extensions that include further explanatory variables such as firm size
debt and ownership While firm size (139) debt (104) and ownership (166) represent the core
of additional explanatory variables 419 of the identified coefficients relate to estimations that
include other firm-specific explanatory variables such as liquidity or growth opportunities15 Due to the
heterogeneity of those variables across literature they can only be considered as a joint set of lsquootherrsquo
explanatory variables Another deviation from the original work of Lintner (1956) refers to the use of
cash-flows as earnings measure which applies to 113 of estimated smoothing coefficients Finally
Table 1 indicates that the literature on dividend smoothing has also focused on a wide set of countries
and industries As regards countries we have identified a general pattern of focus on the US (114)
the UK (83) other EU countries (174) and developing countries (344) while the remainder of
coefficients (277) relate to a set of other countries which due to its diversity has to be captured by
means of a single dummy variable16 To account for studies focusing on different industries we
15 See eg Leary and Michaely (2011) for an overview of potential firm-specific determinants of dividend smoothing
16 Countries which cannot be categorized into independent categories (eg Canada China or Russia) are assigned to the
group ldquoother countriesrdquo We refer to the definition of the World Bank to classify developing countries
19
distinguish between firms from the service and consumer goods sector (15) financial firms (150)
and manufacturing firms (61) while the remaining coefficients are not based on a specific industry
[Insert Table 1 about here]
4 Meta regression analysis
In section 41 we first provide a descriptive analysis of reported estimates that allows to derive
preliminary hints regarding the presence of publication bias by means of a funnel plot Moreover a
proxy for the rsquotruersquo smoothing value is derived Section 42 then describes the MRA framework used
whereas section 43 focuses on econometric issues that need to be considered Finally section 44
presents and discusses the MRA results
41 DESCRIPTIVE ANALYSIS OF THE lsquoTRUErsquo-EFFECT AND PUBLICATION BIAS
Before estimating MRA models we conduct a preliminary analysis of the dividend smoothing
coefficient and of publication bias Publication bias is the consequence of a favor for statistically
significant results by authors or journal editors Stanley (2005 2008) suggests that the degree of this
bias can be proxied by the correlation of estimates and their standard errors If publication bias is
present a significant correlation between estimated coefficients and their standard errors which leads
to statistical significance should prevail (Oczkowski and Doucouliagos 2014) To graphically illustrate
this relationship Stanley and Doucouliagos (2010) propose to plot estimated coefficients against their
precision where precision is measured by the inverse of coefficientsrsquo standard errors (Oczkowski and
Doucouliagos 2014 Zigraiova and Havranek 2016) If the underlying literature is not affected by
publication bias the estimated smoothing coefficients with high standard errors in the lower part of the
20
plot shall be characterized by high but symmetrical variation around a proxy for the lsquotruersquo dividend
smoothing coefficient while estimates with low standard errors in the upper part of the plot should be
characterized by low variation around the proxy for the lsquotruersquo value Thus without publication bias the
plot should take the form of a symmetric inverted funnel In turn skewness of the funnel indicates
favor for a specific direction of results and is therefore a hint for publication bias In order to construct
the funnel plot we follow Stanley (2005) and first derive a proxy for the lsquotruersquo smoothing coefficient by
averaging the top 10 of most precisely estimated smoothing coefficients leading to a value of 0728
We then plot estimated coefficients and their precision around this proxy for the lsquotruersquo value The
resulting funnel plot is shown in Figure 1 The funnel plot appears widely spread and indicates
skewness towards positive smoothing coefficients close to one as well as high speed of adjustment
coefficients (ie low dividend smoothing coefficient close to zero) This indicates bi-directional
publication bias towards high dividend smoothing and a high speed of adjustment (ie low smoothing)
To assess the degree of excess variation we follow Stanley (2005) and calculate the following statistic
for all j=1 hellip 979 coefficient estimates where corresponds to the
reported dividend smoothing estimates the corresponding standard errors and d represents the
true effect based on the top 10 of the most precisely estimated smoothing coefficients In case a
publication bias is absent one would expect that should exceed 196 for only 5 of coefficient
estimates Using this statistic we find that exceeds 196 in 604 of the cases indicating a strong
excess variation This casts doubt on the assumption of a single underlying lsquotruersquo effect and points
toward the presence of publication bias towards two directions Authors might favor positive and high
dividend smoothing coefficients ( close to one) as well as positive and low dividend smoothing
coefficients corresponding to a high speed of adjustment ( close to zero)
21
[Insert Figure 1 about here]
Funnel plots though assume a single lsquotruersquo effect for different regions sectors time periods or
estimation techniques Hence possible publication bias within country or industry subsamples of
reported smoothing coefficients cannot be detected with this method (Hirsch 2018 Doucouliagos et
al 2005 Stanley 2005 2008) In the following we therefore conduct MRA which provides a more
objective analysis than funnel plots17
42 META REGRESSION MODEL
While the funnel analysis performed in section 41 can provide first indications regarding the
smoothing effect and publication bias its main disadvantage lies in the assumption that only a single
lsquotruersquo effect exists
We therefore perform several MRA`s based on different estimation strategies Compared to funnel
graphs which can only reveal the degree of publication bias across the entire sample of smoothing
coefficients MRA enables to more precisely analyze possible publication bias by accounting for
different subgroups in the sample (eg defined by time countries or industries) It is likely that those
subgroups are affected by publication bias to varying degrees MRA also allows to account for
heterogeneity in reported coefficients driven by the underlying study design ie the applied
17 To further illustrate the distribution of dividend smoothing coefficients Figures A1 and A2 in the appendix show the
frequency distribution and the Kernel density In addition we also captured the distribution of dividend smoothing
coefficients based on median values of reported dividend smoothing coefficients and median precision per study
Figures A3-A5 in the appendix show the respective funnel plot frequency distribution as well as Kernel density based
on median values
22
econometric estimator or the inclusion of additional independent variables when estimating dividend
smoothing (Doucouliagos et al 2005 Stanley 2005 2008)
Following Stanley (2005 2008) we implement several specifications of the following model
jn
njnjj xdsed εβββ +++= sum)ˆ(ˆ10 (8)
where the dependent variable reflects the j=1hellip 979 identified dividend smoothing coefficients jd
The standard error of each coefficient ( )ˆ( jdse ) is included as independent variable together with a
vector sumn
njn xβ of those variables reported in Table 1 that relate to structural characteristics of the
underlying studies The respective coefficients ( nβ ) therefore capture the variance in reported
smoothing coefficients caused by those characteristics Finally jε is an iid error term
The inclusion of the standard error of estimated coefficients as an independent variable serves as a
basis for testing for publication bias If publication bias prevails across the analyzed literature a
significant correlation between estimated coefficients and their standard errors should prevail
(Oczkowski and Doucouliagos 2014) Thus authors will likely prefer those results where the quotient
of the estimated coefficient and its standard error is equal or larger than two implying significance at
the 5-level or lower In contrast if publication bias is not present estimated coefficients are distributed
randomly around the lsquotruersquo value and there should be no significant correlation with standard errors
Testing 0ˆ 10 =βH can therefore be considered as a test for publication bias
23
As indicated by the funnel plot in Figure 1 the research on dividend smoothing might be biased
towards findings of high smoothing or a high speed of adjustment In this case we expect a different
impact of over the domain of high dividend smoothing and low dividend smoothing coefficients
(high speed of adjustment) Whereas authors focusing on dividend smoothing might prefer high
dividend smoothing coefficients authors with a focus on speed of adjustment might prefer lower
dividend smoothing coefficients Hence to test for bi-directional publication bias we use 05 as cutoff
for coefficient estimates of indicating a focus on high dividend smoothing parameter ( or
high speed of adjustment parameters ( This yields the following specification (eg Bom and
Ligthart 2009)
(9)
where
le
=otherwise
difD j
050ˆ1
1 and
gt
=otherwise
difD j
050ˆ1
2
Based on this specification 0ˆ 20 =βH is a test towards a publication bias in favor of low dividend
smoothing coefficients (ie high speed of adjustment) 0ˆ 30 =βH in turn serves as our test for a
publication bias towards high dividend smoothing coefficients
Stanley and Doucouliagos (2012) suggest to also consider specifications where the standard error is
introduced non-linearly Non-linearity allows for a more flexible relationship between coefficients and
standard errors over the domain of standard errors where publication bias will be less severe for
24
estimates with low standard errors We therefore also consider a specification of (9) where the standard
error is introduced in a quadratic way
(10)
where
le
=otherwise
difD j
050ˆ1
1 and
gt
=otherwise
difD j
050ˆ1
2
Finally in each specification the intercept 0β reflects the mean value of dividend smoothing corrected
for publication bias given that the impact of all study design characteristics included in is set to zero
The presence of a dividend smoothing effect can hence be tested by 0ˆ 01 =βH and rejecting this
hypothesis points towards the existence of an effect According to Stanley (2005 2008) the test of a
non-significant MRA intercept is also known as precision effect test (PET)
43 ECONOMETRIC IMPLEMENTATION
Various econometric approaches are necessary to account for problems caused by the fact that the
dependent variable of (8) to (10) is composed of estimated regression coefficients )ˆ( jd (Stanley et al
2013) These regression coefficients are derived by means of separate empirical studies implying
heterogeneous variances that potentially cause heteroscedasticity in the error terms of (8) to (10)
(Nelson and Kennedy 2009) We therefore use weighted least squares (WLS) for the estimation of (8)
to (10) As Stanley (2005) and Oczkowski and Doucouliagos (2014) point out 2)ˆ(1 jdse can serve as
25
an adequate weight as it captures the heterogeneous variances of the coefficients and thus generates
heteroscedasticity corrected standard errors18
Another econometric issue arises from the fact that most of the studies included in our MRA (86)
provide more than one estimate This implies that the meta-data is composed of clusters of estimates
with similar error structures Nelson and Kennedy (2009) point out that such within-cluster error
correlation leads to biases in the standard errors of (8) to (10) To correct for within study-cluster
correlation we follow Oczkowski and Doucouliagos (2014) and employ several techniques to derive
unbiased standard errors In particular we first estimate (8) to (10) using WLS with heteroscedasticity
robust standard errors as our base model We then correct for within-study error correlation by
estimating WLS models with study-cluster robust and bootstrapped clustered standard errors More
specifically we use the wild bootstrap method which is particularly suited when study clusters are of
significantly different sizes (Cameron et al 2008 MacKinnon and Webb 2017) Moreover as Table
A1 indicates clusters in our sample are of significantly different sizes According to MacKinnon and
Webb (2017) the wild bootstrap may yield reliable inferences in this case
Although panel estimators such as fixed and random effects are suitable to capture the clustered (ie
panel) structure of our data it is known that WLS with study-cluster robust standard errors is the more
reasonable approach to estimate MRA models (Hirsch 2018) Stanley and Doucouliagos (2013 2015)
demonstrate that WLS outperforms the random- and fixed effects estimator especially when the meta-
data is affected by publication bias Moreover the fixed and random effects estimators are based on a
set of adverse characteristics (Baltagi 2008) First coefficient clusters in our sample are of 18 Note that the sample size can also serve as an indicator for estimation precision of coefficients as it is proportional to the
inverse of the standard error (Stanley 2005)
26
considerably different sizes with a large number of clusters that contain a single observation only19
Nelson and Kennedy (2009) point out that employing the fixed effects estimator to such panels is
disadvantageous as studies with a single observation will be eliminated from the estimation procedure
Second application of the fixed effects estimator leads to inefficient estimates of (8) to (10) as study-
specific fixed effects significantly decrease the degrees of freedom (Baltagi 2008 Nelson and
Kennedy 2009) Third to generate unbiased coefficients of (8) to (10) the random effects estimator
requires zero correlation between the random effect and the explanatory variables (ie the standard
errors as well as the variables in ) (Baltagi 2008 Stanley and Doucouliagos 2013 2015) Due to
these disadvantages and the predominance of WLS in MRA models we consider the WLS estimations
with study-cluster robust standard errors of (8) (9) and (10) as our main results while results with
wild-bootstrapped standard errors shall serve as robustness checks
44 META REGRESSION RESULTS
To get an initial impression of publication bias we follow the procedure used in prior MRAs (Card and
Krueger 1995 Hirsch 2018 Stanley and Doucouliagos 2012) and first estimate equations (8) to (10)
without including the set of explanatory variables x The results are reported in Table 2 In the
interpretation we focus on the WLS estimations of (8) to (10) with study-cluster robust standard errors
as our main results (columns 4-6) The constant of each model indicates mean dividend smoothing
19 We observe 13 studies that report just one coefficient The maximum number of coefficients that a single study reports
amounts to 57 The average number of coefficients reported in the included studies is 989 A standard deviation of
1104 shows that the coefficient clusters in our sample are of considerably different size
27
corrected for publication bias Columns 4-6 reveal that this value is between 0707 and 0755 and thus
close to the average of the 10 most precise measures derived as the proxy for lsquotruersquo smoothing above
(0728) The test for a significant impact of the constant ie the PET test (Stanley 2005 2008) indicates
for all specifications the presence of a significant smoothing effect
[Insert Table 2 about here]
As rejecting 0ˆ10 == βH points towards skewness of the funnel plot (Figure 1) this test is also known
as the funnel asymmetry test (FAT) (Stanley 2005 2008) The models that account for the standard
error as independent variable in a linear way confirm the initial tendency of a publication bias revealed
by the funnel plot The results reveal a negative and significant relationship with the exception of an
insignificant (and still) negative effect when wild-bootstrapped standard errors are used The negative
sign indicates that there might be either a tendency towards reporting low dividend smoothing
coefficients (high speed of adjustment coefficients) However as indicated above the funnel plot points
to the existence of bi-directional publication bias We address this issue through equations (9) and (10)
by considering different impacts of the standard error depending on the magnitude of the estimated
dividend smoothing coefficient The results are in favor of publication biases towards high and low
dividend smoothing effects respectively We find a significant and negative impact of the (squared)
standard error for dividend smoothing coefficients smaller or equal to 05 which is higher in magnitude
than the positive impact of the standard error for dividend smoothing coefficients larger than 05 In
addition the coefficient of the standard error for high dividend smoothing coefficients is significant in
two out of six specifications whereas the coefficient for low dividend smoothing coefficients is
negatively significant in five out of six specifications
28
[Insert Table 3 about here]
As already noted a possible publication bias within subsamples related to countries industries or other
study design characteristics can only be detected by controlling for these factors in a multivariate
MRA Table 3 reports the results of various specifications of the multivariate regression models (8) to
(10) Panel A contains the results based on equation (8) Panel B refers to the results based on equations
(9) and (10) (standard error interacted with dummies for low and high dividend smoothing
coefficients) The base category (captured in the constant) refers to the degree of dividend smoothing
generated by OLS estimations of the classical Lintner model corrected for publication bias and using
pre-1998 data Note that the regression coefficients are to be interpreted accordingly ie a specific
coefficient indicates how the related characteristic addssubtracts dividend smoothing with respect to
this base group In line with the univariate results the results show a negative impact when we account
for the standard error in a linear manner (equation (8)) However the coefficient for the standard error
is not significant when we focus on the WLS estimations of (8)) with study-cluster robust standard
errors as our main results Compared to our univariate analysis we find even stronger support for a bi-
directional publication bias All coefficients for the standard error are statistically significant and have
the expected sign Thus when study design characteristics are considered our results corroborate the
finding towards the presence of publication bias in favor of statistically significant smoothing
coefficients as well as speed of adjustment coefficients (ie low smoothing coefficients)20
Surprisingly the working paper dummy is found to be statistically significant and positive which
20 In unreported robustness checks we use the mean and median of all 979 dividend smoothing coefficients as different
cutoffs to distinguish between studies focusing on high and low dividend smoothing (speed of adjustment) The results
are robust to this specification Results of all robustness checks are available upon request
29
indicates that working papers reports significantly higher dividend smoothing coefficients Rusnak et
al (2013) argue that working papers already take into account the publication process and therefore do
not differ much from published papers with respect to a tendency of reporting significant coefficient
estimates This implies that working papers which are older than 5 years report significantly higher
dividend smoothing coefficients and likely do not suffer from the file drawer problem21
Moreover the multivariate MRA reveals several important findings with respect to the study design
factors affecting the heterogeneity in reported dividend smoothing coefficients As the base category
we use the classical Lintner model (equation 4) estimated using OLS and pre-1998 US data published
in an academic journal The constants of our main results ndashWLS with cluster robust standard errors
reported in column 2 in Panel A and columns 3-4 in Panel Bndash reveal a significant degree of dividend
smoothing for the base category ranging from 0657 to 0678 This degree is in line with Lintner (1956)
who finds a very similar smoothing coefficient of 23 for the US
Several studies (eg Choe 1990 Brav et al 2005 Andres et al 2015) find evidence that the degree of
dividend smoothing has increased in recent years possibly due to the emergence of stock repurchases as
an additional method to disburse temporary earnings If anything our results indicate a slight evidence
for lower dividend smoothing in more recent years (the respective coefficient of the variable capturing
whether the mean sample period is gt1998 is statistically significant in three cases and always
negative)22 We also find no evidence that the length of the analyzed time series impacts the degree of
dividend smoothing (the coefficient has the expected negative sign but is only significant in two 21 The results are robust to an alternative time frame of three years
22 As a robustness check we classify studies as rdquopost-1998ldquo if their sample period begins in 1999 or later The results are
robust to this alternative specification
30
regression models and insignificant in our main regression models with cluster robust standard errors)
In contrast extensions of the classical Lintner model controlling for ownership find significantly higher
dividend smoothing This lends to support of agency conflicts as a primary driver of dividend
smoothing (Leary and Michaely 2011) Agency models as presented by Jensen (1986) and Easterbrook
(1984) underline the importance of dividend smoothing as a disciplining device for managers to raise
external finance from capital markets Our results underline the importance of ownership as moderator
for agency conflicts between managers and shareholders and determinant of dividend smoothing
Whether studies control for size debt or other firm characteristics does not have a significant impact
on resulting dividend smoothing coefficients Moreover we find evidence that modifications of the
classical Lintner model using cash flow instead of earnings measures detect significantly higher
smoothing effects Based on these results firms adjust dividends faster to changes in earnings than to
changes in cash-flows
Our results provide evidence that the use of the econometric technique has a significant impact on
estimated dividend smoothing coefficients We find that the GMM estimator reduces the upward bias
in dividend smoothing that emerges if (8) to (10) are estimated using OLS Similarly using fixed
effects (within) estimation leads to significant lower smoothing coefficients compared to the base
category OLS Note that applying fixed effects estimation to autoregressive processes such as (8) to
(10) leads to a downward biased estimate of dividend smoothing23
23 As the category lsquoother estimatorsrsquo comprises multiple different estimation techniques such as probit logit or random
effects as a robustness check we have excluded all observations related to this category Even after excluding these
observations we do not find significant differences in reported dividend smoothing coefficients across estimation
techniques
31
The presence of dividend smoothing is particularly well documented for firms in the US Several
studies suggest that dividend smoothing is higher in the US than in other countries For instance
Andres et al (2009) document a more flexible dividend payout for German firms whereas Chemmanur
et al (2010) and Dewenter and Warther (1998) document lower dividend smoothing for firms in Hong
Kong and Japan In contrast to this our results do not suggest significant differences in smoothing
effects across different countries In a robustness check we follow a broader classification of countries
by La Porta et al (1998 2000) La Porta et al (1998 2000) relate investor protection financing
conditions and payout policy to the legal origin of countries and distinguish between common law and
civil law counties Using this classification we find lower dividend smoothing for Scandinavian civil
law countries relative to German civil law French civil law and common law countries However we
do not find systematic differences in dividend smoothing between common and civil law countries or
within common law countries such as the UK and the US Overall our results lend support to dividend
smoothing as a global rather than country-specific phenomenon
Finally the results do not reveal that studies with a focus on firms that operate in the service and
consumer goods sector generate significantly different dividend smoothing coefficients while
significant higher dividend smoothing effects can be detected for firms operating in the financial
sector24 Variance Inflation Factors indicate that multicollinearity among the set of explanatory
variables (x) is not present Model diagnostics reveal the overall significance of our specifications and
24 As firms from the financial sector are subject to different regulatory requirements we consider only those studies that
explicitly exclude firms from the financial sector in a robustness check Based on the remaining 29 studies with 397
observations we do not find significant differences in the drivers dividend smoothing coefficients relative to the whole
sample
32
adjusted R2 values amount to 478 up to 608 The fact that R2 is significantly higher for the
specifications that consider bi-directional publication bias ((9) and (10)) compared to equation (8)
reveals the superiority of the former specifications
As our study design controls for many different factors that may have an impact on the reported
dividend smoothing parameter and theory provides us with little guidance on the factors that should be
included in a meta-regression analysis we also investigate the main drivers of the dividend smoothing
parameters by Bayesian model averaging (BMA) (Raftery et al 1997) BMA provides averages for
posterior mean values and standard errors after running all combinations of a predefined set of
explanatory variables (in our case 220 combinations) We follow the procedure in Zigraiova and
Havranek (2016) and run a reduced model using all variables with a posterior inclusion probability
larger than 05 identified by BMA as explanatory variables The results reported in Table A2 of the
appendix corroborate our earlier findings and identify the choice of the earnings measure the
econometric technique used as well as the publication status as the main drivers of the heterogeneity of
reported dividend smoothing coefficients
Finally to assess the robustness of the results with respect to the weighting strategy used and the
handling of extreme values we estimated several further model specifications First we followed
Zigraiova and Havranek (2016) and present results from specifications weighted by the inverse of the
number of estimates reported per study This gives the same importance to each study in the estimation
by mitigating the effect of articles contributing a large number of coefficients Second for the whole
sample (without exclusion of unreasonable values using the bacon algorithm) we estimate robust 05-
quantile (median) regressions The results are reported in Tables A3 and A4 and undermine our main
findings regarding the direction of publication bias and the importance of the econometric estimator
33
applied There are some differences that are mainly related to the variables capturing the analyzed
country or industry for which the robustness checks tend to produce a higher number of significant
results However these variables have not been identified as explanatory variables with a high PIP in
the BMA and thus do not alter our conclusions regarding the main drivers of reported dividend
smoothing coefficients
5 Conclusion
Our MRA sheds light on the reasons for heterogeneous results reported in the empirical literature on
dividend smoothing using a large set of 99 empirical studies and 979 dividend smoothing coefficients
that relate to different time periods countries industries and econometric methods The MRA reveals
that the variability in reported smoothing coefficients is driven by publication bias towards high
dividend smoothing or high speed of adjustment coefficients We find that peer-reviewed publications
based on an OLS estimation of the classical Lintner model corrected for publication bias and using
pre-1998 US data report on average a significant degree of dividend smoothing ranging from 0657 to
0678
Analyzing post-1998 data does not reveal higher dividend smoothing in more recent years This is in
line with the findings of Leary and Michaely (2011) for the US who find that stock repurchases as an
additional payout channel in recent years cannot explain the heterogeneity in reported dividend
smoothing coefficients However we detect a large number of other factors that explain the variability
in dividend smoothing coefficients Our results suggest that accounting for ownership structure among
the set of control variables is important when explaining different degrees of dividend smoothing We
find that the inclusion of ownership characteristics significantly increases estimated smoothing
34
coefficients Moreover we find significant differences in results across the estimation techniques used
Studies using GMM estimation techniques or fixed effects estimators find a considerably lower degree
of dividend smoothing (-0219 and -0205) compared to studies employing OLS estimators Differences
in dividend smoothing do not seem to be driven by the country
Overall the results of our MRA provide a summarizing picture of the large amount of literature on
dividend smoothing and allow to derive average smoothing effects for different regions sectors time
periods or estimation techniques Under the assumption that lsquobest practicersquo in dividend smoothing
estimation requires the inclusion of all relevant firm specific control variables and the GMM estimation
technique our MRA predicts (using earnings as profit measure) average smoothing effects of 0536 for
firms that do not operate in the financial sector
The MRA results provide important insights for future research on this topic Dividend smoothing
estimates differ significantly depending on the inclusion of ownership as a driver of estimated dividend
smoothing effects Researchers should therefore consider the inclusion of ownership characteristics
when estimating dividend smoothing In case ownership characteristics are not available due to data
limitations researchers should discuss the consequences of the corresponding omitted variable bias
Our results provide support for significant differences in reported dividend smoothing effects for
different estimation techniques As the upward (downward) bias of the OLS (fixed effects) estimator is
well-known for AR(1)-type regressions in future studies researchers should carefully consider the
choice of the estimation technique In line with previous literature future research should interpret
results under careful consideration of the specifics of the analyzed industries Based on our analysis it
is of particular relevance whether the study focuses on non-financial firms only
35
Previous studies consider dividend smoothing as a general phenomenon that has increased in recent
years In contrast to this prevailing opinion our MRA does not provide evidence for a general recent
trend of higher dividend smoothing Thus analyzing the development of dividend smoothing over time
and under consideration of different country settings might be a fruitful area for future research (Farre-
Mensa et al 2014) In general future research should consider the fact that study design characteristics
can have an important impact on dividend smoothing effects and the results should hence be interpreted
accordingly
Our results are also important from an investor perspective Whereas Leary and Michaely (2011) find
evidence that dividend smoothing is used to cope with free-cash flow problems dividend smoothing
might be an agency problem in itself (Lambrecht and Myers 2012) Depending on the two different
views our results based on dividend smoothing allow investors to assess the severity of agency
conflicts that they can expect depending on the industry they would like to invest in Thus investors
should take into account that study design characteristics have an important impact on the resulting
dividend smoothing effects and should build their expectation regarding returns accordingly
36
References
Abdullah NMH Ahmad Z Roslan S (2012) The Influence of Ownership Structure on the Firms
Dividend Policy Based Lintner Model International Review of Business Research Papers 8(6) 71-88
Adelegan O (2003) An Empirical Analysis of the Relationship between Cash Flow and Dividend
Changes in Nigeria RampD Management 15(1) 35-49 Ahmed H Javid AY (2008) Dynamics and determinants of dividend policy in Pakistan (evidence
from Karachi stock exchange non-financial listed firms) MPRA Paper No 37342 Ahmed H Javid AY (2009) Dynamics and Determinants of Dividend Policy in Pakistan (Evidence
from Karachi Stock Exchange Non-Financial Listed Firms) International Research Journal of Finance and Economics 25(3) 148-171
Aivazian VA Booth L Cleary S (2006) Dividend Smoothing and Debt Ratings Journal of
Financial and Quantitative Analysis 41(2) 439-453 Al-Ajmi J (2010) Modelling the dividend policy of banks in Gulf Cooperation Council countries
Applied Economics Letters 17(14) 1423-1428 Al-attar AM Al-Shattarat HK Yusuf AN (2015) The effects of contextual factors on
disaggregated earnings in explaining dividend changes in Jordanian firms International Journal of Commerce and Management 25(2) 218-239
Allen F Bernardo A Welch I (2000) A theory of dividends based on tax clientele Journal of
Finance 55(6) 2499-2536 Al-Malkawi H-A Bhatt M I Magableh S (2014) On the dividend smoothing signaling and the
global financial crisis Economic Modelling 42 159-165 Al-Najjar B (2009) Dividend behaviour and smoothing new evidence from Jordanian panel data
Studies in Economics and Finance 26(3) 182-197 Al-Najjar B Belghitar Y (2012) The information content of cash flows Economic Issues 17(2) 57-
70 Al-Yahyaee KH Pham TM Walter TS (2010) Dividend stability in a unique environment
Managerial Finance 36(10) 903-916 Al-Yahyaee KH Pham TM Walter TS (2011) Dividend smoothing when firms distribute most
of their earnings as dividends Applied Financial Economics 21(16) 1175-1183
37
Alzahrani M Lasfer M (2009) The Impact of Taxation on Dividends A Cross-Country Analysis
Working paper King Fahd University of Petroleum amp Minerals Dhahran Ameer R (2007) Dividend Payout of the Property Firms in Malaysia Pacific Rim Property Research
Journal 13(4) 451-472 Ameer R (2008) Product market competition regulation and dividend payout policy of Malaysian
Banks Journal of Financial Regulation and Compliance 16(4) 318-334 Andres C Betzer A Goergen M Renneboog L (2009) Dividend policy of German firms A panel
data analysis of partial adjustment models Journal of Empirical Finance 16(2) 175-187 Andres C Betzer A van den Bongard I Goergen M (2014) Dividend Policy Corporate Control
and the Tax Status of the Controlling Shareholder Working paper Schumpeter School of Business and Economics Bergische Universitaumlt Wuppertal
Andres C Doumet M Fernau E Theissen E (2015) The Lintner model revisited Dividends
versus total payouts Journal of Banking and Finance 55 56-69 Arellano M Bond S (1991) Some tests of specification for panel data Monte Carlo evidence and an
application to employment equations Review of Economic Studies 58 (2) 277-297 Arellano M Bover O (1995) Another look at the instrumental variable estimation of error-
components models Journal of Econometrics 68 29ndash51 Arko AC Abor J Adjasi CKD Amidu M (2014) What influence dividend decisions of firms in
Sub-Saharan African Journal of Accounting in Emerging Economies 4(1) 57-78 Athari SA Adaoglu C Bektas E (2016) Investor protection and dividend policy The case of
Islamic and conventional banks Emerging Markets Review 27 100-117 Baba N Ueno Y (2008) Are stock repurchases more flexible than dividends The case of Japanese
firms Applied Financial Economics Letters 4(5) 315-318 Baiyao Z (2011) Dividend Policy in Mainland China and USA Bachelor thesis Hong Kong Baptist
University Baker HK Chang B Dutta S Saadi S (2013) Canadian corporate payout policy International
Journal of Managerial Finance 9(3) 164-184 Bakucs Z Falkowski J Fertouml I (2014) Does Market Structure Influence Price Transmission in the
Agro-food Sector A Meta-analysis Perspective Journal of Agricultural Economics 65(1) 1-25
38
Baltagi BH (2008) Econometric Analysis of Panel Data Chichester UK John Wiley amp Sons Bawa KS Kaur P (2012) Empirical validity of Dividend Policy Models in The Indian
Manufacturing MSMEs International Journal of Multidisciplinary Management Studies 2(1) 18-39 Banks S Cheffins B Goergen M (2009) Dividends and politics European Journal of Political
Economy 25(2) 208-224 Behm U Zimmermann H (1993) The empirical relationship between dividends and earnings in
Germany Zeitschrift fuumlr Wirtschafts- und Sozialwissenschaften 113(2) 225-254 Benavides J Berggrun L Perafan H (2016) Dividend payout policies Evidence from Latin
America Finance Research Letters 17 197-210 Benhamouda Z (2007) UK corporate share repurchases an empirical analysis of corporate motives
and payout policies Durham theses Durham University Available at Durham E-Theses Online httpethesesduracuk2137
Benzinho J (2004) The dividend policy of the Portuguese corporations Evidence from Euronext
Lisbon Working paper ISCAC Coimbra Business School Bhattarchya S (1979) Imperfect Information Dividend Policy and The Bird in the Hand Fallacy
The Bell Journal of Economics 10(1) 259-270 Billor N Hadi AS Velleman PF (2000) BACON blocked adaptive computationally efficient
outlier nominators Computational Statistics amp Data Analysis 34 279-298 Blundell R Bond S (1998) Initial conditions and moment restrictionsin dynamic panel data models
Journal of Econometrics 87 115-143 Bodla BS Pal K Sura JS (2007) Examining Application of Lintners Dividend Model in Indian
Banking Industry ICFAI Journal of Bank Management 6(4) 40-59 Bom PRD Ligthart JE (2009) How productive is public capital A meta-regression analysis
Working Paper 09-12 International Studies Program Georgia State University Boţoc C Pirtea M (2014) Dividend Payout-Policy Drivers Evidence from Emerging Countries
Emerging Markets Finance and Trade 50(4) 95-112 Brav A Graham JR Harvey CR Michaely R (2005) Payout policy in the 21st century Journal
of Financial Economics 77(3) 483-527 Bremberger F Cambini C Gugler K Rondi L (2016) Dividend Policy in Regulated Network
Industries Evidence from the EU Economic Inquiry 54(1) 408ndash432
39
Brittain JA (1964) The Tax Structure and Corporate Dividend Policy American Economic Review
54(3) 272-287 Cameron AC Gelbach JB Miller DL (2008) Bootstrap-based Improvements for Inference with
Clustered Errors Review of Economics and Statistics 90(3) 414-427 Card D Krueger AB (1995) Time-Series Minimum-Wage Studies A Meta-Analysis American
Economic Review 85(2) 238-243 Card D Kluve J Weber A (2010) Active Labour Market Policy Evaluations A Meta- Analysis
Economic Journal 120 (548) 452-477 Chan KF Powell JG Shi J Smith T (2016) Dividend persistence and dividend behavior
Accounting and Finance doi 101111acfi12208 Chemmanur TJ He J Hu G Liu YH (2010) Is dividend smoothing universal New insights
from a comparative study of dividend policies in Hong Kong and the US Journal of Corporate Finance 16(4) 413-430
Chen X Sinha A K (2016) Large Shareholders and Dividends Game Theoretic Analysis of
Shareholder Power Working paper California State University Bradley University Choe H (1990) Intertemporal and Cross-sectional Variation of Corporate Dividend Policy PhD
Dissertation University of Chicago Correia da Silva L Goergen M Renneboog L Dividend policy of German firms A dynamic panel
data analysis of partial adjustment models Working paper Cardiff University Oxford Economic Research Associates Tilburg University
Dai Q (2007) Influence of a Tax Reform on Dividend Clienteles Working paper Binghamton
University Darling PG (1957) The Influence of Expectations and Liquidity on Dividend Policy Journal of
Political Economy 65(3) 209-224 DeAngelo H De Angelo L Skinner D (2004) Are dividends disappearing Dividend concentration
and the consolidation of earnings Journal of Financial Economics 72(3) 425-456 DeAngelo H De Angelo L Skinner D (2008) Corporate Payout Policy Foundations and Trends in
Finance 3(2-3) 95-287
40
DeAngelo H DeAngelo L (2000) Controlling stockholders and the disciplinary role of corporate payout policy - a study of the Times Mirror company Journal of Financial Economics 56(2) 153-207
Demena BA van Bergeijk PAG (2017) A Meta-Analysis of FDI and Productivity Spillovers in
Developing Countries Journal of Economic Surveys 31(2) 546-571 DerSimonian R Laird N (1986) Meta-analysis in clinical trials Controlled Clinical Trials 7(3) 177-
188 Desai MA Foley CF Hines Jr JR (2001) Repatriation Taxes and Dividend Distortions National
Tax Journal 54(4) 829-851 Dewenter KL Warther VA (1998) Dividends Asymmetric Information and Agency Conflicts
Evidence from a Comparison of the Dividend Policies of Japanese and US Firms Journal of Finance 53(3) 879ndash904
Dharan BG (1988) The Association between Corporate Dividends and Current Cost Disclosure
Journal of Business Finance amp Accounting 15(2) 215-230 Doucouliagos H Laroche P Stanley TD (2005) Publication Bias in Union-Productivity Research
Relations industrielles Industrial Relations 60(2) 320-347 Easterbrook FH (1984) Two Agency-Cost Explanations of Dividends American Economic Review
74(4) 650-659 Esteban JMD Peacuterez OLdF (2001) Dividend Policy of European Banks Working paper
Universidad de Burgos Fama EF (1974) The Empirical Relationships between the Dividend and Investment Decisions of
Firms American Economic Review 64(3) 304-318 Fama EF Babiak H (1968) Dividend Policy An Empirical Analysis Journal of the American
Statistical Association 63(324) 1132-1161 Farre-Mensa J Michaely R Schmalz M (2014) Payout Policy Annual Review of Financial
Economics 6 75-134 Feld LP Heckemeyer JH Overesch M (2013) Capital structure choice and company taxation A
meta-study Journal of Banking amp Finance 37(8) 2850ndash2866 Feldstein MS (1970) Corporate Taxation and Dividend Behaviour Review of Economic Studies
37(1) 57-72
41
Foerster SR Sapp SG (2006) The changing role of dividends a firm-level study from the nineteenth to the twenty-first Century Canadian Journal of Economics 39(4) 1316-1344
Garrett I Priestley R (2000) Dividend Behavior and Dividend Signaling Journal of Financial and
Quantitative Analysis 35(2) 173-189 Goncharov I Triest S v (2011) Do fair value adjustments influence dividend policy Accounting
and Business Research 41(1) 51-68 Grullon G Michaely R (2002) Dividends Share Repurchases and the Substitution Hypothesis
Journal of Finance 57(4) 1649-1684 Gugler K (2003) Corporate governance dividend payout policy and the interrelation between
dividends RampD and capital investment Journal of Banking and Finance 27 1297-1321 Gugler K Yurtoglu BB (2003) Corporate governance and dividend payout policy in Germany
European Economic Review 47(4) 731-758 Gunathilaka C (2014) What Drives the Payout Policy Evidence from Sri Lanka A Dynamic Panel
Data Analysis Wayamba Journal of Management 3(2) 1-16 Haddad AE Al Shattarat WK Al-Hamadeen RM (2008) Partial-Adjustment-Models of Dividend
Policy Behaviour for Industrial Jordanian Firms Corporate Ownership amp Control 5(4) 356-372 Haleem F Javid AY (2011) Modeling Dividend Behavior in Pakistan Information Management
and Business Review 3(6) 289-301 Hayunga DK Stephens CP (2009) Dividend behaviour of US equity REITs Journal of Property
26(2) 105-123 Hines Jr JR Desai MH Foley CF (2007) Dividend Policy Inside the Multinational Firm
Financial Management 36(1) 5-26 Hines JR Jr (1996) Dividends and Profits - Some Unsubtle Foreign Influences Journal of Finance
51(2) 661-689 Hirsch S (2018) Successful in the long run A meta-regression analysis of persistent firm profits
Journal of Economic Surveys 32(1) 23-49 Hsiao C (1986) Analysis of Panel Data Cambridge University Press Cambridge Hussain J (2011) Corporate dividends decisions evidence from Saudi Arabia Journal of Risk
Finance 12(1) 41-56
42
Hutagalung S Yahya MH Kamarudin F Osman Z (2013) The Dividend Payout Policy ndash A Study on Malaysian Financial Institutions Pertanika J Soc Sci amp Hum 21(S) 127-148
Jagannathan M Stephens CP Weisbach M (2000) Financial flexibility and the choice between
dividends and stock repurchases Journal of Financial Economics 57(3) 355-384 Jarrell SB Stanley TD (1990) A Meta-Analysis of the Union-Nonunion Wage Gap Industrial amp
Labor Relations Review 44 54-67 Jensen MC (1986) Agency Costs of Free Cash Flow Corporate Finance and Takeovers American
Economic Review 76(2) 323-329 Kamat MS Kamat MM (2012) An Application of Partial Adjustment Equation in Determining
Payout Behavior using an Extended Instrumental Variable Approach Working paper VVMs Shree Damodar College Goa University
Kamat MS Kamat MM (2013) Economic reforms determinants and stability of dividends in a
dynamic setting Journal of Asia Business Studies 7(1) 5-30 Kanoja S Bhatia BS (2013) Dividend Decisions and Payout Policy An Empirical Analysis of
Listed Indian Companies Working paper University of Delhi Karathanassis GA Chrysanthopoulou ECh (2005) The relationship Between Ownership Structure
and Corporate Dividend Policy ndash Evidence from the Athens Stock Exchange Working paper Athens University of Economics and Business
Khan T (2006) Company Dividends and Ownership Structure Evidence from UK Panel Data The Economic Journal 116(510) C172-C189 Kim J Jeon Y (2015) Dividend Policy and Corporate Social Responsibility A Comparative
Analysis of Multinational Enterprise Subsidiaries and Domestic Firms in Korea Emerging Markets Finance and Trade 51(2) 306-319
Kinfe T (2011) Determinants of Dividend payout An Empirical Study on Bank Industry in Ethiopia
Master thesis Addis Ababa University School of Business and Public Administration Department of Accounting and Finance School of Graduate Studies
Korkeamaki T Liljeblom E Pasternack D (2010) Tax reform and payout policy Do shareholder
clienteles or payout policy adjust Journal of Corporate Finance 16(4) 572-587 Kumar J (2003) Ownership Structure and Dividend Payout Policy in India Working paper Indira
Gandhi Institute of Development Research
43
Kumar R Kumar Jha P (2012) Determinants of Corporate Dividend Policy in India - A Study of Listed IT Companies at BSE Working paper Faculty of Management Studies BHU
La Porta R Lopez-de-Silanes F Shleifer A Vishny RW (1998) Law and Finance Journal of
Political Economy 106(6) 1133-1155 La Porta R Lopez-de-Silanes F Shleifer A Vishny RW (2000) Agency Problems and Dividend
Policies around the World Journal of Finance 55(1) 1-33 Lambrecht BM Myers S C (2012) A Lintner model of payouts and managerial rents Journal of
Finance 67(5) 1761ndash1810 Leary MT Michaely R (2011) Determinants of Dividend Smoothing Empirical Evidence Review
of Financial Studies 24(10) 3197-3249 Lintner J (1956) Distribution of incomes of corporations among dividends retained earnings and
taxes American Economic Review 46(2) 97-113 Longhi S Nijkamp P Poot J (2005) A Meta-Analysis Assessment of the Effect of Immigartion on
Wages Journal of Economic Surveys 19(3) 451-477 Manconi A Peyer U Vermaelen T (2017) Are Buybacks Good for Long-Term Shareholder Value
Evidence from Buybacks around the World European Corporate Governance Institute (ECGI) - Finance Working Paper No 4362014 INSEAD Working Paper No 2013101FIN
McDonald JG Jacquillat B Nussenbaum M (1975) Dividend Investment and Financing
Decisions Empirical Evidence on French Firms Journal of Financial and Quantitative Analysis 10(5) 741-755
McDonald R Soderstrom N (1986) Dividend and Share Changes Is There a Financing Hierarchy
NBER working paper series Working Paper No 2029 MacKinnon JG Webb MD (2017) Wild Bootstrap Inference for Wildly Different Cluster Sizes
Journal of Applied Econometrics 32(2) 233-254 Michaely R Roberts MR (2012) Corporate Dividend Policies Lessons from Private Firms Review
of Financial Studies 25(3) 711-746 Miller MH Rock K (1985) Dividend Policy under Asymmetric Information Journal of Finance
40(4) 1031-1051 Miller M Scholes M (1978) Dividends and Taxes Journal of Financial Economics 6(4) 333-364
44
Modigliani F Miller M (1958) The Cost of Capital Corporation Finance and the Theory of Investment American Economic Review 48(3) 261ndash297
Mohsin HM Ashraf MS (2011) Monetary policy restriction and dividend behavior of Pakistani
firms an empirical analysis MPRA Paper No 34052 Mollah Sabur A (2009) Testing Partial Adjustment Dividend Behavioral Models in Emerging
Markets Evidence from Pre and Post Market Reforms in Bangladesh Global Journal of Business Research 3(1) 1-14
Mookerjee R (1992) An empirical investigation of corporate dividend pay-out behaviour in an
emerging market Applied Financial Economics 2(4) 243-246 Mueller DC (1967) The Firm Decision Process An Econometric Investigation The Quarterly
Journal of Economics 81(1) 58-87 Naceur S Goaied M Belanes A (2006) On the Determinants and Dynamics of Dividend Policy
International Review of Finance 6(1-2) 1-23 Naceur S Goaied M Belanes A (2016) A Re-examination of Dividend Policy A Dynamic Panel
Data Analysis Working paper ESSEC Tunis IHEC Carthage Nakamura A (1985) Rational Expectations and the Firms Dividend Behavior Review of Economics
and Statistics 67(4) 606-615 Nakamura M (1989) Asymmetry in the Dividend Behavior of US and Japanese Firms Managerial
and Decision Economics 10(4) 261-274 Nelson JP Kennedy PE (2009) The Use (and Abuse) of Meta-Analysis in Environmental and
Natural Resource Economics An Assessment Environmental and Resource Economics 42(3) 345-377
Nickell S (1981) Biases in Dynamic Models with Fixed Effects Econometrica 49(6) 1417-1426
Oczkowski E Doucouliagos H (2014) Wine Prices and Quality Ratings a Meta-Regression Analysis American Journal of Agricultural Economics 97(1) 103-121
Omet G (2004) Dividend Policy Behaviour in the Jordanian Capital Market International Journal of
Business 9(3) 287-300 Pal K Goyal P (2007) Leading Determinants of Dividend Policy A Case Study of the Indian
Banking Industry Decision 34(2) 88-112
45
Pandey IM Bhat R (2007) Dividend behavior of Indian companies under monetary policy Managerial Finance 33(1) 14-25
Pandey IM (2003) Corporate Dividend Policy and Behaviour The Malaysian Evidence Asian
Academy of Management Journal 8(1) 17ndash32 Perez-Gonzalez F (2003) Large Shareholders and Dividends Evidence from US Tax Reforms
Working paper Columbia University Persson R (2013) Dividend policy behavior An analysis of firms listed at Stockholm Stock
Exchange Bachelor thesis Uppsala University Department of Economics EKONOMIKUM - Centre for Economic Sciences
Pindado J Requejo I Torre C de la (2012) Do Family Firms Use Dividend Policy as a Governance
Mechanism Evidence from the Euro zone Corporate Governance An International Review 20(5) 413-431
Post C Byron K (2015) Women on boards and firm financial performance A meta-analysis
Academy of Management Journal 58(5) 1546-1571 Powell JG Shi J Smith T (2004) Dividend persistence and return predictability Working paper
School of Finance and Applied Statistics Faculty of Economics and Commerce The Australian National University Canberra
Raftery AE Madigan D Hoeting JA (1997) Bayesian model averaging for linear regression
models Journal of the American Statistical Association 92 179ndash191 Rahman N (2002) Ownership structure and dividend smoothing cross-country evidence Working
paper University of Chicago Graduate School of Business Raza S H Zahaar M Hafeez M (2009) The Ownership Structure and Dividend Payout Policy in
Pakistan Evidence from KSE-100 index Non-financial Firms Pakistan Journal of Education 26(1) 173-188
Renneboog L Szilagyi PG (2015) How Relevant is Dividend Policy under Low Shareholder
Protection Journal of International Financial Markets Institutions and Money Advance online publication DOI 101016jintfin201501006
Renneboog L Trojanowski G (2007) Control structures and payout policy Managerial Finance
27(3) 180-194 Rusnak M Havranek T Horvath R (2013) How to Solve the Price Puzzle A Meta‐Analysis
Journal of Money Credit and Banking 45(1) 37-70
46
Sembenelli A (1993) Signalling Financial Hierarchy and Agency Theory as Explanations for Dividend Behavior Evidence from Italian Firm Data Managerial and Decision 14(1) 37-45
Shinozaki S Uchida K (2015) Ownership structure and dividend smoothing International evidence
Working paper Faculty of Economics Kyushu University Short H Zhang H Keasey K (2002) The link between dividend policy and institutional ownership
Journal of Corporate Finance 8(2) 105-122 Simegen M (2013) Determinants of Dividend Policy of Banks in Ethiopia Master thesis Addis
Ababa University College of Accounting and Finance School of Graduate Studies Skinner D (2008) The evolving relation between earnings dividends and stock repurchases Journal
of Financial Economics 87(3) 582-609 Stanley TD (2001) Wheat from Chaff Meta-Analysis as Quantitative Literature Review Journal of
Economic Perspectives 15(3) 131-150 Stanley TD (2005) Beyond Publication Bias Journal of Economic Surveys 19(3) 309-345 Stanley TD (2008) Meta-Regression Methods for Detecting and Estimating Empirical Effects in the
Presence of Publication Selection Oxford Bulletin of Economics and Statistics 70(1) 103-127 Stanley TD Doucouliagos H (2010) Picture This A Simple Graph That Reveals Much Ado About
Research Journal of Economic Surveys 24(1) 170-191 Stanley TD Doucouliagos H (2012) Meta-regression Analysis in Economics and Business Oxford
UK Routledge Stanley TD Doucouliagos H (2013) Better than Random Weighted Least Squares Meta
Regression Analysis University of Australia School of Accounting Economics and Finance Economics Series Working Paper SWP 20132
Stanley TD Doucouliagos H (2015) Neither fixed nor random weighted least squares meta-
analysis Statistics in Medicine 34 2116-2127 Stanley TD Jarrell B (1989) Meta-Regression Analysis A Quantitative Method of Literature
Journal of Economic Surveys 3(2) 161-170 Stanley TD Doucouliagos H Giles M Heckemeyer JH Johnston RJ Laroche P Nelson JP
Paldam M Poot J Pugh G Rosenberger RS Rost K (2013) Meta-Analysis of Economics Research Reporting Guidelines Journal of Economic Surveys 27(2) 390-394
47
Sudhahar M Saroja T (2010) Determinants of Dividend Policy in Indian Banks An Empirical Analysis Journal of Bank Management 9(3) 63-75
Sura JS Pal K Bodla BS (2006) Factors Influencing Dividend Policy Decisions in Banking
Sector An Indian Evidence Amity Business Review 7(2) 64-75 Tran QT Nguyen TTH (2014) Dividend Policy Behavior in Emerging Stock Markets Evidence
from Vietnamese Stock Market International Journal of Financial Research 5(4) 85-89 Trojanowski G (2004) Ownership structure and payout policy in the UK Working paper University of Exeter Business School Trotman KT Wood R (1991) A Meta-Analysis of Studies on Internal Control Judgements Journal
of Accounting Research 29(1) 180-192 Turnovsky SJ (1967) The Allocation of Corporate Profits between Dividends and Retained Earnings
Review of Economics and Statistics 49(4) 583-589 Valickova P Havranek T Horvath R (2015) Financial Development and Economic Growth A
Meta-Analysis Journal of Economic Surveys 29(3) 506-526 Vasiliou D Eriotis N (2002) The Determinants of Dividend policy some Greek data European
Journal of Management and Public Policy 1(2) 46-56 Wang K Shailer G (2015) Ownership concentration and firm performance in emerging markets a
meta-analysis Journal of Economic Surveys 29(2) 199-229 Wang X Manry D Wandler S (2011) The impact of government ownership on dividend policy in
China Advances in Accounting incorporating Advances in International Accounting 27(2) 366-372
Watts R (1973) The Information Content of Dividends Journal of Business 46(2) 191-211 Weber S (2010) bacon An effective way to detect outliers in multivariate data using Stata (and
Mata) The Stata Journal 10(3) 331-338 Younis D Javid AY (2014) Market Imperfections and Dividend Policy Decisions of Manufacturing
Sector of Pakistan PIDE Working Papers 201499 Zameer H Rasool S Iqbal S Arshad U (2013) Determinants of Dividend Policy A Case of
Banking Sector in Pakistan Middle-East Journal of Scientific Research 18(3) 410-424 Zigraiova D Havranek T (2016) Bank Competition and Financial Stability Much Ado about
Nothing Journal of Economic Surveys 30(5) 944-981
48
Tables and Figures
Figure 1 Funnel plot for the dividend smoothing coefficients
Note The dividend smoothing is measured on the x-axis while the y-axis represents precision calculated as the inverse
standard error The vertical line at 0728 indicates the ldquotruerdquo dividend smoothing as the mean of the 10 most precise
smoothing coefficients
49
Table 1 Summary statistics of meta data
Variable label Definition Mean Standard deviation
Dependent Variable
Dividend smoothing (d)
Dividend smoothing coefficient 0562 0325
Precision
Standard error (se)
Standard error of the dividend smoothing coefficient 0093 0102
Study design characteristics
Working Paper The study is a working paper older than 5 years = 1 0 otherwise
0112 0316
Post 1998 The mean year of estimation period gt1998 = 1 0 otherwise 0470 0499 No of years Length of the analyzed time series dimension 12526 11524 Debt Ownership Size Other Lintner classical
Estimation controls for firm debt = 1 0 otherwise Estimation controls for ownership = 1 0 otherwise Estimation controls for firm size =1 0 otherwise Estimation controls for other firm factors =1 0 otherwise Estimation does not include variables in addition to contemporaneous earnings and lagged dividends as independent variables =1 0 otherwise
0104 0166 0139 0419 0420
0306 0373 0346 0494 0494
Cash flow The estimation uses a cash flow measure =1 0 if earnings measure
0113 0317
OLS The estimation is based on OLS =1 0 otherwise 0553 0497
GMM The estimation is based on GMM=1 0 otherwise 0147 0354
Fixed effects The estimation is based on fixed effects = 1 0 otherwise 0157 0364 Other estimators The estimation is based on other methods = 1 0 otherwise 0143 0350 Service and Consumer Goods Financial firms Industry firms
Study analyzes serviceconsumer goods firms =1 0 otherwise Study analyzes financial firms =1 0 otherwise Study analyzes industry sector firms =1 0 otherwise
0015
0150 0061
0123
0357 0240
EU Developing US UK Other countries
Study analyzes a country or several countries from the EU =1 0 otherwise
Study analyzes a developing country or several developing countries =1 0 otherwise Study analyzes the US =1 0 otherwise Study analyzes the UK =1 0 otherwise Study focuses on other countries =1 0 otherwise
0174
0344
0114 0083 0277
0379
0475
0318 0276 0447
Note We use the following reference categories in the MRA classical Lintner model for pre 1998 US data estimated with OLS
50
Table 2 WLS FAT-PET meta-regression analysis results
Variable Robust se
(1)
Robust se
(2)
Robust se
(3)
Study cluster
robust se (4)
Study cluster
robust se (5)
Study cluster
robust se (6)
Wild bootstrap
se clustered by study
(7)
Wild bootstrap
se clustered by study
(8)
Wild bootstrap
se clustered by study
(9)
Constant 0755 (2035)
0732 (2147)
0707 (2481)
0755 (712)
0732 (760)
0707 (777)
0755 [0000]
0732 [0000]
0707 [0000]
SE -3613 (-482) - -3613
(-200) -3613 [0216] -
SE (smoothingle05) -1130 (-1724) -1130
(-481) -1130 [0002]
SE (smoothinggt05) 2526 (264) 2526
(148) 2526 [0246]
SEsup2 (smoothingle05) - -17412 (-385) - -17412
(-261) - -17412 [0148]
SEsup2(smoothinggt05) 4746 (237) 4746
(087) 4746 [0596]
F 2327 2273 1270 398 2273 558 p(F) 0000 0000 0000 0049 0000 0005 R2 0043 0284 0018 0042 0284 0018 0043 0284 0018 Adj R2 0042 0283 0016 Observations 979 979 979 979 979 979 978 978 978
Notes Dependent variable is dividend smoothing coefficient t-values in parentheses p values in brackets significance at the 1
5 10 level Squared standard errors of adjustment coefficients are used as weights
51
Table 3 WLS estimation results of models (8) (9) and (10)
Panel A
Variable
Robust se
(1)
Cluster robust se by study
(2)
Wild bootstrap se clustered by
study (3)
Constant
0678 (823)
0678 (414)
0678 [0072]
se
-1536 (-244)
-1536 (-162)
-1536 [0172]
Working paper 0157 (220)
0157 (193)
0157 [0284]
Post 1998
-0085 (-165)
-0085 (-129)
-0085 [-0372]
No of years
-0004 (-160)
-0004 (-092)
-0004 [0594]
Debt
-0035 (-039)
-0035 (-035)
-0035 [-0830]
Ownership
0077 (245)
0077 (206)
0077 [0000]
Size
0025 (0037)
0025 (0024)
0025 [0868]
Other
0024 (083)
0024 (072)
0024 [0484]
Cash Flow
0371 (548)
0371 (367)
0371 [0010]
GMM
-0219 (-319)
-0219 (-232)
-0219 [0078]
Fixed effects
-0205 (-322)
-0205 (-275)
-0205 [0036]
Other estimators -0083 (-106)
-0083 (-089)
-0083 [0610]
Service amp consumer goods -0381 (-160)
-0381 (-154)
-0381 [0452]
Financial firms
0250 (285)
0250 (249)
0250 [0052]
Industry firms
0078 (109)
0078 (097)
0078 [0422]
EU
-0092 (-113)
-0092 (-060)
-0092 [-0696]
Developing
0050 (064)
0050 (041)
0050 [0786]
UK
0058 (066)
0058 (043)
0058 [0722]
Other countries 0086 (095)
0086 (068)
0086 [0714]
F 7502 1977 1977 p(F) 0000 0000 Rsup2 0473 0473 0473 Adj Rsup2 0462
Observations 979 979 979 Notes All variables are as defined as in table 1 Dependent variable is dividend smoothing coefficient This panel contains specifications with the standard error of the estimated dividend smoothing as independent variable In Panel B the (squared) standard error is interacted with a dummy variable equal to 1 for dividend smoothing coefficients higher or lower or equal than 05 respectively t-values in parentheses p values in brackets significance at the 1 5 10 level Squared standard errors of adjustment coefficients are used as weights Reference category classical Lintner model for pre 1998 US data estimated with OLS
52
Panel B
Variable
Robust se
(1)
Robust se
(2)
Cluster
robust se by study
(3)
Cluster
robust se by study
(4)
Wild bootstrap se clustered by
study (5)
Wild bootstrap se clustered by
study (6)
Constant
0675 (925)
0657 (812)
0675 (478)
0657 (400)
0675 [0042]
0657 [0072]
SE (smoothingle05)
-7499 (-1307)
-7499 (-673)
-7499 [0002]
SE (smoothinggt05) 3591 (375)
3591 (257)
3591 [0004]
SEsup2 (smoothingle05) -11997 (-382)
-11997 (-344)
-11997 [0086]
SEsup2(smoothinggt05) 8195 (384)
8195 (246)
8195 [0022]
Working paper 0160 (270)
0161 (235)
0160 (245)
0161 (203)
0160 [0164]
0161 [0276]
Post 1998
-0081 (-191)
-0094 (-185)
-0081 (-151)
-0094 (-142)
-0081 [0258]
-0094 [0344]
No of years
-0006 (-240)
-0004 (-174)
-0006 (-144)
-0004 (-099)
-0006 [0386]
-0004 [0578]
Debt
-0019 (-027)
-0028 (-030)
-0019 (-024)
-0028 (-027)
-0019 [0938]
-0028 [0888]
Ownership
0082 (303)
0080 (255)
0082 (266)
0080 (210)
0082 [0000]
0080 [0000]
Size
0018 (033)
0029 (041)
0018 (023)
0029 (041)
0018 [0922]
0029 [0874]
Other
0017 (071)
0015 (049)
0017 (064)
0015 (042)
0017 [0610]
0015 [0710]
Cash Flow
0272 (431)
0350 (494)
0272 (295)
0350 (316)
0272 [0154]
0350 [0104]
GMM
-0092 (-136)
-0193 (-283)
-0092 (-106)
-0193 (-206)
-0092 [0468]
-0193 [0120]
Fixed effects
-0111 (-191)
-0187 (-298)
-0111 (-169)
-0187 (-256)
-0111 [0190]
-0187 [0062]
Other estimators -0017 (-025)
-0067 (-087)
-0017 (-025)
-0067 (-073)
-0017 [0902]
-0067 [-0640]
Service amp consumer goods -0281 (-140)
-0412 (-188)
-0281 (-145)
-0412 (-184)
-0281 [0434]
-0412 [0390]
Financial firms
0209 (271)
0235 (259)
0209 (251)
0235 (226)
0209 [0038]
0235 [0082]
Industry firms
-0011 (-020)
0026 (034)
-0011 (-017)
0026 (028)
-0011 [-0916]
0026 [0776]
EU
-0131 (-184)
-0135 (-167)
-0131 (-109)
-0135 (-089)
-0131 [-0476]
-0135 [0570]
Developing
-0001 (-001)
0037 (048)
-0001 (-001)
0037 (030)
-0001 [-0986]
0037 [0810]
UK
0032 (039)
0065 (075)
0032 (027)
0065 (048)
0032 [0890]
0065 [0722]
Other countries 0061 (078)
0093 (104)
0061 (059)
0093 (073)
0061 [0740]
0093 [0630]
F 9332 3475 9332 1588 p(F) 0000 0000 0000 0000 Rsup2 0608 0478 0478 0478 0608 0478 Adj Rsup2 0600 0467
Observations 979 979 979 979 979 979
53
Appendix
Table A1 Overview of studies estimating dividend smoothing coefficients
Authors Countries Time span No of firms No of estimates Method Mean
)ˆ(d Median
)ˆ(d Darling (1957) US 1921-1954 34 2 OLS 0495 0495
Brittain (1964) US 1920-1960 41 4 OLS 0716 0776
Mueller (1967) US 1957-1960 67 5 OLS amp other method 0877 0837 Turnovsky (1967) US 1948-1962 15 3 OLS 0594 0590 Feldstein (1970) UK 1953-1964 12 18 OLS amp other method 0567 0603 Mcdonald amp Nussenbaum (1975) France 1967-1968 2 7 OLS 0791 0802 Nakamura (1985)
Japan US
1964-1981 18 24 OLS 0680 0756
Mcdonald amp Soderstrom (1986) US 1965-1984 20 1 Fixed effects 0840 0840 Dharan (1988) US 1981-1983 3 6 OLS 0933 0947 Nakamura (1989) US 1960-1982 23 48 OLS 0701 0779 Mookerjee (1992) India 1950-1981 32 8 Other method 0255 0240 Behm amp Zimmermann (1993) Germany 1962-1988 32 8 OLS 0813 0812 Sembenelli (1993) Italy 1962-1988 27 6 OLS amp GMM 0703 0733 Hines (1996) US 1984-1989 6 5 OLS 0596 0569 DeAngelo amp DeAngelo (2000) US 1958-1979 22 4 Other method 0268 0270 Garrett amp Priestley (2000) US 1876-1997 122 3 Other method 0691 0670 Desai et al (2001) US 1982-1997 16 24 OLS Fixed effects amp
other method 0282 0279
Esteban amp Peacuterez (2001) 22 European countries
1991-1998 8 1 GMM 0342 0342
Rahman (2002) 28 1992-1999 8 57 OLS 0900 0945
54
countries Short et al (2002) UK 1988-1992 5 3 OLS 0556 0622 Vasiliou amp Eriotis (2002) Greece 1996-2001 6 4 OLS amp Fixed effects 0530 0530 Adelegan (2003) Nigeria 1984-1997 14 5 OLS 1358 1405 Gugler amp Yurtoglu (2003) Germany 1992-1998 7 6 Fixed effects 0400 0414 Kumar (2003) India 1994-2000 7 28 OLS amp Fixed effects 0500 0729 Pandey (2003) Malaysia 1993-2000 8 7 Fixed effects 0391 0432 Perez-Gonzalez (2003) US 1980-1999 20 2 Fixed effects 0503 0503 Benzinho (2004) Portugal 1990-2002 34 1 Other method 0352 0352 Correia da Silva et al (2004) Germany 1984-1993 10 24 OLS Fixed effects
GMM amp other method 0641 0684
Omet (2004) Jordania 1985-1999 15 3 OLS Fixed effects amp other method
0631 0681
Powell et al (2004) US 1927-1996 70 2 OLS 0788 0788 Trojanowski (2004) UK 1992-1998 7 11 GMM 0253 0270 Karathanassis amp Chrysanthopoulou (2005) Greece 1996-1998 3 32 Fixed effects amp other
method 0265 0266
Aivazian et al (2006) US 1981-1999 19 1 Fixed effects 0089 0089 Foerster amp Sapp (2006) Canada 1871-2003 133 4 OLS 0787 0785 Khan (2006) UK 1985-1997 330 6 OLS amp GMM 0674 0677 Naceur et al (2006) Tunisia 1996-2002 7 24 OLS Fixed effects
GMM amp other method 0334 0264
Sura et al (2006) India 2003-2004 2 43 OLS 0475 0503 Ameer (2007) Malaysia 1995-2005 11 3 OLS 0633 0595 Benhamouda (2007) UK 2000-2004 5 20 OLS amp Fixed effects 0127 0031 Bodla et al (2007) India 1996-2006 11 32 OLS 0485 0506 Dai (2007) Norway 1989-1998 10 5 Other method 0763 0764 Hines et al (2007) US 1982-2002 21 29 OLS Fixed effects amp
other method 0241 0239
Pal amp Goyal (2007) India 1997-1998 2 9 OLS 0920 0852 Pandey amp Bhat (2007) India 1989-1997 9 8 GMM 0259 0258
55
Renneboog amp Trojanowski (2007) UK 1992-1998 7 6 GMM 0313 0305 Ahmed amp Javid (2008) Pakistan 2001-2006 6 16 OLS Fixed effects
GMM amp other method 0549 0705
Ameer (2008) Malaysia 1995-2005 11 7 OLS 0525 0576 Baba amp Ueno (2008) Japan 1990-2003 14 1 GMM 0657 0657 Haddad et al (2008) Jordania 1996-2002 7 6 OLS amp GMM 0409 0373 Ahmed amp Javid (2009) Pakistan 2001-2006 6 12 OLS Fixed effects
GMM amp other method 0532 0500
Al-Najjar (2009) Jordania 1994-2003 10 3 OLS Fixed effects amp other method
0495 0561
Alzahrani amp Lasfer (2009) 24 OECD countries
2000-2007 8 12 Fixed effects amp GMM 0240 0236
Andres et al (2009) Germany 1984-2005 22 20 OLS Fixed effects amp GMM
0683 0697
Hayunga amp Stephens (2009) UK 1992-2003 12 9 OLS amp other method 0663 0621 Mollah (2009) Bnagladesh 1988-2003 16 15 OLS 0730 0741 Raza et al (2009) Pakistan 2001-2006 6 1 OLS 0771 0771 Al-Ajmi (2010) Qatar 1997-2006 10 14 OLS 0873 0808 Al-Yahyaee et al (2010) Oman 1989-2004 16 1 Other method 0747 0747 Chemmanur et al (2010)
Hong Kong US
1984-2002 19 8 OLS 0623 0513
Korkeamaki et al (2010) Finland 2003-2006 4 10 OLS Fixed effects amp other method
0072 0110
Sudhahar amp Saroja (2010) India 1997-2007 11 3 OLS 0680 0715 Al-Yahyaee et al (2011) Oman 1989-2004 16 1 Other method 0059 0059 Baiyao (2011) US 1991-2007 17 1 OLS 0450 0450 Goncharov amp Triest (2011) Russia 2003-2006 4 7 OLS 0546 0377 Haleem amp Javid (2011) Pakistan 2007-2009 3 21 OLS 0898 0803 Hussain (2011) Saudia
Arabia 1990-2006 17 9 Fixed effects amp other
method 0546 0377
Kinfe (2011) Ethiopia 2006-2010 5 1 OLS 0191 0191 Mohsin amp Ashraf (2011) Pakistan 2001-2009 9 3 Fixed effects amp GMM amp
other method 0568 0626
56
Wang et al (2011) China 1998-2008 11 13 OLS amp other method 0448 0450 Abdullah et al (2012) Malaysia 2009-2010 2 1 OLS 0889 0889 Al-Najjar amp Belghitar (2012) UK 1991-2007 17 8 Fixed effects amp GMM amp
other method 0552 0568
Bawa amp Kaur (2012) India 2006-2006 1 24 OLS amp Fixed effects 0898 0847 Kamat amp Kamat (2012) India 1971-2007 37 9 GMM 0476 0401 Kumar amp Kumar Jha (2012) India 2007-2011 5 3 OLS 0039 0077 Baker et al (2013) Canada 1988-1999 12 2 OLS 0550 0550 Hutagalung et al (2013) Malaysia 2001-2010 10 1 Fixed effects 0856 0856 Kamat amp Kamat (2013) India 1975-1992 18 3 GMM 0534 0571 Kanoja amp Bhatia (2013) India 2007-2012 6 5 OLS 0587 0682 Persson (2013) Sweden 2005-2011 7 6 Fixed effects 0378 0225 Simegen (2013) Ethiopia 2002-2011 10 2 Fixed effects 0203 0203 Zameer et al (2013) Pakistan 2003-2009 7 1 OLS 0699 0699 Al-Malkawi et al (2014) Oman 2001-2010 10 2 Other method 0744 0744 Andres et al (2014) Germany 1984-2005 22 19 OLS amp GMM 0592 0501 Arko et al (2014) Sub-
Saharan African countries
1997-2007 11 9 OLS 0677 0662
Boţoc amp Pirtea (2014) 16 emerging countries
2003-2011 9 16 OLS amp GMM 0474 0487
Gunathilaka (2014) Sri Lanka 2006-2010 5 7 GMM 0273 0350 Tran amp Nguyen (2014) Vietnam 2006-2011 6 2 Fixed effects 0122 0122 Younis amp Javid (2014) Pakistan 2003-2011 9 6 Fixed effects amp other
method 0512 0570
Al-Attar et al (2015) Jordania 2006-2011 6 7 OLS 0506 0487 Andres et al (2015) Germany 1988-2008 21 3 OLS Fixed effects amp
GMM 0716 0681
Kim amp Jeon (2015) Korea 2000-2010 11 8 OLS Fixed effects amp other method
0614 0722
57
Renneboog amp Szilagyi (2015) Netherlands 1996-2004 9 8 GMM 0996 0825 Shinozaki amp Uchida (2015) 44
countries 2003-2013 11 1 Fixed effects 0788 0788
Athari et al (2016) 7 Arabian countries
2003-2012 10 4 GMM 0404 0407
Benavides et al (2016) Argentina 1995-2013 19 45 OLS 0650 0660 Brazil Chile Columbia Mexico Peru Bremberger et al (2016) 14 EU
countries 1986-2010 25 11 OLS Fixed effects amp
GMM 0510 0506
Chan et al (2016) US 1927-2013 87 2 OLS 0742 0742 Chen amp Sinha (2016) US 1996-2001 6 4 OLS 0739 0738 Naceur et al (2016) Tunisia 1996-2002 7 14 OLS Fixed effects
GMM amp other method 0160 0165
Source Authors literature search
58
Figure A1 Frequency distribution of dividend smoothing coefficients
050
100
150
Freq
uenc
y
-1 0 1 2 3Smoothing coefficient
Note The dividend smoothing is measured on the x-axis while the y-axis represents the frequency of dividend smoothing coefficients within the respective interval
Figure A2 Kernel density of dividend smoothing coefficients
05
11
5D
ensi
ty
-1 0 1 2 3Smoothing coefficient
e e de s y es a e
Note The dividend smoothing is measured on the x-axis while the y-axis represents the density of dividend smoothing coefficients estimated by Kernel density estimation
59
Figure A3 Funnel plot for the dividend smoothing coefficients (median)
0
20
40
60
80
100
120
140
160
0 05 1 15
Note The dividend smoothing is measured on the x-axis while the y-axis represents precision calculated as the inverse standard error The vertical line at 0671 indicates the ldquotruerdquo dividend smoothing as the mean of the 10 most precise smoothing coefficients The plot is based on median values of the dividend smoothing coefficients and precision per study
Figure A4 Frequency distribution of dividend smoothing coefficients (median)
Figure A5 Kernel density of dividend smoothing coefficients (median)
010
2030
Freq
uenc
y
0 5 1 15Smoothing coefficient
05
11
52
Den
sity
0 5 1 15Smoothing coefficient
y
Note Figure A4 (left-hand side) The dividend smoothing is measured on the x-axis while the y-axis represents the frequency of dividend smoothing coefficients within the respective interval The figure is based on median values of the dividend smoothing coefficients and precision per study
Note Figure A5 (right-hand side) The dividend smoothing is measured on the x-axis while the y-axis represents the density of dividend smoothing coefficients estimated by Kernel density estimation The figure is based on median values of the dividend smoothing coefficients and precision per study
60
Table A2 Bayesian averaging of models (8) (9) and (10)
Variable Post mean (Post SE) PIP
Robust se
Post mean (Post SE) PIP
Robust se Post mean
(Post SE) PIP
Robust se
Constant
0682 (1998)
100 0705 (1408)
0583 (2555)
100 0579 (818)
0641 (2016)
100 0654 (1153)
SE
-0264 (-181)
084 -2379 (-430)
SE (smoothingle05)
-1150 (-1441)
100 -7390 (-1027)
SE (smoothinggt05) 1701 (1591)
100 3568 (351)
SEsup2 (smoothingle05) -0678 (-708)
100 -12513 (-385)
SEsup2(smoothinggt05) 3941 (1259)
100 5238 (217)
Working paper 0043 (089)
050
0102 (402)
100 0239 (337)
0110 (328)
098 0271 (487)
Post 1998
-0087 (-331)
099 -0077 (-197)
-0119 (-646)
100 -0088 (-186)
-0101 (-447)
100 -0064 (-114)
No of years
0000 (007)
004
0000 (004)
004 0000 (029)
011
Debt
-0000 (-004)
003
0000 (011)
004 -0002 (-004)
003
Ownership
0000 (000)
003
0006 (038)
038 0000 (004)
003
Size
0001 (014)
005
0000 (003)
003 0000 (004)
004
Other
-0000 (-005)
003
-0004 (-036)
015 -0001 (-015)
005
Cash Flow
0168 (551)
100 0370 (525)
0095 (376)
099 0219 (303)
0125 (447)
100 0329 (433)
GMM
-0241 (-838)
100 -0269 (-533)
-0136 (-617)
100 -0159 (-260)
-0223 (-872)
100 -0220 (-354)
Fixed effects
-0379 (-1322)
100 -0256 (-421)
-0239 (-1078)
100 -0121 (-185)
-0349 (-1368)
100 -0232 (-334)
Other estimators -0146 (-497)
100 -0149 (-232)
-0089 (-383)
099 0005 (007)
-0137 (-520)
100 -0099 (-117)
Service amp consumer goods 0128 (108)
061 -0415 (-152)
0004 (019)
006 0004 (018)
006
Financial firms
-0067 (-145)
075 0276 (340)
-0004 (-031)
012 -0035 (-090)
051 0271 (310)
Industry firms
0208 (498)
100 0007 (013)
0021 (058)
030 0084 (148)
076 0032 (051)
EU
0014 (044)
020
0009 (040)
018 0013 (042)
019
Developing
0045 (094)
055 0048 (105)
0064 (216)
090 0067 (099)
0035 (081)
047
UK
-0003 (-017)
008
0001 (006)
004 -0004 (-021)
009
Other countries 0056 (106)
061 0167 (315)
0080 (273)
095 0087 (106)
0030 (070)
039
n 979 979 979 979 979 979 Notes All variables are as defined as in table 1 Dependent variable is dividend smoothing coefficient t-values in parentheses p values in brackets All models estimated with robust standard errors significance at the 1 5 10 level Squared standard errors of adjustment coefficients are used as weights PIP refers to the posterior inclusion probability of the variables estimated by Bayesian modeling averaging Reference category classical Lintner model for pre 1998 US data estimated with OLS
61
Table A3 WLS FAT-PET meta-regression robustness checks
Variable Robust 05-quantile estimation WLS coefficients per study
Constant 0659 (2955)
0573 (4779)
0564 (3030)
0663 (4468)
0581 (2492)
0566 (4244)
SE -0628 (-359) -0752
(-557)
SE (smoothingle05) -1960 (-1336) -1381
(-403)
SE (smoothinggt05) 1585 (1172) 1497
(762)
SEsup2 (smoothingle05) -4534 (-152) -0636
(-351)
SEsup2(smoothinggt05) 5283 (801) 4899
(980) F 3100 9802 5561 p(F) 0000 0000 0000 R2 0020 0262 0090 0065 0390 0149 n 998 998 998 979 979 979
Note Dependent variable is dividend smoothing coefficient All models estimated with robust standard errors t-values in parentheses p values in brackets significance at the 1 5 10 level
62
Table A4 robustness checks of models (8) (9) and (10)
Variable Robust 05-quantile estimation WLS coefficients per study
Constant
0702 (2093)
0555 (1704)
0569 (1761)
0565 (1378)
0460 (1198)
0436 (1153)
SE -0619 (-692) -0663
(-692)
SE (smoothingle05) -1404
(-1274) -0979 (-405)
SE (smoothinggt05) 1397 (846) 1672
(764)
SEsup2 (smoothingle05) -2258 (-093) -0526
(-425) SEsup2(smoothinggt05) 3791
(547) 4682 (808)
Working paper 0078 (267)
0075 (221)
0112 (367)
0106 (357)
0157 (548)
0175 (607)
Post 1998
-0134 (-710)
-0151 (-1021)
-0156 (-893)
-0112 (-379)
-0125 (-517)
-0126 (-441)
No of years
0001 (234)
0001 (244)
0002 (268)
-0000 (-014)
0002 (150)
0003 (314)
Debt
-0027 (-069)
0038 (120)
-0045 (-143)
-0088 (-230)
-0042 (-135)
-0061 (-178)
Ownership
-0042 (-115)
0001 (003)
-0040 (-165)
0032 (136)
0072 (377)
0041 (182)
Size
0014 (039)
0009 (052)
0023 (071)
0026 (068)
0024 (079)
0030 (086)
Other
-0008 (-038)
-0034 (-219)
-0010 (-061)
0026 (112)
-0012 (-069)
0011 (051)
Cash Flow
0071 (258)
0041 (183)
0077 (459)
0136 (305)
0065 (175)
0098 (226)
GMM
-0281 (-1026)
-0170 (-942)
-0258 (-1160)
-0238 (-794)
-0169 (-678)
-0230 (-847)
Fixed effects
-0450 (-1807)
-0256 (-1139)
-0366 (-1847)
-0402 (-1410)
-0279 (-1161)
-0366 (-1332)
Other estimators -0159 (-536)
-0097 (-600)
-0147 (-704)
-0138 (-548)
-0085 (-433)
-0114 (-504)
Service amp consumer goods 0166 (211)
0050 (084)
0079 (066)
0524 (397)
0274 (268)
0327 (293)
Financial firms
-0037 (-120)
-0033 (-141)
-0053 (-184)
-0073 (-187)
-0058 (-177)
-0110 (-300)
Industry firms
0163 (579)
0065 (250)
0122 (776)
0313 (620)
0075 (221)
0098 (290)
EU
0079 (214)
0117 (361)
0107 (387)
0159 (452)
0103 (353)
0151 (444)
Developing
0116 (371)
0169 (607)
0171 (595)
0214 (511)
0176 (537)
0224 (564)
UK
0002 (005)
0079 (221)
0084 (248)
0072 (179)
0072 (217)
0084 (217)
Other countries 0111 (371)
0187 (607)
0162 (601)
0191 (505)
0178 (572)
0202 (567)
F 5135 7186 5798 p(F) 0000 0000 0000 Rsup2 0251 0389 0297 0417 0627 0489 n 998 998 998 979 979 979
Notes All variables are as defined as in table 1 Dependent variable is dividend smoothing coefficient All models estimated with robust standard errors t-values in parentheses p values in brackets significance at the 1 5 10 level Squared standard errors of adjustment coefficients are used as weights Reference category classical Lintner model for pre 1998 US data estimated with OLS
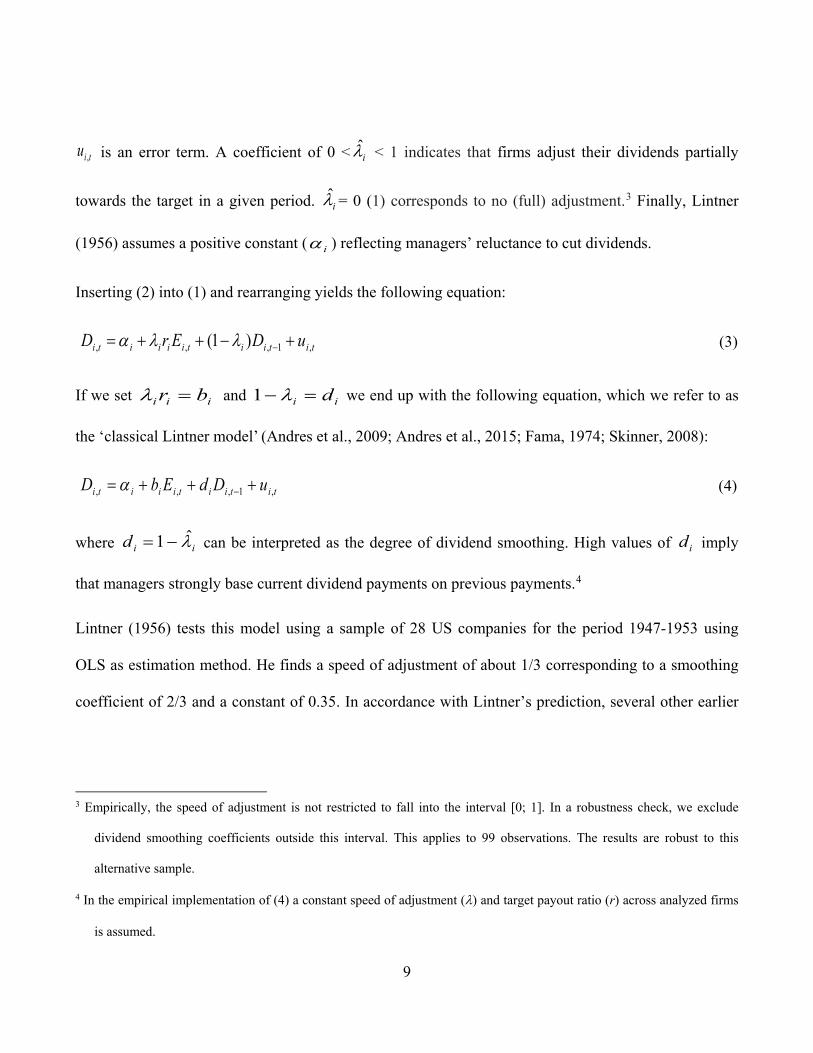
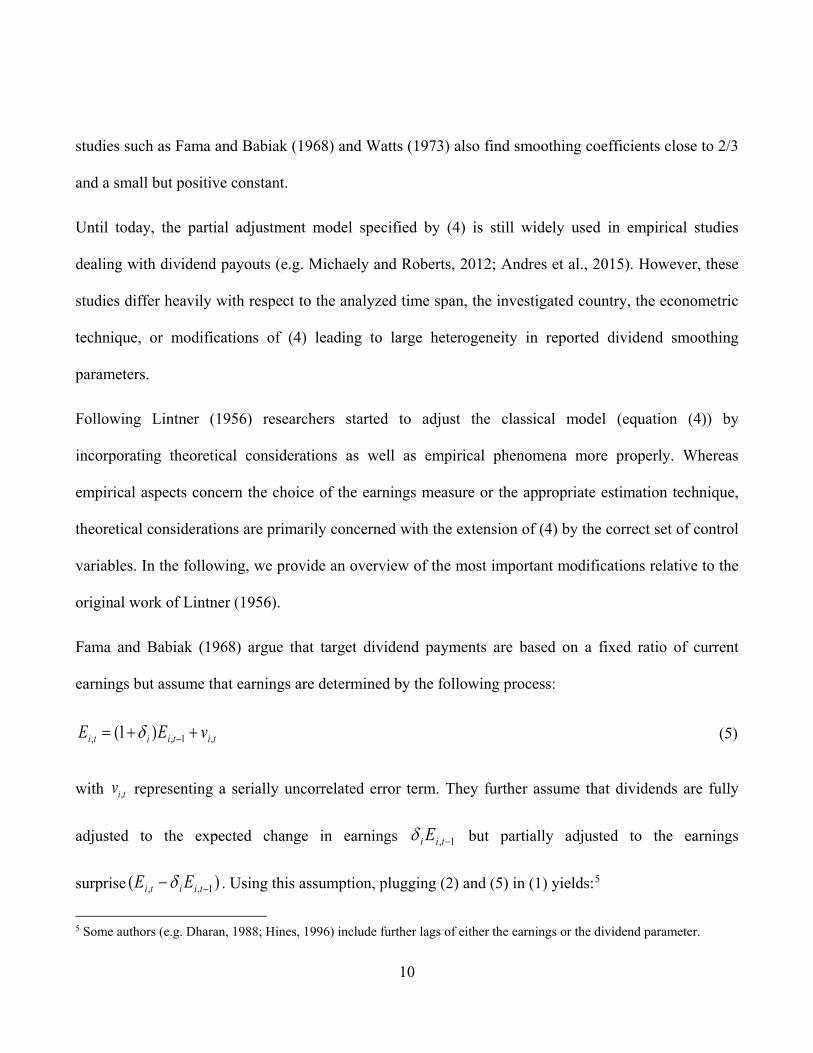
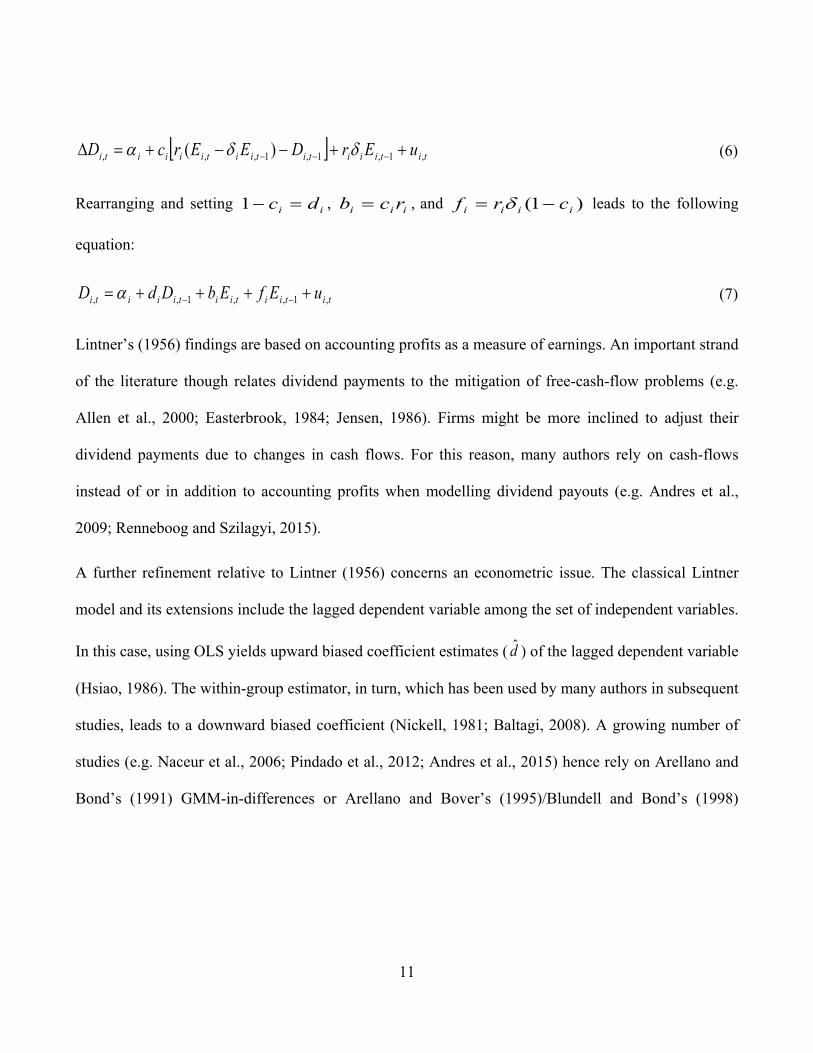
11
[ ] titiiititiitiiiiti uErDEErcD 111 )( ++minusminus+=∆ minusminusminus δδα (6)
Rearranging and setting ii dc =minus1 iii rcb = and )1( iiii crf minus= δ leads to the following
equation
titiitiitiiiti uEfEbDdD 11 ++++= minusminusα (7)
Lintnerrsquos (1956) findings are based on accounting profits as a measure of earnings An important strand
of the literature though relates dividend payments to the mitigation of free-cash-flow problems (eg
Allen et al 2000 Easterbrook 1984 Jensen 1986) Firms might be more inclined to adjust their
dividend payments due to changes in cash flows For this reason many authors rely on cash-flows
instead of or in addition to accounting profits when modelling dividend payouts (eg Andres et al
2009 Renneboog and Szilagyi 2015)
A further refinement relative to Lintner (1956) concerns an econometric issue The classical Lintner
model and its extensions include the lagged dependent variable among the set of independent variables
In this case using OLS yields upward biased coefficient estimates ( d ) of the lagged dependent variable
(Hsiao 1986) The within-group estimator in turn which has been used by many authors in subsequent
studies leads to a downward biased coefficient (Nickell 1981 Baltagi 2008) A growing number of
studies (eg Naceur et al 2006 Pindado et al 2012 Andres et al 2015) hence rely on Arellano and
Bondrsquos (1991) GMM-in-differences or Arellano and Boverrsquos (1995)Blundell and Bondrsquos (1998)
12
GMM-in-systems estimators6 These approaches yield unbiased coefficient estimates ( d ) of the lagged
dependent variable (Baltagi 2008)
The substantial rise in the volume of stock repurchases in and outside the US marks a major challenge
for the concept of a long-term dividend payout In recent studies Skinner (2008) Brav et al (2005)
and Leary and Michaely (2011) report evidence questioning that firms base their payout on a target
dividend ratio Whereas stock repurchases gained in importance in the US from 1980 onwards they
emerged as an alternative payout method in many non-US countries at the end of the 1990s (Manconi
et al 2017)7 The availability of a different payout method suggest that firms might use stock
repurchases to disburse temporary earnings (Jagannathan et al 2000) leading to higher dividend
smoothing Andres et al (2015) Brav et al (2005) and Choe (1990) find evidence in line with this
prediction
In addition institutional differences across countries such as the taxation of dividends and capital gains
or the frequency of dividend payments might be another reason for heterogeneous results in dividend
smoothing Andres et al (2009) McDonald et al (1975) and Short et al (2002) find dividend
smoothing coefficients that are different from the US analyzing samples of German French and UK
firms respectively Chemmanur et al (2010) compare the dividend policies of firms in the US and
Hong Kong and relate the finding of a more flexible dividend payout in Hong Kong to differences in
6 Arellano and Bover (1995) and Blundell and Bond (1998) show that GMM-in-systems is superior to GMM-in-differences
when applied to samples with a short time series dimension
7 The basis for stock repurchases in the EU is the Second Council Directive of December 13th 1976 (7791EEC)
However as EU countries still had to translate the directive into national law the volume in stock repurchases did not
reach meaningful levels in any EU country before the end of the 1990s
13
the equity ownership and tax regime across the two countries As the tax status of investors as well as
their equity ownership might also differ within countries Chemmanur et alrsquos (2010) finding can also
be interpreted as consistent with different firm characteristics as drivers for the heterogeneity in
dividend smoothing
Leary and Michaely (2011) provide a thorough overview of potential firm-specific characteristics that
are important to consider when estimating the degree of dividend smoothing As we show in our meta-
analysis firm size ownership structure as well as leverage are among the most commonly used firm
characteristics that have been used as control variables in Lintner-type partial adjustment models The
inclusion of these variables is in line with agency models (eg Easterbrook 1984 Jensen 1986)
signaling models (eg Bhattarchya 1979 Miller and Rock 1985) or tax-based models (eg Miller and
Scholes 1978 Allen et al 2000) The MRA can reveal the impact of their inclusionomission in
equations (4) and (7) on the resulting degree of dividend smoothing
Finally several studies have excluded financial firms from their analysis due to different regulatory
requirements for these firms In addition the evidence of DeAngelo et al (2004) suggests substantial
differences in payout policies across industries We therefore consider industry sectors as another
potential driver of heterogeneity in smoothing effects
3 Meta regression data amp descriptive statistics
In section 31 we describe the process of identifying the studies included in our MRA Subsequently
we provide some descriptive statistics with respect to relevant study design characteristics in section
32
14
31 SAMPLE SELECTION
First we performed a literature search based on the MRA guidelines of Stanley et al (2013) to identify
all potentially relevant unpublished and published empirical studies on dividend smoothing We
performed an initial search with all reasonable combinations of the following key terms ldquodividendsrdquo
ldquopayoutsrdquo ldquoLintner modelrdquo ldquodividend smoothingrdquo rdquotarget payoutrdquo and ldquospeed of adjustmentrdquo The
following databases have been employed for the literature search Econstor Google Scholar SSRN
Jstor Wiley Business Source Premier EBSCOhost NBER Econ papers We then checked the
reference lists of the identified studies by means of snowballing techniques to identify studies that have
not been detected by the initial key term search (Longhi et al 2005) This resulted in an initial set of
407 published and unpublished research papers We then checked whether those studies are based on
an empirical estimation of Lintner`s model or an extension of the latter As MRA requires a uniform
interpretation across the included coefficients we excluded 6 studies that used logarithms of dividends
andor earnings For the same reason 10 studies that estimated dividend smoothing individually for
each firm and afterwards report mean values are dropped from the sample8 In addition we ensured
that articles by ldquopredatoryrdquo publishers according to ldquoBeall`s List of Predatory Journals and Publishersrdquo
are not considered9 Finally we further excluded studies which are an earlier working paper version of
a subsequently published paper However whenever two versions exist we compared the working
paper version to the published version More specifically we extracted 28 unpublished smoothing
coefficients from two working papers which have been excluded from the published version
8 If only means of firm-level smoothing coefficients are reported this also implies that precision measures for individual
estimates are not available
9 This led to the exclusion of 3 articles For more information on this list see httpsbeallslistweeblycom
15
Comparing the results of unpublished working papers to those of published articles allows to assess the
presence of publication bias caused by what is known as the file-drawer problem This phenomenon
arises if authors or editors prefer statistically significant results that support a particular theory
(Valickova et al 2015) However as most articles are working papers before being eventually
published it remains unclear whether recent working papers will remain unpublished gray literature or
if they are published in their current form (Hirsch 2018) Therefore similar to Hirsch (2018) we only
consider working papers that have been finalized more than five years ago (ie pre 2012) as ldquotruerdquo
unpublished working papers that potentially suffer from the file-drawer problem10
A more common option to test for publication bias is to analyze the relationship between reported
coefficients and their estimation precision We therefore excluded studies that fail to report a precision
measure for individual estimates such as standard errors p-values or t-values11 Moreover as will
become apparent below the availability of precision measures is crucial for the correct econometric
implementation of the MRA Some studies focus on the estimation of the speed of adjustment
coefficient ( λ ) according to eq (1) while others are interested in determining dividend smoothing
( d ) (eq (4) and (7)) We therefore converted all speed of adjustment coefficients to smoothing
coefficients according to λ1ˆ minus=d
10 As the literature provides little guidance on a specific time frame we also classify papers that have been finalized more
than three years ago as ldquotruerdquo unpublished papers as a robustness check Note that it can also be the case that articles are
not published due to quality issues with respect to method applied writing style etc If rational authors nevertheless
already adopt the strategy to produce ldquodesirablerdquo results in the earlier stages of research as they prepare for journal
publication including working papers in the MRA does not help to detect publication bias (Rusnak et al 2013)
11 Lintner (1956) is one example for a study that we had to exclude due to missing information on estimation precision
16
To control our sample for unreasonable observations eg caused by reporting errors in the underlying
studies we performed multivariate outlier screening using the lsquobaconrsquo algorithm proposed by Billor et
al (2000) which identifies outliers based on Mahalanobis distances (Weber 2010) The application of
the bacon algorithm led to the exclusion of 19 unreasonable observations12 This led to a final sample
of 99 studies and 979 dividend smoothing coefficients ( d ) the main coefficient of interest in our
empirical analysis 86 studies report several coefficients which are the result of estimations for
subsamples or estimations based on different econometric approaches13 It is important to note that our
final dataset comprises a diverse set of dividend smoothing estimates where each of the 979 identified
coefficients refers to a unique combination of underlying dataset model specification regional focus
or time period analyzed
Table A1 in the appendix provides a chronological overview of the final set of 99 studies on dividend
smoothing It can be observed that the literature search has identified a comprehensive dataset
including studies from 1957 to 2016 Moreover mean and median values of smoothing coefficients per
12 Eg two studies reported implausible standard errors In both cases for the same underlying sample of firms and only
slightly different model specifications significantly different standard errors for the smoothing coefficient that diverged
by a factor of gt1000 were reported
13 Examples are Persson (2013) who reports coefficients for different industry sectors or Foerster and Sapp (2006) who split
their sample into three different time frames However some reported results referring to subsamples within studies had
to be excluded from our analysis as they cannot be captured by the MRA due to the fact that they only appear once
Examples are Athari et al (2016) who report separate results related to a subsample of islamic banks Persson (2013)
who reports results for subsamples of firms with different market caps (small mid large) or Ameer (2007) who reports
results for subsamples related to high and low growth firms
17
study are reported in the right columns and provide a first indication that dividend smoothing varies
significantly across literature
32 DESCRIPTIVE STATISTICS
Table 1 summarizes the variables included in the MRA It can be observed that the mean smoothing
coefficient across included studies is 0562 indicating the presence of a mediocre and slightly lower
degree of dividend smoothing in comparison to Lintnerrsquos (1956) findings The included explanatory
variables have been selected based on two criteria (i) the MRA shall cover the development from the
classical Lintner model (equation 4) to more recent extensions and specifications as described in
section 2 and (ii) cover to the largest possible extend the study design characteristics used to generate
the dividend smoothing coefficients
Table 1 reveals that 112 of identified smoothing coefficients originate from working papers that are
at least five years old 470 of the coefficients relate to a mean year of the analyzed sample after
1998 The year 1998 has been selected as a threshold since a large number of countries included in our
dataset exhibits meaningful levels of stock repurchases as an additional payout channel from the end of
the 1990s onwards Baltagi (2008) shows that estimating partial adjustment models such as (4) and (7)
with OLS leads to upward biased smoothing coefficients Nevertheless only 147 of the 979
coefficients have been generated by applying the unbiased GMM estimator while the remainder has
either been estimated using OLS (553) the fixed effects (within) estimator (157) or by means of
other methods (143)14 As pointed out above the GMM estimator can be differentiated into the
difference- and system-approach with the system-estimator being superior when applied to panels with 14 Examples for other methods are Probit Tobit Logit or Random Effects estimations
18
a small time series dimension However as the majority of studies do not report which of the GMM
approaches has been used we do not further differentiate between GMM-in-systems and GMM-in-
differences in our MRA In addition as the underlying literature is based on relatively long panels with
an average time series dimension of 125 years there are likely no significant differences in the results
generated with the two approaches
As regards extensions of the classical Lintner model specified by (4) it can be observed that 420 of
reported coefficients are generated based on the classical version while the remainder of coefficients
has been estimated based on extensions that include further explanatory variables such as firm size
debt and ownership While firm size (139) debt (104) and ownership (166) represent the core
of additional explanatory variables 419 of the identified coefficients relate to estimations that
include other firm-specific explanatory variables such as liquidity or growth opportunities15 Due to the
heterogeneity of those variables across literature they can only be considered as a joint set of lsquootherrsquo
explanatory variables Another deviation from the original work of Lintner (1956) refers to the use of
cash-flows as earnings measure which applies to 113 of estimated smoothing coefficients Finally
Table 1 indicates that the literature on dividend smoothing has also focused on a wide set of countries
and industries As regards countries we have identified a general pattern of focus on the US (114)
the UK (83) other EU countries (174) and developing countries (344) while the remainder of
coefficients (277) relate to a set of other countries which due to its diversity has to be captured by
means of a single dummy variable16 To account for studies focusing on different industries we
15 See eg Leary and Michaely (2011) for an overview of potential firm-specific determinants of dividend smoothing
16 Countries which cannot be categorized into independent categories (eg Canada China or Russia) are assigned to the
group ldquoother countriesrdquo We refer to the definition of the World Bank to classify developing countries
19
distinguish between firms from the service and consumer goods sector (15) financial firms (150)
and manufacturing firms (61) while the remaining coefficients are not based on a specific industry
[Insert Table 1 about here]
4 Meta regression analysis
In section 41 we first provide a descriptive analysis of reported estimates that allows to derive
preliminary hints regarding the presence of publication bias by means of a funnel plot Moreover a
proxy for the rsquotruersquo smoothing value is derived Section 42 then describes the MRA framework used
whereas section 43 focuses on econometric issues that need to be considered Finally section 44
presents and discusses the MRA results
41 DESCRIPTIVE ANALYSIS OF THE lsquoTRUErsquo-EFFECT AND PUBLICATION BIAS
Before estimating MRA models we conduct a preliminary analysis of the dividend smoothing
coefficient and of publication bias Publication bias is the consequence of a favor for statistically
significant results by authors or journal editors Stanley (2005 2008) suggests that the degree of this
bias can be proxied by the correlation of estimates and their standard errors If publication bias is
present a significant correlation between estimated coefficients and their standard errors which leads
to statistical significance should prevail (Oczkowski and Doucouliagos 2014) To graphically illustrate
this relationship Stanley and Doucouliagos (2010) propose to plot estimated coefficients against their
precision where precision is measured by the inverse of coefficientsrsquo standard errors (Oczkowski and
Doucouliagos 2014 Zigraiova and Havranek 2016) If the underlying literature is not affected by
publication bias the estimated smoothing coefficients with high standard errors in the lower part of the
20
plot shall be characterized by high but symmetrical variation around a proxy for the lsquotruersquo dividend
smoothing coefficient while estimates with low standard errors in the upper part of the plot should be
characterized by low variation around the proxy for the lsquotruersquo value Thus without publication bias the
plot should take the form of a symmetric inverted funnel In turn skewness of the funnel indicates
favor for a specific direction of results and is therefore a hint for publication bias In order to construct
the funnel plot we follow Stanley (2005) and first derive a proxy for the lsquotruersquo smoothing coefficient by
averaging the top 10 of most precisely estimated smoothing coefficients leading to a value of 0728
We then plot estimated coefficients and their precision around this proxy for the lsquotruersquo value The
resulting funnel plot is shown in Figure 1 The funnel plot appears widely spread and indicates
skewness towards positive smoothing coefficients close to one as well as high speed of adjustment
coefficients (ie low dividend smoothing coefficient close to zero) This indicates bi-directional
publication bias towards high dividend smoothing and a high speed of adjustment (ie low smoothing)
To assess the degree of excess variation we follow Stanley (2005) and calculate the following statistic
for all j=1 hellip 979 coefficient estimates where corresponds to the
reported dividend smoothing estimates the corresponding standard errors and d represents the
true effect based on the top 10 of the most precisely estimated smoothing coefficients In case a
publication bias is absent one would expect that should exceed 196 for only 5 of coefficient
estimates Using this statistic we find that exceeds 196 in 604 of the cases indicating a strong
excess variation This casts doubt on the assumption of a single underlying lsquotruersquo effect and points
toward the presence of publication bias towards two directions Authors might favor positive and high
dividend smoothing coefficients ( close to one) as well as positive and low dividend smoothing
coefficients corresponding to a high speed of adjustment ( close to zero)
21
[Insert Figure 1 about here]
Funnel plots though assume a single lsquotruersquo effect for different regions sectors time periods or
estimation techniques Hence possible publication bias within country or industry subsamples of
reported smoothing coefficients cannot be detected with this method (Hirsch 2018 Doucouliagos et
al 2005 Stanley 2005 2008) In the following we therefore conduct MRA which provides a more
objective analysis than funnel plots17
42 META REGRESSION MODEL
While the funnel analysis performed in section 41 can provide first indications regarding the
smoothing effect and publication bias its main disadvantage lies in the assumption that only a single
lsquotruersquo effect exists
We therefore perform several MRA`s based on different estimation strategies Compared to funnel
graphs which can only reveal the degree of publication bias across the entire sample of smoothing
coefficients MRA enables to more precisely analyze possible publication bias by accounting for
different subgroups in the sample (eg defined by time countries or industries) It is likely that those
subgroups are affected by publication bias to varying degrees MRA also allows to account for
heterogeneity in reported coefficients driven by the underlying study design ie the applied
17 To further illustrate the distribution of dividend smoothing coefficients Figures A1 and A2 in the appendix show the
frequency distribution and the Kernel density In addition we also captured the distribution of dividend smoothing
coefficients based on median values of reported dividend smoothing coefficients and median precision per study
Figures A3-A5 in the appendix show the respective funnel plot frequency distribution as well as Kernel density based
on median values
22
econometric estimator or the inclusion of additional independent variables when estimating dividend
smoothing (Doucouliagos et al 2005 Stanley 2005 2008)
Following Stanley (2005 2008) we implement several specifications of the following model
jn
njnjj xdsed εβββ +++= sum)ˆ(ˆ10 (8)
where the dependent variable reflects the j=1hellip 979 identified dividend smoothing coefficients jd
The standard error of each coefficient ( )ˆ( jdse ) is included as independent variable together with a
vector sumn
njn xβ of those variables reported in Table 1 that relate to structural characteristics of the
underlying studies The respective coefficients ( nβ ) therefore capture the variance in reported
smoothing coefficients caused by those characteristics Finally jε is an iid error term
The inclusion of the standard error of estimated coefficients as an independent variable serves as a
basis for testing for publication bias If publication bias prevails across the analyzed literature a
significant correlation between estimated coefficients and their standard errors should prevail
(Oczkowski and Doucouliagos 2014) Thus authors will likely prefer those results where the quotient
of the estimated coefficient and its standard error is equal or larger than two implying significance at
the 5-level or lower In contrast if publication bias is not present estimated coefficients are distributed
randomly around the lsquotruersquo value and there should be no significant correlation with standard errors
Testing 0ˆ 10 =βH can therefore be considered as a test for publication bias
23
As indicated by the funnel plot in Figure 1 the research on dividend smoothing might be biased
towards findings of high smoothing or a high speed of adjustment In this case we expect a different
impact of over the domain of high dividend smoothing and low dividend smoothing coefficients
(high speed of adjustment) Whereas authors focusing on dividend smoothing might prefer high
dividend smoothing coefficients authors with a focus on speed of adjustment might prefer lower
dividend smoothing coefficients Hence to test for bi-directional publication bias we use 05 as cutoff
for coefficient estimates of indicating a focus on high dividend smoothing parameter ( or
high speed of adjustment parameters ( This yields the following specification (eg Bom and
Ligthart 2009)
(9)
where
le
=otherwise
difD j
050ˆ1
1 and
gt
=otherwise
difD j
050ˆ1
2
Based on this specification 0ˆ 20 =βH is a test towards a publication bias in favor of low dividend
smoothing coefficients (ie high speed of adjustment) 0ˆ 30 =βH in turn serves as our test for a
publication bias towards high dividend smoothing coefficients
Stanley and Doucouliagos (2012) suggest to also consider specifications where the standard error is
introduced non-linearly Non-linearity allows for a more flexible relationship between coefficients and
standard errors over the domain of standard errors where publication bias will be less severe for
24
estimates with low standard errors We therefore also consider a specification of (9) where the standard
error is introduced in a quadratic way
(10)
where
le
=otherwise
difD j
050ˆ1
1 and
gt
=otherwise
difD j
050ˆ1
2
Finally in each specification the intercept 0β reflects the mean value of dividend smoothing corrected
for publication bias given that the impact of all study design characteristics included in is set to zero
The presence of a dividend smoothing effect can hence be tested by 0ˆ 01 =βH and rejecting this
hypothesis points towards the existence of an effect According to Stanley (2005 2008) the test of a
non-significant MRA intercept is also known as precision effect test (PET)
43 ECONOMETRIC IMPLEMENTATION
Various econometric approaches are necessary to account for problems caused by the fact that the
dependent variable of (8) to (10) is composed of estimated regression coefficients )ˆ( jd (Stanley et al
2013) These regression coefficients are derived by means of separate empirical studies implying
heterogeneous variances that potentially cause heteroscedasticity in the error terms of (8) to (10)
(Nelson and Kennedy 2009) We therefore use weighted least squares (WLS) for the estimation of (8)
to (10) As Stanley (2005) and Oczkowski and Doucouliagos (2014) point out 2)ˆ(1 jdse can serve as
25
an adequate weight as it captures the heterogeneous variances of the coefficients and thus generates
heteroscedasticity corrected standard errors18
Another econometric issue arises from the fact that most of the studies included in our MRA (86)
provide more than one estimate This implies that the meta-data is composed of clusters of estimates
with similar error structures Nelson and Kennedy (2009) point out that such within-cluster error
correlation leads to biases in the standard errors of (8) to (10) To correct for within study-cluster
correlation we follow Oczkowski and Doucouliagos (2014) and employ several techniques to derive
unbiased standard errors In particular we first estimate (8) to (10) using WLS with heteroscedasticity
robust standard errors as our base model We then correct for within-study error correlation by
estimating WLS models with study-cluster robust and bootstrapped clustered standard errors More
specifically we use the wild bootstrap method which is particularly suited when study clusters are of
significantly different sizes (Cameron et al 2008 MacKinnon and Webb 2017) Moreover as Table
A1 indicates clusters in our sample are of significantly different sizes According to MacKinnon and
Webb (2017) the wild bootstrap may yield reliable inferences in this case
Although panel estimators such as fixed and random effects are suitable to capture the clustered (ie
panel) structure of our data it is known that WLS with study-cluster robust standard errors is the more
reasonable approach to estimate MRA models (Hirsch 2018) Stanley and Doucouliagos (2013 2015)
demonstrate that WLS outperforms the random- and fixed effects estimator especially when the meta-
data is affected by publication bias Moreover the fixed and random effects estimators are based on a
set of adverse characteristics (Baltagi 2008) First coefficient clusters in our sample are of 18 Note that the sample size can also serve as an indicator for estimation precision of coefficients as it is proportional to the
inverse of the standard error (Stanley 2005)
26
considerably different sizes with a large number of clusters that contain a single observation only19
Nelson and Kennedy (2009) point out that employing the fixed effects estimator to such panels is
disadvantageous as studies with a single observation will be eliminated from the estimation procedure
Second application of the fixed effects estimator leads to inefficient estimates of (8) to (10) as study-
specific fixed effects significantly decrease the degrees of freedom (Baltagi 2008 Nelson and
Kennedy 2009) Third to generate unbiased coefficients of (8) to (10) the random effects estimator
requires zero correlation between the random effect and the explanatory variables (ie the standard
errors as well as the variables in ) (Baltagi 2008 Stanley and Doucouliagos 2013 2015) Due to
these disadvantages and the predominance of WLS in MRA models we consider the WLS estimations
with study-cluster robust standard errors of (8) (9) and (10) as our main results while results with
wild-bootstrapped standard errors shall serve as robustness checks
44 META REGRESSION RESULTS
To get an initial impression of publication bias we follow the procedure used in prior MRAs (Card and
Krueger 1995 Hirsch 2018 Stanley and Doucouliagos 2012) and first estimate equations (8) to (10)
without including the set of explanatory variables x The results are reported in Table 2 In the
interpretation we focus on the WLS estimations of (8) to (10) with study-cluster robust standard errors
as our main results (columns 4-6) The constant of each model indicates mean dividend smoothing
19 We observe 13 studies that report just one coefficient The maximum number of coefficients that a single study reports
amounts to 57 The average number of coefficients reported in the included studies is 989 A standard deviation of
1104 shows that the coefficient clusters in our sample are of considerably different size
27
corrected for publication bias Columns 4-6 reveal that this value is between 0707 and 0755 and thus
close to the average of the 10 most precise measures derived as the proxy for lsquotruersquo smoothing above
(0728) The test for a significant impact of the constant ie the PET test (Stanley 2005 2008) indicates
for all specifications the presence of a significant smoothing effect
[Insert Table 2 about here]
As rejecting 0ˆ10 == βH points towards skewness of the funnel plot (Figure 1) this test is also known
as the funnel asymmetry test (FAT) (Stanley 2005 2008) The models that account for the standard
error as independent variable in a linear way confirm the initial tendency of a publication bias revealed
by the funnel plot The results reveal a negative and significant relationship with the exception of an
insignificant (and still) negative effect when wild-bootstrapped standard errors are used The negative
sign indicates that there might be either a tendency towards reporting low dividend smoothing
coefficients (high speed of adjustment coefficients) However as indicated above the funnel plot points
to the existence of bi-directional publication bias We address this issue through equations (9) and (10)
by considering different impacts of the standard error depending on the magnitude of the estimated
dividend smoothing coefficient The results are in favor of publication biases towards high and low
dividend smoothing effects respectively We find a significant and negative impact of the (squared)
standard error for dividend smoothing coefficients smaller or equal to 05 which is higher in magnitude
than the positive impact of the standard error for dividend smoothing coefficients larger than 05 In
addition the coefficient of the standard error for high dividend smoothing coefficients is significant in
two out of six specifications whereas the coefficient for low dividend smoothing coefficients is
negatively significant in five out of six specifications
28
[Insert Table 3 about here]
As already noted a possible publication bias within subsamples related to countries industries or other
study design characteristics can only be detected by controlling for these factors in a multivariate
MRA Table 3 reports the results of various specifications of the multivariate regression models (8) to
(10) Panel A contains the results based on equation (8) Panel B refers to the results based on equations
(9) and (10) (standard error interacted with dummies for low and high dividend smoothing
coefficients) The base category (captured in the constant) refers to the degree of dividend smoothing
generated by OLS estimations of the classical Lintner model corrected for publication bias and using
pre-1998 data Note that the regression coefficients are to be interpreted accordingly ie a specific
coefficient indicates how the related characteristic addssubtracts dividend smoothing with respect to
this base group In line with the univariate results the results show a negative impact when we account
for the standard error in a linear manner (equation (8)) However the coefficient for the standard error
is not significant when we focus on the WLS estimations of (8)) with study-cluster robust standard
errors as our main results Compared to our univariate analysis we find even stronger support for a bi-
directional publication bias All coefficients for the standard error are statistically significant and have
the expected sign Thus when study design characteristics are considered our results corroborate the
finding towards the presence of publication bias in favor of statistically significant smoothing
coefficients as well as speed of adjustment coefficients (ie low smoothing coefficients)20
Surprisingly the working paper dummy is found to be statistically significant and positive which
20 In unreported robustness checks we use the mean and median of all 979 dividend smoothing coefficients as different
cutoffs to distinguish between studies focusing on high and low dividend smoothing (speed of adjustment) The results
are robust to this specification Results of all robustness checks are available upon request
29
indicates that working papers reports significantly higher dividend smoothing coefficients Rusnak et
al (2013) argue that working papers already take into account the publication process and therefore do
not differ much from published papers with respect to a tendency of reporting significant coefficient
estimates This implies that working papers which are older than 5 years report significantly higher
dividend smoothing coefficients and likely do not suffer from the file drawer problem21
Moreover the multivariate MRA reveals several important findings with respect to the study design
factors affecting the heterogeneity in reported dividend smoothing coefficients As the base category
we use the classical Lintner model (equation 4) estimated using OLS and pre-1998 US data published
in an academic journal The constants of our main results ndashWLS with cluster robust standard errors
reported in column 2 in Panel A and columns 3-4 in Panel Bndash reveal a significant degree of dividend
smoothing for the base category ranging from 0657 to 0678 This degree is in line with Lintner (1956)
who finds a very similar smoothing coefficient of 23 for the US
Several studies (eg Choe 1990 Brav et al 2005 Andres et al 2015) find evidence that the degree of
dividend smoothing has increased in recent years possibly due to the emergence of stock repurchases as
an additional method to disburse temporary earnings If anything our results indicate a slight evidence
for lower dividend smoothing in more recent years (the respective coefficient of the variable capturing
whether the mean sample period is gt1998 is statistically significant in three cases and always
negative)22 We also find no evidence that the length of the analyzed time series impacts the degree of
dividend smoothing (the coefficient has the expected negative sign but is only significant in two 21 The results are robust to an alternative time frame of three years
22 As a robustness check we classify studies as rdquopost-1998ldquo if their sample period begins in 1999 or later The results are
robust to this alternative specification
30
regression models and insignificant in our main regression models with cluster robust standard errors)
In contrast extensions of the classical Lintner model controlling for ownership find significantly higher
dividend smoothing This lends to support of agency conflicts as a primary driver of dividend
smoothing (Leary and Michaely 2011) Agency models as presented by Jensen (1986) and Easterbrook
(1984) underline the importance of dividend smoothing as a disciplining device for managers to raise
external finance from capital markets Our results underline the importance of ownership as moderator
for agency conflicts between managers and shareholders and determinant of dividend smoothing
Whether studies control for size debt or other firm characteristics does not have a significant impact
on resulting dividend smoothing coefficients Moreover we find evidence that modifications of the
classical Lintner model using cash flow instead of earnings measures detect significantly higher
smoothing effects Based on these results firms adjust dividends faster to changes in earnings than to
changes in cash-flows
Our results provide evidence that the use of the econometric technique has a significant impact on
estimated dividend smoothing coefficients We find that the GMM estimator reduces the upward bias
in dividend smoothing that emerges if (8) to (10) are estimated using OLS Similarly using fixed
effects (within) estimation leads to significant lower smoothing coefficients compared to the base
category OLS Note that applying fixed effects estimation to autoregressive processes such as (8) to
(10) leads to a downward biased estimate of dividend smoothing23
23 As the category lsquoother estimatorsrsquo comprises multiple different estimation techniques such as probit logit or random
effects as a robustness check we have excluded all observations related to this category Even after excluding these
observations we do not find significant differences in reported dividend smoothing coefficients across estimation
techniques
31
The presence of dividend smoothing is particularly well documented for firms in the US Several
studies suggest that dividend smoothing is higher in the US than in other countries For instance
Andres et al (2009) document a more flexible dividend payout for German firms whereas Chemmanur
et al (2010) and Dewenter and Warther (1998) document lower dividend smoothing for firms in Hong
Kong and Japan In contrast to this our results do not suggest significant differences in smoothing
effects across different countries In a robustness check we follow a broader classification of countries
by La Porta et al (1998 2000) La Porta et al (1998 2000) relate investor protection financing
conditions and payout policy to the legal origin of countries and distinguish between common law and
civil law counties Using this classification we find lower dividend smoothing for Scandinavian civil
law countries relative to German civil law French civil law and common law countries However we
do not find systematic differences in dividend smoothing between common and civil law countries or
within common law countries such as the UK and the US Overall our results lend support to dividend
smoothing as a global rather than country-specific phenomenon
Finally the results do not reveal that studies with a focus on firms that operate in the service and
consumer goods sector generate significantly different dividend smoothing coefficients while
significant higher dividend smoothing effects can be detected for firms operating in the financial
sector24 Variance Inflation Factors indicate that multicollinearity among the set of explanatory
variables (x) is not present Model diagnostics reveal the overall significance of our specifications and
24 As firms from the financial sector are subject to different regulatory requirements we consider only those studies that
explicitly exclude firms from the financial sector in a robustness check Based on the remaining 29 studies with 397
observations we do not find significant differences in the drivers dividend smoothing coefficients relative to the whole
sample
32
adjusted R2 values amount to 478 up to 608 The fact that R2 is significantly higher for the
specifications that consider bi-directional publication bias ((9) and (10)) compared to equation (8)
reveals the superiority of the former specifications
As our study design controls for many different factors that may have an impact on the reported
dividend smoothing parameter and theory provides us with little guidance on the factors that should be
included in a meta-regression analysis we also investigate the main drivers of the dividend smoothing
parameters by Bayesian model averaging (BMA) (Raftery et al 1997) BMA provides averages for
posterior mean values and standard errors after running all combinations of a predefined set of
explanatory variables (in our case 220 combinations) We follow the procedure in Zigraiova and
Havranek (2016) and run a reduced model using all variables with a posterior inclusion probability
larger than 05 identified by BMA as explanatory variables The results reported in Table A2 of the
appendix corroborate our earlier findings and identify the choice of the earnings measure the
econometric technique used as well as the publication status as the main drivers of the heterogeneity of
reported dividend smoothing coefficients
Finally to assess the robustness of the results with respect to the weighting strategy used and the
handling of extreme values we estimated several further model specifications First we followed
Zigraiova and Havranek (2016) and present results from specifications weighted by the inverse of the
number of estimates reported per study This gives the same importance to each study in the estimation
by mitigating the effect of articles contributing a large number of coefficients Second for the whole
sample (without exclusion of unreasonable values using the bacon algorithm) we estimate robust 05-
quantile (median) regressions The results are reported in Tables A3 and A4 and undermine our main
findings regarding the direction of publication bias and the importance of the econometric estimator
33
applied There are some differences that are mainly related to the variables capturing the analyzed
country or industry for which the robustness checks tend to produce a higher number of significant
results However these variables have not been identified as explanatory variables with a high PIP in
the BMA and thus do not alter our conclusions regarding the main drivers of reported dividend
smoothing coefficients
5 Conclusion
Our MRA sheds light on the reasons for heterogeneous results reported in the empirical literature on
dividend smoothing using a large set of 99 empirical studies and 979 dividend smoothing coefficients
that relate to different time periods countries industries and econometric methods The MRA reveals
that the variability in reported smoothing coefficients is driven by publication bias towards high
dividend smoothing or high speed of adjustment coefficients We find that peer-reviewed publications
based on an OLS estimation of the classical Lintner model corrected for publication bias and using
pre-1998 US data report on average a significant degree of dividend smoothing ranging from 0657 to
0678
Analyzing post-1998 data does not reveal higher dividend smoothing in more recent years This is in
line with the findings of Leary and Michaely (2011) for the US who find that stock repurchases as an
additional payout channel in recent years cannot explain the heterogeneity in reported dividend
smoothing coefficients However we detect a large number of other factors that explain the variability
in dividend smoothing coefficients Our results suggest that accounting for ownership structure among
the set of control variables is important when explaining different degrees of dividend smoothing We
find that the inclusion of ownership characteristics significantly increases estimated smoothing
34
coefficients Moreover we find significant differences in results across the estimation techniques used
Studies using GMM estimation techniques or fixed effects estimators find a considerably lower degree
of dividend smoothing (-0219 and -0205) compared to studies employing OLS estimators Differences
in dividend smoothing do not seem to be driven by the country
Overall the results of our MRA provide a summarizing picture of the large amount of literature on
dividend smoothing and allow to derive average smoothing effects for different regions sectors time
periods or estimation techniques Under the assumption that lsquobest practicersquo in dividend smoothing
estimation requires the inclusion of all relevant firm specific control variables and the GMM estimation
technique our MRA predicts (using earnings as profit measure) average smoothing effects of 0536 for
firms that do not operate in the financial sector
The MRA results provide important insights for future research on this topic Dividend smoothing
estimates differ significantly depending on the inclusion of ownership as a driver of estimated dividend
smoothing effects Researchers should therefore consider the inclusion of ownership characteristics
when estimating dividend smoothing In case ownership characteristics are not available due to data
limitations researchers should discuss the consequences of the corresponding omitted variable bias
Our results provide support for significant differences in reported dividend smoothing effects for
different estimation techniques As the upward (downward) bias of the OLS (fixed effects) estimator is
well-known for AR(1)-type regressions in future studies researchers should carefully consider the
choice of the estimation technique In line with previous literature future research should interpret
results under careful consideration of the specifics of the analyzed industries Based on our analysis it
is of particular relevance whether the study focuses on non-financial firms only
35
Previous studies consider dividend smoothing as a general phenomenon that has increased in recent
years In contrast to this prevailing opinion our MRA does not provide evidence for a general recent
trend of higher dividend smoothing Thus analyzing the development of dividend smoothing over time
and under consideration of different country settings might be a fruitful area for future research (Farre-
Mensa et al 2014) In general future research should consider the fact that study design characteristics
can have an important impact on dividend smoothing effects and the results should hence be interpreted
accordingly
Our results are also important from an investor perspective Whereas Leary and Michaely (2011) find
evidence that dividend smoothing is used to cope with free-cash flow problems dividend smoothing
might be an agency problem in itself (Lambrecht and Myers 2012) Depending on the two different
views our results based on dividend smoothing allow investors to assess the severity of agency
conflicts that they can expect depending on the industry they would like to invest in Thus investors
should take into account that study design characteristics have an important impact on the resulting
dividend smoothing effects and should build their expectation regarding returns accordingly
36
References
Abdullah NMH Ahmad Z Roslan S (2012) The Influence of Ownership Structure on the Firms
Dividend Policy Based Lintner Model International Review of Business Research Papers 8(6) 71-88
Adelegan O (2003) An Empirical Analysis of the Relationship between Cash Flow and Dividend
Changes in Nigeria RampD Management 15(1) 35-49 Ahmed H Javid AY (2008) Dynamics and determinants of dividend policy in Pakistan (evidence
from Karachi stock exchange non-financial listed firms) MPRA Paper No 37342 Ahmed H Javid AY (2009) Dynamics and Determinants of Dividend Policy in Pakistan (Evidence
from Karachi Stock Exchange Non-Financial Listed Firms) International Research Journal of Finance and Economics 25(3) 148-171
Aivazian VA Booth L Cleary S (2006) Dividend Smoothing and Debt Ratings Journal of
Financial and Quantitative Analysis 41(2) 439-453 Al-Ajmi J (2010) Modelling the dividend policy of banks in Gulf Cooperation Council countries
Applied Economics Letters 17(14) 1423-1428 Al-attar AM Al-Shattarat HK Yusuf AN (2015) The effects of contextual factors on
disaggregated earnings in explaining dividend changes in Jordanian firms International Journal of Commerce and Management 25(2) 218-239
Allen F Bernardo A Welch I (2000) A theory of dividends based on tax clientele Journal of
Finance 55(6) 2499-2536 Al-Malkawi H-A Bhatt M I Magableh S (2014) On the dividend smoothing signaling and the
global financial crisis Economic Modelling 42 159-165 Al-Najjar B (2009) Dividend behaviour and smoothing new evidence from Jordanian panel data
Studies in Economics and Finance 26(3) 182-197 Al-Najjar B Belghitar Y (2012) The information content of cash flows Economic Issues 17(2) 57-
70 Al-Yahyaee KH Pham TM Walter TS (2010) Dividend stability in a unique environment
Managerial Finance 36(10) 903-916 Al-Yahyaee KH Pham TM Walter TS (2011) Dividend smoothing when firms distribute most
of their earnings as dividends Applied Financial Economics 21(16) 1175-1183
37
Alzahrani M Lasfer M (2009) The Impact of Taxation on Dividends A Cross-Country Analysis
Working paper King Fahd University of Petroleum amp Minerals Dhahran Ameer R (2007) Dividend Payout of the Property Firms in Malaysia Pacific Rim Property Research
Journal 13(4) 451-472 Ameer R (2008) Product market competition regulation and dividend payout policy of Malaysian
Banks Journal of Financial Regulation and Compliance 16(4) 318-334 Andres C Betzer A Goergen M Renneboog L (2009) Dividend policy of German firms A panel
data analysis of partial adjustment models Journal of Empirical Finance 16(2) 175-187 Andres C Betzer A van den Bongard I Goergen M (2014) Dividend Policy Corporate Control
and the Tax Status of the Controlling Shareholder Working paper Schumpeter School of Business and Economics Bergische Universitaumlt Wuppertal
Andres C Doumet M Fernau E Theissen E (2015) The Lintner model revisited Dividends
versus total payouts Journal of Banking and Finance 55 56-69 Arellano M Bond S (1991) Some tests of specification for panel data Monte Carlo evidence and an
application to employment equations Review of Economic Studies 58 (2) 277-297 Arellano M Bover O (1995) Another look at the instrumental variable estimation of error-
components models Journal of Econometrics 68 29ndash51 Arko AC Abor J Adjasi CKD Amidu M (2014) What influence dividend decisions of firms in
Sub-Saharan African Journal of Accounting in Emerging Economies 4(1) 57-78 Athari SA Adaoglu C Bektas E (2016) Investor protection and dividend policy The case of
Islamic and conventional banks Emerging Markets Review 27 100-117 Baba N Ueno Y (2008) Are stock repurchases more flexible than dividends The case of Japanese
firms Applied Financial Economics Letters 4(5) 315-318 Baiyao Z (2011) Dividend Policy in Mainland China and USA Bachelor thesis Hong Kong Baptist
University Baker HK Chang B Dutta S Saadi S (2013) Canadian corporate payout policy International
Journal of Managerial Finance 9(3) 164-184 Bakucs Z Falkowski J Fertouml I (2014) Does Market Structure Influence Price Transmission in the
Agro-food Sector A Meta-analysis Perspective Journal of Agricultural Economics 65(1) 1-25
38
Baltagi BH (2008) Econometric Analysis of Panel Data Chichester UK John Wiley amp Sons Bawa KS Kaur P (2012) Empirical validity of Dividend Policy Models in The Indian
Manufacturing MSMEs International Journal of Multidisciplinary Management Studies 2(1) 18-39 Banks S Cheffins B Goergen M (2009) Dividends and politics European Journal of Political
Economy 25(2) 208-224 Behm U Zimmermann H (1993) The empirical relationship between dividends and earnings in
Germany Zeitschrift fuumlr Wirtschafts- und Sozialwissenschaften 113(2) 225-254 Benavides J Berggrun L Perafan H (2016) Dividend payout policies Evidence from Latin
America Finance Research Letters 17 197-210 Benhamouda Z (2007) UK corporate share repurchases an empirical analysis of corporate motives
and payout policies Durham theses Durham University Available at Durham E-Theses Online httpethesesduracuk2137
Benzinho J (2004) The dividend policy of the Portuguese corporations Evidence from Euronext
Lisbon Working paper ISCAC Coimbra Business School Bhattarchya S (1979) Imperfect Information Dividend Policy and The Bird in the Hand Fallacy
The Bell Journal of Economics 10(1) 259-270 Billor N Hadi AS Velleman PF (2000) BACON blocked adaptive computationally efficient
outlier nominators Computational Statistics amp Data Analysis 34 279-298 Blundell R Bond S (1998) Initial conditions and moment restrictionsin dynamic panel data models
Journal of Econometrics 87 115-143 Bodla BS Pal K Sura JS (2007) Examining Application of Lintners Dividend Model in Indian
Banking Industry ICFAI Journal of Bank Management 6(4) 40-59 Bom PRD Ligthart JE (2009) How productive is public capital A meta-regression analysis
Working Paper 09-12 International Studies Program Georgia State University Boţoc C Pirtea M (2014) Dividend Payout-Policy Drivers Evidence from Emerging Countries
Emerging Markets Finance and Trade 50(4) 95-112 Brav A Graham JR Harvey CR Michaely R (2005) Payout policy in the 21st century Journal
of Financial Economics 77(3) 483-527 Bremberger F Cambini C Gugler K Rondi L (2016) Dividend Policy in Regulated Network
Industries Evidence from the EU Economic Inquiry 54(1) 408ndash432
39
Brittain JA (1964) The Tax Structure and Corporate Dividend Policy American Economic Review
54(3) 272-287 Cameron AC Gelbach JB Miller DL (2008) Bootstrap-based Improvements for Inference with
Clustered Errors Review of Economics and Statistics 90(3) 414-427 Card D Krueger AB (1995) Time-Series Minimum-Wage Studies A Meta-Analysis American
Economic Review 85(2) 238-243 Card D Kluve J Weber A (2010) Active Labour Market Policy Evaluations A Meta- Analysis
Economic Journal 120 (548) 452-477 Chan KF Powell JG Shi J Smith T (2016) Dividend persistence and dividend behavior
Accounting and Finance doi 101111acfi12208 Chemmanur TJ He J Hu G Liu YH (2010) Is dividend smoothing universal New insights
from a comparative study of dividend policies in Hong Kong and the US Journal of Corporate Finance 16(4) 413-430
Chen X Sinha A K (2016) Large Shareholders and Dividends Game Theoretic Analysis of
Shareholder Power Working paper California State University Bradley University Choe H (1990) Intertemporal and Cross-sectional Variation of Corporate Dividend Policy PhD
Dissertation University of Chicago Correia da Silva L Goergen M Renneboog L Dividend policy of German firms A dynamic panel
data analysis of partial adjustment models Working paper Cardiff University Oxford Economic Research Associates Tilburg University
Dai Q (2007) Influence of a Tax Reform on Dividend Clienteles Working paper Binghamton
University Darling PG (1957) The Influence of Expectations and Liquidity on Dividend Policy Journal of
Political Economy 65(3) 209-224 DeAngelo H De Angelo L Skinner D (2004) Are dividends disappearing Dividend concentration
and the consolidation of earnings Journal of Financial Economics 72(3) 425-456 DeAngelo H De Angelo L Skinner D (2008) Corporate Payout Policy Foundations and Trends in
Finance 3(2-3) 95-287
40
DeAngelo H DeAngelo L (2000) Controlling stockholders and the disciplinary role of corporate payout policy - a study of the Times Mirror company Journal of Financial Economics 56(2) 153-207
Demena BA van Bergeijk PAG (2017) A Meta-Analysis of FDI and Productivity Spillovers in
Developing Countries Journal of Economic Surveys 31(2) 546-571 DerSimonian R Laird N (1986) Meta-analysis in clinical trials Controlled Clinical Trials 7(3) 177-
188 Desai MA Foley CF Hines Jr JR (2001) Repatriation Taxes and Dividend Distortions National
Tax Journal 54(4) 829-851 Dewenter KL Warther VA (1998) Dividends Asymmetric Information and Agency Conflicts
Evidence from a Comparison of the Dividend Policies of Japanese and US Firms Journal of Finance 53(3) 879ndash904
Dharan BG (1988) The Association between Corporate Dividends and Current Cost Disclosure
Journal of Business Finance amp Accounting 15(2) 215-230 Doucouliagos H Laroche P Stanley TD (2005) Publication Bias in Union-Productivity Research
Relations industrielles Industrial Relations 60(2) 320-347 Easterbrook FH (1984) Two Agency-Cost Explanations of Dividends American Economic Review
74(4) 650-659 Esteban JMD Peacuterez OLdF (2001) Dividend Policy of European Banks Working paper
Universidad de Burgos Fama EF (1974) The Empirical Relationships between the Dividend and Investment Decisions of
Firms American Economic Review 64(3) 304-318 Fama EF Babiak H (1968) Dividend Policy An Empirical Analysis Journal of the American
Statistical Association 63(324) 1132-1161 Farre-Mensa J Michaely R Schmalz M (2014) Payout Policy Annual Review of Financial
Economics 6 75-134 Feld LP Heckemeyer JH Overesch M (2013) Capital structure choice and company taxation A
meta-study Journal of Banking amp Finance 37(8) 2850ndash2866 Feldstein MS (1970) Corporate Taxation and Dividend Behaviour Review of Economic Studies
37(1) 57-72
41
Foerster SR Sapp SG (2006) The changing role of dividends a firm-level study from the nineteenth to the twenty-first Century Canadian Journal of Economics 39(4) 1316-1344
Garrett I Priestley R (2000) Dividend Behavior and Dividend Signaling Journal of Financial and
Quantitative Analysis 35(2) 173-189 Goncharov I Triest S v (2011) Do fair value adjustments influence dividend policy Accounting
and Business Research 41(1) 51-68 Grullon G Michaely R (2002) Dividends Share Repurchases and the Substitution Hypothesis
Journal of Finance 57(4) 1649-1684 Gugler K (2003) Corporate governance dividend payout policy and the interrelation between
dividends RampD and capital investment Journal of Banking and Finance 27 1297-1321 Gugler K Yurtoglu BB (2003) Corporate governance and dividend payout policy in Germany
European Economic Review 47(4) 731-758 Gunathilaka C (2014) What Drives the Payout Policy Evidence from Sri Lanka A Dynamic Panel
Data Analysis Wayamba Journal of Management 3(2) 1-16 Haddad AE Al Shattarat WK Al-Hamadeen RM (2008) Partial-Adjustment-Models of Dividend
Policy Behaviour for Industrial Jordanian Firms Corporate Ownership amp Control 5(4) 356-372 Haleem F Javid AY (2011) Modeling Dividend Behavior in Pakistan Information Management
and Business Review 3(6) 289-301 Hayunga DK Stephens CP (2009) Dividend behaviour of US equity REITs Journal of Property
26(2) 105-123 Hines Jr JR Desai MH Foley CF (2007) Dividend Policy Inside the Multinational Firm
Financial Management 36(1) 5-26 Hines JR Jr (1996) Dividends and Profits - Some Unsubtle Foreign Influences Journal of Finance
51(2) 661-689 Hirsch S (2018) Successful in the long run A meta-regression analysis of persistent firm profits
Journal of Economic Surveys 32(1) 23-49 Hsiao C (1986) Analysis of Panel Data Cambridge University Press Cambridge Hussain J (2011) Corporate dividends decisions evidence from Saudi Arabia Journal of Risk
Finance 12(1) 41-56
42
Hutagalung S Yahya MH Kamarudin F Osman Z (2013) The Dividend Payout Policy ndash A Study on Malaysian Financial Institutions Pertanika J Soc Sci amp Hum 21(S) 127-148
Jagannathan M Stephens CP Weisbach M (2000) Financial flexibility and the choice between
dividends and stock repurchases Journal of Financial Economics 57(3) 355-384 Jarrell SB Stanley TD (1990) A Meta-Analysis of the Union-Nonunion Wage Gap Industrial amp
Labor Relations Review 44 54-67 Jensen MC (1986) Agency Costs of Free Cash Flow Corporate Finance and Takeovers American
Economic Review 76(2) 323-329 Kamat MS Kamat MM (2012) An Application of Partial Adjustment Equation in Determining
Payout Behavior using an Extended Instrumental Variable Approach Working paper VVMs Shree Damodar College Goa University
Kamat MS Kamat MM (2013) Economic reforms determinants and stability of dividends in a
dynamic setting Journal of Asia Business Studies 7(1) 5-30 Kanoja S Bhatia BS (2013) Dividend Decisions and Payout Policy An Empirical Analysis of
Listed Indian Companies Working paper University of Delhi Karathanassis GA Chrysanthopoulou ECh (2005) The relationship Between Ownership Structure
and Corporate Dividend Policy ndash Evidence from the Athens Stock Exchange Working paper Athens University of Economics and Business
Khan T (2006) Company Dividends and Ownership Structure Evidence from UK Panel Data The Economic Journal 116(510) C172-C189 Kim J Jeon Y (2015) Dividend Policy and Corporate Social Responsibility A Comparative
Analysis of Multinational Enterprise Subsidiaries and Domestic Firms in Korea Emerging Markets Finance and Trade 51(2) 306-319
Kinfe T (2011) Determinants of Dividend payout An Empirical Study on Bank Industry in Ethiopia
Master thesis Addis Ababa University School of Business and Public Administration Department of Accounting and Finance School of Graduate Studies
Korkeamaki T Liljeblom E Pasternack D (2010) Tax reform and payout policy Do shareholder
clienteles or payout policy adjust Journal of Corporate Finance 16(4) 572-587 Kumar J (2003) Ownership Structure and Dividend Payout Policy in India Working paper Indira
Gandhi Institute of Development Research
43
Kumar R Kumar Jha P (2012) Determinants of Corporate Dividend Policy in India - A Study of Listed IT Companies at BSE Working paper Faculty of Management Studies BHU
La Porta R Lopez-de-Silanes F Shleifer A Vishny RW (1998) Law and Finance Journal of
Political Economy 106(6) 1133-1155 La Porta R Lopez-de-Silanes F Shleifer A Vishny RW (2000) Agency Problems and Dividend
Policies around the World Journal of Finance 55(1) 1-33 Lambrecht BM Myers S C (2012) A Lintner model of payouts and managerial rents Journal of
Finance 67(5) 1761ndash1810 Leary MT Michaely R (2011) Determinants of Dividend Smoothing Empirical Evidence Review
of Financial Studies 24(10) 3197-3249 Lintner J (1956) Distribution of incomes of corporations among dividends retained earnings and
taxes American Economic Review 46(2) 97-113 Longhi S Nijkamp P Poot J (2005) A Meta-Analysis Assessment of the Effect of Immigartion on
Wages Journal of Economic Surveys 19(3) 451-477 Manconi A Peyer U Vermaelen T (2017) Are Buybacks Good for Long-Term Shareholder Value
Evidence from Buybacks around the World European Corporate Governance Institute (ECGI) - Finance Working Paper No 4362014 INSEAD Working Paper No 2013101FIN
McDonald JG Jacquillat B Nussenbaum M (1975) Dividend Investment and Financing
Decisions Empirical Evidence on French Firms Journal of Financial and Quantitative Analysis 10(5) 741-755
McDonald R Soderstrom N (1986) Dividend and Share Changes Is There a Financing Hierarchy
NBER working paper series Working Paper No 2029 MacKinnon JG Webb MD (2017) Wild Bootstrap Inference for Wildly Different Cluster Sizes
Journal of Applied Econometrics 32(2) 233-254 Michaely R Roberts MR (2012) Corporate Dividend Policies Lessons from Private Firms Review
of Financial Studies 25(3) 711-746 Miller MH Rock K (1985) Dividend Policy under Asymmetric Information Journal of Finance
40(4) 1031-1051 Miller M Scholes M (1978) Dividends and Taxes Journal of Financial Economics 6(4) 333-364
44
Modigliani F Miller M (1958) The Cost of Capital Corporation Finance and the Theory of Investment American Economic Review 48(3) 261ndash297
Mohsin HM Ashraf MS (2011) Monetary policy restriction and dividend behavior of Pakistani
firms an empirical analysis MPRA Paper No 34052 Mollah Sabur A (2009) Testing Partial Adjustment Dividend Behavioral Models in Emerging
Markets Evidence from Pre and Post Market Reforms in Bangladesh Global Journal of Business Research 3(1) 1-14
Mookerjee R (1992) An empirical investigation of corporate dividend pay-out behaviour in an
emerging market Applied Financial Economics 2(4) 243-246 Mueller DC (1967) The Firm Decision Process An Econometric Investigation The Quarterly
Journal of Economics 81(1) 58-87 Naceur S Goaied M Belanes A (2006) On the Determinants and Dynamics of Dividend Policy
International Review of Finance 6(1-2) 1-23 Naceur S Goaied M Belanes A (2016) A Re-examination of Dividend Policy A Dynamic Panel
Data Analysis Working paper ESSEC Tunis IHEC Carthage Nakamura A (1985) Rational Expectations and the Firms Dividend Behavior Review of Economics
and Statistics 67(4) 606-615 Nakamura M (1989) Asymmetry in the Dividend Behavior of US and Japanese Firms Managerial
and Decision Economics 10(4) 261-274 Nelson JP Kennedy PE (2009) The Use (and Abuse) of Meta-Analysis in Environmental and
Natural Resource Economics An Assessment Environmental and Resource Economics 42(3) 345-377
Nickell S (1981) Biases in Dynamic Models with Fixed Effects Econometrica 49(6) 1417-1426
Oczkowski E Doucouliagos H (2014) Wine Prices and Quality Ratings a Meta-Regression Analysis American Journal of Agricultural Economics 97(1) 103-121
Omet G (2004) Dividend Policy Behaviour in the Jordanian Capital Market International Journal of
Business 9(3) 287-300 Pal K Goyal P (2007) Leading Determinants of Dividend Policy A Case Study of the Indian
Banking Industry Decision 34(2) 88-112
45
Pandey IM Bhat R (2007) Dividend behavior of Indian companies under monetary policy Managerial Finance 33(1) 14-25
Pandey IM (2003) Corporate Dividend Policy and Behaviour The Malaysian Evidence Asian
Academy of Management Journal 8(1) 17ndash32 Perez-Gonzalez F (2003) Large Shareholders and Dividends Evidence from US Tax Reforms
Working paper Columbia University Persson R (2013) Dividend policy behavior An analysis of firms listed at Stockholm Stock
Exchange Bachelor thesis Uppsala University Department of Economics EKONOMIKUM - Centre for Economic Sciences
Pindado J Requejo I Torre C de la (2012) Do Family Firms Use Dividend Policy as a Governance
Mechanism Evidence from the Euro zone Corporate Governance An International Review 20(5) 413-431
Post C Byron K (2015) Women on boards and firm financial performance A meta-analysis
Academy of Management Journal 58(5) 1546-1571 Powell JG Shi J Smith T (2004) Dividend persistence and return predictability Working paper
School of Finance and Applied Statistics Faculty of Economics and Commerce The Australian National University Canberra
Raftery AE Madigan D Hoeting JA (1997) Bayesian model averaging for linear regression
models Journal of the American Statistical Association 92 179ndash191 Rahman N (2002) Ownership structure and dividend smoothing cross-country evidence Working
paper University of Chicago Graduate School of Business Raza S H Zahaar M Hafeez M (2009) The Ownership Structure and Dividend Payout Policy in
Pakistan Evidence from KSE-100 index Non-financial Firms Pakistan Journal of Education 26(1) 173-188
Renneboog L Szilagyi PG (2015) How Relevant is Dividend Policy under Low Shareholder
Protection Journal of International Financial Markets Institutions and Money Advance online publication DOI 101016jintfin201501006
Renneboog L Trojanowski G (2007) Control structures and payout policy Managerial Finance
27(3) 180-194 Rusnak M Havranek T Horvath R (2013) How to Solve the Price Puzzle A Meta‐Analysis
Journal of Money Credit and Banking 45(1) 37-70
46
Sembenelli A (1993) Signalling Financial Hierarchy and Agency Theory as Explanations for Dividend Behavior Evidence from Italian Firm Data Managerial and Decision 14(1) 37-45
Shinozaki S Uchida K (2015) Ownership structure and dividend smoothing International evidence
Working paper Faculty of Economics Kyushu University Short H Zhang H Keasey K (2002) The link between dividend policy and institutional ownership
Journal of Corporate Finance 8(2) 105-122 Simegen M (2013) Determinants of Dividend Policy of Banks in Ethiopia Master thesis Addis
Ababa University College of Accounting and Finance School of Graduate Studies Skinner D (2008) The evolving relation between earnings dividends and stock repurchases Journal
of Financial Economics 87(3) 582-609 Stanley TD (2001) Wheat from Chaff Meta-Analysis as Quantitative Literature Review Journal of
Economic Perspectives 15(3) 131-150 Stanley TD (2005) Beyond Publication Bias Journal of Economic Surveys 19(3) 309-345 Stanley TD (2008) Meta-Regression Methods for Detecting and Estimating Empirical Effects in the
Presence of Publication Selection Oxford Bulletin of Economics and Statistics 70(1) 103-127 Stanley TD Doucouliagos H (2010) Picture This A Simple Graph That Reveals Much Ado About
Research Journal of Economic Surveys 24(1) 170-191 Stanley TD Doucouliagos H (2012) Meta-regression Analysis in Economics and Business Oxford
UK Routledge Stanley TD Doucouliagos H (2013) Better than Random Weighted Least Squares Meta
Regression Analysis University of Australia School of Accounting Economics and Finance Economics Series Working Paper SWP 20132
Stanley TD Doucouliagos H (2015) Neither fixed nor random weighted least squares meta-
analysis Statistics in Medicine 34 2116-2127 Stanley TD Jarrell B (1989) Meta-Regression Analysis A Quantitative Method of Literature
Journal of Economic Surveys 3(2) 161-170 Stanley TD Doucouliagos H Giles M Heckemeyer JH Johnston RJ Laroche P Nelson JP
Paldam M Poot J Pugh G Rosenberger RS Rost K (2013) Meta-Analysis of Economics Research Reporting Guidelines Journal of Economic Surveys 27(2) 390-394
47
Sudhahar M Saroja T (2010) Determinants of Dividend Policy in Indian Banks An Empirical Analysis Journal of Bank Management 9(3) 63-75
Sura JS Pal K Bodla BS (2006) Factors Influencing Dividend Policy Decisions in Banking
Sector An Indian Evidence Amity Business Review 7(2) 64-75 Tran QT Nguyen TTH (2014) Dividend Policy Behavior in Emerging Stock Markets Evidence
from Vietnamese Stock Market International Journal of Financial Research 5(4) 85-89 Trojanowski G (2004) Ownership structure and payout policy in the UK Working paper University of Exeter Business School Trotman KT Wood R (1991) A Meta-Analysis of Studies on Internal Control Judgements Journal
of Accounting Research 29(1) 180-192 Turnovsky SJ (1967) The Allocation of Corporate Profits between Dividends and Retained Earnings
Review of Economics and Statistics 49(4) 583-589 Valickova P Havranek T Horvath R (2015) Financial Development and Economic Growth A
Meta-Analysis Journal of Economic Surveys 29(3) 506-526 Vasiliou D Eriotis N (2002) The Determinants of Dividend policy some Greek data European
Journal of Management and Public Policy 1(2) 46-56 Wang K Shailer G (2015) Ownership concentration and firm performance in emerging markets a
meta-analysis Journal of Economic Surveys 29(2) 199-229 Wang X Manry D Wandler S (2011) The impact of government ownership on dividend policy in
China Advances in Accounting incorporating Advances in International Accounting 27(2) 366-372
Watts R (1973) The Information Content of Dividends Journal of Business 46(2) 191-211 Weber S (2010) bacon An effective way to detect outliers in multivariate data using Stata (and
Mata) The Stata Journal 10(3) 331-338 Younis D Javid AY (2014) Market Imperfections and Dividend Policy Decisions of Manufacturing
Sector of Pakistan PIDE Working Papers 201499 Zameer H Rasool S Iqbal S Arshad U (2013) Determinants of Dividend Policy A Case of
Banking Sector in Pakistan Middle-East Journal of Scientific Research 18(3) 410-424 Zigraiova D Havranek T (2016) Bank Competition and Financial Stability Much Ado about
Nothing Journal of Economic Surveys 30(5) 944-981
48
Tables and Figures
Figure 1 Funnel plot for the dividend smoothing coefficients
Note The dividend smoothing is measured on the x-axis while the y-axis represents precision calculated as the inverse
standard error The vertical line at 0728 indicates the ldquotruerdquo dividend smoothing as the mean of the 10 most precise
smoothing coefficients
49
Table 1 Summary statistics of meta data
Variable label Definition Mean Standard deviation
Dependent Variable
Dividend smoothing (d)
Dividend smoothing coefficient 0562 0325
Precision
Standard error (se)
Standard error of the dividend smoothing coefficient 0093 0102
Study design characteristics
Working Paper The study is a working paper older than 5 years = 1 0 otherwise
0112 0316
Post 1998 The mean year of estimation period gt1998 = 1 0 otherwise 0470 0499 No of years Length of the analyzed time series dimension 12526 11524 Debt Ownership Size Other Lintner classical
Estimation controls for firm debt = 1 0 otherwise Estimation controls for ownership = 1 0 otherwise Estimation controls for firm size =1 0 otherwise Estimation controls for other firm factors =1 0 otherwise Estimation does not include variables in addition to contemporaneous earnings and lagged dividends as independent variables =1 0 otherwise
0104 0166 0139 0419 0420
0306 0373 0346 0494 0494
Cash flow The estimation uses a cash flow measure =1 0 if earnings measure
0113 0317
OLS The estimation is based on OLS =1 0 otherwise 0553 0497
GMM The estimation is based on GMM=1 0 otherwise 0147 0354
Fixed effects The estimation is based on fixed effects = 1 0 otherwise 0157 0364 Other estimators The estimation is based on other methods = 1 0 otherwise 0143 0350 Service and Consumer Goods Financial firms Industry firms
Study analyzes serviceconsumer goods firms =1 0 otherwise Study analyzes financial firms =1 0 otherwise Study analyzes industry sector firms =1 0 otherwise
0015
0150 0061
0123
0357 0240
EU Developing US UK Other countries
Study analyzes a country or several countries from the EU =1 0 otherwise
Study analyzes a developing country or several developing countries =1 0 otherwise Study analyzes the US =1 0 otherwise Study analyzes the UK =1 0 otherwise Study focuses on other countries =1 0 otherwise
0174
0344
0114 0083 0277
0379
0475
0318 0276 0447
Note We use the following reference categories in the MRA classical Lintner model for pre 1998 US data estimated with OLS
50
Table 2 WLS FAT-PET meta-regression analysis results
Variable Robust se
(1)
Robust se
(2)
Robust se
(3)
Study cluster
robust se (4)
Study cluster
robust se (5)
Study cluster
robust se (6)
Wild bootstrap
se clustered by study
(7)
Wild bootstrap
se clustered by study
(8)
Wild bootstrap
se clustered by study
(9)
Constant 0755 (2035)
0732 (2147)
0707 (2481)
0755 (712)
0732 (760)
0707 (777)
0755 [0000]
0732 [0000]
0707 [0000]
SE -3613 (-482) - -3613
(-200) -3613 [0216] -
SE (smoothingle05) -1130 (-1724) -1130
(-481) -1130 [0002]
SE (smoothinggt05) 2526 (264) 2526
(148) 2526 [0246]
SEsup2 (smoothingle05) - -17412 (-385) - -17412
(-261) - -17412 [0148]
SEsup2(smoothinggt05) 4746 (237) 4746
(087) 4746 [0596]
F 2327 2273 1270 398 2273 558 p(F) 0000 0000 0000 0049 0000 0005 R2 0043 0284 0018 0042 0284 0018 0043 0284 0018 Adj R2 0042 0283 0016 Observations 979 979 979 979 979 979 978 978 978
Notes Dependent variable is dividend smoothing coefficient t-values in parentheses p values in brackets significance at the 1
5 10 level Squared standard errors of adjustment coefficients are used as weights
51
Table 3 WLS estimation results of models (8) (9) and (10)
Panel A
Variable
Robust se
(1)
Cluster robust se by study
(2)
Wild bootstrap se clustered by
study (3)
Constant
0678 (823)
0678 (414)
0678 [0072]
se
-1536 (-244)
-1536 (-162)
-1536 [0172]
Working paper 0157 (220)
0157 (193)
0157 [0284]
Post 1998
-0085 (-165)
-0085 (-129)
-0085 [-0372]
No of years
-0004 (-160)
-0004 (-092)
-0004 [0594]
Debt
-0035 (-039)
-0035 (-035)
-0035 [-0830]
Ownership
0077 (245)
0077 (206)
0077 [0000]
Size
0025 (0037)
0025 (0024)
0025 [0868]
Other
0024 (083)
0024 (072)
0024 [0484]
Cash Flow
0371 (548)
0371 (367)
0371 [0010]
GMM
-0219 (-319)
-0219 (-232)
-0219 [0078]
Fixed effects
-0205 (-322)
-0205 (-275)
-0205 [0036]
Other estimators -0083 (-106)
-0083 (-089)
-0083 [0610]
Service amp consumer goods -0381 (-160)
-0381 (-154)
-0381 [0452]
Financial firms
0250 (285)
0250 (249)
0250 [0052]
Industry firms
0078 (109)
0078 (097)
0078 [0422]
EU
-0092 (-113)
-0092 (-060)
-0092 [-0696]
Developing
0050 (064)
0050 (041)
0050 [0786]
UK
0058 (066)
0058 (043)
0058 [0722]
Other countries 0086 (095)
0086 (068)
0086 [0714]
F 7502 1977 1977 p(F) 0000 0000 Rsup2 0473 0473 0473 Adj Rsup2 0462
Observations 979 979 979 Notes All variables are as defined as in table 1 Dependent variable is dividend smoothing coefficient This panel contains specifications with the standard error of the estimated dividend smoothing as independent variable In Panel B the (squared) standard error is interacted with a dummy variable equal to 1 for dividend smoothing coefficients higher or lower or equal than 05 respectively t-values in parentheses p values in brackets significance at the 1 5 10 level Squared standard errors of adjustment coefficients are used as weights Reference category classical Lintner model for pre 1998 US data estimated with OLS
52
Panel B
Variable
Robust se
(1)
Robust se
(2)
Cluster
robust se by study
(3)
Cluster
robust se by study
(4)
Wild bootstrap se clustered by
study (5)
Wild bootstrap se clustered by
study (6)
Constant
0675 (925)
0657 (812)
0675 (478)
0657 (400)
0675 [0042]
0657 [0072]
SE (smoothingle05)
-7499 (-1307)
-7499 (-673)
-7499 [0002]
SE (smoothinggt05) 3591 (375)
3591 (257)
3591 [0004]
SEsup2 (smoothingle05) -11997 (-382)
-11997 (-344)
-11997 [0086]
SEsup2(smoothinggt05) 8195 (384)
8195 (246)
8195 [0022]
Working paper 0160 (270)
0161 (235)
0160 (245)
0161 (203)
0160 [0164]
0161 [0276]
Post 1998
-0081 (-191)
-0094 (-185)
-0081 (-151)
-0094 (-142)
-0081 [0258]
-0094 [0344]
No of years
-0006 (-240)
-0004 (-174)
-0006 (-144)
-0004 (-099)
-0006 [0386]
-0004 [0578]
Debt
-0019 (-027)
-0028 (-030)
-0019 (-024)
-0028 (-027)
-0019 [0938]
-0028 [0888]
Ownership
0082 (303)
0080 (255)
0082 (266)
0080 (210)
0082 [0000]
0080 [0000]
Size
0018 (033)
0029 (041)
0018 (023)
0029 (041)
0018 [0922]
0029 [0874]
Other
0017 (071)
0015 (049)
0017 (064)
0015 (042)
0017 [0610]
0015 [0710]
Cash Flow
0272 (431)
0350 (494)
0272 (295)
0350 (316)
0272 [0154]
0350 [0104]
GMM
-0092 (-136)
-0193 (-283)
-0092 (-106)
-0193 (-206)
-0092 [0468]
-0193 [0120]
Fixed effects
-0111 (-191)
-0187 (-298)
-0111 (-169)
-0187 (-256)
-0111 [0190]
-0187 [0062]
Other estimators -0017 (-025)
-0067 (-087)
-0017 (-025)
-0067 (-073)
-0017 [0902]
-0067 [-0640]
Service amp consumer goods -0281 (-140)
-0412 (-188)
-0281 (-145)
-0412 (-184)
-0281 [0434]
-0412 [0390]
Financial firms
0209 (271)
0235 (259)
0209 (251)
0235 (226)
0209 [0038]
0235 [0082]
Industry firms
-0011 (-020)
0026 (034)
-0011 (-017)
0026 (028)
-0011 [-0916]
0026 [0776]
EU
-0131 (-184)
-0135 (-167)
-0131 (-109)
-0135 (-089)
-0131 [-0476]
-0135 [0570]
Developing
-0001 (-001)
0037 (048)
-0001 (-001)
0037 (030)
-0001 [-0986]
0037 [0810]
UK
0032 (039)
0065 (075)
0032 (027)
0065 (048)
0032 [0890]
0065 [0722]
Other countries 0061 (078)
0093 (104)
0061 (059)
0093 (073)
0061 [0740]
0093 [0630]
F 9332 3475 9332 1588 p(F) 0000 0000 0000 0000 Rsup2 0608 0478 0478 0478 0608 0478 Adj Rsup2 0600 0467
Observations 979 979 979 979 979 979
53
Appendix
Table A1 Overview of studies estimating dividend smoothing coefficients
Authors Countries Time span No of firms No of estimates Method Mean
)ˆ(d Median
)ˆ(d Darling (1957) US 1921-1954 34 2 OLS 0495 0495
Brittain (1964) US 1920-1960 41 4 OLS 0716 0776
Mueller (1967) US 1957-1960 67 5 OLS amp other method 0877 0837 Turnovsky (1967) US 1948-1962 15 3 OLS 0594 0590 Feldstein (1970) UK 1953-1964 12 18 OLS amp other method 0567 0603 Mcdonald amp Nussenbaum (1975) France 1967-1968 2 7 OLS 0791 0802 Nakamura (1985)
Japan US
1964-1981 18 24 OLS 0680 0756
Mcdonald amp Soderstrom (1986) US 1965-1984 20 1 Fixed effects 0840 0840 Dharan (1988) US 1981-1983 3 6 OLS 0933 0947 Nakamura (1989) US 1960-1982 23 48 OLS 0701 0779 Mookerjee (1992) India 1950-1981 32 8 Other method 0255 0240 Behm amp Zimmermann (1993) Germany 1962-1988 32 8 OLS 0813 0812 Sembenelli (1993) Italy 1962-1988 27 6 OLS amp GMM 0703 0733 Hines (1996) US 1984-1989 6 5 OLS 0596 0569 DeAngelo amp DeAngelo (2000) US 1958-1979 22 4 Other method 0268 0270 Garrett amp Priestley (2000) US 1876-1997 122 3 Other method 0691 0670 Desai et al (2001) US 1982-1997 16 24 OLS Fixed effects amp
other method 0282 0279
Esteban amp Peacuterez (2001) 22 European countries
1991-1998 8 1 GMM 0342 0342
Rahman (2002) 28 1992-1999 8 57 OLS 0900 0945
54
countries Short et al (2002) UK 1988-1992 5 3 OLS 0556 0622 Vasiliou amp Eriotis (2002) Greece 1996-2001 6 4 OLS amp Fixed effects 0530 0530 Adelegan (2003) Nigeria 1984-1997 14 5 OLS 1358 1405 Gugler amp Yurtoglu (2003) Germany 1992-1998 7 6 Fixed effects 0400 0414 Kumar (2003) India 1994-2000 7 28 OLS amp Fixed effects 0500 0729 Pandey (2003) Malaysia 1993-2000 8 7 Fixed effects 0391 0432 Perez-Gonzalez (2003) US 1980-1999 20 2 Fixed effects 0503 0503 Benzinho (2004) Portugal 1990-2002 34 1 Other method 0352 0352 Correia da Silva et al (2004) Germany 1984-1993 10 24 OLS Fixed effects
GMM amp other method 0641 0684
Omet (2004) Jordania 1985-1999 15 3 OLS Fixed effects amp other method
0631 0681
Powell et al (2004) US 1927-1996 70 2 OLS 0788 0788 Trojanowski (2004) UK 1992-1998 7 11 GMM 0253 0270 Karathanassis amp Chrysanthopoulou (2005) Greece 1996-1998 3 32 Fixed effects amp other
method 0265 0266
Aivazian et al (2006) US 1981-1999 19 1 Fixed effects 0089 0089 Foerster amp Sapp (2006) Canada 1871-2003 133 4 OLS 0787 0785 Khan (2006) UK 1985-1997 330 6 OLS amp GMM 0674 0677 Naceur et al (2006) Tunisia 1996-2002 7 24 OLS Fixed effects
GMM amp other method 0334 0264
Sura et al (2006) India 2003-2004 2 43 OLS 0475 0503 Ameer (2007) Malaysia 1995-2005 11 3 OLS 0633 0595 Benhamouda (2007) UK 2000-2004 5 20 OLS amp Fixed effects 0127 0031 Bodla et al (2007) India 1996-2006 11 32 OLS 0485 0506 Dai (2007) Norway 1989-1998 10 5 Other method 0763 0764 Hines et al (2007) US 1982-2002 21 29 OLS Fixed effects amp
other method 0241 0239
Pal amp Goyal (2007) India 1997-1998 2 9 OLS 0920 0852 Pandey amp Bhat (2007) India 1989-1997 9 8 GMM 0259 0258
55
Renneboog amp Trojanowski (2007) UK 1992-1998 7 6 GMM 0313 0305 Ahmed amp Javid (2008) Pakistan 2001-2006 6 16 OLS Fixed effects
GMM amp other method 0549 0705
Ameer (2008) Malaysia 1995-2005 11 7 OLS 0525 0576 Baba amp Ueno (2008) Japan 1990-2003 14 1 GMM 0657 0657 Haddad et al (2008) Jordania 1996-2002 7 6 OLS amp GMM 0409 0373 Ahmed amp Javid (2009) Pakistan 2001-2006 6 12 OLS Fixed effects
GMM amp other method 0532 0500
Al-Najjar (2009) Jordania 1994-2003 10 3 OLS Fixed effects amp other method
0495 0561
Alzahrani amp Lasfer (2009) 24 OECD countries
2000-2007 8 12 Fixed effects amp GMM 0240 0236
Andres et al (2009) Germany 1984-2005 22 20 OLS Fixed effects amp GMM
0683 0697
Hayunga amp Stephens (2009) UK 1992-2003 12 9 OLS amp other method 0663 0621 Mollah (2009) Bnagladesh 1988-2003 16 15 OLS 0730 0741 Raza et al (2009) Pakistan 2001-2006 6 1 OLS 0771 0771 Al-Ajmi (2010) Qatar 1997-2006 10 14 OLS 0873 0808 Al-Yahyaee et al (2010) Oman 1989-2004 16 1 Other method 0747 0747 Chemmanur et al (2010)
Hong Kong US
1984-2002 19 8 OLS 0623 0513
Korkeamaki et al (2010) Finland 2003-2006 4 10 OLS Fixed effects amp other method
0072 0110
Sudhahar amp Saroja (2010) India 1997-2007 11 3 OLS 0680 0715 Al-Yahyaee et al (2011) Oman 1989-2004 16 1 Other method 0059 0059 Baiyao (2011) US 1991-2007 17 1 OLS 0450 0450 Goncharov amp Triest (2011) Russia 2003-2006 4 7 OLS 0546 0377 Haleem amp Javid (2011) Pakistan 2007-2009 3 21 OLS 0898 0803 Hussain (2011) Saudia
Arabia 1990-2006 17 9 Fixed effects amp other
method 0546 0377
Kinfe (2011) Ethiopia 2006-2010 5 1 OLS 0191 0191 Mohsin amp Ashraf (2011) Pakistan 2001-2009 9 3 Fixed effects amp GMM amp
other method 0568 0626
56
Wang et al (2011) China 1998-2008 11 13 OLS amp other method 0448 0450 Abdullah et al (2012) Malaysia 2009-2010 2 1 OLS 0889 0889 Al-Najjar amp Belghitar (2012) UK 1991-2007 17 8 Fixed effects amp GMM amp
other method 0552 0568
Bawa amp Kaur (2012) India 2006-2006 1 24 OLS amp Fixed effects 0898 0847 Kamat amp Kamat (2012) India 1971-2007 37 9 GMM 0476 0401 Kumar amp Kumar Jha (2012) India 2007-2011 5 3 OLS 0039 0077 Baker et al (2013) Canada 1988-1999 12 2 OLS 0550 0550 Hutagalung et al (2013) Malaysia 2001-2010 10 1 Fixed effects 0856 0856 Kamat amp Kamat (2013) India 1975-1992 18 3 GMM 0534 0571 Kanoja amp Bhatia (2013) India 2007-2012 6 5 OLS 0587 0682 Persson (2013) Sweden 2005-2011 7 6 Fixed effects 0378 0225 Simegen (2013) Ethiopia 2002-2011 10 2 Fixed effects 0203 0203 Zameer et al (2013) Pakistan 2003-2009 7 1 OLS 0699 0699 Al-Malkawi et al (2014) Oman 2001-2010 10 2 Other method 0744 0744 Andres et al (2014) Germany 1984-2005 22 19 OLS amp GMM 0592 0501 Arko et al (2014) Sub-
Saharan African countries
1997-2007 11 9 OLS 0677 0662
Boţoc amp Pirtea (2014) 16 emerging countries
2003-2011 9 16 OLS amp GMM 0474 0487
Gunathilaka (2014) Sri Lanka 2006-2010 5 7 GMM 0273 0350 Tran amp Nguyen (2014) Vietnam 2006-2011 6 2 Fixed effects 0122 0122 Younis amp Javid (2014) Pakistan 2003-2011 9 6 Fixed effects amp other
method 0512 0570
Al-Attar et al (2015) Jordania 2006-2011 6 7 OLS 0506 0487 Andres et al (2015) Germany 1988-2008 21 3 OLS Fixed effects amp
GMM 0716 0681
Kim amp Jeon (2015) Korea 2000-2010 11 8 OLS Fixed effects amp other method
0614 0722
57
Renneboog amp Szilagyi (2015) Netherlands 1996-2004 9 8 GMM 0996 0825 Shinozaki amp Uchida (2015) 44
countries 2003-2013 11 1 Fixed effects 0788 0788
Athari et al (2016) 7 Arabian countries
2003-2012 10 4 GMM 0404 0407
Benavides et al (2016) Argentina 1995-2013 19 45 OLS 0650 0660 Brazil Chile Columbia Mexico Peru Bremberger et al (2016) 14 EU
countries 1986-2010 25 11 OLS Fixed effects amp
GMM 0510 0506
Chan et al (2016) US 1927-2013 87 2 OLS 0742 0742 Chen amp Sinha (2016) US 1996-2001 6 4 OLS 0739 0738 Naceur et al (2016) Tunisia 1996-2002 7 14 OLS Fixed effects
GMM amp other method 0160 0165
Source Authors literature search
58
Figure A1 Frequency distribution of dividend smoothing coefficients
050
100
150
Freq
uenc
y
-1 0 1 2 3Smoothing coefficient
Note The dividend smoothing is measured on the x-axis while the y-axis represents the frequency of dividend smoothing coefficients within the respective interval
Figure A2 Kernel density of dividend smoothing coefficients
05
11
5D
ensi
ty
-1 0 1 2 3Smoothing coefficient
e e de s y es a e
Note The dividend smoothing is measured on the x-axis while the y-axis represents the density of dividend smoothing coefficients estimated by Kernel density estimation
59
Figure A3 Funnel plot for the dividend smoothing coefficients (median)
0
20
40
60
80
100
120
140
160
0 05 1 15
Note The dividend smoothing is measured on the x-axis while the y-axis represents precision calculated as the inverse standard error The vertical line at 0671 indicates the ldquotruerdquo dividend smoothing as the mean of the 10 most precise smoothing coefficients The plot is based on median values of the dividend smoothing coefficients and precision per study
Figure A4 Frequency distribution of dividend smoothing coefficients (median)
Figure A5 Kernel density of dividend smoothing coefficients (median)
010
2030
Freq
uenc
y
0 5 1 15Smoothing coefficient
05
11
52
Den
sity
0 5 1 15Smoothing coefficient
y
Note Figure A4 (left-hand side) The dividend smoothing is measured on the x-axis while the y-axis represents the frequency of dividend smoothing coefficients within the respective interval The figure is based on median values of the dividend smoothing coefficients and precision per study
Note Figure A5 (right-hand side) The dividend smoothing is measured on the x-axis while the y-axis represents the density of dividend smoothing coefficients estimated by Kernel density estimation The figure is based on median values of the dividend smoothing coefficients and precision per study
60
Table A2 Bayesian averaging of models (8) (9) and (10)
Variable Post mean (Post SE) PIP
Robust se
Post mean (Post SE) PIP
Robust se Post mean
(Post SE) PIP
Robust se
Constant
0682 (1998)
100 0705 (1408)
0583 (2555)
100 0579 (818)
0641 (2016)
100 0654 (1153)
SE
-0264 (-181)
084 -2379 (-430)
SE (smoothingle05)
-1150 (-1441)
100 -7390 (-1027)
SE (smoothinggt05) 1701 (1591)
100 3568 (351)
SEsup2 (smoothingle05) -0678 (-708)
100 -12513 (-385)
SEsup2(smoothinggt05) 3941 (1259)
100 5238 (217)
Working paper 0043 (089)
050
0102 (402)
100 0239 (337)
0110 (328)
098 0271 (487)
Post 1998
-0087 (-331)
099 -0077 (-197)
-0119 (-646)
100 -0088 (-186)
-0101 (-447)
100 -0064 (-114)
No of years
0000 (007)
004
0000 (004)
004 0000 (029)
011
Debt
-0000 (-004)
003
0000 (011)
004 -0002 (-004)
003
Ownership
0000 (000)
003
0006 (038)
038 0000 (004)
003
Size
0001 (014)
005
0000 (003)
003 0000 (004)
004
Other
-0000 (-005)
003
-0004 (-036)
015 -0001 (-015)
005
Cash Flow
0168 (551)
100 0370 (525)
0095 (376)
099 0219 (303)
0125 (447)
100 0329 (433)
GMM
-0241 (-838)
100 -0269 (-533)
-0136 (-617)
100 -0159 (-260)
-0223 (-872)
100 -0220 (-354)
Fixed effects
-0379 (-1322)
100 -0256 (-421)
-0239 (-1078)
100 -0121 (-185)
-0349 (-1368)
100 -0232 (-334)
Other estimators -0146 (-497)
100 -0149 (-232)
-0089 (-383)
099 0005 (007)
-0137 (-520)
100 -0099 (-117)
Service amp consumer goods 0128 (108)
061 -0415 (-152)
0004 (019)
006 0004 (018)
006
Financial firms
-0067 (-145)
075 0276 (340)
-0004 (-031)
012 -0035 (-090)
051 0271 (310)
Industry firms
0208 (498)
100 0007 (013)
0021 (058)
030 0084 (148)
076 0032 (051)
EU
0014 (044)
020
0009 (040)
018 0013 (042)
019
Developing
0045 (094)
055 0048 (105)
0064 (216)
090 0067 (099)
0035 (081)
047
UK
-0003 (-017)
008
0001 (006)
004 -0004 (-021)
009
Other countries 0056 (106)
061 0167 (315)
0080 (273)
095 0087 (106)
0030 (070)
039
n 979 979 979 979 979 979 Notes All variables are as defined as in table 1 Dependent variable is dividend smoothing coefficient t-values in parentheses p values in brackets All models estimated with robust standard errors significance at the 1 5 10 level Squared standard errors of adjustment coefficients are used as weights PIP refers to the posterior inclusion probability of the variables estimated by Bayesian modeling averaging Reference category classical Lintner model for pre 1998 US data estimated with OLS
61
Table A3 WLS FAT-PET meta-regression robustness checks
Variable Robust 05-quantile estimation WLS coefficients per study
Constant 0659 (2955)
0573 (4779)
0564 (3030)
0663 (4468)
0581 (2492)
0566 (4244)
SE -0628 (-359) -0752
(-557)
SE (smoothingle05) -1960 (-1336) -1381
(-403)
SE (smoothinggt05) 1585 (1172) 1497
(762)
SEsup2 (smoothingle05) -4534 (-152) -0636
(-351)
SEsup2(smoothinggt05) 5283 (801) 4899
(980) F 3100 9802 5561 p(F) 0000 0000 0000 R2 0020 0262 0090 0065 0390 0149 n 998 998 998 979 979 979
Note Dependent variable is dividend smoothing coefficient All models estimated with robust standard errors t-values in parentheses p values in brackets significance at the 1 5 10 level
62
Table A4 robustness checks of models (8) (9) and (10)
Variable Robust 05-quantile estimation WLS coefficients per study
Constant
0702 (2093)
0555 (1704)
0569 (1761)
0565 (1378)
0460 (1198)
0436 (1153)
SE -0619 (-692) -0663
(-692)
SE (smoothingle05) -1404
(-1274) -0979 (-405)
SE (smoothinggt05) 1397 (846) 1672
(764)
SEsup2 (smoothingle05) -2258 (-093) -0526
(-425) SEsup2(smoothinggt05) 3791
(547) 4682 (808)
Working paper 0078 (267)
0075 (221)
0112 (367)
0106 (357)
0157 (548)
0175 (607)
Post 1998
-0134 (-710)
-0151 (-1021)
-0156 (-893)
-0112 (-379)
-0125 (-517)
-0126 (-441)
No of years
0001 (234)
0001 (244)
0002 (268)
-0000 (-014)
0002 (150)
0003 (314)
Debt
-0027 (-069)
0038 (120)
-0045 (-143)
-0088 (-230)
-0042 (-135)
-0061 (-178)
Ownership
-0042 (-115)
0001 (003)
-0040 (-165)
0032 (136)
0072 (377)
0041 (182)
Size
0014 (039)
0009 (052)
0023 (071)
0026 (068)
0024 (079)
0030 (086)
Other
-0008 (-038)
-0034 (-219)
-0010 (-061)
0026 (112)
-0012 (-069)
0011 (051)
Cash Flow
0071 (258)
0041 (183)
0077 (459)
0136 (305)
0065 (175)
0098 (226)
GMM
-0281 (-1026)
-0170 (-942)
-0258 (-1160)
-0238 (-794)
-0169 (-678)
-0230 (-847)
Fixed effects
-0450 (-1807)
-0256 (-1139)
-0366 (-1847)
-0402 (-1410)
-0279 (-1161)
-0366 (-1332)
Other estimators -0159 (-536)
-0097 (-600)
-0147 (-704)
-0138 (-548)
-0085 (-433)
-0114 (-504)
Service amp consumer goods 0166 (211)
0050 (084)
0079 (066)
0524 (397)
0274 (268)
0327 (293)
Financial firms
-0037 (-120)
-0033 (-141)
-0053 (-184)
-0073 (-187)
-0058 (-177)
-0110 (-300)
Industry firms
0163 (579)
0065 (250)
0122 (776)
0313 (620)
0075 (221)
0098 (290)
EU
0079 (214)
0117 (361)
0107 (387)
0159 (452)
0103 (353)
0151 (444)
Developing
0116 (371)
0169 (607)
0171 (595)
0214 (511)
0176 (537)
0224 (564)
UK
0002 (005)
0079 (221)
0084 (248)
0072 (179)
0072 (217)
0084 (217)
Other countries 0111 (371)
0187 (607)
0162 (601)
0191 (505)
0178 (572)
0202 (567)
F 5135 7186 5798 p(F) 0000 0000 0000 Rsup2 0251 0389 0297 0417 0627 0489 n 998 998 998 979 979 979
Notes All variables are as defined as in table 1 Dependent variable is dividend smoothing coefficient All models estimated with robust standard errors t-values in parentheses p values in brackets significance at the 1 5 10 level Squared standard errors of adjustment coefficients are used as weights Reference category classical Lintner model for pre 1998 US data estimated with OLS
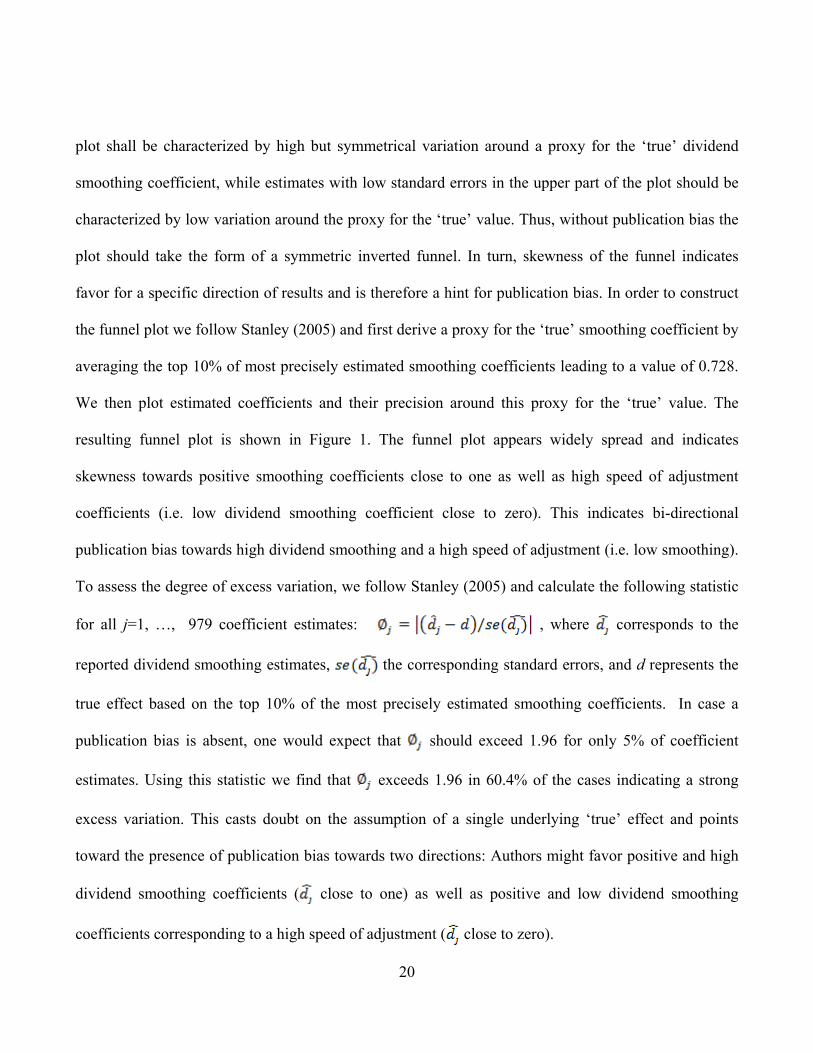
20
plot shall be characterized by high but symmetrical variation around a proxy for the lsquotruersquo dividend
smoothing coefficient while estimates with low standard errors in the upper part of the plot should be
characterized by low variation around the proxy for the lsquotruersquo value Thus without publication bias the
plot should take the form of a symmetric inverted funnel In turn skewness of the funnel indicates
favor for a specific direction of results and is therefore a hint for publication bias In order to construct
the funnel plot we follow Stanley (2005) and first derive a proxy for the lsquotruersquo smoothing coefficient by
averaging the top 10 of most precisely estimated smoothing coefficients leading to a value of 0728
We then plot estimated coefficients and their precision around this proxy for the lsquotruersquo value The
resulting funnel plot is shown in Figure 1 The funnel plot appears widely spread and indicates
skewness towards positive smoothing coefficients close to one as well as high speed of adjustment
coefficients (ie low dividend smoothing coefficient close to zero) This indicates bi-directional
publication bias towards high dividend smoothing and a high speed of adjustment (ie low smoothing)
To assess the degree of excess variation we follow Stanley (2005) and calculate the following statistic
for all j=1 hellip 979 coefficient estimates where corresponds to the
reported dividend smoothing estimates the corresponding standard errors and d represents the
true effect based on the top 10 of the most precisely estimated smoothing coefficients In case a
publication bias is absent one would expect that should exceed 196 for only 5 of coefficient
estimates Using this statistic we find that exceeds 196 in 604 of the cases indicating a strong
excess variation This casts doubt on the assumption of a single underlying lsquotruersquo effect and points
toward the presence of publication bias towards two directions Authors might favor positive and high
dividend smoothing coefficients ( close to one) as well as positive and low dividend smoothing
coefficients corresponding to a high speed of adjustment ( close to zero)
21
[Insert Figure 1 about here]
Funnel plots though assume a single lsquotruersquo effect for different regions sectors time periods or
estimation techniques Hence possible publication bias within country or industry subsamples of
reported smoothing coefficients cannot be detected with this method (Hirsch 2018 Doucouliagos et
al 2005 Stanley 2005 2008) In the following we therefore conduct MRA which provides a more
objective analysis than funnel plots17
42 META REGRESSION MODEL
While the funnel analysis performed in section 41 can provide first indications regarding the
smoothing effect and publication bias its main disadvantage lies in the assumption that only a single
lsquotruersquo effect exists
We therefore perform several MRA`s based on different estimation strategies Compared to funnel
graphs which can only reveal the degree of publication bias across the entire sample of smoothing
coefficients MRA enables to more precisely analyze possible publication bias by accounting for
different subgroups in the sample (eg defined by time countries or industries) It is likely that those
subgroups are affected by publication bias to varying degrees MRA also allows to account for
heterogeneity in reported coefficients driven by the underlying study design ie the applied
17 To further illustrate the distribution of dividend smoothing coefficients Figures A1 and A2 in the appendix show the
frequency distribution and the Kernel density In addition we also captured the distribution of dividend smoothing
coefficients based on median values of reported dividend smoothing coefficients and median precision per study
Figures A3-A5 in the appendix show the respective funnel plot frequency distribution as well as Kernel density based
on median values
22
econometric estimator or the inclusion of additional independent variables when estimating dividend
smoothing (Doucouliagos et al 2005 Stanley 2005 2008)
Following Stanley (2005 2008) we implement several specifications of the following model
jn
njnjj xdsed εβββ +++= sum)ˆ(ˆ10 (8)
where the dependent variable reflects the j=1hellip 979 identified dividend smoothing coefficients jd
The standard error of each coefficient ( )ˆ( jdse ) is included as independent variable together with a
vector sumn
njn xβ of those variables reported in Table 1 that relate to structural characteristics of the
underlying studies The respective coefficients ( nβ ) therefore capture the variance in reported
smoothing coefficients caused by those characteristics Finally jε is an iid error term
The inclusion of the standard error of estimated coefficients as an independent variable serves as a
basis for testing for publication bias If publication bias prevails across the analyzed literature a
significant correlation between estimated coefficients and their standard errors should prevail
(Oczkowski and Doucouliagos 2014) Thus authors will likely prefer those results where the quotient
of the estimated coefficient and its standard error is equal or larger than two implying significance at
the 5-level or lower In contrast if publication bias is not present estimated coefficients are distributed
randomly around the lsquotruersquo value and there should be no significant correlation with standard errors
Testing 0ˆ 10 =βH can therefore be considered as a test for publication bias
23
As indicated by the funnel plot in Figure 1 the research on dividend smoothing might be biased
towards findings of high smoothing or a high speed of adjustment In this case we expect a different
impact of over the domain of high dividend smoothing and low dividend smoothing coefficients
(high speed of adjustment) Whereas authors focusing on dividend smoothing might prefer high
dividend smoothing coefficients authors with a focus on speed of adjustment might prefer lower
dividend smoothing coefficients Hence to test for bi-directional publication bias we use 05 as cutoff
for coefficient estimates of indicating a focus on high dividend smoothing parameter ( or
high speed of adjustment parameters ( This yields the following specification (eg Bom and
Ligthart 2009)
(9)
where
le
=otherwise
difD j
050ˆ1
1 and
gt
=otherwise
difD j
050ˆ1
2
Based on this specification 0ˆ 20 =βH is a test towards a publication bias in favor of low dividend
smoothing coefficients (ie high speed of adjustment) 0ˆ 30 =βH in turn serves as our test for a
publication bias towards high dividend smoothing coefficients
Stanley and Doucouliagos (2012) suggest to also consider specifications where the standard error is
introduced non-linearly Non-linearity allows for a more flexible relationship between coefficients and
standard errors over the domain of standard errors where publication bias will be less severe for
24
estimates with low standard errors We therefore also consider a specification of (9) where the standard
error is introduced in a quadratic way
(10)
where
le
=otherwise
difD j
050ˆ1
1 and
gt
=otherwise
difD j
050ˆ1
2
Finally in each specification the intercept 0β reflects the mean value of dividend smoothing corrected
for publication bias given that the impact of all study design characteristics included in is set to zero
The presence of a dividend smoothing effect can hence be tested by 0ˆ 01 =βH and rejecting this
hypothesis points towards the existence of an effect According to Stanley (2005 2008) the test of a
non-significant MRA intercept is also known as precision effect test (PET)
43 ECONOMETRIC IMPLEMENTATION
Various econometric approaches are necessary to account for problems caused by the fact that the
dependent variable of (8) to (10) is composed of estimated regression coefficients )ˆ( jd (Stanley et al
2013) These regression coefficients are derived by means of separate empirical studies implying
heterogeneous variances that potentially cause heteroscedasticity in the error terms of (8) to (10)
(Nelson and Kennedy 2009) We therefore use weighted least squares (WLS) for the estimation of (8)
to (10) As Stanley (2005) and Oczkowski and Doucouliagos (2014) point out 2)ˆ(1 jdse can serve as
25
an adequate weight as it captures the heterogeneous variances of the coefficients and thus generates
heteroscedasticity corrected standard errors18
Another econometric issue arises from the fact that most of the studies included in our MRA (86)
provide more than one estimate This implies that the meta-data is composed of clusters of estimates
with similar error structures Nelson and Kennedy (2009) point out that such within-cluster error
correlation leads to biases in the standard errors of (8) to (10) To correct for within study-cluster
correlation we follow Oczkowski and Doucouliagos (2014) and employ several techniques to derive
unbiased standard errors In particular we first estimate (8) to (10) using WLS with heteroscedasticity
robust standard errors as our base model We then correct for within-study error correlation by
estimating WLS models with study-cluster robust and bootstrapped clustered standard errors More
specifically we use the wild bootstrap method which is particularly suited when study clusters are of
significantly different sizes (Cameron et al 2008 MacKinnon and Webb 2017) Moreover as Table
A1 indicates clusters in our sample are of significantly different sizes According to MacKinnon and
Webb (2017) the wild bootstrap may yield reliable inferences in this case
Although panel estimators such as fixed and random effects are suitable to capture the clustered (ie
panel) structure of our data it is known that WLS with study-cluster robust standard errors is the more
reasonable approach to estimate MRA models (Hirsch 2018) Stanley and Doucouliagos (2013 2015)
demonstrate that WLS outperforms the random- and fixed effects estimator especially when the meta-
data is affected by publication bias Moreover the fixed and random effects estimators are based on a
set of adverse characteristics (Baltagi 2008) First coefficient clusters in our sample are of 18 Note that the sample size can also serve as an indicator for estimation precision of coefficients as it is proportional to the
inverse of the standard error (Stanley 2005)
26
considerably different sizes with a large number of clusters that contain a single observation only19
Nelson and Kennedy (2009) point out that employing the fixed effects estimator to such panels is
disadvantageous as studies with a single observation will be eliminated from the estimation procedure
Second application of the fixed effects estimator leads to inefficient estimates of (8) to (10) as study-
specific fixed effects significantly decrease the degrees of freedom (Baltagi 2008 Nelson and
Kennedy 2009) Third to generate unbiased coefficients of (8) to (10) the random effects estimator
requires zero correlation between the random effect and the explanatory variables (ie the standard
errors as well as the variables in ) (Baltagi 2008 Stanley and Doucouliagos 2013 2015) Due to
these disadvantages and the predominance of WLS in MRA models we consider the WLS estimations
with study-cluster robust standard errors of (8) (9) and (10) as our main results while results with
wild-bootstrapped standard errors shall serve as robustness checks
44 META REGRESSION RESULTS
To get an initial impression of publication bias we follow the procedure used in prior MRAs (Card and
Krueger 1995 Hirsch 2018 Stanley and Doucouliagos 2012) and first estimate equations (8) to (10)
without including the set of explanatory variables x The results are reported in Table 2 In the
interpretation we focus on the WLS estimations of (8) to (10) with study-cluster robust standard errors
as our main results (columns 4-6) The constant of each model indicates mean dividend smoothing
19 We observe 13 studies that report just one coefficient The maximum number of coefficients that a single study reports
amounts to 57 The average number of coefficients reported in the included studies is 989 A standard deviation of
1104 shows that the coefficient clusters in our sample are of considerably different size
27
corrected for publication bias Columns 4-6 reveal that this value is between 0707 and 0755 and thus
close to the average of the 10 most precise measures derived as the proxy for lsquotruersquo smoothing above
(0728) The test for a significant impact of the constant ie the PET test (Stanley 2005 2008) indicates
for all specifications the presence of a significant smoothing effect
[Insert Table 2 about here]
As rejecting 0ˆ10 == βH points towards skewness of the funnel plot (Figure 1) this test is also known
as the funnel asymmetry test (FAT) (Stanley 2005 2008) The models that account for the standard
error as independent variable in a linear way confirm the initial tendency of a publication bias revealed
by the funnel plot The results reveal a negative and significant relationship with the exception of an
insignificant (and still) negative effect when wild-bootstrapped standard errors are used The negative
sign indicates that there might be either a tendency towards reporting low dividend smoothing
coefficients (high speed of adjustment coefficients) However as indicated above the funnel plot points
to the existence of bi-directional publication bias We address this issue through equations (9) and (10)
by considering different impacts of the standard error depending on the magnitude of the estimated
dividend smoothing coefficient The results are in favor of publication biases towards high and low
dividend smoothing effects respectively We find a significant and negative impact of the (squared)
standard error for dividend smoothing coefficients smaller or equal to 05 which is higher in magnitude
than the positive impact of the standard error for dividend smoothing coefficients larger than 05 In
addition the coefficient of the standard error for high dividend smoothing coefficients is significant in
two out of six specifications whereas the coefficient for low dividend smoothing coefficients is
negatively significant in five out of six specifications
28
[Insert Table 3 about here]
As already noted a possible publication bias within subsamples related to countries industries or other
study design characteristics can only be detected by controlling for these factors in a multivariate
MRA Table 3 reports the results of various specifications of the multivariate regression models (8) to
(10) Panel A contains the results based on equation (8) Panel B refers to the results based on equations
(9) and (10) (standard error interacted with dummies for low and high dividend smoothing
coefficients) The base category (captured in the constant) refers to the degree of dividend smoothing
generated by OLS estimations of the classical Lintner model corrected for publication bias and using
pre-1998 data Note that the regression coefficients are to be interpreted accordingly ie a specific
coefficient indicates how the related characteristic addssubtracts dividend smoothing with respect to
this base group In line with the univariate results the results show a negative impact when we account
for the standard error in a linear manner (equation (8)) However the coefficient for the standard error
is not significant when we focus on the WLS estimations of (8)) with study-cluster robust standard
errors as our main results Compared to our univariate analysis we find even stronger support for a bi-
directional publication bias All coefficients for the standard error are statistically significant and have
the expected sign Thus when study design characteristics are considered our results corroborate the
finding towards the presence of publication bias in favor of statistically significant smoothing
coefficients as well as speed of adjustment coefficients (ie low smoothing coefficients)20
Surprisingly the working paper dummy is found to be statistically significant and positive which
20 In unreported robustness checks we use the mean and median of all 979 dividend smoothing coefficients as different
cutoffs to distinguish between studies focusing on high and low dividend smoothing (speed of adjustment) The results
are robust to this specification Results of all robustness checks are available upon request
29
indicates that working papers reports significantly higher dividend smoothing coefficients Rusnak et
al (2013) argue that working papers already take into account the publication process and therefore do
not differ much from published papers with respect to a tendency of reporting significant coefficient
estimates This implies that working papers which are older than 5 years report significantly higher
dividend smoothing coefficients and likely do not suffer from the file drawer problem21
Moreover the multivariate MRA reveals several important findings with respect to the study design
factors affecting the heterogeneity in reported dividend smoothing coefficients As the base category
we use the classical Lintner model (equation 4) estimated using OLS and pre-1998 US data published
in an academic journal The constants of our main results ndashWLS with cluster robust standard errors
reported in column 2 in Panel A and columns 3-4 in Panel Bndash reveal a significant degree of dividend
smoothing for the base category ranging from 0657 to 0678 This degree is in line with Lintner (1956)
who finds a very similar smoothing coefficient of 23 for the US
Several studies (eg Choe 1990 Brav et al 2005 Andres et al 2015) find evidence that the degree of
dividend smoothing has increased in recent years possibly due to the emergence of stock repurchases as
an additional method to disburse temporary earnings If anything our results indicate a slight evidence
for lower dividend smoothing in more recent years (the respective coefficient of the variable capturing
whether the mean sample period is gt1998 is statistically significant in three cases and always
negative)22 We also find no evidence that the length of the analyzed time series impacts the degree of
dividend smoothing (the coefficient has the expected negative sign but is only significant in two 21 The results are robust to an alternative time frame of three years
22 As a robustness check we classify studies as rdquopost-1998ldquo if their sample period begins in 1999 or later The results are
robust to this alternative specification
30
regression models and insignificant in our main regression models with cluster robust standard errors)
In contrast extensions of the classical Lintner model controlling for ownership find significantly higher
dividend smoothing This lends to support of agency conflicts as a primary driver of dividend
smoothing (Leary and Michaely 2011) Agency models as presented by Jensen (1986) and Easterbrook
(1984) underline the importance of dividend smoothing as a disciplining device for managers to raise
external finance from capital markets Our results underline the importance of ownership as moderator
for agency conflicts between managers and shareholders and determinant of dividend smoothing
Whether studies control for size debt or other firm characteristics does not have a significant impact
on resulting dividend smoothing coefficients Moreover we find evidence that modifications of the
classical Lintner model using cash flow instead of earnings measures detect significantly higher
smoothing effects Based on these results firms adjust dividends faster to changes in earnings than to
changes in cash-flows
Our results provide evidence that the use of the econometric technique has a significant impact on
estimated dividend smoothing coefficients We find that the GMM estimator reduces the upward bias
in dividend smoothing that emerges if (8) to (10) are estimated using OLS Similarly using fixed
effects (within) estimation leads to significant lower smoothing coefficients compared to the base
category OLS Note that applying fixed effects estimation to autoregressive processes such as (8) to
(10) leads to a downward biased estimate of dividend smoothing23
23 As the category lsquoother estimatorsrsquo comprises multiple different estimation techniques such as probit logit or random
effects as a robustness check we have excluded all observations related to this category Even after excluding these
observations we do not find significant differences in reported dividend smoothing coefficients across estimation
techniques
31
The presence of dividend smoothing is particularly well documented for firms in the US Several
studies suggest that dividend smoothing is higher in the US than in other countries For instance
Andres et al (2009) document a more flexible dividend payout for German firms whereas Chemmanur
et al (2010) and Dewenter and Warther (1998) document lower dividend smoothing for firms in Hong
Kong and Japan In contrast to this our results do not suggest significant differences in smoothing
effects across different countries In a robustness check we follow a broader classification of countries
by La Porta et al (1998 2000) La Porta et al (1998 2000) relate investor protection financing
conditions and payout policy to the legal origin of countries and distinguish between common law and
civil law counties Using this classification we find lower dividend smoothing for Scandinavian civil
law countries relative to German civil law French civil law and common law countries However we
do not find systematic differences in dividend smoothing between common and civil law countries or
within common law countries such as the UK and the US Overall our results lend support to dividend
smoothing as a global rather than country-specific phenomenon
Finally the results do not reveal that studies with a focus on firms that operate in the service and
consumer goods sector generate significantly different dividend smoothing coefficients while
significant higher dividend smoothing effects can be detected for firms operating in the financial
sector24 Variance Inflation Factors indicate that multicollinearity among the set of explanatory
variables (x) is not present Model diagnostics reveal the overall significance of our specifications and
24 As firms from the financial sector are subject to different regulatory requirements we consider only those studies that
explicitly exclude firms from the financial sector in a robustness check Based on the remaining 29 studies with 397
observations we do not find significant differences in the drivers dividend smoothing coefficients relative to the whole
sample
32
adjusted R2 values amount to 478 up to 608 The fact that R2 is significantly higher for the
specifications that consider bi-directional publication bias ((9) and (10)) compared to equation (8)
reveals the superiority of the former specifications
As our study design controls for many different factors that may have an impact on the reported
dividend smoothing parameter and theory provides us with little guidance on the factors that should be
included in a meta-regression analysis we also investigate the main drivers of the dividend smoothing
parameters by Bayesian model averaging (BMA) (Raftery et al 1997) BMA provides averages for
posterior mean values and standard errors after running all combinations of a predefined set of
explanatory variables (in our case 220 combinations) We follow the procedure in Zigraiova and
Havranek (2016) and run a reduced model using all variables with a posterior inclusion probability
larger than 05 identified by BMA as explanatory variables The results reported in Table A2 of the
appendix corroborate our earlier findings and identify the choice of the earnings measure the
econometric technique used as well as the publication status as the main drivers of the heterogeneity of
reported dividend smoothing coefficients
Finally to assess the robustness of the results with respect to the weighting strategy used and the
handling of extreme values we estimated several further model specifications First we followed
Zigraiova and Havranek (2016) and present results from specifications weighted by the inverse of the
number of estimates reported per study This gives the same importance to each study in the estimation
by mitigating the effect of articles contributing a large number of coefficients Second for the whole
sample (without exclusion of unreasonable values using the bacon algorithm) we estimate robust 05-
quantile (median) regressions The results are reported in Tables A3 and A4 and undermine our main
findings regarding the direction of publication bias and the importance of the econometric estimator
33
applied There are some differences that are mainly related to the variables capturing the analyzed
country or industry for which the robustness checks tend to produce a higher number of significant
results However these variables have not been identified as explanatory variables with a high PIP in
the BMA and thus do not alter our conclusions regarding the main drivers of reported dividend
smoothing coefficients
5 Conclusion
Our MRA sheds light on the reasons for heterogeneous results reported in the empirical literature on
dividend smoothing using a large set of 99 empirical studies and 979 dividend smoothing coefficients
that relate to different time periods countries industries and econometric methods The MRA reveals
that the variability in reported smoothing coefficients is driven by publication bias towards high
dividend smoothing or high speed of adjustment coefficients We find that peer-reviewed publications
based on an OLS estimation of the classical Lintner model corrected for publication bias and using
pre-1998 US data report on average a significant degree of dividend smoothing ranging from 0657 to
0678
Analyzing post-1998 data does not reveal higher dividend smoothing in more recent years This is in
line with the findings of Leary and Michaely (2011) for the US who find that stock repurchases as an
additional payout channel in recent years cannot explain the heterogeneity in reported dividend
smoothing coefficients However we detect a large number of other factors that explain the variability
in dividend smoothing coefficients Our results suggest that accounting for ownership structure among
the set of control variables is important when explaining different degrees of dividend smoothing We
find that the inclusion of ownership characteristics significantly increases estimated smoothing
34
coefficients Moreover we find significant differences in results across the estimation techniques used
Studies using GMM estimation techniques or fixed effects estimators find a considerably lower degree
of dividend smoothing (-0219 and -0205) compared to studies employing OLS estimators Differences
in dividend smoothing do not seem to be driven by the country
Overall the results of our MRA provide a summarizing picture of the large amount of literature on
dividend smoothing and allow to derive average smoothing effects for different regions sectors time
periods or estimation techniques Under the assumption that lsquobest practicersquo in dividend smoothing
estimation requires the inclusion of all relevant firm specific control variables and the GMM estimation
technique our MRA predicts (using earnings as profit measure) average smoothing effects of 0536 for
firms that do not operate in the financial sector
The MRA results provide important insights for future research on this topic Dividend smoothing
estimates differ significantly depending on the inclusion of ownership as a driver of estimated dividend
smoothing effects Researchers should therefore consider the inclusion of ownership characteristics
when estimating dividend smoothing In case ownership characteristics are not available due to data
limitations researchers should discuss the consequences of the corresponding omitted variable bias
Our results provide support for significant differences in reported dividend smoothing effects for
different estimation techniques As the upward (downward) bias of the OLS (fixed effects) estimator is
well-known for AR(1)-type regressions in future studies researchers should carefully consider the
choice of the estimation technique In line with previous literature future research should interpret
results under careful consideration of the specifics of the analyzed industries Based on our analysis it
is of particular relevance whether the study focuses on non-financial firms only
35
Previous studies consider dividend smoothing as a general phenomenon that has increased in recent
years In contrast to this prevailing opinion our MRA does not provide evidence for a general recent
trend of higher dividend smoothing Thus analyzing the development of dividend smoothing over time
and under consideration of different country settings might be a fruitful area for future research (Farre-
Mensa et al 2014) In general future research should consider the fact that study design characteristics
can have an important impact on dividend smoothing effects and the results should hence be interpreted
accordingly
Our results are also important from an investor perspective Whereas Leary and Michaely (2011) find
evidence that dividend smoothing is used to cope with free-cash flow problems dividend smoothing
might be an agency problem in itself (Lambrecht and Myers 2012) Depending on the two different
views our results based on dividend smoothing allow investors to assess the severity of agency
conflicts that they can expect depending on the industry they would like to invest in Thus investors
should take into account that study design characteristics have an important impact on the resulting
dividend smoothing effects and should build their expectation regarding returns accordingly
36
References
Abdullah NMH Ahmad Z Roslan S (2012) The Influence of Ownership Structure on the Firms
Dividend Policy Based Lintner Model International Review of Business Research Papers 8(6) 71-88
Adelegan O (2003) An Empirical Analysis of the Relationship between Cash Flow and Dividend
Changes in Nigeria RampD Management 15(1) 35-49 Ahmed H Javid AY (2008) Dynamics and determinants of dividend policy in Pakistan (evidence
from Karachi stock exchange non-financial listed firms) MPRA Paper No 37342 Ahmed H Javid AY (2009) Dynamics and Determinants of Dividend Policy in Pakistan (Evidence
from Karachi Stock Exchange Non-Financial Listed Firms) International Research Journal of Finance and Economics 25(3) 148-171
Aivazian VA Booth L Cleary S (2006) Dividend Smoothing and Debt Ratings Journal of
Financial and Quantitative Analysis 41(2) 439-453 Al-Ajmi J (2010) Modelling the dividend policy of banks in Gulf Cooperation Council countries
Applied Economics Letters 17(14) 1423-1428 Al-attar AM Al-Shattarat HK Yusuf AN (2015) The effects of contextual factors on
disaggregated earnings in explaining dividend changes in Jordanian firms International Journal of Commerce and Management 25(2) 218-239
Allen F Bernardo A Welch I (2000) A theory of dividends based on tax clientele Journal of
Finance 55(6) 2499-2536 Al-Malkawi H-A Bhatt M I Magableh S (2014) On the dividend smoothing signaling and the
global financial crisis Economic Modelling 42 159-165 Al-Najjar B (2009) Dividend behaviour and smoothing new evidence from Jordanian panel data
Studies in Economics and Finance 26(3) 182-197 Al-Najjar B Belghitar Y (2012) The information content of cash flows Economic Issues 17(2) 57-
70 Al-Yahyaee KH Pham TM Walter TS (2010) Dividend stability in a unique environment
Managerial Finance 36(10) 903-916 Al-Yahyaee KH Pham TM Walter TS (2011) Dividend smoothing when firms distribute most
of their earnings as dividends Applied Financial Economics 21(16) 1175-1183
37
Alzahrani M Lasfer M (2009) The Impact of Taxation on Dividends A Cross-Country Analysis
Working paper King Fahd University of Petroleum amp Minerals Dhahran Ameer R (2007) Dividend Payout of the Property Firms in Malaysia Pacific Rim Property Research
Journal 13(4) 451-472 Ameer R (2008) Product market competition regulation and dividend payout policy of Malaysian
Banks Journal of Financial Regulation and Compliance 16(4) 318-334 Andres C Betzer A Goergen M Renneboog L (2009) Dividend policy of German firms A panel
data analysis of partial adjustment models Journal of Empirical Finance 16(2) 175-187 Andres C Betzer A van den Bongard I Goergen M (2014) Dividend Policy Corporate Control
and the Tax Status of the Controlling Shareholder Working paper Schumpeter School of Business and Economics Bergische Universitaumlt Wuppertal
Andres C Doumet M Fernau E Theissen E (2015) The Lintner model revisited Dividends
versus total payouts Journal of Banking and Finance 55 56-69 Arellano M Bond S (1991) Some tests of specification for panel data Monte Carlo evidence and an
application to employment equations Review of Economic Studies 58 (2) 277-297 Arellano M Bover O (1995) Another look at the instrumental variable estimation of error-
components models Journal of Econometrics 68 29ndash51 Arko AC Abor J Adjasi CKD Amidu M (2014) What influence dividend decisions of firms in
Sub-Saharan African Journal of Accounting in Emerging Economies 4(1) 57-78 Athari SA Adaoglu C Bektas E (2016) Investor protection and dividend policy The case of
Islamic and conventional banks Emerging Markets Review 27 100-117 Baba N Ueno Y (2008) Are stock repurchases more flexible than dividends The case of Japanese
firms Applied Financial Economics Letters 4(5) 315-318 Baiyao Z (2011) Dividend Policy in Mainland China and USA Bachelor thesis Hong Kong Baptist
University Baker HK Chang B Dutta S Saadi S (2013) Canadian corporate payout policy International
Journal of Managerial Finance 9(3) 164-184 Bakucs Z Falkowski J Fertouml I (2014) Does Market Structure Influence Price Transmission in the
Agro-food Sector A Meta-analysis Perspective Journal of Agricultural Economics 65(1) 1-25
38
Baltagi BH (2008) Econometric Analysis of Panel Data Chichester UK John Wiley amp Sons Bawa KS Kaur P (2012) Empirical validity of Dividend Policy Models in The Indian
Manufacturing MSMEs International Journal of Multidisciplinary Management Studies 2(1) 18-39 Banks S Cheffins B Goergen M (2009) Dividends and politics European Journal of Political
Economy 25(2) 208-224 Behm U Zimmermann H (1993) The empirical relationship between dividends and earnings in
Germany Zeitschrift fuumlr Wirtschafts- und Sozialwissenschaften 113(2) 225-254 Benavides J Berggrun L Perafan H (2016) Dividend payout policies Evidence from Latin
America Finance Research Letters 17 197-210 Benhamouda Z (2007) UK corporate share repurchases an empirical analysis of corporate motives
and payout policies Durham theses Durham University Available at Durham E-Theses Online httpethesesduracuk2137
Benzinho J (2004) The dividend policy of the Portuguese corporations Evidence from Euronext
Lisbon Working paper ISCAC Coimbra Business School Bhattarchya S (1979) Imperfect Information Dividend Policy and The Bird in the Hand Fallacy
The Bell Journal of Economics 10(1) 259-270 Billor N Hadi AS Velleman PF (2000) BACON blocked adaptive computationally efficient
outlier nominators Computational Statistics amp Data Analysis 34 279-298 Blundell R Bond S (1998) Initial conditions and moment restrictionsin dynamic panel data models
Journal of Econometrics 87 115-143 Bodla BS Pal K Sura JS (2007) Examining Application of Lintners Dividend Model in Indian
Banking Industry ICFAI Journal of Bank Management 6(4) 40-59 Bom PRD Ligthart JE (2009) How productive is public capital A meta-regression analysis
Working Paper 09-12 International Studies Program Georgia State University Boţoc C Pirtea M (2014) Dividend Payout-Policy Drivers Evidence from Emerging Countries
Emerging Markets Finance and Trade 50(4) 95-112 Brav A Graham JR Harvey CR Michaely R (2005) Payout policy in the 21st century Journal
of Financial Economics 77(3) 483-527 Bremberger F Cambini C Gugler K Rondi L (2016) Dividend Policy in Regulated Network
Industries Evidence from the EU Economic Inquiry 54(1) 408ndash432
39
Brittain JA (1964) The Tax Structure and Corporate Dividend Policy American Economic Review
54(3) 272-287 Cameron AC Gelbach JB Miller DL (2008) Bootstrap-based Improvements for Inference with
Clustered Errors Review of Economics and Statistics 90(3) 414-427 Card D Krueger AB (1995) Time-Series Minimum-Wage Studies A Meta-Analysis American
Economic Review 85(2) 238-243 Card D Kluve J Weber A (2010) Active Labour Market Policy Evaluations A Meta- Analysis
Economic Journal 120 (548) 452-477 Chan KF Powell JG Shi J Smith T (2016) Dividend persistence and dividend behavior
Accounting and Finance doi 101111acfi12208 Chemmanur TJ He J Hu G Liu YH (2010) Is dividend smoothing universal New insights
from a comparative study of dividend policies in Hong Kong and the US Journal of Corporate Finance 16(4) 413-430
Chen X Sinha A K (2016) Large Shareholders and Dividends Game Theoretic Analysis of
Shareholder Power Working paper California State University Bradley University Choe H (1990) Intertemporal and Cross-sectional Variation of Corporate Dividend Policy PhD
Dissertation University of Chicago Correia da Silva L Goergen M Renneboog L Dividend policy of German firms A dynamic panel
data analysis of partial adjustment models Working paper Cardiff University Oxford Economic Research Associates Tilburg University
Dai Q (2007) Influence of a Tax Reform on Dividend Clienteles Working paper Binghamton
University Darling PG (1957) The Influence of Expectations and Liquidity on Dividend Policy Journal of
Political Economy 65(3) 209-224 DeAngelo H De Angelo L Skinner D (2004) Are dividends disappearing Dividend concentration
and the consolidation of earnings Journal of Financial Economics 72(3) 425-456 DeAngelo H De Angelo L Skinner D (2008) Corporate Payout Policy Foundations and Trends in
Finance 3(2-3) 95-287
40
DeAngelo H DeAngelo L (2000) Controlling stockholders and the disciplinary role of corporate payout policy - a study of the Times Mirror company Journal of Financial Economics 56(2) 153-207
Demena BA van Bergeijk PAG (2017) A Meta-Analysis of FDI and Productivity Spillovers in
Developing Countries Journal of Economic Surveys 31(2) 546-571 DerSimonian R Laird N (1986) Meta-analysis in clinical trials Controlled Clinical Trials 7(3) 177-
188 Desai MA Foley CF Hines Jr JR (2001) Repatriation Taxes and Dividend Distortions National
Tax Journal 54(4) 829-851 Dewenter KL Warther VA (1998) Dividends Asymmetric Information and Agency Conflicts
Evidence from a Comparison of the Dividend Policies of Japanese and US Firms Journal of Finance 53(3) 879ndash904
Dharan BG (1988) The Association between Corporate Dividends and Current Cost Disclosure
Journal of Business Finance amp Accounting 15(2) 215-230 Doucouliagos H Laroche P Stanley TD (2005) Publication Bias in Union-Productivity Research
Relations industrielles Industrial Relations 60(2) 320-347 Easterbrook FH (1984) Two Agency-Cost Explanations of Dividends American Economic Review
74(4) 650-659 Esteban JMD Peacuterez OLdF (2001) Dividend Policy of European Banks Working paper
Universidad de Burgos Fama EF (1974) The Empirical Relationships between the Dividend and Investment Decisions of
Firms American Economic Review 64(3) 304-318 Fama EF Babiak H (1968) Dividend Policy An Empirical Analysis Journal of the American
Statistical Association 63(324) 1132-1161 Farre-Mensa J Michaely R Schmalz M (2014) Payout Policy Annual Review of Financial
Economics 6 75-134 Feld LP Heckemeyer JH Overesch M (2013) Capital structure choice and company taxation A
meta-study Journal of Banking amp Finance 37(8) 2850ndash2866 Feldstein MS (1970) Corporate Taxation and Dividend Behaviour Review of Economic Studies
37(1) 57-72
41
Foerster SR Sapp SG (2006) The changing role of dividends a firm-level study from the nineteenth to the twenty-first Century Canadian Journal of Economics 39(4) 1316-1344
Garrett I Priestley R (2000) Dividend Behavior and Dividend Signaling Journal of Financial and
Quantitative Analysis 35(2) 173-189 Goncharov I Triest S v (2011) Do fair value adjustments influence dividend policy Accounting
and Business Research 41(1) 51-68 Grullon G Michaely R (2002) Dividends Share Repurchases and the Substitution Hypothesis
Journal of Finance 57(4) 1649-1684 Gugler K (2003) Corporate governance dividend payout policy and the interrelation between
dividends RampD and capital investment Journal of Banking and Finance 27 1297-1321 Gugler K Yurtoglu BB (2003) Corporate governance and dividend payout policy in Germany
European Economic Review 47(4) 731-758 Gunathilaka C (2014) What Drives the Payout Policy Evidence from Sri Lanka A Dynamic Panel
Data Analysis Wayamba Journal of Management 3(2) 1-16 Haddad AE Al Shattarat WK Al-Hamadeen RM (2008) Partial-Adjustment-Models of Dividend
Policy Behaviour for Industrial Jordanian Firms Corporate Ownership amp Control 5(4) 356-372 Haleem F Javid AY (2011) Modeling Dividend Behavior in Pakistan Information Management
and Business Review 3(6) 289-301 Hayunga DK Stephens CP (2009) Dividend behaviour of US equity REITs Journal of Property
26(2) 105-123 Hines Jr JR Desai MH Foley CF (2007) Dividend Policy Inside the Multinational Firm
Financial Management 36(1) 5-26 Hines JR Jr (1996) Dividends and Profits - Some Unsubtle Foreign Influences Journal of Finance
51(2) 661-689 Hirsch S (2018) Successful in the long run A meta-regression analysis of persistent firm profits
Journal of Economic Surveys 32(1) 23-49 Hsiao C (1986) Analysis of Panel Data Cambridge University Press Cambridge Hussain J (2011) Corporate dividends decisions evidence from Saudi Arabia Journal of Risk
Finance 12(1) 41-56
42
Hutagalung S Yahya MH Kamarudin F Osman Z (2013) The Dividend Payout Policy ndash A Study on Malaysian Financial Institutions Pertanika J Soc Sci amp Hum 21(S) 127-148
Jagannathan M Stephens CP Weisbach M (2000) Financial flexibility and the choice between
dividends and stock repurchases Journal of Financial Economics 57(3) 355-384 Jarrell SB Stanley TD (1990) A Meta-Analysis of the Union-Nonunion Wage Gap Industrial amp
Labor Relations Review 44 54-67 Jensen MC (1986) Agency Costs of Free Cash Flow Corporate Finance and Takeovers American
Economic Review 76(2) 323-329 Kamat MS Kamat MM (2012) An Application of Partial Adjustment Equation in Determining
Payout Behavior using an Extended Instrumental Variable Approach Working paper VVMs Shree Damodar College Goa University
Kamat MS Kamat MM (2013) Economic reforms determinants and stability of dividends in a
dynamic setting Journal of Asia Business Studies 7(1) 5-30 Kanoja S Bhatia BS (2013) Dividend Decisions and Payout Policy An Empirical Analysis of
Listed Indian Companies Working paper University of Delhi Karathanassis GA Chrysanthopoulou ECh (2005) The relationship Between Ownership Structure
and Corporate Dividend Policy ndash Evidence from the Athens Stock Exchange Working paper Athens University of Economics and Business
Khan T (2006) Company Dividends and Ownership Structure Evidence from UK Panel Data The Economic Journal 116(510) C172-C189 Kim J Jeon Y (2015) Dividend Policy and Corporate Social Responsibility A Comparative
Analysis of Multinational Enterprise Subsidiaries and Domestic Firms in Korea Emerging Markets Finance and Trade 51(2) 306-319
Kinfe T (2011) Determinants of Dividend payout An Empirical Study on Bank Industry in Ethiopia
Master thesis Addis Ababa University School of Business and Public Administration Department of Accounting and Finance School of Graduate Studies
Korkeamaki T Liljeblom E Pasternack D (2010) Tax reform and payout policy Do shareholder
clienteles or payout policy adjust Journal of Corporate Finance 16(4) 572-587 Kumar J (2003) Ownership Structure and Dividend Payout Policy in India Working paper Indira
Gandhi Institute of Development Research
43
Kumar R Kumar Jha P (2012) Determinants of Corporate Dividend Policy in India - A Study of Listed IT Companies at BSE Working paper Faculty of Management Studies BHU
La Porta R Lopez-de-Silanes F Shleifer A Vishny RW (1998) Law and Finance Journal of
Political Economy 106(6) 1133-1155 La Porta R Lopez-de-Silanes F Shleifer A Vishny RW (2000) Agency Problems and Dividend
Policies around the World Journal of Finance 55(1) 1-33 Lambrecht BM Myers S C (2012) A Lintner model of payouts and managerial rents Journal of
Finance 67(5) 1761ndash1810 Leary MT Michaely R (2011) Determinants of Dividend Smoothing Empirical Evidence Review
of Financial Studies 24(10) 3197-3249 Lintner J (1956) Distribution of incomes of corporations among dividends retained earnings and
taxes American Economic Review 46(2) 97-113 Longhi S Nijkamp P Poot J (2005) A Meta-Analysis Assessment of the Effect of Immigartion on
Wages Journal of Economic Surveys 19(3) 451-477 Manconi A Peyer U Vermaelen T (2017) Are Buybacks Good for Long-Term Shareholder Value
Evidence from Buybacks around the World European Corporate Governance Institute (ECGI) - Finance Working Paper No 4362014 INSEAD Working Paper No 2013101FIN
McDonald JG Jacquillat B Nussenbaum M (1975) Dividend Investment and Financing
Decisions Empirical Evidence on French Firms Journal of Financial and Quantitative Analysis 10(5) 741-755
McDonald R Soderstrom N (1986) Dividend and Share Changes Is There a Financing Hierarchy
NBER working paper series Working Paper No 2029 MacKinnon JG Webb MD (2017) Wild Bootstrap Inference for Wildly Different Cluster Sizes
Journal of Applied Econometrics 32(2) 233-254 Michaely R Roberts MR (2012) Corporate Dividend Policies Lessons from Private Firms Review
of Financial Studies 25(3) 711-746 Miller MH Rock K (1985) Dividend Policy under Asymmetric Information Journal of Finance
40(4) 1031-1051 Miller M Scholes M (1978) Dividends and Taxes Journal of Financial Economics 6(4) 333-364
44
Modigliani F Miller M (1958) The Cost of Capital Corporation Finance and the Theory of Investment American Economic Review 48(3) 261ndash297
Mohsin HM Ashraf MS (2011) Monetary policy restriction and dividend behavior of Pakistani
firms an empirical analysis MPRA Paper No 34052 Mollah Sabur A (2009) Testing Partial Adjustment Dividend Behavioral Models in Emerging
Markets Evidence from Pre and Post Market Reforms in Bangladesh Global Journal of Business Research 3(1) 1-14
Mookerjee R (1992) An empirical investigation of corporate dividend pay-out behaviour in an
emerging market Applied Financial Economics 2(4) 243-246 Mueller DC (1967) The Firm Decision Process An Econometric Investigation The Quarterly
Journal of Economics 81(1) 58-87 Naceur S Goaied M Belanes A (2006) On the Determinants and Dynamics of Dividend Policy
International Review of Finance 6(1-2) 1-23 Naceur S Goaied M Belanes A (2016) A Re-examination of Dividend Policy A Dynamic Panel
Data Analysis Working paper ESSEC Tunis IHEC Carthage Nakamura A (1985) Rational Expectations and the Firms Dividend Behavior Review of Economics
and Statistics 67(4) 606-615 Nakamura M (1989) Asymmetry in the Dividend Behavior of US and Japanese Firms Managerial
and Decision Economics 10(4) 261-274 Nelson JP Kennedy PE (2009) The Use (and Abuse) of Meta-Analysis in Environmental and
Natural Resource Economics An Assessment Environmental and Resource Economics 42(3) 345-377
Nickell S (1981) Biases in Dynamic Models with Fixed Effects Econometrica 49(6) 1417-1426
Oczkowski E Doucouliagos H (2014) Wine Prices and Quality Ratings a Meta-Regression Analysis American Journal of Agricultural Economics 97(1) 103-121
Omet G (2004) Dividend Policy Behaviour in the Jordanian Capital Market International Journal of
Business 9(3) 287-300 Pal K Goyal P (2007) Leading Determinants of Dividend Policy A Case Study of the Indian
Banking Industry Decision 34(2) 88-112
45
Pandey IM Bhat R (2007) Dividend behavior of Indian companies under monetary policy Managerial Finance 33(1) 14-25
Pandey IM (2003) Corporate Dividend Policy and Behaviour The Malaysian Evidence Asian
Academy of Management Journal 8(1) 17ndash32 Perez-Gonzalez F (2003) Large Shareholders and Dividends Evidence from US Tax Reforms
Working paper Columbia University Persson R (2013) Dividend policy behavior An analysis of firms listed at Stockholm Stock
Exchange Bachelor thesis Uppsala University Department of Economics EKONOMIKUM - Centre for Economic Sciences
Pindado J Requejo I Torre C de la (2012) Do Family Firms Use Dividend Policy as a Governance
Mechanism Evidence from the Euro zone Corporate Governance An International Review 20(5) 413-431
Post C Byron K (2015) Women on boards and firm financial performance A meta-analysis
Academy of Management Journal 58(5) 1546-1571 Powell JG Shi J Smith T (2004) Dividend persistence and return predictability Working paper
School of Finance and Applied Statistics Faculty of Economics and Commerce The Australian National University Canberra
Raftery AE Madigan D Hoeting JA (1997) Bayesian model averaging for linear regression
models Journal of the American Statistical Association 92 179ndash191 Rahman N (2002) Ownership structure and dividend smoothing cross-country evidence Working
paper University of Chicago Graduate School of Business Raza S H Zahaar M Hafeez M (2009) The Ownership Structure and Dividend Payout Policy in
Pakistan Evidence from KSE-100 index Non-financial Firms Pakistan Journal of Education 26(1) 173-188
Renneboog L Szilagyi PG (2015) How Relevant is Dividend Policy under Low Shareholder
Protection Journal of International Financial Markets Institutions and Money Advance online publication DOI 101016jintfin201501006
Renneboog L Trojanowski G (2007) Control structures and payout policy Managerial Finance
27(3) 180-194 Rusnak M Havranek T Horvath R (2013) How to Solve the Price Puzzle A Meta‐Analysis
Journal of Money Credit and Banking 45(1) 37-70
46
Sembenelli A (1993) Signalling Financial Hierarchy and Agency Theory as Explanations for Dividend Behavior Evidence from Italian Firm Data Managerial and Decision 14(1) 37-45
Shinozaki S Uchida K (2015) Ownership structure and dividend smoothing International evidence
Working paper Faculty of Economics Kyushu University Short H Zhang H Keasey K (2002) The link between dividend policy and institutional ownership
Journal of Corporate Finance 8(2) 105-122 Simegen M (2013) Determinants of Dividend Policy of Banks in Ethiopia Master thesis Addis
Ababa University College of Accounting and Finance School of Graduate Studies Skinner D (2008) The evolving relation between earnings dividends and stock repurchases Journal
of Financial Economics 87(3) 582-609 Stanley TD (2001) Wheat from Chaff Meta-Analysis as Quantitative Literature Review Journal of
Economic Perspectives 15(3) 131-150 Stanley TD (2005) Beyond Publication Bias Journal of Economic Surveys 19(3) 309-345 Stanley TD (2008) Meta-Regression Methods for Detecting and Estimating Empirical Effects in the
Presence of Publication Selection Oxford Bulletin of Economics and Statistics 70(1) 103-127 Stanley TD Doucouliagos H (2010) Picture This A Simple Graph That Reveals Much Ado About
Research Journal of Economic Surveys 24(1) 170-191 Stanley TD Doucouliagos H (2012) Meta-regression Analysis in Economics and Business Oxford
UK Routledge Stanley TD Doucouliagos H (2013) Better than Random Weighted Least Squares Meta
Regression Analysis University of Australia School of Accounting Economics and Finance Economics Series Working Paper SWP 20132
Stanley TD Doucouliagos H (2015) Neither fixed nor random weighted least squares meta-
analysis Statistics in Medicine 34 2116-2127 Stanley TD Jarrell B (1989) Meta-Regression Analysis A Quantitative Method of Literature
Journal of Economic Surveys 3(2) 161-170 Stanley TD Doucouliagos H Giles M Heckemeyer JH Johnston RJ Laroche P Nelson JP
Paldam M Poot J Pugh G Rosenberger RS Rost K (2013) Meta-Analysis of Economics Research Reporting Guidelines Journal of Economic Surveys 27(2) 390-394
47
Sudhahar M Saroja T (2010) Determinants of Dividend Policy in Indian Banks An Empirical Analysis Journal of Bank Management 9(3) 63-75
Sura JS Pal K Bodla BS (2006) Factors Influencing Dividend Policy Decisions in Banking
Sector An Indian Evidence Amity Business Review 7(2) 64-75 Tran QT Nguyen TTH (2014) Dividend Policy Behavior in Emerging Stock Markets Evidence
from Vietnamese Stock Market International Journal of Financial Research 5(4) 85-89 Trojanowski G (2004) Ownership structure and payout policy in the UK Working paper University of Exeter Business School Trotman KT Wood R (1991) A Meta-Analysis of Studies on Internal Control Judgements Journal
of Accounting Research 29(1) 180-192 Turnovsky SJ (1967) The Allocation of Corporate Profits between Dividends and Retained Earnings
Review of Economics and Statistics 49(4) 583-589 Valickova P Havranek T Horvath R (2015) Financial Development and Economic Growth A
Meta-Analysis Journal of Economic Surveys 29(3) 506-526 Vasiliou D Eriotis N (2002) The Determinants of Dividend policy some Greek data European
Journal of Management and Public Policy 1(2) 46-56 Wang K Shailer G (2015) Ownership concentration and firm performance in emerging markets a
meta-analysis Journal of Economic Surveys 29(2) 199-229 Wang X Manry D Wandler S (2011) The impact of government ownership on dividend policy in
China Advances in Accounting incorporating Advances in International Accounting 27(2) 366-372
Watts R (1973) The Information Content of Dividends Journal of Business 46(2) 191-211 Weber S (2010) bacon An effective way to detect outliers in multivariate data using Stata (and
Mata) The Stata Journal 10(3) 331-338 Younis D Javid AY (2014) Market Imperfections and Dividend Policy Decisions of Manufacturing
Sector of Pakistan PIDE Working Papers 201499 Zameer H Rasool S Iqbal S Arshad U (2013) Determinants of Dividend Policy A Case of
Banking Sector in Pakistan Middle-East Journal of Scientific Research 18(3) 410-424 Zigraiova D Havranek T (2016) Bank Competition and Financial Stability Much Ado about
Nothing Journal of Economic Surveys 30(5) 944-981
48
Tables and Figures
Figure 1 Funnel plot for the dividend smoothing coefficients
Note The dividend smoothing is measured on the x-axis while the y-axis represents precision calculated as the inverse
standard error The vertical line at 0728 indicates the ldquotruerdquo dividend smoothing as the mean of the 10 most precise
smoothing coefficients
49
Table 1 Summary statistics of meta data
Variable label Definition Mean Standard deviation
Dependent Variable
Dividend smoothing (d)
Dividend smoothing coefficient 0562 0325
Precision
Standard error (se)
Standard error of the dividend smoothing coefficient 0093 0102
Study design characteristics
Working Paper The study is a working paper older than 5 years = 1 0 otherwise
0112 0316
Post 1998 The mean year of estimation period gt1998 = 1 0 otherwise 0470 0499 No of years Length of the analyzed time series dimension 12526 11524 Debt Ownership Size Other Lintner classical
Estimation controls for firm debt = 1 0 otherwise Estimation controls for ownership = 1 0 otherwise Estimation controls for firm size =1 0 otherwise Estimation controls for other firm factors =1 0 otherwise Estimation does not include variables in addition to contemporaneous earnings and lagged dividends as independent variables =1 0 otherwise
0104 0166 0139 0419 0420
0306 0373 0346 0494 0494
Cash flow The estimation uses a cash flow measure =1 0 if earnings measure
0113 0317
OLS The estimation is based on OLS =1 0 otherwise 0553 0497
GMM The estimation is based on GMM=1 0 otherwise 0147 0354
Fixed effects The estimation is based on fixed effects = 1 0 otherwise 0157 0364 Other estimators The estimation is based on other methods = 1 0 otherwise 0143 0350 Service and Consumer Goods Financial firms Industry firms
Study analyzes serviceconsumer goods firms =1 0 otherwise Study analyzes financial firms =1 0 otherwise Study analyzes industry sector firms =1 0 otherwise
0015
0150 0061
0123
0357 0240
EU Developing US UK Other countries
Study analyzes a country or several countries from the EU =1 0 otherwise
Study analyzes a developing country or several developing countries =1 0 otherwise Study analyzes the US =1 0 otherwise Study analyzes the UK =1 0 otherwise Study focuses on other countries =1 0 otherwise
0174
0344
0114 0083 0277
0379
0475
0318 0276 0447
Note We use the following reference categories in the MRA classical Lintner model for pre 1998 US data estimated with OLS
50
Table 2 WLS FAT-PET meta-regression analysis results
Variable Robust se
(1)
Robust se
(2)
Robust se
(3)
Study cluster
robust se (4)
Study cluster
robust se (5)
Study cluster
robust se (6)
Wild bootstrap
se clustered by study
(7)
Wild bootstrap
se clustered by study
(8)
Wild bootstrap
se clustered by study
(9)
Constant 0755 (2035)
0732 (2147)
0707 (2481)
0755 (712)
0732 (760)
0707 (777)
0755 [0000]
0732 [0000]
0707 [0000]
SE -3613 (-482) - -3613
(-200) -3613 [0216] -
SE (smoothingle05) -1130 (-1724) -1130
(-481) -1130 [0002]
SE (smoothinggt05) 2526 (264) 2526
(148) 2526 [0246]
SEsup2 (smoothingle05) - -17412 (-385) - -17412
(-261) - -17412 [0148]
SEsup2(smoothinggt05) 4746 (237) 4746
(087) 4746 [0596]
F 2327 2273 1270 398 2273 558 p(F) 0000 0000 0000 0049 0000 0005 R2 0043 0284 0018 0042 0284 0018 0043 0284 0018 Adj R2 0042 0283 0016 Observations 979 979 979 979 979 979 978 978 978
Notes Dependent variable is dividend smoothing coefficient t-values in parentheses p values in brackets significance at the 1
5 10 level Squared standard errors of adjustment coefficients are used as weights
51
Table 3 WLS estimation results of models (8) (9) and (10)
Panel A
Variable
Robust se
(1)
Cluster robust se by study
(2)
Wild bootstrap se clustered by
study (3)
Constant
0678 (823)
0678 (414)
0678 [0072]
se
-1536 (-244)
-1536 (-162)
-1536 [0172]
Working paper 0157 (220)
0157 (193)
0157 [0284]
Post 1998
-0085 (-165)
-0085 (-129)
-0085 [-0372]
No of years
-0004 (-160)
-0004 (-092)
-0004 [0594]
Debt
-0035 (-039)
-0035 (-035)
-0035 [-0830]
Ownership
0077 (245)
0077 (206)
0077 [0000]
Size
0025 (0037)
0025 (0024)
0025 [0868]
Other
0024 (083)
0024 (072)
0024 [0484]
Cash Flow
0371 (548)
0371 (367)
0371 [0010]
GMM
-0219 (-319)
-0219 (-232)
-0219 [0078]
Fixed effects
-0205 (-322)
-0205 (-275)
-0205 [0036]
Other estimators -0083 (-106)
-0083 (-089)
-0083 [0610]
Service amp consumer goods -0381 (-160)
-0381 (-154)
-0381 [0452]
Financial firms
0250 (285)
0250 (249)
0250 [0052]
Industry firms
0078 (109)
0078 (097)
0078 [0422]
EU
-0092 (-113)
-0092 (-060)
-0092 [-0696]
Developing
0050 (064)
0050 (041)
0050 [0786]
UK
0058 (066)
0058 (043)
0058 [0722]
Other countries 0086 (095)
0086 (068)
0086 [0714]
F 7502 1977 1977 p(F) 0000 0000 Rsup2 0473 0473 0473 Adj Rsup2 0462
Observations 979 979 979 Notes All variables are as defined as in table 1 Dependent variable is dividend smoothing coefficient This panel contains specifications with the standard error of the estimated dividend smoothing as independent variable In Panel B the (squared) standard error is interacted with a dummy variable equal to 1 for dividend smoothing coefficients higher or lower or equal than 05 respectively t-values in parentheses p values in brackets significance at the 1 5 10 level Squared standard errors of adjustment coefficients are used as weights Reference category classical Lintner model for pre 1998 US data estimated with OLS
52
Panel B
Variable
Robust se
(1)
Robust se
(2)
Cluster
robust se by study
(3)
Cluster
robust se by study
(4)
Wild bootstrap se clustered by
study (5)
Wild bootstrap se clustered by
study (6)
Constant
0675 (925)
0657 (812)
0675 (478)
0657 (400)
0675 [0042]
0657 [0072]
SE (smoothingle05)
-7499 (-1307)
-7499 (-673)
-7499 [0002]
SE (smoothinggt05) 3591 (375)
3591 (257)
3591 [0004]
SEsup2 (smoothingle05) -11997 (-382)
-11997 (-344)
-11997 [0086]
SEsup2(smoothinggt05) 8195 (384)
8195 (246)
8195 [0022]
Working paper 0160 (270)
0161 (235)
0160 (245)
0161 (203)
0160 [0164]
0161 [0276]
Post 1998
-0081 (-191)
-0094 (-185)
-0081 (-151)
-0094 (-142)
-0081 [0258]
-0094 [0344]
No of years
-0006 (-240)
-0004 (-174)
-0006 (-144)
-0004 (-099)
-0006 [0386]
-0004 [0578]
Debt
-0019 (-027)
-0028 (-030)
-0019 (-024)
-0028 (-027)
-0019 [0938]
-0028 [0888]
Ownership
0082 (303)
0080 (255)
0082 (266)
0080 (210)
0082 [0000]
0080 [0000]
Size
0018 (033)
0029 (041)
0018 (023)
0029 (041)
0018 [0922]
0029 [0874]
Other
0017 (071)
0015 (049)
0017 (064)
0015 (042)
0017 [0610]
0015 [0710]
Cash Flow
0272 (431)
0350 (494)
0272 (295)
0350 (316)
0272 [0154]
0350 [0104]
GMM
-0092 (-136)
-0193 (-283)
-0092 (-106)
-0193 (-206)
-0092 [0468]
-0193 [0120]
Fixed effects
-0111 (-191)
-0187 (-298)
-0111 (-169)
-0187 (-256)
-0111 [0190]
-0187 [0062]
Other estimators -0017 (-025)
-0067 (-087)
-0017 (-025)
-0067 (-073)
-0017 [0902]
-0067 [-0640]
Service amp consumer goods -0281 (-140)
-0412 (-188)
-0281 (-145)
-0412 (-184)
-0281 [0434]
-0412 [0390]
Financial firms
0209 (271)
0235 (259)
0209 (251)
0235 (226)
0209 [0038]
0235 [0082]
Industry firms
-0011 (-020)
0026 (034)
-0011 (-017)
0026 (028)
-0011 [-0916]
0026 [0776]
EU
-0131 (-184)
-0135 (-167)
-0131 (-109)
-0135 (-089)
-0131 [-0476]
-0135 [0570]
Developing
-0001 (-001)
0037 (048)
-0001 (-001)
0037 (030)
-0001 [-0986]
0037 [0810]
UK
0032 (039)
0065 (075)
0032 (027)
0065 (048)
0032 [0890]
0065 [0722]
Other countries 0061 (078)
0093 (104)
0061 (059)
0093 (073)
0061 [0740]
0093 [0630]
F 9332 3475 9332 1588 p(F) 0000 0000 0000 0000 Rsup2 0608 0478 0478 0478 0608 0478 Adj Rsup2 0600 0467
Observations 979 979 979 979 979 979
53
Appendix
Table A1 Overview of studies estimating dividend smoothing coefficients
Authors Countries Time span No of firms No of estimates Method Mean
)ˆ(d Median
)ˆ(d Darling (1957) US 1921-1954 34 2 OLS 0495 0495
Brittain (1964) US 1920-1960 41 4 OLS 0716 0776
Mueller (1967) US 1957-1960 67 5 OLS amp other method 0877 0837 Turnovsky (1967) US 1948-1962 15 3 OLS 0594 0590 Feldstein (1970) UK 1953-1964 12 18 OLS amp other method 0567 0603 Mcdonald amp Nussenbaum (1975) France 1967-1968 2 7 OLS 0791 0802 Nakamura (1985)
Japan US
1964-1981 18 24 OLS 0680 0756
Mcdonald amp Soderstrom (1986) US 1965-1984 20 1 Fixed effects 0840 0840 Dharan (1988) US 1981-1983 3 6 OLS 0933 0947 Nakamura (1989) US 1960-1982 23 48 OLS 0701 0779 Mookerjee (1992) India 1950-1981 32 8 Other method 0255 0240 Behm amp Zimmermann (1993) Germany 1962-1988 32 8 OLS 0813 0812 Sembenelli (1993) Italy 1962-1988 27 6 OLS amp GMM 0703 0733 Hines (1996) US 1984-1989 6 5 OLS 0596 0569 DeAngelo amp DeAngelo (2000) US 1958-1979 22 4 Other method 0268 0270 Garrett amp Priestley (2000) US 1876-1997 122 3 Other method 0691 0670 Desai et al (2001) US 1982-1997 16 24 OLS Fixed effects amp
other method 0282 0279
Esteban amp Peacuterez (2001) 22 European countries
1991-1998 8 1 GMM 0342 0342
Rahman (2002) 28 1992-1999 8 57 OLS 0900 0945
54
countries Short et al (2002) UK 1988-1992 5 3 OLS 0556 0622 Vasiliou amp Eriotis (2002) Greece 1996-2001 6 4 OLS amp Fixed effects 0530 0530 Adelegan (2003) Nigeria 1984-1997 14 5 OLS 1358 1405 Gugler amp Yurtoglu (2003) Germany 1992-1998 7 6 Fixed effects 0400 0414 Kumar (2003) India 1994-2000 7 28 OLS amp Fixed effects 0500 0729 Pandey (2003) Malaysia 1993-2000 8 7 Fixed effects 0391 0432 Perez-Gonzalez (2003) US 1980-1999 20 2 Fixed effects 0503 0503 Benzinho (2004) Portugal 1990-2002 34 1 Other method 0352 0352 Correia da Silva et al (2004) Germany 1984-1993 10 24 OLS Fixed effects
GMM amp other method 0641 0684
Omet (2004) Jordania 1985-1999 15 3 OLS Fixed effects amp other method
0631 0681
Powell et al (2004) US 1927-1996 70 2 OLS 0788 0788 Trojanowski (2004) UK 1992-1998 7 11 GMM 0253 0270 Karathanassis amp Chrysanthopoulou (2005) Greece 1996-1998 3 32 Fixed effects amp other
method 0265 0266
Aivazian et al (2006) US 1981-1999 19 1 Fixed effects 0089 0089 Foerster amp Sapp (2006) Canada 1871-2003 133 4 OLS 0787 0785 Khan (2006) UK 1985-1997 330 6 OLS amp GMM 0674 0677 Naceur et al (2006) Tunisia 1996-2002 7 24 OLS Fixed effects
GMM amp other method 0334 0264
Sura et al (2006) India 2003-2004 2 43 OLS 0475 0503 Ameer (2007) Malaysia 1995-2005 11 3 OLS 0633 0595 Benhamouda (2007) UK 2000-2004 5 20 OLS amp Fixed effects 0127 0031 Bodla et al (2007) India 1996-2006 11 32 OLS 0485 0506 Dai (2007) Norway 1989-1998 10 5 Other method 0763 0764 Hines et al (2007) US 1982-2002 21 29 OLS Fixed effects amp
other method 0241 0239
Pal amp Goyal (2007) India 1997-1998 2 9 OLS 0920 0852 Pandey amp Bhat (2007) India 1989-1997 9 8 GMM 0259 0258
55
Renneboog amp Trojanowski (2007) UK 1992-1998 7 6 GMM 0313 0305 Ahmed amp Javid (2008) Pakistan 2001-2006 6 16 OLS Fixed effects
GMM amp other method 0549 0705
Ameer (2008) Malaysia 1995-2005 11 7 OLS 0525 0576 Baba amp Ueno (2008) Japan 1990-2003 14 1 GMM 0657 0657 Haddad et al (2008) Jordania 1996-2002 7 6 OLS amp GMM 0409 0373 Ahmed amp Javid (2009) Pakistan 2001-2006 6 12 OLS Fixed effects
GMM amp other method 0532 0500
Al-Najjar (2009) Jordania 1994-2003 10 3 OLS Fixed effects amp other method
0495 0561
Alzahrani amp Lasfer (2009) 24 OECD countries
2000-2007 8 12 Fixed effects amp GMM 0240 0236
Andres et al (2009) Germany 1984-2005 22 20 OLS Fixed effects amp GMM
0683 0697
Hayunga amp Stephens (2009) UK 1992-2003 12 9 OLS amp other method 0663 0621 Mollah (2009) Bnagladesh 1988-2003 16 15 OLS 0730 0741 Raza et al (2009) Pakistan 2001-2006 6 1 OLS 0771 0771 Al-Ajmi (2010) Qatar 1997-2006 10 14 OLS 0873 0808 Al-Yahyaee et al (2010) Oman 1989-2004 16 1 Other method 0747 0747 Chemmanur et al (2010)
Hong Kong US
1984-2002 19 8 OLS 0623 0513
Korkeamaki et al (2010) Finland 2003-2006 4 10 OLS Fixed effects amp other method
0072 0110
Sudhahar amp Saroja (2010) India 1997-2007 11 3 OLS 0680 0715 Al-Yahyaee et al (2011) Oman 1989-2004 16 1 Other method 0059 0059 Baiyao (2011) US 1991-2007 17 1 OLS 0450 0450 Goncharov amp Triest (2011) Russia 2003-2006 4 7 OLS 0546 0377 Haleem amp Javid (2011) Pakistan 2007-2009 3 21 OLS 0898 0803 Hussain (2011) Saudia
Arabia 1990-2006 17 9 Fixed effects amp other
method 0546 0377
Kinfe (2011) Ethiopia 2006-2010 5 1 OLS 0191 0191 Mohsin amp Ashraf (2011) Pakistan 2001-2009 9 3 Fixed effects amp GMM amp
other method 0568 0626
56
Wang et al (2011) China 1998-2008 11 13 OLS amp other method 0448 0450 Abdullah et al (2012) Malaysia 2009-2010 2 1 OLS 0889 0889 Al-Najjar amp Belghitar (2012) UK 1991-2007 17 8 Fixed effects amp GMM amp
other method 0552 0568
Bawa amp Kaur (2012) India 2006-2006 1 24 OLS amp Fixed effects 0898 0847 Kamat amp Kamat (2012) India 1971-2007 37 9 GMM 0476 0401 Kumar amp Kumar Jha (2012) India 2007-2011 5 3 OLS 0039 0077 Baker et al (2013) Canada 1988-1999 12 2 OLS 0550 0550 Hutagalung et al (2013) Malaysia 2001-2010 10 1 Fixed effects 0856 0856 Kamat amp Kamat (2013) India 1975-1992 18 3 GMM 0534 0571 Kanoja amp Bhatia (2013) India 2007-2012 6 5 OLS 0587 0682 Persson (2013) Sweden 2005-2011 7 6 Fixed effects 0378 0225 Simegen (2013) Ethiopia 2002-2011 10 2 Fixed effects 0203 0203 Zameer et al (2013) Pakistan 2003-2009 7 1 OLS 0699 0699 Al-Malkawi et al (2014) Oman 2001-2010 10 2 Other method 0744 0744 Andres et al (2014) Germany 1984-2005 22 19 OLS amp GMM 0592 0501 Arko et al (2014) Sub-
Saharan African countries
1997-2007 11 9 OLS 0677 0662
Boţoc amp Pirtea (2014) 16 emerging countries
2003-2011 9 16 OLS amp GMM 0474 0487
Gunathilaka (2014) Sri Lanka 2006-2010 5 7 GMM 0273 0350 Tran amp Nguyen (2014) Vietnam 2006-2011 6 2 Fixed effects 0122 0122 Younis amp Javid (2014) Pakistan 2003-2011 9 6 Fixed effects amp other
method 0512 0570
Al-Attar et al (2015) Jordania 2006-2011 6 7 OLS 0506 0487 Andres et al (2015) Germany 1988-2008 21 3 OLS Fixed effects amp
GMM 0716 0681
Kim amp Jeon (2015) Korea 2000-2010 11 8 OLS Fixed effects amp other method
0614 0722
57
Renneboog amp Szilagyi (2015) Netherlands 1996-2004 9 8 GMM 0996 0825 Shinozaki amp Uchida (2015) 44
countries 2003-2013 11 1 Fixed effects 0788 0788
Athari et al (2016) 7 Arabian countries
2003-2012 10 4 GMM 0404 0407
Benavides et al (2016) Argentina 1995-2013 19 45 OLS 0650 0660 Brazil Chile Columbia Mexico Peru Bremberger et al (2016) 14 EU
countries 1986-2010 25 11 OLS Fixed effects amp
GMM 0510 0506
Chan et al (2016) US 1927-2013 87 2 OLS 0742 0742 Chen amp Sinha (2016) US 1996-2001 6 4 OLS 0739 0738 Naceur et al (2016) Tunisia 1996-2002 7 14 OLS Fixed effects
GMM amp other method 0160 0165
Source Authors literature search
58
Figure A1 Frequency distribution of dividend smoothing coefficients
050
100
150
Freq
uenc
y
-1 0 1 2 3Smoothing coefficient
Note The dividend smoothing is measured on the x-axis while the y-axis represents the frequency of dividend smoothing coefficients within the respective interval
Figure A2 Kernel density of dividend smoothing coefficients
05
11
5D
ensi
ty
-1 0 1 2 3Smoothing coefficient
e e de s y es a e
Note The dividend smoothing is measured on the x-axis while the y-axis represents the density of dividend smoothing coefficients estimated by Kernel density estimation
59
Figure A3 Funnel plot for the dividend smoothing coefficients (median)
0
20
40
60
80
100
120
140
160
0 05 1 15
Note The dividend smoothing is measured on the x-axis while the y-axis represents precision calculated as the inverse standard error The vertical line at 0671 indicates the ldquotruerdquo dividend smoothing as the mean of the 10 most precise smoothing coefficients The plot is based on median values of the dividend smoothing coefficients and precision per study
Figure A4 Frequency distribution of dividend smoothing coefficients (median)
Figure A5 Kernel density of dividend smoothing coefficients (median)
010
2030
Freq
uenc
y
0 5 1 15Smoothing coefficient
05
11
52
Den
sity
0 5 1 15Smoothing coefficient
y
Note Figure A4 (left-hand side) The dividend smoothing is measured on the x-axis while the y-axis represents the frequency of dividend smoothing coefficients within the respective interval The figure is based on median values of the dividend smoothing coefficients and precision per study
Note Figure A5 (right-hand side) The dividend smoothing is measured on the x-axis while the y-axis represents the density of dividend smoothing coefficients estimated by Kernel density estimation The figure is based on median values of the dividend smoothing coefficients and precision per study
60
Table A2 Bayesian averaging of models (8) (9) and (10)
Variable Post mean (Post SE) PIP
Robust se
Post mean (Post SE) PIP
Robust se Post mean
(Post SE) PIP
Robust se
Constant
0682 (1998)
100 0705 (1408)
0583 (2555)
100 0579 (818)
0641 (2016)
100 0654 (1153)
SE
-0264 (-181)
084 -2379 (-430)
SE (smoothingle05)
-1150 (-1441)
100 -7390 (-1027)
SE (smoothinggt05) 1701 (1591)
100 3568 (351)
SEsup2 (smoothingle05) -0678 (-708)
100 -12513 (-385)
SEsup2(smoothinggt05) 3941 (1259)
100 5238 (217)
Working paper 0043 (089)
050
0102 (402)
100 0239 (337)
0110 (328)
098 0271 (487)
Post 1998
-0087 (-331)
099 -0077 (-197)
-0119 (-646)
100 -0088 (-186)
-0101 (-447)
100 -0064 (-114)
No of years
0000 (007)
004
0000 (004)
004 0000 (029)
011
Debt
-0000 (-004)
003
0000 (011)
004 -0002 (-004)
003
Ownership
0000 (000)
003
0006 (038)
038 0000 (004)
003
Size
0001 (014)
005
0000 (003)
003 0000 (004)
004
Other
-0000 (-005)
003
-0004 (-036)
015 -0001 (-015)
005
Cash Flow
0168 (551)
100 0370 (525)
0095 (376)
099 0219 (303)
0125 (447)
100 0329 (433)
GMM
-0241 (-838)
100 -0269 (-533)
-0136 (-617)
100 -0159 (-260)
-0223 (-872)
100 -0220 (-354)
Fixed effects
-0379 (-1322)
100 -0256 (-421)
-0239 (-1078)
100 -0121 (-185)
-0349 (-1368)
100 -0232 (-334)
Other estimators -0146 (-497)
100 -0149 (-232)
-0089 (-383)
099 0005 (007)
-0137 (-520)
100 -0099 (-117)
Service amp consumer goods 0128 (108)
061 -0415 (-152)
0004 (019)
006 0004 (018)
006
Financial firms
-0067 (-145)
075 0276 (340)
-0004 (-031)
012 -0035 (-090)
051 0271 (310)
Industry firms
0208 (498)
100 0007 (013)
0021 (058)
030 0084 (148)
076 0032 (051)
EU
0014 (044)
020
0009 (040)
018 0013 (042)
019
Developing
0045 (094)
055 0048 (105)
0064 (216)
090 0067 (099)
0035 (081)
047
UK
-0003 (-017)
008
0001 (006)
004 -0004 (-021)
009
Other countries 0056 (106)
061 0167 (315)
0080 (273)
095 0087 (106)
0030 (070)
039
n 979 979 979 979 979 979 Notes All variables are as defined as in table 1 Dependent variable is dividend smoothing coefficient t-values in parentheses p values in brackets All models estimated with robust standard errors significance at the 1 5 10 level Squared standard errors of adjustment coefficients are used as weights PIP refers to the posterior inclusion probability of the variables estimated by Bayesian modeling averaging Reference category classical Lintner model for pre 1998 US data estimated with OLS
61
Table A3 WLS FAT-PET meta-regression robustness checks
Variable Robust 05-quantile estimation WLS coefficients per study
Constant 0659 (2955)
0573 (4779)
0564 (3030)
0663 (4468)
0581 (2492)
0566 (4244)
SE -0628 (-359) -0752
(-557)
SE (smoothingle05) -1960 (-1336) -1381
(-403)
SE (smoothinggt05) 1585 (1172) 1497
(762)
SEsup2 (smoothingle05) -4534 (-152) -0636
(-351)
SEsup2(smoothinggt05) 5283 (801) 4899
(980) F 3100 9802 5561 p(F) 0000 0000 0000 R2 0020 0262 0090 0065 0390 0149 n 998 998 998 979 979 979
Note Dependent variable is dividend smoothing coefficient All models estimated with robust standard errors t-values in parentheses p values in brackets significance at the 1 5 10 level
62
Table A4 robustness checks of models (8) (9) and (10)
Variable Robust 05-quantile estimation WLS coefficients per study
Constant
0702 (2093)
0555 (1704)
0569 (1761)
0565 (1378)
0460 (1198)
0436 (1153)
SE -0619 (-692) -0663
(-692)
SE (smoothingle05) -1404
(-1274) -0979 (-405)
SE (smoothinggt05) 1397 (846) 1672
(764)
SEsup2 (smoothingle05) -2258 (-093) -0526
(-425) SEsup2(smoothinggt05) 3791
(547) 4682 (808)
Working paper 0078 (267)
0075 (221)
0112 (367)
0106 (357)
0157 (548)
0175 (607)
Post 1998
-0134 (-710)
-0151 (-1021)
-0156 (-893)
-0112 (-379)
-0125 (-517)
-0126 (-441)
No of years
0001 (234)
0001 (244)
0002 (268)
-0000 (-014)
0002 (150)
0003 (314)
Debt
-0027 (-069)
0038 (120)
-0045 (-143)
-0088 (-230)
-0042 (-135)
-0061 (-178)
Ownership
-0042 (-115)
0001 (003)
-0040 (-165)
0032 (136)
0072 (377)
0041 (182)
Size
0014 (039)
0009 (052)
0023 (071)
0026 (068)
0024 (079)
0030 (086)
Other
-0008 (-038)
-0034 (-219)
-0010 (-061)
0026 (112)
-0012 (-069)
0011 (051)
Cash Flow
0071 (258)
0041 (183)
0077 (459)
0136 (305)
0065 (175)
0098 (226)
GMM
-0281 (-1026)
-0170 (-942)
-0258 (-1160)
-0238 (-794)
-0169 (-678)
-0230 (-847)
Fixed effects
-0450 (-1807)
-0256 (-1139)
-0366 (-1847)
-0402 (-1410)
-0279 (-1161)
-0366 (-1332)
Other estimators -0159 (-536)
-0097 (-600)
-0147 (-704)
-0138 (-548)
-0085 (-433)
-0114 (-504)
Service amp consumer goods 0166 (211)
0050 (084)
0079 (066)
0524 (397)
0274 (268)
0327 (293)
Financial firms
-0037 (-120)
-0033 (-141)
-0053 (-184)
-0073 (-187)
-0058 (-177)
-0110 (-300)
Industry firms
0163 (579)
0065 (250)
0122 (776)
0313 (620)
0075 (221)
0098 (290)
EU
0079 (214)
0117 (361)
0107 (387)
0159 (452)
0103 (353)
0151 (444)
Developing
0116 (371)
0169 (607)
0171 (595)
0214 (511)
0176 (537)
0224 (564)
UK
0002 (005)
0079 (221)
0084 (248)
0072 (179)
0072 (217)
0084 (217)
Other countries 0111 (371)
0187 (607)
0162 (601)
0191 (505)
0178 (572)
0202 (567)
F 5135 7186 5798 p(F) 0000 0000 0000 Rsup2 0251 0389 0297 0417 0627 0489 n 998 998 998 979 979 979
Notes All variables are as defined as in table 1 Dependent variable is dividend smoothing coefficient All models estimated with robust standard errors t-values in parentheses p values in brackets significance at the 1 5 10 level Squared standard errors of adjustment coefficients are used as weights Reference category classical Lintner model for pre 1998 US data estimated with OLS
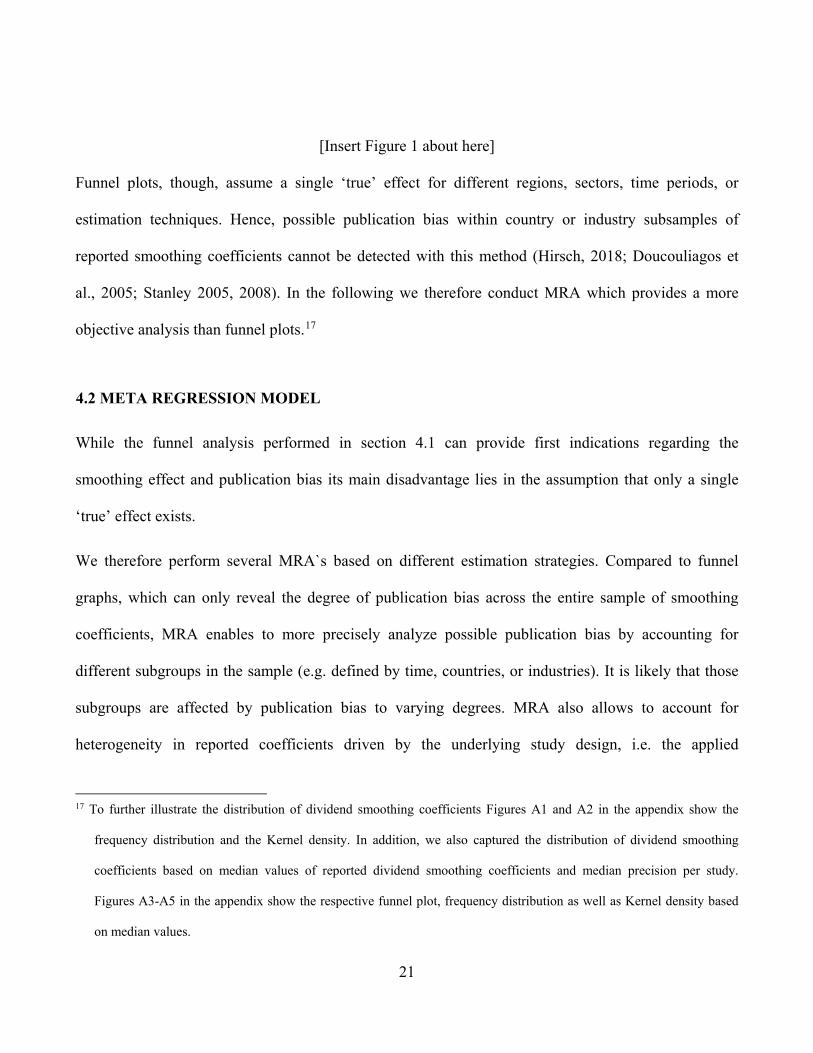
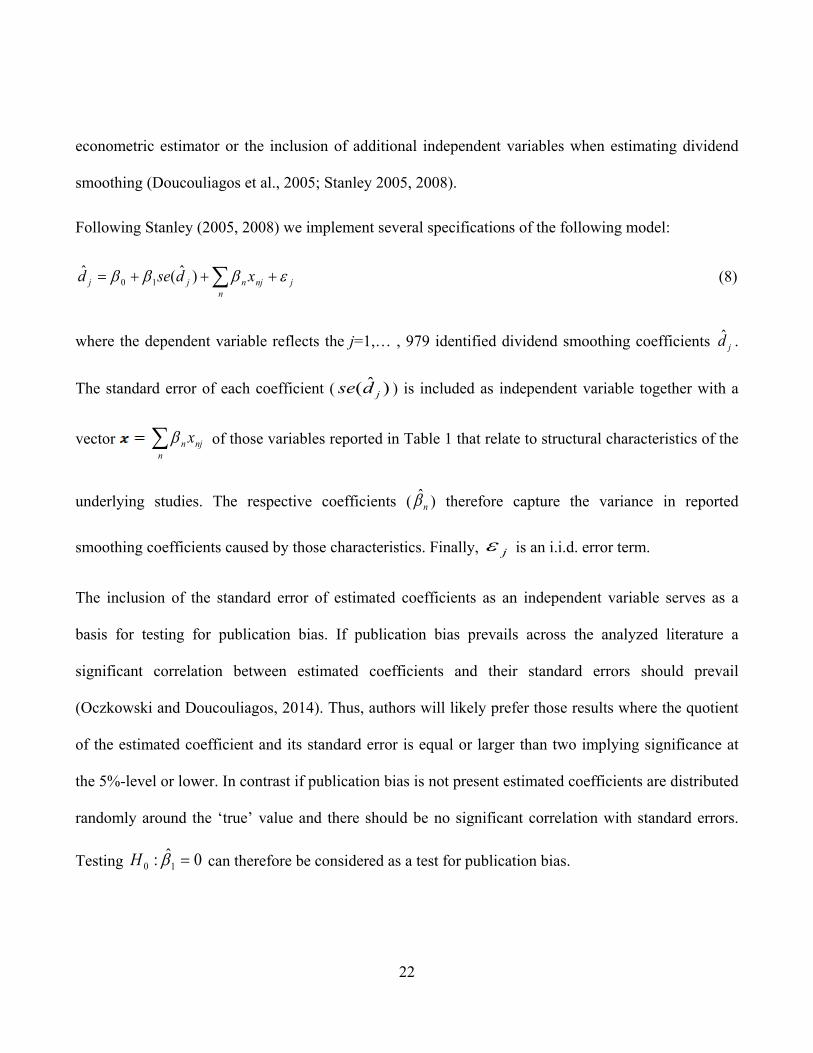
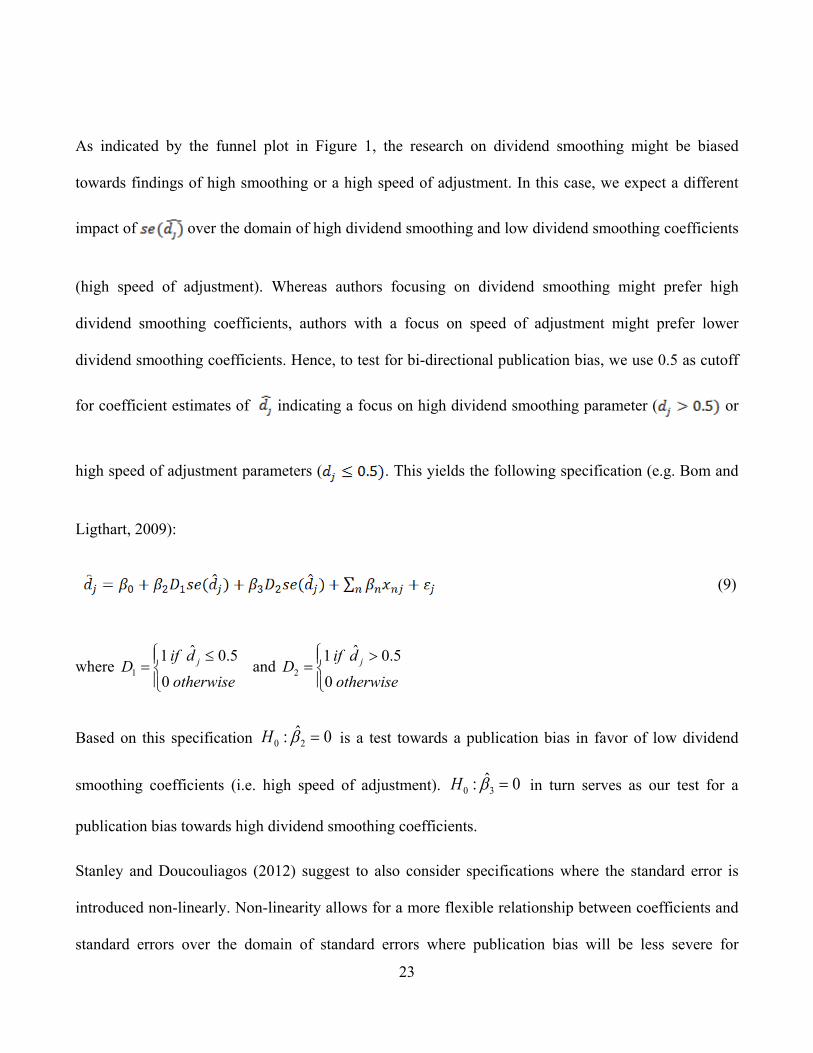
40
DeAngelo H DeAngelo L (2000) Controlling stockholders and the disciplinary role of corporate payout policy - a study of the Times Mirror company Journal of Financial Economics 56(2) 153-207
Demena BA van Bergeijk PAG (2017) A Meta-Analysis of FDI and Productivity Spillovers in
Developing Countries Journal of Economic Surveys 31(2) 546-571 DerSimonian R Laird N (1986) Meta-analysis in clinical trials Controlled Clinical Trials 7(3) 177-
188 Desai MA Foley CF Hines Jr JR (2001) Repatriation Taxes and Dividend Distortions National
Tax Journal 54(4) 829-851 Dewenter KL Warther VA (1998) Dividends Asymmetric Information and Agency Conflicts
Evidence from a Comparison of the Dividend Policies of Japanese and US Firms Journal of Finance 53(3) 879ndash904
Dharan BG (1988) The Association between Corporate Dividends and Current Cost Disclosure
Journal of Business Finance amp Accounting 15(2) 215-230 Doucouliagos H Laroche P Stanley TD (2005) Publication Bias in Union-Productivity Research
Relations industrielles Industrial Relations 60(2) 320-347 Easterbrook FH (1984) Two Agency-Cost Explanations of Dividends American Economic Review
74(4) 650-659 Esteban JMD Peacuterez OLdF (2001) Dividend Policy of European Banks Working paper
Universidad de Burgos Fama EF (1974) The Empirical Relationships between the Dividend and Investment Decisions of
Firms American Economic Review 64(3) 304-318 Fama EF Babiak H (1968) Dividend Policy An Empirical Analysis Journal of the American
Statistical Association 63(324) 1132-1161 Farre-Mensa J Michaely R Schmalz M (2014) Payout Policy Annual Review of Financial
Economics 6 75-134 Feld LP Heckemeyer JH Overesch M (2013) Capital structure choice and company taxation A
meta-study Journal of Banking amp Finance 37(8) 2850ndash2866 Feldstein MS (1970) Corporate Taxation and Dividend Behaviour Review of Economic Studies
37(1) 57-72
41
Foerster SR Sapp SG (2006) The changing role of dividends a firm-level study from the nineteenth to the twenty-first Century Canadian Journal of Economics 39(4) 1316-1344
Garrett I Priestley R (2000) Dividend Behavior and Dividend Signaling Journal of Financial and
Quantitative Analysis 35(2) 173-189 Goncharov I Triest S v (2011) Do fair value adjustments influence dividend policy Accounting
and Business Research 41(1) 51-68 Grullon G Michaely R (2002) Dividends Share Repurchases and the Substitution Hypothesis
Journal of Finance 57(4) 1649-1684 Gugler K (2003) Corporate governance dividend payout policy and the interrelation between
dividends RampD and capital investment Journal of Banking and Finance 27 1297-1321 Gugler K Yurtoglu BB (2003) Corporate governance and dividend payout policy in Germany
European Economic Review 47(4) 731-758 Gunathilaka C (2014) What Drives the Payout Policy Evidence from Sri Lanka A Dynamic Panel
Data Analysis Wayamba Journal of Management 3(2) 1-16 Haddad AE Al Shattarat WK Al-Hamadeen RM (2008) Partial-Adjustment-Models of Dividend
Policy Behaviour for Industrial Jordanian Firms Corporate Ownership amp Control 5(4) 356-372 Haleem F Javid AY (2011) Modeling Dividend Behavior in Pakistan Information Management
and Business Review 3(6) 289-301 Hayunga DK Stephens CP (2009) Dividend behaviour of US equity REITs Journal of Property
26(2) 105-123 Hines Jr JR Desai MH Foley CF (2007) Dividend Policy Inside the Multinational Firm
Financial Management 36(1) 5-26 Hines JR Jr (1996) Dividends and Profits - Some Unsubtle Foreign Influences Journal of Finance
51(2) 661-689 Hirsch S (2018) Successful in the long run A meta-regression analysis of persistent firm profits
Journal of Economic Surveys 32(1) 23-49 Hsiao C (1986) Analysis of Panel Data Cambridge University Press Cambridge Hussain J (2011) Corporate dividends decisions evidence from Saudi Arabia Journal of Risk
Finance 12(1) 41-56
42
Hutagalung S Yahya MH Kamarudin F Osman Z (2013) The Dividend Payout Policy ndash A Study on Malaysian Financial Institutions Pertanika J Soc Sci amp Hum 21(S) 127-148
Jagannathan M Stephens CP Weisbach M (2000) Financial flexibility and the choice between
dividends and stock repurchases Journal of Financial Economics 57(3) 355-384 Jarrell SB Stanley TD (1990) A Meta-Analysis of the Union-Nonunion Wage Gap Industrial amp
Labor Relations Review 44 54-67 Jensen MC (1986) Agency Costs of Free Cash Flow Corporate Finance and Takeovers American
Economic Review 76(2) 323-329 Kamat MS Kamat MM (2012) An Application of Partial Adjustment Equation in Determining
Payout Behavior using an Extended Instrumental Variable Approach Working paper VVMs Shree Damodar College Goa University
Kamat MS Kamat MM (2013) Economic reforms determinants and stability of dividends in a
dynamic setting Journal of Asia Business Studies 7(1) 5-30 Kanoja S Bhatia BS (2013) Dividend Decisions and Payout Policy An Empirical Analysis of
Listed Indian Companies Working paper University of Delhi Karathanassis GA Chrysanthopoulou ECh (2005) The relationship Between Ownership Structure
and Corporate Dividend Policy ndash Evidence from the Athens Stock Exchange Working paper Athens University of Economics and Business
Khan T (2006) Company Dividends and Ownership Structure Evidence from UK Panel Data The Economic Journal 116(510) C172-C189 Kim J Jeon Y (2015) Dividend Policy and Corporate Social Responsibility A Comparative
Analysis of Multinational Enterprise Subsidiaries and Domestic Firms in Korea Emerging Markets Finance and Trade 51(2) 306-319
Kinfe T (2011) Determinants of Dividend payout An Empirical Study on Bank Industry in Ethiopia
Master thesis Addis Ababa University School of Business and Public Administration Department of Accounting and Finance School of Graduate Studies
Korkeamaki T Liljeblom E Pasternack D (2010) Tax reform and payout policy Do shareholder
clienteles or payout policy adjust Journal of Corporate Finance 16(4) 572-587 Kumar J (2003) Ownership Structure and Dividend Payout Policy in India Working paper Indira
Gandhi Institute of Development Research
43
Kumar R Kumar Jha P (2012) Determinants of Corporate Dividend Policy in India - A Study of Listed IT Companies at BSE Working paper Faculty of Management Studies BHU
La Porta R Lopez-de-Silanes F Shleifer A Vishny RW (1998) Law and Finance Journal of
Political Economy 106(6) 1133-1155 La Porta R Lopez-de-Silanes F Shleifer A Vishny RW (2000) Agency Problems and Dividend
Policies around the World Journal of Finance 55(1) 1-33 Lambrecht BM Myers S C (2012) A Lintner model of payouts and managerial rents Journal of
Finance 67(5) 1761ndash1810 Leary MT Michaely R (2011) Determinants of Dividend Smoothing Empirical Evidence Review
of Financial Studies 24(10) 3197-3249 Lintner J (1956) Distribution of incomes of corporations among dividends retained earnings and
taxes American Economic Review 46(2) 97-113 Longhi S Nijkamp P Poot J (2005) A Meta-Analysis Assessment of the Effect of Immigartion on
Wages Journal of Economic Surveys 19(3) 451-477 Manconi A Peyer U Vermaelen T (2017) Are Buybacks Good for Long-Term Shareholder Value
Evidence from Buybacks around the World European Corporate Governance Institute (ECGI) - Finance Working Paper No 4362014 INSEAD Working Paper No 2013101FIN
McDonald JG Jacquillat B Nussenbaum M (1975) Dividend Investment and Financing
Decisions Empirical Evidence on French Firms Journal of Financial and Quantitative Analysis 10(5) 741-755
McDonald R Soderstrom N (1986) Dividend and Share Changes Is There a Financing Hierarchy
NBER working paper series Working Paper No 2029 MacKinnon JG Webb MD (2017) Wild Bootstrap Inference for Wildly Different Cluster Sizes
Journal of Applied Econometrics 32(2) 233-254 Michaely R Roberts MR (2012) Corporate Dividend Policies Lessons from Private Firms Review
of Financial Studies 25(3) 711-746 Miller MH Rock K (1985) Dividend Policy under Asymmetric Information Journal of Finance
40(4) 1031-1051 Miller M Scholes M (1978) Dividends and Taxes Journal of Financial Economics 6(4) 333-364
44
Modigliani F Miller M (1958) The Cost of Capital Corporation Finance and the Theory of Investment American Economic Review 48(3) 261ndash297
Mohsin HM Ashraf MS (2011) Monetary policy restriction and dividend behavior of Pakistani
firms an empirical analysis MPRA Paper No 34052 Mollah Sabur A (2009) Testing Partial Adjustment Dividend Behavioral Models in Emerging
Markets Evidence from Pre and Post Market Reforms in Bangladesh Global Journal of Business Research 3(1) 1-14
Mookerjee R (1992) An empirical investigation of corporate dividend pay-out behaviour in an
emerging market Applied Financial Economics 2(4) 243-246 Mueller DC (1967) The Firm Decision Process An Econometric Investigation The Quarterly
Journal of Economics 81(1) 58-87 Naceur S Goaied M Belanes A (2006) On the Determinants and Dynamics of Dividend Policy
International Review of Finance 6(1-2) 1-23 Naceur S Goaied M Belanes A (2016) A Re-examination of Dividend Policy A Dynamic Panel
Data Analysis Working paper ESSEC Tunis IHEC Carthage Nakamura A (1985) Rational Expectations and the Firms Dividend Behavior Review of Economics
and Statistics 67(4) 606-615 Nakamura M (1989) Asymmetry in the Dividend Behavior of US and Japanese Firms Managerial
and Decision Economics 10(4) 261-274 Nelson JP Kennedy PE (2009) The Use (and Abuse) of Meta-Analysis in Environmental and
Natural Resource Economics An Assessment Environmental and Resource Economics 42(3) 345-377
Nickell S (1981) Biases in Dynamic Models with Fixed Effects Econometrica 49(6) 1417-1426
Oczkowski E Doucouliagos H (2014) Wine Prices and Quality Ratings a Meta-Regression Analysis American Journal of Agricultural Economics 97(1) 103-121
Omet G (2004) Dividend Policy Behaviour in the Jordanian Capital Market International Journal of
Business 9(3) 287-300 Pal K Goyal P (2007) Leading Determinants of Dividend Policy A Case Study of the Indian
Banking Industry Decision 34(2) 88-112
45
Pandey IM Bhat R (2007) Dividend behavior of Indian companies under monetary policy Managerial Finance 33(1) 14-25
Pandey IM (2003) Corporate Dividend Policy and Behaviour The Malaysian Evidence Asian
Academy of Management Journal 8(1) 17ndash32 Perez-Gonzalez F (2003) Large Shareholders and Dividends Evidence from US Tax Reforms
Working paper Columbia University Persson R (2013) Dividend policy behavior An analysis of firms listed at Stockholm Stock
Exchange Bachelor thesis Uppsala University Department of Economics EKONOMIKUM - Centre for Economic Sciences
Pindado J Requejo I Torre C de la (2012) Do Family Firms Use Dividend Policy as a Governance
Mechanism Evidence from the Euro zone Corporate Governance An International Review 20(5) 413-431
Post C Byron K (2015) Women on boards and firm financial performance A meta-analysis
Academy of Management Journal 58(5) 1546-1571 Powell JG Shi J Smith T (2004) Dividend persistence and return predictability Working paper
School of Finance and Applied Statistics Faculty of Economics and Commerce The Australian National University Canberra
Raftery AE Madigan D Hoeting JA (1997) Bayesian model averaging for linear regression
models Journal of the American Statistical Association 92 179ndash191 Rahman N (2002) Ownership structure and dividend smoothing cross-country evidence Working
paper University of Chicago Graduate School of Business Raza S H Zahaar M Hafeez M (2009) The Ownership Structure and Dividend Payout Policy in
Pakistan Evidence from KSE-100 index Non-financial Firms Pakistan Journal of Education 26(1) 173-188
Renneboog L Szilagyi PG (2015) How Relevant is Dividend Policy under Low Shareholder
Protection Journal of International Financial Markets Institutions and Money Advance online publication DOI 101016jintfin201501006
Renneboog L Trojanowski G (2007) Control structures and payout policy Managerial Finance
27(3) 180-194 Rusnak M Havranek T Horvath R (2013) How to Solve the Price Puzzle A Meta‐Analysis
Journal of Money Credit and Banking 45(1) 37-70
46
Sembenelli A (1993) Signalling Financial Hierarchy and Agency Theory as Explanations for Dividend Behavior Evidence from Italian Firm Data Managerial and Decision 14(1) 37-45
Shinozaki S Uchida K (2015) Ownership structure and dividend smoothing International evidence
Working paper Faculty of Economics Kyushu University Short H Zhang H Keasey K (2002) The link between dividend policy and institutional ownership
Journal of Corporate Finance 8(2) 105-122 Simegen M (2013) Determinants of Dividend Policy of Banks in Ethiopia Master thesis Addis
Ababa University College of Accounting and Finance School of Graduate Studies Skinner D (2008) The evolving relation between earnings dividends and stock repurchases Journal
of Financial Economics 87(3) 582-609 Stanley TD (2001) Wheat from Chaff Meta-Analysis as Quantitative Literature Review Journal of
Economic Perspectives 15(3) 131-150 Stanley TD (2005) Beyond Publication Bias Journal of Economic Surveys 19(3) 309-345 Stanley TD (2008) Meta-Regression Methods for Detecting and Estimating Empirical Effects in the
Presence of Publication Selection Oxford Bulletin of Economics and Statistics 70(1) 103-127 Stanley TD Doucouliagos H (2010) Picture This A Simple Graph That Reveals Much Ado About
Research Journal of Economic Surveys 24(1) 170-191 Stanley TD Doucouliagos H (2012) Meta-regression Analysis in Economics and Business Oxford
UK Routledge Stanley TD Doucouliagos H (2013) Better than Random Weighted Least Squares Meta
Regression Analysis University of Australia School of Accounting Economics and Finance Economics Series Working Paper SWP 20132
Stanley TD Doucouliagos H (2015) Neither fixed nor random weighted least squares meta-
analysis Statistics in Medicine 34 2116-2127 Stanley TD Jarrell B (1989) Meta-Regression Analysis A Quantitative Method of Literature
Journal of Economic Surveys 3(2) 161-170 Stanley TD Doucouliagos H Giles M Heckemeyer JH Johnston RJ Laroche P Nelson JP
Paldam M Poot J Pugh G Rosenberger RS Rost K (2013) Meta-Analysis of Economics Research Reporting Guidelines Journal of Economic Surveys 27(2) 390-394
47
Sudhahar M Saroja T (2010) Determinants of Dividend Policy in Indian Banks An Empirical Analysis Journal of Bank Management 9(3) 63-75
Sura JS Pal K Bodla BS (2006) Factors Influencing Dividend Policy Decisions in Banking
Sector An Indian Evidence Amity Business Review 7(2) 64-75 Tran QT Nguyen TTH (2014) Dividend Policy Behavior in Emerging Stock Markets Evidence
from Vietnamese Stock Market International Journal of Financial Research 5(4) 85-89 Trojanowski G (2004) Ownership structure and payout policy in the UK Working paper University of Exeter Business School Trotman KT Wood R (1991) A Meta-Analysis of Studies on Internal Control Judgements Journal
of Accounting Research 29(1) 180-192 Turnovsky SJ (1967) The Allocation of Corporate Profits between Dividends and Retained Earnings
Review of Economics and Statistics 49(4) 583-589 Valickova P Havranek T Horvath R (2015) Financial Development and Economic Growth A
Meta-Analysis Journal of Economic Surveys 29(3) 506-526 Vasiliou D Eriotis N (2002) The Determinants of Dividend policy some Greek data European
Journal of Management and Public Policy 1(2) 46-56 Wang K Shailer G (2015) Ownership concentration and firm performance in emerging markets a
meta-analysis Journal of Economic Surveys 29(2) 199-229 Wang X Manry D Wandler S (2011) The impact of government ownership on dividend policy in
China Advances in Accounting incorporating Advances in International Accounting 27(2) 366-372
Watts R (1973) The Information Content of Dividends Journal of Business 46(2) 191-211 Weber S (2010) bacon An effective way to detect outliers in multivariate data using Stata (and
Mata) The Stata Journal 10(3) 331-338 Younis D Javid AY (2014) Market Imperfections and Dividend Policy Decisions of Manufacturing
Sector of Pakistan PIDE Working Papers 201499 Zameer H Rasool S Iqbal S Arshad U (2013) Determinants of Dividend Policy A Case of
Banking Sector in Pakistan Middle-East Journal of Scientific Research 18(3) 410-424 Zigraiova D Havranek T (2016) Bank Competition and Financial Stability Much Ado about
Nothing Journal of Economic Surveys 30(5) 944-981
48
Tables and Figures
Figure 1 Funnel plot for the dividend smoothing coefficients
Note The dividend smoothing is measured on the x-axis while the y-axis represents precision calculated as the inverse
standard error The vertical line at 0728 indicates the ldquotruerdquo dividend smoothing as the mean of the 10 most precise
smoothing coefficients
49
Table 1 Summary statistics of meta data
Variable label Definition Mean Standard deviation
Dependent Variable
Dividend smoothing (d)
Dividend smoothing coefficient 0562 0325
Precision
Standard error (se)
Standard error of the dividend smoothing coefficient 0093 0102
Study design characteristics
Working Paper The study is a working paper older than 5 years = 1 0 otherwise
0112 0316
Post 1998 The mean year of estimation period gt1998 = 1 0 otherwise 0470 0499 No of years Length of the analyzed time series dimension 12526 11524 Debt Ownership Size Other Lintner classical
Estimation controls for firm debt = 1 0 otherwise Estimation controls for ownership = 1 0 otherwise Estimation controls for firm size =1 0 otherwise Estimation controls for other firm factors =1 0 otherwise Estimation does not include variables in addition to contemporaneous earnings and lagged dividends as independent variables =1 0 otherwise
0104 0166 0139 0419 0420
0306 0373 0346 0494 0494
Cash flow The estimation uses a cash flow measure =1 0 if earnings measure
0113 0317
OLS The estimation is based on OLS =1 0 otherwise 0553 0497
GMM The estimation is based on GMM=1 0 otherwise 0147 0354
Fixed effects The estimation is based on fixed effects = 1 0 otherwise 0157 0364 Other estimators The estimation is based on other methods = 1 0 otherwise 0143 0350 Service and Consumer Goods Financial firms Industry firms
Study analyzes serviceconsumer goods firms =1 0 otherwise Study analyzes financial firms =1 0 otherwise Study analyzes industry sector firms =1 0 otherwise
0015
0150 0061
0123
0357 0240
EU Developing US UK Other countries
Study analyzes a country or several countries from the EU =1 0 otherwise
Study analyzes a developing country or several developing countries =1 0 otherwise Study analyzes the US =1 0 otherwise Study analyzes the UK =1 0 otherwise Study focuses on other countries =1 0 otherwise
0174
0344
0114 0083 0277
0379
0475
0318 0276 0447
Note We use the following reference categories in the MRA classical Lintner model for pre 1998 US data estimated with OLS
50
Table 2 WLS FAT-PET meta-regression analysis results
Variable Robust se
(1)
Robust se
(2)
Robust se
(3)
Study cluster
robust se (4)
Study cluster
robust se (5)
Study cluster
robust se (6)
Wild bootstrap
se clustered by study
(7)
Wild bootstrap
se clustered by study
(8)
Wild bootstrap
se clustered by study
(9)
Constant 0755 (2035)
0732 (2147)
0707 (2481)
0755 (712)
0732 (760)
0707 (777)
0755 [0000]
0732 [0000]
0707 [0000]
SE -3613 (-482) - -3613
(-200) -3613 [0216] -
SE (smoothingle05) -1130 (-1724) -1130
(-481) -1130 [0002]
SE (smoothinggt05) 2526 (264) 2526
(148) 2526 [0246]
SEsup2 (smoothingle05) - -17412 (-385) - -17412
(-261) - -17412 [0148]
SEsup2(smoothinggt05) 4746 (237) 4746
(087) 4746 [0596]
F 2327 2273 1270 398 2273 558 p(F) 0000 0000 0000 0049 0000 0005 R2 0043 0284 0018 0042 0284 0018 0043 0284 0018 Adj R2 0042 0283 0016 Observations 979 979 979 979 979 979 978 978 978
Notes Dependent variable is dividend smoothing coefficient t-values in parentheses p values in brackets significance at the 1
5 10 level Squared standard errors of adjustment coefficients are used as weights
51
Table 3 WLS estimation results of models (8) (9) and (10)
Panel A
Variable
Robust se
(1)
Cluster robust se by study
(2)
Wild bootstrap se clustered by
study (3)
Constant
0678 (823)
0678 (414)
0678 [0072]
se
-1536 (-244)
-1536 (-162)
-1536 [0172]
Working paper 0157 (220)
0157 (193)
0157 [0284]
Post 1998
-0085 (-165)
-0085 (-129)
-0085 [-0372]
No of years
-0004 (-160)
-0004 (-092)
-0004 [0594]
Debt
-0035 (-039)
-0035 (-035)
-0035 [-0830]
Ownership
0077 (245)
0077 (206)
0077 [0000]
Size
0025 (0037)
0025 (0024)
0025 [0868]
Other
0024 (083)
0024 (072)
0024 [0484]
Cash Flow
0371 (548)
0371 (367)
0371 [0010]
GMM
-0219 (-319)
-0219 (-232)
-0219 [0078]
Fixed effects
-0205 (-322)
-0205 (-275)
-0205 [0036]
Other estimators -0083 (-106)
-0083 (-089)
-0083 [0610]
Service amp consumer goods -0381 (-160)
-0381 (-154)
-0381 [0452]
Financial firms
0250 (285)
0250 (249)
0250 [0052]
Industry firms
0078 (109)
0078 (097)
0078 [0422]
EU
-0092 (-113)
-0092 (-060)
-0092 [-0696]
Developing
0050 (064)
0050 (041)
0050 [0786]
UK
0058 (066)
0058 (043)
0058 [0722]
Other countries 0086 (095)
0086 (068)
0086 [0714]
F 7502 1977 1977 p(F) 0000 0000 Rsup2 0473 0473 0473 Adj Rsup2 0462
Observations 979 979 979 Notes All variables are as defined as in table 1 Dependent variable is dividend smoothing coefficient This panel contains specifications with the standard error of the estimated dividend smoothing as independent variable In Panel B the (squared) standard error is interacted with a dummy variable equal to 1 for dividend smoothing coefficients higher or lower or equal than 05 respectively t-values in parentheses p values in brackets significance at the 1 5 10 level Squared standard errors of adjustment coefficients are used as weights Reference category classical Lintner model for pre 1998 US data estimated with OLS
52
Panel B
Variable
Robust se
(1)
Robust se
(2)
Cluster
robust se by study
(3)
Cluster
robust se by study
(4)
Wild bootstrap se clustered by
study (5)
Wild bootstrap se clustered by
study (6)
Constant
0675 (925)
0657 (812)
0675 (478)
0657 (400)
0675 [0042]
0657 [0072]
SE (smoothingle05)
-7499 (-1307)
-7499 (-673)
-7499 [0002]
SE (smoothinggt05) 3591 (375)
3591 (257)
3591 [0004]
SEsup2 (smoothingle05) -11997 (-382)
-11997 (-344)
-11997 [0086]
SEsup2(smoothinggt05) 8195 (384)
8195 (246)
8195 [0022]
Working paper 0160 (270)
0161 (235)
0160 (245)
0161 (203)
0160 [0164]
0161 [0276]
Post 1998
-0081 (-191)
-0094 (-185)
-0081 (-151)
-0094 (-142)
-0081 [0258]
-0094 [0344]
No of years
-0006 (-240)
-0004 (-174)
-0006 (-144)
-0004 (-099)
-0006 [0386]
-0004 [0578]
Debt
-0019 (-027)
-0028 (-030)
-0019 (-024)
-0028 (-027)
-0019 [0938]
-0028 [0888]
Ownership
0082 (303)
0080 (255)
0082 (266)
0080 (210)
0082 [0000]
0080 [0000]
Size
0018 (033)
0029 (041)
0018 (023)
0029 (041)
0018 [0922]
0029 [0874]
Other
0017 (071)
0015 (049)
0017 (064)
0015 (042)
0017 [0610]
0015 [0710]
Cash Flow
0272 (431)
0350 (494)
0272 (295)
0350 (316)
0272 [0154]
0350 [0104]
GMM
-0092 (-136)
-0193 (-283)
-0092 (-106)
-0193 (-206)
-0092 [0468]
-0193 [0120]
Fixed effects
-0111 (-191)
-0187 (-298)
-0111 (-169)
-0187 (-256)
-0111 [0190]
-0187 [0062]
Other estimators -0017 (-025)
-0067 (-087)
-0017 (-025)
-0067 (-073)
-0017 [0902]
-0067 [-0640]
Service amp consumer goods -0281 (-140)
-0412 (-188)
-0281 (-145)
-0412 (-184)
-0281 [0434]
-0412 [0390]
Financial firms
0209 (271)
0235 (259)
0209 (251)
0235 (226)
0209 [0038]
0235 [0082]
Industry firms
-0011 (-020)
0026 (034)
-0011 (-017)
0026 (028)
-0011 [-0916]
0026 [0776]
EU
-0131 (-184)
-0135 (-167)
-0131 (-109)
-0135 (-089)
-0131 [-0476]
-0135 [0570]
Developing
-0001 (-001)
0037 (048)
-0001 (-001)
0037 (030)
-0001 [-0986]
0037 [0810]
UK
0032 (039)
0065 (075)
0032 (027)
0065 (048)
0032 [0890]
0065 [0722]
Other countries 0061 (078)
0093 (104)
0061 (059)
0093 (073)
0061 [0740]
0093 [0630]
F 9332 3475 9332 1588 p(F) 0000 0000 0000 0000 Rsup2 0608 0478 0478 0478 0608 0478 Adj Rsup2 0600 0467
Observations 979 979 979 979 979 979
53
Appendix
Table A1 Overview of studies estimating dividend smoothing coefficients
Authors Countries Time span No of firms No of estimates Method Mean
)ˆ(d Median
)ˆ(d Darling (1957) US 1921-1954 34 2 OLS 0495 0495
Brittain (1964) US 1920-1960 41 4 OLS 0716 0776
Mueller (1967) US 1957-1960 67 5 OLS amp other method 0877 0837 Turnovsky (1967) US 1948-1962 15 3 OLS 0594 0590 Feldstein (1970) UK 1953-1964 12 18 OLS amp other method 0567 0603 Mcdonald amp Nussenbaum (1975) France 1967-1968 2 7 OLS 0791 0802 Nakamura (1985)
Japan US
1964-1981 18 24 OLS 0680 0756
Mcdonald amp Soderstrom (1986) US 1965-1984 20 1 Fixed effects 0840 0840 Dharan (1988) US 1981-1983 3 6 OLS 0933 0947 Nakamura (1989) US 1960-1982 23 48 OLS 0701 0779 Mookerjee (1992) India 1950-1981 32 8 Other method 0255 0240 Behm amp Zimmermann (1993) Germany 1962-1988 32 8 OLS 0813 0812 Sembenelli (1993) Italy 1962-1988 27 6 OLS amp GMM 0703 0733 Hines (1996) US 1984-1989 6 5 OLS 0596 0569 DeAngelo amp DeAngelo (2000) US 1958-1979 22 4 Other method 0268 0270 Garrett amp Priestley (2000) US 1876-1997 122 3 Other method 0691 0670 Desai et al (2001) US 1982-1997 16 24 OLS Fixed effects amp
other method 0282 0279
Esteban amp Peacuterez (2001) 22 European countries
1991-1998 8 1 GMM 0342 0342
Rahman (2002) 28 1992-1999 8 57 OLS 0900 0945
54
countries Short et al (2002) UK 1988-1992 5 3 OLS 0556 0622 Vasiliou amp Eriotis (2002) Greece 1996-2001 6 4 OLS amp Fixed effects 0530 0530 Adelegan (2003) Nigeria 1984-1997 14 5 OLS 1358 1405 Gugler amp Yurtoglu (2003) Germany 1992-1998 7 6 Fixed effects 0400 0414 Kumar (2003) India 1994-2000 7 28 OLS amp Fixed effects 0500 0729 Pandey (2003) Malaysia 1993-2000 8 7 Fixed effects 0391 0432 Perez-Gonzalez (2003) US 1980-1999 20 2 Fixed effects 0503 0503 Benzinho (2004) Portugal 1990-2002 34 1 Other method 0352 0352 Correia da Silva et al (2004) Germany 1984-1993 10 24 OLS Fixed effects
GMM amp other method 0641 0684
Omet (2004) Jordania 1985-1999 15 3 OLS Fixed effects amp other method
0631 0681
Powell et al (2004) US 1927-1996 70 2 OLS 0788 0788 Trojanowski (2004) UK 1992-1998 7 11 GMM 0253 0270 Karathanassis amp Chrysanthopoulou (2005) Greece 1996-1998 3 32 Fixed effects amp other
method 0265 0266
Aivazian et al (2006) US 1981-1999 19 1 Fixed effects 0089 0089 Foerster amp Sapp (2006) Canada 1871-2003 133 4 OLS 0787 0785 Khan (2006) UK 1985-1997 330 6 OLS amp GMM 0674 0677 Naceur et al (2006) Tunisia 1996-2002 7 24 OLS Fixed effects
GMM amp other method 0334 0264
Sura et al (2006) India 2003-2004 2 43 OLS 0475 0503 Ameer (2007) Malaysia 1995-2005 11 3 OLS 0633 0595 Benhamouda (2007) UK 2000-2004 5 20 OLS amp Fixed effects 0127 0031 Bodla et al (2007) India 1996-2006 11 32 OLS 0485 0506 Dai (2007) Norway 1989-1998 10 5 Other method 0763 0764 Hines et al (2007) US 1982-2002 21 29 OLS Fixed effects amp
other method 0241 0239
Pal amp Goyal (2007) India 1997-1998 2 9 OLS 0920 0852 Pandey amp Bhat (2007) India 1989-1997 9 8 GMM 0259 0258
55
Renneboog amp Trojanowski (2007) UK 1992-1998 7 6 GMM 0313 0305 Ahmed amp Javid (2008) Pakistan 2001-2006 6 16 OLS Fixed effects
GMM amp other method 0549 0705
Ameer (2008) Malaysia 1995-2005 11 7 OLS 0525 0576 Baba amp Ueno (2008) Japan 1990-2003 14 1 GMM 0657 0657 Haddad et al (2008) Jordania 1996-2002 7 6 OLS amp GMM 0409 0373 Ahmed amp Javid (2009) Pakistan 2001-2006 6 12 OLS Fixed effects
GMM amp other method 0532 0500
Al-Najjar (2009) Jordania 1994-2003 10 3 OLS Fixed effects amp other method
0495 0561
Alzahrani amp Lasfer (2009) 24 OECD countries
2000-2007 8 12 Fixed effects amp GMM 0240 0236
Andres et al (2009) Germany 1984-2005 22 20 OLS Fixed effects amp GMM
0683 0697
Hayunga amp Stephens (2009) UK 1992-2003 12 9 OLS amp other method 0663 0621 Mollah (2009) Bnagladesh 1988-2003 16 15 OLS 0730 0741 Raza et al (2009) Pakistan 2001-2006 6 1 OLS 0771 0771 Al-Ajmi (2010) Qatar 1997-2006 10 14 OLS 0873 0808 Al-Yahyaee et al (2010) Oman 1989-2004 16 1 Other method 0747 0747 Chemmanur et al (2010)
Hong Kong US
1984-2002 19 8 OLS 0623 0513
Korkeamaki et al (2010) Finland 2003-2006 4 10 OLS Fixed effects amp other method
0072 0110
Sudhahar amp Saroja (2010) India 1997-2007 11 3 OLS 0680 0715 Al-Yahyaee et al (2011) Oman 1989-2004 16 1 Other method 0059 0059 Baiyao (2011) US 1991-2007 17 1 OLS 0450 0450 Goncharov amp Triest (2011) Russia 2003-2006 4 7 OLS 0546 0377 Haleem amp Javid (2011) Pakistan 2007-2009 3 21 OLS 0898 0803 Hussain (2011) Saudia
Arabia 1990-2006 17 9 Fixed effects amp other
method 0546 0377
Kinfe (2011) Ethiopia 2006-2010 5 1 OLS 0191 0191 Mohsin amp Ashraf (2011) Pakistan 2001-2009 9 3 Fixed effects amp GMM amp
other method 0568 0626
56
Wang et al (2011) China 1998-2008 11 13 OLS amp other method 0448 0450 Abdullah et al (2012) Malaysia 2009-2010 2 1 OLS 0889 0889 Al-Najjar amp Belghitar (2012) UK 1991-2007 17 8 Fixed effects amp GMM amp
other method 0552 0568
Bawa amp Kaur (2012) India 2006-2006 1 24 OLS amp Fixed effects 0898 0847 Kamat amp Kamat (2012) India 1971-2007 37 9 GMM 0476 0401 Kumar amp Kumar Jha (2012) India 2007-2011 5 3 OLS 0039 0077 Baker et al (2013) Canada 1988-1999 12 2 OLS 0550 0550 Hutagalung et al (2013) Malaysia 2001-2010 10 1 Fixed effects 0856 0856 Kamat amp Kamat (2013) India 1975-1992 18 3 GMM 0534 0571 Kanoja amp Bhatia (2013) India 2007-2012 6 5 OLS 0587 0682 Persson (2013) Sweden 2005-2011 7 6 Fixed effects 0378 0225 Simegen (2013) Ethiopia 2002-2011 10 2 Fixed effects 0203 0203 Zameer et al (2013) Pakistan 2003-2009 7 1 OLS 0699 0699 Al-Malkawi et al (2014) Oman 2001-2010 10 2 Other method 0744 0744 Andres et al (2014) Germany 1984-2005 22 19 OLS amp GMM 0592 0501 Arko et al (2014) Sub-
Saharan African countries
1997-2007 11 9 OLS 0677 0662
Boţoc amp Pirtea (2014) 16 emerging countries
2003-2011 9 16 OLS amp GMM 0474 0487
Gunathilaka (2014) Sri Lanka 2006-2010 5 7 GMM 0273 0350 Tran amp Nguyen (2014) Vietnam 2006-2011 6 2 Fixed effects 0122 0122 Younis amp Javid (2014) Pakistan 2003-2011 9 6 Fixed effects amp other
method 0512 0570
Al-Attar et al (2015) Jordania 2006-2011 6 7 OLS 0506 0487 Andres et al (2015) Germany 1988-2008 21 3 OLS Fixed effects amp
GMM 0716 0681
Kim amp Jeon (2015) Korea 2000-2010 11 8 OLS Fixed effects amp other method
0614 0722
57
Renneboog amp Szilagyi (2015) Netherlands 1996-2004 9 8 GMM 0996 0825 Shinozaki amp Uchida (2015) 44
countries 2003-2013 11 1 Fixed effects 0788 0788
Athari et al (2016) 7 Arabian countries
2003-2012 10 4 GMM 0404 0407
Benavides et al (2016) Argentina 1995-2013 19 45 OLS 0650 0660 Brazil Chile Columbia Mexico Peru Bremberger et al (2016) 14 EU
countries 1986-2010 25 11 OLS Fixed effects amp
GMM 0510 0506
Chan et al (2016) US 1927-2013 87 2 OLS 0742 0742 Chen amp Sinha (2016) US 1996-2001 6 4 OLS 0739 0738 Naceur et al (2016) Tunisia 1996-2002 7 14 OLS Fixed effects
GMM amp other method 0160 0165
Source Authors literature search
58
Figure A1 Frequency distribution of dividend smoothing coefficients
050
100
150
Freq
uenc
y
-1 0 1 2 3Smoothing coefficient
Note The dividend smoothing is measured on the x-axis while the y-axis represents the frequency of dividend smoothing coefficients within the respective interval
Figure A2 Kernel density of dividend smoothing coefficients
05
11
5D
ensi
ty
-1 0 1 2 3Smoothing coefficient
e e de s y es a e
Note The dividend smoothing is measured on the x-axis while the y-axis represents the density of dividend smoothing coefficients estimated by Kernel density estimation
59
Figure A3 Funnel plot for the dividend smoothing coefficients (median)
0
20
40
60
80
100
120
140
160
0 05 1 15
Note The dividend smoothing is measured on the x-axis while the y-axis represents precision calculated as the inverse standard error The vertical line at 0671 indicates the ldquotruerdquo dividend smoothing as the mean of the 10 most precise smoothing coefficients The plot is based on median values of the dividend smoothing coefficients and precision per study
Figure A4 Frequency distribution of dividend smoothing coefficients (median)
Figure A5 Kernel density of dividend smoothing coefficients (median)
010
2030
Freq
uenc
y
0 5 1 15Smoothing coefficient
05
11
52
Den
sity
0 5 1 15Smoothing coefficient
y
Note Figure A4 (left-hand side) The dividend smoothing is measured on the x-axis while the y-axis represents the frequency of dividend smoothing coefficients within the respective interval The figure is based on median values of the dividend smoothing coefficients and precision per study
Note Figure A5 (right-hand side) The dividend smoothing is measured on the x-axis while the y-axis represents the density of dividend smoothing coefficients estimated by Kernel density estimation The figure is based on median values of the dividend smoothing coefficients and precision per study
60
Table A2 Bayesian averaging of models (8) (9) and (10)
Variable Post mean (Post SE) PIP
Robust se
Post mean (Post SE) PIP
Robust se Post mean
(Post SE) PIP
Robust se
Constant
0682 (1998)
100 0705 (1408)
0583 (2555)
100 0579 (818)
0641 (2016)
100 0654 (1153)
SE
-0264 (-181)
084 -2379 (-430)
SE (smoothingle05)
-1150 (-1441)
100 -7390 (-1027)
SE (smoothinggt05) 1701 (1591)
100 3568 (351)
SEsup2 (smoothingle05) -0678 (-708)
100 -12513 (-385)
SEsup2(smoothinggt05) 3941 (1259)
100 5238 (217)
Working paper 0043 (089)
050
0102 (402)
100 0239 (337)
0110 (328)
098 0271 (487)
Post 1998
-0087 (-331)
099 -0077 (-197)
-0119 (-646)
100 -0088 (-186)
-0101 (-447)
100 -0064 (-114)
No of years
0000 (007)
004
0000 (004)
004 0000 (029)
011
Debt
-0000 (-004)
003
0000 (011)
004 -0002 (-004)
003
Ownership
0000 (000)
003
0006 (038)
038 0000 (004)
003
Size
0001 (014)
005
0000 (003)
003 0000 (004)
004
Other
-0000 (-005)
003
-0004 (-036)
015 -0001 (-015)
005
Cash Flow
0168 (551)
100 0370 (525)
0095 (376)
099 0219 (303)
0125 (447)
100 0329 (433)
GMM
-0241 (-838)
100 -0269 (-533)
-0136 (-617)
100 -0159 (-260)
-0223 (-872)
100 -0220 (-354)
Fixed effects
-0379 (-1322)
100 -0256 (-421)
-0239 (-1078)
100 -0121 (-185)
-0349 (-1368)
100 -0232 (-334)
Other estimators -0146 (-497)
100 -0149 (-232)
-0089 (-383)
099 0005 (007)
-0137 (-520)
100 -0099 (-117)
Service amp consumer goods 0128 (108)
061 -0415 (-152)
0004 (019)
006 0004 (018)
006
Financial firms
-0067 (-145)
075 0276 (340)
-0004 (-031)
012 -0035 (-090)
051 0271 (310)
Industry firms
0208 (498)
100 0007 (013)
0021 (058)
030 0084 (148)
076 0032 (051)
EU
0014 (044)
020
0009 (040)
018 0013 (042)
019
Developing
0045 (094)
055 0048 (105)
0064 (216)
090 0067 (099)
0035 (081)
047
UK
-0003 (-017)
008
0001 (006)
004 -0004 (-021)
009
Other countries 0056 (106)
061 0167 (315)
0080 (273)
095 0087 (106)
0030 (070)
039
n 979 979 979 979 979 979 Notes All variables are as defined as in table 1 Dependent variable is dividend smoothing coefficient t-values in parentheses p values in brackets All models estimated with robust standard errors significance at the 1 5 10 level Squared standard errors of adjustment coefficients are used as weights PIP refers to the posterior inclusion probability of the variables estimated by Bayesian modeling averaging Reference category classical Lintner model for pre 1998 US data estimated with OLS
61
Table A3 WLS FAT-PET meta-regression robustness checks
Variable Robust 05-quantile estimation WLS coefficients per study
Constant 0659 (2955)
0573 (4779)
0564 (3030)
0663 (4468)
0581 (2492)
0566 (4244)
SE -0628 (-359) -0752
(-557)
SE (smoothingle05) -1960 (-1336) -1381
(-403)
SE (smoothinggt05) 1585 (1172) 1497
(762)
SEsup2 (smoothingle05) -4534 (-152) -0636
(-351)
SEsup2(smoothinggt05) 5283 (801) 4899
(980) F 3100 9802 5561 p(F) 0000 0000 0000 R2 0020 0262 0090 0065 0390 0149 n 998 998 998 979 979 979
Note Dependent variable is dividend smoothing coefficient All models estimated with robust standard errors t-values in parentheses p values in brackets significance at the 1 5 10 level
62
Table A4 robustness checks of models (8) (9) and (10)
Variable Robust 05-quantile estimation WLS coefficients per study
Constant
0702 (2093)
0555 (1704)
0569 (1761)
0565 (1378)
0460 (1198)
0436 (1153)
SE -0619 (-692) -0663
(-692)
SE (smoothingle05) -1404
(-1274) -0979 (-405)
SE (smoothinggt05) 1397 (846) 1672
(764)
SEsup2 (smoothingle05) -2258 (-093) -0526
(-425) SEsup2(smoothinggt05) 3791
(547) 4682 (808)
Working paper 0078 (267)
0075 (221)
0112 (367)
0106 (357)
0157 (548)
0175 (607)
Post 1998
-0134 (-710)
-0151 (-1021)
-0156 (-893)
-0112 (-379)
-0125 (-517)
-0126 (-441)
No of years
0001 (234)
0001 (244)
0002 (268)
-0000 (-014)
0002 (150)
0003 (314)
Debt
-0027 (-069)
0038 (120)
-0045 (-143)
-0088 (-230)
-0042 (-135)
-0061 (-178)
Ownership
-0042 (-115)
0001 (003)
-0040 (-165)
0032 (136)
0072 (377)
0041 (182)
Size
0014 (039)
0009 (052)
0023 (071)
0026 (068)
0024 (079)
0030 (086)
Other
-0008 (-038)
-0034 (-219)
-0010 (-061)
0026 (112)
-0012 (-069)
0011 (051)
Cash Flow
0071 (258)
0041 (183)
0077 (459)
0136 (305)
0065 (175)
0098 (226)
GMM
-0281 (-1026)
-0170 (-942)
-0258 (-1160)
-0238 (-794)
-0169 (-678)
-0230 (-847)
Fixed effects
-0450 (-1807)
-0256 (-1139)
-0366 (-1847)
-0402 (-1410)
-0279 (-1161)
-0366 (-1332)
Other estimators -0159 (-536)
-0097 (-600)
-0147 (-704)
-0138 (-548)
-0085 (-433)
-0114 (-504)
Service amp consumer goods 0166 (211)
0050 (084)
0079 (066)
0524 (397)
0274 (268)
0327 (293)
Financial firms
-0037 (-120)
-0033 (-141)
-0053 (-184)
-0073 (-187)
-0058 (-177)
-0110 (-300)
Industry firms
0163 (579)
0065 (250)
0122 (776)
0313 (620)
0075 (221)
0098 (290)
EU
0079 (214)
0117 (361)
0107 (387)
0159 (452)
0103 (353)
0151 (444)
Developing
0116 (371)
0169 (607)
0171 (595)
0214 (511)
0176 (537)
0224 (564)
UK
0002 (005)
0079 (221)
0084 (248)
0072 (179)
0072 (217)
0084 (217)
Other countries 0111 (371)
0187 (607)
0162 (601)
0191 (505)
0178 (572)
0202 (567)
F 5135 7186 5798 p(F) 0000 0000 0000 Rsup2 0251 0389 0297 0417 0627 0489 n 998 998 998 979 979 979
Notes All variables are as defined as in table 1 Dependent variable is dividend smoothing coefficient All models estimated with robust standard errors t-values in parentheses p values in brackets significance at the 1 5 10 level Squared standard errors of adjustment coefficients are used as weights Reference category classical Lintner model for pre 1998 US data estimated with OLS
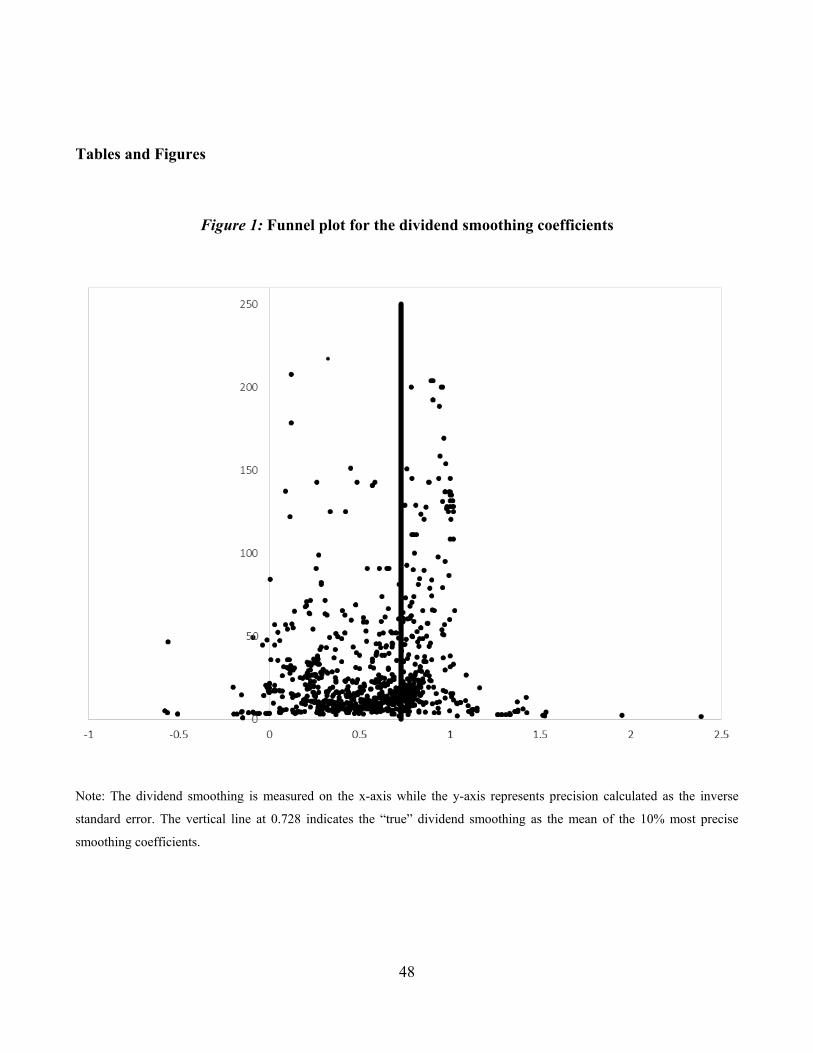
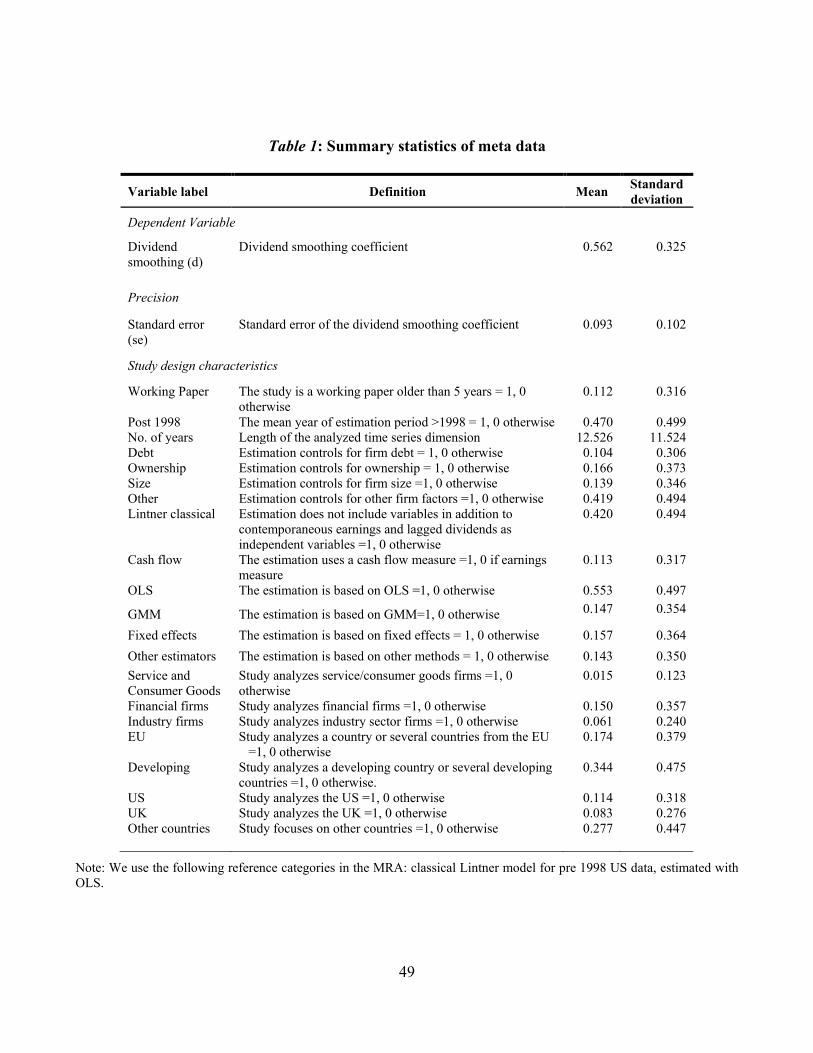
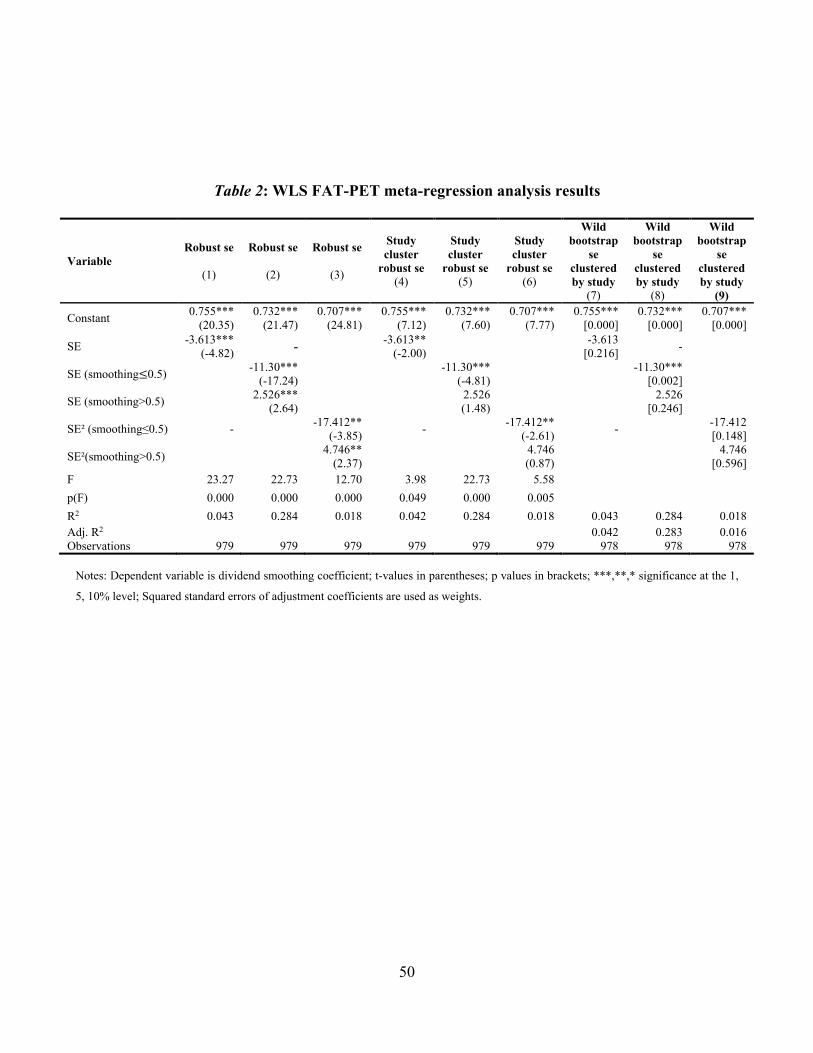
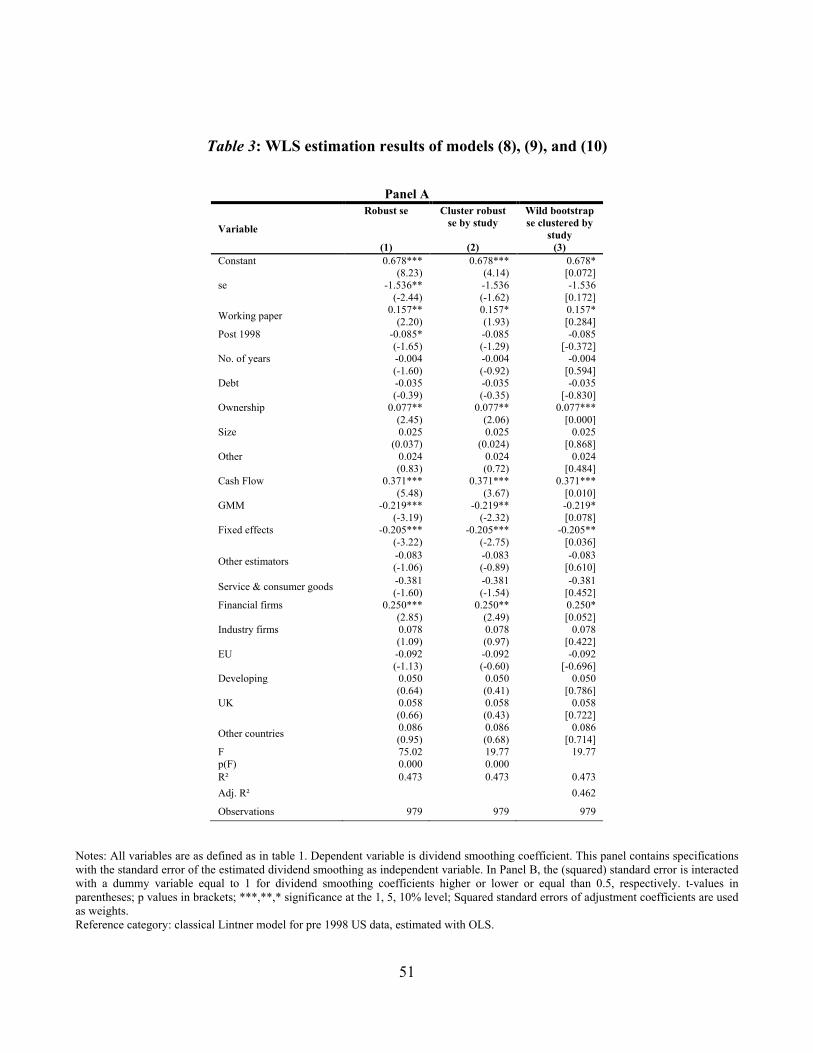
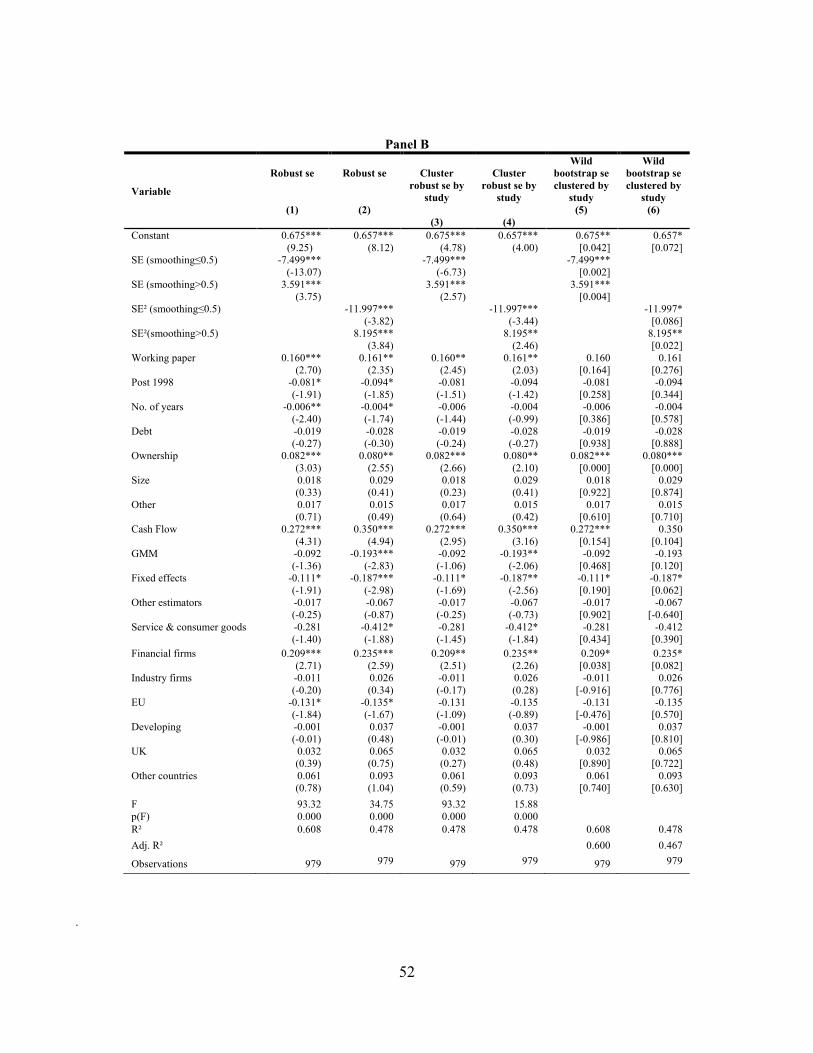
52
Panel B
Variable
Robust se
(1)
Robust se
(2)
Cluster
robust se by study
(3)
Cluster
robust se by study
(4)
Wild bootstrap se clustered by
study (5)
Wild bootstrap se clustered by
study (6)
Constant
0675 (925)
0657 (812)
0675 (478)
0657 (400)
0675 [0042]
0657 [0072]
SE (smoothingle05)
-7499 (-1307)
-7499 (-673)
-7499 [0002]
SE (smoothinggt05) 3591 (375)
3591 (257)
3591 [0004]
SEsup2 (smoothingle05) -11997 (-382)
-11997 (-344)
-11997 [0086]
SEsup2(smoothinggt05) 8195 (384)
8195 (246)
8195 [0022]
Working paper 0160 (270)
0161 (235)
0160 (245)
0161 (203)
0160 [0164]
0161 [0276]
Post 1998
-0081 (-191)
-0094 (-185)
-0081 (-151)
-0094 (-142)
-0081 [0258]
-0094 [0344]
No of years
-0006 (-240)
-0004 (-174)
-0006 (-144)
-0004 (-099)
-0006 [0386]
-0004 [0578]
Debt
-0019 (-027)
-0028 (-030)
-0019 (-024)
-0028 (-027)
-0019 [0938]
-0028 [0888]
Ownership
0082 (303)
0080 (255)
0082 (266)
0080 (210)
0082 [0000]
0080 [0000]
Size
0018 (033)
0029 (041)
0018 (023)
0029 (041)
0018 [0922]
0029 [0874]
Other
0017 (071)
0015 (049)
0017 (064)
0015 (042)
0017 [0610]
0015 [0710]
Cash Flow
0272 (431)
0350 (494)
0272 (295)
0350 (316)
0272 [0154]
0350 [0104]
GMM
-0092 (-136)
-0193 (-283)
-0092 (-106)
-0193 (-206)
-0092 [0468]
-0193 [0120]
Fixed effects
-0111 (-191)
-0187 (-298)
-0111 (-169)
-0187 (-256)
-0111 [0190]
-0187 [0062]
Other estimators -0017 (-025)
-0067 (-087)
-0017 (-025)
-0067 (-073)
-0017 [0902]
-0067 [-0640]
Service amp consumer goods -0281 (-140)
-0412 (-188)
-0281 (-145)
-0412 (-184)
-0281 [0434]
-0412 [0390]
Financial firms
0209 (271)
0235 (259)
0209 (251)
0235 (226)
0209 [0038]
0235 [0082]
Industry firms
-0011 (-020)
0026 (034)
-0011 (-017)
0026 (028)
-0011 [-0916]
0026 [0776]
EU
-0131 (-184)
-0135 (-167)
-0131 (-109)
-0135 (-089)
-0131 [-0476]
-0135 [0570]
Developing
-0001 (-001)
0037 (048)
-0001 (-001)
0037 (030)
-0001 [-0986]
0037 [0810]
UK
0032 (039)
0065 (075)
0032 (027)
0065 (048)
0032 [0890]
0065 [0722]
Other countries 0061 (078)
0093 (104)
0061 (059)
0093 (073)
0061 [0740]
0093 [0630]
F 9332 3475 9332 1588 p(F) 0000 0000 0000 0000 Rsup2 0608 0478 0478 0478 0608 0478 Adj Rsup2 0600 0467
Observations 979 979 979 979 979 979
53
Appendix
Table A1 Overview of studies estimating dividend smoothing coefficients
Authors Countries Time span No of firms No of estimates Method Mean
)ˆ(d Median
)ˆ(d Darling (1957) US 1921-1954 34 2 OLS 0495 0495
Brittain (1964) US 1920-1960 41 4 OLS 0716 0776
Mueller (1967) US 1957-1960 67 5 OLS amp other method 0877 0837 Turnovsky (1967) US 1948-1962 15 3 OLS 0594 0590 Feldstein (1970) UK 1953-1964 12 18 OLS amp other method 0567 0603 Mcdonald amp Nussenbaum (1975) France 1967-1968 2 7 OLS 0791 0802 Nakamura (1985)
Japan US
1964-1981 18 24 OLS 0680 0756
Mcdonald amp Soderstrom (1986) US 1965-1984 20 1 Fixed effects 0840 0840 Dharan (1988) US 1981-1983 3 6 OLS 0933 0947 Nakamura (1989) US 1960-1982 23 48 OLS 0701 0779 Mookerjee (1992) India 1950-1981 32 8 Other method 0255 0240 Behm amp Zimmermann (1993) Germany 1962-1988 32 8 OLS 0813 0812 Sembenelli (1993) Italy 1962-1988 27 6 OLS amp GMM 0703 0733 Hines (1996) US 1984-1989 6 5 OLS 0596 0569 DeAngelo amp DeAngelo (2000) US 1958-1979 22 4 Other method 0268 0270 Garrett amp Priestley (2000) US 1876-1997 122 3 Other method 0691 0670 Desai et al (2001) US 1982-1997 16 24 OLS Fixed effects amp
other method 0282 0279
Esteban amp Peacuterez (2001) 22 European countries
1991-1998 8 1 GMM 0342 0342
Rahman (2002) 28 1992-1999 8 57 OLS 0900 0945
54
countries Short et al (2002) UK 1988-1992 5 3 OLS 0556 0622 Vasiliou amp Eriotis (2002) Greece 1996-2001 6 4 OLS amp Fixed effects 0530 0530 Adelegan (2003) Nigeria 1984-1997 14 5 OLS 1358 1405 Gugler amp Yurtoglu (2003) Germany 1992-1998 7 6 Fixed effects 0400 0414 Kumar (2003) India 1994-2000 7 28 OLS amp Fixed effects 0500 0729 Pandey (2003) Malaysia 1993-2000 8 7 Fixed effects 0391 0432 Perez-Gonzalez (2003) US 1980-1999 20 2 Fixed effects 0503 0503 Benzinho (2004) Portugal 1990-2002 34 1 Other method 0352 0352 Correia da Silva et al (2004) Germany 1984-1993 10 24 OLS Fixed effects
GMM amp other method 0641 0684
Omet (2004) Jordania 1985-1999 15 3 OLS Fixed effects amp other method
0631 0681
Powell et al (2004) US 1927-1996 70 2 OLS 0788 0788 Trojanowski (2004) UK 1992-1998 7 11 GMM 0253 0270 Karathanassis amp Chrysanthopoulou (2005) Greece 1996-1998 3 32 Fixed effects amp other
method 0265 0266
Aivazian et al (2006) US 1981-1999 19 1 Fixed effects 0089 0089 Foerster amp Sapp (2006) Canada 1871-2003 133 4 OLS 0787 0785 Khan (2006) UK 1985-1997 330 6 OLS amp GMM 0674 0677 Naceur et al (2006) Tunisia 1996-2002 7 24 OLS Fixed effects
GMM amp other method 0334 0264
Sura et al (2006) India 2003-2004 2 43 OLS 0475 0503 Ameer (2007) Malaysia 1995-2005 11 3 OLS 0633 0595 Benhamouda (2007) UK 2000-2004 5 20 OLS amp Fixed effects 0127 0031 Bodla et al (2007) India 1996-2006 11 32 OLS 0485 0506 Dai (2007) Norway 1989-1998 10 5 Other method 0763 0764 Hines et al (2007) US 1982-2002 21 29 OLS Fixed effects amp
other method 0241 0239
Pal amp Goyal (2007) India 1997-1998 2 9 OLS 0920 0852 Pandey amp Bhat (2007) India 1989-1997 9 8 GMM 0259 0258
55
Renneboog amp Trojanowski (2007) UK 1992-1998 7 6 GMM 0313 0305 Ahmed amp Javid (2008) Pakistan 2001-2006 6 16 OLS Fixed effects
GMM amp other method 0549 0705
Ameer (2008) Malaysia 1995-2005 11 7 OLS 0525 0576 Baba amp Ueno (2008) Japan 1990-2003 14 1 GMM 0657 0657 Haddad et al (2008) Jordania 1996-2002 7 6 OLS amp GMM 0409 0373 Ahmed amp Javid (2009) Pakistan 2001-2006 6 12 OLS Fixed effects
GMM amp other method 0532 0500
Al-Najjar (2009) Jordania 1994-2003 10 3 OLS Fixed effects amp other method
0495 0561
Alzahrani amp Lasfer (2009) 24 OECD countries
2000-2007 8 12 Fixed effects amp GMM 0240 0236
Andres et al (2009) Germany 1984-2005 22 20 OLS Fixed effects amp GMM
0683 0697
Hayunga amp Stephens (2009) UK 1992-2003 12 9 OLS amp other method 0663 0621 Mollah (2009) Bnagladesh 1988-2003 16 15 OLS 0730 0741 Raza et al (2009) Pakistan 2001-2006 6 1 OLS 0771 0771 Al-Ajmi (2010) Qatar 1997-2006 10 14 OLS 0873 0808 Al-Yahyaee et al (2010) Oman 1989-2004 16 1 Other method 0747 0747 Chemmanur et al (2010)
Hong Kong US
1984-2002 19 8 OLS 0623 0513
Korkeamaki et al (2010) Finland 2003-2006 4 10 OLS Fixed effects amp other method
0072 0110
Sudhahar amp Saroja (2010) India 1997-2007 11 3 OLS 0680 0715 Al-Yahyaee et al (2011) Oman 1989-2004 16 1 Other method 0059 0059 Baiyao (2011) US 1991-2007 17 1 OLS 0450 0450 Goncharov amp Triest (2011) Russia 2003-2006 4 7 OLS 0546 0377 Haleem amp Javid (2011) Pakistan 2007-2009 3 21 OLS 0898 0803 Hussain (2011) Saudia
Arabia 1990-2006 17 9 Fixed effects amp other
method 0546 0377
Kinfe (2011) Ethiopia 2006-2010 5 1 OLS 0191 0191 Mohsin amp Ashraf (2011) Pakistan 2001-2009 9 3 Fixed effects amp GMM amp
other method 0568 0626
56
Wang et al (2011) China 1998-2008 11 13 OLS amp other method 0448 0450 Abdullah et al (2012) Malaysia 2009-2010 2 1 OLS 0889 0889 Al-Najjar amp Belghitar (2012) UK 1991-2007 17 8 Fixed effects amp GMM amp
other method 0552 0568
Bawa amp Kaur (2012) India 2006-2006 1 24 OLS amp Fixed effects 0898 0847 Kamat amp Kamat (2012) India 1971-2007 37 9 GMM 0476 0401 Kumar amp Kumar Jha (2012) India 2007-2011 5 3 OLS 0039 0077 Baker et al (2013) Canada 1988-1999 12 2 OLS 0550 0550 Hutagalung et al (2013) Malaysia 2001-2010 10 1 Fixed effects 0856 0856 Kamat amp Kamat (2013) India 1975-1992 18 3 GMM 0534 0571 Kanoja amp Bhatia (2013) India 2007-2012 6 5 OLS 0587 0682 Persson (2013) Sweden 2005-2011 7 6 Fixed effects 0378 0225 Simegen (2013) Ethiopia 2002-2011 10 2 Fixed effects 0203 0203 Zameer et al (2013) Pakistan 2003-2009 7 1 OLS 0699 0699 Al-Malkawi et al (2014) Oman 2001-2010 10 2 Other method 0744 0744 Andres et al (2014) Germany 1984-2005 22 19 OLS amp GMM 0592 0501 Arko et al (2014) Sub-
Saharan African countries
1997-2007 11 9 OLS 0677 0662
Boţoc amp Pirtea (2014) 16 emerging countries
2003-2011 9 16 OLS amp GMM 0474 0487
Gunathilaka (2014) Sri Lanka 2006-2010 5 7 GMM 0273 0350 Tran amp Nguyen (2014) Vietnam 2006-2011 6 2 Fixed effects 0122 0122 Younis amp Javid (2014) Pakistan 2003-2011 9 6 Fixed effects amp other
method 0512 0570
Al-Attar et al (2015) Jordania 2006-2011 6 7 OLS 0506 0487 Andres et al (2015) Germany 1988-2008 21 3 OLS Fixed effects amp
GMM 0716 0681
Kim amp Jeon (2015) Korea 2000-2010 11 8 OLS Fixed effects amp other method
0614 0722
57
Renneboog amp Szilagyi (2015) Netherlands 1996-2004 9 8 GMM 0996 0825 Shinozaki amp Uchida (2015) 44
countries 2003-2013 11 1 Fixed effects 0788 0788
Athari et al (2016) 7 Arabian countries
2003-2012 10 4 GMM 0404 0407
Benavides et al (2016) Argentina 1995-2013 19 45 OLS 0650 0660 Brazil Chile Columbia Mexico Peru Bremberger et al (2016) 14 EU
countries 1986-2010 25 11 OLS Fixed effects amp
GMM 0510 0506
Chan et al (2016) US 1927-2013 87 2 OLS 0742 0742 Chen amp Sinha (2016) US 1996-2001 6 4 OLS 0739 0738 Naceur et al (2016) Tunisia 1996-2002 7 14 OLS Fixed effects
GMM amp other method 0160 0165
Source Authors literature search
58
Figure A1 Frequency distribution of dividend smoothing coefficients
050
100
150
Freq
uenc
y
-1 0 1 2 3Smoothing coefficient
Note The dividend smoothing is measured on the x-axis while the y-axis represents the frequency of dividend smoothing coefficients within the respective interval
Figure A2 Kernel density of dividend smoothing coefficients
05
11
5D
ensi
ty
-1 0 1 2 3Smoothing coefficient
e e de s y es a e
Note The dividend smoothing is measured on the x-axis while the y-axis represents the density of dividend smoothing coefficients estimated by Kernel density estimation
59
Figure A3 Funnel plot for the dividend smoothing coefficients (median)
0
20
40
60
80
100
120
140
160
0 05 1 15
Note The dividend smoothing is measured on the x-axis while the y-axis represents precision calculated as the inverse standard error The vertical line at 0671 indicates the ldquotruerdquo dividend smoothing as the mean of the 10 most precise smoothing coefficients The plot is based on median values of the dividend smoothing coefficients and precision per study
Figure A4 Frequency distribution of dividend smoothing coefficients (median)
Figure A5 Kernel density of dividend smoothing coefficients (median)
010
2030
Freq
uenc
y
0 5 1 15Smoothing coefficient
05
11
52
Den
sity
0 5 1 15Smoothing coefficient
y
Note Figure A4 (left-hand side) The dividend smoothing is measured on the x-axis while the y-axis represents the frequency of dividend smoothing coefficients within the respective interval The figure is based on median values of the dividend smoothing coefficients and precision per study
Note Figure A5 (right-hand side) The dividend smoothing is measured on the x-axis while the y-axis represents the density of dividend smoothing coefficients estimated by Kernel density estimation The figure is based on median values of the dividend smoothing coefficients and precision per study
60
Table A2 Bayesian averaging of models (8) (9) and (10)
Variable Post mean (Post SE) PIP
Robust se
Post mean (Post SE) PIP
Robust se Post mean
(Post SE) PIP
Robust se
Constant
0682 (1998)
100 0705 (1408)
0583 (2555)
100 0579 (818)
0641 (2016)
100 0654 (1153)
SE
-0264 (-181)
084 -2379 (-430)
SE (smoothingle05)
-1150 (-1441)
100 -7390 (-1027)
SE (smoothinggt05) 1701 (1591)
100 3568 (351)
SEsup2 (smoothingle05) -0678 (-708)
100 -12513 (-385)
SEsup2(smoothinggt05) 3941 (1259)
100 5238 (217)
Working paper 0043 (089)
050
0102 (402)
100 0239 (337)
0110 (328)
098 0271 (487)
Post 1998
-0087 (-331)
099 -0077 (-197)
-0119 (-646)
100 -0088 (-186)
-0101 (-447)
100 -0064 (-114)
No of years
0000 (007)
004
0000 (004)
004 0000 (029)
011
Debt
-0000 (-004)
003
0000 (011)
004 -0002 (-004)
003
Ownership
0000 (000)
003
0006 (038)
038 0000 (004)
003
Size
0001 (014)
005
0000 (003)
003 0000 (004)
004
Other
-0000 (-005)
003
-0004 (-036)
015 -0001 (-015)
005
Cash Flow
0168 (551)
100 0370 (525)
0095 (376)
099 0219 (303)
0125 (447)
100 0329 (433)
GMM
-0241 (-838)
100 -0269 (-533)
-0136 (-617)
100 -0159 (-260)
-0223 (-872)
100 -0220 (-354)
Fixed effects
-0379 (-1322)
100 -0256 (-421)
-0239 (-1078)
100 -0121 (-185)
-0349 (-1368)
100 -0232 (-334)
Other estimators -0146 (-497)
100 -0149 (-232)
-0089 (-383)
099 0005 (007)
-0137 (-520)
100 -0099 (-117)
Service amp consumer goods 0128 (108)
061 -0415 (-152)
0004 (019)
006 0004 (018)
006
Financial firms
-0067 (-145)
075 0276 (340)
-0004 (-031)
012 -0035 (-090)
051 0271 (310)
Industry firms
0208 (498)
100 0007 (013)
0021 (058)
030 0084 (148)
076 0032 (051)
EU
0014 (044)
020
0009 (040)
018 0013 (042)
019
Developing
0045 (094)
055 0048 (105)
0064 (216)
090 0067 (099)
0035 (081)
047
UK
-0003 (-017)
008
0001 (006)
004 -0004 (-021)
009
Other countries 0056 (106)
061 0167 (315)
0080 (273)
095 0087 (106)
0030 (070)
039
n 979 979 979 979 979 979 Notes All variables are as defined as in table 1 Dependent variable is dividend smoothing coefficient t-values in parentheses p values in brackets All models estimated with robust standard errors significance at the 1 5 10 level Squared standard errors of adjustment coefficients are used as weights PIP refers to the posterior inclusion probability of the variables estimated by Bayesian modeling averaging Reference category classical Lintner model for pre 1998 US data estimated with OLS
61
Table A3 WLS FAT-PET meta-regression robustness checks
Variable Robust 05-quantile estimation WLS coefficients per study
Constant 0659 (2955)
0573 (4779)
0564 (3030)
0663 (4468)
0581 (2492)
0566 (4244)
SE -0628 (-359) -0752
(-557)
SE (smoothingle05) -1960 (-1336) -1381
(-403)
SE (smoothinggt05) 1585 (1172) 1497
(762)
SEsup2 (smoothingle05) -4534 (-152) -0636
(-351)
SEsup2(smoothinggt05) 5283 (801) 4899
(980) F 3100 9802 5561 p(F) 0000 0000 0000 R2 0020 0262 0090 0065 0390 0149 n 998 998 998 979 979 979
Note Dependent variable is dividend smoothing coefficient All models estimated with robust standard errors t-values in parentheses p values in brackets significance at the 1 5 10 level
62
Table A4 robustness checks of models (8) (9) and (10)
Variable Robust 05-quantile estimation WLS coefficients per study
Constant
0702 (2093)
0555 (1704)
0569 (1761)
0565 (1378)
0460 (1198)
0436 (1153)
SE -0619 (-692) -0663
(-692)
SE (smoothingle05) -1404
(-1274) -0979 (-405)
SE (smoothinggt05) 1397 (846) 1672
(764)
SEsup2 (smoothingle05) -2258 (-093) -0526
(-425) SEsup2(smoothinggt05) 3791
(547) 4682 (808)
Working paper 0078 (267)
0075 (221)
0112 (367)
0106 (357)
0157 (548)
0175 (607)
Post 1998
-0134 (-710)
-0151 (-1021)
-0156 (-893)
-0112 (-379)
-0125 (-517)
-0126 (-441)
No of years
0001 (234)
0001 (244)
0002 (268)
-0000 (-014)
0002 (150)
0003 (314)
Debt
-0027 (-069)
0038 (120)
-0045 (-143)
-0088 (-230)
-0042 (-135)
-0061 (-178)
Ownership
-0042 (-115)
0001 (003)
-0040 (-165)
0032 (136)
0072 (377)
0041 (182)
Size
0014 (039)
0009 (052)
0023 (071)
0026 (068)
0024 (079)
0030 (086)
Other
-0008 (-038)
-0034 (-219)
-0010 (-061)
0026 (112)
-0012 (-069)
0011 (051)
Cash Flow
0071 (258)
0041 (183)
0077 (459)
0136 (305)
0065 (175)
0098 (226)
GMM
-0281 (-1026)
-0170 (-942)
-0258 (-1160)
-0238 (-794)
-0169 (-678)
-0230 (-847)
Fixed effects
-0450 (-1807)
-0256 (-1139)
-0366 (-1847)
-0402 (-1410)
-0279 (-1161)
-0366 (-1332)
Other estimators -0159 (-536)
-0097 (-600)
-0147 (-704)
-0138 (-548)
-0085 (-433)
-0114 (-504)
Service amp consumer goods 0166 (211)
0050 (084)
0079 (066)
0524 (397)
0274 (268)
0327 (293)
Financial firms
-0037 (-120)
-0033 (-141)
-0053 (-184)
-0073 (-187)
-0058 (-177)
-0110 (-300)
Industry firms
0163 (579)
0065 (250)
0122 (776)
0313 (620)
0075 (221)
0098 (290)
EU
0079 (214)
0117 (361)
0107 (387)
0159 (452)
0103 (353)
0151 (444)
Developing
0116 (371)
0169 (607)
0171 (595)
0214 (511)
0176 (537)
0224 (564)
UK
0002 (005)
0079 (221)
0084 (248)
0072 (179)
0072 (217)
0084 (217)
Other countries 0111 (371)
0187 (607)
0162 (601)
0191 (505)
0178 (572)
0202 (567)
F 5135 7186 5798 p(F) 0000 0000 0000 Rsup2 0251 0389 0297 0417 0627 0489 n 998 998 998 979 979 979
Notes All variables are as defined as in table 1 Dependent variable is dividend smoothing coefficient All models estimated with robust standard errors t-values in parentheses p values in brackets significance at the 1 5 10 level Squared standard errors of adjustment coefficients are used as weights Reference category classical Lintner model for pre 1998 US data estimated with OLS
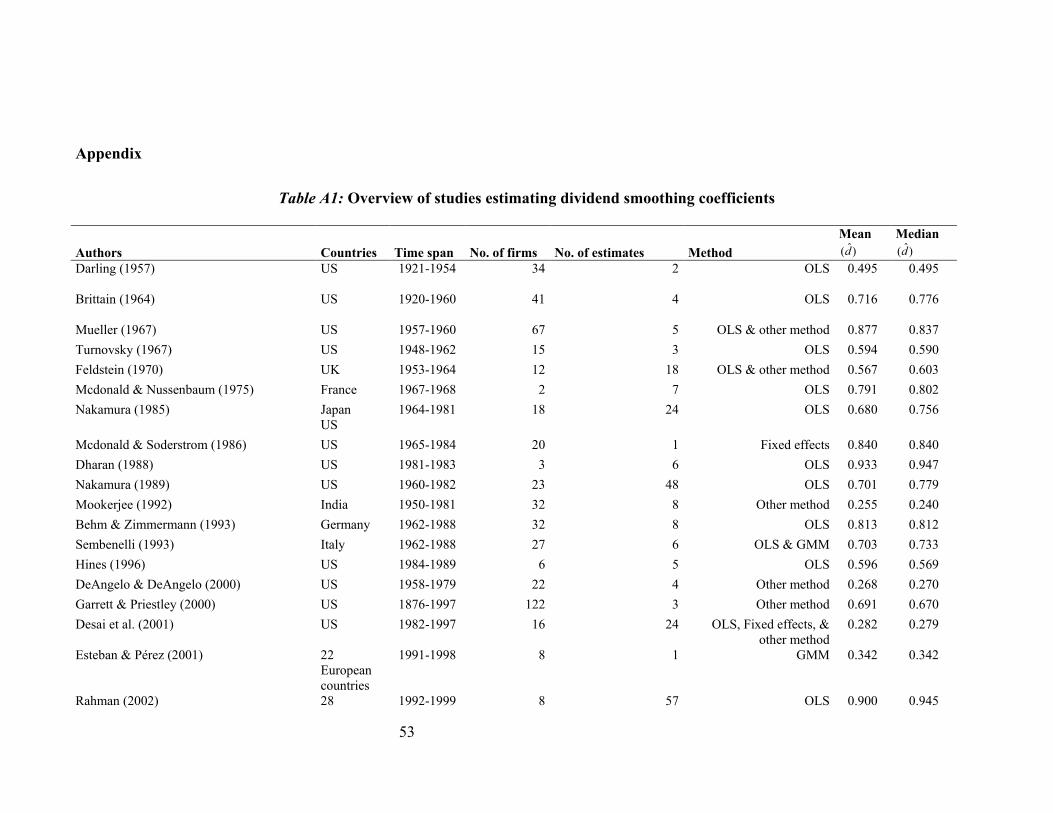
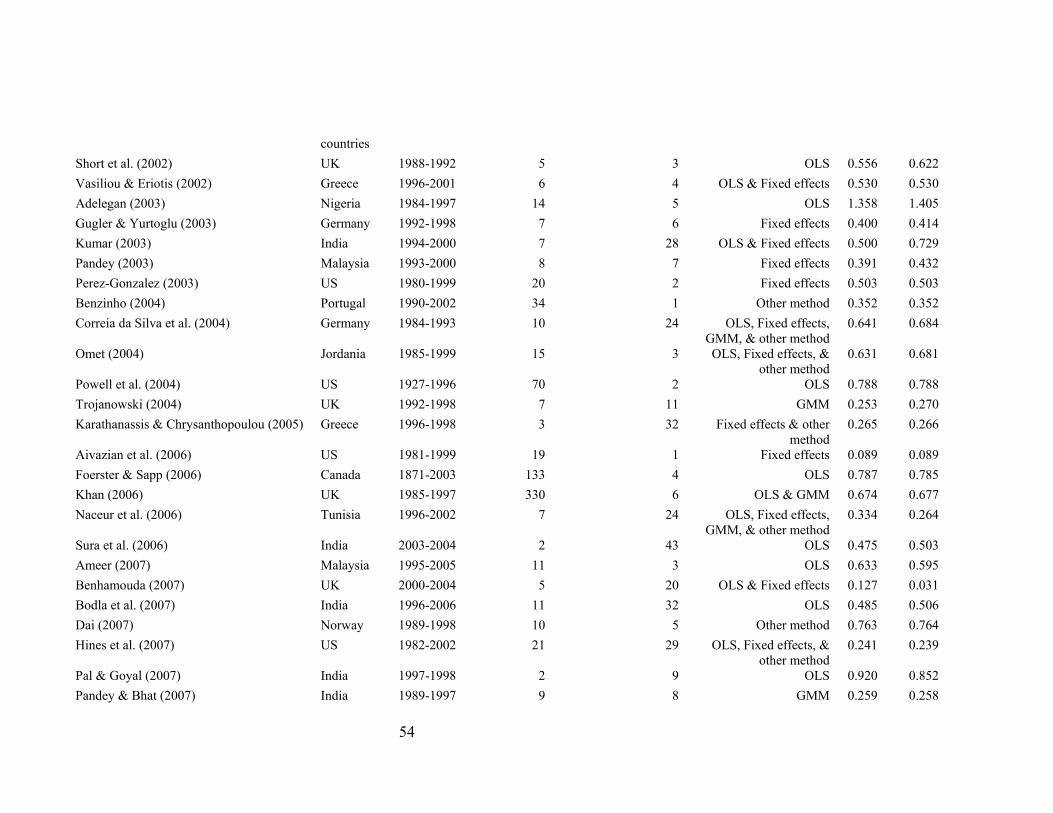
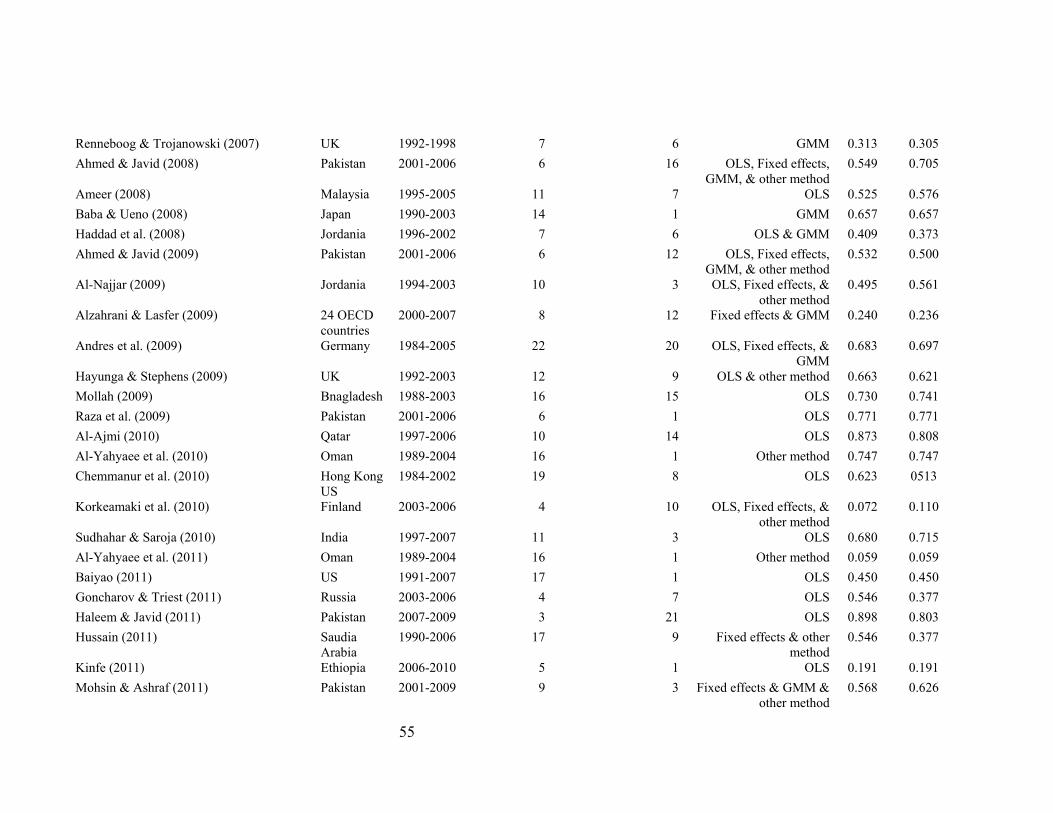
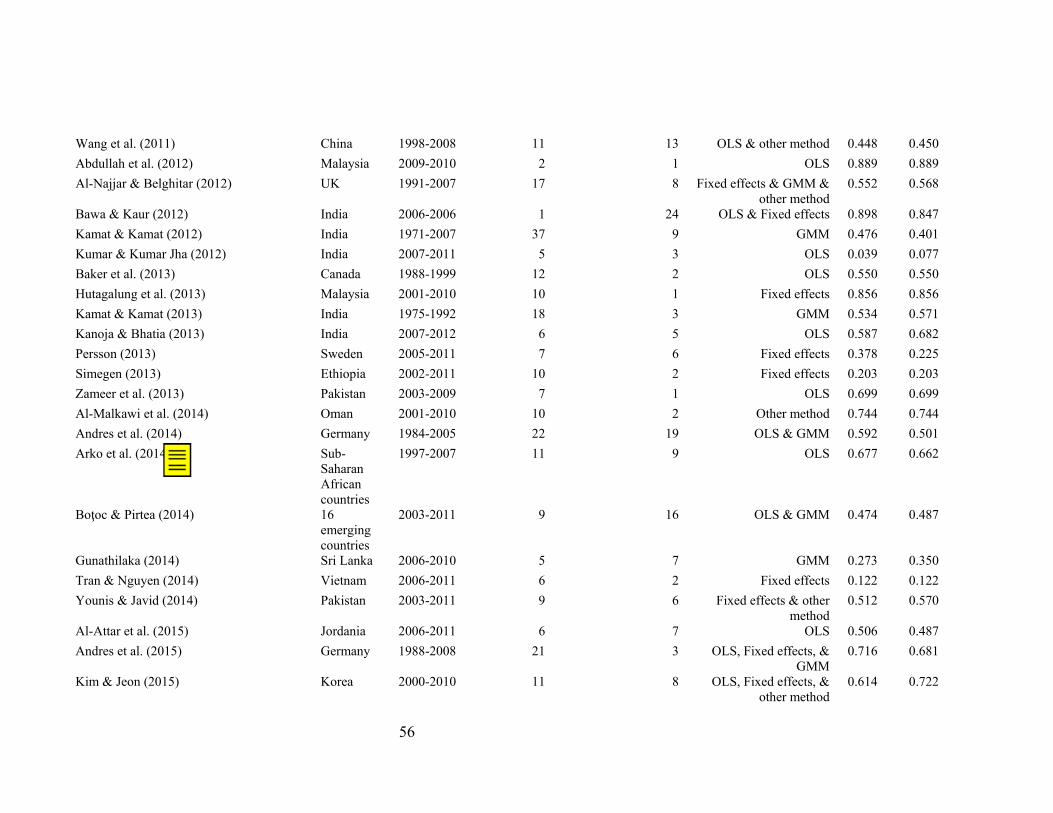
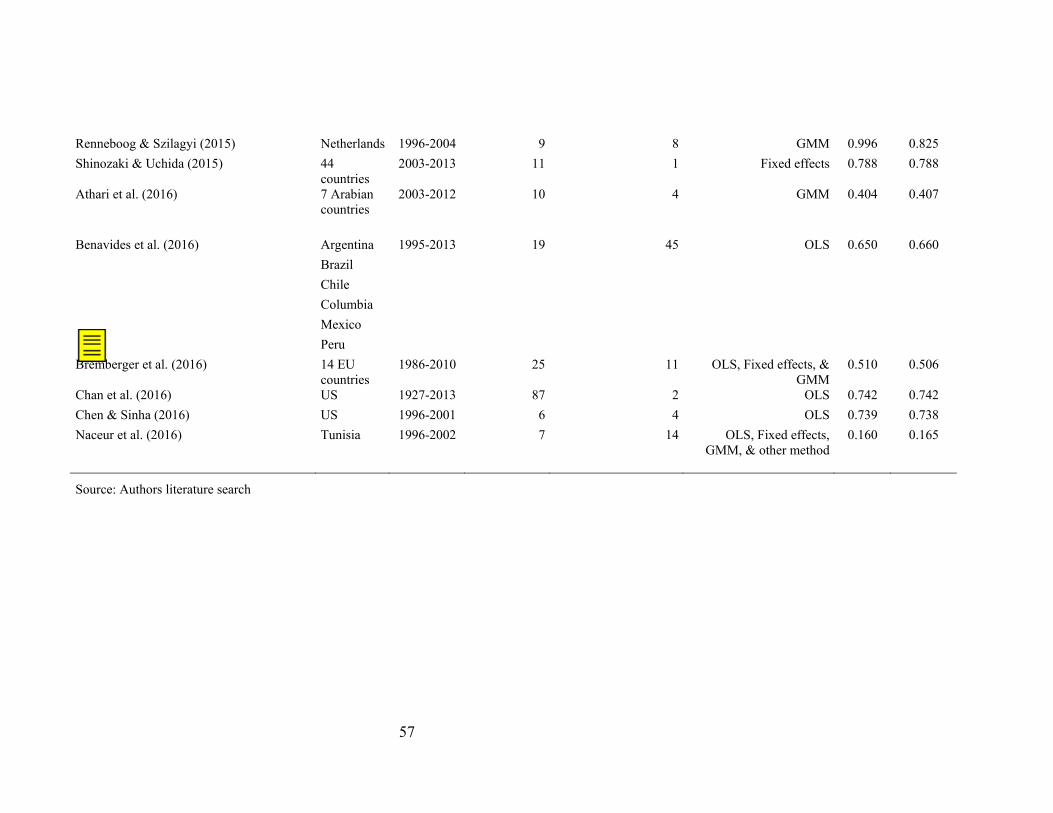
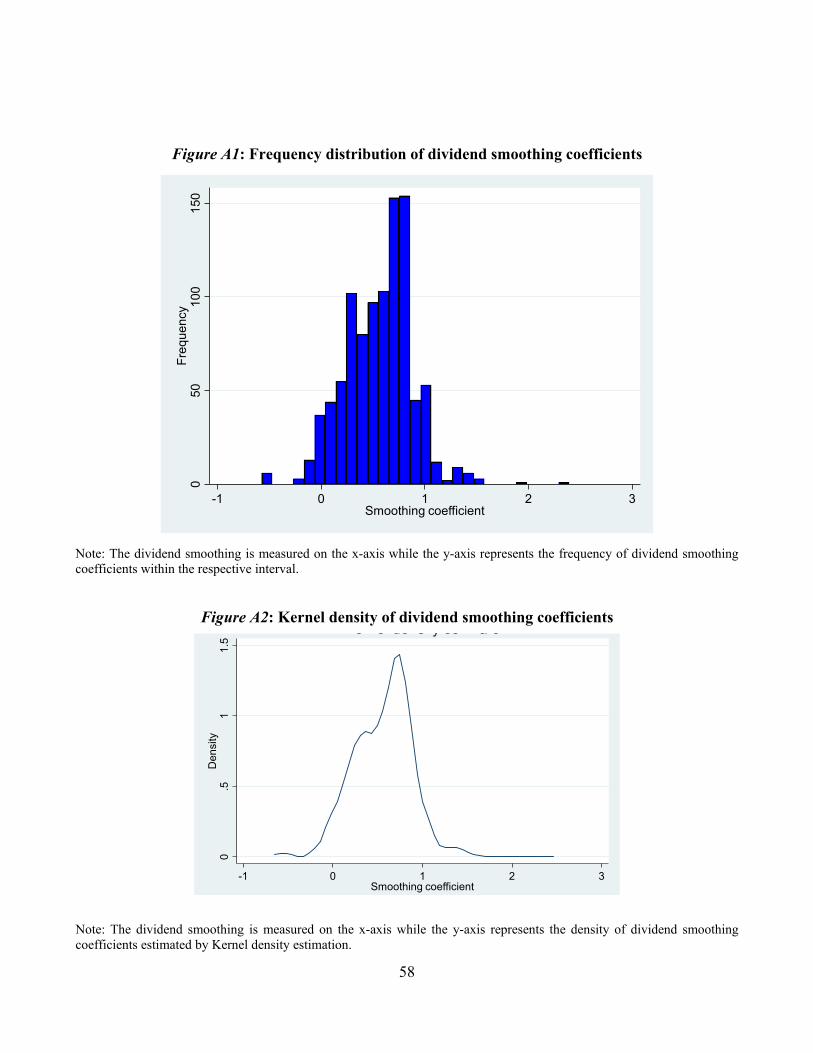
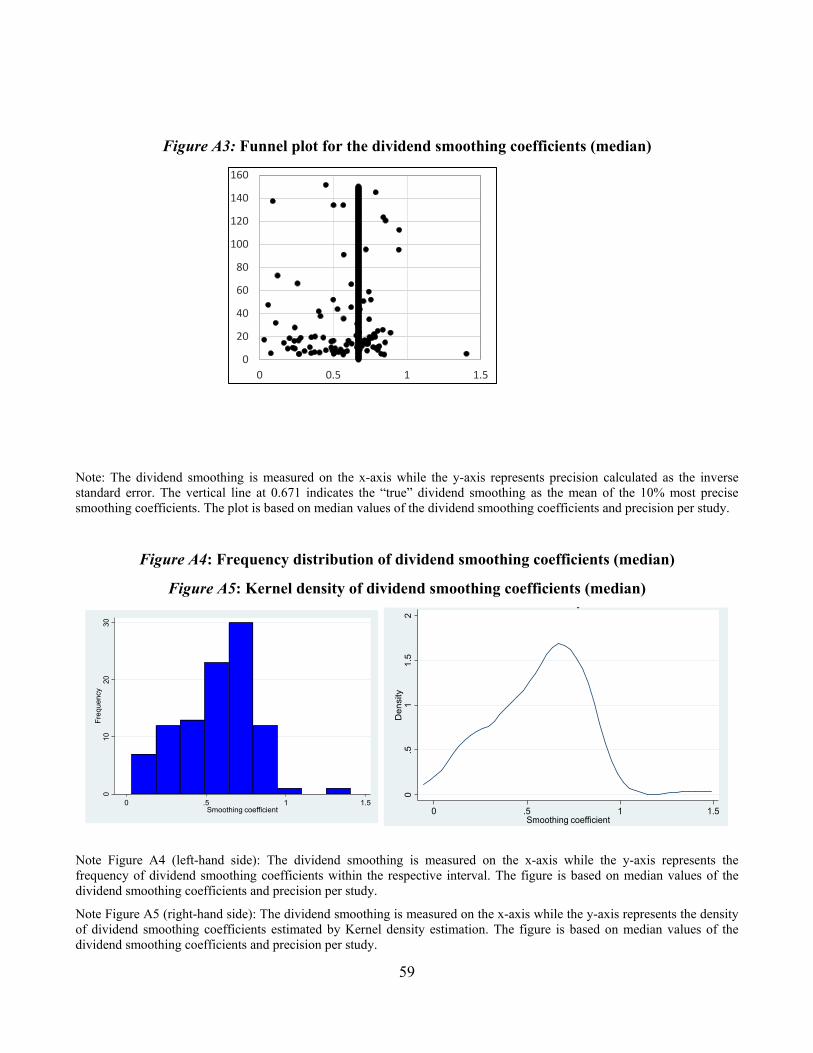
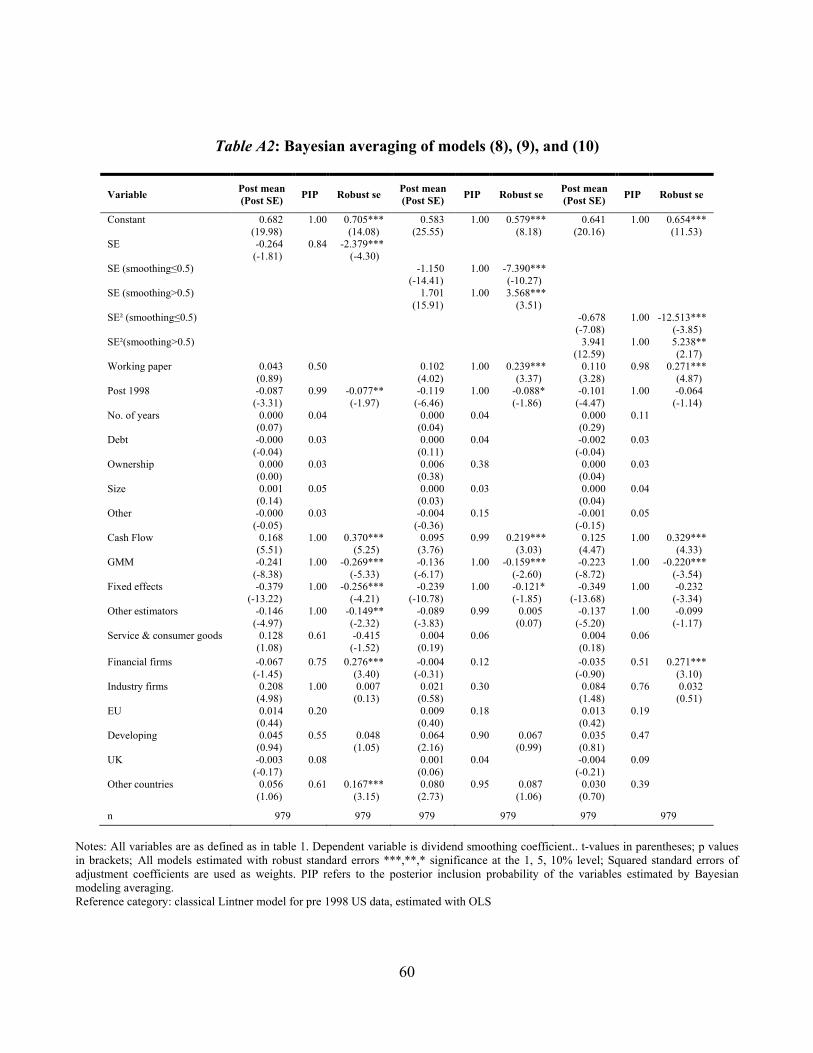
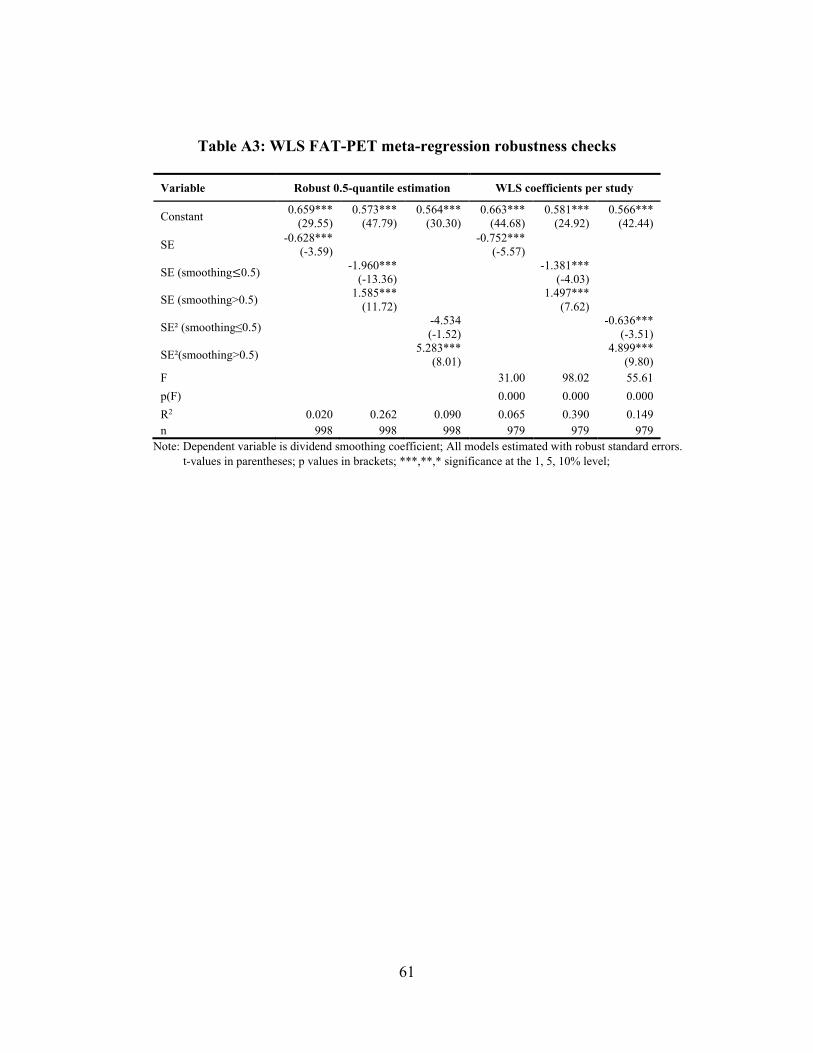
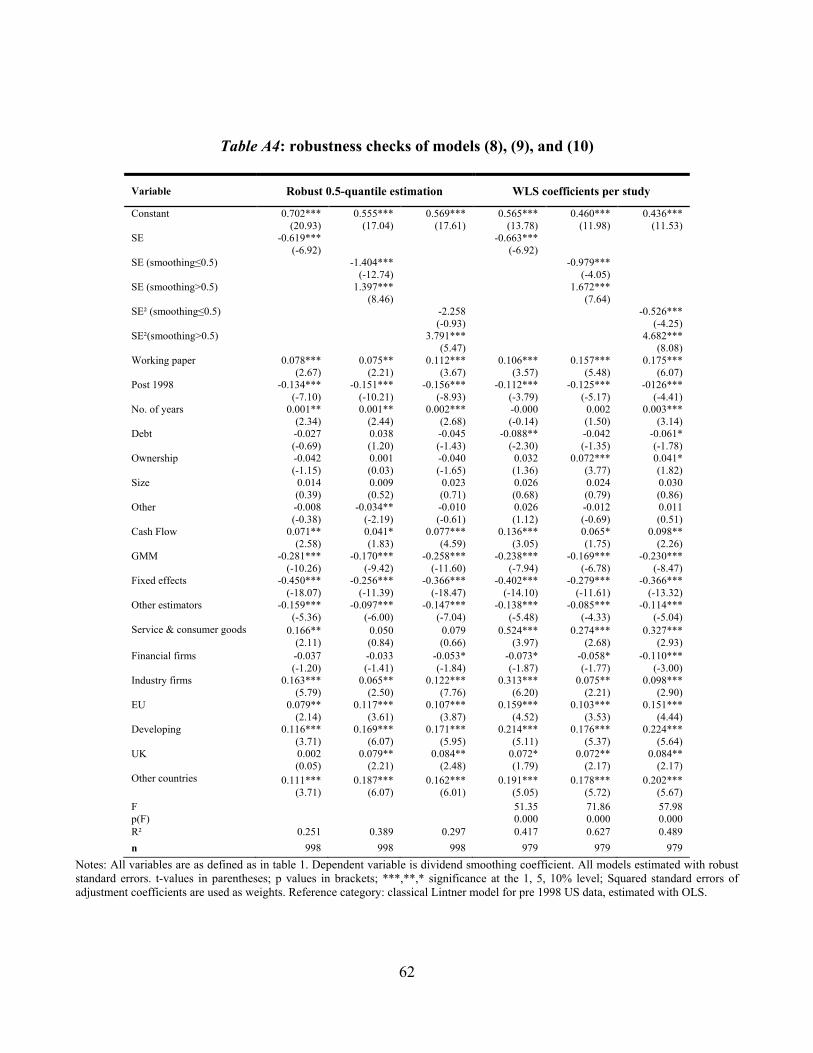


