Embed Size (px)
Citation preview
1
VNU Journal of Economics and Business Vol. 29, No. 5E (2013) 1-33
Determinants of Dividend Payments of Non-financial Listed Companies in Ho Chi Minh Stock Exchange
Nguyen Kim Thu1, Le Vinh Trien, Duong Thuy Tram Anh,Hoang Thanh Nhon
International University,Quarter 6, Linh Trung Ward, Thu Due Dist., Ho Chi Minh City, Vietnam
Received 20 December 2013 Revised 20 December 2013; Accepted 30 December2013
Abstract: This research aims to examine the determinants ofdividend payments of non-financial listed companies in the Ho ChiMinh Stock Exchange (HOSE) in the period 2007 to 2012. Using thePooled Ordinary Least Square and the Fixed effect model (FEM) forpanel data, the authors found that in HOSE, the profitability offirms is statistically significant and negatively related topayout ratio (DPR). In other words, companies tend to plow backmore earnings when profitability increases. Moreover, leveragehas a positive and statistically significant relationship withDPR. There are no statistically significant differences in DPRsamong accommodation services, mineral ore exploitation,investment consulting services and related services, supportingservices, scientific and technical services and the otherservices industry. Meanwhile, DPRs in the remaining industriesare statistically lower than those of the above-mentionedindustries.
Keywords: Dividend policy, listed companies, HOSE.
1. Introduction
Vietnamese companies have beenoperating in a difficult time sinceVietnam joined the World TradeOrganization (WTO) in 2007. Theyear 2007 can be considered as thethreshold when Vietnam opened itsdoor to the world market. However,
with low competitiveness, it hasbecome harder for Vietnamesecompanies to compete with theirforeign rivals, especially whentrade protection barriers have beengradually lowered according to WTOagreements. In such a difficultcontext, dividend policy, which ispart of financing policy, has
1 Corresponding author. Tel.: 84-902988770 E-mail: [email protected]
2 N.K. Thu et al. / VNU Journal of Economics and Business Vol. 29, No. 5E (2013) 16-33
become more important forVietnamese companies. The decisionof whether a company should pay outall its net income as dividends, orplow back part or all of its netincome for reinvestment, is the keydecision. If companies decide tokeep a high dividend payout ratio,they may please shareholders,especially when other channels ofinvestment such as real estate turnsour and deposit rates plummet.However, a high dividend payoutpolicy can be costly in case thecompanies have to search forexternal financing for theirinvestment projects. A low (or evenno) dividend payout policy, on theother hand, may save the companyfrom seeking outside financing. Yeta low dividend payout policy maynot attract short-term investorswho have the desire for currentincome.
In Vietnam, most studies ofdividend policy are qualitative innature. To the best knowledge ofthe authors, there have been noextensive studies on the dividendpolicy of Vietnamese listedcompanies during the 2007-2012period that use quantitativemodels to identify the keydeterminants of dividend payments.This paper fills the gap in theliterature review about dividendpolicy in Vietnam, particularly inHOSE during the 2007-2012 period.
This research aims to examinethe determinants of dividendpolicy of listed companies in HOSEfrom 2007 to 2012. Regarding thismain objective, this paper willaim to answer the following tworesearch questions:
-What are the firm-specificfactors that can affect thedividend policy of listedcompanies in HOSE?
-Are there any differences inthe dividend policy amongindustries?
Besides this section, this paperconsists of five more sections.Section 2 presents the theoreticalbackground of dividend policy andsummarizes previous empiricalstudies on determinants ofdividend policy. Section 3investigates the dividend paymentpractice of listed companies inHOSE. Section 4 introduces theregression model and section 5presents data analysis andfindings from the regressionresults. Finally, section 6concludes the paper.
2. Literature review
Dividend policy is an integralpart of a firm’s financingdecision. When a firm’sinvestments generate free cashflow, it must decide how to usethat cash. It can reinvest the
N.K. Thu et al. / VNU Journal of Economics and Business Vol. 29, No. 5E (2013) 16-33 3
cash in new investmentopportunities and increase thevalue of the firm. Alternatively,it can hold those funds to paycash out to shareholders. If thefirm decides to follow the latterapproach, it has two choices: Itcan either pay a dividend or itcan repurchase shares from currentowners.
Dividend is defined by Ross etal. (2007) as the payment made outof a firm’s earnings to its ownersin the form of either cash orstock. The most common type ofdividend is a cash dividend. Apublic company’s board ofdirectors determines the amount ofthe firm’s dividend. The boardsets the amount per share thatwill be paid and decides when thepayment will occur.
An alternative way to pay cashto investors is through a sharerepurchase. In this kind oftransaction, the firm uses cash tobuy shares of its own outstandingstock. These shares are generallyheld in the corporate treasury andthey can be resold if the companyneeds to raise money in thefuture.
Theories on dividend policy arederived from the pioneering workof Miller and Modigliani (M&M). Intheir seminar paper in 1961, M&Margued that the change in dividendpolicy does not affect the value
of a share of stock. Theirarguments were based on thefollowing assumptions: (1) Firmsare operating in perfect markets,which means that there are neithertaxes nor brokerage fees, and nosingle participant can affect themarket price of the securitythrough his or her trades; (2) Allindividuals have the same beliefsconcerning future investments,profits, and dividends, i.e.,these individuals have homogeneousexpectations; (3) The investmentpolicy of the firm is set ahead oftime, and is not altered bychanges in dividend policy. Giventhose assumptions, M&M establishedthat a firm’s value is affectedonly by its investment decisions,its earning power and businessrisks, but not by its dividendpolicy. The changes the managersmake in dividend policy can beundone by investors by eitherreinvesting dividends or sellingoff stocks to achieve theirdesired dividend stream.
However, real world financialmarkets do not satisfy the strictconditions of perfect capitalmarkets. The presence of marketimperfections, such as taxes,asymmetric information, agencycosts and transaction costsimplies that dividend policy isrelevant to the firm’s value underseveral contexts.
4 N.K. Thu et al. / VNU Journal of Economics and Business Vol. 29, No. 5E (2013) 16-33
There are two theories thatsupport the positive effect ofdividend payments on firm value.The first theory is the bird-in-hand theory proposed by Gordon andWalter (1963), which argues thatsince investors are risk- averse,they prefer the current dividendto a promise of a higher but riskyincome in the future. In otherwords, “One bird in the hand isworth more than two in the bush”.The second theory that favorsdividend payment is the agencycost theory, which was firstmentioned by Rozeff (1982) andEasterbrook (1984). The agencytheory implies that dividendpayments play the role of keepingcash away from managers, andtherefore, reduce the agency costsfor the company.
Two other theories recognize therelevance of dividend policy undercertain conditions. The signalingtheory (which was discussed inBhattacharya (1979, 1980), Ross(1977), Miller and Rock (1985))argues that in a world withasymmetric information, dividendpolicy affects stock prices whenthe dividend policy signals futureprospects of the firm. In thecontext where investors belong todifferent tax brackets, the taxclientele theory (pointed out in
John Graham and Alok Kumar(2006)), establishes that thedividend policy is relevant aslong as there remains a differencein the demand and supply of high-dividend paying stocks. As long asthe demand for high-dividend-paying stocks has been satisfied,dividend policy becomesirrelevant.
On the contrary, the transactioncost theory argues againstdividend payments (Fama (1974),Higgins (1972)). The transactioncost theory argues that firms withhigh transaction costs of equityor debt issuance should pay lessdividends, since it will cost themmore to raise external financingto meet investment needs. Thepecking-order theory (see Myers(1984), and Myers and Majluf(1984)) asserts that firms withmore investment opportunities payless dividends, since those firmsprefer internal financing toissuing securities to financetheir investment needs.Based on various theories, a numberof empirical studies have been conducted to research the determinants of dividend policy. A list of dividend policy determinants collected from empirical studies is provided in Table 1
.Independent Variable
Proxy Expectedsign
Explanation Supportingtheory
Authors
N.K. Thu et al. / VNU Journal of Economics and Business Vol. 29, No. 5E (2013) 16-33 5
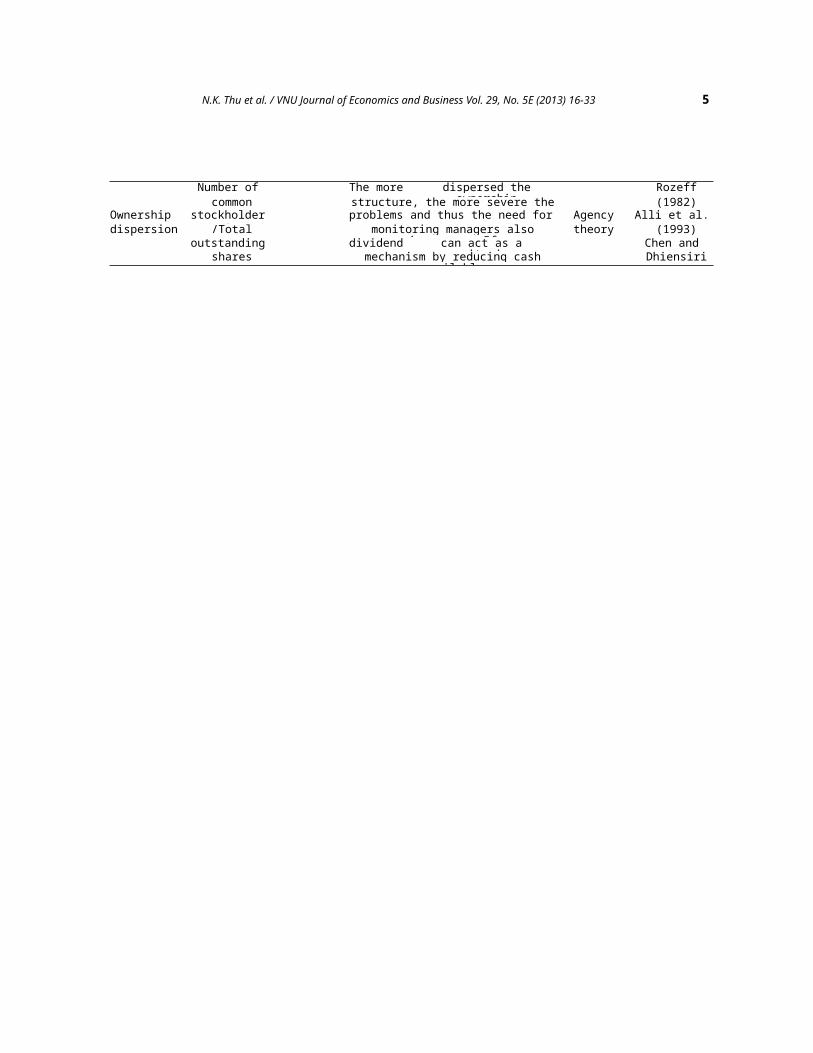
Number of The more dispersed theownership
Rozeffcommon structure, the more severe the
agency(1982)
Ownership stockholders
problems and thus the need for Agency Alli et al.dispersion /Total monitoring managers also
increases. Iftheory (1993)
outstanding dividends
can act as amonitoring
Chen andshares mechanism by reducing cash
availableDhiensiri
6 N.K. Thu et al. / VNU Journal of Economics and Business Vol. 29, No. 5E (2013) 16-33
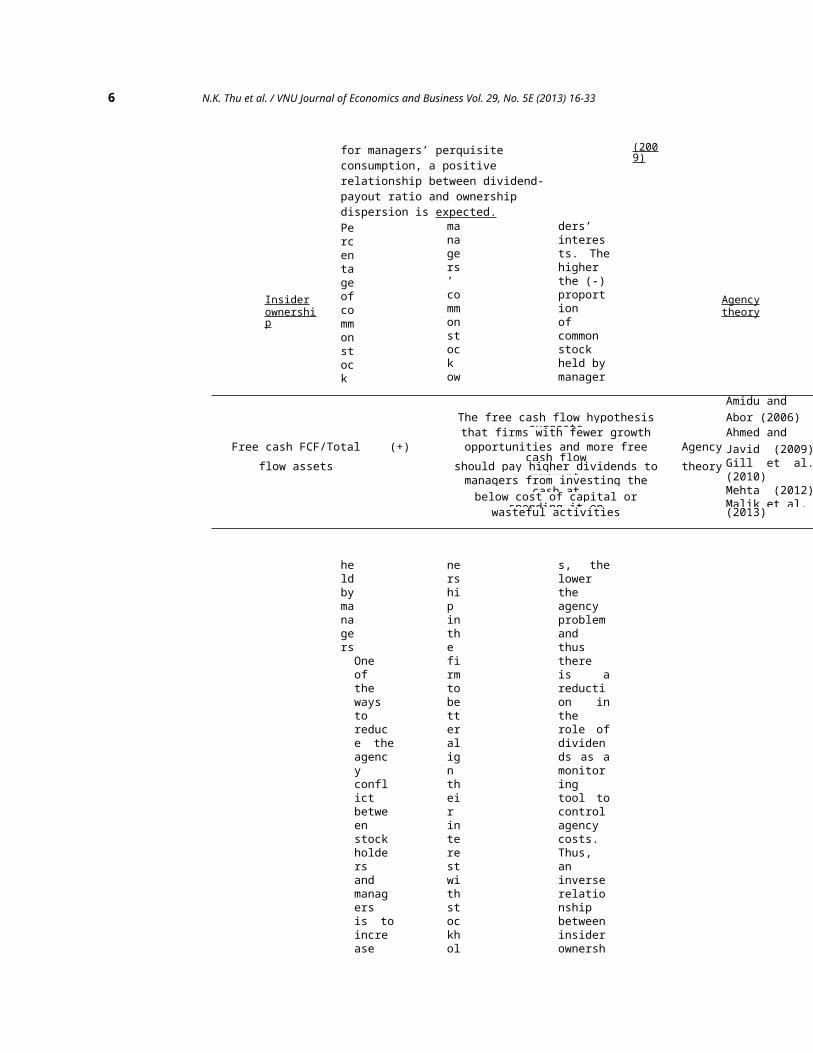
for managers’ perquisite consumption, a positive relationship between dividend- payout ratio and ownership dispersion is expected.Percentageofcommonstock
heldbymanagersOneofthewaystoreduce theagencyconflictbetweenstockholdersandmanagersis toincrease
managers’commonstockow
nershipinthefirmtobetteraligntheirinterestwithstockhol
ders’interests. Thehigherthe (-)proportionofcommonstockheld bymanager
s, thelowertheagencyproblemandthusthereis areduction intherole ofdividends as amonitoringtool tocontrolagencycosts.Thus,aninverserelationshipbetweeninsiderownersh
(2009)
Insiderownership
Agencytheory
Amidu andThe free cash flow hypothesis
suggestsAbor (2006)
that firms with fewer growth Ahmed andFree cash FCF/Total (+) opportunities and more free
cash flowAgency Javid (2009)
Gill et al.(2010)Mehta (2012)Malik et al.
flow assets should pay higher dividends toprevent
theorymanagers from investing the
cash atbelow cost of capital orspending it onwasteful activities (2013)
N.K. Thu et al. / VNU Journal of Economics and Business Vol. 29, No. 5E (2013) 16-33 7
ipanddividend-payoutratioisexpected.
Rozeff(1982)Alli etal. (1993)Chay andSuh (2009)Chen andDhiensiri (2009
)
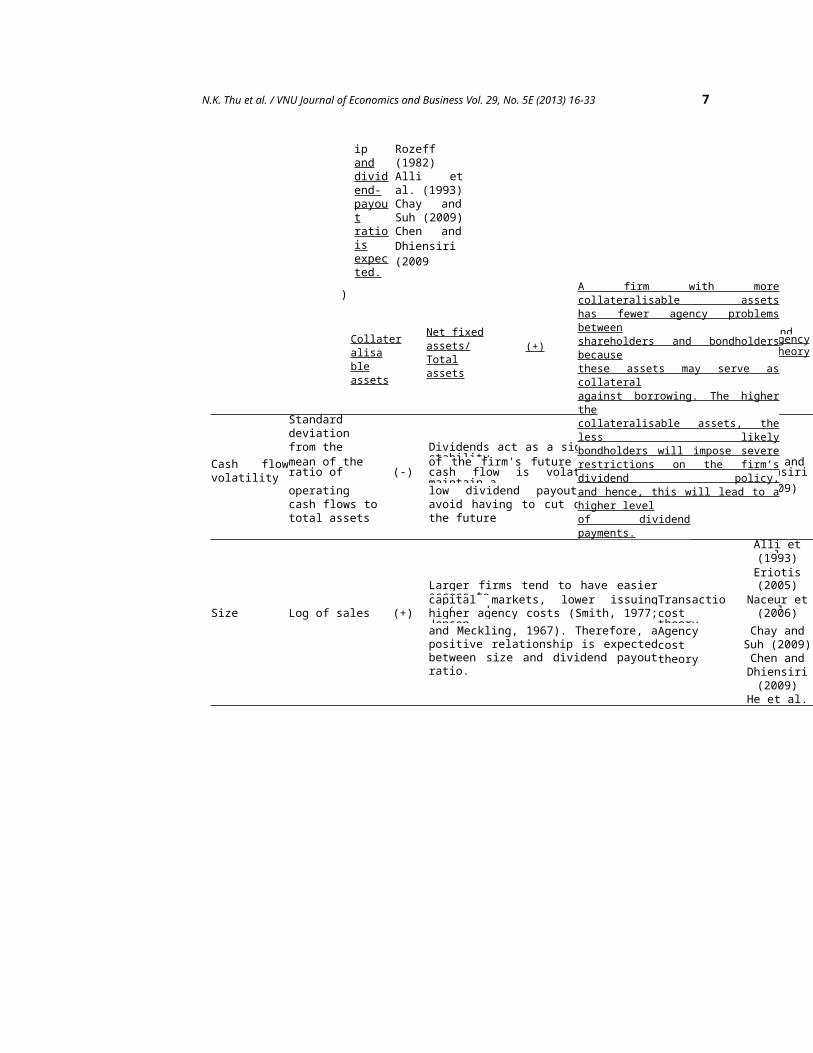
Net fixedassets/Totalassets
Chen andDhiensiri(2009)
Collateralisableassets
Agencytheory(+)
Standarddeviationfrom the Dividends act as a signal for the
stabilityCash flowvolatility
mean of the of the firm's future cash flows. Chen andratio of (-) cash flow is volatile, firms
maintain aSignaling Dhiensiri
operatingcash flows tototal assets
low dividend payout ratio toavoid having to cut dividends inthe future
theory (2009)
Alli etal.(1993)
EriotisLarger firms tend to have easieraccess to
(2005)capital markets, lower issuingcosts and
Transaction
Naceur etalSize Log of sales (+) higher agency costs (Smith, 1977;
Jensencosttheory
(2006)and Meckling, 1967). Therefore, apositive relationship is expectedbetween size and dividend payoutratio.
Agencycosttheory
Chay andSuh (2009)Chen andDhiensiri(2009)
He et al.
A firm with morecollateralisable assetshas fewer agency problemsbetweenshareholders and bondholdersbecausethese assets may serve ascollateralagainst borrowing. The higherthecollateralisable assets, theless likelybondholders will impose severerestrictions on the firm’sdividend policy,and hence, this will lead to ahigher levelof dividendpayments.
8 N.K. Thu et al. / VNU Journal of Economics and Business Vol. 29, No. 5E (2013) 16-33
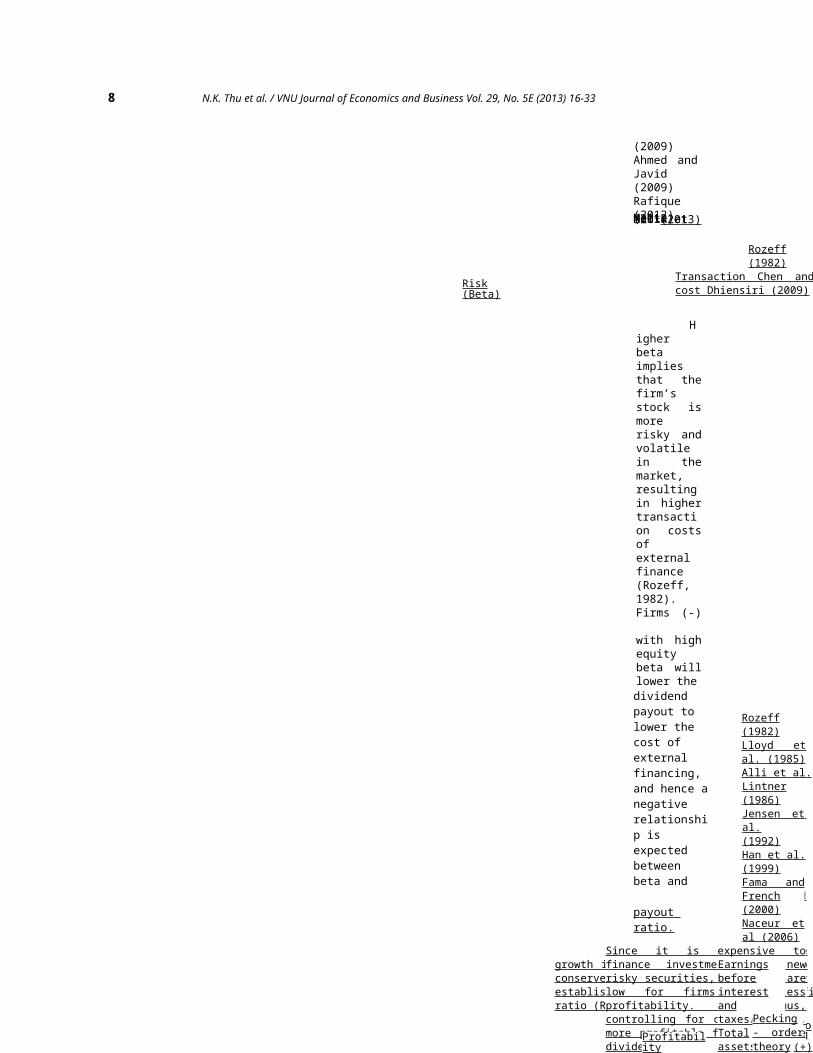
(2009)Ahmed andJavid(2009)Rafique(2012)Mehta (2012) Malik et al. (2013)
Higherbetaimpliesthat thefirm’sstock ismorerisky andvolatilein themarket,resultingin highertransaction costsofexternalfinance(Rozeff,1982).Firms (-)
with highequitybeta willlower thedividend payout to lower the cost of external financing, and hence anegative relationship is expected between beta and
payout ratio.
Rozeff(1982)
Transaction Chen andcost Dhiensiri (2009)Risk
(Beta)
Rozeff(1982)Lloyd etal. (1985)Alli et al.(1993)Collins etal. (1996)D’Souza(1999)Amidu andAbor(2006)Chen andDhiensiri(2009)He et(2009)Gill et(2009) Rafique (2012)Malik etal. (2013)
If past or anticipated futuregrowth is rapid, then managers tend toconserve funds for reinvestment byestablishing a (-) lower payout ratio (Rozeff, 1982). Hence
a negative relationship isexpected between growth rateand dividend payout.
Salesgrowth
Transaction
costGrowthal.al.
Lintner(1986)Jensen etal.(1992)Han et al.(1999)Fama andFrench(2000)Naceur etal (2006)He et al.(2009)Ahmed andJavid(2009)Al-Kuwari(2009)Gill et al.
Since it is expensive tofinance investment with newrisky securities, dividends arelow for firms with lessprofitability. Thus,controlling for other effects,more profitable firms pay moredividends.
Earningsbeforeinterestandtaxes/Totalassets
Pecking- ordertheory
Profitability (+)

N.K. Thu et al. / VNU Journal of Economics and Business Vol. 29, No. 5E (2013) 16-33 9
10 N.K. Thu et al. / VNU Journal of Economics and Business Vol. 29, No. 5E (2013) 16-33
(2010)Rafique(2012)Mehta(2012)Malik etal.(2013)
3.Dividendpaymentoflist
Lloyd etal. (1985)Crutchleyand Hansen(1989)Jensen etal. (1992)Agrawal andJayaraman(1994)Collins etal. (1996)D’Souza(1999)Faccio etal. (2001)Gugler andYurtoglu(2003) Al-Malkawi(2008)Naceur etal (2006)Al-Kuwari(2009)He et al.(2009)Ahmed andJavid(2009)Gill etal.(2009) Rafique (2012)Mehta(2012)Malik etal. (2013)
Financialleverage
Debt/Equity
(-)
-Firms that are highly levered tend tohave high transaction costs, which thenlead to a reduction in dividend paymentsin order to avoid the cost of external Pecking financing (Rozeff, 1982; Myers, 1984) ordertheory-When a firm obtains debt, it makes a Transactionfixed commitment to creditors, which cost theorythen reduces the discretionary funds Agencycostavailable to managers and subjects them theory to the scrutiny of debt-suppliers. As aresult, highly leveraged companies willpay lower dividends (Jensen, 1986)
Source: Authors’summary.
N.K. Thu et al. / VNU Journal of Economics and Business Vol. 29, No. 5E (2013) 16-33 11
edcompaniesinHOSEintheperiodof2007-2012
Datarelatedtothedividendpaymentsof286non-
financiallistedcompaniesinHOSEwascollectedfortheperiodfrom2007to2012.Fromthe
12 N.K. Thu et al. / VNU Journal of Economics and Business Vol. 29, No. 5E (2013) 16-33
database,wemakethefollowingobservationsonformsofdividendpaymentsanddividendpayo
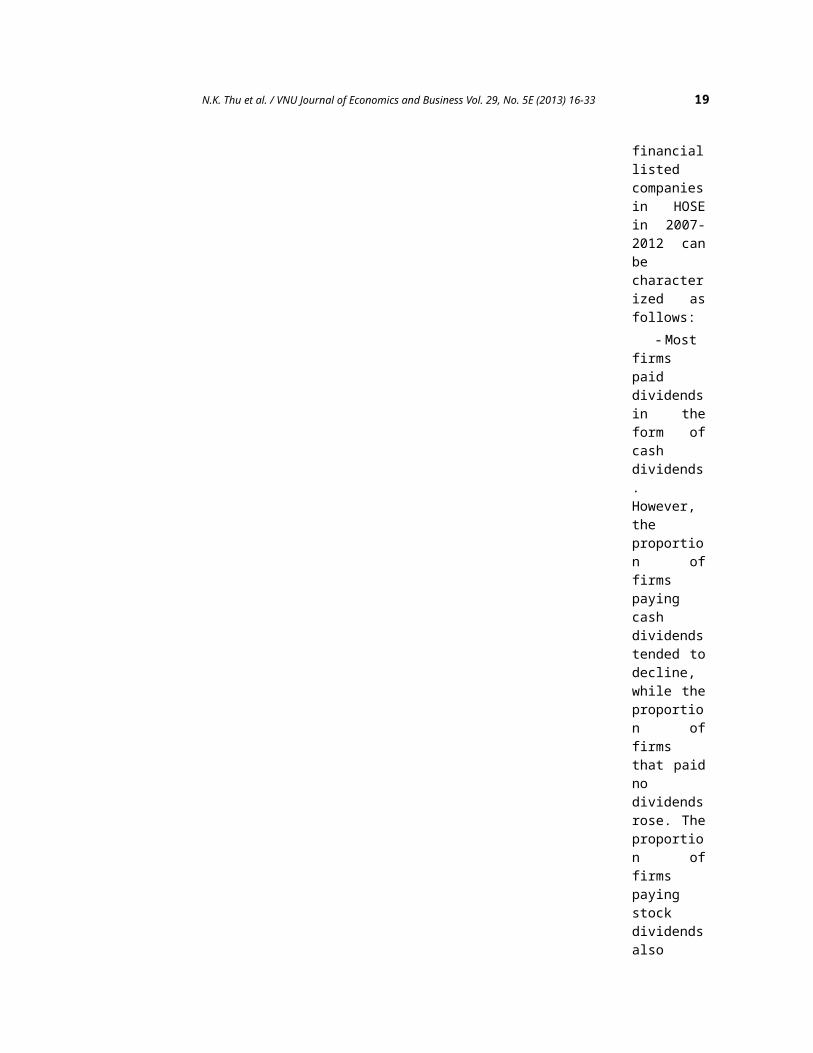
utratios.Figure1 shows thatmostfirms listedinHOSEpaida cashdividendduring2007-2012. On
N.K. Thu et al. / VNU Journal of Economics and Business Vol. 29, No. 5E (2013) 16-33 13
average,66.1% ofthe total numberoflistedfirms inHOSEpaida cashdividendinthe study period.
However,the proportiondeclinedinrecentyears,from75.8% in2008to46.8% in2012. Meanwhile,the
14 N.K. Thu et al. / VNU Journal of Economics and Business Vol. 29, No. 5E (2013) 16-33
proportionoffirms not payingany typeofdividends increased from1.9%in2007
to45.4% in2012. Asa result, in2012, the proportionoffirms thatdid not pa
yany
type ofdividendsapproximatelyequaledtheproportio
N.K. Thu et al. / VNU Journal of Economics and Business Vol. 29, No. 5E (2013) 16-33 15
n offirmsthat paidcashdividends. Firmsalsotended topay lessstockdividends. Thenumber offirmspayingstockdividendsaccountedfor 14.4%in 2007,however,thisproportion fell to2.8% in2012. Theproportion offirmspayingboth cashdividendsand stockdividendsalsodeclinedfrom16.3% in2007 to4.9% in2012(Datafileprovided

16 N.K. Thu et al. / VNU Journal of Economics and Business Vol. 29, No. 5E (2013) 16-33
byVietstockcompany).
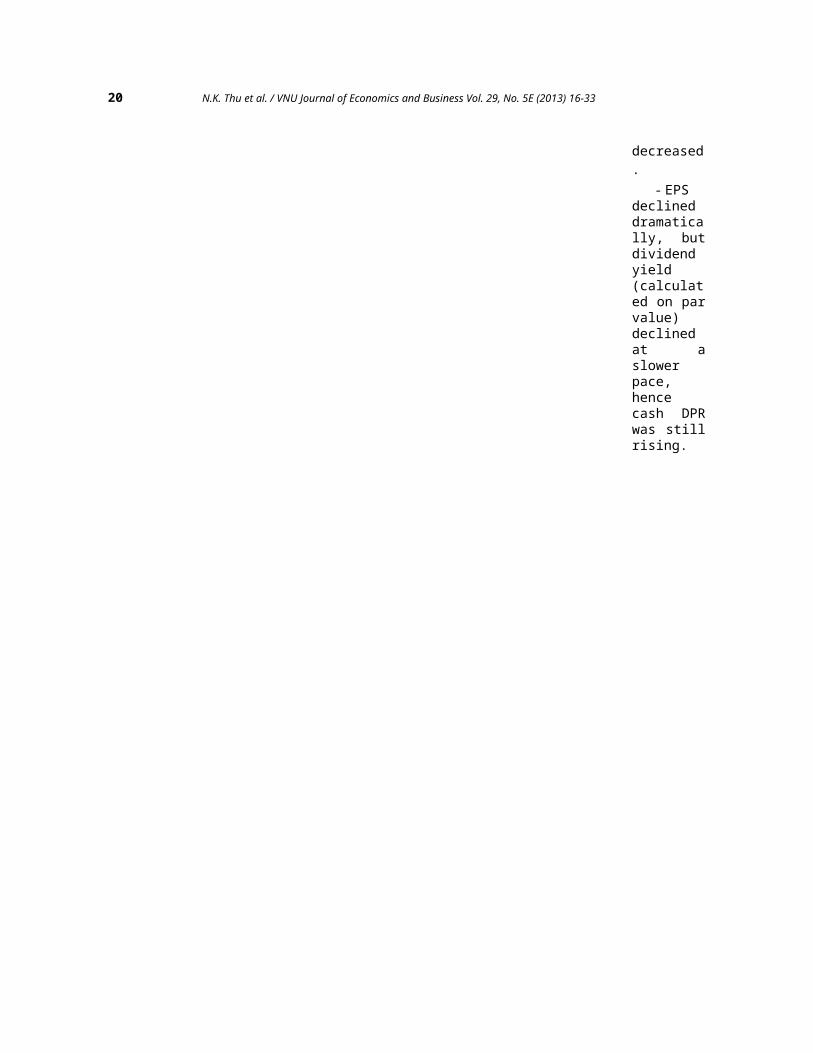
As canbeobservedfromFigure 2,the cashdividendpayoutratio,definedas thecashdividendper sharedividedbyearningspershare,climbedup anddownduring2007-2009beforesteadilyincreasing in theperiod of20092012.Inparticular, DPRrose from30.1% in2009 to46% in2012. Theincreasing trendin DPR is
N.K. Thu et al. / VNU Journal of Economics and Business Vol. 29, No. 5E (2013) 16-33 17
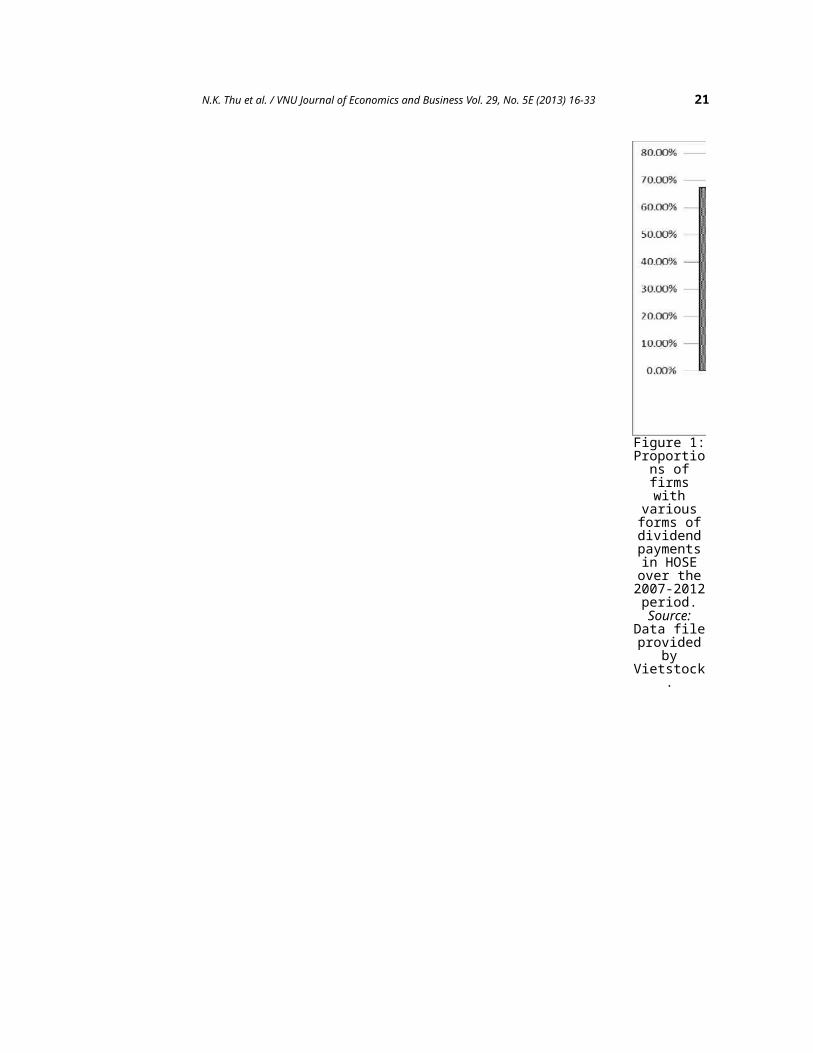
due tothe factthatearningsper share(EPS) inHOSE wasdecliningat afasterrate thanthedecreaseindividendyield.Figure 3indicatesthat EPSwas on adownwardtrendsince2009 andfell bymore thanhalf,from VND4,433 pershare in2009 toVND 2,097per sharein 2012.(DatafileprovidedbyVietstock).Meanwhile, thecashdividend
18 N.K. Thu et al. / VNU Journal of Economics and Business Vol. 29, No. 5E (2013) 16-33
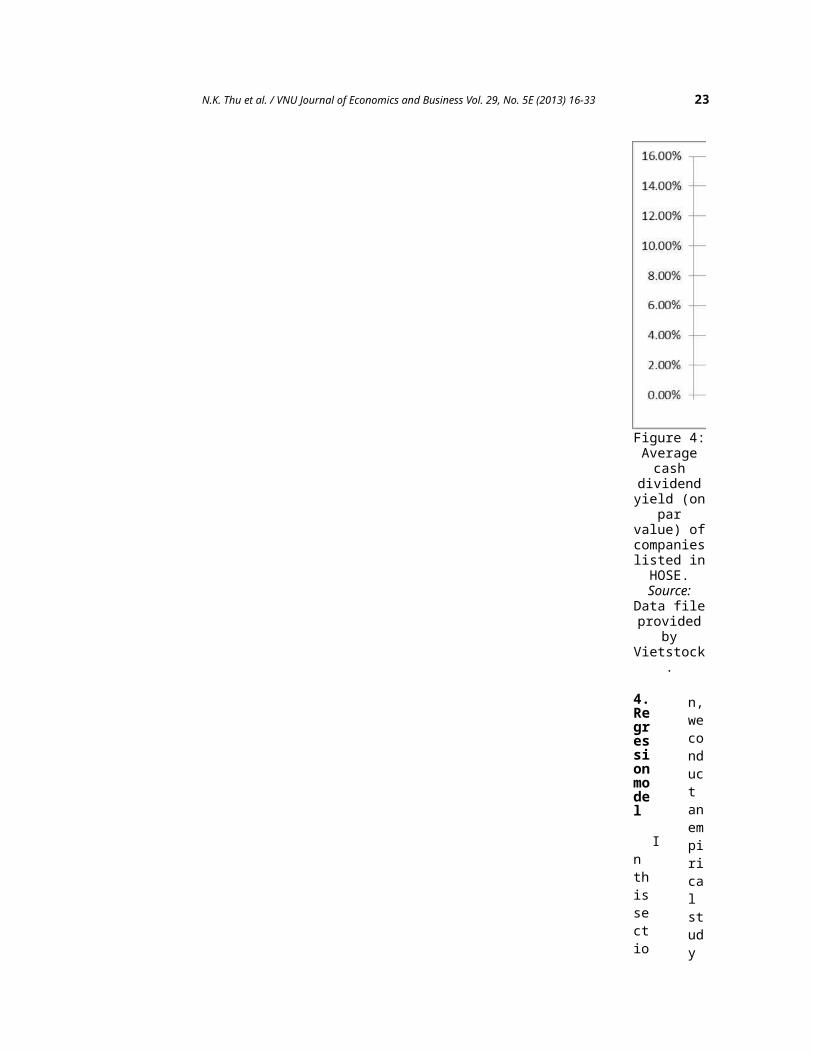
yield,definedas cashdividendper sharedividedby parvalue,increasedin the2009-2010periodbeforedeclininggraduallyfrom14.6% in2010 to9.6% in2012 (seeFigure4). EPSin HOSEwent downby 2.11timesfrom 2009to 2012,whiledividendper sharedeclinedby 1.38times inthe sametimeperiod.
Inconclusion, thedividendpaymentpracticesof non-
N.K. Thu et al. / VNU Journal of Economics and Business Vol. 29, No. 5E (2013) 16-33 19
financiallistedcompaniesin HOSEin 2007-2012 canbecharacterized asfollows:
- Mostfirmspaiddividendsin theform ofcashdividends.However,theproportion offirmspayingcashdividendstended todecline,while theproportion offirmsthat paidnodividendsrose. Theproportion offirmspayingstockdividendsalso
20 N.K. Thu et al. / VNU Journal of Economics and Business Vol. 29, No. 5E (2013) 16-33
decreased.
- EPSdeclineddramatically, butdividendyield(calculated on parvalue)declinedat aslowerpace,hencecash DPRwas stillrising.
N.K. Thu et al. / VNU Journal of Economics and Business Vol. 29, No. 5E (2013) 16-33 21
Figure 1:Proportions offirmswith
variousforms ofdividendpaymentsin HOSEover the2007-2012period.Source:
Data fileprovided
byVietstock
.
22 N.K. Thu et al. / VNU Journal of Economics and Business Vol. 29, No. 5E (2013) 16-33
Figure 2:Averagecash
dividendpayoutratio ofcompanieslisted in
HOSE(2007-2012).Source:Datafiles
providedby
Vietstock.
Figure 3:AverageEPS of
companieslisted in
HOSE(2007-2012).Source:
Data fileprovided
byVietstock
.
N.K. Thu et al. / VNU Journal of Economics and Business Vol. 29, No. 5E (2013) 16-33 23
4.Regressionmodel
Inthissectio
n,weconductanempiricalstudy
Figure 4:Averagecash
dividendyield (on
parvalue) ofcompanieslisted inHOSE.Source:
Data fileprovided
byVietstock
.
24 N.K. Thu et al. / VNU Journal of Economics and Business Vol. 29, No. 5E (2013) 16-33
onthedeterminantsofcashdividendpayoutratioofnon-financiallistedcompaniesinHOSE.Onlyth
ecashdividendpayoutratioisconsideredsincecashdividendisthemostpopularformofdividendpa
N.K. Thu et al. / VNU Journal of Economics and Business Vol. 29, No. 5E (2013) 16-33 25
ymentsinHOSEintheperiod2007-2012asdiscussedinsection3.Inaddition,besidetheinaccuracy
andcomplexityofconvertingvalueofstockdividendintocash,stockdividendisnotconsideredfo
26 N.K. Thu et al. / VNU Journal of Economics and Business Vol. 29, No. 5E (2013) 16-33
ranalysisbecauseoftheinconsistencyinthewayofcalculatingstockdividendvaluesamongfi
rms.
Thelimitationofrelevantinformationandthestabilityindividendpolicyoffinancialfirm

N.K. Thu et al. / VNU Journal of Economics and Business Vol. 29, No. 5E (2013) 16-33 27
sexplainwhythisstudyonlyconcentratesonnon-financialfirms.Forfinancialinstitutions,
suchasbanksandinsurancecompanies,thestability,includingthestabilityindividendpaymen
28 N.K. Thu et al. / VNU Journal of Economics and Business Vol. 29, No. 5E (2013) 16-33
t,istheprioritytowinthetrustoftheircustomers.Thecutorreductionindividendpaymentma
yresultinunfavorablereactionsfromthemarket.Hence,thedividendpayoutratiosoffinancial
N.K. Thu et al. / VNU Journal of Economics and Business Vol. 29, No. 5E (2013) 16-33 29
firmsdonotshowmuchvolatilitycomparedwiththoseofnon-financialfirms.Thus,wefinditmorein
terestingtoresearchthedividendpaymentsofnon-financiallistedfirms.
4.1.Hypothesis
Duetoinform
30 N.K. Thu et al. / VNU Journal of Economics and Business Vol. 29, No. 5E (2013) 16-33
ationunavailabilityforownershipdispersionandcashflowvolatility,thestudyonlyincludes
eightfirm-specificfactorsassumedtohaveeffectsoncashDPRoflistedcompaniesinVietnam,wh
N.K. Thu et al. / VNU Journal of Economics and Business Vol. 29, No. 5E (2013) 16-33 31
ichareinsiderownership,freecashflow,collateralisableassets,firm
size,firmrisk,grow
thopportunities,
profitabilityandfinancialleverage.Basedonthetheoreticalarguments
32 N.K. Thu et al. / VNU Journal of Economics and Business Vol. 29, No. 5E (2013) 16-33
presentedin
theliteraturereview,thecorrespondinghypothesesabouttherelationshipbetw
eeneachindependentvariableandthedependentvariableareasfollows:
H1:
Thereis anegativerelation
N.K. Thu et al. / VNU Journal of Economics and Business Vol. 29, No. 5E (2013) 16-33 33
shipbetweeninsiderownershipandDPR
H2:ThereisapositiverelationshipbetweenfreecashflowandDPR
H3:Th
ereisapositiverelationshipbetweenthelevelofcollateralisableassetsandDPR
H4:Thereisapositive

34 N.K. Thu et al. / VNU Journal of Economics and Business Vol. 29, No. 5E (2013) 16-33
relationshipbetweenfirmsizeandDPR
H5:
There is
a
negative
relationshipbetweenfirmriskandDP
RH
6:
There is
a
negative
relationshipbetweengrowthopportunityandDPR
H7:Thereisapositive
N.K. Thu et al. / VNU Journal of Economics and Business Vol. 29, No. 5E (2013) 16-33 35
relationshipbetweenprofitabilityandDPR
H8:
There is
a
negative
relationshipbetweenfinanciallev
erageandDPR
4.2.Methodology
Ininvestigatingthedeterminantsofdividendpayoutratio,datawa
36 N.K. Thu et al. / VNU Journal of Economics and Business Vol. 29, No. 5E (2013) 16-33
scollectedon286non-financiallistedcompaniesinHOSEduringthe2007-2012period.
Ourda
tasetispaneldata,whichcontainsobservationsonmultiplecompaniesobservedovera6yearperi
N.K. Thu et al. / VNU Journal of Economics and Business Vol. 29, No. 5E (2013) 16-33 37
od.OneappropriatemethodforpaneldataistousethePooledOrdinaryLeastSquare(PooledOLS)
regressionmodel.However,sincethePooledOLSassumestheinterceptvalueofallcross-sectio
38 N.K. Thu et al. / VNU Journal of Economics and Business Vol. 29, No. 5E (2013) 16-33
nalunitarethesame,andthattheslopecoefficientsoftheindependentvariablesareidenti
calforalltheindividuals,itmaydistortthetruepictureoftherelationshipbetweenthede
N.K. Thu et al. / VNU Journal of Economics and Business Vol. 29, No. 5E (2013) 16-33 39
pendentvariablesandtheindependentvariablesacrosstheindividuals.
Inordertotakeinto
accountthespecificnatureofeachindividual,thefixedeffectmodel(FEM)canalsobeused.Fi
40 N.K. Thu et al. / VNU Journal of Economics and Business Vol. 29, No. 5E (2013) 16-33
rst,FEMwillberunintermsofcrosssectionandtime,allowingfordifferencesacrossindividu
alsanddifferencesintimeeffect,respectively.Then,wetakeintoaccountboththeindividual

N.K. Thu et al. / VNU Journal of Economics and Business Vol. 29, No. 5E (2013) 16-33 41
andthetimeeffectsbyrunningtheFEMinbothcrosssectionandtimeconcurrently.
Inorder
tochoosebetweenthePooledregressionmodelandtheFEM,wecheckthestatisticalsignificance
42 N.K. Thu et al. / VNU Journal of Economics and Business Vol. 29, No. 5E (2013) 16-33
oftheestimatedcoefficients,theR2
valueandtheDurbin-Watsonvalue.Wecanalsousethere
strictedFtesttocheckthevalidityoftherestrictedmodel(thePooledOLS).IfFvalueishighly
N.K. Thu et al. / VNU Journal of Economics and Business Vol. 29, No. 5E (2013) 16-33 43
significant,itmeansthatthePooledOLSisinvalid,andwemayprefertheFEMtothePooledOLS.
A
lthoughstraightforwardtoapply,fixedeffectsmodelingcanbeexpensiveintermsofdegreesof

44 N.K. Thu et al. / VNU Journal of Economics and Business Vol. 29, No. 5E (2013) 16-33
freedomifwehaveseveralcross-sectionalunits.WeuseFEMincasetherearerelevantexplanator
yvariablesthatdonotchangeovertime,andthoseunobservedvariablesmayhavecorrelationwi
N.K. Thu et al. / VNU Journal of Economics and Business Vol. 29, No. 5E (2013) 16-33 45
ththeexplanatoryvariables.However,ifthereisnocorrelationbetweentheerrortermandthe
explanatoryvariables,weusetheRandomeffectmodel(REM)toruntheregression.Inordertoch
46 N.K. Thu et al. / VNU Journal of Economics and Business Vol. 29, No. 5E (2013) 16-33
oosebetweenFEMandREM,weconductatestdevelopedbyHausman(1978).Thenullhypothesisunde
rlyingtheHausmantestisthattheFEMandREMestimatorsdonotdiffersubstantially.Ifthenull
N.K. Thu et al. / VNU Journal of Economics and Business Vol. 29, No. 5E (2013) 16-33 47
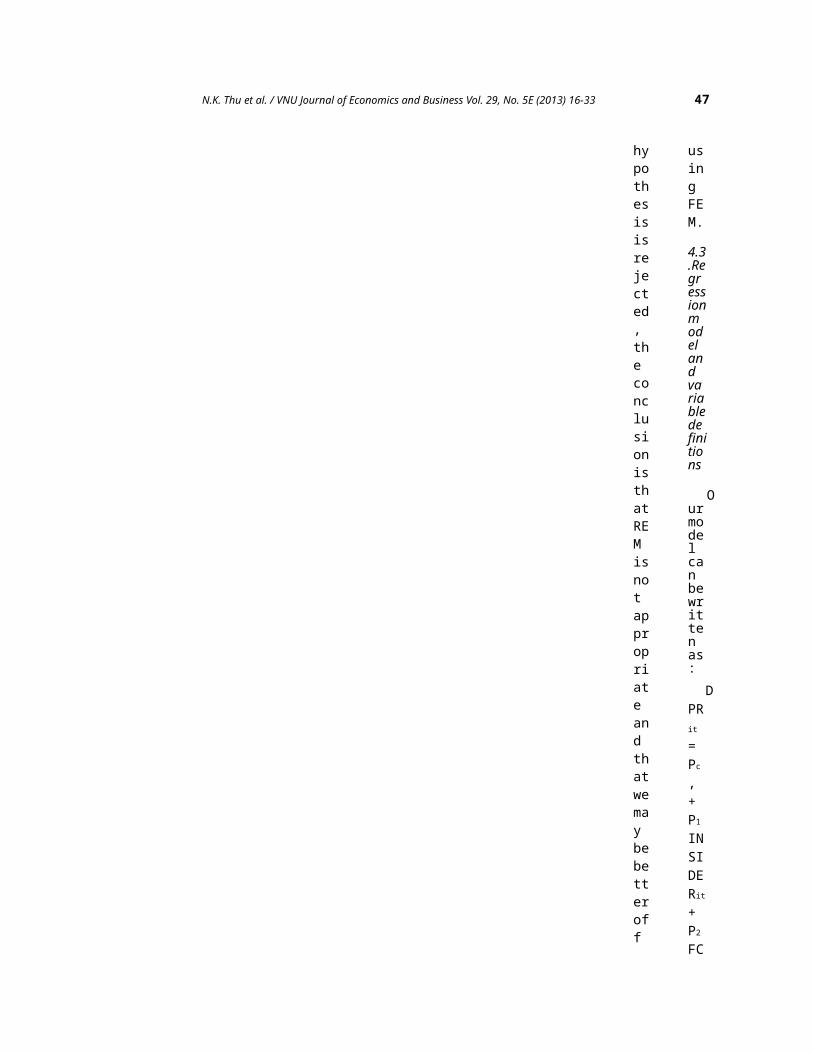
hypothesisisrejected,theconclusionisthatREMisnotappropriateandthatwemaybebetteroff
usingFEM.
4.3.Regressionmodelandvariabledefinitions
Ourmodelcanbewrittenas:
DPRit
=Pc,+P1INSIDERit+P2FC
48 N.K. Thu et al. / VNU Journal of Economics and Business Vol. 29, No. 5E (2013) 16-33
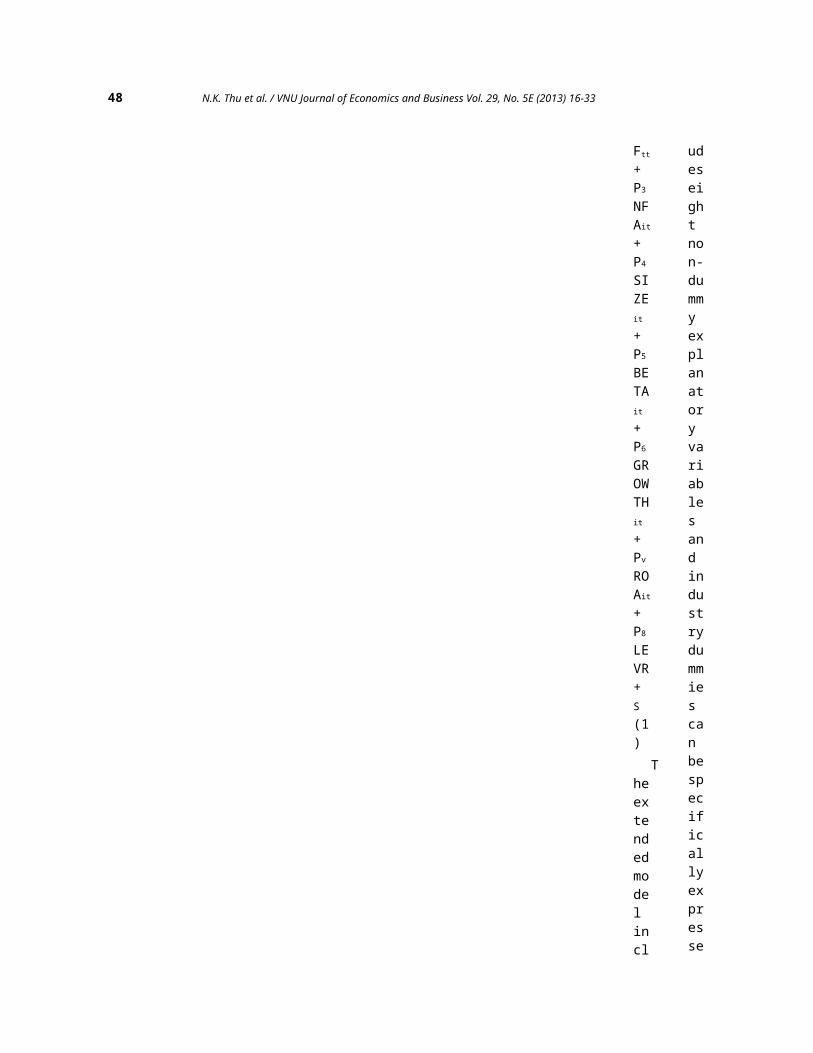
Ftt
+P3NFAit+P4SIZEit
+P5BETAit
+P6GROWTHit
+PvROAit+P8LEVR+S(1)
Theextendedmodelincl
udeseightnon-dummyexplanatoryvariablesandindustrydummiescanbespecificallyexpresse
N.K. Thu et al. / VNU Journal of Economics and Business Vol. 29, No. 5E (2013) 16-33 49
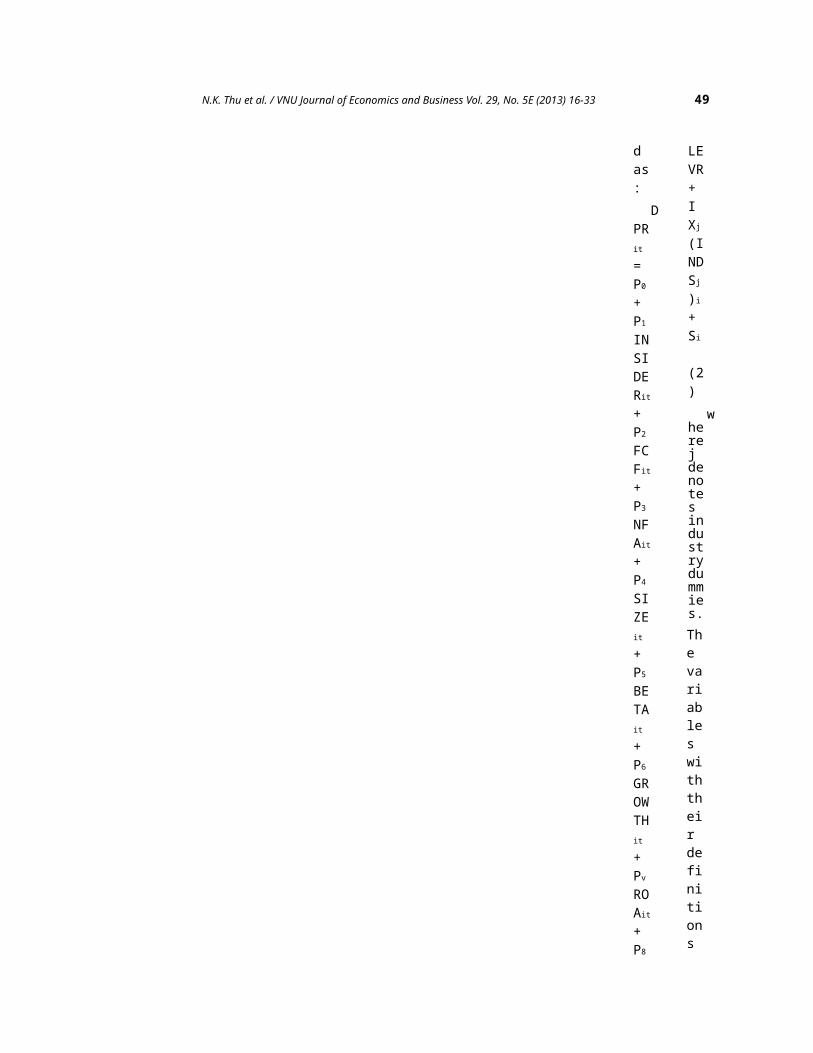
das:
DPRit
=P0+P1INSIDERit+P2FCFit+P3NFAit+P4SIZEit
+P5BETAit
+P6GROWTHit
+PvROAit+P8
LEVR+IXj(INDSj)i+Si
(2)
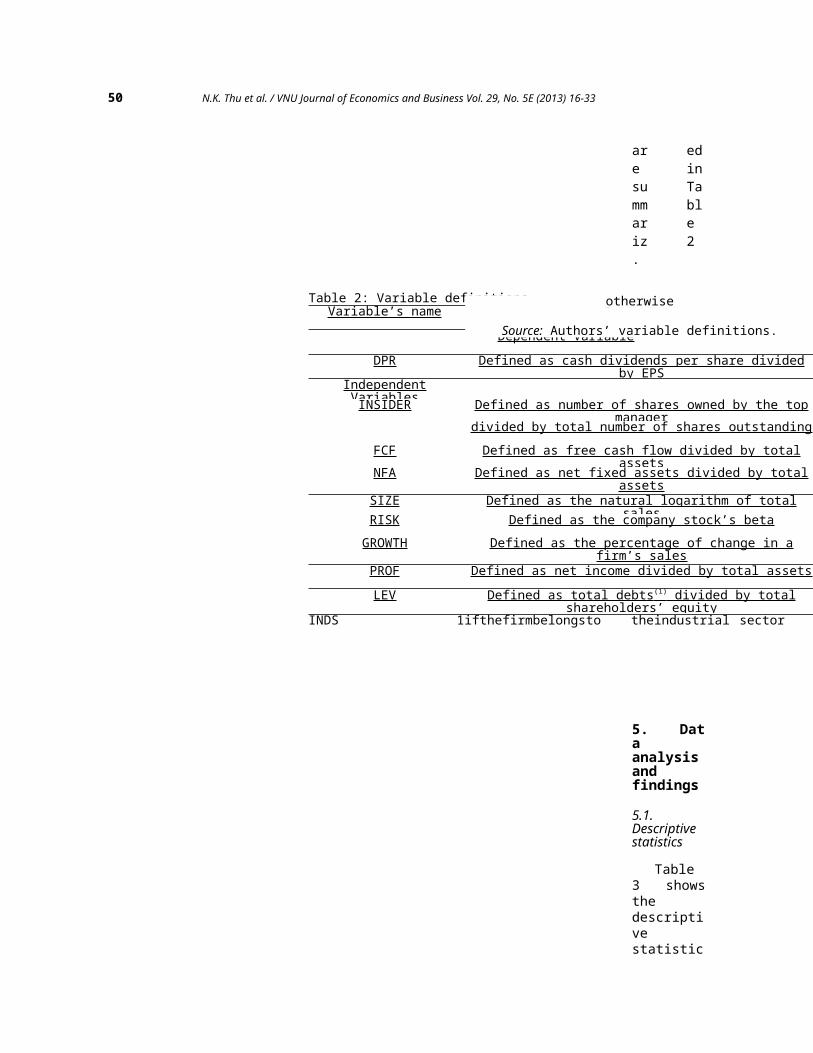
wherejdenotesindustrydummies.The variables withtheir definitions
50 N.K. Thu et al. / VNU Journal of Economics and Business Vol. 29, No. 5E (2013) 16-33
are summariz
edinTable 2
.
5. Dataanalysisandfindings
5.1.Descriptivestatistics
Table3 showsthedescriptivestatistic
Table 2: Variable definitionsVariable’s name Definition
Dependent VariableDPR Defined as cash dividends per share divided
by EPSIndependentVariablesINSIDER Defined as number of shares owned by the top
managerdivided by total number of shares outstandingFCF Defined as free cash flow divided by total
assetsNFA Defined as net fixed assets divided by totalassets
SIZE Defined as the natural logarithm of totalsalesRISK Defined as the company stock’s beta
GROWTH Defined as the percentage of change in afirm’s sales
PROF Defined as net income divided by total assetsLEV Defined as total debts (1) divided by total
shareholders’ equityINDS 1ifthefirmbelongsto theindustrial sector
otherwise
Source: Authors’ variable definitions.
N.K. Thu et al. / VNU Journal of Economics and Business Vol. 29, No. 5E (2013) 16-33 51
s fordependentandindependentvariablesused intheregression forcompanieslisted inHOSE. Thedividendpayoutratio of286 non-financiallistedfirms hasa meanvalue of57% withastandarddeviationof 59%.Thismeans, onaverage,listedfirms inHOSE use57% oftheirearningsto paydividendstoshareholders. Thehigh gapbetweenthemaximumand theminimumDPRsreflectsthe wildfluctuati
52 N.K. Thu et al. / VNU Journal of Economics and Business Vol. 29, No. 5E (2013) 16-33
ons inthedividendpaymentpracticesof listedfirms inHOSE. TheminimumDPR is anegativenumber,whichreflectsthe casethat thecompanymaintainsitsdividendpaymentdespite anegativeEPS. Likethedependentvariable,independentvariableshavetheirmean andmedianrelatively closeto eachother,thereforeeliminating theproblemofoutliers.

N.K. Thu et al. / VNU Journal of Economics and Business Vol. 29, No. 5E (2013) 16-33 53
(11 Thetotal debtsexcludeaccountpayablesand otherpayables.
54 N.K. Thu et al. / VNU Journal of Economics and Business Vol. 29, No. 5E (2013) 16-33
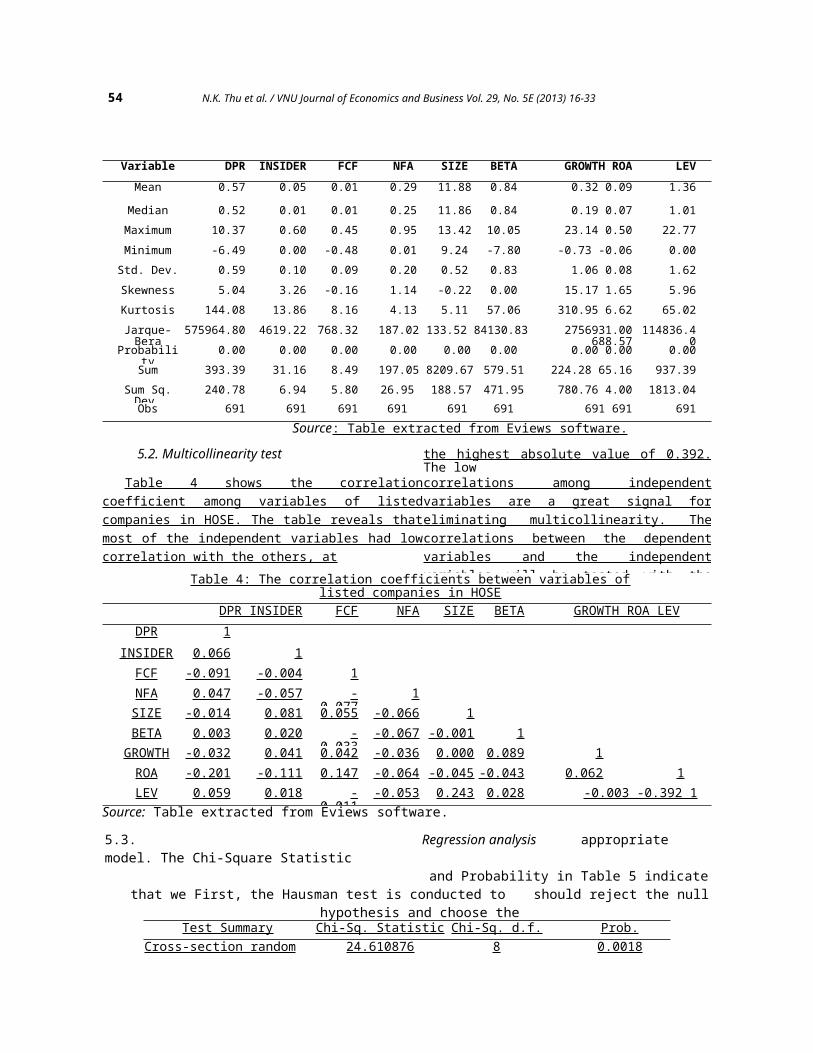
Variable DPR INSIDER FCF NFA SIZE BETA GROWTH ROA LEVMean 0.57 0.05 0.01 0.29 11.88 0.84 0.32 0.09 1.36
Median 0.52 0.01 0.01 0.25 11.86 0.84 0.19 0.07 1.01Maximum 10.37 0.60 0.45 0.95 13.42 10.05 23.14 0.50 22.77Minimum -6.49 0.00 -0.48 0.01 9.24 -7.80 -0.73 -0.06 0.00
Std. Dev. 0.59 0.10 0.09 0.20 0.52 0.83 1.06 0.08 1.62Skewness 5.04 3.26 -0.16 1.14 -0.22 0.00 15.17 1.65 5.96Kurtosis 144.08 13.86 8.16 4.13 5.11 57.06 310.95 6.62 65.02Jarque-Bera
575964.80 4619.22 768.32 187.02 133.52 84130.83 2756931.00688.57
114836.40Probabili
ty0.00 0.00 0.00 0.00 0.00 0.00 0.00 0.00 0.00
Sum 393.39 31.16 8.49 197.05 8209.67 579.51 224.28 65.16 937.39Sum Sq.Dev.
240.78 6.94 5.80 26.95 188.57 471.95 780.76 4.00 1813.04Obs 691 691 691 691 691 691 691 691 691
Source: Table extracted from Eviews software.
5.2. Multicollinearity test the highest absolute value of 0.392.The low
Table 4 shows the correlationcoefficient among variables of listedcompanies in HOSE. The table reveals thatmost of the independent variables had lowcorrelation with the others, at
correlations among independentvariables are a great signal foreliminating multicollinearity. Thecorrelations between the dependentvariables and the independentvariables will be tested with theTable 4: The correlation coefficients between variables of
listed companies in HOSEDPR INSIDER FCF NFA SIZE BETA GROWTH ROA LEV
DPR 1INSIDER 0.066 1
FCF -0.091 -0.004 1NFA 0.047 -0.057 -
0.0771
SIZE -0.014 0.081 0.055 -0.066 1BETA 0.003 0.020 -
0.033-0.067 -0.001 1
GROWTH -0.032 0.041 0.042 -0.036 0.000 0.089 1ROA -0.201 -0.111 0.147 -0.064 -0.045 -0.043 0.062 1LEV 0.059 0.018 -
0.011-0.053 0.243 0.028 -0.003 -0.392 1
5.3. Regression analysis appropriatemodel. The Chi-Square Statistic
and Probability in Table 5 indicatethat we First, the Hausman test is conducted to should reject the null
hypothesis and choose theTest Summary Chi-Sq. Statistic Chi-Sq. d.f. Prob.
Cross-section random 24.610876 8 0.0018
Source: Table extracted from Eviews software.
N.K. Thu et al. / VNU Journal of Economics and Business Vol. 29, No. 5E (2013) 16-33 55
Source: Table extracted from Eviews
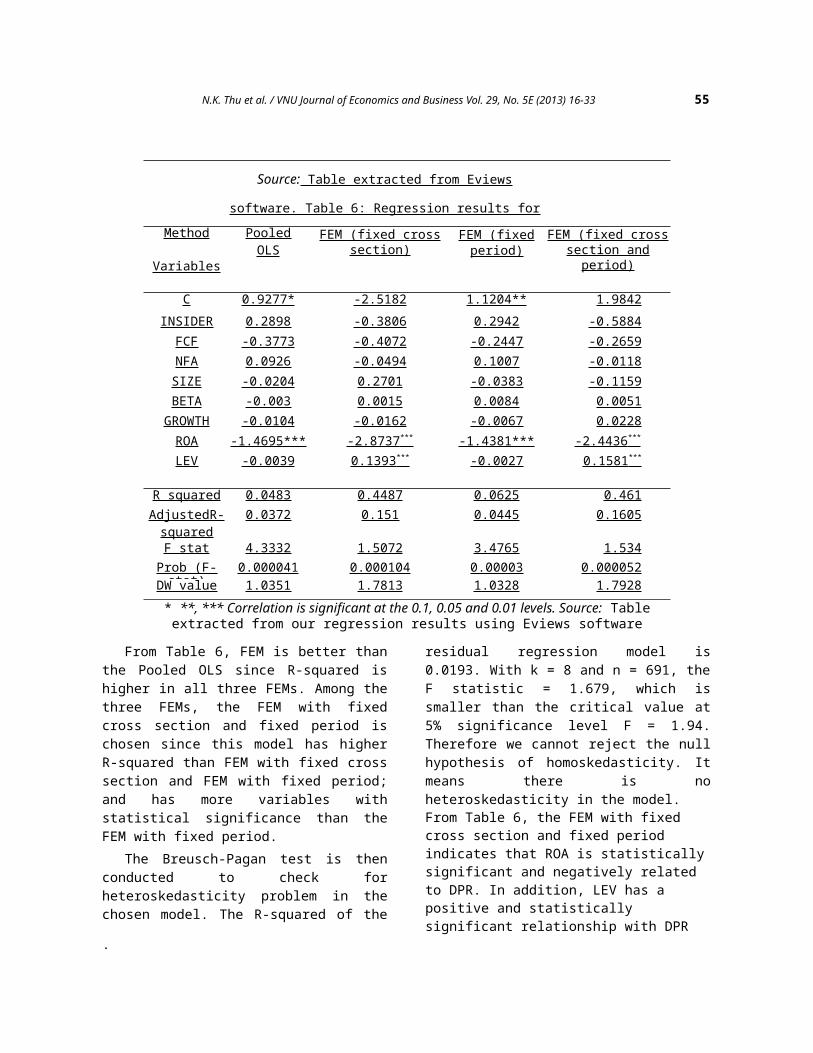
software. Table 6: Regression results for
Pooled OLS and FEMsMethod
Variables
PooledOLS
FEM (fixed crosssection)
FEM (fixedperiod)
FEM (fixed crosssection andperiod)
C 0.9277* -2.5182 1.1204** 1.9842INSIDER 0.2898 -0.3806 0.2942 -0.5884
FCF -0.3773 -0.4072 -0.2447 -0.2659NFA 0.0926 -0.0494 0.1007 -0.0118SIZE -0.0204 0.2701 -0.0383 -0.1159BETA -0.003 0.0015 0.0084 0.0051GROWTH -0.0104 -0.0162 -0.0067 0.0228ROA -1.4695*** -2.8737 *** -1.4381*** -2.4436 *** LEV -0.0039 0.1393 *** -0.0027 0.1581 ***
R squared 0.0483 0.4487 0.0625 0.461AdjustedR-squared
0.0372 0.151 0.0445 0.1605
F stat 4.3332 1.5072 3.4765 1.534Prob (F-stat)
0.000041 0.000104 0.00003 0.000052DW value 1.0351 1.7813 1.0328 1.7928
From Table 6, FEM is better thanthe Pooled OLS since R-squared ishigher in all three FEMs. Among thethree FEMs, the FEM with fixedcross section and fixed period ischosen since this model has higherR-squared than FEM with fixed crosssection and FEM with fixed period;and has more variables withstatistical significance than theFEM with fixed period.
The Breusch-Pagan test is thenconducted to check forheteroskedasticity problem in thechosen model. The R-squared of the
residual regression model is0.0193. With k = 8 and n = 691, theF statistic = 1.679, which issmaller than the critical value at5% significance level F = 1.94.Therefore we cannot reject the nullhypothesis of homoskedasticity. Itmeans there is noheteroskedasticity in the model.From Table 6, the FEM with fixed cross section and fixed period indicates that ROA is statisticallysignificant and negatively related to DPR. In addition, LEV has a positive and statistically significant relationship with DPR
.
* **, *** Correlation is significant at the 0.1, 0.05 and 0.01 levels. Source: Tableextracted from our regression results using Eviews software
56 N.K. Thu et al. / VNU Journal of Economics and Business Vol. 29, No. 5E (2013) 16-33
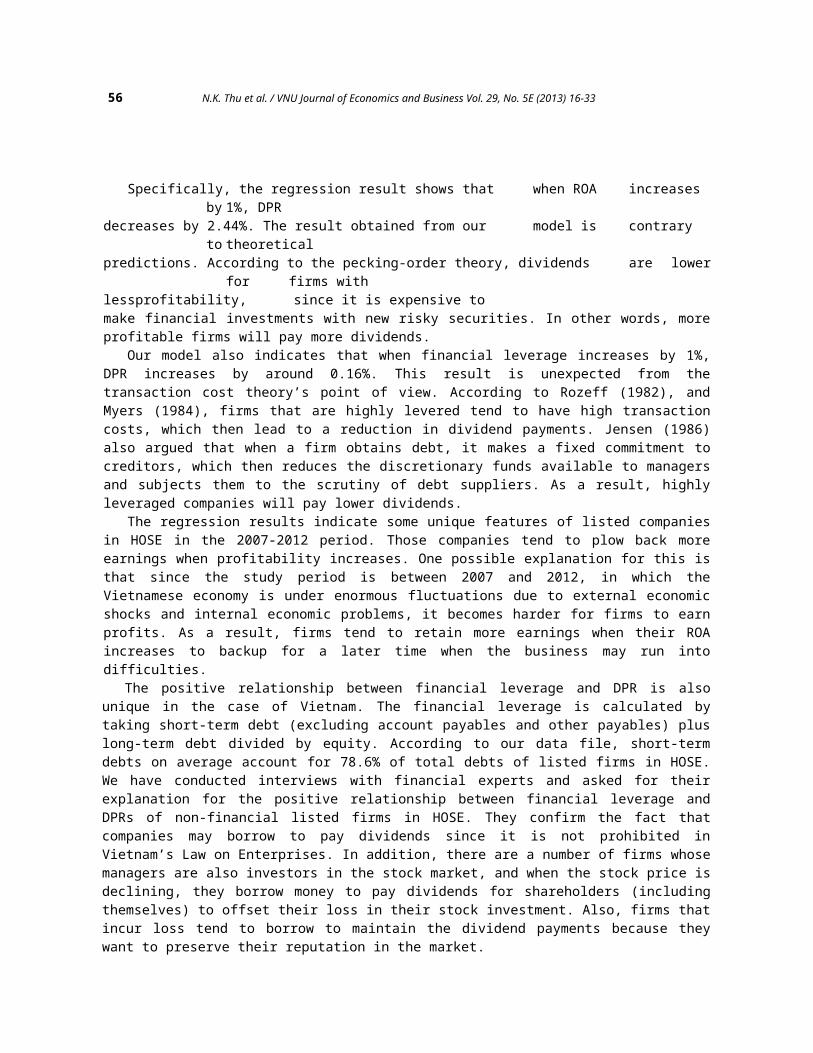
Specifically, the regression result shows that when ROA increasesby 1%, DPR
decreases by 2.44%. The result obtained from our model is contraryto theoretical
predictions. According to the pecking-order theory, dividends are lowerfor firms with
lessprofitability, since it is expensive tomake financial investments with new risky securities. In other words, moreprofitable firms will pay more dividends.
Our model also indicates that when financial leverage increases by 1%,DPR increases by around 0.16%. This result is unexpected from thetransaction cost theory’s point of view. According to Rozeff (1982), andMyers (1984), firms that are highly levered tend to have high transactioncosts, which then lead to a reduction in dividend payments. Jensen (1986)also argued that when a firm obtains debt, it makes a fixed commitment tocreditors, which then reduces the discretionary funds available to managersand subjects them to the scrutiny of debt suppliers. As a result, highlyleveraged companies will pay lower dividends.
The regression results indicate some unique features of listed companiesin HOSE in the 2007-2012 period. Those companies tend to plow back moreearnings when profitability increases. One possible explanation for this isthat since the study period is between 2007 and 2012, in which theVietnamese economy is under enormous fluctuations due to external economicshocks and internal economic problems, it becomes harder for firms to earnprofits. As a result, firms tend to retain more earnings when their ROAincreases to backup for a later time when the business may run intodifficulties.
The positive relationship between financial leverage and DPR is alsounique in the case of Vietnam. The financial leverage is calculated bytaking short-term debt (excluding account payables and other payables) pluslong-term debt divided by equity. According to our data file, short-termdebts on average account for 78.6% of total debts of listed firms in HOSE.We have conducted interviews with financial experts and asked for theirexplanation for the positive relationship between financial leverage andDPRs of non-financial listed firms in HOSE. They confirm the fact thatcompanies may borrow to pay dividends since it is not prohibited inVietnam’s Law on Enterprises. In addition, there are a number of firms whosemanagers are also investors in the stock market, and when the stock price isdeclining, they borrow money to pay dividends for shareholders (includingthemselves) to offset their loss in their stock investment. Also, firms thatincur loss tend to borrow to maintain the dividend payments because theywant to preserve their reputation in the market.
N.K. Thu et al. / VNU Journal of Economics and Business Vol. 29, No. 5E (2013) 16-33 57
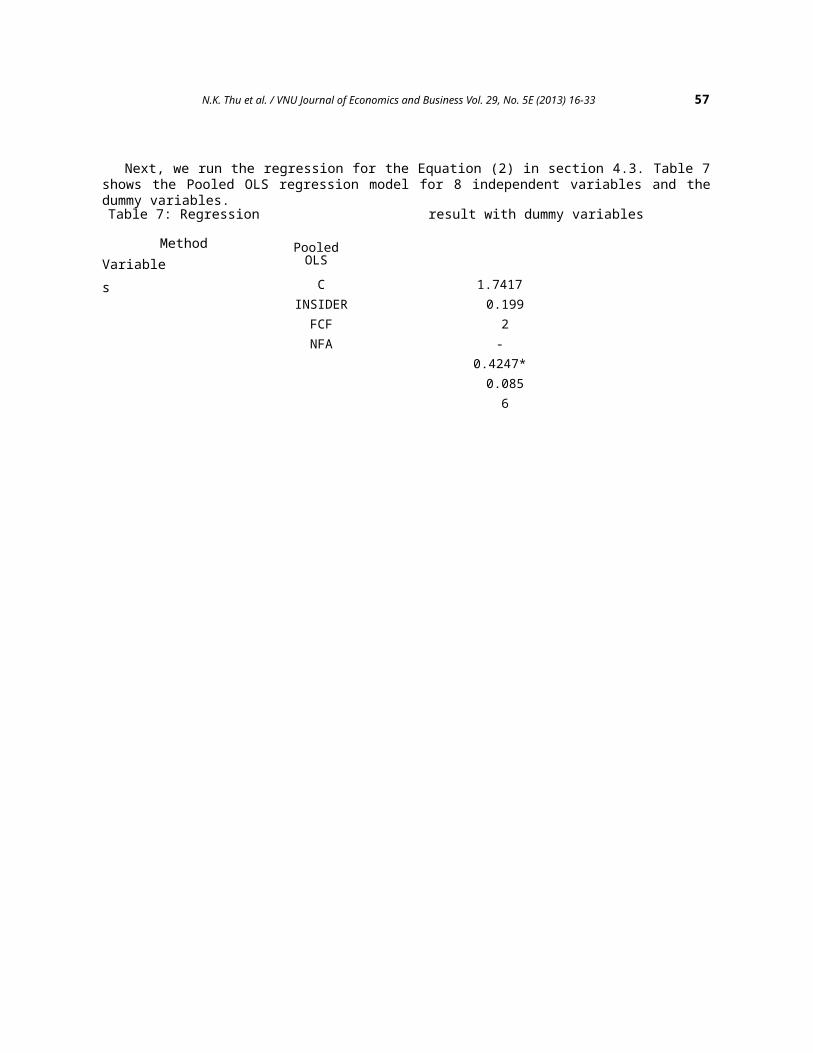
Next, we run the regression for the Equation (2) in section 4.3. Table 7shows the Pooled OLS regression model for 8 independent variables and thedummy variables.Table 7: Regression result with dummy variables
MethodVariables
PooledOLSC
INSIDERFCFNFA
1.74170.1992-
0.4247*0.0856
58 N.K. Thu et al. / VNU Journal of Economics and Business Vol. 29, No. 5E (2013) 16-33
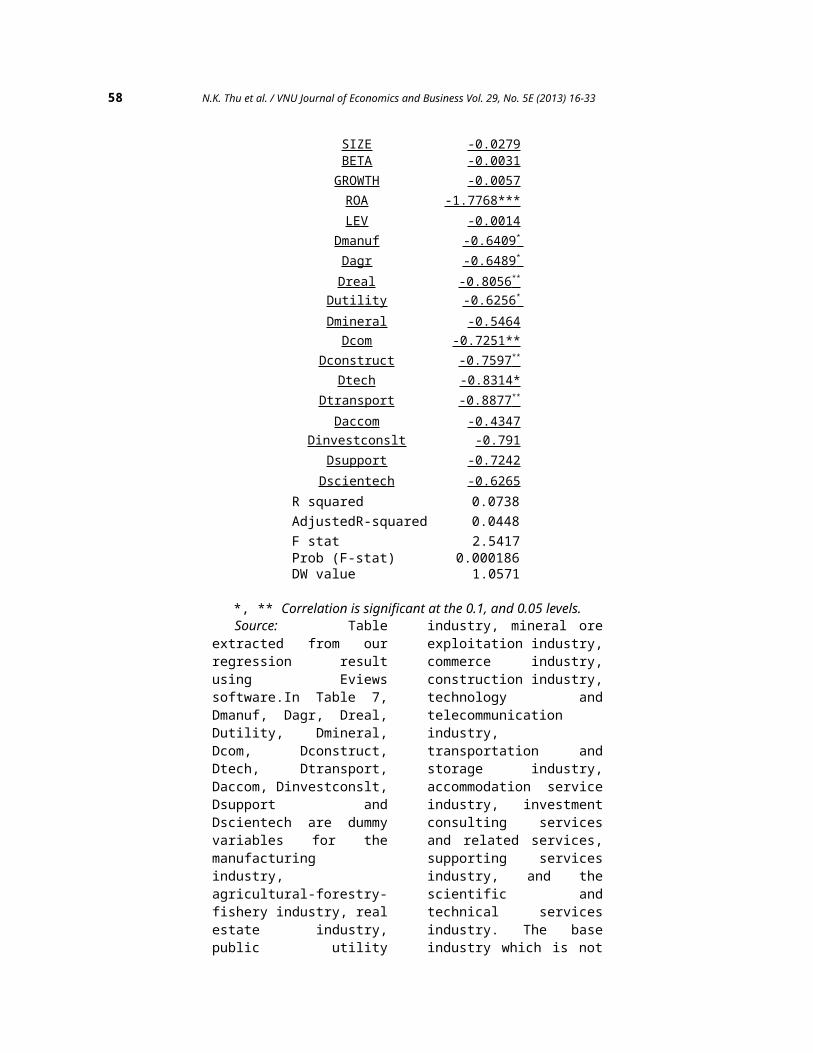
SIZE -0.0279BETA -0.0031GROWTH -0.0057ROA -1.7768***LEV -0.0014
Dmanuf -0.6409 * Dagr -0.6489 * Dreal -0.8056 **
Dutility -0.6256 * Dmineral -0.5464Dcom -0.7251**
Dconstruct -0.7597 ** Dtech -0.8314*
Dtransport -0.8877 ** Daccom -0.4347
Dinvestconslt -0.791Dsupport -0.7242Dscientech -0.6265
*, ** Correlation is significant at the 0.1, and 0.05 levels.Source: Table
extracted from ourregression resultusing Eviewssoftware.In Table 7,Dmanuf, Dagr, Dreal,Dutility, Dmineral,Dcom, Dconstruct,Dtech, Dtransport,Daccom, Dinvestconslt,Dsupport andDscientech are dummyvariables for themanufacturingindustry,agricultural-forestry-fishery industry, realestate industry,public utility
industry, mineral oreexploitation industry,commerce industry,construction industry,technology andtelecommunicationindustry,transportation andstorage industry,accommodation serviceindustry, investmentconsulting servicesand related services,supporting servicesindustry, and thescientific andtechnical servicesindustry. The baseindustry which is not
R squared 0.0738AdjustedR-squared 0.0448F stat 2.5417Prob (F-stat) 0.000186DW value 1.0571
N.K. Thu et al. / VNU Journal of Economics and Business Vol. 29, No. 5E (2013) 16-33 59
included in the modelis the “otherservices” industry2.
The regressionresult in Table 7indicates that thereare no statisticallysignificantdifferences in theDPRs amongaccommodationservices, mineral oreexploitation,investment consultingservices and relatedservices, supportingservices, scientificand technical servicesand the other servicesindustry. Meanwhile,the DPRs in theremaining industriesare statisticallylower than the DPRs inthe other servicesindustry.
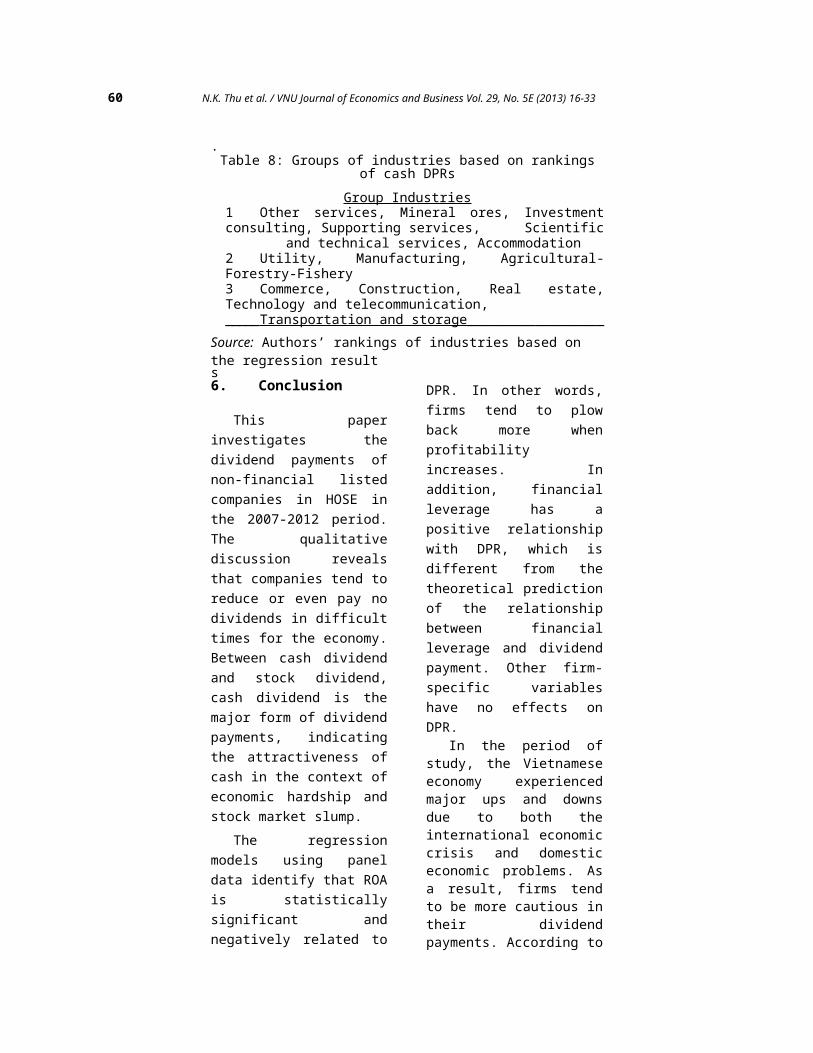
Based on theregression result,Table 8 classifiesindustries into threegroups according tothe cash DPRs. Group 1consists of industriesthat have high DPRs,
2 The companies classified in the “other services” industry in HOSEinclude Western Bus Station Joint- Stock Company and Electrical andTechnical Service Joint-Stock Company. The former was listed in 2010 and thelatter was listed in 2011.Therefore data are not available for the years before 2010.
includingaccommodationservices, mineral oreexploitation,investment consultingservices and relatedservices, supportingservices, scientificand technical servicesand the other servicesindustry. Groupincludes industries that have DPRs around 60% lower than the DPRs of the other services industry, which are utility, manufacturing, and agricultural-forestry-fishery industry. Finally, Group 3 liststhose that have DPRs that are more than 70%lower than the DPRs ofthe other services industry, including commerce, construction, real estate, technology andtelecommunication, transportation and storage
60 N.K. Thu et al. / VNU Journal of Economics and Business Vol. 29, No. 5E (2013) 16-33
.Table 8: Groups of industries based on rankings
of cash DPRsGroup Industries
1 Other services, Mineral ores, Investmentconsulting, Supporting services, Scientific
and technical services, Accommodation2 Utility, Manufacturing, Agricultural-Forestry-Fishery3 Commerce, Construction, Real estate,Technology and telecommunication,_____Transportation and storage__________________
Source: Authors’ rankings of industries based on the regression results6. Conclusion
This paperinvestigates thedividend payments ofnon-financial listedcompanies in HOSE inthe 2007-2012 period.The qualitativediscussion revealsthat companies tend toreduce or even pay nodividends in difficulttimes for the economy.Between cash dividendand stock dividend,cash dividend is themajor form of dividendpayments, indicatingthe attractiveness ofcash in the context ofeconomic hardship andstock market slump.
The regressionmodels using paneldata identify that ROAis statisticallysignificant andnegatively related to
DPR. In other words,firms tend to plowback more whenprofitabilityincreases. Inaddition, financialleverage has apositive relationshipwith DPR, which isdifferent from thetheoretical predictionof the relationshipbetween financialleverage and dividendpayment. Other firm-specific variableshave no effects onDPR.
In the period ofstudy, the Vietnameseeconomy experiencedmajor ups and downsdue to both theinternational economiccrisis and domesticeconomic problems. Asa result, firms tendto be more cautious intheir dividendpayments. According to
N.K. Thu et al. / VNU Journal of Economics and Business Vol. 29, No. 5E (2013) 16-33 61
some financial expertsthat we interviewed,when the economy getstough, firms tend toreserve funds tobackup for futureuses. This isreflected in thenegative relationshipbetween ROA and DPR.On the other hand, thepositive relationshipbetween financialleverage and DPRreflects the fact thatfirms tend to borrowmoney to pay dividendsfor various reasons,including keeping thecompany’s reputation,or offsetting themanagers’ loss intheir stockinvestment.
Finally, theregression resultshows that there arestatisticallysignificantdifferences in theDPRs among industries.Mineral ores,accommodation andservice industries areamong those that havehigh DPRs. Meanwhile,construction, realestate,commerce, technologyandtelecommunication,and transportationand storageindustries are thosethat maintain lowerDPRs.
References
[1] Agrawal, A. andJayaraman, N.(1994), “TheDividend Policiesof All-equityFirms: A DirectTest of the FreeCash Flow Theory”,Managerial andDecisionEconomics, 15(2),pp. 139-148.
[2] Ahmed, H. andJavid, A. (2009),“The Determinantsof Dividend Policyin Pakistan”,InternationalResearch Journalof Finance andEconomics, 29(1),pp. 110-125.
[3] Al-Malkawi, H.and Nizar, H.(2008), “FactorsInfluencingCorporate DividendDecision: Evidencefrom JordanianPanel Data”,InternationalJournal ofBusiness, 13(2),pp. 177-195.
[4] Al Kuwari, D.(2009),“Determinants ofthe DividendPolicy in EmergingStock Exchanges:The Case of GCCCountries”, GlobalEconomy andFinance Journal,2(2), pp. 38-63.
[5] Alli, K. L.,Khan, A. Q., andRamirez, G. G.(1993),“Determinants ofCorporate DividendPolicy: AFactorialAnalysis”, The
62 N.K. Thu et al. / VNU Journal of Economics and Business Vol. 29, No. 5E (2013) 16-33
Financial Review,28(4), pp. 523-547.
[6] Amidu, M. andAbor, J. (2006),“Determinants ofDividend PayoutRatios in Ghana”,Journal of RiskFinance, 7(2), pp.136-145.
[7] Bhattacharya, S.(1979), “ImperfectInformation,Dividend Policy,and “the Bird inthe Hand”Fallacy”, BellJournal ofEconomics, 10(1),pp. 259-270.
[8] Bhattacharya, S.(1980), “Non-dissipativeSignalingStructure andDividend Policy”,Quarterly Journalof Economics,95(1), pp. 1-24.
[9] Chay, J. B. andSuh, J. (2009),“Payout Policy andCash-flowUncertainty”,Journal ofFinancialEconomics, 93(1),pp. 88-107.
[10] Chen, J. andDhiensiri, N.(2009),“Determinants ofDividend Policy:
TheEvidence from NewZealand”,InternationalResearch Journalof Finance andEconomics, 34, pp.18-28.
[11] Collins, M. C.,Saxena, A., andWansley, J.(1996), “The Roleof Insiders and
Dividend Policy: AComparison ofRegulated andUnregulatedFirms”, Journal ofFinancial andStrategicDecisions, 9(2).
[12] D’Souza, J.(1999), “AgencyCost, Market Risk,InvestmentOpportunities andDividend Policy -An InternationalPerspective”,ManagerialFinance, 25(6),pp. 35-43.
[13] Easterbrook, F.(1984), “TwoAgency-costExplanations ofDividends”, TheAmerican EconomicReview, 74(4), pp.650-659.
[14] Eriotis, N.(2005), “TheEffect ofDistributedEarnings and Sizeof the Firm to itsDividend Policy”,InternationalBusiness andEconomics Journal,4(1), pp. 67-74.
[15] Fama E. (1974),“The EmpiricalRelationshipbetween Dividendand InvestmentDecisions ofFirms”, TheAmerican EconomicReview, 64(3), pp.304-318.
[16] Gill, M., Biger,N. and Tibrewala,R. (2010),“Determinants ofDividend PayoutRatios: Evidencefrom UnitedStates”, The OpenBusiness Journal,
N.K. Thu et al. / VNU Journal of Economics and Business Vol. 29, No. 5E (2013) 16-33 63
3(1), pp. 8-14.[17] Graham, J. and
Kumar, A. (2006),“Do DividendClienteles Exist?Evidence onDividendPreferences ofRetail Investors”,Journal ofFinance, 61(3),pp. 1305-1336.
[18] He, X., Li, M.,Shi, J. and Twite,G. (2009),“Determinants ofDividend Policy inChinese Firms:Cash versus StockDividends”,Journal ofCorporate Finance.
[19] Higgins, R. C.(1972), “TheCorporateDividend- savingDecisions”,Journal ofFinancial andQuantitativeAnalysis, 7(2),pp. 1527-1541.
[20] Jensen, G.,Solberg, D., andZorn, T. (1992),“SimultaneousDetermination ofInsider Ownership,Debt, and DividendPolicies”, Journalof Financial andQuantitativeAnalysis, 27(2),pp. 247-263.
[21] Lintner, J.(1956),“Distribution ofIncomes ofCorporations amongDividends,Retained Earnings,and Taxes”, TheAmerican EconomicReview, 46(2), pp.97-113.
[22] Lloyd, W.,
Jahera, J. andPage, D. (1985),“Agency Costs andDividend PayoutRatios”, QuarterlyJournal ofBusiness andEconomics, 24(1),pp. 19-29.
[23] Malik, F., Gul,S., Khan, M. T.,Rehman, S. U., andKhan, M. (2013),“Factors InfluenceCorporate DividendPayout Decisionsof Financial andNon- financialFirms”, ResearchJournal of Financeand Accounting,4(1), pp. 35-46.
[24] Mehta, A.(2012), “AnEmpirical Analysisof Determinants ofDividend Policy -Evidence from theUAE Countries”,Global Review ofAccounting andFinance, 3(1), pp.18-31.
[25] Miller, M. andModigliani, F.(1961), “DividendPolicy, Growth,and the Valuationof Shares”, TheJournal ofBusiness, 34(4),pp. 411-433.
[26] Miller, M. andRock, K. (1985),“Dividend Policyunder AsymmetricInformation”,Journal ofFinance, 40(4),pp. 1031-1051.
[27] Myers, S.(1984), “TheCapital StructurePuzzle”, TheJournal ofFinance, 39(3),pp. 574-592.
64 N.K. Thu et al. / VNU Journal of Economics and Business Vol. 29, No. 5E (2013) 16-33
[28] Myers, S. andMajluf, N. (1984),“CorporateFinancing andInvestmentDecisions whenFirms haveInformation thatInvestors do nothave”, Journal ofFinancialEconomics, 13(2),pp. 187-221.
[29] Naceur, S. B.and Goaied, M.(2002), “TheRelationshipbetween DividendPolicy, FinancialStructure,Profitability andFirm Value”,Applied FinancialEconomics, 12(12),pp. 843-849.
[30] Ross, S. (1977),“The Determinationof FinancialStructure: TheIncentiveSignalingApproach”, BellJournal ofEconomics, 8(1),pp. 23-40.
[31] Ross, S.,Randolph, A.,Westerfield, W.,and Jaffe, J.(2008), CorporateFinance (KindleLocations 17034-17035). McGraw-Hill HigherEducation.
[32] Rozeff, M.(1982), “Growth,Beta and AgencyCosts asDeterminants ofDividend PayoutRatios”, Journalof FinancialResearch, 5(3),pp. 249-259.
[33] Rafique, M.(2012), “Factors
Affecting DividendPayout: Evidencefrom Listed Non-financial Firms ofKarachi StockExchange”,BusinessManagementDynamics, 1(11),pp. 76-92.
[34] Faccio, M.,Lang, L., andYoung, L. (2001),“Dividends andExpropriation”,American EconomicsAssociation,91(1), pp. 54-78.
[35] Gugler, K. andYurtoglu, B.(2003), “CorporateGovernance andDividend PayoutPolicy inGermany”, EuropeanEconomic Review,47(4), pp. 731-758.


![[123doc vn] - chuong2](https://img.dokumen.tips/doc/110x75/6322f08763847156ac06d90c/123doc-vn-chuong2.jpg)


![[xaydung360.vn]TRA THEP-NAM VIET](https://img.dokumen.tips/doc/110x75/63544355faec9f0e5f047a42/xaydung360vntra-thep-nam-viet.jpg)


