Embed Size (px)
Citation preview
Water Quality Trading and Offset Initiatives in the U.S.: A Comprehensive Survey*
August 5, 2004
Hanna L. Breetz Karen Fisher-Vanden**
Laura Garzon Hannah Jacobs
Kailin Kroetz Rebecca Terry
Dartmouth College
Hanover, New Hampshire
*This research was supported by the US Environmental Protection Agency and the Rockefeller Center at Dartmouth College. **Corresponding author: 6182 Steele Hall, Hanover, NH 03755; phone: 603-646-0213; email: [email protected]
Table of Contents
PageINTRODUCTION 4 ACRONYMS 7
SUMMARY OF TRADING INITIATIVES AND STATE POLICIES 8
TRADING INITIATIVES
California Grassland Area Farmers 10 San Francisco Bay 19
Colorado Bear Creek 24 Boulder Creek 31 Chatfield Reservoir 37 Cherry Creek 44 Clear Creek 56 Lake Dillon 64 Lower Colorado River 74
Connecticut Long Island Sound 80
Florida Tampa Bay 90
Idaho Lower Boise River 97
Illinois Illinois Pretreatment Trading Program 106 Piasa Creek Watershed Project 110
Massachusetts Acton WWTP 120 Charles River 125 Edgarton WWTP 131 Falmouth WWTP 137 Massachusetts Estuaries Project 143 Specialty Minerals, Inc. 147 Wayland Business Center 154
Michigan Kalamazoo River 162
Minnesota Minnesota River 170 Rahr Malting Co. 176 Southern Minnesota Beet Sugar Cooperative 183
1
Nevada Truckee River 190
New Jersey Passaic Valley Sewerage Commission Pretreatment Trading 199
New York New York City Watershed 207
North Carolina Neuse River Basin 219 Tar-Pamlico Basin 226
Ohio Clermont County 233 Great Miami River Watershed Trading Pilot Program 238
Pennsylvania Conestoga River 246 Pennsylvania Water-based Trading Simulations 251
Virginia Blue Plains 260 Henry County 265
Wisconsin Fox-Wolf Basin 269 Red Cedar River 275 Rock River 282
Regional Chesapeake Bay 289
STATE POLICIES AND PROGRAMS
Maryland Nutrient Trading Policy 297 Michigan Water-Quality Trading Rules 300 Pennsylvania Multi-media Trading Registry 305 Virginia Nutrient Trading Program 308 West Virginia Trading Framework 312 Wisconsin Nutrient Trading Rules 316
OTHER PROJECTS AND RECENT PROPOSALS Alabama
Montgomery Water Works and Sanitary Sewer Board 320 California
City of Santa Rosa 320 Lake Tahoe (regional initiative with Nevada) 321 Sacramento Regional County Sanitation District’s Mercury Offsets 322
2
Georgia Lake Allatoona 322
Idaho Bear River (regional initiative with Utah and Wyoming) 323
Indiana Lake Erie Land Company 324
Maryland Monocacy River 324 St. Martin’s River Watershed 324 Wicomico River 324
Massachusetts Nashua River 325
Michigan Gun Lake Tribe, Kalamazoo River 325
Nevada Lake Tahoe (regional initiative; listed under “California”) 321
New York East River 326
North Carolina Cape Fear 327
Ohio Ohio River Basin 328 Honey Creek Watershed 329
Oklahoma Lower North Canadian River 329
Oregon Tualitin River 330
Rhode Island City of Providence 330
Tennessee Boone Reservoir 331
Utah Bear River (regional initiative; listed under “Idaho” ) 323
Virginia Colonial Soil and Water Conservation District 331
Washington Chehalis River 332 Puyallup River 333 Yakima River 333
West Virginia Cacapon/Lost River 334 Cheat River 334
Wyoming Bear River (regional initiative; listed under “Idaho” ) 323
3
Introduction This document summarizes water quality trading and offset initiatives in the United States, including state-wide policies and recent proposals. The following format was used to present information on each program. We attempted to have each program summary reviewed by at least one contact person for program accuracy. In the cases where this review occurred, we added the statement “Reviewed by…..” at the end of the case summary. <Name of program and state> A. Program Background
1. Program description <Program background and current status>
2. Program motivation <Water quality issue to be addressed and why a trading approach is being used>
3. Pollutant being traded
4. Size of program < e.g., size of watershed, geographic area, extent of potential polluting sources> Trading parties: <sources that are trading or potentially will trade>
5. Stakeholders/participants <list of program stakeholders and participants, including description of each stakeholder’s role in the program>
6. Regulatory drivers <specific regulation or policy that creates a need for pursuing improvements in water quality through trading>
B. Trade Structure
7. Determination of credit
4
<e.g., method used to measure/estimate reductions, whether credit is given for cost-share projects>.
8. Trading ratios and other mechanisms to deal with uncertainty <Mechanisms to deal with uncertainty of measurement, performance, compliance, etc.—e.g., trading ratios>
9. Liability/penalties for noncompliance <Liability/penalties for noncompliance faced by buyer, seller, government, 3rd party.>
10. Approval process <Description of process required for trade approval>
11. Ex post verification/auditing. <Mechanism used to verify trades>
12. Mechanisms for trade identification and communication (education and outreach, third party facilitation, embedded ties) <Approach taken to identify potential trades and to communicate with potential trading partners—in particular, whether the credit purchaser is responsible for direct outreach (including education campaigns), whether third parties are employed to identify and negotiate trades, or whether existing networks such as working relationships or associations (“embedded ties”) facilitate negotiations with potential suppliers of credits.>
13. Market structure (bilateral, clearinghouse, third party brokers)
<Type of market structure created to facilitate trades. For a description of market structures, see Woodward, R. T., Kaiser, R. A. and Wicks, A. B. (2002). The structure and practice of water quality trading markets. Journal of the American Water Resources Association. 38: 967-979 >
14. Types of trades allowed <e.g., trading only between point sources allowed? Or is point/nonpoint source trading permitted?>
C. Outcomes
15. Types and volume of trades that have occurred
5
16. Administrative costs <Costs incurred to administer program>
17. Transaction costs
<Cost associated with trades>
18. Cost savings <Savings expected or realized through trading>
19. Program goals achieved <Whether program objectives were achieved. In some cases, the program’s objective may be to facilitate a single trade or bring interested parties to the table rather than to engage in a significant volume of trades. The program’s goal and whether it was achieved will therefore depend on each specific case>
20. Program obstacles <Were there any specific obstacles to establishing a trading program or to achieving the program goals?>
21. NPS involvement and incentives to engage in trading. <Description of the extent of involvement by nonpoint sources and specific incentives created to encourage nonpoint sources to participate>
22. Other
Program information/References Websites: <related program websites> Contacts: <Persons providing program information or verifying accuracy of information presented in each case summary> Written Program Information: <References cited in program summary or other sources of program information>
6
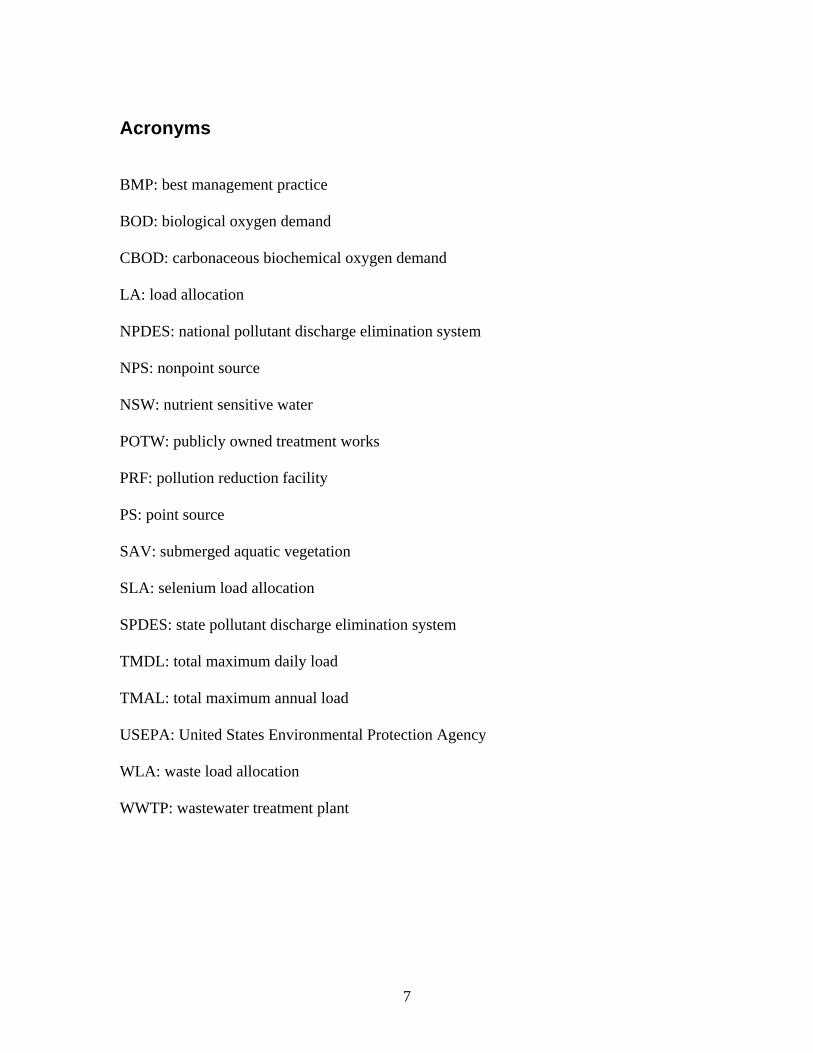
Acronyms BMP: best management practice BOD: biological oxygen demand CBOD: carbonaceous biochemical oxygen demand LA: load allocation NPDES: national pollutant discharge elimination system NPS: nonpoint source NSW: nutrient sensitive water POTW: publicly owned treatment works PRF: pollution reduction facility PS: point source SAV: submerged aquatic vegetation SLA: selenium load allocation SPDES: state pollutant discharge elimination system TMDL: total maximum daily load TMAL: total maximum annual load USEPA: United States Environmental Protection Agency WLA: waste load allocation WWTP: wastewater treatment plant
7
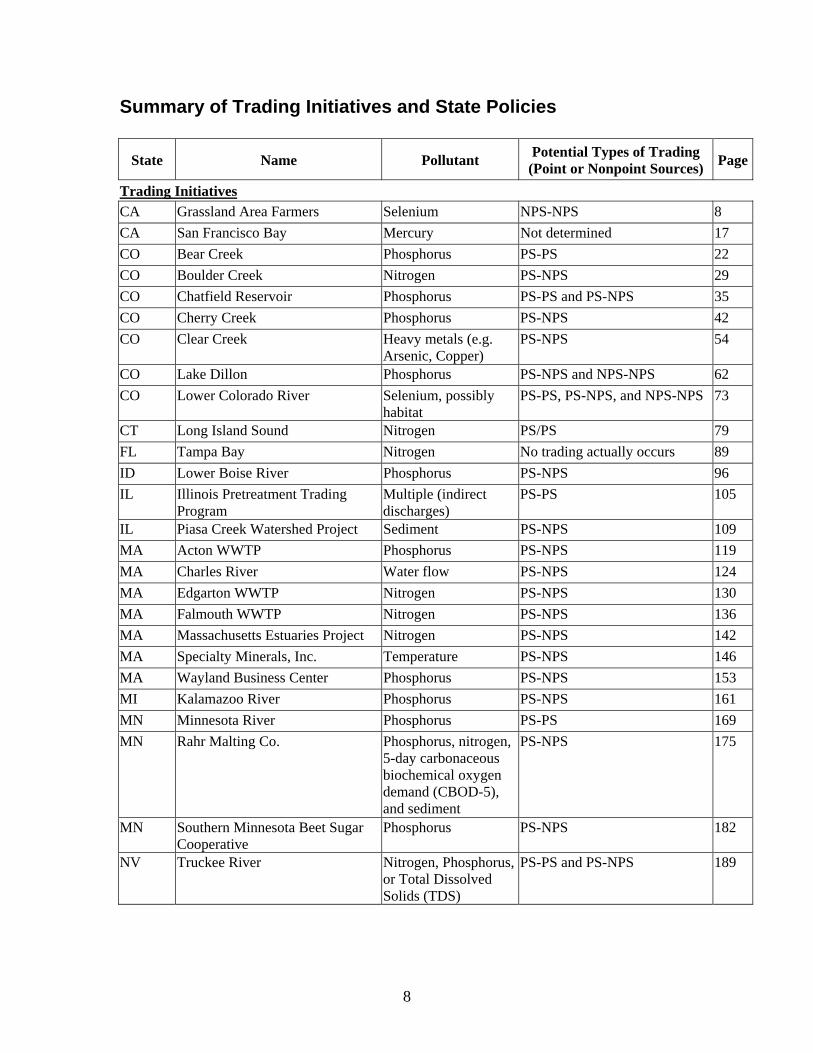
Summary of Trading Initiatives and State Policies
State Name Pollutant Potential Types of Trading (Point or Nonpoint Sources) Page
Trading Initiatives CA Grassland Area Farmers Selenium NPS-NPS 8 CA San Francisco Bay Mercury Not determined 17 CO Bear Creek Phosphorus PS-PS 22 CO Boulder Creek Nitrogen PS-NPS 29 CO Chatfield Reservoir Phosphorus PS-PS and PS-NPS 35 CO Cherry Creek Phosphorus PS-NPS 42 CO Clear Creek Heavy metals (e.g.
Arsenic, Copper) PS-NPS 54
CO Lake Dillon Phosphorus PS-NPS and NPS-NPS 62 CO Lower Colorado River Selenium, possibly
habitat PS-PS, PS-NPS, and NPS-NPS 73
CT Long Island Sound Nitrogen PS/PS 79 FL Tampa Bay Nitrogen No trading actually occurs 89 ID Lower Boise River Phosphorus PS-NPS 96 IL Illinois Pretreatment Trading
Program Multiple (indirect discharges)
PS-PS 105
IL Piasa Creek Watershed Project Sediment PS-NPS 109 MA Acton WWTP Phosphorus PS-NPS 119 MA Charles River Water flow PS-NPS 124 MA Edgarton WWTP Nitrogen PS-NPS 130 MA Falmouth WWTP Nitrogen PS-NPS 136 MA Massachusetts Estuaries Project Nitrogen PS-NPS 142 MA Specialty Minerals, Inc. Temperature PS-NPS 146 MA Wayland Business Center Phosphorus PS-NPS 153 MI Kalamazoo River Phosphorus PS-NPS 161 MN Minnesota River Phosphorus PS-PS 169 MN Rahr Malting Co. Phosphorus, nitrogen,
5-day carbonaceous biochemical oxygen demand (CBOD-5), and sediment
PS-NPS 175
MN Southern Minnesota Beet Sugar Cooperative
Phosphorus PS-NPS 182
NV Truckee River Nitrogen, Phosphorus, or Total Dissolved Solids (TDS)
PS-PS and PS-NPS 189
8
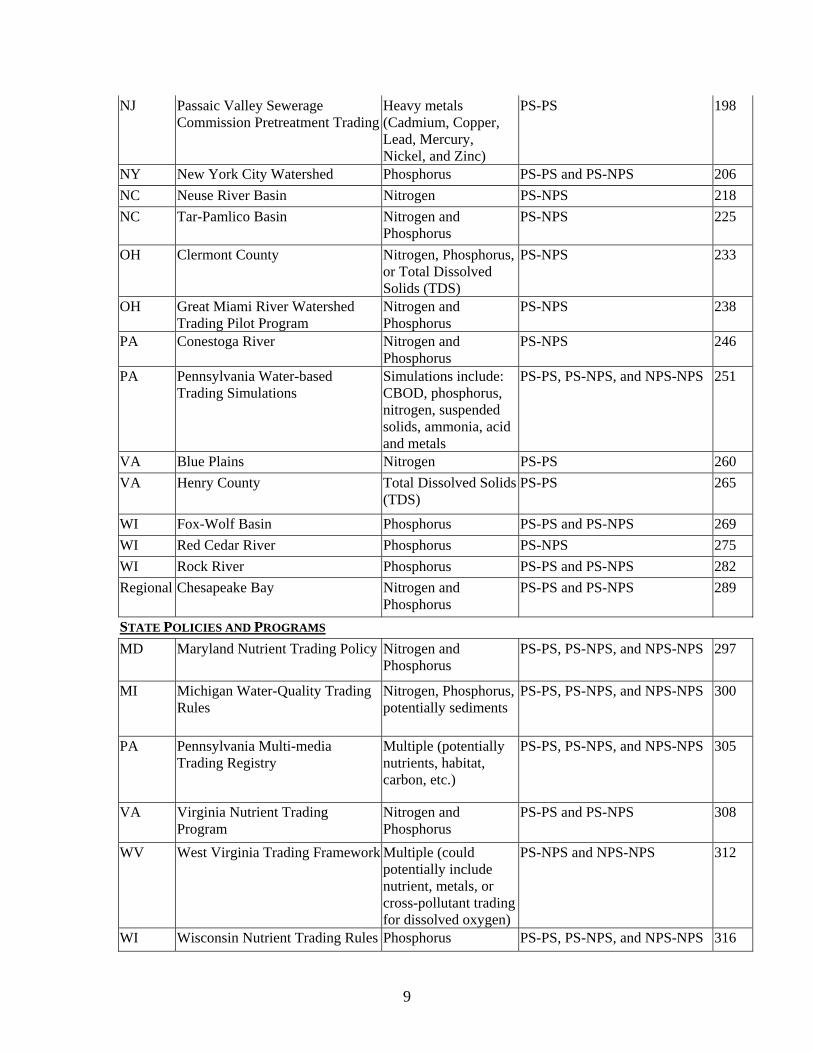
NJ Passaic Valley Sewerage Commission Pretreatment Trading
Heavy metals (Cadmium, Copper, Lead, Mercury, Nickel, and Zinc)
PS-PS 198
NY New York City Watershed Phosphorus PS-PS and PS-NPS 206 NC Neuse River Basin Nitrogen PS-NPS 218 NC Tar-Pamlico Basin Nitrogen and
Phosphorus PS-NPS 225
OH Clermont County Nitrogen, Phosphorus, or Total Dissolved Solids (TDS)
PS-NPS 233
OH Great Miami River Watershed Trading Pilot Program
Nitrogen and Phosphorus
PS-NPS 238
PA Conestoga River Nitrogen and Phosphorus
PS-NPS 246
PA Pennsylvania Water-based Trading Simulations
Simulations include: CBOD, phosphorus, nitrogen, suspended solids, ammonia, acid and metals
PS-PS, PS-NPS, and NPS-NPS 251
VA Blue Plains Nitrogen PS-PS 260 VA Henry County Total Dissolved Solids
(TDS) PS-PS 265
WI Fox-Wolf Basin Phosphorus PS-PS and PS-NPS 269 WI Red Cedar River Phosphorus PS-NPS 275 WI Rock River Phosphorus PS-PS and PS-NPS 282 Regional Chesapeake Bay Nitrogen and
Phosphorus PS-PS and PS-NPS 289
STATE POLICIES AND PROGRAMS MD Maryland Nutrient Trading Policy Nitrogen and
Phosphorus PS-PS, PS-NPS, and NPS-NPS 297
MI Michigan Water-Quality Trading Rules
Nitrogen, Phosphorus, potentially sediments
PS-PS, PS-NPS, and NPS-NPS 300
PA Pennsylvania Multi-media Trading Registry
Multiple (potentially nutrients, habitat, carbon, etc.)
PS-PS, PS-NPS, and NPS-NPS 305
VA Virginia Nutrient Trading Program
Nitrogen and Phosphorus
PS-PS and PS-NPS 308
WV West Virginia Trading Framework Multiple (could potentially include nutrient, metals, or cross-pollutant trading for dissolved oxygen)
PS-NPS and NPS-NPS 312
WI Wisconsin Nutrient Trading Rules Phosphorus PS-PS, PS-NPS, and NPS-NPS 316
9
Grassland Area Farmers Tradable Loads Program (CA) A. Program Background
1. Program description The Grassland Area Farmers, a regional consortium of seven irrigation and drainage districts in the San Joaquin Valley, administers an internal cap-and-trade program for selenium. Each district in Grassland Area Farmers is allocated a portion of the collective selenium cap, which was established as part of the Grassland Bypass Project. The district-level selenium cap forms the basis for trading. The Grassland Tradable Loads Program was the first water quality trading program among nonpoint sources, although since the selenium loading from irrigated agriculture is accurately measured at the drainage pumps, it may be more akin to a point-point trading program (Woodward, Kaiser and Wicks 2002). The Grassland Bypass Project is the foundation for the Tradable Loads program. The bypass project enabled the seven districts in the Grassland Drainage Basin to use the federal San Luis Drain to convey drainage to the San Joaquin River. The Agreement for Use (Use Agreement) of the drain, signed between the U.S. Bureau of Reclamation and the San Luis and Delta-Mendota Water Authority in 1995, established aggregate monthly and annual selenium discharge limits. The districts are subject to “incentive fees” if they exceed their aggregate cap, and their use of the drain will be cut off after a 20% exceedance (Austin 2001). The Use Agreement also established the Grassland Area Farmers as a legal entity, controlled by a Steering Committee with representatives from all seven districts. The selenium cap was lowered each year, and the incentive fee for exceedances was raised each year, providing a strong incentive for the districts to control their discharge. Actual discharge into the San Luis Drain began in 1997. The selenium limits imposed by the Use Agreement were incorporated into the Waste Discharge Requirement Order issued by the California Regional Water Quality Control Board in August 1998 (Anderson 2000). Phase II of the Grassland Bypass Project was signed in 2001 and will continue through 2009 (Joe McGahan, personal communication, May 12, 2004). The monthly and annual selenium load limits in Waste Discharge Requirements and the load caps in the Use Agreement decrease each year through 2011 until they are equal to the load allocations in the selenium TMDL for the Lower San Joaquin River, which was completed in August 2001. The TMDL will begin setting the load limits in the Use Agreement in 2005 (CRWQCB-CVR 2001;
eslie Grober, personal communication, June 2, 2004). L District-level selenium load allocations and the tradable load program were internal mechanisms to help Grassland Area Farmers comply with the Grassland Bypass Project selenium cap. The Steering Committee distributed the aggregate SLA among the districts in March 1998 based on tilled acreage, total acreage, and historical selenium loads. Each district had the flexibility
10
of designing its own methods for complying with the district SLA, such as tiered water pricing, low interest loans, workshops, and recycling of drainage water. The fee for exceedances over the aggregate cap was proportionally divided among districts exceeding their district-level caps. The tradable loads program was introduced in June, 1998. The Environmental Defense Fund (EDF) had first proposed using market mechanisms to control the San Joaquin Valley’s agricultural pollution in 1994 (Young and Congdon 1994), and the EDF proposal provided the impetus and initial framework for designing the Grassland tradable loads program (Austin 2001). In the first year (Water Year 1998), only one trade occurred because of the unusual weather and resultant uncertainty. The exceptionally heavy rainfall during that year caused the districts to exceed their selenium caps even when they were not irrigating, and incentive fees were not levied because it was deemed an uncontrollable and unforeseeable event (Austin 2000). The trading rules for Water Year 1999 added a fee and rebate system that functioned similarly to an automatic trading program (Anderson 2000). Regardless of whether the region exceeded its selenium cap, the Grassland Area Farmers would levy a fee for exceeding district-level limits and redistributed these fees as rebates for districts that remain below their SLA. This established greater incentives for controlling selenium loading and for creating trade agreements to avoid the fees (Austin 2000). Eight trade agreements were signed in Water Year 1999. Several more trades were planned in Water Year 2000, but there have been no trades since then. One drainage district implemented a drainage recycling project, in which drainage water is applied to salt-tolerant crops. This has sufficiently reduced the regional selenium loading to the point where there is no need to trade (Joe McGahan, personal communication, May 12, 2004). This drainage recycling project was installed with contributions from other drainage districts. Grassland Area Farmers continues to write trading rules for each year, but they are not official since one drainage district does not approve them. The group wants to keep trading open as an option that may become useful again in the future (Joe McGahan, personal communication, May 12, 2004).
2. Program motivation Much of the land in the region has a shallow layer of subsurface clay and must be tiled and drained to avoid crop damage. The drainage water that is pumped out of the irrigated fields carries significant amounts of selenium, which naturally occurs at high levels in the region’s soils (USEPA 2000). Selenium loading from the Westland Water District was found to cause wildlife death and deformity in the Kesterson Reservoir, and the partially constructed San Luis Drain that empties into the reservoir was closed in 1983.
11
The Grassland Area Farmers historically conveyed their drainage to the San Joaquin River through the discharge channels within the Grassland Water District. The channels were also used by the district to supply fresh water to the entire wetland area, including an array of wildlife refuges. Although the channels would alternate the use of the channels for fresh and drainage water, the arrangement was cumbersome and did not completely prevent selenium discharge into the wetlands (Austin 2001). Farmers in the Grassland drainage area wanted to reopen a portion of the San Luis Drain because they faced instability with this discharge arrangement and recognized that stringent water quality standards were imminent (EDF 2000). The Grassland Bypass Project diverted flow around the sensitive ecosystems using a 28 mile section of the San Luis Drain, but the Use Agreement stipulated a regional selenium cap on the discharge. The trading system developed as a means of meeting this regional load limit more cost-effectively and equitably.
3. Pollutant being traded
Selenium
4. Size of program There are seven irrigation and drainage districts covering 97,000 acres of irrigated farmland in the Grassland Area Farmers (Anderson 2000). Parties outside the Grassland Area Farmers are not permitted to purchase and retire credits. Trading parties: Irrigation and drainage districts in Grassland Area Farmers
5. Stakeholders/participants • Grassland Area Farmers (GAF): regional consortium of seven irrigation
and discharge districts in the Grassland Basin, San Joaquin Valley. Signed the Use Agreement with the US Bureau of Reclamation and obtained a discharge permit from California. Has the legal authority to distribute selenium load allocations among its members and enforce discharge requirements.
• Economic Incentives Advisory Committee: met to design the Tradable Loads program. Included a farmer, a regulator, and environmentalist, and an academic.
• San Luis and Delta-Mendota Water Authority: regional group of water and drainage districts, seven of whose members are additionally organized as the Grassland Area Farmers. Signed the Use Agreement for the San Luis Drain with the Bureau of Reclamation
12
• U.S. Bureau of Reclamation: controls the San Luis Drain; established the selenium cap for the Grassland Area Farmers as part of the Grassland Bypass Project; participates in the Grassland Area Farmers Drainage Steering Committee meetings
• California Regional Water Quality Control Board, Central Valley Region (CRWQCB-CVR): issued a Waste Discharge Requirements Order to regulate the discharge from the bypass project; participates in the Grassland Area Farmers Drainage Steering Committee meetings
• Environmental Defense Fund (EDF): contributed significantly to the design of a workable trading program and the development of interim goals. First put forth the idea of using economic incentives to control the San Joaquin Valley’s agricultural pollution in 1994.
• Susan Austin: consultant and Project Director for the Economic Incentives Advisory Committee. Her role was to work with Grassland Area Farmers, environmentalists, and regulators to design, implement, and assess the selenium load trading program.
• California Department of Fish and Game: participates in the Grassland Area Farmers Drainage Steering Committee meetings
6. Regulatory drivers
The regional SLA provided the impetus and foundation for the tradable loads program. The California Regional Water Quality Control Board, Central Valley Region (CRWQCB-CVR) first developed load allocations for the region’s subsurface agricultural drainage in a 1994 report, which later formed the basis of the TMDL (CRWQCB-CVR 2001). When the Use Agreement for the San Luis Drain was signed in 1995, the selenium load limits were directly incorporated into the contract as an interim measure because they were not provided by existing state regulations (Young and Karkoski 2000). The RWQCB issued a Waste Discharge Requirement Order in 1998 to establish a limit enforceable by state permit. The selenium TMDL for the Lower San Joaquin River was completed in 2001 and now forms the basis for the monthly and annual load limits in the Waste Discharge Requirements and the Use Agreement’s load limits. The load allocations specified in the TMDL are the basis for the load limits in the Use Agreement starting in 2005 (CRWQCB-CVR 2001). TMDLs also exist for the Grassland Marshes (to protect the wetland channels) and the Salt Slough.
B. Trade Structure
7. Determination of credit
The total regional selenium load has been allocated among the districts in Grassland Area Farmers. These district-level SLAs set the baseline for trading. Districts that discharge below their SLA generate credits, and districts that exceed their SLA must trade with another district or pay an exceedence fee.
13
Credits are based on actual monthly selenium loads as measured by each irrigation district. Since it takes a month or two to process the data and make the exact numbers available, most trades have been retroactive (Joe McGahan, personal communication, May 12, 2004).
8. Trading ratios and other mechanisms to deal with uncertainty There is no trading ratio in the Grassland Tradable Loads program. There is a high degree of certainty compared to many other trading programs, since trades are based on measured selenium loads rather than estimates of BMP effectiveness. Furthermore, there is no need to adjust credits for relative environmental impacts because there is a single discharge point (Austin 2001).
9. Liability/penalties for noncompliance With retroactive trades based on actual selenium loads, there is no danger of noncompliance with trade agreements. Grassland Area Farmers does, however, have a fee and rebate policy that governs district-level SLA exceedances not offset by trades. Each district has its own system to enforce agreements and rules with farmers.
10. Approval process Trading agreements must be certified by the Regional Drainage Coordinator (Austin 2001).
11. Ex post verification/auditing. The drainage districts monitor selenium loads at the 62 sumps where water is pumped into the drain. A combination of flow measurements and analytical sampling is used to determine selenium loading, and although farmers and districts can estimate weekly updates on loading, it often takes a month or two before the exact numbers are known (Anderson 2000; Joe McGahan, personal communication, May 12, 2004). For this reason, final trade agreements are retroactive. In addition to the districts’ monitoring, the Bureau of Reclamation continuously monitors the discharge within the drain at an automated stations (Anderson 2000).
12. Mechanisms for trade identification and communication (education and outreach, third party facilitation, embedded ties) Embedded ties. Trading occurs between districts within the Grassland Area Farmers. District representatives have an opportunity to arrange trades at monthly meetings. The Regional Drainage Coordinator can also facilitate trades by sharing information (Austin 2001).
14

13. Market structure (bilateral, clearinghouse, third party brokers)
Bilateral. Irrigation and drainage districts sign bilateral Trade Agreements. An example of a Trade Agreement is included as an appendix in Austin (2001).
14. Types of trades allowed Nonpoint/nonpoint. Trades are for either monthly or annual allowances, with no banking permitted (Austin 2001).
C. Outcomes
15. Types and volume of trades that have occurred Nine trading agreements, involving 39 trades, had occurred by February 2000. These trades totaled 605 lbs of monthly selenium loads at approximately $40/lb and 128 lbs. of annual selenium loads at about $100/lb (Grumbles 2002).
16. Administrative costs The Tradable Loads program piggy-backs onto existing organizations of farmers and systems of monitoring and record-keeping, which streamlines the administration and regulatory oversight associated with trades (EDF 2000).
17. Transaction costs
The open communication and working relationship between the districts in Grassland Area Farmers has kept transaction costs to a minimum (Woodward et al. 2002). Information costs are kept low because monitoring is already conducted by each district, and search costs are low because districts can arrange trades at monthly meetings. Most districts report negligible costs for implementing a trade, with only one district reporting $500-1,000 for having a lawyer review the contract (Austin 2001).
18. Cost savings A total of $14,320 changed hands during the first five years of the agreement (Grumbles 2002). Many trades exchanged in-kind services, which makes trading significantly less costly for a district than paying incentive fees for an exceedance (Joe McGahan, personal communication, May 12, 2004). It is difficult, however, to estimate the costs savings of trading because the structures of trading purchases and incentive fees are very different. Incentive and rebate fees from SLA exceedances is a variable price per pound based on the total fees for the group (Anderson 2000).
15
19. Program goals achieved
Selenium loading has decreased every water year from 1995 to 2001, except the wet year in 1998, and regional selenium load targets have been met nearly every month through February 2004 (gathered from monthly reports posted at Grassland Bypass Compliance Monitoring Program, http://www.sfei.org/grassland/reports/gbppdfs.htm).
20. Program obstacles Green and Karkoski (2000: 157) noted that “several years of rancorous meetings preceded the final agreement.” Susan Austin opined that the biggest implementation challenge for the tradable loads program was determining a reasonable price for trading (Austin 2001).
21. NPS involvement and incentives to engage in trading. Farmers are already organized into water and drainage districts, and the districts can help manage the farmers’ selenium loading with policies such as tiered water pricing, low-interest loans for more efficient irrigation equipment, and recirculation requirements for drainage water. Irrigation efficiency decreases the deep percolation of water into fields and therefore the amount of selenium in the drainage water. (Austin 2000). The individual farmers, however, are not directly participating in trading. Selenium load allocations and accountability remains at the district level. In an ideal trading program, the market would be set at the farm level (Austin 2001).
22. Other An additional environmental benefit of the project was that removing drainage water from more than 93 miles of conveyance channels allowed the delivery of fresh water to wetland areas (USEPA 2001).
Program information/References Websites: Grassland Bypass Compliance Monitoring Program. http://www.sfei.org/grassland/reports/gbppdfs.htm Contacts: Joe McGahan, Drainage Coordinator for the Grassland Area Farmers, Summers Engineering, Inc. (559) 582-9237
16
Leslie F. Grober, Senior Land and Water Use Scientist, California Regional Water Quality Control Board. (916) 464-4851 Written Program Information: Anderson, Steven J. (2000). Appendix B: San Joaquin River Basin, CA: the
Grassland Bypass Project and Tradable Loads program In Kerr, Robert L., Anderson, Steven J., and Jaksch, John, Crosscutting analysis of trading programs: case studies in air, water, and wetland mitigation trading systems. Kerr, Greiner, Anderson & April and Battelle Pacific Northwest Division. A report prepared for the National Academy of Public Administration. Retrieved May 13, 2004 from http://www.napawash.org/pc_economy_environment/epa0601.pdf
Austin, Susan A. (2000). The tradable loads program in the Grassland Drainage Area [memo]. Retrieved February 17, 2004 from http://ageco.tamu.edu/faculty/woodward/et/grassland.htm
------(2001). Designing a selenium load trading program to reduce the water quality impacts of discharge from irrigated agriculture. Harvard Environmental Law Review 25(2): 337-403.
California Regional Water Quality Control Board - Central Valley Region (2001). Total Maximum Daily Load for the Lower San Joaquin River. California Environmental Protection Agency. Retrieved May 28, 2004 from http://www.swrcb.ca.gov/rwqcb5/programs/tmdl/Se%20TMDL%20Report.pdf
Environmental Defense (2000). Nonpoint source pollution control: breaking the regulatory stalemate. Retrieved March 14, 2004 from http://www.environmentaldefense.org/article.cfm?ContentID=2015
Environomics (1999). A summary of U.S. effluent trading and offset projects. A report prepared for Dr. Mahesh Podar, U.S. Environmental Protection Agency, Office of Water. Retrieved May 7, 2004 from http://www.epa.gov/owow/watershed/trading/traenvrn.pdf
Grumbles, Benjamin H. (2002). Statement before the Subcommittee on Water Resources and Environment of the Committee on Transportation and Infrastructure, U.S. House of Representatives, June 13, 2002. Retrieved March 14, 2004 from http://www.house.gov/transportation/water/06-13-02/grumbles.html
US Bureau of Reclamation (2002). Mid-Pacific region 2002 year in review. Retrieved May 12, 2004 from http://www.usbr.gov/mp/mp140/Yearinreview
US Environmental Protection Agency (2000). California farmers adopt tradable loads program to reduce selenium in agriculture irrigation runoff. Nonpoint Source News-Notes [electronic version], 60. Retrieved May 12, 2004 from http://www.epa.gov/owow/info/NewsNotes/issue60/agricult60.html#runoff
17
------(2001). Grassland bypass project: Economic incentives program help to improve water quality. Section 319 Success Stories III. Retrieved May 14, 2003 from http://www.epa.gov/owow/nps/Section319III/CA.htm
Woodward, R. T., Kaiser, R. A. and Wicks, A. B. (2002). The structure and practice of water quality trading markets. Journal of the American Water Resources Association. 38: 967-979
Young, Terry F. and Congdon, Chelsea H. (1994) Plowing new ground: using economic incentives to control water pollution from agriculture. Environmental Defense Fund.
Young, Terry F. and Karkoski, Joe (2000). Green evolution: are economic incentives the next step in nonpoint source pollution control? Water Policy. 2: 151-173.
Reviewed by Leslie Grober, Senior Land and Water Use Scientist, California Regional Water Quality Control Board
18
San Francisco Bay Mercury Offset Program (CA) A. Program Background
1. Program description Since the issue of mercury contamination was first raised in the early 1990’s, concerns over mercury in the Bay have escalated year by year. In 2000, a draft TDML was first written, and currently is in its final stages with final approval expected within the year (Mercury Watershed Council 2003). This document will include targets, in the form of goals related to bioaccumulation concentrations and wildlife risk concentrations, TMDL allocation, and an implementation plan. These targets and the implementation protocol will then enter the Basin Plan as an amendment (Strass 2004). No trading program has been developed, although the California Regional Water Quality Control Board (RWQCB) has stated that they are willing to consider a mercury trading program if a discharger proposes one (Dyan Whyte, personal communication, January 28, 2004). The Central Valley Watershed and Guadalope River Watersheds both contribute to mercury levels in the Bay, and thus establishing TMDLs and making progress in these watersheds are essential to lower the level of mercury in the Bay (Mercury Watershed Council 2003). In particular a TDML is in the process of being developed for Guadalope River (Strass 2004). The San Francisco Bay TMDL is currently in the final approval stage, and with 1,200 kilograms of mercury entering the Bay each year, trading may be essential after TMDL implementation (Mercury Watershed Council, 2003). The current proposed mercury concentration objective is .025 µg/l (averaged over 4 days), while the sediment target is a one-hour average total mercury sediment concentration of 2.1 µg/l.
2. Program motivation Mercury mines around the Bay first attracted public attention in the early 1990’s (RWQCB 2003) with concerns regarding the effects of mercury on the environment. The California EPA has issued fish consumption advisories warning people to limit their consumption of fish from the Bay (RWQCB 2003). Furthermore, reproductive failures have been witnessed among bird populations that consume fish from the Bay, believed to be due to mercury ingested by the birds that is subsequently passed through to their eggs (RWQCB 2003). According to the San Francisco Estuary Institute’s latest survey of fish, screening values of mercury were exceeded by about 38% (Greenfield et. al. 2003). Concern has been expressed by certain environmental groups that the consumption and negative effects of mercury in fish are disproportionately
19
borne by minorities because certain minority groups are more likely to fish the Bay for food and are often unaware of warnings from the EPA (NRDC 2001). The current goals for mercury reduction are .2 ppm mercury in fish tissue, .5 ppm mercury in bird eggs, and .2 ppm in sediments, which amounts to a 50% reduction (Mercury Watershed Council 2003).
3. Pollutant being traded
Mercury.
4. Size of program The TDML, and thus any potential trading program, includes these specific sections of the bay: Sacramento/San Joaquin River Delta, Suisun Bay, Carquinez Strait, San Pablo Bay, Richardson Bay, Central San Francisco Bay, Lower San Francisco Bay, and South San Francisco Bay (including the Lower South Bay) (Johnson and Looker, 2003). Potential trading parties: N/A
5. Stakeholders/participants • Mercury Watershed Council: A division of the San Francisco Bay
Regional Water Quality Control Board, this council is most directly responsible for setting forth guidelines and developing solutions.
• San Francisco Estuary Institute: The San Francisco Estuary Institute is a non-profit research organization made up of scientists, governments, industries, and other concerned citizens that focuses on environmental issues in the San Francisco Bay region. In particular the Institute published a study on the contamination of fish by the Bay, and conducts a comprehensive regional monitoring program in collaboration with the Regional Water Quality Control Board, and regulated dischargers. http://www.sfei.org
• National Resources Defense Council: The National Resources Defense Council is an environmental group with a section in San Francisco working to alert the public of environmental problems in the region. This group is concerned that the effects of mercury contamination in fish are disproportionately borne by minorities. http://www.nrdc.org/greengate/health/fishf.asp
• Local industrial, municipal wastewater, and municipal storm water permittees: These groups will are to be given waste load allocations that will be included in the Basin Management Plan once the TDML is released.
6. Regulatory drivers
20
The Clean Water Act of 1977 requires that states identify water bodies that do not meet certain standards. If these standards are not met, then a TMDL must be developed. This act has been the impetus for the San Francisco Bay TMDL. The TDML is still in the development stages as the final document has not been released. Although the TDML/Planning and Policy Division of the California Regional Water Quality Control Board has announced their willingness to consider specific trades by stakeholders, without a TDML there is little incentive for trading.
B. Trade Structure
Trading structure for the San Francisco Bay Mercury Offset Program has not yet been developed. 7. Determination of credit
N/A
8. Trading ratios and other mechanisms to deal with uncertainty
N/A
9. Liability/penalties for noncompliance
N/A
10. Approval process
N/A
11. Ex post verification/auditing.
N/A
12. Mechanisms for trade identification and communication (education and outreach, third party facilitation, embedded ties)
N/A
13. Market structure (bilateral, clearinghouse, third party brokers)
N/A
14. Types of trades allowed
21
N/A
C. Outcomes
15. Types and volume of trades that have occurred
None. There does not yet exist a framework in which trades can occur.
16. Administrative costs
N/A
17. Transaction costs
N/A
18. Cost savings
N/A
19. Program goals achieved N/A
20. Program obstacles N/A
21. NPS involvement and incentives to engage in trading.
N/A
22. Other Program information/References
Websites: San Francisco Bay Regional Water Quality Control Board: San Francisco Bay Mercury TMDL. http://www.swrcb.ca.gov/rwqcb2/sfbaymercurytmdl.htm Contacts: Dyan Whyte, TMDL/Planning and Policy Division, San Francisco Bay
Mercury Offset Program. (510) 622-2441. Written Program Information:
22
Environomics (1999). A summary of U.S. effluent trading and offset projects. A report prepared for Dr. Mahesh Podar, U.S. Environmental Protection Agency, Office of Water. Retrieved May 7, 2004 from http://www.epa.gov/owow/watershed/trading/traenvrn.pdf
Greenfield, Ben K., Davis, J.A., Fairy, R., Roberts, C., Crane, D.B., Ichikawa, G. and Petreas, M. (2003). Contaminant concentrations in fish from San Francisco Bay, 2000. RMP Technical Report: SFEI Contribution 77. San Francisco Estuary Institute, Oakland, CA.
Johnson, Bill and Looker, Richard (2003). Mercury in San Francisco Bay Total Maximum Daily Load (TDML) Report. Retrieved April 20, 2004 from http://www.swrcb.ca.gov/rwqcb2/TMDL/SFBayMercury/SFBayMercuryTMDLProjectReport.pdf
Mercury Watershed Council (2003). San Francisco Bay Mercury TMDL. Retrieved May 11, 2004 from http://www.swrcb.ca.gov/rwqcb2/sfbaymercurytmdl.htm
National Resources Defense Council (NRDC) (2001). Contamination of fish from San Francisco Bay. Retrieved February 18, 2005 from http://www.nrdc.org/greengate/health/fishf.asp
San Francisco Regional Water Quality Control Board (RWQCB) (1995). Water Quality Control Plan (Basin Plan) for the San Francisco Bay Basin. Retrieved May 11, 2004 from http://www.swrcb.ca.gov/rwqcb2/basinplan.htm
------(2003). San Francisco Bay Mercury TMDL Project Plan. Retrieved May 11, 2004 from http://www.swrcb.ca.gov/rwqcb2/TMDL/SFBayMercury/SFBayMercuryProjectPlan.pdf
Strass, A. (2004). Synopsis of the U.S. EPA Comments Regarding the June 2003 SF Bay Mercury TMDL Report and Water Board Responses. January 30, 2004.
23
Bear Creek (CO) A. Program Background
1. Program description The Colorado Water Quality Control Commission is appointed by the Governor and serves as the rule-making policy body for clean water in Colorado. The Bear Creek Watershed Control Regulation (Regulation #74), issued by the Colorado Department of Public Health and Environment, Water Quality Control Commission defines water quality goals, wasteload allocation for total phosphorus, and outlines the monitoring program, and other strategies for the Bear Creek Watershed (RNC Consulting 2003). There is not an official trading program outlined in the Regulation; however, the Regulation does permit the Water Quality Control Division of the Colorado Department of Public Health and Environment to “allow small wastewater treatment facilities with design capacities of 20,000 gallons per day or less to discharge a total phosphorus concentration of greater than 1.0 mg/l if an agreement is made for equal phosphorus reduction at another facility” (CDPH 2001). There is one instance in which trading has occurred. The Forest Hills Metropolitan District is a very small point source polluter. Forest Hills is allowed to discharge more than allowed under its permit with offsets from the Evergreen Metropolitan District, a large point source polluter.
2. Program motivation
Bear Creek Reservoir currently is experiencing algal blooms in the growing season due to a high level of nutrients in the water (CDPH 2001). Low oxygen conditions have eliminated most of the cold water habitat for aquatic life from July to September, severely limiting the recreational potential of the lake (CDPH 2001). A study by Richard P. Arber Associates (1998) of wastewater treatment plants in the basin showed that “biological treatment processes for reducing phosphorus, or simple alum addition to wastewater in a chemical treatment plant, can achieve a total phosphorus concentration of 1.0 mg/l without a major upgrade of treatment facilities and with considerably less operation and maintenance expense then with advanced treatment” (CDPH 2001, Richard P. Arber Associates 1998, pp. 30-31). As a result of this study, the management plan recommends a 75% reduction from the current 21,584 pounds per year in point source phosphorus loading each year (CDPH 2001). Trading pollution rights is a secondary outcome of this program and has been integrated into the program to achieve goals of improved water quality in the most cost effective way. One point source-point source trade has occurred which allows a small polluter to take advantage of a larger polluters better
24
technology and pay the larger polluter to clean up an amount of pollution equivalent to what the small plant would need to clean up. This allows the small polluter to pay less over time for pollution reduction and thus the trade is motivated by the implications and limitations of economies of scale that affect the small polluter. Currently, non point sources have been instructed to adhere to best management practices (BMPs), which essentially eliminates the potential to trade pollution rights.
3. Pollutant being traded Phosphorus. Reducing phosphorus has been identified as the necessary step to reduce levels of chlorophyll a and its negative side effects that currently plague the reservoir (CDPH 2001).
4. Size of program The Bear Creek Watershed is 83,665 acres (RNC Consulting 2003). It includes Bear Creek and all its tributaries, Turkey Creek and all its tributaries, and Bear Creek Reservoir in Jefferson County (CDPH 2001). The watershed also extends into Clear Creek and Park counties (CDPH 2001). Potential trading parties: There are two participants, Evergreen Metropolitan District and Forest Hills Metropolitan District, who actually participated in the trade, as described below. Other point source polluters could also attempt to take advantage of trading opportunities, but have not.
5. Stakeholders/participants • Colorado Water Quality Control Commission: Created by the Colorado
Clean Water Act, this Commission issues “control regulations which describe prohibitions, standards, concentrations, and effluent limitations on the extent of specifically identified pollutants that any person many discharge into and specified class of state waters” (CDPH, 2001). The Commission issues the regulations that other committees and organizations must enforce and adhere to, such as Regulation #74.
• Water Quality Control Division of the Colorado Department of Public Health and the Environment: The duties of the Water Quality Control Division are defined under the Colorado Water Quality Control Act. This division can issue requirements with regard to site approvals and discharge permits and overseas potential trades which are then reviewed by the Bear Creek Watershed Association.
• Denver Regional Council of Governments (DRCOG): The DRCOG is a voluntary association of 50 county and municipal governments in the Denver, Colorado metro area, working together to address regional issues.
25
This group has released the Clean Water Plan which addresses clean water concerns and management programs on both a regional and local scale.
• Bear Creek Management Plan Committee: The committee is made up of representatives from the following four groups: Local Governments, State Agencies, Federal Agencies, Denver Regional Council of Governments. This Committee defines goals and objectives for improving water quality in the reservoir.
• Bear Creek Watershed Association: The Association is recognized by the Denver Regional Council of Governments (DRCOG) as the “designated water quality management agency for the Bear Creek Watershed. The agency implements the Bear Creek Reservoir Control Regulation” (Regulation #74) (RNC Consulting 2003).Members of the Association include governments, special districts, and all National Pollutant Discharge Elimination System (NPDES) dischargers in the Watershed. The Association promotes joint participation and planning among all members.
6. Regulatory drivers
The Bear Creek Watershed Management Plan was developed by the DRCOG after the implementation of the Clean Water Act (DRCOG 1998). This plan was developed with cooperation from local governments, state agencies, and citizens with the goal of improving the quality of the water in the Bear Creek Reservoir (CDPH 2001). The Bear Creek Watershed Control Regulation (Regulation No. 74; 5 CCR 1002-74) “assures watershed point and nonpoint source water quality compliance consistent with adopted stream standards and classifications” (RNC Consulting 2003). It also defines the water quality goal, wasteload allocation for total phosphorus (pages 3-4 describe the initial formula for allocation), monitoring and control strategies for the Bear Creek Watershed (RNC Consulting 2003).
B. Trade Structure 7. Determination of credit
Within the Bear Creek Watershed, all point sources are to be limited to an aggregate phosphorus wasteload of 5,255 pounds per year (RNC Consulting 2003). The Evergreen Metropolitan District is allowed 1,500 pounds of phosphorus to be discharged each year, while Forest Hills Metropolitan District is allowed 80. However, Forest Hills produces closer to 98 pounds of phosphorus (Russell Clayshulte, personal communication, April 9, 2004). For this reason the trade is built into each company’s permits, requiring Evergreen Metro to offset Forest Hills’ discharge in a 1:1 ratio of 48 pounds (Russell Clayshulte, personal communication, April 9, 2004).
26
8. Trading ratios and other mechanisms to deal with uncertainty
This trade is built into the permits of both Evergreen Metro and Forest Hills. There is no monitoring program set up, it is only required that Evergreen and Forest Hills report their releases, but a violation of a permit is serious, so there is a strong incentive for them to comply.
9. Liability/penalties for noncompliance
Failure to meet to the specified discharge by either organization would be a violation of their permit and thus would be subject to Clean Water Act penalties (Russell Clayshulte, personal communication, April 9, 2004). The actual control regulation has been adapted by the state, and so although no system of penalties for violations of the regulation has been set up, it is expected in the future (Russell Clayshulte, personal communication, April 9, 2004). This year, in fact, the Association is scheduled to meet to strengthen regulations and in particular look more closely as how to regulate and enforce nonpoint pollution (Russell Clayshulte, personal communication, April 9, 2004).
10. Approval process In this specific case, the trade was first recommended by the Association and a site application and permit amendment process by the State Department of Health was carried out (Russell Clayshulte, personal communication, April 9, 2004). Once approved by the Regional Council of Governments, the Water Quality Control Division included the trade in the two permits (Russell Clayshulte, personal communication, April 9, 2004).
11. Ex post verification/auditing. All point source dischargers will be subject to monitoring under the Bear Creek Watershed Control Regulation (2001), section 74.6.
12. Mechanisms for trade identification and communication (education and
outreach, third party facilitation, embedded ties)
It is expected that the control regulation will be changed in the near future to incorporate more trading as treatment plants are approaching their allocations and new players want their own allocations (Russell Clayshulte, personal communication, April 9, 2004).
13. Market structure (bilateral, clearinghouse, third party brokers)
So far the only trade that has occurred was between two point sources that met directly.
27
14. Types of trades allowed
This program addresses point sources and non-point sources separately. Nonpoint sources are required by the Bear Creek Watershed Control Regulation (2001) to implement BMPs to control erosion and sediment loading. Further information about what defines BMPs and what the specific restrictions is available in the Bear Creek Watershed Control Regulation (2001). Nonpoint sources will not be discussed further here because the requirement of BMPs eliminates the possibility of trading. One point source trade (discussed above and below) has occurred. However, it is expected that more point-point trades will occur in the future.
C. Outcomes
15. Types and volume of trades that have occurred
One point-point trade has occurred. Each year Evergreen Metro reduces phosphorus release in a trade of 40-80 pounds per year so that Forest Hills does not have to undergo a costly upgrade of facilities (Russell Clayshulte, personal communication, April 9, 2004).
16. Administrative costs
The administrative costs of this trade are minimal. The parties must meet and discuss the trade, and then loading data needs to be entered into a spreadsheet and an annual report is released (Russell Clayshulte, personal communication, April 9, 2004). The regulatory agency only needs to pay someone to look over the annual report (Russell Clayshulte, personal communication, April 9, 2004).
17. Transaction costs
As mentioned above, a yearly meeting is necessary in addition to minimal loading data that needs to be reported.
18. Cost savings It is estimated that Forest Hills saves over $1.2 million, the cost of an expensive system replacement that would be necessary to meet their allocation with out a trade (Russell Clayshulte, personal communication, April 9, 2004). In exchange for Evergreen Metro reducing their discharge, Forest Hills pays an undisclosed amount of money that has been estimated to be around $5,000 per year (Russell Clayshulte, personal communication, April 9, 2004).
19. Program goals achieved
28
According to RNC Consulting (2003), the trophic status of the reservoir has shifted from hypertrophic-eutrophic towards the eutrophic-mesotrophic boundary. In addition, all major wastewater treatment plants are in compliance with the control regulation and are meeting the specific wasteload they were allocated.
20. Program obstacles Several small plants (Brook Forest Inn, Bear Creek Development Corporation, Bear Creek Cabins, and Geneva Glen) have had compliance problems or have not been meeting the agency’s reporting standards (RNC Consulting 2003).
21. NPS involvement and incentives to engage in trading.
NPS involvement in trading was restricted due to a mandate of implementation of best management practices (BMPs) in the permit (CDPH 2001). The implementation of BMPs will be reviewed along with the regulation in general at each mandatory triennial review. NPS activities will likely be the focus of the Bear Creek Watershed Association in the future (RNC Consulting 2003).
22. Other Program information/References
Websites: See individual websites under “Written program information.” Contacts: Russell N. Clayshulte, RNC Consulting and Denver Regional Council of Governments. (303) 751-7144 Bill McKee, Water Quality Control Division, Colorado Department of Health
and Environment. (303) 692-3583 Written program information: Bear Creek Watershed Association and Colorado Water Quality Control
Division (2001). 2002-2005 Bear Creek Watershed: Sample Analysis Plan (SAP) and Quality Assurance Project Plan (QAPP). Retrieved May 11, 2004 from http://www.drcog.org/reg_growth/water/regional_water_quality%20data_management/pdf_files/Bear_Creek_SAP_and_QAPP.pdf
Clear Creek County Planning and Zoning Department (2003). Clear Creek County Master Plan. Retrieved May 11, 2004 from
http://www.co.clear-creek.co.us/Depts/Planning/Masterplan.htm Colorado Department of Public Health and Environment Water Quality
Control Commission (CDPH) (2001). Bear Creek Watershed Control
29
Regulation (Regulation No. 74 5 CCR 1002-74). Retrieved January 30, 2004 from http://www.cdphe.state.co.us/op/regs/waterregs/100274.pdf
Denver Regional Council of Governments (1998). Metro Vision 2020 Clean Water Plan: policies, assessments, and management programs. Retrieved February 11, 2004 from http://www.drcog.org/reg_growth/water/1pagecwp.htm
------(1999). 1999 Clean Water Plan amendments to the Metro Vision 2020 Plan. Retrieved May 11, 2004 from http://www.drcog.org/downloads/cwp.pdf
Environomics (1999). A summary of U.S. effluent trading and offset projects. A report prepared for Dr. Mahesh Podar, U.S. Environmental Protection Agency, Office of Water. Retrieved May 7, 2004 from http://www.epa.gov/owow/watershed/trading/traenvrn.pdf
Richard P. Arber Associates (1998). Water Sewer Availability Study: Clear Creek County. Available from Richard P. Arber and Associates upon request. (www.arber.com)
RNC Consulting (2003). Bear Creek Watershed Report 2002: Annual Report & Water Quality Summary Sheets. A report prepared for the Bear Creek Watershed Association. Available from RNC Consulting upon request.
30
Boulder Creek Trading Program (CO) A. Program Background
1. Program description
In 1986, the City of Boulder, CO needed to renew the National Pollutant Discharge Elimination System (NPDES) permit for its wastewater treatment plant (WWTP), but it faced increased regulation due to impaired water quality in Boulder Creek. A traditional approach would have called for upgrading the WWTP to full nitrification, but after studies indicated that the ammonia toxicity was largely due to degraded riparian conditions, the City proposed a combination of partial nitrification upgrades and stream restoration projects (USEPA 1996). The City emphasizes that this innovative approach to water quality, known as the Boulder Creek Enhancement Project, is a case of “trade-offs” rather than formal trading (Chris Rudkin, personal communication, March 13, 2003). The 1991 WWTP modifications cost $23 million, which was primarily used for partial nitrification upgrades. The stream restoration projects proceeded in four phases and covered 4.6 miles. Phase I, completed in 1990, implemented six best management practices (BMPs) over a 1.3-mile segment of the creek that ran through a cattle ranch. The BMPs included cattle fencing, streambank stabilization, riparian revegetation, channel modification, and reaeration (USEPA 1996). Phase II, completed in 1991, extended restoration along another 1.1 miles. Phase III, completed in 1992, added another 0.5 miles. Phase IV, completed in 1994, involved 1.7 miles.
2. Program motivation
Although the POTW was in compliance with state water quality guidelines, a 15.5-mile segment of Boulder Creek below the WWTP exceeded standards for un-ionized ammonia and failed to attain the state-designated uses for warm water aquatic life (USEPA 1993b). Studies indicated that plant upgrades alone could not have solved these water quality problems. Stream channelization, riparian degradation by cattle, and, to a lesser extent, nonpoint source nutrient loading significantly contributed to the impaired water quality (USEPA 1993b).
3. Pollutant being traded
Nitrogen
4. Size of program
The environmental focus was on 15.5 miles of Boulder Creek downstream of Boulder, CO. The Boulder Creek Enhancement Project involved only one
31
point source (the Boulder WWTP) and 4.6 miles of stream. The total watershed covered 1,160 km2. Parties to trade: City of Boulder, CO; landowners along Boulder Creek
5. Stakeholders/participants • City of Boulder, CO: created offset framework, negotiated with
landowners, implemented stream restoration projects • State of Colorado, Colorado Water Quality Control Division: provided
monitoring data and financial support under the Nonpoint Source Pollution Prevention Program
• US EPA Region 8: provided guidance and financial support to Boulder • City of Longmont, CO: conducted instream monitoring • community volunteers: provided labor and materials for restoration
projects • Consultants: Love & Associates; Aquatic and Wetland Consultants
6. Regulatory drivers
Colorado protects the designated uses of surface waters, including warm water aquatic life, under NPDES permitting requirements. Although not formally submitted as a TMDL, the Boulder Creek Enhancement Project demonstrated a holistic approach and paralleled the TMDL process (USEPA 1993b). As of 1999, Boulder Creek was on a list of waters for which a TMDL must be developed (Environomics 1999).
B. Trade Structure 7. Determination of credit
Since this was not a formal trading program, there was no need to determine credits.
8. Trading ratios and other mechanisms to deal with uncertainty
Since this was not a formal trading program, and the ultimate bar was set by water quality standards rather than compliance, there was no need to manage uncertainty with trading ratios. Although there was uncertainty introduced by the fact that many BMPs had been somewhat untested, the three-phase approach allowed for adaptive improvements to be made in the fencing and replanting technology (USEPA 1992).
9. Liability/penalties for noncompliance
32
Most of the BMPs involved permanent constructions or plantings to restore the stream integrity rather than agricultural practices that could be subject to noncompliance. An easement guarantees the permanent protection of a cattle exclusion buffer between grazing land and the creek.
10. Approval process Since this was not a formal trading program, individual nonpoint source projects did not have to be certified or approved by any regulatory agency.
11. Ex post verification/auditing. Baseline data was collected before, during, and after the implementation of each BMP project, but some of the riparian restoration and revegetation projects may take up to a decade to show measurable results. Instream monitoring included monthly sampling for water quality, flow, temperature and vegetation. Rapid Bioassessment and Indices of Biotic Integrity for fish and vertebrates are also conducted (USEPA 1992). US EPA Region VII provides financial support for the in-stream monitoring efforts of the Cities of Boulder and Longmont, and the USGS, the Colorado Water Quality Control Division, and a University of Colorado Undergraduate Research Program have also provided additional stream monitoring data (USEPA n.d.).
12. Mechanisms for trade identification and communication (education and
outreach, third party facilitation, embedded ties)
Education and Outreach. Consultants helped to identify the important sections of the creek, and the City’s real estate office helped to identify ownership plots fitting certain criteria. These criteria included environmental priority, project budget, and size and ownership patterns. The City then contacted landowners directly, although word of mouth spread the news about the project and helped landowners initiate projects themselves (Chris Rudkin, personal communication, March 13, 2003)
13. Market structure (bilateral, clearinghouse, third party brokers)
Sole-source offsets. The City of Boulder, CO coordinated and implemented all BMPs directly as part of a holistic approach towards water quality.
14. Types of trades allowed
Point/nonpoint. This is technically not a trade, but it utilized in-stream restoration projects to help defer full nitrification WWTP upgrades.
C. Outcomes
33
15. Types and volume of trades that have occurred
Stream restoration projects have included: streambank stabilization, riparian restoration, development of pool habitat, narrowing/deepening the channel, returning natural sinuosity, restoring ring wetlands habitat, rerouting irrigation return flows through developed wetland (USEPA 1996).
16. Administrative costs
The Phase I demonstration project cost $125,000, and is estimated to value $426,000, including donated time, labor, and materials. Phase II funding was also $125,000. Phase III was funded for $75,000, and Phase IV is estimated at $225,000. The total cost is estimated at $1.3-1.4 million (USEPA 1996). Costs included the costs of gathering data for planning and evaluation, construction, materials, labor, and time. The overall cost was brought down by the donation of volunteer labor, time, materials, and land easements from landowners.
17. Transaction costs
The City coordinated and implemented stream restoration projects, reducing transaction costs.
18. Cost savings
Although the City did have to go forward with significant WWTP upgrades, it saved $3-7 million by deferring full nitrification modifications (USEPA 1996).
19. Program goals achieved
The key environmental objective of the Boulder Creek Enhancement Project was to restore water quality and achieve the designated uses for aquatic life. The project did achieve these goals: un-ionized ammonia has decreased, and measurements of pH, temperature, and aquatic life have improved (USEPA 1996). In addition, the Boulder Creek Enhancement Project was valuable as a laboratory for testing how channel modifications, revegetation, and riparian habitat restoration could impact ambient water quality. The project was innovative in its use of stream restoration technologies, and the phasing allowed for BMPs to be tested and improved (USEPA 1992).
20. Program obstacles
34

Some of the BMPs, particularly the fencing and the tree-planting, were not initially successful. The three-phase approach allowed subsequent improvements to be made (USEPA 1992).
21. NPS involvement and incentives to engage in trading. The City reached out to landowners with an upfront, watershed-wide educational campaign, and it worked cooperatively and flexibly with landowners to respond to their needs and concerns. Positive incentives for cooperating with the City included increased stability of land, increased land values, aesthetic improvements, and community strengthening. Although landowners were not paid, there was no cost to them because the City constructed all BMPs (Bruce Zander, personal communication, March 2003).
22. Other 23. Program information references
Websites: N/A Contacts: Chris Rudkin, City of Boulder, CO. (303) 413-7355. Bruce Zander, U.S. Environmental Protection Agency Region 8. (303) 312-
6846. Written Program Information: Environomics (1999). A summary of U.S. effluent trading and offset projects.
A report prepared for Dr. Mahesh Podar, U.S. Environmental Protection Agency, Office of Water. Retrieved May 7, 2004 from http://www.epa.gov/owow/watershed/trading/traenvrn.pdf
US Environmental Protection Agency (USEPA) (n.d.). Boulder Creek, CO: considerations for using ecological restoration: elevated concentrations of un-ionized ammonia. Retrieved January 20, 2004 from http://www.epa.gov/owow/nps/Ecology/chap6bou.html
--------(1992). Boulder Creek, CO: nonpoint source meets point source in win-win situation. Nonpoint Source News Notes, 18. Retrieved February 20, 2003 from http://www.epa.gov/owow/info/NewsNotes/issue18/nps18new.html
--------(1993a). Polluted runoff (nonpoint source pollution ) – Section 319 success stories – Colorado. Retrieved January 15, 2003 from http://www.epa.gov/OWOW/NPS/Success319/CO.html
--------(1993b). TMDL case study: Boulder Creek, Colorado. EPA841-F-93-006. Retrieved January 8, 2004 from http://www.epa.gov/OWOW/tmdl/cs8/cs8.htm
--------(1996). Draft trading framework – December 1996: Boulder Creek, Colorado. Retrieved on January 8, 2004 from http://www.epa.gov/owow/watershed/trading/bould.htm
35
US Geological Survey (2003). Water quality of the Boulder Creek watershed, Colorado. USGS Fact Sheet 043-03. Retrieved on January 8, 2004 from http://wwwbrr.cr.usgs.gov/projects/SWC_Boulder_Watershed/Fact%20Sheet%20FINAL508.pdf
36
Chatfield Reservoir Trading Program (CO) A. Program Background
1. Program description
Eutrophication concerns prompted the development of a phosphorus management program for the Chatfield Watershed. A TMAL has been established and trading guidelines have been developed. A point source’s discharge may only exceed the set phosphorus concentration limit of 1.0 mg/l if, through the purchase of credits, the amount of discharge above this limit is offset by reductions made at another source (CDPHE 1999). The Chatfield Watershed Authority acts as a clearinghouse through which nonpoint sources can deposit credits into a “Authority Removal Credits” pool (Chatfield Watershed Authority 2000). Once a 2:1 trading ratio and additional processing fees have been applied, these nonpoint reductions enter the “Authority Discharge Credits Pool” from which point sources can purchase credits (Chatfield Watershed Authority 2000). Credit purchases allow a point source’s discharge to exceed its allowance outlined in the Chatfield Reservoir Control Regulation, and specified in its permit. Point sources may also engage in bilateral trading and are permitted to proactively recruit other point sources to supply credits. The generally accepted trading ratio for both point and nonpoint sources is 2:1 (Chatfield Watershed Authority 2000). However, all trades must be approved by the Water Quality Control Commission on a case-by-case basis, so trading ratios may differ across cases.
2. Program motivation Although originally constructed to protect Denver from possible floods, the Chatfield reservoir is now a state park and a popular recreation area (Little and Zander 1996). Concerns about chlorophyll A levels and resulting eutrophication are the principal motivating factors behind the Water Quality program (Little and Zander 1996). A TMAL has been created that allocates 7,446 lbs/yr of phosphorus loading to point sources, and 51,554 lbs/yr to nonpoint sources, background pollution, and phosphorus that enters from the Upper South Platte River Watershed (which amounts to approximately 17,930 lbs/yr) (RNC Consulting 2003). In 2002, only 3,676 pounds of phosphorus were discharged from point sources (RNC Consulting 2003).
37
3. Pollutant being traded Phosphorus
4. Size of program The Watershed is approximately 3,000 square miles in area (Little and Zander 1996), receives drainage from the South Platte River Watershed in Jefferson and Park counties (RNC Consulting 2003) and borders Cherry Creek Watershed to the east. Trading parties: Both point and nonpoint sources are expected to be involved.
5. Stakeholders/participants • Chatfield Watershed Authority: The designated water quality management
agency for the Chatfield Watershed (RNC Consulting 2003). The Authority is responsible for implementing the Chatfield Reservoir Control Regulation. Formed by an intergovernmental agreement (CDPHE 1999), membership includes local towns, counties, districts, industry and agencies, and church camps (RNC Consulting 2003).
• Point Source Dischargers: There are 7 point source dischargers (CDPHE 1999).
• Nonpoint Source Dischargers: Nonpoint source dischargers are actively recruited through different Chatfield Watershed Authority projects to reduce discharge.
• Water Quality Control Division: The Water Quality Control Division reviews all decisions and recommendations of the Chatfield Watershed Authority.
6. Regulatory drivers
The Chatfield Reservoir Control Regulation (Regulation #73) specifies water quality standards to be met by both point and nonpoint sources. It also outlines the formulas and procedures used to determine the TMAL. Denver Regional Council of Governments (DRCOG) Metro Vision 2020 Clean Water Plan (the Chatfield Water quality program is referenced in this.) http://www.drcog.org/downloads/cwp.pdf. The Metro Vision 2020 Plan outlines community goals, including clean water. Although not a regulatory driver, it affects the environment in which trading will occur.
B. Trade Structure
7. Determination of credit
38
No point source discharges (including municipal, domestic or individual waster water discharge) can exceed 1.0 mg/l total phosphorus as a 30-day average concentration, except as provided for under trading provisions (RNC Consulting 2003). The regulation authorizes both point-point and point-nonpoint trades. In particular point sources can increase their wasteload allocation if nonpoint sources reduce their phosphorus release in a ratio of 2:1 (RNC Consulting 2003). This ratio may be less, but is evaluated on a case-by-case basis. Point sources can bilaterally transfer pollution allocations to one another if approved by the Chatfield Watershed Authority, but a 2:1 trading ratio is applied. Finally, all trading and approvals by the Chatfield Watershed Authority are subject to confirmation by the Water Quality Control Division (RNC Consulting 2003).
8. Trading ratios and other mechanisms to deal with uncertainty
The trading ratio is 2:1; for every 2 pounds of phosphorus reduced by nonpoint sources, a point source is granted a one pound phosphorus credit (RNC Consulting 2003).
9. Liability/penalties for noncompliance
“Trade credits shall be incorporated into the discharge permits by the Water Quality Control Division, as appropriate and incorporated as proposed amendments to the phosphorus allocation at the next triennial review of rulemaking hearing for the Regulation (RNC Consulting 2003).” Serious penalties are applied in cases where a permit is violated.
10. Approval process Trades that are either done through the Chatfield Watershed Authority and its “Authority Discharge Credits” pool as well as those trades negotiated by a third party or negotiated directly by two point sources must all be approved by both the Chatfield Watershed Authority and the Water Quality Control Division.
11. Ex post verification/auditing. A monitoring program that takes samples throughout the watershed is in place and is being carried out by the Chatfield Watershed Authority (RNC Consulting 2003). The monitoring program attempts to assess the annual and growing season limnological status of Chatfield Reservoir; whether the current total phosphorus load controls are working to prevent further eutrophication of the reservoir, and whether the watershed is in compliance with the regulation (RNC Consulting, 2003). The 2003-2005 Chatfield
39
Watershed Authority: Quality Assurance Project Plan (QAPP), Sampling and Analysis Plan (SAP) and Standard Operating Procedures (SOP) Version 2.0, January 1, 2003 provides a more detailed description of the monitoring program.
12. Mechanisms for trade identification and communication (education and outreach, third party facilitation, embedded ties)
Point sources can apply to the Chatfield Watershed Authority for phosphorus trade credits, which would allow them to increase their phosphorus discharge above their permitted level, or above the 1.0 mg/l concentration limit. These trade credits for point sources are based on phosphorus reductions made by nonpoint sources (RNC Consulting 2003). The Chatfield Watershed Authority develops specific programs and incentive strategies to encourage nonpoint sources to reduce phosphorus discharges. These reductions are banked by the Authority and subsequently sold to point sources.
13. Market structure (bilateral, clearinghouse, third party brokers) The Chatfield trading program includes a clearinghouse but also accepts bilateral agreements. The Chatfield Watershed Authority accepts credits from nonpoint sources and pools them as credits to be purchased by point sources. Point sources can alternatively contact point sources directly to pursue a trade, subject to approval.
14. Types of trades allowed Both point/point and point/nonpoint trades are allowed. In both cases, a 2:1 trading ratio is applied unless otherwise approved by the Authority and the Water Quality Control Division. The Authority essentially banks credits from nonpoint sources until they are purchased by point sources.
C. Outcomes
15. Types and volume of trades that have occurred
One trade has taken place and although other trades have been discussed, they have yet to be implemented. The one trade involves the purchase of credits by the Ponderosa Wastewater Treatment Plant at the Ponderosa Retreat and Conference Center from the Authority’s pool (Russell Clayshulte, personal communication, April 25, 2004). In the end, Ponderosa will only need two pounds of phosphorus credit from the pool. The actual project involves the replacement of an outdated septic system with a new sewage treatment plant. The project will occur in two phases. The first phase will result in reductions in phosphorus almost equal to what is required cover the increase in discharge from the new treatment plant, once the 2:1 trading ratio is applied; however, the project will be short two pounds (Russell Clayshulte, personal
40
communication, April 25, 2004). The Authority has approved Ponderosa’s purchase of these 2 pounds from the “emergency pool” that was created under Regulation 73 (Russell Clayshulte, personal communication, April 25, 2004). After phase II, however, the permit pounds will equal the trade credit pounds and the two pounds will reenter the emergency pool (Russell Clayshulte, personal communication, April 25, 2004).
16. Administrative costs A $100 application fee to cover administrative costs is required for point sources to apply for increased discharge through trading (Chatfield Watershed Authority 2000). Credits that enter the pool are sold at a price that reflects the cost of nonpoint source reduction projects, costs associated with the pooling program, and costs incurred by the Authority to administer the trading program (Chatfield Watershed Authority 2000). Exact costs are unknown, but the monitoring program has been estimated to cost $58,500/year (DRCOG 2004).
17. Transaction costs
Discussed above under ‘administrative costs.’
18. Cost savings Not determined
19. Program goals achieved
The program has created the necessary infrastructure for trading in the future. However, little trading has occurred due to the lack of need for credits (Kathleen Reilly, personal communication, May 26, 2004).
20. Program obstacles
Little and Zander (1996) determined that nonpoint source involvement in pollution reduction via trading only becomes cost-effective once point sources are subject to strict discharge limits—approximately 1.0 to .5 mg/l effluent total phosphorus. Until this limit is reached, most dischargers have no need for the trading program. Funding is a problem for nonpoint source reduction efforts due to difficulties associated with measuring the change in water quality from nonpoint sources reductions (DRCOG 2004).
21. NPS involvement and incentives to engage in trading.
41
Regulation 73 states that BMP’s for sediment and erosion control should be implemented by nonpoint sources. In addition “nonpoint control programs” should be implemented to reduce nonpoint phosphorus release into the Basin by nonpoint sources to 33,712 lbs/yr in the category reservoir base load and background. The required nonpoint source phosphorus pollution reduction plan has been put in place by the Chatfield Watershed Authority. The Authority has divided the watershed into 30 drainage areas so that base-loads, point source and storm water runoff can be assigned phosphorus loads (RNC Consulting 2003). The Authority then works with potential phosphorus polluters to maintain a plan to reduce overall phosphorus discharge from nonpoint sources (RNC Consulting 2003). The nonpoint strategy includes permit managing, BMP’s implementation, TMDL screening, sediment and erosion control reduction and monitoring programs, establishing BMP’s with regards to stream bank restoration and new highway construction, and developing water quality education efforts, as well as other measures described in the Chatfield Watershed Report 2002 (RNC Consulting 2003). Nonpoint source reductions and BMPs such as those related to storm water runoff, will be incorporated into permits (CDPHE 1999).
22. Other
Program information/References
Websites: See websites related to specific sources below. Contacts: Russell N. Clayshulte, RNC Consulting and Denver Regional Council of Governments. (303) 751-7144 Kathleen Reilly, Colorado Department of Public Health and Environment. (303) 692-3573 Written Program Information: Chatfield Watershed Authority (2000). Water Quality Trading Guidelines.
Accepted February 15, 2000 and Modified April 18, 2000. Available upon request from RNC Consulting.
Chatfield Watershed Authority (2002). Chatfield Watershed 2001-2005: sampling and quality assurance plans. Retrieved May 11, 2004 from http://www.drcog.org/reg_growth/water/regional_water_quality%20data_management/pdf_files/Chatfield_Sampling_and_Quality_Assurance_Plan.pdf
Colorado Department of Public Health and Environment (CDPHE) (1999). Chatfield Reservoir Control Regulation, Regulation No. 73. Retrieved April 10, 2004 from http://www.cdphe.state.co.us/op/regs/100272.pdf
42
Denver Regional Council of Governments (DRCOG) (2004). Chatfield Watershed Authority: long-range nonpoint source strategies and priorities 1998-2020. DRCOG, Colorado. Available upon request from RNC Consulting.
Environomics (1999). A summary of U.S. effluent trading and offset projects. A report prepared for Dr. Mahesh Podar, U.S. Environmental Protection Agency, Office of Water. Retrieved May 7, 2004 from http://www.epa.gov/owow/watershed/trading/traenvrn.pdf
Little, Keith, and Zander, Bruce (1996). Optimal trading between point and nonpoint sources of phosphorus in the Chatfield Basin, Colorado. Retrieved April 10, 2004 from http://www.epa.gov/OWOW/watershed/Proceed/little.html
RNC Consulting (2003). Chatfield watershed report 2002: Annual Summary and Water Quality Fact Sheets. Available from RNC Consulting upon request.
Reviewed by Kathleen Reilly, Colorado Department of Public Health and Environment.
43
Cherry Creek Basin (CO) A. Program Background
1. Program description
The U.S. Army Corps of Engineers constructed the Cherry Creek Reservoir in the1950s to control the frequent flooding of Cherry Creek. Located in southeast Denver, the 850-acre Reservoir and the 4200-acre State Park that surrounds it now provide outdoor recreational opportunities to about 1.5 million visitors each year (CCBWQA 2003a, p. 2-01). The reservoir also serves as a water source for the Denver area and is currently classified for warm water aquatic life, including fisheries, as well as agricultural uses. Cherry Creek flows through one of the nation’s fastest growing metropolitan areas. Escalating development has necessitated increasingly comprehensive management strategies, in which phosphorus has become a central target, as the principal nutrient leading to algal growth in the Reservoir. Municipal wastewater treatment facilities are the primary point sources of phosphorus in the Cherry Creek Watershed, and urban stormwater runoff is the most significant nonpoint source. In 1985, the Colorado Department of Public Health and Environment adopted the Cherry Creek Control Regulation, assigning phosphorus wasteload allocations to point source dischargers throughout the watershed, under a total maximum daily load (TMDL). Since becoming effective in 1989, the Regulation has allowed point sources to increase these allocations by removing nonpoint source phosphorus loadings in exchange. Yet several years passed before any specific guidelines for trading were in place (USEPA 1996). A framework for a watershed-based trading program began to take form in 1996 and was implemented the following year, under the direction of the Cherry Creek Basin Water Quality Authority (“Authority”). In 2001, a new Control Regulation introduced a phased total maximum annual load (TMAL) that will evolve to reflect new findings on the Reservoir’s water quality, incorporating both point and nonpoint source controls. The TMAL allocations established in this latest Control Regulation are upheld in the Cherry Creek Reservoir Watershed Plan, put forth by the Authority in 2003, along with revised guidelines for the trading program.
2. Program motivation Primarily, the trading program aims to allow wastewater treatment plants to increase their phosphorus discharges as they meet escalating demands on their facilities. The development of a framework for trading addressed the problem that local treatment plants, having achieved a high level of phosphorus abatement, would face extremely high costs for achieving additional reductions under pressure of regulations and growing populations. The
44
program makes increased wasteload allocations for point sources possible by requiring in exchange the implementation of best management practices (BMPs) that reduce phosphorus pollution from nonpoint sources. Given predictions of increasing phosphorus loading due to a rise in stormwater runoff and stream erosion, incentives for greater nonpoint source controls are particularly crucial in wider efforts to preserve the reservoir (CCBWQA 2003a, p. 2-19).
3. Pollutant being traded Phosphorus
4. Size of program The Cherry Creek Watershed covers nearly 380 square miles, within which run 600 miles of riparian vegetated stream corridors (CCBWQA 2003a). The watershed contains six principal wastewater treatment facilities that are authorized to discharge into the reservoir directly or land-apply reclaimed water within the Basin. According to the 2000 Census, these facilities serve a population of approximately 440,000 and close to 194,000 total housing units (CCBWQA 2004). Meanwhile, in about 80% of the watershed that remains rural or undeveloped, agricultural runoff, septic systems, and gravel mining make significant contributions to the phosphorus load (CCBWQA 2003a, p. 2-16). Trading parties: Municipal wastewater treatment plants and nonpoint sources (e.g., agricultural runoff, septic systems, gravel mining)
5. Stakeholders/participants Colorado Department of Public Health and Environment Within the Department, the Water Quality Control Commission (“Commission”) adopts water quality classifications and standards for surface and ground waters of the state. It develops regulations aimed at achieving compliance with those classifications and standards. The Water Quality Control Division (“Division”) enforces Colorado's discharge permit program and the regulations adopted by the Commission.
Cherry Creek Basin Water Quality Authority (“Authority”) Since 1988, the Cherry Creek Basin Water Quality Authority has managed Cherry Creek, the reservoir, its tributaries, and the surrounding land. Established by the state legislature, the Authority is comprised of elected officials and governor-appointed representatives from two counties, seven municipalities, seven special districts, and various environmental and economic interests. Its stated mission is to maintain beneficial uses of the Cherry Creek Reservoir by promoting water quality throughout the watershed. The Authority must spend at least 60% of its authorized revenues
45
constructing, operating, maintaining, and monitoring pollution reduction facilities (PRFs), which increase the level of water quality protection above baseline BMPs (CCBWQA 2003a, pp. 2-17). The initial PRFs constructed in the early and mid-1990s have become a source of credits for the trading program. The Authority administers and oversees the development of credits, authorizing their exchange.
Point Source Dischargers - Wastewater treatment facilities. Within the Cherry Creek Watershed, there are six municipal water supply entities that provide centralized wastewater treatment services and "either directly discharge the treated water or land apply the reclaimed water within the basin" (CCBWQA 2003a, p. 2-13). These are: 1) Arapahoe County Wastewater Authority/Cottonwood Water and Sanitation District, 2) Denver Southeast Suburban Water and Sanitation District, 3) Inverness Water and Sanitation District, 4) Meridian Metropolitan District, 5) Parker Water and Sanitation District, and 6) Stonegate Center Metropolitan District.
6. Regulatory drivers
The following documents provide the regulatory basis for the Cherry Creek trading program: a) Regulation #72: Cherry Creek Reservoir Control Regulation Originally adopted in 1985 and last amended in 2001, this Regulation from the Water Quality Control Commission is the legal basis for the Authority's management of the Cherry Creek Reservoir. It establishes the TMAL for phosphorus and authorizes trading between nonpoint and point sources. The Regulation allocates more than 70% of the annual phosphorus load (approximately 10,300 lbs) to nonpoint sources, calling on local governments (counties, municipalities, and districts) to carry out control measures in nonpoint sources within their jurisdictions. In particular, new development is required to provide high level BMPs. The Division and the Authority oversee progress in nonpoint reductions and recommend additional controls to the Commission if best management practices are not being effectively implemented to meet the overarching goal of a 50% reduction in nonpoint source pollution. Point sources receive an aggregate annual load allocation of approximately 2,300 lbs, which is predicated upon nonpoint source controls. Each wastewater treatment facility’s share of this total is based on the Commission’s analysis of its service area and needs given the projected population for 2007-2010 (CDPHE 2001, p. 46). Point source allocations must be updated periodically to reflect changes in the service areas, and all point sources must achieve a discharge concentration of 0.05 mg/l total phosphorus or less (CDPHE 2001, p. 7). b) Watershed Plan 2003 & Trading Program GuidelinesThe Watershed Plan 2003 outlines the Cherry Creek Basin Water Quality Authority’s strategy for protecting the uses of the Reservoir and sets the
46
objective of meeting the 40 µg/L total phosphorus standard. The revised Trading Program Guidelines that the Authority put forth in 2003 comply with 2001 modifications to the Cherry Creek Control Regulation and provide a more detailed framework for trades. According to the guidelines, point sources can “receive, in allocated form, or purchase/lease, a total of 432 lbs of phosphorus for new or increased phosphorus wasteload allocations” (CCBWQA 2003a, p. 2-19). These credits are split evenly in two categories. The Reserve Pool contains 216 lbs of credits awarded in “new trade projects,” which represent phosphorus reductions from nonpoint source control projects constructed by point sources, governmental entities, or private landowners. The Phosphorus Bank contains 216 lbs of credits awarded in “historic trade projects,” which represent phosphorus reductions from four pollution reduction facilities that the Authority began constructing between 1991 and 1997. Point sources may purchase credits from the Phosphorus Bank at a price established by the Authority. c) Colorado Discharge Permit System for Municipal Separate Storm Sewers The EPA’s Pollutant Discharge Elimination System (NPDES) requires that many of the municipalities represented by the Authority implement certain water quality controls in their storm sewer system. The Division supports this mandate in its stormwater regulations, which require that storm sewer systems in the Cherry Creek Reservoir drainage basin obtain permits to discharge through the Colorado Discharge Permit System (CDPS). CDPS calls for the use of BMPs that optimize pollution reduction on a location-by-location basis. The Division evaluates proposed stormwater BMPs to determine whether they are appropriate and sufficient to comply with state and federal water quality controls and discharge regulations. The permit contains requirements additional to those in the Control Regulation specifically for stormwater BMPs that impact the amount of phosphorus entering state waters.
B. Trade Structure 7. Determination of credit
The trading program gives credits for phosphorus reductions for nonpoint source projects involving existing developed areas that originally lacked BMPs, retrofits to required BMPs that achieve a higher level of phosphorus removal, or BMPs in new development that reduce more phosphorus than the BMPs required to comply with the TMAL (CDPHE 2001, p. 11). Credits for these projects are determined using “site-specific monitoring data or best available scientific evidence of similar types of projects” (CCBWQA 2003d, p. 6). For a pollution reduction facility, the calculation of credits involves three steps. First, the average annual phosphorus load into the PRF from the watershed is calculated. Second, the average annual phosphorus load reduction by the PRF is calculated. In some cases, expected performance range values can be applied to determine a PRF’s potential to immobilize
47
phosphorus by sedimentation, infiltration, and adsorption and filtration in wetlands. When considering less standard PRFs, the Authority must evaluate potential reductions on a case-by-case basis. Third, adjustment factors and a trade ratio are applied to the PRFs’ average annual phosphorus load reduction to account for fate and transport and dissolved versus particulate phosphorus (CCBWQA 2003b).
8. Trading ratios and other mechanisms to deal with uncertainty
Trade ratio-- The minimum trade ratio used in calculating credits exchanged in new trade projects is 2:1, i.e. 2 lbs of dissolved phosphorus removed in a nonpoint source project can be traded for a maximum of 1 lb of credit toward point source discharges (CDPHE 2001, p. 11). The trade ratio can be adjusted up to a value of 3 on a project-specific basis. A 3:1 ratio is appropriate “when the point source discharge is further away from the reservoir than the nonpoint source project location” (CDPHE 2001, p. 12). The ratio ensures that trading provides a net water quality benefit greater than that provided by the 1.3:1 trading ratio, which was in effect prior to the 1997 revisions to the Control Regulation.
Additionality-- When BMP projects are expanded or retrofitted in land development activities undertaken prior to 2000, only the increase in phosphorus removal beyond that resulting from existing BMP projects is available for trading. When new BMP projects are implemented in land development activities undertaken in 2000 or subsequently, only the phosphorus reduction greater than that resulting from required BMP projects is available for trading (CCBWQA 2003d, p. 5).
9. Liability/penalties for noncompliance
The Control Regulation for Cherry Creek states that “local governments, individuals, corporations, partnerships, associations, agencies, or other entities with responsibility for activities or facilities that cause … nonpoint source pollution of waters in the Cherry Creek Watershed shall adopt and implement best management practices to the maximum extent practicable to reduce nutrient loading from such sources” (CDPHE 2001, p. 14). While nonpoint sources face a total load allocation, no individual nonpoint source faces specific regulations. Counties and cities bear the burden of implementing BMPs to try to reduce nonpoint pollution, but unlike point sources that are bound to wasteload allocations through NPDES permits, nonpoint sources are not regulated or punished for pollution (Dick Parachini, Colorado Department of Public Health and Environment, personal communication, 2002). Penalties can be imposed, however, on municipal storm sewage systems regulated under the Colorado Discharger Permit System that lack permits or fail to comply with permits. Fines for violations range from up to $10,000 per day to $25,000 per day (CDPHE 2002, p. 3). Point sources are fully accountable for the legitimacy of the trades they propose. If a point source exceeds its
48
allocated phosphorus load because a nonpoint project it has funded as a trade falters, it faces the same legal consequences as it would by simply exceeding its allocation through excess production of phosphorus from its facility (Dick Parachini, Colorado Department of Public Health and Environment, personal communication, 2002).
10. Approval process The owners of nonpoint source projects can earn Reserve Pool credits. Point source dischargers can implement nonpoint source projects to generate credits and increase their wasteload allocations. Before submitting an application for a trade, the owner must present a project proposal to the Authority’s Technical Advisory Committee and modify it according to the Committee’s recommendations. The application must justify the need to trade, describe the project’s design, and provide a schedule for its construction, as well as a plan for operation, maintenance, monitoring, and reporting. Also, the project owner must pay an application fee to the Authority and provide evidence of sufficient financial resources to construct and operate the project. After a comprehensive review of the application, the Technical Advisory Committee recommends an approval, conditional approval, or denial to the Authority Board. The Board then considers comments from the project owner, the Division, and other interested parties, holds a public hearing on the potential project, and prepares a written decision. Any awarded credits are then incorporated into the Reserve Pool under the title of the project owner. Credits earned by point sources can be used to increase their own allocation or transferred to another discharger (CCBWQA 2003d, pp. 8-12).
Before selling credits from the Phosphorus Bank, the Authority must determine that the potential point source recipient qualifies as a permit-holding discharger that has complied with its past effluent limitations and has adequate operations to meet future effluent limitations. Taking into account treatment capacity, population estimates, and facility expansion plans, the Authority compares the need of the potential credit buyer with that of other dischargers in the watershed. The discharger must submit an application that justifies the trade and describes its plans for new or modified facilities. The Technical Advisory Committee reviews the applications for consistency with the Trading Guidelines and recommends to the Authority Board that the sale be approved, conditionally approved, or denied. As in the process for granting Reserve Pool credits, the Authority considers comments from interested parties and holds a hearing before finalizing its decision over a proposed sale of credits from the Phosphorus Bank (CCBWQA 2003d, pp. 15-18).
11. Ex post verification/auditing. Working in conjunction with local governments, the Authority carries out a routine annual monitoring program of the Cherry Creek watershed and reservoir to assess water quality and inflow volumes (CDPHE 2001, p. 27).
49
As required by the trading program, the monitoring of nonpoint sources determines the total annual transport of nutrients to the reservoir and provides data on the removal efficiencies of BMPs. The retention of credits in the phosphorus bank and the reserve pool depends on the continued demonstration of the performance of the nonpoint source project. Meanwhile, point source permits require monthly reports of 7-day average and 30-day average measurements of phosphorus concentrations and loadings. The Authority retains the right to modify or revoke a trade if it either the point source of nonpoint source party fails to comply with the Control Regulation (CDPHE 2001, p. 13).
12. Mechanisms for trade identification and communication (education and outreach, third party facilitation, embedded ties)
In September 2001, the Authority submitted to the Division a prioritized list of capital improvement projects to control nonpoint source pollution, as required by the Control Regulation. The list identifies the watershed’s most effective and/or cost efficient projects in terms of phosphorus removal. The list is updated each year as new information becomes available (CDPHE 2001, p.14). The Control Regulation also directs the Authority to develop and implement a public education program focused on the abatement of nutrient pollution from agricultural practices, individual sewage disposal systems, lot development, and other nonpoint sources, especially those associated with rapidly urbanizing areas (CDPHE 2001, p.51). In 2003, the Authority developed an educational fact sheet program, The BMP Series, which addresses “the role that BMPs and PRFs serve as potential remedial actions to improve water quality” (CCBWQA 2004, p. 39). Also, the Authority has seen a positive early response to its new ‘phosphorus facilitator” program, which promotes BMPs going well beyond minimum requirements among local developers (CCBWQA 2004, p. ES-6).
13. Market structure (bilateral, clearinghouse, third party brokers) The phosphorus trading program at Cherry Creek functions as a clearinghouse. The Reserve Pool and the Phosphorus Bank convert nonpoint source reductions from diverse BMPs and PRFs into uniform credits. The Authority reserves the right to purchase phosphorus reductions from nonpoint source project owners and sell them to dischargers seeking larger allocations.
14. Types of trades allowed Two types of point-nonpoint trades are possible in the trading program. The Authority can grant credits from the Reserve Pool to point sources that have completed a new trade project or have extended wastewater service to semi-urban areas (CDPHE 2001, p.10). It can also sell or lease credits from the Phosphorus Bank to point sources that can demonstrate compliance with past effluent limitations and the adequate designs/operations to meet future
50
effluent limitations. The program also allows for one kind of point-point trade. The Authority may transfer phosphorus allocations from one wastewater facility to another for a single year or for multiple years, as long as the receiving discharger is committed to “take all reasonable interim steps to decrease, to the extent practicable, the total phosphorus loading” (CDPHE 2001, p.9).
C. Outcomes
15. Types and volume of trades that have occurred
Since the early 1990s, the Authority has been constructing, maintaining, and monitoring pollution reduction facilities in the vicinity of the Cherry Creek Reservoir. There are now four projects in operation: (1) Shop Creek detention pond and wetlands, (2) Quincy Drainage detention pond, (3) East Shade Shelter streambank improvements, and (4) Cottonwood Perimeter Road Pond (CCBWQA 2003a: 2-17). The reductions in phosphorus loadings derived from these PRFs comprise the 216 pounds of credits in the Phosphorus Bank, which can be used in “historic trade projects.” Thus far there have been no credits drawn from the Phosphorus Bank (Dan Beley, CDPHE, personal communication, 2004). A summary of effluent trading efforts prepared for the EPA in 1999 indicates that three trades had occurred since the Cherry Creek trading program was launched in 1997 (Environomics 1999). The summary mentions a point-point trade and the point source purchase of credits from the Reserve Pool. Dischargers seeking trades were located in districts with initially low allocations that experienced explosive growth, since regulation required offsets for increased wastewater treatment capacity. Demand for credits has been minimal since these early trades because point source wasteload allocations based on project populations for 2007-2010 proved more than sufficient. Trading will likely increase when populations have grown enough to require plants to expand operations and load allocations (Dick Parachini, Colorado Department of Public Health and Environment, personal communication, 2002). According to an Annual Report of Activities by the Authority, “there were no temporary transfers or Reserve Pool actions in 2002” (CCBWQA 2003e, p. 25). In 2003, however, the Authority received and reviewed three trade project applications in 2003, two from the Parker Water Sanitation District (PWSD) and one from the Arapahoe County Water and Wastewater Authority (CCBWQA 2004, p. 35). PWSD requested credits for two nonpoint source projects involving wetlands, one that it had constructed the previous year and another that it proposed to construct. It withdrew both applications after the Authority found them problematic in the initial review.
51
The Arapahoe County Water and Wastewater Authority (ACWWA) had reserved the right to modify two detention ponds in 2002 (CCBWQA 2003e, p. 24). In January 2004, the Authority granted ACWWA a conditional allocation of 57 lbs of phosphorus for the planned retrofit of one of these ponds, a stormwater detention pond two miles upstream from the Cherry Creek Reservoir, which is scheduled to begin in June 2004 (Will Koger, ACWWA, personal communication, May 28, 2004). The allocation represents the program’s first phosphorus trade between a point and nonpoint source (CCBWQA 2004, p. 37). Although the credits level in this groundbreaking point-nonpoint trade is lower than ACWWA originally anticipated, it was determined through a comprehensive review of the proposed project during 2003 by the Authority’s Technical Advisory Committee. Estimating phosphorus reduction potential involved an EPA-approved method for assessing the settling of suspended solids, dissolved-to-total-phosphorus ratios from a comparable facility, and a fate and transport adjustment. Trade ratios of 2.9:1 for total phosphorus and 2.2:1 for dissolved phosphorus were applied (CCBWQA 2004, p. 36). If the extensive monitoring required in this project reveals that a greater level of phosphorus is removed at the pond than expected, Arapahoe may request an increase its allocation. Conversely, if monitoring demonstrates that the upgrade does not perform as well as planned, the Authority can reduce ACWWA’s allocation. Officials at the Arapahoe County Water and Wastewater Authority pursued this trade because they expect to increase the treatment capacity of their facilities from the current 1.6 million gallons per day to over 2 million gallons per day in the next year, to 3.6 million gallons per day by 2007, and eventually, to 6 million gallons per day over 30-40 years. ACWWA has discussed the possibility of obtaining credits for the retrofit of a second detention pond with the Authority and expects to proceed with the application process. Additionally, the Inverness Water and Sanitation District, which also anticipates growth in its service needs, is preparing to apply for a phosphorus allocation for a nonpoint source project they have in place (Will Koger, ACWWA, personal communication, May 28, 2004).
16. Administrative costs Coming from a combination of property taxes and user fees, the Authority’s budget for 2003 was $1.4 million, of which at least 60% had to be spent on the construction and maintenance of PRFs. The remaining 40% is used in research, planning documents, technical reports, and administrative costs. State grants finance a smaller portion of the Authority’s work, particularly that involving educational campaigns about nonpoint source pollution and construction of PRFs (CCBWQA 2004, p. 5).
52
17. Transaction costs
Given that the Authority functions partially on user fees, the price paid by applicants to the trading program reflects the transaction costs associated with trading. The Authority charges each project owner submitting an application to create Reserve Pool credits $2,500 to cover the costs of consultants to review the application, regardless of the outcome of the review (CCBWQA 2003d, p. 10). Dischargers seeking credits from the Phosphorus Bank must deposit $500 for the consideration of their request (CCBWQA 2003d, p. 17).
18. Cost savings For a sanitation district serving a rapidly expanding population, an increase in its phosphorus discharge allocation through nonpoint source credits represents a cost effective response to demographic pressure. Although ACWWA was using only 90% of its phosphorus wasteload allocation when it applied to trade, it anticipates a future need for the credits. Moreover, because it had already achieved the .05 mg/L phosphorus discharge concentration using advanced technology, it recognizes that the cost of upgrading its treatment facilities would far exceed that of implementing nonpoint source projects (CCBWQA 2004, p. 35). Given the $8,000/lb value of phosphorus credits, a project that costs $400,000 and yields 57 lbs of credit (worth $456,000), as does ACWWA’s planned pond retrofit, appears financially favorable (Will Koger, ACWWA, personal communication, May 2004).
19. Program goals achieved
Although the Cherry Creek Reservoir has not achieved the phosphorus concentration goal of 40 µg/L, the loads of this crucial nutrient have been lower than the TMAL of 14,270 pounds in all but one of the past 10 years (CCBWQA 2004, p. ES-1). Watershed management strategies implemented thus far at Cherry Creek should prove beneficial over the long term, even though they have not resulted in immediate measurable improvements to the Reservoir’s quality. When demand for credits rises among point sources under pressure from growing populations and continued regulation, pollution reduction facilities will advance as an integral element of the trading program. In a September 2003 statement before the Senate, an EPA representative referred to the Cherry Creek trading program as a success case that has “reduced phosphorus loads to the Cherry Creek watershed by approximately 450 pounds per year” (USEPA 2003). She noted that nonpoint source projects carried out in an effort to create the phosphorus credits “have provided ancillary environmental benefits such as flood control and wildlife habitat” (USEPA 2003). Trading is expected to favor watershed health by encouraging management practices that exceed minimum requirements during new development.
53
20. Program obstacles
Recent studies on nutrient enrichment at Cherry Creek illustrate the importance of gearing additional management strategies toward “more short-term improvements to reservoir water quality” (CCBWQA 2004, p. ES-8). Because of the lack of pressure currently imposed by point source wasteload allocations, trading has yet seem like a short-term strategy. Still, the Authority is considering ways to bolster trading and thereby strengthen water quality controls. For instance, after much deliberation, the Authority has determined that it will remove the 216 lb cap from the Reserve Pool to increase incentives for both publilc and private entities to implement BMPs or PRFs (Dan Beley, CDPHE, personal communication, 2004).
21. NPS involvement and incentives to engage in trading.
22. Other
Program information/References
Websites: Cherry Creek Basin Water Quality Authority
www.cherrycreekbasin.org Colorado Department of Public Health and Environment
Water Quality Control Commission: http://www.cdphe.state.co.us/op/wqcc/wqcchom.asp
Water Quality Control Division: http://www.cdphe.state.co.us/wq/wqhom.asp
Cherry Creek Stewardship Partners http://www.cherry-creek.org/ Colorado State Parks http://parks.state.co.us/ Contacts: Dan Beley, Colorado Dept of Public Health and Environment
4300 Cherry Creek Dr. South, Denver, CO 80222-1530 (303) 692-3606 [email protected]
Dick Parachini, Colorado Department of Public Health and Environment, (303) 692-3500, [email protected]
Will Koger, Authority Engineer, Arapahoe County Water and Wastewater Authority, 1301 East Caley Avenue, Centennial, CO 80111, (303) 790-4830 ext. 17 [email protected] Written Program Information:
54
Cherry Creek Basin Water Quality Authority (CCBWQA) (2004). 2003 Annual Report of Activities by the Cherry Creek Basin Water Quality Authority. March 2004. Retrieved May 25, 2004 from http://www.cherrycreekbasin.org/%20pdf/2003%20Annual%20Report_final.pdf
------(2003a). Cherry Creek Reservoir Watershed Plan 2003. Retrieved June 2, 2004 from http://www.cherrycreekbasin.org/cc_plan2003.asp
------(2003b). Illustrated Example: Trading Credits Associated with Pollutant Reduction Facilities. Retrieved June 2, 2004 from http://www.cherrycreekbasin.org/cc_trading.asp
------(2003c). PRF Lone Tree Creek: Arapahoe County Water and Wastewater Authority Pre-Application for Phosphorus Credit. Retrieved June 2, 2004 from http://www.cherrycreekbasin.org/cc_trading.asp
------(2003d). Trading Program Guidelines. Retrieved June 2, 2004 from http://www.cherrycreekbasin.org/cc_trading.asp
Colorado Department of Public Health and Environment (CDPHE) (2002). Stormwater Discharges Associated with Cherry Creek Reservoir Drainage Basin Municipal Separate Storm Sewer Systems. Colorado Discharge Permit Number COR-080000. Retrieved May 25, 2004 from http://www.cdphe.state.co.us/wq/PermitsUnit/MS4-CC-rat.PDF
------(2001). Creek Reservoir Control Regulation. Regulation NO. 72. 5 CCR 1002-72. Retrieved May 25, 2004 from http://www.cdphe.state.co.us/op/wqcc/GeneralInfo/StatutesRegsPolicies/Superceded%20Regs/superceded/1002720598.pdf
Environomics (1999). A summary of U.S. effluent trading and offset projects. A report prepared for Dr. Mahesh Podar, U.S. Environmental Protection Agency, Office of Water. Retrieved May 7, 2004 from http://www.epa.gov/owow/watershed/trading/traenvrn.pdf
United States Environmental Protection Agency (USEPA) (2003). Statement of G. Tracy Mehan, III, Assistant Administrator for Water. US EPA, September 16, 2003. Retrieved May 25, 2004 from http://www.epa.gov/water/speeches/091603tm.html
------(1996). Draft Trading Update -- December 96 Cherry Creek Basin, Colorado. Retrieved June 2, 2004 from http://www.epa.gov/owow/watershed/trading/cherry.htm
55
Clear Creek (CO) A. Program Background
1. Program description. The Clear Creek Trading program began as a case study to examine how a multiple pollutant trading system could be implemented, in contrast with traditional programs that focus primarily on regulated point sources and single pollutants. In the case of Clear Creek, the concept of “allowing any interested party to implement trades involving the clean up of unregulated “orphan” sources, often involving multiple pollutants, in exchange for “credits” that could be used for immediate purposes or that could be banked, and may or may not be water quality related” was explored (Hydrosphere 1998). Since only one trade occurred during the Clear Creek experimental program, this case summary will focus on this one trade and the information about orphan trading necessary to understand the trade. The concept of orphan trading and its potential beyond Clear Creek is currently being explored by Colorado, as the state is in the process of developing a state-wide water quality trading program (Carl Norbeck, personal communication, May 2, 2004). The only trade that occurred was initiated by a mining company, ASARCO (Carl Norbeck, personal communication, May 2, 2004). In exchange for better relations with the EPA and public recognition of its environmental effort, ASARCO agreed to clean up a mine tailings pile known as “Little Six #1” located in Virginia Canyon of the Clear Creek Basin (Hydrosphere 2001; Carl Norbeck, personal communication, May 2, 2004).
2. Program motivation This specific trade was motivated by efforts to demonstrate the success of potential orphan site trading programs. Because of Colorado’s mining history, numerous abandoned mine sites throughout the state are releasing toxic chemicals and metals into the state’s waterways. In the early 1990’s the Coors Brewing Company first proposed the possibility of cleaning up orphan mine sites located near the mouth of Clear Creek, in exchange for avoiding additional copper removal from its wastewater effluent (Hydrosphere 2001). Although this particular trade never occurred, it set forth the idea of orphan site cleanup. Orphan site trading would allow orphan sites, defined as “an identifiable source of water-quality impairment that cannot be regulated under current laws or is unlikely to be corrected due to funding realities even though the owners can be identified” (Hydrosphere 2001), to be cleaned up by companies or organizations interested in exchanging the orphan site cleanup for discharge
56
or non-discharge credits. The expectation is that such a trading system would provide a cost-effective approach to achieving improvements in water quality. The abandoned mine site Little Six #1 was chosen by ASARCO and the Steering Committee because portions of waste rock found at the site were eroding into the stream, reducing water quality downstream, during storms, snow melts and periods of higher stream flow (Hydrosphere 2001). This waste rock is comprised of metals like arsenic and sulfuric materials (Hydrosphere 2001). These metals, when released into the water supply, lead to problems with surface and groundwater quality and negatively impact aquatic organisms. The oxidation of metallic sulfide minerals generates acids, which lower the pH value of the water, and increases dissolution, mobility, and bioavailability of metals and the concentrations of sulfates (Hydrosphere 2001).
3. Pollutant being traded
No particular pollutant was traded. Instead ASARCO agreed to clean up an orphan mining site in exchange for better relations with the EPA and public recognition of its efforts. This cleanup involved the removal and transportation of waste rock from the site to an approved landfill, and recontouring and reseeding of the site (Hydrosphere 2001). Public recognition took the form of several newspaper articles, television news coverage, a public recognition and dedication ceremony, and a display sign near the clean-up site (Hydrosphere 2001).
4. Size of program
The Clear Creek watershed is located west of Denver, Colorado and was used as an example in an orphan site feasibility study completed in 1998 (Hydrosphere 1998). Because of past mining activities, the water quality in this basin is considered impaired (Hydrosphere 2001). The actual trade involved ASARCO cleaning up a mine waste site called “Little Six #1” (Hydrosphere 2001). Little Six #1 consists of a 750 cubic yard pile of waste rock located next to a stream bed (Hydrosphere 2001). This site consisted of two separate mining claims, one owned by an individual (Tom Boy Claim, Mineral Survey #20148) and the other owned by Clear Creek County (Queen Elizabeth Claim, Mineral Survey #20148) (Hydrosphere 2001). Both are located on Virginia Creek, a minor, yet one of the most toxic, tributaries of Clear Creek (Hydrosphere 2001). The waste material was transferred to a disposal site outside the Clear Creek Basin at the Keenesburg Coal Mine owned by Coors Brewing Company. The advantage of this site was that disposal was free, courtesy of the Coors Brewing Company, and thus the cost of transportation and the proximity to
57
the clean-up site of the dumpsite were outweighed by the cheap disposal cost (Hydrosphere 2001). Potential trading parties: Under a potential Orphan Trading Program any organization that wanted some sort of credit and was willing to clean up a polluted site to get it, would be eligible to trade. Any site that polluted the waterways and could cost-effectively be cleaned up, would be eligible to be used in trade for credits.
5. Stakeholders/participants • ASARCO: a mining company that cleaned up Little Six #1 in exchange
for credit. • The Conservation Fund and the National Geographic Society: These
two agencies convened the National Forum on Non-point Source pollution which sought innovative non-regulatory approaches to non-point source pollution (Hydrosphere 2001). One of the initiatives was the Orphan Sites Feasibility Study to take place in the Clear Creek Basin.
• Steering Committee: A steering committee was created to provide direction on the Orphan Sites Feasibility Study. This Committee consisted of representatives from The Conservation Fund, the United States Environmental Protection Agency, the Colorado Department of Public Health and Environment, the Clear Creek Watershed Forum, Environmental Defense, Colorado School of Mines, City of Westminster, ASARCO, Frick & Gilman Inc, Coor Brewing Company, Duprey Environmental, Cyprus Climax, Hydrosphere Resource Consultants (Hydrosphere 2001).
• Water Quality Control Commission (WQCC): This agency is responsible for implementing the Colorado Water Quality Control Act and thus is responsible for water-quality classifications and water quality standards (Hydrosphere 2001). Their role in future Orphan Site trading would be important because of their role in specifying waterway impairment.
• Coors Brewing Company: Although the company refused to accept credit for the trade because they considered their contribution to be small, the company did allow the waste to be disposed without charge in an abandoned mine that was in the process of reclamation.
6. Regulatory drivers
The Clean Water Act requires that all point source polluters, both owners and operators, obtain a permit under the National Pollutant Discharge Elimination System. Problems regarding liability for cleanup arise because a sponsor or volunteer who works to clean up a polluted site could become an “operator” and thus is liable for a complete clean up that meets the applicable water quality standards (Hydrosphere 2001). Third party “good samaritans” are not
58
protected under the Clean Air Act and thus corporations and organizations are often hesitant to share any role in the clean up of pollutants for fear of imposed liability. Amendments have been proposed recently to try to remedy this problem. Under the Comprehensive Environmental Response, Compensation, and Liability Act (CERCLA), “the EPA has authority to respond directly or compel potentially responsible parties to respond to releases or threatened releases of hazardous substances, pollutants, or contaminants (Hydrosphere 2001).” However, CERCLA does have a “Good Samaritan” clause that protects volunteers from liability as long as their work is in accordance with the National Contingency Plan, or if the work is supervised by the appropriate government official (Hydrosphere 2001). This has allowed the State of Colorado and the EPA to protect the liability of “good samaritans” attempting to clean up orphan mining sites. It is also possible that in some instances CERCLA’s Good Samaritan clause can also protect an organization under the EPA’s Clean Water Act (Hydrosphere 2001). In order to obtain a Good Samaritan exemption the EPA must approve the project and grant an Administrative Order on Consent (Hydrosphere 2001). This approach would be limited when actually applied to the hundreds of orphan mine sites in Colorado because of the sheer bulk of paper work required. There are also remaining concerns by organizations that liability under the Clean Water Act could still be invoked in the future (Hydrosphere 2001). The Voluntary Clean-up Act of Colorado applies to abandoned sites, and sites without an owner held liable for clean up (Hydrosphere 2001). This act could also be used to get around the fears of liability claims of potential participants in orphan site trading.
B. Trade Structure
Note: Orphan Site Trading is still in the developmental stages. Therefore, trade structure is not well defined.
7. Determination of credit
As proposed as part of a general Orphan Site trading program a Target Zone approach could be used to measure pollution and quantify water-quality goals to be met in specific waterways. This approach assigns numerical targets to various indicators. This could be used as a tool to decide how important proposed cleanups are, and to what extent one proposed cleanup would be more beneficial and more creditworthy than another.
59
8. Trading ratios and other mechanisms to deal with uncertainty
N/A
9. Liability/penalties for noncompliance
N/A
10. Approval process.
N/A
11. Ex post verification/auditing.
N/A
12. Mechanisms for trade identification and communication (education and outreach, third party facilitation, embedded ties)
N/A
13. Market structure (bilateral, clearinghouse, third party brokers) In the pilot study, a third party broker was used to identify parties interested in cleaning up one of the orphan mines in exchange for some amount of pollution credits.
14. Types of trades allowed
The orphan sites are all nonpoint pollution sources. However, their cleanup could be exchanged for pollution currently discharged by either a point or a nonpoint source, or even for credits unrelated to pollution. There are two types of credits that can be awarded: Type 1: “credit use results in a direct impact on water quality in the basin” Type 2: “credit use does not result in a direct impact on water quality use in the basin” (Hydrosphere 2001). Three types of trades as defined in 2001 Hydrosphere Final Report: Type 1: Out-of-kind trade – Where the pollutants, or other nonpollutant tradable items to be traded differ. Type 2: Out-of–time trade - “Where from the perspective of the receiving water body, there is a significant temporal mismatch between the water quality benefits resulting from the clean up and the water-quality impacts of the credit use, after each is implemented.” Type 3: Out-of-place trade - A “trade in which, from the perspective of the receiving water body, the water-quality benefits from a clean up and the
60
water-quality impact of the credit use occur at significantly different locations.”
C. Outcomes
15. Types and volume of trades that have occurred As discussed, only one trade occurred. The trade between ASARCO and the EPA involved ASARCO cleaning up the Little Six #1 mine tailings pile in exchange for better relations with the public and the EPA.
16. Administrative costs Not determined.
17. Transaction costs Not determined.
18. Cost savings The clean-up cost to ASARCO was estimated to be approximately $50,000 (Hydrosphere 2001).
19. Program goals achieved The objective of the Orphan Sites Feasibility Study was “to investigate market-based incentives and mechanisms to achieve net water-quality benefits to the watersheds not otherwise attainable under existing regulatory programs” (Hydrosphere 2001). The concept of orphan trading is now being explored at the state level, so it appears this goal has been met. Water-quality improvements that resulted from this trade include:
• The total loading of heavy metals to the surface and groundwater supplies within the basin was reduced;
• Metal sulfides were reduced which will reduce acid drainage; and • In-water sediment concentrations were reduced (Hydropshere 2001).
Other benefits include: • Improved aesthetic appearance • Positive effects of revegetation • Habitat improvement • Improved health of the area • Downstream fish populations benefited from less water pollution and
61
• Removing the metals will reduce the costs of water treatment for both municipal and industrial purposes (Hydrosphere 2001).
20. Program obstacles
There are obstacles that both impede the process of orphan site trading in general, and that applied in this specific case. For more information about general orphan trading obstacles please see the 2001 Hydrosphere Final Report. Unlike trading, orphan trading is a relatively new idea not addressed by the EPA or in the current literature (Hydrosphere 2001). In particular, the EPA has not yet offered any advice regarding trades involving credits that have no direct water-quality implications, like tax credits (Hydrosphere 2001). However, the EPA does not envision, but does not expressly forbid, cross-parameter trading, or trading involving clean up and credit for different pollutants (Hydrosphere 2001). Cross parameter trades have occurred, as evidenced by the Rahr Plant in Minnesota. The lack of a Good Samaritan clause addressing liability issues in the Clean Water Act poses problems for those volunteering to clean-up orphan pollution sites (Hydrosphere 2001). In the specific case of the ASARCO trade an “Administrative Order on Consent” was granted (Hydrosphere 2001). Tools and technical assessment approaches with which to evaluate trades involving unlike water quality parameters are needed (Hydrosphere 2001). The Target Zone Approach is one approach that has been outlined, but because ASARCO wanted only the Type 2 trade incentive of positive image, this was never employed (Hydrosphere 2001). Substantial financial resources are needed to establish multiple pollutant trading programs and their necessary educational components (Hydrosphere 2001). ASARCO would have liked to have pursued Type 1 or Type 2 credit other than just recognition, but it did not have any operations specifically located within the Clear Creek Basin, and so trades of metal loading, or reduced monitoring requirements were beyond the scope of the program (Hydrosphere 2001).
21. NPS involvement and incentives to engage in trading.
Credits are the main incentive to engage in trading. As discussed above, proposed orphan site trading programs would involve a variety of credit types that would appeal to a variety of organizations. Flexible use banking, where credits could be stored without a pre-defined future use restriction, has also been suggested as an additional incentive for clean up (Hydrosphere 2001).
62
22. Other Program information/References
Websites: None Contacts: Carl Norbeck. Clear Creek Forum/ Clear Creek Watershed Foundation. Phone: (303) 692-3513 Written program information: Colorado Division of Wildlife and the Colorado Hazardous Material and
Waste Management Division (1998). Clear Creek Monitoring Program. Accessed April 30, 2004 from the World Wide Web: http://ndis1.nrel.colostate.edu/waterquality/ftp/clcrweb.pdf
Hydrosphere Resource Consultants (1998). Orphan Sites Feasibility Study: Phase III, Task 3. Colorado: Boulder. Available upon request from Hydrosphere Resource Consultants.
Hydrosphere Resource Consultants (2001). Adapting Orphan Sites for Credit: Expanding Watershed-Based Trades Through Unlike Trades. Available for a fee by contacting Hydrosphere Resource Consultants. This report is a summary of all previous reports and summarizes legislation and other key issues central to the project. The appendix provides a lengthy discussion of the case study and includes access agreements between ASARCO and property owners, the Agreement on Consent between ASARCO and the EPA, the pertinent Colorado Water Quality Control Commission stream classifications, and soil analysis results.
Woodling, John. 1998. Clear Creek Monitoring Program Report, July 1998, Colorado Division of Wildlife. This report details fish and macroinvertebrate monitoring procedures conducted in the Clear Creek Watershed with the expressed goal of determining whether superfund mine cleanup efforts are working effectively. Copper, in particular, is discussed on page 16. Available at http://ndis1.nrel.colostate.edu/waterquality/ftp/clcrweb.pdf
63
Lake Dillon (CO) A. Program Background
1. Program description In the early 1960s, the Denver Water Board built a dam on the Blue River fifty-five miles west of the city to create a staging reservoir for the municipal water system. The resulting Dillon Reservoir—often called Lake Dillon today—is a prominent recreational area in the Arapaho National Forest and the source of more than one-half of Denver’s water (Anderson 2001, p. 102). In response to growing concerns over the reservoir’s water quality and predicted acceleration in local development, the EPA launched a study of Lake Dillon in1982 under its Clean Lakes Program. The study identified phosphorus loading as the most significant factor behind algae growth in the reservoir and determined a phosphorus concentration standard that the State of Colorado subsequently put forth. The study also set the stage for the Dillon Reservoir Control Regulation, which went into effect in1984 to maintain water quality at the current levels at that time. The Control Regulation established a total phosphorus wasteload cap and distributing discharge allocations among the watershed’s point sources, primarily municipal wastewater treatment plants. It also requires local governments to develop ordinances controlling nonpoint sources of phosphorus, predominantly septic tanks and commercial/residential runoff. Since its origin, the Regulation has allowed for increased point source allocations in exchange for reductions from nonpoint sources, setting the framework for the nation’s second oldest effluent trading program and the first to promote point-nonpoint trades (Woodward 2003, p. 3). Continual monitoring of Lake Dillon since the early 1980s has documented increasing phosphorus loading from nonpoint sources, heightening the effort for better incentives to control this crucial nutrient’s nonpoint sources.
2. Program motivation
The basic structure of the trading program reflects the findings of economic analyses that suggest that wastewater treatment plants around Lake Dillon could cut their average annual cost of reducing phosphorus by about 50% if, rather than investing in facility upgrades, these plants funded nonpoint source reductions to offset their increase in wasteload (Jarvie and Solomon 1998, p. 146). The program’s underlying assumption—that a demand for credits would exist among point sources—was reinforced by the finding that one of the watershed’s four municipal treatment plants was in violation of its NPDES permit for phosphorus prior to the adoption of the Control Regulation (Bruce Zander, EPA, personal communication, May 2004). By providing a framework for trades between point and nonpoint sources, the program provides a dual purpose. Trading would allow plants to increase their
64
wasteload and accommodate an expanding population, while encouraging efforts to mitigate the region’s growing nonpoint source pollution problem. In the decade following the Clean Lakes Study, the unanticipated discovery of low cost direct control methods for point sources caused their phosphorus discharges to fall sharply, below permitted levels. Point sources therefore lacked the incentive to fund nonpoint sources controls through trades. Meanwhile, the contribution to the total phosphorus load from privately owned septic systems nearly doubled, and, given projected growth expected in areas not currently served by treatment plants, their impact will escalate (NWCCOG 2002, p. B-18). Phosphorus pollution from nonpoint sources like residential runoff and construction in ski areas also increased. In 2002, the Northwest Colorado Council of Governments affirmed that “nutrient enrichment due to phosphorus loading from nonpoint sources” had become “the principle concern in the Dillon Reservoir” (NWCCOG 2002, p. B-18). Accordingly, the program has modified its emphasis on point-nonpoint trading, combining regulations and a system for nonpoint-nonpoint trading: “new nonpoint sources must offset their water quality impacts by implementing additional BMPs at older nonpoint source sites” (USEPA 1996).
3. Pollutant being traded Phosphorus
4. Size of program Three tributaries originating at the continental divide empty into Lake Dillon: the Blue River, Ten Mile Creek, and the Snake River. Together they form the Upper Blue River Watershed, each contributing approximately one-third of the flow to the reservoir, which covers 3,220 acres (NWCCOG 2002, p. B-5). The 840 square kilometers (325 mi 2) watershed includes all of Summit County, home to a permanent resident population of approximately 25,000 and an additional ski season population of approximately 100,000 at its peak (Chen 2002; Fedstats 2004). Four municipal wastewater treatment plants discharge into Lake Dillon, and these are the primary point sources of phosphorus. Approximately 1,000 individual septic systems of vacation and primary residences, mostly along the Blue River, are the primary nonpoint sources of phosphorus, followed by urban runoff (Chen 2002).
5. Stakeholders/participants • Colorado Department of Public Health and Environment: Within the
Department, the Water Quality Control Commission (“Commission”) adopts state-wide water quality classifications and standards for surface and ground waters. It develops regulations aimed at achieving compliance
65

with these classifications and standards. The Water Quality Control Division (“Division”) enforces Colorado's discharge permit program and regulations adopted by the Commission. In the Lake Dillon watershed, the Division issues point source discharge permits that incorporate nonpoint sources offsets. It also reports periodically to the Commission and to local governments of Summit County on the results of inspections of nonpoint source controls.
• Summit Water Quality Committee: Since 1984, the Summit Water Quality Committee has overseen the monitoring of water quality standards and the proper implementation of nonpoint source controls throughout the Blue River watershed. Made up of representatives from local municipalities, Summit County, and Sanitation Districts in Summit County, and the Denver Water Board, the Committee “reviews all activities in the watershed that may potentially impact water quality” and reports to the Commission on management efforts (USEPA 1996). The members played a central role in the development of the water quality management plan for the basin and continue collaborating toward their mission of protecting and enhancing water quality in Lake Dillon, the nearby Green Mountain Reservoir, and the tributaries of both. As the coordinating body of the Lake Dillon trading program, the Committee identifies potential BMP projects.
• Local governments in Summit County: establish regulations requiring phosphorus controls of new nonpoint sources within their jurisdictions. They provide information to the Division so it can assess the effectiveness of local regulations. The Northwest Colorado Council of Governments, a voluntary association of municipal governments and five counties, provides support through its Watershed Services Program and the Blue River Water Quality Management Plan, which consolidates recent findings on the conditions of the Lake Dillon, the larger of two water storage facilities in the Blue River watershed.
• Pollution Sources: As the beneficiaries of potential trades, the four municipal treatment plants—point sources—and the owners of individual sewage systems, nonpoint sources, are key stakeholders in the program. Other representatives of nonpoint sources include supervisors of private ski areas, golf courses, and other commercial/residential development, as well as managers of the Forest Service and municipal governments (Bruce Zander, EPA, personal communication, 2004).
6. Regulatory drivers
Discharge Permit System Authorized by the Clean Water Act, the EPA’s NPDES permit program regulates point sources that discharge pollutants into U.S. waters. Point sources in the Lake Dillon watershed are subject to the Colorado Discharge Permit System (CDPS), the state program that addresses the federal regulations on water pollution. Because these point sources have been able to reduce phosphorus discharges, achieving levels below their allowances, the
66
CDPS restrictions have not produced a demand for trades. One analyst of the program suggests that without more rigid restrictions on nonpoint sources, “only substantial downward revisions in the point sources’ NPDES permits would create demand for nonpoint source abatement” (Woodward 2003, p. 12). Total Maximum Daily Load According to the federal Clean Water Act, states must identify impaired waters and establish a total maximum daily load (TMDL) for each pollutant that exceeds water quality standards, including nutrients. The TMDL represents the amount of the pollutant that a waterbody can assimilate without affecting its designated uses. Originally, efforts to enforce TMDLs targeted point sources, but since 2000, the Clean Water Act has extended the use of TMDLs to include nonpoint sources. Thus, TMDLs now incorporate the “sum of the point sources, nonpoint sources, and a margin of safety (which can include anticipated future pollutant loadings)” (NWCCOG 2002, p. B-46). The EPA approved a TMDL for phosphorus at the Dillon Reservoir in 1997. Dillon Reservoir Control Regulation Since adopting the Control Regulation in 1984, the Commission has aimed to maintain water quality at1982 levels, which it considered adequate for protecting classified uses of the reservoir––cold water aquatic life and recreation (CDPHE 2003, p. 4). The regulation established a standard total phosphorus concentration of 7.4 g/l in the top 15 m of the reservoir during the growing season and a total maximum annual phosphorus load from point sources of 1,634 lb/yr. Within this cap, it distributes allocations between four major municipal and six minor domestic wastewater treatment facilities. Limits on phosphorus concentration also take the form of a 0.5mg/l daily maximum for any point source treating more than 2,000 gallons per day (CDPHE 2003, p. 1). The regulation requires a state-local partnership to control both point and nonpoint sources of phosphorus in the Lake Dillon watershed. Since 1995, the point source allocations it puts forth have been “based on the assumption that Summit County and local governments in Summit County adopt regulations that require best management practices or other methods of phosphorus control will result in pound for pound mitigation for all new nonpoint sources of phosphorus” (CDPHE 2003, p. 3). Only nonpoint sources that were established within the watershed prior to July of 1984 can generate credits. This provision prevents entities from purposefully creating a nonpoint source pollution problem with the intention proposing a treatment for it at a later time for which they can receive phosphorus credit (Bruce Zander, EPA, personal communication, May 2004).
B. Trade Structure
67
7. Determination of credit Credits received through trades are based directly on the amount of phosphorus reduced by the particular practice installed (Stephenson and Shabman 1996). The amount of credit is “determined using site-specific data or a water quality modeling approach with review and approval by the Division” (CDPHE 2003, p. 2). This approach followed from the Clean Lakes Study and has been continually updated to reflect the findings of ongoing monitoring.
8. Trading ratios and other mechanisms to deal with uncertainty The Dillon Reservoir program sets a 2:1 trading ratio between point and nonpoint sources and a 1:1 trading ratio between nonpoint sources. The 2:1 ratio requires a 2 lb reduction of phosphorus discharges from nonpoint source for each credit used by a point source. According to some analysts of the program, “this trade ratio was established so that there would be enough P reduction in the basin to allow for growth of the [treatment plants] and new nonpoint sources” (Jarvie and Solomon 1998, p. 146). The 1:1 ratio requires that all new nonpoint sources offset their discharges pound for pound with existing nonpoint sources (Anderson and Lohof 2001). The effort to mitigate the nutrient loading from nonpoint sources is supported by the Colorado Department of Public Health and Environment, which has the authority to reconsider allowed phosphorus allocations among point sources if it determines that “nonpoint source controls are not adequate to prevent exceedance of the phosphorus standard in the Dillon Reservoir” (CDPHE 2003, p. 3).
9. Liability/penalties for noncompliance Because nonpoint sources do not typically come under the restrictions of the Clean Water Act, point sources are held responsible for the compliance of all trades. Thus, if a nonpoint source is not in compliance, the point source is held in violation of its NPDES permit, and it falls under the penalty structure of the Clean Water Act” (Sohngen 1998).
10. Approval process While the control regulation authorizes the Division to issue point source permits incorporating point sources—nonpoint sources tradeoffs, the trades themselves are approved by the Commission (CDPHE 2003, p. 2). To receive credit, a point source must submit to the Division an application describing the proposed design of the nonpoint source controls and indicating the total phosphorus load that will be reduced. The application must demonstrate that the operation and maintenance of nonpoint source controls as well as monitoring and reporting procedures in accordance with all the relevant guidelines provided by the Commission. If the Division approves the
68
application, it issues a permit specifying the construction requirements for the nonpoint source project and the amount of credit that the point source will earn. Credits are incorporated into point source permits only after local governments adopt regulations addressing the phosphorus contribution of the nonpoint source (CDPHE 2003, p. 3).
11. Ex post verification/auditing. Point source discharge permits require treatment plants to monitor and report total phosphorus concentrations and loadings in terms of a 30-day average, 7-day average, daily maximum, or another measurement determined by the Division. Permits granting credit for nonpoint source controls contain monitoring requirements that comply with the Commission’s guidelines (CDPHE 2003, p. 3).
12. Mechanisms for trade identification and communication (education and
outreach, third party facilitation, embedded ties) No standard mechanism to identify nonpoint source projects exists at Lake Dillon. Each entity seeking credits, whether a point or nonpoint source, must determine for itself the likely benefits and drawbacks of each potential project. Options that involve low capital cost and fewer monitoring requirements tend receive attention and serve as models for other interested parties (Bruce Zander, EPA, personal communication, May 2004).
13. Market structure (bilateral, clearinghouse, third party brokers)
The market structure at Lake Dillon distinctly supports bilateral negotiations, in which each transaction must be carefully negotiated between individual buyers and sellers of credits. Buyers and sellers are responsible for agreeing upon the terms of trade.
14. Types of trades allowed The Lake Dillon trading program encourages point-nonpoint and nonpoint-nonpoint trades. It does not include a mechanism for point sources to transfer surplus phosphorus allocations to other point sources. It also prohibits the banking of nonpoint source credits for future sale. In 1995, the Commission considered proposals for point-point trading and for a “reserve pool” of point source allocations, but could resolve issues regarding the ecological impacts of such trades and the appropriate standards for accumulating or distributing the stored credits (CDPHE 2003, p. 7).
C. Outcomes
15. Types and volume of trades that have occurred
69
Opportunities for point-nonpoint trades have not been nearly as numerous as was originally anticipated, since treatment plants in the watershed found affordable ways to drastically reduce phosphorus discharges. Using some of the most advanced nutrient removal capabilities in the nation, all the plants around the reservoir had reduced their share of its total phosphorus load to only 2% by 1990 (Kashmanian and Podar 1992). Having attained phosphorus discharge levels well below their allowances, the point sources lacked the incentive to seek credits through trades. Despite the absence of CDPHE regulatory pressure, point sources have collaborated with nonpoint source reductions in a few instances, supporting the greater effort to protect Lake Dillon’s water quality while accommodating growth. In1985, the Frisco Sanitation District built a system of underground pipes that removed 50-70% of the phosphorus load from the town of Frisco’s runoff. At that time, the Sanitation District was only using 50 of the 341 phosphorus lbs in its permit allocation, so it “donated its surplus credits toward a proposed town golf course” (Jarvie and Soloman 1998,p. 146). In 1995, the Breckenridge Sanitation District removed two nonpoint source septic systems—one at a residential subdivision and the other at a ski area—and incorporated their wastewater into its sewer system. Although Breckenridge received an 11.5 lb increase in its phosphorus allocation as credit for these projects, the Summit Water Quality Committee reported in 1995 that this point source had been discharging phosphorus at less than 15% of its permitted load level for two years (CDPHE 2003, p. 6; Woodward 2003). In 1997, for the first time in the trading program’s history, a point source began seeking credits from nonpoint source reductions to increase discharges beyond its wasteload allocation. The motive for the trade arose with a developer’s plans to expand the Copper Mountain Ski Resort by 1,000 residential units and 80,000 square feet of commercial space. Managers of the municipal wastewater treatment plant servicing the resort—Copper Mountain Consolidated Metro District—determined that the expansion would cause phosphorus discharges to exceed the NPDES permit by 40 lbs, even after upgrading the plant. After considering various options, including compensating Breckenridge for placing sewage lines in a proposed housing development, Copper Mountain settled a deal with the Frisco Sanitation District. Copper Mountain offered to pay an “investment fee” to homeowners with individual septic systems in Frisco’s service area, which would cover part of the cost of connecting their residences to the Frisco plant (Woodward 2003, p. 7). Because the State of Colorado considers the phosphorus load per residence serviced by a wastewater facility to be “negligible” and estimates that the load per residence with an individual septic system is one pound per year, a total of 80 homes had to connect to the municipal sewer system in order to
70
compensate for the proposed increase of 40 lbs in Copper Mountain’s phosphorus load (CDPHE 2003, pp. 8-9). The project was completed in 1999 and the changes to Copper Mountain’s permit were included in the January 2001 rulemaking of the Control Regulation (Woodward 2003, p. 8; CDPHE 2003, p. 8). In September 2003, the Commission updated the regulation to reflect a 13-lb increase in Copper Mountain’s load allocation, which the plant had earned by sewering an additional 26 homes in Frisco’s service area.
16. Administrative costs Not available
17. Transaction costs
The transaction costs vary according to the specific trade and the nature of the nonpoint source project. In the case of the Frisco-Copper Mountain trade, transaction costs were restricted by the Commission’s assessment that sewage disposal systems of individual homes generate approximately one pound of phosphorus per residence. This standard of one pound per home became “a basis on which trading could easily proceed, greatly reducing transaction costs when a trading opportunity became available" (Woodward 2003, p. 4).
18. Cost savings In the Control Regulation, the Commission reviews a series of time value and opportunity cost analyses, finding that “the social and economic costs of allowing Dillon Reservoir to become eutrophic could be over two million dollars annually” (CDPHE 2003, p. 5). At the same time, the Commission estimates a cost of “slightly over 1.5 million dollars annually” to maintain the reservoir’s water quality without employing nonpoint source tradeoffs (CDPHE 2003, p. 5). Noting that trading could reduce that figure by about a half, the Commission concludes that the costs of maintaining water quality controls are significantly less than the potential economic and social cost of allowing the Reservoir to become eutrophic. There State of Colorado thereby considers the Control Regulation, including its trading provisions, “quite defensible on economic grounds” (CDPHE 2003, p. 5).
19. Program goals achieved
Although continuous monitoring since the Clean Lake Study has shown sustained reductions in total phosphorus loading, reductions have been mostly attributable to the improved performance of wastewater treatment plants. In the interest of maintaining high property value around Lake Dillon and high drinking water standards for the Denver community, a cooperative management approach has developed around the trading program, successfully safeguarding water quality at Lake Dillon. As in the case of the
71
Frisco-Copper Mountain trade where many homes with substandard septic systems transferred to more effective wastewater treatment, trading can bring a broad range of environmental benefits.
20. Program obstacles
The program’s greatest obstacle lies in the limited demand for credits. While most point sources are not compelled by regulatory pressure on the allocation permits to participate in trades, the inability to invest in future sales of nonpoint source credits limits the motive to engage in nonpoint source projects (Woodward 2003, p. 6).
21. NPS involvement and incentives to engage in trading.
New nonpoint sources face regulatory pressure to offset their phosphorus dischargers by implementing pollution controls. Although a 1:1 trade ratio is in place to account for these offsets, mechanisms to monitor the exchanges between nonpoint sources are not as precise as in the case of point source reductions (Bruce Zander, EPA, personal communication, 2004). Still, the effort to watchdog nonpoint source reductions throughout the watershed grows and populations expand and more potential projects are identified.
22. Other
Program information/References Websites: See websites related to specific sources below. Contacts: Bruce Zander, TMDL Coordinator, EPA Region 8. (303) 312-6846 Vern Berry, TMDL Assistant, EPA Region 8. (303) 312-6234 Written Program Information:
Anderson, Robert. 2001. The United States Experience with Economic Incentives for Protecting the Environment. Environmental Protection Agency. January 2001. Reviewed May 28, 2004 from http://yosemite.epa.gov/EE/epa/eerm.nsf/vwSER/4336170C9605CAF8852569D20076110F?OpenDocument
Anderson, Robert C. and Lohof, Andrew Q. 2001. The United States experience with economic incentives for protecting the environment. Environmental Law Institute. A report prepared for the U.S. Environmental Protection Agency, Office of Economy and Environment. Retrieved May 28, 2004 from http://yosemite.epa.gov/EE/epa/eerm.nsf/0/0fd04cf84b314347852564ed006ce17d?OpenDocument
Colorado Department of Public Health and Environment, Water Quality Control Commission (CDPHE) (2003). Regulation No. 71: Dillon
72
Reservoir Control Regulation, 5 CCR 1002-71. Retrieved May 10, 2004 from http://www.cdphe.state.co.us/op/regs/waterregs/100271wqccdillonreservoir92003.pdf
Chen, Carl (2002). Development of TMDL Implementation Plan with consensus module of WARMF. Presented at the Water Environment Federation National TMDL Science and Policy Conference, Phoenix, AZ, November 13-16, 2002. Retrieved May 10, 2004 from www.systechengineering.com/downloaddocs/WEFTMDL_consensus_02.pdf
Environomics (1999). A summary of U.S. effluent trading and offset projects. A report prepared for Dr. Mahesh Podar, U.S. Environmental Protection Agency, Office of Water. Retrieved May 7, 2004 from http://www.epa.gov/owow/watershed/trading/traenvrn.pdf
Fedstats (2004). Summit County, Colorado. Retrieved May 10, 2004 from http://www.fedstats.gov/qf/states/08/08117.html
Jarvie, Michelle and Solomon, Barry (1998). Point-nonpoint effluent trading in watersheds: a review and critique. Environmental Impact Assessment Review. 18: 135-57.
Kashmanian, Richard and Podar, Mahesh (1992). Incentive analysis for Clean Water Act reauthorization: point source/nonpoint source trading for nutrient discharge reductions. Apogee Research, Inc. A report prepared for the U.S. Environmental Protection Agency, Office of Water and Office of Policy, Planning, and Evaluation.
Kraemer, Andreas, Kampa, Eleftheria, and Interwies, Eduard (2003). The role of tradable permits in water pollution control. Ecologic, Institute for International and European Environmental Policy. Retrieved May 10, 2004 from http://www.ecologic.de/download/projekte/1850-1899/1872-03/1872-03_tradable_permits.PDF
Northwest Colorado Council of Governments (NWCCOG) (2002). Blue River water quality management plan 2002. www.nwc.cog.co.us/Programs/Water/PDF/BLU02REV.final.pdf
Sohngen , Brent (1998). Incentive based conservation policy and the changing role of government. American Farmland Trust Center for Agriculture in the Environment. Working Paper CAE/WP98-6. Retrieved May 10, 2004 from http://www.aftresearch.org/researchresource/wp/wp98-6.html
Stephenson, Kurt and Shabman, Leonard (1996). Effluent allowance trading: a new approach to watershed management. Water Science Reporter. National Institutes for Water Resources. Retrieved May 10, 2004 from http://www.vwrrc.vt.edu/pdf/wsr.pdf
U.S. Environmental Protection Agency (USEPA) (1996). Draft trading update—December 96 Lake Dillon, Colorado. Retrieved May 10, 2004 from http://www.epa.gov/owow/watershed/trading/lakedil.htm
Woodward, Richard (2003). Lessons about Effluent Trading from a Single Trade. Review of Agricultural Economics. 25 (1): 235-245.
73
Lower Colorado River Selenium and Aquatic Habitat Offset Program (CO) A. Program Background
1. Program description The City of Grand Junction, CO has received grant funding from USEPA Region 8 to develop a water quality trading program for selenium in the Lower Colorado River with URS Corporation. The project is still in the conceptual stages, and no trading framework or demonstration projects have been fully developed. Phase I of the project was performed in 2002-2003. Phase I addressed stakeholder coordination, data collection on selenium loading and monitoring, and initial trading framework design. The Grand Valley Selenium Task Force formed in August 2002, when it became evident that many tributaries in Segment 13b of the Colorado River could be listed on the 303(d) list for selenium impairment (NIWQP 2003). The purpose of the task force was to evaluate strategies for bringing the tributaries into compliance with the 4.6 µg/L state selenium standard. In January, 2003, the City of Grand Junction received a grant from the USEPA Region 8– one of eleven trading pilots funded under the new Water Quality Trading Policy – and contracted with URS Corporation to design a selenium trading framework (USEPA 2003; Eileen List, personal communication, May 21, 2004). The Phase I report discusses trading concepts and provides guidance on potential projects, but no trading framework was established (Julie Vlier, personal communication, May 24, 2004). Phase II of the grant will continue with data collection and trading design and will begin looking into pilot or demonstration projects (Julie Vlier, personal communication, May 24, 2004).
2. Program motivation High concentrations of selenium are naturally found in the Colorado River Basin soil due to the presence of marine Mancos shale (Gunnison Basin Selenium Task Force n.d.). Irrigated agriculture leaches selenium from the shale, and other activities such as urban development or sand and gravel mining can also cause selenium loading to the watershed. High levels of selenium have been found to cause reproductive deformities in wildlife. The Grand Valley Selenium Task Force was assembled to evaluate measures for bringing the region’s tributaries into compliance with the 4.6 µg/L state selenium standard (NIWQP 2003). The City of Grand Junction’s primary motivation for participating in the Task Force and spearheading research into a trading framework is the specter of a TMDL that could force it to remove
74
insignificant point sources of selenium from wastewater and stormwater discharge despite the fact that selenium originates from significant nonpoint sources. See “Regulatory Drivers” for more details on the City’s motivating factors.
3. Pollutant being traded Selenium. Other pollutants, phosphorus and habitat offsets have also been discussed (Julie Vlier, personal communication, May 24, 2004).
4. Size of program Not determined. The trading arena might potentially be expanded to include the Gunnison Basin, which contributes the majority of the selenium to the Colorado River near Grand Junction. Point sources for selenium include WWTPs, stormwater discharges, and sand and gravel dewatering operations, but these sources are arguably negligible (City of Grand Junction 2004). Downstream states could theoretically be interested in reducing selenium loads in Colorado, and the U.S. Fish and Wildlife Service could be interested if remediation projects could improve the habitat of endangered fish species (Julie Vleir, personal communication, May 24, 2004). Although not related to selenium, the City of Grand Junction and Mesa County are converting individual septic systems to sewer connections, and these agencies are interested in determining what kinds of tradable credits could be generated (Eileen List, personal communication, May 21, 2004). Selenium remediation measures being explored in the region include phytoremediation (uptake by plants), lining of irrigation canals, polymer applications, agricultural water efficiency, and conservation methods and dilution (Gunnison Basin Selenium Task Force n.d.; Eileen List, personal communication, June 2, 2004). Potential trading parties: wastewater treatment plants; stormwater discharge systems; sand and gravel mining operations; irrigated agriculture
5. Stakeholders/participants • City of Grand Junction: spearheading the development of a trading
program; obtained funding from USEPA • URS Corporation: contracted for developing trading framework • U.S. Environmental Protection Agency, Region 8: funded the City of
Grand Junction’s 2003 proposal to develop a selenium trading program • Grand Valley Selenium Task Force: Assembled in August, 2002 because
many tributaries within Grand Valley would be placed on the 303(d) list for selenium impairment. Includes representatives from the Cities of Grand Junction and Fruita, local water and land users, Mesa County, Grand Junction Drainage District, Mesa County Soil Conservation District, Colorado River Water Conservation District, Natural Resources Conservation Service, Colorado Department of Public Health and
75

Environment (CDPHE) Water Quality Control Division, Colorado Division of Wildlife, U.S. Fish and Wildlife Service, U.S. Bureau of Reclamation, U.S. Geological Survey, and U.S. Environmental Protection Agency Region 8 Water Quality Unit.
6. Regulatory drivers
There is no regulatory driver for selenium trading, primarily because the vast majority of the selenium loads originates from unregulated nonpoint sources (Eileen List, personal communication, May 21, 2004). Point sources, including the Persigo WWTP operated by the City of Grand Junction and co-owned with Mesa County, have effluent standards set by the Colorado Discharge Permit System. The Persigo WWTP discharges into Persigo Wash just before it joins the Colorado River, and selenium concentrations in the Persigo Wash and other tributaries often exceeds the acute selenium standard of 18 µg/L. Due to the uncertainty associated with the selenium standard, however, the Colorado Water Quality Control Commission issued a temporary modification of the selenium standard (among other pollutants) for Persigo Wash and other Grand Valley washes in July, 2001 (City of Grand Junction 2004). A TMDL for selenium has not yet been developed for the segment of the Colorado River below the Gunnison River confluence near Grand Junction, but it is on the 303(d) list of impaired waters. Grand Junction proposed that the segment be downgraded to the Monitoring and Evaluation (M&E) list because existing selenium concentrations have not harmed fish, including threatened and endangered species. The City also notes that a TMDL might not be appropriate at this time since the EPA may be revising its criteria for the chronic selenium standard. Since more than 60% of the selenium in the segment comes from the Gunnison River Basin, Grand Junction concludes that upstream selenium remediation could preclude the need for a TMDL (City of Grand Junction 2004). The State has reassured Grand Junction that the selenium discharge limits for the WWTP will not be lower than the ambient stream concentrations, but Grand Junction remains concerned that they will be forced to reduce the background and inflow selenium concentration at great expense (City of Grand Junction 2004), especially due to the presence of threatened and endangered fish species in designated critical habitat of the Colorado River Although the City is concerned that a TMDL would burden them with an unfairly large portion of the selenium reductions, a TMDL might provide a baseline for nonpoint/nonpoint trading. It is worth noting that the Grassland Area Farmers (see “Trading Initiatives”) achieved nonpoint/nonpoint selenium trading among irrigation districts in the San Joaquin Valley, California, using allocations under an aggregate selenium cap (although not through the TMDL process).
76

B. Trade Structure
7. Determination of credit Not determined.
8. Trading ratios and other mechanisms to deal with uncertainty Not determined.
9. Liability/penalties for noncompliance Not determined.
10. Approval process Not determined.
11. Ex post verification/auditing. Not determined.
12. Mechanisms for trade identification and communication (education and outreach, third party facilitation, embedded ties) Not determined.
13. Market structure (bilateral, clearinghouse, third party brokers) Not determined.
14. Types of trades allowed Point/point, point/nonpoint, nonpoint/nonpoint and habitat offset trades are being considered (Eileen List, personal communication, May 21, 2004).
C. Outcomes 15. Types and volume of trades that have occurred
None. The trading framework is only at the conceptual stage.
16. Administrative costs All costs will depend on the trading framework and market structure.
17. Transaction costs
77
Not determined.
18. Cost savings Not determined.
19. Program goals achieved It is too early to determine the outcome of selenium trading on the Lower Colorado River, but the initiative has faced significant obstacles in crafting a viable trading framework.
20. Program obstacles The project has faced difficulty in determining what to trade, how water quality credits could potentially be generated, and who might be interested in generating and/or purchasing nonpoint source selenium credits (Eileen List, personal communication, May 21, 2004). Additional complications arise from the controversy regarding potential changes in selenium standards. The project has also found it difficult to elicit interest and support from the federal agencies and agricultural community (see below).
21. NPS involvement and incentives to engage in trading. Gaining nonpoint source support for trading has been a challenge because agricultural sources of pollution are unregulated in Colorado. Pilot projects and incentives are needed to engage water and land users by demonstrating how they can benefit from trading (Eileen List, personal communication, May 21, 2004).
22. Other
Program information/References Websites: See individual online documents, listed below Contacts: Eileen List, Environmental Regulatory Coordinator, City of Grand Junction. (970) 256-4149 Julie Vlier, URS Corporation. (303) 740-2715 Ronda Sandquist, Jackson Kelly PLLC, (303) 390-0186 Written Program Information:
City of Grand Junction (2004). Prehearing statement of City of Grand Junction, February 2, 2004. Retrieved May 26, 2004 from
78
http://www.cdphe.state.co.us/op/wqcc/OtherRegs/93-94/PHSGrandJunction9394.pdf
Gunnison Basin Selenium Task Force (n.d.). What can be done about the selenium problem? Retrieved May 26, 2004 from http://www.seleniumtaskforce.org/
National Irrigation Water Quality Program (2003). Selenium update for Colorado’s Lower Gunnison River Basin and Grand Valley. U.S. Bureau of Reclamation. Retrieved May 26, 2004 from http://www.usbr.gov/niwqp/info/current/ggv/news6.pdf
U.S. Environmental Protection Agency (2003). City of Grand Junction receives innovative grant to help clean up Lower Colorado River. Environmental News, January 24, 2003. Retrieved May 3, 2004 from http://yosemite.epa.gov/r8/r8media.nsf/0/5c07e1fc3940e4e587256cb70083143b?OpenDocument
Reviewed by Eileen List, Environmental Regulatory Coordinator, City of Grand Junction and Ronda Sandquist, Attorney, Jackson Kelly PLLC.
79
Long Island Sound (CT) A. Program Background
1. Program description
The entire Connecticut coastline and portions of New York’s coast make up the shores of the Long Island Sound. The bulk of the Sound’s watershed is in Connecticut, as are most of the point sources discharging nutrients that threaten its water quality. Efforts to address low oxygen levels in the Long Island Sound began in 1990 with controls of nitrogen loading from sewage treatment plants (McGinnis 2001, p.168). After multiple phases of conventional reduction strategies in management zones across Connecticut and New York, plans began for a watershed-based approach that included effluent trading between point sources. In 2001, the Connecticut Department of Environmental Protection (CTDEP) and the New York State Department of Environmental Conservation formally established an EPA-approved TMDL calling for nitrogen reductions of 58.5% from point and non-point sources by 2014, given the 1990 base load. Although the two states developed the TMDL in coordination, New York chose not to participate in an interstate trading program (McGinnis 2001, p.169, Gary Johnson, CTDEP, personal communication, 2004). Legislators in Connecticut proceeded to pass a NPDES General Permit for Nitrogen Discharges in the Long Island Sound, including a Nitrogen Credit Exchange Program, which became effective January 1, 2002. The General Permit limits nitrogen discharges from individual municipal sewage treatment plants while allowing plants discharging less than their allocation to generate credits for plants discharging more than their allocation.
2. Program motivation
The Long Island Sound lies in one of the nation’s most densely populated regions, a highly urban and suburban setting. The Sound contributes an estimated $5.5 billion per year to the regional economy from boating, commercial and sport fishing, and other forms of recreation for more than 8 million people live in the watershed. Ecological degradation due to increasing development threatens a diversity of plant and animal species that inhabit the estuary and its surroundings. In 1985, Congress initiated the Long Island Sound Study, which found low levels of oxygen to be the greatest threat to the watershed and identified nitrogen as the primary pollutant causing hypoxia in the summer (Peterson 2003, CTDEP 2003). Excess nitrogen stimulates the growth of dense algae blooms, which are decomposed by bacteria in a process that consumes large amounts of the dissolved oxygen necessary to sustain aquatic life, including important fish and shellfish resources. Short periods of hypoxia have occurred in the Long Island Sound since the 1950s, but beginning in the 1980s, scientists documented extended periods of severely
80
low oxygen levels that they attributed mostly to increasing nitrogen loads from sewage treatment plants (McGinnis 2001, p. 168). In Connecticut, officials foresaw that plants able to cost-effectively remove nitrogen due to their size and design would be willing to implement nitrogen reductions greater than those required by their permit, especially given the opportunity to sell excess reductions in the form of credits (CTDEP 2001). The state estimated that a flexible distribution of allowances through a trading program would reduce the overall cost of nitrogen removal by more than $200 million (CGA 2001b).
3. Pollutant being traded Nitrogen
4. Size of program
Long Island Sound covers about 1,300 square miles, measuring more than 100 miles from east to west and about 21 miles wide at its widest point. The Sound drains an area of more than 16,000 square miles, encompassing virtually all of Connecticut and portions of several other states (CTDEP 2000). The General Permit, however, applies only throughout the State of Connecticut. The Connecticut portion of the watershed contains 79 publicly owned sewage treatment plants that that each discharge at least 20 lbs of total N per day (USEPA 2003b, p. 1). Nonpoint sources of nitrogen to the Sound include atmospheric deposition of automobile emissions and stormwater runoff from urban and residential areas.
5. Stakeholders/participants The Connecticut Department of Environmental Protection administers the TMDL, issues the General Permit to comply with its limits, and monitors annual progress in its 15-year schedule. It also monitors all nitrogen removal projects, consults with Nitrogen Credit Advisory Board to oversee and execute the exchange of all nitrogen credits, and maintains an account of state-owned nitrogen credits. The Connecticut General Assembly and the Governor of the State appoint the Nitrogen Credit Advisory Board (NCAB), which includes 12 members representing a balance between buyers and sellers of credits, large and small municipalities, and different regions of the state. The Board meets monthly throughout the year to assist and advise the CTDEP in the exchange of all nitrogen credits. It reports to the Environment Committee of the Connecticut General Assembly on the progress of the nitrogen exchange program, suggested improvements, and the adequacy of funding for the program.
The 79 sewage treatment plants regulated under the General Permit are the main point sources of nitrogen in the Long Island Sound and the most
81
significant sources of the nutrient in this highly urbanized region. As publicly owned wastewater facilities, they represent municipalities and towns. They make up the buyers and sellers of the Long Island Sound trading program
6. Regulatory drivers
Under the federal Clean Water Act, municipal water treatment plants must reduce the annual loading of total nitrogen to meet a statewide aggregate target as established in the TMDL. The state modified existing NPDES permits for point sources to comply with the TMDL and committed to nonpoint source reduction actions. The TMDL load allocation target is based on a “64% reduction goal for treatment plants of the state and a “10% reduction in nonpoint and stormwater nitrogen from land classified as urban/suburban and agricultural” (Gary Johnson, CTDEP, personal communication, 2004). Connecticut’s General Permit for Nitrogen Discharges in the Long Island Sound reflects annual limits established in the TMDL. According to the Nitrogen Credit Exchange Program under the General Permit, facilities that discharge less total nitrogen than the permit allows receive credit for nitrogen removal. Facilities that discharge more total nitrogen than the permit allows must secure nitrogen credits equivalent to the amount by which they exceed their limit. The credits are bought and sold annually through the Credit Exchange Program. Credits representing the difference between the maximum allowable nitrogen discharge from all of the plants and their total actual discharge are held by the state.
Although trading allows some treatment plants to purchase credits rather than reduce nitrogen discharges, the overall 58.5% reduction goal requires that other municipalities modify existing treatment methods or build new systems. Since1986, the State of Connecticut has provided municipalities with a combination of grants and loans to design and construct wastewater control projects through the Clean Water Fund (CWF). The Long Island Sound Restoration Act of 2000 authorized the use of additional federal funds to upgrade the watershed’s wastewater treatment facilities (NCAB 2003, p. 12). Now designated as a “revolving loan program” required under the Clean Water Act, the CWF receives federal assistance and is subject to EPA regulation. As of 1999, it has provided a 30% grant for nitrogen removal projects, compared to the 20% grant otherwise awarded, and a loan for the remainder of the costs. Using the CWF, the state purchases excess credits generated from municipalities within the Nitrogen Credit Exchange Program (CTDEP 2004a).
B. Trade Structure
7. Determination of credit
Plants receive nitrogen credits for any amount their discharge limit under the General Permit exceeds their actual discharge, in pounds of nitrogen per day,
82
as determined through monitoring. The nitrogen reduction is calculated by subtracting the actual end-of-pipe pounds of nitrogen discharged from the “baseline” loading established in the TMDL for Long Island Sound (NCAB 2003, p. 8). The cost of a credit represents “the cost of the removal of an equivalent pound of nitrogen per day at each treatment facility” (Moore 1998, p. 7). Each year, the CTDEP audits the performance of plants operating for the full calendar year (January 1 to December 31) to establish the value of nitrogen credits, taking into consideration increased capital costs of nitrogen removal as well as added operational and maintenance costs of reduction methods. At the end of March each year, the CTDEP determines the total number of credits to be bought and sold, publishes the annual value of nitrogen credits, and notifies each plant of its nitrogen credit balance. Plants have until the end of July to purchase credits from the CTDEP to meet their discharge limit. By the middle of August, the CTDEP must purchase all available credits (CGA 2001a)
8. Trading ratios and other mechanisms to deal with uncertainty
The CTDEP adjusts nitrogen credits using an "equivalency factor” to account for the locations of treatment plants and their varied impact on the Long Island Sound. The equivalency factor makes nitrogen reductions closer to hypoxic zones more valuable than reductions occurring further from these zones, encouraging plants with more detrimental discharges to remove nitrogen beyond their permit requirement and sell the credits (CGA 2001b). While nitrogen credit exchange can help the 79 dischargers in Connecticut’s portion of the watershed meet their collective limit, trading cannot be used to meet any local river or harbor water quality requirements or nitrogen limits (Moore 1998, p. 6). Discharge limits under the General Permit are “set with the objective of balancing credits sold and purchased to prevent a large deficit or surplus of credits in any year” (EPA 2003b, p. 2). New information on annual performance can be incorporated to better adjust the permits and achieve a more effective balance of credits. To ensure compliance with the TMDL, the General Permit establishes annual limits on each plant well below TMDL requirements and reduces the limits each year (EPA 2003b, p. 2). Also, the State reserves the right to revoke a point source’s authorization under the General Permit or “modify it to establish any appropriate conditions, schedules of compliance, or other provisions which may be necessary to protect human health or the environment or to implement the 15 year TMDL” (CTDEP 2002, p. 9)
9. Liability/penalties for noncompliance
The CTDEP is authorized to conduct compliance audits of the annual operating data for plants participation in the program. Any plant that fails to meet its individual waste load allocations and does not purchase the appropriate amount of credits is subject to existing statutory water pollution control enforcement provisions (CGA 2001b). Within five days of learning of
83
a violation under the General Permit, a point source must determine the cause of this violation; it must institute plans to correct it, mitigate its effects, and prevent further forms of it. The permittee is also required to report the violation and subsequent corrective action to the State (CTDEP 2002, p. 7)
10. Approval process
Because the 79 treatment plants in Connecticut’s portion of the watershed are all subject to the Nitrogen Exchange Program, they do not have to undertake any additional application process to complete a trade besides the procedures required under the General Permit. If their annual audit indicates that they have exceeded their allocation, they are expected to purchase sufficient credits from the state to account for the difference between their actual discharge and their permitted discharge. Treatment plants make these purchases by certified bank check or money order to the Nitrogen Credit Exchange Program; they must do so in July, after being an issued an invoice by the state at the end of March (CGA 2001a). For those plants that reduce more nitrogen than required by their permit, the state approves funds for the purchasing of excess credits and issues the respective municipalities checks in mid-August.
11. Ex post verification/auditing Since 2002, treatment plants have been required to monitor flow and total nitrogen, reporting to the state on a monthly basis. All treatment facilities must monitor daily flow continuously to calculate their average daily flow volume. Depending on the facility’s flow rate, it must monitor the final effluent either once (if its flow rate is less than 10,000,000 gallons per day) or twice per week (if its flow rate greater or equal to 10,000,000 gallons per day) (CTDEP 2002, p. 6). Each month, municipalities must enter the results of analyses for the total nitrogen and the average daily flow volume of the effluent on Monthly Operating Reports and Nitrogen Analysis Reports, which they present to the CTDEP (CTDEP 2002, p. 7). Plants are also subject to annual inspections. The CTDEP inspects each of the 79 municipal facilities regulated under the General Permit at least once during each year of the program, evaluating all aspects of the facility’s operation and monitoring procedures (NCAB 2003, p.10)
12. Mechanisms for trade identification and communication (education and
outreach, third party facilitation, embedded ties)
The CTDEP funds the most cost-effective, or lowest cost per pound, construction of nitrogen treatment facilities in priority process, according the financing procedures of the Clean Water Fund, (Moore 1998, p. 6). When federal funds are awarded, “distressed communities receive priority” (NCAB 2003, p. 12). The NCAB conducts “technical assistance outreach projects and presentations” to assist communities in “operating their treatment facilities to remove nitrogen more efficiently” (NCAB 2003, p. 9)
84
13. Market structure (bilateral, clearinghouse, third party brokers)
Connecticut’s nitrogen trading program at Long Island Sound represents a prototypical clearinghouse. The equivalency factor converts nitrogen reductions from point sources throughout the watershed into uniform credits, and the NCAB assigns a single dollar value to these credits through careful analysis of typical reduction costs. This state-controlled system involves numerous checks and balances that encourages confidence in the trades among stakeholders and reinforces the efficacy of the program. The clearinghouse framework has eased concerns that more financially distressed towns would end up sending money to wealthier communities in the southwest corner of the state, where most of the initial upgrades to facilities were feasible. Towns feel more comfortable with a central credit exchange than bilateral trades because they feel like they are paying for the true value of credits rather than just subsidizing the wealthy towns (Gary Johnson, CTDEP, personal communication, 2003).
14. Types of trades allowed
While the program has emphasized point-point trades since the onset, it is flexible enough to allow for trading with nonpoint sources. Because nonpoint source controls in the Long Island Sound have proven to be much more costly than point source controls and point sources dominate the nitrogen load, the CTDEP has suggested that “the purchase of point source credits to offset nonpoint reductions requirements” could help cut the costs of managing nitrogen (CTDEP 2001, p. 2). Managers of the Long Island Sound currently consider the inclusion of credits from nonpoint sources unlikely, given the high cost of removing nitrogen from these sources, the limited force of the regulations they face, and the impracticality of monitoring their reductions. Applying trading ratios would address the uncertainty of measurement, but it would also increase the incremental cost of managing nonpoint source pollution, thereby reducing the appeal of point-nonpoint trades. Thus, although trading with nonpoint sources may be technically permitted in the Long Island Sound, specific ground rules and actual incentives are lacking (Paul Stacey, CTDEP, personal communication, 2004).
The authors of the trading program recognize that protecting the Sound from severe hypoxia calls for continuous standards on nitrogen control, year after year. For this reason, the CTDP does not allow nitrogen reductions achieved at an individual source to be saved for use or sale beyond a 12-month period. The absence of a year-to-year banking provision in the trading program ensures that the 12-month average discharge remains below nitrogen reduction targets (CTDEP 2001, p. 2).
C. Outcomes
85
15. Types and volume of trades that have occurred
Given audited monitoring data for the period January through December 2002, the first year of the trading program, the NCAB notified 38 municipalities at the end of March 2003 that they would have to purchase a total of $1.32 million worth of credits in order to remain in compliance with the General Permit. During the same period, 41 treatment plants were able to reduce more nitrogen than their permit stipulated, allowing them to sell a total of $2.76 million worth of credits. The exchange left the State of Connecticut with excess credits amounting to $1.44 million, which it purchased through the Clean Water Fund. These dollar amounts are based on the credit price of $1.65 that the NCAB calculated from nitrogen removal costs at 24 sewage treatment plants (CTDEP 2003b, p. 4). The Board reported that all 79 municipalities regulated under the General Permit cooperated fully in implementing the Nitrogen Credit Exchange program in 2002 (NCAB 2003, p. 4).
At the end of March 2004, the State of Connecticut accepted the NCAB’s recommendation to set the cost of a credit at $2.14 for the trading program’s second year. This value results from the division of $5,869,569 —the combined capital, operation and maintenance costs at the 25 facilities with nitrogen removal projects financed by the Clean Water Fund during this period—by 2,742,081 pounds of equalized nitrogen removed. This higher price relative to the 2002 credit value is attributable in part to differences in weather between first to second years of trading. Compared to the colder conditions in 2003, a mild winter and above average heat in the summer and fall of 2002 favored the biological nitrogen removal activity at treatment plants. Moreover, wetter conditions in 2003 caused greater flows at the plants, placing strain on their treatment capacity. The higher credit price in 2003 also reflects normal increases in capital costs, as well as the costs of operation and maintenance. Between January and December 2003, 40 municipalities exceeded their nitrogen discharge allocation and 39 municipalities reduced more nitrogen than required by their permits. Given the $2.15 credit price, municipalities seeking to increase their allocations by buying credits owe a total of $2.12 million and municipalities able to sell credits expect a total of $2.43 in compensation for their reductions. The State will purchase the remaining $312,000 worth of credits using the Clean Water Fund (Gary Johnson, CTDEP, personal communication, 2004).
16. Administrative costs
The trading program at Long Island Sound has carried out two years of credit exchange with relatively limited financial resources, besides the state and federal funds used to implement nitrogen removal projects. The CTDEP currently employs between four and five individuals to work on the Nitrogen Credit Exchange, the equivalent of two full-time employees (Gary Johnson, CTDEP, personal communication, 2004). All members of the Nitrogen Credit
86
Advisory Board complete their work for the program without monetary compensation.
17. Transaction costs
The CTDEP does not collect a transaction fee for credit sales. Although early drafts of the legislation authorized the CTDEP to collect such a fee, this provision was excluded from the final bill. The bill did allow the use of state clean water funds to support the program if needed (Gary Johnson, CTDEP, personal communication, 2004).
18. Cost savings The CTDEP estimates that reaching the 15-year nitrogen reduction goal without trading would cost approximately $1 billion, and that trading will save 20% of that cost over those 15 years, or approximately $200 million (Gary Johnson, CTDEP, personal communication, 2004).
19. Program goals achieved In April 2003, the EPA described Connecticut’s Long Island Sound trading program as a “national model of holistic planning based on sound science, watershed permitting of multiple dischargers, and the use of water quality trading to achieve necessary nitrogen reductions at lower cost" (EPA 2003a). The State expects to be well ahead of the reduction targets established in the TMDL for nitrogen. When the TMDL is fully implemented, established criteria for dissolved oxygen can be achieved (Paul Stacey, CTDEP, personal communication, 2004).
20. Program obstacles
Upgrades to municipal treatment plants require stable, multi-year funding. The single most critical factor to the continued progress of the program is the continued availability of Clean Water Fund to support the infrastructure of nitrogen removal (NCAB 2003, p. 4). In September 2003, the NCAB reported that “the projected demand for Clean Water Fund financing to support construction projects is more than twice the amount projected to be available” (NCAB 2003, p. 11).
21. NPS involvement and incentives to engage in trading. Because point sources dominate the nitrogen load to the Sound and since accurate, affordable, and enforceable methods for controlling nonpoint sources are currently lacking, the program does not rely on nonpoint source reductions. Still, the potential remains to accommodate nonpoint source trading, especially as the cost of reducing nitrogen from point sources increases. The cost of a point source credit been estimated to range from just
87
over $1.50 per pound in the first year to “$29.84 per pound at the point when the nitrogen reduction goal of 58.5% total reduction to the Sound is achieved” (Moore 1998, p. 7)
22. Other Program information/References
Websites: CTDEP, Nitrogen Control Program for Long Island Sound http://www.dep.state.ct.us/wtr/lis/nitrocntr/nitoindex.htm Contacts: Paul E. Stacey, Long Island Sound Study Coordinator, CTDEP, Water
Management Bureau, 79 Elm St., Hartford, CT 06106, (860) 424-3728, [email protected]
Gary Johnson, Senior Environmental Engineer, CTDEP, Water Management Bureau, 79 Elm St., Hartford, CT 06106, (860) 424-3754, [email protected]
Written program information: Connecticut Department of Environmental Protection (CTDEP). (2004).
“Connecticut’s Clean Water Fund.” Retrieved May 27, 2004 from http://dep.state.ct.us/wtr/cwa/cwfund.htm
---------(2003a). "Connecticut's Nitrogen Control Program: General Permit for Nitrogen Discharges and Nitrogen Credit Exchange Program." February 2003. Retrieved May 27, 2004 from www.envtn.org/docs/ct_fact_sheet.PDF
---------(2003b). "Long Island Sound Benefits from Nitrogen Credit Exchange." Managing Environmental Compliance in Connecticut. November 2003. Issue 4. Retrieved May 27, 2004 from http://dep.state.ct.us/enf/newsletter/envcompliance.htm
---------(2003c). Lt. Governer Jodi Rell. "L. Governor Rell Marks the Success of Connecticut's Innovative Nitrogen Trading Program" October 24, 2003. Retrieved May 27, 2004 from http://dep.state.ct.us/whatshap/press/2003/cr1024a.htm
---------(2002). Bureau of Water Management Permitting, Enforcement & Remediation Division. General Permit for Nitrogen Discharges. Issuance Date: January 2, 2002. Retrieved May 28, 2004, http://www.dep.state.ct.us/pao/download.htm#WaterGP
---------(2001). "Connecticut's Nitrogen Control Program: Facilitating Hypoxia Control in Long Island Sound through a Nitrogen Credit Exchange Program." April 2001. Retrieved May 27, 2004 from dep.state.ct.us/wtr/lis/nitrocntr/nitrcrdt.pdf
---------(2000). "A Total Maximum Daily Load Analysis to Achieve Water Quality Standards for Dissolved Oxygen in Long Island Sound."
88
December 2000. Retrieved May 27, 2004 from www.epa.gov/region01/eco/lis/assets/pdfs/Tmdl.pdf
Connecticut General Assembly (CGA) (2001a). Public Act 01-180. An Act Concerning Nitrogen Reduction in Long Island Sound. Retrieved May 27, 2004 from http://www.cga.state.ct.us/2001/act/Pa/2001PA-00180-R00SB-01012-PA.htm
--------(2001b)." OLR Bill Analysis: An Act Concerning Nitrogen Reduction in Long Island Sound." Retrieved May 27, 2004 from http://www.cga.state.ct.us/olr/ba2001/1012.htm.
Report of the Nitrogen Credit Advisory Board to the Joint Standing Environment Committee of the General Assembly;
McGinnis, S.L. "Watershed-based Pollution Trading Development and Current Trading Programs." Environ Engg and Policy 2 (2001): 161-70.
Moore, Robert. “Long Island Sound Watershed-Based Trading Demonstration Project.” October 4, 1998 http://www.envtn.org/programs/longisld.htm
Nitrogen Credit Advisory Board (NCAB). (2002). Report to the Joint Standing Environment Committee of the General Assembly Concerning the Nitrogen Credit Exchange Program. November 27, 2002. Retrieved May 27, 2004 from http://www.envtn.org/docs/long_island_N_act.PDFB.
---------(2003). Nitrogen Credit Advisory Board. Second Annual Report to the Joint Standing Environment Committee of the General Assembly Concerning the Nitrogen Credit Exchange Program. September 25, 2003 Retrieved May 27, 2004 from http://dep.state.ct.us/wtr/lis/nitrocntr/annrpt.pdf
Peterson, Greg. "Trading Water Pollution." Geotimes. March 2003. Retrieved May 27, 2004 from http://www.geotimes.org/mar03/NN_water.html
United States Environmental Protection Agency (USEPA). (2003a). Office of Water, April 10, 2003 Letter to Connecticut Department of Environmental Protection Commissioner Arthur J. Rocque Jr. from G. Tracy Mehan, III Assistant Administrator
---------(2003b). "Watershed-Based Permitting Case Study: Final Permit. General Permit for Nitrogen Discharges." December 2003 update. Retrieved May 27, 2004 from www.epa.gov/npdes/pubs/wq_casestudy_factsht1.pdf
89
Tampa Bay Estuary Program (FL) A. Program Background
1. Program description
The Tampa Bay National Estuary Program (TBNEP) was initiated in 1991 to protect the health of the Bay (Nanette Holland, personal communication, May 10, 2004). In the spring of 1997, after gaining approval from the EPA and community partners, the Tampa Bay Management Plan was approved and the program’s name changed to the Tampa Bay Estuary Program (TBEP) (Nanette Holland, personal communication, May 10, 2004). The Tampa Bay Estuary Program (TBEP) takes an interdependent ecosystem approach to solving regional environmental issues by bringing all stakeholders together. The emphasis of this program is unique in that it is not driven solely by government policies and regulations, but rather by what studies have shown is best for the health of the bay, and the concern of local residents over the health of the bay. This makes for a unique situation in which “trading” does not actually occur, but group consultation and decision-making are used as alternative approaches to determine how certain sources should reduce their discharge. Although trading does not occur, it is believed that the interdependent ecosystem perspective taken by the program leads to similar results. In particular, participants work together to keep nitrogen levels beneath an established threshold by instituting reduction programs and adopting other individual measures. This program is based on the premise that all stakeholders should work together to do what is best for the Bay. In defining “what is best for the Bay,” the TBEP has established and allocated nitrogen loading goals for the Bay to encourage seagrass recovery (TBNEP 1996). In 1996 local government and agency partners in the NEP agreed to maintain nitrogen loading at existing levels (using 1992-1994 average) (TBNEP 1996). However it is expected that local governments and agencies will actually have to reduce their nitrogen reduction quota by about 7% by 2010 to offset anticipated population growth (TBNEP 1996). Each city and participating agency has been assigned a nitrogen release quota to meet this reduction goal through individual local government action plans (TBNMC 1998). These quotas are flexible and allow reductions to be credited to future years, and to be achieved through a selection of projects. Governments and other polluters have an incentive to participate in nitrogen reduction through the TBEP because through participation these entities are granted regulatory flexibility by regulatory agencies (Nanette Holland, personal communication, May 10, 2004). All participation is voluntary, but as long as overall nitrogen reduction goals are being met, the participation of
90
these Bay area polluters in the TBEP will take the place of a more formal TDML (Nanette Holland, personal communication, May 10, 2004). Originally local governments agreed to reduce nitrogen emissions by 6 tons per year (from sources including stormwater runoff and discharges from municipal sources), while the Nitrogen Management Consortium (made up of industries, local governments and regulatory agencies) pledged to reduce nitrogen pollution by 11 tons (from atmospheric deposition, industrial point sources, fertilizer shipping and handling, and intensive agriculture) (TBNEP 1996). The Nitrogen Management Consortium members have calculated existing nitrogen pollution, as well as planned reductions that will occur from specific projects. These pollution loads are outlined in Tampa Bay Nitrogen Management Consortium (1998). The group then calculated each participant’s contribution to nitrogen cleanup based on the participants current system of nitrogen reduction and is working on deciding the most efficient reduction strategies for the future.
The Tampa Bay Nitrogen Management Consortium (TBNMC) has also been established with the specific goal of nitrogen pollution reduction. Its purpose is to “work with nongovernmental point and nonpoint polluters to reduce the 56 tons of nitrogen to 11 tons of nitrogen that currently comes from atmospheric deposition , industrial point sources, fertilizer shipping and handling, and intensive agriculture” (TBNMC 1998). A flexible and holistic approach has been taken by the TBNMC whereby members work together to identify the most cost effective ways of reducing nitrogen pollution and equitably distributing the costs through a credit program among its members (TBNMC 1998). The goal is to have all nitrogen reduction projects identified and completed by 2005 (TBNMC 1998). If the projects that have been proposed and those that actually have begun, are not enough, the consortium will identify the most cost effective projects that should then be undertaken to achieve the goal.
2. Program motivation
The Clean Water Act of 1972 first alerted the public about potential nitrogen problems in the Bay. Nitrogen was the main nutrient targeted in the 70’s because it was leading to eutrophication and algal growth. This growth was clouding the water of the bay and cutting off light to seagrass, which in turn negatively affected fish habitats (TBNEP 1996).
3. Pollutant being traded Nitrogen is the focus of the TBEP, but no pollutant is actually traded.
4. Size of program
91
The TBEP territory covers an area of approximately 2,200 square miles in Hillsborough, Pinellas, and Manatee counties, which combined has a population of 2.5 million people and three seaports (TBNEP 1996; Nanette Holland, personal communication, May 10, 2004). The estuary itself covers almost 400 square miles (TBNEP 1996). Potential trading parties: none
5. Stakeholders/participants • Partners in the Estuary Program: Hillsborough, Pinellas and Manatee
counties; the cities of Tampa, St. Petersburg and Clearwater; the Southwest Florida Water Management District; Florida Department of Environmental Protection; and the U.S. Environmental Protection Agency
• U.S. Environmental Protection Agency (USEPA): oversees the Tampa Bay Estuary Program along with 27 other estuary programs, which were all instituted under the Clean Water Act.
• Tampa Bay Regional Planning Council: supports the Estuary Program at a local level
• Tampa Bay Nitrogen Management Consortium (TBNMC): The TBNMC is a unique public and private partnership between major industries, including utilities, agriculture and fertilizer manufactures, and local governments, which works to meet specific nitrogen reduction goals (Nanette Holland, personal communication, May 10, 2004).
• Agency on Bay Management (ABM): ABM is the natural resources committee of the Tampa Bay Regional Planning Council and works closely with the TBEP. The association represents interests of recreational and commercial fisheries, industrial, academic, and scientific sectors, and local, state and regional governments.
• Southwest Florida Water Management District (SWFWMD) and its Surface Water Improvement and Management Program (SWIM): integral in implementing the Bay plan
• Hillsborough County Environmental Protection Commission: played active role in water quality monitoring, leading to a database for tracking improvements.
• The TBEP has a community advisory committee comprised of interested citizens who offer advice on potential educational outreach programs (Nanette Holland, personal communication, May 10, 2004).
6. Regulatory drivers
The Clean Water Act initially drew attention to the nitrogen pollution problem of the Bay, but the TBEP goes beyond the standards of specific legislation. However, there are regulations within the documents of the TBEP that members have agreed to. In particular, each participating local and government agency was required to develop its own action plan to reduce
92
nitrogen and help meet the goals for the Bay, which was submitted to TBEP’s Management and Policy Committee. These action plans are critical because portions of these plans are later incorporated into regulatory permits (TBNEP 1996). The Clean Air Act Amendments of 1990 require reductions in NOx from coal-fired power plants nationwide. Tampa Electric Company actually reduced emissions before the 2000 deadline to meet requirements and help with nitrogen reduction under the TBEP (TBNMC 1998).
D. Trade Structure
7. Determination of credit
N/A
8. Trading ratios and other mechanisms to deal with uncertainty
N/A
9. Liability/penalties for noncompliance
N/A
10. Approval process
N/A
11. Ex post verification/auditing Several local governments and agencies work together to monitor the region with an emphasis on health and diversity of bay habitats rather than the traditional laboratory standards. In particular, a Regional Ambient Monitoring Program (RAMP) exists through which all the agencies test the samples in their own laboratories and subsequently reconvene to evaluate the results on total nitrogen, nitrate, nitrite, ammonia, turbidity, and other factors (Pribble et al 2002). The TBEP will revisit the nitrogen goal and the associated management strategies every five years, or as often as new information comes up (TBEP 1996). In addition, an annual progress report for the TREP Management and Policy Boards and local community will be released that compares the current situation to the goals outlined in TBNMC 1998. Finally, a biannual report on bay monitoring will be prepared for bay managers (TBNMC 1998).
93

12. Mechanisms for trade identification and communication (education and outreach, third party facilitation, embedded ties)
N/A
13. Market structure (bilateral, clearinghouse, third party brokers)
N/A
14. Types of trades allowed
N/A
E. Outcomes 15. Types and volume of trades that have occurred
No trades have occurred, and there is no infrastructure in place to permit trading in the future.
16. Administrative costs
N/A
17. Transaction costs
N/A
18. Cost savings Preliminary analyses suggest that the cost to meet certain water quality goals for Tampa Bay will be relatively minimal over the plan’s lifetime (see Implementation & Financing chapter of TBNEP 1996). For example, local communities and industries will need to reduce future nitrogen loadings to the Bay by about 17 tons (or about one-half percent of the total load) per year to maintain water quality levels and provide for continued seagrass recovery. The cost of achieving this goal is estimated to be an additional $2 to $4 million per year over current expenditures, or about $2 per bay area resident (TBNEP 1996).
19. Program goals achieved In 2000, all government stakeholders updated their action plans for nitrogen removal projects, which became an amendment to the Consortium Action Plan (Holly Greening, personal communication, May 3, 2004). These planned reductions will be compared to actual reductions in the future.
94

Chlorophyll a concentrations are measured yearly to keep track of nitrogen loading (Holly Greening, personal communication, May 3, 2004). A “decision matrix” has been developed through which chlorophyll a concentrations and light attenuation are tracked and assessed (Poe et al 2004). In 2000, 2001 and 2002 chlorophyll a targets for all four Bay segments were met, and three of the four targets were met in 2003 (Poe et al 2004). This indicates that nitrogen loading maintenance is on track (Holly Greening, personal communication, May 3, 2004). In 2003, the TBEP initiated development of a computerized database to track nitrogen reduction projects that are either planned, or have been undertaken by the various stakeholders (Holly Greening, personal communication, May 3, 2004). Once this database is complete and up-to-date, load goals and actual reductions will be easier to track (Holly Greening, personal communication, May 3, 2004). The next full loading estimate, undertaken every five years and include TN, TP, and TSS, will be available in August 2004 (Holly Greening, personal communication, May 3, 2004).
20. Program obstacles
N/A
21. NPS involvement and incentives to engage in trading. Nonpoint sources are not the focus of the Estuary Program.
22. Other Program information/References
Websites: Tampa Bay Estuary Program. http://www.tbep.org/index.html Contacts: Nanette Holland, Public Outreach Coordinator, Tampa Bay Estuary Program, (727) 893-2765 Holly Greening, Senior Scientist, Tampa Bay Estuary Program, (727) 893-2765 Written program information: Pribble, R.J., Janicki, A.J., and Greening, H. 2002. Baywide Environmental
Monitoring Report 1983-1998. Tampa Bay Estuary Program, Technical Report 07-99. Retrieved April 1, 2004 from http://www.tbeptech.org/TechPubs/FishWild1Page2.html
Environomics (1999). A summary of U.S. effluent trading and offset projects. A report prepared for Dr. Mahesh Podar, U.S. Environmental Protection
95
Agency, Office of Water. Retrieved May 7, 2004 from http://www.epa.gov/owow/watershed/trading/traenvrn.pdf
Poe, A., Janicki, A., & Janicki, S. (2004). Technical memorandum: Tracking chlorophyll-a and light attenuation in Tampa Bay: Application to 2003 data. Tampa Bay Estuary Program.
Tampa Bay National Estuary Program (TBNEP) (1996). Charting the course: the comprehensive conservation and management plan for Tampa Bay. Retrieved May 20, 2004 from http://www.tbep.org/pdfs/ctc/ctctoc.html. Also available from the Tampa Bay Estuary Program on CD-ROM.
Tampa Bay Nitrogen Management Consortium (TBNMC) (1998). Partnership for progress: Tampa Bay Nitrogen Management Consortium Action Plan 1995-1999. Available from the Tampa Bay Estuary Program on CD-ROM
Reviewed by Nanette Holland, Tampa Bay Estuary Program.
96
Lower Boise River Effluent Trading Demonstration Project (ID) A. Program Background
1. Program description The U.S. Environmental Protection Agency (EPA) and the Idaho Department of Environmental Quality (DEQ) are designing a phosphorus trading demonstration project for the Lower Boise River. The trading framework will be implemented to help achieve the nutrient reduction goals set by the TMDL. Trading will occur within a watershed-wide, market-based trading system that will include both point and nonpoint sources. The EPA began working with Idaho, Oregon, and Washington in 1997 to examine how trading could reduce the cost of meeting TMDL requirements. The Lower Boise Effluent Trading Demonstration Project was launched as the first pilot project. Phase I of the demonstration project, which began in January, 1998, assessed the market feasibility for phosphorus trading. In Phase II, beginning in August, 1998, the project developers began designing the trading structure and protocols and completed two trading simulations. A draft framework was completed in December 1999, and the final report was issued in September 2000 (Ross and Associates 2000). Within the Lower Boise River’s trading framework, point sources can purchase credits to comply with the phosphorus limits in the NPDES permit. Point/nonpoint source trades will generally proceed as follows: First, trading parties are identified and contract terms are negotiated. The trading parties sign a contract specifying the amounts of credits to be delivered, the best management practice (BMP) to be used to generate these credits, payments, monitoring provisions, and penalties for noncompliance. The nonpoint source will install the BMP generating the phosphorus reductions and maintain the BMP according to the standards specified in the list of BMPs approved for the watershed. Each month, the point source gathers the information from the nonpoint source to complete the reduction credit certificate and signs it, attesting that they verified the operation of the BMP themselves. The credits documented in the certificate are recorded in the Trade Tracking System, which is a central database that holds credits that can be transferred to other accounts. The Trade Tracking System will be administered by a new nonprofit association, The Idaho Clean Water Cooperative. To complete a trade, the buyer and seller jointly submit an official Trade Notification Form that transfers these credits to the buyer and gives the DEQ and the EPA (accompanied by the Soil Conservation Commission) access to the site of the BMP for the purpose of assessing the regulatory compliance of the NPDES permit holder (Ross and Associates 2000; Schary and Fisher-Vanden 2004). Trading was initially expected to commence by the end of 2001 (Environomics 1999). The delay of the Snake River/Hell’s Canyon TMDL, which is expected to set the nutrient reduction targets for the Lower Boise
97

River TMDL, has delayed the implementation of the Lower Boise River trading framework. The Idaho DEQ submitted the Hell’s Canyon phosphorus TMDL to the EPA in July, 2003 and approval is anticipated by Fall 2004.
2. Program motivation Faced with the considerable challenge of developing and then implementing many TMDLs on a strict court-ordered schedule, Idaho, Oregon, and Washington joined the U.S. EPA Region 10 in exploring trading as a new water quality management tool. Trading seemed to offer a flexible and cost-effective option for achieving the pollutant reduction goals established by a TMDL (Ross and Associates 2000). The Lower Boise River TMDL did not establish nutrient reduction targets independent of Snake River-Hell’s Canyon TMDL because the Lower Boise itself is not visibly impaired by nuisance aquatic growth. In anticipation of basin-wide nutrient reduction goals set by the Snake River TMDL, however, the Lower Boise River TMDL called for no net increase of total phosphorus as an interim measure (Lower Boise River TMDL 1998). The Lower Boise River is the greatest contributor of phosphorus to the Brownlee Reservoir (via the Snake River), which suffers from excess nutrient loading and nuisance aquatic growth. The TMDL for the Hell’s Canyon reach of the Snake River is expected to establish significant nutrient reduction goals for the Lower Boise (Schary and Fisher-Vanden 2004).
3. Pollutant being traded
Phosphorus
4. Size of program
The Lower Boise River watershed drains 1290 square miles. The trading program extends over approximately 64 miles, from Lucky Peak Dam to the mouth of the Boise River at the Snake River (Ross and Associates 2000). Potential trading parties within this area include seven POTWs, three industrial dishchargers, and eight irrigation districts (Environomics 1999). Potential trading parties: NPDES permit holders (wastewater treatment plants, industrial dischargers); farmers; irrigation districts
5. Stakeholders/participants
• Idaho Department of Environmental Quality (DEQ)—prepares a TMDL and implementation plan, and develops trading ratios.
• U.S. EPA Region 10—issues NPDES permits for Idaho and approves TMDLs.
98
• Idaho Soil Conservation Commission (ISCC) – created the list of approved BMPs, effectiveness calculations, and uncertainty discounts. (ISCC 2002).
• Ross and Associates Environmental Consulting, Ltd. – consultant and facilitator for development of the trading framework, under contract to the EPA and DEQ.
• Idaho Clean Water Cooperative (ICWC)– a newly created non-profit entity that will be responsible for administering the Trade Tracking System
• Natural Resources Conservation Service (NRCS) • Agricultural stakeholders: Idaho Water Users Association, Idaho Farm
Bureau, Pioneer Irrigation District, Payette River Water Master, Ada and Canyon Soil Conservation Districts (SCD)
• Industrial stakeholders: Micron, Simplot, Idaho Power Company • Environmental stakeholders: Idaho Rivers United • Municipal governments: Association of Idaho Cities, Cities of Boise,
Meridian, Nampa, Middletown, Star, Notus, and Parma. • U.S. Bureau of Reclamation (USBR) – operator of Lucky Peak Dam
which provides water to the irrigation districts. • Southwest Idaho Resource Conservation and Development Council
(SWIRCD)—nonprofit established by the NRCS and assists in the development of the ICWC.
• American Wetlands—private, for-profit entity that constructs wetlands. • Boise State University Environmental Finance Center—funded by grants
to assist municipal governments with environmental issues.
6. Regulatory drivers Trading will occur within the framework of a TMDL since no phosphorus limits are specified in the permits currently. The regulatory driver in the short term is likely to be a No Net Increase policy for total phosphorus, established in the Lower Boise River TMDL. The regulatory drivers in the longer term are likely to be TMDLs for the Lower Boise River and Snake River/Hell’s Canyon (Ross and Associates 2000). The proposed draft TMDL for Snake River could require up to a 80% reduction in phosphorus loads for the Lower Boise River (Claire Schary, personal communication, May 24, 2004). The broader regulatory context for water quality trading has been established by the U.S. EPA’s Final Water Quality Trading Policy, finalized in January 2003, and the Idaho DEQ’s Pollutant Trading Guidance, drafted in November 2003 and being revised based on public comment. Idaho is not a delegated state for NPDES permits, so the U.S. EPA is responsible for issuing NPDES permits in Idaho.
B. Trade Structure 7. Determination of credit
99
The Idaho Soil Conservation Commission (ISCC) created a list of surface irrigated cropland best management practices (BMPs) that are approved for generating credits (ISCC 2002). BMPs eligible for trading include sediment basins, filter strips, efficient irrigation systems, constructed wetlands, and crop sequencing. Preference is given to measurable reductions, but the ISCC report includes a formula for estimating phosphorus reductions and acknowledges that direct measurement on a field scale BMP would not provide a reduction amount that can take the baseline year runoff into account. Therefore, measurement methods are only allowed for watershed scale BMPs. Each approved BMP is assigned an effectiveness ratio and an uncertainty discount. The uncertainty discount is eliminated if the farmer follows a certified nutrient management plan. Phosphorus loading reductions for a nonpoint source seller are calculated by first multiplying the nonpoint source’s baseline load (estimated using the Surface Irrigation Soil Loss (SISL) model applying a conversion factor of 2 lbs phosphorus per ton of soil loss) by a ‘water quality contribution percentage’ that represents the individual nonpoint source’s share of the reduction amount needed to achieve the load allocation assigned in the TMDL. This ‘water quality contribution’ represents the amount of reductions the nonpoint source must exceed to generate credits to sell. The amount of reductions created by a BMP is estimated by multiplying the nonpoint source’s baseline load by a BMP effectiveness ratio. The number of credits that can be sold is calculated as the difference between the amount of reductions generated by the BMP and the ‘water quality contribution’ reduction amount. These remaining reductions are multiplied by three ratios to determine the number of tradable credits: 1. a “river location ratio” to calculate credits in “Parma pounds” (Parma is the small town near the mouth of the Boise River where the TMDL’s reduction target is measured; this conversion reflects how phosphorus reductions throughout the watershed will have differential impacts on the water quality at Parma); 2. a “drainage delivery ratio” to account for transmission losses within a drainage channel; and 3. a “site location factor” to account for transmission losses between cropland and drainage channels (Claire Schary, personal communication, May 24, 2004). Approved BMPs, effectiveness and uncertainty ratios, SISL estimates, and ratios for river location, site location, and drainage delivery are listed in ISSC (2002). The report also contains an example of how tradable credits are calculated. Point sources’ initial permit limits (which can be adjusted through trades) are established by the Waste Load Allocations (WLA) in their NPDES permit.
100
8. Trading ratios and other mechanisms to deal with uncertainty As detailed above in “How credits are determined,” the formula for credits includes an uncertainty discount. Additional trading ratios reflect river location, site location, and drainage delivery (ISCC 2002). The approval process is also intended to reduce uncertainty, since Reduction Credit Certificates are submitted at the end of each month to document that the reduction has already taken place.
9. Liability/penalties for noncompliance The State will ultimately hold the point source liable for securing sufficient credits, but the trading parties sign a private contract that includes the amount of credits in Parma pounds, a description of the practices that will generate credits, monitoring requirements and assignment of responsibility, payment terms, and penalties for failure to deliver credits (Ross and Associates 2000).
10. Approval process A Reduction Credit Certificate, signed by the point source purchasing the credit and containing information provided by the nonpoint source, is submitted every month to the ICWC. The credits are entered into the Trade Tracking System and the credits are placed into the nonpoint source’s account. The buyer and seller subsequently sign and submit an official Trade Notification Form that specifies the amount, effective date, and duration of a trade which then transfers the credits to the point source’s account at the end of each month (Ross and Associates 2000). Since trading is broadly authorized by the rule, trades do not need to be individually approved by regulators. The ICWC reviews the forms for completeness before submitting the information into the Trade Tracking System. The point source is responsible for evaluating nonpoint source credits, although the Trade Notification Form also authorizes the IDEQ and the EPA (when accompanied by the ISCC) to inspect the BMP to evaluate compliance (Ross and Associates 2000). The point source’s Discharge Monitoring Report (DMR) is due 45 days after the end of the month that it covers. This allows time to verify nonpoint source reductions and submit the necessary forms for a trade (Schary and Fisher-Vanden 2004). The DMR worksheet indicates how the point source’s initial limit and subsequent trades establish a new limit that is equal to or greater than its actual reported discharge for that month. A Trade Summary Report from the Trade Trading System must accompany the DMR. (Claire Schary, personal communication, May 24, 2004).
11. Ex post verification/auditing.
101
Trades can be audited through the existing verification and inspection process for NPDES permittees (Ross and Associates 2000). Point sources must submit a monthly Discharge Monitoring Report, and purchased credits will be checked against these discharge reports in audits of NPDES permits. For measurable nonpoint reductions, water quality monitoring of inflow and outflow verifies the exact amount of reduction. For calculated nonpoint sources reductions, BMP installation is monitored by the point source prior to the creation of credit, and maintenance inspections are conducted by the point source to document monthly credits (Ross and Associates 2000). Nonpoint source projects are inspected by the point source at least once a year after installation and before seasonal operation. A schedule of inspections is contained in ISCC (2002).
12. Mechanisms for trade identification and communication (education and outreach, third party facilitation, embedded ties) The trading framework does not define how buyers and sellers must identify trades. Buyers can contact sellers directly (as in education and outreach) or through a third party broker or cooperative, should one develop. The ISCC will play an important role in identifying trading opportunities and can market trading along with their cost share programs (Claire Schary, personal communication, May 24, 2004). Farmers are not recruited through cost-share, but neither are they disqualified for receiving cost-share funds. The “voluntary water quality contribution” represents the individual nonpoint source’s share of the reduction amount needed to achieve the load allocation assigned in the TMDL. This satisfies the expectation that reductions from farmers need to be “surplus” to the reductions implied by the TMDL as part of the load allocation.
13. Market structure (bilateral, clearinghouse, third party brokers)
Bilateral. Buyers and sellers are expected to sign long-term private contracts for credit delivery, although there may be opportunities to purchase credits in the open market (Schary and Fisher-Vanden 2004). A new non-profit group, the Idaho Clean Water Cooperative, will be responsible for administering the Trade Tracking System (Schary and Fisher-Vanden 2004), but this is a trade registry and auditing system rather than a clearinghouse.
14. Types of trades allowed Point/point and point/nonpoint. Credits are generated and used on a monthly basis. Nonpoint source credits are created at the end of the month, and point sources must use those credits to offset nutrient loading during the same month. (Ross and Associates 2000).
102

C. Outcomes 15. Types and volume of trades that have occurred
None. Trading is being delayed by the EPA approval of the Snake River/Hell’s River TMDL, which will set the reduction target for the Lower Boise River phosphorus TMDL.
16. Administrative costs Administrative costs should be very low since the onus for identifying and evaluating trading opportunities is on the point sources. The regulator’s time has been spent on defining the trading conditions rather than individually brokering or evaluating trades (Schary and Fisher-Vanden 2004)
17. Transaction costs The BMP list provides one strategy for reducing transaction costs, but transaction costs could vary greatly depending on the mechanisms used to identify trades and communicate with trading partners.
18. Cost savings Environomics (1999) estimated a cost savings potential of $10-158/lb of phosphorus reduced, based on 80% phosphorus reduction estimates of $12-178/lb for point sources and $2-20/lb for nonpoint sources. Ross and Associates (2000) similarly estimated that phosphorus reductions at wastewater treatment plants ranged from $5 to more than $200/lb, while reductions through BMPs cost only $5-50/lb.
19. Program goals achieved The goals for the Demonstration Project were to “create a proposed trading program that is environmentally and legally sound; work within existing regulatory programs; allow trades to occur in a dynamic, market-based manner; and that is grounded in environmentally protective requirements” (Ross and Associates 2000: ii). The participants have succeeded in developing a trading framework within these parameters, but the trading program has yet to be implemented due to the delay of the Snake River/Hell’s Canyon TMDL and subsequently the Lower Boise River TMDL.
20. Program obstacles
The delay associated with TMDL approval has been the most significant obstacle to trading. The TMDL is needed to establish phosphorus limits in the NPDES permits. The project team also faced many challenges during the trading framework development process, from determining the legality of
103
trading under a TMDL to negotiating with all stakeholders to ensure that their needs are met (Environomics 1999).
21. NPS involvement and incentives to engage in trading. The primary incentive for farmers to participate is that they are partially compensated financially for BMPs. Gaining farmers’ broad support, however, could be a challenging process. For example, many farmers were concerned about losing their water rights and making themselves more vulnerable to increased regulation (Environomics 1999). Handing the trade administration over to a nonprofit association was one design choice that may have helped farmers feel more comfortable with the trading program and ensured that regulatory liability remained with the point source in any trade transaction (Claire Schary, personal communication, May 24, 2004).
22. Other
Program information/References Websites: Idaho Department of Environmental Quality: Lower Boise Effluent Trading Demonstration Project. http://www.deq.state.id.us/water/tmdls/lowerboise_effluent/lowerboiseriver_effluent.htm Contacts: Claire Schary, U.S. Environmental Protection Agency Region 10. (206) 553-8514 Susan Burke, Idaho Department of Environmental Quality. (208) 373-0574 Written program information: Environomics (1999). A summary of U.S. effluent trading and offset projects.
A report prepared for Dr. Mahesh Podar, U.S. Environmental Protection Agency, Office of Water. Retrieved May 7, 2004 from http://www.epa.gov/owow/watershed/trading/traenvrn.pdf
Idaho Department of Environmental Quality. (2003). Pollutant trading guidance, November 2003 Draft. Retrieved May 17, 2004 from http://www.deq.state.id.us/water/wastewater/guidance_pollutant_trading_Nov03.pdf
------(2002) 2nd annual status report for the Lower Boise River Effluent Trading Demonstration Project. Retrieved May 12, 2004 from http://www.deq.state.id.us/water/tmdls/lowerboise_effluent/Effluent_AR_June02.pdf
------(2001). 1st annual status report for the Lower Boise River Effluent Trading Demonstration Project. Retrieved May 12, 2004 from http://www.deq.state.id.us/water/tmdls/lowerboise_effluent/Effluent_AR_May01.pdf
104
Idaho Soil Conservation Commission (ISCC) (2002). Best management practice (BMP) list for the Lower Boise River Pollution Trading Program. Retrieved May 13, 2004 from http://www.envtn.org/programs/docs/carter2002bmps.pdf
Lower Boise River TMDL: subbasin assessment, Total Maximum Daily Loads (1998). Retrieved May 12, 2004 from http://www.deq.state.id.us/water/tmdls/LowerBoise/LBR_TMDL.htm#TMDL
Ross and Associates Environmental Consulting, Ltd. (2000). Lower Boise River Effluent Trading Demonstration Project: summary of participant recommendations for a trading framework. A report prepared for the Idaho Department of Environmental Quality. Retrieved May 12, 2004 from http://www.deq.state.id.us/water/tmdls/lowerboise_effluent/lowerboiseriver_effluent.htm
Schary, Claire and Fisher-Vanden, Karen (2004). Applying the Acid Raid Program’s cap and trade approach to water quality trading. Working paper.
Reviewed by Claire Schary, US EPA Region 10.
105
Illinois Pretreatment Trading Program (IL) A. Program Background
1. Program description In 1995, the Illinois Environmental Protection Agency (IEPA) investigated five water quality trading options and determined that pretreatment trading had the “greatest potential” (Park 1996). Through an amendment to the Illinois Environmental Protection Act in 1998, the General Assembly mandated IEPA to design a pretreatment market system that would give POTWs and their industrial permittees the greatest flexibility in achieving cost-effective pollution reductions. The design team evaluated four operational pretreatment programs and found that federal categorical limits were often more stringent than local limits, making trading feasible primarily at the categorical level. However, the US EPA does not allow trading of the categorical pretreatment limits that mandate technology-based standards for industrial sectors (EPA 2003). Further development of a pretreatment trading program was not pursued, and no plans exist to revive the trading initiative in the immediate future due to a lack of interest from POTWs and industrial permittees and also staff and resource limitations within the IEPA (Toby Frevert, Personal Communication, May 14, 2004).
2. Program motivation Minimization of compliance costs while meeting pretreatment regulatory requirements at the federal, state, and local levels was the motivation behind the establishment of a pretreatment market system. The General Assembly wanted to employ a market-based approach for pollution reductions that would encourage innovative and cost-effective solutions while achieving environmental goals associated with water quality, sludge quality and protection of the treatment system (State of Illinois 1998).
3. Pollutant being traded
Multiple (within indirect discharges)
4. Size of program Implementation of a pretreatment market system would be approved by IEPA for any POTW service area in Illinois meeting the following requirements: the POTW operates a local pretreatment program in accordance with State and federal regulations and has incorporated a market system or trading rule into that program; the POTW is not, at the time of application, in violation of NPDES requirements; and the POTW receives indirect discharges from industries subject to federal categorical or local pretreatment limits (Illinois
106
Environmental Protection Act, Section 13.4(d)). At the time of the design of the program, there were 45 POTWs with delegated pretreatment programs in Illinois (Environomics 1999). Potential trading parties: Indirect dischargers within POTW service areas in Illinois
5. Stakeholders/participants • Industrial Dischargers - subject to federal categorical and local
pretreatment limits • POTWs – responsible for implementing local pretreatment programs • Illinois Environmental Protection Agency (IEPA) – responsible for
conducting water quality trading feasibility studies, designing pretreatment market system and approving implementation; Pretreatment Market System design team represented municipal, industrial and public interests
• United States EPA – active participant in the development of a pretreatment trading rule for the State of Illinois and prohibitor of trading federal categorical pretreatment limits implemented through technology standards
6. Regulatory drivers
Section 13.4 of the Illinois Environmental Protection Act mandates the development of a pretreatment trading program by IEPA. Development of the proposed trading rule was stymied by EPA’s Effluent Guidelines & Limitations, Parts 405-471, which designate technology-based categorical limits and also EPA’s water quality trading policy.
B. Trade Structure 7. Determination of credit
N/A
8. Trading ratios and other mechanisms to deal with uncertainty N/A
9. Liability/penalties for noncompliance N/A
10. Approval process If a pretreatment trading program had been designed, within 120 days of receiving notification of a POTW’s intent to implement a pretreatment trading
107
rule, IEPA would provide approval based on the POTW’s ability to meet the following requirements: the POTW operates a local pretreatment program in accordance with State and federal regulations and has incorporated a market system into that program; the POTW is not, at the time of application, in violation of NPDES requirements; and the POTW receives indirect discharges from industries subject to federal categorical or local pretreatment limits (Illinois Environmental Protection Act, Section 13.4(d)).
11. Ex post verification/auditing. N/A
12. Mechanisms for trade identification and communication (education and
outreach, third party facilitation, embedded ties) N/A
13. Market structure (bilateral, clearinghouse, third party brokers)
N/A
14. Types of trades allowed Point/Point
C. Outcomes
15. Types and volume of trades that have occurred N/A
16. Administrative costs N/A
17. Transaction costs N/A
18. Cost savings One service area estimated a cost savings of $6.9 million dollars if able to trade federal categorical pretreatment limits (Park 1996).
19. Program goals achieved No trading to achieve cost-effective reductions occurred and the pretreatment trading initiative is dormant.
108
20. Program obstacles
US EPA does not allow categorical pretreatment loading allowances to be traded, but rather utilizes technology-based standards developed on an industry-by-industry basis to achieve the environmental goal. Since federal categorical limits were more stringent than local limits, there was no incentive for trading.
21. NPS involvement and incentives to engage in trading. N/A
22. Other Program information/References
Websites: http://cfpub.epa.gov/npdes/pretreatment/pstandards.cfm#categorical Contacts: Toby Frevert; Manager, Division of Water Pollution Control, Bureau of
Water, Illinois EPA. Telephone: 217-782-1654 E-mail:[email protected]
References: Park, James B. 1996. Original Comments on Watershed-Based Trading: State
of Illinois Environmental Protection Agency. Retrieved May 7, 2004 from http://www.epa.gov/OWOW/watershed/tradecom/level3/iepa.html
State of Illinois. Public Acts: 90th General Assembly. Retrieved May 7, 2004 from http://www.legis.state.il.us/legislation/publicacts/pubact90/acts/90-0773.html
Environomics. 1999. A summary of U.S. effluent trading and offset projects. A report prepared for Dr. Mahesh Podar, U.S. Environmental Protection Agency, Office of Water. Retrieved May 7, 2004 from http://www.epa.gov/owow/watershed/trading/traenvrn.pdf
US Environmental Protection Agency, Office of Water. 2003. Water Quality Trading Policy. Retrieved May 13, 2004 from http://www.epa.gov/owow/watershed/trading/finalpolicy2003.pdf
Reviewed by Toby Frevert, Illinois EPA.
109
Piasa Creek Watershed Project (IL) A. Program Background
1. Program description The Piasa Creek Watershed Project is a point/nonpoint trading program developed to reduce the flow of sediments into the Mississippi River. Facilitated by a local, not-for-profit organization, Great Rivers Land Trust (GRLT), and funded by the Illinois-American Water Company (IL-AWC), the Project is designed to generate nonpoint sediment reductions within the Piasa Creek, a tributary of the Mississippi River, over a period of ten years. In exchange for funding the Project, the IL-AWC with the support of the Illinois Environmental Protection Agency (IEPA), was able to obtain an adjusted standard from effluent discharge requirements as granted by the Illinois Pollution Control Board (IPCB). The adjusted standard enabled IL-AWC’s new public water supply treatment facility located in Alton, IL to directly discharge its residual into the Mississippi River rather than install a costly and publicly opposed lagoon, dewatering and landfill management system (Gregory 2003). The terms of the adjusted standard and contractual agreement signed between IL-AWC and GRLT for the Piasa Creek Watershed Project are incorporated into the Alton water treatment facility’s NPDES permit by IEPA. First proposed by GRLT and brought before the IPCB by IL-AWC and IEPA in late 1999 and early 2000, implementation of the Project began in 2001 (IPCB 2000b). In year one of the Project, GRLT updated its 1995 watershed plan, identified potential sediment reduction sites and control measures through a “geomorphic inventory assessment,” and contacted local landowners with the help of county Soil and Water Conservation Districts and USDA service centers (IPCB 2000a, Gregory 2003, Alley Ringhausen, personal communication, May 27, 2004). During years two through five, GRLT has been working and will continue to work with landowners to install sediment control practices (Gregory 2003). In year six, the halfway point of the program, IEPA will review IL-AWC’s adjusted NPDES permit and the Project itself to ensure sediment reductions (IPCB 2000b). Between years six and ten, installation of sediment control structures will continue and by year ten, the Project will have reduced sedimentation within the Piasa Creek watershed by 6600 tons/year in accordance with a 2:1 trading ratio for the Alton facility’s 3300 tons/year direct discharge (Gregory 2003). Projected year-end sediment reductions in 2003 were 2613 tons/year (ibid). Sediment reductions are achieved through such measures as land acquisition, conservation easements, streambank stabilization, and development of silt basins, dry dams, terraces, grassed waterways, filter strips, and grade control structures (Gregory 2003 and Cheng 2001).
110
As outlined by the GRLT at the first hearing before the IPCB, major components of the Piasa Creek Watershed Project include: watershed stewardship, siltation dam construction, monitoring, educational outreach, streambank protection, and land protection through acquisitions and easements (IPCB 1999).
2. Program motivation IL-AWC decided to replace a water supply treatment facility in Alton, IL, that had been filtering Mississippi River water and supplying clean water to customers for over 100 years (Ringhausen n.d). While the old water treatment facility was subject to flooding, it did receive regulatory relief from the IEPA in meeting environmental regulations (Gregory 2003). The regulatory relief included a Site-Specific Exemption that allowed for direct discharge and a nonstandard NPDES permit that exempted the discharge from total suspended solids (TSS) and iron effluent standards (Gregory 2003, IPCB 2000b, Kieser 2003). IEPA and a site specific impact study performed by ENSR environmental engineers determined a sediment lagoon, dewatering equipment and off-site landfilling would be necessary for the management of residuals at the new facility in accordance with Illinois technology-based effluent standards for suspended solids (Gregory 2003; Toby Frevert, personal communication, May 21, 2004). Other treatment alternatives included farmland application, discharge to the Alton POTW, and permanent storage in monofills (IPCB 2000b). While IL-AWC found the storage lagoon and landfill system to be “technologically feasible,” it did not consider the treatment “economically reasonable” (IPCB 2000b). However, the IEPA would not support a variance allowing for direct discharge since IL-AWC had full knowledge of federal and State effluent and water quality standards during construction of the facility (IPCB 2000b). The lagoon system required a $7.4 million capital investment and would involve $0.42 million in annual operation and maintenance expenses (Gregory 2003). The hauling of dewatered solids from the storage lagoon to the landfill would also increase truck traffic along a national Scenic Byway, a fact that generated strong local opposition for both aesthetic and safety reasons (Gregory 2003). The Great Rivers Land Trust, the organization responsible for the Scenic Byway designation, proposed the Piasa Creek Watershed Project to IL-AWC and IEPA as an alternative to the lagoon and landfill requirements (IPCB 1999, 2000a). The Project would generate greater environmental benefits within the watershed via a 2:1 trading ratio for upstream nonpoint source reductions as compared to the direct discharge of the water treatment facility (IPCB 2000b).
111
GRLT supported the Project because it would help fund its watershed plan, allowing for larger scale demonstration projects, and target the real problem of sedimentation in the Mississippi River (nonpoint source pollution) (IPCB 1999). IL-AWC approved the proposal because the Project would be a cost-effective means of meeting environmental regulations (requiring funds of $4.15 million over a period of ten years) and lessen any rate impacts on IL-AWC customers (IPCB 1999, Gregory 2003). Local groups supported the lower rate impacts and avoidance of any nuisance associated with a lagoon and landfill system (IPCB 1999, Gregory 2003). Although first opposed to the proposal, IEPA determined the Project would achieve greater environmental benefits than on-site treatment by the IL-AWC facility and serve as a model for future trading initiatives managing point and nonpoint source reductions together (IPCB 1999, 2000b).
3. Pollutant being traded
Sediment
4. Size of program Located in parts of Jersey, Macoupin and Madison counties, the Piasa Creek watershed drains over 78,000 acres (Ringhausen n.d.). The 78,000 acres includes 44,705 acres of cropland, 15,029 acres of woodland, 13,930 acres of grassland, and 2,496 acres of urban development (www.greatriverslandtrust.com). Most of the land in the Piasa Creek watershed is privately-owned (IPCB 2000a). The Piasa Creek is the last tributary of the Mississippi River before convergence with the Missouri River (IPCB 1999). In 2000, the Piasa Creek was described as having a “foul odor” and being “loaded with sediment” predominantly as a result of urban development and wetland loss (IPCB 2000b). The new 16.0 million gallons per day (mgd) Alton public water supply treatment facility is located approximately five miles downstream from the Piasa Creek/Mississippi River confluence (ETN n.d., Ringhausen n.d.) The residuals of the new facility would be almost identical in composition to the previous facility’s discharge and have little economic or environmental damage downstream (IPCB 2000b). The new facility’s discharge of total suspended solids is 91% silt and 9% coagulants (IPCB 2000b). Potential trading parties: Illinois-American Water Company’s public drinking water supply treatment facility in Alton, IL and nonpoint sources of sediments in the Piasa Creek Watershed, primarily agricultural lands
5. Stakeholders/participants
112
• Illinois-American Water Company (IL-AWC) – applied for adjusted standard that would allow new public water supply treatment facility to directly discharge purification residuals into the Mississippi River, funds Piasa Creek Watershed Project in exchange for adjusted standard
• Great Rivers Land Trust (GRLT) – formed by private citizens in 1992; created watershed plan in 1995; proposed Piasa Creek Watershed Project to IL-AWC and IEPA in 1999; sought technical and cooperative assistance from USDA, IEPA, IDNR, US Army Corps of Engineers, and County soil and water districts regarding project development; updated watershed plan in 2001; facilitates nonpoint sediment reductions; negotiates land acquisitions and easements; runs educational outreach programs encouraging local participation; administers Project; and monitors reductions
• Illinois Environmental Protection Agency (IEPA) – supported Piasa Creek Watershed Project and filed joint motion with IL-AWC for adjusted standard, writes and issues NPDES discharge permit, monitors reductions, enforces terms of the adjusted standard and contractual agreement, and reviews Project’s effectiveness
• Illinois Pollution Control Board (IPCB) – writes environmental laws for Illinois, granted adjusted standard for IL-AWC facility
• Illinois Department of Natural Resources (IDNR) – worked with IL-AWC, GRLT, and IEPA on offset Project agreement
• Alton Lake Heritage Parkway Commission – created by Illinois General Assembly, recommended formation of Great Rivers Land Trust, opposed lagoon and landfill management system, testified before the IPCB
• River Bend Growth Association – testified before IPCB in opposition to lagoon and landfill management system because of the increased truck traffic and expense to taxpayers
• City of Alton – opposed lagoon construction and off-site landfilling for safety and aesthetic reasons
• IL-AWC’s customers – felt expense of residual management system in water rates
• Landowners in the Piasa Creek Watershed – work with GRLT to achieve nonpoint sediment reductions
• County Soil and Water Conservation Districts – help identify landowners for participation in the program and estimate sediment reductions
6. Regulatory drivers
In late 1999 and early 2000, counsel for the Illinois-American Water Company (IL-AWC) and Illinois Environmental Protection Agency (IEPA) introduced before the Illinois Pollution Control Board (IPCB), the Piasa Creek Watershed Project proposal which would enable the IL-AWC to receive an Adjusted Standard, AS 99-6, from 35 Illinois Administrative Code sections 304.124, 304.106, and 302.203. Section 304.106 “bans offensive discharges,” such that no effluent contains “settleable solids, floating debris, visible oil, grease, scum, or sludge solids” and color, odor, and turbidity are below
113
“obvious levels” (IPCB 2000b, IPCB 2002). Section 304.124 delineates effluent standard concentrations (IPCB 2002). Section 302.203 is the water quality standard that bans “offensive conditions” (IPCB 2000b, IPCB 2002). IPCB found the adjusted standard request to be consistent with federal law in that the designated use status of the Mississippi River would not change as a result of a direct discharge from the new facility (IPCB 2000b). The approved adjusted standard and contractual agreement between GRLT and IL-AWC were written into the terms of the Alton facility’s NPDES permit by IEPA (IPCB 2000b). The adjusted standard expires on September 7, 2007, but IL-AWC may file for an extension (IPCB 2000b).
B. Trade Structure 7. Determination of credit
Streambank stabilization calculations performed quarterly (determination of erosion rates) and estimated sediment accumulations taken for silt basins (IPCB 2000a). Physical measurements are also taken at maintenance time (Alley Ringhausen, personal communication, May 27, 2004). GRLT employs the universal soil loss equation and USDA standards to estimate soil savings for different sediment control methods (Alley Ringhausen, personal communication, May 27, 2004). Other nonpoint sediment control projects performed by the Illinois State Water Survey and IEPA’s Bureau of Water, Watershed Planning Section under Section 319 of the Clean Water Act were used to illustrate the likelihood of the Piasa Creek Watershed Project meeting its goal of 2:1 sediment reductions by the end of the year ten (IPCB 2000b). Credit is given for cost-share projects that receive additional funding from GRLT (Alley Ringhausen, personal communication, May 27, 2004). Credit is not given for farm management plans such as no-till or minimal-till cropping systems that were put into place without Project aid (Alley Ringhausen, personal communication, May 27, 2004). Sediment reductions are intended to be sustainable (Alley Ringhausen, personal communication, May 27, 2004). Resource inventory worksheets are kept for every project (Gregory 2003).
8. Trading ratios and other mechanisms to deal with uncertainty A 2:1 trading ratio must be in place by year ten of the Project. IEPA used federal guidance for TMDLs in determining the trading ratio even though TMDLs did not apply in this specific case (IPCB 2000a). IEPA showed conservatism in the trading ratio determination as TMDL guidance requires only a 1.5:1 ratio (IPCB 2000a).
9. Liability/penalties for noncompliance
114
Landowners are responsible for the maintenance of sediment control structures built on their land (Alley Ringhausen, personal communication, May 27, 2004).
If, at the halfway review point, the IEPA determines the program is not effective in achieving sediment reductions, the contract will be terminated (IPCB 2000b). Although, this does not seem likely given the progress of the Project (Alley Ringhausen, personal communication, May 27, 2004). Monitoring and reporting requirements are incorporated into the NPDES permit in order to enable IEPA to monitor sediment offsets (IPCB 2000b). If, for some reason, GRLT disbands before the Project is completed, acquired lands, easements, and responsibility for the Project will be accepted by the Illinois Nature Conservancy or the Nature Institute (IPCB 2000b).
10. Approval process Approval for the contractual agreement between GRLT and IL-AWC came from the IPCB and IEPA. The process took almost two years from the time the motion for an adjusted standard was first filed in March 1999 to implementation of the program in 2001 (IPCB 2000b). Due to a high level of participation by landowners, GRLT ranks projects to receive funding based on a sliding scale of total tons soil saved and cost (cost/ton soil saved) (Alley Ringhausen, personal communication, May 27, 2004).
11. Ex post verification/auditing. GRLT is responsible for monitoring and provides quarterly and annual reports to IEPA and IL-AWC (Alley Ringhausen, personal communication, May 27, 2004). During the first year of the Project, GRLT provided monthly, quarterly, and annual reports (Alley Ringhausen, personal communication, May 27, 2004). Maintenance of sediment control structures is performed by landowners (Alley Ringhausen, personal communication, May 27, 2004).
12. Mechanisms for trade identification and communication (education and outreach, third party facilitation, embedded ties) GRLT organizes educational outreach programs, such as the Piasa Creek Watershed Education Team, to involve local landowners and community members in the implementation of sedimentation control measures (www.greatriverslandtrust.com).
115
GRLT facilitates identification of priority nonpoint source reduction sites with the help of county Soil and Water Conservation Districts and USDA service centers (Alley Ringhausen, personal communication, May 27, 2004). Based on the success of demonstration projects, landowners now come to GRLT wanting to participate in the Project (see also NPS incentives) (Alley Ringhausen, personal communication, May 27, 2004). GRLT cooperates with other initiatives such as the Illinois Buffer Partnership program managed by Trees Forever to achieve sediment loadings reductions (www.greatriverslandtrust.com/Trees%20Forever.htm). GRLT has also worked on projects with the Illinois Department of Transportation, the Illinois Department of Natural Resources, the Illinois Board of Education, and the City of Alton (Alley Ringhausen, personal communication, May 27, 2004).
13. Market structure (bilateral, clearinghouse, third party brokers)
The Great Rivers Land Trust serves as a third party broker responsible for generating sediment reductions at nonpoint sources in order to fulfill the contractual agreement signed between Illinois-American Water Company and the Great Rivers Land Trust, the terms of which are incorporated into the Alton facility’s NPDES permit and written into Illinois law.
14. Types of trades allowed Point/Nonpoint
C. Outcomes
15. Types and volume of trades that have occurred An isolated trade agreement between IL-AWC and GRLT has occurred. Nonpoint source sediment reductions generated by the Project are mapped with accompanying meta-data that give project specifics such as the total number of acres affected, tons soil saved, percentage cost share funds, and percentage Project funds (Alley Ringhausen, personal communication, May 27, 2004). In 2004, year four of Project implementation, sediment reductions had already exceeded the halfway point (Alley Ringhausen, personal communication, May 27, 2004).
16. Administrative costs Administrative costs account for 15% of individual project costs (Alley Ringhausen, personal communication, May 27, 2004).
17. Transaction costs N/A. Landowners are coming to GRLT with requests for project funding (Alley Ringhausen, personal communication, May 27, 2004).
116
18. Cost savings
IL-AWC avoided capital, operation and maintenance costs associated with lagoon and landfill system and there was no waste of landfill space (Difference between capital investment of lagoon and Piasa Creek Watershed Project funding: app $3.25 million) GRLT is also able to supplement IL-AWC funding with in-kind services and federal matching grants (Cheng 2001, Alley Ringhausen, personal communication, May 27, 2004).
19. Program goals achieved The goal of the Piasa Creek Watershed Project is to significantly reduce or mitigate nonpoint sources of sediments entering the Mississippi River from Piasa Creek (IPCB 1999). Projected year-end sediment reductions in 2003 were 2613 tons/year and the Project is ahead of schedule with sediment reductions already exceeding the halfway point (Gregory 2003, Alley Ringhausen, personal communication, May 27, 2004). The Piasa Creek Watershed Project has renewed the Piasa Creek Watershed plan, decreased rate impacts for IL-AWC customers as a result of costs savings associated with avoidance of the lagoon and landfill system, prevented increased truck traffic along a national Scenic Byway, and saved landfill space (Gregory 2003, Alley Ringhausen, personal communication, May 27, 2004). The Project serves as a precedent for other point/nonpoint trading programs in Illinois (Gregory 2003, Alley Ringhausen, personal communication, May 27, 2004, Cheng 2001).
20. Program obstacles At the start of the Project, landowners were hesitant and wary (Alley Ringhausen, personal communication, May 27, 2004). However, GRLT employed county Soil and Water Conservation Districts, the NRCS, USDA service centers, and local individuals with agricultural knowledge to help explain the Project, facilitate agricultural interests and encourage participation (Alley Ringhausen, personal communication, May 27, 2004). As a result of this initial outreach and the success of demonstration projects, the level of landowner participation is high and there is a waiting list for Project funding (Alley Ringhausen, personal communication, May 27, 2004).
21. NPS involvement and incentives to engage in trading. Nonpoint source reductions are the backbone of the Piasa Creek Watershed Project. As indicated by Richard Mollahan of the Watershed Planning Section in the IEPA’s Bureau of Water, the Project involved “a great deal of
117
landowner and organization cooperation” even before the proposal was approved by IPCB (IPCB 2000b). All NPS pollution control measures in Illinois are voluntary (Cheng 2001). However, financial incentives encourage farmers and landowners to participate in the Project and implement conservation practices; “loss of acreage [as caused by erosion] means loss of income” (Alley Ringhausen, personal communication, May 27, 2004). Due to the success of demonstration projects, voluntary landowner participation is high, and GRLT must rank proposed projects due to limited resources (Alley Ringhausen, personal communication, May 27, 2004).
22. Other Program information/References
Websites: Great Rivers Land Trust (home) http://www.greatriverslandtrust.com
(Piasa Creek Watershed) http://www.greatriverslandtrust.com/pcwp.htm (Illinois Buffer Partnership)
http://www.greatriverslandtrust.com/Trees%20Forever.htm Contacts: Alley Ringhausen, Director Piasa Creek Watershed Project, Great Rivers
Land Trust. Telephone: (618) 467-2265. E-mail:[email protected] References: Cheng, Ching-Wen, Daniel Gaebel, Janelle M. St. Pierre, Anna J. Willow and
Michael R. Moore. 2001. A Resting Place for the Ducks: A Multidisciplinary Analysis of Floodplain Restoration of the Hennepin Levee District, Illinois. Ecosystem Management Initiative. August 2001. Sections 3.4.2 & 5. Retrieved on May 19, 2004, from http://www.snre.umich.edu/ecomgt/pubs/hennepin.htm
Environmental Trading Network. n.d. Great Lakes Protection Fund – Final Report: Market-Based Approach to Ecosystem Improvement, Grant #609. N.D. Attachment A. Retrieved on May 19, 2004, from http://www.envtn.org/docs/finalGLPFreport.pdf
Great Rivers Land Trust. 2003. “Students Assist GRLT in Stream Buffer Project,” Great Rivers Views, Volume IX, Summer 2003, Number 1. Retrieved on May 17, 2004, from http://www.greatriverslandtrust.com/summer_2003.htm
Great Rivers Land Trust. 2001. “Piasa Creek Watershed Project,” in Great Rivers Views, Volume VII, Spring 2001, Number 1. Retrieved on May 17, 2004, from http://www.greatriverslandtrust.com/Spring%202001.htm
Gregory, Brent. 2003. Water Quality Trading – Point Source for Non-point Source Sediments: Piasa Creek Watershed Project. Adapted from K.A. Thomas. Illinois-American Water Company.
Illinois Pollution Control Board. 1999. Proceedings In the Matter Of: Proposed Adjusted Standard Applicable to Illinois-American Water
118
Company’s Alton Public Water Supply Replacement Facility Discharge to the Mississippi River. Proceedings held on November 30, 1999, at Alton City Hall, Alton, Illinois, before the Honorable Karen Kavanagh Mack, Hearing Officer. Keefe Reporting Company. Reported by: Darlene M. Niemeyer. Retrieved on May, 17, 2004, from http://www.ipcb.state.il.us/Archive/dscgi/ds.py/Get/File-13032/99-006tr113099.PDF
Illinois Pollution Control Board. 2000a. Proceedings In the Matter Of: Proposed Adjusted Standard Applicable to Illinois-American Water Company’s Alton Public Water Supply Replacement Facility Discharge to the Mississippi River. Proceedings held on January 6, 2000 at Alton City Hall, Alton, Illinois, before the Honorable John Knittle, Hearing Officer. Keefe Reporting Company. Reported by: Darlene M. Niemeyer. Retrieved on May, 17, 2004, from http://www.ipcb.state.il.us/Archive/dscgi/ds.py/Get/File-13030/99-006tr010600.PDF
Illinois Pollution Control Board. 2000b. Proceedings In the Matter of: Petition of Illinois American Water Company’s Alton Public Water Supply Replacement Facility Discharge to the Mississippi River for an Adjusted Standard from Ill. Adm., Code 302.203, 304.106, and 304.124, Opinion and Order of the Board (by N.J. Melas). Illinois Pollution Control Board: September 7, 2000. Retrieved on May 24, 2004, from http://www.ipcb.state.il.us/Archive/dscgi/ds.py/Get/File-2497/99-006s090700.pdf
Illinois Pollution Control Board. 2002. Environmental Regulations. http://www.ipcb.state.il.us/SLR/IPCBandIEPAEnvironmentalRegulations-Title35.asp
Kieser, Mark S. Market Approaches for Environmental Improvements: Opportunities in the Great Lakes Region and Beyond. September 17, 2003. Retrieved on May 18, 2004, from http://www.potomacfriends.org/programs/env_markets/EM_Kieser.pdf
Ringhausen, Alley. “Piasa Creek Watershed Project to have benefits for all,” Illinois Business Journal. N.D. Retrieved on May 19, 2004, from http://www.greatriverslandtrust.com/PCWP%20Article%20IL%20Buisness%20Journal.jpg
119
Acton WWTP (MA) A. Program Background
1. Program description The Town of Acton explored water quality trading to offset a new publicly owned treatment works (POTW). Acton’s 20,000 residents historically relied on individual septic systems, many of which were failing. Title V of the Massachusetts Environmental Code brought further pressure to develop a municipal sewer system, and the Town finally obtained funding in the late 1990s (Woodward and Curran, n.d.). Due to the degraded water quality of the Assabet River, however, the U.S. Environmental Protection Agency (EPA) denied the Town’s proposal for a discharge permit. The EPA entertained the idea of water quality trading, but it strongly advocated a groundwater infiltration facility rather than a trading program in light of the degraded river conditions (David Pincumbe, personal communication July 3, 2003). Acton ultimately adopted this latter strategy and built a POTW that discharges into a groundwater infiltration basin rather than directly into the river. Since the infiltration system does not appear to cause phosphorus loading of the river, there is no need for nonpoint source offsets.
2. Program motivation As the largest town in the state without municipal wastewater treatment, Acton insisted that it needed a POTW to address its increasing problems of waste disposal and failing septic systems (Cole 1998). The Assabet River, part of the Sudbury-Assabet-Concord (SuAsCo) basin, already suffered from high phosphorus loading from urban runoff, failing septic systems, and four upstream POTWs. At a minimum, the EPA wanted a TMDL to determine loading before it could consider an additional POTW, but improving water quality really required reducing all phosphorus sources as much as possible (David Pincumbe, personal communication, July 3, 2003). At low flow times the water table was pulled down so low that many towns faced water shortages and nearly all of the water in the Assabet’s main stem came from wastewater discharge (David Pincumbe, personal communication, July 3, 2003). Therefore, the EPA’s focus on groundwater infiltration facilities combined river protection and groundwater recharge.
3. Pollutant being traded
Phosphorus
4. Size of program
120
The Sudbury-Assabet-Concord (SuAsCo) watershed encompasses 377 square miles and is experiencing rapid development (SuAsCo Watershed Council website). Several nonpoint source offsets were considered as offsets for the Acton POTW, including agricultural BMPs, road sanding, and landscaping (Environomics 1999). Potential trading participants: Town of Acton, MA; farmers
5. Stakeholders/participants • Town of Acton, MA – initiated discussions about trading for proposed
POTW • U.S. Environmental Protection Agency, Region I – regulatory agency,
denied Acton’s initial request for surface water discharge permit, steered Acton towards groundwater infiltration system
• Massachusetts Department of Environmental Protection • SuAsCo Watershed Community Council – local environmental nonprofit
6. Regulatory drivers At the time that Acton was exploring trading, a TMDL and a six-town Comprehensive Wastewater Management Plan (CWMP) were being written for the SuAsCo basin. The CWMP proposed a phosphorus limit for 0.75 mg/L, possibly eventually decreasing to 0.2 or 0.1 mg/L (Nancy Bryant, personal communication, April 4, 2002). The Acton POTW may have faced a 0.2 mg/L limit rather than 0.1 mg/L because it planned to offset all phosphorus discharge to surface water (Environomics 1999). The TMDL for the Assabet River was finally completed in 2004 (David Pincumbe, personal communication, June 1, 2004).
B. Trade Structure 7. Determination of credit
Not determined. Phosphorus credits could not be generated by the reductions resulting from replacing failing septic systems with the municipal sewer system (Environomics 1999).
8. Trading ratios and other mechanisms to deal with uncertainty A trading ratio of 3:1 was proposed (Environomics 1999.)
9. Liability/penalties for noncompliance Not determined.
10. Approval process
121
Not determined.
11. Ex post verification/auditing. Not determined.
12. Mechanisms for trade identification and communication (education and
outreach, third party facilitation, embedded ties) Not fully determined, but possibly third party facilitation. The Town of Acton used GIS to identify phosphorus sources with the greatest water quality impact. During a river clean-up effort organized by the Organization for the Assabet, volunteers surveyed 25 miles of shoreline and identified potential areas for nonpoint source phosphorus controls (Environomics 1999).
13. Market structure (bilateral, clearinghouse, third party brokers)
Not determined.
14. Types of trades allowed Point/nonpoint offsets were considered.
C. Outcomes
15. Types and volume of trades that have occurred None.
16. Administrative costs Not determined
17. Transaction costs Not determined.
18. Cost savings The proposed scheme to build a $7 million surface-water discharge POTW, offset by nonpoint source phosphorus reductions, was estimated to save Acton residents $2.25 million annually. Although the Town would have spent $100,000-200,000 annually for nonpoint source offsets, the POTW would enable residents to avoid approximately 150 septic tank reconstructions each year, with an average cost of $15,000 each. The operating costs for the POTW would be financed through user fees (Environomics 1999).
122
19. Program goals achieved No trading program was implemented. The Town of Acton was able to build a groundwater infiltration POTW that did not impact surface water, obviating the need for water quality trading.
20. Program obstacles The degraded condition of the SuAsCo basin was the primary reason that the EPA steered Acton towards an infiltration system rather than water quality trading, but the project faced additional obstacles. Acton had difficulty identifying sufficient numbers of nonpoint sources to offset the POTW, partly phosphorus credits would not be granted for connecting failing septic systems to the municipal sewer system. Environomics (1999) notes that phosphorus reductions resulting from the sewering could not be traded because of a debate over “additionality” (“additionality” means that credits are only tradable if the reductions would not be achieved in the absence of trading; in this case, Environomics suggests that sewering would not be considered additional because it would have happened as a matter of course). However, the bigger issue was that the many of the septic systems drained to the Concord River, which is downstream of the Assabet River. Phosphorus reductions achieved by sewering those properties would not have reduced phosphorus loading to the Assabet (David Pincumbe, personal communication, June 1, 2004).
21. NPS involvement and incentives to engage in trading. Not determined.
22. Other Program information/References
Websites: SuAsCo Watershed Community Council, http://www.suasco.org Contacts: Nancy Bryant, SuAsCo Watershed Community Council. (978) 461-0735 David Pincumbe, Water Quality Management Section, U.S. Environmental
Protection Agency, Region I. (617) 565-3544 Written Program Information: Cole, Caroline Louise (1998). For Acton, sewer plan hinges on clean river:
Assabet seen as key for treatment plant. Boston Globe, Northwest Weekly, August 9, 1998, p. 1. Retrieved from Lexis-Nexus Academic Universe.
Environomics (1999). A summary of U.S. effluent trading and offset projects. A report prepared for Dr. Mahesh Podar, U.S. Environmental Protection
123
Agency, Office of Water. Retrieved May 7, 2004 from http://www.epa.gov/owow/watershed/trading/traenvrn.pdf
Griesser, J. Elliot (2004). Offset projects: success and suitability in addressing water quality impairment. Unpublished master’s thesis, Bard College, Annandale on Hudson, NY.
Woodward and Curran, Inc. (n.d.). Sewer System Development and Treatment Facility Design: Acton, Massachusetts. Retrieved March 31, 2004 from http://www.woodardcurran.com/aoe_RelProjArticle/ProjectID/32/SA_ID/218
Reviewed by David Pincumbe, U.S. Environmental Protection Agency, Region I.
124

Charles River Flow-Trading Program (MA) A. Program Background
1. Program description
The Charles River Watershed Association (CRWA) is establishing a water flow trading program that will re-engineer how municipalities manage rainwater. CRWA observed that municipal stormwater systems, which are designed to get rid of water quickly, have disrupted the water cycle in a way that increases total pollutant loading and decreases river flow. Impervious surfaces have created contaminated stormwater runoff (e.g. by oil and grease in parking lots or agricultural chemicals in lawns and golf courses) that is subsequently collected and treated by WWTPs. The rainwater is no longer available to percolate through the soil and recharge the groundwater, and as a result, aquifers are being depleted and the base flow of the river is reduced. CRWA’s theory is that recharging clean water to the ground is a less expensive and more environmentally beneficial alternative to collecting and treating contaminated runoff. In addition to reducing total pollutant loading to the river, it will boost river flows. WWTPs benefit because fewer pollutants will be in their inflow, thereby reducing net treatment (EPA 2003). Additionally, greater river baseflow resulting from enhanced groundwater storage dilutes the effects of point source dischargers. A 1994 study found that combined sewer overflows (CSOs) and low river flows were the primary sources of impairment in the Charles River. By 1996, CRWA started realizing that the larger problem was the way in which municipalities manage rainwater. CRWA received a grant from the U.S. Environmental Protection Agency (EPA) in 1997 to investigate watershed permitting, and in 1998 began flow modeling for eight towns with help from the U.S. Geological Survey (USGS) (Robert Zimmerman, personal communication, May 28, 2004; ETN 2003). CRWA also invented SmartStorm®, a rainwater remediation system that collects water in cisterns for watering lawns and washing cars, using an integral high-tech drywall system to infiltrate excess roof runoff back into the ground year round. The average home sheds 50,000-60,000 gallons of water off of the roof each year, and collecting this water for home use reduces groundwater withdrawal while the excess enhances groundwater storage(EPA 2003). Now supported by a 2003 EPA grant for water quality trading, CRWA and the Massachusetts Department of Environmental Protection (DEP) are working to develop a viable flow-trading program. CRWA has already negotiated flow and rainwater remediation deals with Intel and American National Power. These demonstration projects will inform the development of broader flow management rules and a water bank. Payments made to the water bank will be made on a “water in/water out” basis at the subbasin level: a discharger will calculate how much water is “lost” by its facility through consumptive use or infiltration/inflow (see “Program motivation”), and payments into the
125
water bank will offset this loss at a 2:1 ratio by funding rainwater collection and recharge systems, such as SmartStorm®. CRWA plans to test the water bank model by 2005 (Robert Zimmerman, personal communication, May 28, 2004).
2. Program motivation
The base flow in the Charles River is so low that 90% of the summer river flow is treated wastewater (ETN 2003). CRWA recognized that water quality would only be improved by an expansive and holistic approach to the hydrologic system, not simply by improving treatment at the WWTP. Trading was attractive because it provides economic incentives and funding mechanisms for improving stormwater management systems throughout the watershed (Robert Zimmerman, personal communication, May 28, 2004).
3. Pollutant being traded Water flows
4. Size of program The Charles River is 80 miles long and drains 308 square miles. Purchasers of water flow credits within the watershed will likely be expanding WWTPs, municipal stormwater systems, residential and industrial developments, and water suppliers (Kathy Baskin, personal communication, May 24, 2004). Towns can generate credits by helping residential homeowners install SmartStorm® systems or by reducing groundwater withdrawal (Robert Zimmerman, personal communication, May 28, 2004). Potential trading parties: WWTPs, stormwater systems, residential and industrial developments, water suppliers, municipalities
5. Stakeholders/participants
• Charles River Watershed Association (CRWA): partner in the development of the flow-trading program
• Massachusetts Department of Environmental Protection (DEP): partner in the development of the flow-trading program
• U.S. Environmental Protection Agency (EPA): provided grant money, issues NPDES permits in Massachusetts
• U.S. Geological Survey (USGS): conducted flow monitoring • Municipalities: negotiate with landowners to install stormwater collection
systems; potential purchasers of credits • Industrial dischargers, e.g. Intel and American National Power: purchasers
of credits in demonstration projects
126

6. Regulatory drivers CRWA is motivated by environmental interests rather than cost-savings, and to some extent the inadequacy of the current regulatory context has driven its interest in flow-trading. CRWA’s theory is that flow-trading will improve water quality in a way that traditional end-of-pipe limits or even TMDLs cannot achieve. Ultimately, CRWA hopes to link groundwater recharge, including impervious surfaces and stormwater runoff, to permits for water withdrawal, development, and wastewater discharge (EPA 2003). TMDLs for phosphorus, nitrogen, bacteria, and dissolved oxygen (DO) are currently being developed for the watershed. Flow-trading is separate from the TMDL process, but the TMDL can be used to verify how flow-trading reduces pollutant loading and improves river flow and habitat. If the flow-trading is successful, then it could be linked or used as an alternative to TMDLs in the future. (Robert Zimmerman, personal communication, May 28, 2004). In 2001, the Massachusetts Bureau of Resource Protection enacted an Interim Policy on Infiltration and Inflow in recognition of how wastewater and stormwater collection systems can impede groundwater recharge. Infiltration and inflow refers to water that enters the sewer system through defects or openings, such as yard drains, sump pumps, manhole covers, roof gutters, or indirect stormwater connections (BRP 2001). Infiltration/inflow can account for a significant amount of water; the infiltration/inflow associated with the Deer Island WWTP is greater than the entire river flow of the Charles River (Robert Zimmerman, personal communication, May 28, 2004). The Interim policy requires all NPDES permittees to develop and implement a plan to control infiltration/inflow, and the overall strategy is meant to prioritize areas for aquifer recharge (BRP 2001). This infiltration/inflow issue may be used to steer dischargers towards flow trading.
B. Trade Structure 7. Determination of credit
The baselines for purchasing credits are set by the water in-water out equation. This balance is modeled fairly readily. It is not fully determined how the baseline will be set for rainwater remediation projects that generate credits (Robert Zimmerman, personal communication, May 28, 2004).
8. Trading ratios and other mechanisms to deal with uncertainty The trading ratio will probably be 2:1. The American National Power trade used nearly a 2.5:1 trading ratio (Robert Zimmerman, personal communication, May 28, 2004).
9. Liability/penalties for noncompliance
127
Not determined.
10. Approval process A third party, most likely a non-profit organization established for the purpose, will oversee the release of funds for rain water remediation and other credit-generating projects. In the case of the American National Power (ANP) project, the money for flow offsets was banked with the Crossroads Community Foundation. Individual rainwater remediation projects were approved by a five-person committee with representatives from two towns, CRWA, Crossroads, and ANP (Robert Zimmerman, personal communication, May 28, 2004).
11. Ex post verification/auditing. The SmartStorm systems are maintained by the municipalities and CRWA (Robert Zimmerman, personal communication, May 28, 2004).
12. Mechanisms for trade identification and communication (education and outreach, third party facilitation, embedded ties)
Education and Outreach to municipalities, Embedded Ties to individual homeowners. In the case of the ANP project, rainwater remediation projects were planned on a town basis. The town itself negotiated with homeowners to install SmartStorm systems (Robert Zimmerman, personal communication, May 28, 2004).
13. Market structure (bilateral, clearinghouse, third party brokers) The first couple of trades will be similar to third party brokers, since trades will probably be written directly into dischargers’ permits with direct links to the remediation projects. CRWA plans to set up a clearinghouse or water bank to support flow-trades in the future (Kathy Baskin, personal communication, May 24, 2004).
14. Types of trades allowed These trades are closest to point/nonpoint trades. Point source dischargers will be able to pay into a water bank to fund water flow offsets in exchange for expanding or building a new facility.
C. Outcomes 15. Types and volume of trades that have occurred
CRWA already negotiated deals with Intel and American National Power (ANP). ANP wanted to build two new gas-fired power plants in the upper
128
Charles River with a combined cooling water demand of 7 million gallons per day (gpd). Under pressure from CRWA, ANP switched to air-cooled systems, reduced average daily flow to 80,000 gpd (the flow ranges from 13,000 gpd and to nearly 250,000 gpd during the peak summer months). To offset these flows, ANP has paid $1.3 million to fund water flow projects such as the elimination of infiltration and inflow and rainwater remediation projects (Robert Zimmerman, personal communication, May 28, 2004).
16. Administrative costs Not determined.
17. Transaction costs Not determined.
18. Cost savings Not determined.
19. Program goals achieved The water bank has not yet been established, but the early pilot trades have been very successful (Robert Zimmerman, personal communication, May 28, 2004).
20. Program obstacles The biggest obstacle has been the predilection for following traditional engineering practices. Water flow-trading requires municipalities and dischargers to completely change the way they think about water flows and water quality. (Robert Zimmerman, personal communication, May 28, 2004).
21. NPS involvement and incentives to engage in trading. Individual property owners who have a SmartStorm® system on their property will benefit from having irrigation water at a very low or no cost (Robert Zimmerman, personal communication, May 28, 2004).
22. Other
Program information/References
Websites: U.S. Environmental Protection Agency, Region 1: Charles River. http://www.epa.gov/region1/charles/index.html
129
Charles River Watershed Association (CRWA). http://www.crwa.org Contacts: Robert Zimmerman, Executive Director, Charles River Watershed Association. (781) 788-0007 Kathy Baskin, Technical Director, Charles River Watershed Association. (781) 788-0007 Written Program Information:
Bureau of Resource Protection (2001). Interim Infiltration and Inflow Policy, Policy No. BRP01-1, Effective September 6, 2001. Massachusetts Department of Environmental Protection. Retrieved May 23, 2004 from http://www.mass.gov/dep/brp/wwm/files/iipolicy.doc
Environmental Trading Network (2003). April 30, 2003 Conference Call. Retrieved May 11, 2004 from http://www.envtn.org/calls/april2003call.pdf
Landers, J. (2003). Water quality trading program seeks to restore natural river flows. Civil Engineering, the journal of the American Society of Civil Engineers. 73(4): 22-24.
U.S. Environmental Protection Agency (2003). EPA selects Charles River Watershed Association for innovative water trading project. EPA New England Press Release, February 13, 2003, Release # 03-02-04. Retrieved May 24, 2004 from http://www.epa.gov/region1/pr/2003/feb/030204.html
Reviewed by Robert Zimmerman, Charles River Watershed Association.
130
Edgartown WWTP (MA) A. Program Background
1. Program description
The Edgartown wastewater treatment plant (WWTP) was upgraded in 1996 to meet Class I Ground Water Discharge Standards. The upgrade increased the WWTP’s flow capacity from 500,00 gallons per day (gpd) to 750,000 gpd (average daily flow was 250,000 gpd before the upgrade, but ranged from 55,000 gpd in the winter to over 450,000 gpd in the summer during 2003) (MA DEP 1999; Claire Barker, personal communication, June 2, 2004). At the same time, actual nitrogen discharge was reduced from approximately 3000 or 4000 kg/year to 625 kg/year (Bill Wilcox, personal communication, May 24, 2004). The permit sets a target goal of 2,200 kg/year, which is three times higher than the current discharge. This goal was based on the nitrogen loading tolerance of Edgartown Great Pond and will give the WWTP the capacity to tie in several hundred additional homes (Bill Wilcox, personal communication, May 24, 2004). The Edgartown Wastewater Commission applied for the WWTP’s new permit in December 1997 and was issued the permit in December 1999. During the review of the permit, the Martha’s Vineyard Commission (MVC) completed a report to determine Great Pond’s tolerance for nitrogen loading and describe nutrient management options under three growth scenarios (MVC 1998). The report recommended that Edgartown reduce nonpoint sources of nitrogen loading by sewering an additional 300 residences near Great Pond, which the authors visualized as a subdivision near the WWTP, and installing on-site denitrification systems for approximately 900 homes elsewhere in the watershed (Bill Wilcox, personally communication, May 24, 2004; MA DEP 2003). Additional nitrogen-reducing measures included reducing fertilizer use and purchasing conservation easements from vacant lots in the watershed. All of these nonpoint source projects would be voluntary, and there is no current timetable for their implementation. The WWTP permit itself contains no offset requirements or provisions. Edgartown has not ended up extending sewers to the subdivision near the WWTP, but it has accepted treatment from a golf course and clubhouse, comprising approximately 10,000 gallons per day (gpd). The golf course was not part of the 1998 MVC study, so this load is in addition to those projected in the study. A neighborhood that has discovered nitrogen leaching into their well water is also considering tying into the WWTP (Bill Wilcox, personal communication, May 24, 2004). Nitrogen reductions from the other avenues have similarly seen mixed progress. Interest in denitrification systems has languished, primarily because of the high cost to individual homeowners but also because the Board of Health, which enforces regulations for on site wastewater disposal, remains
131
unconvinced that Great Pond needs that level of protection. Public education about reducing lawn fertilizer, however, has been taken on by a diverse set of organizations, including the Great Pond Foundation and the Edgartown Ponds Advisory Committee. Furthermore, the acquisition of conservation land has far exceeded the 200 acres (under low growth scenarios) recommended by the 1998 MVC report. The individual acquisitions of Town of Edgartown, the Department of Environmental Management, the Martha’s Vineyard Land Bank, and the Nature Conservancy collectively add up to several hundred acres of land with conservation easements, primarily for habitat protection or the preservation of open space (Bill Wilcox, personal communication, May 24, 2004). The Massachusetts DEP portrays this as a point/nonpoint source trade, suggesting that Edgartown received a larger nitrogen load allocation in exchange for reducing nonpoint source nitrogen loading (MA DEP 2003). The original intent of the nonpoint source nitrogen reductions was not, however, to directly offset the WWTP discharge. The nonpoint source projects were recommended as a margin of safety to compensate for any calculation errors in Great Pond’s nitrogen loading capacity (Bill Wilcox, personal communication, May 24, 2004). The 1998 study did not recommend trades as much as it outlined a program to keep within a yearly loading limit of total nitrogen to Edgartown Great Pond. The study assigned projected loads to various sources, but trading was not recommended in the study or pursued as an implementation. The Town will need additional nitrogen reductions if the WWTP approaches capacity. If in any year the load reaches 80% of the 2,200 kg/year target, the Town must develop a plan of specific actions to keep within the target. At present the facility averages 5 mg/L total nitrogen, but the Town would need additional treatment to reduce its nitrogen discharge to the 2.1 mg/L limit needed for 750,000 gpd (Claire Barker, personal communication, June 2, 2004).
2. Program motivation
Edgartown Great Pond is a brackish coastal pond on the island of Martha’s Vineyard. The pond is separated from the Atlantic Ocean by a barrier beach, which is breached for about a week every three months by excavating a trench between the pond and ocean. The breaching maintains pond salinity and brings the pond down to sea level, and since it also increases the rate of groundwater nitrogen discharge, it is important to leave the trench open for long enough to remove sufficient nitrogen from the pond. The pond appears to alternate between excess nitrogen and times of nitrogen deficiency, but on the whole, excess nutrient loading has contributed to algae blooms, oyster kills, and declines in eelgrass beds. Currently, septic systems contribute approximately 30% of the nitrogen loading in great pond, followed by farms at 14%, the WWTP at 8%, and lawns/garden at 3%. Acid rain contributes approximately 45% of the nitrogen loading, but it is not caused locally (MVC
132
1998). Buildout projections predict septic systems will become the primary source of nitrogen. The WWTP upgrade provided the opportunity to think more broadly about nutrient management in the watershed. MVC’s proposal for the nutrient study coincided with a movement among some residents to contest the increased flow of the WWTP. At the same time, the DEP was interested in innovative options for reducing nutrient loads, and the MVC study provided an opportunity to explore some degree of nitrogen offsets for Edgartown (Bill Wilcox, personal communication, May 24, 2004).
3. Pollutant being traded
Nitrogen
4. Size of program The recharge area for Great Pond is approximately 5150 acres, which included 615 residential structures, hundreds of buildable lots, and 2348 acres of conservation land as of 1998 (MVC 1998). There is no plan for actual trades or offsets, but recommendations for nitrogen reduction included sewering 300 homes near the WWTP, installing denitrification systems in 900 new homes elsewhere in the watershed, reducing fertilizer use, and acquiring conservation land (MA DEP 2003). Edgartown has tied a golf course and clubhouse into their WWTP, and fertilizer reduction and conservation easements have been pursued by other organizations. Potential trading parties: Edgartown WWTP; residential property owners
5. Stakeholders/participants
• Martha’s Vineyard Commission (MVC): conducted study of nutrient loading and management options in Great Pond in 1998
• Edgartown Wastewater Commission: permittee for Edgartown WWTP • Massachusetts Department of Environmental Protection (DEP): issues
groundwater discharge permit for Edgartown WWTP; provided grant to MVC for the 1998 nutrient loading and management report
• University of Massachusetts Cooperative Extension: partnered in the MVC 1998 study
6. Regulatory drivers
The DEP issues groundwater discharge permits in Massachusetts. The WWTP upgrade did not violate antibacksliding or antidegradation provisions of the Clean Water Act, for it drastically reduced the WWTP’s nitrogen discharge. Although Massachusetts regulations do not expressly authorize nutrient trading, the DEP had an interest in exploring nonpoint source offsets
133
in Edgartown, particularly because of the residents’ opposition to the WWTP’s new permit.
B. Trade Structure 7. Determination of credit
No “credits” are determined or traded. Connecting 300 homes to the WWTP was estimated to reduce nitrogen loads by 1130 kg/year, while installing on-site denitification systems for approximately 900 new homes was estimated to reduce nitrogen by 1135 kg/year (MA DEP 2003). But since there is no official trade, actual nitrogen reductions resulting from the golf course tie-in have not been calculated.
8. Trading ratios and other mechanisms to deal with uncertainty The nonpoint source projects are simply meant to compensate for the uncertainty in calculating Great Pond’s nitrogen carrying capacity (Bill Wilcox, personal communication, May 24, 2004). Since no firm “offsets” or “credits” are determined, trading ratios are not applicable.
9. Liability/penalties for noncompliance Not applicable. The Edgartown Wastewater Commission is not required to install nonpoint source nitrogen reductions.
10. Approval process Not applicable.
11. Ex post verification/auditing. Not applicable.
12. Mechanisms for trade identification and communication (education and outreach, third party facilitation, embedded ties)
The MVC report (1998) identified several measures for reducing nonpoint source loading. Individual nonpoint source projects are pursued for a variety of reasons that have no direct connection to WWTP offsets; the golf course and subdivision with nitrogen contamination sought WWTP connections to solve their own wastewater problems, and conservation land is acquired by various organizations to further their own goals of open space or habitat.
13. Market structure (bilateral, clearinghouse, third party brokers) There are no official offsets or trades.
134

14. Types of trades allowed
Although the DEP characterizes these as point/nonpoint offsets (MA DEP 2003), there are no actual trades.
C. Outcomes 15. Types and volume of trades that have occurred
No actual “trades” have occurred. “Program Description” describes several nonpoint source nutrient-reducing measures, but these have not been actual offsets or trades.
16. Administrative costs Not applicable.
17. Transaction costs Not applicable.
18. Cost savings Not applicable.
19. Program goals achieved It is not accurate to delineate any program goals since there has not been an official trading or offset program. The MVC report (1998) recommended several nonpoint source nitrogen reduction measures, and indeed there have been reductions associated with the golf course tie-in and the acquisition of conservation easements. However, these reductions have not been in the context of any official trades or offsets.
20. Program obstacles The MA DEP cites funding for sewer extensions and conservation easements as an obstacle (MA DEP 2003). The MVC report (1998) describes the disadvantages associated with each nitrogen reduction measure – such as high financial costs, consuming WWTP capacity that could potentially be used for downtown expansion, or difficulty of public outreach – that would serve as obstacles to their implementation.
21. NPS involvement and incentives to engage in trading.
135
Nonpoint sources do not engage in trading per se, but individual nonpoint sources (the golf course and subdivision) have pursued WWTP tie-ins to solve their wastewater problems.
22. Other
Program information/References
Websites: See individual online documents, listed below Contacts: Bill Wilcox, Martha’s Vineyard Commission. (508) 693-3453 Claire Barker, Massachusetts Department of Environmental Protection. (617) 556-1128 Written Program Information:
Barker, Claire I. (2003). Using nutrient offsets to improve water quality [Powerpoint]. Massachusetts Estuary Project, Massachusetts Department of Environmental Protection. Presented to the Environmental Business Council of New England on February 23, 2003. Retrieved on May 3, 2004 from http://www.ebcne.org/ppts/clairebarker.ppt
Martha’s Vineyard Commission (MVC) (1998) Edgartown Great Pond: nutrient loading and recommended management program. Available on request from the Martha’s Vineyard Commission.
Massachusetts Department of Environmental Protection (MA DEP) (2003). Appendix 1: nutrient trading: background and case studies. In The Massachusetts Estuaries Project: embayment restoration and guidance for implementation strategies. Retrieved May 4, 2004 from http://www.mass.gov/dep/smerp/files/mepappen.pdf
------(1999). Discharge Permit SE #2-24. Issued to the Edgartown Wastewater Commission for the Edgartown municipal wastewater treatment facility, March 5, 1999.
Reviewed by Bill Wilcox, Martha’s Vineyard Commission and Claire Barker, Massachusetts Department of Environmental Protection.
136
Falmouth WWTP (MA) A. Program Background
1. Program description The Town of Falmouth, MA will implement nonpoint source nitrogen reduction measures in conjunction with its current wastewater treatment plant (WWTP) upgrade. The nonpoint source projects, which include connecting additional properties to the sewer and installing on-site denitification systems, grew out of a comprehensive wastewater management plan developed by the Town from 1998-2001. Construction on the new WWTP began in June, 2003 and does not yet include plans for sewer connections (Town of Falmouth n.d.). However, the current discharge permit does require the Town to submit a proposed schedule for constructing the sewers proposed by the plan (MA DEP 2002), and it is likely that the new WWTP permit will specify a construction timetable (Brian Dudley, personal communication, May 24, 2004). As one of the last four Class III facilities in the state, the Falmouth WWTP did not previously have nitrogen controls but tried to reduce nitrogen loading by spray irrigating about 75% of the effluent into woodlands near the facility (Costa 1997). The discharge contained approximately 23 mg/L total nitrogen, with a permit up to 50 mg/L. The WWTP upgrades will increase the flow capacity from 810,000 gallons per day (gpd) to 1.2 million gallons per day (although only 1 mgd can be discharged within the watershed), while reducing nitrogen discharge to 3 mg/L nitrogen through tertiary treatment. Annual nitrogen loading will be capped at 9,100 lbs (MA DEP 2003). The Town expects to offset some of the nitrogen discharge by connecting more than 400 properties to the WWTP in dense areas of West Falmouth Harbor and installing on-site dentrification systems eastern portions of the watershed (Weeks 2004; MA DEP 2003). It has not been determined whether the sewer connections will be funded through betterment assessments or taxes. The denitrification systems will be operated and managed by the town, but the costs will be borne by the individual property owners (Brian Dudley, personal communication, May 24, 2004). The Town’s Wastewater Treatment Facility Improvement Project does not include sewer expansions at this time (Town of Falmouth n.d.), but current permit requires the Town to submit a proposed construction schedule to the DEP, and the final WWTP permit, which will be completed by late 2005, will likely require an implementation timetable (Brian Dudley, personal communication, May 24, 2004). In some sense, the anticipated offsets have already been “counted,” since they were taken into account when determining the WWTP’s annual nitrogen load limit. The 9,100 lb/year limit was back calculated from West Falmouth Harbor’s estimated nitrogen carrying capacity, accounting for anticipated nonpoint source offsets and attenuation factors (Brian Dudley, personal
137
communication, May 24, 2004). The attenuation factors acknowledge that the nutrient loading to West Falmouth Bay is reduced by 20% in the Masapaquit Creek salt marsh and 45% through the spray irrigation (MA DEP 2003).
2. Program motivation West Falmouth Harbor suffers from excess nitrogen loading and eutrophication (MA DEP 2003). Wastewater constitutes approximately 70-80% of the nitrogen load in the Harbor (Brian Dudley, personal communication, May 24, 2004), or about 55% after considering attenuation factors (Burce and Kang 2002). A 1997 report conducted by Falmouth by the Buzzards Bay Project recommended that the Town consider facilities planning and an upgrade to tertiary treatment (Costa 1997). The Falmouth WWTP had reached 80% of its permitted facility, which is often the trigger point for DEP review, partly due to the renovation of summer homes into year-round use. Furthermore, Falmouth was one of the last four towns in Massachusetts to have a Class III groundwater discharge WWTP, and it was likely that the DEP would be considering more stringent limits (Costa 1997). Environmentally concerned citizens focused on the nitrogen issue and provided the impetus to explore nonpoint source nutrient reductions (Brian Dudley, personal communication, May 24, 2004). The Town of Falmouth’s comprehensive wastewater facility plan, completed over 1998-2001 with the consulting services of Stearns & Wheler, LLC, recommended the sewering and denitification systems in addition to the WWTP upgrades (Weeks 2004).
3. Pollutant being traded Nitrogen
4. Size of program The potential nitrogen offsets will come from two sources: sewering 400 properties west of Route 28, and installing on-site denitrification systems east of Route 28. Potential trading parties: Falmouth WWTP; local property owners
5. Stakeholders/participants • Town of Falmouth • Massachusetts Department of Environmental Protection (MA DEP): issues
groundwater discharge permits; currently evaluating watershed planning and nitrogen limits for coastal watersheds under the Massachusetts Estuaries Project (MEP)
138
• Buzzards Bay Project: prepared nitrogen loading reports for Falmouth (Costa 1997)
• Cape Cod Commission: worked with the Buzzards Bay Project and the Town of Falmouth to determine nitrogen loads to West Falmouth Harbor
• School for Marine Science & Technology (SMAST), University of Massachusetts Dartmouth: conducted watershed evaluations and developed nitrogen loading limits in partnership with the DEP
• Local environmentally-concerned citizens: provided impetus for focusing on nonpoint source nitrogen loads
• Stearn’s and Wheler, LLC: consulting company for the Town of Falmouth’s wastewater facilities planning
6. Regulatory drivers
The MA DEP issues groundwater discharge permits in Massachusetts. The Falmouth WWTP upgrade did not violate antibacksliding or antidegradation provisions of the Clean Water Act, for it drastically reduced the WWTP’s nitrogen discharge. The Town of Falmouth did not face a strict regulatory incentive for developing nonpoint source offsets; it was motivated to include offsets in its comprehensive wastewater facilities plan because of local citizen action. West Falmouth Harbor does not currently have a TMDL, but it is in the Round 1 list of estuaries for which the Massachusetts Estuaries Program (MEP) will develop nitrogen limits and TMDLs.
B. Trade Structure 7. Determination of credit
The estimated nitrogen carrying capacity of West Falmouth Harbor was used to back calculate the nitrogen allocations and reduction goals, taking into account the attenuation factors and anticipated offsets (Brian Dudley, personal communication, May 24, 2004). It is not clear whether the individual nonpoint source reductions will be quantified and written into the final permit, but some kind of accounting system will be developed to ensure that the loads to the Harbor do not exceed the threshold (Brian Dudley, personal communication, June 1, 2004).
8. Trading ratios and other mechanisms to deal with uncertainty The trading ratio was 1:1 (Claire Barker, personal communication, May 4, 2004), in the sense that offsets were taken into account without a discount for uncertainty.
9. Liability/penalties for noncompliance Not determined.
139
10. Approval process
Not determined.
11. Ex post verification/auditing. Not determined.
12. Mechanisms for trade identification and communication (education and outreach, third party facilitation, embedded ties) Embedded ties. The comprehensive wastewater management plan, completed in 2001, recommended several areas for sewering and installing on-site denitrification. The Town will likely be identifying and negotiating with individual property owners within its jurisdiction.
13. Market structure (bilateral, clearinghouse, third party brokers) Sole-source offsets. The Town will implement additional sewer connections and centrally-managed, on-site denitification systems to offset its wastewater treatment plant discharge. However, since the individual property owners will bear much of the costs of offsets, it is difficult to characterize this as a market in which a point source purchases offsets from nonpoint sources.
14. Types of trades allowed Point/nonpoint.
C. Outcomes 15. Types and volume of trades that have occurred
None. No nonpoint source offsets have been constructed yet.
16. Administrative costs Not determined.
17. Transaction costs Not determined.
18. Cost savings The WWTP upgrades will cost approximately $800,000 for design and $14,070,000 for construction (Town of Falmouth n.d.). There are no estimates yet on the costs of for the nonpoint source nitrogen reduction projects, and
140
funding has not yet been determined. It is not possible to determine cost savings, since the WWTP would probably have continued with current operations for some time in the absence of the offset program (Brian Dudley, personal communication, May 24, 2004).
19. Program goals achieved It is still too early to determine the outcome of the program.
20. Program obstacles Funding and some local political issues may be an obstacle, but the interest throughout the town in restoring the embayments will likely overcome these problems (Brian Dudley, personal communication, June 1, 2004).
21. NPS involvement and incentives to engage in trading. Not determined. Since individual property owners will bear the costs of on-site denitrification systems, and may pay for sewer connections, presumably they will not participate unless their participation solves their own wastewater problems.
22. Other
Program information/References Websites: See individual online documents, listed below Contacts: Brian Dudley, Massachusetts Department of Environmental Protection. (508) 946-2753 Written Program Information:
Barker, Claire I. (2003). Using nutrient offsets to improve water quality [Powerpoint]. Massachusetts Estuary Project, Massachusetts Department of Environmental Protection. Presented to the Environmental Business Council of New England on February 23, 2003. Retrieved on May 3, 2004 from http://www.ebcne.org/ppts/clairebarker.ppt
Burce, Allison and Kang, Simon (2002). Quantifying nitrogen attenuation through West Falmouth aquifer using boron as a tracer. Student research from the Summer 2002 Semester in Environmental Science. Marine Biological Laboratory, Woods Hole, MA. Retrieved May
141
24, 2004 from http://courses.mbl.edu/SES/data/project/2002/burce.pdf
Costa, Joseph E. (1997). An updated analysis of wastewater disposal at the Falmouth wastewater disposal facility with respect to nitrogen loading in West Falmouth Harbor. Buzzards Bay Project, National Estuary Program. Retrieved May 23, 2004 from http://www.buzzardsbay.org/wfup997.htm
Massachusetts Department of Environmental Protection (MA DEP) (2003). Appendix 1: nutrient trading: background and case studes. In The Massachusetts Estuaries Project: embayment restoration and guidance for implementation strategies. Retrieved May 4, 2004 from http://www.mass.gov/dep/smerp/files/mepappen.pdf
------(2002). Discharge Permit SE#3-168. Issued to the Town of Falmouth Utilities Department for the Falmouth municipal wastewater treatment facility, February 15, 2002.
Town of Falmouth (2003). Wastewater Treatment Facility (WWTF) Improvement Project. Retrieved May 24, 2004 from http://www.town.falmouth.ma.us/deppage.php?number=65
Weeks, Nathan C (2004). Wastewater and nitrogen management planning in coastal watershed. Stearns & Wheler, LLC. Presented at the New York Water Environment Association Annual Meeting, New York, NY, February 4, 2004. Retrieved May 25, 2004 from
http://www.sw-engineers.com/downloads/Wastewater%20and%20N itrogen%20Management%20Planning.pdf
142
Massachusetts Estuaries Project (MEP) A. Program Background
1. Program description The Massachusetts Estuaries Project (MEP) is a $12 million project to provide technical data and guidance on nitrogen loading, limits, and management options for 89 estuaries in southeastern Massachusetts. The project was initiated in 2001 and will run for six years. Coastal communities are encouraged by the MEP guidance document to consider nitrogen trading, and the DEP initiated pilot projects in three estuaries to provide roadmaps for trading and watershed-wide permitting. The pilots were initiated in October, 2003 with a Water Quality Cooperative Agreement grant from the EPA Office of Wastewater Management, and they will run through September, 2005 (Claire Barker, personal communication, May 4, 2004). The three estuaries chosen as pilots are Popponesset Bay, Three Bays, and the Wareham-Agawam River. Each pilot was chosen because it is representative of many other estuaries and will provide a good model for other communities. To date, no trading framework has been determined (Claire Barker, personal communication, May 4, 2004).
2. Program motivation Nitrogen trading will give coastal communities another tool to address nitrogen pollution. Heavy nutrient loads, particularly nitrogen, have reduced the dissolved oxygen available in the water, leading to fish kills and declines in eelgrass beds (a crucial aquatic habitat). The DEP expects that the pilots will help develop a trading framework, inform future regulation, and provide a roadmap for watershed-based permitting and nutrient trading. Southeastern Massachusetts relies heavily on fishing and tourism; many of its citizens and officials are very environmentally aware and understand the issues raised by nitrogen pollution. (Claire Barker, personal communication, May 4, 2004).
3. Pollutant being traded Nitrogen
4. Size of program Wastewater, primarily from septic systems but also from groundwater discharge wastewater treatment plants (WWTPs), is the dominant source of nitrogen loading in the Poppenesset Bay and Three Bays areas. Stormwater runoff is another source of nitrogen, while cranberry bogs and wetlands result
143
in nitrogen uptake. The Wareham-Agawam River Watershed also includes WWTPs that discharge into surface water. Potential trading parties: wastewater treatment plants; stormwater runoff; cranberry bogs; wetlands
5. Stakeholders/participants
• Massachusetts Department of Environmental Protection (DEP): collaborative partner in the MEP; conducting nutrient trading pilot programs
• University of Massachusetts, School of Marine Science and Technology (SMAST): collaborative partner in the MEP; conducting nutrient monitoring, eel grass mapping, and regional estuary modeling to determine target nitrogen loads
• U.S. Environmental Protection Agency, Region 1: collaborative partner in the MEP
• Massachusetts Executive Office of Environmental Affairs (EOEA): collaborative partner in the MEP
• Cape Cod Commission: collaborative partner in the MEP • Communities within the three pilot watersheds (Mashpee, Barnstable,
Sandwich, Wareham, Plymouth and Carver):
6. Regulatory drivers Massachusetts does not have regulations that explicitly authorize nutrient trading, but the DEP has encouraged communities to explore trading in their watershed planning and nutrient reduction plans (MA DEP 2003). The MEP will establish target nitrogen load limits that will form the basis of TMDLs. The pilots will evaluate how to incorporate water quality trading into TMDL implementation (Claire Barker, personal communication, May 4, 2004).
B. Trade Structure 7. Determination of credit
Not determined. It is not clear how the TMDLs will affect the baselines for trading (Claire Barker, personal communication, May 4, 2004).
8. Trading ratios and other mechanisms to deal with uncertainty Not determined.
9. Liability/penalties for noncompliance Not determined.
10. Approval process
144
Not determined.
11. Ex post verification/auditing. Not determined.
12. Mechanisms for trade identification and communication (education and outreach, third party facilitation, embedded ties) Not determined.
13. Market structure (bilateral, clearinghouse, third party brokers) Not determined.
14. Types of trades allowed Point/nonpoint trading will be explored.
C. Outcomes 15. Types and volume of trades that have occurred
None. The MEP is only beginning to explore trading structures and rules.
16. Administrative costs All cost estimates will depend largely on the trade structure, which has yet to be developed.
17. Transaction costs Not determined.
18. Cost savings Not determined.
19. Program goals achieved
The goal of the program is not necessarily to see trading but to develop guidance on the development of a trading framework, community nutrient management options, and future regulation on trading. It is too early to determine whether the program will achieve these goals.
20. Program obstacles
145
The small geographic size and small number of nitrogen sources in each estuary may limit the use of trading as a nitrogen reduction strategy (Claire Barker, personal communication, May 4, 2004).
21. NPS involvement and incentives to engage in trading. Not determined.
22. Other
Program information/References
Websites: Massachusetts Department of Environmental Protection: Massachusetts Estuaries Project. http://www.mass.gov/dep/smerp/smerp.htm Contacts: Claire Barker, Massachusetts Department of Environmental Protection. (617) 556-1128 Written Program Information:
Massachusetts Department of Environmental Protection (MA DEP) (2003). The Massachusetts Estuaries Project: embayment restoration and guidance for implementation strategies 2003. Retrieved May 4, 2004 from http://www.mass.gov/dep/smerp/smerp.htm
Reviewed by Claire Barker, Massachusetts Department of Environmental Protection.
146
Specialty Minerals, Inc. (MA) A. Program Background
1. Program description The U.S. Environmental Protection Agency (EPA) has issued a NPDES permit to Specialty Minerals, Inc. (SMI) containing elements of river temperature offsets. SMI will be permitted to discharge a greater volume of water from its limestone processing plant once an upstream flood chute restoration project lowers the river temperature by 4º F. Although this holistic watershed management approach departs from traditional permitting, it is difficult to characterize it as a formal trade since SMI is not legally obligated to contribute to the restoration project. SMI’s plant discharges clean but warm water into the Hoosic River. SMI renewed its NPDES permit every five years since 1975, but in the late 1990s it wanted to expand operations and increase its discharge from 4.2 million gallons per day (mgd) to 6 mgd. When SMI claimed that more stringent temperature restrictions would force them to construct three expensive and unsightly cooling towers along the river, the USEPA began looking into offsets. The Hoosic River Watershed Association (HooRWA) had conducted extensive temperature monitoring several years earlier and warned the USEPA that increased high-temperature discharge could raise river temperatures high enough to damage wild trout populations. HooRWA had also discovered, however, that SMI was not predominantly responsible for the high instream temperatures; while SMI's discharge raised the river temperature by about 1.25º F, upstream flood control chutes raised the river temperature by as much as 7º F during sunny, low flow conditions (Ely 2002). The Army Corps of Engineers had constructed the flood control chutes within the Towns of Adams, North Adams, and Williamstown after major floods in the 1950s. The wide concrete channels create a shallow flow with a large surface area, and the consequent water heating creates potentially harmful temperature conditions for the wild trout population. Once HooRWA’s documentation of river temperature came to light, the EPA invited the Corps to investigate restoration options (Ely 2002). The Corps initiated a $1.1 million restoration project to deepen channels and create more natural flow conditions with rock features and vegetation, improving habitat and reducing water heating. The Preliminary Restoration Plan was approved in June, 2000, and the feasibility phase was initiated in February, 2002 (USACOE n.d.). However, funding for the Corps project has recently been cut, and the project may or may not move forward. The total cost of the project is too expensive for SMI alone to support (David Pincumbe, personal communication, June 1, 2004). In the original proposal for the offset, SMI would have been required to place contributions into an escrow fund or contribute in-kind services (BRPC 2003).
147
SMI initially agreed to contribute approximately $100,000 but objected to having contribution requirements in its NPDES permit. SMI’s NPDES permit, issued in September, 2003, simply assumes that the restoration project will be completed to lower river temperatures by 4º F within the next five years (David Pincumbe, personal communication, July 3, 2003). The NPDES permit builds in this condition by establishing two sets of temperature and flow limits: SMI is initially authorized to discharge 5 mgd with a limit of 84.7º F, which will result in an instream river temperature of 82º F. If the river temperature decreases by 4º F through the restoration project, SMI will be permitted to discharge 6 mgd with a limit of 81.5º F, which will result in an instream river temperature of 79º F (BRPC 2003). If the temperature reductions are not realized within the five-year permit duration, then SMI will face more stringent effluent limits (David Pincumbe, personal communication, June 1, 2004). At this time, given the state of the Corps’ funding, the restoration project may not be completed within the permit duration. In any case, SMI is doing well at 5 mgd and may not need to access the additional 1 mgd capacity (David Pincumbe, personal communication, June 1, 2004).
2. Program motivation The restoration and offset project grew out of SMI’s desire for a new NPDES permit with an increased discharge volume. The Town of Adams was interested in supporting the project because SMI is one of its largest businesses and employers (Danforth 2003). The Hoosic River is designated as a warm water fishery with instream temperature limits of 83º F. SMI faced more stringent temperature discharge limits, however, because the mortality temperature for trout is considered to be 79º F (BRPC 2003). The Clean Water Act’s antidegradation provisions require the Massachusetts DEP and the EPA to protect the river at the state in which it currently exists. Since there are trout in the river now, and the temperatures are too warm for the trout, the EPA interpreted the antidegradation requirements as not merely keeping the river at current conditions but actually improving conditions to allow for the continued survival of trout (David Pincumbe, personal communication, February 2, 2002).
3. Pollutant being traded
Temperature
4. Size of program
148
The ACOE project will modify approximately 2.2 miles of the flood damage channels to restore more natural flow and habitat (BRPC 2003).
Potential trading parties: Specialty Minerals, Inc.; flood chute restoration project sponsored by U.S. Army Corps of Engineers
5. Stakeholders/participants • Specialty Minerals, Inc. (SMI) • U.S. Environmental Protection Agency (EPA), Region I: issues NPDES
permits in Massachusetts. • Massachusetts Department of Environmental Protection (DEP): • U.S. Army Corps of Engineers (ACOE): implementing a stream
restoration project through the Ecosystem Restoration Program, which uses federal funds to restore habitat that has been degraded by past Corps projects
• Hoosic River Watershed Association (HooRWA): conducted extensive monitoring that was a key to designing the offset provisions
• Town of Adams, MA: works in partnership with the ACOE on the feasibility analysis for the flood chute restoration project
• Berkshire Regional Planning Council (BRPC): provided a review to the draft NPDES permit
6. Regulatory drivers
The Antidegradation Provision of the Clean Water Act stipulates that all existing uses and the water quality needed to sustain those uses must be protected. In determining temperature discharge limits for SMI’s permit, the EPA interpreted this to mean that the river temperature must be reduced to protect the wild trout population. The Massachusetts Water Quality Standards designated the Hoosic River as a warm water fishery. Although this allows a maximum temperature of 83º F, the antidegradation rules further constrain water temperatures. The U.S. Environmental Protection Agency issues NPDES permits in Massachusetts.
B. Trade Structure 7. Determination of credit
The “credit” in this offset will be instream temperature reductions generated by the ACOE’s flood chute restoration project. If the project reduces river temperatures by 4º F, then SMI will be permitted to discharge a greater volume of water.
8. Trading ratios and other mechanisms to deal with uncertainty
149
The trade ratio is 1:1. Temperature is measurable, reducing uncertainty, and the restoration project and SMI have equivalent impacts on water temperature (Environomics 1999).
9. Liability/penalties for noncompliance If the project does not reduce river temperatures within five years, then SMI will be required to reduce the river temperature by those 4º F, most likely with cooling towers (David Pincumbe, personal communication, February 19, 2002).
10. Approval process Once the Army Corps decided to take on the flood chute restoration project, the EPA only needed to place offset provisions in SMI’s NPDES permit. There is no oversight of any actual “trade,” since SMI is not required to contribute to the restoration project. The EPA only needs to monitor river temperature, not trading activities.
11. Ex post verification/auditing. Monitoring will most likely be done by local groups, such as HooRWA. The EPA will also audit river temperatures at the end of the five year permit, or sooner if necessary (David Pincumber, personal communication, February 19, 2002).
12. Mechanisms for trade identification and communication (education and outreach, third party facilitation, embedded ties) Third party facilitation. HooRWA’s research showed the relative heating impact of both SMI and the flood control channels, which provided the foundation for the temperature offset arrangement.
13. Market structure (bilateral, clearinghouse, third party brokers) This offset project does not fit any clear trading or market structure, since SMI is not obligated to contribute to the restoration project. It is perhaps closest to a bilateral structure in the sense that SMI’s contributions would go directly to the restoration project rather than through a clearinghouse or broker.
14. Types of trades allowed Closest to point/nonpoint trade, offsetting end-of-pipe temperature discharges through river flow and habitat restoration efforts. However, temperature does not follow the same designations as pollution discharge.
150
C. Outcomes 15. Types and volume of trades that have occurred
None. The ACOE will proceed with the flood chute restoration project if it is able to secure more funding, but SMI is not obligated to contribute to the project. The cost of restoration is too great for SMI alone to fund (David Pincumbe, personal communication, June 1, 2004).
16. Administrative costs The offset arrangement was crafted during the NPDES permitting process. It is difficult to separate the costs of designing the “trade” from the process of permitting. The administration costs associated with the offset itself are minimal, since SMI will simply be allowed to discharge a higher volume of water from its plant if river temperature monitoring shows a 4º F reduction.
17. Transaction costs Not determined.
18. Cost savings Installing cooling towers would be a very expensive strategy for reducing SMI’s discharge temperature. Although the offset may provide SMI with a low or no cost mechanism (depending on its contributions) for gaining permission to discharge 6 mgd, SMI may still face costs to reduce the discharge temperature to 81.5º F. Furthermore, if the restoration project is not completed, does not sufficiently reduce river temperatures, or is reclassified as a cold water fishery, SMI will face a more stringent permit.
19. Program goals achieved If the restoration project succeeds in reducing river temperatures by 4º F, then the entire offset arrangement will successfully meet environmental goals as well as SMI’s goal of increasing discharge.
20. Program obstacles A review of the draft permit by the Berkshire Regional Planning Commission (BRPC 2003) asserted that the permit may create a disincentive for SMI to contribute, since SMI could face increased water treatment costs when the discharge temperature limit declines at 6 mgd. The BRPC review further observed that the Town of Adam will likely follow the lead of SMI and may similarly choose to not contribute the money that it had approved for the purpose.
151
The bigger discincentive, however, would have come from the potential reclassification of the Hoosic River as a cold water fishery (David Pincumbe, personal communication, June 1, 2004). The Hoosic River is classified as a warm water fishery, but temperatures needed to sustain trout health are lower than is required by this designation. Although SMI argued that the existence of the fish demonstrates that river temperatures need not be significantly reduced (Roberts 2003), there was a movement among other stakeholders to reclassify the river as a cold water fishery. In the end, the DEP has decided that the fish must be protected, but it has stopped short of reclassifying the river (David Pincumbe, personal communication, June 1, 2004).
21. NPS involvement and incentives to engage in trading. The flood chute restoration project is closer to a nonpoint source than a single point of discharge, although the point/nonpoint source classifications are not an accurate fit for temperature. The Army Corps’ motivation for funding and implementing the restoration project is environmental (rather than most NPS offsets, which depend on financial incentives for farmers, stormwater systems, failing septic tank owners, etc.). The Army Corps is authorized by the Ecosystem Restoration Program to use federal funds to restore habitat that has been degraded by past Corps project (Ely 2003).
22. Other
Program information/References Websites: See individual online documents, listed below Contacts: David Pincumbe, U.S. EPA Region I. (617) 918-1695 Written Program Information:
Berkshire Regional Planning Commission (BRPC) (2003). Review of Draft NPDES Permit for Specialty Minerals Inc. Retrieved May 19, 2004 from http://www.berkshireplanning.org/download/ADM_SMI%202.11.03%20-%20Final.pdf
Danforth, Nina (2003). River recovery: how wild species can be the catalyst for activism. Conservation Perspectives, the online journal of the New England Chapter of the Society for Conservation Biology (NESBC), 1. Retrieved January 19, 2004 from http://www.nescb.org/epublications/spring2003/danforth.html
Ely, Eleanor (2002). Keeping trout cool. The Volunteer Monitor, the national newsletter of Volunteer Watershed Monitoring, 14:2.
152
Retrieved May 19, 2004 from http://www.epa.gov/volunteer/summer02/volmon.pdf
Environomics (1999). A summary of U.S. effluent trading and offset projects. A report prepared for Dr. Mahesh Podar, U.S. Environmental Protection Agency, Office of Water. Retrieved May 7, 2004 from http://www.epa.gov/owow/watershed/trading/traenvrn.pdf
Massachusetts Department of Environmental Protection (MA DEP) (2001). Massachusetts Surface Water Quality Standards (314 CMR 4.00) [electronic version]. Retrieved May 19, 2004 from http://www.state.ma.us/dep/bwp/iww/files/314cmr4.htm#04
Roberts, Donna. (2003, February 25). Specialty Minerals offers views on regs. The North Adams Transcript. Retrieved April 1, 2004 from http://www.berkshireplanning.org/1/detail.php?story=39
Schlesinger, Richard (2002). Final Quality Assurance Project Plan For Hoosic River Monitoring in 2002. Hoosic River Watershed Association (HooRWA).
U.S. Army Corps of Engineers (USACOE) (n.d.). Hoosic River Restoration, Adams, Massachusetts: project modifications for improvement of the environment [Fact Sheet]. Retrieved May 19, 2004 from http://www.nan.usace.army.mil/project/mass/factsh/pdf/hoosic.pdf
U.S. Environmental Protection Agency (USEPA) (2003). National Pollutant Discharge Elimination System (NPDES) Permit MA 0005991. Issued September 16, 2003.
Reviewed by David Pincumbe, U.S. Environmental Protection Agency, Region I.
153
Wayland Business Center Permit (MA) A. Program Background
1. Program description When the Wayland Business Center, LLC (WBC) redeveloped an abandoned commercial property in Wayland, MA, it sought to reactivate the previous owner’s NPDES permit for the small, on-site wastewater treatment plant (WWTP). The U.S. Environmental Protection Agency (USEPA) and the Massachusetts Department of Environmental Protection (MA DEP) denied WBC the permit renewal, interpreting the discharge as a new source to the Sudbury River. In developing a new NPDES permit for WBC, the USEPA initially set a 0.2 mg/L phosphorus limit, but the final permit allowed a 0.5 mg/L phosphorus limit in exchange for nonpoint source offsets. The nonpoint source phosphorus reductions came from sewering over two dozen properties in downtown Wayland that have failing septic systems The Raytheon Corporation had previously operated a 403,000 square foot research and testing facility on the 55-acre property (McDonald 2003). Raytheon had a small WWTP to treat its own effluent, but the NPDES permit was cancelled when Raytheon closed the facility in 1995 (Jaksch 2000). Congress Group Ventures purchased the Raytheon property in 1996 and established WBC as a subsidiary to redevelop the building into office space. Thinking that the NPDES permit was transferred with the property, WBC approached the EPA for a renewal in 1997. The EPA and the MA DEP ruled that WBC’s discharge was a new source that should be capped at a 0.2 mg/L phosphorus limit. After extensive negotiations, the USEPA issued a permit in September, 1998a allowing WBC to discharge at 0.5 mg/L in exchange for reducing three times as much phosphorus loading from nonpoint sources. Since many properties in downtown Wayland had leaky or failing septic systems, WBC could generate phosphorus offsets by treating the effluent from these properties at its WWTP. The permit set a total flow limit of 65,000 gallons per day (gpd) and stipulated that a minimum of 4,740 gpd (up to 20,000 gpd) must be “tie-ins” from existing, failing sewer systems. As of 1999, 33 properties, with a daily flow of 10,000-18,000 gallons, had pledged connections to the WWTP (Jaksch 2000), and 25 properties had been connected as of January, 2003 (MA DEP 2003). Although WBC negotiated and received the NPDES permit for the WWTP, the Town of Wayland quickly took over the operation of the facility and the implementation of the offsets. The Town of Wayland had voted to acquire the WWTP by eminent domain in June, 1998a, three months before the NPDES permit was issued. The Town wanted to be able to limit individual property owners’ access to the WWTP as a form of zoning control to restrict subdivisions of larger lots (Jaksch 2000). WBC opposed the taking of the
154
facility, but it signed a Memorandum of Agreement (MOA) with the Town in August, 1999 to transfer the title. WBC was reimbursed for the facility and guaranteed 45,000 gpd in treatment capacity. The Wayland Wastewater Management District Commission (WDMC) has been operating the WWTP since October 1999. Changes in the ownership and use of the Raytheon property could affect the future treatment distribution of the WWTP. Credit Suisse First Boston took the title for the property from WBC in December 2003. WBC’s last tenant for the building had been Polaroid, which went bankrupt in 2001. Most recently, several officials for the Town of Wayland have expressed an interest in developing a downtown business district on the site (McDonald 2003).
2. Program motivation The Sudbury River is highly eutrophic during the warmer months and frequently suffers from algae blooms and nuisance aquatic weeds. Phosphorus loading from both point and nonpoint sources is the largest contributor to the eutrophic conditions (Jaksch 2000). WBC’s motivation for pursuing a trading option was the high cost of treating their effluent to a 0.2 mg/L phosphorus limit. The Town of Wayland pushed for the trading provisions because it helped address their long-term problem of failing septic systems. Wayland does not have a POTW, partly out of concern that it would encourage growth and subdivision of larger properties. However, old septic systems in the Town are a significant source of phosphorus pollution because the water table in the area is very shallow. Many septic tanks are below the water table during the wet months of the year, and their leach field release pollutants directly into the groundwater. (Jaksch 2000).
3. Pollutant being traded
Phosphorus
4. Size of program The Sudbury River is only 28.8 miles long and is part of the greater Sudbury-Assabet-Concord (SuAsCo) watershed. The permit allowed WBC to investigate three types of nonpoint source offets within the watershed: treating the effluent of existing, failing septic systems, repairing or upgrading failing septic systems, and harvesting nuisance plants or other phosphorus-releasing materials. The sewer connection plan was the most permanent and cost-effective option. Potential trading parties: Wayland Business Corporation; property owners in downtown Wayland with leaking septic systems
155
5. Stakeholders/participants
• Congress Group Ventures and its subsidiary Wayland Business Center,
LLC (WBC): developer of the abandoned Raytheon property • U.S. Environmental Protection Agency (USEPA) Region I: issues NPDES
permits in Massachusetts • Massachusetts Department of Environmental Protection (MA DEP): sets
State Water Quality Standards; worked cooperatively with the USEPA during the permitting process although the MA DEP does not issue NPDES permits
• Town of Wayland: provided comments to the permitting process; assumed the WBC NPDES permit and WWTP by eminent domain so that it could restrict the number of hookups to the facility
• Wayland Wastewater Management District Commission (WMDC): establishes small wastewater systems in Town; now operates the WWTP taken from WBC through eminent domain
• Wayland Board of Health (WBOH): is responsible for ensuring that the town’s septic systems are not a public health threat; provided comments to the permitting process
• U.S. National Park System: provided comments to the permitting process because the Sudbury River is listed as a Wild and Scenic River
• SuAsCo Watershed Coalition: represents environmental interests; provided comments to the permitting process
• Neighboring property owners
6. Regulatory drivers The trade took place without a TMDL for the Sudbury River, although one is planned. Water quality standards are set by the Massachusetts DEP. The Sudbury River is designated a Class B water, which means that it must meet standards to support aquatic life and allow fishing and swimming (Jaksch 2000). Since the Sudbury did not meet water quality standards, the EPA wanted to regulate new discharge at 0.2 mg/L, and the costs associated with this limit were high enough to drive interest in trading as a more innovative, cost-effective solution (Environomics 1999). Massachusetts is a non-delegated state, and the USEPA issues NPDES permits. The DEP determined that the permitted discharge from the WBC facility will not violate Clean Water Act Antidegradation provisions since it will result in a net reduction of nutrient loading (Jaksch 2000).
B. Trade Structure 7. Determination of credit
The permit stipulates that WBC must achieve 0.375 lb/day of phosphorus reductions to offset the 0.125 lb/day to be discharged. The EPA estimated the
156

phosphorus loading from septic systems at approximately 10 mg/L. Diverting the wastewater from septic systems to the WWTP, which discharges phosphorus at 0.5 mg/L, therefore reduces phosphorus loading by 9.5 mg/L (Jaksch 2000). At this rate, the WWTP must treat a minimum of 4,740 gpd from newly sewered properties to achieve 0.375 lb/day of offsets.
8. Trading ratios and other mechanisms to deal with uncertainty The permit sets a trading ratio of 3:1. In real terms, the WWTP must achieve phosphorus reductions of 0.375 lb/day to offset its phosphorus discharge of 0.125 lb/day. Sewering properties with failing septic systems offers a permanent source of phosphorus reductions. Since these reductions are not quantified and monitored, however, the trading ratio provides a margin of safety.
9. Liability/penalties for noncompliance The offset provisions are written into the permit, and the permittee is responsible for achieving the nonpoint source reductions necessary to comply with the permit.
10. Approval process The negotiation process for the modified permit took about a year.
11. Ex post verification/auditing. The permit specifies monitoring requirements and protocols. Phosphorus is measured weekly, and the permittee must submit monthly and annual monitoring reports to the EPA and the DEP. The annual reports discuss compliance with the permit, scheduled milestones for phosphorus offsets, and efforts to reduce phosphorus loading in the forthcoming year. In addition to discharge monitoring, the permit requires in-stream monitoring of the Sudbury River upstream and downstream of the discharge. The EPA and the DEP approve the sampling locations, and sampling must be conducted monthly from May to November. However, there is no monitoring system in place to quantify the nonpoint source reductions for the trade. Monitoring the phosphorus loading reduction that result from sewering each property would be prohibitively expensive (Jaksch 2000).
12. Mechanisms for trade identification and communication (education and outreach, third party facilitation, embedded ties) The Town of Wayland was responsible for identifying the failing septic systems and building the sewer line (US EPA 1998a). As long as WBC was
157
the permittee, this would have appeared to be third party facilitation. The Town of Wayland intended to take over the WWTP even before the NPDES permit was issued, however, so it is more accurate to think of this as outreach and trade identification conducted directly by the buyer.
13. Market structure (bilateral, clearinghouse, third party brokers) This “market” does not clearly fit any of the water quality trading market structures. Since the individual property owners will likely have to pay the connection cost (Franklin 1998a), it is difficult to characterize this as a bilateral trade in which point source purchase offsets from nonpoint source. Since the Town of Wayland operates the WWTP, it appears more like a traditional POTW that charges residents for treating their effluent.
14. Types of trades allowed Point/nonpoint.
C. Outcomes 15. Types and volume of trades that have occurred
As of January, 2003, 25 properties had been connected to the sewer line (MA DEP 2003).
16. Administrative costs The costs associated with the permitting process were higher than for a traditional permit, partly because this was the first trading project for the EPA Region 1 (Jaksch 2000). However, since monitoring of nonpoint source reductions is not required, and the offset provisions do not demand much additional monitoring or oversight compared to a traditional permit, the ongoing administrative costs are presumably not burdensome.
17. Transaction costs Not determined.
18. Cost savings Under the 0.2 mg/L phosphorus limit (i.e. in the absence of offset provisions), WBC would have faced $1 million in plant upgrades. Since the Raytheon plant was already upgraded for phosphorus removal, the 0.5 mg/L phosphorus limit only required $140,000 for upgrades. WBC would have paid the connection fees for individual properties (US EPA 1998a), but with the Town operating the WWTP, property owners must pay for the hookup (MA DEP 2003). The Town agreed to pay WBC $250,000 for the facility, but WBC in turn had to pay back approximately $173,000 as a one-time user fee. In all,
158
the offset provisions saved WBC approximately $937,000 ($1 million - $140,000 + $250,000 - $173,000) (Jaksch 2000). The Town of Wayland spent $731, 367 for the treatment facility and the sewer system, financed through Town bonds and low interest loans from a revolving State fund. The capital costs will be recovered through “betterment assessments” of connected properties, and operating costs are funded through user fees (Town of Wayland n.d.).
19. Program goals achieved The offset provisions provided WBC with a cost-effective solution for gaining its NPDES permit. Environmentally, it promised to reduce net phosphorus loading to the Sudbury River. The 0.5 mg/L limit represented an 80% phosphorus reduction compared to the Raytheon discharge, and the 3:1 trading ratio ensured a net phosphorus reduction (Jaksch 2000). Since the trade enabled the redevelopment of the property to move forward, the Town of Wayland benefited from the trade through increased tax rolls and the revitalization of an abandoned property. Another interpretation, however, is that WBC got a break for fixing a problem that the Town should have cleaned up on its own. The State could have issued an order for Wayland to take care of the septic problem, either by tight-tanking the failing septic systems or by starting their own POTW. This would have resulted in both the Town and WBC cleaning up their respective phosphorus loading (David Pincumbe, personal communication, July 3, 2003).
20. Program obstacles Public comments on the draft permit from the Town of Wayland, the Wayland Board of Health, the SuAsCo Watershed Coalition, the National Park Service, and the Massachusetts DEP show several environmental concerns, including that the 0.5 mg/l was not sufficiently stringent, that the permit allows for deferred trading after the onset of the discharge, that nitrogen should also be addressed. The EPA’s Response to Public Comments explained its rationale in response to each of these concerns.
21. NPS involvement and incentives to engage in trading. Property owners had both economics and aesthetic reasons to connect to the WWTP. Compared to installing raised leach fields or tight-tanking failing septic systems, connecting to the WWTP may have provided a more cost-effective and aesthetically pleasing alternative (MA DEP 2003).
22. Other
159

Program information/References Websites: See individual online documents, listed below Contacts: David Pincumbe, U.S. Environmental Protection Agency Region I. (617) 918-1695 Lana Carlsson-Irwin, Irwin Engineers and the Wayland Wastewater Management District Commission. (508) 653-8007 Written Program Information:
Environomics (1999). A summary of U.S. effluent trading and offset projects. A report prepared for Dr. Mahesh Podar, U.S. Environmental Protection Agency, Office of Water. Retrieved May 7, 2004 from http://www.epa.gov/owow/watershed/trading/traenvrn.pdf
Franklin, James L. (1998a, August 30) Wayland meets the challenge of septic problems. Boston Globe, West Weekly pg. 1.
Griesser, J. Elliot (2004). Offset projects: success and suitability in addressing water quality impairment. Unpublished master’s thesis, Bard College, Annandale on Hudson, NY.
Jaksch, John (2000). Appendix A: Wayland-Sudbury. In Kerr, Robert L., Anderson, Steven J., and Jaksch, John, Crosscutting analysis of trading programs: case studies in air, water, and wetland mitigation trading systems. Kerr, Greiner, Anderson & April and Battelle Pacific Northwest Division. A report prepared for the National Academy of Public Administration. Retrieved May 13, 2004 from http://www.napawash.org/pc_economy_environment/epa0601.pdf
Massachusetts Department of Environmental Protection (MA DEP) (2003). Appendix I: nutrient trading: background and case studies. In The Massachusetts Estuaries Project: embayment restoration and guidance for implementation strategies. Retrieved May 4, 2004 from http://www.mass.gov/dep/smerp/files/mepappen.pdf
McDonald, Matt (2003, December 28). Raytheon site eyed by officials: some see an opportunity to develop ‘new town in town.’ Boston Globe, Globe West pg. 1.
Town of Wayland (n.d.). Wastewater District Commission: General Information. Retrieved May 23, 2004 from http://www.wayland.ma.us/waytow/wmdc.htm
U.S. Environmental Protection Agency (USEPA) (1998a). EPA approves unique discharge permit for developer in Wayland. Release #1998a-9-14. Retrieved July 3, 2003 from http://www.epa.gov/region1/pr/1998a/092898b.html
------(1998b). National Pollutant Discharge Elimination System (NPDES) Permit MA0039853. Issued September 4, 1998
160
Reviewed by David Pincumbe, U.S. Environmental Protection Agency, Region I and Claire Barker, Massachusetts Department of Environmental Protection.
161
Kalamazoo River Water Quality Demonstration Project (MI) A. Program Background
1. Program description A coalition of local watershed partners implemented a point/nonpoint source water quality demonstration project on the Kalamazoo River targeting voluntary nonpoint source phosphorus reductions. Program formulation began in late 1996, and the Kalamazoo Project was formally launched in July 1997 (Kieser 2000). The project was directed by a Steering Committee comprised of state and local regulatory agency representatives, industrial and municipal dischargers, farmers, agricultural organizations, local nonprofits, and environmental consultants. With a focus on consensus building and community participation, the negotiations over trading rules and credit allocation took nearly two years. The Steering Committee administered a fund, financed by grants and point source contributions, to support the installation of nonpoint source phosphorus controls. The Natural Resources Conservation Service (NRCS) partnered with the project to develop conservation plans, oversee the installation of phosphorus controls, and provide follow-up inspections. All credits generated from the project fund were banked with the Steering Committee. In purchasing nonpoint source reduction credits, point sources would receive credits in proportion to their contribution to the cost of best management practices (BMPs). Although farmers were much more reluctant to participate than had been expected, the project eventually succeeded in implementing BMPs and structural controls at six sites beginning in 1998. The credits generated by these controls were never purchased, however, and they were retired when the demonstration project ended in late 2000. A local paper company had contributed $25,000 to the fund in anticipation of credits needed to address a production increase. The paper company’s participation had helped drive community support of trading and had served to establish initial nonpoint source targets, but the company went out of business before purchasing credits. Consequently, the project shifted towards credit banking, but no other credit purchasers were identified before the end of the demonstration project in 2000. (David Batchelor, personal communication, March 21, 2003).
2. Program motivation
Three interests coalesced in 1996-1997 to create the Kalamazoo River demonstration project: a local coalition’s interest in reducing nonpoint source pollution, the State of Michigan’s desire for a pilot trading program, and a local paper company’s interest in accommodating increased wastewater loads of phosphorus from new production that would otherwise require expensive capital investments for new equipment. Trading provided an opportunities for
162
lower compliance costs. The paper company, which processed special orders and had cyclical production needs, wanted to increase discharge in order to reach maximum production capacity at select times of the year. Despite recent upgrades to control Biochemical Oxygen Demand (BOD), it was estimated that holding phosphorus discharge steady at 1 mg/L would require another $1.5-2 million in engineering and capital costs and $500,000/yr in operating costs (Kieser 2000). The MDEQ had denied their request to increase their discharge due to hypereutrophic conditions in the downstream impoundment, Lake Allegan, and an anticipated TMDL for the Kalamazoo River and this impoundment (Mark Kieser, personal communication, May 28, 2004). The paper mill was therefore looking for more cost-effective alternatives to upgrades (David Batchelor, personal communication, March 21, 2003). The driving motivations of the multiple stakeholders are reflected in the goals of this initiative, as explained on the DEQ website: “to form partnerships, improve water quality, optimize costs and provide greater flexibility for a sustained local economy. The project will identify policy issues and provide design information for a statewide program.” (Kalamazoo Water Quality Trading Demonstration Project Summary n.d.).
3. Pollutant being traded
Phosphorus
4. Size of program The Kalamazoo watershed includes over 2,000 square miles. There are over fifty permitted dischargers in the watershed, primarily municipal wastewater treatment plants and paper mills, although the City of Kalamazoo Water Reclamation Plant and the Crown Vantage Paper Company were the only major point sources in the demonstration project study area (Kieser 2000). Potential trading participants: point sources (initially the Crown Vantage Paper Co.); farmers implementing agricultural BMPs; landowners installing streambank restoration controls
5. Stakeholders/participants
• Michigan Department of Environmental Quality (MDEQ): regulatory agency overseeing demonstration project
• The Forum of Greater Kalamazoo: nonprofit co-principal investigator for project administration and communications
• Kieser and Associates: Co-principal investigator on technical issues, voluntary chair of steering committee
163
• Natural Resources Conservation Service (NRCS): provided technical assistance to farms with conservation planning and monitoring
• Kalamazoo Conservation District: provided technical support and framework development
• City of Kalamazoo Water Reclamation Plant: provided input on municipal point source perspectives
• Crown Vantage Paper Company: potential point source purchaser of credits, assisted with technical review and framework development
• Menasha Corporation-Paperboard Division: contributed industrial perspective on trading
• Kalamazoo Environmental Council: contributed environmental community perspective on trading
• Michigan Farm Bureau: contributed agricultural perspective and assisted with outreach to farmers
• Michigan Agricultural Stewardship Association: provided agricultural perspective and agricultural participant monetary support
• Michigan Department of Agriculture: provided regulatory perspectives for agriculture
• Michigan Integrated Food and Farming Services (MIFFS): advocate and public liaison representative for agricultural NPS partners
(for more detailed list of roles, see Kieser 2000).
6. Regulatory drivers The demonstration project preceded a TMDL, although the fact that a TMDL was in the pipeline was hoped to be a driver for farmers’ participation (David Batchelor, personal communication, March 21, 2003). The TMDL was finalized in July 2002.
B. Trade Structure 7. Determination of credit
Trading credits and costs are calculated in a six-step process: 1. Monitor to determine baseline conditions and annual reductions; 2. Apply trading ratios to calculate available credits for trading; 3. Calculate total costs, including design, construction, and monitoring; 4. Assess the life span of installed BMPs; 5. Calculate the annual cost per pound of phosphorus reductions; 6. Calculate the value of each credit based on the trading ratio and per pound costs, amortizing for the BMP life span (Kieser 2000). The minimum eligibility requirement for a baseline for agricultural credits was set by Generally Accepted Agricultural Management Practices (GAAMPs). Improvements to achieve GAAMPs were discounted 50% (Kalamazoo Water Quality Trading Demonstration Project Summary n.d.). Extensive background monitoring included historical site data, aerial
164
photographs, soils information, property use history, current practices, surface water sampling, and a revised soil loss equation (Kieser 2000).
8. Trading ratios and other mechanisms to deal with uncertainty Trading ratios were used both to deal with uncertainty and to guarantee a net environmental benefit with each trade. The trading ratio for point-nonpoint trades was 2:1 (4:1 for BMPs to achieve GAAMPs). Any point-point trades would have had a 1.1:1 trading ratio (Kalamazoo River/Lake Allegan TMDL Implementation Committee 2002). Further trading ratios and restrictions could also be used to address distance, seasonality, and equivalence (Kalamazoo Water Quality Trading Demonstration Project Summary n.d.). Service agreements with nonpoint sources established a schedule of three payments for phosphorus controls: 25% after agreeing on conservation plans, 50% after implementation and completion of controls, and the final 25% after determination that the controls are operating as proposed (Kieser 2000).
9. Liability/penalties for noncompliance
The Service Agreements established that the noncompliance results in a Steering Committee notification to correct deficiencies within 60 days. If the nonpoint source partner failed to respond, payments would need to be refunded within 90 days (Kieser 2000).
10. Approval process Once a nonpoint source project was identified, the landowner submitted a Service Agreement to the Steering Committee for approval. An example of a generic service agreement, which was modified for individual needs and site conditions, is available in Kieser 2000, Appendix A. Subsequently, Kieser & Associates completed background site monitoring, and the NRCS worked with the landowner to develop conservation plans and implement BMPs. The Steering Committee, Kieser & Associates, and the NRCS also assisted the landowners in soliciting and evaluating bids for the construction (Kieser 2000). In all, project planning and approval typically took 4-10 weeks but could take up to 4-6 months (Kieser 2000). The approval process for a point sources’ purchase of credits was not determined.
11. Ex post verification/auditing. Follow up monitoring and technical assistance are conducted by the NRCS. Kieser & Associates also conducted follow-up water quality monitoring where possible (Kieser 2000).
165

12. Mechanisms for trade identification and communication (education and outreach, third party facilitation, embedded ties) Education and Outreach. The Steering Committee identified potential nonpoint source sites using U.S. Department of Agriculture Farm Services Agency aerial photographs, U.S. Geological Survey topographic maps, and county ownership maps (Kieser 2000). Agricultural producers on the steering committee held informal meetings to educate farmers about trading and visited landowners who expressed interest (Mark Kieser, personal communication, March 27, 2003).
13. Market structure (bilateral, clearinghouse, third party brokers)
Clearinghouse. The Steering Committee acted as the clearinghouse for banking all nonpoint source credits and negotiating separately with point and nonpoint sources.
14. Types of trades allowed
Point/nonpoint. All nonpoint source credits were banked with the Steering Committee, which allocated credits to point sources. Unpurchased credits were retired in 2000 at the end of the demonstration project. Point sources could purchase credits to accommodate growth but not to discharge above their NPDES limits (Kieser 2000).
C. Outcomes
15. Types and volume of trades that have occurred Six nonpoint source projects were implemented to generate credits for trading, but no credits were purchased and the credits were retired. The six projects included agricultural BMPs on two farms (animal exclusion, soil fertility sampling, and treatment of feedlot runoff) and streambank stabilization projects on two industrial sites, one municipal site, and one private site. For more details, see Kieser 2000.
16. Administrative costs The administrative costs involved in installing nonpoint source controls include identifying and designing BMPs, creating bid specifications, obtaining bids for work, selecting contractors, overseeing construction, and calculating a cost per pound for each credit generated (Kieser 2000). Coordinating many of these activities through the NCRS helped reduce administrative costs.
17. Transaction costs
166
The purchaser would be responsible for contractual arrangements, negotiating the funding level if credits were not already generated, and post-implementation tracking (Kieser 2000).
18. Cost savings The paper company estimated that their first year capital costs would average $292/lb phosphorus, with five- and ten-year costs respectively $58.40 and $29.20/lb phosphorous. For nonpoint source controls, first year costs ranged from $8.18-$372.23/lb, with five- and ten-year costs respectively $1.64-$193.59 and $0.82-$96.80/lb (not reflecting a trade ratio). These costs indicate that the use of nonpoint source controls could be cost-effective, particularly when accounting for point source operating costs (Kieser 2000).
19. Program goals achieved While no nonpoint source credits were purchased, the Kalamazoo River demonstration project established a local framework for trading, implemented voluntary nonpoint source reductions, and demonstrated how trading can potentially be a cost-effective water quality solution before a TMDL (Kieser 2000). The MDEQ asserts that the demonstration project “is nationally recognized as a highly successful innovative program built on partnerships and voluntary local initiatives…[that] demonstrated how trading can occur, improved water quality and provided information to help design the state water quality trading program” (MDEQ n.d.).
20. Program obstacles
It took nearly two years of continuous negotiations to formulate the trading rules due to the lack of existing partnerships and interagency coordination, conflicting perceptions of various stakeholders, clashes with the personal interests of several individuals on the Steering Committee, and unexpected resistance from local environmental groups that had declined earlier involvement (David Batchelor, personal communication, March 21, 2003; Kieser 2000). A broad-based community education and participation initiative eventually built consensus around the local trading framework. The collaboration with the NRCS was valuable for reducing administrative costs and giving farmers a trusted contact. The lack of sufficient NRCS staff time, however, significantly slowed the program implementation, left nonpoint sources waiting for approval, permits, and construction, and may have risked the credibility of the project (Mark Kieser, personal communication, March 27, 2003). The Project had more difficulty identifying both point source and nonpoint source participants. The City of Kalamazoo was not responsive to the trading program because it perceived a number of barriers for both economic and
167
social reasons (detailed in Kieser 2000). Farmers’s reluctance to participate is explained below.
21. NPS involvement and incentives to engage in trading. In practical terms for the farmer, there was not a significant difference between traditional cost-sharing subsidy programs and trading payments (Mark Kieser, personal communication, March 27, 2003). Furthermore, it was anticipated that the specter of a future TMDL would have provided an incentive to implement BMPs before they became mandatory. Yet the project did not achieve widespread support from the agricultural community because farmers did not trust regulators, were afraid of being targeted as polluters, and were reluctant to make voluntary changes that might later become required (David Batchelor, personal communication, March 21, 2003). Informal meetings with farmers on the Steering Committee were instrumental in recruiting two farmers for trading. Identifying sites by geographic location (rather than the farmer’s name) and letting the farmers work with trusted and recognized agricultural contacts were also important steps in eliciting farmers’ voluntary participation (Kieser 2000).
22. Other Program information/References
Websites: Environmental Trading Network. http://www.envtn.org Kalamzooriver.net: “water resource information for the Kalamazoo River watershed communities.” http://www.kalamazooriver.net Contacts: Mark Kieser, Senior Scientist, Kieser and Associates. (269) 344-7117 David Batchelor, US EPA. Retired. Written program information: Environomics (1999). A summary of U.S. effluent trading and offset projects.
A report prepared for Dr. Mahesh Podar, U.S. Environmental Protection Agency, Office of Water. Retrieved May 7, 2004 from http://www.epa.gov/owow/watershed/trading/traenvrn.pdf
Kalamazoo River/Lake Allegan TMDL Implementation Committee (2002). Water quality improvement (implementation) plan for the Kalamazoo River watershed and Lake Allegan through a phosphorus Total Maximum Daily Load (TMDL) process. Retrieved October 20, 2003 from http://www.kalamazooriver.net/tmdl/implement/Implementation_text.PDF
168
Kalamazoo Water Quality Trading Demonstration Project Summary (n.d.). Retrieved May 1, 2002 from http://www.deq.state.mi.us/documents/deq-swq-trading-TradingDemonstration.doc
Kieser, Mark (2000). Phosphorus credit trading in the Kalamazoo River basin: forging nontraditional partnerships. Water Environment Research Foundation, Project 97-IRM-5C.
Michigan Department of Environmental Quality (MDEQ) (n.d.). Water Quality program overview. Retrieved February 3, 2004 from http://www.michigan.gov/deq/0,1607,7-135-3313_3682_3719-13825--,00.html
Reviewed by Mark Kieser, Senior Scientist, Kieser and Associates.
169
Minnesota River (MN) A. Program Background
1. Program description Upstream phosphorus discharge is leading to high algal growth and low dissolved oxygen concentrations in the lower 22 miles of the Minnesota River. To combat this problem a two phase process has begun. Phase I set wastewater treatment plant biochemical oxygen demand (BOD) discharge limits for plants in the lower 22 miles of the river and established a 40% BOD reduction goal for the river upstream of Shakopee (MPCA 2004). Phase I is complete. Phase II is outlined in the Lower Minnesota River Dissolved Oxygen TMDL (2004) and focuses on reducing the level of phosphorus in the river upstream of the metropolitan area in order to achieve the 40% BOD reduction. A model of phosphorus sources and their impacts was made to aid an advisory committee with assessing potential land changes and to help understand how these changes would alter phosphorus concentrations (MPCA 2004). As Phase II continues, a watershed permit which will deal exclusively with phosphorus will be drafted for the Minnesota River Basin. The implementation plan of Phase II requires that communities and all continuous and controlled dischargers explore the feasibility of a 30-50% phosphorus reduction, which will be implemented if found feasible. Two alternatives for reducing phosphorus from large wastewater treatment plants discharging 1,800 pounds per year or more of phosphorus are being considered. 1. A 1 mg/l effluent limit will be implemented in the watershed permit to
achieve a 51% phosphorus reduction in 10 years (MPCA 2004); or 2. A point-point trading system will be implemented and trades will
incorporated into an initial 5 year watershed permit. In the first 5 years, a 35% reduction in phosphorus loading will be achieved, which will be followed by a five year watershed permit requiring the 1 mg/l effluent limit described above to be met (MPCA 2004). (The watershed permit will be revised every five years subsequently).
This trading plan has been developed to allow point sources to trade phosphorus release credits with other point sources so that the pollution of facilities without treatment capacity can be offset by the facilities that do have the capacity. It is expected that after 5 years those without treatment capacity will establish treatment capacity. The trading scheme would allow flexibility in the time frame given to the large polluters to build treatment capacity. This is important because several studies on effective ways to reduce phosphorus are not complete and will not be complete until the first 5 year phase is complete. The results of these studies will be integrated into the next version of the basin wide permit after they become available. Thus a point-point trading program will allow facilities to
170
update treatment facilities after all information is made available and a more stable watershed permit has been drafted (Larry Gunderson, personal communication, May 19, 2004).
2. Program motivation
The current water-quality of the Minnesota River does not meet expectations for uses including drinking, swimming, industrial and agricultural uses, and safety of aquatic life (MPCA 2004). Low total dissolved oxygen problems are occurring in low flow periods in the lower 22 mile stretch of the Minnesota River (MPCA 2004). Upstream input of phosphorus has been found to influence downstream total dissolved oxygen concentrations (MPCA 2004). In 1985, a Wasteload Allocation Study established biochemical oxygen demand (BOD) discharge limits for plants on the lower 22 miles of the river as Phase I of the TMDL (MPCA 2004). Phase II will target phosphorus because high phosphorus levels will result in high algal growth which leads to low dissolved oxygen (MPCA 2004).
3. Pollutant being traded
Phosphorus.
4. Size of program The Minnesota River is about 335 miles long and flows from Big Stone Lake to where it meets the Mississippi at Fort Snelling (MPCA 2004). The River Basin covers almost 17,000 square miles, almost 20% of the state with approximately 486,000 residents (MPCA 2004). Parties to trade: Point source polluters without treatment capacity are expected to trade with those who have treatment capacity if the point-point trading scheme is implemented.
5. Stakeholders/participants Advisory Committee: A 45 member advisory committee was established to discuss the model of phosphorus sources and the potential impacts of changes in land use (MPCA, 2004). The committee was composed of cites and their consulting groups, industry, agriculture, commodity groups, counties, watershed projects, and environmental groups (MPCA 2004). Minnesota River Assessment Project (MRAP): The MPCA and other agencies founded this project to look into upstream sources of BOD. Summarizes of their studies on water-quality issues on the river can be found at:
171

http://mrbdc.mnsu.edu/projects/
6. Regulatory drivers Clean Water Act/ EPA’s Water Quality Planning and Management Regulations Both of these pieces of legislation require states with polluted water bodies that do not meet criteria of good health, to develop TMDL’s for these water bodies (MPCA 2004). Lower Minnesota River Dissolved Oxygen Total Maximum Daily Load Report This report sets out the draft TDML for the lower Minnesota River. The TDML is 752 pounds of phosphorus per day including a waste allocation for point sources, a load allocation for nonpoint sources, a margin of safety (based on modeling assumptions), and a reserve capacity for growth (MPCA 2004). This is a reduction from the 1,240 pounds currently projected to enter the basin during critically low flow conditions (MPCA 2004). According to the a Minnesota Pollution Control Agency (MPCA) “the emphasis of this low flow TMDL is on wastewater facilities, although agriculture, noncompliant ISTS and stormwater are also considered” (MPCA, 2004). The modeling done for the Advisory Committee led to the realization that it is the point sources that are the largest contributors to the phosphorus problem, and thus the TMDL focuses on reducing point source phosphorus discharge (Larry Gunderson, personal communication, May 19, 2004) Watershed Permit for the Minnesota River Basin A wastewater permit for the entire basin will be drafted requiring wastewater treatment facilities discharging over 1,800 pounds of phosphorus per year to 1) develop a phosphorus management plan with a seasonal average goal of 1 mg/l which will result in a 51% phosphorus reduction in 10 years or 2) a point-point trading program will be implemented so that dischargers can choose to treat to meet an individual 35% reduction goal, or trade to meet the 35% reduction goal as part of a trade association team (MPCA 2004). Furthermore, all communities and continuous and controlled dischargers will evaluate the potential of a 30-50% phosphorus reduction, and, where feasible, will implement these reductions (MPCA 2004). Lower Minnesota River Model project: This project should be completed by the Metropolitan Council in 2007 and its findings will be incorporated into future watershed permits and TMDL allocations. Revised 1985 Wasteload Allocation: The 1985 Wasteload Allocation should be revised by the MPCA after the completion of the Lower Minnesota River Model. Any information gained from the potential trading program between point sources will be included in the final allocations as well (MPCA 2004).
172
B. Trade Structure
The actual watershed permit and an implementation plan have not been drafted yet. However, the TMDL gives some vague idea of what trading may be like, under the implementation strategy chosen.
7. Determination of credit
It has been implied in the 2004 TMDL report that perhaps a 1.1 to 1 ratio in trading would be used (MPCA 2004). This would lead to a net benefit from trading and provide a margin of error.
8. Trading ratios and other mechanisms to deal with uncertainty N/A
9. Liability/penalties for noncompliance N/A
10. Approval process
N/A
11. Ex post verification/auditing. N/A
12. Mechanisms for trade identification and communication (education and
outreach, third party facilitation, embedded ties) N/A
13. Market structure (bilateral, clearinghouse, third party brokers)
N/A
14. Types of trades allowed It is anticipated that only point-point trading would occur between the 40 1,800 pound plus polluters (Larry Gunderson, personal communication, May 19, 2004). It is planned that trade agreements will take into account both geographic transport factors, and actual discharged loading (MPCA 2004). Both of these factors have been explored in modeling experiments and will help access the potential outcomes and success of trades.
173
C. Outcomes
No trades have occurred.
15. Types and volume of trades that have occurred N/A
16. Administrative costs N/A
17. Transaction costs
N/A
18. Cost savings N/A
19. Program goals achieved N/A
20. Program obstacles
N/A
21. NPS involvement and incentives to engage in trading. N/A
22. Other
Program information/References Websites: N/A Contacts: Gunderson, Larry, Minnesota River Basin Coordinator, Minnesota Pollution Control Agency. (651) 297-3825. Written Program Information:
174
Minnesota Pollution Control Agency (MPCA): Regional Environmental Management Division (2004). Lower Minnesota River Dissolved Oxygen Total Maximum Daily Load Report. Accessed online May 19, 2004 from the World Wide Web: http://www.pca.state.mn.us/publications/reports/tmdl-final-lowermn-doreport.pdf
175
Rahr Malting Company Permit (MN) A. Program Background
1. Program description The Rahr Malting Company negotiated an agreement with the Minnesota Pollution Control Agency (MPCA) to offset five-day carbonaceous biochemical oxygen demand (CBOD5) discharge from its new wastewater treatment plant by funding upstream nonpoint source phosphorus reductions. A TMDL on the Minnesota River had barred Rahr from obtaining a load allocation for CBOD5 and therefore from building a wastewater treatment plant, but Rahr worked cooperatively with the MPCA, the EPA, and several environmental organizations to craft a NPDES permit incorporating pollution trading. Rahr’s permit was issued in 1997. Their wastewater treatment plant began operating in June, 1999 under an effluent cap of 2 mg/L for phosphorus and 12 mg/L average for CBOD5 (estimated at 150 lbs/day of CBOD5). To secure nonpoint source offsets, Rahr established the Minnesota River Corporate Sponsorship Program with a $275,000 fund (Riggs and Hartwell 2000). The board of this fund oversees the selection of nonpoint source projects and must include representatives from Rahr, state agencies, and local citizen groups (MPCA 1997a). In the five years of the project, Rahr achieved the nonpoint source credit requirements through four trades. Two projects converted farmland back to floodplain by restoring vegetation and setting aside the land through easements. Two projects stabilized eroding stream banks with structural work, one of which additionally included livestock exclusion (Fang and Easter 2003).
2. Program motivation
Rahr’s desire to operate its own wastewater treatment plan was part of a strategy to reduce and control costs while increasing production by 20%. Rahr’s discharge had been treated at the Blue Lake regional wastewater treatment plant, and the planned expansion would have cost an additional $1 million in sewer access charges (Peplin 1998). Rahr was initially unable to obtain an NPDES permit in 1996, since a TMDL for CBOD5 on the Minnesota River did not allow for an additional load allocation (US EPA 2003). Rahr’s discharge was already allocated to Blue Lake facility, and Rahr was unable to get the discharge rights transferred. Water quality trading – in this case reducing upstream nutrient discharge as a means of reducing downstream oxygen demand – remained the only viable solution.
176
3. Pollutant being traded
Phosphorus, nitrogen, 5-day carbonaceous biochemical oxygen demand (CBOD5), and sediment.
4. Size of program Rahr Malting Company is the single point source. Nonpoint source sites must be upstream of Shakopee in the Minnesota River Basin. In all, the Minnesota River Basin drains 16,700 square miles. Nonpoint sources account for 74% of the phosphorus loading in the watershed under long-term average flow conditions (MPCA n.d.). Trading parties: Rahr Malting Company; farmers
5. Stakeholders/participants • Rahr Malting Company • Minnesota Pollution Control Agency (MPCA): issues NPDES permit,
approves nonpoint source projects, conducts site visits to monitor nonpoint source projects
• Soil and Water Conservation Districts: helped determine selection of BMPs
• EPA Region V: advised modification of NPDES permit • City of New Ulm: assisted with monitoring • Coalition for a Clean Minnesota River: helped identify nonpoint source
projects and negotiate with farmers • HDR Inc., American Wetland Engineering: consultants
6. Regulatory drivers
In 1988, a TMDL for the lower Minnesota River had been established for CBOD5. The loads for CBOD5 were fully allocated to other point sources under the TMDL. Rahr was therefore unable to obtain the load allocation necessary for discharging to the river.
B. Trade Structure 7. Determination of credit
The MPCA specified that acceptable projects include soil erosion BMPs, livestock exclusion, rotational grazing, wetland restoration, and land set-asides. BMPs that are already being widely adopted, such as reduced tillage, would not be considered additional and are therefore not eligible for trading. The permit is able to trade off nonpoint source nutrient discharge (phosphorus, nitrogen, and sediments) and point source CBOD5 loading because the
177
nutrient discharge is converted to organic matter, whose subsequent decay increases oxygen demand. The MPCA based the crediting ratio for these multiple parameters on the research of Erwin Van Nieuwenhuyse (formerly MPCA staff) correlating phosphorus with chlorophyll-a and chlorophyll-a with CBOD5. The phosphorus to BOD credit ratio is 1:8 in addition to a 0.75 safety factor for soil phosphorus content. The nitrogen to BOD ratio is 1:4, and calculations of nitrogen will assume a field loss factor of 50%. Furthermore, the credits are discounted using delivery ratios (DR) to account for location. A DR of 100% will be used for riparian areas, but the DR is reduced to 20% for lands within a quarter mile and 10% for lands further away (MPCA 1997a). The credits are granted in a schedule to give the point source greater flexibility in meeting the permit requirements: 45% are granted when the contractual agreements are reached, 45% when the nonpoint source controls have been implemented, and 10% when vegetation establishment criteria are reached (Fang and Easter 2003).
8. Trading ratios and other mechanisms to deal with uncertainty In addition to the ratios correlating nutrients, a 2:1 trading ratio is applied to trades. BMPs must be visually trackable or monitorable, as well as subject to a contract for long-term assurance of BMPs (MPCA 1997a). The corporate sponsorship program uses long-term contracts, easements, and land purchases.
9. Liability/penalties for noncompliance The NPDES permit specifies that Rahr is liable for securing nonpoint source credits, and noncompliance is subject to enforcement. If a nonpoint source seller defaults, then Rahr is responsible for finding another project (Jim Klang, personal communication, June 4, 2003).
10. Approval process
The Commissioner of the MPCA gives final approval for each nonpoint source project and determines the amount of CBOD5 credits generated (MPCA 1997a).
11. Ex post verification/auditing. For both of the Minnesota trading programs, the point source is responsible for submitting technical and engineering reports, including structural specification, operation plans, and detailed photographs, to the MPCA before and after each trade (Fang and Easter 2003). The permit also requires annual reports accounting for nonpoint source credits (MPCA1997). The MPCA monitors the implementation of BMPs with period site inspections. However, the MPCA does not verify pollution reduction with systematic monitoring,
178
which would be very expensive and would have to be long-term to generate conclusive results (Fang and Easter 2003).
12. Mechanisms for trade identification and communication (education and
outreach, third party facilitation, embedded ties) Third Party Facilitation. A board of citizens, state officials, and company representatives oversee the final selection of BMP sites, but the process of initial trade identification was very “network driven” and depended on local environmental organizations and agency personnel (Scott Sparlin, personal communication, April 27, 2003). Two trades were identified by CCMR, one trade was identified by a hydrologist from the Minnesota Department of Natural Resources (DNR), and one trade was identified by a member of the American Waters’ local chapter (Fang and Easter 2003).
13. Market structure (bilateral, clearinghouse, third party brokers)
Sole-source offsets. [note: Woodward, Kaiser, and Wicks (2002) identify Rahr as a clearinghouse because of the trust fund]. Rahr is responsible for identifying and contracting for nonpoint source credits to satisfy its NPDES permit.
14. Types of trades allowed Point/nonpoint. Trading provisions are written into the NPDES permit. If Rahr discharges less than 150 lb/day of CBOD5, then they are not required to obtain 150 nonpoint source load reduction units within the term of the permit. Rahr does, however, have to achieve the reductions within ten years (MPCA 1997a).
C. Outcomes
15. Types and volume of trades that have occurred Rahr funded four nonpoint source projects. Two included conservation easements and vegetation restoration on former floodplains. Two involved structural streambank stabilization, one of which also included animal exclusion at a feedlot operation. (Fang and Easter 2003).
16. Administrative costs See below under “Transaction Costs.” Fang and Easter (2003) provide comprehensive information on transaction costs that include program administration.
17. Transaction costs
179
The transaction costs associated with this trading program were high because there was no water quality trading precedent in Minnesota. Rahr and the MPCA had to design a permit and trading framework, determine the effectiveness of BMPs, negotiate with landowners, write detailed contracts, and monitor the implementation of nonpoint source controls. The participation of CCMR in identifying trades significantly helped to reduce transaction costs (Riggs and Hartwell 2000).
Fang and Easter (2003) break down transaction costs between the permitting and implementation phases. During the two-year permitting phase Rahr spent about $16,500 ($12,000 for consultants and $4,500 for staff time), while the MPCA spent about $51,800 on staff time. During the implementation phase, Rahr spent about $2,200 on staff time, the MPCA spent about $33,000 on staff time, a local citizen’s group spent about $750, and nonpoint sources spent about $500 on legal assistance. The grand total for transaction costs during these two phases was about $105,000, 81% of which were borne by the MPCA as it designed the overall trading structure (Fang and Easter 2003).
18. Cost savings Overall, nonpoint source phosphorus control did appear to be cost-effective. The four nonpoint source projects controlled phosphorus at costs ranging from $2.22 to 2.64/lb during the five years permit phase, which sets the cost of credits (calculated with a 2:1 trading ratio) from $4.44-5.28/lb P. Including the transaction costs raises the average cost of nonpoint source phosphorus control to $8.56 over five years, but if the structural improvements last twenty years, which is likely, then the annualized cost is reduced to about $2.10/lb P. To compare this to pollution control costs outside of a trade, we have to use the cost of controlling CBOD5 to 1 mg/L through the municipal WWTP. Senjem (1997) estimated this point source control at $4-18/lb P for capital and operating costs, based on a 20 year investment and an 8% annual interest rate. For more details about costs, see Fang and Easter (2003).
19. Program goals achieved Yes. Rahr achieved its goal of building its own WWTP, which lowered production costs and increased operational flexibility. This offset was also an environmental success; Rahr obtained nonpoint source credits for 204 lb CBOD5 per day, exceeding its discharge of 150 lb CBOD5/day (USEPA 2003).
20. Program obstacles
One significant challenge was defining the appropriate trade ratio between upstream nonpoint source phosphorus loading and CBOD discharges from Rahr’s WWTP (Riggs and Hartwell 2000; Fang and Easter 2003). The
180
MPCA was able to determine a 1:8 trading ratio by conducting studies relating phosphorus to chlorophyll-a and chlorophyll-a to CBOD. Local environmentalists initially objected to the trading program, but Rahr gained their support by cooperatively working with and accepting input from environmental organizations (Riggs and Hartwell 2000).
21. NPS involvement and incentives to engage in trading. NPS were financially compensated, and the BMPs provided ancillary benefits by improving land stability. In the case of two agricultural sites, the farmers were very concerned about the severe riverbank erosion that threatened their agricultural land, fences and buildings, and for years they had been searching unsuccessfully for financial assistance (Riggs and Hartwell 2000; Fang and Easter 2003). Landowners’ participation also had a strong social component. Farmers were recognized for their good stewardship of the land, and newspaper coverage helped build community support. The trading program may also have been well-received in the agricultural community because it was seen as a private initiative, while CCMR’s participation meant that farmers were approached by a trustworthy local conservationist rather than a corporate, governmental, or environmental representative (Scott Sparlin, personal communication, April 27, 2003).
22. Other Rahr benefited from the fact that it was already viewed as a “good actor” in the watershed and worked cooperatively with local stakeholders (Jim Klang, personal communication, June 4, 2003). In addition, they were able to give something back to the community. Rahr donated two sites, one to the City of New Ulm and one to the Coalition for a Clean Minnesota River, to be used for parkland and environmental education (Fang and Easter 2003).
Program information/References Websites: See individual online documents, listed below Contacts: Jim Klang, Minnesota Pollution Control Agency. (651) 296-8402. Scott Sparlin, Coalition for a Clean Minnesota River, (507) 359-2346. Written Program Information:
Environomics (1999). A summary of U.S. effluent trading and offset projects. A report prepared for Dr. Mahesh Podar, U.S. Environmental Protection Agency, Office of Water. Retrieved May
181
7, 2004 from http://www.epa.gov/owow/watershed/trading/traenvrn.pdf
Fang, Feng and Easter, K. William (2003). Pollution Trading to Offset New Pollutant Loadings -- A Case Study in the Minnesota River Basin. Presented at the American Agricultural Economics Association Annual Meeting, Montreal, Canada, July 27-30, 2003. Retrieved March 15, 2004 from http://www.envtn.org/docs/MN_case_Fang.pdf
Minnesota Pollution Control Agency (MPCA) (n.d.). Phosphorus in the Minnesota River. Retrieved March 16, 2004 from http://www.pca.state.mn.us/water/pubs/mnr-phos.pdf
------(1997a). National Pollutant Discharge Elimination System (NPDES) and State Disposal System (SDS) Permit MN 0031917. Issued January 8, 1997.
------(1997b). Case study: Minnesota – pollutant trading at Rahr Malting Co. (1997). Presented at the Environmental Regulatory Innovations Symposium, November 5-7, 1997. Retrieved January 19, 2002 from http://www.pca.state.mn.us/hot/es-mn-r.html
Peplin, Robert (1998). Regulating runoff. Forum for Applied Research and Public Policy. 13(3): 45-48.
------(1997). Trading up. Pollution Engineering 29(7): 50-53. Riggs, David W. and Hartwell, Christopher A. (2000). Environmental
flexibility in action: a Minnesota case study. Reason Public Policy Institute, Policy Study #265. Retrieved March 24, 2003 from http://www.rppi.org/environment/ps265.html
Senjem, Norman (1997). Case Study: Minnesota - Pollutant Trading at Rahr Malting Co. Presented at the Environmental Regulatory Innovations Symposium, Minneapolis, MN, November 5-7, 1997. Retrieved March 15, 2004 from http://www.pca.state.mn.us/hot/es-mn-r.html
U.S. Environmental Protection Agency (2003). Final permit, Rahr Malting Company. Watershed-Based Permitting Case Study #5. Retrieved March 16, 2004 from http://www.epa.gov/npdes/pubs/wq_casestudy_factsht5.pdf
Woodward, Richard T., Kaiser, Ronald A. & Wicks, Aaron-Marie B. (2002). The structure and practice of water quality trading markets. Journal of the American Water Resources Association. 38: 967-979
Reviewed by Jim Klang, Minnesota Pollution Control Agency.
182
Southern Minnesota Beet Sugar Cooperative Permit (MN) A. Program Background
1. Program description The Minnesota Pollution Control Agency (MPCA) incorporated water quality trading provisions into the wastewater treatment permit for the Southern Minnesota Beet Sugar Cooperative (SMBSC). A TMDL on the lower Minnesota River prohibited the addition of a new discharger, but the MPCA allowed SMBSC to build a wastewater treatment plant providing it offset all discharge with nonpoint source phosphorus reductions. The permit was issued in April, 1999. SMBSC was obligated to establish a trust fund of $300,000 to implement nonpoint source projects. A trade board, made up of a processing plant official, SMBSC’s consultant, a Soil and Water Conservation District official, the Hawk Creek watershed coordinator, and an environmental advocacy representative, oversees the release of funds (Jim Klang, personal communication, June 4, 2003). SMBSC is able to discharge nearly 5,000 lbs of phosphorus per year, and in the first two years it offset this discharge by contracting with its beet growers to grow spring cover crops on about 36,000 acres (Fang and Easter 2003). In the future, SMBSC may shift towards more permanent and cost-effective nonpoint source projects, such as replacing surface tile water intake systems with subsurface tiles (Jim Klang, personal communication, June 4, 2003).
2. Program motivation SMBSC wanted to build a wastewater treatment plant to accommodate a proposed 40% expansion in production. Previously, wastewater was stored in holding ponds during the processing season and spray-irrigated over 500 acres of alfalfa and grassland during the growing season (Fang and Easter 2003). This approach was reaching its limits because hydrogen-sulfide from the holding ponds had created a major odor nuisance and more land was needed for spray irrigation (Jim Klang, personal communication, June 4, 2003). The wastewater treatment plant would have discharged into a tributary of the Minnesota River, but the TMDL for the lower Minnesota River for CBOD5 was already fully allocated and prohibited additional dischargers. Water quality trading was the only viable strategy for accommodating the addition of SMBSC as a discharger (Jim Klang, personal communication, June 4, 2003).
3. Pollutant being traded
Phosphorus
4. Size of program
183
SMBSC is the sole point source. Landowners in the lower two-thirds of the Minnesota River Basin are eligible nonpoint sources (MPCA 1999). There are 600 beet growers, cultivating a total of 120,000 acres, in this region (Jim Klang, personal communication, June 4, 2003), and approximately 100 growers have participated in the program during each of the last four years (Griesser 2004). In all, the Minnesota River Basin drains 16,700 square miles. Nonpoint sources account for 74% of the phosphorus loading in the watershed under long-term average flow conditions (MPCA n.d.). Trading parties: SMBSC, sugar beet farmers, cattle ranchers
5. Stakeholders/participants • Southern Minnesota Beet Sugar Cooperative (SMBSC) • Minnesota Pollution Control Agency (MPCA): issues NPDES permit,
approves nonpoint source projects, conducts site visits to monitor nonpoint source projects
• Minnesota Department of Natural Resources (MDNR) • Minnesota River Basin Joint Powers Board: facilitated the negotiation on
the Memorandum of Understanding (MOU) between SMBS, the MPCA, the MDNR, the Hawk Creek Watershed Project, Chippewa River Watershed Project, Redwood-Cottonwood Rivers Control Area, Sibley County Water Resources Advisory Committee, Rivers Council of Minnesota, and Minnesota Center for Environmental Advocacy (MCEA).
• Sugar beet growers (shareholders in SMBSC): have implemented cover crop BMPs to satisfy the nonpoint source requirements of the SMBSC permit.
• Cattle ranchers: were approached by SMBSC as a potential trading partner.
6. Regulatory drivers
A TMDL has existed since 1988 on the lower Minnesota River for carbonaceous biochemical oxygen demand as determined by a five-day test (CBOD5). The loads for CBOD5 were fully allocated to other point sources under the TMDL. SMBSC’s wastewater treatment plant would have discharged into Beaver Creek, a tributary to the Minnesota River.
B. Trade Structure 7. Determination of credit
The MPCA specified that acceptable BMPs included cattle exclusions, buffer strips, constructed wetlands, set-asides, alternative surface tile inlets and cover cropping, all of which are designed to reduce the runoff of phosphorus to surface waters (MPCA 1999).
184
The SMBSC NPDES permit specifies the formulas used to calculate phosphorus credits from each BMP. For soil erosion and cover cropping BMPs, the Revised Universal Soil Loss Equation (RUSLE) was used to estimate the soil erosion reduction (tons/acre/year), which was subsequently multiplied by area, a delivery ratio, and a soil phosphorus content factor to determine phosphorus reductions. For cattle exclusion and rotational grazing, the phosphorus load is calculated from the manure deposited in each pasture area and the associated phosphorus content and delivery ratio. The permit also specifies phosphorus reduction calculations for critical area set-asides, constructed wetland treatment systems, and alternative surface tile inlets (Fang and Easter 2003).
8. Trading ratios and other mechanisms to deal with uncertainty The trading ratio is 2.6:1, which reflects 1 lb for the offset, 1 lb for environmental improvement, and 0.6 lb as an “engineering safety factor” (Environomics 1999).
9. Liability/penalties for noncompliance SMBSC is liable for ensuring nonpoint source phosphorus reductions. If BMPs are not properly implemented or maintained, then the SMBSC will be responsible for identifying another project (Jim Klang, personal communication, June 4, 2003).
10. Approval process After a trade has been approved by the trade board, it must receive final approval from the MPCA. Compared to the Rahr Malting Company’s permit, SMBSC’s permit had many more prescriptive elements for documenting BMPs to submit for approval (Jim Klang, personal communication, June 4, 2003)
11. Ex post verification/auditing.
For both of the Minnesota trading programs, the point source is responsible for submitting technical and engineering reports, including structural specification, operation plans, and detailed photographs, to the MPCA before and after each trade (Fang and Easter 2003). The permit also requires annual reports accounting for nonpoint source credits (MPCA 1997). The MPCA monitors the implementation of BMPs with periodic site inspections, randomly auditing 10% of the contract sites (Griesser 2004). However, the MPCA does not verify pollution reduction with systematic monitoring, which would be very expensive and would have to be long-term to generate conclusive results (Fang and Easter 2003).
185
12. Mechanisms for trade identification and communication (education and outreach, third party facilitation, embedded ties) Embedded Ties. Although SMBSC did approach several cattle ranchers as potential trade partners, nearly all nonpoint source credits have come from the beet growers who are shareholders in SMBSC.
13. Market structure (bilateral, clearinghouse, third party brokers)
Sole-source offset with bilateral negotiation. SMBSC is responsible for identifying and contracting for nonpoint source credits to satisfy its NPDES permit.
14. Types of trades allowed Point/nonpoint.
C. Outcomes
15. Types and volume of trades that have occurred Out of a total of 120,000 acres in cultivation for sugar beets, spring cover cropping had been implemented on 35,839 acres during 2000 and 2001. SMBSC generated an average of 5,765 lbs. of phosphorus credits each year, which exceeds their discharge limit of approximately 5,000 lbs (Fang and Easter 2003). As of spring 2004, SMBSC has worked with a total of 399 cover crop contracts for over 39,000 acres (Jim Klang, personal communication, May 18, 2004). SMBSC also contracted with one cattle operation for a cattle exclusion and bank stabilization project (Jim Klang, personal communication, June 6, 2003). In addition, SMBSC has been working with Hawk Creek Watershed Organization to install surface tile intakes and is exploring surface tile intake contracts with Redwood River and Chippewa River organizations (Jim Klang, personal communication, May 18, 2004).
16. Administrative costs Fang and Easter (2003) estimated that the SMBSC program required approximately three times more staff time than the Rahr Malting Co. program due to the large number of trades and the individual approval required for each trade. SMBSC disputes Fang and Easter’s conclusions (Jim Klang, personal communication, May 18, 2004). See below under “Transaction Costs” for more details.
17. Transaction costs SMBSC finalized its trading framework and NPDES permit in one and a half years. The MPCA’s experience with the Rahr Malting Co. permit presumably
186
helped reduce the permitting time and associated transaction costs for SMBSC (Fang and Easter 2003). SMBSC reduced the costs of identifying trades and negotiating with farmers by trading with its own shareholders, the beet growers. Despite the advantages of this internal trading, however, the total transaction costs may be higher than in the Rahr Malting Co. project because of the MPCA staff time required to administer the trades (Fang and Easter 2003). The cover crop BMPs required a large number of individual trades, each of which had to be individually documented and verified by the MPCA staff.
18. Cost savings SMBSC implemented BMPs on approximately 18,000 acres/year, generating an average of 5,765 lbs of phosphorus reduction credits. Since SMBSC paid farmers $2/acre to implement spring cover crop BMPs, the cost to SMBSC of nonpoint source offsets was $6.22/lb. However, this does not reflect that farmers themselves incurred a cost of $6/acre, which would bring the actual cost of phosphorus credits to $18.65/lb, while including transaction costs could drive the cost higher than $24/lb. Fang and Easter (2003) conclude from this analysis that SMBSC’s trading was not more cost-effective than the phosphorus controls for a small-to-medium sized waste water treatment plant. SMBSC, however, disputes Fang and Easter’s conclusions (Jim Klang, personal communication, May 18, 2004). Fang and Easter (2003) compared the nonpoint source controls to the cost of reducing point source discharge from 1.5 mg/L to 1.0 mg/L, but SMBSC was actually looking at bringing the limit down to 0 mg/L, a scenario in which trading did indeed lower compliance costs (Griesser 2004). SMBSC does not release the details of the actual trading costs out of concerns that doing so may encourage farmers to demand a higher offset price (Griesser 2004).
19. Program goals achieved Water quality trading enabled SMBSC to obtain an NPDES permit and solved the hydrogen-sulfide odor problem that had been a significant community nuisance. SMBSC has successfully met its nonpoint source offset requirements by implementing sugar beet spring cover crops. The wastewater treatment plant can discharge a maximum of 4,982 lbs of phosphorus/year, and the cover crop BMPs generated reduction credits for 5,675 lbs. phosphorus/year (Fang and Easter 2003).
20. Program obstacles
The environmental community was initially uneasy with the trading program because SMBSC had a history of environmental compliance problems. Consequently, the NPDES permit was contingent on the resolution of these
187
alleged environmental violations. SMBSC entered into a Compliance Agreement with the MPCA that contained a schedule of corrective actions, including the implementation of an environmental management system (MPCA 1999). SMBSC’s sub-par environmental track record, coupled with concerns that the Rahr permit had not required enough explicit documentation, resulted in the SMBSC permit having more prescriptive requirements than the Rahr permit (Jim Klang, personal communication, June 4, 2003). SMBSC tried to engage several cattle ranchers as potential trade partners, but they were turned down by three cattle operations. Most likely the ranchers did not want to cooperate with SMBSC because of historical tensions between ranchers and beet growers regarding land values (Jim Klang, personal communication, June 4, 2003).
21. NPS involvement and incentives to engage in trading.
Although farmers were compensated at $2/acre for implementing BMPs, it actually cost farmers $6/acre. The spring cover crops provide additional benefits to farmers, however, by protecting young sugar beet plants (Fang and Easter 2003). SMBSC tried to engage cattle farmers for the trade, and they did have one contract for cattle exclusion and bank stabilization. Three other cattle farmers turned them down, most likely because of tensions between cattle farmers and sugar beet growers. The cattle farmers thought that the beet growers drove up land prices, and they did not want to do business with the beet growers even if it made financial sense (Jim Klang, personal communication, June 4, 2003).
22. Other Fang and Easter (2003) assert that the use of the Revised Universal Soil Loss Equation (RUSLE) may have underestimated the phosphorus load reductions from soil erosion BMPs. They have compared RUSLE to the Agricultural Drainage and Pesticide Transport (ADAPT) model, which also includes hydrology components.
Program information/References Websites: See individual online documents, listed below Contacts: Jim Klang, Minnesota Pollution Control Agency. (651) 296-8402
188
Written Program Information: Environomics (1999). A summary of U.S. effluent trading and offset projects.
A report prepared for Dr. Mahesh Podar, U.S. Environmental Protection Agency, Office of Water. Retrieved May 7, 2004 from http://www.epa.gov/owow/watershed/trading/traenvrn.pdf
Fang, Feng and Easter, K. William (2003). Pollution Trading to Offset New Pollutant Loadings -- A Case Study in the Minnesota River Basin. Presented at the American Agricultural Economics Association Annual Meeting, Montreal, Canada, July 27-30, 2003. Retrieved March 15, 2004 from http://www.envtn.org/docs/MN_case_Fang.pdf
Griesser, J. Elliot (2004). Offset projects: success and suitability in addressing water quality impairment. Unpublished master’s thesis, Bard College, Annandale on Hudson, NY.
Minnesota Pollution Control Agency (MPCA) (n.d.). Phosphorus in the Minnesota River. Retrieved March 16, 2004 from http://www.pca.state.mn.us/water/pubs/mnr-phos.pdf
-------(1999). MPCA, Beet Sugar Cooperative, State and Local Groups Craft Innovative Watershed Protections in Southwestern Minnesota. News Release, May 12, 1999. Retrieved January 19, 2002 from http://www.pca.state.mn.us/news/may99/nr51299.html
Reviewed by Jim Klang, Minnesota Pollution Control Agency.
189
Truckee River Water Quality Settlement Agreement and Truckee Meadows Wastewater Reclamation Facility Permit (NV) A. Program Background
1. Program description The Cities of Reno and Sparks, Washoe County, and the Nevada Division of Environmental Protection (DEP) are developing creative solutions to solve water quality and flow issues in the Truckee River, which flows from Lake Tahoe to Pyramid Lake through the Cities of Reno and Sparks. Three avenues of water quality trading are being explored to authorize increased discharge at the Truckee Meadows Water Reclamation Facility (TMWRF): water rights purchases and flow augmentation as part of the 1996 Truckee River Water Quality Settlement Agreement (WQSA), point/nonpoint trading for agricultural best management practices (BMPs) and septic conversions, and point/point trading with two other wastewater treatment plants (WWTPs). Under the WQSA, Reno, Sparks, Washoe County, and the Department of the Interior will purchase water rights to improve water quality and increase instream flows. The water will be held in a federal reservoir and released to the river during the summer, when the river is very low or even dry (US DOJ 1996). This arrangement does not constitute direct trading or offsets, since Reno and Sparks will not receive a higher wasteload allocation (WLA) in exchange for increasing instream flow. However, since the higher flows will enable the river to carry a higher nutrient load, and since this increased assimilative capacity could lead to an increased TMDL and WLA, the Cities’ acquisition of water rights could indirectly allow greater discharge at TMWRF in the future (RWPC 2004). When the WQSA was granted a five-year extension in 2001, only seventeen contracts for water rights had been signed (Cheryl McGovern, personal communication, July 21, 2003). By spring 2004, 33 contracts, totaling 4197 acre feet of water, have been signed (Susan Rothe, personal communication, May 27, 2004). Only a fraction of the water rights needed to fulfill the WQSA have been acquired so far, but purchases will be initiated on a much larger scale once the Truckee River Operating Agreement (TROA) is finalized in summer 2004 (Mahmood Azad, personal communication, May 26, 2004). Provisions in the TMWRF NPDES permit allow for two more kinds of trading. Point/point trades between TMWRF and two other WWTPs – Sparks Marina Park and Canyon Vista Group - is possible under a permit clause stating that a discharger that does not use its full allocation can share any remaining allocations with the other dischargers. (NDEP 2003, Part I.A.3). From a practical view, however, it is unlikely that this will ever lead to point/point trades, since neither Sparks Marina Park nor Canyon Vista Group
190
will be able to reduce nitrogen loading enough to create a trade (Mike Brisbin, personal communication, May 24, 2004). The outlook for point/nonpoint trades is more promising. Part I.A.5 of the TMWRF permit establishes a three-phase approach for modifying the WLA to reflect water quality trades or offsets (NDEP 2003, Part I.A.5). The Water Quality Standards Branch (WQSB) is simply waiting for TMWRF to put together a proposal (Randy Pahl, personal communication, May 20, 2004). TMWRF will probably submit a proposal in 2005, based on the Watershed Analysis Risk Management Framework (WARMF) being developed by Systech Engineers, Inc. for the Truckee River. The WARMF watershed model, which should be completed in late 2004, will estimate the predicted nutrient and sediment loading reductions from nonpoint source projects (Mahmood Azad, personal communication, May 26, 2004).
2. Program motivation The motivation for trading has been both environmental and financial. The WQSA in particular was developed to be an environmentally beneficial and cost-effective solution to accommodate the PLPT’s needs as well as the needs of the TMWRF to expand. Low flows and heavy pollutant loading have caused a variety of water quality challenges in the Truckee River. Summer flows can be low enough that there is no significant aquatic habitat, and flow augmentation can have a significant effect on the biological communities and water quality of the river (Mahmood Azad, personal communication, May 26, 2004; RWPC 2004). TMWRF needed to expand capacity, but the Cities needed to seek creative solutions because TMWRF already faced the most stringent nitrogen discharge limits in the nation as a result of the TMDL. Higher flows and lower nonpoint source pollution will mitigate the impact of TMWRF’s effluent and can allow TMWRF to expand capacity. The EPA has traditionally preferred to treat pollution rather than allowing for increased dilution, but it recognized that, given the low river flows and the difficulty of increased treatment, flow augmentation provided the greatest and most cost-effective benefits (Cheryl McGovern, personal communication, July 21, 2003).
3. Pollutant being traded Potentially point/point or point/nonpoint trades for total nitrogen, total phosphorus, or total dissolved solids (TDS); water rights purchases may enable the TMWRF to increase its nitrogen, phosphorus, or TDS discharge
4. Size of program
191
The Truckee River watershed contains a variety of point and nonpoint sources that could provide trading opportunities. The Truckee River is just over 110 miles long, but many interests compete for the water, including irrigated agriculture, wastewater treatment, light industry, power generation, urban and residential development, and fishing (Doherty 2002). Potential trading parties: The TMWRF is the central actor within all three potential trade structures. The point/point trades would only involve two other WWTPs. The point/nonpoint trades will likely include agricultural BMPs and septic tank conversions, although a 5-mile river restoration project with the Nature Conservancy might be evaluated for trading purposes as well (Mike Brisbin, personal communication, May 24, 2004). In the Final Environmental Impact Statement (FEIS) for the proposal to initiate the water rights purchases, the Bureau of Indian Affairs (BIA) presumes that most of the water rights will be acquired from the Truckee Newlands project, with additional water coming from the Reno-Sparks metropolitan area and land within the Truckee River corridor from Vista downstream to Wadsworth (McCaleb 2002).
5. Stakeholders/participants
• Cities of Reno and Sparks: jointly operate the Truckee Meadows Water Reclamation Facility; contributing funds to purchase water rights
• Washoe County: contributing funds to purchase water rights • Pyramid Lake Paiute Tribe: party to WQSA • U.S. Department of Interior, Bureau of Reclamation: contributing funds to
purchase water rights • U.S. Bureau of Indian Affairs: completed a Final Environmental Impact
Statement for the federal acquisition of water rights under WQSA • U.S. Environmental Protection Agency: party to WQSA • Nevada Division of Environmental Protection: issues NPDES permits,
will approve nonpoint source offsets, party to WQSA • Washoe County Regional Water Planning Commission (RWPC) • Sparks Marina Lake and Canyon Vista Group: WWTPs that have an
umbrella clause in their permits to allow sharing of the individual WLAs to meet an aggregate WLA
• Systech Engineering, Inc.: developing WARMF watershed model for Truckee River, to be used in nonpoint source trades and possibly an update of a TMDL
• Desert Research Institute (DRI): consultant regarding salt loadings and irrigated agriculture
6. Regulatory drivers
Water quality standards in the Truckee River have been set by a TMDL for total nitrogen, total phosphorus, and total dissolved solids (TDS) since 1994. The TMDL and stringent nutrient allocations are the drivesr for TMWRF’s
192

interest in nonpoint source offsets. TMWRF currently discharges nitrogen at 1.6 mg/L, which is the lowest nitrogen limit in the nation (Mahmood Azad, personal communication, May 26, 2004). The broad context of water rights allocations is set by the Truckee-Carson-Pyramid Lake Water Rights Settlement Act (Public Law No. 101-618), which was passed by Congress in 1990 to address the negotiation and development of water rights allocations among the watershed’s many competing interests. Section 205 of the Settlement Act directed the Department of the Interior to negotiate an operating agreement for the Truckee River Reservoirs. A draft of the Truckee River Operating Agreement (TROA) was released in 2003, and the final TROA will be promulgated as Section 205(a)(5) of the Settlement Act once the Environmental Impact Report is completed in 2004. The TROA will provide the regulatory foundation for purchasing water rights. The driver for the water rights “trades” came from the Truckee River Water Quality Service Agreement (WQSA), which was signed in 1996 after two years of negotiations among the Pyramid Lake Paiute Tribe (PLPT), the Cities of Reno and Sparks, Washoe County, the Nevada Division of Environmental Protection, the U.S. Environmental Protection Agency, the U.S. Department of the Interior (DOI), and the U.S. Department of Justice. The WQSA resolved a lawsuit filed by the PLPT for alleged violations of the Endangered Species Act, Clean Water Act, National Environmental Protection Act, and the federal government’s responsibility to the tribe. Under the agreement, $12 million from Reno, Sparks, and Washoe County and $12 from the DOI will be used to purchase water rights in the Truckee River. The water will be stored upstream in federal reservoirs and released to the river during low-flow times (typically June through September) (US DOJ 1996). In July, 2001, the WQSA was extended for another five years to give the parties time to finalize the Operating agreement and obtain water rights purchases (Cheryl McGovern, personal communication, July 21, 2003).
B. Trade Structure 7. Determination of credit
The water rights will be purchased to comply with the WQSA and will not directly authorize increased discharges at TMWRF. Increasing the flow in the river is expected to improve habitat and increase the river’s capacity to assimilate nutrients, which could potentially lead to an increased TMDL and TMWRF’s WLA. Any offsets will therefore be determined through the TMDL revision process. For the point/nonpoint trades, watershed modeling (the WARMF model) will estimate the nutrient and sediment loading reductions resulting from agricultural BMPs, structural improvements, and septic conversions.
193
For the point/point trades, all discharge is measurable. The baseline is set by the individual WLAs, and a facility that discharges below its WLA could share its remaining allocation with another facility.
8. Trading ratios and other mechanisms to deal with uncertainty No trading ratio is applicable for the water rights purchases, since the offset is not as straightforward as allowing an additional amount of discharge for each unit of additional flow in the water. The TMDL sets nitrogen, phosphorus, and TDS limits by mass, not concentration, so TMWRF will face the same WLA until the additional flow leads to a revised TMDL. The trading ratio has not yet been determined for point/nonpoint trades (Mahmood Azad, personal communication, May 26, 2004). Point sources would share their WLAs with one another without a discount (i.e. a 1:1 ratio).
9. Liability/penalties for noncompliance The water rights will be purchased to comply with the WQSA, and failure to obtain sufficient water rights will result in enforcement action. Any additional discharge rights that result from the increased flow will be granted in the context of a revised TMDL. Liability and penalties are not yet determined for point/nonpoint and point/point trades. Point sources are ultimately responsible for meeting their own discharge limits, and the permit clause for point/point trades merely states that no discharger would be penalized for the WLA exceedances of another discharger (NDEP 2003, Part I.A.3).
10. Approval process The water rights purchases were approved as part of the WQSA. The TROA, which will be finalized by late 2004, will establish the regulatory framework for water rights acquisitions The TMWRF NPDES permit establishes a three-phased approach to implementing a point/nonpoint trading program and incorporating offsets into the permit. Phase I, based on the permit reopener clause (Part I.A.5), will allow for case-by-case reviews of potential trades without reopening other provisions of the permit. Phase II focuses on the development of trade proposals that include demonstration projects. Upon approval, the demonstration project will be implemented and the results monitored, and a Water Quality Management Demonstration Project Report will be submitted to the DEP. The DEP will decide whether to proceed with full implementation of the proposal. Phase III is the full implementation of the water quality management project and the development of trading ratios,
194
monitoring and enforcement provisions, and a phase-in schedule for WLA increases (NDEP 2003, Part I.A.5).
11. Ex post verification/auditing. Auditing for the water rights project is conducted under the WQSA and the TMDL. Monitoring and enforcement provisions for nonpoint source offsets will be determined through the process of trade approval (see “Approval Process”) (NDEP 2003).
12. Mechanisms for trade identification and communication (education and outreach, third party facilitation, embedded ties) Third party facilitation for water rights. The water rights will be purchased through established water rights broker. The trade identification process has not been determined for nonpoint source offsets, but it is unlikely that Reno and Sparks will directly negotiate with individual farmers or property owners. (Mahmood Azad, personal communication, May 26, 2004).
13. Market structure (bilateral, clearinghouse, third party brokers) The water rights will be purchased through brokers, but it is inaccurate to say that this makes it a brokered water quality trade. The potential water quality offset does not fit any market models, since TMWRF does not receive direct offsets in exchange for increasing water flow downstream. TMWRF will only receive an increased WLA if the increased flow can lead to a revised TMDL. The market structure for nonpoint trades has not yet been determined. Point/point trades would be bilateral.
14. Types of trades allowed Point/point, point/nonpoint. The water rights “trade” does not fit into any category, but point/nonpoint is probably the best approximation (Environomics 1999).
C. Outcomes 15. Types and volume of trades that have occurred
Thirty-three water rights contracts, comprising 4,197 acre feet, have been signed as of May, 2004 (Susan Rothe, personal communication, May 27, 2004). TMWRF will probably propose a nonpoint source trade within the next year (Mahmood Azad, personal communication, May 26,2004). It is unlikely that there will be any point/point trading with Sparks Marina Lake and Vista Canyon Group (Mike Brisbin, personal communication, May 24, 2004).
195
16. Administrative costs
Not determined.
17. Transaction costs Not determined.
18. Cost savings Not determined. Any point/nonpoint trades will likely help the TMWRF increase capacity with lower costs than they would face through conventional treatment. The water rights will probably cost $20-40 million dollars (Mahmood Azad, personal communication, May 26, 2004), and it remains to be seen whether the increased flow leads provide a financial ‘payback’ through a revised TMDL and higher WLA.
19. Program goals achieved After extensive negotiations, policy-making, and modeling efforts, it appears that water quality trading in the Truckee River is likely to come to fruition in 2005. The foundation for acquiring water rights on a large scale will finally be in place by late 2004, nearly a decade after the WQSA. Greater water rights purchases and flow augmentation will probably be initiated within the following year. Once the watershed modeling is finished, proposals for nonpoint source trades will be submitted to the DEP (Mahmood Azad, personal communication, May 26, 2004).
20. Program obstacles Water rights are a highly contentious and politically charged issue in the region. Negotiations for the WQSA, the TROA, and individual offset projects have had to proceed slowly and sensitively, which has led to delays in the implementation of water rights purchases. Acquiring water rights is a complex and challenging process. Water rights are a precious commodity in the region, and it may be difficult to find enough interested sellers (Randy Pahl, personal communication, May 20, 2004). The City of Reno must ensure that it is purchasing senior water rights, that the water will be transferable to USBR reservoirs upstream, and that the sellers do not perceive that the City is forcefully pressuring them to sell (Mahmood Azad, personal communication, May 26, 2004). Some stakeholders, both at the DEP and TMWRF, have felt that the Truckee TMDL is too flawed to consider nonpoint trades at this time (Mahmood Azad, personal communication, May 26, 2004). Nearly 70% of TMWRF’s nitrogen
196
discharge is dissolved organic nitrogen (DON), which may or may not be a biologically available form of nitrogen. If DON has very low biodegradability, then it should be removed from the TMDL. Revising the TMDL to remove DON would have an enormous impact on TMWRF’s need to further control nitrogen, since TMWRF is currently close to its WLA for total nitrogen (Mike Brisbin, personal communication, May 24, 2004).
21. NPS involvement and incentives to engage in trading. Nonpoint sources will primarily have a financial incentive to engage in trading.
22. Other
Program information/References Websites: See individual online documents, listed below Contacts: Moody Azad, City of Reno. (775) 334-3311 Mike Brisbin, Water Quality Control Technician, Truckee Meadows Water Reclamation Facility. (775) 861-4148 Susan Rothe, Reno City Attorney. (775) 334-2069 Randy Pahl, Nevada Division of Environmental Protection. (775) 687-4670 Cheryl McGovern, U.S. Environmental Protection Agency. (415) 972-3415 Written Program Information:
Draft Truckee River Operating Agreement (2003). U.S. Bureau of Reclamation. Retrieved May 26, 2004 from http://www.usbr.gov/mp/lbao/troa/docs/TROAdraft.pdf
Doherty, John (2002). ‘Dilution’ no longer the ‘solution to pollution:’ finding a new future for Truckee River water quality. DRI News. Desert Research Institute. Retrieved May 26, 2004 from http://newsletter.dri.edu/2002/fall/truckeeriver.htm
Environomics (1999). A summary of U.S. effluent trading and offset projects. A report prepared for Dr. Mahesh Podar, U.S. Environmental Protection Agency, Office of Water. Retrieved May 7, 2004 from http://www.epa.gov/owow/watershed/trading/traenvrn.pdf
McCaleb, Neal A. (2002). Notice of availability of the Final Environmental Impact Statement for the Truckee River Water Quality Settlement Agreement, Federal Water Rights Acquisition Program for Washoe, Storey, and Lyon Counties, NV. Federal Register 67(198): 63445-6
197
Nevada Division of Environmental Protection (NDEP) (2003). Fact Sheet, Permit NV0020120 – Renewal, Truckee Meadows Water Reclamation Facility. Retrieved May 20, 2004 from http://ndep.nv.gov/sec/20150ffact.pdf
Regional Water Planning Commission (RWPC) (2004). The Washoe County Regional Water Management Plan, 2004 Update, Administrative Draft. Retrieved May 23, 2004 from http://www.co.washoe.nv.us/water_dept/rwpc/regionalpln.htm
U.S. Department of Justice (US DOJ) (1996). Settlement reached in Truckee River dispute. Press release #500: 10-10-96. Retrieved May 26, 2004 from http://www.usdoj.gov/pr/1996/Oct96/500enr.htm
198
Passaic Valley Sewerage Commissioners Pretreatment Trading Project (NJ) A. Program Background
1. Program description The Passaic Valley Sewerage Commissioners (PVSC), a publicly-owned treatment works (POTW) servicing domestic and industrial wastewater, incorporated trading of heavy metals into its rules for indirect discharges. PVSC’s trading provisions were intended to provide its industrial permittees with greater flexibility in meeting its new local pretreatment limits. Although the trading rule was made effective in 1994, industrial facilities did not pursue trading as a result of high transaction costs and uncertainties associated with the negotiation process (US EPA 1998). In November 1996, working with PVSC, the New Jersey Department of Environmental Protection (NJ DEP) and EPA Region 2, the Effluent Trading Pilot Team of the New Jersey Chemical Industry Project began to facilitate trading among industrial permittees within the PVSC service area. At an information session held by the Pilot Team to identify parties interested in trading, small companies revealed that the minimum trade amounts set by PVSC in 1994 were too large for their participation in the program. In response, PVSC adjusted the trade requirements in order to accommodate the small companies and establish a larger trading market (see “Approval Process” below). The first trade agreement took effect on July 1, 1997. To date, there have been two executed contracts, one of which is still effective (see “Types and volumes of trades” below) (Andy Caltagirone, Personal Communication, May 14, 2004).
2. Program motivation
PVSC decided to “beneficially reuse” its biosolids and, in order to meet “exceptional quality” standards by June 30, 1997, established more stringent, local pretreatment limits for certain heavy metals (US EPA 1998, Environomics 1999). PVSC included the option of trading heavy metals to meet new local limits in response to concerns raised by indirect dischargers (a large leather tanner in particular) already meeting federal categorical pretreatment standards (US EPA 1998). The indirect dischargers were concerned that large and expensive renovations to pretreatment equipment would be required and certain production processes might have to be curtailed or stopped altogether if costs proved to be too prohibitive. PVSC determined that flexibility could be established in assigning local pretreatment limits through trading provided that ex post adjusted local limits did not exceed federal categorical limits (US EPA 1998). Trading would enable facilities
199
within the PVSC service area to reduce compliance costs and also remove the incentive for “local limits shopping” (US EPA 1998, pp. 3-2). The Effluent Trading Pilot Project was chosen by the New Jersey Chemical Industry Project Stakeholder Group as one of four pilot projects designed to test strategies that would enable and encourage companies to achieve greater environmental protection. With rules and regulations already in effect that allowed trading, the Pilot Team for the Effluent Trading Project worked within the PVSC service area to facilitate trading of local pretreatment limits.
3. Pollutant being traded Heavy metals (Cadmium, Copper, Lead, Mercury, Nickel, and Zinc)
4. Size of program Located in Newark, New Jersey, the PVSC service area encompasses land “draining into the Passaic River from the Great Falls in Paterson to Newark Bay” (US EPA 1998, 1-1). Spread across 48 municipalities in four counties (Passaic, Bergen, Essex and Hudson), the PVSC treats domestic and industrial wastewaters from northeastern New Jersey (Andy Caltagirone, Personal Communication, May 14, 2004). 260 major industrial plants discharge their wastewater into the PVSC sewer system (Andy Caltagirone, Personal Communication, May 14, 2004). Of those 260, the vast majority need to pretreat their effluent in order to meet chemical, heavy metal and pH local limits (Andy Caltagirone, Personal Communication, May 14, 2004, Sharing 1998). The main industries include “electroplaters, metal finishers, pharmaceutical and organic chemical manufacturers, textile dyers, hospitals, electronic products manufacturers, and newsprint recycling mills” (PVSC 2003). To date, three industrial facilities have participated in the pretreatment trading program: two buyers (one organic chemical manufacturer and one pharmaceutical company) and one seller (an organic chemical manufacturer) (Andy Caltagirone, Personal Communication, May 14, 2004). Potential trading parties: Indirect dischargers within the PVSC service area
5. Stakeholders/participants • Passaic Valley Sewerage Commissioners (PVSC) – designed trading
requirements, determines local pretreatment limits, approves trading agreements and revises discharge limits according to trade contracts
• Pilot Team for the Effluent Trading Pilot Project – facilitated trade negotiations, helped facilities identify potential trading partners, provided guidance on trading qualifications and preparation of trading agreements, and represented industry, environmental, and regulatory interests as subset
200
of New Jersey Chemical Industry Project Stakeholder group with additional experts (for a complete list of Pilot Team members see US EPA 1998).
• New Jersey Chemical Industry Project Stakeholder group – composed of representatives from EPA, POTWs, the chemical manufacturing industry, trade associations, unions, academia and the community, created to analyze environmental protection strategies
• New Jersey Department of Environmental Protection (NJ DEP) – participated in New Jersey Chemical Industry Project and Effluent Trading Pilot Project
• Environmental Protection Agency Region 2 (EPA) - participated in New Jersey Chemical Industry Project and Effluent Trading Pilot Project
• EPA’s Industry Strategies Group – helped establish New Jersey Chemical Industry Project
6. Regulatory drivers
Pretreatment local limits set by PVSC to achieve “exceptional quality” sludge, and the strong enforcement of compliance requirements drive the trading of heavy metals. Such trading of uniform local pretreatment limits by industrial facilities is allowed in the rules and regulations regarding indirect discharges made effective in 1994 by PVSC in accordance with state and federal pretreatment and residual management regulations. Applicable federal regulations include EPA’s water quality trading policy and 40 CFR Part 403 (general pretreatment regulations) particularly Sections 403.8(f)(4) and 403.5 (for more information visit http://cfpub.epa.gov/npdes/pretreatment/pstandards.cfm#local). At the state level, guidance for local limits is provided in the New Jersey Pollution Discharge Elimination System Regulations, N.J.A.C.7: 14A-1.1 et seq (visit http://www.state.nj.us/dep/dwq/loc_lim.htm for more information).
B. Trade Structure 7. Determination of credit
In order to qualify as a seller, an industrial facility must illustrate to PVSC through monitoring data and compliance records that it has achieved positive reductions for the traded metal through control measures or pollution prevention techniques implemented to meet the most recent local pretreatment limits (Murphy 1997). Excess reductions for sale cannot come from the discontinuation of a production process (Murphy 1997). Buyers may purchase credits for more than one metal, but for a given metal, the entire credit amount must come from a single seller (PVSC 2003). Sellers may sell credits for a given metal to a maximum of ten buyers (Murphy 1997).
201
Trades for heavy metals’ credits are conducted in pounds per day while local limits are expressed as concentrations (US EPA 1998). Trading partners must convert between pounds and concentrations using average annual discharge volumes to determine level of trade (US EPA 1998). The Pilot Team provided sample calculations to potential trading partners (US EPA 1998).
8. Trading ratios and other mechanisms to deal with uncertainty The trading ratio is 10:8. 20% of reductions purchased are “banked” or “retired” for environmental benefit, not to be counted towards the discharge limit of the buyer, leading to an overall reduction in pollutant loading (US EPA 1998).
9. Liability/penalties for noncompliance If a seller goes out of business or discontinues the production process that discharges the heavy metal traded, the buyer loses those purchased credits for reductions as indicated in the trading agreement (US EPA 1998). PVSC gives the buyer a reasonable time to come into compliance (US EPA 1998). Once a trade is approved and discharge limits have been adjusted by PVSC, each facility is responsible for meeting its own revised permit level. A violation by one trading partner does not affect the other facility’s compliance status. However, if routine violations occur, PVSC may adjust the trade agreement to reflect the lack of compliance (US EPA 1998).
10. Approval process PVSC approves trades based on the following criteria: buyers and sellers are in compliance with all other POTW requirements; both trading partners have illustrated the ability to comply with the adjusted discharge limits; the traded amount is greater than 0.1 lbs per day (adjusted in 1997 to accommodate small companies, originally 1.0 lbs per day); the metal is traded in increments of no less than 0.05 lbs per day (originally 0.5 lbs per day), the price of the credits and terms of payment are defined, and the timeframe of the agreement is established including timing of renewals and adjustments (PVSC 2003).
11. Ex post verification/auditing. Each permittee must perform monthly sampling and discharge monitoring data is compiled by PVSC.
12. Mechanisms for trade identification and communication (education and
outreach, third party facilitation, embedded ties) The Pilot Team facilitated identification of trading partners through its outreach program which included a letter inviting industrial facilities within
202
the PVSC service area to attend a meeting at which the logistics of trading local limits would be discussed, and a follow-up letter after the meeting, providing contact information and identifying companies’ specific interests in trading (i.e. buyer or seller, specific heavy metal and approximate amount to be traded) (US EPA 1998). The Pilot Team also facilitated the negotiation process by establishing guidance for trading agreements (US EPA 1998).
13. Market structure (bilateral, clearinghouse, third party brokers)
The market structure is currently bilateral. A consortium approach involving one seller with multiple buyers for a given metal could develop if found to be practical, which could be the case for smaller companies (US EPA 1998). In the initial stages of the program’s development, the Pilot Team’s role resembled that of a third party broker and in fact, EPA considered bringing in a mediator for price negotiations but the initial trading partners were able to reach an agreement on their own (US EPA 1998). The Pilot Team does indicate that a brokerage service or consortium approach might help overcome trading obstacles (US EPA 1998). The brokerage service may even be provided by PVSC (or more generally, the POTW) taking a more active role in identifying potential trading partners through the compilation of a database containing discharge monitoring data and the distribution of information (US EPA 1998).
14. Types of trades allowed Point/Point
C. Outcomes 15. Types and volume of trades that have occurred
Two trading agreements have occurred through the program, one of which is still effective as of May 2004. Both agreements involved the same seller. The initial trade, which is no longer effective, was a trade for copper between two organic chemical manufacturers. Although the buyer in this agreement eventually went out of business, the industrial facility used the contract time, including multi-year reauthorizations, to improve its own pretreatment equipment. Once the buyer came into compliance, the contract was terminated and the revised discharge limits were adjusted back to the uniform local limits set by PVSC (Andy Caltagirone, Personal Communication, May 14, 2004). In the second contract, a pharmaceutical company has purchased zinc and copper credits from an organic chemical manufacturer (Andy Caltagirone, Personal Communication, May 14, 2004).
203
16. Administrative costs Administrative costs are negligible for PVSC: estimated to be in the hundred of dollars per contract (Andy Caltagirone, Personal Communication, May 14, 2004). Administrative costs involve employee time spent reviewing final contract drafts for approval and associated adjustment of permit limits (Andy Caltagirone, Personal Communication, May 14, 2004).
17. Transaction costs
Not determined but perceived in the initial stages of development, especially by small companies, to be high, requiring the investment of a lot of time and resources during the negotiation process (US EPA 1998). PVSC does not charge for overseeing transactions (Andy Caltagirone, Personal Communication, May 14, 2004).
18. Cost savings There are no analytical cost savings as each permittee must continue to perform monthly sampling (Andy Caltagirone, Personal Communication, May 14, 2004). Buyers are able to avoid fines associated with noncompliance, but actual quantification of this value is difficult as the number depends on how many times and by how much the buyer would not have been in compliance if not for the trade (Andy Caltagirone, Personal Communication, May 14, 2004). Sellers are able to defray pretreatment costs through revenue gained from the sale of excess reductions.
19. Program goals achieved The goal of the Effluent Trading Pilot Project was to develop trading arrangements among indirect dischargers within the PVSC service area to help industrial facilities achieve compliance with local pretreatment limits. PVSC credited fair and credible enforcement as a necessary prerequisite for acceptance of such a program by the public (Catherine Tunis, Personal Communication, May 27, 2004). Lower costs of compliance were a crucial motivator in encouraging participation in the program by industries that were going to have trouble meeting compliance requirements (Catherine Tunis, Personal Communication, May 27, 2004). Lessons learned in the PVSC service area could be extrapolated for developing similar trading opportunities in other POTW service areas and recommendations to improve the process were made by the Pilot Team.
20. Program obstacles
No precedent existed for a formal pretreatment trading program involving indirect discharges (US EPA 1998, Environomics 1999). Uncertainties regarding price negotiations, transaction costs, how much information
204
businesses should share, and a general lack of information regarding trading as allowed by PVSC’s rules and regulations led to a lack of trading during the initial stages of development (US EPA 1998). By the time the Pilot Team initiated the facilitation of trades and the trading rules were finalized by PVSC, many facilities had already made compliance investments, changing the nature of the market and affecting price negotiations (US EPA 1998). The available market for trading that remained was small, consisting of twenty facilities only two of which were potential sellers (US EPA 1998, Environomics 1999). No new interest involving participation in the program has been generated since 1999 (date second agreement executed) (Andy Caltagirone, Personal Communication, May 14, 2004).
21. NPS involvement and incentives to engage in trading. Non-point sources are not involved in the PVSC Effluent Trading Project.
22. Other
The Effluent Trading Pilot Team identified a need for trading to be authorized in the rules and regulations of a POTW, to be initiated at the same time new local pretreatment limits are being developed in order to maximize cost-effectiveness and participation, and to be facilitated through the dispersal of information (US EPA 1998).
Program information/References
Websites: Passaic Valley Sewerage Commissioners (Home) http://www.pvsc.com/ Passaic Valley Sewerage Commissioners (Industrial Rules and Regulations)
http://www.pvsc.com/industrial/rules.htm NJ DEP, Division of Water Quality http://www.state.nj.us/dep/dwq/ NJ DEP, Division of Water Quality, Bureau of Pretreatment and Residuals
http://www.state.nj.us/dep/dwq/bpr.htm NJ DEP, Division of Water Quality, Bureau of Pretreatment and Residuals,
Excerpts Regarding Development and Implementation of Local Discharge Limitations http://www.state.nj.us/dep/dwq/loc_lim.htm
US EPA, National Pollutant Discharge Elimination System (NPDES), Pretreatment Standards and Limits http://cfpub.epa.gov/npdes/pretreatment/pstandards.cfm#local
Contacts: Andy Caltagirone, PVSC Manager of Industrial & Pollution Control.
Telephone: (973)-817-5710. E-mail: [email protected] Tunis, US EPA Office of Policy, Economics and Innovation.
Telephone: (202)-566-2830. E-mail: [email protected]
205
Written Program Information: Murphy, Jim. 1997. “PVSC Kicks Off Effluent Trading Pilot Project,” New
Jersey Discharger. Vol. 5, No.1: Summer 1997. Retrieved on April 30, 2004 from http://www.state.nj.us/dep/dwq/discharg/v5n1b.htm
Murphy, Jim. 1998. “Update on Effluent Trading,” New Jersey Discharger. Vol. 6, No.1: Summer 1998. Retrieved on April 30, 2004 from http://www.state.nj.us/dep/dwq/discharg/v6n1c.htm
Passaic Valley Sewerage Commissioners (PVSC). 2003. Rules and Regulations Concerning Discharges to the Passaic Valley Sewerage Commissioners, Section B-104. Retrieved on May 5, 2004 from http://www.pvsc.com/pdf/rules.pdf
US Environmental Protection Agency (US EPA), Office of Policy, Economics, and Innovation. 1998. “Sharing the Load: Effluent Trading for Indirect Dischargers,” Lessons from the New Jersey Chemical Industry Project—Effluent Trading Team. Retrieved on April 29, 2004 from http://www.indecon.com/njcip/etdoc/home.htm
Environomics. 1999. A summary of U.S. effluent trading and offset projects. A report prepared for Dr. Mahesh Podar, U.S. Environmental Protection Agency, Office of Water. Retrieved May 7, 2004 from http://www.epa.gov/owow/watershed/trading/traenvrn.pdf
US Environmental Protection Agency, Office of Water. 2003. Water Quality Trading Policy. Retrieved May 13, 2004 from http://www.epa.gov/owow/watershed/trading/finalpolicy2003.pdf
Reviewed by Andy Caltagirone, PVSC Manager of Industrial & Pollution Control and Catherine Tunis, US EPA Office of Policy, Economics and Innovation
206
New York City Watershed Phosphorus Offset Pilot Programs (NY) A. Program Background
1. Program description As part of the comprehensive 1997 Watershed Rules and Regulations (WR&R) for the Protection from Contamination, Degradation and Pollution of the New York City Water Supply and Its Sources, the Phosphorus Offset Pilot Programs were designed to support economic growth while protecting water quality. The pilot programs permit the construction of new and expansion of existing WWTPs with surface water discharges in phosphorus-restricted basins (otherwise prohibited by the WR&Rs). Counties east and west of the Hudson River designed comprehensive water quality strategies in order to participate in the pilot programs. Spread across eight counties in upstate New York and a small area in Fairfield County, Connecticut, the New York City water supply system is divided into three components: the Catskill and Delaware systems located West of the Hudson River and the Croton system located East of the Hudson River (City of New York 1997) East of the Hudson River, the Phosphorus Pilot Offset Program allows for the development of up to three new WWTPs with a total discharge not to exceed 150,000 gpd. West of the Hudson River, a maximum of three projects involving new or expanding WWTPs with a discharge limited to 100,000 gpd is allowed by the pilot program. Offsets accommodating phosphorus discharges may be obtained through point or nonpoint source reductions. In order to qualify as an offset, a phosphorus reduction is required to be “surplus,” “quantifiable,” “permanent” and “enforceable” (City of New York 1997, Section 18-16 (70)). To date, ten applications have been received by the New York City Department of Environmental Protection (NYC DEP) and three were found to meet the basic offset requirements. Of the three applications approved by NYC DEP, one project has been developed (see “Types and Volumes of Trades” below). The WR&Rs gave the pilot programs an experimental term of five years to be extended another five if insufficient data exists to determine the success of the program as measured by the achievement of offsets. In 2002, NYC DEP extended the pilot programs and it is likely that another extension will be granted in 2007 (Jim Benson, Personal Communication, May 26, 2004). If found to be successful, the pilot programs may become permanent (City of New York 1997, Section 18-84).
2. Program motivation In response to federal regulation of surface water supplies through the 1986 Safe Drinking Water Act Amendments and the 1989 Surface Water Treatment Rule, the City of New York updated its own watershed rules and regulations dating back to 1953. The 1986 Safe Drinking Water Act Amendments
207
required disinfection by all public water supply systems and the development of filtration criteria by the EPA. The 1989 Surface Water Treatment Rule (SWTR) established the objective water quality, operational, and watershed control criteria needed for filtration avoidance determinations. The New York City water supply system is one of the largest, unfiltered, surface water supply systems in the country with a storage capacity of approximately 600 billion gallons and supplying, on average, 1.3 billion gallons of drinking water each day to 8 million NYC residents and 1 million suburban residents (NRC 2000, Rodenhausen 2000). Wanting to avoid the high costs of a filtration plant, originally estimated at $6-8 billion, the City applied for a filtration waiver for the Catskill/Delaware systems in 1991 (Hoffer 2003). The City did not apply for a filtration waiver for the Croton system because of “periodic violations of aesthetic standards for color, odor, and taste” and the anticipation that the Croton system would not be able to meet future water quality standards and treatment regulations (NYC DEP 2001). The City is under Consent Decree to construct a filtration plant for the Croton system by 2010 or 2011, depending on site location (Hoffer 2003). In order to meet the watershed control requirements for filtration avoidance for the Catskill/Delaware systems, the City needed to develop a water quality protection plan. The Memorandum of Agreement and WR&Rs were signed and implemented in 1997 after six years of negotiation between upstate watershed communities, environmental groups, EPA, the City and New York State. A major challenge throughout the negotiations was balancing the City’s interest in protecting the quality of its water supply with the economic interests of watershed residents (NRC 2000). At the time, only 6% of the Catskill/Delaware watershed was owned by New York City and residents of upstate watershed communities feared that the protection of a drinking water supply which they did not use would come at their expense (NRC 2000). Phosphorus levels were chosen as a measure of reservoir health (NRC 2000). Considered to be the limiting nutrient in the NYC watershed, when found in excess amounts, phosphorus leads to eutrophication and increased algal growth which affects color, odor and taste of drinking water. TMDLs were established for the entire watershed in a two-phase approach as part of the City’s filtration avoidance determinations and State’s requirements under Section 303 (d) of the Clean Water Act. TMDLs and guidance values for phosphorus restriction make new development in basins that exceed designated phosphorus levels difficult without the employment of offsets (Environomics 1999). The Phosphorus Pilot Offset Programs East and West of the Hudson River allow development to continue in phosphorus-restricted basins while maintaining water quality by preventing a net increase in phosphorus loading.
208
To date, the City has received 5 filtration avoidance determinations for the Catskill/Delaware supply systems with the latest one expiring in 2007 (Hoffer 2003). The City is on a “dual-track approach,” to meet surface drinking water quality standards, creating a water quality protection plan while investigating filtration options for the future (NRC 2000)
3. Pollutant being offset
Phosphorus
4. Size of program
The New York City Water Supply watershed encompasses 1,968 sq miles. (Rodenhausen 2000). The Catskill, Delaware, and Croton water supply systems consist of 19 reservoirs and 3 controlled lakes (Rodenhausen 2000). Over 100 WWTPs, the majority of which are located East of the Hudson in the developed Westchester and Putnam counties, discharge into the surface water of the watershed while operating under SPDES permits (Rodenhausen 2000, NRC 2000). Any plant whose point of discharge is located in a phosphorus- restricted basin is subject to expansion and construction limitations set by the WR&Rs (Sections 18-36, 18-61). According to the City of New York, in 2002, eight reservoirs and two controlled lakes in the Croton system were classified as phosphorus-restricted: Amawalk Reservoir, Bog Brook Reservoir, Croton Falls Reservoir, Diverting Reservoir, East Branch Reservoir, Middle Branch Reservoir, Muscoot Reservoir, Titicus Reservoir, Lake Gleneida and Lake Gilead. No reservoirs in the Catskill or Delaware System were on the 2002 list and therefore would not qualify for participation in the offset pilot program (Jim Benson, Personal Communication, May 26, 2004). However, any new or expanding surface water discharges West of the Hudson would operate under specific permitting conditions in accordance with phosphorus TMDLs. (Jim Benson, Personal Communication, May 26, 2004). Before 2002, the Cannonsville Reservoir in the Delaware System was phosphorus-restricted and the Village of Delhi was considering participation in the offset pilot program for expansion purposes, however no formal application was filed and the Reservoir has since been taken off the phosphorus restricted list (Jim Benson, Personal Communication May 26, 2004)
The phosphorus offset pilot programs authorize a maximum of 6 projects in phosphorus-restricted basins over a trial period of five years to be extended another five if insufficient data exists for determining the success of the programs. Three new WWTPs may be built on the East side not to exceed a total discharge of 150,000 gallons per day (gpd) and three new or expanding WWTPs are allowed on the West side with a total discharge limited to 100,000gpd (NRC 2000, NYC DEP 2001). In order to participate in the pilot
209
offset program, a county must have developed a comprehensive water quality plan (City of New York 1997, Sections 18-82&18-83). Potential trading parties: New or expanding wastewater treatment plants trading with stormwater best management practice retrofits, street sweeping, land reclamation, surplus reductions from existing WWTPs, diverted flow from existing WWTPs, conversion from surface to subsurface discharges, removal of poorly functioning septic systems, or wetland restoration
5. Stakeholders/participants • U.S. Environmental Protection Agency Region 2 (USEPA) – approves
filtration avoidance waiver for the Catskill/Delaware watershed subject to criteria outlined under the Surface Water Treatment Rule of 1989, helped develop offset program guidelines
• City of New York Department of Environmental Protection (NYC DEP) - ensures quality of drinking water, administers WR&Rs, monitors major waterbodies, inspects WWTPs, runs nonpoint source control programs, regulates activities which might affect water quality, implements programs and TMDLs in NYC watershed, issues guidance documents for programs, provides educational outreach, helped develop offset program guidelines and reviews applications (NYC DEP 2001)
• New York State Department of Environmental Conservation (NYSDEC) – develops TMDLs, administers SPDES permitting programs, helped develop MOA, WR&R’s and offset program guidelines (NRC 2000)
• New York State Department of Health – acquires primacy in 2007 from the EPA for overseeing the MOA, helped develop offset program guidelines (NRC 2000)
• City and County Departments of Health - monitor waterborne diseases and quality of drinking water subject to public health laws
• Environmental Organizations (i.e. Natural Resources Defense Council, Catskill Center for Conservation and Development, Hudson Riverkeeper, Trust for Public Land, Open Space Institute, New York Public Interest Group)
• Coalition of Watershed Towns (CWT) – organized in 1991 to represent thirty watershed towns during negotiations for updated WR&Rs, took lead opposition role to ensure continued economic development while demanding compensation for costs to communities as a result of watershed protection plan (NRC 2000)
• Catskill Watershed Corporation – manages Watershed Protection and Partnership Programs in the West of Hudson to enable development while preserving water quality, administers Catskill Fund for the Future
• Watershed Protection and Partnership Council – consists of twenty-seven members representing the interests of the city, state, watershed counties, environmental groups, agricultural sector, and EPA; established in Article IV of the MOA as a forum to share ideas, concerns, information and
210
recommendations “relating to watershed protection and environmentally responsible economic development” (City of New York 1997).
• Watershed Communities (i.e. particularly Westchester and Putnam Counties in East of the Hudson and Delaware County in West of the Hudson – developed comprehensive water quality strategies identifying available economic resources, water quality problems, possible solutions for water quality problems and recommendations for economic development that would not diminish the integrity of the water supply as required in Section 18-82 and 18-83 of the WR&Rs for participation in the pilot offset program, review applications for potential participants in the offset program) (NRC 2000)
• Developers (i.e. Delaware Engineering, Lexington Realty, Emgee Highlands, Putnam Seabury Partnership)
6. Regulatory drivers
The 1989 Surface Water Treatment Rule spurred the development of a watershed protection plan for the NYC water supply system as a way to avoid costly filtration for the Catskill/Delaware systems (Hoffer 2003). The subsequent 1997 Rules and Regulations for the Protection From Contamination, Degradation and Pollution of the New York City Water Supply and Its Sources, particularly Sections 18-36, 18-61, 18-82, 18-83 and 18-84, became the regulatory drivers for the pilot offset program. Section 18-36 (a14b) prohibits the construction of new and the expansion of existent WWTPs with surface discharges in phosphorus-restricted basins. Phosphorus restriction is determined by a basin’s inability to meet phosphorus water quality guidance values. A reservoir is designated phosphorus-restricted if the average phosphorus concentration over five years exceeds the NYS phosphorus guidance value (20µg/L) two years in a row (NRC 2000). TMDLs (Phase I: 20µg/l, Phase II:15µg/L, source-specific) exist for the entire watershed, established by the NYS DEC and NYC DEP to meet the city’s filtration avoidance determinations and as required by Section 303(d) of the Clean Water Act (National 2000, Kane 1999). All projects receiving approval to participate in the pilot program must receive SPDES permits and be incorporated into the TMDL for the watershed (NRC 2000).
B. Trade Structure 7. Determination of credit
Determination of credit depends on the offset mechanism. Applicants must first calculate the projected phosphorus load increase from the WWTP and any accompanying nonpoint sources of phosphorus. Nonpoint source loading for specific developments is determined using models such as the Simple Method, the P8 Urban Catchment Model, or Stormwater Management Model (NRC 2000). If post-development nonpoint source loading is less than pre-
211
development, the decrease in phosphorus can be used as an offset (NRC 2000). However, this decrease is not able to diminish the overall net increase in phosphorus loading as determined by the contribution from the WWTP (NRC 2000). Once the phosphorus load for the project is calculated, it is multiplied by three (trading ratio) to determine the offset requirement. As a variety of offset mechanisms are allowed, the determination of estimated reductions for each mechanism requires different techniques. For point source offsets, the “reduction in flow is multiplied by the effluent limit” (NRC 2000, p. 347). For nonpoint sources, the NYC DEP guidance allows for any reliable method that estimates phosphorus reductions (NRC 2000). Reductions generated by stormwater retrofits are calculated as “a function of the predevelopment loading rate and estimated BMP removal rates,” provided in the NYC DEP guidance (NRC 2000). Land reclamation and wetland restoration practices compare loading rates across gradients of land quality (NRC 2000). For the removal of septic systems, an offset is calculated by multiplying the daily flow of the septic system by the phosphorus concentration in septic discharge as determined by the NYSDOH (NRC 2000). All offsets must be “surplus,” “quantifiable,” “permanent,” and “enforceable” (City of New York 1997). NYC DEP needs to develop criteria to determine whether baseline, required phosphorus reductions are in place before defining “surplus” reductions (NRC 2000).
8. Trading ratios and other mechanisms to deal with uncertainty
The trading ratio is 3:1. Reductions and discharges must occur within the same basin, except in Putnam County. A new WWTP locating in Putnam County may receive credit for a reduction in an upstream phosphorus–restricted basin that is hydrologically connected to the basin of surface discharge (NYC DEP 2001).
9. Liability/penalties for noncompliance Contingency plans must be in place before approval will be given on an application, allowing for the event that actual offsets are less than predicted estimates.
10. Approval process Conceptual offset plans are first screened by an application review committee to ensure that the proposed reductions are “surplus,” “quantifiable,” “permanent” and “enforceable” in order to qualify as offsets (NYC DEP 2001). The application review committee consists of representatives from City/DEP engineering, water quality, planning and legal departments (NYC DEP 2001). The committee makes recommendations to DEP management
212
regarding participant selection (NYC DEP 2001). The committee also makes recommendations to firms as to how their application can be improved in order to comply with all regulations and water quality objectives (NYC DEP 2001). In order to receive approval, an application must have an appropriate model for estimating reductions and satisfactory monitoring, “quality assurance/quality control,” contingency, and maintenance plans (NRC 2000, 347). All potential participants must obtain approval from the County/town in which their projects will be located in addition to NYC DEP (City of New York 1997 Sections 18-82, 18-83).
11. Ex post verification/auditing.
All WWTPs are responsible for self monitoring offset mechanisms by measuring input and outflow (James Benson, personal communication, May 31, 2002). According to a committee established to review the entire MOA, “The establishment of a reliable, long-term monitoring program is probably the most challenging aspect of the New York City pilot phosphorus program,” (NRC 2000, p. 353).
12. Mechanisms for trade identification and communication (education and outreach, third party facilitation, embedded ties) Individuals requesting participation in the pilot offset program design their own offset mechanisms. Suggestions for offset mechanisms provided in NYC DEP guidance include stormwater best management practice retrofits, land reclamation, surplus reductions from existing WWTPs, diversion of flow from existing WWTPs to a location outside the NYC watershed, conversion of an existing surface discharger to a subsurface discharger, complete removal of poorly functioning or damaged septic systems, or wetland restoration (NRC 2000). Reductions performed by the Catskill Fund for the Future and the Stormwater Retrofit Program may be used as offsets in West of the Hudson (NRC 2000). Reductions funded through mandated MOA programs do not count towards offsets (NYC DEP 1999).
13. Market structure (bilateral, clearinghouse, third party brokers) Bilateral – each WWTP is required to determine its own offset mechanism. For West of the Hudson projects, the Catskill Fund for the Future and Stormwater Retrofit Program may supply reductions in a clearinghouse capacity.
14. Types of trades allowed Point/Nonpoint or Point/Point. To date, all approved applications have utilized nonpoint source reductions.
C. Outcomes
213

15. Types and volume of trades that have occurred While three out of ten applications were approved by the NYC DEP, only one program has been implemented to date. In 1998, Emgee Highlands, Incorporated, submitted a conceptual offset plan to allow for the development of a WWTP in the Town of Southeast. The WWTP would discharge 36,000gpd into the phosphorus-restricted Middle Branch Reservoir basin in Putnam County (NYC DEP 2001). The proposed offset was on-site stormwater treatment. Emgee Highlands was required to recycle wastewater, reducing surface discharge to 12,000gpd, obtain an SPDES permit with a phosphorus effluent limit of 0.10mg/l, and create quality assurance, monitoring and contingency plans before obtaining approval from the Town of Southeast and DEP. Baseline water quality sampling by Emgee Highlands began in 1999 and construction began in 2000. Final approval on revised quality assurance and contingency plans was given by DEP in spring 2001. The Emgee Highlands offset project has been able to achieve 8:1 reductions as opposed to the required 3:1 trading ratio (Jim Benson, Personal Communication, May 26, 2004). Kent Manor, a project approved by DEP, employing on-site and off-site stormwater treatment as an offset, did not obtain approval from the Town of Kent and Putnam County. In December 1999, Kent Manor sued the Town of Kent as a result of the town’s refusal to approve the project (NYC DEP 2001). Campus at Field Corners, another project proposed in the Town of Southeast in Putnam County, decided to revise its development plans because, the discharge DEP allowed (68,000 gpd) was less than the amount requested (110,450 gpd). Campus at Field Corners initially proposed removal of failing septic systems as the offset mechanism, but DEP did not find that these reductions met the “surplus” requirement. The agreed upon offset plan became weekly street sweeping, the extent of which would be increased as part of a contingency plan if monitoring showed that less phosphorus was being reduced than predicted (NYC DEP 2001). In 2004, NYC DEP approved another conceptual plan submitted by Campus at Field Corners. Scaled down development plans were delayed by a two-year moratorium on development in the Town of Southeast and then had to be redesigned again as a result of new town wetland regulations for a total delay of four years (Jim Benson, Personal Communication, May 26, 2004).
16. Administrative costs For development of the comprehensive strategies in the Croton System, the NYC DEP allocated up to $1 million to each county required to develop a water quality protection plan (NRC 2000). In support of the pilot program, New York State offered to provide each pilot plant developer up to $100,000 towards the design, engineering, construction and maintenance of equipment and facilities needed for reductions and monitoring (Rodenhausen 2000). In
214
West of the Hudson, potential participants may use reductions generated by the Catskill Fund for the Future, a $59.9 million fund established in the MOA to increase economic welfare within watershed communities by supporting development that maintains water quality (NRC 2000, City of New York 1997; Hoffer 2003).
17. Transaction costs
Not determined. To date, all offset mechanisms have been designed by the individual developers. In an attempt to encourage applications and lower costs, DEP requires a “conceptual plan rather than detailed offset proposals” in the initial stages of project development (Environomics 1999, p. 29).
18. Cost savings As part of the MOA, the pilot program has enabled the Catskill/Delaware watershed to avoid the cost of filtration. However, the goal of the pilot program was not to achieve a certain level of phosphorus reductions at the lowest possible cost, but rather allow development that might otherwise be prohibited (NRC 2000). As such, offset mechanisms have been chosen based more on the developer’s “familiarity with operating and monitoring” than cost-effectiveness (NRC 2000, p. 357).
19. Program goals achieved
The first five year time limit for evaluating the success of the program passed in 2002 with only one documented successful trade. This trade, however, did achieve the program goal of enabling economic growth within a phosphorus-restricted basin without a decline in water quality and surpassed the required 3:1 trading ratio to achieve 8:1 reductions (Jim Benson, Personal Communication, May 26, 2004). While one trade is not enough to evaluate the pilot program as a whole and lead to the implementation of a permanent phosphorus offset program, it does allow an extension of the pilot program for another five years (City of New York 1997, Section 18-84).
20. Program obstacles The negotiation of the entire MOA proved to be a challenge because the people who benefited from improved water quality and filtration avoidance were not the same people who would incur the economic hardships of stricter water quality regulations, including limits on development (NRC 2000). 74% of the watershed is privately owned and there was some concern of eminent domain (NRC 2000). Although the pilot program allowed development of WWTPs in otherwise restricted areas, interest in the trading program remained low as evidenced by the following outtake from the Delaware County Comprehensive Strategy for Phosphorus Reductions: “Trading may be greeted with great reluctance by municipalities and businesses in Delaware
215
County, none of whom benefit from water quality in the Cannonsville Reservoir” (NYS Water Resources Institute and Delaware County Department of Planning and Economic Development 1999). Since 2002, there have been no phosphorus-restricted reservoirs West of the Hudson so no new development projects would qualify for participation in the offset pilot program (James Benson, Personal Communication, May 26, 2004). Despite an educational outreach campaign by DEP designed to inform the public, prospective applicants and regulatory authorities, the Kent Manor project, approved by NYC DEP, failed to obtain approval from the Town of Kent and Putnam County because of a misunderstanding regarding the use of available allowances. The Town of Kent did not approve the Kent Manor project, which was allowed a flow discharge of 70,000gpd by DEP, because the town thought it could support another project that used the 70,000 gallons in an alternative way (James Benson, personal communication, May 31, 2002). Changing town environmental regulations have delayed approval and implementation of offset development projects (i.e. Campus at Field Corners and the Town of Southeast).
A law suit brought against the city in 1999, asserting the approval process for participation in the pilot program was “arbitrary,” sought to obtain an injunction, preventing any approved projects from proceeding with construction. In January 2001, the Court granted summary judgment for the City and dismissed the lawsuit (NYC DEP 2001). Identification of reductions as “surplus” and finding appropriate offset mechanisms has also been a challenge for some communities (NRC 2000).
21. NPS involvement and incentives to engage in trading. Since counties cannot build or expand WWTPs in phosphorus-restricted basins without offsets, incentives to engage in generating reductions through nonpoint sources are high (James Benson, personal communication, May 31, 2002). All approved applications have employed nonpoint offset mechanisms.
22. Other
The Committee to Review the New York City Watershed Management Strategy had the following recommendations for the Phosphorus Offset Pilot Programs in 2000: phosphorus concentration data for an entire year, not just the growing season, should be used in determining phosphorus-restriction and the phase II TMDL value of 15µg/L should be used as the phosphorus
216
guidance value instead of the phase I, 20µg/L; NYC DEP needs to develop criteria to determine whether baseline, required phosphorus reductions are in place before defining “surplus” reductions; and NYC DEP should reevaluate trading ratios in order to ensure the quality of the drinking water supply, reflect safety margins associated with offset mechanisms, account for spatial and temporal variability between the discharge and offset, and accommodate different forms of phosphorus (NRC 2000).
Program information/References
Websites: New York City water supply watersheds, http://www.nyc.gov/html/dep/watershed Contacts: James Benson, Project Manager, New York City Department of
Environmental Protection. Telephone: (914) 742-2034 E-mail: [email protected]
Dr. Kimberly Kane, Director of Watershed Management Studies, New York City Department of Environmental Protection. (In regard to TMDL implementation and phosphorus restriction) Telephone: (914) 773-4473.
References: City of New York (n.d.). Phosphorus-restricted basins. Retrieved May 4,
2004 from http://www.nyc.gov/html/dep/watershed/html/prestricted.html
------(1997). Final Rules and Regulations for the Protection from Contamination, Degradation and Pollution of the New York City Water Supply and Its Sources. Chapter 18. Retrieved April 4, 2004 from http://www.nyc.gov/html/dep/html/ruleregs/finalrandr.html
Environomics (1999). A summary of U.S. effluent trading and offset projects. A report prepared for Dr. Mahesh Podar, U.S. Environmental Protection Agency, Office of Water. Retrieved May 7, 2004 from http://www.epa.gov/owow/watershed/trading/traenvrn.pdf
Hoffer, Mark D. (2003). Financing the journey to protection: the New York City Watershed Memorandum of Agreement – forging a partnership to protect water quality. Presented at the United States EPA National Source Water Protection Conference, Washington, D.C. June 2-4, 2003. Retrieved April 14, 2004 from http://www.epa.gov/safewater/protect/conference/pdf/plenary.hoffer.pdf
Kane, Kimberlee (1999). Methodology for calculating Phase II Total Maximum Daily Loads (TMDLs) of phosphorus for New York City drinking water reservoirs. New York City Department of Environmental Protection. Retrieved April 20, 2004, from http://www.ci.nyc.ny.us/html/dep/pdf/tmdl/methodology.pdf
217
National Research Council (NRC). 2000. Watershed Management for Potable Water Supply: Assessing the New York City Strategy. National Academy press: Washington, D.C.
New York City Department of Environmental Protection (NYC DEP) (2001). New York City’s 2001 Watershed Protection Program summary, assessment and long-term plan. Retrieved April 14, 2004 from http://www.nyc.gov/html/dep/watershed/html/reports.html
NYS Water Resources Institute and Delaware County Department of Planning and Economic Development (1999). Delaware County comprehensive strategy for phosphorus reductions. Retrieved April 7, 2004 from http://wri.eas.cornell.edu/projects/nycwshed/delaware/compstrat.pdf
Proposed Delaware County Action Plan (1999). Retrieved April 7, 2004, from http://wri.eas.cornell.edu/projects/nycwshed/ delaware/Chp_10-DCAP.pdf
Rodenhausen, George A. (2000). Protecting New York’s drinking water. Presented at the American Planning Association National Planning Conference, New York, NY, April 15-19, 2000. Retrieved April 27, 2004 from
http://www.asu.edu/caed/proceedings00/RODENHAU/rodenhau.htm
218
Neuse River Basin Nutrient Sensitive Waters Management Strategy (NC)
A. Program Background
1. Program description The 1997 Nutrient Management Strategy for the Neuse River basin established nitrogen allocations and control options, including elements of point/point trading for nitrogen allocations and point/nonpoint offsets for nitrogen loading. The Strategy also established a group compliance option for point source dischargers (currently 22 point sources are members of the Neuse River Compliance Association, which is issued a single, collective NPDES permit for nitrogen based on the sum of the members’ individual nitrogen allocations). Point/point transactions for nitrogen allocations can occur either internally within the Association or between members of the Compliance Association and non-members. Point/nonpoint trades are conducted indirectly through the North Carolina Wetlands Restoration Fund. If new or expanding dischargers cannot secure nitrogen allocations from other point sources, they can purchase nonpoint source offsets by paying into the Fund. The Compliance Association must pay into the fund at a fixed, per-pound price if it exceeds its annual nitrogen allocation. Similar in structure to the trading program for the adjacent Tar-Pamlico Basin, the nonpoint source offset arrangement for the Compliance Association is more akin to an exceedance tax than a traditional trading program. The Compliance Association was established in 2002 and was issued a NPDES permit effective January 1, 2003 (Brookhart 2003). There are currently 22 members, primarily large municipalities. Each of these facilities has an individual nitrogen load allocation, although it is not enforced by the State, and the group nitrogen discharge cap is the sum of the individual caps. The Compliance Association met its 2003 cap with relative ease and did not need to purchase offsets. Although point sources in the basin were charged with a 30% nitrogen reduction, the larger facilities in the Compliance Association achieved an approximately 50% reduction (Mike Templeton, personal communication, May 20, 2004). The North Carolina Division of Water Quality (DWQ) oversees compliance with the group nitrogen cap. The Compliance Association manages the individual nitrogen discharge of members through an internal fee system, and it expects all facilities to come into compliance with individual limits within five years. In 2003, the Compliance Association allowed a grace period and did not levy fees for exceeding individual caps. In 2004, members exceeding their individual caps must pay 25% of what they would have paid to the Wetlands Restoration Fund for their personal exceedance, regardless of whether the group as a whole meets its cap. This fee for individual
219
noncompliance will be raised to 50% in 2005, 75% in 2006, and 100% in 2007. (Mike Templeton, personal communication, May 20, 2004).
2. Program motivation The Neuse River basin suffers from excess nutrient loading and eutrophication. The upper portion of the basin (Falls Lake and the freshwater reaches just upstream of the estuary) was declared as Nutrient Sensitive Waters (NSW) for total phosphorus in 1983, and the entire basin was classified as Nutrient Sensitive in 1988. The State developed a Nutrient Management Strategy in response to the 1988 NSW classification, and issued a Basinwide Water Quality Plan in 1993. In the 1997 update of the Nutrient Management Strategy, the DWQ included a group compliance option and established a mechanism for funding offsets. The 1997 Strategy focused on nitrogen issues at the estuary and some total phosphorus controls upstream. These options were enacted as permanent rules by the General Assembly in 1998. The group compliance option came about during the development of the 1997 Strategy. Point sources were concerned that stringent nutrient allocations would have been burdensomely expensive, and they were interested in more cost-effective and flexible regulatory structures. The experiences of the Tar-Pamlico Basin Association provided an obvious model for exploring a collective nutrient cap with provisions for offsets (Mike Templeton, personal communication, May 20, 2004).
3. Pollutant being traded
Nitrogen
4. Size of program The Neuse River basin covers 6,192 square miles. Point sources contribute approximately 24% of the nitrogen loading to the estuary (Brookhart 2003). There were 111 dischargers in 1995 (the baseline year). The largest 32 accounted for over 95% of the total phosphorus loading to the estuary. The Neuse River Compliance Association has 19 members with a total of 23 facilities (Mike Templeton, personal communication, May 20, 2004). Potential trading parties: members of the Neuse River Compliance Association; any discharger holding an allocation; landowners receiving grants from the Wetlands Restoration Fund (indirectly)
5. Stakeholders/participants
220
• North Carolina Division of Water Quality (DWQ): issues NPDES permits to individual dischargers and permit to NRCA, provides regulatory oversight for the group nitrogen allocation
• North Carolina Environmental Management Commission (EMC): responsible for developing and adopting the Neuse River Nutrient Management Strategies and associated rules
• Neuse River Compliance Association (NRCA): association of point source dischargers, primarily large municipal wastewater treatment plants, with a common nutrient cap
• Lower Neuse Basin Association (LNBA): a nonprofit coalition of dischargers that conducts instream monitoring; preceded the NRCA by several years and served as the starting point for the development of the NRCA. May LNBA members became NRCA members
• Wetlands Restoration Fund • U.S. Environmental Protection Agency, Region IV: • Neuse River Foundation and Neuse Riverkeepers: environmental
advocates
6. Regulatory drivers The upper portion of the Neuse River basin was declared Nutrient Sensitive Waters in 1983, and the rest of the basin joined in this designation in 1988. In response to this classification, the North Carolina Environmental Management Commission (EMC) adopted a Nutrient Management Strategy for the basin, establishing a 2 mg/L phosphorus limit for point sources discharging 0.5 million gallons per day (mgd). In 1993, the first Neuse River Basinwide Water Quality Plan was approved. The Basinwide Plan recommended reducing nutrients and oxygen-consuming wastes, and it recommended that the Nutrient Management Strategy be revisited before the 1998 renewal date because nitrogen was increasingly being recognized as a problem (NCDENR 1998). Major fish kills in the estuary in the summer and fall of 1995 prompted legislation requiring nutrient controls, and the EMC revised the Nutrient Management Strategy in 1997. The 1997 Strategy established a system of allocations and controls that were intended to reduce total nitrogen loading in the Neuse River Estuary by 30% by 2003. The 1997 Strategy maintained technology-based concentration limits for phosphorus and added water quality-based nitrogen allocations, charging both point and nonpoint sources with the 30% reduction. A group compliance and offset option was included to help point sources meet this nitrogen reduction goal more cost-effectively. The EMC approved the 30% reduction, the nitrogen allocations and group compliance option for wastewater dischargers, and the offset provisions were enacted as permanent rules, effective August, 1998 (respectively Rules .0232, .0234, and .0240 of 15A NCAC 2B).
221
A TMDL for total nitrogen in the Neuse estuary was subsequently approved in 1999 (Environomics 1999). The TMDL references the allocations and nutrient controls that had been established by the 1997 (Mike Templeton, personal communication, June 2, 2004).
B. Trade Structure 7. Determination of credit
Nonpoint source offsets are funded through the Watershed Restoration Fund at a fixed price of $11/lb of nitrogen per year. New and expanding dischargers that acquire allocation must pay 200% of that rate and purchase 30 years’ allocation prior to applying for an NPDES permit. (Mike Templeton, personal communication, June 2, 2004).
8. Trading ratios and other mechanisms to deal with uncertainty There is no trade ratio for point/point trades, nor is the nonpoint source offset rate paid to the Wetlands Restoration Fund formally a trade ratio. However, Environomics (1999) suggest that a 2:1 trading ratio is embedded in the offset rate since the $11/lb price represents about twice the cost of the least cost-effective nutrient BMPs (based on calculations done for the Tar-Pamlico Basin trading program).
9. Liability/penalties for noncompliance The Compliance Association is responsible for making offset payments into the Wetlands Restoration Fund if it exceeds its cap. The State assumes responsibility for ensuring that the money results in nonpoint source nitrogen reduction. In addition to the offset payments, the Association is subject to penalties and other enforcement action for any exceedance. In that event, the Association members are also subject to enforcement if they exceed their individual allocations as listed in the Association’s permit. Non-members with total nitrogen limits are not required to make offset payments but are subject to enforcement for any exceedance of their total nitrogen limits (Mike Templeton, personal communication, June 2, 2004).
10. Approval process No individual approval is needed for nonpoint source offsets through the Wetlands Restoration Fund. The Compliance Association is simply obliged to pay into the Fund if the group nitrogen cap is exceeded. The Association is free to conduct internal point/point trades. Transactions are not subject to DWQ oversight except to ensure that allocations are verified and calculated correctly. However, the Association and/or affected
222
dischargers must obtain a permit modification if the changes are to be reflected in their enforceable permit limits (Mike Templeton, personal communication, June 2, 2004).
11. Ex post verification/auditing. Co-permittees in the Compliance Association submit monthly Discharge Monitoring Reports to the DWQ as specified in their NPDES permits. The NRCA compiles the co-permittee reports for its own reporting (Watershed-based permitting case study 2002). As a group, the Association submits mid-year, year-end, and five-year reports (Brookhart 2003).
12. Mechanisms for trade identification and communication (education and
outreach, third party facilitation, embedded ties) Embedded ties for nonpoint source offsets. The point sources do not identify individual offsets or communicate directly with landowners. The Wetlands Restoration Fund has taken on these roles.
13. Market structure (bilateral, clearinghouse, third party brokers)
Clearinghouse for nonpoint source offsets. All offsets are funded at a fixed price through the Wetlands Restoration Fund, and there is no direct link between point sources and landowners
14. Types of trades allowed Point/nonpoint offsets would be funded through a fixed-price payment to the Wetlands Restoration Fund. Point/point trades are also permitted.
C. Outcomes
15. Types and volume of trades that have occurred The Compliance Association has met its group cap with relative ease due to capital and operational offsets at several of its member facilities and has not needed to fund nonpoint source offsets through the Wetlands Restoration Fund. One point/point trade is being considered that would raise the Association’s nitrogen cap. A sewer district near the estuary converted to a land application system, and it sold the allocation for its two NPDES permits to an upstream discharger in the Compliance Association. The trade, if approved, will double the buyers total nitrogen allocation, and there is some concern that the trade may not be protective of Falls Lake, which is the major drinking water supply for the City of Raleigh. The permit modification is in public review, and the issue has not yet been resolved (Mike Templeton, personal communication, May 20, 2004).
223
16. Administrative costs
Not determined.
17. Transaction costs
The State, rather than the Compliance Association, would assume most of the transaction costs associated with nonpoint source offsets (Environomics 1999). Transaction costs for point/point trades within the Compliance Association would presumably be very low. There are no transaction cost estimates for the point/point trade with a non-member (Mike Templeton, personal communication, June 2, 2004).
18. Cost savings Environomics (1999) notes that the $11/lb offset payment can be compared to the $25-30/lb nitrogen control costs estimated for point sources elsewhere in North Carolina. It appears, however, that the greatest cost savings result from the flexibility afforded by the group NPDES permit rather than the nonpoint source offset options.
19. Program goals achieved The goal of this “trading” program was to provide another option for achieving compliance with nitrogen allocations. The Compliance Association has successfully met its nitrogen reduction goals to date without needing to purchase offsets.
20. Program obstacles Not available.
21. NPS involvement and incentives to engage in trading. Landowners voluntarily participate in the Wetlands Restoration Fund. Agricultural BMPs are not eligible for trading within this program.
22. Other
Program information/References Websites: See individual online documents, listed below
224
Contacts: Mike Templeton, North Carolina Division of Water Quality. (919) 733-5083 Written Program Information:
Brookhart, Morris (2003). Watershed permitting in North Carolina: NPDES Permit NCC000001 became effective Jan 1, 2003, Neuse River Compliance Association [Powerpoint]. Presented at the National Forum on Water Quality Trading, Chicago, IL, July 22-23, 2003. Retrieved May 18, 2004 from www.epa.gov/owow/watershed/trading/brookhart.ppt
Environomics (1999). A summary of U.S. effluent trading and offset projects. A report prepared for Dr. Mahesh Podar, U.S. Environmental Protection Agency, Office of Water. Retrieved May 7, 2004 from http://www.epa.gov/owow/watershed/trading/traenvrn.pdf
North Carolina Department of Environment and Natural Resources (NCDENR). 1998. Neuse River Basinwide Water Quality Plan. http://h2o.enr.state.nc.us/basinwide/Neuse/neuse_wq_management_plan.htm
U.S. Environmental Protection Agency. (USEPA) 2002. Watershed based permitting case study: final permit, Neuse River Compliance Association. Retrieve May 18, 2004 from http://www.epa.gov/npdes/pubs/wq_casestudy_factsht11.pdf
Reviewed by Mike Templeton, North Carolina Division of Water Quality.
225
Tar-Pamlico Nutrient Reduction Trading Program (NC) A. Program Background
1. Program description Nutrient trading in the Tar-Pamlico Basin allows a group of point sources to meet nutrient reduction goals by funding agricultural best management practices (BMPs). The trade structure is perhaps most accurately characterized as an exceedence tax on the sixteen municipal and industrial dischargers in the Tar-Pamlico Basin Association (NCDENR 2001). Members of the Association, who comprise approximately 94% of point source discharge flows in the basin, have a common cap for nitrogen and phosphorus (Rich Gannon, personal communication, May 21, 2004). If the Association exceeds the nutrient cap, it must fund nutrient-reducing BMPs by paying a fixed, per-kilogram price to the North Carolina Agricultural Cost-Share Program. Cost-Share is an existing program, administered by the Division of Soil and Water Conservation (DSWC), that pays farmers up to 75% of the costs of installing BMPs. In Phase I (1990-1994), the Association agreed to fund the development of estuarine computer modeling, conduct an efficiency evaluation of their water treatment facilities, submit annual reports on nutrient loading, and make minimum payments for administering and implementing BMPs (NCDENR1994). The Association’s nutrient cap was gradually stepped down from 525,000 to 425,000 kg/yr, and the price of nonpoint source offsets was set at $56/kg. By implementing several operational measures and minor capital improvements at several larger facilities, as recommended by the efficiency study, the Association successfully reached its nutrient reduction goals without trading (Environomics 1999). Even so, the Association provided $850,000 for demonstration projects to bank credits, $400,000 for estuary nutrient modeling, and $150,000 for additional DSWC personnel to assist in trade identification and BMP implementation (Jacobson et al. 1994). In Phase II (1995-2004), the focus of the nutrient management strategy shifted to include nonpoint sources based on the recognition that nonpoint sources contribute the majority of nutrient loading to the watershed. The Association cap Phase II calculations estimated that nonpoint sources account for 92% of the nutrient loads (Coan 2002), although a more accurate estimate is approximately 83% (Rich Gannon, personal communication, May 21, 2004). While the Association maintained steady, separate caps for nitrogen and phosphorus (adjusted only for the addition of new members) in Phase II, nonpoint sources were charged with a voluntary 30% nitrogen reduction goal, based on the instream, biologically-based reduction goals produced by the estuary model. Mandated rules on riparian buffers, fertilizer application, stormwater, and agriculture were adopted by the Environmental Management Commission and went into effect in 2000 and 2001 (NCDENR 2003). The price of nonpoint source credits was reduced to $29/kg, but through 2003 the
226
Association has discharged well below its caps without needing nonpoint source offsets (Rich Gannon, personal communication, May 21, 2004). Now entering Phase III, the North Carolina Division of Water Quality will be revisiting the caps and offset rates. Modeling and other studies are being conducted, although a final decision may not be reached until mid-2005 (Rich Gannon, personal communication, May 21, 2004).
2. Program motivation
Eutrophication in the upper Pamlico River prompted the North Carolina Environmental Management Commission (EMC) to classify the entire Tar-Pamlico River Basin as Nutrient Sensitive Waters (NSW) in September, 1989. This designation requires the state Division of Environmental Management (DEM) to develop a special nutrient management strategy. The DEM proposed stricter nutrient discharge limits for point sources at estimated capital costs of $50 million, despite the fact that nonpoint sources accounted for 80% of nutrient loading in the basin (Hall and Howett 1994). In response, a coalition of point sources formed the Tar-Pamlico Basin Association and collaborated with the Environmental Defense Fund and the Pamlico-Tar River Foundation to develop a cost-effective alternative addressing both point and nonpoint source pollution. Approved by the EMC in December 1989 and finalized in 1992, this plan combined group point-source controls, nutrient trading to fund BMPs, and estuary modeling.
3. Pollutant being traded
Nitrogen and Phosphorus
4. Size of program The Tar-Pamlico Basin encompasses 11,650 km2. As of 1989, there were approximately 875 hog, chicken, dairy, and turkey operations in the basin (USEPA n.d.). Of the point source dischargers in the basin, seven are major municipals, twelve are minor municipals, two are major industrial, and 127 are nonmunicipal (Jacobson et al. 1994). The 16-member Association now comprises about 94% of the point source discharge (Rich Gannon, personal communication, May 21, 2004). Trading participants: Tar-Pamlico Basin Association (originally 12 members, currently 16 members); farmers
5. Stakeholders/participants
Parties to Phase I: Tar-Pamlico Basin Association; Division of Water Quality; Division of Soil and Water Conservation; two environmental groups - the Environmental Defense Fund and the Pamlico-Tar River Foundation
227
Parties to Phase II: Tar-Pamlico Basin Association; Division of Water Quality; Division of Soil and Water Conservation. The environmental groups did not sign because they disagreed with several points. • North Carolina Environmental Management Commission – Approved
trading program • North Carolina Division of Water Quality (aka Division of Environmental
Management) – Regulatory agency, oversees trading program • North Carolina Division of Soil and Water Conservation (DSWC) –
administers nonpoint source participation in trading program through its Agricultural Cost-Share program.
6. Regulatory drivers
The NSW designation requires the DEM to create a nutrient management plan known as the NSW Implementation Strategy. A TMDL for nitrogen and phosphorus was developed during Phase I, assisted by the estuarine modeling initiative, and approved in 1995 (Environomics 1999). The trading program is one element of the implementation strategy of the Tar-Pamlico nutrient TMDL (NCDENR 2001). The TMDL also charges agriculture and stormwater with a 30% nutrient reduction.
B. Trade Structure 7. Determination of credit
Nonpoint source credits are purchased at a fixed, per-kilogram price. The price takes into account farmers’ capital costs, maintenance costs, BMP effectiveness, area affected, and BMP life expectancy (McCarthy et al. 1996). BMP effectiveness values were based on a literature review that included empirical studies of conservation tillage, terracing, and buffer strip BMPs in the Chesapeake Bay. The cost to point sources also includes a trading ratio that reflects a 10% increase for administrative costs and a margin of safety. Credits for structural BMPs have a useful life of ten years, while non-structural BMPs have a credit life of three years (NCDENR 1994). In October 2003, the EMC approved the Nitrogen Loss Evaluation Worksheet (NLEW), developed at North Carolina State University, as the primary method for estimating nitrogen reductions from agricultural BMPs and measuring progress towards the 30% reduction goal (Tar-Pamlico Basin Oversight Committee 2003).
8. Trading ratios and other mechanisms to deal with uncertainty
228
The effective trading ratio is 2.1:1. This reflects a margin of safety of two plus 10% administrative costs (Gannon 2003).
9. Liability/penalties for noncompliance Once point sources have purchased credits, they are no longer liable. The State assumes responsibility for the monitoring and verification of BMPs. Nonpoint sources in noncompliance must return the cost-share funds (Gannon 2003).
10. Approval process The Association submits annual nutrient loading reports, which determine the need for nonpoint source offsets, to the DWQ every March 1. The DWQ has final authority over nutrient tradeoffs and allocations, and the Soil and Water Conservation Commission has final authority over BMP implementation (NCDENR 1994).
11. Ex post verification/auditing.
The Soil and Water Conservation Districts inspect at least 5% of the contracts each year, and the Division of Soil and Water Conservation reviews all local programs after five years. Animal waste systems are inspected twice a year (Gannon 2003).
12. Mechanisms for trade identification and communication (education and
outreach, third party facilitation, embedded ties Embedded ties. The North Carolina Agricultural Cost-Share Program assumes the responsibility of communicating with farmers and negotiating nutrient management plans. Cost-Share is a voluntary program, and farmers’ interest in participating exceeds the available funds.
13. Market structure (bilateral, clearinghouse, third party brokers)
Clearinghouse. The Cost-Share program operates like a clearinghouse because it breaks any direct connection between buyers and sellers and delivers credits at a uniform price (Woodward, Kaiser & Wicks 2002).
14. Types of trades allowed Point/Point, Point/Nonpoint. Informal point/point tradeoffs occur among the sixteen members of the Tar-Pamlico Basin Association. In some sense, the larger facilities implementing upgrades have covered for the smaller facilities, but there is no formal structure for determining an equitable distribution of loading among members of the Association (Rich Gannon, personal communication, May 14, 2003).
229
Formal point/nonpoint trades would be conducted via Cost-Share, although no point/nonpoint trades have occurred yet. The Association’s payments to Cost-Share in Phase I were used to bank credits at $56/kg. Any funds not utilized by Cost-Share during Phase I were carried over to fund BMPs in Phase II at $29/kg.
C. Outcomes
15. Types and volume of trades that have occurred The Association has consistently discharged below the nutrient cap without engaging in trading. In Phase I, however, it did allocate nearly $1 million to fund agricultural BMPs in anticipation of needing nonpoint source offsets.
16. Administrative costs The Association gave $150,000 to the DEM during Phase I to fund a staff position, and the trading ratio includes 10% for administrative costs.
17. Transaction costs
For the point sources in the Association, using Cost-Share to administer nonpoint source projects minimizes the transaction costs of individual trades.
18. Cost savings Original projections of the Association’s cost of meeting the nutrient cap in Phase I were $50-100 million through individual technology-based limits and $11.8 million through offsets by agricultural BMPs. The actual cost to the Association in Phases I and II totaled $1.35 million, broken down as follows: $400,000 for the estuary model, $50,000 for the facility optimization study, $50,000 for the trading document, $150,000 for staff time at the DWSC, and $700,000 for the implementation of BMPs through the Cost-Share program. The Association received a Clean Water Act 104b3 grant to fund all but the estuary modeling and facility optimization study (Rich Gannon, personal communication, May 21, 2004).
19. Program goals achieved The program is viewed as a success by the Division of Water Quality because it achieved its nutrient reduction goals at a significantly lower cost (NCDENR 2001) The NC DEM estimated that total nutrient loading in the absence of a nutrient management strategy would have reached 625,000 kg/yr by 1994 (Jacobson et al. 1994), but the Association succeeded in discharging only 371,200 kg in that year despite increasing flows by 25-33% (Gannon 2003)
20. Program obstacles
230
Environmentalists have criticized the Tar-Pamlico Nutrient Strategy, arguing that the caps were set too high and the nutrient reduction goal was set too low (Gannon 2003). Now that the TMDL charges agriculture and stormwater with a 30% reduction in nitrogen and no net increase for phosphorus, the Association would need to implement BMPs other than those that needed to satisfy the TMDL if they wanted to purchase credits (Rich Gannon, personal communication, May 14, 2003). Administering trades through Cost-Share streamlined the program in many ways, but Cost-Share staff ran into difficulty predicting available funds and staffing needs in Phase II, when the Association was no longer required to make minimum payments for these purposes. Some stakeholders have argued that a funding baseline is necessary to guarantee that Cost-Share infrastructure and staff are available to install BMPs and document credits in the event of a trade (Coan 2002).
21. NPS involvement and incentives to engage in trading. Farmers participate voluntarily in the Cost-Share program, and farmers’ interest typically exceeds available funds. Farmers are educated and recruited by a number of agencies, including the North Carolina Cooperative Extension Service, local Soil and Water Conservation Districts, and the Natural Resources Conservation Service (NRCS) (Rich Gannon, personal communication, May 14, 2003). Although the trading program has succeeded in increasing cost-share funding, North Carolina farmers observe that it has also led from voluntary participation to regulatory mandates. Farmers perceive that the baseline for Phase II reductions did not adequately account for what they had already achieved voluntarily, and better documentation of voluntary progress might have precluded the need for regulations (Coan 2002).
22. Other
Program information/References
Websites: North Carolina Department of Environment and Natural Resources. “Tar-
Pamlico Nutrient Strategy.” http://h2o.enr.state.nc.us/nps/tarpam.htm Contacts: Rich Gannon, Division of Water Quality, North Carolina Department of
Environment and Natural Resources. (919) 733-5083
231
Written Program Information: Coan, Anne (2002). The Tar-Pamlico trading program and North Carolina
farmers’ experiences. Testimony before the Subcommittee on Water Resources and the Environment of the House Transportation and Infrastructure Committee regarding trading water pollution credits. Retrieved October 10, 2003 from: http://www.house.gov/transportation/water/06-13-02/coan.html
Gannon, Rich (2003). Nutrient ‘trading’ in the Tar-Pamlico River Basin, North Carolina. Slideshow presented at the USDA Seminar on Nutrient Trading, October 23, 2003. Retrieved May 7, 2004 from http://h2o.enr.state.nc.us/nps/NSW-Oview-USDA10-03.ppt
Hall, John and Howlett, Ciannat. (1994). Albemarle-Pamlico: Case study in pollutant trading. EPA Journal. 20: 27-29.
Jacobson, Elaine Mullaly, Danielson, Leon E., and Hoag, Dana L. (1994). The Tar-Pamlico River basin trading program. Retrieved May 7, 2004 from http://www5.bae.ncsu.edu/programs/extension/publicat/arep/tarpam.html
McCarthy, Michael, Dodd, Randall, Tippett, John M., and Harding, David (1996). Cost-effectiveness and targeting of agricultural BMPs for the Tar-Pamlico nutrient trading program. In the proceedings of the Watershed 1996 Moving Ahead Together Technical Conference and Exposition, Baltimore, MD, June 8-12, 1996. Retrieved May 2, 2002 from http://www.epa.gov/owowwtr1/watershed/Proceed/mccarthy.html
North Carolina Department of Environment and Natural Resources (NCDENR) (2003). Tar-Pamlico nutrient strategy. Retrieved January 27, 2003 from http://h2o.enr.state.nc.us/nps/tarpam.htm
------(2001). Frequently asked questions about the Tar-Pamlico nutrient trading program. Retrieved January 10, 2003 from http://h2o.enr.state.nc.us/nps/FAQs9-01prn.pdf.
------(1994). Tar-Pamlico NSW Implementation Strategy: Phase II (1994). Retrieved January 12, 2003 from http://h2o.enr.state.nc.us/nps/PhIIAgreemtOrig-prn.pdf
Tar-Pamlico Basin Oversight Committee (2003). Request for approval of Local Nitrogen Strategies: Tar-Pamlico agriculture rule. A report to the North Carolina Environmental Management Commission. Retrieved February 3, 2004 from http://h2o.enr.state.nc.us/nps/EMCRpt-LocStrtgs10-03prn.pdf
US Environmental Protection Agency (n.d.). TMDL case study: Tar-Pamlico Basin, North Carolina. Retrieved January 26, 2002 from http://www.epa.gov/owow/watershed/trading/cs10.htm
Woodward, Richard T., Kaiser, Ronald A. & Wicks, Aaron-Marie B. (2002). The structure and practice of water quality trading markets. Journal of the American Water Resources Association. 38: 967-979
Reviewed by Rich Gannon, North Carolina Department of Natural Resources.
232
Clermont County (OH) A. Program Background
1. Program description
This program is still in the planning stages. The U.S. Environmental Protection Agency awarded a Project XL grant of $225,000 to Clermont County to assign a pollution budget for each point and nonpoint pollution source in the County. This project will investigate whether Clermont County can design a watershed management plan for point and nonpoint pollution sources, based on participation on the part of stakeholders, that can improve environmental conditions for a rapidly growing community. The goal is to maintain a balance between economic growth, preservation of rural character, and protection of area water quality (USEPA 2002). A computer-based model has been constructed and will be used to identify policy and capital changes that can be made to meet the County’s water quality goals (USEPA 2002; John McManus, personal communication, April 21, 2004). The County is experimenting with a unique process by which all polluters, environmental groups, and community members can come together to set water quality goals that the County will then translate into pollution permits. The County will explore the possibility of developing an effluent trading program where point and nonpoint sources can trade pollution rights. Finally, Clermont County hopes to establish a community designed, local framework for water quality control by instituting a local sampling and monitoring program, a computer-based watershed model, and a County environmental protection plan.
2. Program motivation The State of Ohio has set standards regarding the concentration of pollutants in water that are used to determine the health of an aquatic system. When these standards are exceeded, a pollution allowance schedule called the “Total Maximum Daily Load,” or TMDL, must be developed (Clermont County, OEQ 2001d). In the case of the East Fork Little Miami River and its watershed, this level has been reached. It is also hoped that this program will improve polluted streams and protect existing streams in order that these are suitable for recreation and as a drinking water supply (Clermont Country, OEQ 2001d).
3. Pollutant being traded
The program is not yet to the point where specific pollutants to be traded have been identified. However, if a program is eventually put into place it would likely focus on nutrients and solids (John McManus, personal communication, April 21, 2004). It is anticipated that through various modes of testing and
233
community input, the pollutants that should be regulated and thus would be traded will be identified. This project will focus on the type and level of pollutant that stream life is unable to tolerate when making this determination (Clermont Country, OEQ 2001b). All point and nonpoint sources will receive a discharge budget, including nonpoint pollution sources such as stormwater runoff. These sources must meet or stay below their budget to ensure stream protection (Clermont Country OEQ 2001c).
4. Size of program
The program will span the East Fork Little Miami Watershed. The East Fork of the Little Miami River (EFLMR) encompasses an area of approximately 320,000 acres (500 square miles) and includes portions of five counties (Clermont Country, OEQ 2001a). Potential trading parties: Both point sources (WWTPs) and nonpoint sources (agricultural, stormwater, land development) could participate in trading. Of course this could only occur in the future after a TMDL has been developed and discharge permits have been written.
5. Stakeholders/participants • Clermont Country, Office of Environmental Quality (OEQ): The OEQ is
responsible for monitoring environmental conditions in Clermont County and investigating how environmental processes are impacted (OEQ 2001). The OEQ’s goal for the future is to predict the impacts of human activities on environmental conditions and work to balance environmental quality with continued growth and development.
• East Fork Watershed Collaborative: The Collaborative is made up of a diverse group of local public and private entities and agencies, and includes representation from all four counties that discharge into the East Fork River. The East Fork Watershed Collaborative has a mission, “to protect and enhance the biological, chemical, and physical integrity of the East Fork of the Little Miami River and its tributaries” (Clermont County, Department of Community Planning and Development n.d.).
• It is anticipated that local governments, regional area consortia or governments, neighborhood and community organizations, empowerment zones and enterprise communities, community development organizations, and private and public local entities will be integral in making this project a success (USEPA 2002). The plan is that all these groups should come together to set regional water quality goals through a participation scheme designed to deliver more cost-effective environmental and public health protection (USEPA 2002).
234
6. Regulatory drivers
See Section 2.
B. Trade Structure 7. Determination of credit
To date, no trading structure has been designed. 8. Trading ratios and other mechanisms to deal with uncertainty
N/A
9. Liability/penalties for noncompliance
N/A
10. Approval process
N/A
11. Ex post verification/auditing.
N/A
12. Mechanisms for trade identification and communication (education and
outreach, third party facilitation, embedded ties)
N/A
13. Market structure (bilateral, clearinghouse, third party brokers)
N/A
14. Types of trades allowed
N/A
C. Outcomes
15. Types and volume of trades that have occurred
To date no trades have occurred. The OEQ is currently in the process of creating management plans for different segments of the watershed. These management plans include an inventory of resources and stream conditions, as well as recommended management strategies. During and after the plans are
235

written, they are subject to public comment. The watershed management plan for the Lower East Fork of the Little Miami River (available at http://www.oeq.net/default.php?section=wataction) is the only plan completed as of May 2004. The Lower East Fork Watershed Management Plan has been accepted by the state, implying that it meets the criteria for additional funding to assist with implementation. However, only much later in the process will pollutants to be traded be identified, TMDL’s created and trades occur. According to the Project Manager at the OEQ, John McManus, the County is just beginning to develop a TMDL for the East Fork watershed.
16. Administrative costs
N/A 17. Transaction costs
N/A
18. Cost savings
N/A
19. Program goals achieved
N/A
20. Program obstacles
N/A
21. NPS involvement and incentives to engage in trading.
N/A
22. Other
Program information/References Websites: Clermont County, Office of Environmental Quality. http://www.oeq.net Contacts: John McManus, Project Manager, Office of Environmental Quality, Clermont County. (513) 732-7310 Written Program Information:
236
Clermont County, Department of Community Planning and Development, (n.d.) Ohio 32 Vision Plan: open space action item implementation strategies. Retrieved May 11, 2004 from http://www.co.clermont.oh.us/planning/vision%20open%20space.htm
Clermont County, Office of Environmental Quality (OEQ) (2000). Project XLC Phase I Agreement. Retrieved May 11, 2004 from http://www.oeq.net/upload/XLPhase108-11-00.pdf
------(2001a). Water Quality: East Fork Little Miami River Watershed. Retrieved May 11, 2004 from http://www.oeq.net/default.php?section=eforkshed
------(2001b). Water Quality: East Fork Little Miami River Watershed. Retrieved May 11, 2004 from http://www.oeq.net/default.php?section=monitor
------(2001c). Water Quality: East Fork Little Miami River Watershed. Retrieved May 11, 2004 from http://www.oeq.net/default.php?section=projects
------(2001d). Water Quality: East Fork Little Miami River Watershed. Retrieved May 11, 2004 from http://www.oeq.net/default.php?section=news&article=tmdl&type=true
Environomics (1999). A summary of U.S. effluent trading and offset projects. A report prepared for Dr. Mahesh Podar, U.S. Environmental Protection Agency, Office of Water. Retrieved May 7, 2004 from http://www.epa.gov/owow/watershed/trading/traenvrn.pdf
Tetra Tech, Inc. (2000). 2000 Water Quality Report: Supplement to the East Fork Little Miami River Water Quality Assessment Report for Clermont County, Ohio. A report prepared for Clermont County OEQ. Retrieved May 19, 2004 from http://www.oeq.net/upload/WQReport2000.pdf
U.S. Environmental Protection Agency (2002). Clermont County, Ohio (XLC). Retrieved January 31, 2004 from http://www.epa.gov/projectxl/clermont/
Reviewed by John McManus, Clermont County Office of Environmental Quality
237
Great Miami River Watershed Water Quality Credit Trading Pilot Program (OH) A. Program Background
1. Program description
The Great Miami River Watershed Water Quality Credit Trading Pilot Program is a ten-year project scheduled to begin in October 2004 (MCD 2004a). Managed by the Miami Conservancy District (MCD), a watershed-based regional government agency, the point/nonpoint trading program will focus on the reduction of phosphorus and nitrogen loadings into the Great Miami River (MCD 2004a). Reductions will be achieved by agricultural producers through the implementation of best management practices (BMPs) funded by regulated dischargers looking to purchase upstream credits in order to cost-effectively comply with stricter water quality standards (MCD 2004a). Continuation of the program and possible implementation elsewhere in the Ohio River Basin will depend on program success (MCD 2004b).
2. Program motivation Despite pollutant reductions by point sources, over 40% of the rivers and streams in the Great Miami River watershed do not meet Ohio’s water quality standards and will be subject to TMDLs and state-wide nutrient criteria (MCD 2004a). Nonpoint sources, especially agriculture, are the major remaining causes of impairment, but will not be subject to nutrient regulations expected in 2005 (impoundments and reservoirs) and 2007 (rivers and streams) (Douglas Hall, personal communication, June 2, 2004). The pilot trading program will enable regulated dischargers to meet stricter effluent standards by purchasing credits generated through voluntary and less costly nonpoint source reductions rather than installing more expensive technology upgrades (MCD 2004b). The ten-year pilot program will focus on the installation of best management practices on agricultural lands based on cost-effectiveness and the predominance of agriculture within the watershed (MCD 2004a). Trading will ensure water quality improvement in the Great Miami River watershed, Ohio River, Mississippi River, and Gulf of Mexico. Reduction of nutrient loadings within the Great Miami River will help to alleviate the Gulf of Mexico hypoxia problem (MCD 2004a). It is estimated that 32% of the nutrients entering the Gulf of Mexico come from the Ohio River Basin, a significant portion of which originate in the Great Miami River watershed (Mississippi River/Gulf of Mexico Watershed Nutrient Task Force 2003, MCD 2004a).
238
Improvement of surface water quality will also help to ensure the quality of underlying groundwater, which is the source of drinking water for more than one million people in the region (MCD 2004a).
3. Pollutant being traded Phosphorus and Nitrogen
4. Size of program
Composed of four major sub-watersheds (Lower Great Miami River, Mad River, Upper Great Miami River, and Stillwater River), the Great Miami River watershed in Ohio is located across fifteen counties and drains approximately 4,000 square miles (Kieser & Associates 2004, MCD 2004a). Land use is 12% residential, commercial, and urban, and over 80% agricultural (MCD 2004a). According to preliminary estimates, while approximately 50% of croplands are currently under no-till practices, less than 5% of agricultural producers within the watershed employ nutrient management plans (Kieser & Associates 2004). 314 point sources discharge into the watershed (Kieser & Associates 2004). Potential trading parties: Point sources operating under NPDES permits and upstream agricultural producers
5. Stakeholders/participants • Miami Conservancy District (MCD) – initiated trading program
development, requested economic and market analysis from Kieser and Associates to determine trading opportunities, manages the Project, and brokers trades.
• Ohio Environmental Protection Agency (Ohio EPA) – supported development of a watershed-wide trading program, regulates point sources through NPDES permits, modifies permits based on participation in the trading program, supports an Adaptive Implementation Approach.
• US EPA – encouraged the development of a trading program within the Ohio River Basin to combat the Gulf of Mexico hypoxia problem.
• Ohio Department of Natural Resources (Ohio DNR), Division of Soil and Water Conservation – participated in development of the program, provides in-kind training regarding the calculation of BMP performance, helps quantify credits, supports an Adaptive Implementation Approach.
• County Soil and Water Conservation Districts – participated in program development, work with agricultural producers to identify and install most effective BMPs, help quantify credits.
• Ohio Farm Bureau Federation and county farm bureaus- participated in program development, facilitate agricultural participation.
• USDA Farm Service Agency – will help MCD ensure that participating agricultural producers are EQIP-eligible as necessary.
239
• USDA-NRCS – participated in program development, helps quantify credits.
• Ohio River Valley Sanitation Commission (ORSANCO) –participated in program development and will evaluate program to see if applicable to other areas within the Ohio River Basin.
• Kieser & Associates – conducted economic and market analysis. • Environmental Trading Network - participated in Conservation Innovation
Grant proposal, provides trading information and educational outreach. • Eligible Regulated Dischargers - purchase credits and provide
administrative funding. • Wastewater Treatment Plants - Dayton, Englewood, Union, Butler
County, and Tri-Cities Wastewater Authority – will establish initial fund for best management practices to obtain upstream credits to meet regulatory requirements.
• Agricultural Producers – implement best management practices to generate reductions as supported by local soil and water conservation districts.
6. Regulatory drivers
Stricter state-wide nutrient standards are expected in 2005 (impoundments and reservoirs) and 2007 (rivers and streams) (Douglas Hall, personal communication, June 2, 2004). TMDL studies began in 2001 (MCD 2004a).
B. Trade Structure 7. Determination of credit
Credits achieved through voluntary reductions (i.e. reductions not required by local, state, or federal regulations) will be in terms of pounds of nitrogen reduced and pounds of phosphorus reduced as quantified by “qualified soil and water conservation professionals” according to standardized procedures (MCD 2004a). Buyers may only purchase credits generated upstream from the point of discharge (MCD 2004b). Costs of each credit are generally expected to be the cost of the best management practice divided by the number of pounds of nutrient reduced ($/lb) (MCD 2004b).
8. Trading ratios and other mechanisms to deal with uncertainty
The Trading Program distinguishes between final and predicted credits (MCD 2004b). While a BMP is still in the implementation phase and the final result is uncertain the credits are “predicted” (Douglas Hall, personal communication, June 2, 2004). Predicted credits must be matched by other predicted credits to provide “insurance” that regulatory commitments can be met (ibid). As broker, MCD holds the extra predicted credits in escrow and applies them as necessary to ensure regulated dischargers meet their permit obligations (ibid). Final credits are based on BMPs that are already completed
240
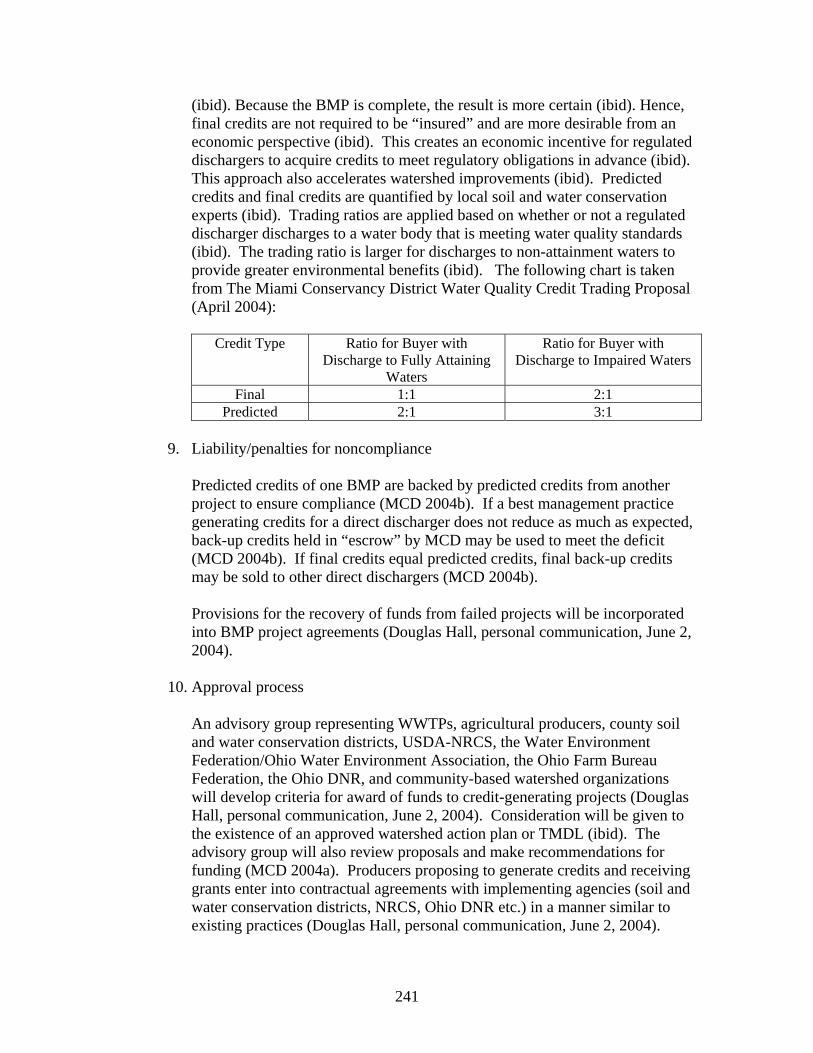
(ibid). Because the BMP is complete, the result is more certain (ibid). Hence, final credits are not required to be “insured” and are more desirable from an economic perspective (ibid). This creates an economic incentive for regulated dischargers to acquire credits to meet regulatory obligations in advance (ibid). This approach also accelerates watershed improvements (ibid). Predicted credits and final credits are quantified by local soil and water conservation experts (ibid). Trading ratios are applied based on whether or not a regulated discharger discharges to a water body that is meeting water quality standards (ibid). The trading ratio is larger for discharges to non-attainment waters to provide greater environmental benefits (ibid). The following chart is taken from The Miami Conservancy District Water Quality Credit Trading Proposal (April 2004):
Credit Type Ratio for Buyer with Discharge to Fully Attaining
Waters
Ratio for Buyer with Discharge to Impaired Waters
Final 1:1 2:1 Predicted 2:1 3:1
9. Liability/penalties for noncompliance
Predicted credits of one BMP are backed by predicted credits from another project to ensure compliance (MCD 2004b). If a best management practice generating credits for a direct discharger does not reduce as much as expected, back-up credits held in “escrow” by MCD may be used to meet the deficit (MCD 2004b). If final credits equal predicted credits, final back-up credits may be sold to other direct dischargers (MCD 2004b). Provisions for the recovery of funds from failed projects will be incorporated into BMP project agreements (Douglas Hall, personal communication, June 2, 2004).
10. Approval process
An advisory group representing WWTPs, agricultural producers, county soil and water conservation districts, USDA-NRCS, the Water Environment Federation/Ohio Water Environment Association, the Ohio Farm Bureau Federation, the Ohio DNR, and community-based watershed organizations will develop criteria for award of funds to credit-generating projects (Douglas Hall, personal communication, June 2, 2004). Consideration will be given to the existence of an approved watershed action plan or TMDL (ibid). The advisory group will also review proposals and make recommendations for funding (MCD 2004a). Producers proposing to generate credits and receiving grants enter into contractual agreements with implementing agencies (soil and water conservation districts, NRCS, Ohio DNR etc.) in a manner similar to existing practices (Douglas Hall, personal communication, June 2, 2004).
241
MCD will contract with the implementing agency to obtain the water quality credits (ibid).
11. Ex post verification/auditing.
Site-specific monitoring will occur at 5-10% of BMPs and continuous water sampling will take place every eight hours at four locations on a sub-watershed scale (MCD 2004a). Twice a year predicted versus actual reductions will be reviewed and assessed through an Adaptive Implementation Approach that will serve to improve nutrient reduction predictions throughout the duration of the Program (MCD 2004a, 2004c).
12. Mechanisms for trade identification and communication (education and
outreach, third party facilitation, embedded ties)
Local soil and water conservation professionals will help agricultural producers identify and install the most effective BMPs (MCD 2004a). The Ohio Farm Bureau Federation will train producers on conservation self-assessments for BMP identification (Douglas Hall, personal communication, June 2, 2004). State-funded 319 projects may also generate credits (MCD 2004b).
13. Market structure (bilateral, clearinghouse, third party brokers)
MCD serves as a non-regulatory, third party broker (MCD 2004b). MCD obtains water quality credits through contractual agreements with agencies and organizations that traditionally sponsor agricultural producers implementing BMPs (Douglas Hall, personal communication, June 2, 2004). MCD then sells the voluntary reductions to regulated direct dischargers under a separate contractual agreement (MCD 2004b). Funds from the sale of credits are used to fund more BMPs for the generation of additional nutrient reductions (MCD 2004b). The process for funding BMPs is competitive (Douglas Hall, personal communication, June 2, 2004). The cost of a water quality credit is generally expected to be equal to the cost of the BMP from which the credit is generated, divided by the pounds of pollutant reduced (MCD 2004b).
14. Types of trades allowed
Point/Nonpoint (upstream)
C. Outcomes 15. Types and volume of trades that have occurred
242
N/A. A start date of October 1, 2004 is dependent upon grant funding (MCD 2004a). Additional funding strategies for startup and long-term operation are being evaluated (Douglas Hall, personal communication, June 2, 2004).
16. Administrative costs The Conservation Innovation Grant anticipates a three-year project cost of $1,999,965 including $500,000 to fund BMPs (Douglas Hall, personal communication, June 2, 2004). For the grant, the Program receives in-kind support primarily in the form of water quality monitoring and the training of soil and water conservation professionals by other organizations (MCD 2004a). A Water Quality Credit Fund of $500,000, capitalized by a loan from Ohio’s State Revolving Fund, will be used to generate the first credits (MCD 2004a). These credits will go to the WWTPs borrowing the money from the State Revolving Fund (MCD 2004a). In the longer term, administrative costs are expected to be between $400,000 and $600,000 per year (Douglas Hall, personal communication, June 2, 2004). The majority of the administrative costs arise from the extensive subwatershed water quality monitoring proposed (ibid). MCD will maintain administrative and project funds separately (ibid). In the absence of grant funding, it is expected that wastewater treatment plants will fund the administrative costs of the program from the dollars they save through participation (ibid).
17. Transaction costs
Minimal as a result of third-party brokerage service provided by MCD.
18. Cost savings
An economic and market analysis conducted by Kieser and Associates in 2004 estimated a cost savings for wastewater treatment plants of $314M - $384.7M over a twenty-year period (Kieser and Associates 2004, Douglas Hall, personal communication, June 2, 2004).
19. Program goals achieved
N/A. Grant project objectives are: “establish and broker an innovative Water Quality Credits Trading Pilot Program; increase funding for agricultural BMPs in the Great Miami River watershed; provide regulated dischargers with a cost-effective regulatory compliance option; analyze water quality to evaluate the Pilot Program and watershed conditions; improve water quality in the Great Miami River watershed, Ohio River, Mississippi River, and Gulf of Mexico, provide a trading model for use throughout the Ohio River Basin and the nation” (MCD 2004a).
20. Program obstacles
243
Uncertainty associated with the calculation of nonpoint source reductions and the cost of overcoming that uncertainty through increased monitoring are the major obstacles faced by the program (Douglas Hall, personal communication, June 1, 2004). Restricting valid credit purchases to upstream reductions limits the market for direct dischargers at the headwaters of the watershed (Kieser & Associates 2004).
21. NPS involvement and incentives to engage in trading.
NPS involvement is at the crux of this trading program. Agricultural producers have high financial incentives (up to 100% full cost coverage of BMP implementation) to participate in the Trading Program (MCD 2004a). BMPs, while improving water quality, will also improve agricultural performance. Agricultural producers do not have to worry about facing legal battles with credit buyers if final credits are less than predicted or projects fail entirely due to the brokerage service provided by MCD (MCD 2004b).
22. Other
Program information/References Websites: The Miami Conservancy District (home)
http://www.miamiconservancy.org/default.asp The Miami Conservancy District (Great Miami River Watershed)
http://www.miamiconservancy.org/Great_Miami_River_Watershed/default.htm
Contacts: Douglas “Dusty” Hall, Manager, Watershed Initiatives, The Miami
Conservancy District. Telephone: (937)-223-1278 ext 3210 E-mail: [email protected]
Sarah Hippensteel, Watershed Coordinator, The Miami Conservancy District. Telephone: (937)-223-1278 ext 3244 E-mail: [email protected]
Written Program Information:
Environmental Trading Network (ETN). “Great Lakes Protection Fund – Final Report: Market-Based Approach to Ecosystem Improvement Grant #609.” No date. Attachment A. Retrieved on May 25, 2004, from http://www.envtn.org/docs/finalGLPFreport.pdf
Kieser & Associates. 2004. Executive Summary for the Preliminary Economic Analysis of Water Quality Trading Opportunities in the Great Miami River Watershed, Ohio. (Preliminary Draft). May 19, 2004.
244
Miami Conservancy District (MCD). 2004a. Conservation Innovation Grant Proposal (May 2004).
-------- 2004b. Water Quality Credit Trading Proposal of The Miami Conservancy District (April 2004)
---------2004c. An Adaptive Implementation Approach to Predicting Nutrient Reductions, Project Description (May 2004)
Mississippi River/Gulf of Mexico Watershed Nutrient Task Force. 2003. Tenth Meeting of the Mississippi River/Gulf of Mexico Watershed Nutrient Task Force. Meeting Summary. Saint Louis, Missouri: November 19, 2003. Retrieved on May 26, 2004, from http://www.epa.gov/msbasin/pdf/10thMeetSumm.pdf
Reviewed by Dusty Hall, Manager, Watershed Initiatives, The Miami Conservancy District.
245
Conestoga River Nutrient Trading Pilot (PA) A. Program Background
1. Program description The Conestoga River Nutrient Trading Pilot is a Pennsylvania pilot within the Chesapeake Bay trading scheme. The Conestoga River has the highest nutrient concentrations of all Pennsylvania rivers, and multi-credit trading is being explored as a means of avoiding a TMDL. The pilot program is also intended to raise awareness about nutrient pollution and to inform the development of state trading policy. The Pennsylvania Environmental Council (PEC) and Enterprising Environmental Solutions, Inc. (EESI) submitted a proposal for a trading pilot to the Pennsylvania Department of Environmental Protection (DEP) in the fall of 2000. The Steering Committee launched the pilot in fall of 2001, and by early 2002 they had begun nutrient modeling and drafting a trading framework. EPA Water Quality Trading guidelines were finalized in 2003. The PA DEP developed a Draft Nutrient Credit Trading Discussion Paper in April 2003 and continues to develop trading policy options for the state. An outreach team, including representatives from the Plain Sect and Amish communities, has been conducting informal meetings and field trips to demonstrate BMPs. At this time, one demonstration project with a poultry producer is being pursued (Scott Van de Mark, personal communication, October, 2003). The pilot is expected to run through 2005.
2. Program motivation
Several segments within the Conestoga River watershed have been listed by the DEP as impaired, primarily due to nitrogen and phosphorus enrichment. Several TMDLs for the watershed are in development, and the specter of a TMDL has been one factor motivating point and nonpoint sources’ interest in trading (Scott Van de Mark, personal communication, October, 2003). The watershed was chosen as a pilot program because it has a mixture or intensive agriculture and rapid growth. Active grassroots efforts to improve water quality also gave this watershed potential for broad stakeholder involvement (Crable 2002).
3. Pollutant being traded
Nitrogen and Phosphorus
4. Size of program.
246
The Conestoga River watershed drains nearly 500 miles in Lancaster, Lebanon, and Berk Counties. There are 1,250 small farms within the watershed (PA DEP n.d.).
5. Stakeholders/participants
• The Pennsylvania Environmental Council (PEC), Enterprising Environmental Solutions, Inc. (EESI), the Chesapeake Bay Foundation, Environmental Defense, and the Conservation Fund are partnering to develop the Conestoga River pilot.
• Pennsylvania Department of Environmental Protection (PA DEP): provides regulatory oversight
• CH2M Hill: consultant • Jones-Day: law firm • Local watershed associations. • Steering Committee’ Outreach Team, with representatives from the
Lancaster County Conservation District, Wenger Feeds, Severn Trent Services, Pfizer, LandStudies, ELA Group and a member of the local farming community
6. Regulatory drivers
The Conestoga River has been listed as impaired, and several TMDLs are under development within the watershed. Local stakeholders are interested in trading as a means of avoiding a TMDL (Crable 2002).
B. Trade Structure 7. Determination of credit
The State has not yet established baselines to determine agricultural credits.
8. Trading ratios and other mechanisms to deal with uncertainty Trading ratios will likely be used, although the exact trading ratio has yet to be determined.
9. Liability/penalties for noncompliance Not yet determined.
10. Approval process Credits will be given after the nutrient loading reductions have already been verified. After verification, the point source will submit a credit certificate to register the trade (EESI n.d.) The program is currently exploring design
247
specifications for a trading registry (Scott Van de Mark, personal communication, May 5, 2004).
11. Ex post verification/auditing. Not determined.
12. Mechanisms for trade identification and communication (education and outreach, third party facilitation, embedded ties). The Steering Committee designated an outreach team, including representatives from the agricultural and Amish communities, to conduct informal meetings and field trips to demonstrate BMPs (Scott Van de Mark, personal communication, October, 2003).
13. Market structure (bilateral, clearinghouse, third party brokers)
The Steering Committee is exploring design specifications for a water quality trading registry and credit bank. It is not yet determined whether a registry and bank would be administered by the DEP or as an independent entity (Scott Van de Mark, personal communication, May, 2004).
14. Types of trades allowed. The trading policy has yet to be developed and finalized, but it is likely that it will include point/nonpoint trades. Any entity can potentially purchase credits, whether as a point source offset or to retire credits for environmental improvement.
C. Outcomes
15. Types and volume of trades that have occurred The pilot is conducting a demonstration project with a poultry producer. This demonstration project provides an exercise in the quantification of credits, and it is unlikely that it will generate any trades. At this time, there exists neither the regulatory framework nor the demand for credits needed for actual trading (Scott Van de Mark, personal communication, May 5, 2004).
16. Administrative costs. Not yet determined. One option may be to finance administrative costs through fees associated with the trades themselves (Scott Van de Mark, personal communication, May 11, 2004).
17. Transaction costs. Not available.
248
18. Cost savings.
No cost-savings analyses have been conducted at this time (Scott Van de Mark, personal communication, May 5, 2004).
19. Program goals achieved The goals of the Conestoga River pilot are to reduce nutrient loadings in the watershed, increase stakeholder involvement, and inform the development of a state-wide trading network (EESI n.d.). The project is making significant progress in terms of stakeholder outreach and involvement and trading policy development (Scott Van de Mark, personal communication, May 5, 2004), although a trading framework has yet to be finalized.
20. Program obstacles
21. NPS involvement and incentives to engage in trading. The threat of a TMDL has motivated stakeholders in the watershed to explore conservation options (Scott Van de Mark, personal communication, October, 2003). Trading in particular might be attractive to farmers because it is seen as private money rather than a government initiative (Crable 2002).
22. Other
Program information/References
Websites: Enterprising Environmental Solutions, Inc. http://www.eesi21.org/market.htm Contacts: Scott Van de Mark, Director of Special Projects, Pennsylvania Environmental Council. (412) 481-9400 Written Program Information: Crable, A. (2002). Polluters urged: pay farmers to clean waterways. Lancaster New
Era, August 26, 2002. Retrieved February 22, 2004 from http://www.waterobservatory.org/News/news.cfm?News_ID=375
Enterprising Environmental Solutions Inc. (EESI) (n.d.). Multi-credit trading and the Conestoga River Nutrient Trading Pilot [Brochure]. Retrieved February 22, 2004 from http://www.envtn.org/docs/conestogabrochure.doc
Pennsylvania Department of Environmental Protection (PA DEP) (2003). Pilot projects featured during nutrient trading event. Environmental Quality Update [newsletter]. Retrieved on March 1, 2004 from:
249
http://www.dep.state.pa.us/newsletter/?varQueryType=PrintVersion&NewsletterID=102
------(n.d.) Pennsylvania Businesses for the Bay (B4B) Environmental Management Resources. Retrieved May 11, 2004 from http://www.dep.state.pa.us/dep/deputate/pollprev/b4b/envManResources.htm
Pennsylvania Environmental Council (PEC) (n.d.). Nutrient Trading Pilot Project: Conestoga River Watershed, Pennsylvania. Powerpoint presentation. Retrieved on March 1, 2004 from: http://www.eesi21.org/ConestogaNutrientTradingPowerPoint.pdf
Reviewed by Scott Van de Mark, Pennsylvania Environmental Council.
250
Pennsylvania Water-based Trading Simulations (PA) A. Program Background
1. Program description Sponsored by the US EPA and supported by the Pennsylvania Department of Environmental Protection (PA DEP), four trading simulations were conducted in Pennsylvania to “develop insights about trading policies and standards and quantitative issues, and to bring out the pros and cons on the many variables by which trades can be structured and evaluated.” The trading variables included pollutant selection, trade structure, “units of trade and minimum quantities,” potential trading partners, “directionality [of the trade, upstream or downstream],” “size of trading area,” “trading ratio,” “monitoring requirements,” “banking,” “inter-pollutant trades,” load calculation, assurance of real trades, “trade approvals,” “enforcement and responsibility,” “registration system,” credit verification, “anyway credits,” “public information,” and “interstate trading.” Pennsylvania was chosen to host the simulations based on its impaired waters, “good mix of point and nonpoint source challenges,” relation to the Chesapeake Bay watershed and nutrient trading initiative, and proximity to the EPA contractor charged with managing the simulation process. Between March 30 and August 12, 1999, the simulation working group evaluated four out of a proposed seven trading simulations. All seven were not reviewed due to time and data constraints. Each of the simulated trades involved actual sources of pollution and real stream data subject to real or assumed regulatory requirements and water quality standards. At the time the study was performed, Pennsylvania was in the early stages of TMDL implementation. While this served as an incentive for PA DEP to participate in the simulation project in order to gain a better understanding of how trading might be incorporated into the TMDL process, it also served as an obstacle in the determination of necessary pollutant reductions and evaluation of trading opportunities within the simulations. Other obstacles faced by the trading simulation working group included stream data collection, identification of potential trading partners, indirect load calculations, and Pennsylvania’s mostly voluntary approach to nonpoint source pollution control. Trading simulations represented point/point, point/nonpoint, and nonpoint/nonpoint trades. Pollutants to be traded included carbonaceous biochemical oxygen demand (CBOD), phosphorus, nitrogen, suspended solids, ammonia, acid and metals, depending on the particular simulation. A brief description of each trading simulation is provided below: Delaware River New Source Offset - The expansion of an existing POTW in Special Protection Waters required offsets for both direct and indirect pollutant loadings. Although both point/point and point/nonpoint trades were
251
investigated, the working group determined that an interstate trade involving another POTW was “the only likely trading candidate.”
Moshanon Creek Coal Mine Drainage Simulation - The Rushton coal mine located in North Central Pennsylvania would be able to replace treatment of a contaminated groundwater pool with upstream treatment of acid mine drainage leading to “in-stream benefits.” More specifically, five miles of fishable waters would be created by changing the site of treatment. Despite fishery generation, the change in treatment would also result in increased loadings of iron and manganese. The working group questioned whether the increased loadings would be in violation of technology-based treatment standards and anti-backsliding requirements of the Clean Water Act. Swatara Creek POTW Nutrient Simulation - A POTW could achieve nutrient reductions through nonpoint sources in order to meet reduced permit levels. Predominant nonpoint sources in the area included agricultural lands and golf courses. The working group found that a trade for phosphorus was not economically viable even if nutrients could be substituted for one another (i.e. nitrogen for phosphorus). The possibility that BMP reductions would be required by TMDL implementation plans limited trading options. Spring Creek Simulation - Trading between nonpoint sources in impaired waters as required by an assumed TMDL. (Point sources not thought to be the sources of impairment.) The working group discovered that limited trading opportunities existed for the various causes of impairment, determining that only siltation could be viably traded. However, the working group experienced difficulty in calculating siltation loads and associated nutrient amounts and an actual simulation was not performed. The working group recognized that real trades would depend on actual TMDL implementation plans and associated BMP requirements and load reductions. Although no actual trades occurred as a result of the simulations, the “process met the goals of capturing a variety of opinions on water-trading from a diverse group of participants.” Pennsylvania is still pursuing trading options within the context of TMDL implementation and Chesapeake Bay initiatives through such pilot programs as the Conestoga River Nutrient Trading Pilot. The state is also in the early stages of developing a multi-credit trading registry and statewide trading framework. Conclusions drawn from the trading simulations included: the different motives of potential trading partners “coupled with regulatory goals and public concerns [would] make development of a viable trading program difficult,” and that the “variability of conditions in each watershed [would] further complicate development of a consistent enforceable trading program.” These realizations prompted the working group to recommend that trading guidelines be flexible, but contain specific criteria for trading ratios.
252
All information in this entry, unless otherwise noted, comes from Marshall (1999).
2. Program motivation
The trading simulations were designed as a “bottom-up approach” to developing trading programs and testing potential regulations. As stated in the final report on the simulations, “In theory the basis for a regulation or program would emerge from resolution of issues raised by the simulations.” EPA supported the program as a way to analyze the process by which trading criteria is established through the input of a variety of stakeholders examining realistic situations. The simulations allowed “what-if” questions to be discussed and economic and technical specifics to be pursued before an agency was faced with “an actual proposed trade or regulatory development process.” Pros and cons associated with trading variables were recorded and differences among stakeholders noted to aid in the development of future programs. Trading variables requiring federal and state guidance as opposed to local evaluation were identified by the working group. Pennsylvania was chosen to host the simulations based on its impaired waters, “good mix of point and nonpoint source challenges,” relation to the Chesapeake Bay watershed and nutrient trading initiative, and proximity to the EPA contractor charged with managing the simulation process. (See Regulatory Drivers for Specific Trading Simulation’s Motivation)
3. Pollutant being traded
Multiple: CBOD, phosphorus, nitrogen, suspended solids, ammonia, acid and metals, depending on the particular simulation. Delaware River New Source Offset - CBOD, phosphorus, nitrogen, suspended solids, and ammonia Moshanon Creek Coal Mine Drainage Simulation - Iron, aluminum, manganese, acidity, alkalinity, and pH Swatara Creek POTW Nutrient Simulation - Phosphorus and Nitrogen Spring Creek Simulation - Siltation
4. Size of program.
The trading simulations occurred throughout Pennsylvania.
Delaware River New Source Offset – One potential polluter (expanding POTW) in the Delaware River Basin. Limits for the trading area were not explicitly discussed but could be the entire length of the stream in which offsets would be required.
253
Moshanon Creek Coal Mine Drainage Simulation – One mine company, largest discharger of treated acid mine drainage in PA. Trade must occur within the same stream but distance between discharge and offset determined on a case-by-case basis. Moshanon Creek is located in North Central Pennsylvania and flows into the Susquehanna River which flows into the Chesapeake Bay. Swatara Creek POTW Nutrient Simulation - TMDL area or entire Chesapeake basin depending on regulatory driver. Swatara Creek is located in central PA and flows into the Susquehanna River which flows into the Chesapeake Bay. Spring Creek Simulation – Spring Creek is located in central Pennsylvania and flows into Swatara Creek. A proposed land restoration by one major landowner, Hershey School, could serve as a source of reductions for other nonpoint sources “located on the one mile distance to the next downstream confluence with another tributary, or for 1.5 to 2.0 miles downstream of that confluence to the Swatara Creek.” Potential trading parties: Delaware River New Source Offset - Point/Point: POTW in Westfalls Township, PA would purchase reduction credits from POTW in Port Jervis, NY. Although nonpoint offsets were also considered, the working group decided Port Jervis was “the only likely trading candidate.” Moshanon Creek Coal Mine Drainage Simulation - Not discussed Swatara Creek POTW Nutrient Simulation - Point/Nonpoint: POTW/agricultural lands or golf courses Spring Creek Simulation - Nonpoint/Nonpoint: Hershey School land restoration
5. Stakeholders/participants
The simulation working group represented the interests of EPA, Pennsylvania Department of Environmental Protection (PA DEP), the Chesapeake Bay Program, River Basin Commissions, Conservation Districts, a municipal wastewater treatment association, planning commission and land use consultant, abandoned mine reclamation, industry, agriculture and the environment. • US EPA - sponsor of the simulation project • PA DEP - main supporter and actor: helped coordinate stakeholders to be
represented in the working group, described PA’s TMDL process, outlined key issues associated with the development of trading programs, and favored trades involving at least one point source for enforcement reasons
• Philip Services - EPA contractor for the project: assembled background information and presented trading cases to the working group
6. Regulatory drivers
254
Pennsylvania was in the early stages of developing TMDL implementation plans for impaired waters. Delaware River New Source Offset Regulatory Driver: Special Protection Waters as designated by the Delaware River Basin Commission Regulations are subject to antidegradation policies in which a new or expanding source of pollution must maintain or improve water quality and pursue load reduction possibilities to offset associated direct and indirect discharges (Environomics 1999). Moshanon Creek Coal Mine Drainage Simulation Motivation: Generation of “in-stream benefits” Swatara Creek POTW Nutrient Simulation Regulatory Driver: TMDL and Chesapeake Bay initiative (Swatara Creek flows into the Susquehanna River which flows into the Chesapeake Bay), requiring load reductions of phosphorus for improved dissolved oxygen levels Spring Creek Simulation Regulatory Driver: assumed TMDL
B. Trade Structure 7. Determination of credit
Delaware River New Source Offset Monitoring Requirements: Trade monitored through NPDES permits Moshanon Creek Coal Mine Drainage Simulation Monitoring Requirements: Evaluation of improved stream usage through fish and biological studies Swatara Creek POTW Nutrient Simulation Monitoring Requirements: In-stream monitors and BMP inspections Spring Creek Simulation – Credits generated only for reductions beyond BMP and load reduction requirements established by actual TMDL.
8. Trading ratios and other mechanisms to deal with uncertainty
Delaware River New Source Offset Trading Ratio: Between 1.1:1 and 1.25:1 based on certainty of point source trade under NPDES permits. Moshanon Creek Coal Mine Drainage Simulation Trading Ratio: Trades based on “stream miles improved.” Swatara Creek POTW Nutrient Simulation Trading Ratio: Between 1.5:1 and 2.0:1; if allowed, pollutants could be substituted at a 1:1 ratio (nitrogen for phosphorus). Spring Creek Simulation Trading Ratio: Not determined, but would have to account for the uncertainty of reference load rates pertaining to nonpoint sources and the actual flow of pollutants based on underlying geology.
9. Liability/penalties for noncompliance
255
Delaware River New Source Offset Liability: Regulated through NPDES permits Moshanon Creek Coal Mine Drainage Simulation Liability: Contingency plan in place if stream not measurably improved Swatara Creek POTW Nutrient Simulation Liability: Regulated through NPDES permits and BMP inspections Spring Creek Simulation Liability: Not determined
10. Approval process Delaware River New Source Offset - Approval for trade received from EPA and state authorities issuing NPDES permits. Moshanon Creek Coal Mine Drainage Simulation - Approval for trade received through NPDES permitting requirements as determined by PA DEP- approved watershed plan. Swatara Creek POTW Nutrient Simulation - Approval for trade received through state NPDES permit. Spring Creek Simulation – Not determined, but reductions would have to be
“surplus”
11. Ex post verification/auditing. Delaware River New Source Offset – monitoring through NPDES permits Moshanon Creek Coal Mine Drainage Simulation – not discussed Swatara Creek POTW Nutrient Simulation – not discussed Spring Creek Simulation – not discussed
12. Mechanisms for trade identification and communication (education and outreach, third party facilitation, embedded ties). Delaware River New Source Offset – interstate facilitation Moshanon Creek Coal Mine Drainage Simulation – possible PA DEP facilitation, educational outreach for public support Swatara Creek POTW Nutrient Simulation – private transactions Spring Creek Simulation – N/A; if data available on control costs, least cost methods would be identified as “preferred trading candidates.”
13. Market structure (bilateral, clearinghouse, third party brokers)
Delaware River New Source Offset – Due to interstate nature of the trade, private, bilateral trade unlikely. State involvement would be necessary if state revolving funds borrowed by POTW to purchase treatment. Moshanon Creek Coal Mine Drainage Simulation – bilateral or PA DEP facilitation through development of a watershed plan
256
Swatara Creek POTW Nutrient Simulation – bilateral; registration of credits not discussed Spring Creek Simulation – not discussed
14. Types of trades allowed. Delaware River New Source Offset – Point/Point Moshanon Creek Coal Mine Drainage Simulation – Point/Nonpoint; According to a document published in June 2003 regarding PA’s TMDL program, abandoned mine discharges are treated as nonpoint sources (Pennsylvania 2003). Swatara Creek POTW Nutrient Simulation – Point/Nonpoint Spring Creek Simulation – Nonpoint/Nonpoint
C. Outcomes
15. Types and volume of trades that have occurred N/A
16. Administrative costs. N/A
17. Transaction costs. N/A
18. Cost savings. N/A
19. Program goals achieved Although no actual trades occurred, the “process met the goals of capturing a variety of opinions on water-trading from a diverse group of participants.” (See “project description” above).
20. Program obstacles Delaware River New Source Offset - Interstate nature raised issue of whether or not state revolving funds could be borrowed to subsidize the treatment process. Difficulty experienced in calculating indirect loads. Moshanon Creek Coal Mine Drainage Simulation - Despite generating fishable waters, the change in treatment would result in increased loadings of iron and manganese and the working group was faced with deciding if this was in violation of technology-based treatment standards and anti-backsliding
257
requirements of the Clean Water Act. Also public support, especially from people living downstream of Rushton, would be needed before an actual trade could occur. Swatara Creek POTW Nutrient Simulation - Overall, a trade for phosphorus was not economically viable even if nutrients could be substituted. Possibility that BMP reductions would be required by TMDL implementation plans limited trading options. Spring Creek Simulation - Limited trading opportunities existed for the causes of impairment. The working group experienced difficulty in calculating siltation loads and associated nutrient amounts. An actual simulation was not performed. Members of the working group disputed reference load rates and nutrient flow. The working group determined real trades would depend on actual TMDL implementation plans requiring BMPs and load reductions.
21. NPS involvement and incentives to engage in trading.
Delaware River New Source Offset – N/A Moshanon Creek Coal Mine Drainage Simulation – Improvement of waters might be achieved at less cost depending on required treatment. Swatara Creek POTW Nutrient Simulation – Incentives for nonpoint source involvement greater when facing nitrogen rather than phosphorus load reductions. Spring Creek Simulation – TMDL implementation plan requiring load reductions. Incentives would be increased if buyers could also obtain credits for nutrients not eroded as a result of siltation load reductions.
22. Other
Program information/References
Websites: PA Department of Environmental Protection, http://www.dep.state.pa.us/ Delaware River Basin Commission, http://www.state.nj.us/drbc/drbc.htm Susquehanna River Basin Commission, http://www.srbc.net/ Contacts: Charles Marshall, Project Manager. E-mail: [email protected] Paul Scally, Delaware River Basin Commission. Telephone: (609) 883-9500.
E-mail: [email protected] Written Program Information: Bureau of Water Supply and Wastewater Management. 2004. Pennsylvania
DEP’s Six-Year Plan for TMDL Development. Retrieved on May 7, 2004, from http://www.dep.state.pa.us/dep/deputate/watermgt/wqp/wqstandards/TMDL/TMDL_6yearplan.pdf
258
Delaware River Basin Commission. 2002. 2002 305(b) Water Quality Assessment Report. Retrieved on May 7, 2004, from http://www.state.nj.us/drbc/305b02.htm
Marshall, Chuck. 1999. Final Report: Results of Water-Based Trading Simulations. US EPA: September 30, 1999. Retrieved on May 7, 2004, from http://www.epa.gov/owow/watershed/trading/marshal2.pdf
Pennsylvania Department of Environmental Protection. 2003. Pennsylvania’s TMDL Program: Restoring water quality. Retrieved on May 7, 2004, from http://www.dep.state.pa.us/dep/deputate/watermgt/wqp/wqstandards/TMDL/TMDL_Slides.pdf
Environomics. 1999. A summary of U.S. effluent trading and offset projects. A report prepared for Dr. Mahesh Podar, U.S. Environmental Protection Agency, Office of Water. Retrieved May 7, 2004 from http://www.epa.gov/owow/watershed/trading/traenvrn.pdf
Reviewed by Chuck Marshall, Project Manager.
259
Blue Plains WWTP (VA and Washington, DC) A. Program Background
1. Program description The State of Virginia considered a nitrogen trading program with the Blue Plains WWTP in Washington, D.C. during the late 1990s. Virginia looked to trading as an interim strategy for meeting the state’s Year 2002 commitment to achieve a 40% nutrient reduction goal for the Potomac River (John Kennedy, personal communication, April 26, 2004). Several treatment facilities in Virginia were still constructing biological nutrient reduction (BNR) retrofits at their facilities to meet the tributary nutrient reduction goals. The Blue Plains WWTP had already installed BNR on half of its flow to meet a 7.5 mg/L nitrogen limit. Virginia proposed to pay Blue Plains to further reduce their nitrogen discharge until the Virginia POTWs could complete their own BNR upgrades. Since each additional mg/L of nitrogen removed from Blue Plains’ discharge reduced nitrogen loading to the Chesapeake Bay by about 1 million lbs/year, this trade would have allowed Virginia to meet its nitrogen reduction commitment on schedule (Environomics 1999; John Kennedy, personal communication, May 28, 2004). Environomics reports that the agreement was near finalization as of late 1999, and Virginia had already set aside about $1.5 million in WQIF funds to purchase credits beginning in 2000 (John Kennedy, personal communication, May 21, 2004). Trading was expected to last until 2003. In the end, however, Virginia did not sign a trading agreement with Blue Plains. The Chesapeake 2000 Agreement established even more stringent reduction goals, which provided further impetus for Virginia’s POTWs to upgrade their facilities rather than trade (John Kennedy, personal communication, April 26, 2004). Other considerations that influenced the negotiations with Blue Plains are included under “Program Obstacles.”
2. Program motivation High levels of nutrients have led to algal growth and low dissolved oxygen in the Chesapeake Bay. Virginia, Maryland, Pennsylvania, and Washington, D.C. joined in the Chesapeake Bay Program in 1983 to address this nutrient load and eutrophication. In 1987, they agreed that they needed to reduce the Bay’s nutrient load by 40%. In 1992, they determined that individual tributary strategies were needed to achieve this reduction goal. Virginia’s Tributary Strategy for the Shenandoah/Potomac watershed was approved in January 1997, setting a 37% nitrogen reduction goal by the end of 2000 (Commonwealth of Virginia 2004). The motivation for the Blue Plains trade was established by this tributary nitrogen reduction goal. Virginia explored trading as an interim strategy for
260
meeting the tributary goal while several POTWs in Northern Virginia were retrofitting their treatment systems for BNR (Environomics 1999).
3. Pollutant being traded
Nitrogen
4. Size of program Several Virginia facilities were considering trading with the Blue Plains STP in Washington, D.C.
5. Stakeholders/participants • The State of Virginia • Several POTWs in Northern Virginia • The District of Columbia • The Blue Plains WWTP • U.S. EPA – approves trades
6. Regulatory drivers Although not a regulation, the driver for nutrient reduction actions was the 1997 Tributary Strategy for the Shenandoah/Potomac watershed. The Tributary Strategies contained implementation plans to achieve the goals of the Chesapeake Bay Agreement, which charged Virginia with a 40% nutrient reduction target by the end of 2000. However, when the Chesapeake 2000 Agreement set new nutrient reduction goals, Virginia no longer needed to secure nutrient reduction credits from the Blue Plains facility. Furthermore, since the new goals were more stringent, it made sense to invest more heavily in BNR upgrades within Virginia rather than use the funds for interim offsets (John Kennedy, personal communication, May 28, 2004).
B. Trade Structure 7. Determination of credit
Blue Plains’ concentration limits and annual load allowance were set by a federal court order, and the credits available for Virginia’s use would have been generated by treating beyond these requirements (John Kennedy, personal communication, May 28, 2004).
8. Trading ratios and other mechanisms to deal with uncertainty The trading ratio would have been 1:1 (Environomics 1999).
9. Liability/penalties for noncompliance
261
Failure to achieve the enhanced treatment levels would have likely resulted with the DC Water and Sewer Authority, which owned and operated Blue Plains, receiving less funding from Virginia (John Kennedy, personal communication, May 28, 2004). Since Virginia’s 40% nutrient reduction target was not enforceable (it was a voluntary goal established by the Chesapeake Bay Agreement), it was not liable for securing additional credits.
10. Approval process The approval process was simply a negotiation between Virginia and DC (John Kennedy, personal communication, May 28, 2004).
11. Ex post verification/auditing. All wastewater treatment facilities conducted ongoing water monitoring.
12. Mechanisms for trade identification and communication (education and outreach, third party facilitation, embedded ties) Not determined.
13. Market structure (bilateral, clearinghouse, third party brokers) Not determined. The Virginia DEQ negotiated directly with the Blue Plains WWTP on behalf of several POTWs (John Kennedy, personal communication, May 28, 2004). The nutrient reduction goals were established for the state and not allocated to individual facilities.
14. Types of trades allowed (past, present and future) Point/Point.
C. Outcomes 15. Types and volume of trades that have occurred
None.
16. Administrative costs Not determined.
17. Transaction costs
Not determined.
18. Cost savings
262
Virginia had set aside $1.5 million to purchase credits from Blue Plains, which was estimated to achieve up to three million pounds of additional nutrient reductions (John Kennedy, personal communication, May 28, 2004). At approximately $0.58/lb, these reductions presented a very low cost alternative for achieving the nitrogen reduction goals.
19. Program goals achieved Virginia has been short of its 2000 Shenandoah/Potomac point source nitrogen reduction goal. However, the major BNR retrofits in northern Virginia have now been completed, and nutrients have been reduced slightly beyond the 40% reduction goal (John Kennedy, personal communication, May 28, 2004).
20. Program obstacles Blue Plains had some concerns about anti-backsliding requirements once VA no longer provided funds to meet the 4.5 mg/L standard (Environomics 1999). In addition, Blue Plains would have needed to accommodate greater methane storage (methane is needed for the BNR process, and much of Virginia’s funding would have been used to purchase methane for Blue Plains) and increased disposal of biosolid waste (John Kennedy, personal communication, May 28, 2004).
21. NPS involvement and incentives to engage in trading. Nonpoint sources were not involved.
22. Other
Program information/References
Websites: None Contacts: John Kennedy, Virginia DEQ, (804) 698-4312. Written Program Information: Commonwealth of Virginia (2004). Chesapeake Bay nutrient and sediment
reduction Tributary Strategy for the Shenandoah and Potomac river basins. Public comment draft. Retrieved 4/28/04 from http://www.naturalresources.virginia.gov/Initiatives/TributaryStrategies/FinalTribStrats/trib-potomac-shenandoah.pdf
Environomics (1999). A summary of U.S. effluent trading and offset projects. A report prepared for Dr. Mahesh Podar, U.S. Environmental Protection
263
Agency, Office of Water. Retrieved May 7, 2004 from http://www.epa.gov/owow/watershed/trading/traenvrn.pdf
Reviewed by John Kennedy, Virginia Department of Environmental Quality.
264
Henry County Public Service Authority and City of Martinsville Agreement (VA) A. Program Background
1. Program description In 1998 a single trade of total dissolved solid (TDS) discharge was proposed in Virginia between the Lower Smith River Waste Water Treatment Plant (WWTP) in Henry County and the City of Martinsville Sewage Treatment Plant (STP). This trade was intended to allow the Henry County textile industry to expand (Environomics 1999), but never occurred because the Henry County textile industry encountered financial difficulties. The textile industry was the most significant contributor to total discharged solids, so as individual factories went out of business, the need to trade disappeared (Kip Foster, personal communication, April 27, 2004). The proposed trade would have transferred 20,000 kg/day of total dissolved solid discharge from the City of Martinsville to the Lower Smith River WWTP and led to the rewriting of the two discharge permits associated with the trade (Environomics 1999).
2. Program motivation Dissolved solids in the Smith River were degrading the quality of river water. Concern over river water quality arose because the river supplies drinking water for the town of Eden, North Carolina (Environomics 1999). In 1988, TDS limits were developed for both the Martinsville STP and Lower Smith River WWTP so as to maintain an in stream standard of 500 mg/l maximum TDS at Eden (Wise 2000). These limits were written into the permits of each of these sources, so that the Martinsville STP was issued a maximum weekly average TDS limit of 110,00 kg/d and the Lower Smith River WWTP was issued a maximum weekly average TDS limit of 55,000 kg/d (Wise 2000). When the textile plant Bassett Walker proposed an expansion of its facilities, which would lead to an increase in discharge waste into the Lower Smith WWTP, it became apparent that the Lower Smith WWTP could not handle the waste within the confines of its permit (Wise 2000). The two waste treatment plants agreed to lower the TDS limit of the Martinsville plant to 90,000 kg/d and increase the TDS limit of the Lower Smith Plant to 75,000 kg/d (Wise 2000).
3. Pollutant being traded Total dissolved solids
4. Size of program
265
The trade would have been between two point sources in the Roanoke River Basin on the Smith River in Virginia (Wise 1999). Potential trading parties: Lower Smith River Waste Water Treatment Plant (WWTP) in Henry County and the City of Martinsville Sewage Treatment Plant (STP)
5. Stakeholders/participants • Henry County’s Lower Smith River Wastewater Treatment Plant: The
WWTP could not take on more industrial waste without violating its permit regulating total dissolved solids (Environomics 1999).
• Martinsville sewage treatment plant: This plant entered into trade negotiations with Henry County’s WWTP that would lead to a modification of its permit reflecting a decrease in dissolved solid pollution to allow Henry County’s WWTP to raise the dissolved solid pollution allowance on its permit.
• Virginia Department of Environmental Quality Permitting Division: This agency was responsible for ensuring that the trade would be acceptable under the EPA’s Clean Water Act of 1997 (Environomics 1999).
• Bassett Walker: This textile plant considered an expansion of its facilities around 1999. As the chief contributor of waste to the Lower Smith River WWTP, contributing about 95% of total waste, this increase would have put the Lower Smith River Plant beyond its permitted allowance (Wise 1999). This plant, along with other textile plants in the area, went out of business in the late 90’s, eliminating the need to trade.
6. Regulatory drivers
The Virginia Department of Environmental Quality had to ensure that trading would not violate the anti-backsliding clause included in the Clean Water Act (Environomics 1999). The Virginia anti-backsliding policy (9 VAC 25-31-220L): Relaxation of water quality standards is permitted as long as it does not violate anti-degradation policy (Wise 1999). The rewriting of permits in this case would have been allowable since the two dischargers were considered part of the same stream segment and therefore no net increase in pollutants would be discharged (Wise 1999).
B. Trade Structure
7. Determination of credit Since no trade occurred, credit was not determined.
266
8. Trading ratios and other mechanisms to deal with uncertainty A 1:1 trading ratio would have been applied to the trade (Environomics 1999)—i.e., Henry County’s Lower Smith River WWTP would have increased its permitted allowance of total dissolved solid discharge by reducing the Martinsville’s sewage treatment plant’s allowance by the same amount.
9. Liability/penalties for noncompliance
N/A
10. Approval process
N/A
11. Ex post verification/auditing.
N/A
12. Mechanisms for trade identification and communication (education and outreach, third party facilitation, embedded ties)
N/A
13. Market structure (bilateral, clearinghouse, third party brokers)
N/A
14. Types of trades allowed This would have been a point/point trade.
C. Outcomes
15. Types and volume of trades that have occurred None.
16. Administrative costs
N/A
17. Transaction costs
N/A
267

18. Cost savings
N/A
19. Program goals achieved
The trade was initially intended to enable the textile industry to expand, but there was no need to pursue trading once the textile industry began to decline.
20. Program obstacles
The textile industry was the most significant contributor to total discharged solids, so as individual factories went out of business, the need to trade disappeared (Kip Foster, personal communication, April 27, 2004).
21. NPS involvement and incentives to engage in trading.
This would have been a point/point trade.
22. Other
Program information/References
Websites: None Contacts: Kip Foster, Virginia Department of Environmental Quality. (540) 562-6782 Written program information: Environomics (1999). A summary of U.S. effluent trading and offset projects.
A report prepared for Dr. Mahesh Podar, U.S. Environmental Protection Agency, Office of Water. Retrieved May 7, 2004 from http://www.epa.gov/owow/watershed/trading/traenvrn.pdf
Wise, Lynn (2000). Martinsville Water Pollution Control Plant; VODES Permit No. VA0025305. Virginia Department of Environmental Quality, West Central Regional Office.
Wise, Lynn (1999). VDDES Permit Program Fact Sheet: Lower Smith River WWTP. Virginia Department of Environmental Quality, West Central Regional Office.
268
Fox-Wolf Basin Watershed Pilot Trading Program (WI) A. Program Background
1. Program description. As part of the State of Wisconsin’s effort to investigate trading, the Wisconsin Department of Natural Resources (WDNR) chose the Fox-Wolf Basin as one of three trading pilot programs in 1997 (WDNR 2002). The Fox-Wolf Watershed Alliance (FWWA, formerly Fox-Wolf Basin 2000), a non-profit organization focused on water quality, had taken the lead in conducting extensive water quality monitoring, modeling, economic analysis, and policy formulation regarding water quality trading (Baumgart et al. 2000). Despite FWWA’s extensive research and promotion of trading, the lack of regulatory drivers and economic incentives has hindered the program. Point sources already faced phosphorus limits of 1 mg/L, and it has proven to be more economically attractive to meet this limit through plant upgrades than through substantial trades. In addition, several dischargers demonstrating economic hardship were granted temporary alternative limits, which suggests that point sources will most likely not be compelled to explore trading until a TMDL is implemented (Kramer 2003). This lack of regulatory and economic drivers, coupled with uncertain state trading guidelines, has effectively held up trading in the Basin. It appears unlikely that any trades will occur in the Basin unless the State of Wisconsin formulates definitive trading guidelines and stricter effluent limits for point sources (Kramer 2003; Linda Stoll, personal communication, March 13, 2003). In the future, smaller point sources that need to expand for population growth might hold potential for trading. Dischargers with temporary alternative limits might also look to trading when renewing their permits. (Linda Stoll, personal communication, March 13, 2003).
2. Program motivation
The Fox-Wolf River Basin drains into Lake Michigan’s Green Bay, which has faced excessive nutrient loading since the mid-1980s. Point sources have been regulated down to a 1 mg/L phosphorus limit as part of a 1988 Remedial Action Plan for the Basin (Environomics 1999), but the basin’s aquatic health has continued to decline. This motivated many stakeholders in the basin to explore water quality trading as a mechanism for addressing nonpoint source pollution and improving water quality in a cost-effective manner. Despite the environmental logic for trading, however, the program has been held up by the lack of regulatory drivers and economic incentives.
3. Pollutant being traded
Phosphorus
269
4. Size of program
The Fox-Wolf Basin includes 6,400 square miles in the Lower Fox, Upper Fox, and Wolf river basins and drains into the Green Bay in Lake Michigan (FWWA website). There are potentially hundreds of point source participants, particularly wastewater treatment plants, in this area (Environomics 1999). Potential participants in trading: wastewater treatment plants; farmers
5. Stakeholders/participants • Wisconsin Department of Natural Resources (WDNR): authorized pilot
trading programs • Fox-Wolf Watershed Alliance (FWWA), formerly Fox-Wolf Basin 2000:
conducted monitoring, modeling, economic analyses, and policy formulation
• United States Geological Survey: assisted with monitoring • Water Environment Research Foundation: provided funding for
monitoring and policy analysis • Resource Strategies, Inc.: consultant to FWWA
6. Regulatory drivers FWWA has advocated strongly for a TMDL, noting that there exists no other regulatory driver for trading at this time. Although the WDNR indicates that the Upper and Lower Fox Rivers were on the 1998 TMDL Development Two-Year Schedule, no TMDL has been developed for the basin (James Baumann, personal communication, 5/31/02). Many point sources in Wisconsin were affected by the 1999 addition of Chapter NR 217 to the Wisconsin Administrative Code, which stipulates a 1 mg/L phosphorus discharge limit for municipal and industrial treatment plants of a certain size. Since point sources in the Fox-Wolf Basin have faced this limit for many years, and several point sources have been able to acquire alternative permit limits due to economic hardship, the phosphorus discharge limit has not been an adequate driver for cost-effective trades (WDNR 2002). In the future, however, the DNR may require non-compliant or struggling point sources to consider trading as a margin of safety (WDNR 2002). Without definitive state-wide guidelines on trading, it is not clear how trading will be integrated with other regulations on nonpoint source pollution. For example, Wisconsin recently ruled that nonpoint sources do not have to comply with water quality standards when there is not enough money available to subsidize BMPs (Kramer 2003). Since nonpoint sources may not be able to trade unless they are incompliance with water quality standards,
270
trading may be limited by the availability of state cost-share funds. Without standardized state guidelines on trading, point sources wishing to trade face considerable uncertainty regarding trading costs, liability, applicability to federal permits, and trade ratios (Kramer 2003).
B. Trade Structure 7. Determination of credit
FWWA has actively supported much of the technical effort to facilitate trading in the watershed, primarily through the Soil and Water Assessment Tool (SWAT) model and the promotion of the World Resources Institute’s NutrientNet software. However, since no trades have occurred, there does not yet exist an established method for determining credits.
8. Trading ratios and other mechanisms to deal with uncertainty Early estimates of point/nonpoint source pollution abatement costs assumed a 2:1 trading ratio, but the State has at times mentioned trading ratios as high as 10:1 (Linda Stoll, personal communication, March 13, 2003).
9. Liability/penalties for noncompliance
Not determined.
10. Approval process Not determined.
11. Ex post verification/auditing.
Not determined.
12. Mechanisms for trade identification and communication (education and outreach, third party facilitation, embedded ties) The Fox-Wolf Watershed Alliance has promoted the use of NutrientNet, an online nutrient registry from the World Resources Institute, to help establish a market for pollution credits.
13. Market structure (bilateral, clearinghouse, third party brokers)
The market structure will most likely be bilateral, although brokered trades have also been discussed as a possibility (Kramer 2003). At this point, point sources interested in trading would have to individually design trades.
14. Types of trades allowed
271
Point/point and point/nonpoint trades have both been discussed, although no trades have occurred and trading guidelines have not been defined.
C. Outcomes
15. Types and volume of trades that have occurred To date, no trades have occurred in the Fox-Wolf Basin. The City of Ripon discussed trading with the WDNR in 1999, but it decided not to pursue a trade due to the uncertainty of correlating phosphorus with other pollutants. Ripon had been interested in offsetting biological oxygen demand (BOD) and/or ammonia limits with phosphorus BMPS (WDNR 2000)
16. Administrative costs Not determined.
17. Transaction costs
Without clearer guidance and leadership from the state on trading, anticipated transaction costs for point sources are high. Point sources interested in trading would be responsible for developing much of their own trading program, while there is a fear of a backlash from the environmental community if trading is not supported by state guidelines (Linda Stoll, personal communication, March 13, 2003). Faced with large reductions, point sources may choose to trade with other point sources rather than negotiate with many small nonpoint sources (Kramer 1999).
18. Cost savings Initial estimates indicated a viable economic basis for trading in the basin, with average phosphorus control costs estimated at $73/lb for point sources and $26/lb for agricultural BMPs (Environomics 1999). Subsequent economic analyses, however, determined that phosphorus control costs were lower for point sources than for nonpoint sources in the Upper Fox and Wolf Rivers, leaving only the Lower Fox River with a favorable cost differential (Kramer 1999).
19. Program goals achieved The purpose of the pilot programs was to assess under which conditions trading might be viable, not to establish robust trading (WDNR 2002). By this broad definition, the Fox-Wolf Basin pilot has been useful in generating much valuable information and lessons. However, no trades have been completed, no trading model has been defined, and the potential for future trades seems weak without greater state leadership on a TMDL or trading
272
guidelines. Many stakeholders view the initiative as more “frustrating” than productive (Linda Stoll, personal communication, March 13, 2003).
20. Program obstacles
The primary obstacle has been the lack of regulatory and economic incentives. In addition, point sources have been reluctant to trade because of high uncertainty and anticipated transaction costs, while farmers have hesitated to become involved with a government pilot program (Kramer 2001). The lack of communication between stakeholders, state and federal agency ambiguities, and a resistance to innovation have also posed significant challenges to trading (Kramer 2003; Baumgarten et al. 2000).
21. NPS involvement and incentives to engage in trading. Nonpoint sources would be more than adequately compensated for any BMPs that took land out of production. Many farmers, however, had a strong sense of property rights and were not interested in being involved with the government (Linda Stoll, personal communication, March 13, 2003).
22. Other Program information/References
Websites: Fox-Wolf Watershed Alliance. http://www.fwwa.org Wisconsin Department of Natural Resources: Watershed-based pollutant
trading. http://www.dnr.state.wi.us/org/water/wm/nps/pt/ Contacts: Linda Stoll, Director, Fox-Wolf Watershed Alliance. (920) 738-7025 James Baumann, Wisconsin Department of Natural Resources. (608) 266-
9277. Written Program Information: Baumgart, P., Johnson, B. N., & Pinkham, J. R. (2000). Phosphorus credit
trading in the Fox-Wolf Basin: exploring legal, economic, and technical issues. Water Environment Research Foundation, Project 97-IRM-5D.
De Alessi, Michael. (n.d.). New tools for addressing the nutrient loading problem in the Fox-Wolf River basin: trading white paper. Retrieved January 28, 2004 from http://www.fwwa.org/PDF/NewToolsMarketIncentives.pdf
------(2003). Removing muck with markets: a case study on pollutant trading for cleaner water. Reason Public Policy Institute, Policy Brief 24. Retrieved January 28, 2004 from http://www.rppi.org/pb24.pdf
Environomics (1999). A summary of U.S. effluent trading and offset projects. A report prepared for Dr. Mahesh Podar, U.S. Environmental Protection
273
Agency, Office of Water. Retrieved May 7, 2004 from http://www.epa.gov/owow/watershed/trading/traenvrn.pdf
Kramer, Joseph M. (2003). Lessons from the trading pilots: applications for Wisconsin water quality trading policy. Resources Strategies, Inc: A report prepared for the Fox-Wolf Watershed Alliance. Retrieved January 28, 2003 from http://www.fwwa.org/pdf/WisconsinTradingFinal.pdf
------(1999). Analysis of phosphorus control costs and effectiveness for point and nonpoint sources in the Fox-Wolf Basin. Resource Strategies, Inc.: A report prepared for Fox-Wolf Basin 2000. Retrieved May 7, 2004 from http://www.rs-inc.com/FWB2K_Final_Report.pdf
Wisconsin Department of Natural Resources (WDNR) (2002). Fourth progress report on the trading of water pollution credits. Retrieved January 30, 2004 from http://www.dnr.state.wi.us/org/water/wm/nps/pt/PT2002.htm
------(2000). Third progress report on the trading of water pollution credits. Retrieved May 4, 2004 from http://www.dnr.state.wi.us/org/water/wm/nps/pt/ptreport2000.pdf
------(1999). Second progress report on the trading of water pollution credits. Retrieved May 4, 2004 from http://www.dnr.state.wi.us/org/water/wm/nps/pt/Pollutanttrade.pdf
------(1998). First progress report on the trading of water pollution credits. Retrieved May 4, 2004 from http://www.dnr.state.wi.us/org/water/wm/nps/pt/Govrept98.pdf
Reviewed by Linda Stoll, Fox-Wolf Watershed Alliance.
274
Red Cedar River Nutrient Trading Pilot Program (WI) A. Program Background
1. Program description The Red Cedar River was chosen in 1997/1998 as one of three water quality trading pilots for the State of Wisconsin. A local group called the Red Cedar Steering Committee, which later incorporated as the non-profit Red Cedar River Basin, Inc., had been exploring watershed-based water quality management options for the basin since 1994. Funded by a USEPA grant and coordinated by a University of Wisconsin Extension basin educator, the Steering Committee coordinated water quality monitoring at several lakes and developed the Simulator for Water Resources in Rural Basins (SWRRB) model to determine the phosphorus loading rates of different land uses. By 1999, there were only two municipalities actively considering water quality trading: the City of Cumberland and the Village of Colfax. Cumberland wanted to postpone expensive upgrades for its publicly owned treatment work (POTW) by purchasing 4400 lbs. of annual phosphorus offsets. The City agreed to obtain trading commitments by October 1, 2000 and implement the trades by October 1, 2001. The Barron County Land Conservation Department (LCD) served as a liaison with farmers, signing farmers up for trading and verifying best management practices (BMPs). By July, 2001, Cumberland had contracted with 22 farmers and obtained 5000 lbs. of phosphorus credits (WDNR 2002). Cumberland contracted with a similar number of farmers in 2002 and 2003 and intends to continue the trading program until it is too difficult to identify enough eligible farmers (Peter Prusak, personal communication, June 1, 2004). Colfax eventually determined that water quality trading was not economically feasible. They would have needed 1750 lbs. of phosphorus offsets within a budget of $23,500. However, without the same participation from Dunn County LCD, the administrative costs of identifying and verifying trades were too high (WDNR 2002).
2. Program motivation Watershed-wide, water quality management activities were started in 1994 by the Red Cedar Steering Committee, prompted by algal blooms and eutrophication in Tainter Lake. The City of Cumberland, faced with a 1 mg/L phosphorus discharge limit for their publicly owned treatment work (POTW), looked to water quality trading as a means of reducing compliance costs (Environomics 1999). The City strongly believed that a non-point phosphorus reduction effort would be more beneficial for protecting water quality than chemical phosphorus removal at
275
the POTW. Non-point trades will reduce both phosphorus and sediment (Peter Prusak, personal communication, June 2, 2004). The Village of Colfax applied for an alternative POTW effluent limit on the basis of economic hardship. Since Colfax is within the trading area, it was obligated to evaluate the economic feasibility of water quality trading as a requirement of this application (WDNR 2002).
3. Pollutant being traded
Phosphorus
4. Size of program The Red Cedar Watershed drains 1,800 square miles in west central Wisconsin. Nonpoint sources deliver an estimated 93% of the phosphorus loading to the watershed. The basin includes 18 municipalities: Menomonie, Glenwood City, Downing, Boyceville, Wheeler, Colfax, Prairie Farm, Ridgeland, Dallas, Chetek, Turtle Lake, Almeana, Barron, Cameron, Rice Lake, Cumberland, Haugen, and Birchwood (WDNR 2002). For the City of Cumberland's trade, all land must have been in the Hay River watershed above the Prairie Farm impoundment, and the majority of treated fields must lie within 400 feet of channelized flow (WDNR 2002). Thirty farmers originally signed up for trading through the LCD, and 22 met the final criteria. Potential trading parties: municipal wastewater treatment plants, farmers
5. Stakeholders/participants
• Wisconsin Department of Natural Resource (WDNR): • Red Cedar River Steering Committee (incorporated in 1996 as Red Cedar
River Basin, Inc.) • Municipal POTWs. • City of Cumberland • Village of Colfax • Barron County Land Conservation Department: coordinated with farmers
for the City of Cumberland’s trades. • Dunn County Land Conservation Department
6. Regulatory drivers Tainter Lake, a downstream impoundment on the Red Cedar River, and a small section of the Red Cedar River in Barron County are listed as impaired waters (Peter Prusak, personal communication, June 2, 2004). These sections of the River were listed as a Wisconsin Impaired River with the EPA in 1998 and was on a TMDL Development Two Year Schedule, but no specific plan
276
for a TMDL has been developed for the Basin (James Baumann, personal communication, May 31, 2002). The primary regulatory driver for point sources is Chapter NR 217 of the Wisconsin Administrative Code. Ch. NR 217 mandated 1 mg/L phosphorus discharge limits for municipal treatment plants with a monthly discharge exceeding 150 lb. of phosphorus and industrial sources with a monthly discharge exceeding 60 lb. of phosphorus. This was expected to affect 35-40% of all POTWs in the state. Exemptions from this effluent limit are only granted in four conditions, including proven economic hardship
B. Trade Structure 7. Determination of credit
Farmers can only receive payment for a BMP for three years. The phosphorus reduction credits associated with a BMP were estimated using phosphorus loading models that have been developed for and used by many Priority Watershed projects (Peter Prusak, personal communication, June 1, 2004). All of the trades have involved nutrient management planning or no-tillage, which are well established and understood practices.
8. Trading ratios and other mechanisms to deal with uncertainty Trades are subject to a 2:1 trading ratio (Environomics 1999).
9. Liability/penalties for noncompliance Liability is not handled within the permitting framework, since the trading program is authorized by a letter from the DNR to Cumberland (Peter Prusak, personal communication, June 1, 2004). The City of Cumberland and the DNR agreed that Cumberland could discontinue the trading agreement at any time providing that Cumberland installs phosphorus removal at its POTW within one year to meet the 1 mg/L phosphorus effluent limit (Environomics 1999). Farmers’ noncompliance is not a significant risk because payment is only given for a BMP after the DNR has verified that it is has been properly implemented (Peter Prusak, personal communication, June 1, 2004).
10. Approval process The Barron County LCD and the City of Cumberland evaluated landowners according to the trading area criteria. Soil testing of each field was done to calculate the phosphorus delivery to the stream from the field where the BMP was used. (WDNR 2002).
11. Ex post verification/auditing.
277

The Barron County LCD verified all BMPs implemented for trading with Cumberland (WDNR 2002).
12. Mechanisms for trade identification and communication (education and
outreach, third party facilitation, embedded ties) Embedded ties – City of Cumberland. The City of Cumberland partnered with the Barron County LCD to identify and negotiate with landowners. Cumberland matched its incentive payments to the LCD’s soil and water conservation payments, and the LCD advertised both programs to farmers at the same time. The farmers could choose whether to enroll in the trading program or the traditional cost-share program (WDNR 2002). Third Party Facilitation - Village of Colfax. Since the Dunn County LCD was not interested in taking on the cost of identifying and administering trades, the Village of Colfax would likely hire a crop consultant to contact farmers. After estimating that these administrative costs were prohibitive, the Village of Colfax did not pursue trading (WDNR 2002).
13. Market structure (bilateral, clearinghouse, third party brokers)
Bilateral. The discharger is responsible for contracting directly with the removing sources.
14. Types of trades allowed Point/nonpoint. Dischargers may only trade to meet phosphorus requirements.
C. Outcomes
15. Types and volume of trades that have occurred In 2001 the City of Cumberland paid 22 landowners a total of $14,526, primarily for reduced tillage on lands with excessive phosphorus soil tests. These trades resulted in 5000 lbs. of phosphorus credits (WDNR 2002). Approximately the same number of farmers participated in 2002 and 2003 as well, and it is anticipated that the City will continue trading until it becomes impossible to secure enough nonpoint source credits (Peter Prusak, personal communication, June 1, 2004).
16. Administrative costs The City of Cumberland benefited from the fact that the Barron County LCD took on many of the administrative costs of trading, but the Village of Colfax determined that, without similar cooperation from the Dunn County LCD, the administrative costs would be almost as expensive as the costs of implementing BMPs.
278
17. Transaction costs
Not available.
18. Cost savings The WWTP would have spent approximately $35,000 to control phosphorus at the plant, and nonpoint source phosphorus reductions were achieved for about $20,000. The trading program saved Cumberland approximately $15,000 in 1998, and savings were probably similar in subsequent years (Peter Prusak, personal communication, June 1, 2004).
19. Program goals achieved The City of Cumberland, which was the only municipality completing a trade on the Red Cedar River, was successful in meeting its trading goals. They were required to purchase 4400 lbs. of phosphorus credits annually, and the BMPs resulted in 5000 lbs. of phosphorus reductions (WDNR 2002). It is too soon to determine if this trade has measurably improved water quality (Peter Prusak, personal communication, June 1, 2004). The Village of Colfax would have needed 1570 lbs. of phosphorus credits, but the administrative costs were too high to pursue trading (WDNR 2002).
20. Program obstacles
Many farmers in Wisconsin have been wary of entering into long-term agreements for water quality trading (USEPA). Introducing farmers to trading through the LCD, which has strong working relationships with the agricultural community, was a successful approach to recruit agricultural trading partners. Determining a precise phosphorus credit for BMPs posed a challenge for implementing point-nonpoint source trading. Across the three Wisconsin pilots, differing information came out of the City of Cumberland’s monitoring, the Rock River project’s monitoring, and the Conservation Reserve Enhancement Program (CREP) model (WDNR 2000). The Village of Colfax concluded that the administrative costs of identifying trades were too high without the full partnership of the LCD. The Dunn County LCD, however, was not interested in assuming the administrative costs for the project.
21. NPS involvement and incentives to engage in trading. The City of Cumberland compensated landowners at the same rate as other county or federal cost-share programs: reduced tillage at $15/acre, no till at $18.50/acre, contour farming at $3/acre, contour strip cropping at $6/acre,
279
buffer strips at $35/acre, and a nutrient management plan at $3/acre. These BMPs are expected to have ancillary benefits for the farmers, and it is hoped that farmers will continue to practice them after the three years of trading payments (WDNR 2002). Trading payments were modeled on the cost-share payments, but trading was more attractive to farmers because the cost-share agreements took longer to implement (Peter Prusak, personal communication, June 1, 2004).
22. Other Program information/References
Websites: Wisconsin Department of Natural Resources: Watershed-based pollutant
trading. http://www.dnr.state.wi.us/org/water/wm/nps/pt/ Contacts: Peter Prusak, Basin Engineer, Wisconsin Department of Natural Resources. (715) 822-5421 James Baumann, Wisconsin Department of Natural Resources, (608) 266-9277. Written Program Information: Environomics (1999). A summary of U.S. effluent trading and offset projects.
A report prepared for Dr. Mahesh Podar, U.S. Environmental Protection Agency, Office of Water. Retrieved May 7, 2004 from http://www.epa.gov/owow/watershed/trading/traenvrn.pdf
Griesser, J. Elliot (2004). Offset projects: success and suitability in addressing water quality impairment. Unpublished master’s thesis, Bard College, Annandale on Hudson, NY.
Kramer, J. M. (2003). Lessons from the trading pilots: applications for Wisconsin water quality trading policy. Retrieved January 28, 2003 from http://www.fwwa.org/pdf/WisconsinTradingFinal.pdf
Wisconsin Department of Natural Resources (WDNR) (2002). Fourth progress report on the trading of water pollution credits. Retrieved January 30, 2004 from http://www.dnr.state.wi.us/org/water/wm/nps/pt/PT2002.htm
------(2000). Third progress report on the trading of water pollution credits. Retrieved May 4, 2004 from http://www.dnr.state.wi.us/org/water/wm/nps/pt/ptreport2000.pdf
------(1999). Second progress report on the trading of water pollution credits. Retrieved May 4, 2004 from http://www.dnr.state.wi.us/org/water/wm/nps/pt/Pollutanttrade.pdf
------(1998). First progress report on the trading of water pollution credits. Retrieved May 4, 2004 from http://www.dnr.state.wi.us/org/water/wm/nps/pt/Govrept98.pdf
280
Beginning in 2005, Cumberland will submit annual reports to the DNR on the status of the water quality trading program.
Reviewed by Peter Prusak, Wisconsin Department of Natural Resources
281
Rock River Nutrient Trading Pilot Program (WI) A. Program Background
1. Program description In 1997/1998, the Rock River was chosen as one of three pilot trading programs for the State of Wisconsin. The idea of water quality trading in the basin was originally proposed in 1996, as part of the Rock River Watershed Partnership’s (RRWP) exploration of a more holistic watershed-wide approach to water quality. Since the RRWP is a local stakeholder group without budgetary authority, a group of POTWs formed the offshoot Rock River POTW Watershed Group and raised over $300,000 to conduct watershed modeling, coordinate water quality monitoring, draft a trading framework, complete a literature review of agricultural best management practices (BMPs), and analyze instream results of phosphorus controls. In 1997, the POTW group had signed a three-year Memorandum of Understanding (MOU) with the Wisconsin Department of Natural Resources (WDNR) that stated among other things that point sources would not be mandated to implement phosphorus controls if the nutrient reductions could be achieved more cost-effectively through nonpoint source offsets. The Trading Structure Workgroup (TSW) of the RRWP formulated trading rules with the WDNR. Trades were to be approved in five-year increments, tied to Wisconsin Pollutant Discharge Elimination System (WPDES) permits. Out of over sixty point sources that initially expressed interest in trading, ten conducted feasibility analyses in 2000. All point sources ultimately decided to implement phosphorus controls at their treatment plants rather than purchase nonpoint source offsets, largely because water quality trading in the basin did not prove to be as cost-effective as anticipated. For more details on the economic feasibility studies of point sources, see WDNR (2002).
2. Program motivation The primary environmental problem that prompted state and local interest in water quality trading was poor water quality – eutrophication, excessive nutrients, and high sediment content - in the Rock River Basin. Many point sources were motivated to explore trading as a result of Chapter NR 217, Wisconsin Administrative Code. Ch. NR 217 mandates a 1 mg/L phosphorus discharge limit for publicly owned treatment works (POTWs) and industrial facilities of a certain size, respectively 150 lbs. and 60 lbs. of annual phosphorus discharge. Over sixty participants expressed interest in trading, many as a means of complying with Ch. NR 217 without expensive phosphorus control upgrades.
3. Pollutant being traded
282
Trading program development initially focused on phosphorus but did not rule out trading of other pollutants in the future.
4. Size of program The Rock River watershed encompasses 3,000 square miles in south central Wisconsin (WDNR 2000). Soil and Water Assessment Tool (SWAT) modeling estimated that nonpoint sources contribute 59% of the annual phosphorus load to the basin (RRPWG 2000). As of late 1999, over sixty participants had committed to trading, including 24 publicly owned treatment works (POTWs) (Environomics 1999). By 2000 only ten dischargers continued to show an interest, and only seven completed feasibility analyses of trading by the end of the year. By 2002 only one discharger remained interested in trading, in this case a point-point trade (WDNR 2002). Potential trading parties: wastewater treatment plants, dairy processing plant, farmers
5. Stakeholders/participants • Wisconsin Department of Natural Resource (WDNR): collaborated on
water quality monitoring • Rock River Watershed Partnership (RRWP): stakeholder group
coordinating the pilot program • Rock River POTW Watershed Group (RRPWG): group of POTWs that
conducted economic feasibility studies • U.S. Geologic Service (USGS): collaborated on water quality monitoring • University of Wisconsin: collaborated on instream monitoring of nonpoint
source phosphorus load reductions
6. Regulatory drivers The Upper Rock River was listed as a Wisconsin Impaired River with the EPA in 1998, but a TMDL has not yet been developed for the basin (James Baumann, personal communication, May 31, 2002). The primary regulatory driver for point sources was expected to be Chapter NR 217 of the Wisconsin Administrative Code. Ch. NR 217 mandated 1 mg/L phosphorus discharge limits for municipal treatment plants with a monthly discharge exceeding 150 lb. of phosphorus and industrial sources with a monthly discharge exceeding 60 lb. of phosphorus. This was expected to affect 35-40% of all POTWs in the state, and it did encourage many dischargers to consider trading. However, the DNR concluded that this effluent limit was not an adequate driver for trading and that a TMDL will be necessary to make trading more financially attractive (WDNR 2002).
283
B. Trade Structure
7. Determination of credit The Trading Structure Workgroup (TSW) of RRWP agreed that any BMP or nonpoint source project that is not a “minimal standard practice” for all for farmers in the county will be considered eligible. A BMP could be considered for trading in more than one five-year permit increment providing that it has not yet been adopted as a standard practice or been found to be less effective at phosphorus control (RRWP 1999).
8. Trading ratios and other mechanisms to deal with uncertainty The Trade Ratio Workgroup (TRW) of RRWP defined trade ratios ranging from 1:1 to 1.5:1 for point-point trades and from 1.75:1 to 3.6:1 for point-nonpoint trades. The formula for calculating trade ratios is as follows: A) Base Trade Ratio: 1.0 for point-point and 1.75 for point-nonpoint trading. B) Add 0.125 if trade is not in target area. (Target areas are those “sub-basins with the highest loading rates” and those “contributing runoff to identified significant water resources.”) C) Add 0.125 if trade is not in same WDNR “Watershed.” D) Add 0.125 if trade is not “nearby” (within 20 miles). E) Add 0.125 if “credits” are obtained downstream of trader’s location. Trade Ratio = A + B + C + D + E (RRPWG 2000)
9. Liability/penalties for noncompliance
The point sources are ultimately responsible for obtaining the required nonpoint source credits and will be liable if repairs are needed to maintain BMP effectiveness, the BMP is determined to be less effective than predicted, or the nonpoint source fails to install or maintain BMPs. Deed restrictions can be placed on a property to maintain BMPs if a landowner goes bankrupt (RRPWG 2000).
10. Approval process Not available.
11. Ex post verification/auditing. The point source is responsible for enforcing contracts with nonpoint source trading partners, but the TSW notes that, from a practical standpoint, a county Land Conservation District (LCD) might assume the responsibility of verifying BMPs and monitoring compliance with trading contracts. Although the WDNR may conduct follow up monitoring in targeted areas, it would not require that water quality improvements from individual trades be
284
demonstrated by water chemistry monitoring; a trade will be assumed to have achieved the nutrient reduction goals if all trading contracts and point source discharge limits are met (RRPWG 2000).
12. Mechanisms for trade identification and communication (education and outreach, third party facilitation, embedded ties) All three mechanisms would be permitted, but third party facilitation or embedded ties appears to be the most likely. The WDNR had hoped that County LCDs, who have a strong working relationship with the agricultural community, would function as third party brokers. The LCDs in Dane and Fond du Lac Counties did work with POTWs to identify trades, but budget and staff time constraints made most LCDs reluctant to assume this responsibility (WDNR 2000).
13. Market structure (bilateral, clearinghouse, third party brokers)
Bilateral or Third Party Brokers. The TSW agreed to allow two different trade scenarios: 1. Trade initiator deals directly with trade recipient; 2. Trade initiator deals directly through a third party. State or local government agencies could act as brokers (RRPWG 2000).
14. Types of trades allowed Both point/point and point/nonpoint trades have been investigated (Environomics 1999). Trades will be approved in five-year increments, tied to the Wisconsin Pollutant Discharge Elimination System (WPDES) permit. The TSW had not yet determined if this would occur through a permit modification or a side letter to the existing permit (RRPWG 2000).
C. Outcomes
15. Types and volume of trades that have occurred No trades have occurred. Based primarily on cost and trading requirements, many communities decided to implement phosphorus removal at their POTWs. The Village of Fall River was still considering a point-point trade as late as 2002, but by 2003 it had received loans for a $3.6 million upgrade for their POTW.
16. Administrative costs Not available. The TSW did agree that administrative costs exceeding the normal cost of business may be charged to the trade initiator (RRPWG 2000).
17. Transaction costs
285
Overall transaction costs not available but were likely substantial. Certainly the information costs associated with monitoring and feasibility studies were considerable. For example, the City of Waumpun spent $20,000 on consulting services before deciding that trading was not economically feasible (WDNR 2002).
18. Cost savings Initial cost estimates indicated that water quality trading could be a cost-effective strategy for meeting state phosphorus limits, but later studies revealed that trades were difficult to justify on cost savings. Actual phosphorus control costs at 20 POTWs ranged from $0.40-$20/lb, with most between $2 and $10. Nonpoint source phosphorus control costs were estimated at $0.50-$4.50/lb for converting to conservation tillage, $0.40-$2.50 for converting to no-till, and $1-$100 for 50 ft. wide buffer strips (WDNR 2000). At least two of the final seven point sources determined that they would need a 1.1:1 trading ratio to make trades economically viable (WDNR 2002). The Rock River Watershed Group of POTWs also suggested that trade periods of greater than 5 years could spread the capital costs over more time (RRPWG 2000).
19. Program goals achieved No trades have been completed, although the pilot was valuable as a learning tool for Wisconsin (WDNR 2002). The TSW asserted that the DNR would consider the pilot successful if a straightforward mathematical calculation showed the desired net phosphorus reduction in the basin (RRPWG 2000), which presumably has been achieved by POTW upgrades.
20. Program obstacles
Most point sources decided that trades were not economically feasible. Establishing the trade ratio was a difficult process (Environomics 1999), and the POTW group reported that the high trade ratio might have jeopardized the effectiveness of the pilot project. The five-year trade limit may have further reduced the cost-effectiveness of nonpoint source controls (RRPWG 2000). Reaching farmers was also an inherently difficult task (Suzanne Wade, personal communication, June 4, 2002). Several point sources were unable to identify a sufficiently large pool of nonpoint source trading partners (WDNR 2002). The WDNR had hoped that the LCDs would assist in identifying farmers, but few LCDs were eager to devote their resources to facilitate trading.
21. NPS involvement and incentives to engage in trading.
286
The primary incentive offered to landowners was economic compensation for implementing BMPs. The TSW and the WDNR agreed that farmers who already received federal cost-share funds could also receive trading dollars for the same BMPs, with credit likely awarded according to the proportion of trading dollars. Many of the BMPs could be economically beneficial to farmers on their own merit, such as composting manure to produce a commercially viable product (RRPWG 2000). The Jefferson County LCD conducted a survey of farmers. They found that farmers in their county would consider converting 5,408 acres from conventional to conservation tillage at an average of $31/acre, 6,213 acres from conventional tillage to no-till at an average of $30/acre, 3,678 acres from conventional tillage to no-till at an average of $41/acre, 1,302 acres of tilled land to wetlands for $651/acre, and 71,600 feet tilled lands to buffers at $53/foot (WDNR 2000).
22. Other
Program information/References
Websites: Rock River Watershed Partnership. http://clean-water.uwex.edu/rrp/ Wisconsin Department of Natural Resources: Watershed-based pollutant
trading. http://www.dnr.state.wi.us/org/water/wm/nps/pt/ Contacts: Suzanne Wade, Rock River Watershed Partnership. (920) 674-8972 James Baumann, Wisconsin Department of Natural Resources. (608) 266-9277. Written Program Information: Environomics (1999). A summary of U.S. effluent trading and offset projects.
A report prepared for Dr. Mahesh Podar, U.S. Environmental Protection Agency, Office of Water. Retrieved May 7, 2004 from http://www.epa.gov/owow/watershed/trading/traenvrn.pdf
Kramer, J. M. (2003). Lessons from the trading pilots: applications for Wisconsin water quality trading policy. Retrieved January 28, 2003 from http://www.fwwa.org/pdf/WisconsinTradingFinal.pdf
Rock River POTW Watershed Group (RRPWG) (2000). Summary of Watershed Studies. Retrieved on March 25, 2004 from http://clean-water.uwex.edu/rockriver/Watershed%20Study%20Summary.htm
Rock River Watershed Partnership (RRWP) (1999). Trading Structure Workgroup: Draft Issue List. Retrieved on May 1, 2002 from http://clean-water.uwex.edu/rrp/ISSList.htm
Wisconsin Department of Natural Resources (WDNR) (2002). Fourth progress report on the trading of water pollution credits. Retrieved
287
January 30, 2004 from http://www.dnr.state.wi.us/org/water/wm/nps/pt/PT2002.htm
------(2000). Third progress report on the trading of water pollution credits. Retrieved May 4, 2004 from http://www.dnr.state.wi.us/org/water/wm/nps/pt/ptreport2000.pdf
------(1999). Second progress report on the trading of water pollution credits. Retrieved May 4, 2004 from http://www.dnr.state.wi.us/org/water/wm/nps/pt/Pollutanttrade.pdf
------(1998). First progress report on the trading of water pollution credits. Retrieved May 4, 2004 from http://www.dnr.state.wi.us/org/water/wm/nps/pt/Govrept98.pdf
Reviewed by Suzanne Wade, Rock River Watershed Partnership.
288
Chesapeake Bay Nutrient Trading Program (VA, MD, PA, and Washington, D.C.) A. Program Background
1. Program description The Chesapeake Bay Program has developed voluntary nutrient trading guidelines for its member jurisdictions (Pennsylvania, Maryland, Virginia, and the District of Columbia). Trading will be one option for achieving existing nutrient reduction goals and tributary strategies. Cooperative action to address nutrient loading in the Bay dates to 1983, when the Chesapeake Bay Program was initiated by the states of Virginia, Pennsylvania, and Maryland, the District of Columbia, the U.S. Environmental Protection Agency, and the tri-state Chesapeake Bay Commission. The 1987 Chesapeake Bay Agreement established a 40% reduction goal for nutrients from controllable sources by 2000, with the baseline set by 1985 levels. In 1992, individual reduction goals were set for each major tributary, and the states committed to achieving these goals through Tributary Strategies. Under the Chesapeake Bay 2000 agreement, all of the states agreed to a collective cap on nitrogen and phosphorus. Formal allocations for each state and basin were finally established in April 2003. TMDLs will be imposed if the nutrient reduction goals set by these policies are not achieved by 2010. Nutrient trading surfaced during this policy-making process as one potential mechanism for meeting nutrient reduction goals. By early 1998, both Virginia and Maryland were exploring the idea, and the Chesapeake Bay Program found broad stakeholder interest in developing a coordinated nutrient trading plan for the entire Bay. A Nutrient Trading Negotiation Team was convened in 1999 and produced draft nutrient trading guidelines by September, 2000. After extensive public review, the nutrient trading guidelines were approved in March 2001. The guidelines specifically address nitrogen and phosphorus trading in pre-TMDL waters with nutrient baselines and caps established by Tributary Strategies. At the core of the guidelines are eight fundamental trading principles, summarized as: 1. Trades must not negatively affect local water quality; 2. Trades are allowed only within each major Bay tributary; 3. Trading programs must comply with all federal, state, and local regulations and be flexible enough to adapt to regulatory changes; 4. Trading programs must be consistent with Tributary Strategies and nutrient reduction goals; 5. Each trade must reduce net nutrient loading; 6. Trading should only be pursued after all sources have achieved a 40% reduction in nutrient loading; 7. Trading participants must be good actors in substantial compliance with all laws and regulations; 8. Trading programs must seek the guidance of a diverse
289
set of stakeholders (for exact wording, see Chesapeake Bay Program Nutrient Trading Negotiation Team 2001). The trading plan also offers guidance on six elements of trading programs: 1. nutrient reduction goals; 2. eligibility; 3. trade administration; 4. accountability; 5. assessment/indicators; 6. stakeholder involvement. The guidelines are voluntary, and each jurisdiction will be responsible for determining an individual trading policy, establishing mechanisms for certifying and registering credits, creating a central coordinating office for tracking trades, and developing a system of monitoring and evaluating performance (Chesapeake Bay Program Nutrient Trading Negotiation Team 2001). Interstate trading within a single watershed may become a possibility in the future, but trading will likely proceed within each state first.
2. Program motivation
Chesapeake Bay has long suffered from excess nutrient loading, which results in algae blooms and low dissolved oxygen levels. Rapid population growth, agricultural runoff, and industrial development have all contributed to continued pressure on the ecosystem, despite significant attempts to reduce both point and nonpoint source nutrient pollution. Maryland, Pennsylvania, Virginia, and the District of Columbia have been collaborating on efforts to address this pollution since the Chesapeake Bay Agreement was signed in 1983.
With the threat of TMDLs if nutrient reduction goals are not met by 2010, there is an increased interest in innovative mechanisms for addressing nutrient loading in the Bay. Trading is seen as an attractive strategy because it offers rapid nutrient reductions at low cost, engages nonpoint sources, provides a mechanism to offset population growth, and encourages technological innovation (Chesapeake Bay Program 2002).
3. Pollutant being traded
Nitrogen and Phosphorus
4. Size of program The Chesapeake Bay is the largest estuary in the U.S., covering approximately 64,000 square miles in Virginia, West Virginia, Maryland, Pennsylvania, Delaware, New York, and the District of Columbia. The major Bay tributaries include Susquehanna, Potomac, Rappahannock, York, James, Patuxent, Maryland Western Shore, Virginia Western Shore, Maryland Eastern Shore. Eligibility for trading will be defined in separate state rules, so it is not possible to conclusively state the number of potential trading parties.
290
Potential trading parties: POTWs, industrial point source, urban runoff, agricultural sources, oyster farms
5. Stakeholders/participants
• States/Jurisdictions (PA, MD, VA, and Washington D.C): States will be
responsible for developing their own trading programs based on the Bay-wide Nutrient Trading recommendations.
• Chesapeake Bay Program: convened the Nutrient Trading Negotiation Team to explore the feasibility of nutrient and develop voluntary nutrient trading guidelines
• Trading Negotiation Team, with representatives from EPA-CB, EPA-Region III, State of Maryland, State of Pennsylvania, District of Columbia, Commonwealth of Virginia, local governments, public interest, environmental groups, stormwater interests, point source interests, nonpoint source interests, Chesapeake Bay Commission.
6. Regulatory drivers
The Chesapeake Bay Program set Bay-wide nutrient caps in 2000 and state and basin allocations in 2003, and each state agreed to establish Tributary Strategies to meet their goals. Maryland, Pennsylvania, Virginia, and the District of Columbia have substantial incentives for achieving nutrient reduction goals under the threat of TMDLs. Trading is seen as one promising strategy for meeting the reductions specified by the Tributary Strategies. The regulatory drivers for developing trading programs vary in each state. Maryland, Virginia, Delaware and D.C. are on schedules to complete water quality standards that will be one step further towards having a regulatory driver for trading. All four jurisdictions are working to produce similar standards to increase uniformity across the watershed (Robert Rose, personal communication, May 26, 2004). For more details on the development of trading programs in particular for the states under the Chesapeake Bay Agreement, see individual entries under “State Rules” for Pennsylvania, Maryland, and Virginia.
B. Trade Structure 7. Determination of credit
The nutrient trading guidelines specify that nonpoint sources must have a mechanism in place for calculating credits, but each state must individually determine how to calculate credits (Nutrient Trading for the Chesapeake Bay 2002).
8. Trading ratios and other mechanisms to deal with uncertainty
291
Trading ratios are recommended in consideration of delivery, retirement, uncertainty, and special needs (Chesapeake Bay Program 2002)
9. Liability/penalties for noncompliance The Nutrient Trading guidelines state that the buyer should be ultimately responsible for complying with its own permit and ensuring that adequate credits are delivered. Buyers should be given time to correct for noncompliance when a seller defaults and should be able to seek legal recourse against the seller. Depending on the contract, a seller may be required to pay penalties, return the trading dollars, or lose state certification for trades (Chesapeake Bay Program Nutrient Trading Negotiation Team 2001).
10. Approval process The Nutrient Trading guidelines strongly recommend that trades be governed by state policy rather than individual approval of contracts. States will be responsible for certifying and registering credits, although the approval process will vary by state. (Chesapeake Bay Program Nutrient Trading Negotiation Team 2001).
11. Ex post verification/auditing. The Nutrient Trading guidelines outline that point sources will be responsible for self-monitoring and reporting on a monthly basis, while nonpoint sources must monitor on a seasonal basis. Nonpoint source monitoring should include an annual on-site inspections to ensure that BMPs are functioning properly. Credits will be calculated annually (Chesapeake Bay Program 2002). States will be responsible for monitoring ambient water quality and other data (e.g. weather, slope, soil types) necessary for overall program assessment. (Chesapeake Bay Program Nutrient Trading Negotiation Team 2001).
12. Mechanisms for trade identification and communication (education and outreach, third party facilitation, embedded ties) NutrientNet, an online trading registry developed by the World Resources Institute, is being explored as one mechanism for identifying trading partners. (Allison Wiedeman, personal communication, May 15, 2003)
13. Market structure (bilateral, clearinghouse, third party brokers)
It is still too early to tell whether nutrient markets in each state will be structured as bilateral agreements or clearinghouses. Many farmers do not
292
want to be written into a point source permit, but point sources need to have a link to the trades in their permits. The preferable outcome might be a clearinghouse, possibly a quasi-state company, that obtains a large enough pool of credits to assume liability (Allison Wiedeman, personal communication, May 15, 2003).
14. Types of trades allowed
Potentially both point/point and point/nonpoint. The nutrient trading guidelines recommended that point/nonpoint trading only be permitted after the 40% reduction goal has been met. This guarantees the greatest possible contributions from both point and nonpoint sources to the nutrient reduction goals (Chesapeake Bay Program Nutrient Trading Negotiation Team 2001).
C. Outcomes
15. Types and volume of trades that have occurred No trades have occurred in the Chesapeake Bay, and no Bay state has yet developed state-wide trading regulations. Maryland considered developing state rules, although recent legislation requiring POTWs to apply limits of technology standards may undermine the economic incentives for trading (see Maryland under “State Rules”). Pennsylvania established a pilot trading program on the Conestoga River (see “Trading Initiatives”) and is looking into state-wide rules, including multi-credit trading. Virginia decided against trading with the Blue Plains WWTP in Washington, D.C. (see “Trading Initiatives”), but is considering two new pilots and a state-wide trading scheme for Water Quality Improvement Fund grantees (see “State Rules”).
16. Administrative costs Administrative costs will depend on each state’s trading rules.
17. Transaction costs
Transaction costs will depend on each state’s trading rules.
18. Cost savings Cost savings will depend on each state’s trading rules. Estimates of point source nutrient reduction costs were collected by the Nutrient Reduction Technology Cost Task Force (2002).
19. Program goals achieved The Negotiation Team did succeed in creating nutrient trading guidelines for the entire Chesapeake Bay. Each jurisdiction may choose to design trading rules and implement workable trading programs. The final test for whether
293
trading helps each state achieve its nutrient reduction goals will come in 2010, when TMDLs will be imposed on non-achieving waters. At this time, it appears that the momentum for trading within each state may be slowing (see individual entries under “State Rules”)
20. Program obstacles
Environomics (1999) notes that balancing the interests of such a diverse set of stakeholders was a challenge for developing Bay-wide trading guidance.
21. NPS involvement and incentives to engage in trading. Nonpoint source interests have participated in the Negotiation Team. Most trading programs will establish economic incentives for farmers to install BMPs. Many farmers, however, do not want to be regulated and oppose being written into a point source permit (Allison Wiedeman, personal communication, May 15, 2003).
22. Other
Program information/References Websites: Chesapeake Bay Program: Nutrient Trading. http://www.chesapeakebay.net/trading.htm Contacts: Robert Rose, Chesapeake Bay Program, U.S. Environmental Protection Agency. 410-267-5779 Written program references: Chesapeake Bay Program, Nutrient Trading Negotiation Team (2001).
Chesapeake Bay Program Nutrient Trading Fundamental Principles and Guidelines. Retrieved May 11, 2004 from http://www.chesapeakebay.net/pubs/subcommittee/nsc/final15guidancedoc.pdf
Chesapeake Bay Program, Nutrient trading for the Chesapeake Bay [Powerpoint] (2002). Retrieved April 28, 2004 from http://www.mde.state.md.us/assets/document/Nutrient%20Trading%20for%20the%20Chesapeake%20Bay_AW.pdf
Environomics (1999). A summary of U.S. effluent trading and offset projects. A report prepared for Dr. Mahesh Podar, U.S. Environmental Protection Agency, Office of Water. Retrieved May 7, 2004 from http://www.epa.gov/owow/watershed/trading/traenvrn.pdf
Nutrient Reduction Technology Cost Task Force (2002). Nutrient reduction technology cost estimations for point sources in the Chesapeake Bay
294
Watershed. Chesapeake Bay Program. Retrieved May 24, 2004 from http://www.chesapeakebay.net/pubs/NRT_REPORT_FINAL.pdf
Reviewed by Robert Rose, Chesapeake Bay Program, U.S. EPA..
295
State-wide Policies
296

Maryland Nutrient Trading Policy A. Program Background
1. Program description
The State of Maryland began exploring water quality trading in the mid 1990s as a strategy for improving water quality and meeting the nutrient reduction goals established by the Chesapeake Bay Agreement (Environomics 1999). It was estimated that nutrient trading could save $9 million to $12 million annually in compliance costs compared to all plants meeting a 5 mg/L limit without trading (Water Environment Research Foundation 2002). The Maryland Department of the Environment (MDE) developed a draft concept paper on nutrient trading in 1997, but conclusive guidance and trading rules were never finalized. MDE also participated in an EPA Chesapeake Bay Program effort that developed regional guidance on trading. MDE brought renewed focus to nutrient trading with a March 2003 forum to gauge statewide interest and discuss possible program development. Maryland also continues to work with the World Resources Institute (WRI) in the development of a NutrientNet website for the Potomac River. Finally, two pilot programs are being in various stages of possible development. In spring 2004, state legislation (MD House Bill 555 and MD Senate Bill 320) authorized the funding of the Chesapeake Bay Watershed Restoration Fund through fees assessed on users of public sewers and septic systems. The Fund, effective as of October 1, 2004, will be used to support wastewater treatment plant upgrades and cover crop programs on agricultural fields. As a result of this state policy, the primary economic incentive to trade has been significantly reduced by providing a dedicated funding stream for wastewater treatment plant upgrades. In the future, urban stormwater systems facing high retrofit costs and load maintenance issues could potentially revive a focus on water quality trading. Based on the low load and concentration levels required of municipal point sources and the high implementation levels of agricultural best management practices associated with tributary strategies it appears that opportunities for nutrient trading in Maryland are minimal.
2. Potential trading participants
Wastewater treatment facilities; stormwater municipalities with MS-4 permits; farmers.
3. Regulatory context
In 2004, the State Legislature passed legislation to fund upgrades of major wastewater treatment facilities (defined as greater than 0.5 million gallons/day) through user fees. Total nitrogen and phosphorus discharges will be lowered to levels approaching the limit of current technology (3mg/L –
297
4mg/L TN and 0.18mg/L - 0.2mg/L TP). Additionally, the Maryland Water Quality Improvement Act requires nutrient management plans for all farms within the state. Although a non-regulatory program, Maryland is a party to the Chesapeake Bay Agreement. Based on the revised agreement signed in 2000, Maryland has recently completed Tributary Strategies that focus on reducing the load of nutrients entering into the Chesapeake Bay. Based on the Tributary Strategies, Maryland is attempting to significantly reduce its nutrient loading by undertaking efforts to reduce point source discharges through wastewater plant upgrades, and nonpoint source discharges though the installation of urban and agricultural BMPs. As a result of the high levels of implementation associated with this effort there are a limited number of potential credits available for trades based on the current theory on how to determine credits. The Chesapeake Bay is scheduled to have a TMDL developed for it if water quality does not meet standards by 2010.
B. Trade Structure
4. Specific rules governing trades
Maryland has not finalized rules governing nutrient trading. The 1997 draft concept paper on trading suggested a 2:1 trading ratio for point/nonpoint trades (Environomics 1999). A formal determination has not been made regarding the specific impacts (e.g., baseline for generation of agricultural credits) associated with the 2004 approval of the Chesapeake Bay Watershed Restoration Fund and the Maryland Tributary Strategies (Scott Macomber, personal communication, May 18, 2004).
5. Market structure (bilateral, clearinghouse, third party brokers)
Banking and clearinghouse concepts have been discussed. NutrientNet is an option for structuring trade monitoring and market pricing (Scott Macomber, personal communication, May 18, 2004).
6. Types of trades allowed
Point/point, point/nonpoint, and nonpoint/nonpoint have all been considered.
C. Outcomes 7. Trading programs operating under state rules or pilot programs informing rule
development There are two pilot programs in the funding proposal stage: • Monocacy River watershed. See “Recent Proposals” • St. Martin’s River watershed. See “Recent Proposals”
298
These pilots, if funded, will help the State of Maryland determine more specific rules for trading.
8. Program obstacles High levels of urban and agricultural BMP implementation are required to reduce nonpoint source loads necessary for improvements in Chesapeake Bay water quality. Current legislation will fund upgrades to municipal point sources >0.5mgd to levels approaching the limits of technology. As a result of these policies, the potential available credits for trading are limited, therefore reducing the economic driver for trades to occur.
9. Other Program information/References
Websites: Maryland Department of the Environment (MDE). “Maryland Nutrient Trading Program Exploration.” http://www.mde.state.md.us/Programs/WaterPrograms/TMDL/home/Nutrient%20Trading%20Exploration.asp Contact Information: Scott Macomber, Maryland Department of the Environment. (410) 537-3077 Marya Levelev, Maryland Department of the Environment. (410) 537-3720 Written information: Environomics (1999). A summary of U.S. effluent trading and offset projects.
A report prepared for Dr. Mahesh Podar, U.S. Environmental Protection Agency, Office of Water. Retrieved May 7, 2004 from http://www.epa.gov/owow/watershed/trading/traenvrn.pdf
Water Environment Research Foundation (2002). Nitrogen credit trading in Maryland: a market analysis for establishing a statewide framework.
Maryland Department of the Environment (MDE) (1997). Concept paper for a nutrient trading policy. Available from MDE on request.
Reviewed by Scott Macomber, Maryland Department of the Environment.
299
Michigan Water Quality Trading Rules A. Program Background
1. Program description The State of Michigan began exploring water quality trading in 1995 and completed a Market Based Program Feasibility Study in 1997. The Surface Water Quality Division subsequently established a Water Quality Trading Workgroup and initiated a watershed-based trading demonstration project in 1998. The workgroup completed a draft of water quality trading rules in August 1999, and formal rulemaking began in January 2000. After a series of public hearings, the rules were adopted in November 2002 (MDEQ 2002c). The primary motivation for developing state-wide trading rules was to address unregulated nonpoint source runoff that is a major source of pollution to the Great Lakes. Water quality trading promised to provide nonpoint sources with the financial incentives to implement nutrient- and sediment-reducing best management practices (BMPs), while giving point sources an additional tool for maintaining environmental compliance (Michigan Office of Regulatory Reform 2000). The rules note that the trading program is also intended to facilitate the implementation of TMDLs and encourage the development of new quantification procedures (MDEQ 1999).
2. Potential trading participants The water quality trading rules permit nutrient trading between and among point sources, stormwater sources, agricultural sources, and streambank erosion sources.
3. Regulatory context Water quality rules are promulgated under part 31 of the Natural Resources and Environmental Protection Act, 1994 PA 451, as Amended (Act 451). All trading under the state-wide rule must be consistent with the federal Clean Water Act, NPDES permit requirements, and antidegradation policy as well as state water quality standards (MDEQ 2002b). Open trading may occur in water that attains water quality standards. Closed trading may occur in impaired waters under a total maximum daily load (TMDL), lakewide management plan (LaMP), remedial action plan (RAP), or watershed management plan (WSMP) approved by the DEQ. Point sources are ineligible to trade if they do not comply with technology-based discharge limitations or established monitoring and record-keeping requirements. Nonpoint source credits cannot be generated by management practices used to abate a nuisance under the Michigan Right to Farm Act, 1981 PA 93, or funded under Section 319 of the Clean Water Act or the Clean
300
Michigan Initiative, 1998 PA 288. Nonpoint sources may, however, generate tradable credits from projects administered by the Natural Resource Conservation Service (NRCS) in proportion to the percent local match (MDEQ 1999).
B. Trade Structure 4. Specific rules governing trades
Michigan’s regulations for state-wide trading contain explicit rules for eligibility requirements, baselines, water quality contributions, credit banking, notification and registration requirements for credit generation and use, the water quality trading registry, delineation of watersheds, program evaluation, and compliance and enforcement. The Program description and reference to rules (MDEQ n.d.) provides a detailed summary for each rule. Here we include only a brief summary of the rules: General rules: Trading occurs by rule rather than by individual permit modifications. Reductions must be “real, surplus, and quantifiable.” “Real” means that an actual change must be made. “Surplus” means that reductions must be greater than those required by regulation (note that “surplus” is not the same test as “additional”). Eligibility: Trading parties must be within the same watershed. Point sources must be in compliance with monitoring and record-keeping requirements. Determination of credits: Point source baselines are established by actual loading levels (rather than discharge limits) over a 3-year period. The baseline is calculated as the product of flow, concentration, and a unit conversion constant. Nonpoint source baselines are set by the TMDL, a TMDL, remedial action plan (RAP), lakewide management plan (LaMP), or a watershed management plan (WSMP) in closed trading. In open trading, agricultural baselines are set by a certified nutrient management plan, while streambank erosion and unregulated stormwater runoff baselines are derived from pollutant-specific loading estimates for different land uses or management practices. Uncertainty: To guarantee environmental improvement, each point source must retire 10% of the credits it generates (effectively a 1.1:1 trading ratio) and each nonpoint source must retire 50% of the credits it generates (effectively a 2:1 trading ratio). Additional site-specific discount factors may be applied to provide greater equivalence where there is an impoundment between sources and greater net reduction in impaired waters pre-TMDL. Noncompliance: Nonpoint source reductions are not written into point source permits. Michigan holds both credit sellers and purchasers liable in each trade. Generators of credits must obtain three times the number of registered but insufficient credits, which are retired to promote water quality. Purchasers
301
of credits are solely responsible for complying with their permits and showing due diligence. If they provide notice of insufficient credits without having received previous notice from the DEQ, or if purchasers use credits that are later discovered to be insufficient (and the DEQ determines that they had no way of knowing), they are given a reconciliation period to true-up insufficient credits. This reconciliation period provides an incentive for internal audits. Registry for the generation and use of credits: Sources intending to sell credits must submit a notice of credit generation or use, which are reviewed for completeness and certified within 30 days. The changes specified by the notice become legally enforceable once the DEQ has certified them. For point sources, the generation or use of credits constitutes a permit modification by rule. Monitoring: Individuals farmers must submit annual reports to verify that the BMPs are successfully installed. Point sources already must submit discharge monitoring reports, which will be used to monitor compliance with trading requirements. The DEQ conducts ambient water quality monitoring and cost calculations as well as more comprehensive program evaluations every five years. The first program evaluation will be due in 2005.
5. Market structure (bilateral, clearinghouse, third party brokers) The DEQ will maintain a trading registry to record and monitor trades, but the trade structure itself appears to be bilateral. The registry could potentially be one mechanism by which purchasers of credits could identify trading opportunities. Open trading can occur where water quality standards are being met or in impaired waters with a TMDL. Closed trading may occur where a pollutant-specific cap and load allocations have been established by a TMDL, remedial action plan (RAP), lakewide management plan (LaMP), or a watershed management plan (WSMP) approved by the department for the purposes of trading (MDEQ 1999).
6. Types of trades allowed Point/point, point/nonpoint, and nonpoint/nonpoint. Banking of credits for five years is allowed to encourage early reductions, but all banking must be individually approved (MDEQ 2002a). Trading of pollutants other than nutrients, cross-pollutant trading, intra-plant trading, and trading under a LaMP or a RAP are not covered by the state-wide rules and must be individually approved.
C. Outcomes
7. Trading programs operating under state rules or pilot programs informing rule development
302
The State of Michigan conducted one pilot program on the Kalamazoo River (see “Trading Initiatives”) that informed the development of state-wide rules.
8. Program obstacles The 1999 Environomics report cites information gaps, misperceptions about trading, and federal-state disputes about legality as obstacles.
9. Other The rules establish many new responsibilities for the MDEQ, as listed in MDEQ 2002b. The administrative costs of the state-wide trading program were estimated at $208,700 for the first three years. This cost covered the salaries and benefits of three environmental quality personnel (RIS 2000).
Program information/References
Websites: Michigan Department of Environmental Quality: Water Quality Trading. http://www.michigan.gov/deq/0,1607,7-135-3313_3682_3719---,00.html Contacts: Richard Hobrla, Chief, Inland Lakes and Remedial Action Unit, Michigan Department of Environmental Quality. (517) 335-4173 Written information: Environomics (1999). A summary of U.S. effluent trading and offset projects.
A report prepared for Dr. Mahesh Podar, U.S. Environmental Protection Agency, Office of Water. Retrieved May 7, 2004 from http://www.epa.gov/owow/watershed/trading/traenvrn.pdf
Michigan Department of Environmental Quality (MDEQ) (1999). Part 30. Water Quality Trading Rules. Retrieved 4/28/04 from http://www.state.mi.us/orr/emi/arcrules.asp?type=Numeric&id=1999&subId=1999-036+EQ&subCat=Admincode
------(2002a). Executive summary. Retrieved April 28, 2004 from http://www.michigan.gov/printerFriendly/0,1687,7-135--14329--,00.html
-------(2002b). Rules development. Retrieved April 28, 2004 from http://www.michigan.gov/printerFriendly/0,1687,7-135--14293--,00.html
-------(2002c). Water quality program overview. Retrieved April 28, 2004 from http://www.michigan.gov/printerFriendly/0,1687,7-135--13825--,00.html
303
-------(n.d.). Program description and reference to rules. Retrieved April 28, 2004 from http://www.deq.state.mi.us/documents/deq-swq-trading-RulesReference.doc
Michigan Office of Regulatory Reform. 2000. Regulatory Impact Statement, Rule ORR #99-036EQ. Retrieved May 6, 2004 from http://www.state.mi.us/orr/emi/arcrules.asp?type=dept&id=EQ&subId=1999%2DO36+EQ&subCat=RIS
304
Pennsylvania Multi-Media Trading Registry A. Program Background
1. Program description The Pennsylvania Department of Environmental Protection (PA DEP) is currently working on the development of a multi-media trading registry. A Request for Information (RFI) ended in January 2004 to which the PA DEP received ten responses. The responses discussed issues that need to be considered when developing trading programs such as consistency with water quality standards (Andy Zemba, Personal Communication, May 27, 2004). However, no actual cost estimates or plans for building the registry were received (Andy Zemba, Personal Communication, May 27, 2004). To investigate likely constructs and costs of the registry, PA DEP awarded the Pennsylvania Environmental Council (PEC) a “Growing Greener” grant of $150,000 (Andy Zemba, Personal Communication, May 27, 2004). PA DEP also applied for funding through the EPA (PA DEP 2004). The registry will likely be a mixed market system, depending on the media. In relation to water quality trading, the market will most likely be closed - subject to caps through TMDLs or Chesapeake Bay tributary strategies (Andy Zemba, Personal Communication, May 27, 2004). PA DEP has also been working on the development of a statewide trading framework. While there is no official trading rule in place to date, PA DEP will be evaluating the Conestoga River Nutrient Trading pilot to guide a final trading policy. Whether the registry precedes the trading guidance will depend on the structure of the registry (Andy Zemba, Personal Communication, May 27, 2004).
2. Potential trading participants Multi-media registry - wide variety of potential participants
3. Regulatory context The multi-media trading registry and statewide watershed-based trading guidance will operate within the context of TMDLs and Chesapeake Bay tributary strategies (Andy Zemba, Personal Communication, May 27, 2004). PA DEP will be the regulatory agency responsible for enforcement (PA DEP 2004).
B. Trade Structure 4. Specific rules governing trades
The State of Pennsylvania has not adopted definitive trading rules to date.
305
5. Market structure (bilateral, clearinghouse, third party brokers)
The multi-media trading registry may act as a clearinghouse, connecting buyers and sellers (PA DEP 2003a). The registry may also have a banking capacity, depending on final design (PA DEP 2003a).
6. Types of trades allowed Point/point, point/nonpoint, and nonpoint/nonpoint could all be possible.
C. Outcomes
7. Trading programs operating under state rules or pilot programs informing rule development Pennsylvania currently has one pilot program for the Conestoga River (see “Trading Initiatives”).
8. Program obstacles The scope of the trading registry is the biggest obstacle in actual development. (Andy Zemba, Personal Communication, May 27, 2004).
9. Other
Program information/References
Websites: Pennsylvania Department of Environmental Protection, Office of Water Management http://www.dep.state.pa.us/dep/deputate/watermgt/watermgt.htm Enterprising Environmental Solutions, Inc. http://www.eesi21.org/market.htm Contacts: Andy Zemba, Office of Water Management, DEP. Telephone: (717)-772-5633; E-mail: [email protected] Written information: Argall, David G. and Raphael J. Musto. 2001. Report on Water Quality
Credits and Trading. Joint Legislative Air and Water Pollution Control and Conservation Committee. February. Retrieved on May 18, 2004, from http://jcc.legis.state.pa.us/es/reports/2001%20HR%20361%20Report.doc
306
Pennsylvania Department of Environmental Protection (PA DEP). 2003a. “DEP Seeks Information on Multi-Media Trading Registry,” News Release. Commonwealth of Pennsylvania. October. Retrieved on May 18, 2004, from http://www.dep.state.pa.us/newsreleases/default.asp?ID=2626
Pennsylvania Department of Environmental Protection (PA DEP). 2003b. Nutrient Credit Trading for Watershed Improvement PA Discussion Paper. Draft Discussion Paper. April. Retrieved on May 18, 2004, from http://www.eesi21.org/DEPTrading%20Discussion%20Paper.pdf
Pennsylvania Department of Environmental Protection (PA DEP). 2004. Citizens Advisory Council Meeting Minutes. March 16, 2004. Retrieved on May 18, 2004, from http://www.cacdep.state.pa.us/cac/archives/minutes/2004/04_03min.htm
Reviewed by Andy Zemba, Pennsylvania Department of Environmental Protection.
307
Virginia Nutrient Trading Program A. Program Background
1. Program description The State of Virginia has considered a nutrient trading program among point sources that receive Water Quality Improvement Fund (WQIF) grants. Grantees, primarily POTWs, receive cost-share funds for projects that reduce phosphorus and nitrogen discharge. Currently, each WQIF grant agreement contains a provision that allows for nutrient trading to be implemented once the Virginia Department of Environmental Quality publishes these guidelines for market-based incentives (Treacy 2001). No nutrient trading has occurred, however, since the VDEQ has not yet developed these guidelines. The guidelines were initially expected by the spring of 2000 (Environomics 1999). In March 2000, members of the VDEQ Director’s Water Quality Advisory Committee were asked to participate in a work group for this purpose, but further developments were postponed in light of the Chesapeake Bay Program’s new guidelines on nutrient trading (Treacy 2001). Virginia Senate Bill No. 639, proposed in January 2004 by Sen. Mary Whipple and written with the help of the Chesapeake Bay Foundation, would have charged the State Water Control Board with establishing point and nonpoint source nutrient load allocations for each basin and developing a point/point nutrient trading program. S.B. 639 was carried over to the 2005 session (Free Lance-Star 2004). Although State guidelines have yet to be developed, draft guidelines (based on the Chesapeake Bay Program’s trading guidelines, adopted in March 2001) suggest that the trading program would use as a baseline the nutrient reductions specified by WQIF grant agreements. A point source that discharges below annual performance requirements would earn nutrient credits that could be banked for one year or traded to other WQIF grantees or the State. A point source that fails to meet its annual performance requirements would have to secure nutrient credits or repay a portion of the cost-share funds with interest (John Kennedy, personal communication, May 28, 2004). The trading program was intended to set incentives for wastewater treatment facilities to control nutrient discharge more efficiently than required by their WQIF grant agreement (Treacy 2001). Water quality trading has also been mentioned as a means of meeting basin-wide nutrient caps in the future (Virginia Secretary of Natural Resources et al. 1996).
2. Potential trading participants
308
Initially, trading may only be an option for point sources receiving WQIF grants. As of January 2004, 25 wastewater treatment plants had signed WQIF grant agreements with the DEQ (VDEQ 2004a).
3. Regulatory context Although not enforceable regulations, the interstate Chesapeake Bay Agreement established Tributary Strategies in 1996-1998 for each tributary to the Chesapeake Bay, including the Shenandoah-Potomac basin in Virginia. The Strategies provide the impetus and implementation plans for achieving nutrient reduction goals. The Water Quality Improvement Act of 1997, which authorized creation of the Water Quality Improvement Fund, was part of the State’s effort to implement its tributary strategies. Virginia is currently drafting regulation to authorize and govern “Technology-Based Numerical Limits for Nutrient Discharges Within the Chesapeake Bay Watershed” (VDEQ 2004b). This regulation will consider the use of trading to comply with nutrient discharge caps and reduction goals for wastewater treatment facilities.
B. Trade Structure
4. Specific rules governing trades Virginia has not yet developed trading guidelines. Draft guidelines suggest that nutrient credits would be earned by controlling nutrient discharge more stringently than is required by the WQIF grant. A 1:1 trading ratio would likely be adopted for point/point trades. Point sources that fail to meet their nutrient reduction goals as called for by their WQIF grant would likely be required to repay a portion of the cost-share funds with interest or secure credits from grantees that had exceeded their performance requirements (Environomics 1999; John Kennedy, personal communication, May 28, 2004)
5. Market structure (bilateral, clearinghouse, third party brokers) Most likely bilateral. WQIF grantees could secure credits from another point source (Environomics 1999).
6. Types of trades allowed Point/point trading would be implemented in conjunction with WQIF grants, although possibly point/nonpoint trading would be explored under the Chesapeake Bay Program. Point sources could bank credits for one year for their own use (Environomics 1999).
C. Outcomes
309
7. Trading programs operating under state rules or pilot programs informing rule development No viable trading program has been administered in Virginia (John Kennedy, personal communication, April 2004). The State of Virginia considered one trade with the Blue Plains WWTP in Washington, D.C. (see “Trading Initiatives”), but a grant agreement was never reached and the trade became unnecessary under the Chesapeake 2000 Agreement’s new reduction targets. The Colonial Soil and Water Conservation District has interest in exploring trading on the Lower James River (see “Recent Proposals”).
8. Program obstacles The trading program has not appeared to garner great support from either the environmental community or the municipal and industrial dischargers. Early on, environmentalists sought more formal regulation of trading provisions rather than mere guidance (Environomics 1999). More recently, the Virginia Manufacturers Association and the Virginia Association of Municipal Wastewater Authorities fought the passage of S.B. 639. Although their principal objections focused on the nutrient caps rather than the trading, the deferment of S.B. 639 delayed the development of trading guidelines (Bay Bill Banished 2004).
9. Other
Program information/References
Websites: Virginia Department of Environmental Quality (VDEQ). “Water Quality Improvement Fund.” http://www.deq.state.va.us/bay/wqif.html Contacts: John Kennedy, Virginia Department of Environmental Quality, Chesapeake Bay Program. (804) 698-4312 Written Material: Environomics (1999). A summary of U.S. effluent trading and offset projects.
A report prepared for Dr. Mahesh Podar, U.S. Environmental Protection Agency, Office of Water. Retrieved May 7, 2004 from http://www.epa.gov/owow/watershed/trading/traenvrn.pdf
Free Lance-Star (2004). “Bay bill banished.” (2004, March 29). [Fredricksburg, VA]. Retrieved April 15, 2004 from http://www.freelancestar.com/News/FLS/2004/032004/03292004/1310552/printer_friendly
Treacy, Dennis (2001). Annual report on the Virginia Water Quality Improvement Fund cooperative point source pollution control program.
310
Virginia Department of Environmental Quality. Retrieved April 14, 2004 from http://www.deq.state.va.us/bay/wqif2001.pdf
Virginia Secretary of Natural Resources, Virginia Chesapeake Bay Local Assistance Department, Virginia Department of Conservation and Recreation, and Virginia Department of Environmental Quality (1996). Shenandoah and Potomac river basins tributary nutrient reduction strategy. Retrieved April 19, 2004 from http://www.deq.state.va.us/pdf/strategies/potomac.pdf
Virginia Department of Environmental Quality (2004a). Signed grant agreements. Retrieved April 14, 2004 from http://www.deq.state.va.us/bay/wqiflist.html#SGA
------(2004b). Technology based numerical limitations for nutrients in permits. Retrieved May 28, 2004 from http://www.deq.virginia.gov/bay/multi.html
Virginia drafted nutrient trading guidelines a preliminary form in the late 1990s, but they were never finalized or distributed (John Kennedy, personal communication, May 28, 2004).
Reviewed by John Kennedy, Virginia Department of Environmental Quality, Chesapeake Bay Program.
311
West Virginia Trading Framework A. Program Background
1. Program description The State of West Virginia convened a Water Quality Trading Stakeholders Committee (aka the Trading Team) in July, 2002 to evaluate whether a state-wide trading framework was appropriate and, if so, to develop a conceptual framework. The Trading Team included representatives from the agricultural and forestry sectors, utility industries, environmental organizations, and State government. All decisions and recommendations of the Trading Team were to be consensus-based. Ultimately, however, the Trading Team did not reach consensus on whether a state-wide trading framework was appropriate for West Virginia. The final report to the West Virginia Department of Environmental Protection (DEP), in April 2004, contains further information about specific provisions, but since the state is not pursuing a state-wide policy, these recommendations are non-binding (Water Quality Trading Team 2004).
2. Potential trading participants
The Trading Team considered both point and nonpoint source participants but did not specify potential trading participants.
3. Regulatory context
The Water Quality Trading Stakeholders Committee grew out of the State’s TMDL Implementation Committee. Trading was initially seen as a way for the State to avoid TMDL mandates, since lawsuits filed against the state for slow TMDL development could cause the EPA to step in and develop TMDLs (ETN 2004). The Trading Team agreed that water quality trading did not have to take place in the context of a TMDL; they provisionally recommended that trading could occur in all waters if the water quality benefit is demonstrated (Water Quality Trading Team 2004).
B. Trade Structure
4. Specific rules governing trades
Since the Trading Team did not reach consensus on whether a trading framework was appropriate for West Virginia, its recommendations on individual trading issues are to be considered for information only (Water Quality Trading Team 2004). The Trading Team’s provisional recommendations are summarized as follows:
312
• Trades should only proceed if nonpoint source nutrient reductions can offset point source discharge increases at critical low river flows (Issues 2 and 3)
• Trading parties must be not pose undue compliance risks (i.e. they must be considered good actors) (Issue 6).
• Trading does not have to occur under a TMDL; trading can occur in any waters where there is a demonstrated environmental benefit (Issues 7 and 37)
• Credits should be generated before or during the period in which they will be used (Issue 9)
• The DEP should provide public notice and comment periods when draft NPDES permits are developed or modified to include trading, draft program evaluations of trading are released, or draft watershed plans that included trading are released. The DEP should also provide real time public access when credits are generated for or used by trading registries or banks (Issues 11 and 19).
• Credits may be generated by wetland restoration or creation, stormwater pollution control practices, stream restoration, riparian buffers, or management practices at orphan mining or contamination sites by an actor that is not responsible for either the contamination or its clean up, (Issue 13)
• Trading arrangements in interstate waters should be developed within the context of on West Virginia’s participation in ORSANCO, IRPRB, and the Chesapeake Bay Partnership (Issue 27).
• The DEP should require appropriate monitoring of environmental effectiveness into the NPDES permits of trading parties. Point sources, at a minimum, should conduct quarterly sampling and analysis. Nonpoint source monitoring may include sampling and analysis not otherwise subject to NPDES requirements. Ambient water quality monitoring should also be included where assessment of the discharge alone is not sufficient. (Issue 28).
• Trading policies must be sufficiently flexible to address pollutant concerns, whether local or extending beyond watershed boundaries (Issues 29 and 51).
• Cross-pollutant trading must provide a net ecological benefit and will be subject to strict review by the DEP. (Issues 30 and 34).
• Public entities should be included as trading parties (Issue 57). • Trades should be allowed within a single NPDES permit, as long as it
results in a net loading reduction and individual outlets are assigned water quality-based effluent limits. (Issue 62).
• Real monitoring data and modeling should be used to develop baselines, performance standards, and loading reductions associated with nonpoint sources and agricultural BMPs. (Issues 16 and 42).
• A net environmental benefit is defined as a net increase in the overall environmental condition (measured by physical and chemical properties), consistent with pre-TMDL and TMDL standards (Issues 23 and 36).
313
• Trades is 303(d) listed waters must show significant progress towards water quality standards, as demonstrated by trading ratios. Trades in TMDL waters must lead to compliance with all water quality standards. Trades in unimpaired waters must meet all water quality standards (Issue 52).
• Trade credits must be quantifiable, in units of pollutant loads or other appropriate measures approved by the DEP. All pollutants will be tracked separately, except for cross-pollutant trading for dissolved oxygen (Issue 56).
• The DEP should approve or disapprove all trades (Issue 25)
5. Market structure—e.g., bilateral, clearinghouse, third party brokers. Not determined.
6. Types of trades allowed
Both point/point and point/nonpoint trades were considered.
C. Outcomes 7. Trading programs operating under state rules or pilot programs informing rule
development Two pilot programs have been proposed in West Virginia: • Cheat River – Acid Mine Drainage. See “Recent Proposals” • Cacapon/Lost River. See “Recent Proposals” These pilot programs, however, are not directly connected to the development of a statewide trading framework. The Trading Team itself acknowledges that the national momentum driving water quality trading will probably result in trading programs in West Virginia, regardless of the outcome of the state-level process (Water Quality Trading Team 2004)
8. Program obstacles The final report concludes with four reasons that some Trading Team members did not support a state-wide trading program. First, the fact that consensus could not be reached on several key trading issues raised doubt that water quality could be guaranteed. Second, it was not clear that the State had sufficient funds to properly carry out trading, especially since administering the trading program could draw funds away from enforcement. Third, there was doubt that the State had the will to carry out the environmental enforcement actions necessary for water quality trading. Fourth, some members believed that the State should develop a trading framework on the basis of the EPA policy rather than on the recommendations of the Trading Team (Water Quality Trading Team 2004).
314
9. Other Program information/References
Websites: West Virginia Department of Natural Resources: water quality trading stakeholder committee http://www.dep.state.wv.us/item.cfm?ssid=21&ss1id=429 Contact Information: Mark Scott, National Institute of Chemical Studies (facilitator of the Trading Team). (304) 346-6349 Written information: Environmental Trading Network (2004). Draft March 2004 Conference Call
[Minutes]. Retrieved May 4, 2004 from http://www.envtn.org/calls/CallSumMar04.PDF
Water Quality Trading Team (2004). Final report of the water quality trading team. West Virginia Department of Environmental Protection. Retrieved May 28, 2004 from http://www.dep.state.wv.us/item.cfm?ssid=21&ss1id=429
315
Wisconsin Watershed-based Pollutant Trading A. Program Background
1. Program description Several wastewater treatment plants in Wisconsin initiated discussion about water quality trading after the state established 1 mg/L phosphorus discharge limits (Mary Anne Lowndes, personal communication, May 4, 2004). The Wisconsin legislature authorized three pilots – in the Fox-Wolf Basin, Red Cedar River, and Rock River – with Act 27 in 1997. Due to budget constraints, funding for these three pilots was discontinued in 2002 (WDNR 2002). The Red Cedar River basin was the only pilot to complete trades. The final progress report on the pilots concluded that a 1 mg/L phosphorus limit was not an adequate driver for trading in most areas (WDNR 2002). Although at least one pilot cited the lack of definitive state trading guidelines as a reason that point sources were reluctant to trade (Linda Stoll, personal communication, March 21, 2003), the outcomes of the pilots created little pressure for the WDNR to follow up with state-wide trading rules. If future TMDLs and performance standards bring renewed demands for nutrient trading, then the DNR might revisit the idea of a state-wide trading policy (Mary Anne Lowndes, personal communication, May 4, 2004).
2. Potential trading participants Waste water treatment plants; agricultural producers
3. Regulatory context Act 27 authorized the Wisconsin DNR to conduct nutrient trading pilots that would be used to develop a trading framework (WDNR 2002). The trading pilots were conducted in advance of TMDLs (Environomics 1999). Wisconsin passed new agricultural pollution standards in 2002, which would set the baseline for generating agricultural credits according to the new EPA policy. However, since the State does not require compliance unless there is cost-share money available to the farmers, the availability of State cost-share funds could potentially limit farmers’ participation in trading (Kramer 2003).
B. Trade Structure
4. Specific rules governing trades The State of Wisconsin did not adopt definitive trading rules. The State discussed trading ratios ranging from 2:1 to 10:1 for point/nonpoint trades
316
(Linda Stoll, personal communication, March 21, 2003). The final progress report for the pilots noted that there needs to be an agreed-upon tool for quantifying the phosphorus reductions from nonpoint source BMPs (WDNR 2002).
5. Market structure (bilateral, clearinghouse, third party brokers) No single market structure has been defined under Wisconsin trading guidelines. The fourth progress report did conclude, however, that having a broker or facilitator to assume the administrative role is key for an effective trading program (WDNR 2002). A county land conservation district assisted the City of Cumberland in the Red Cedar River pilot.
6. Types of trades allowed Point/point, point/nonpoint, and nonpoint/nonpoint have all been considered (Environomics 1999)
C. Outcomes
7. Trading programs operating under state rules or pilot programs informing rule development Three pilot programs have been completed in Wisconsin: • Fox-Wolf Basin. See “Trading Initiatives”. • Red Cedar River. See “Trading Initiatives”. • Rock River. See “Trading Initiatives”. The Red Cedar River pilot was the only program that completed trades. These pilots demonstrated that Wisconsin’s 1 mg/L phosphorus limit was not able to drive trading in most circumstances. Most programs will need a TMDL or performance standard to drive trading and a broker to perform the administrative functions (WDNR 2002).
8. Program obstacles The relative lack of success of the pilots was a main reason that the state has not devoted the resources towards developing state-wide rules on trading (Mary Anne Lowndes, personal communication, May 4, 2004).
9. Other
Program information/References Websites: Wisconsin Department of Natural Resources. “Watershed-based pollutant
trading.” http://www.dnr.state.wi.us/org/water/wm/nps/pt/
317
Contacts: Mary Anne Lowndes, Wisconsin Department of Natural Resources. (608)
261-6420 Linda Stoll, Director, Fox-Wolf Watershed Alliance. (920) 738-7025. Written Material: Environomics, Inc. (1999). A summary of U.S. effluent trading and offset
projects. A report prepared for Dr. Mahesh Podar, U.S. Environmental Protection Agency, Office of Water. Retrieved May 7, 2004 from http://www.epa.gov/owow/watershed/trading/traenvrn.pdf
Kramer, Joseph (2003). Lessons from the trading pilots: applications for Wisconsin water quality trading policy. Resource Strategies, Inc. Prepared for Fox-Wolf Watershed Alliance. Retrieved May 4, 2004 from http://www.fwwa.org/pdf/WisconsinTradingFinal.pdf
Wisconsin Department of Natural Resources (WDNR) (2002). Fourth progress report on the trading of water pollution credits. Retrieved May 4, 2004 from http://www.dnr.state.wi.us/org/water/wm/nps/pt/PT2002.htm
------(2000). Third progress report on the trading of water pollution credits. Retrieved May 4, 2004 from http://www.dnr.state.wi.us/org/water/wm/nps/pt/ptreport2000.pdf
------(1999). Second progress report on the trading of water pollution credits. Retrieved May 4, 2004 from http://www.dnr.state.wi.us/org/water/wm/nps/pt/Pollutanttrade.pdf
------(1998). First progress report on the trading of water pollution credits. Retrieved May 4, 2004 from http://www.dnr.state.wi.us/org/water/wm/nps/pt/Govrept98.pdf
Reviewed by Mary Anne Lowndes, Wisconsin Department of Natural Resources
318

Other Projects and Recent Proposals
319
Alabama Montgomery Water Works and Sanitary Sewer Board, Coosa River The Montgomery Water Works and Sanitary Sewer Board (Board) is sponsoring a trading pilot for their service area, funded by at least $500,000 from the Board and $100,000 from the EPA. They are expecting to establish both closed and open market conditions, since not all of the segments of their watershed are 303(d) listed. Multi-credit trading has also been proposed. State or local partnerships will likely facilitate much of the development and implementation of the trading program, such as setting pollutant targets and baselines, identifying buyers and sellers, assessing cost-effectiveness, developing monitoring and verification systems, registering or certifying trades, and managing a web-based marketplace (Morgan 2002). Contact:
Thomas “Buddy” Morgan, General Manager, Montgomery Water Works and Sanitary Sewer Board. (334) 206-1600
References:
Morgan, Thomas R. (2002). Testimony before the U.S. House of Representatives Committee on Transportation and Infrastructure Subcommittee on Water Resources and Environment: a hearing on “Water quality trading – an innovative approach to achieving water quality goals on a watershed basis,” June 13, 2002. Retrieved May 20, 2004 from http://www.house.gov/transportation/water/06-13-02/morgan.html
California City of Santa Rosa The City of Santa Rosa developed a beneficial reuse program in the early 1990s for more than 50% of its tertiary treated wastewater. The City was not permitted to discharge from its regional POTW into the Russian River, due to wastewater discharge prohibitions established by the Regional Water Quality Control Board, and the solution was to irrigate approximately 6,400 acres of farmlands, vineyards, and urban landscaping with the nutrient-rich wastewater (City of Santa Rosa n.d.). The main environmental concern was that farmers could apply the wastewater too close to the river, thereby indirectly discharging to the water (Dave Smith, personal communication, May 28, 2004). As the regions population swelled, however, the City’s bigger concern was finding a place to discharge all of its wastewater, and in 1998 a plan was developed to transfer the discharge to the Geysers Recharge Project through a 41-mile pipeline. The wastewater will recharge subterranean caverns in a geothermal steam field that produces electricity. These wastewater transfer and beneficial reuse strategies are not accurately characterized as trading or offsets, but the agricultural reuse program is sometimes considered a trading program, perhaps because the farmers were initially paid (USEPA 1996). Contacts:
320
Dave Smith, U.S. Environmental Protection Agency, Region 9. (415) 972-3416 References:
City of Santa Rosa (n.d.). The Geysers Recharge Project. Retrieved May 28, 2004 from http://ci.santa-rosa.ca.us/geysers/project.asp
U.S. Environmental Protection Agency (1996). Appendix C: Examples of existing and potential future trading programs, Table 1: Existing programs. In Draft Framework for Watershed-Based Trading, EPA 800-R-96-001, May, 1996. Retrieved May 28, 2004 from http://www.epa.gov/OWOW/watershed/appc1.pdf
Lake Tahoe The California Regional Water Quality Control Board and the Nevada Division of Environmental Protection received a 2004 Targeted Watershed (formerly Watershed Initiative) grant to develop a water quality trading strategy for Lake Tahoe. Water clarity in Lake Tahoe has declined at nearly one foot per year since 1968, due to nutrient and fine sediment loading. Major source categories include urban and forest runoff, atmospheric deposition (primarily from transportation), stream channel erosion, and groundwater. Potential BMPs to address water clarity include infiltration basins, wetland controls, stream bank restoration, flow reductions, dust management, fertilizer management, building restrictions, BMP maintenance, highway management, and controls on wood burning emissions. Modeling is currently being developed to link land use, atmospheric deposition, and BMPs to lake clarity as part of the TMDL process, which is due to be completed in 2005. The Targeted Watershed funds will be used to (1.) create ground-rules for water quality trading between agencies and local jurisdictions responsible for mitigation, which includes developing a pollution control ‘currency’ and evaluating interstate trading options; (2.) evaluate new approaches and technologies for pollution control; and (3.) create a load reduction matrix or spreadsheet model to identify opportunities for mitigation projects and estimate a basin-wide load reduction potential. The proposal for the Targeted Watershed grant estimates a total budget of $1.7 million, including $737,400 to develop the trading ground rules, $475,000 to develop pollution control approaches, and $445,000 for the load reduction matrix. A final report on the monitoring program to validate load quantification methodologies will be due in March, 2006. Final reports on water quality trading feasibility, load quantification methodologies, pollutant reductions from innovative control measures, and load reduction opportunities, as well as a final manual on trading aimed at nonpoint sources and the final spreadsheet model for nutrient and sediment reductions, will be due in June, 2006. A comprehensive evaluation with stakeholder input of load reduction opportunities and a calculation of basin-wide load reduction potential will be completed in September, 2006. (all information from CRWQCB and NDEP (2004)) Contacts:
Dave Roberts, CA Regional Water Quality Board. (530) 542-5469
321
John E. Reuter, University of California at Davis; Director of the Tahoe TMDL Research Program.
References:
California Regional Water Quality Control Board and Nevada Division of Environmental Protection (2004). Market-based tools for air and water pollutant load reduction to protect Lake Tahoe clarity. Application to the U.S. Environmental Protection Agency, 2004 Watershed Initiative Funding. Retrieved July 30, 2004 from http://www.epa.gov/owow/watershed/initiative/2004/2004proposals/04laketahoe.pdf
U.S. Environmental Protection Agency (2004). 2004 Watershed project summaries: targeted watersheds under the 2004 Watershed Initiative. Retrieved July 30, 2004 from http://www.epa.gov/owow/watershed/initiative/2004/04selectsumm.html
Sacramento Regional County Sanitation District’s Mercury Offset Program Under the EPA’s Water Quality Trading Policy issued in January of 2003, the Sacramento Regional County Sanitation District is conducting a pilot project for trading in persistent bio-accumulative toxic substances (Vicki Fry, personal communication, May 25, 2004). To date, this effort is still in the feasibility study stage and is focusing on how to implement an offset program to deal with discharge from abandoned mercury and gold mines. The study is based on the premise that there are more efficient ways to reduce mercury than reducing mercury release at the Sacramento Regional Wastewater Treatment Plant. The study is still in its draft stage, but stakeholders including regulators, land managers, scientists, NPDES permitees, and other interested parties have been brought together in a series of working meetings to identify constraints and concerns (Vicki Fry, personal communication, May 25, 2004). Contacts:
Vicki Fry, Associate Engineer and Mercury Offset Program Manager of the Sacramento Regional County Sanitation District. Phone: (916) 876-6113
References:
Sacramento Regional County Sanitation (2004). Be Mercury Free offset program. Retrieved June 1, 2004 from http://www.bemercuryfree.net/offsets.html
Georgia Lake Allatoona Researchers at the University of Georgia’s River Basin Science and Policy Center are developing a framework for point/nonpoint phosphorus trading in the Lake Allatoona reservoir. The researchers will conduct stream sampling, watershed modeling, trading
322
ratio development, cost analyses, and studies of different trading frameworks. There are eight wastewater treatment plants and a variety of agricultural and forestry nonpoint sources in the watershed (RBSPC n.d.). Contact:
David E. Radcliffe, University of Georgia. (706) 542-0897 References:
River Basin Science and Policy Center (RBSPC) (n.d.). A framework for trading phosphorus credits in the Lake Allatoona Watershed. University of Georgia. Retrieved April 27, 2004 from http://www.rivercenter.uga.edu/service/agriculture/trading.htm
Idaho Bear River Basin The Bear River Commission received a 2004 Targeted Watershed (formerly Watershed Initiative) grant to develop a water quality trading program in the Bear River watershed. The Bear River watershed crosses boundaries between three states – Idaho, Utah, and Wyoming - and two EPA regions and faces water quality impairment from agriculture, urban development, logging, phosphate mining, and oil and gas exploration. The project is a collaborative effort between the Bear River Commission, which will manage the grant, the Bear River Water Quality Committee, which is composed of the water quality agency administrative heads from the three states, and the Bear River Water Quality Task Force. The Targeted Watershed grant will be used to develop: (1.) an integrated Watershed Information System (WIS), including a watershed-wide coordination webpage, a comprehensive data warehouse, a document warehouse, visualization and statistical tools, a virtual trading room, real-time water quality data, and watershed-wide education; (2.) a point-nonpoint source phosphorus trading program in the Middle and Lower Bear River, driven by TMDLs and managed by the WIS; and (3.) dynamic water quality monitoring to evaluate the site-specific phosphorus loading impacts of best management practice (BMP), evaluate the viability of individual trades, compare the outcome of different watershed-wide management options, and develop equivalence ratios. The total budget is estimated at $1.1 million, including $352,890 for the WIS, $161,246 for the water quality trading program, $256,028 for water quality modeling, $226,378 for community outreach, and $82,684 for project management. (all information from Barnett 2004). Contact:
Jack Barnett, Bear River Commission. (801) 292-4662 References:
323
Barnett, Jack (2004). Nomination of the Tri-State Bear River Basin for the U.S. EPA Watershed Initiative Program. Bear River Commission. Application to the U.S. Environmental Protection Agency, 2004 Watershed Initiative Funding. Retrieved July 30, 2004 from http://www.epa.gov/twg/2004/2004proposals/04bearriver.pdf
U.S. Environmental Protection Agency (2004). 2004 Watershed project summaries: targeted watersheds under the 2004 Watershed Initiative. Retrieved July 30, 2004 from http://www.epa.gov/owow/watershed/initiative/2004/04selectsumm.html
Indiana Lake Erie Land Company/Little Calumet River The Lake Erie Land Co. has spoken with consultants about the potential for water quality trading within the Little Calumet River watershed. The Lake Erie Land Co. is currently engaged in wetland mitigation banking for the same watershed (Don Ewoldt, personal communication, June 1, 2004). Contact:
Don Ewoldt. Project Manager, Lake Erie Land Company. (219) 395-5300 Maryland Monocacy River The Maryland Department of the Environment (MDE) has submitted a Watershed Initiative 2004 proposal for water quality trading in the Monocacy River watershed. The watershed has a mix of urban and agricultural sources, and the project could look very flexibly into point/point, point/nonpoint, and nonpoint/nonpoint trading. The proposal was submitted in December 2003. (Scott Macomber, personal communication, May 18, 2004). Contact:
Scott Macomber, Maryland Department of the Environment. (410) 537-3077 St. Martin’s River Watershed The U.S. Environmental Protection Agency, Region III, has expressed interest in water quality trading within the St. Martin’s River basin. An initial stakeholders meeting is planned for early summer 2004, and the EPA probably has a 2-5 year time frame in mind. The St. Martin’s River watershed does not have any urban areas, and there are only two point source dischargers. One is already at the limit of technology and the other is only one step away. There are major nonpoint source nutrient loads in the watershed, and nonpoint/nonpoint trades could be explored (Scott Macomber, personal communication, May 18, 2004)
324
Contact:
Scott Macomber, Maryland Department of the Environment. (410) 537-3077 Wicomico River A 1987 simulation studied the potential cost savings of point/nonpoint trading for phosphorus in the Wicomico River basin. Although the simulation suggested that trading offered potentially significant cost savings and water quality improvements, no program was developed (USEPA 1996). References:
U.S. Environmental Protection Agency (1996). Appendix C: Examples of existing and potential future trading programs, Table 2: Programs under consideration/development. In Draft Framework for Watershed-Based Trading, EPA 800-R-96-001, May, 1996. Retrieved May 28, 2004 from http://www.epa.gov/OWOW/watershed/appc2.pdf
Massachusetts Nashua River The Massachusetts Department of Environmental Protection (MDEP) has developed a proposal to explore how point/nonpoint phosphorus trading and a watershed-wide permit can facilitate TMDL implementation in the Nashua River Watershed. The DEP hopes that the project will also promote interstate cooperation on water quality issues. The MDEP submitted the proposal for a 2004 Targeted Watershed (formerly Watershed Initiative) grant in January, 2004 (MDEP 2004). Contacts:
Sharon Pelosi, Director of Watershed Permitting, Massachusetts Department of Environmental Protection. (617) 556-1104
Claire Barker, Coordinator for Policy, Outreach and Innovative Technology, Watershed Permitting Program, Massachusetts Department of Environmental Protection. (617) 556-1128
Bryant Firmin, NPDES Coordinator, Massachusetts Department of Environmental Protection. (508) 849-4003
References:
Massachusetts Department of Environmental Protection (MDEP) (2004). Using watershed-based permitting and phosphorus trading for TMDL implementation in the Nashua River Watershed. Application to the U.S. Environmental Protection Agency, 2004 Watershed Initiative Funding. Available from the DEP on request, but not for public distribution.
325
Michigan Gun Lake Tribe, Kalamazoo River The Gun Lake Tribe receieved a 2004 Targeted Watershed (formerly Watershed Initiative) grant to develop a water quality trading infrastructure and market tools for the Kalamazoo River watershed, which contains their tribal land. Agricultural BMPs will generate nutrient loading reductions, and point/nonpoint trading can help meet TMDL goals. The tribe is leading the initiative in collaboration with a watershed-wide group of stakeholders, including the Environmental Trading Network, a TMDL Implementation Committee, state and local governments, and county conservation districts (Gun Lake Tribe 2004; Mark Kieser, personal communication, May 27, 2004). Contact:
Mike Tenenbaum, Gun Lake Tribe. Mark Kieser, Kieser & Associates, (269) 344-7117
References:
Gun Lake Tribe (2004). Development and application of infrastructure for a model trading registry and agricultural participation in the Kalamazoo River Watershed, Michigan. Application to the U.S. Environmental Protection Agency, 2004 Watershed Initiative Funding. Retrieved July 30, 2004 from http://www.epa.gov/twg/2004/2004proposals/04kalamazoo.pdf
U.S. Environmental Protection Agency (2004). 2004 Watershed project summaries: targeted watersheds under the 2004 Watershed Initiative. Retrieved July 30, 2004 from http://www.epa.gov/owow/watershed/initiative/2004/04selectsumm.html
Nevada Lake Tahoe See entry above, under “California.” New York East River The New York City Department of Environmental Protection (NYC DEP), facing modification of SPDES permits for fourteen publicly-owned sewage treatment facilities, is requesting that the New York State Department of Environmental Conservation (NYS DEC) incorporate nitrogen trading into discharge permits for the East River. The NYC DEP's Upper East River plants are located in management zone eight while the Lower East River plants are located in zone nine. The Long Island Sound Study (LISS) approved nitrogen trading among management zones as a way to meet water quality standards and reduce nitrogen entering the Sound. A TMDL, developed in 2000 and approved by EPA in 2001, is the driver for both nitrogen trading and permit modifications (NYS DEC 2004). Although not formally approved by NYS DEC but
326
included in regulatory reports, NYC DEP has been operating a nitrogen credit bank and trading to meet nitrogen limits since November 2002 (Diane Hammerman, personal communication, June 2, 2004). The Lower East River and Upper East River management zones trade under a 2:1 trading exchange ratio (LER:UER) approved by LISS (Mark Tedesco, personal communication, June 2, 2004 and Diane Hammerman, personal communication, 2002). However, this trading ratio may be raised (4.63:1 – 5.19:1, LER:UER) based on an increased impact estimate of Upper East River plants to western LIS dissolved oxygen levels as determined by modelling (Diane Hammerman, personal communication, 2002). NYC DEP would like the trading ratios to be formalized by NYS DEC through incorporation in SPDES permits but NYS DEC does not currently have a state-wide water quality trading guidance or specific trading regulations (NYS DEC 2004). The final ruling on nitrogen trading for wastewater discharges is still pending with NYC DEP in negotiations with NYS DEC regarding the City’s nitrogen removal program (Diane Hammerman, personal communication, June 2, 2004). Contacts:
Diane Hammerman, NYC DEP, Bureau of Wastewater Treatment. E-mail: [email protected]
Mark Tedesco, Long Island Sound Study. Telephone: (203)-977-1541. References:
New York State Department of Environmental Conservation (NYS DEC). “ALJ Ruling for NYC Department of Environmental Protection in the Matter of Modification of the Fourteen State Pollutant Discharge Elimination System (SPDES) Permits Pursuant to Environmental Conservation Law Article 17 and 6 NYCRR Parts 621, 624 and 750 et seq., for the City of New York’s 14 Publicly Owned Sewage Treatment Plants Operated by the City of New York Department of Environmental Protection (NYC DEP).” Ruling on Proposed Adjudicable Issues and Petitions for Party Status and Ruling on Motion for Stay. January 28, 2004. Retrieved on June 2, 2004, from http://www.dec.state.ny.us/website/ohms/decis/nycdepspdesr.html
New York State Department of Environmental Conservation (NYS DEC) and Connecticut Department of Environmental Protection. A Total Maximum Daily Load Analysis to Achieve Water Quality Standards for Dissolved Oxygen in Long Island Sound. December 2000. Retrieved on May 30, 2004, from http://www.epa.gov/NE/eco/lis/assets/pdfs/Tmdl.pdf
Websites:
Long Island Sound Study (home) http://www.longislandsoundstudy.net/index.htm New York City Department of Environmental Protection, Bureau of Wastewater
Treatment http://www.nyc.gov/html/dep/html/wastewater.html North Carolina Cape Fear River Basin
327
The Cape Fear River Assembly received a 2004 Targeted Watershed (formerly Watershed Initiative) grant to develop watershed permitting and water quality trading for the heavily urbanized Cape Fear River Basin. The trading framework will allow point-point and point-nonpoint trades, and municipal sources will be allowed to trade between their NPDES and stormwater (MS4) permits. Eligible projects may include structural urban BMPs, agricultural BMPs, and nonstructural BMPs such as land banking, riparian buffering, wetland restoration, low impact development, clustering, and conservation subdivisions. Trading will initially assist in the implementation of a TMDL for the Jordan Lake watershed, which is in the upper portion of the Cape Fear River Basin. The ultimate objective is to develop approaches that can be expanded through the entire basin. In all, the proposal outlines has six elements: (1.) “visioning” and project charter; (2.) designing the trading framework; (3.) developing an implementation framework, which may include watershed permitting; (4.) evaluating and enhancing the existing monitoring; (5.) conducting the pilot project in Jordan Lake; (6.) expanding the framework for the rest of the basin. The budget for the entire project is $1.45 million, including $130,000 for visioning and chartering, $280,000 for the trading framework, $230,000 for the implementation framework, $350,000 to enhance monitoring, $410,000 for the pilot project, and $55,000 to extend the program throughout the basin. The pilot project is expected begin in mid-2005. (all information above from Freeman 2004). Contact:
Don Freeman, Jr., Executive Director, Cape Fear River Assembly. (910) 223-4601 References:
Freeman, Don (2004). Basinwide water quality trading study: incorporating urban stormwater management into an incentive-based watershed permitting framework. Cape Fear River Assembly. Application to the U.S. Environmental Protection Agency, 2004 Watershed Initiative Funding. Retrieved July 30, 2004 from http://www.epa.gov/twg/2004/2004proposals/04capefear.pdf
U.S. Environmental Protection Agency (2004). 2004 Watershed project summaries: targeted watersheds under the 2004 Watershed Initiative. Retrieved July 30, 2004 from http://www.epa.gov/owow/watershed/initiative/2004/04selectsumm.html
Ohio Ohio River Basin The Ohio River Valley Water Sanitation Commission (ORSANCO) and its member states (Illinois, Indiana, Kentucky, New York, Ohio, Pennsylvania, Virginia and West Virginia) will investigate trading as a means of reducing nutrient loadings within the Ohio River Basin to improve water quality and mitigate the Gulf of Mexico hypoxia
328

problem. EPA contacted ORSANCO regarding the possible development of a nutrient trading program in 2003 and discussions between ORSANCO, EPA and USDA have continued to date (ORSANCO 2003). ORSANCO is currently developing stream nutrient criteria, but a lack of regulatory drivers within states will slow the development of a trading program (if states have TMDLs in place, they are usually for phosphorus and hypoxia is primarily a nitrogen problem) (Peter Tennant, Personal Communication, May 27, 2004). ORSANCO submitted a Watershed Initiative grant to US EPA through WV DEP in 2004 to fund the formation of a Sub-Basin Committee that will address ways to manage nutrient loadings including trading (ORSANCO 2004). ORSANCO will also evaluate the success of the Great Miami River watershed water quality credit trading pilot program to determine if trading might be applied throughout the Basin (Peter Tennant, Personal Communication, May 27, 2004). Contact:
Peter Tennant, Deputy Executive Director, ORSANCO. Telephone: (513)-231-7719. E-mail: [email protected]
References:
Mississippi River/Gulf of Mexico Watershed Nutrient Task Force. 2003. Tenth Meeting of the Mississippi River/Gulf of Mexico Watershed Nutrient Task Force [Meeting Summary]. Saint Louis, Missouri: November 19, 2003. Retrieved on May 26, 2004, from http://www.epa.gov/msbasin/pdf/10thMeetSumm.pdf
Ohio River Valley Water Sanitation Commission (ORSANCO). 2003. 177th
Commission Meeting [Minutes]. Cincinnati, Ohio: October 16, 2003. Retrieved on May 21, 2004, from http://www.orsanco.org/orsa/docs/Commission%20Minutes/177th-commission%20minutes%20oct%2003.pdf
Ohio River Valley Water Sanitation Commission (ORSANCO). 2004. 178th
Commission Meeting [Minutes]. White Sulphur Springs, West Virginia: February 12, 2004. Retrieved on May 21, 2004, from http://www.orsanco.org/orsa/docs/Commission%20Minutes/178th-commission%20minutes%20feb%2004.pdf
Honey Creek Watershed EPA sponsored a case study to compare the cost-effectiveness of implementing agricultural best managment practices (specifically conservation tillage) versus upgrading point source treatment to reduce phosphorus loadings within the Honey Creek watershed, a 151 sq. mi. "agricultural watershed in the Lake Erie drainage basin of north central Ohio" (DPRA 1986). An actual trading program was not developed. References: DPRA Incorporated. 1986. An Evaluation of the Cost Effectiveness of Agricultural Best
Management Practices and Public Owned Treatment Works in Controlling Phosphorus Pollution in the Great Lakes Basin. Submitted to: US Environmental Protection Agency. Revised February 1989. Retrieved on June 1, 2004, from http://yosemite.epa.gov/ee/epa/eermfile.nsf/vwAN/EE-0317.pdf/$file/EE-317.pdf
329
Oklahoma Lower North Canadian River The Oklahoma Conservation Commission completed a study on water quality trading in Oklahoma, using the Lower North Canadian watershed in central Oklahoma as a potential case study. The report concluded that the watershed was unsuitable for a point/nonpoint source trading program, since point sources contribute more than 90% of the nutrient load. The large number of point sources, however, raise the possibility of point/point trading (OCC 2002). Contact:
Cheryl Ormston, Oklahoma Conservation Commission. (405) 522-4735
References: Oklahoma Conservation Commission (OCC) (2002). Implementation of a nutrient
trading strategy in Oklahoma. Available on request from the Oklahoma Conservation Commission.
Oregon Tualitin River The Oregon Department of Environmental Quality has incorporated trading for “oxygen-demanding substances” (ammonia and BOD) and temperature into permit limits issued to Clean Water Services. Clean Water Services (CWS) is a “sewerage and stormwater special service district” located in Washington County. Through the terms of the trade, CWS is able to shift, the extent to which depends on instream flow and temperature conditions, a portion of load allocations for BOD and ammonia between two, operating WWTPs discharging into the Tualitin River basin. CWS is also able to trade to meet temperature standards by engaging in riparian restoration and flow augmentation rather than installing more expensive, on-site, cooling technologies (ODEQ 2004). Contact:
Sonja Biorn-Hansen, Project Manager, ODEQ, Water Quality Division. Telephone: (503) 229-5257. E-mail: [email protected]
References:
Oregon Department of Environmental Quality (ODEQ). 2004. Water Quality Credit Trading: Frequently Asked Questions. Retrieved on May 25, 2004, from http://www.deq.state.or.us/wq/wqTrading/wqTrading.htm
Rhode Island Providence salting
330

The City of Providence instituted an arrangement between the City’s Department of Water and Department of Transportation. Faced with sodium standards within the supply source recharge area, which would have required costly in-plant treatment, the Water Department arranged to pay the Transportation Department $60,000 a year to use alternative, non-sodium deicing chemicals. The Department of Water was able to meet sodium standards at a lower cost (Sohngen 1998; USEPA 1996). This is included in the EPA’s 1996 list of trading programs, but it is more similar to subsidies for alternative technologies than trading. Contacts:
Michael Russo, Providence Water Department. (401) 521-6300. References:
Sohngen, Brent (1998). Incentive Based Conservation Policy and the Changing Role of Government. American Farmland Trust, Center for Agriculture and the Environment, Working Paper CAE/WP98-6. Retrieved May 27, 2004 from http://www.aftresearch.org/researchresource/wp/wp98-6.html
U.S. Environmental Protection Agency (1996). Appendix C: Examples of existing and potential future trading programs, Table 1: Existing programs. In Draft Framework for Watershed-Based Trading, EPA 800-R-96-001, May, 1996. Retrieved May 28, 2004 from http://www.epa.gov/OWOW/watershed/appc1.pdf
Tennessee Boone Reservoir A 1989 study evaluated the cost effectiveness of point and nonpoint source controls for phosphorus, nitrogen, and BOD in the Boone Reservoir. A combination of point and nonpoint source controls was found to be the most cost-effective means of nutrient and BOD control. No trading program was developed (USEPA 1996). References:
U.S. Environmental Protection Agency (USEPA) (1996). Appendix C: Examples of existing and potential future trading programs, Table 2: Programs under consideration/development. In Draft Framework for Watershed-Based Trading, EPA 800-R-96-001, May, 1996. Retrieved May 28, 2004 from http://www.epa.gov/OWOW/watershed/appc2.pdf
Utah Bear River Basin See entry above, under “Idaho.”
331
Virginia Colonial Soil and Water Conservation District, Lower James River The Colonial Soil and Water Conservation District (SWCD) has developed a continuous, no-till farm management system, the Innovative Cropping System (ICS), that can reduce sediment and nutrient loads by over 90%. If all 131,300 acres in the Lower James River watershed followed ICS, nitrogen loading could be reduced by over 2.5 million lbs/year and phosphorus by over 1 million lbs/year (Kieser 2003). In light of these immense pollution reductions, the Colonial SWCD is interested in exploring how the ICS and other farm management techniques might be used within a water quality trading program (Colonial SWCD n.d.). In 2003, the Colonial SWCD submitted a proposal to the EPA and the Environmental Trading Network conducted a trading workshop for the Lower James River, but obtaining funding to initiate a pilot project has been challenging (ETN 2003). Contact:
Brian Noyes, Conservation Specialist and District Coordinator, Colonial SWCD. (804) 932-4376 Jim Wallace, Agricultural Water Quality Specialist, Colonial SWCD. (804) 932-4376
References:
Colonial Soil and Water Conservation District (n.d.). Tributary Strategies, TMDLs, and water quality trading. Retrieved April 27, 2004 from http://colonialswcd.vaswcd.org/Trib%20Strat%20TMDLs%20and%20WQ%20Trading.htm
Environmental Trading Network (2003). March 5, 2003 Conference Call Summary. Retrieved May 11, 2004 from www.envtn.org/calls/march2003call.PDF
Kieser, Mark S (2003). Market approaches for environmental improvements: opportunities in the Great Lakes Region and beyond. Presented at the Forum on Environmental Markets in the Potomac Basin hosted by Friends of the Potomac and the Environmental Finance Center, Washington, DC, September 16-17, 2003.
Washington Chehalis River The Chehalis River appeared to provide an opportunity for initiating a trading program in conjunction with a TMDL. The Chehalis River was first identified as a potential location for trading in a 1992 report for the Washington Department of Ecology by Apogee Research, Inc. Further research on the economic, regulatory, and political context for trading was conducted, and both point/nonpoint and nonpoint/nonpoint trades were considered (USEPA n.d.). However, the TMDL did not succeed in laying the foundation for trading. The opportunities for trading appeared remote because the load allocation for
332
nonpoint sources above the Skookumchuck was zero, all point sources with wasteload allocations happened to be above the Skookumchuck River, and the river sections with the lowest assimilative capacities were just above the Skookumchuck River (USEPA 1996). A draft implementation plan was developed, but no program was implemented (WDOE 1996). References:
U.S. Environmental Protection Agency (USEPA) (1996). Appendix C: Examples of existing and potential future trading programs, Table 2: Programs under consideration/development. In Draft Framework for Watershed-Based Trading, EPA 800-R-96-001, May, 1996. Retrieved May 28, 2004 from http://www.epa.gov/OWOW/watershed/appc2.pdf
Washington Department of Ecology (WDOE) (2001). Proposal for doing an effluent trading project – first draft 6/08/01. Retrieved May 20, 2004 from http://www.ecy.wa.gov/programs/wq/partnership/09_20_01/support/effluent_%20trading_pilot_bernath.doc
------(1996). State of Washington comments on “Draft Framework for Watershed-Based Trading.” Letter to the U.S. Environmental Protection Agency. Retrieved May 24, 2004 from http://www.epa.gov/OWOW/watershed/tradecom/level3/wsde.html
Puyallup River The USEPA, Region 10, provided grant money in 1997 for a pilot water quality trading project in the Puyallup River basin (USEPA 2003). The project focused on biochemical oxygen demand (BOD) and ammonia, and it was agreed that the two point sources with waste load allocations(WLAs) for BOD could have permit modifications to allow for point/point trading (WDOE 2001). However, the program did not result in any trading. It was determined to be infeasible, primarily because of changing economic needs of the point sources (USEPA 2003). References:
U.S. Environmental Protection Agency (USEPA) (2003). EPA Region 10's Water Quality Trading Initiative. Last updated 8/07/2003 Retrieved May 28, 2004 from http://yosemite.epa.gov/R10/OI.NSF/0/e061bb2efbef6d54882566950062b816?OpenDocument
Washington Department of Ecology (WDOE) (2001). Proposal for doing an effluent trading project – first draft 6/08/01. Retrieved May 20, 2004 from http://www.ecy.wa.gov/programs/wq/partnership/09_20_01/support/effluent_%20trading_pilot_bernath.doc
------(1998). Agreement on the allocation of the Puyallup River TMDL reserve of biochemical oxygen demand (BOD5) and ammonia. Retrieved May 28, 2004 from http://www.ecy.wa.gov/programs/wq/tmdl/watershed/puyallup/puy_bod_allo.pdf
333
Yakima River Concurrent studies by Battelle’s Pacific Northwest Laboratory and the Wisconsin Department of Ecology identified the Yakima River as a potential location for a point/nonpoint source water quality trading program (USEPA 1996). The Yakima TMDL, however, made determining cost-savings and environmental benefits difficult to determine, since the TMDL set attainment targets rather than load allocations (WDOE 1996). At this time, a coalition of stakeholders has proposed a nonprofit water rights clearinghouse and bank called the Yakima Water Exchange (Roundtable Associates 2003). Promoters of the Yakima Water Exchange proposal point out that it can be used as a tool to address water quality, However, the primary mission of the Yakima Water Exchange “would be to facilitate the exchange of water and water rights in the Yakima basin from willing sellers or lessors to those who wish to acquire water and water rights for both in and out of stream uses on a temporary or permanent basis” (Roundtable Associates 2003). Unlike the water rights acquisitions on the Truckee River and the flow-trading proposed for the Charles River (see entries under “Trading Initiatives”), the Exchange is not focused on trading for the purpose of water quality. References:
Roundtable Associates (2003). Water Exchange in the Yakima Basin, version 5.1, October 6, 2003. Retrieved May 27, 2004 from http://www.roundtableassociates.com/ywe/WB%20Final/Yakima%20Water%20Bank%20ver%205.1%20(Final%20Draft).pdf
U.S. Environmental Protection Agency (USEPA) (1996). Appendix C: Examples of existing and potential future trading programs, Table 2: Programs under consideration/development. In Draft Framework for Watershed-Based Trading, EPA 800-R-96-001, May, 1996. Retrieved May 28, 2004 from http://www.epa.gov/OWOW/watershed/appc2.pdf
Washington Department of Ecology (WDOE) (1996). State of Washington comments on “Draft Framework for Watershed-Based Trading.” Letter to the U.S. Environmental Protection Agency. Retrieved May 24, 2004 from http://www.epa.gov/OWOW/watershed/tradecom/level3/wsde.html
West Virginia Cacapon/Lost River Friends of the Potomac is interested in carbon and nutrient trading between power companies and farms in the upper Potomac basin. Friends of the Potomac hosted a trading forum in September, 2003 and established a steering committee to investigate a pilot trading project in the Cacapon/Lost River basin. In collaboration with the Environmental Trading Network, Friends submitted a 2004 Watershed Initiative proposal for the Cacapon/Lost River pilot program. Contact:
Dan Nees, Executive Director, Friends of the Potomac. (301) 495-6699
334
References: Environmental Trading Network (2004). Current ETN Efforts/Pending proposals,
May 19, 2004. Retrieved May 29, 2004 from http://www.envtn.org/docs/may19_04ETNFunding.pdf
Friends of the Potomac (2003). Environmental Markets Forum. Retrieved May 29, 2004 from http://www.potomacfriends.org/programs/econdev.shtml
Cheat River As one of eleven water quality trading pilot projects sponsored by US EPA in 2002, the Cheat Trading Stakeholder Group met between 2002 and 2004 to assess the potential for water quality trading within the Cheat River watershed (Downstream Strategies 2004). Water quality trading would enable point and nonpoint sources facing a TMDL to achieve pollutant load reductions more quickly and more cost-effectively (Downstream Strategies 2004). In 2001, US EPA established a TMDL for 55 segments of the Cheat River and its tributaries because of a failure to meet pH, iron, aluminum, manganese, and/or zinc water quality standards (Downstream Strategies 2004). Acid mine drainage (AMD) is the dominant limiting factor within the watershed (Downstream Strategies 2004). Most of the necessary pollutant reductions are required at orphan mine sites which are not regulated by permits and rely on limited government funding for remediation (Downstream Strategies 2004). A trading program could facilitate clean-up of these sites by providing cost-effective reduction credits to other regulated sources facing more stringent water quality effluent limits under the Cheat TMDL (Downstream Strategies 2004). Another driver for trading is West Virginia’s anti-degradation policy (Downstream Strategies 2004). Although no specific trading rules have been developed, a trading framework was finalized by the Cheat Trading Stakeholder Group in February 2004 and a final report was submitted to US EPA and WV DEP in April. The trading framework includes guidance for: the generation and approval of credits; types of trading allowed (same-pollutant versus cross-pollutant); appropriate units of exchange (tons for same-pollutant trades, pounds of acidity for cross-pollutants within AMD, “eco-units” for cross-pollutants outside AMD); and the development of trading ratios to account for varying levels of certainty in achieving net reductions or net ecological benefits based on the type of trade, spatial relationship between buyer and seller, and “contribution to watershed restoration goals” (Cheat Trading Stakeholder Group 2004a). The trading framework also provides for the creation of the Cheat Watershed Restoration Authority to develop and monitor a watershed management plan; facilitate trades; manage a credit bank jumpstarted by publicly-funded reductions; coordinate funding for remediation projects through the development of a Watershed Management Trust Fund financed by trades, grants, and contributions; and ensure that all trades are consistent with the trading framework, watershed management plan, and local, state and federal water quality regulations and policies (Cheat Trading Stakeholder Group 2004a and Downstream Strategies 2004).
335
All trades will be incorporated into NPDES permits by WV DEP and the DEP will have final authority regarding the approval, monitoring and enforcement of trades (Downstream Strategies 2004). Friends of the Cheat have applied for a Watershed Initiative Grant to support a pilot project for a thermal/AMD cross-pollutant trade involving the Albright power plant (Cheat Trading Stakeholder Group 2004b). Pilot projects for AMD/AMD trades may also be proposed to DEP for approval (Evan Hansen, Personal Communication, June 1, 2004). Contact:
Evan Hansen, Downstream Strategies. Telephone: (304)-291-8205. E-mail: [email protected]
References:
Cheat Trading Stakeholder Group. 2004a. A Trading Framework for the Cheat River Watershed, West Virginia. Downstream Strategies. Retrieved on May 27, 2004, from http://downstreamstrategies.com/cheat.html
Cheat Trading Stakeholder Group. 2004b. Minutes (Final Meeting). Downstream Strategies. Retrieved on May 27, 2004, from http://downstreamstrategies.com/cheat.html
Downstream Strategies, LLC. The Potential for Water Quality Trading to Help Implement the Cheat Watershed Acid Mine Drainage Total Maximum Daily Load in West Virginia. Submitted to US EPA Region 3 and WV DEP, Division of Water and Waste Management by Friends of the Cheat. April 2004. Retrieved on May 27, 2004, from http://downstreamstrategies.com/cheat.html
Further written information is available from http://downstreamstrategies.com/cheat.html Reviewed by Evan Hansen, Downstream Strategies. Wyoming Bear River Basin See entry above, under “Idaho.”
336


