Embed Size (px)
Citation preview
.- .C
GRAPHIC ARTS (GENERAL) AP-42 Section 4.9 Reference Number
12
Research Triangle Park, N. C.
U.S. ENVIRONMENTAL PROTECTION AGENCY
Office of Air and Water Programs Office of Air Quality Planning and Standards
Research Triangle Park, North Carolina 27711
EVALUATIONS OF EMISSIONS AND CONTROL TECHNOLOGIES
IN THE
GRAPHIC ARTS INDUSTRIES PHASE--II: WEB OFFSET AND
METAL DECORATING
PROCESSES
EnvlroIlmental Protf?utlon Amucx Teobnlaal Information Servlo_e
._a_
APTD-1463
EVALUATIONS OF EMISSIONS
AND CONTROL TECHNOLOGIES
IN THE GRAPHIC ARTS INDUSTRIES PHASE II: WEB OFFSET
AND METAL DECORATING PROCESSES
bY
R. R. Gadomski, A. V. Gimbrone, Mary P. David, and W. 3. Green
Graphic Arts Technical Foundation 4615 Forbes Avenue
Pittsburgh, Pennsylvania 15213
Contract No. 68-02-0001
EPA Project Officer: e John T . Dale
Prepared for
ENVIRONMENTAL PROTECTION AGENCY Office of Air and Water Programs
Office of Air Quality Planning and Standards Research Triangle Park, North Carolina 27711
May 1973

f
The APTD (Air Pollution Technical Data) series of reports is issued by the Office of Air Quality Planning and Standards, Office of Air and Water Pro- grams, Environmental Protection Agency, to report technical data of interest to a limited number of readers. Copies of APTD reports are available free of charge to Federal employees, current contractors and grantees, and non- profit organizations - as supplies permit - from the Air Pollution Technical Information Center, Environmental Protection Agency, Research Triangle Park, North Carolina 27711 or may be obtained, for a nominal cost, from the National Technical Information Service, 5285 Port Royal Road, Springfield, Virginia 22151.
This report was furnished to the Environmental Protection Agency by Graphic Arts Technical Foundation, Pittsburgh, Pennsylvania, in fulfillment of Contract No. 68-02-0001. The contents of this report are reproduced herein as received from the contractor. The opinions, findings, and con- clusions expressed are those of the author and not necessarily those of the Environmental Protection Agency. Mention of company or product names is not to be considered as an endorsement by the Environmental Protection Agency.
Publication No. APTD- 1463
ii
Evaluation of Emissions and Control Technologies in the Graphic Arts Industry
Raymond R. Gadomski Anthony V. Gimbrone Mary P. David William J. Green
Phase II Fina 1 Technica 1 Report
Prepared Under Contract No. EPA 68-02-0001
for
Industrial Studies Branch Applied Technology Division
Stationary Source Pollution Control Programs Office of Air 6 Water Programs
Environmental Protection Agency Research Triangle Park, N. C. 27711
May 1973
FOREWORD
This report summarizes the studies conducted by the Graphic Arts Technical Foundation for the Environmental Protection Agency, Office of Air & Water Programs, during the second phase under EPA Contract No. 68-02-0001. Previous (first phase) work was conducted under a National Air Pollution Control Administration, Department of Health, Education and Welfare Contract No. CPA- 22-69-72.
The work was performed by staff members of the Environmental Control Division of the Research Department of GATF and covers the contract period between January 4, 1971 and July 4, 1972.
This report is intended to be a final one for two graphic arts processes, web offset lithography and metal decorating. It is anticipated that addi- tional contract work will cover the remaining printing processes, letterpress, gravure, flexo- graphy and silk screen.
ACKNOWLEDGMENTS
The authors gratefully acknowledge the financial support of the Environmental Protection Agency as well as that of the industry members of the Graphic Arts Technical Foundation. On many occasions throughout the conduct of the field sampling performed under this Contract, industry members gave freely of time and facilities for which a dollar cost cannot be estimated. It was this cooperation which provided a sound basis for the conduct of the on-site field sampling studies so necessary and valuable to the study. The work upon which this report is based was performed pursuant to Contract No. EPA- 68-02-0001 with the Office of Air & Water Programs, Environmental Protection Agency.
The authors wish to thank Mr. William H. Webber, Executive Director of the Graphic Arts Technical Foundation, for his support of this effort. Dr. William D. Schaeffer, Research Director of GATF, provided supervision and coordina- tion throughout this work. In addition, he offered guidance and assistance in the review of this text.
The Air Pollution Control Advisory Committee comprising thirty-one (31) indus- try members (see Appendix A) is acknowledged for their technical review, assistance and support in this effort. In addition, various members of the Ad Hoc Web Heatset Committee served in a technical review capacity of the draft report and are acknowledged for their efforts.
Dr. J. J. McGovern, Head of Research Services, and Dr. Robert J. Reitz, Senior Fellow, Mellon Institute of Carnegie-Mellon University, Pittsburgh, Pa., are acknowledged for their contribution to this study. Mr. P. R. Eisaman, Fellow and Mr. V. G. Colaluca, Research Assistant of the Physical Measurements Laboratory, Mellon Institute of Carnegie- Mellon University, Pittsburgh, Pa., contributed to the analysis, data calculations, and materials handling practices associated with the field sampling program. Their diligent and conscientious efforts to the overall conduct of the analytical studies enabled the contract work to be completed as scheduled.
Mr. William H. Webber, Executive Director, Mr. James Alm, Administration Director, Dr. William D. Schaeffer, Research Director, and Mr. Raymond R. Gadomski, Project Manager, of the Graphic Arts Technical Foundation suc- cessfully coordinated the contractual and administrative procedures associ- ated with this effort. Mr. David B. Crouse served as a consultant for the printing processes. The final report as well as the many drafts and re- visions to the report was typed by Ms. Lenore Hyatt, Secretary, Environ- mental Control Division of t.he Research Department of the Foundation.

TABLE OF CONTENTS ,
SUMMARY. . . . . . . . . . . . _.
I
ABBREVIATIONS AND TERMS USED IN THIS REPORT
INTRODUCTION . . . . . . ’ . . . .
PERSPECTIVE OF THE INDUSTRY . ’ . . i .
CONTROL THROUGH CHANGE . . . . . . . .
1.0 1.1 1.11 1.12 1.13 1.2 1.21 1.22 1.3 1.4 1.5
MATERIALS MODIFICATION . . . . . Innovative Ink Sys terns . . . . . . Heat-reactive Inks . . . . . . . Photo-reactive Inks . . . . . . Other Radiation-cured InLs . . . . Research/Development/Commercialization. Hea t-reactive (Therma lly-Ca ta lyzed) Ink . Photo-reactive (UV) Inks. . . . . . Ink Reformulation . Miscellaneous MaterIals.MddifIcat.i,on: . Trends . . . . . . . . . . .
.
.
.
.
.
.
.
.
.
.
.
.
.
.
.
.
.
.
.
.
.
.
.
.
.
.
.
.
.
.
.
.
2.0 2.1 2.11 2.2 2.3 2.4 2.5 2.6
PROCESS MODIFICATION/CONTROL EQUIPMENT. Incineration ........... Energy Shortage .......... Carbon Adsorption ......... Scrubbing Ozone Treatmeit .. Coating Process for Web’Offlet. .................... Electrostatic Precipitation .......
3.0 INSTRUMENTATION AND CONTROL EQUIPMENT .
_. 4.0
4.1 4.11 4.12 4.2 4.21 4.22 4.23 4.24 4.25 4.26
SAMPLING AND ANALYSIS OF STACK EFFLUENT FOR GRAPHIC ARTS PROCESSES
Introduction .............. Sampling ............... Analysis ............... Sampling and Analytical Technique ........ Summary . .. . .. Summary of Stack Gas Sampler Consideration: ........... Stack Gas Sampler (Figure 9, Appendix B) ...... Sampling Procedure ............ Total Sample Volume ............ Analysis of the Cylinder. ..........
.
.
.
.
0
.
.
.
.
.
.
.
.
.
l
.
.
.
.
.
.
.
.
.
.
.
.
.
.
*
.
.
.
.
.
.
.
.
.
.
.
.
.
.
.
.
.
.
.
.
.
cr
.
.
.
.
.
.
.
.
.
.
.
.
.
.
.
.
.
.
.
.
.
.
.
.
.
.
.
.
.
.
.
.
.
.
.
.
.
.
.
.
.
.
.
.
.
.
.
.
.
.
.
.
.
.
.
.
. l
.
.
.
.
.
.
.
.
.
.
.
.
.
.
.
.
.
.
.
.
.
.
.
.
.
.
.
.
.
. l
.
.
.
.
.
.
.
1
3
5
11
14
14 14 16 17 19 21 22 25 28 28 29
31 31 32 33 33 34 35 35
37
39
39 40 42 43 43 45 45 46 47 48
cont’d. i
.
Table of Contents continued .
4.27 4.28 4.29 4.3 4.4 4.41 4.42 4.5 4.6 4.7
4.71 4.72 4.73 4.8 4.9
5.0 5.1 5.2 5.3 5.31 5.32 5.33 5.34 5.35 5.5 5.51 5.52 5.6 5.61 5.62 5.63 5.7 5.8 5.9 5.91 5.92 5.93 5.94
6.0 6.1 6.2 6.21 6.22
Analysis of the Trap Sample . . . . Cylinder and Probe Trap Maintenance . Cost Analysis . . . . . . . . Appraisal and Summary . . . . . Experimenta 1 . . . . . . . . Introduction and Summary. . . . . Preliminary Studies . . . . . . Preliminary Field Studies’. . . . . Stack Simulator Study. . . . . .
. . . . .
. . . . .
. . . . . .-
. . . ‘.‘- .
. . . . .
. . . . .
. f . . .
. . . . .
. . . . .
Comparison of Isokinetic Sampling With GATF Integrated. Grab Sampling
Introduction .......... ... Experimental .............. Discussion of Test Results ......... Gradient Studies ............ Efficiency of Trap ............
TREATMENT OF EXPERIMENTAL SAMPLING DATA . . . Introduction . . . . . . . . . . . Data Sheets (Firms’) . . . . . . . . . . Data Sheets (Description). . . . . . . . . .
-
“XL
.
.
.
.
.
.
.
.
.
.
.
.
.
.
.
.
.
.
.
I.. -_
.
.
.
. l
.
.
.
.
.
.
.
.
.
.
.
.
.
.
I _
.
.
.
.
.
.
.
.
.
.
.
.
.
.
.
.
.
.
. Data Sheet #l-ECD (Source Location and Sample Background Data) . Data Sheet #2-ECD (Physical and Operational Plant Data) . . Data Sheet #3-ECD (Effluent Sampling Data) ...... Data Sheet #4-ECD (Visible Emissions Evaluation) .... Data Sheet #S-ECD (Gas Velocity Data) ....... Development of a Test Program .......... Web Offset Publication Printing Test Program ...... Metal Decorating Test Program .......... Basis for Calculations Calculation of Observed E’mis’sions ................... Calculation of Material Inputs .......... Significance of the Material Balance ........ Calculation of Control Equipment Organic Conversion Efficiency. Sample Calculations . . . . . . . . . . Discussion of Error . . . . . . . . . . Effluent Gas Flow Rate . . . . . . . . . Hydrocarbon Concentration . . . . . . . . Hydrocarbon Emission Error Calculations . . Summary of Error, Organics Emission Calculation;
.
.
WEB OFFSET FIELD STUDIES . . . . . . . . Introduction . . . . . . . . . . . Uncontrolled Sour&s . . . . . . . . . . Web Offset Press Using Direct Flame Hot Air Drying . Web Offset Press Using High Velocity Hot Air Drying.
.
.
.
.
.
.
.
.
.
.
.
.
.
.
.
.
.
.
.
.
.
.
.
.
.
.
.
.
.
.
.
.
.
.
.
.
.
.
.
.
.
.
.
.
.
.
.
.
.
.
.
.
.
.
.
.
.-
52 53 54 58 58 58 59 61 66 67
67 68 70 71 74
77 77 77 77 77 78 78 78 78 80 80 80 81 81 85 87 87 88 90 90 93 96
107
109 109 109 109 114
cont’d. ii
_- .
Table of Contents continued
6.23 6.3 6.31. 6.32 6.33 6.34 6.35 6.36 6.4 6.5
Field Observations .............. Controlled Sources .............. Introduction ................ Thermal Incineration With High Velocity Hot Air Dryer .... Thermal Incineration With Direct Flame Hot Air Dryer .... Catalytic Incineration (l-bed) With Direct Flame Hot Air Dryer . Catalytic Incineration (2-bed) With Direct Flame Hot Air Dryer . Field Observations .............. Summary of Web Offset Test Results ......... Recommendations/Conclusions Based on Web Offset Field. .. Studies
7.0 7.1 7.2 7.21 7.22 7.23 7.3 7.31 7.32 7.33 7.4 7.5
METAL DECORATING FIELD TESTS. ......... Introduction . .. ... Experimental Results - UncontrollLd dlan.ts .............. Plant Test No. 2-MD (Appendix E). ......... Plant Test No. 3-MD (Appendix E). ......... Field 0 bservations . Experimental Results - Controlled.Pla.nts: ................. Plant Test No. 4-MD (Appendix E). ......... Plant Test No. S-MD (Appendix E). ......... Field 0 bserva tions .............. Summary Tables ..... . Conclusions/Recommendations on Me’tal’Decorating ........ Field Stud ies
8.0 8.1 8.2 8.3 8.4 8.41
8.42
8.43
8.44
8.5 8.6 8.7
TESTING OF BEST CONTROLLED INSTALLATIONS. ..... Introduction ................ Objectives ................ Background for Conduct of Tests .......... Test Results .. . Web Offset With Therma’l Iicineraiion ..................
[8-WO (BC) Appendix Dl Web Offset With Catalytic Incineration ........
[g-W0 (BC) Appendix D1 Metal Decorating With Catalytic Incineration ...... [ 6-MD (BC) Appendix El
Metal Decorating With Thermal Incineration. ...... [ 7-MD (BC) Appendix ~‘1
Discussion of Test Results. ........... Cost Versus Effectiveness ............ Conclusion ................
1. 17 118 118 118 122 125 129 129 134 148
153 153 3.53 153 159 160 161 161 167 172 172 183
191 191 191 192 193 193
196
197
199
201 203 205
BIBLIOGRAPHY ............... 207
cont’d.
iii
Table of Coritents continued
APPENDIX A - Air Pollution Control Advisory Committee APPENDIX B - Figures . . . . . . . . . . APPENDIX C -- Tables . . . . . . . . . . APPENDIX D- Data Sheets, Web Offset Plants . . APPENDIX E - Data Sheets, Metal Decorating Plank . APPENDIX F - Carnegie Mellon University, Physical .
Measurements Laboratory Reports
- I * -..
7
I
. . . . 221
. . . . 225
. . . . 257
. . . . 269
. . . . 385 I
. . . . 481 I
I
iv

. _.~ _
. . ._ ..-
SUMMARY
The initial study of the air pollution problems of the graphic arts industry* provided the information and direction for further study. Two of the major printing processes, web offset lithography and metal decorating, were examined more closely so as to more fully define and minimize the pollution potential of these processes. Web offset uses heatset inks and metal decor- ating employs a variety of coatings that are dried by the application of heat. Both usually are located where the concentration. of hydrocarbons in the ambient air frequently exceeds the prescribed level and where restrictive legislation now exists .
An apparatus and procedure for integrated grab sampling was developed-that was reliable and relatively simple, as well as the analytical technique using gas chromatography for total organic analysis. The sampling apparatus was evaluated under controlled laboratory conditions. Isokinetic sampling was conducted to determine if significant particulates (condensed organics) existed in the stack gas in amounts which would invalidate grab sampling techniques.
The testing effort was directed first to assessment of emissions from the web offset process and then to metal decorating. Uncontrolled as well as controlled sources were studied, with examples of both thermal and catalytic incineration represented in the data. The organic conversion efficiency of incineration equipment was also determined and related to operational parameters.
In web offset, the effect of press speed, ink coverage, method of drying (direct flame hot air or high velocity hot air) and type of incineration equipment on the quantity of organics emitted were determined. The contributions of paper and dryer exhaust to the total organic content of the stream were con- s idered . Experience verified that the two major variables in the process, press speed and ink coverage, determine the quantity of organics emitted. An equa- tion of this direct relationship was developed that has utility for predicting quantity of emissions when all parameters (process variables) are known.
Both dryer systems (direct flame hot air and high velocity hot air) served to oxidize some of the solvent vapors - latter.
, with the former more effective than the
For each control (incineration) unit evaluated, a temperature range was deter- mined which produced an organic conversion efficiency of about 95 percent.
The coating and lithographic operations of the metal decorating process were studied in a manner consistent with that for web offset. The individual and net effects on organic emissions for various coatings, ink and oven combus- tion products were determined. Theorganic emissions from lithographic operations were found to be insignificant when compared to emissions from the coating operations . The major variables in the metal decorating process
*Cited in first bibliographic reference.
1
-
directly affecting organic emissions - the solvent fraction in the coating, area of the sheet coated, weight of coating or film applied and coater speed- were correlated and expressed in an equation as for web offset.
Thermal and catalytic combustion equipment installations studied were found to be effective in reducing organics. So as to characterize the effectiveness of incineration equipment in both the web offset and metal decorating operations to the maximum degree possible, four additional sources, chosen as being the most recent control installations, were studied. Thus, a total of nine installa- tions with air pollution control equipment were evaluated.
Operational incineration temperatures for both web offset and metal decorating are indicated as being 1100 o-1200°F and 700°-8000F for thermal and catalytic incineration, respectively, to achieve an organic conversion efficiency of 95 percent.
Cost information on the control units is presented and an attempt made to develop a comparison of cost versus effectiveness between the various cataly- tic and thermal incineration units as evaluated. A selective bibliography with review comments is presented. Efficiency curves for each system evaluated appear throughout the technical discuss ions.
Although this study was aimed primarily at developing data on air pollution control technology already in use by the industry (thermal or catalytic incin- eration), the changes being investigated within the industry, with raw materials as well as process modifications were followed to the extent possible. All information and data, mostly qualitative, made available to us is included in this report. The state of the art regarding the development and use of innovative inks presented is as current as possible.
ABBREVIATIONS AND TERMS USED IN THIS REPORT
A. Symbols
acfm Btu BC C
OC 1 -c
c.i. cfh cfm CMUPML
CYl d.f.h.a. Eta lc Eobs
/v
h.v. h.a. iph imp OK lb C/hr lb, #
mg n.a. n.d. % mm OR scfm
sq in T, Temp. t. i. V/v%, v/v% wo
actual cubic feet per minute British therma 1 unit a best controlled process ratio of the observed to the calculated organics emission .._
degrees centigrade (Celsius) effectiveness of dryer in conversion of orga nit material
catalytic incineration cubic feet per hour cubic feet per minute Carnegie Mellon University, Physical Measurements La bora tory
concentration in ppm cubic feet cylinder direct flame hot air dryer calculated organics emission (lb C/hr) observed organics emission (lb C/hr) equals approximately degrees Fahrenheit high velocity hot air dryer impressions per hour impression absolute temperature, degrees Kelvin= ‘C + 273.1 pound carbon per hour pound metal decorating plant, process or operation milligram information not available not detected percentage parts per million parts absolute temperature, degrees Rankine = oF + 460 standard cubic feet per minute at 600F and 29.92 inches of mercury (Hg)
square inches temperature thermal incineration volume to volume percentage web offset plant, process or operation
continued
Abbreviations and Terms Used in This Report continued
B. Terms
coated litho perfecting trace unc oa ted web 0.0000
coated paper used lithography printing both sides of a web a maximum of 10 ppm. lincoa ted paper used roll of paper to be printed less than one ppm; greater than n.d.
I
I

I .1 u - 1
t 9
INTRODUCTION
In order toconduct a systematic national investigation aimed at evaluating air pollution generated by the printing and metal decorating industry, GATF pro- posed, obtained and completed a Phase I emission study entitled “Evaluations of Emissions and Control Technologies in the Graphic Arts Industries, ” Contract No. CPA-22-69-72, with the National Air Pollution Control Administra- tion (NAPCA), CPE, Public Health Service, Department of Health, Education and Welfare. The contract, awarded April 28, 1969, culminated in a Final Report in August 1970. The report may be obtained for a nominal cost, from the National Technical Information Service under the publication number PB 195-770.
So as to provide a logical and uninterrupted extension of the work completed in Phase I, technical proposals covering Phase II were submitted early in 1970 to the Environmental Protection Agency. The original proposed technical program had to be reduced in several areas because of limited funds. The revised pro- posal was accepted and the Foundation awarded a cost reimbursement contract on January 4, 1971. The contract awarded consisted of a period of performance of twelve months encompassing a four-task project (Figure 1, Appendix B). Essentially the work to be performed in the various tasks was as follows:
Task 1 - Maintain Perspective and Awareness
Continue the study initiated in Phase I to provide the necessary information and background as to developments in related fields that can influence the course of Phase II and subsequent efforts.
The results will provide current awareness of new and revised air pollution legislation; modified and new sampling and analytical instrumentation (con- tinuous and automated techniques are of prime interest); changing and evolu- tionary raw material modifications (inclusive of new drying system) with the graphic arts industry and its suppliers; improved concepts in air pollution control equipment: availability and effectiveness in processes: and generally to gather information required for project planning and execution.
Task 2 - Familiarization with Field Testing Equipment
Perform measurements at local printing and metal decorating plants to provide field testing personnel with experience in source testing equipment. Mass flow rates based on stack dimensions and gas velocities, temperature and pressure measurement will be made. Sampling apparatus designed and de- veloped in Phase I will be used to obtain stack effluents which will be ana- lyzed according to procedures adopted as a result of Phase I investigations.
5
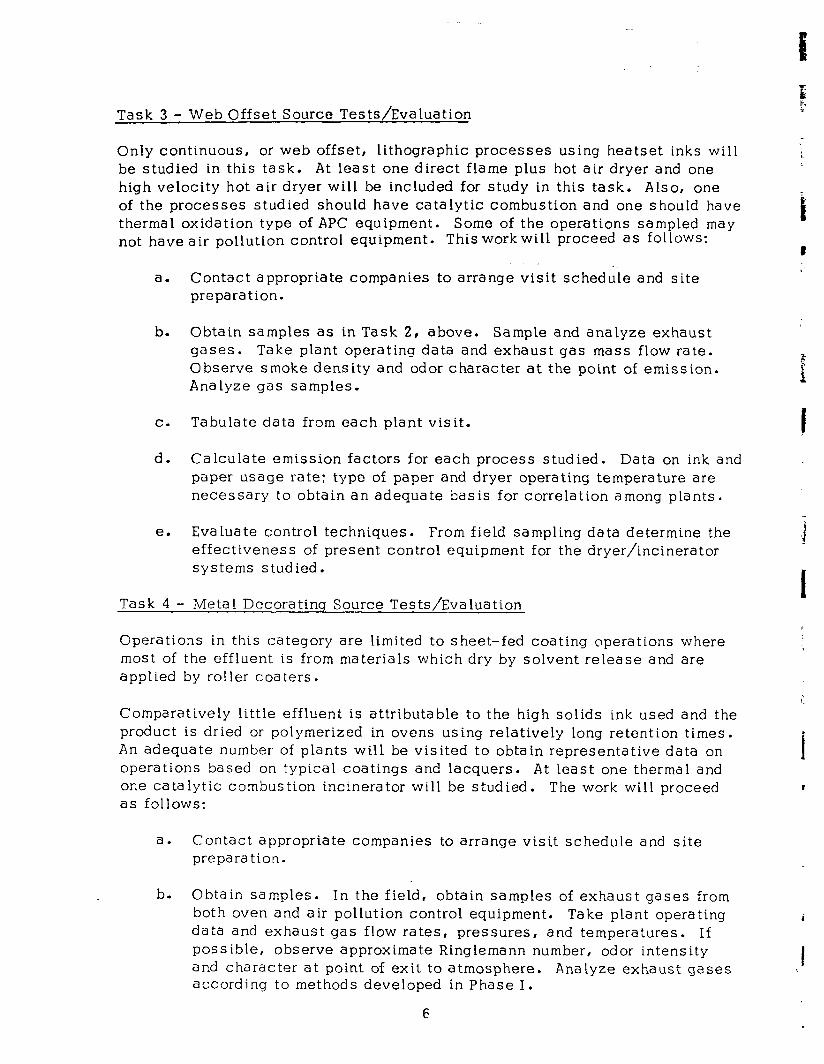
Task 3 - Web Offset Source Tests/Evaluation
Only continuous, or web offset, lithographic processes using heatset inks will be studied in this task. At least one direct flame plus hot air dryer and one high velocity hot air dryer will be included for study in this task. Also, one of the processes studied should have catalytic combustion and one should have thermal oxidation type of APC equipment. Some of the operations sampled may not have air pollution control eqUiPment* This work will proceed as follows:
_ a. Contact appropriate companies to arrange visit schedule and site
preparation.
b. Obtain samples as in Task 2, above. Sample and analyze exhaust gases. Take plant operating data and exhaust gas mass flow rate. Observe smoke density and odor character at the point of emission. Analyze gas samples.
c. Tabulate data from each plant visit.
d. Calculate emission factors for each process studied. Data on ink and paper usage rate: type of paper and dryer operating temperature are necessary to obtain an adequate basis for correlation among plants.
e. Eva lua te control techniques. From field sampling data determine the effectiveness of present control equipment for the dryer/incinerator systems studied.
Task 4 - Metal Decoratinq Source Tests/Evaluation
Operations in this category are limited to sheet-fed coating operations where most of the effluent is from materials which dry by solvent release and are applied by roller coa ters.
Comparatively little effluent is attributable to the high solids ink used and the product is dried or polymerized in ovens using relatively long retention times. An adequate number of plants will be visited to obtain representative data on operations based on typical coatings and lacquers. At least one thermal and one catalytic combustion incinerator will be studied. The work will proceed as follows:
a. Contact appropriate companies to arrange visit schedule and site prepara ti0.n.
b. Obtain samples. In the field, obtain samples of exhaust gases from both oven and air pollution control equipment. Take plant operating data and exhaust gas flow rates, pressures, and temperatures. If possible, observe approximate Ringlemann number, odor intensity and character at point of exit: to atmosphere. Analyze exhaust gases according to methods developed in Phase I.
e I
I
I
I

. . A:
* :.-:.- f.
c. Tabulate data from each plant visit.
d. Calculate emission factors using all the field sampling data: calculate emission factors for the various types of coatings tested.
e. Eva lua te control techniques. From field sampling data determine the effectiveness of present control equipment for the dryer/incinerator systems studied.
_. Phase II had two specified goals initially. The first was to acquire familiarity with the sampling and analytical techniques recommended in Phase I and then to characterize the emissions from the web offset and metal decorating opera- tions. These processes had been chosen because they possess the greatest potential for air pollution among the graphic arts processes. Neither appeared to be amenable to solvent recovery because the high temperatures in the dryer were likely to produce chemical modification of the solvents. The second ob- jective was to determine the effectiveness of air pollution control equipment presently installed on these printing operations, using the sampling and ana- lytical technique developed in Phase I and further refined in Phase II.
Contract Modifications
During the first six months of the contract, five modifications were made. In February the time was extended 30 days to allow for preparation of a draft of the final technical report (Modification No. 1).
As a result of problems encountered during the preliminary field testing of both the metal decorating and web offset processes performed under Task 2, some modifications were deemed necessary by the EPA project officer. These included laboratory tests on the sampling equipment to determine 1) what sampling pro- cedures should be followed to insure proper sampler operation and 2) the accu- racy of the analytical method being used. This additional effort (Modification No. 2) and commensurate financial support (Modification No. 3) were supplied accordingly.
Also during the period assigned for work under Task 2, EPA discussed with the - Foundation various aspects of the Clean Air Amendments of 1970. EPA is respon- sible for obtaining emission data from plants, using the best known control equipment, with the purpose of establishing standards of performance for new stationary sources. Since standards of performance for new sources may be required for the graphic arts industry, it was logical that some data be obtained under the current contract work which could be used for that purpose. Thus, the Foundation submitted a technical proposal to EPA for additionat work to be performed under the existing contract. As a result, Modifications Nos. 4 and 5 extended the existing contract to 15 months (inclusive of a final technical report) and created Task 5, “Source Testing of Best Controlled Processes.” The work to be completed in Task 5 is outlined as follows:
7

Task 5 - Source Testing of Best Controlled Processes
To further characterize the effectiveness of control equipment in both web off- set and meta 1 decorating operations, four additional sources shall be studied. (Here the work “source” means any combination of press, dryer and incinerator: hence, a single plant may contain several sources.) These sources shall include: 1) web offset press with thermal incineration: 2) web offset press with catalytic incineration; 3) metal decorating operation with thermal incinera- tion: 4) metal decorating operation with catalytic incineration.
Procedure . Contact appropriate companies to arrange visit schedule and site preparation. Obtain EPA agreement that the selected source is a “best” con- trolled process.
Obtain Samples. Take plant operating data prior to and during the test and measure exhaust gas flow rates, pressures and temperatures throughout the testing period. Obtain samples of exhaust gases prior to the inlet of the con- trol equipment and at the outlet. Analyze the exhaust gases according to the presently developed lmethod of analysis.
Tabulate Data from Each Source Test. Perform necessary calculations to pro- vide data that can be used to evaluate the control techniques being used.
Shown in Figure 2 (Appendix B) is the Phase II Air Pollution Program complete with contract modifications Nos. 1 through 5 as discussed previously in this section. Figure 2 (Appendix B) also depicts each task divided into specific sub-tasks. For administrative as well as cost purposes, Task 1 was to con- tinue for the duration of the contract while three months were allotted for “ask 2. Tasks 3 and 4 were allotted 4-l/2 months each, and Task 5 two months of project time. As indicated earlier, all task effort would be followed by preparation of the final report.
In the course of Task 2 work, problems occurred with the sampling and analytical work which could not be foreseen when time estimations were made for the work. Consequently, Modification No. 6 essentially provided for four additional con- tract months to satisfactorily complete this segment of the contract. As a result, Modification No. 6 extended the contract to 19 months from the effective date of the contract of January 4, 1971 to August 4, 1972 (inclusive of the prepara- tion time of a draft final technical report.) A final modification was made which extended the contract to 26 months and provided additional financial support (Modification No. 7). This was required because final reporting, reviewing and redrafting required longer than anticipated and the completion of all required work items entailed higher costs than planned.
i
I
I
. In sclmmary, the scope of researc h and technological activity as stated in Contract No. 68-02-0001 entitled “Evaluations of Emissions and Control Tech- nologies in the Graphic Arts Industry” represents a continuation of the efforts initiated in Phase I of a 1969 contract (NAPCA CPA 22-69-72). The Graphic
8
Arts Technical Foundation through cooperation and financial support of the Office of Air & Water Programs, Environmental Protection Agency, has utilized the accomplishments and results of the initial study to examine more closely two printing processes, namely web offset lithography which uses heatset inks and metal decorating which employs coatings, to measure emissions from these processes and determine the effectiveness of existing air pollution control sys terns.
With the program oriented toward those specific areas. in greatest need, and timed to provide the necessary data, the goals of Phase TI were: 1) con- tinued awareness of the legal and technical aspects of emission control to include continual survey of research disclosures in the literature and the screening of commercial developments in air pollution control equipment as well as materials modification such as innovations in ink systems: 2) a pre- liminary effort at obtaining samples of effluent from a metal decorating and web offset process in order to insure that the proposed sampling and analytical techniques are both suitable and reliable for obtaining data on the type of emission encountered with these processes: 3) the conduct of laboratory tests on the sampling apparatus as developed to insure reliability of the sampling method as well as the accuracy of the method of analysis: 4) on-site field sampling and analysis of emissi.ons from web offset and meta! decorating pro- cess conducted to the extent needed to characterize effluents with respect to processes and product, and within defined capabilities, the establishment of emission factors based on the process-material-product orientation as studied: 5) a determination of the efficiency of air pollution equipment installed on web offset and metal decorating processes according to the analysis of gases as they enter and leave the equipment: 6) the further characterization of the effec- tiveness of control equipment in both web offset and metal decorating opera- tions considered as best controlled processes.
9

1 PERSPECTIVE OF THE INDUSTRY
I The report submitted on the Phase I contract (1) presented an in-depth perspec- tive of the industry in the manufacturing community including its rank in value added to the Gross National Product, employment figures, distribution of estab- lishments according to geography, size and printing process(es) involved, dollar value of shi.pments and other similar data. No substantial changes have taken place in the interim and the statistics (primarily 1967 Census of Manu- factures) included in that report can still be considered valid representation. Accordingly, there is no need to present here a detailed discussion of the status of the printing industry in the manufacturing community. However, a few remarks are in order relative to the specifics of the contract here reported upon.
4
I
1
I
1
I
According to recent government statistics (2) commercial lithographic printing (SIC 2752) experienced a 9.9 percent annual growth throughout the 1960’s, exceeding that of all other printing and publishing activities. Approximately ten percent of magazines are printed by lithography, 75 to 80 percent of which is by the web-fed process. Ten years ago, only 60 percent of the magazines printed by offset lithography was done by web. The trend is expected to con- tinue, but letterpress continues to dominate in periodicals printing.
Lithography and letterpress (SIC 2751) continue to account for approximately 90 percent of the $9.2 billion commercial printing market, with lithography’s share steadily increasing, from 47 percent to an expected 53 percent for the five-year period 1967 to 1972. New York City, Chicago, Los Angeles and Philadelphia continue to be the major commercial printing production areas.
The total value of shipments of the entire printing and publishing industry (15 individual industries are included in SIC 27) is expected to reach $28 billion for 1972, representing approximately a 15 percent increase over 1969.
As reported earlier (1) metal decorating, classified by the U. S. Department L
iI__ of Commerce as a product of the metal can industry (SIC 3411), is considered by both printers and :metal decorators to be a segment of the printing industry. Its economic performance has followed earlier predictions with $4.3 billion
: 1
value of shipments realized for 1971 and $4.6 billion expected for 1972 (3). The metal can industry consists of over 100 companies operating approximately 300 plants, with the four largest compani.es accounting for 73 percent of the
I total can production. According to statistics taken from a recently published marketing guide to the packaging industries and published in the trade press (4), the sale of metal cans is expected to grow at an average annual rate of 6.6
d percent to 1980.
Tn addition to statistics, the status of the commercial printing industry and pro- jections for the next ten years are expressed in the recent remarks of one of the industry’s most respected consultants (5). “It will still be many years
11
before the industry will resolve itself into more professionally managed com- panies that recognize the value of research and education and are prepared to pay for them, and fewer job shops that cannot afford these services and have to depend on others to supply them.. l The primary changes will be in technology rather than the products.. . Materials will change also, with radiation sensitive inks dominating the litho field, and water-base inks and mircrowave dryers satisfying gravure’s needs for pollution-free printing.. . Pollution will not be as great a problem because by the time the printer makes the switch to web (offset, radiation sensitive inks will be in widespread use.. . commercial printers will gain the advantages of developments made for other printers without incurring the displeasure of civic groups and facing litigation from civil authorities. ”
Drioqraphy. A milestone in commercial lithography was reached in 1976 with the development of a new printing plate which imparts selective ink receptivity to the planographic (plate) surface without the use of water. Introduction of this new process does not affect the solvent-ink-emission problem: but it is now an established commercial process - in small to medium size runs - and properly deserves mention in the present status of the lithographic offset process. It is expected that, as the special inks suitable for the process are refined further, “driographycancommandan appreciable share of the plano- graphic printing market, which will represent the bulk of commercial printing in the next ten years” (5).
The Industry and the Clean Air Amendments of 1970. As implementation of the 1970 amendments to the Clean Air Act proceeded through 1971 and 1972, the entire industrial community became increasingly aware of and individually involved with the timely subject of responsibility for the quality of the en- vironment. The graphic arts industry is no exception. All 50 states are equally responsible for attaining the national ambient air quality standards established for six pollutants: sulfur oxides, particular matter, carbon mon- oxide, nitrogen oxides, photochemical oxidants and hydrocarbons. Although each state is equally liable, the severity of the problem is not equally dis- tributed. Accordingly, the extent and type of state (and ultimately local) activity required is determined by the quality of the air under existing circum- stances. As a result, restrictions placed on industry are governed by those pollutants and their concentrations in a given area. As steps are taken below the federal Level in order to accomplish the standards, emission sources become targets for control and involvement on an individual basis becomes a reality.
Each state was required to submit to the Environmental Protection Agency (EPA) its plan for accomplishing the standards that have been established. In order that plans submitted by the states would be likely to be approved in a minimum length of t.ime, EPA, in April 1971, published proposed regulations and guidelines for the states to follow in formulating their implementation plans.
12

1 1 .- During the period provided for consideration and public comment, a total of more than 400 interested parties - government agencies at all levels, citizen groups, commercial and industrial organizations - were heard from. Although the nature of complaints was diverse, the most general adverse criticism was embodied in the statement that the proposed regulations spelled out in the most minute detail the scope, limitations and provisions of state implementa- tion plans in conflict with the Clean Air Act and the intent of Congress that
“each state shall have the primary responsibility for assuring air quality within the entire geographic area comprising such state.. .‘I
1
After extensive evaluation of all considerations for revision, the final guide- lines promulgation took place in August 1971, six to eight weeks later than expected.
In the period from August 1971 to January 30, 1972 when all state plans were due, activity in and among the states was indicative of whatwould be required eventually of industry. Most states found it necessary to enact new legisla- tion, or at least modify regulations in existing legislation, so as to comply with the provisions of the Act. In the months that followed, during which EPA was reviewing plans ,, and since June 1 I when EPA made announcement of its initial approvals and disapprovals, administrative and legislative activity within state regulato’ry agencies and with the public has continued to be vigorous.
The net result of all the laws and regulations that n,ow exist throughout the country is that many segments of the graphic arts industry, as expected, will be extensively affected by restrictions imposed on hydrocarbon emissions from stationary sources. Other regulations will have little, if any, impact.
I The industry is highly concentrated in densely populated urban areas, where the incidence of Priority I (photochemical oxidants) areas of Air Quality Regions is greatest. Over half of a 11 commercial printing is performed in
1 I!linois, New York, Pennsylvania and California (1), each containing at least one such Priority I area. Major centers for printing and metal decorat- ing also are located in Ohio, Maryland, Indiana, Missouri and Wisconsin, -
I states with Priority I areas. Not all will be able to attain and maintain hydro-
-- carbon standards by control of mobile sources.
At present, hydrocarbon emission regulations are in effect, have been adopted or are in the process of being adopted for most of the important graphic arts centers: coastal areas of California, and some, if not a 11, of the Priority I areas of Ohio, Illinois, Indiana, Maryland, New York, Pennsylvania and Wisconsin. (Although not enacted by the state of Pennsylvania, Philadelphia’s Regulation V has the same effect on industry as state law applicable to a designated area of the state.) Connecticut, Kentucky, Yorth Carolina and Virginia regulations will affect many, although fewer, members of the industry. The effect of regulations in Arizona, Alabama, Louisiana and Cklahoma will be scattered and minimal.
13
Solid particulate does not pose a problem, but most printers, as most of all of industry, are affected by plume opacity being restricted to 20 percent or less nationwide; and the ubiquitous odor problem possibilities may plague many, irrespective of location.
Members of the graphic arts industries should experience little or no difficulty in complying with the standards for carbon monoxide, nitrogen oxides and sulfur oxides.
Carbon monoxide is not normally recognized or observed as a significant product (45-50 ppm) of controlled drying ovens or incineration equipment (6). However, a plant may be required to check for this contaminant infrequently or under cer- tain circumstances.
Nitrogen oxides emission may present a problem for some printing plants. The experience of the Foundation in evaluating emissions from thermal incineration equipment (included elsewhere in this report) indicated that a temperature of llOO”-1200°F was required to achieve an organic conversion efficiency of 95 percent. In both instances where the effluent in this temperature range was examined for nitrogen oxides, tests were positive, as measured by the length- of-stain method. With catalytic combustion, 95 percent conversion of organics was achieved at temperatures in the range of 7OOo-800°F and no nitrogen oxides were detected.
No equipment or process found in a printing or metal decorating plant at the present time is capable of emitting sulfur oxides, with the possible exception of the source of heat to the plant. This pollutant is not a potential process emission.
CONTROL THROUGH CHANGE
Whenever possible, a preferred control approach is to eliminate air contamina- tion by prevention rather than correction. Effort expended before the fact - preservation - can be more rewarding, if only esthetically, than that required after the fact - restoration. The latter implies that the manufacture of a salable commodity becomes the product of two distinct and diverse processes, where formerly only one direct procedure was required. It follows that ulti- ma tely, if not immediately, the value of an ounce of prevention being equal to a pound of cure will become an economic fact.
The printing process is amenable to the “prevention” approach, and appro- priately is being pursued. Both restoration and preservation measures are discussed in the three sections that follow.
I. 0 MATERIALS MODIFICATION
1.1 Innovative Ink Systems
Except for news ink which never really does dry (vehicle is absorbed by newsprint), inks traditionally dry by a combination of absorption of one or more components by the paper, chemical oxidation of unsaturated oils catalyzed by heavy metal salts of organic acids
14
(conventiona 1 for sheet-fed operations) and solvent removal by evapora- tion at slightly elevated or room temperatures. Although such inks do not dry for several hours, they set rapidly and, with the assistance of spray powders to protect the printed film, allow satisfactory over-printing through successive units as in multicolor work. However, they are not acceptable for high speed web operations in letterpress and offset. These relatively recent processes require an ink that will dry in a second or less. Heatset inks were developed to fill this need.
_ . -. Heatset inks contain varnishes made by solubilizing solid resins in high-boiling hydrocarbon solvents and are dried by rapidly removing the solvent as the paper web passes through a dryer at elevated tempera- tures sometimes as high as 400-SOOOF. Thus, the drying of heatset inks is a physical process rather than chemical, although some thermal degradation, principally of ink and paper components, does occur.
The use of these heatset inks makes possible the printing of webs effectively, but they also impose limits on high speed web operations. The practical length of dryers approaches a maximum and the use of lower-boiling solvents allows solvent evaporation at the press, result- ing in ink viscosity control problems.
These considerations furnished the incentive for the study of instantane- ous reactions to convert liquids to solids. For several years ink manu- facturers sought more economical means of printing with high-speed presses. To put solvent into an ink before printing and promptly remove it - by a costly process - was’ expedient, but not the answer (7). A typical conventional heatset ink such as is used for letterpress or offset printing may contain 35 to 45 percent of petroleum hydrocarbon solvent blends in the high boiling range of 450 to 550°F (230-29OoC) (8). When the imprinted ink film is heated in the press oven, the solvent 1s rapidly flashed off through the oven stack to the atmosphere.
Since late 1969, announcements have been forthcoming from printing ink manufacturers concerning the availability, subsequent field testing and commercial use of “innovative inks.” This designation may be used to include all the recent accomplishments in ink technology for high-speed printing by the web-fed processes, from the relatively simple reformulation to reduce or eliminate photochemica Ily reactive and odorous solvents, to the most sophisticated systems presently available commercially, those cured by ultraviolet light and completely solventless.
Emerging from the research and development stage at a time when pro- tection and restoration of our environment is of maximum concern, the new ink systems are designed to be consistent with restrictive legis- lation on emissions of solvents and other organic material from station- ary sources. Some inks that have been reformulated to eliminate odor
15
and certain solvents probably owe their existence primarily to the estab- lishment-of air quality‘standards. Highly refined deodorized solvents were developed some time ago for printing on materials for use on pack- aging for food products. Other inks, however, have resulted from long- term research conducted to improve several ink qualities, including drying characteristics, to be compatible with increased press speeds and a wide variety of papers and other substrates. Undoubtedly, atmos- pheric polluti.on problems furnished impetus to the research, but such considerations were not the initial motivating force.
a New inks that represent scientific and technological advancement beyond solvent reformulation of conventional heatset inks are empha- sized in the sections that follow. The thermally-cata!yzed single and two-component (heat-reactive) systems and the ultraviolet - sensitive (ph.oto-reactive) systems developed have progressed to commercial feasibility and installation in the United States, and are at presen.t receiving the maximum attention, consideration and publicity. (Some references to work abroad are included in the bibliography.‘)
Other innovative inks are dried by microwave, electron beam and radio frequency energy. These are not at present receiving commercial appli- cation consideration in this country.
1.11 Heat-reactive Inks
Thermally reactive catalyzed inks have become known as “thermoset” and “catalytic” inks, but more properly should be called “heat-reactive. ‘I I
Presumably, no confusion with heatset inks (which dry by solvent re- moval at elevated temperatures) has resulted.
Both single and two-component systems contain a prepolymer, a cross- linking resin and a catalyst. The catalyst becomes active when heated to a temperature of 3OO-350°F in the dryer and rapidly converts the liquid into a ,solid polymeric film via condensation polymerization reaction. The web is cooled as it passes over chill rollers to approxi- mately 9OoF (32OC). The reaction byproducts (lo-15 percent of that from a conventional system) are principally Cl-C4 alcohols, moisture, and in certain cases small amounts of formaldehyde, thus precluding condensate buildup in the dryer.. The overall volatile content of such inks is 20 percent or less of that of a conventional heatset ink, the smoking tendency is nil, and stack odor level is said to be reduced to a bout one-tenth of that from a conventional heatset ink (5, 7, 9).
Systems for web operations in both letterpress and offset have been developed because of the need for water insensitivity in the litho- graphic vehicle. In addition, since there is little liquid vaporizing during the reaction (ink. drying), the resultant films (printed solids)
a costly high-pressure UV lamp system (conventional dryers are useless). On existing sheet-fed equipment the available space for these installa- tions is lacking (or less than optimum) and physical interference between energy source and the imprinted sheet inhibits drying. The temperature rise of press components due to convective and radiation heating can limit the time the press is run continuously. Web-fed presses can utilize space where heaters currently are installed. A variation of UV- cure called UV-set has been developed for sheet-fed operations (see Section 1.22).
At present the drying efficiency of high pressure mercury vapor lamps drops gradually after about 1000 hours and so have a maximum life expectancy of 1500-2000 hours depending upon the ratio of time off to time on. Severa 1 lamps , costing about 7.5 cents per hour per lamp, are necessary for each press (13).
A recently published Foundation report (14) presented a model for analy- sis of the economic considerations in evaluating the installation of UV drying systems on both web and sheet-fed lithographic processes. Each judgmen.t must be made as an individual case.
Economic considerations (14, 15) comprise only a portion of the disad- vantages of the use of UV-cured inks. Hazards to the hea1t.h and safety of personnel also exist. Cperators must be protected from ultraviolet radiation, both direct and reflected, since either can damage the retina of the eye, and from ozone that is formed during warm-up periods by the action of ultraviolet light on oxygen. The need for retraining of opera- tors also is obvious.
Regardless of the sizable capital investment involved in order to use UV inks, as well as other considerations, the attitude of several ink manufacturers, is that these are the inks of the future and will dominate web offset for printing on coated papers before the end of the decade. Should such become reality, the heat-reactive inks would serve as in- terim inks until presses are equipped with UV energy sources. Cthers, however, feel. that the use of solventless inks (all species) represents, essentially, another way of printing and that progress will be evolu- tionary rather than revolutionary (16).
1.13 Other Radiation-cured Inks
As indicated earlier, innovative inks which are dried by microwave, electron beam1 and radio frequency are not at present receiving commer- cial application consideration, at least in this country. However, the ink industry is looking at all non-conventional drying methods. One major ink maker to date has claimed a limited measure of success in formulating a web offset ink for microwave drying (17). The company feels, however, that additional work must be done before these inks would be ready for commercial use. (Coatings for plywood and certain automobile bodies are being cured by the electron beam technique.)
19
The principles of these radiation curing systems are discussed briefly here.
Microwave. Microwaves are used industrially in such applications as evaporating solvents in the manufacture of pharmaceuticals, curing resins in foundry molds, cooking foods: and have been proposed for drying paper webs. In the United Kingdom (18), microwave drying captured the imagination of printers to the point that the principle be- came popular when discussing new ink drying and processing techniques. (However, at least one unit has been removed from a commercial plant where trials were made.)
Water and other polar liquids, (alcohols, ketones and esters are some) can be heated efficiently by microwaves. Polar solvents tend to become oriented in the direction of a magnetic fi.eld. AS energy is absorbed, the rapidly alternating field causes molecular motion gen- erating heat which volatilizes solvent, promotes oxidative drying, evaporation, etc. Specially formulated inks absorb most of the energy pass,ing through the imprinted paper, thus allowing not only efficient drying of the ink film, but also the paper to be little affected by the heat generated.
Although solvent-free systems for microwave drying are, to our knowl- edge, not available, much developmental work is reported to be in progress abroad, primarily in Europe and Japan (18, 19). Solvents which are vaporized suffer little or no degradation, and if adsorbed or otherwise trapped (and recovered, if desired) are not contamin- ated with products of partial oxidation. The temperature of the exit gases is much lower than from a gas-fired burner. The conserva- tion of one of our natural resources - natura 1 gas - is obvious.
As with other innovative inks, special formulations are necessary and equipment costs are very high (‘2 0). Maintenance must be performed by an operator skilled in microwave equipment. Metal substrates pre- sent a problem because they reflect the waves back to the applicator (energy source) and damage it. Microwaves are a potential health hazard should leakage occur. (The Department of HEW has issued a standard (21) limiting microwave radiation emission from cooking ovens.) Microwave drying is said to have its widest possible application at present in ‘gravure and flexography, and offers a means of using exten- sively water-base gravure inks on plastic substrates (22, 23). However, even some of those enthusiastic about these possibilities, anticipate that acceptance of such a system is some time away.
In lithography, microwave energy has been tried in high speed web printing and on sheet-fed carton board. The web offset trial, a tempor- ary installation in England at a newspaper plant, had limited success, partially attributed to the fact that “responsive” inks were not very well developed at that time (1907). Commercial trials in Europe with microwave units for drying ink on cartons (presumably by gravure)
3 I
I
I
20
-
.-~ I
have been sufficiently successful that several large European corIver- ters reportedly have installed such dryers (18). Microwave appears to have no application in web offset drying (23) principally i~ecausc the polar solvents are incompatible with the litho process.
Radio Frequency.. The principle of using radio frequency energy to heat and so dry or cure an ink film is essentially the same as that for microwave. Radio and television frequencies are adjacent to micro- wave on the electromagnetic spectrum. The difference is one of fre- quency range. Some researchers have stated that uti!ization of radio energy is more efficient than microwave (24), thus affording an advan- tage to drying by radio frequency. One pilot plant tria 1 with a water- base gravure ink and similar production conditions required twice as long to dry as with high velocity air heaters, but only one-tenth the energy (2 5). They advocated a combination of hot air and radio fre- quency for maximum efficiency.
Electron Beam (13). Energy in the form of a beam of electrons may be used to “dry” or “cure” an ink film. The reaction i.s one of free-radical polymerization with the electrons as the free-radical initiators to pro- mote crosslinking and so curing. The number of free radicals created is large and the reaction is rapid. The cure is effected at low (room) temperature and no solvents are required (the monomers are liquid). Because no catalytic agent is contained in the reaction mixture, the ink has a long shelf life and good press stability.
Flowever, there are many serious disadvantages and/or deficiencies to the use of this system for ink drying, some of which are the loss of tear and tensile strength of paper by the dosage required to cure exist- ing coatings, (and the need for development of new inks curable at an energy dosage not deleterious to paper. (?he effect on paper prompted one writer to say that the future of electron beam lies in the metal decorating field.) In addition, X-rays, generated when the beam strikes the tarlget, necessitate elaborate and expensive operator pro- tection, and printed waste cannot be recovered by traditional de-inking processes.
1.2 Research/Development/Commercialization
As mentioned in Section 1.1, ink manufacturers have been seeking to replace hea tset inks, or at least provide alternate methods of utiliz- ing the capabilities of the high-speed printing presses. The results of their resear’ch and development activity progressed to commercial availability of several heat-reactive catalytic inks (and limited use) during 1969 and 1970 (26-38). Success had been realized earlier with catalytic inks in the letterpress process, but the use of water in lithography precluded applicability of the initial ink systems interchangeably. At present, catalytic systems for web operations in both letterpress and offset lithography are available.
21

During the late months of 1970, announcements were made of field testing with the photo-reactive inks cured by ultraviolet light with projections for commercia1 installation during 1971 (39).
The use of ultraviolet light to dry ink is not new (12). As far back as 1944, several ink companies received patents on the concept, but results achieved on commercial equipment were poor and research programs were terminated. The original inks were composed of dry- ing oils such as tung and Linseed, and the mechanism for curing was by ozone absorption rather than rapid polymerization of the vehicle. UV radiation across an air gap produced ozone which dried the ink film in the same manner as conventional (oxidative drying) ink, except that the agent was ozone rather than oxygen. A more sophisticated approach (by a press manufacturer) in the late fifties also failed to reach commercialization. The present work, initiated in 1961, was motivated by the need to eliminate the solvents from ink and improve the over-all. efficiency and quality of printing. These goals could be achieved only by the development of radically new techniques.
Ink companies known to have developed and on the market heat-reactive and/or photo-reactive (UV) inks are identified below. Pertinent infor- mation and data included were furnished primarily directly from each c ompa ny , from notes in the trade press resulting from company news releases, or presentations by company representatives.
Additional companies were included in some of the early publicity as having developed heat-reactive inks. However, progress to the point of commercial availability and acceptance presumably has not been accomplished. Current comment in the trade press is that all ink com- panies are devoting a major portion of their effort to innovative inks and that most, if not all, will be marketing at least one type in the not too distant future.
1.2 1 Heat-reactive (Thermally-Catalyzed) Inks
Bowers Printing Ink Company introduced “Crystal-Aire” inks in 1969 after five years work (27, 28). Initial testing on production jobs took place in the Los Angeles area and presumably this ink is being used primarily in west coast areas.
Kohl E: Madden Printing Ink Corporation was one of four ink companies who “after extensive research” field tested their inks under con- trolled pressroom conditions at the Rochester Institute of Technology (40) in the early months of 1971. In June of 1971 (41) K & M announced very satisfactory results with .their CLEAN-AIR inks in four-color print- ing trials using normal procedures and existing equipment. Satisfactory de-inking of printed waste has also been accomplished (42) based on tests performed by an independent paper testing laboratory. To our knowledge commerical trials and use with the K & M inks have not been publicized.
22
A July 1971 trade publication (43) announced the availability of Inmont Corporation’s new low-solvent heat-reactive inks (XL-37) “designed to eliminate air polluting characteristics from printing ink solvents. ” The ink, is however, not catalytrc, but a low-solvent (28 to 32 percent) heatset ink that may be dried at 250-280°F (44). The solvent content is comprised of two “deodorized solvents which are exempt under Los Angeles Rule 66”. The XL-37 series, as well as a newer LTD (low- solvent low temperature) series (30 to 35 percent solvent and 200°F drying temperature), are said to offer advantages over a conventional heatset web offset ink (containing 40 to 45 percent solvent) including better gloss, outstanding resistance to scratch, rub and body oils, better drying, reduction or elimination of condensate in the dryer and 50 percent lower level of effluent. As recently as May, a representa- tive of the company said that it would be premature to discuss their experience in the area of the “high solids heat-reactive” systems they have developed, except to say that some serious drawbacks have been recognized (44). Inmont also conducted 1971 trials at Rochester Institute of Technology (RIT).
Richardson Ink. Company’s SOLIDstate inks were introduced in 1970 after five years of development work (38). There are single component catalytic (heat-reactive) inks for both web offset and web letterpress. SOLIDstate inks contain “no hydrocarbon oils or petroleum products”. Successful production runs were made at several large printing plants. High quality products were obtained using standard process colors, on both heatset letterpress and offset presses at speeds up to 1100 feet per minute. Shelf life is specified to be approximately 60 days. A late 1971 news release stated that this ink “produces a slight odor at the fountain, but is neither offensive nor harmful. . . enables the printer to meet new clean air regulations easily.. . if used exclusively, it is not necessary to install or operate costly afterburners to oxidize hydrocarbon emissions. There are absolutely no hydrocarbon air effluent pollutants in the formulation. ” Hydrocarbon emissions in stack tests were reported to be zero. Patents for these inks are pend- ing. A successful de-inking process involving only minor changes in the traditional method has also been publicized by Richardson (45). However, commercial acceptability of any modified de-inking procedure by paper mills is yet to come.
.-..
1 F. -.
1
Unfortunately there has been a tendency in the graphic arts industry to refer to all the various commercial heat-reactive catalyzed inks as “solid-state inks I’. This is improper reference, however, since SCLIDstate is the property of the Richardson Ink Company.
Roberts d Porter, Inc. introduced in 1970 (34) a “completely solvent- free, non-polluting heatset ink” for web offset usable with conventional drying ovens. No additional publicity has been noted but field tests in printing plants are known to have been performed in recent months.
23
.^- -, , ~
._. .., ,- -*
1 I I I - I 1 I I I
1.22
The press utilized was a five-unit one equipped with a direct-flame hot air dryer with its own exhaust, and the stack configuration was ideal for sampling. To eliminate one variable, paper from only one company was used, a 50-pound web offset type, 34 inches wide.
The three heat-reactive inks - A, B and C - contained 15, 10 and 0 percent volatiles, respectively. Ink D, conventional heatset, con- ta ined 35 to 40 percent volatiles.
Before any printing took place, samples were taken of the dryer at the operating temperature and then with paper only, running at 12, 000 im- pressions per hour through the dryer. No odor or visible emission was noted. The inks were run in the sequence: D, A, B, C, D.
Inks A and C were run for two to three hours, during which time no visible emission or odor was noted with either ink and the quality of product was judged acceptable by both plant and GATF personnel. An offensive plant odor (similar to aldehyde) was noticeable while Ink C was running and clean-up difficulty was experienced with C possibly because some reaction had occurred on the plates and in the ink founta ins. The possibility exists, however, that improper wash- up solvent was employed.
Ink B proved to be incompatible with the type of plate dampening system on the press and the quality of the printed product was unacceptable. The ink company representative said that this problem is soluble. However, samples were taken as with A and C during the one-hour run. No visible emission or odor was detectable.
The conventional ink (D) was run before and after the three others. Effluent samples were taken during both runs. A slight odor was de- tectable in the sampling area and a Ringlemann No. 3 was noted during a 12 to 18-minute press equilibration period. Thereafter, a Ringle- mann number approximately 1.5 was visible. The web temperature measured during the runs with Ink D was 280°F, and with Inks A, Band C the temperature ranged from 320 to 34O’F.
The general attitude of all personnel was one of optimism and enthusi- asm for a possible solution to the air pollution problem without sacri- ficing product quality, especially gloss. Also, as mentioned previously, the thermally-catalyzed heat-reactive inks require no equipment modi- fications as do the UV inks.
Photo-reactive (UV) Inks
Three ink companies have advanced at least to the stage of press trials with UV inks (7). Two are Sun Chemical and Tnmont. Sinclair .SJ Valen- tine may be the third, but this could not be confirmed.
25
f L
Patents issued to Sun in 1970 and 1971 (49-54) are the resuit of icr, years ’ research. During 1970, drying with ultraviolet energy VJas
demonstrated to a selected group of web printers at a press manufac-
turers’ Plant (17) and subsequently received controlled commercial exposure using six "SUnCUre" ink systems. The company also has
developed its own curing unit for drying Suncure inks (55, 56) said to be about 10 percent of the cost of a printing press (57).
Two large printing firms in the Midwest are known to have had this equipment installed in the past year (58-60), Jensen Printing, a sub- sidiary of Hol.dcn Industries, in Minneapolis and I.S. Berlin in Chicago. Sun anticipates having six to eight web offset installations completed by the end of 1972. Interestingly, only one-third of the installations to date have been based on the ability of the system to provide solu- tions to emission problems. Special film properties that the inks are capable of providing prompted the others. According to the executive officer of Sun Chemical, the Suncure drying system will afford no profit to the company for two years (61).
Initial reaction of the first few months of use at Jensen is generally cautiously enthusiastic (62-64), with the economics in long-range perspective undetermined, constant attention to employee safety must be unrelentinig and vigilant, and quality of product “commercially acceptable” rather than excellent. The latter necessarily affects Cus- tomer acceptance. Ink costs per pound are more expensive with mile- age not yet known: actual energy consumption and life of tubes in the energy source is undetermined: the extent of actual paper waste (which is not de-inkable) is not known but expected to be less: and press make-ready times, potentially reducible, have not yet been es- tablished as routine. I.S. Berlin has not issued any comments yet. This installation was made more recently.
In late 1971 the largest financial printing operation in the country, Bowne 5. Company of New York, announced the installation of a UV- ink curing system for a new web press. This drying unit was obtained from Thermogenics of New York, Inc. (68-70), but the ink supplier was not identified. It may have been Inmont.
According to a Bowne executive, had UV inks and the drying (curing) system not been available, the web press, although desperately needed, would not have been purchased because of their location (in New York City on the eleventh floor of a 17-story office building), the need for unusually large quantities of duct work, and costly after- burners requiring addit.ional fuei already in short supply. In addition, the company wished to avoid the possibility of production shutdown as during an air pollution emergency episode. Their economic health, they said, depends on rapid turnout and a high degree of efficiency, especially because of their liaison with the Securities and Exchange Commission in Washington.
26
1 1 I 1 1 3 ..- 4
1 ..I I P 1
J ‘9,
After several months’ use, Bowne spokesmen cited some of the eco- nomic advantages as: 1) savings in press costs since downtime is reduced for such purposes as washups or other interruptions, partially due to 2) ink stability which eliminates spraying ink rollers during shutdowns to avoid ink drying on rollers, with subsequent running of paper (causing waste) to render the rollers once more operable; 3) no change in properties of the paper web such as moisture content and thereby size and/or tensile: 4) reducing the number of web breaks caused by moisture loss or scorch: 5) the feasibility of running lighter weights of paper: and 6) elimination of many bindery problems caused by cracking along folds.
Among the disadvantages Bowne cited are the cost of UV inks, not necessarily justifiable unless faced with pollution control expendi- ture, the inability to print on polyurethane, the unavailability of UV- curable metallic inks, and the difficulty with de-inking of waste.
Except for the necessity to properly train operators, Thermogenics states that there is no physical danger involved with the UV drying system since‘ all the necessary safety consideration such as guards and interlocks are built into the system (68).
An estimate of comparable equipment costs (no energy) by Thermogenics for a one-web four-color press was $22,500 using ultraviolet energy and $73,500 using gas. The latter included dryer ($28,500), chill rolls ($17, OOO), cooling system/tower ($18,000) and afterburner ($20,000).
Inmont Corporation (formerly Interchemical Corp.) was issued its first patent for the drying of special inks by ultraviolet radiation in 1946 (39, 65) and patent applications have been filed on their new UV-curable ink compositions (66). The first web offset commercial installation was scheduled for 1971.
Inmont has developed two UV drying systems - UV-cure and UV-set (66). With the UV-cure system, printing is by the conventional manner and dried completely by exposure to ultraviolet light. The UV-set ink sys tern, developed for sheet-fed work, contains enough photopolymer in the mixture to polymerize the film to a tack-free print quickly by exposure to ultraviolet energy, and to later completely dry by oxidation. The principal advantage of the latter system is that the inks cost less than conventional inks, only five to ten percent more according to one source (67). However, the system requires more energy than the UV- cure sys tern.
Commercial application of UV curing of ink films on plastic containers has been mentioned briefly in the trade press (71). A demonstration at the AMA Packaging Exposition in April 1972 showed a dry offset press using multi-color UV-inks and UV-cure at speeds as high as
.I 27
*: ,
t . --i ;, 300 containers a minute. Dry offset is a variation of the letterpress P process that employs a letterpress plate, transfer of the.ink to a blanket mounted on an intermediate cylinder and thence to the substrate. :
1.3 Ink Reformulation ’ ‘,i -. ,’ I ,
The use of highly refined and deodorized solvents to reformulate heatset inks was inaugurated several years ago, primarily to improve the esthetic: qualities of the printed product. -More recently; refor- mulation to reduce the quantity of solvent is being studied, as ind ica ted previously by Inmont.
Many of the new state and local regulations (applicable in 1973 and later) restricting hydrocarbon emissions exempt, or ‘are less stringent toward, the use of materials containing no more than 20 percent of volatile organic solvents provided that no additional volatiles except water are present and that the volatile content is not photo- chemically reactive. Most of1 the heatset ink solvents are sufficiently low in aromatic and olefinic content to be classified as photochem- ica lly unreactive. Accordingly, resins or resin. combinations possess- ing increased solubility in these solvents would be desirable. The degree of success in this area throughout the ink industry is not known, but at least some ink manufacturers involved in this pursuit are optimismtic.
1.4 Miscellaneous Materials Modification
In 1971, the Lithium Corporation of America introduced a new liquid polybutadiene-alpha methylstyrene copolymer resin for solvent-free manufacture of printing inks and coatings (72). Trademarked as Lithene Y, the resin series, available in both low and high molecular weights eliminates the need for solvents because of their low vis- cosity as X00 percent solids. Publicity indicated that the materials would be marketed to manufacturers of coatings and intermediates . No information regarding use has been noted.
Recently, Richardson Ink Company announced the development of an ink system that eliminates the need for overprint lacquer when print- ing aluminum beverage cans (73). The inks, carrying the trademark Duraltim Mark V, have excellent mobility and reduce misting at the press, and produce a hard finish with high gloss. “Because they are 83 to 93 percenr solids there is less hydrocarbon effluent during printing, reducing air pollution. ” (Lacquer systems normally used in metal decorating contain 75 to 85 percent solvent.) No additional information is available at this writing, except that “Duralum is finding wide use in the beverage industry.”
28
I 1 I I I
I
1 1 1 !!I
In addition to the effort being expended by all facets of the industry to the effluent problems of the web printer and metal decorator, much attention is being directed toward the other major printing processes. Water-base inks, solventless inks and high gloss coatings which dry (or cure) at room temperature are the major areas of study.
. Although the study reported here pursued the problems of other pro- cesses, awareness of technological developments throughout the indus- try has been maintained and several pertinent references are included in the bibliography. , _ ’ . .
1.5 Trends
It is evident from the preceding paragraphs that a variety of possible options exist, in various stages of development, to pursue reduction of pollutants through the materials charged to process, principally the inks and coatings. In reality, each company or plant must make its own choice, and each evaluation must be made in relation to its locale, economic health of the plant (whether a single plant or multi-facility company), existing regulations and the likelihood for their becoming more restrictive, availability and cost of energy, and available invest- ment capital. The economics of the printing industry are such that printers can accept only modest increases in cost. It is unlikely that one approach more than another will characterize the industry’s decisions regarding control of air pollution during the next five years. A few generalizations can be made, but each will have exceptions, for management attitude is personal and cannot be assessed with any degree of predictability.
Small to medium-size companies generally will choose reformulation, if possible,where immediate action is necessary. New materials that will allow them to achieve compliance with a minimum of process pro- cedure change, at least initially, and the least economic effect on the status quo will be utilized.
For the most part, the large companies are the leaders in gaining accept- ance for innovations . And so it is they who become the pace-setters. The initiative of three large web offset printers was mentioned on page 26. Early in 1973, Continental Can Company, a major metal decorator announced the installation of the world’s first commercial system for UV curing of printing on metal. The new process is designed for lithographing Ion flat metal sheets used for three-piece cans, but is adaptable to two-piece cans. An annual capacity of six billion cans is expected to be realized by’the end of 1973, and more than half of their total capacity by 1975. Although the inks are more expensive, large ovens that used substantial quantities of natural gas are unneces- sary, and the length of the production line is reduced substantially. An executive officer of the company stated that the new system “will allow us to conserve 85 percent of our present energy requirements” (73a).
29
‘1
In addition to intra-corporate consid-erations, large companies also form the nucleus of industry-wide activity. Late in 1972, the Environ- menta 1 Conservation Board of the Graphic Communications Industries, Inc., composed of executives of major companies and associations, was established for a cooperative industry approach to help the several industry segments that face problems involving air and water pollution as well as in-plant safety and health.
While the organization was still incomplete, GATF organized an Ad Hoc Web Heatset Committee, and developed a cooperative program, with the evaluation of new inks and drying systems having highest priority. The first effort of this group is reported on pages 24 and 25. The tests are continuing. There is general agreement in the industry that bring- ing together, literally, all elements concerned in the process to the problem is expedient and mutually beneficial. Printers of all sizes are offering their facilities, dryer manufacturers their expertise, and paper and ink companies their supplies. All are furnishing personnel and time.
The autonomous group expects their effort will achieve not only compli- ance for our industry but hasten acceptance by printers of new pro- cedures. Part of the proposed activity of the parent Environmental Conservation Board is to sponsor research and development in areas not yet specified. The ink companies, of course, are continuing their corporate research and development. It follows that accomplishments and improvements within these companies will be made public at appropriate times in the conventional manner.
2.0 PROCESS MODIFICATION/CONTROL EQUIPMENT
In addition to the extensive investigation in modifying the inks to reduce or eliminate their potential for organic emissions, some pro- gress has been realized in process variation, mostly in the area of press speed and dryer operation, with and without control. Air flow rates in the dryer have been reduced in certain instances without sacri- ficing efficiency (74). The extent to which industry can eliminate the practice of emitting all the air from the web presses directly to the at- mosphere is being investigated. If higher organic loadings of the gas stream can be controlled satisfactorily so as to operate at a high per- centage of the LEL, cleaning the gas stream would be somewhat simpli- fied and a smaller portion of the overall gas flow could be emitted and a larger part recycled.
Additional considerations, experimentation and experiences are included in the following sections.
2.1 Incineration
Both catalytic and thermal incineration continue to be established and effi.cient means to convert solvents and fumes to carbon dioxide and water under properly controlled conditions. In fact, this route has been that followed by almost all of the heatset web printing and metal decorating plants which have installed emission control equipment. High capital investment, operating and maintenance costs have been offset partially by heat recovery. Designers and manufacturers are continually improving both dryer and afterburner equipment, so as to better serve industry’s needs. The following are examples.
A modular ink drying and emission control system has been developed (75-77) that may be installed as a unit or as separate components. The dryer is designed to fit all web presses and the afterburner can be used with existing dryers. (Mechanical features of the dryer per- mit conversion to UV-cure.) The system features a sinusoid wave web control that provides improved drying capability with stable web behavior at lower web temperatures. Heated air applied from alter- nately separated nozzles, above and below the web, causes the web to travel through the dryer in the sine wave pattern rather than a straight line. Drying efficiency is increased at lower temperatures through the complete range of ink coverages, web speeds and web weights. The afterburner may be placed directly on top of the dryer or at a remote location. _
Also in mid-1971, the “first one-piece high velocity dryer ever built” was announced (78) offering the advantages of compact size, fast and less costly installation and add-on capability. Other various features of the standard model were retained including sine wave
31
positioning, easy internal access, low exhaust rates and cool external surface temperature, among others. In 1972, the same company re- leased news of an afterburner and “element for odorless discharge with up to 951 percent hydrocarbon cleanup at exhaust temperatures as Low as 12OO’F” (79,80). No preheating is required and the equip- ment is “guaranteed to combust hydrocarbon material, fumes and odors to meet air pollution authority requirement. ” Applications specified for the unit include printing and metal decorating.
2.11 Energy S hortaqe
Much of the dryer and incineration technology and equipment refine- ments have been the result of limited fuel supplies as well as the traditional goal of efficient and economical operation.
Those who have investigated the use of incineration to control organic effluent are acutely aware that the shortage of natural gas is serious (81). Even the most casual reader of the daily newspaper knows of the fuel and power crisis, and the shortage becomes quite personal when the homebuilder is faced with the possibility of curtailment. Reams of paper have been filled with discussion of the subject, and 55 studies on the national energy crisis have been conducted in the past few years according to the federal Office of Science and Technol- %3Y* The Federal Power Commission (FPC) said that the U.S. gas industry reached a turning point in 1971 - the end of that industry’s growth period unhampered by supply considerations. The head of FPC’s natural gas bureau said that never again will there be enough gas to meet all demands. By 1990 the deficit will have increased by 17 trillion cubic feet. Ironically, efforts to a Lleviate the energy crisis by increasing capacities and sources for generating other forms of power, e.g., electricity, cause environmental problems, and it is to restore the environment that a portion of the additional fuel is needed. Unfortunately, but inevitably, the areas in greatest need of pollution control are the same areas where fuel and power needs, and shortages, for people and industry are also the greatest.
The dilemma of printing management attempting to comply by incinera- ting is obvious. Many areas of the country do not and will not have available the additional quantities of gas required. Afterburners have been adapted in some cases to utilize other fuels such as oil (which may pose additional problems) and liquefied petroleum gas (LPG) representing substantially higher fuel costs. Definite differ- ences of opinion exis t among members of the industry as to the utility of fuels other than gas. Manufacturers ’ representatives, however, have indicated that new types of burners are capable of utilizing fuel
32
oil and that the principal problem may be one of adequate supply with limited sulfur content. At least three installations using fuel oil are now operating with hydrocarbon reduction in the area of 98 percent, according to a representative of an incineration equipment manufacturer. The plants were not identified.
2.2 Carbon Adsorption
Adsorption of organic effluent has not been recommended for heatset ink systems because organic degradation products in the exhaust can render the carbon ineffective within a few cycles and are difficult to remove from the activated carbon when regenerated with steam. Also, the utility of the material recovered is questionable. Several years ago, charcoal adsorption was tried on a pilot plant scale in a metal decorating plant in Los Angeles (82). Because of the degradation products of resins and drying oils, as well as the complexity of sol- vents involved, the material recovered was so contaminated that, even after rat her sophisticated fractional distillation, the company’s quality control department would not recommend it even for wash-up purposes.
T-Towever, a web offset printer on the West Coast has adopted this approach for emission control. Since patent possibilities are being pursued, no details are available. To our knowledge, the adsorp- tion principle is not now being investigated for control in metal decor- ating .
2.3 Scrubbing
There has been no report, public or private, of an attempt to use scrubbing in t:he industry as the sole means to control air emissions from printing processes. Much discussion has taken place between companies and consultants of the possibility of effective perform- ance, but to our knowledge no one has been willing to assume the necessary risks involved. All the unknown quantities set forth in our first report (1) including that of possibly creating water pollution problems rema in unresolved. One instance is known where a Venturi- type scrubber was evaluated for a web offset installation with nega- tive results. Scrubbing (with a suitable liquid) is included as a possible means of control for organic solvent emissions in the litera- ture (83). However, it is acknowledged that if the solvent concen- tration in the gas stream is low and/or the solvent is not recoverable, scrubbing, as well as the alternate of condensation, may not be economically feasible.
Xowever, in olperations with allowable quantities of solvent emissions but faced with solving an odor problem, the use of potassium perman- ganate in an aqueous scrubbing medium, provides a possible solution to some odor problems.
33
A 1971 survey on air pollution research problems (84) cites odor control as a continuing difficult and complex problem, especially in the treatment of large volumes of air contaminated by traces of odor- causing organics.
The technical coordinating committee on particulates of the Air Poltu- tion Control Association recently published a report that represents the “best thinking of the Association” on wet scrubbing (85). The paper is not a state of the art report, but a guide with its main pur- pose “to provide information required for (a) the selection and speci- fication of equipment by the prospective suppliers, (b) the evaluation of competitive bids by the prospective user, and (c) the evaluation of equipment ,performance under actual operating conditions by both user and supplier. ” The applicability of the process as well as economic, environmental and engineering factors involved in selection are dis- cussed in detail. This report is recommended especially to any facility considering scrubbing as a means of control for liquid particu- late matter.
2.4 Ozone Treatment
Odor problems can exist where emission limitations of organic material are not exceeded or where such regulations do not exist, as inPriority III areas of Air Quality Regions. Odor and nuisance regulations have uniform applicability.
Ozone could have possible applicability in odor control in web offset emissions if two major problems were solved. Ozone will react with oxidizable organic material provided that an adequate concentration of ozone and adequate residence time, up to ten seconds, is allowed. The production of ozone is relatively economical and several compan- ies have commercially available systems to generate the gas. How- ever, ozone as a photochemical oxidant may not be emitted from the stack and the usual press and dryer systems have much shorter resi- dence times than ten seconds.
- Concerning the first problem, there is relatively little danger that ozone would be emitted since its lifetime at elevated temperatures is extremely limited, but the possibility would exist. However, the second problem would require that some provision be made for a longer holdup of the gas stream within the system if odor control were to be achieved, and the effect of ozone on the composition of materials used in the exhaust system would require investigation. To hold exhaust in the dryer for a longer period of time, as by recycl- ing, would cause some risk of maximum buildup of organic vapors in the air stream which is normally limited to a percentage of the LEL. New and serious problems become obvious.
I
i
I
I
34

At least two printers were reported to have tested the effectiveness of injecting ozone into the stack for odor control, but neither could be confirmed.
The Department of Health, Education and Welfare has recently pro- posed (86) limitations on the level of ozone that may be emitted from a device, either by design or as an incidental byproduct. Such a device will be considered adulterated and/or misbranded if “it is used or intended for use to produce and emit ozone into the atmos- phere and does not indicate in its labeling the maximum acceptable concentration of ozone which may be emitted (not to exceed 0.05 part per million by volume of air circulating through the device). . = and the smallest area in which such device can be used as not to produce an ozone accumulation in excess of 0.05 part per million. ‘I This proposed amendment to the Food, Drug and Cosmetics Act (now in the 60-day period allowed for comment) would affect the use of ozone as mentioned above, but probably not inhibit it. The quantity of ‘ozone (if any) in the effluent would have to be deter- mined, and possibly monitored.
2.5 Coating Process for Web Offset
Some experimental studies have been in progress for several months in the Midwest involving the use of a coater for applying a quick- drying coating to an oxidative-drying ink film in a high speed web operation. ‘Low concentrations of a polymeric ester (Eastman Chemi- cal’s Alcohol-Soluble Propionate) in 95 percent ethanol solution can be applied,as one example, with a flexo coater to protect the slow- drying (conventional) ink film from setoff (transfer) while the oxida- tive drying proceeds under the coating applied at speeds up to 1600 feet per minute. The protective film is dried in a warm (140-150°F) atmosphere Twith ethanol and water the only solvents evolved and emitted from the process. The company expected to have set up this summer a web press so equipped for an adequate commercial evaluation of a variety of ink, paper and coating combinations. Eventually, they will be willing to make the information generally available to the industry.
This approach would not, strictly speaking, eliminate “liquid organ- ic material” from a plant’s effluent. However, being a photochemi- tally unreactive low molecular weight aliphatic alcohol, vaporized below its boiling point, would seem to allow the emission and the process to require little or no control. In addition, the opportunity for visible emission and nuisance odor is virtually eliminated.
2.6 Electrostatic Precipitation
Electrostatic: precipitation for smoke control has been proposed for
35
i
at least one large plant in an “urban-suburban” location. The approach suggested is to inject an oil mist into the gas stream, before the pre- cipitator, to absorb organics from the gas stream. Although the parti- cles certainly would be collected with this type of system, the plant engineer beI.ieves that it undoubtedly would introduce some pre-cooling and premature precipitation in areas where this would be undesirable. It is doubtful that this approach will be pursued.
, _
i
36
3.0 INSTRUMENTATION AND CONTROL EQUIPMENT
Characterization, preservation and restoration of the atmosphere rely heavily on the technology afforded by instrumentation, in both the broad and narrow concepts of the word. Indeed, current technology is not yet sufficient to define all of today’s pollution problems, much less solve them. If it were sufficient, an unadulterated environment could be achieved entirely by moral and financial commitments.
It seems practical and expedient here to minimize discussion of this facet of the entire experience of the study and direct the reader to the references in the bibliography that comprise recent trends, atti- tudes and emerging technology.
Most industries have some problems in common, but as each investi- gates its own, many problems defined are peculiar to a given indus- try. Few are able to control emissions by duplicating procedures found suitable to others. Even the applicability of existing instru- ments - to measure and identify pollutants - cannot be predicted. Only after experimentation that defines accurately the problem, is the solution indicated and finally prescribed.
Some of the new developments in instrumentation and equipment for use of the printing industry in pursuit of its responsibility toward the environment have been included in the foregoing discussions. An economica 1 measurement system for hydrocarbon emissions cap- able of monitoring or making analyses on site would be a valuable contribution to the web printer and metal decorator.
Strictly defined standards are imposed and the degree of accuracy required in measurement is not available in all situations. A whole new market for instruments and equipment now exists, and so essen- tially a new industry is born, A $500 million figure has been projected as the probable size of the market in the period 1970-1980, for instru- mentation (86 a-86d). Sophisticated sensors, e.g., solid state, that have sensitivity, specificity and reliability are urgently needed.
Applications for patents on inventions which might curb environmen- tal abuses have been receiving priority treatment since early 1970. Processing of applications requires six to eight months rather than the usual average of three years.
Monitoring emissions is implicit, and in some cases explicit, as a means of air quality control. Recent (state and loca 1) regulations require continuous source monitoring while operating under a vari- ance. The states themselves must set up ambient air monitoring systems to comply with the Clean Air Amendments of 1970. However, governments and regulatory bodies have been monitoring, some for
37
many years, for data on which to base rules. Pennsylvania has in- stalled, and in partial operation, a $2.3 million air monitoring syste.m reputed to be the most efficient of any state. Continuous readings of one per minute from 17 remote units on levels of 13 parameters, including measurement of the six pollutants for which standards have been established, are transmitted to a central station. Since the system was financed primarily by EPA, the design is available to other state and local agencies.
Individual monitoring by companies of their sources has become necessary only recently to avoid citations. In source monitoring by individuals, one major obstacle, in addition to in-house trained per- sonnel, is the lack of instruments to measure (and record) econom- ically and accurately specific pollutants in the presence of known and unknown interfering substances. Much remains to be accom- plished in this area.
Partially because all these considerations represent considerable expenditure without definite utility, and partly because it is typical of American business enterprise, renting and leasing of instruments and equipment, as well as services, is becoming popular.
Various annual pollution control directories to products and services are being published. The December issue of the “Journal of the Air Pollution Control Association, a Fall issue (usually October) of “Environmental Science and Technology”, a publication of the American C hemica 1 Society, ” and the Deskbook Issue of “Chemical Engineering, “ published by McGraw-Hill are typical. In addition, the books, periodicals, monographs and conferences of the Instru- ment Society of America are valuable contributions to the subject.
The Environmental Protection Agency published reference methods and available instruments as appendices to the announcement of National Primary and Secondary Ambient Air Quality Standards in the Federal Register on April 30, 1971 (36, 8186). Each reference method de- - scribes a procedure for evaluating the ambient concentration of a pollutant. Appendix E, pertaining to hydrocarbons, includes a biblio- gra phy of severa 1 references. Instrumentation of severa 1 companies is cited: Eleckman, Bendix, Byron, Mine Safety, Monsanto, Union Carbide and Tracer.
38
4.0 SAMPLING AND ANALYSIS OF STACK EFFLUENT FOR GRAPHIC ARTS PROCESSES
4.1 Introduction
Originally in Phase I , air pollution control instrument manufacturers and printing and metal decorating companies with appreciable air pollution experience were contacted, and provided valuable practical information to aid in evaluating various methods of emission sampling equipment and analysis, and to develop procedures sufficiently accur- ate, reliable and simple to engage in subsequent project activity. Much field trip data were gathered from printers, metal decorators and suppliers to the industry, and represented background information for activity in sampling, analysis, measurement of emissions, and characterization of the industry’s air pollution problems.
To assist in accomplishing the objectives of the project, the service of the Physical Measurements Laboratory of Carnegie-Mellon University (C MUPML) was engaged. Their tasks were to review methods for measuring emissions and to make appropriate recommendations as to a method to be employed in printing press/metal decorating effluent measurements. Approximately seven methods of sampling and analy- sis of effluents from printing and metal decorating operations as well as those described in published literature were obtained from field trips. The information was forwarded to CMUPML personnel for their evaluation and use. Tables 1 and 2 (Appendix C) outline the various sampling and analysis techniques reviewed, and includes a summary of the salient features of each method used.
Upon review of these methods of sampling and analysis, CMUPML along with GATF, during the Phase I contract period, recommended methods using appropriate sampling and measuring equipment and acceptable analytical technique. Further work under Phase I en- tailed preliminary evaluations of various methods of sampling and analysis. It became increasingly apparent that before standards of control to govern pollutants were established, devices and procedures to measure these pollutants had to be developed.
Also under the Phase I contract, an overview of the industry’s air pollution problems was gained, and reliable methods for measuring emissions, both qualitatively and quantitatively, were evaluated. Information was collected on control equipment and on various pro- cess modifications that might serve to mitigate the quantity or char- acter of effluents. This Phase I study considered the various types of printing processes including metal decorating. The degree that the graphic arts industry was involved technically in pollution, the problem of defining materials, processes, and available emission control alternatives were explored along with development of a
39
I sampling and analytical procedure capable of measuring emissions from various graphic arts industry. ,
Following the Phase I contract commitments, a major task of Phase II was the development of a reliable source sampling and analytical method that could preferably be universally applied. To this end printers and metal decorators were asked to contribute the use of their physical resources. Certain plants were selected because they were ideal sampling locations, and they were requested to assist in GATF’s air pollution activities. The long-range objective was to use a method of measuring emissions explored in Phase I to Characterize effluents with respect to 6rocess and product, and then to establish a basis for reasonably predicting the types and quantities of emissions according to process and throughputs.
The effectiveness of air pollution control equipment presently in use were determined by emission measurements. Analytical procedures developed in the Phase I effort were applied in Phase II to determine the capability of control techniques for existing equipment and for evaluating new control processes, material modifications, and equip- ment. ilere tod, GATF industry members presently utilizing air pollu- tion control equipment, as revealed by a recent survey and various field visitations, were
4.1.1 Samplinq
It should be noted that
requested t.o permit field sampling.
two sampling principles, grab and continuous as well as modifications thereof, have been generally used in graphic arts processes. A “grab sample” is a sample taken at a particular time within a very short defined time interval. A “continuous sample” is a sample taken from an effluent stream over a relatively long period of time. Grab sampling techniques can be modified to take a continuous sample within a restricted time period by the utilization of a device to indicate and regulate the sampling flow rate.
After reviewing various sampling methods and taking into consideration that the pollution in graphic arts processes is gaseous in nature, gener- ally steady in output over time intervals, and can be usually found rela- tively uniform in distribution across some particular location of a stack’s cross section, and that flow velocity, dependent upon exhaust fan opera- tion, is normally steady, it was decided that a sampling technique appro- priate to the study would be a modified “grab” method by which a true representation of pollutant concentration should be obtainable. There is seldom a sampling situation, in the graphic arts industry, in which a steady and uniform process variable (e.g. pollutant concentration, pollutant exhaust flow rate, etc.) location cannot be found.
A common collection technique used in grab sampling, shown diagra- matically in Figure 3, (Appendix B) is the use of evacuated con- tainers of glass or metal. A sampling train designed for specific situations encountered in the various printing processes includes a
40
probe inserted into the duct, a cold trap that functions to colle:! the condensible portion of the sampie, heating tape on the probe to main- tain its temperature above the dew point of the gas stream being sampled, and a precision needle valve to provide a repeatab!e sampling rate. When this valve is opened, sample is admitted to the evacuated cylinder over a definite time interval.
Upon review of established and field-tested grab sampling techniques, a prototype field sampling apparatus was assembled by personnel of the Physical Measurement Laboratory of Carnegie Mellon University and field-tested by GATF. The apparatus (schematically shown in Figure 4 (Appendix B) and photographically shown in Figure 5 (Appen- dix B) consists of a 300-ml stainless steel cylinder with a threaded opening at both ends. A vacuum gage is attached to the lower open- ing when held in a verticat position. The upper opening connects to a union, a needle valve, a second union, and a fabricated double- tee fitting connected to the U-shaped trap. After the trap, another union is used to attach the sample probe. When the trap is detached, each end is capped with a fitting before removing from the dry ice bath. Both trap and probe are l/8” stainless steel tubing, and the probe length chosen was two feet. This length could be changed de- pending on stack width and sampling location. The trap was 14 inches long with approximately 12 inches immersed in the dry ice trap.
The volume of gas sample needed for analysis depended primarily on the sensitivity of the analytical method used, and the concentrations of given components in the gas stream. This last consideration was also the basis for selection of particular sampling equipment and analytical methods to be employed.
Two factors were considered in selecting the dimensions of the gas sampler:
1. Since the trap and probe initially contains normal air which is swept into the cylinder during sampling, a correction factor must be applied to determine the actual sample volume.
2. All of the condensibles must be injected at once into the chromatograph for analysis; consequently, the size of the cylinder must be such as to insure collection of an appro- priate quantity of condensible material.
A 300-ml sample cylinder and.1/8” O.D., 38” long (probe and trap), 24-gage tubing necessitated a correction for air of only 2.5 percent to the cylinder volume. Assuming a maximum concentration of con- densibles on the order of 1000 ppm, the trap could contain a bout 1 mg of sample for injection into the chromatograph.
41
:. -.
are substantially smoother, have exceptionally high scratch and rub resistance, and very little solubility in greases and skin oils. An attractive feature of these inks is that they can be used with existing equipment - presses and dryers, ink fountains and trains.
However, because heat is required for drying, these inks cannot be used on sheet-fed presses, the heat required tends to dry the paper more than is desirable, and the properties of the ink which impart high scratch and rub resistance also make repulping of the printed waste paper more difficult. Other objectionable properties of some of these inks are in-plant odor (the reaction mixtures are unpleasantly odiferous), two-component systems must be mixed before use and unused mixed ink is not recoverable after completion of a press run. The latter could increase costs substantially. Informally it has been reported that heat- reactive inks have caused problems with static electricity in the fold- ing operation. This phenomenon has been explained, at least partially, by the fact that some of these inks are melamine-formaldehyde sys- tems which are good dielectrics and that charges build up readily on the surface during web transport.
These disadvantages coupled with the principal one of price (35 to 80 percent more than heatset) may delay their wide acceptance. However, an ink company spokesman estimated that a printer using 250 thousand pounds of ink per year and forced to install incineration equipment would effectively increase the cost of his conventional heatset ink to 97 percent of that of heat-reactive ink. Also, when these inks become a large-volume production item, the price may drop somewhat. The president of a major ink company marketing heat-reactive inks stated (10):
“Our assessment of the market generally indicates these inks will not receive printers’ acceptance until such time as the printing business finds a level of equity in the competitive requirements of effluent control related to economics within a given competitive situation. This is not unusual as this same type of condition seems to exist in many other area industries. ”
1.12 Photo-reactive Inks
Photo-reactive ink systems utilize ultraviolet radiation to initiate a free-radical polymerizat!on which is accomplished in one second or less. The novel vehicles involved consist minimally of one or more monomers and a photo-sensitizer which selectively absorbs energy in the wave- length region of 2400 to 3600 angstroms. These inks have become known as UV-inks.
Uniike the heat-reactive (thermally catalyzed) systems, most of which contain limited amounts of solvent, no solvents are contained in the UV-reactive mixture. Also, there are no byproducts since the reaction
17
is addition (rather than condensation) polymerization. The system is reported to be simple to operate and easy to maintain (11). Since the reaction is cool (120 to 125OF, ca. SO’C), a minimum of moisture is lost from from the paper. Paper handling problems caused by .brittle- ness are thus reduced. The low reaction temperature may allow chill rolls to be eliminated. Chill rolls are now an integral part of web presses using conventiona 1 heatset or hea t-reactive inks. However, chill rolls commonly serve to not only cool the web but also to help pull the web through the press, and removal would depend on press manufacturer determination. In addition, a printer has indicated that the need for chill rolls depends on the temperature at which given resins (ink films) no longer are tacky. Tests have indicated that sub- stantially all of the lamp energy is absorbed by the system, with approximately 2.5 percent to the web.
Since the UV inks do not react until exposed to the energy sourcer they may be allowed to remain in the fountains and on the rollers for long periods of time. ho washup is necessary between runs or after web breaks. They are equally applicable to letterpress and offset, sheet- fed and web.
UV inks offer several advantages that are specific to sheet-fed lithog- raphy. An ink film that dries instantaneously precludes the possibility of “setoff”, the unintentional transfer of ink to adjacent sheets before the ink has dried completely. With the possibility for setoff eliminated, there is no need to use “anti-setoff sprays”, powders that are applied to protect an ink film that is “set” but not “dry”. The use of these dry powder sprays can cause an in-pl.ant dust nuisance. Also eliminated with the use of UV inks in sheet-fed work is the annoying necessity at times to “ventilate” stacks of printed sheets as the oxidative drying process continues. of severa 1 hours.
Conventional inks dry by oxidation over a period The process of ventilating the stacks by riffling the
sheets is ca lied “winding” by printers.
The attractive features of the UV-cured ink film are similar to the heat- cured - smooth, resistant to scratch and rub, etc. De-inking of printed waste is not possible using conventional commercial procedures. Much effort is being directed toward providing a process for waste paper recoveryI essential in the traditional economy of the industry.
Trrespective of the advantages, real and potential, some disadvantages exist that must, at present, be considered serious deterrents to their being used extensively soon (‘12, 13).
7’hese inks can be as much as 75 or 100 percent more expensive than conventional heatset inks and the press itself must be equipped with
18

4.12
Several modifications were possible with this sampling equipment. The trap length could be increased from 14 to 24 inches or longer if the tubing was further coiled, and column packing or a glasswool plug could be added to the trap which, due to the increased surface area provided, could help catch condensible material. Provisions could also easily be made to plug both ends of the probe after samp- ling if condensible material was being collected in the probe.
Ana lys is
Once a sample has been obtained, it must be analyzed either on-site at the field location or in a laboratory. Pollutant identity and con- centration is vital to the establishment of the nature and extent of air pollution problems and the effectiveness of control techniques being used. Assuming valid samples are obtained and proper analy- tical procedures employed, the analytical results become the vital link in the measurement-evaluation cycle.
Several analytical methods having potential appl.icability in the graphic arts industry were reviewed in the final report for Phase I. Two techniques were particularly sui.ted to the objectives of Phase II.
Figure 6 (Appendix B) is a schematic diagram of the Cal-Colonial Chemsolve chromatographic flame ionization technique. If a sample had been collected into a container without a cold trap in the samp- ling train, it is first separated by means of a cold trap into con- densible and non-condensible portions. Each portion is then oxidized to carbon dioxide (C02) and subsequently reduced to met ha ne (CH4). Therefore, the only organic introduced into the detector is methane, a fact which insures linearity of response. Results are reportable in parts per million methane, carbon monox- ide (CO), carbon dioxide and total carbon.
An alternate method (Los Angeles APCD) is schematically shown in Figure 7 (Appendix B). Here, both condensible and non-condensible portions of the sample are catalytically oxidized to CO2 and de- tected by infrared analysis . The results are similar to those*out- lined in the Cal-Colonial analytical method.
It had been noted in the Phase I final report that the Cal-Colonial method has three features which commended its use in the Phase II study. First, the scale of the sample size is compatible with con- ventional gas chromatographic components: second, the hydrogen flame detector is not flow dependent as is the non-dispersive infrared detector: and third, the prior reduction of all sample com- ponents to methane could provide a true carbon content analysis.
42
-._--I.. ._ -
It was found, however, expedient to develop a somewhat mod if ied analytical method involving the simultaneous use of a thermal con- ductivity and a hydrogen flame detector. With this technique, two injections are needed for cylinder content analysis (non-condensibles). Trap condensibles are analyzed separately using a flame ionization detector. One aliquot from the cylinder is separated on a 58 sieve and detected by thermal conductivity. The other aliquot from the cylinder is resolved ona PoropakQcolumn, and the effluent is passed through both a thermal conductivity and hydrogen flame detector. Carbon dioxide and carbon monoxide are determined by thermal con- ductivity, and the organics by flame ionization.
The major accomplishment of the Phase II work, again, was the ulti- mate development of a simple and reliable field-tested, EPA-approved method of sampling and analysis of emissions from graphic arts pro- cesses and control equipment. Also, research activity was conducted with the purpose of defining problems, and provided a consistent means of evaluating the effectiveness of the different types of pollu- tion control measures utilized by the graphic arts industry. Activity in this area was an integral part of the Phase II contract work.
4.2 Sampling and Analytical Technique
4.21 Summary
Early development of the sampling and analyticat procedures to be used in the study of organic emissions were previously discussed. Subsequent field experience dictated certain modifications in sampler design and sampling technique sufficient to bring the method within acceptable limits of accuracy and precision.
As field work progressed during the months of January through April, 19 71, it became apparent that the prototype integrated grab sampler designed in Phase I (Figures 4 and 5, Appendix B) lacked the efficiency necessary to condense and retain organics in the l/8” diameter stainless steel trap. A sizeable percentage of organics was being swept into the cylinder where it could not be detected using the analytical techniques of CMUPML. Over a four-month period (January through April 1971) the following modifications were evolved to insure that all condensibles would be caught in the l/8” stainless steel trap tube.
1. The probe and trap were combined into a single, easily handled unit, and the trap was lengthened to provide a longer low temperature path for the sample.
2. Glass wool was inserted in the trap just prior to the cylinder
I 43
I
in order to prevent the loss of any condensible organics that may not have condensed or been captured in the trap.
3. The dry ice was replaced by a slurry of dry ice and trichloro- ethylene to promote more effective cooling.
4. A 20-minute sampling period, using an initial flow rate of 20 cc/min, was selected as being optimum to adequately cool and catch sample in the trap.
A schematic representation of the modified sampling apparatus with material components is shown in Figure 8 (Appendix B). The final integrated grab sampler which was used during Phase II on commer- cial printing plants is schematically shown in Figure 9 (Appendix B) along with all material component parts.
In the analytical procedure, by virtue of the collection process described above, the organic portions of the samples are divided spontaneously into non-condensibles and condensibles. Conden- sibles are collected in the l/8” diameter stainless steel probe-trap assembly.
I
Non-condensibles are contained in the cylinder and are analyzed by a modified Perkin-Elmer Gas Chromatograph, using two separate injections. One aliquot is passed through a 5A molecular sieve. The packed column effects separation of oxygen, nitrogen, methane (CH4) and carbon monoxide. Concentrations of CO are determined using thermal conductivity. Another aliquot is eluted with helium through a Poropak Q column, a thermal conductivity detector, and a hydrogen flame detector. Methane is first determined with the hydrogen flame detector activated, then (C02) is measured by thermal conductivity. Immediately after elution of the CO2 peak, column flow through the Poropak Q column is reversed, and the organics content is determined by flame ionization.
The high CO2 content characteristic of samples taken downstream from an afterburner required the use of a reduced size aliquot in a separate analysis. Normal dryer samples do not require the use of this reduced size aliquot in a separate analysis.
The trap, which contains the condensibles, is immersed in dry ice and connected through Swagelok fittings to an Aerograph G .C. equipped with a flame ionization detector. No column is used. The trap sample is allowed to warm to room temperature and vaporize at a rate which permits controlled attenuation of the electrometer signal. After the low- boiling organics have been measured, the trap is heated to 250°C at a controlled rate to vaporize high-boiling materials. An integrator with d igita 1 output is used to determine peak area.
44
- . - - - “,,^-l-__-l.. - - . . . . - . .--_ _ . - - . -.l-l_ -____,_
4.22 Summary of Stack Gas Sampler Desiqn Considerations
The stack gas sampler was originally patterned from a design of the Los Angeles Air Pollution Control District (APCD) (87). The unit illustrated in Figure 9 (Appendix B) can be considered a modified grap sampler, and consists of a stack probe, a dry ice-trichloroethylene refrigerated trap,. and an evacuable cylinder with a valve between the trap and cylinder. The valve should be of good quality in order to maintain the high vacuum in the cylinder during transport from the laboratory to the sampling site and the sample in the cylinder when returning back to the laboratory. It should also be sufficiently sensi- tive to permit time-averaging of the sample over a 15-20 minute interva 1. A low cost Bourdon vacuum gage attached to the cylinder is helpful in controlling the sampling rate.
The size of the cylinder is dictated by the method which is used for the analysis of the trap sample. It is not practical to take aliquots of the trap sample, and thus its quantity is limited by the capacity of the analyzer. A cylinder of 300 ml capacity was selected for our use because the average range of organic compounds likely to be encountered for analysis is 10-10, 000 ppm (88). As hydrocarbonsthis corresponds to about (O.Ol-lOmg)/300 ml of sample, which is a con- venient range for introduction into a gas chromatograph.
As a further consideration, the internal volume of the sampler between the end of the probe and the valve of the cylinder should be as small as convenient. At the start of the test it will be filled with atmos- pheric air which is swept into the cylinder as a diluent of the sample. For the present sampler, assuming an approximate average trap-probe length of 60 inches, the air dilution in the cylinder is estimated to be 12 ml or 4 percent of the nominal volume, and is not included in any concentration calculations.
4.23 Stack Gas Sampler (Figure 9, Appendix B)
,Cylinders. The basic member is a stainless steel Whitey cylinder, HDF4-300-304, with a nominal capacity of 300 ml. The lower end of the cylinder is fitted with a 2-l/2 inch Bourdon vacuum gauge, and a sensitive needle valve is mounted in the upper end. The side of the valve is fitted for attachment of the trap with the latter extending horizontally.
Since the interior volume of the sample cylinder must be known, each individual cylinder is calibrated using helium or nitrogen in a precision gas manipulating system.
Traps . The first devices which were constructed for condensing !higher boiling components from stack gases consisted of two parts:
45
E a double loop of stainless steel tubing (14 inches long) approximately 12 inches of which was immersed in the refrigerant, and a straight variable length of tubing (length dependent on stack dimensions) which entered the stack. The two pieces were joined by a silver soldered coupling. This design was then changed to a single piece of tubing having the same conformation as the two-piece assembly but without the coupling. The contents of the two-piece probe-trap required two analyses, since during sampling the silver soldered coupling and adjacent probe acted as a cold spot area which condensed high-boiling compounds. By simply combining the two pieces, the analytical effort was reduced by one-half and the elimination of the silver soldered coupling reduced significantly the error caused by this type of fitting. Generally, the redesign of the trap as a single piece construction proved to be very successful , and is easier to manipulate in the field.
The traps are constructed from a l/8” O.D., 25-gauge 304 stainless steel tubing. At 3-l/2 inches from the cylinder end of the tubing, three flattened loops each 5-l/2 inches deep and l-3/4 inches wide are formed by bending the tubing. The loops extend below the hori- zontal run of the tubing. The remaining 24 inches of tubing, except for a small semi-loop (see 3, Figure 9), formed to prevent contact of the Swagelok cap and slurry, continues the horizontal line from the cylinder and functions as the stack probe.
The result is a triple U-shaped loop centered 4-l/2 inches from the point of attachment to the cylinder, with a probe 20-24 inches long for insertion through the stack wall.
A small length of glass fiber is inserted into the cylinder end of the tubing to retain aerosols. Both ends of the traps are fitted with seals which prevent loss of sample during transport.
4.24 Samptinq Procedure
A. Fully evacuate the cylinders of the sampling units before trans- porting to the sampling site. Check for leaks.
B. Locate a sampling site that is as free as possible from distortion or non- uniformity of flow. Normally, the sampling site should be at least eight stack diameters downstream from any bend, expansion, contraction or visible flame in the stack or flue, and at least two diameters upstream from any bend and/or obstruction (89).
E P /:
I
I
C. Perform velocity and temperature traverses to determine gas flow rate and temperature variation across the stack at the sampling site. [If flow or temperature at this site is uniform (Less than 10 percent variation) then proceed: if not, locate new samplingsite.]
46
D.
E.
F.
G.
H.
I.
T*
K.
Check aga in for possible cylinder leaks. Prepare sampler for testing by removing all packing plugs (Swagelok cap body hex and Swagelok male connector nut-hex) and attach probe-trap assembly to cylinder.
Place trap in steel glass-lined Dewar flask and surround with slurry of crushed dry ice and tricholoroethylene. Caution should be exercised so that no packing caps (Swagelok cap nut hex) contact the slurry in the flask.
Insert probe into stack, locating probe tip at center of stack. Seal space around the probe with asbestos tape or other suit- able material. If duplicate testing is being performed, locate samplers at a go-degree angle to each other.
Open needle valve to approximate an initial flow rate of 20 cc/min.
Employ a 20-minute sampling period or sampling period of not less than 15 minutes unless otherwise restricted. Note sample interruptions, if any. In the event of process difficul- ties, shut sampler off immediately and resume sampling once process is on stream.
At completion of sampling period, close needle valve securely and withdraw probe. Plug both ends of probe-trap assemblytightly, making sure again that no packing caps or plugs contact the slurry in the Dewar flask.
Secure probe-trap assembly by tape or other means to sample cylinder for transportation to laboratory for analysis.
Repeat procedure for additional samples.
4.25 Total Sample Volume
The contents of both the cylinder sample and trap sample must be quantitatively related to the total volume of gas which constitutes the sample.. The latter volume will vary with prevailing temperature and barometric pressure at the time the sample is taken. The geo- metric volume of each sample cylinder is known since it is measured before the cylinder is placed into service.
The chromatograph used for the gas phase analyses is equipped with a sample injection system in which the sample is introduced into an evacuated space equipped with a pressure gauge. The volume of the connection to the cylinder valve is variable.
47
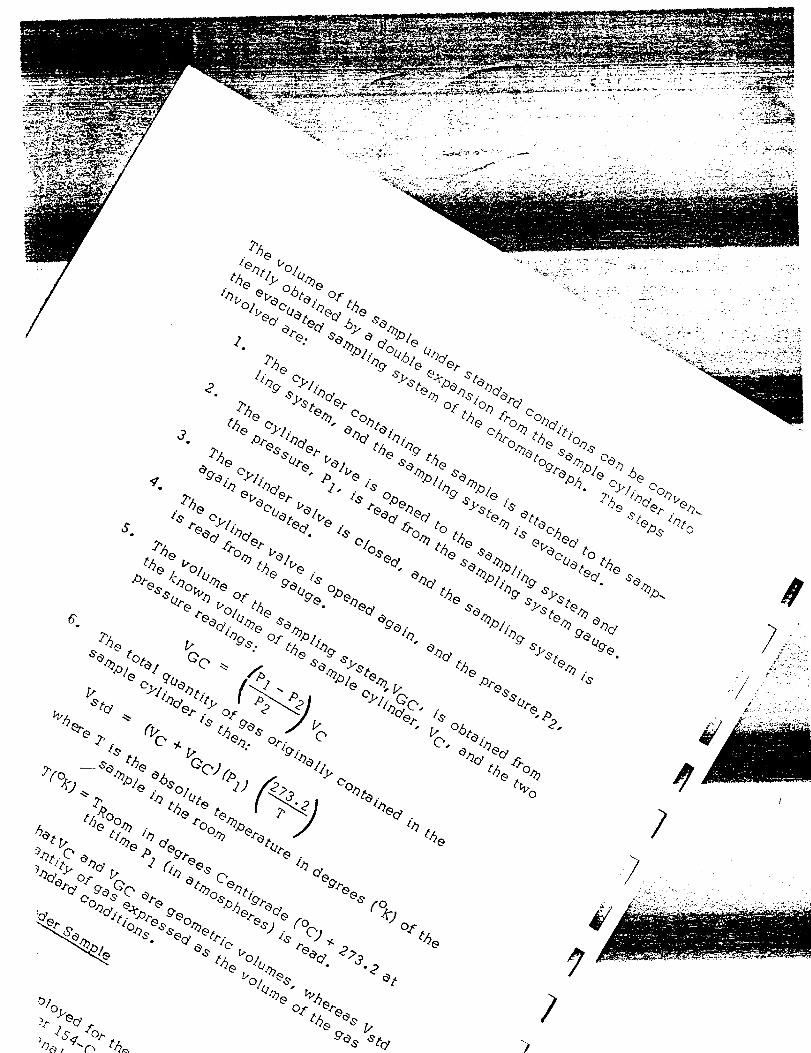
/
The carrier gas system is manifolded to permit rapid change from helium to argon (the latter is necessary for samples containing hydrogen). The inlet pressure is controlled by a sensitive pressure reducing valve. The absolute flow rate is controlled by a regulator (Moore, Model 63BU-L) referenced by an up- stream adjustable impedance (Foxboro). A flow impedance (laboratory constructed) with a by-pass valve is employed to damp the small flow oscillations induced by the regulators.
Within the instrument, the carrier gas flows first through the reference side of the thermal conductivity detector and then through the sampling valve (shown in the sample injection posi- tion). From the sampling valve, the carrier gas passes to two valves either of which can route the carrier through an attached chromatographic column. The second column position includes a third valve which may be used to reverse the carrier flow direction. Yrom the outlet of the second column position, the carrier gas flows through the sample detection side of the thermal conductivity detector. Finally, from this point, it flows to a hydrogen flame detector. The latter also requires hydrogen and compressed air service.
Introduction of a sample begins ,with the valve plunger in the position alternate to that in the drawing (i.e., moved to the right) . The two carrier gas lines are then directly connected within a single “compartment” of the valve and the sample inlet line, pressure gauge (the valve to the pressure gauge is normally open), sample loop and vacuum line (the valve to the vacuum pump is normally closed) are interconnected. The sample holder is attached, and the vacuum valve is opened until the gauge indicates full pump-down. The vacuum valve is closed. Sample is introduced under the control of the valve on the sample holder.
The sample is injected by moving the six-port valve to the left position (as shown in Figure 10, Appendix B). The carrier gas thereupon sweeps the sample into the chromatograph.
The volume of the sample loop and the two associated valve compartments have been calibrated (a group of sample loops with effective volumes from 0.250 to 5.000 cc is available).
Since the geometric volume, pressure and temperature (ambient) of the sample are known, the volume of the sample under stan- dard conditions can be calculated.
After the sample has been injected into the carrier gas, it is swept through whichever column has been valved into the flow
pattern. The components of the sample elute from the column, separated according to specific retardations that the column effects.
The column effluent next passes through the sample side of the I thermal conductivity detector (Perkin-Elmer No. 154-1009). This detector employs thermistors as the sensing elements. It has been mounted in a very stable thermostat-held at 32’C. At this temperature the sensitivity is excellent (circa 2 x lo4 mv-ml/mg).
Power for the thermal conductivity bridge circuit is provided by a Video Instruments Company, Inc. voltage regulated supply Model SR-200 EM to which has been added an external LC filter.
The thermistors of the thermal conductivity detector are two legs of a simple, conventional bridge which includes balancing potentiometers.
The signal from the thermal conductivity detector is fed to an Infotronics Model GRS-llAB/HS Integrator with digital output. From the integrator, the signal is returned to a Leeds and Northrup 1 mv full scale recorder with a binary attenuator.
After passing through the TC detector, the carrier gas and sample components are led through a surge-damping valve to a Perkin- Elmer Model 154-0410 hydrogen flame ionization detector. The signal from this detector is conducted first to its electrometer, then to the Infotronics integrator and finally to the recorder.
In general, the print-out of the integrator is used for quantita- tive analyses. The recorder trace is used primarily to follow the course of the analyses while they are in progress.
B. Cylinder Contents -
The cylinder contains the components of the stack gas which at their particular partial pressures are not condensed at dry ice temperature. These include the nitrogen, oxygen, argon and trace gases of the atmosphere, carbon monoxide (CO), carbon dioxide (C02) and methane. It will also contain vapors of organic compounds which were not condensed by the cold trap.
The Los Angeles APCD requires analysis for the carbon monoxide, carbon dioxide, methane and “organics” which are present in the cylinder gas.
50
C. Ana lyt ica 1 Procedure
When earlier work was done, the least satisfactory of the pro- cedures developed for analyzing stack gas samples was for the organics in the cylinder samples. The analysis requires a revers- al of the direction in which the carrier gas flows through the chromatographic column. If the reversal is omitted there can be no assurance that detection is complete.. However, intolerable base- line displacements frequently occurred when the column in use was reversed. A satisfactory analysis was achieved by a change in column geometry. The 19-l/2 feet x l/4 inch column packed with Poropak Q which is specified in the Los Angeles APCD procedure (87) was shortened to 6 feet. This was possible since the determination of carbon monoxide (CO) is now being made in the laboratory by a separate injection on a 5 Angstrom unit (8) molecular sieve column. Reversal of the shorter Poropa k Q column induces a base-line disturbance which is acceptable.
For the analysis of the cylinder sample, two columns are mounted on the chromatograph. At position No. 1, a 4 feet x l/4 inch stainless steel column packed with 19.7 g. 40/50 mesh 58 molecular sieve adjusted to 3 w/w percent water content is attached. At position No. 2, a 6 feet x l/4 inch stainless steel column containing 14 g. 80/100 mesh Poropak Q which has been degassed under vacuum at 160°C is attached. Both columns are opera ted at ambient temperature.
The separation on the Poropak Q column is carried out first. This column is valved into the carrier gas flow with the molecu- lar sieve column by-passed. The sample which remains in the 4 ml sample loop after the determination of total sample volume (see section 4.25 on “Total Sample Volume”) is injected into the chromatograph. With the hydrogen flame detector activated, the methane peak is the first to be detected and integrated. This peak is incompletely separated from CO but the latter elicits no response from the flame detector.
Detection is then shifted to the thermal conductivity detector for the elution of the CO2 peak. For samples taken downstream from an afterburner, which contain high CO2 content, a separate analysis is made using a smaller sample.
The direction of carrier gas flow through the Poropak Q column is reversed immediately after the CO2 has eluted,and detection is shifted back to the hydrogen flame detector. This configura- tion is maintained throughout the elution of “organics” and until the recorder has returned to base-line.
51
-
CO is measured by a separate analysis in which the molecular sieve column is valved into the carrier flow path and the Poropak Q column is by-passed. The CO is detected with the thermal conductivity detector.
Calibration of the hydrogen flame detector is made with methane and of the thermal conductivity detector with CO and CO2 respec- tively. .
4.27 Analysis of the Trap’Sample
A. Instrumentation
The measurement of the trap contents is executed with an Aero- graph Model 204-1B gas chromatograph with an Infotronics Model CRS- 11 AB/HS integrator interfaced between the electro- meter and the recorder. This instrument provides a greater dynamic range of operation plus added convenience in accommo- dating trap length than a chromatograph originally used in GATF’s study.
Only one of the dual hydrogen flame detectors is used for the analyses (there is no column “bleed” which requires balancing). The trap is mounted external to the oven of the chromatograph. A short length of l/8 inch stainless steel tubing is connected at the normal inlet to the detector and, by appropriate bending, brought out of the oven to one side. The short horizontal run of the trap is attached to it with a tubing union. Helium at 20 ml/min from the flow control system of the chromatograph is introduced at the end of the long horizontal run of the trap by means of 0.070 inch 0-D. Teflon tubing.
The trap is heated by low voltage-high amperage current passed directly through the l/8 inch stainless steel tubing from which the trap is constructed. The current is supplied from a 0.55 kw 110:17 stepdown transformer which is powered from a 2 kva variable autotransformer.
B. Analytical Procedure
The procedure for an analysis starts with immersion of the coiled section of the trap in dry ice-trichloroethylene until the sample is fully condensed. Without withdrawing the trap from the refrigerant, the two caps are removed from the trap and it is “spliced” into the helium flow pattern. The temperature of the trap is then increased step-wise, first by exchange of the dry ice for ordinary ice and then by raising the electrical power
52
input. The rate of vaporization must not exceed a linear detec- tion rate.
For calibration of the detector, 10 microliters (~1) of n-heptane is placed in a trap and frozen with dry ice. It is injected into the chromatograph in the same manner as a sample except that the trap temperature is not raised above -16’C (initially O’C, see Addendum, PML71-40 and 72-229, Appendix F). The delivery from the syringe has been tested gravimetrically and is better than+ 2 percent. The 10 microliter injection of n-heptane is equivalent to 10.65 ml CO2. The integrated output from the hydrogen flame detector is about 35, 000 Kilo counts/ml equiva- lent C02=
C. Trap Contents
In reporting the trap analyses, an arbitrary distinction is made between “low boilers” and “high boilers”. The “low boilers” consist of the total integrated signal obtained while the trap temperature is allowed to rise to ambient temperature (refriger- ated in dry ice first, followed by ordinary icerand finally warmed to ambient temperature) . The “high boilers” consist of the total integrated signal obtained during the electrical heating of the trap above ambient to approximately 250°C.
4.28 Cylinder and Probe-Trap Maintenance
A method for cleaning and general maintenance of the GATF stack samples prior to re-use is as follows:
A. Cylinders 1. Evacuate cylinders on a high vacuum system. 2. Flush cylinders with three volumes of dry air. 3. Heat cylinders with a hot air gun (Heat-B10 Model 750X)
while flushing with three volumes of dry air. 4. Evacuate cylinders until a maximum pressure of 0.1 micron
is obtained in the vacuum system manifold. 5. Close the needle valves of the cylinders. 6. Record the readings of the cylinder vacuum gauge readings. 7. Compare the vacuum gauge readings after 48 hours with
the recorded readings to determine if leakage is occurring.
B. Stack Probe-Trap (or probes) 1. Rinse the probes with 50 ml of perchloroethylene in a venti-
lated hood. 2. Pass nitrogen through the probes at the rate of 70 ml/min
until dry.
53
3.
4.
Continue the nitrogen flow, and heat the probes by passing a low voltage-high amperage current (other heating methods can be used) directly through them, increasing the voltage to yield, approximately, 80°C temperature rise increments within at least ten minute time intervals until a final tempera- ture of 250°C is reached. Rinse the probe’s body hex capping sections three times with perchloroethylene in a ventilated hood, and then dry at 12oOc.
Cylinder leakage usually occurs at threaded connections or from scored needle valves. A “Comco” teflon pipe thread seal (available from Commercial Plastics, 2022 Chateau Street, Pittsburgh, Pa. 15233, $1.65 per l/2 in x 540 in roll) has been found very effective in eliminating thread connection leaks. Other commercially avail- able thread sealing means (i.e., silver solder, etc.) can also be used.
The probe’s end-seals (Swagelok caps) must be inspected after each use. Due to over tightening of the probe’s Swagelok caps, “crimping” or “necking” of the l/8 inch stainless steel probe tubing directly ahead or under the front ferrule of the Swagelok cap, or stretching and splitting of the Swagelok cap’s body hex may occur,and leakage of probe-trap contents during or after sampling can result.
Another organic solvent, depending upon the stack probed and material sampled, may be substituted in the probe-trap rinsing process. If available, ultrasonic cleaning of the probe-trap can also be used.
The cleaned sampler units, probe-traps and cylinders, should be subjected to periodic instrumental analysis to check for possible contamination. The frequency of analysis would, of course, depend upon the total sampling time involvement, sampling environment, and material sampled. In our studies, sampling units are checked every fourth or fifth cleaning.
The stack probes and cylinders are always identified by a numbered tag, and a service record for each sampler unit component part is ma inta ined.
4.29 Cost Analysis
Representative cost data for both the GATF sampling equipment and analytical time and instrumentation are presented in this section. i A sampler unit (or “unit”) is defined here as a sampler cylinder with fittings plus the probe-trap assembly. Where possible, equipment 1 suppliers are indicated.
54
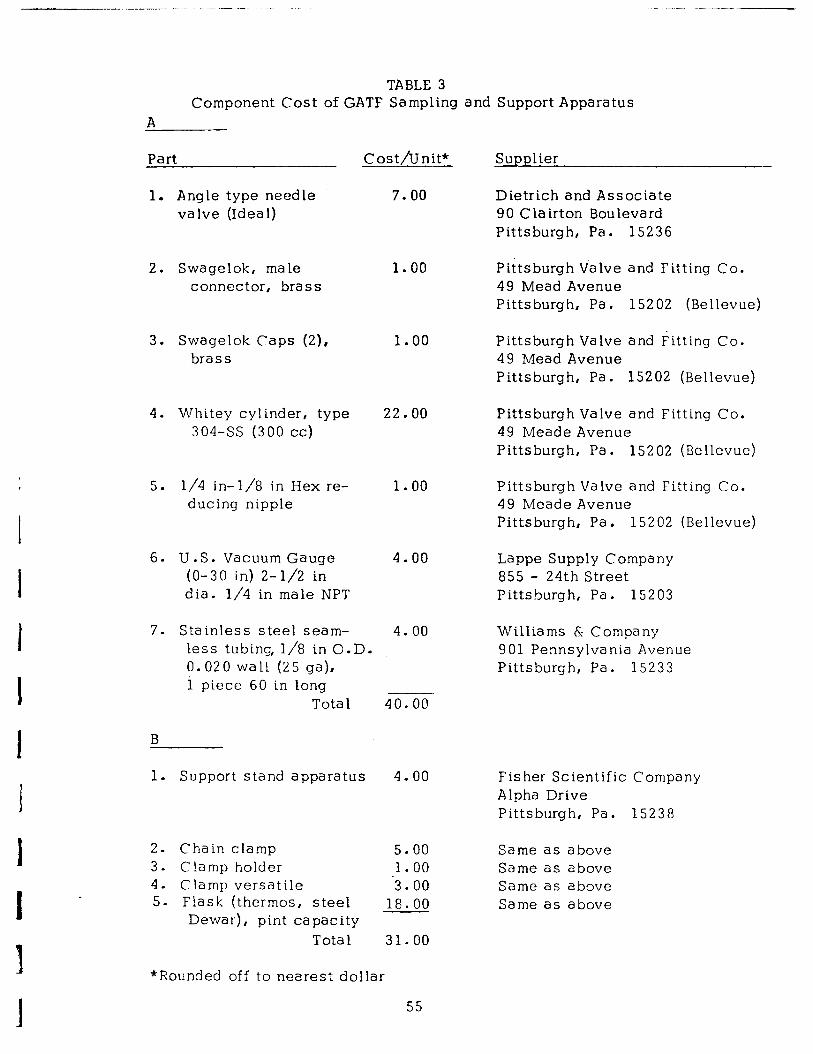
TABLE 3 Component Cost of GATF Sampling and Support Apparatus
A
Part Cost/Unit* Supplier
1. Angle type needle valve (Idea 1)
7.00 Dietrich and Associate 90 Clairton Boulevard Pittsburgh, Pa. 15236
2. Swagelok, male connector, brass
1.00
3. Swagelok Caps (2), brass
1.00
4. Whitey cylinder, type 304-ss (300 cc)
5. l/4 in- l/8 in Hex re- ducing nipple
6. U.S. Vacuum Gauge (O-30 in) 2-l/2 in dia. l/4 in male NPT
7. Stainless steel seam- less tubing, l/8 in 0.D 0.020 wall (25 ga), 1 piece 60 in long
Tota 1
B
1. Support stand apparatus 4.00
2. Chain clamp 3. Clamp holder 4. Clamp versatile 5. Flask (thermos, steel
Dewar), pint capacity Total
.
40.00
5.00 Same as above 1.00 Same as above
-3.00 Same as above 18.00 Same as above
31.00
*Rounded off to nearest dollar
22.00
1.00
4.00
4.00
55
Pittsburgh Valve and Fitting Co. 49 Mead Avenue Pittsburgh, Pa. 15202 (Bellevue)
Pittsburgh Valve and Fitting Co. 49 Mead Avenue Pittsburgh, Pa. 15202 (Bellevue)
Pittsburgh Valve and Fitting Co. 49 Meade Avenue Pittsburgh, Pa. 15202 (Bellevue)
Pittsburgh Valve and Fitting Co. 49 Meade Avenue Pittsburgh, Pa. 15202 (Bellevue)
Lappe Supply Company 855 - 24th Street Pittsburgh, Pa. 15203
Williams & Company 901 Pennsylvania Avenue Pittsburgh, Pa. 15233
Fisher Scientific Company Alpha Drive Pittsburgh, Pa. 15238
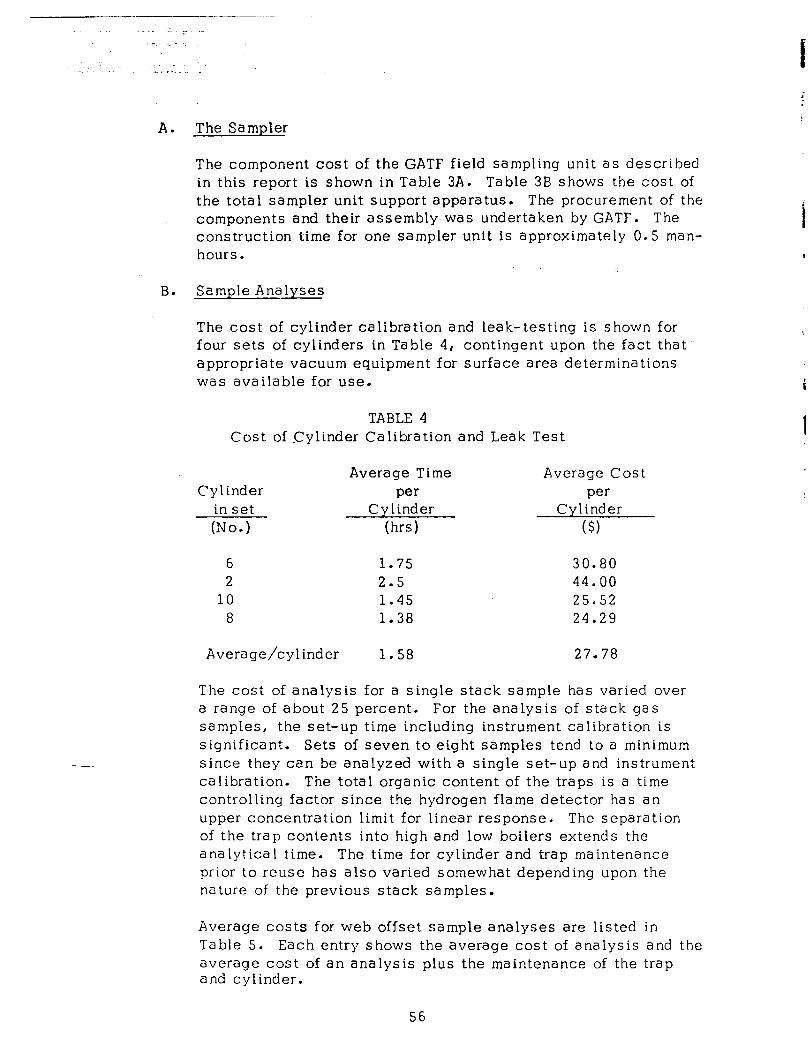
A. The Sampler
B. Sample Analyses
-
The component cost of the GATF field sampling unit as described in this report is shown in Table 3A. Table 3B shows the cost of the total sampler unit support apparatus. The procurement of the components and their assembly was undertaken by GATF. The construction time for one sampler unit is approximately 0.5 man- hours.
The cost of cylinder calibration and leak-testing is shown for four sets of cylinders in Table 4, contingent upon the fact that. appropriate vacuum equipment for surface area determinations was available for use.
TABLE 4 Cost of Cylinder Calibration and Leak Test
Cylinder in set (No=)
Average Time Average Cost per per
Cylinder Cylinder (hr.4 ($1
6 1.75 30.80 2 2.5 44.00
10 1.45 25.52 8 1.38 24.29
Average/cylinder 1.58 27.78
The cost of analysis for a single stack sample has varied over a range of about 25 percent. For the analysis of stack gas samples, the set-up time including instrument calibration is significant. Sets of seven to eight samples tend to a minimum since they can be analyzed with a single set-up and instrument ca 1 ibration. The total organic content of the traps is a time controlling factor since the hydrogen flame detector has an upper concentration limit for linear response. The separation of the trap contents into high and low boilers extends the analytical time. The time for cylinder and trap maintenance prior to reuse has also varied somewhat depending upon the nature of the previous stack samples.
Average costs for web offset sample analyses are listed in Table 5. Each entry shows the average cost of analysis and the average cost of an analysis plus the maintenance of the trap and cylinder.
56
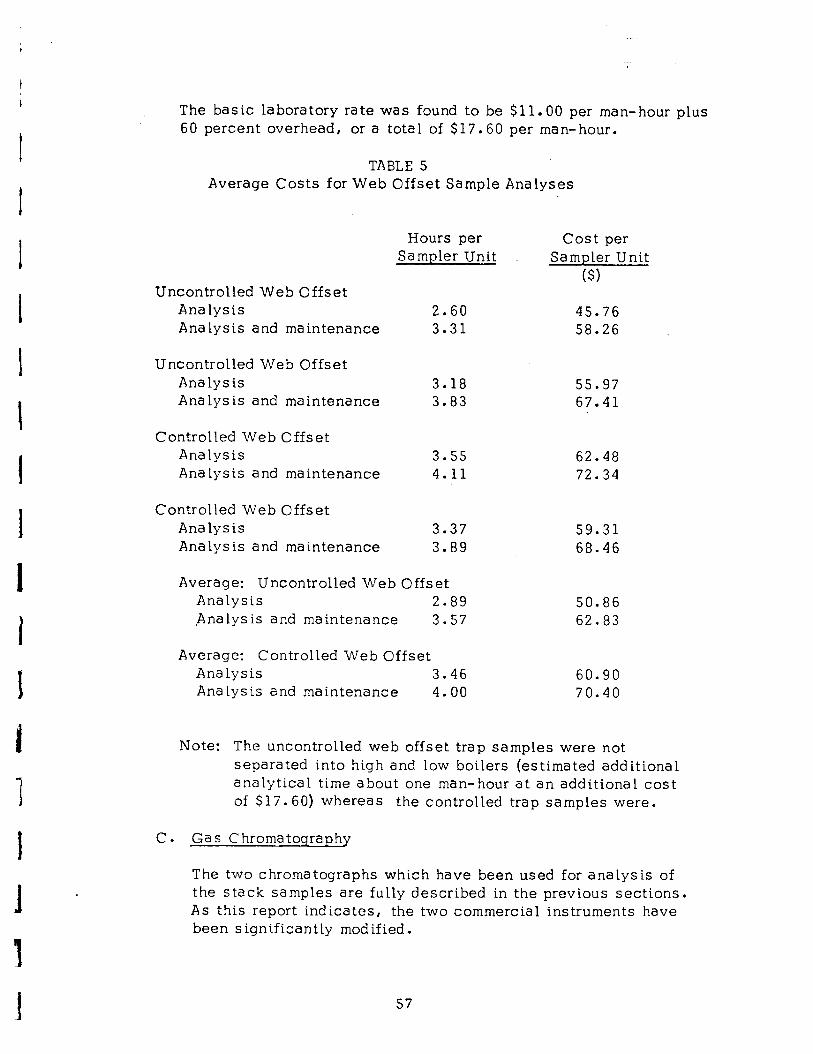
The basic laboratory rate was found to be $11.00 per man-hour plus 6 0 percent overhead, or a total of $17.60 per man-hour.
TABLE 5 Average Costs for Web Offset Sample Analyses
Uncontrolled Web Offset Analysis Analysis and maintenance
Uncontrolled Web Offset Analysis Analysis and maintenance
Controlled Web Offset Analysis Ana lysis and maintenance
Controlled Web Offset Analysis Analysis and maintenance
Hours per Sampler Unit
2.60 45.76 3.31 58.26 _
3.18 55.97 3.83 67.41
3.55 62.48 4.11 72.34
3.37 59.31 3.89 68.46
Average: Uncontrolled Web Offset Analysis 2.89 Analysis and maintenance 3.57
Average: Controlled Web Offset Analysis 3.46 Analysis and maintenance 4.00
Cost per Sampler Unit
($>
50.86 62.83
60.90 70.40
Note: The uncontrolled web offset trap samples were not separated into high and low boilers (estimated additional analytical time about one man-hour at an additional cost of $17.60) whereas the controlled trap samples were.
c. Gas C hroma toqraphy
The two chromatographs which have been used for analysis of the stack samples are fully described in the previous sections. As this report indicates, the two commercial instruments have been significantly modified.
57
--- -- .__. . -- ..-.- .-..- ..I . ..- .- .-“I. _ .._.. “,_ .-.- .~
- ~,. _. ., .- 1.
The present cost of commercial chromatographs range from about S3,OOO to S12,OOO. In general, ancillary equipment will be required. A chemist experienced in gas chromatography can probably set up a facility to duplicate the procedures we are using at a cost of $2O,OOOt $5,000.
D. Summary .
The average sampler-unit cost including all component sampling equipment and analyses and maintenance time is $136.00. This figure does not represent GATF component procurement and sampler construction time nor the sampler unit support apparatus.
4.3 Appraisal and Summary
The field sampling equipment is not cumbersome and is very rugged. It avoids the hazard always present with evacuated glassware. The stainless steel-gas cylinder and the tube fittings, although expensive, are justified by the reduced labor cost of assembly (0.5 man-hours).
The time for analysis of sampler content is relatively short (3 to 4 man- hours) and compares favorably to other methods. The response of the hydrogen flame detector is more affected by chemical composition than is an infrared detector. However, the flame detector is insen- sitive to moderate flow rate changes whereas the response of the infrared detector is inversely proportional to flow rate.
4.4 Experimenta 1
4.41 Introduction and Summary
A laboratory test was performed to insure proper operation of the grab samplers and to evaluate the accuracy of the method. Known hydrocarbon concentrations were found to be in excellent agreements with experi- menta lly measured values. Under laboratory conditions the sampling and analytical techniques were shown to be accurate. It was deter- mined that a twenty-minute sampling period using an initial flow rate of 20 cc/min was suitable in providing adequate trap sample cooling time.
EPA personnel conducted isokinetic sampling at a web offset plant, attempting to determine if the exhaust stream contained significant amounts of particulates (condensed organics) which would invalidate the use of grab sampling techniques. (Isokinetic sampling occurs when the gas stream velocity entering the sampling nozzle equals the stack gas velocity immediately surrounding the nozzle.) If the stack exhaust contained sizable particulates or condensed matter, isokinetic sampling
58
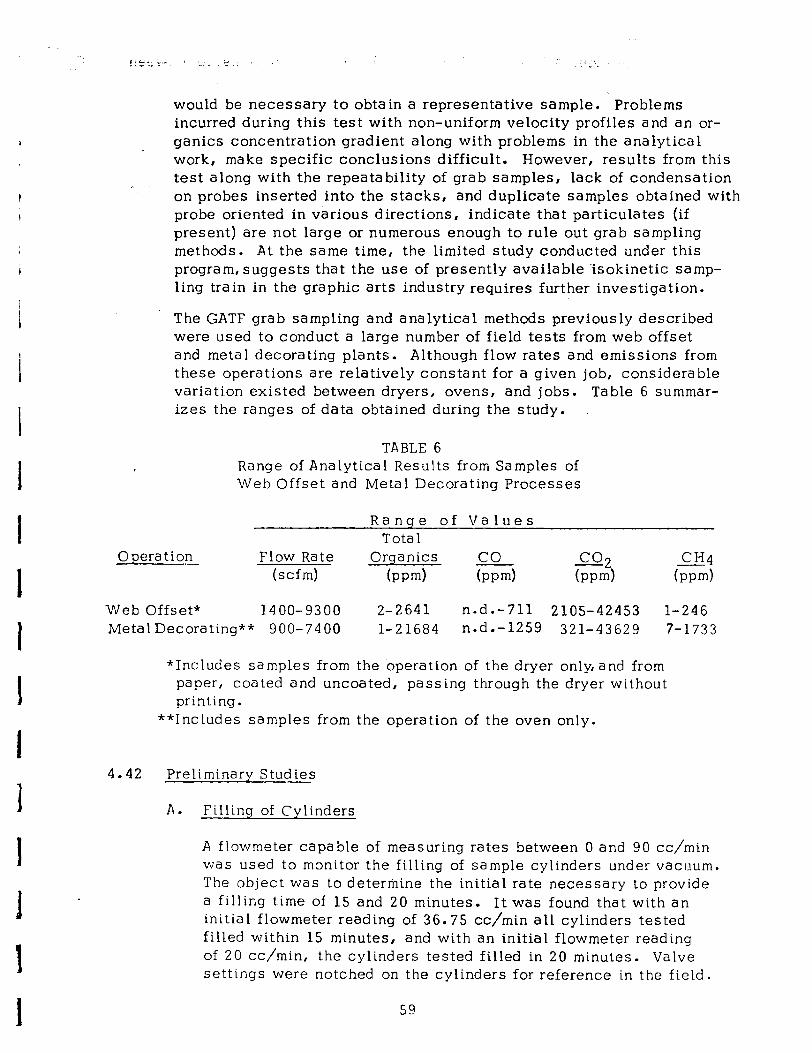
would be necessary to obtain a representative sample. Problems incurred during this test with non-uniform velocity profiles and an or- ganics concentration gradient along with problems in the analytical work, make specific conclusions difficult. However, results from this test along with the repeatability of grab samples, lack of condensation on probes inserted into the stacks, and duplicate samples obtained wit1 probe oriented in various directions, indicate that particulates (if present) are not large or numerous enough to rule out grab sampling methods. At the same time, the limited study conducted under this program, suggests that the use of presently available Isokinetic samp- ling train in the graphic arts industry requires further investigation.
i The GATF grab sampling and analytical methods previously described were used to conduct a large number of field tests from web offset and metal decorating plants. Although flow rates and emissions from these operations are relatively constant for a given job, considerable variation existed between dryers, ovens, and jobs. Table 6 summar- izes the ranges of data obtained during the study.
TABLE 6 Range of Analytical Results from Samples of Web Offset and Metal Decorating Processes
Ranqe of Values Total
aeration Flow Rate Organics CO CH4 (scfm) (Pw-J bpm)
-=2 bpd (ppm)
Web Offset* 1400-9300 2-2641 n.d e-711 2105-42453 l-246 MetalDecorating** 900-7400 1-21684 nod .-1259 321-43629 7-1733
*Includes samples from the operation of the dryer only,and from paper, coated and uncoated, passing through the dryer without printing.
**Includes samples from the operat.ion of the oven only.
4.42 Preliminary Studies
A. Filling of Cylinders
A flowmeter capable of measuring rates between 0 and 90 cc/min was used to monitor the filling of sample cylinders under vacuum. The object was to determine the initial rate necessary to provide a filling time of 15 and 20 minutes. It was found that with an initial flowmeter reading of 36.75 cc/min all cylinders tested filled within 15 minutes, and with an initial flowmeter reading of 20 cc/min, the cylinders tested filled in 20 minutes. Valve settings were notched on the cylinders for reference in the field.
59

__-.. .-- -_ ._
. Pan _ _ Figures 11 and 12 (Appendix B) show the relationship between. t gauge pressure and time,and were used in the field to monitor ; filling.
;
A plot of flow rate versus time, (Figures 13 and 14, Appendix B) made for a 15-minute sampling period, showed that 49 percent of the sample was collected during the first five minutes, 35.9 I
percent during the next five,, and 15.1 percent during the last five minutes. When a ZO-minute sampling time was used, 56 percent was collected during the first seven minutes, 33 percent I
during the next seven minutes, and 11 percent during the last 1 six minutes. ,I :.
For four samplers, pressure and flow rate readings were taken after eight minutes filling time. The results are tabulated below (Table 7): .i..
TABLE 7 Pressure and Flow Rate Reading for Four Samplers
After Eight-Minutes Filling Time
t
-
Cylinder No.
Filling Gage Time Pres sure (min) (in)
Flowmeter (cc/min)
r 8 6.2 4.0 2 8 6.5 4.0 3 8 6.5 4.0 4 8 6.2 4.0
It can be seen that for the cylinders tested, filling character- istics are essentially constant.
B. Temperature of Probe
In the initial sampling method, it was necessary to heat that section of the probe which was not inserted into the stack (see Figure 3, Appendix B) in order to preclude condensation of vapors . The exposed length of probe was wrapped with a flexi- heating tape and controlled by a variable transformer (Variac). The Variac was calibrated by plotting dial setting (volts) against air temperature inside the probe. Temperatures were measured with a chromel-alumel thermocouple. A plot of Variac setting versus temperature is given in Figure 15 (Append ix B) .
During the initial course of this study, since condensible material was found collecting in the probe despite the use of the heating tape during sampling, the use of the heating tape was discontinued and the stack probe and trap were constructed from a single piece of tubing allowing the simultaneous analysis of both the trap and probe.
60

._ .._ -_-
4.5 Preliminary Field Studies
A. Plant Test Code No. MD-P-l
On January 19, 1971 the first sample was obtained under the Phase II contraFt. This, in conjunction with planned future samples, were to be used to assess the effectiveness of our chromatographic technique as applied to metal decorating emissions. Sufficient plant data to characterize the process under study was obtained. This is given in Appendix E, MD-P- 1.
A sample of exhaust from the coating line was collected at about 2:00 pm. The sampling unit was mounted in a ring stand and secured with clamps. The entire assembly was then posi- tioned on the equipment carrying case such that the probe lined up with an existing hole in the stack. This sampling site was free of any flow distortion and appeared to follow good sampling location principles.
The probe was inserted so that the tip was situated approximately in the center of the stack. The heating tape, which surrounded that section of the probe exposed to the air, was heated for ten minutes at SOO’F, prior to drawing the sample. As an expedient mea sure, the trap was immersed in dry ice. It was noted that dry ice should be taken into the field when there is any doubt as to its availability near the site.
Ambient temperature at the testing site was O°F with a 15-mile per hour wind effectively producing a wind-chill factor on the order of -10 to -2OOF.
Because of a brief interruption in the coating operation, it was necessary to collect the sample in two stages, of three and seven minutes duration respectively, two minutes between the two periods. Thus, the lo-minute sampling time consumed twe Lve minutes.
Sample MD-P-l was analyzed by gas chromatography for CH4, CO, CO2 and total organics. The results are also given in Appendix E, MD-P-l. It should be noted that an error in an equation used by CMUPML in calculating results has decreased the reported calculated total sample volume and increased cal- culated organic content presented on the data sheets in Appendix E (see PML-72-24, Appendix F, for extent of change).
B. Plant Test Code No- l-MD
In order to gain familiarity with the original testing equipment and to insure the adequacy of sampling and analytica! procedures,
61
_-_ - . .-l-“-----.l_-F - - - - - - , . . . - .
--
preliminary field tests were conducted at a metal decorating plant. Information was obtained on coating thickness, solvent composition, production rate, emission velocities and tempera- tures, etc. Five samples were collected and analyzed for CO, CH4, C02’ and total organics. For two of the three coating processes studied, flow rates were calculated in actual cubic feet per minute and then standardized.
Duplicate sets of samples were obtained from the metal decor- ating plant. One set was sent to Cal-Colonial Laboratories in California for analysis and the other set was analyzed by Carnegie-Mellon Institute Physical Measurements Laboratory (CMUPML) in Pittsburgh, Pa. Comparisons were made between the reported results of the samples from these two laboratories.
Certain difficulties were encountered in the sampling procedure, and some modifications appeared warranted at that time. Although it was tentatively concluded that the analytical technique em- ployed by CMUPML could give precise results, further testing was necessary.
The results of this source test, along with background informa- tion on the plant and process, including the original report from Cal-Colonial and CMUPML, are given in Appendix E (refer to Plant Code No. l-MD). Again, an error in the equation used by CMUPML in calculating results has decreased reported sample volume and increased calculated organic content (see PML- 72-24, Appendix F for extent of change).
The data on Sheets #3-ECD-A and B (Appendix E) suggest that certain unexpected complications are present in the sampling method, at least for metal decorating emissions. These merit some discussion.
MD-P-2 and MD-P-3 were collected simultaneously using a single probe. The probe was securely wound with heating tape, and was hea ted to a temperature of 2 15’C as measured under static laboratory conditions (see Figure 15, AppendixB). Con- sidering the solvents used in this process, it was expected that the temperature would be sufficient to preclude condensa- t ion of vapor in the probe. Examination of the results of MD-P-2 and MD-P-3, however, showed that a total of 1414 ppm organics condensed in the probe. It was, therefore, con- cluded that it would be necessary to include the probe in all future sample concentration determinations.
MD-P-3 gave a much higher trap analysis than did MD-P-2. This was attributed to a bias in the sampling configuration,
62
I I I I 1
1 I 1
favoring MD-P-3. A schematic of the two samples, attached to a common probe through a modified “T” is shown in Figure 16, Append ix B. It was decided that any additional duplicate samples would be collected using separate probes.
In both sets of duplicate samples, Cal-Colonial reported con- siderably higher cylinder concentrations than CMUPML. Com- pare, for example, a cylinder organic concentration of 278 in MD-P-4 with one of 7.0 ppm in MD-P-3. Since the practice at Cal-Colonial Laboratories is to heat the cylinder prior to injec- tion of sample into the gas chromatograph, it appeared that the low values obtained cy CMUPML resulted from failure to vapor- ize the condensate. The discrepancy between the two analyses meant that all of the high boiling components were not being caught in the trap. To remedy this, it would have been necessary to resort either to a longer trap or to a trap which has been packed with high surface area material, or to a lower trap temperature.
It is known that a sample rich in oxygenated compounds, when subjected to analysis via flame ionization detection, tends to give low results unless put through oxidation (CO2) and reduc- tion (CH4) stages prior to detection. It seemed likely, therefore, that analyses obtained from CMUPML would be lower (although perhaps not significantly so) than those obtained from Cal- Colonial. Comparison of trap samples for MD-P-4 and MD-P-5 shows that this was not the case. Tentatively, then, it was concluded that the analytical method employed by CMLJPML was sufficiently accurate to warrant its continued use.
c. Plant Test Code No. l-W0
A preliminary field test was conducted at a web offset plant to gain familiarity with the web offset process and to insure the adequacy of sampling and analytical procedures as applied to this process. Ten samples were collected and analyzed for CO, CH4, CO2, and tota 1 organics . The results of this test are given in Appendix D, l-WO, along with background information about the plant and about the specific graphic operations involved. (Please note error in reported total sample volume and calculated organic contents, PML 72-24, Appendix F.)
Samples No. 11 and No. 12 (see Data Sheet #3-ECD-A, Appendix were collected as duplicates and sent to different laboratories. Of interest here is the discrepancy between the two analyses. For the cylinder concentration, CMUPML reports 4 ppm, Cal- Colonial reports 120 ppm. The difference, as previously sug- gested, is apparently due to the fact that Cal-Colonial heats the cylinder prior to analysis whereas CMUPML does not. It was also stated that a solution to this problem was the use of a
D)
’ .t. -. .- -
more efficient packed condensible collection trap to insure against carry-over of condensibies into the cylinder.
Trap concentrations reported by the two laboratories are compar- able but a wide discrepancy exists between probe concentrations. The value obtained by CMSJPML is seven times greater than the Cal-Colonia 1 results. One possible explanation for this differ- ence was that although the probe itself was heated to an esti- mated 25O’C in the Cal-Colonial analytical method, a short section of capillary connecting the probe to the chromatograph was maintained at a considerably lower temperature. It seems likely that the high boilers in the probe condense out on this relatively low temperature surface and are, therefore, not de- tected by the Cal-Colonial method.
Samples Nos. 9 and 10 were also collected as duplicates and sent to different laboratories. The results and conclusions are comparable to those given above.
Samples Nos. 7 and 8,collected over a 5-second and 5-minute interval, respectively, and Nos. 6 and 3, collected over a 0.5- minute and 1. O-minute time interval, respectively, indicated that sampling time may be a factor in reported results. Varia- tion in tota 1 organics with time could be attributed to increased carry-over of undetected condensibles into the cylinder at faster sampling rates. This could be remedied by using a more effi- ciently packed condensible col.lection trap.
In samples Nos. 4 and 5, only paper was flowing through the press. As expected, organic values were low. In sample No. 4, both CO2 and organic (trap) concentrations appeared anomalous. The anomaly was explained by the presence of a leak detected in the soldered joint of the sampler.
- Samples Nos. 3 and 6 were taken with the oven on and no paper flowing. Organic values are the lowest of any of the tests con- ducted.
Based upon the preceding discussion, conclusions, and results from MD-P-l, l-MD and l-W0 field tests, and considering the carry-over of condensible portions of the gas sample into the sampling cylinder, several possible corrective actions were decided upon. First, trap length then set at 24 inches could be lengthened to 36 inches: the trap tube diameter of l/8 inch could be increased to accommodate l/4 inch tubing: packing of the trap could be employed if needed; the trap could be immersed in dry ice-Methyl Cellosolve or trichloroethylene as opposed to
64

I I
I I
I
just crushed dry ice, and finally, the probe could be considered as part of the trap during analysis.
It was decided to pack the l/8 inch trap with glass wool and ceramic beading and to consider the trap and probe as a single unit for analysis since condensible material was collecting in the probe despite the use of a heating tape during sampling. The use of the heating tape was discontinued, and by following this recommended procedure, the need to analyze the probe and trap separately was eliminated.
With regards to the relative comparability of analytical results from the two independent laboratories (CMSJPML Cal-Colonial), assuming both received similar samples and assuming that samp- ling procedures employed were as uniform and consistent as possible, it could be expected that reasonable agreement would occur between laboratories for measured quantities of gases in excess of 100 ppm and that smaller quantities (in the range of 30 ppm) might show significant deviation. However, considering the type of analysis required in this study and the fact that no established standards existed upon which to base the analysis, no conclusions could be determined.
D. Plant Test Code No. 2-WO
Modifications developing from previous preliminary plant tests were employed, and plant tests conducted under code No. 2-WO were used to explore the effects of these modifications on the sampling results. Twelve samples were collected from two web offset presses having direct flame drying on April 12, 13, 14, 15, 1971. The samples were analyzed for CO, CH4, CO2 and total organics. The results of this test are presented in Appendix D, 2-WOO (Please note error in reported total sample volume and calculated organic contents, PML 72-24, Appendix F.)
The following samples were collected in duplicate: Nos. 1 and 13; 3 and 12; 2 and 14; 6 and 10. The data for No. 2 is invali- dated by the fact that the glass-lined Dewar flask containing dry ice and the sampler trap was found broken. The low value is probably due to organic carry-over into the cylinder-
Samples Nos. 4 and 8 were collected simultaneously. In No. 4 the front of the probe was-oriented perpendicular to the gas stream, and in No. 3, it was parallel (e.g., the circular cross- section of the probe was parallel and perpendicular, respectively, to the effluent gas stream lines). Since the difference between results are no greater than those differences already reported, and taking into consideration gas stream turbulence possibilities,
I 65
-
- :i _. ._ . . _ _
various sampling biases that may result from different probe orientations, and general efficiency of field sampling procedures, it was decided that a straight probe (perpendicular to the gas stream) would be preferable to a bent configuration (parallel to the gas stream).’ Later conversations with Dr. J. D. Carruthers of Ambassador College Press, Pasadena, California, further sub- stantiated this final decision on probe configuration.
Samples taken from the operation of the dryer only (Nos. 14 and 15) did not show signtficant reduction in emission rate. This was particularly true in the case of No. 14 which should be com- pared with Nos. 3 and 12. It seemed possible that the results were due to a high residual concentration of condensed organics on the walls of the stack. It should be noted that methane values for Press A are lower than Press B, suggesting that in the Press A dryer more efficient mixing of air and fuel resulted in better combustion.
Samples Nos. 6 and 10 had glass beads in their traps along with the glass wool normally used, and the analytical results indi- cated that the traps packed with glass wool functioned as effi- ciently as those packed with t.he additional glass beads.
4.6 Stack Simulator Study
A stack simulator experiment was performed inclusive of a complete mass balance to ascertain the effectiveness of our sampling and ana- lytical methods. This experiment is described in detail in Appendix F, reports dated July 27, 1971 and May 1, 1972, investigation No. PML- 71-17.
Generally, in the preliminary experiment a large volume of a static mixed gas sample was prepared containing known volumes of air, methane, butane, and cyclohexane at atmospheric pressure and ambient temperature. The air, methane and butane concentrations were determined in advance. The methane concentration approximated that encountered in previously sampled web offset printing operations utilizing heatset inks. The cyclohexane concentration corresponded to the equilibrium vapor concentrations at the ambient conditions. In later studies water pumped nitrogen was substituted for the air, methane, butane carrier gas. Samples of the emission were collected at various filling rates using the same GATF apparatus as employed in the field.
The overall objectives of the tests were to determine: (1) the effi- ciency of the trap using sampling periods ranging from five to thrity minutes, and (2) the accuracy of the analytical method.
66
- _... - - _. -.-- .---. .-__
Analysis of the trap samples from the first stack simulator tests indi- cated that during the two- hour sampling period the concentration of cyclohexane in the gas stream was increasing as a function of time. Since the simulator was obviously not functioning properly these initial trap results were invalidated and more experimental data was needed.
Several other tests were run to establish that the measured quantity of cyclohexane in the trap actually equaled that delivered. However, it was not until a modification in design was introduced that a cyclo- hexane balance could be obtained.
In the finally utilized test analysis, the average tota 1 hydrocarbon content as CO2 of the sampling apparatus, 0.5210 + 0.0032 V/V%, - was compared with the calculated hydrocarbon content, 0.535 + 0.016 V/V%; and it was found to be within a standard deviation of thecal- culated hydrocarbon content of the flow in the stack simulator.
4.7 Comparison of Tsokinetic Sampling With GATF Inteqrated Grab Samplinq
4.71 Introduction
In order to further substantiate that the GATF integrated grab sampling technique was reliable and to determine if possibly the exhaust stream contained significant amounts of particulates (condensed organics) which would invalidate the use of grab sampling techniques, the Environ- mental Protection Agency (EPA) requested that.GATF conduct an experi- ment to compare GATF’s method of sampling with the widely-used and commonly accepted method of is okinetic sampling . Isokinetic samp- ling is recommended (proportional sampling is required) when the gas flow rate and pollution output rate is not steady, and required when the gas stream contains particulates or condensed matter (e.g. hydro- carbons in either a solid or liquid state). Isokinetic sampling is a sampling condition established when the velocity of the gas stream entering the sampling probe or nozzle equals the stack gas velocity immediately surrounding the probe or nozzle.
EPA’s emission testing branch was of the opinion that isokinetic sampling might be necessary for the graphic arts industry, and there- fore, was desirous of evaluating the method. A comparison test was planned in which both integrated grab samples and isokinetic samples would be collected from a web offset emission source. Therefore, two samples were taken isokinetically in the field at one source with a modified impinger train to 1) -see if the results from those samples and ones obtained concurrently with the GATF method were of the same order of maqnitude, and to: 2) try to determine if the results indicated that any organics were being emitted in the form of particulates at that particular source under the particular set of operating conditions in effect at the time of sampling.
67

I by ,-
4.72 Experimental
A.-- *-- Samplinq and Analysis of a Web Offset Emission Usinq the Isokinetic Method (by EPA Personnel)
On June 23, two samples were collected isokinetically at a web offset plant by three representatives of the Emissions Source Testing Division of EPA. The objective, again, was to determine whether or not isokinetically collected samples yielded results comparable to those obtained using the GATF procedure, a constant volume controlled variable rate method, and whether, perhaps, any organics were being emitted as particulates (solid or condensed liquid) at the source and under the process conditions being evalu- ated. Each isokinetic sampling apparatus consisted essentially of three components: (1) a probe with a l/8” button-hook probe tip, (2) a series of four Greenburg-Smith impingers immersed in a dry ice-trichloroethylene slurry, (3) a GATF gas sampler (placed in series aft.er the fourth impinger) to gauge efficiency of collection of the impingers.
For the two isokinetic samples, three equal areas were utilized in the 32-inch diameter stack, and samples were collected at six points from two locations 90 degrees to each in the duct. The samples, therefore, covered 12 collection points each of five- minutes duration, or a total 60-minutes sampling time.
The components were delivered to CMUPML immediately after collection. It should be noted that there were at least five interruptions during collection of the first isokinetic sample due to web breaks, bearing failure, and register problems. The second sample was collected in one hour without interruption.
Upon delivery of the samples to CMUPML, the condensed phase was transferred by passing nitrogen through the impingers over a trap immersed into liquid nitrogen. Although most of the con- densed phase was transferred into the trap, an oily residue remained in the impingers. This was eventually removed using a volatile organic solvent, and then analyzed.
The analytical method used in determining organic content of these isokinetic samples was reported by CMUPML and is pre- sented in Appendix F (PML-71-23) along with an analysis report of the GATF samples taken at the exit port of the isokinetic sa.mpling train (PML-71-223). EPA data and calculation sheets are also included in Appendix F. A summary of the results is presented in Table 8.
B. Sampling and Analysis of Web Offset Emission Using the GATF Method
While isokinetic sampling was in progress on June 23, 1971, three samples were obtained using the GATF method. Each
68
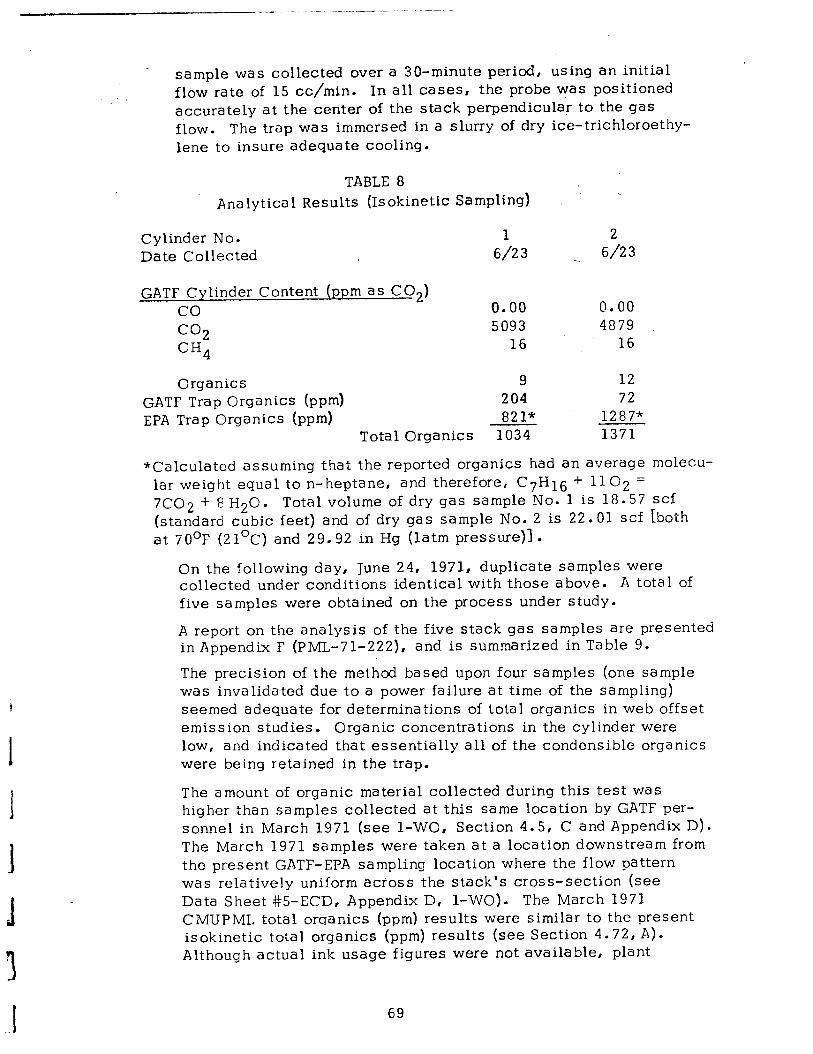
WI -_-._. -., - __... _.I ,,,...- -.. _-
i
I I I d
sample was collected over a 30-minute period, using an initial flow rate of 15 cc/min. In all cases, the probe was positioned accurately at the center of the stack perpendicular to the gas flow. The trap was immersed in a slurry of dry ice-trichloroethy- lene to insure adequate cooling.
TABLE 8 Analytical Results (Isokinetic Sampling)
Cylinder No. 1 2 Date Collected 6123 _ 6/23
GATF Cylinder Content (ppm as C02) co co2 CH4
0.00 0.00 5093 4879 _
16 16
Organics 9 12 GATF Trap Organics (ppm) 204 72 EPA Trap Organics (ppm) 821* 1287*
Total Organics 1034 1371
*Calculated assuming that the reported organics had an average molecu- lar weight equal to n-heptane, and therefore, C7H16 + 1102 = 7Co2 + I! H20. Total volume of dry gas sample No. 1 is 18.57 scf (standard cubic feet) and of dry gas sample No. 2 is 22.01 scf [both at 70°F (21OC) and 29.92 in Hg (latm pressure)].
On the following day, June 24, 1971, duplicate samples were collected under conditions identical with those above. A total of five samples were obtained on the process under study.
A report on the analysis of the five stack gas samples are presented in Appendix F (PML-71-222), and is summarized in Table 9.
The precision of the method based upon four samples (one sample was invalida ted due to a power failure at time of the sampling)
seemed adequate for determinati.ons of total organics in web offset emission studies. Organic concentrations in the cylinder were low, and indicated that essentially all of the condensible organics were being retained in the trap.
The amount of organic material collected during this test was higher than samples collected at this same location by GATF per- sonnel in March 1971 (see 1-WO, Section 4.5, C and Appendix D). The March 1971 samples were taken at a location downstream from the present GATF-EPA sampling location where the flow pattern was relatively uniform acioss the stack’s cross-section (see Data Sheet #5-ECD, Appendix D, 1-WO). The March 1971 CMUPML total orqanics (ppm) results were similar to the present isokinetic total organics (ppm) results (see Section 4.72, A). Although actual ink usage figures were not available, plant
1 69
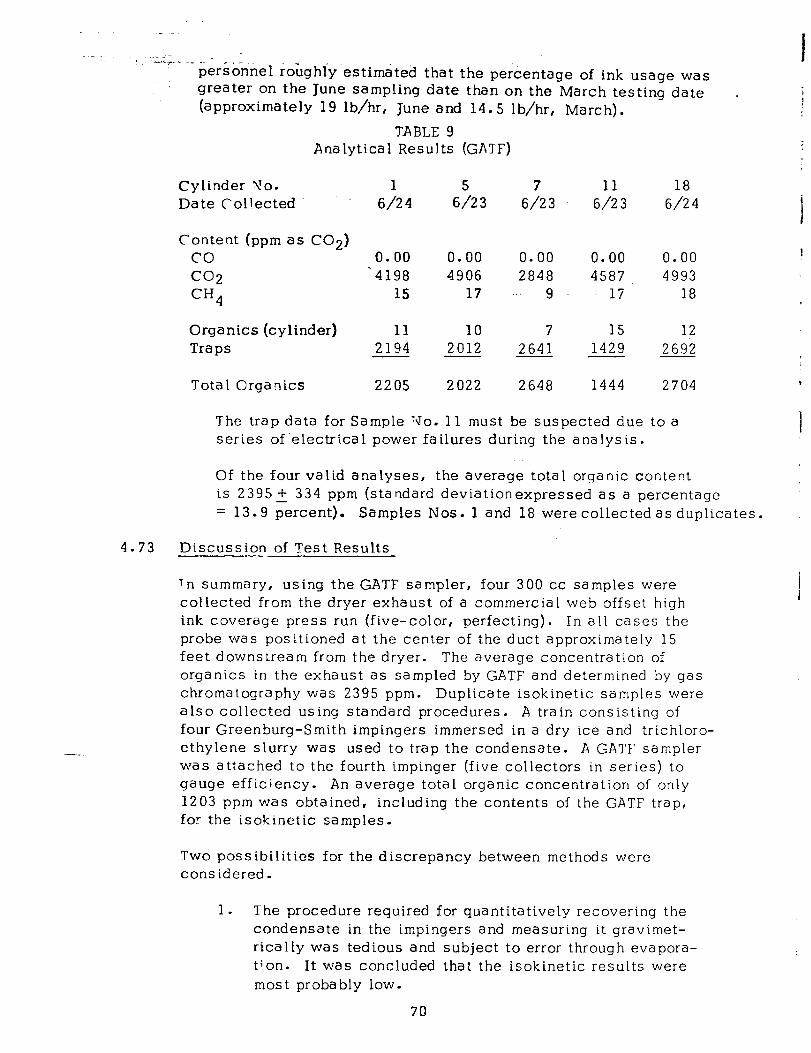
’ -‘-“-% --pers%nel robghl’y estimdted that the percentage of ink usage was I
greater on the June sampling date than on the March testing date . (approximately 19 lb/hr, June and 14.5 lb/hr, March). I
TABLE 9 Analytical Results (GATF)
Cylinder Yo. 1 5 7 11 18 Date Collected - 6/24 6/23 6/23 6/23
6/24 I Content (ppm as CO2)
CO 0.00 0.00 0.00 0.00 0.00 I
CO2 -4198 4906 2848 4587 4993 CH4 15 17 "' 9 17 18
Organics (cylinder) 11 10 7 15 12 Traps 2194 2012 2641 1429 2692
Tota I Orga nits 2205 2022 2648 1444 2704
The trap data for Sample ‘do. 11 must be suspected due series of ‘electrica 1 power failures during the analysis.
to a
Of the four valid analyses, the average total orqanic content is 23952 334 ppm (standard deviationexpressed as a percentage = 13.9 percent). Samples Nos. 1 and 18 were collected as duplicates.
4.73 Discussion of Test Results
Tn summary, using the GATF sampler, four 300 cc samples were collected from the dryer exhaust of a commercial web offset high ink coverage press run (five-color, perfecting). In all cases the probe was positioned at the center of the duct approximately 15 feet downstream from the dryer. The average concentration of organics in the exhaust as sampled by GATF and determined by gas chromatography was 2395 ppm. Duplicate isokinetic samples were also collected using standard procedures. A train consisting of four Greenburg-Smith impingers immersed in a dry ice and trichloro- ethylene slurry was used to t.rap the condensate. A GATF sampler was attached to the fourth impinger (five collectors in series) to gauge efficiency. An average total organic concentration of only 1203 ppm was obtained, including the contents of the GATF trap, for the isokinetic samples.
Two possibilities for the discrepancy between methods were cons idered.
1. The procedure required for quantitatively recovering the condensate in the impingers and measuring it gravimet- rically was tedious and subject to error through evapora- tion. It was concluded that the isokinetic results were most probably low.
70
2. The four values obtained using the GATF method, while i.n good agreement with one another, appeared to be high compared with expected results based on knowledge of the process under study. The question arose as to whether there might not be a concentration gradient in the duct, having a maximum va!ue in the center and falling off near the walls.
lf a concentration gradient existed, it would not affect the isokinetic values since portions of the sample would be taken and weighted at various points in the duct, and, therefore, would constitute an approximate average sample. In contrast, the GATF method of sampling at a single point in the center of duct, where concentrations would most likely be highest, would tend to give high results.
4 u 8 Gradient Studies
In order to resolve the possibility that a concentration gradient existed across the stack cross-section used in the test comparison of the GATF sampling technique with the isokinetic sampling tech- nique, and to further substantiate the fact that the GATF sampling method would provide representative samples when emission flows and temperatures are found uniform across a stack cross-section, two gradient studies were conducted.
In the first study, grab samples were to be taken at the same plant and duct location the GATF-isokinetic samples were taken. On October 11, 1971, after experiencing some delay in conducting the test due to a problem of scheduling a high ink coverage process job that would closely parallel or duplicate the original experimental conditions , GATF testing personnel completed the additional samp- ling at the original isokinetic testing site. Flow and process data is shown in Appendix F, Data Sheet #5-ECD along with the CMXJPML- 72-232 describing the analytical results for these samples. The results are also summarized in Table 10 below.
Duplicate samples were collected at three points in the stack, and analyzed for total organics. One sampling point was located within each of three concentric equal areas of the stack as required in conducting a velocity traverse. The recorded gas velocity head and subsequently calculated gas velocity suggested the possible presence of some bend, impediment, or other structural restriction in the stack. There was no noticeable temperature varia- tion across the stack’s cross-section, and the calculated flow rate was very nearly equal to the flow rate recorded during the June 23, 1971 isokinetic test.
71
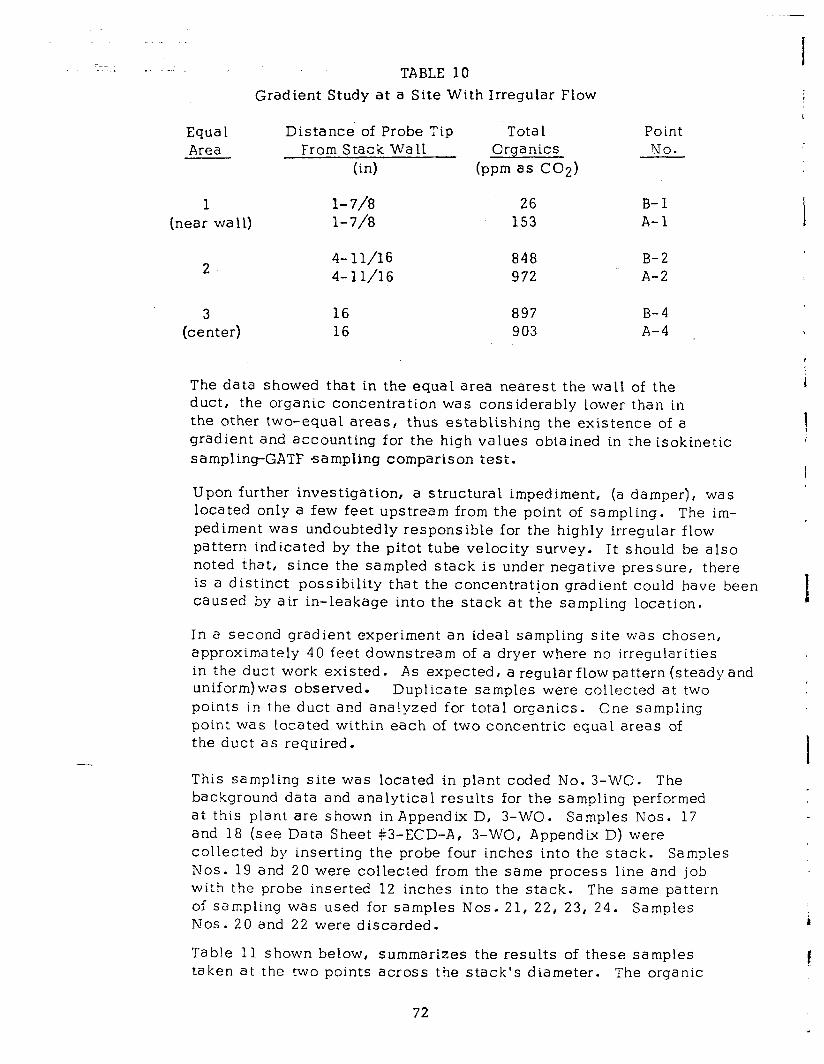
~ ‘ TABLE 10 Gradient Study at a Site With Irregular Flow
Equa 1 Area
Distance of Probe Tip Tota 1 From Stack Wall Organics
(in) - (ppm as C02)
1 (near wa 11)
1-7/a 26 l-7/8 153
2 4-H/16 848. B-2 4-U/16 972 A-2
(ce3nter) 16 897 B-4 16 903 A-4
The data showed that in the equal area nearest the wall of the duct, the organic concentration was considerably lower than in the other two-equat areas, thus establishing the existence of a gradient and accounting for the high values obtained in the isokinetic sampling-GATF sampling comparison test.
Upon further investigation, a structural impediment, (a damper), was located only a few feet upstream from the point of sampling. The im- pediment was undoubtedly responsible for the highly irregular flow pattern indicated by the pitot tube velocity survey. It should be also noted that, since the sampled stack is under negative pressure, there is a distinct possibility that the concentration gradient could have been caused by air in-leakage into the stack at the sampling location.
In a second gradient experiment an ideal sampling site was chosen, approximately 40 feet downstream of a dryer where no irregularities in the duct work existed. As expected, a regular flow pattern (steady and uniform) was observed. Duplicate samples were collected at two points in the duct and analyzed for total organics. One sampling point was Located within each of two concentric equal areas of the duct as required.
This sampling site was located in plant coded No. 3-WO. The background data and analytical results for the sampling performed at this plant are shown in Appendix D, 3-WO. Samples Nos. 17 and 18 (see Data Sheet #3-ECD-A, 3-WO, Appendix D) were collected by inserting the probe four inches into the stack. Samples Nos. 19 and 20 were collected from the same process line and job with the probe inserted 12 inches into the stack. The same pattern of sampling was used for samples Nos. 21, 22, 23, 24. Samples Nos. 20 and 22 were discarded.
Table 11 shown below, summarizes the results of these samples taken at the two points across the stack’s diameter. The organic
72
Point NO.
B-l A-l
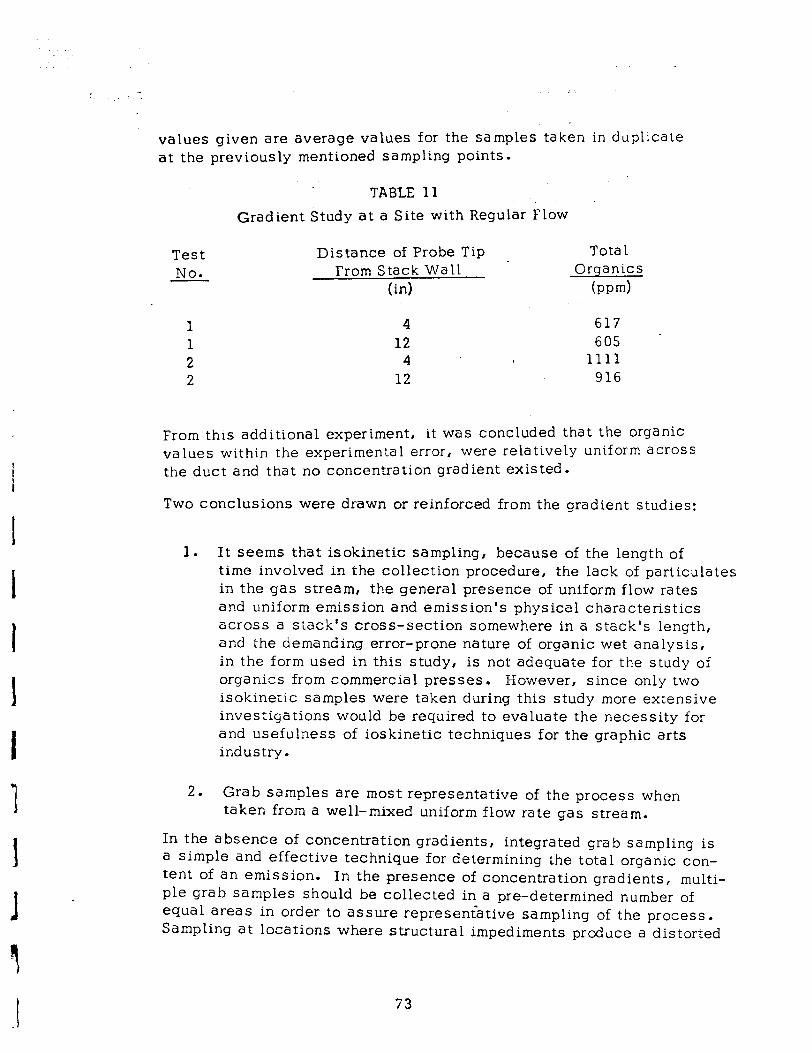
values given are average values for the samples taken in duplicate at the previously mentioned sampling points.
TABLE 11
Gradient Study at a Site with Regular Flow
Test No.
Distance of Probe Tip Tota 1 - From Stack Wall Orqanics
(in) bpd
1 4 617 - 1 12 605
2 4 1111 2 12 916
From this additional experiment, it was concluded that the organic values within the experimental error , were relatively uniform across the duct and that no concentration gradient existed.
Two conclusions were drawn or reinforced from the gradient studies:
1. It seems that isokinetic sampling, because of the length of time involved in the collection procedure, the lack of particulates in the gas stream, the general presence of uniform flow rates and uniform emission and emission’s physical characteristics across a stack’s cross-section somewhere in a stack’s length, and the demanding error-prone nature of organic wet analysis, in the form used in this study, is not adequate for the study of organics from commercial presses. However, since only two isokinetic samples were taken during this study more extensive investigations would be required to evaluate the necessity for and usefulness of ioskinetic techniques for the graphic arts industry.
2. Grab samples are most representative of the process when taken from a well-mixed uniform flow rate gas stream.
In the absence of concentration gradients, integrated grab sampling is a simple and effective technique for determining the total organic con- tent of an emission. In the presence of concentration gradients, multi- ple grab samples should be collected in a pre-determined number of equal areas in order to assure representative sampling of the process. Sampling at locations where structural impediments produce a distorted
73
velocity profile or where infiltrated air creates a concentration gradient should be avoided. It should be noted here that the presence of an uneven velocity profile will mean that the concentrations obtained at the various sampling points will have to be weighted with respect to the measured relative velocity at each sampling point so as to be able to calculate a true average exhaust pollutant mass emission rate. Sampling should be conducted only at a point of uniform flow and good mixing so as to allow a greater assurance that the sample obtained will be representative of the process under evaluation.
4.9 Efficiency of Trap
An attempt was made to determine the degree of efficiency for collec- tion of organics by the trap used in the GATF sampler. This deter- mination involved looking over all the data collected from both web offset and metal decorating samples, stack simulator experimental results (as reported previously in section 4.6 and in Appendix F, PML-71-17),and a test for condensates in GATF sample cylinders, (PML-72-230, Appendix F).
The variables that could affect efficiency of organics entrapment are shown for web offset in Table 12 (Appendix C), and metal decorating in Table 13 (Appendix C), arranged against calculated trap efficiencies. Trap efficiency as defined in these tables and other tables in this report is determined by the following equation (a):
(a) Trap Efficiency (%) = cylinder orqanics
total organics (,jTm) x 100 1 Outlet samples from emission control units/are also noted by asterisks in Tables 12 and 13.
Those factors affecting entrapment are total organics present in the sample, percentage of high and low boilers (see section 4.27, C, for definition of high and low boilers) making up the sampled organics, and sampling time.
Sampling time was chosen after many field sampling trips to be most optimum at 20 minutes (20 cc/min)= The time values on both Table 12 and Table 13 do not indicate a concrete dependence of efficiency of organics entrapment and length of sampling time period. However, it has been determined from field experience that a too fast sampling rate may cause rapid build-up of organics in specific areas of the trap wit.h resultant “clogging” of the trap and subsequent prevention of sampling.
There seems to be a definite dependency of trap efficiency to both total organics and the percentage of high-boilers present in the
i
i
c
74
I
I I
I 1 1
I I-
sample. Generally, the higher the high-boiler percentage and the higher the total organics sampled, the higher the sampling trap organ- its collection efficiency (and vice versa). It should be noted that outlet samples from emission controlled units (i.e., incinerators) have the lower percentages of high boilers and the highest percentage of low boilers. It should also be noted, especially in Table 13 for metal decorating samples, that there seems to be an independence of high-boiler percentages and the concentration level of total organ- its sampled upon the efficiency of organics entrapment. There appears to be a point when, even though the trap sample contains a low per- centage of high- boilers, the presence of certain concentration levels of total organics will yield a high level of trap organics collection efficiency .
The previously discussed stack simulator experiment (see section 4.6 and Appendix F, PML-71-17) showed a high trap collection efficiency for organics under laboratory conditions. Another la bora- tory study, “Test for Condensates in GATF Sample Cylinders”, PML 72-230, Appendix F, indicated that high-boiling organics were not passing through the trap into the cylinder portion of the GATF stack sampling apparatus. As shown on page 3 of PML-72-230, there was a high-boiling residue present in tested cylinders which was also present in cylinders never previously used for sampling purposes. It was concluded that the high-boiling organics or residue in the cylinder has a low vapor pressure at ambient tempera- ture, and would not contribute to previous values reported for cylinder analysis. The residue is probably present in all cylinders, used and unused, and is contributed by materials and the methods used to manufacture the cylinders.
In conclusion, GATF’s sampler (trap and cylinder) and method of sampling was found to be very adequate for sampling both condensi- ble and non-condensible organics from web offset and metal decor- ating processes during the Phase !I contract period. The efficiency of the sampler trap in collecting condensible organics was, for most cases,very high.
I 75
5.0
5.1
5.2
5.3
5.31
TREATMENT OF EXPERIMENTAL SAMPLING DATA
Introduction
In order to comprehensively review and digest the field data for both the web offset lithographic and metal decorating processes, an understanding of the manner in which the data for the above men- tioned processes was recorded, tabulated, ca lcula ted and reported is essential. Previous sections of this report have dealt with a description of the sampling apparatus, the procedure involved in sampling as well as a complete description of the analytical pro- cedures utilized in the program.
Data Sheets (Forms)
Data sheets were designed and developed throughout the program to record test data meaningful to the conduct of the source sampling program. Specifically, these data sheets were numbered l-ECD through 5-ECD and were as follows:
Data Sheet #l-ECD - Source Location and Sample Background Data Data Sheet #2-ECD - Physical and Operational Plant Data Data Sheet #3-ECD - Effluent Sampling Data Data Sheet #4-ECD - Visible Emissions Evaluation Data Sheet #5-ECD - Gas Velocity Data
Sample forms of the above mentioned data sheets can be found in Figures 17 through 21 in Appendix B. As work proceeded, several forms underwent revision and the evolution is presented. For example, 18a, 18b, and 18~ (Appendix B) represent revisions of Data Sheet #2-ECD (Figure 18, Appendix B). Additiona lly, Figure 19a repre- sents a revision of the form shown In Figure 19 (Data Sheet +3-ECD); Figure 21a, a revision of the form as illustrated by Figure 21, (Append ix B) .
Data Sheets (Description)
Data Sheet #l-ECD (Source Location and Sample Backqround Data)
This data sheet provided information on the process to be sampled, type of equipment utilized, stack geometry and any additional data that would be pertinent to understanding the process under evalua- tion. All data pertaining to a specific plant was included with the plant code number assigned (item 4 of this and subsequent data sheets) . The numbering process utilized was simple and direct. Each web offset plant was numbered consecutively as tests were performed. Thus, l-W0 signified the first web offset plant in the study. In all, nine web offset plants were evaluated. Similarly,
77
. .
metal decorating operations were coded l-MD, etc. In all, seven metal decorating plants were evaluated. A copy of this data sheet can be found in Figure 17 (Appendix B).
5.32 Data Sheet #2-ECD (Physical and Operational Plant Data)
This data sheet provided information of physical measurements (temperature, pressure, etc.) as well as the operational data on the process. For web offset, operational data consisted of speed, type of paper and percent ink coverage, the type of data necessary to adequately correlate emissions to process parameters. The data sheet was designed also to accommodate the operational data for metal decorating, thus satisfying a two-fold function. The nature of the data being generated necessitated that this data sheet under- go several revisions as illustrated by Figures 18a, 18b, and 18~ (Append ix B).
5.33 Data Sheet #3-ECD (Effluent Sampling Data)
This data sheet contains specifcs on the collection of the sample: the time over which the sample was collected, probe length and depth of insertion, and description of collection point. With the abandonment of the heating tape and variac and the subsequent refinement of the sampling procedure, the data sheet was revised to include observed smoke density and odor as well as any special notes such as interruptions in the sampling period. A copy of this data sheet can be found in Figure 19a (Appendix B).
5.34 Data Sheet %4-ECD (Visible Emissions Evaluation)
This form recorded smoke density readings and is typical of those used by control agencies for visible emission evaluation. When the form is properly utilized, the operation of a particular piece of equipment (press oven, dryer, etc.) can be effectively evaluated for visible emissions. Included in this visible emission evaluation besides that of smoke (shades of gray expressed as Ringelmann numbers) is equivalent opacity (any colored emission). These readings are recorded as percentages (No. 1 equivalent to 20 per- cent, No. 2 equivalent to 40 percent, etc., and correspond to appropriate Ringelmann numbers). A copy of this data sheet can be found in Figure 20 (Appendix B).
5.35 Data Sheet %5-ECD (Gas Velocity Data)
On this data sheet were recorded velocity head readings during a velocity traverse, gas temperature and atmospheric pressure for subsequent use in flow equations as shown in the lower left hand
78
corner of the form. An average actual gas velocity is calculated and converted to standard cubic feet per minute (scfm). A copy of this data sheet can be found in Figure 21 (Appendix B).
5.4 Arrangement of Data
Appendices D and E contaih data recorded accordingly for the web offset lithographic plant studies as well as metal decorating. Appen- dix D is arranged in a numerical coded sequence utilizing the plant code number for web offset studies: i.e., 1-WO, 2-WO, 3-WO, etc. Similarly, Appendix E is arranged in a numerical coded sequence utilizing the plant code number for metal decorating operations; i.e., l-MD, Z-MD, 3-MD, etc.
The number of data sheets utilized per plant test varies significantly. As a minimum, each plant test will contain Data Sheets Nos. I-ECD, 2-ECD, 3-ECD and 5-ECD. Each may also contain three additional data sheets, Nos. 3-ECD-A, 3-ECD-B and 3-ECD-C, summaries of analytical results, and in tabular form other cal.culated data as a ppropria te . For each plant evaluated there is the laboratory report on the analysis of all samples taken at that plant.
In certain cases, those with air pollution control equipment, addi- tional tabulated data (Data Sheet #3-ECD-D) will appear. This data sheet tabulates the calculated hydrocarbon conversion effi- ciency at various incineration temperatures.
At some of the plants evaluated in this program, additional sampling was performed with detector tubes from a Universal Testing Kit. These measurements are tabulated on Data Sheet #3-ECD-E.
Also appearing in several test data packages is an evaluation of moisture as determined in the effluent stream. This data, however, was confined to a limited number of plants and, therefore, its occur- rence throughout the various numbered tests will be minimal.
On limited occasions and where conditions permitted, smoke density read ings were taken. These read ings were recorded on Data Sheet #4-ECD and may be found in several of the plant tests.
In summary, all plant tests have been coded for easy reference. The plant code number will. be-utilized throughout the discussion in this report. As can be noted, the data is voluminous, however, every attempt has been made to simplify, reduce and report the significant findings of these various tests.
7s
5.5 Development of a Test Proqfam ._-~-I_-.- --_-
So as to be able to conduct a systematic, pre-planned program for the evaluation of the va,rious process variables associat.ed with web offset and the metal decorating operations, test programs were established prior to the conduct of on-site field studies.
5.51 Web Offset Publication Printing Test Proqram
A test program was developed for web offset publication printing (see Table 14, Appendix C) which considered the important variables in a web offset operation. It was decided that information should be obtained on the effect of press speed, ink coverage, paper quality and combustion products of the dryer: any of these factors may have an effect on the nature and extent of the emission. In addition, studies would be conducted of the web offset operation which util- ized thermal’incineration and catalytic incineration equipment in control of this process.
A summary of the tests run and the number of samples obtained for each set of conditions is shown in Table 14 (Appendix C). In all, five web offset plants (Plant Code Nos. 3-WO to 7-WO, inclusive (Appendix D) were utilized in the test program for web offset. Specifically, Plant Code No. 3-WO (Appendix D) covers the evalua- tion of direct flame hot air drying system, while Plant Code No. 4-WO (Appendix D) covers the high velocity hot air drying system. These two plants comprised the work performed under the section entitled “Uncontrolled Source”, Table 14 (Appendix C) of the test program. Plant Code Nos. S-W0 and 6-WO (Appendix D) constituted the test of thermal incineration in control of the web offset opera- tion. Plant Code No. 7-WO constitutes the test of catalytic incin- eration in control of web offset operations. These latter plants comprised the work performed under the section entitled “Controlled
--. Source ‘I, Table 14 (Appendix C) of the test program.
5..52 Metal Decorating Test Proqram
Similar to that for web offset, a test program was developed for metal decorating (Table 15, Appendix C) which considered the im- portant variables in this operation.
It was decided that information should be obtained on the effect of combustion products of the oven, ink coverage and more impor- tantly, the various weights of coatings utilized; any of these factors which may have an effect on the nature and extent of the emission. Generally, the types of coating materials in use by the metal decorating industry consist of: vinyls, acrylics, alkyds,
!?!(I
oleoresinous and phenolic lacquers. An attempt was made to evallJ- ate as many of these coating materials as consistent with the limit.a- tions of the program.
A summary of the tests run and the number of samples obtained for each set of conditions is shown in Table 15 (Appendix C). Four metal decorating plants (Code Nos. 2-MD to S-MD, inclusive (Appendix E) were utilized in the test program. Specifically, Plant Code Nos. 2-MD and 3-MD (Appendix E) cover the evaluation of the process with particular emphasis on evaluating types of coat- ings applied. These two plants comprised the work performed under the section entitled “Uncontrolled Source, Table 15, (Appendix C) of the test program. Plant Code No. 4-MD (Appendix E) relates to the evaluation of a thermal incineration system in control of the metal decorating operation. Plant Code No. S-MD (Appendix E) relates to the evaluation of catalytic incineration in control of the metal decorating operation. These latter two plants comprised the work performed under the section entitled “Controlled Source”, Table 15 (Appendix C) of the test program.
Basis for Calculations
The following sections deal with the many calculations performed in this study. It should be emphasized that several of the equa- tions developed have limited applicability to the particular pro- cess under consideration and thus, should be considered in that manner . Further, it should be noted that these equations are solely based upon findings and determinations made by the environmental field testing staff in the conduct and evaluation of the field studies and thus, should be utilized with this understanding.
It remains, therefore, that in order to obtain an understanding of the results as presented in several subsequent sections of this report, the reader must generally grasp how those results were obtained. This section will attempt to outline the calculational methods used and to define significant terms used in discussing the data.
Calculation of Observed Emissions
Two major factors enter into the calculation of the observed emission rate referred to throughout this report as Eobs, namely, the efflu- ent gas flow rate (expressed as standard cubic feet per minute at 60°F and 29.92” Hg) and the organic concentration of the gas stream (expressed from laboratory analysis as a volume to volume percentage as carbon dioxide, V/?I% as C02). The measurement of the effluent gas flow rate and the subsequent calculation of the
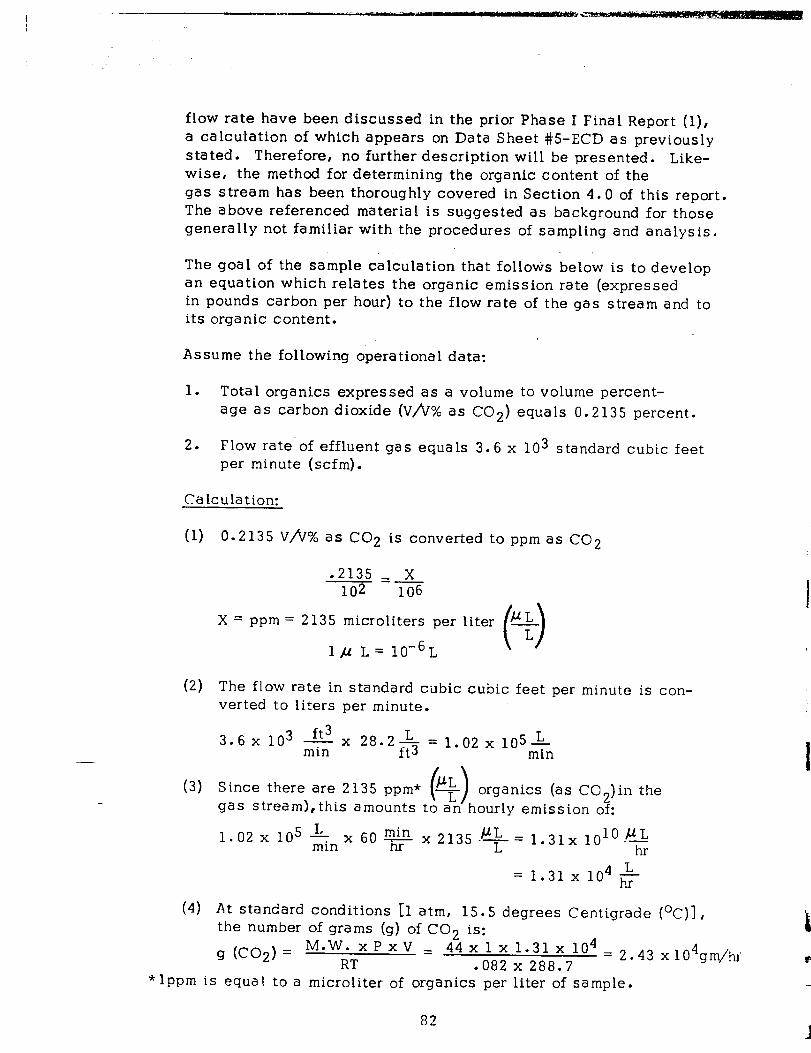
flow rate have been discussed in the prior Phase I Final Report (l), a calculation of which appears on Data Sheet #5-ECD as previously stated. Therefore, no further description will be presented. Like- wise, the method for determining the organic content of the gas stream has been thoroughly covered in Section 4.0 of this report. The above referenced material is suggested as background for those generally not familiar with the procedures of sampling and analysis.
The goal of the sample calculation that follows below is to develop an equation which relates the organic emission rate (expressed in pounds carbon per hour) to the flow rate of the gas stream and to its organic content.
Assume the following operational data:
1. Total organics expressed as a volume to volume percent- age as carbon dioxide (V/V% as CO,) equals 0.2135 percent.
2. Flow rate’of effluent gas equals 3.6 x lo3 standard cubic feet per minute (scfm).
Calculation:
(1) 0.2135 V/tr% as CO2 is converted to ppm as CO2
.2135 - X -- 102 106
x = ppm = 2135 microliters per liter
I& L= 10-6L
(2) The flow rate in standard cubic cubic feet per minute is con- verted to liters per minute.
3.6 x lo3 ft3 x 28.2s = 1.02 x 10⁵L min min
organics (as CO )in the hourly emission 0;:
1.02 x 10⁵ L min x 60 e x 2135 -‘+= 1.31x dorm
hr
= 1.31 x lo4 j$-
(4) At standard conditions 11 atm, 15.5 degrees Centigrade (OC)] , the number of grams (g) of CO9 is: t
g (CO2) = M.W.xPxV = 4~xlx1.31x104=2 43x104gm,iu RT .082x 288.7 l
B
*lppm is equal to a microliter of organics per liter of sample.
82
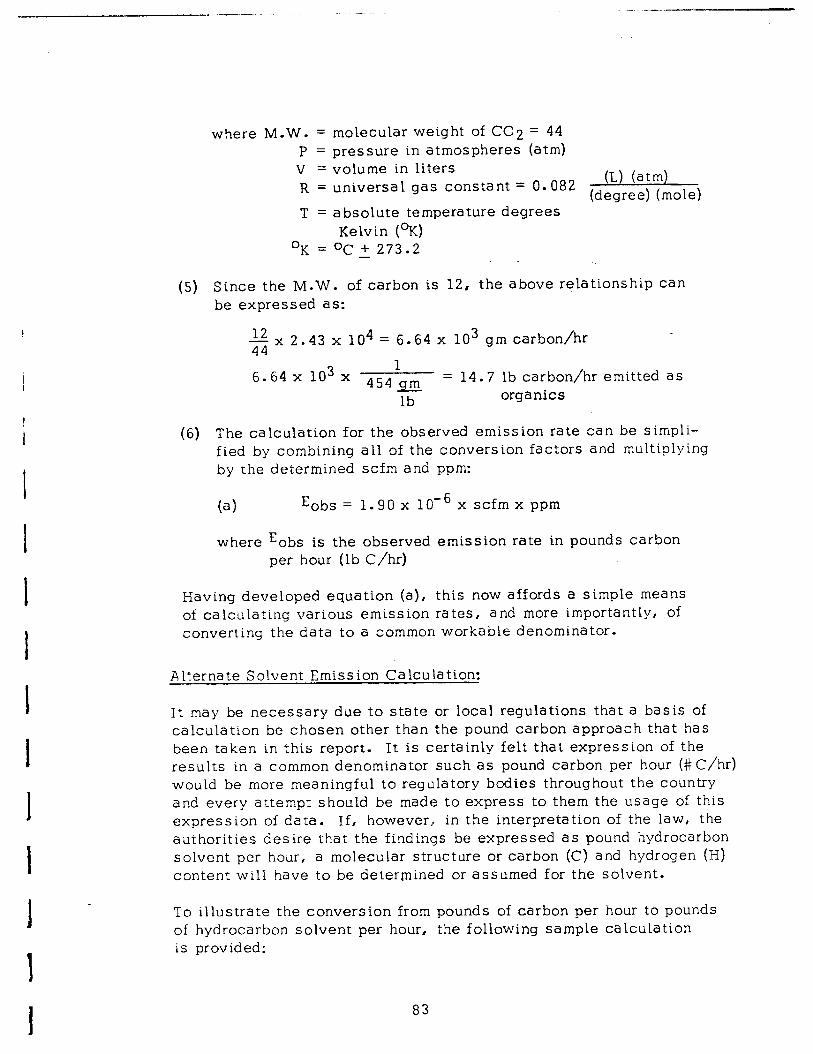
- . .--_.--
where M.W. = molecular weight of CC2 = 44 P = pressure in atmospheres (atm) V = volume in liters R = universal gas constant = 0.082
(L) (atm) (degree) (mole)
T = absolute temperature degrees Kelvin (OK)
OK = OC + 273.2 -_
(5) Since the M.W. of carbon is 12, the above relationship can be expressed as:
12 44
x 2.43 x lo4 = 6.64 x lo3 gm carbon/hr
6.64 x lo3 x 454 gm = 14.7 lb carbon/hr emitted as
lb organics
(6) The calculation for the observed emission rate can be simpli- fied by combining all of the conversion factors and multiplying by the determined scfm and ppm:
(4 Eobs = 1.90 x 10D6 x scfm x ppm
where Eobs is the observed emission rate in pounds carbon per hour (lb C/hr)
Having developed equation (a), this now affords a simple means of calculating various emission rates, and more importantly, of converting the data to a common workable denominator.
Alternate Solvent Emission Calculation:
It may be necessary due to state or local regulations that a basis of calculation be chosen other than the pound carbon approach that has been taken in this report. It is certainly felt that expression of the results in a common denominator such as pound carbon per hour (#C/hr) would be more meaningful to regulatory bodies throughout the country and every attempt should be made to express to them the usage of this expression of data. If, however,, in the interpretation of the law, the authorities desire that the findings be expressed as pound hydrocarbon solvent per hour, a molecular structure or carbon (C) and hydrogen (H) content will have to be determined or assumed for the solvent.
To illustrate the conversion from pounds of carbon per hour to pounds of hydrocarbon solvent per hour, the following sample calculation is provided:
83
-.
The solvent is assumed to be paraffinic with a genera1 formula CnH2n+2* The ratio of solvent weight to carbon content is as follows:
n(C) + (2n + 2) (3) n(C)
C = carbon molecular weight =-12 H = hydrogen molecular weight = 1
Thus, the ratio can be expressed as follows:
12n+ 2n + 2 = 14n-t 2 ti 1 17 12n 12n - l
Since n values generally will be greater than eight for hydrocarbon heatset solvents, and the assumed paraffinic structure provides the maximum solvent-carbon ratio, the constant value of 1.17 can be assumed with.an error of less than two percent. Thus, heatset hydrocarbon solvent emissions can be determined by multiplying the carbon emission rate by 1.1:7.
Brief consideration should be given at this point to the matter of significant figures utilized throughout calculations in this study. In any computation involving approximate numbers, the position of the decimal point as well as the number of significant digits (or significant figures) is important. The reader should take note that the calculated flow rate (recorded as scfm) is expressed as two significant digits with an estimated third digit. This is based on the fact that the least number of significant digits, in this case two, occurs in the measurement of the velocity head (manometer reading) in the performance of the velocity traverse and subsequent calculation of flow.
However, the organic content of the gas stream (recorded as a volume to volume percentage as carbon dioxide) is expressed as four signifi- cant digits. When approximate numbers are multiplied or divided as in equation (a), Section 5.61, the result is expressed with the number of significant digits identical to that of the least accurate number. In this report, the number of digits used for every value reflects the accuracy. Thus, the number of significant digits in the emission rate reflects the limiting measurement of the velocity head. Thus, the
a4
observed as well as calculated emission rates, expressed through- out the report as “lb carbon per hour” will appear as two significant digits with an estimated third.
5.62 Calculation of Material Inputs
So as to be able to compare organic outputs with inputs, thus, estab- lishing an approximate material balance for the process under evalua- tion, it was found desirable to develop a relationship which would permit the calculation of the pounds of organic materialactually intro- duced into a given process. Ideally, such a relationship would involve a minimum of process parameters whose magnitude could be readily or easily determined.
Thus, two equations were developed - one for web offset publica- tion printing, the other for metal decorating - both of which satis- fy the criterion stated above.
A. Web Offset Publication Printinq (Calculated Emission Rate)
The calculated emission rate for web offset expressed through- out this report as Ecalc can be stated as follows by equation (b):
b) Ecalc = Sf (I x P) + R
The terms utilized in equation (b) have the following signifi- ca rice:
Sf = The fractional solvent concentration of the ink. Generally, this value ranges from 0.3 to 0.4, or 30 percent to 40 percent by weight of the ink taken as solvent. Calculations utilized throughout this report are based on a 40 percent solvent (by weight) unless otherwise stated.
I = The ink usage rate (coverage) expressed in pounds per impression. An impression is defined as a completely inked sheet or folded booklet, depending on product: coverage is that calculated value relating the total quan- tity of ink used for the total impressions run. Therefore, the calculated coverage value as utilized by this study is inclusive of all printing units utilized whether the job is two-color or four-color perfecting or non-perfecting.
P = The press speed expressed as impressions per hour.
R = The residual organics emission exhaust observed, expressed as‘ lb carbon/hour, which is present during the operation of the dryer with unprinted paper, coated or uncoated, passing
a5
through it. Samplings conducted throughout this program indicate this background emission may range from 0.5 to 3.5 lb carbon per hour.
Sf (I x P)= pounds solvent per hour”pounds carbon per hour
Equation (b) permits the calculation of the rate oforganics emission (expressed as lb carbon/hour) which would be present if all the solvents passed unchanged through the dryer without loss: i.e., Ecalc represents the maximum possible organics emission rate.
B. Metal Decorating (Calculated Emission Rate)
The calculated emission rate for metal decorating operations expressed throughout this report as Ecalc can be stated as follows b.y equation (c):
(cl E CalC= sf + R
The terms utilized in equation (c) have the following signifi- cance:
Sf = The solvent fraction (by weight) in coating D = The sheet area expressed in square inches (sq in)‘per
sheet s = The coater speed (sheets/hr). This speed has been
calculated on the following basis:
s = sheets/min :x 60 min/hr x 0.95, where
0.95 is a factor determined from operational experience to allow for time necessary to change skids.
t =The essentially dry film weight applied expressed as milligram per square inch (mg/sq in).
1000 =Conversion factor (1000 mg = 1 gram)
453.6 = Conversion factor (453.6 gm = 1 lb)
1-Sf = The solids fraction (by weight) in the coating
R = The residual organics observed and derived from the oven operation expressed ‘as lb carbon/hour. Samplings conducted throughout this program indicate this
86
-..-._.-- -... --_ ..- .._
background emission due to the oven may range from 0.2 to 1.0 lb carbon per hour.
S f E Dxsxt 1000 x 453.6 x 1 (l-Sf) = pounds solvent per hour
“pounds carbon per hour
Equation (c) permits the calculation of the rate of organic emission (expressed as lb carbon/hr) which would be present if all the solvents passed unchanged through the oven without loss: i.e., .Ecalc repre- sents the maximum possible organic emission rate assuming that all solvents are hydrocarbons. Since it is recognized that oxygenated solvents are widely employed, it should be noted that equation (c) will overestimate the pounds of carbon emitted per hour. Since the coating solvents always consist of mixed solvent systems no explicit corrections factor is practical.
5.63 Siqnificance of the Material Balance
Equation (a) as discussed in Section 5.61 permits the calculation (for both the web offset and metal decorating operations) of the actual or observed emission rate expressed in pounds carbon per hour. Equations (b) and (c) (Section 5.62), depending on the pro- cess, provide the means for determining the maximum possible emission rate also expressed in pounds carbon per hour.
Having developed these relationships of the material inputs and outputs of the process, it is possible to present and define a term which will be of considerable utility in later discussions in this report. This is the so-called “C” factor and is defined as the ratio of the observed emission rate (material output) to the calculated emission rate (material input) and is expressed as follows as equation (d):
(d) Eobs
*’ = Ecalc “C” now becomes that fraction of the total organics used in the pro- cess and actually emitted to the atmosphere. Conversely, “1-C” beconnes that fraction of organics which can be assumed to be converted in the dryer or oven to carbon dioxide and water and/or retained in the paper as residual solvent, and/or in some other manner held unaccount- able. Thus, the organic conversion factor for a particular drying system or for that matter a particular process material input (various coatings, etc.) becomes “1-C”. This latter term “1-C” will be referred to in the report as the conversion factor. Its utility will lie in the fact that it can be used to assess the effectiveness of dryers and ovens in combust- ing/converting organics. This relationship will be encountered fre- quently in the ensuing discussions.
*The “C” value is based on the ratio of an experimentally deter-
mined number (Eobs) and an approximate calculated number (Eta lc). The interpretation of the accuracy of the l’CIV value should reflect the significant digits of the measurements. Section 5.61, p. 84.)
(See
87
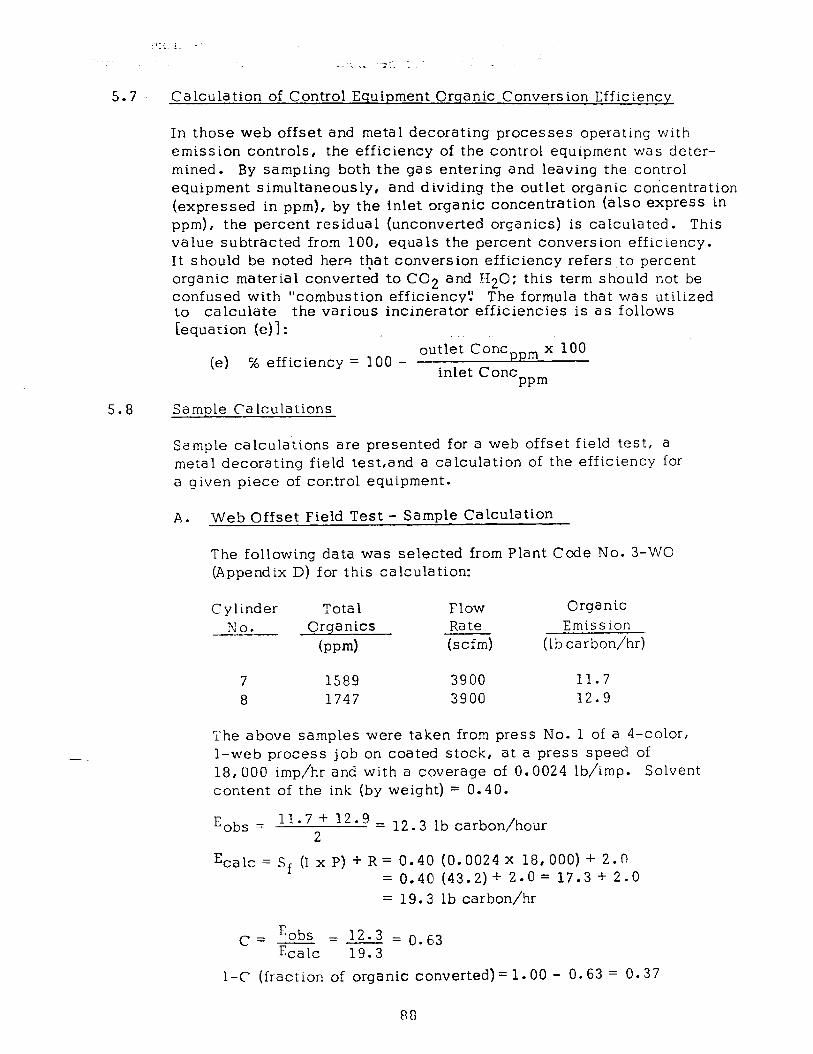
5.7 Calculation of Control Equipment Crqanic Conversion Efficiency
In those web offset and metal decorating processes operating with emission controls, the efficiency of the control equipment was deter- mined. By sampling both the gas entering and leaving the control equipment simultaneously, and dividing the outlet organic concentration (expressed in ppm), by the inlet organic concentration (also express in ppm), the percent residual (unconverted organics) is calculated. This value subtracted from 100, equals the percent conversion efficiency. It should be noted here that conversion efficiency refers to percent organic material converted to CO2 and H20; this term should not be confused with “combustion efficiency!’ The formula that was utilized to calculate the various incinerator efficiencies is as follows [equation (e) 1:
outlet Cone (e) % efficiency = 100 -
m x 100
inlet Cone mm
5.8 Sample Ca lculations
Sample calculations are presented for a web offset field test, a metal decorating field test,and a calculation of the efficiency for a given piece of control equipment.
A. Web Offset Field Test - Sample Calculation
The following data was selected from Plant Code No. 3-WO (Appendix D) for this calculation:
Cylinder Tota 1 Flow Organic NO. Crganics Rate Emission
kw-4 (scfm) (lb carbon/hr)
7 1589 3900 11.7 8 1747 3900 12.9
The above samples were taken from press No. 1 of a 4-color, l-web process job on coated stock, at a press speed of 18,000 imp/hr and with a coverage of 0.0024 lb/imp. Solvent content of the ink (by weight) = 0.40.
E obs = 11.7 + 12.9 2
= 12.3 lb carbon/hour
E talc = sf (I~ p) +R= 0.40 (0.0024x 18,000) + 2.0 = 0.40 (43.2) + 2.0 = 17.3 + 2.0 = 19.3 lb carbon/hr
C= Eobs = 12.3 = o.6,3 Eta lc 19.3
1-C (fraction of organic converted)= 1.00 - 0.63 = 0.37
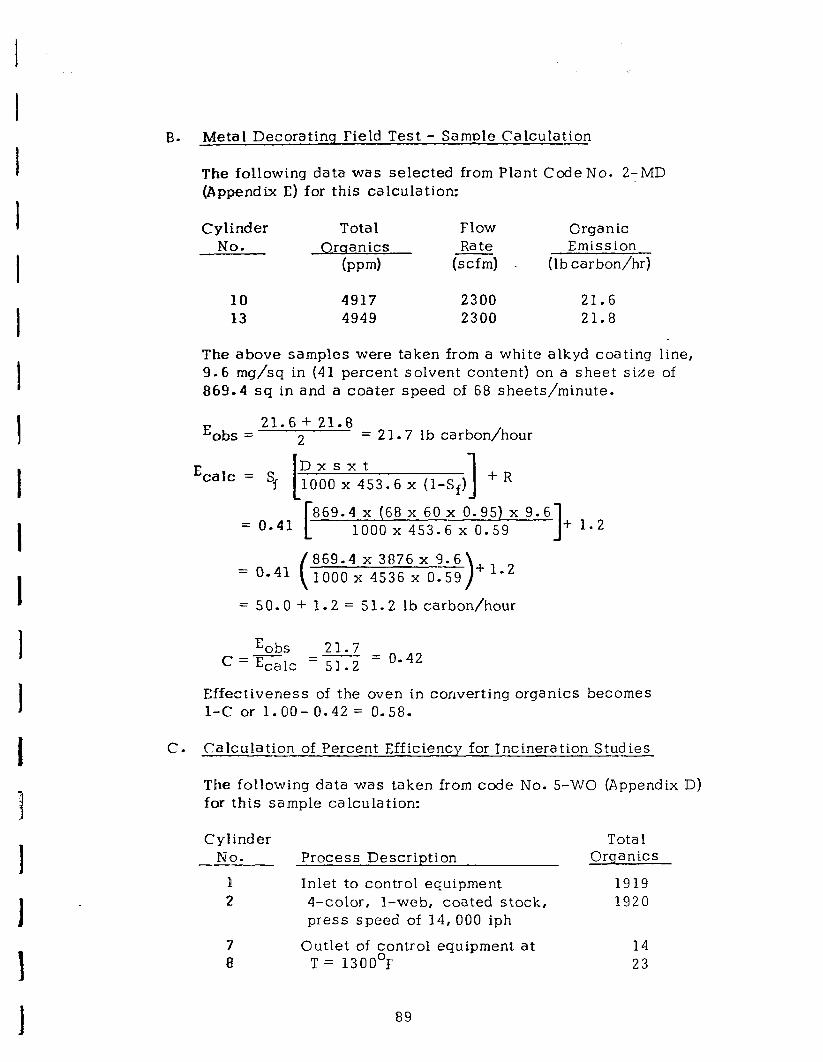
B. Metal Decorating Field Test - Sample Calculation
The following data was selected from Plant CodeNo. Z-MD (Appendix E) for this calculati.on:
Cylinder NO.
Total Flow Oraanics Rate
(mm) (scfm)
Organic Emission
(lb carbon/hr)
10 4917 2300 21.6 13 4949 2300 21.8
The above samples were taken from a white alkyd coating line, 9.6 mg/sq in (41 percent solvent content) on a sheet size of 869.4 sq in and a coater speed of 68 sheets/minute.
E 21-6 + - obs - 2 21*8 = carbon/hour 21.7 lb
E ca1c = ‘f
Dxsxt
L 1000 x 453.6 x (1-Sf)
I + R
869.4 x (68 x 60 x 0.95) x 9.6 = 0.41 C 1000 453.6 0.59 x x 1 + 1.2
869.4 x 3876 x 9.6 = 0.41 1000 x 4536 x 0.59
= 50.0 + 1.2 =: 51.2 lb carbon/hour
E obs 21.7 C=E,,1c =- = 0.42 51.2
Effectiveness of the oven in converting organics becomes 1-C or l.OO- 0.42 = 0.58.
c. Calculation of Percent Efficiency for Incineration Studies
The following data was taken from code No. 5-WO (Appendix D) for this sample calculation:
Cylinder Total NO. Process Description Organics
P Inlet to control equipment 1919 2 4-color, l-web, coated stock, 1920
press speed of 14, 000 iph
7 Outlet of control equipment at 14 8 T = 1300’F 23
89
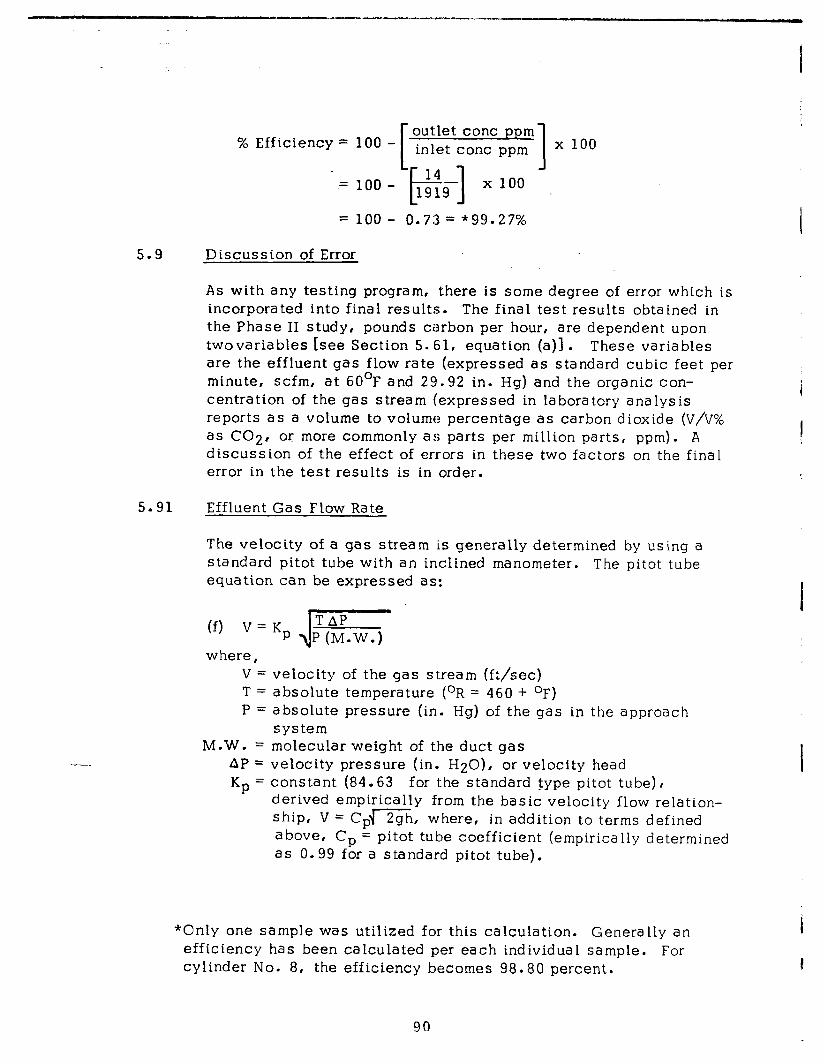
.s.-- -..“m.-*.--m .wl-.. -
I
% Efficiency = 100 - outlet cone ppm inlet cone ppm 1 x 100
= loo- 0.73 = “99.27%
5 . 9 Discussion of Error
As with any testing program, there is some degree of error which is incorporated into final results. The final test results obtained in the Phase II study, pounds carbon per hour, are dependent upon twovariables [see Section 5.61, equation (a)]. These variables are the effluent gas flow rate (expressed as standard cubic feet per minute, scfm, at 60°F and 29.92 in. Hg) and the organic con- centration of the gas stream (expressed in laboratory analysis reports as a volume to volume percentage as carbon dioxide (V/V% as C02, or more commonly as parts per million parts, ppm). A discussion of the effect of errors in these two factors on the final error in the test results is in order.
5.91 Effluent Gas Flow Rate
The velocity of a gas stream is generally determined by using a standard pitot tube with an inclined manometer. The pitot tube equation can be expressed as:
(f) V = Kp jz
where, V = velocity of the gas stream (ft/sec) T = absolute temperature (OR = 460 + OF) P = absolute pressure (in. Hg) of the gas in the approach
system M.W. = molecular weight of the duct gas
AP = velocity pressure (in. H20), or velocity head
KP = constant (84.63 for the standard type pitot tube), derived empirically from the basic velocity flow relation- ship, V = Cpi-?& where, in addition to terms defined above, Cp = pitot tube coefficient (empirically determined as 0.99 for a standard pitot tube).
*Only one sample was utilized for this calculation. Generally an efficiency has been calculated per each individual sample. For cylinder No. 8, the efficiency becomes 98.80 percent.
90
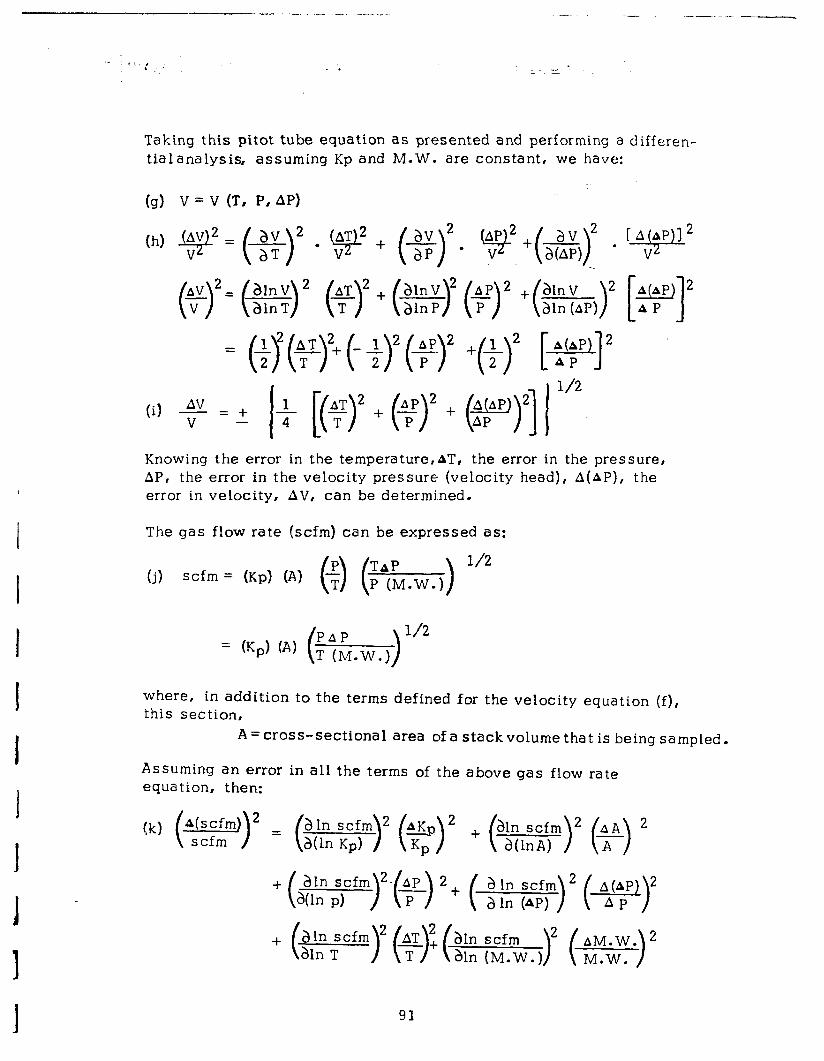
- --.-.- .-.. - -_._. .___“.
- .t:,, . *
Taking this pitot tube equation as presented and performing a differen- tialanalysis, assuming Kp and M.W. are constant, we have:
(g) V = V (T, P, AP)
(h) .y2 =
Av =
0
2
v
(i) + = + I$ [($)2 + (T>’ + (-y,“] 1 1’2
Knowing the error in the temperature,AT, the error in the pressure, AP, the error in the velocity pressure (velocity head), A(AP), the error in velocity, AV, can be determined.
The gas flow rate (scfm) can be expressed as:
(j) scfm = (KP) (A) (4 (E*(IA.w.J) 1’2
= (Kp) (A) (;;;ew.,)1’2
‘where, in addition to the terms defined for the velocity equation (f), this section,
A = cross-sectional area of a stack volume that is being sampled.
Assuming an error in all the terms of the above gas flow equation, then:
rate
(k) (e)’ = (aal;n;“b;“)z (y)’ + ($ssrrr)2 (y) 2
91
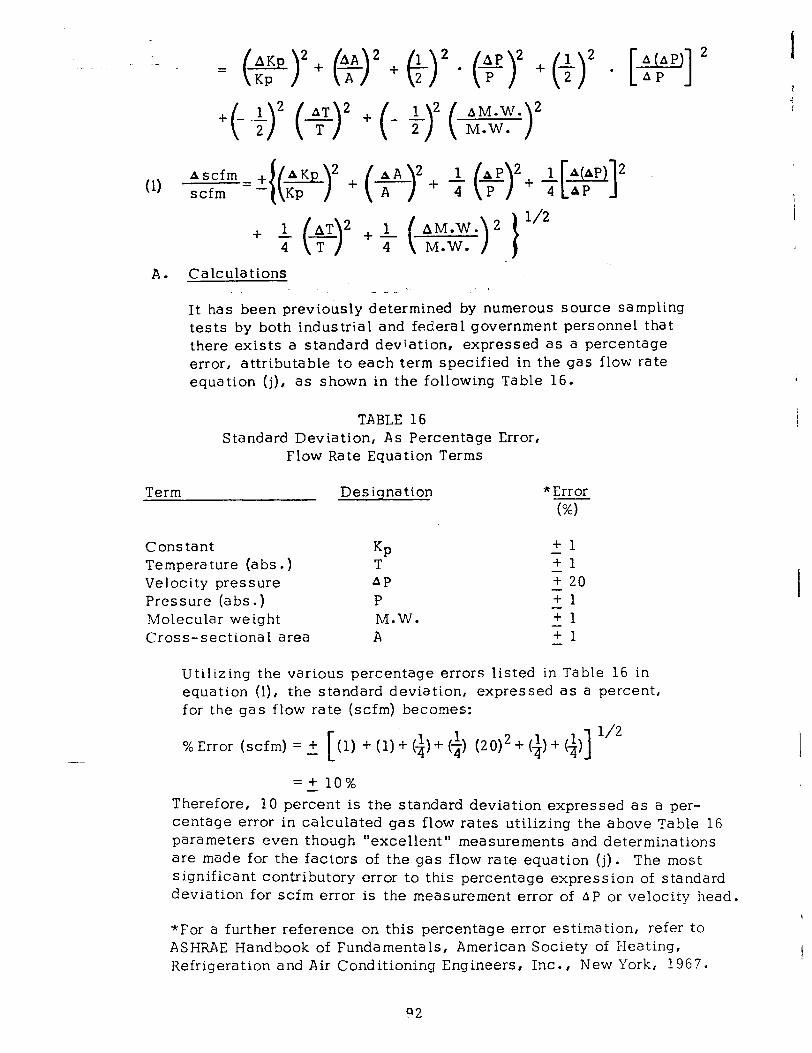
- _ = (e)Z.fy!.)2+(L)2.($Ey+(+)2. [y]’
+(- $2 (y)2 + (- +y ( AM--y=)2
(1) Ascfm scfm =2(($y + p-y + f (q)2+ +[$q2
+ f (mg)’ + + (A&vy y2
A. Calculations ._ _ .
It has been previously determined by numerous source sampling tests by both industrial and federal government personnel that there exists a standard deviation, expressed as a percentage error, attributable to each term specified in the gas flow rate equation (j), as shown in the following Table 16.
TABLE 16 Standard Deviation, As Percentage Error,
Flow Rate Equation Terms
Term Des iqna tion *Error (%I
Constant Temperature (a bs . ) Velocity pressure Pressure (abs.) Molecular weight Cross-sectional area
KP T AP P M.W. A
+1 71 f 20 ‘Tl +1 +1 -
Utilizing the various percentage errors listed in Table 16 in equation (l), the standard deviation, expressed as a percent, for the gas flow rate (scfm) becomes:
%Error (scfm) = + [(1) + (l)+ G)+ (i) (20)~. (+)+ (i)] 1’2 -
=t 10% Therefore, 10 percent is the standard deviation expressed as a per- centage error in calculated gas flow rates utilizing the above Table 16 parameters even though “excellent” measurements and determinations are made for the factors of the gas flow rate equation (j). The most significant contributory error to this percentage expression of standard deviation for scfm error is the measurement error of AP or velocity head.
*For a further reference on this percentage error estimation, refer to ASHRAE Handbook of Fundamentals, American Society of Heating, Refrigeration and Air Conditioning Engineers, Inc., New York, 1967.
92
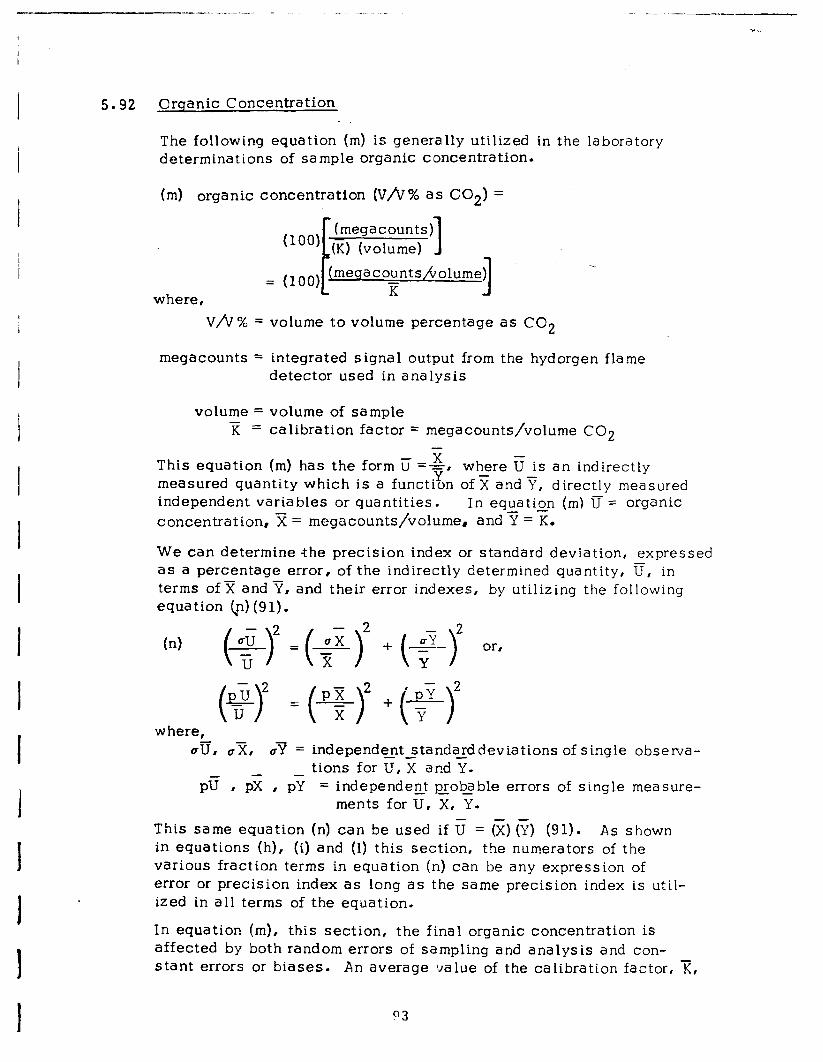
5.92 Orqanic Concentration
The following equation (m) is generally utilized in the laboratory determinations of sample organic concentration.
(m) organic concentration (V/V% as C02) =
(100) (megacounts) (K) (volume) I
= (100) meqacounts/trolume)
where, P ?T 3
V/V% = volume to volume percentage as CO2
megacounts = integrated signal output from the hydorgen flame detector used in analysis
volume = volume of sample x = calib ra ion factor = megacounts/volume CO2 t
x This equation (m) has the form E =-=# where ?! is an indirectly measured quantity which is a functi& of 2 and k, directly measured independent variables or quantities. In equatign (m) ?? = organic concentration, -zi = megacounts/volume, and ? = K.
We can determine the precision index or standard deviation, expressed as a percentage error, of the indirectly determined quantity, g, in terms of ?‘? and Y, and their error indexes, by utilizing the following equation @> (91).
(4 (+r =(+L>’ + (.-$-)” or,
where, fa, ox, CT = independent standa_yddeviations of single obsexva- --
tions for U, X and Y. PC I px , pT = independent zob_able errors of single measure-
ments for U, X, Y.
This same equation (n) can be used if ?? = (y) (y) (91). As shown in equations (h), (i) and (1) this section, the numerators of the various fraction terms in equation (n) can be any expression of error or precision index as lon’g as the same precision index is util- ized in all terms of the equation.
In equation (m), this section, the final organic concentration is affected by both random errors of sampling and analysis and con- stant errors or biases. An average value of the calibration factor, F,
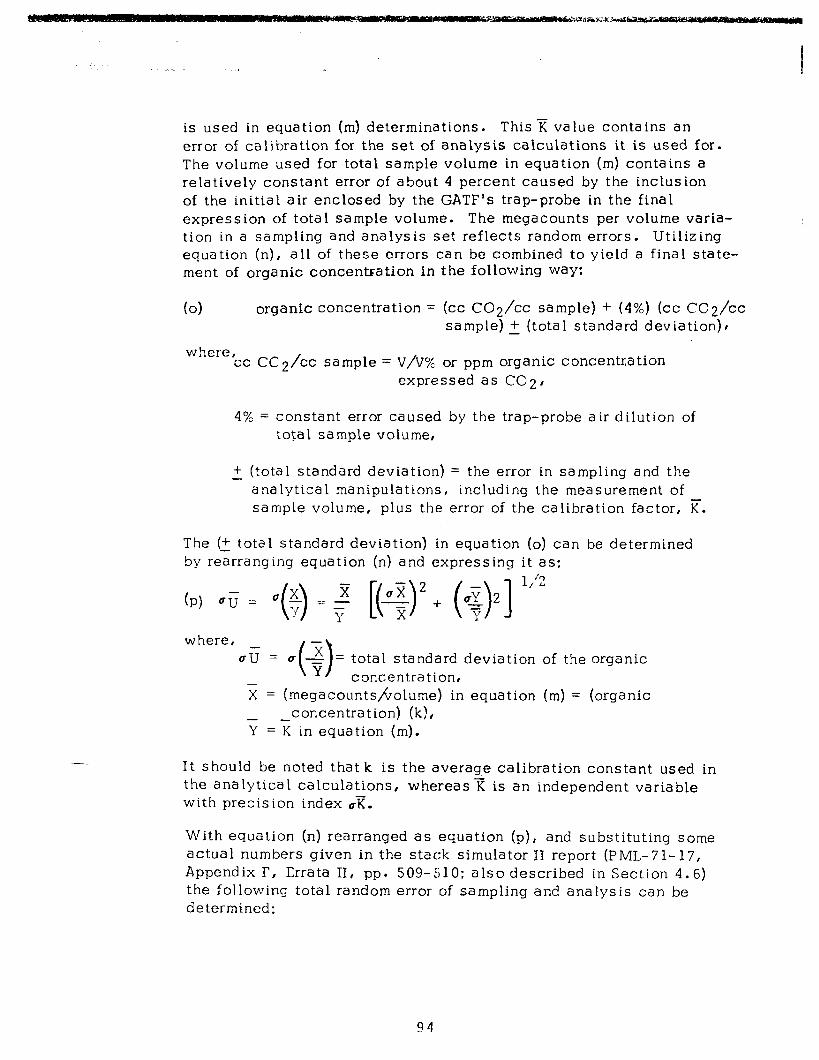
is used in equation (m) determinations. This ?T value contains an error of calibration for the set of analysis calculations it is used for. The volume used for total sample volume in equation (m) contains a relatively constant error of about 4 percent caused by the inclusion of the initial air enclosed by the GATF’s trap-probe in the final expression of total sample volume. The megacounts per volume varia- tion in a sampling and analysis set reflects random errors. Utilizing equation (n), all of these errors can be combined to yield a final state- ment of organic concentration in the following way:
(0) organic concentration = (cc CO2/cc sample) + (4%) (cc CO2/cc sample) + (total standard deviation),
where, cc CO2/cC sample = V/V% or ppm organic concentration
expressed as CO2,
4% = constant error caused by the trap-probe air dilution of total sample volume,
+ (total standard deviation) = the error in sampling and the - analytical manipulations, including the measurement of sample volume, plus the error of the calibration factor, K.
The (f total standard deviation) in equation (0) can be determined by rearranging equation (n) and expressing it as:
(p) “U = u($) = + [(2x)’ + (0.921 1/‘2
where, total standard deviation of the organic concentration,
X = (megacounts/Golume) in equation (m) = (organic - -concentration) (k), Y = K in equation (m).
It should be noted that k is the average calibration constant used in the analytical calculations , whereas x is an independent variable with precision index a??.
With equation (n) rearranged as equation (p), and substituting some actual numbers given in the stack simulator II report (PML-71-17, Appendix F, Errata II, pp* 509-510; also described in Section 4.6) the following total random error of sampling and analysis can be determined:
94
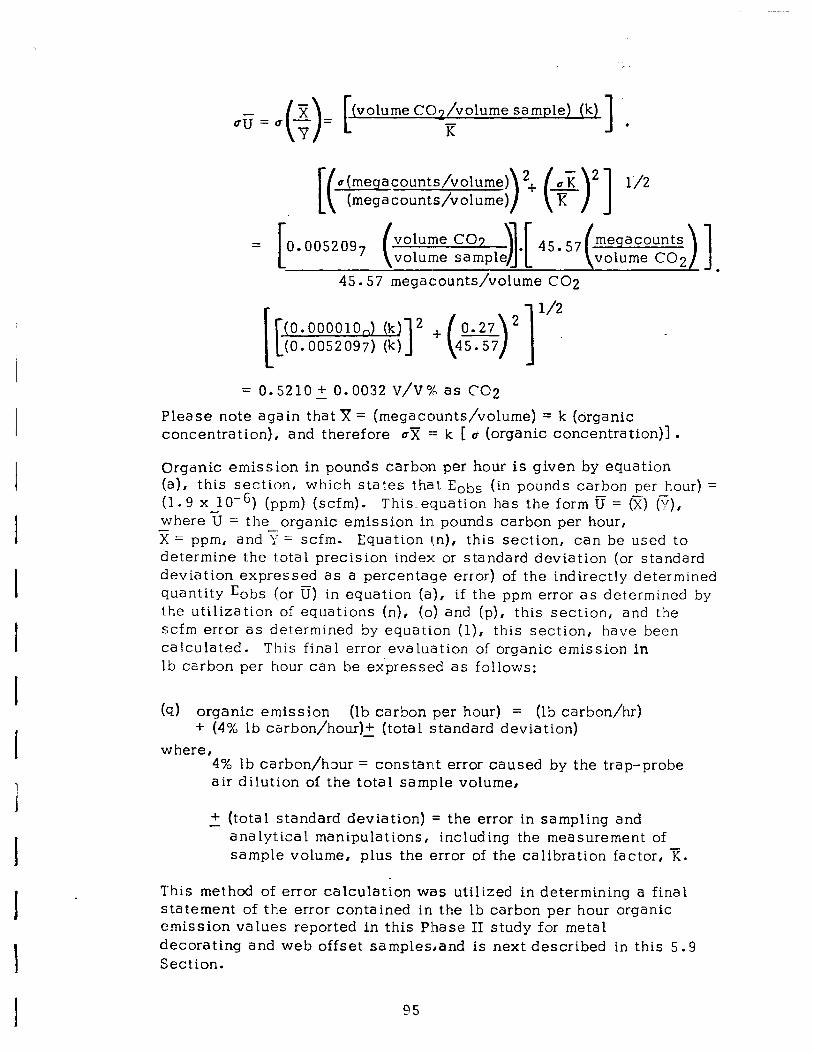
I I I I I I i I I 1 I
x 4+Q- = o[ (volume COT/volume sample) (k)
‘f Tc 1 .
K o(meqacounts/volume) ’ (mega counts/volume)
) + (z)“] 112
= [0.0052097 (;z;um$ Cc&J.[ 45*57(;e$aJa;n~J] .
45.57 megacounts/volume CO2
(0.000010,) (k) (0.0052097) (k)
1’ + (4!u)2]‘”
= 0.52102 0.0032 V/V% as CO2
Please note again that X= (megacounts/volume) = k (organic concentration), and therefore ux -= k [ u (organic concentration)] .
Organic emission in pounds carbon per hour is given by equation (a), this section, which states that Eobs (in pounds carbon per hour) = (1.9 x 10s6) (ppm) (scfm). This-equation has the form u = (2) (?), where 5 = the organic emission in. pounds carbon per hour, x = ppm, and ? = scfm. Equation (n), this section, can be used to determine the total precision index or standard deviation (or standard deviation expressed as a percentage error) of the indirectly determined quantity Eobs (or 8) in equation (a), if the ppm error as determined by the utilization of equations (n), (0) and (p), this section, and the scfm error as determined by equation (l), this section, have been calculated. This final error evaluation of organic emission in lb carbon per hour can he expressed as follows:
(9) organic emission (lb carbon per hour) = (lb carbon/hr) + (4% lb carbon/hour)? (total standard deviation)
where, 4% lb carbon/hour = constant error caused by the trap-probe air dilution of the total sample volume,
+ (total standard deviation) := the error in sampling and - analytical manipulations, including the measurement of sample volume, plus the error of the calibration factor, i?.
This method of error calculation was utilized in determining a final statement of the error contained in the lb carbon per hour organic emission values reported in this Phase II study for metal decorating and web offset samplesland is next described in this 5.9 Section.
95
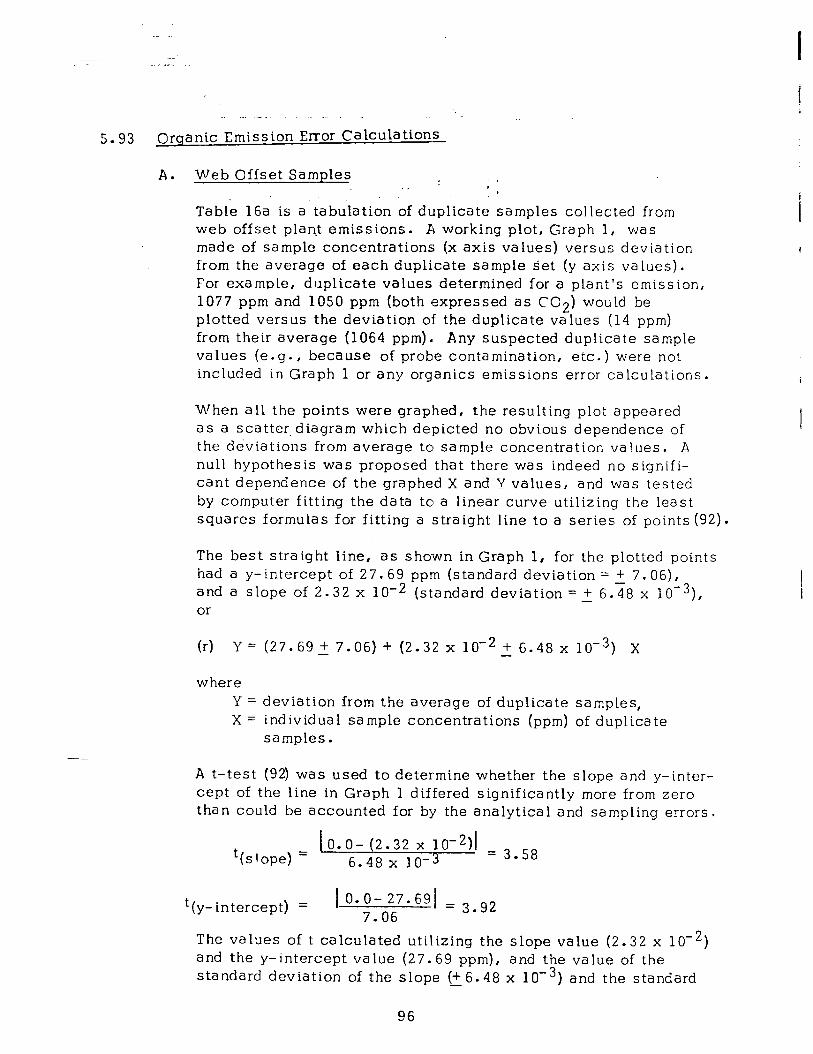
5.93 Orqanic Emission Error Calculations-
A. Web Offset Samples I ., . ’ Table 16a is a tabulation of duplicate samples collected from web offset plant emissions. A working plot, Graph 1, was made of sample concentrations (x axis values) versus deviation from the average of each duplicate sample set (y axis values). For example, duplicate values determined for a plant’s emission, 1077 ppm and 1050 ppm (both expressed as C02) would be plotted versus the deviation of the duplicate values (14 ppm) from their average (1064 ppm). Any suspected duplicate sample values (e.g., because of probe contamination, etc. ) were not included in Graph 1. or any organics emissions error calculations.
When all the points were graphed, the resulting plot appeared as a scatter.diagram which depicted no obvious dependence of the deviations from average to1 sample concentration values. A null hypothesis was proposed that there was indeed no signifi- cant dependence of the graphed X and Y values, and was tested by computer fitting the data to a linear curve utilizing the least squares formulas for fitting a *straight line to a series of points (92).
The best straight line, as shown in Graph 1, for the plotted points had a y-intercept of 27.69 ppm (standard deviation = + 7.06), and a slope of 2.32 x lo- 2 (standard deviation = + 6.48 x 10e3), or
(r) Y= (27.692 7.06) + (2.32 x 10V2+ 6.48 x 10s3) X
where Y = deviation from the average of duplicate samples, X = individual sample concentrations (ppm) of duplicate
samples.
A t-test (92) was used to determine whether the slope and y-inter- cept of the line in Graph 1 differed significantly more from zero than could be accounted for by the analytical and sampling errors.
t(y- intercept) = 1 O-O- 27.691 = 3 g2 7.06
.
The values of t calculated utilizing the slope value (2.32 x 10s2) and the y-intercept value (27.69 ppm), and the value of the standard deviation of the slope (+ 6.48 x 10m3) and the standard -
96
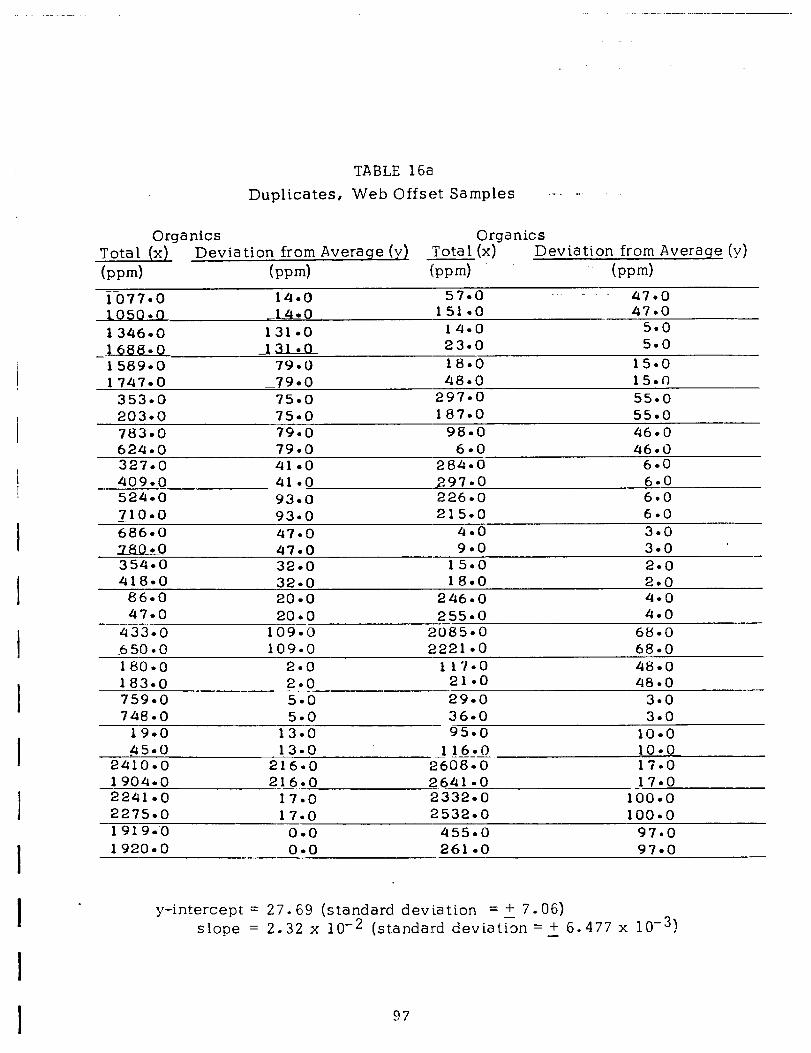
_- -
TABLE 16a
Dupl icates, Web Offset Samples
Organics Deviatioy f Total (x)
b-d
Organics ‘rom Averaqe (y) Total (x) Deviation from Average (y)
bw) bpm) ’ - (w-d 1077.6 14.0 57.0 47.0 LO50 0 1346L
14.0. 151 .o 47.0 131.0 14.0 5.0
1680 0 131 0 23.0 5.0 -1 ss9:o 79:” 18.0 15.0
1747.0 -79*0 48.0 15.1) 353.0 75.0 297-o 55.0 203.0 75.0 187.0 55.0 783.0 79.0 98.0 46.0 624.0 79.0 6.0 46.0 327.0 41.0 284.0 6.0 409.0 41.0 297.0 6*0 524.0 93.0 226.0 6.0 71~0.0 93.0 215.0 6.0
686.0 47.0 4.0 3.0 ZittSQdO 47.0 9.0 3.0 ’ 354*0 32.0 15.0 2.0 418.0 32.0 18.0 2.0
86.0 20.0 246=0 4.0 47.0 20.0 255.0 4.0
433.0 109.0 2085.0 68.0 650.0
-750.0 109-o 2221 .o 68.0
2.0 117.0 48.0 183.0 2.0 21.0 48.0 759.0 5.0 29.0 3.0 748.0 5.0 36.0 3.0 -
19.0 13.0 95.0 10.0 45.0 13.0 _! ra-4 10.0
2410.0 216.0 2608.0 17.0 1904.0 2u.o 2641 l O 7.700 2241 .O 17.0 2332.0 100.0 2275.0 17.0 2532.0 100.0 1919.0 0.0 455.0 97.0 1920.0 0.0 261.0 97.0
y-intercept = 27.69 (standard deviation = + 7.06) slope = 2.32 x 10 -2 (standard deviatk =t 6.477 x 10e3)
97
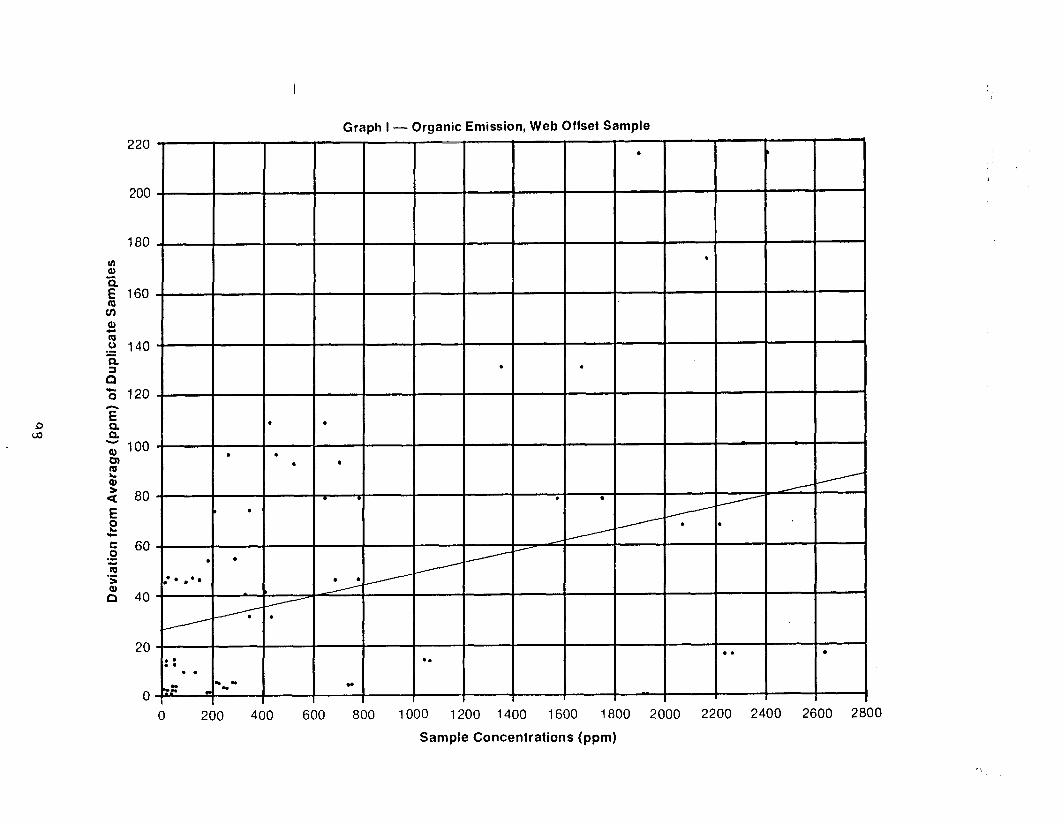
220
200
180
80
20 - :: . .
0 yr" c
.
.
.
A
I-a .
.
Graph I - Organic Emission, Web Offset Sample
. .
. .
. . .
.
. . . .
w
1
.
0 200 400 600 800 1000 1200 1400 1600 1800 2000 2200 2400 2600 2800
Sample Concentrations (ppm)

I
I I I I I I I I 1 I I
deviation of the y-intercept k 7.06 ppm) was compared to the tabular t values, entering the table with 66 (number of points - 2) degrees of freedom (93). Since the calculated t values exceeded the tabular t value at the 99 percent confidence level, it was con- cluded that the slope and y-intercept of the line in Graph 1 both differed significantly from zero, which indicated that the error, or deviation from the average values, of duplicate samples is dependent upon the individual sample’s organics concentration, thus disproving the hypothesis that no dependency existed.
The deviation from the average value of duplicate samples, one of which, supposedly, has an organics concentration of 2000 ppm (as CO2) would be given by:
Deviation from average = 27.7 + (2.32 x 10Y2) (2.0 x 10³) = 27.7 + 46.4 = 74.1 ppm
This can then be converted to the standard deviation for the individual organic sample values of the duplicate sample values set:
Standard Deviation (individua!l sample value) = [ (74.1)2+ (74.1>2
l/2
2-l 1 = L’lO4.79 ppm
Expressed as a percentage error for the 2000 ppm sample value, the standard deviation can be represented bv:
Standard Deviation (as percentage error) =I + 104.79 - ( 1
(100) 2000
= + 5.24 % -
Assuming that calibration factor, ??, used in the determination of the organic sample value (ppm as C02) using equation (m) has a maximum standard deviation, expressed as a percentage, of 1. 0 percent, the following total random error of sampling and analysis for the 2000 ppm sample value can be determined by employing equation (p):
Total random error, ppm, (or total standarddeviation, = (2000 ppm)[(O. 0524)2 + (0. 01)21
l/2
individual sample values) = 2 106.80 ppm
Total random error, %, (or total standard devia- := (100) =+ 5.34 % tion, as a percentage)
The final organic value (ppm, as CO2), including the 4 percent
99
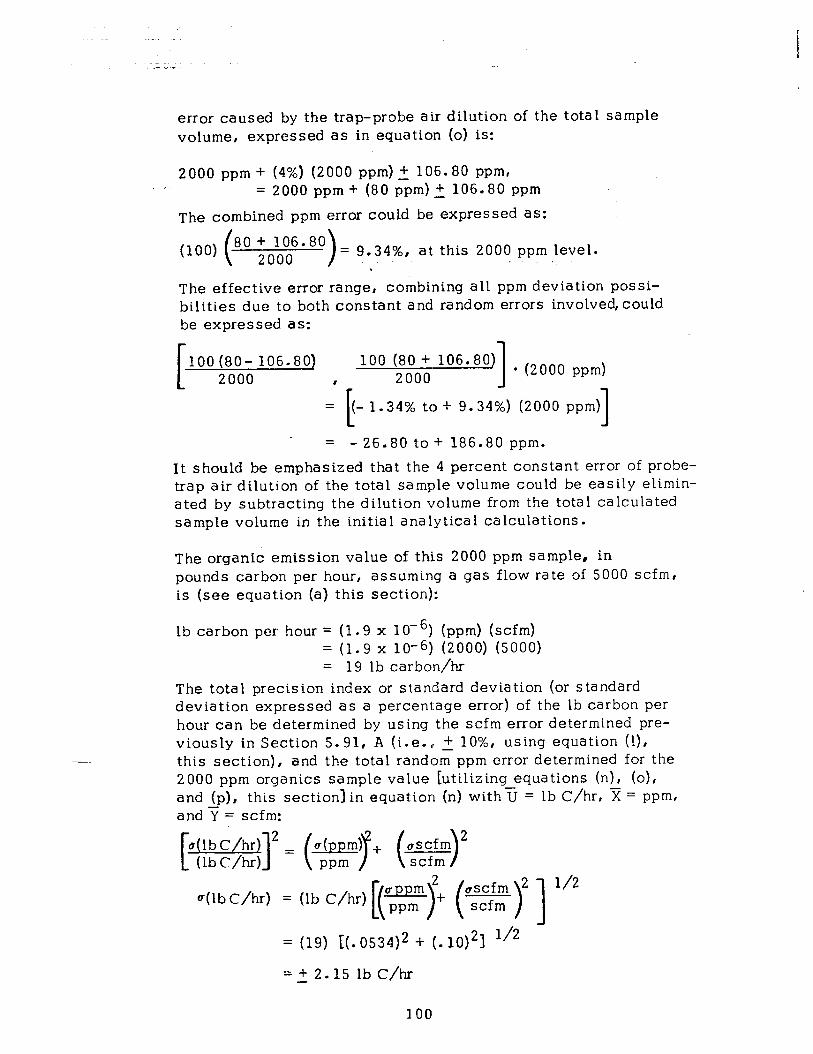
-
error caused by the trap-probe air dilution of the total sample volume, expressed as in equation (0) is:
2000 ppm + (4%) (2000 ppm) 2 106.80 ppm, , = 2000 ppm + (80 ppm) 2 106.80 ppm
The combined ppm error could be expressed as:
(100) 80 + 106.80
2000 > = 9.34%, at this 2000 ppm level.
\ The effective error range, combining all ppm deviation possi- bilities due to both constant and random errors involved,could be expressed as:
[ 100 (80- 106.80) 100 (80 + 106.80)
2000 . 2000 1 l (2000 ppm)
= (- 1.34% to + 9.34%) (2000 ppm) L 1 = - 26.80 to + 186.80 ppm.
It should be emphasized that the 4 percent constant error of probe- trap air dilution of the total sample volume could be easily elimin- ated by subtracting the dilution volume from the total calculated sample volume in the initial analytical calculations.
The organic emission value of this 2000 ppm sample, in pounds carbon per hour, assuming a gas flow rate of 5000 scfm, is (see equation (a) this section):
lb carbon per hour = (1.9 x 10V6) (ppm) (scfm) = (1.9 x 10 -6) (2000) (5000) = 19 lb carbon/hr
The total precision index or standard deviation (or standard deviation expressed as a percentage error) of the lb carbon per hour can be determined by using the scfm error determined pre- viously in Section 5.91, A (i.e.,, + lo%, using equation (l), this section), and the total random ppm error determined for the 2000 ppm organics sample value [utilizing equations (n), (o), and (n), this section] in equation (n) with3 = lb C/hr, 5? = ppm, and Y = scfm:
[~3’= (Deb+ (E&g’
a(lbC/hr) = (lb C/hr) 3 m
= (19) I(.O534)2 + (. 1o)2l 1’2
=t 2.15 lb C/hr
100
Total standard deviation, = as a percentage
The final error evaluation of the organic emission in lb carbon/ hour can be expressed as in equation (q), this section:
19 ibC/hr + (4%) (19 lbC/hr)+ 2.15 lbC/hr = 19 lbC/hr + (0.76 lb C/hr) + 2.15 lb C/hr.
-_ -. The combined (IbC/hr) error could be expressed as:
E 0.76 + 2.15
(100) 19 1 = 15.32%
The effective error range combining all (lb C/hr) deviation possi- bilities due to both constant and random errors involved could be expres sed a s:
(100) (0.76- 2.1,5),(100) W6+2=15+lg lbC/hr) 19 19 1
= I-7.32% to+ 15.32%‘1( 19 lb C/hr) = - 1.39 to -+ 2.91 (lb C/hr)
Again, it should be noted that the 4 percent constant error of the probe- trap air dilution of tota 1 sample volume could be easily eliminated by subtracting the dilution volume from the total sample volume in the initial analytical calculations.
B. Metal Decorating Samples
Table 16b is a tabulation of duplicate samples collected from metal decorating plant emissions. The same method of data analysis performed in Section 5.93, A, was emplqyed in this section B, and it was determined that the graphed points should be linearily fitted utilizing the least squares formulas for fitting a straight line to a series of po#ints. The best straight line, as shown in Graph 2, for the plotted points had a y-intercept of 68.27 ppm (standard deviation:=+ 21.82 ppm), and a slope of 1.46 x 10⁻² (standard deviation =+ 3.21 x lo-3), or
(s) Y= (68.27221.82)+ (1.46x10⁻²L 3.21~10~~) X
where Y = deviation from the average of duplicate samples, X = individual sample co:ncentrations (ppm) of duplicate
samples. - Again, a t-test was used, as in Section 5.93;A,to determine whether the slope and y-intercept of the line in Graph 2 differed significantly more from zero than could be accounted for by the analytical and sampling errors.
101
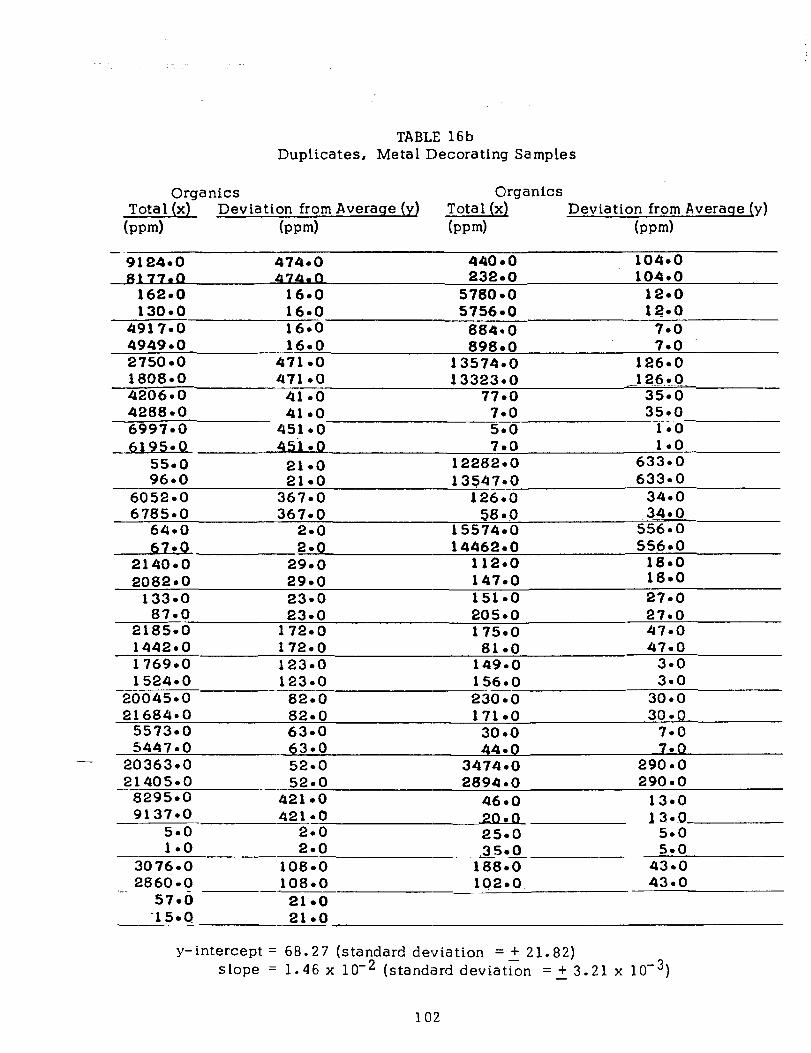
TABLE 16b Duplicates, Metal Decorating Samples
Orga nits Deviation from Average (y) (;;E; (x)
(m-d
Organics Deviation from Average (y)
(pm) -.-
9124.0 474.0 440.0 104.0 8177.0 474.0 232.0 104.0
162.0 16.0 5780.0 12.0 130.0 16.0 5756.0 12.0
4917.0 16.0 884.0 7.0 4949.0 16.0 898eO 7.0 2750.0 471.0 13574.0 126.0 1808.0 471 .o 13323.0 -1 26.~0.
41.0 77.0 35*0 4288.0 41 l 0 7.0 35.0 6997.0 451 .o 5.0 1.0 6195.0 7.0 1.0 -
55.0 21.0 12282.0 633.0 96.0 21.0 13$47*0 633.0
6052.0 367.0 126.0 34.0 6785.0 367.0 58 4 -34.0
64.0 2*0 15574.0 556.0 -m. 2.0 14462.0 556.0
2140.0 29.0 112.0 18.0 2082.0 29.0 147.0 18.0
133.0 23.0 151.0 27-O 87.0 23.0 205.0 27.0
2185.0 172.0 175.0 47.0 1442.0 172.0 81.0 47.0
-i 769.0 123.0 149.0 3.0 1524.0 123.0 156.0 3.0
-20045.0 82.0 230.0 30.0 21684.0 82.0 171.0 30.c
5573.0 63.0 30.0 7.0 5447.0 63.0 0 70
- 20363.0 52.0 34z:o 290:o 21405.0 52.0 2894.0 290.0
8295.0 421 .O 46.0 13.0 9137.0 421.0
S-O- 20 0 25:o
13.0 2.0 5.0
1.0 2.0 5-F 9.. -_ _L 35.E 3076.0 108.0 188.0 43.0 2660.0 108.0 102.0 . . 57.0 -_ 43.0- --
21.0 ‘15.0 .--_ -z 21.0 -____
y-intercept = 68.27 (standard deviation = + 21.82) slope = 1.46 x 10m2 (standard deviation = + 3.21 x 10e3)
102
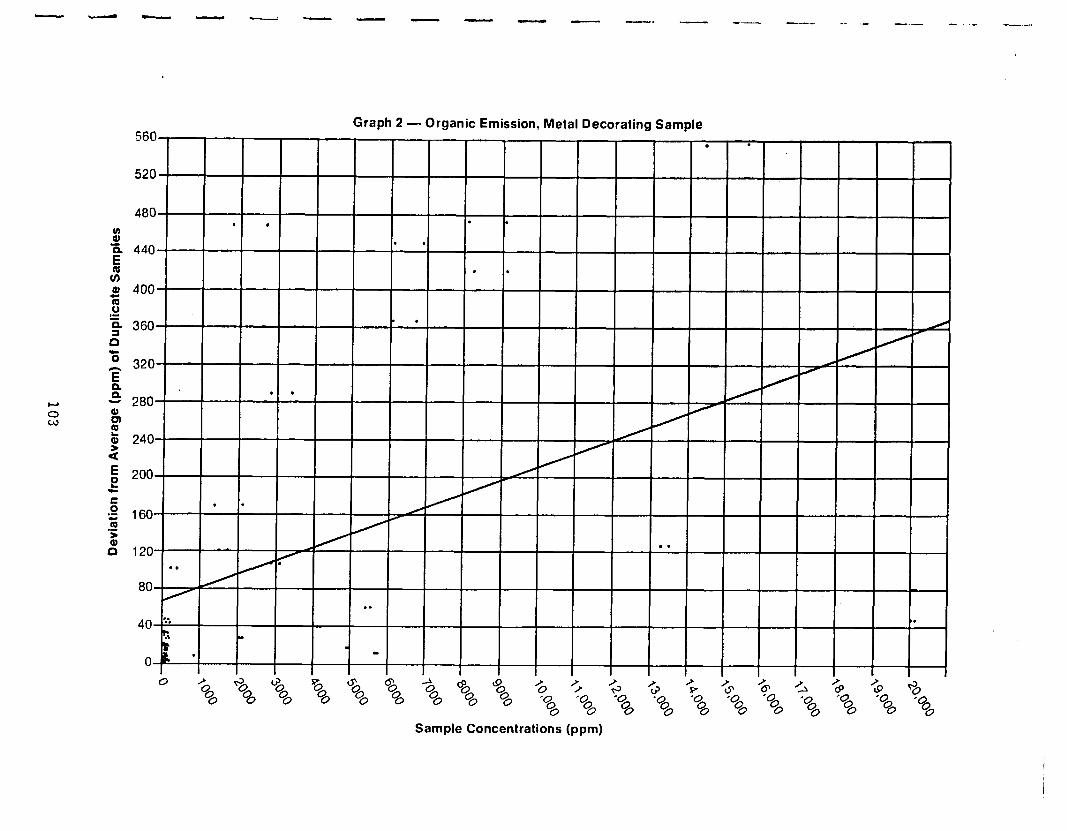
Graph 2 - OrganlC tmlSSlOn, Metal Decorating Sample 560 . .
520
480 . . . .
$ B 440
. .
E G
. . I
0, 400 5 ‘% 360
/ . . Y p’
’ 320 A
E
; 280 B . .
0 t 240 2 ; 200 c s . . *s 160 / *- 5 Q 120
. .
80 . .
4&t: ~~ ~~ . .
r n ?
o* l
m
0 I’0 $3 % PO q$ % -& ql 90 I’0 5 $ 5 G fi- “s 5 $ ,‘9 +
Oo Oo Oo o. o. 00 o. o. o. ‘0 ‘0 ‘0 ‘0 ‘0 ‘0 ‘O. ‘0 ‘O. ‘O. ‘0
00 00 00 00 00 00 0 00 0 0 00
Sample Concentrations (ppm)

_..- _- ___._. --.---.~-
I 0.0 - (1.46 x t(slope) = 3.21 x 10⁻³ 10-2LI= 4 . 55
. t(y- intercept) = lO.O- 68.271 = 3 * 13
21.82 ,. ._ .,._ ._.. .-. ._ . .,. ., --
The values of t calculated utilizing the slope value (1.46 x 10D2) and the y-intercept value (68.27 ppm), and the value of the standard deviation of the slope k 3.21 x 10⁻³) and the standard deviation of the y-intercept & 21.82 ppm) was compared to the tabular t values, entering the table with 76 (number of points - 2) degrees of freedom. Since the calculated t values exceeded the tabular t value at the 99 percent confidence level, it was con-
. eluded that the slope and y-intercept of the line in Graph 2 both differed significantly from zero which demonstrated again, as in Section 5.93A, that the error, or deviation from the average values, of duplicate samples is dependent upon the individual sample’s organics concentration.
The deviation from the average value of duplicate samples, one of which, supposedly, has an organic concentration of 10,000 ppm (as C02) would be given by:
Deviation from average = 68.27 + (1.46x 10W2) (100 x 102) = 68.27 + 146.00 = 214.27 ppm
This can then be converted to the standard deviation for the individual organic sample values of the duplicate Sample value set:
Standard deviation (individual sample volume) =
(214.27)2+ (214.27)2 1’2 2-l 1
=+ 303.02 ppm
Expressed as a percentage error for this 10,000 ppm sample value, the standard deviation can be represented by:
Standard deviation (as percentage error) =
( 2k:2) (100) =t 3.03%
Assuming that the calibration factor, F, used in the determination of the organic sample value (ppm as C02) using equation (m) has a maximum standard deviation, expressed as a percentage, of l.O%, the following total random error of sampling and analysis for the 10,000 ppm sample value can be determined by employing equation (p):
104
I I I I ! 1 I I I I
total random error, ppm, (or total standard deviation, individual sample values) =
(10,000 ppm) [(O. 0303)2 + (0. Ol.)21 1’2 =t 319.08 ppm
total random error, %, (or total standard deviation, as a percentage) =
t ) ‘“,‘;;;8 (100) = + 3.19 % I . .
The final organic value (ppm, as C02) including the 4 percent error caused by the trap-probe air dilution of the total sample volume, expressed as in equation (0) is:
10,000 ppm + (4%) (10,OOOppm)t 319.08 ppm, = 10,000 ppm+ 400 ppmt 319.08 ppm
The combined ppm error could be expressed as:
(100) 400 + 319.08 10,000 >
= 7.19%, at this 10,000 ppm level.
The effective error range, combining all ppm deviation possi- bilities due to both constant and random errors involved could be expressed as:
100 (400- 319.08) 100 (400+ 319.08) 10,000
, 10,000 1 . (10,000 ppm)
= [(+O- 81% to + 7.19%) (10,000 ppm)] = + 81 to + 719 ppm
It should again be emphasized that the 4 percent constant error of probe-trap air dilution of the total sample volume could be easily eliminated by subtracting the dilution volume from the total calculated sample volume in the initial analytical calcula- tions.
The organic emission value of this lo., 000 ppm sample, in pounds carbon per hour, assuming a gas flow rate of 3000 scfm is (see equation (a), this section):
lb carbon per hour = (1.9 x 10W6) (ppm) (scfm) = (1.9 x 10-G) (10,000) (3000) = 57 lb carbon/hr
The total precision index or standard deviation (or standard deviation expressed as a percentage error) of the lb carbon per hour can be determined by using the scfm error determined pre- viously in Section 5.91,A, (i.e. 2 X0 percent, using equation (l), this section), and the total random ppm error determined for the 10,000 ppm organics sample value (utilizing equations (n), lo), and (p), this section) in equation (n) with g = lb C/hr, X = ppm, and Y = scfm:
105

-1 cfm 2 / ascfm ( > 2 scfm
. Irr
.A
= (57) [(0.0319)2+ (o.10)231’”
=+ 5.98 lbC/hr
Total standard deviation = as a percentage
The final error evaluation of th.e organic emission, in lb carbon/hour,can be expressed in equation (q), this section:
57 lb C/hr + (4%)(57 lbC/hr)f: 5.98 lbC/hr = 57 lb C/hr + 2.28 lb C/hr+ 5.98 lbC/hr
The combined (lb C/h.r) error ciould be expressed as:
(100) (,.,,,,.,,>= 14.49%
The effective error range combining all (lb C/hr) deviation possi- bilities due to both constant and random errors involved could be expressed as:
(2.28- 5.98) , (100) (2.28 + 5.98) 57 57 1 57 IbC,hr
= [- 6.49% to + 14.49%‘J (57 lb C/hr) = - 3.70 to 8.26 (lb C/hr)
- Subtraction of the probe-trap dilution vojume from the total sample volume in the initiat analytical calculations would eliminate, as stated previously, the 4 percent constant error.
106

I I I I I-
I
5.94 Summary of Error, Orqanics Emission Calculations
A. Web Offset Samples
1. The error, or deviation from average values, for duplicate samples is dependent upon the individual sample’s organics concentra- tion level (see pp. 96-99).
2. For an average web offset printing operation from which duplicate organics concentration samples have been taken from a fairly uniform exhaust gas flow sampling point (exhaust gas flow rate= 5000 scfm) and analyzed to yield an organics concentration of 2000 ppm (expressed as C02) for one of the duplicate samples:
a. The total ppm random error of sampling a& analysis -- for the 2000 ppm sample value, expressed as total standard deviation, as a percentage, is 2 5.34 percent (seepp. 99-100).
b. The organics emission value of this 2000 ppm sample, in pounds carbon per hour, is 19 lb carbon/hr; the total precision index or standard deviation, expressed as a percentage error, of this lb carbon per hour value is 2 11.32 percent (see pp. loo- 101).
B. Metal Decorating Samples
1. The error, or deviation from average values, for duplicate samples is dependent upon the individual sample’s organics concentration level (see pp. 101-104).
2. For an average metal decorating operation from which duplicate orgarncs concentration samples have been taken from a fairly uniform exhaust gas flow sampling point (exhaust gas flow rate = 3000 scfm) and analyzed to yield an organics concentra- tion of 10,000 ppm (expressed as CO,) for one of the duplicate samples:
a. The totalppm random error of sampling and analysis for the -- 10,000 ppm sample value, expressed as total standard devia- tion, as a percentage, is + 3.19 percent (see pp. 104- 105). _
b. The organics emission value of this 10, 000 ppm sample, in pounds carbon per hour, is 57 lb carbon/hr; the total pre- cision index or standard deviation, expressed as a percent- age error, of this lb carbon per hour value is + 10.49 percent (see pp. 105-106).
107
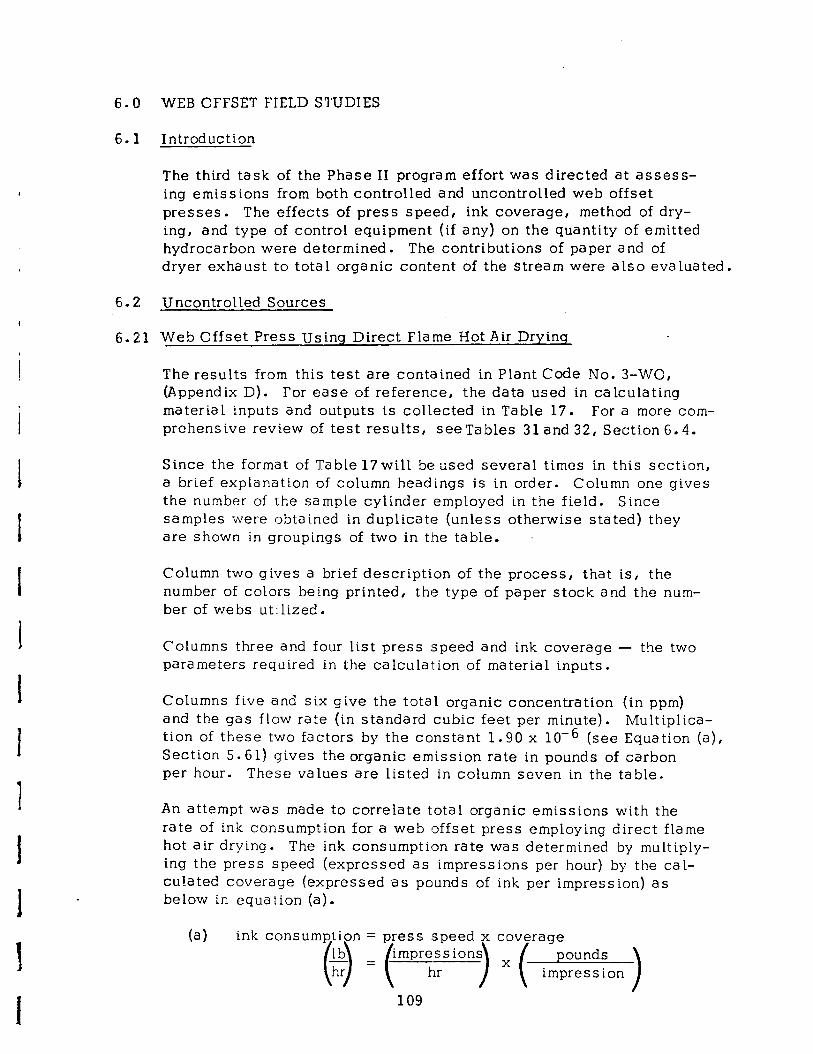
6.0 WEB OFFSET FIELD STUDIES
6.1. Introduction
The third task of the Phase II program effort was directed at assess- ing emissions from both controlled and uncontrolled web offset presses. The effects of press speed, ink coverage, method of dry- ing, and type of control equipment (if any) on the quantity of emitted hydrocarbon were determined. The contributions of paper and of dryer exhaust to total organic content of the stream were also eva tua ted.
6.2 Uncontrolled Sources
6.21 Web Offset Press Using Direct Flame Hot Air Drying
The results from this test are contained in Plant Code No. 3-WO, (Append ix D) . For ease of reference, the data used in calculating material inputs and outputs is collected in Table 17. For a more com- prehensive review of test results, SeeTables 3land32, Section6.4.
Since the format of Table 17will be used several times in this section, a brief explanation of column headings is in order. Column one gives the number of the sample cylinder employed in the field. Since samples were obtained in duplicate (unless otherwise stated) they are shown in groupings of two in the table.
Column two gives a brief description of the process, that is, the number of colors being printed, the type of paper stock and the num- ber of webs utilized.
Columns three and four list press speed and ink coverage - the two parameters required in the calculation of material inputs.
Columns five and six give the total organic concentration (in ppm) and the gas flow rate (in standard cubic feet per minute). Multiplica- tion of these two factors by the constant 1.90 x 10m6 (see Equation (a), Section 5.61) gives the organic emission rate in pounds of carbon per hour. These values are listed in column seven in the table.
An attempt was made to correlate total organic emissions with the rate of ink consumption for a web (offset press employing direct flame hot air drying. The ink consumption rate was determined by multiply- ing the press speed (expressed as impressions per hour) by the cal- cu!ated coverage (expressed as pounds of ink per impression) as below in equation (a).
(a) ink consumption = press rspeed x coverage
(3 = (T.) x ( i;z;t;on)
109
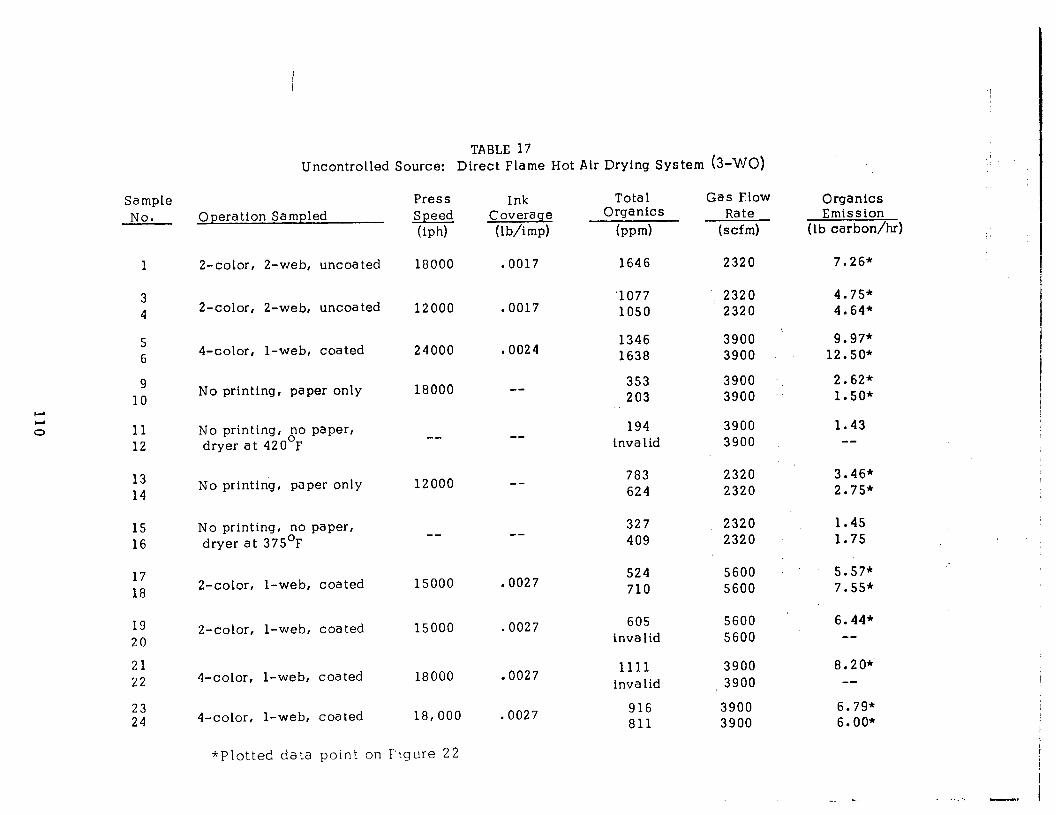
Uncontrolled Source: D~%‘l’dme Hot Air Drying System (3-V/0)
Sample No. 0 pera tion Sampled
Press Ink Tota 1 Gas Flow Speed Coverase Organics Rate (iph) (lb/imp) (wd (scfm)
Organics Emission
(lb carbonhr)
1 2-color, 2-web, uncoated 18000 .0017 1646 2320 7.26*
3 4 2-color, 2-web, uncoated 12000 l 0017
‘1077 ‘; 2320 4.75* 1050 2320 4.64*
5 6
9 10
4-color, l-web, coated 24000 IO024 1346 1638
9.97* 12.50*
No printing, paper only 18000 -- 353 203
3900 3900
3900 3900
2.62* 1.50*
11 12
No priztir?gi “o paper; dryer at 420°F
-- 194 3900 1.43 invalid 3900 --
13 14
No printin’g, paper only 12000 -- 783 2320 3.46* 624 2320 2.75*
15 No printing, no paper, 16 dryer at 375’F
-- -- 327 2320 1.45 409 2320 1.75
17 18
2-color, l-web, coated 15000 .0027 524 5600 5.57* 710 5600 7.55*
19 20
21 22
2-color, l-web, coated 15000 . 0027 605 5600 6.44” invalid 5600 --
I-color, l-web, coated 18000 .0027 1111 invalid
3900 , 3900
3900 3900
8.20* --
23 24 4-color, l-web, coated 18,000 .0027 916
811 6.79* 6.00*
*Plotted data point on 1 igure 22
I -_ - ..:. -, I
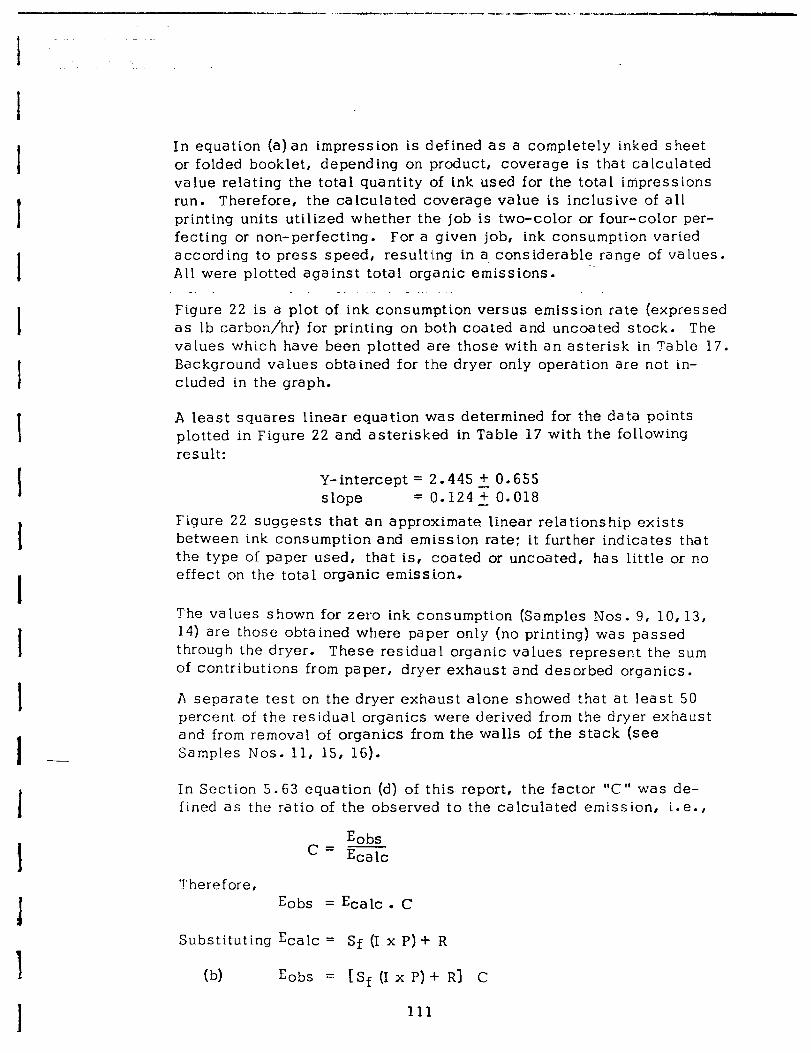
In equation (a)an impression is defined as a completely inked sheet or folded booklet, depending on product, coverage is that calculated value relating the total quantity of ink used for the total impressions run. Therefore, the calculated coverage value is inclusive of all printing units utilized whether the job is two-color or four-color per- fecting or non-perfecting. For a given job, ink consumption varied according to press speed, resulting in a considerable range of values.
-- All were plotted against total organic emissions.
Figure 22 is a plot of ink consumption versus emission rate (expressed as lb carbon/hr) for printing on both coated and uncoated stock. The values which have been plotted are those with an asterisk in Table 17. Background values obtained for the dryer only operation are not in- cluded in the graph.
A least squares linear equation was determined for the data points plotted in Figure 22 and asterisked in Table 17 with the following result:
Y-intercept = 2.445 + 0.655 slope = 0.1242 0.018
Figure 22 suggests that an approximate linear relationship exists between ink consumption and emission rate; it further indicates that the type of paper used, that is, coated or uncoated, has little or no effect on the total organic emission.
The values shown for zero ink consumption (Samples Nos. 9, 10,13, 14) are those obtained where paper only (no printing) was passed through the dryer. These residual organic values represent the sum of contributions from paper, dryer exhaust and desorbed organics.
A separate test on the dryer exhaust alone showed that at least 50 percent of the residual organics were derived from the dryer exhaust and from removal of organics from the walls of the stack (see Samples Nos. 11, 15, 16).
In Section 5.63 equation (d) of this report, the factor “C” was de- fined as the ratio of the observed to the calculated emission, i.e.,
Robs ’ = Ecalc
Therefore, Eobs = Ecalc . C
Substituting Ecalc = Sf (I x P) + R
(b) Eobs = tSf(IxP)+R] c
111

10 ’
6 7
0 Coated Stock q Uncoated Stock
n -0 8 16 24 32 40 48 56 64 70
Ink Consumption (Ib/hr)
Figure 22 - Variation of Emission Rate With Ink Consumption for a Web Offset Press Using Direct Flame Hot Air Drying
12
8
li 3 6
2
0 0 8 16 24 32 40 48 56 64 70
Ink Consumption (Ib/hr)
Figure 23 - Variation of Emission Rate With Ink Consumption for a Web Offset Press Using High Velocity Hot Air Drying
112
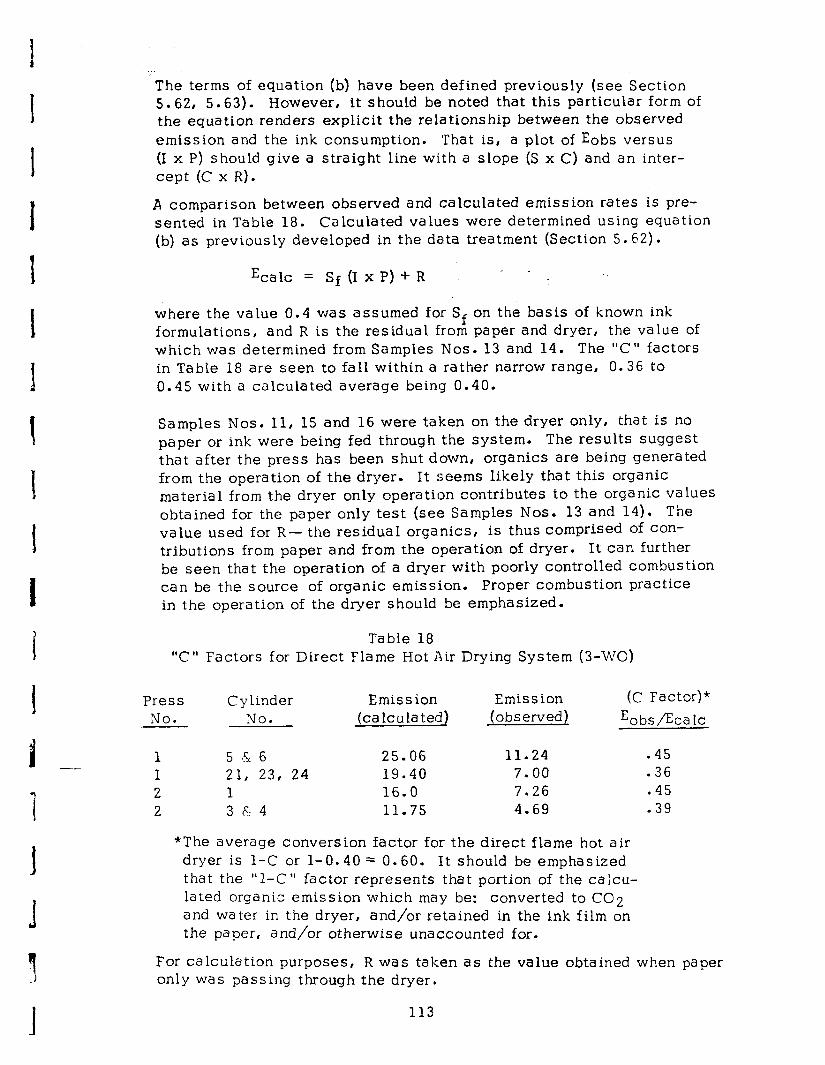
The terms of equation (b) have been defined previously (see Section 5.62, 5.63). However, it should be noted that this particular form of the equation renders explicit the relationship between the observed emission and the ink consumption. That is, a plot of Eobs versus (I x P) should give a straight line with a slope (S x C) and an inter- cept (C x R).
A comparison between observed and calculated emission rates is pre- sented in Table 18. Ca lcula ted va lues were determined using equation (b) as previously developed in the data treatment (Section 5.62).
Ecalc = Sf (I x P) + R - _ ._
where the value 0.4 was assumed for Sf on the basis of known ink formulations, and R is the residual from paper and dryer, the value of which was determined from Samples Nos. 13 and 14. The “C” factors in Table 18 are seen to fall within a rather narrow range, 0.36 to 0.45 with a calculated average being 0.40.
Samples Nos. 11, 15 and 16 were taken on the dryer only, that is no paper or ink were being fed through the system. The results suggest that after the press has been shut down , organics are being generated from the operation of the dryer. It seems likely that this organic material from the dryer only operation contributes to the organic values obtained for the paper only test (see Samples Nos. 13 and 14). The value used for R- the residual organics, is thus comprised of con- tributions from paper and from the operation of dryer. It can further be seen that the operation of a dryer with poorly controlled combustion can be the source of organic emission. Proper combustion practice in the operation of the dryer should be emphasized.
Table 18 “C” Factors for Direct Flame Hot Air Drying System (3-WO)
Press No. .-
Cylinder Emis s ion NO. (calculated
Emission (observed)
(C Factor)* Eobs/Eca lc
1 5 .5 6 25.06 11.24 .45 1 21, 23, 24 19.40 7.00 . 36 2 1 16.0 7.26 .45 2 3&4 11.75 4.69 .39
*The average conversion factor for the direct flame hot air dryer is 1-C or l-0.40 = 0.60. It should be emphasized that the “1-C” factor represents that portion of the calcu- lated organic emission which may be: converted to CO2 and water in the dryer, and/or retained in the ink film on the paper, and/or otherwise unaccounted for.
For calculation purposes, R was taken as the value obtained when paper only was passing through the dryer.
113
. . 1 6.22 Web Offset Press TJsinq High Velocity Hot Air Drying ’
The test conducted on a high velocity hot air drying system was similar in both its execution and intent to the test just described.
Duplicate samples were again collected under a variety of conditions A
and the results were used to correlate emission rate with various inputs. i
The results of this test are contained in Plant Code No. 4-WO (Appendix D). For ease of reference, the results are presented in Table 19 under the same column headings as described earlier in Section 6.21. For a more comprehensive review of test results, see Tables 31 and 33, Section 6.4. The calculated emission rate (expressed as lb carbon/hr) was plotted against ink consumption and is shown in Figure 23. Once again,, the data are roughly linear.
A least squares linear equation was determined for the data points plotted in Figure 23 and asterisked in Table 19 with the following result:
Y-intercept = 0.344 + 0.664 slope = 0.201t 0.025
The “C” factors calculated from E1obs/Ecalc expression are presented in Table 20. The “C” factors as shown in Table 20 tend to fall within a range of 0.50 to 0.70 with a calculated average of approximately 0.60. The values are somewhat higher than those obtained from the direct flame dryer. Since (1-C) is assumed to be a measure of the conversion ability of the dryer in converting organics to CO2 and water, it can be seen that the direct flame dryer serves, to some degree, as a better converter of organic solvents than the high velocity type. The assumption in this comparison of dryers is that the solvent retained by the ink film and paper and solvent losses through other means are independ.ent of the dryer type. Previous studies reported in the Phase I final report (1) have shown that as much as 40 percent of the initial solvent may be retained in the product.
It will be noted in Figure 23 that the line through the data points inter- sects the ordinate at approximately zero, whereas the line in Figure 22 intersects at 2.3 lb/hr. This suggests that considerably fewer organics are derived from paper passing through a hot air dryer than from paper passing through a flame type dryer. Another possibility exists for this phenomenon and that is the effect of the web upon burner performance since the direct flame hot air dryer burners are located near the web to achieve direct flame drying.
Four samples were collected to determine whether or not dryer emission (no printing, no paper) decreased with time (Table 21). It was found that the total organic content of the stream remained relatively constant over a 60-minute period, thus further substantiating the fact that
114
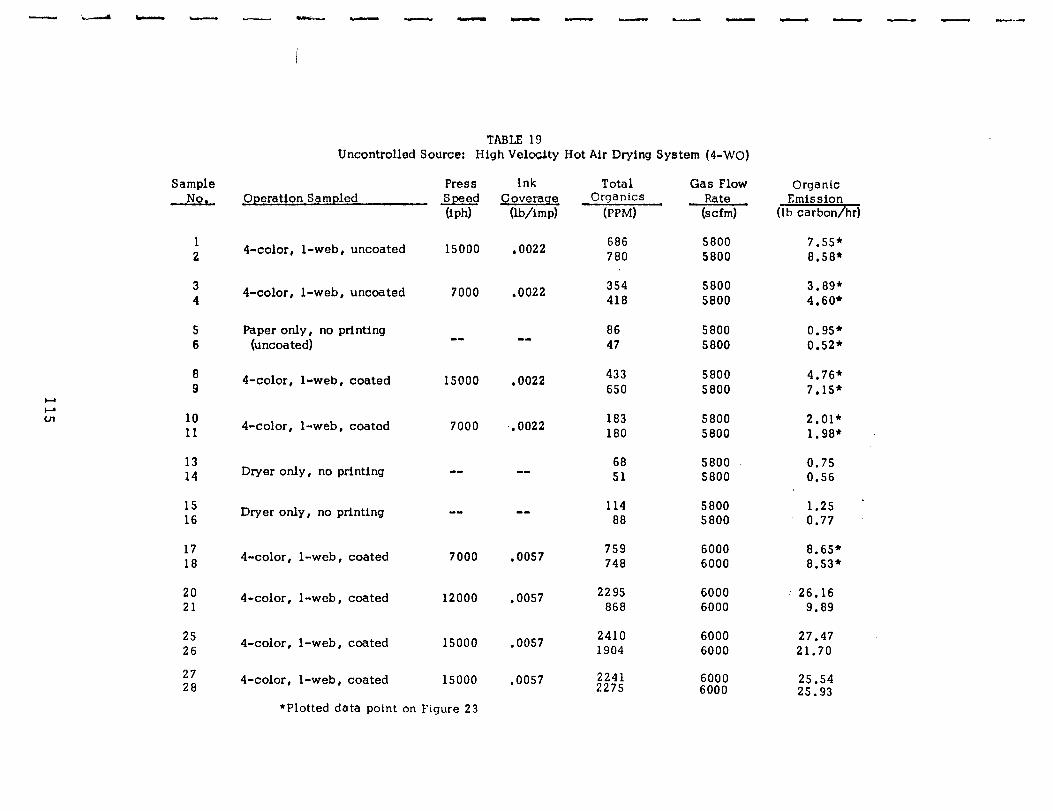
Sample No, Operation Sampled
1 2 4-color, l-web, uncoated
3 4
4-color, l-web, uncoated
5 Paper only, no printing 6 (uncoated)
8 9
4-color, l-web, coated
10 ii 4-color, l-web, coated
13 14 Dryer only, no printing
15 16 Dryer only, no printing
17 18 4-color, l-web, coated
20 21
4-color, l-web, coated
25 26
I-color, l-web, coated
27 28 4-color, l-web, coated
*Plotted data point on Figure 23
TABLE 19 Uncontrolled Source: High Velocity Hot Air Drying System (4-WO)
Press Ink Total Gas Flow Organic Speed Coverage Organics Rate Emission (Q-M Wfmp) @‘PM) (scfm) (lb carbon/hr)
15000
7000
--
15000
7000
mm
Mm
7000
12000
15000
15000
,0022
.0022
WI
.0022
,0022
--
--
.0057
.0057
.0057
.0057
686 5800 7.55* 780 5800 8.58*
354 5800 3,89* 418 5800 4.60*
86 5800 0.95* 47 5800 0.52*
433 5800 4.76* 650 5800 7.15*
183 5800 2.01* 180 5800 i.98*
68 5800 0.75 51 5800 0.56
114 5800 88 5800
759 6000 748 6000
1.25 . 0.77
8.65* 8.53*
2295 6000 26.16 868 6000 9.89
2410 6000 27.47 1904 6000 21.70
2241 6000 2275
25.54 6000 25.93
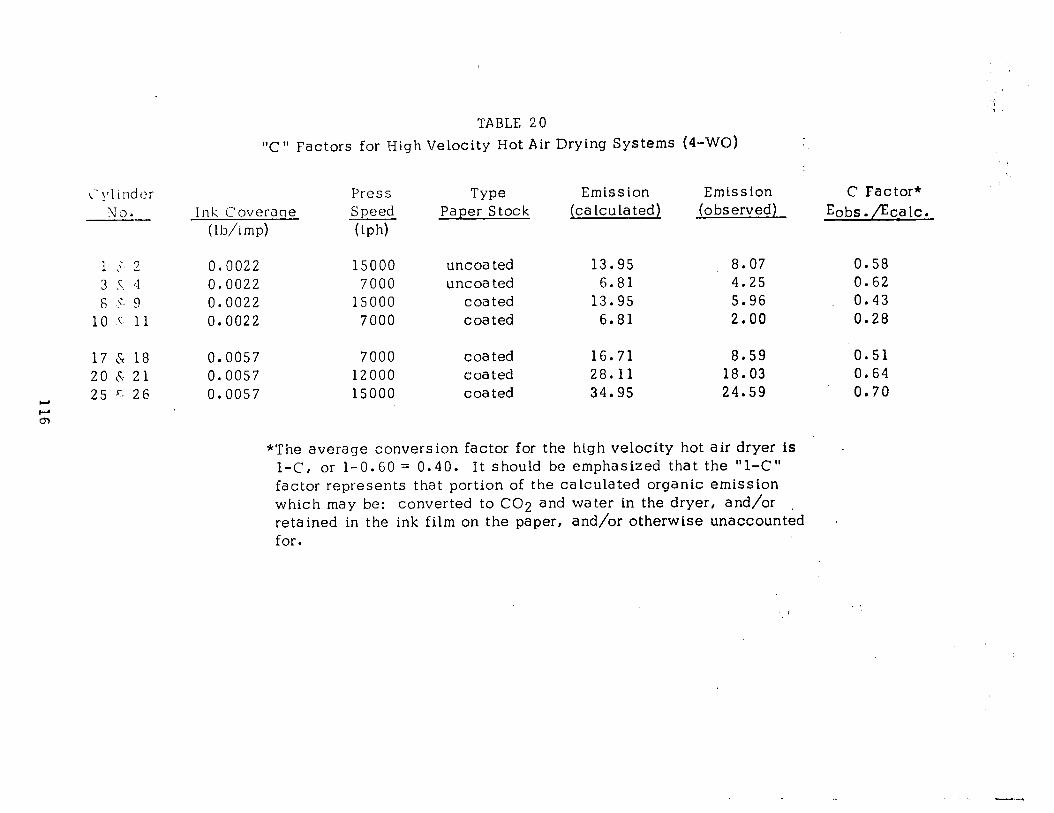
1.\llinder NO.
1 $ 2 3 s. 4 6 \2. 9
10 c 11
17 cc 18 20 F: 21 25 A-Y 26 c--l
w 6,
TABLE 20 “C” Factors for High Velocity Hot Air Drying Systems (4-;\/vC)
Ink Coverage (lb/imp)
0.0022 0.0022 0.0022 0.0022
0.0057 0.0057 0.0057
Press Speed W-d
15000 7000
15000 7000
7000 12000 15000
Type Emission Emission Paper Stock [calculated) (observed)
uncoated 13.95 8.07 uncoated 6.81 4.25
coated 13.95 5.96 c oa ted 6.81 2.00
coated 16.71 8.59 coated 28.11 18.03 coated 34.95 24.59
C Factor* Eobs ./Ecalc.
0.58 0.62 0.43 0.28
0.51 0.64 0.70
*The average conversion factor for the high velocity hot air dryer is l-C, or l-0.60 = 0.40. It should be emphasized that the “1-C” factor represents that portion of the calculated organic emission which may be: converted to CO2 and water in the dryer, and/or retained in the ink film on the paper, and/or otherwise unaccounted for.
‘i
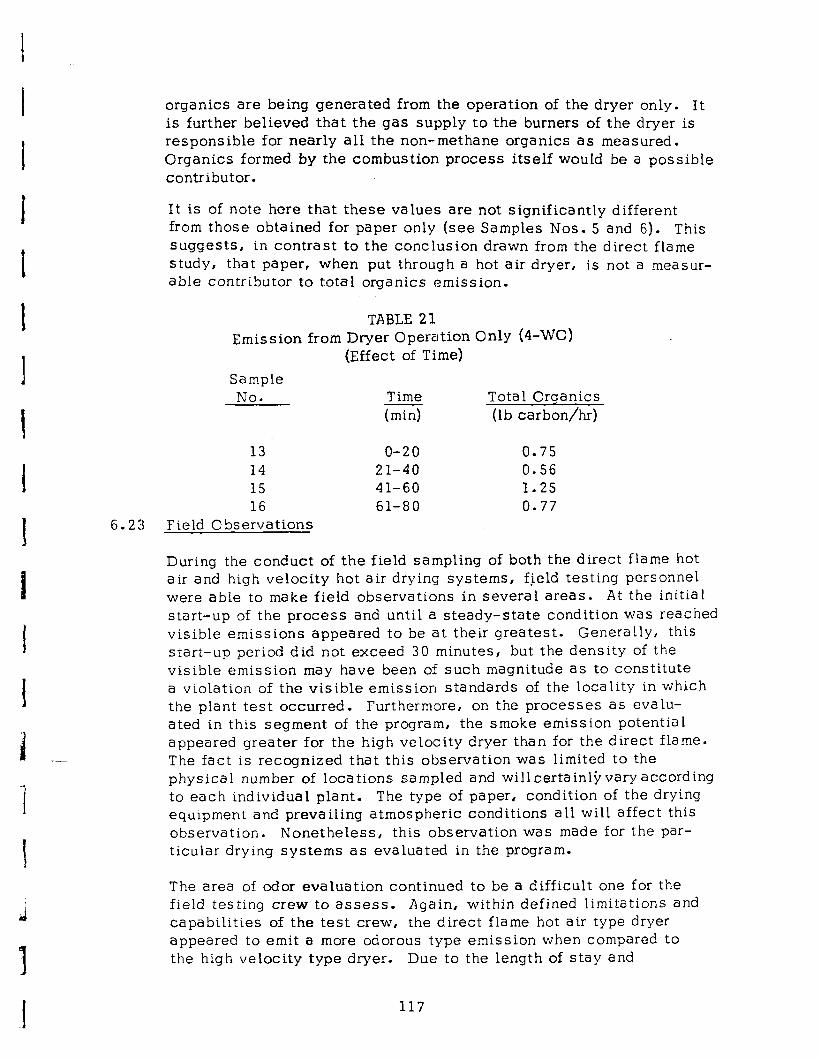
organics are being generated from the operation of the dryer only. It is further believed that the gas supply to the burners of the dryer is responsible for nearly all the non-methane organics as measured. Organics formed by the combustion process itself would be a possible contributor.
It is of note here that these values are not significantly different from those obtained for paper only (see Samples Nos. 5 and 6). This suggests, in contrast to the conclusion drawn from the direct flame study, that paper, when put through a hot air dryer, is not a measur- able contributor to total organics emission.
TABLE 21 Emission from Dryer Operation Only (4-WO)
(Effect of Time) Sample No. Time Tota 1 Organics
(min) (lb carbon/hr)
13 O-20 0.75 14 21-40 0.56 15 41-60 1.25 16 61-80 0.77
6.23 Field Observations
During the conduct of the field sampling of both the direct flame hot air and high velocity hot air drying systems, field testing personnel were able to make field observations in several areas. At the initial start-up of the process and until a steady-state condition was reached visible emissions appeared to be at their greatest. GeneraLly, this start-up period did not exceed 30 minutes, but the density of the visible emission may have been of such magnitude as to constitute a violation of the visible emission standards of the locality in which the plant test occurred. Furthermore, on the processes as evalu- ated in this segment of the program, the smoke emission potential appeared greater for the high velocity dryer than for the direct flame. The fact is recognized that this observation was limited to the physica 1 number of locations sampled and will certain19 vary according to each individual plant. The type of paper, condition of the drying equipment and prevailing atmospheric conditions all will affect this observation. Nonethel,ess, this observation was made for the par- ticular d.rying systems as evaluated in the program.
The area of odor evaluation continued to be a difficult one for the field testing crew to assess. Again, within defined limitations and capabilities of the test crew, the direct flame hot air type dryer appeared to emit a more odorous type emission when compared to the high velocity type dryer. Due to the length of stay and
117
prolonged saturation of the testing crew in the near vicinity- of the stack emis s ions, distinguishing of levels of odors became virtually impossible.
If it is found desirable to rate the intensity of the odor and compare this with known or predetermined levels , an odor panel should then be formed.
Much of the observations made :by the testing crew have been incorpor- ated into Section 6.5 of this report, primarily those where testing data is available to substantiate the recommendation or conclusion. Theobject of this particular section of the report has been to relate certain observa- tions forwhich scientific data are limited or non-existent and to impart to the reader some additional insight which does not appear in the more formal sections of this report.
6.3 Controlled Sources
6.31 Introduction
In order to determine the effectiveness of air pollution control units in converting organic emissions to carbon dioxide and water, the following dryer- incinerator combinations were evaluated.
1. Thermal incinerator with high velocity hot air dryer [refer to Plant Code No. S-W0 (Appendix D)l.
2. Thermal incinerator with direct flame hot air dryer [refer to Plant Code No. 6-WO (Appendix D)].
3. Catalytic incinerator (l-bed) with direct flame hot air dryer [refer to Plant Code No. 7-WO (Appendix D)] .
4. Catalytic incinerator (2-bed) with direct flame hot air dryer [refer to Plant Code No. 7-WO (Appendix D)] .
The practice of *obtaining inlet (prior to the incinerator) and outlet (after the incinerator) samples was followed for all tests so as to permit the calculation of incinerator efficiency. The equation utilized for this calculation can be found in Section 5.7. Incinerator efficiency values were determined over a range of operating temperatures. Measure- ments were also conducted on the concentration of carbon dioxide (CO2), and carbon monoxide, and where applicable the nitrogen oxides (NO,) - three products commonly associated with the combustion process.
6.32 Thermal Incineration with Hiqh Velocity Hot Air Drver
The results from this test are contained in Plant Code No. S-WO, Appendix D. For ease of reference, the data used in calculating material inputs and outputs for this test are summarized in Table 22. For a more comprehensive review elf test results, see Table 34, Section 6.4.
118

_--i Ii-u, Ccc p - - - - - - - - LI - ---
TABLE 22 Controlled Source: Thermai Incineration ‘With High Velocity Hot Air Dryer (S-WO)
(4-color, l-web perfecting press)
Press I nc inera tor Tota 1 Gas Flow Organic Sample No. Speed Temperature Organics Rate Emission
(iph) (OFI hwd (scfm) (lb carbon/hr)
22.80 22.80
1.20 --
Sampling Location
6350 14000 II
1919 1920
1 2
--
-a Inlet to control equipment
Outlet of control equipment
Outlet of control equipment
Outlet of control equipment
Outlet of control equipment
Inlet to control equipment
1000 102 1000 invalid
3 *4
0.68 1.81
0. i7 0.28
0.22 0.48
-- --
1200 1200
57 151
5 )--r 6 G
7 8
ii 1300 14 1300 23
1350 18 1350 28
9 10
-- invalid -- invalid
““11 **12
*Sample result invalidated: possible contact with trichloroethylene slurry **Sample invalidated due to press operational difficult)
Samples Nos. 1 through 12 consecutively were taken on a web offset press with a high velocity hot air type dryer and controlled by a thermal incinerator. Duplicate Samples Nos. 1, 2, 11 and 12 were taken at the outset and the conclusion to the test series,respectively. These samples were taken with the intention of establishing the emission level prior to entry into the air pollution control unit. Un- known to the testing crew , a press stoppage occurred during the sampling period and was so recorded on Data Sheet #3-ECD in the field after the discovery was made. After review of the analytical results, Samples Nos. 11 and 12 were thus invalidated based on this occurrence. In order to establish the efficiency of the control equipment, samples were collected at the outlet. However, due to the inaccessibility of the control equipment, outlet samples were collected sequentially and on an individual basis. Physical size (height) of the control unit and selected sampling location would not permit simultaneous collection of samples in duplicate as was the case on the inlet.
Samples Nos. 3 through 10 consecutively were taken at the outlet of the control equipment over a range of operational temperatures. The incineration temperature of the thermal control unit was ob- tained by means of a read-out from a temperature controller having a thermocouple inserted into the center of the chamber of the control unit. Two sequential and individual samples were taken at each of four temperature settings, 1000°F, 1200°F, 1300°F, and 135OOF with an apparent increase in organic conversion efficiency being noted with a corresponding increase in incineration temperature. Concurrent with each sampling, nitrogen oxides (more commonly referred to as NO,) readings were taken using a Universa 1 Testing Kit, Model No. 2, No. 83498, manufactured by Mine Safety Appliance. These readings along with the respective organic reading in ppm are shown in Table 2 3.
Figure 24 represents a plot of organics and NO, readings (taken at incinerator outlet) versus incineration temperature of the control unit. Also included in Figure 24 i.s a plot of CO2 values versus the corresponding incineration temperature for the high velocity hot air (h.v.h.a.) drying system.
An increase in incineration temperature is accompanied by an appar- ent decrease in organic values while indicating an increase in both the NO, and CO2 values. The oxides of nitrogen are due to the reaction of nitrogen and oxygen at elevated temperatures of incin- eration. Carbon dioxide increase, of course, reflects the increased oxidation of organics.
The data recorded on the NO, values (although measured in low levels, 20-25 ppm) tend to substantiate the fact that thermally controlled processes
120
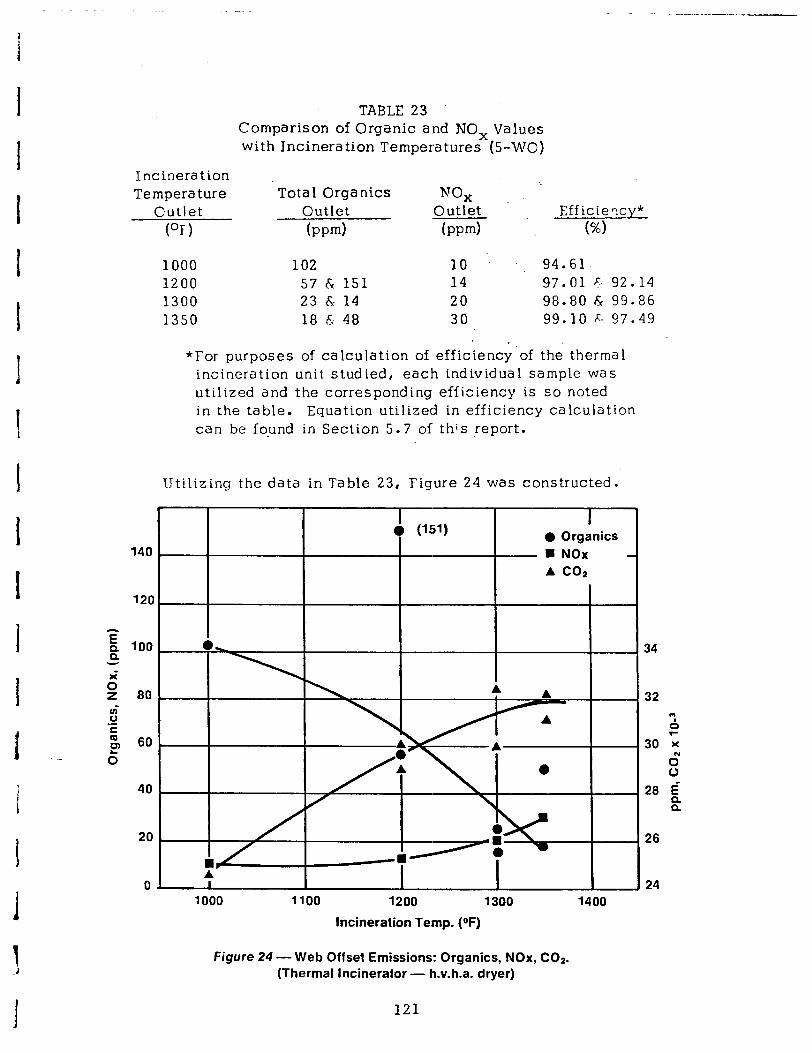
TABLE 23 ’ Comparison of Organic and NO, Values with Incineration Temperatures (S-WO)
Incineration Temperature _ Outl.et
(Of)
Tota 1 Orga nits NO, Outlet Outlet (w-d hwd
Efficiexy* (%I
1000 102 10 . ., 94.61 1200 57 E; 151 14 97.01 f? 92.14 1300 23 d 14 20 98.80 & 99.86 1350 18 6.. 48 30 99.10 A:- 97.49
*For purposes of calculation of efficiency of the thermal incineration unit studied, each individual sample was utilized and the corresponding efficiency is so noted in the table. Equation utilized in efficiency calculation can be found in Section 5.7 of this report.
Utilizing the data in Table 23, Figure 24 was const.ructed.
I l Organics
A co*
1100 1200 1300 1400
Incineration Temp. (OF)
Figure 24 - Web Offset Emissions: Organics, NOx, CO,. (Thermal Incinerator - h.v.h.a. dryer)
32
1 0
26
24
121
(those units utilizing flame type afterburners) have a potential for cre- ating NO, emissions, which are generally accepted as an established contributor to photochemica 1 smog.
An organic conversion efficiency of the 95 percent level was reached at operational incineration temperatures between 1100 to 12OOOF. In- creased incineration temperature above 12OO’F is being accompanied by an increase in the level of NC, emission as well as the carbon monoxide levels and should be a,voided. It should be emphasized that increasing amounts of CO (carbon monoxid’e) indicates incomplete com- bus tion of organic materia 1.
A comparison between the observed and calculated emission rates and the corresponding “C” factor of 0.73 compares favorably with the calculated average “C” value of 0.60 as presented in the uncontrolled discussion of this section of the report for the high velocity hot air type dryers (see Section 6.22).
6.33 Thermal Incineration With Direct. Flame Hot Air Dryer
The results from this test are contained in Plant Code No. 6-WC, (Append ix D) . For ease of reference, the data used in calculating material inputs and outputs for this test are summarized in Table 24. For a more comprehensive review of test results, see Table 35, Section 6.4.
Samples ‘Nos. 13 to 22 consecutively, were taken on a web offset press with a direct flame hot air (multi-stage) type dryer utilizing thermal incineration type control equipment. Samples Nos. 15, 16, 20 and 21 were taken at the inlet to the control equipment in order to characterize the emissions from the process and to establish the inlet loadings for efficiency calculations. During the period in which Samples Nos. 20 and 21 were being taken, a press shutdown occurred which was unknown to the testing crew at that time and not discovered until completion of the tests. This fact was so re- corded on Data Sheet #3-ECD. After review of the analytical results, Samples Nos. 20 and 21 were thus invalidated based on this occur- rence. In order to establish the efficiency of the control equipment, samples were collected at the outlet. However, due to the inaccessi- bility of the control equipment outlet, samples were collected sequen- tially and on an individual basi.s. Physical size (height) of the control unit and selected sampling location would not permit simul- taneous collection of samples induplicate as was the case on the inlet.
122
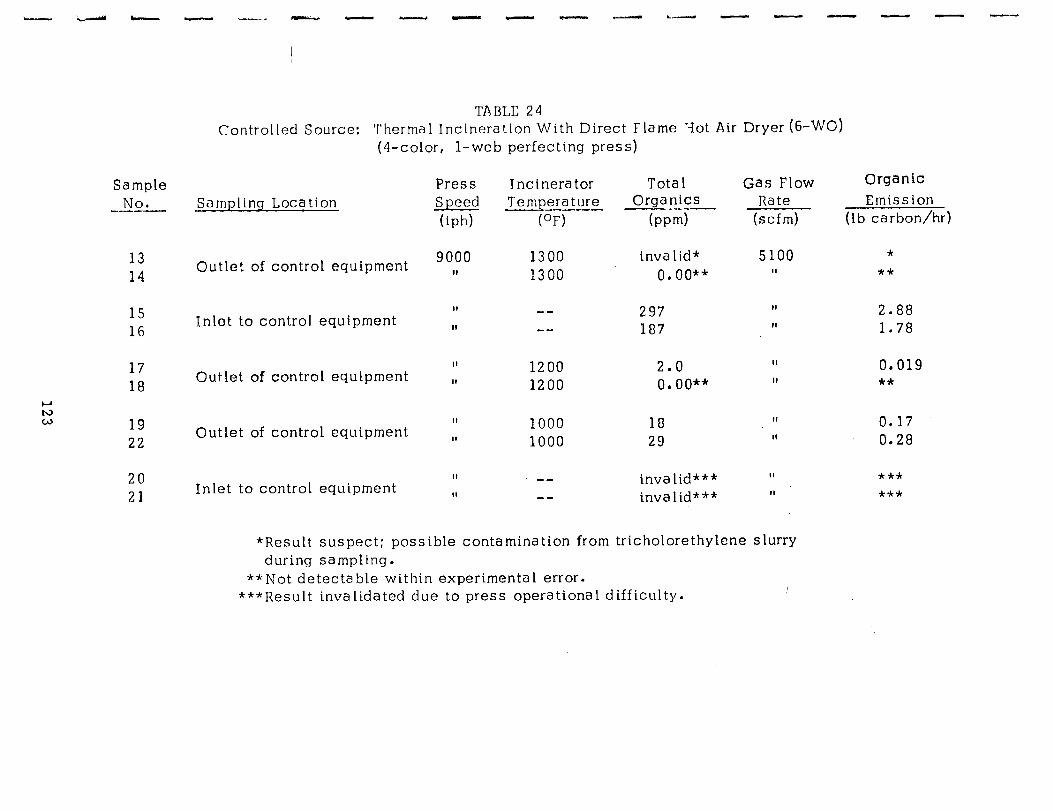
- :4/.--d - - -a - - w - - - - - - - - m - -
z W
Sample No.
13 14
15 16
17 18
19 22
20 21
TABLE 24 Controlled Source: Thermal Incineration With Direct Flame ‘Jot Air Dryer (6-WO)
(4-color, l-web perfecting press)
Samplinq Location
Outlet of control equipment
Inlet to control equipment
Outlet of control equtpment
Outlet of control equipment
Inlet to control equipment
Press Speed (id-d
9000 II
Incinerator Tota 1 Temperature Organics
(OF) (pm)
1300 1300
-- MI
1200 1200
1000 1000
SW --
lnva lid* 0. oo**
297 187
2.0 0. oo**
18 29
invalid*** invalid***
Gas Flow Rate
(scfm)
5100 II
*Result suspect: possible contamination from tricholorethylene slurry during sampling.
**Not detectable within experimental error. ***Result invalidated due to press operational difficulty.
Organic Emission
(lb carbon/hr)
* **
2.88 1.78
0.019 **
0.17 0.28
*** ***
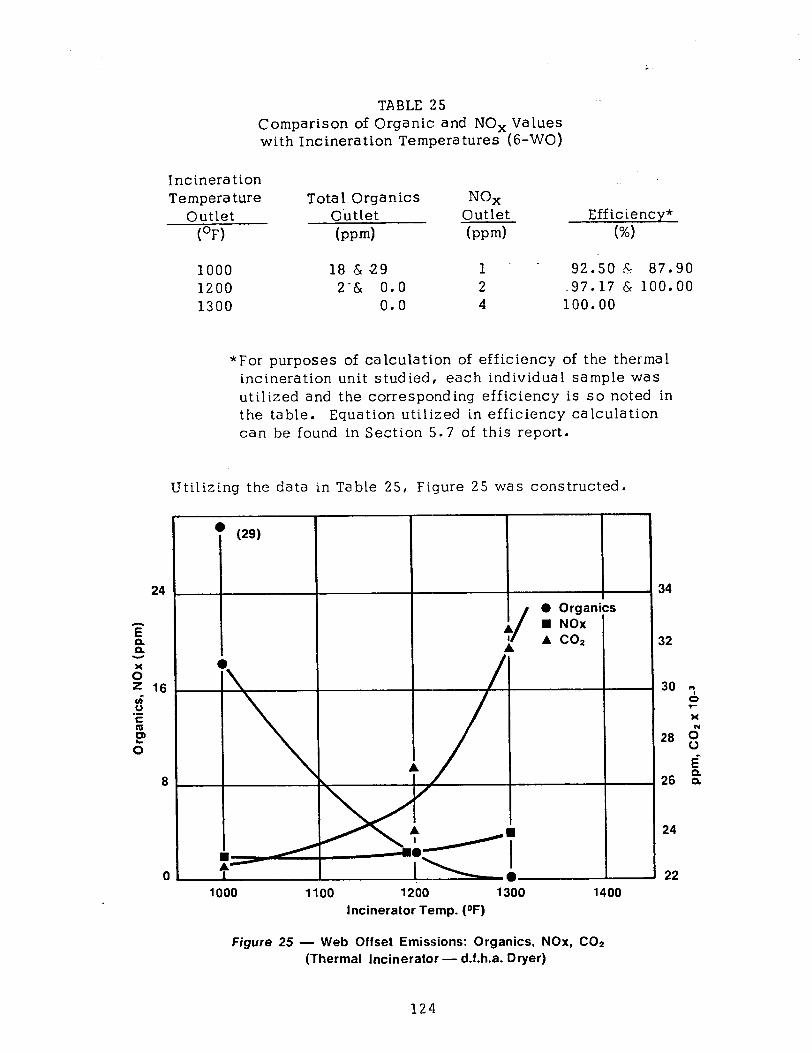
24
8
a
TABLE 25 Comparison of Organic and NO, Values with Incineration Temperatures (6-WO)
Incineration Temperature
Outlet (OF)
Total Organics NO,
Outl.et Outlet kw-4 (mm)
Efficiency* (%)
1000 18 6 29 1 92.50~6 87.90 1200 2-& 0.0 2 -97.17 & 100.00 1300 0.0 4 100.00
*For purposes of calculation of efficiency of the thermal incineration unit studied, each individual sample was utilized and the corresponding efficiency is so noted in the table. Equation utilized in efficiency calculation can be found in Section 5.7 of this report.
Utilizing the data in Table 25, Fi’gure 25 was constructed.
I /
0 Organics
A W NOx
i A coz
1100 1200 1300 1400 Incinerator Temp. (OF)
34
32
24
22
Figure 25 - Web Offset Emissions: Organic% NOx, CO2 (Thermal Incinerator - d.f.h.a. Dryer)
124

Samples Nos. 13, 14, 17, 18, 19 and 22 were taken at the outlet of the control equipment over a range of operational temperatures. In- cineration temperature was determined by direct reading from the thermocouple (of the temperature control device) inserted midway into the chamber of the control unit. Two sequential and individual samples were taken at each of the three temperature settings, 1000°F, 1200°F and 1300°F, with an apparent increase in organic conversion efficiency being noted with an increase in incineration temperature. Concurrent with each sampling, nitrogen oxide readings were taken using the instrument described in the previous test (Section 6.32). These readings along with the respective organic outlet readings in ppm are shown in Table 2 5.
Figure 25 represents a plot of organics and NO, readings (taken at incinerator outlet) versus the incineration temperature of the control unit. Also included in Figure 25 is a plot of CO2 values versus the correspondirig incineration temperature for the direct flame hot air (d.f. h-a.) drying system. An increase in incineration temperature is accompanied by a pronounced decrease in organic values while indicating an increase in NO, va:lues.
Similar to Figure 24, Figure 25 indicates an increase of NO, emissions with increased temperature. Furthermore, Figure 25 indicates an organic conversion efficiency of 95 percent being reached at operational incin- eration temperatures between 1100 and 12OOOF. The formation of NOx and CO is also at a minimum at this temperature (llOO-12OO’F).
A comparison between the observed and calculated emission rates, expressed as the “C” factor of 0.40 compares very favorably with the calculated average range of “C” value of 0.40 as presented in the uncontrolled discussion of this section of the report for direct flame hot air type dryers (see Section 6.21).
6.34 Catalytic Incineration (l-bed) With Direct Flame Hot Air-Dryer
The resuIts from this test are contained in Plant Code No. 7-WO (Appendix D). For ease of reference, the data used in calculating monitored inputs and outputs are summarized in Table 26. For a more comprehensive review of test results, see Table 36, Section 6.4.
Samples Nos. 1 through 12 consecutively were taken on a web offset press with a direct flame hot air dryer and controlled by a single- bed catalytic incinerator. Duplicate samples, Nos. 9, 10, 11, and 12 were taken with the intention of establishing the emission level
125
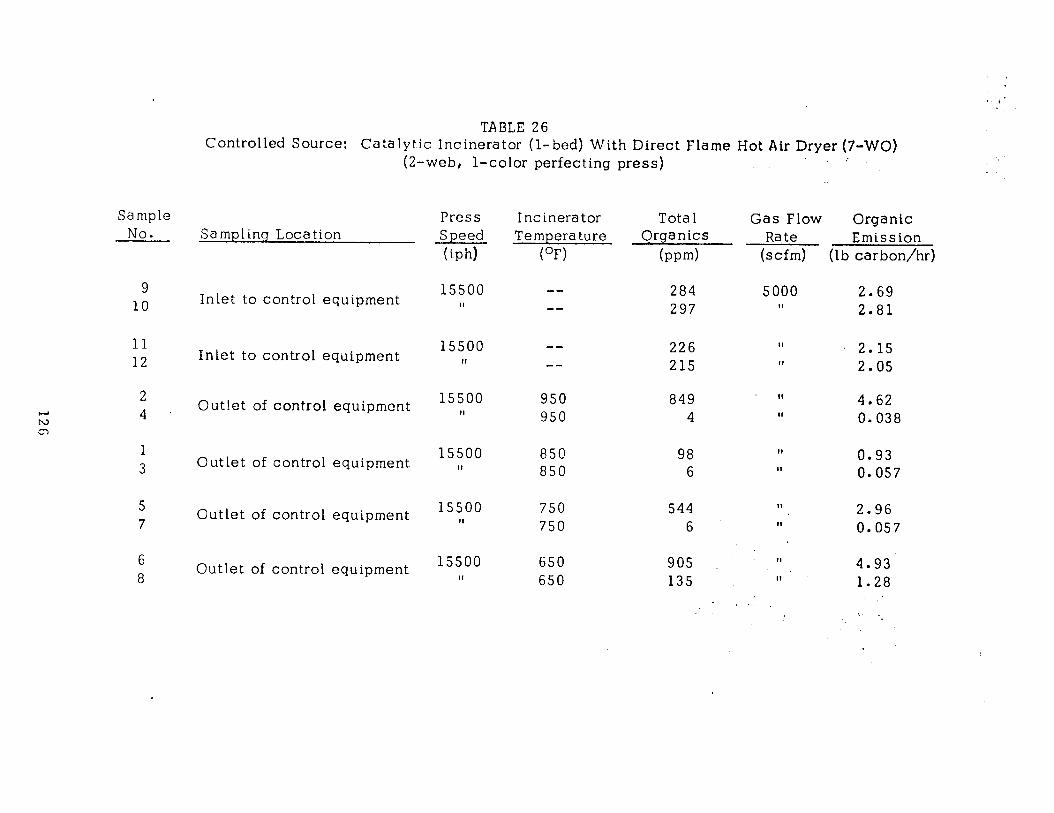
Sample No.
9 10
11 12
2 4,
1 3
5 7
6 8
TABLE 26 Controlled Source: Catalytic Incinerator (l-bed) With Direct Flame Hot Air Dryer (7-WO)
(2-web, l-color perfecting press)
Sampling Location
Inlet to control equipment
Inlet to control equipment
Outlet of control equipment
Outlet of control equipment
Outlet of control equipment
Outlet of control equipment
Press Incinerator Speed Temperature (iph) (OF)
15500 II
15500 I,
15500 II
15500 II
15500 II
15500 II
950 849 ” 4.62 950 4 II 0.038
850 98 II 0.93 850 6 II 0.057
750 544 II 2.96 750 6 11 0.057
650 905 ,‘I. 4.93 650 135 II 1.28
.
Tota 1 Gas Flow Organic Orga nits Rate Emission
(w-d (scfm) (lb carbon/hr)
284 5000 2.69 297 II 2.81
226 II 2.15 215 II 2.05
:
I - --
I
1 -
of the process prior to entry into the air pollution control unit. In order to establish the efficiency of the control equipment, duplicate samples Nos. 1 through 8 were cIollected at the outlet of the control equipment.
Samples Nos. 1 through 8 consecutively were taken at the outlet of the control equipment over a range of operational temperatures. The incineration temperature of the catalytic control unit was obtained by means of a read-out from a temperature controller-having thermo- couples inserted just prior to and immediately after the catalytic bed. In this case, the temperature of incineration was recorded as that measured just prior to the bed, although a comparison check of the temperature after the bed showed little or no variation between the two.
For some unknown reason duplicate samples were not in agreement and at three temperature settings, 650°F, 750°F and 950°F. At these incineration temperatures the organic values of one of the duplicates exceeded the established value for the process input. Upon further investigation it was found that the catalytic unit was built and de- signed to handle 3000 scfm of effluent, while recorded gas flow rates performed during the test series indicated the unit was handling flow rates on the order of 5000 scfm (approximately 1.5 times the design capability) . While the velocity profile for the system provides no indication of irregular flow patterns or obstructions, it cannot be dismissed as pure conjecture that a build-up of organic material on the material on the catalyst bed could conceivably account for the unusually high organic values. .Another possibility that must be considered is that the catalytic incinerator has not undergone major maintenance (i.e., removal and inspection of the catalyst bed for contamination) throughout its ent:ire two years of operation. Analytical results of samples taken at the various temperature settings may tend to support this requirement for maintenance. The data appear to support the claims of air pollution regulatory officials that cataly- tic units - if not properly maintained - may fail to achieve the efficiency levels attained by thermal type afterburners. This-tends to explain the apparent reluctance on the part of officials to approve installation permits for this type of equipment. There is also a greater tendency to place considerable reliability on the samples obtained of the process only, irrespective of the control equipment, since these oruanic values tend to be in agreement with a material balance of the system. The (1-C) value for this type of drying system (0.62) is in agreement with the average range of values reported from previous tests on direct flame hot air type dryers, namely 0.60.
Concurrent with each sampling, an attempt was made utilizing a Universal Testing Kit to obtain readings of nitrogen oxides. Results
J 127

-
proved negative indicating the apparent lack of nitrogen oxide gen- era ted from catalytic incineration. Previous tests of a thermal incin- erator indicated the presence of NO,, however, it should be empha- sized that the temperatures at which this phenomenon occurred was considerably higher than that of catalytic incineration. The normal operating temperatures for thermal units range from 1OOO’F to 1400’F.
Utilizing the organic readings obtained with each corresponding incin- eration temperature, Table 27 was developed. ..(: -
Figure 26 represents a plot of organics and corresponding CO2 read- ings (at incineration outlet) versus incineration temperature of the control unit. Generally, with an increase in incineration temperature, an apparent decrease in organic values occurs while the CO2 readings tend to increase to reflect the incineration of organic matter to CO2 and water. This fact is not readi1.y apparent in the figure and sug- gests further investigation.
TABLE 27 Comparison of Organic and CO2 Values with Incineration Temperatures (7-WO)
Incineration Total Organics* Temperature Outlet
(OF) (mm)
CO2 Outlet
hw-4 Efficiency**
(%)
650 135 & 905 16159 53.45 750 6 & 544 16378 97.93 850 98 6 6 16669 62.21 6 97.93 950 4 c5 849 17535 98.62
*For purposes of table, all data are shown, however, certain samples are suspect since results indicate the organic outlet loading greater than that of the inlet.
**For purposes of calculation of efficiency of the catalytic incineration unit as studied, each individual sample was utilized and the corresponding efficiency is noted in the table. Equation utilized in efficiency calculation can be found in Section 5.7 of this report.
Utilizing the data in Table 27, Figure 26 was constructed.
128
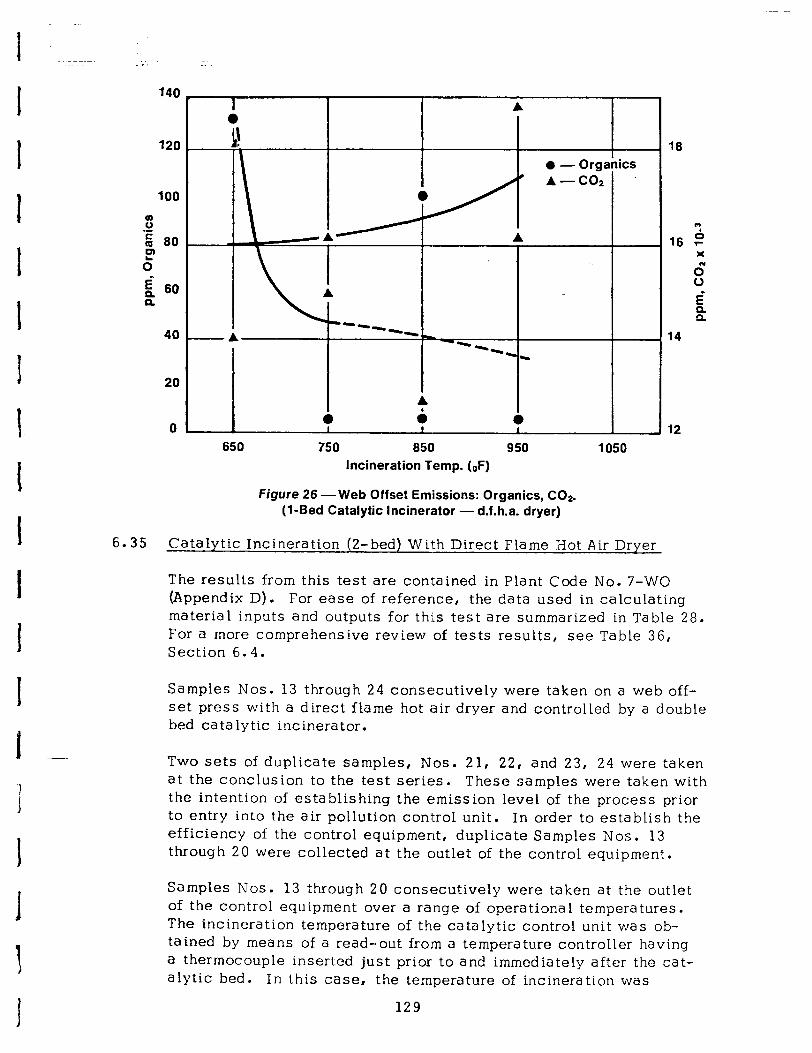
. J. 140
120
100
c .- ii 80 F 0
$ 60 CL
40
20
0
I A 0
650 I I
750 850 950 1050 Incineration Temp. (0F)
Figure 26 -Web Offset Emissions: Organics, COz. (l-Bed Catalytic Incinerator - d.f.h.a. dryer)
18
12
6.35 Catalytic Incineration (2-bed) With Direct Flame Zot Air Dryer
The results from this test are contained in Plant Code No. 7-WO (Appendix D). For ease of reference, the data used in calculating material inputs and outputs for this test are summarized in Table 28. For a more comprehensive review of tests results, see Table 36, Section 6.4.
Samples Nos. 13 through 24 consecutively were taken on a web off- set press with a direct flame hot air dryer and controlled by a double bed catalytic incinerator.
Two sets of duplicate samples, Nos. 21, 22, and 23, 24 were taken at the conclusion to the test series. These samples were taken with the intention of establishing the emission level of the process prior to entry into the air pollution control unit. In order to establish the efficiency of the control equipment, duplicate Samples Nos. 13 through 20 were collected at the outlet of the control equipment.
Samples Nos. 13 through 20 consecutively were taken at the outlet of the control equipment over a range of operational temperatures. The incineration temperature of the catalytic control unit was ob- ta ined by means of a read-out from a temperature controller having a thermocouple inserted just prior to and immediately after the cat- a lytic bed. In this case, the temperature of incineration was
129
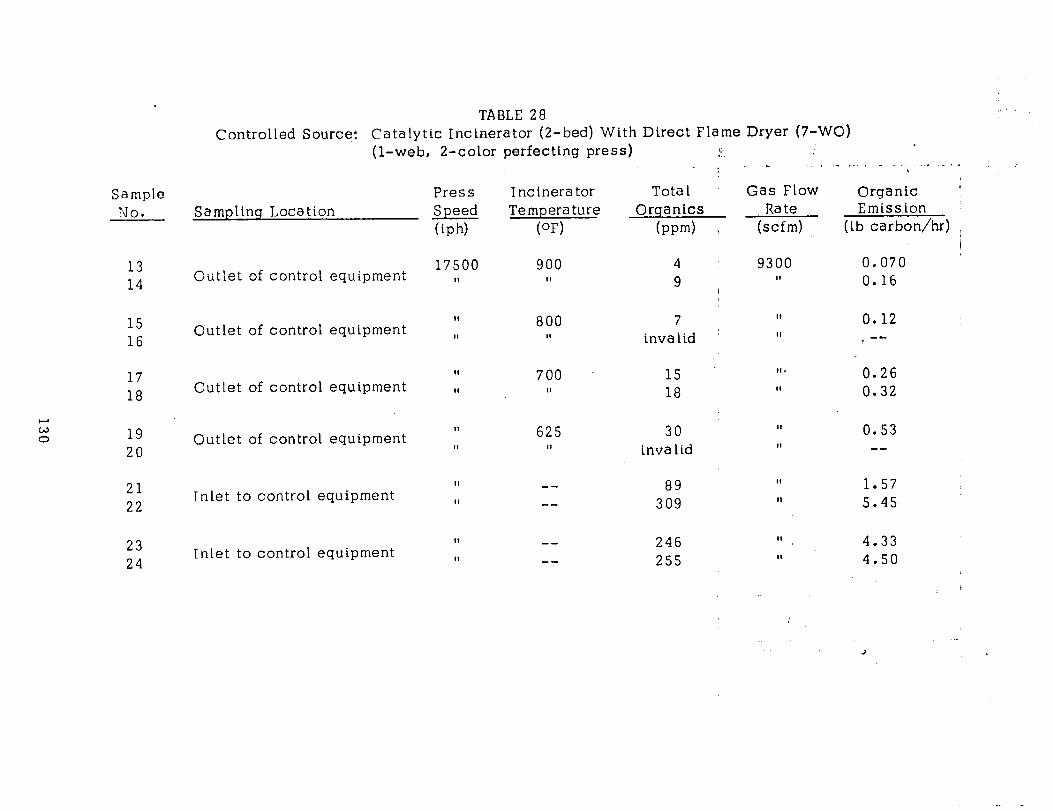
Sample NO.
13 14
15 16
17 18
19 20
21 22
23 24
TABLE 28 ‘,
CQr?trn!!ed Source: Catalytic Inctnerator (2-bed) With Direct Flame Dryer (7-WO) (l-web, 2-color perfecting press) L. _,.
Samplinq Location Press Speed (iph)
Outlet of control equipment 17500
,,
Outlet of control equipment
Outlet of control equipment
Outlet of control equipment
Inlet to control equipment
Inlet to control equipment
I nc inera tor Temperature
(OF)
900 II
800 II
700 II
6 25 II
-- --
-- --
Total Gas Flow Organic ’ Orqanics Rate Emission
(w-4 j (scfm) (Lb carbon/hr) I i
4 9300 0.070 9 , ” 0.16
7 invalid ’
II 0.12 If --
15 ‘lr 0.26 18 II 0.32
30 II 0*53 invalid ,I we
89 II 1.57
309 II 5.45
246 II 4.33 255 II 4.50
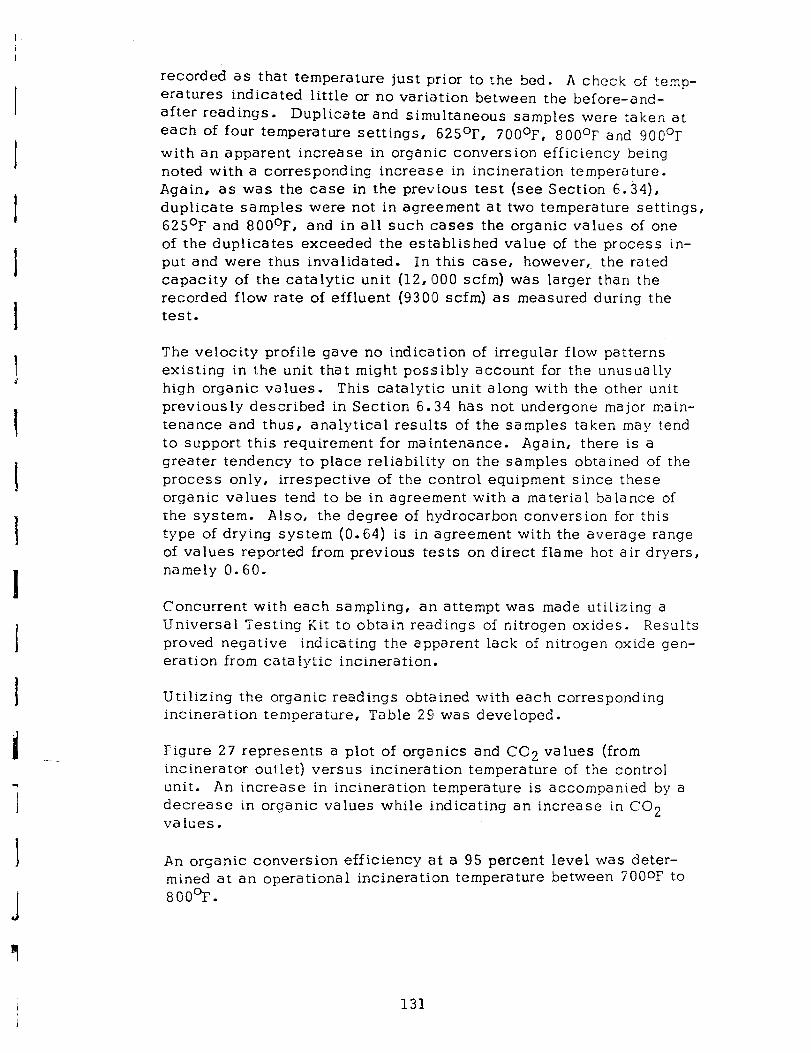
recorded as that temperature just prior to rhe bed. A check of te.Tp- eratures indicated little or no variation between the before-and- after readings . Duplicate and simultaneous samples were taken at each of four temperature settings, 625’F, 700°F, 800°F and 9OO’F with an apparent increase in organic conversion efficiency being noted with a corresponding increase in incineration temperature. Again, as was the case in the previous test (see Section 6.34), duplicate samples were not in agreement at two temperature settings, 6250~ and 800°F, and in all such cases the organic values of one of the duplicates exceeded the established value of the process in- put and were thus invalidated. In this case, however, the rated capacity of the catalytic unit (12,000 scfm) was larger than the recorded flow rate of effluent (9300 scfm) as measured during the test.
The velocity profile gave no indication of irregular flow patterns existing in the unit that might possibly account for the unusually high organic values. This catalytic unit along with the other unit previously described in Section 6.34 has not undergone major main- tenance and thus, analytical results of the samples taken may tend to support this requirement for maintenance. Again, there is a greater tendency to place reliability on the samples obtained of the process only, irrespective of the control equipment since these organic values tend to be in agree.ment with a material balance of the system. Also, the degree of h.ydrocarbon conversion for this type of drying system (0.64) is in agreement with the average range of values reported from previous tests on direct flame hot air dryers, namely 0.60.
Concurrent with each sampling, an attempt was made utilizing a Universal Testing Kit to obtain readings of nitrogen oxides. Results proved negative indicating the ap,parent lack of nitrogen oxide gen- eration from catalytic incineration.
Utilizing the organic readings obtained with each corresponding incineration temperature, Table 291 was developed.
Figure 27 represents a plot of organics and CO2 values (from incinerator outlet) versus incineration temperature of the control unit. An increase in incineration temperature is accompanied by a decrease in organic values while indicating an increase in CO2 values.
An organic conversion efficiency at a 95 percent level was deter- mined at an operational incinerati’on temperature between 7000F to 8OOOF.
131
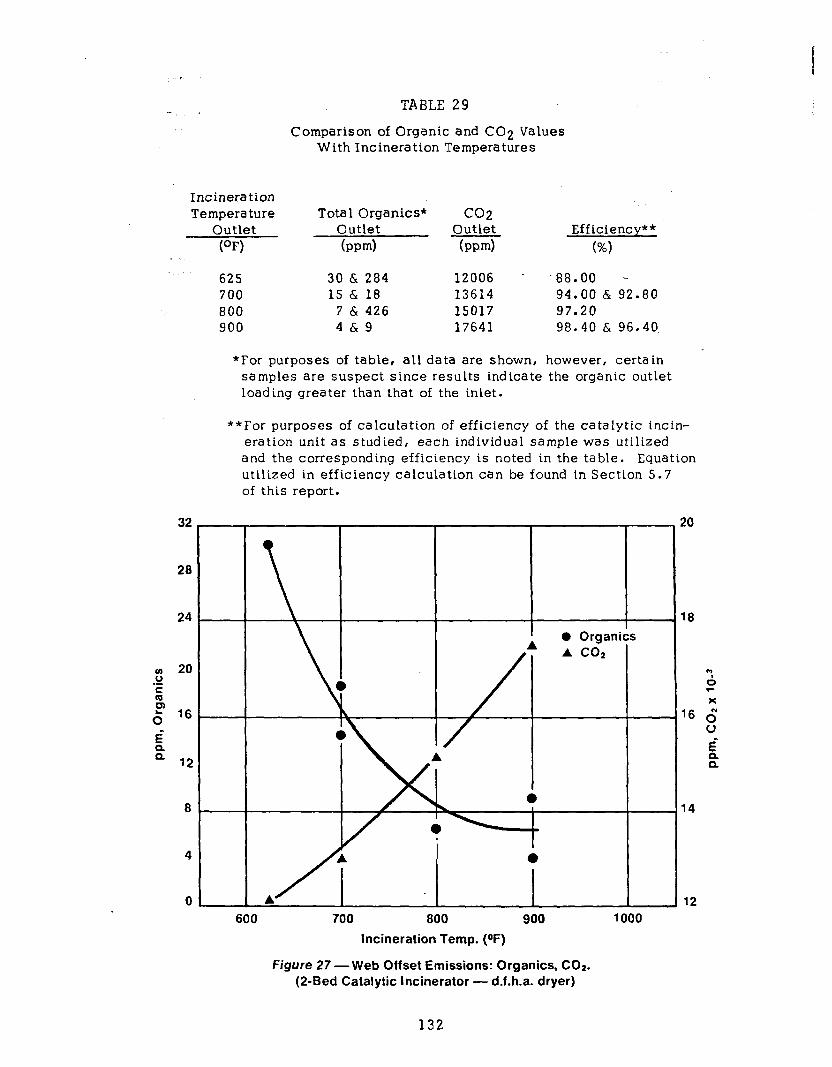
-..- .
Incineration Temperature
Outlet (OF)
625 700 800 900
32
28
24
8
TABLE 29
Comparison of Organic and CO2 Values With Incineration Temperatures
Total Organics* CC2 Outlet Outlet Efficiency** bw4 (pw-d (%I
30 & 284 12006 - .88.00 - 15 & 18 13614 94.00 & 92.80
7 & 426 15017 97.20 4&9 17641 98.40 & 96.40
*For purposes of table, all data are shown, however, certain samples are suspect since results indicate the organic outlet loading greater than that of the inlet.
**For purposes of calculation of efficiency of the catalytic incin- eration unit as studied, each individual sample was utilized and the corresponding efficiency is noted in the table. Equation utilized in efficiency calculation can be found in Section 5.7 of this report.
600 700 800 900 1000
Incineration Temp. (OF)
figure 27 -Web Offset Emissions: Organics, CO*. (2-Bed Catalytic Incinerator - d.f.h.a. dryer)
132
18

6.36 Field Observations
Throughout the conduct of field sampling of air pollution control units in control of the web offset process, field testing personne! were able to make certain field observations. In the control of smoke and odor both types of control equipment, thermal and catalytic, appeared to function equally well. At operational temperatures of 700°F to 800°F for catalysis and 1lOO’F to 12OOOF for thermal type units, no visible emission could be detected. Odor, on the other hand, was not as easily discernible, although determinations were made at various incineration temperature settings. It appeared that at lower incineration temperatures than those stated above odor was prevalent to some degree. This would suggest that certain minimum incineration temperatures be achieved to keep the odor problem to a minimum.
As a result of field samplings and knowledge obtained on the formation of nitrogen oxides, carbon monoxide, and the overall reduction of organic material, local control agencies would do well to thoroughly evaluate all data before recommending or imposing high temperatures of incineration for various types of control equipment in order to elim- inate odor. While the ability to achieve a high degree of organic con- version efficiency is certain feasible, the possible formation of addi- tional contaminants should be noted. Proper opera tiona 1 and main- tenance programs for afterburners should be stressed. Section 6.5 of this report attempts to recommend for consideration certain opera- tional aspects in the usage of control equipment for both the graphic arts industry as well as pertinent regulatory bodies.
133
6 . 4 Summary of Web Offset Test Results
Summary tables for all web offset plants utilized in Task 3 field work, namely Plant Code Nos. 3-WO through 7-WO (excluding l-W0 and 2-WC which were primarily used to evaluate, improve and further develop GATF’s method of sampling and analysis) are pre- sented in this section. These summary tables include ranges of analytical results, organic conversion efficiencies of various types of air pollution equipment and operational characteristics of the various types of metal decorating graphic processes. In addition, a summary table indicating percentage low boilers from the various web offset plant tests is presented.
An error in an equation used by CMUPML in calculating results has decreased the reported calculated total sample volume and in- creased calculated organic contents for plant test data from l-W0 through 7-WO (see PML ;‘2-24, Appendix F, for extent of change). In addition, an error introduced by a change in calibra- tion factors (see PML 71-40 and PML 72-229, Appendix F) indicates that all trap sample results taken from field tests l-W0 through 7-WO may be high by an average value of 24.9 percent. No attempt was made to recalculate the data as presented due to the amount of data and the subsequent treatment of it.
(Summary Tables 30 through 41, inclusive, are shown on the following pages.)
134
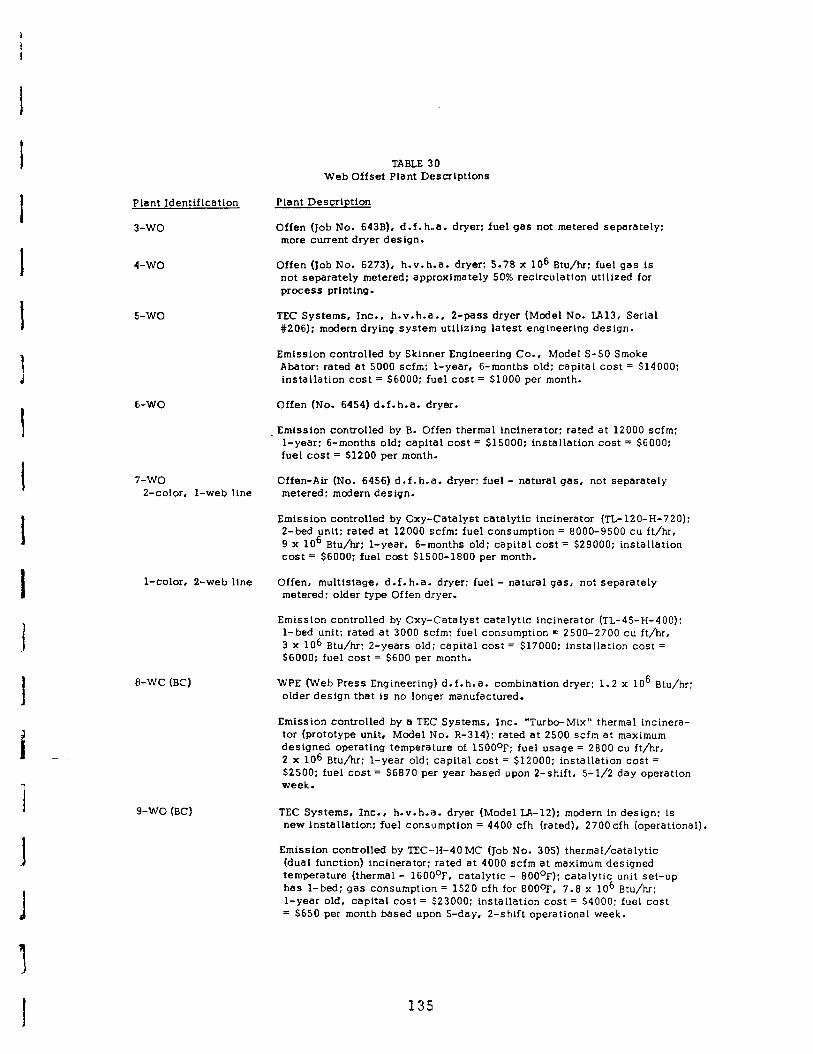
Plant Identification
3-wo
4-wo
s-w0
El-WO
7-wo Z-color, l-web line
l-color. Z-web line
H-W0 (BC)
9-WO (BC)
TABLE 30 Web Offset Plant Descriptions
Plant Description
Offen (Job No. 643B), d.f.h.,a. dryer: fuel gas not metered separately: more current dryer design.
Offen (Job No. 6273), h.v.h.a. dryer: 5.78 x lo6 Btu/hr: fuel gas is not separately metered: approximately 50% recirculation utilized for process printing.
TEC Systems, Inc., h-v-h-a., 2-pass dryer (Model No. LA13, Serial #206): modern drying system utilizing latest engineering design.
Emission controlled by Skinner Engineering Co., Model S-50 Smoke Abater: rated at 5000 scfm: l-year, 6-months old: capital cost = $14000: installation cost = $6000: fuel cost = $1000 per month.
Offen (No. 6454) d.f.h.a. dryer.
Emission controlled by B. Offen thermal incinerator: rated at 12000 scfm: l-year: 6-months old: capital cost = SlSOOO; installation cost = $6000: fuel cost = $1200 per month.
Offen-Air (No. 6456) d.f. h-a. dryer: fuel - natural gas, not separately metered: modern design.
Emission controlled by Oxy-Catalyst catalytic incinerator (TL-120-H-720); P-bed unit; rated at 12000 scfm; fuel consumption = 8000-9500 cu ft/hr, 9 x lo6 Btu/hr; l-year, 6-months old: capital cost = $29000; installation cost = $6000; fuel cost $1500-1800 per month.
Offen, multistage, d-f. h-a. dryer: fuel - natural gas, not separately metered: older type Offen dryer.
Emission controlled by Oxy-Catalyst catalytic incinerator (TL-45-H-400): l-bed unit: rated at 3000 scfm: fuel consumption = 2500-2700 cu ft/hr, 3 x lo6 Btu/hr: P-years old; capital cost = $17000: installation cost = $6000: fuel cost = $600 per month.
WPE (Web Press Engineering) d.f.h.a. combination dryer: 1.2 x lo6 Btu/hr; older design that is no longer manufactured.
Emission controlled by a TEC Systems, Inc. “Turbo-Mix” thermal incinera- tor (prototype unit, Model No. R-314): rated at 2500 scfm at maximum designed operating temperature of 1580°F; fuel usage = 2800 cu ft/hr, 2 x 10⁶ Btu/hr: I-year old: capital cost = $12000: installation cost = $2500: fuel cost = $6870 per year based upon 2-shift, 5-l/2 day operation week.
TEC Systems, Inc., h.v.h.a. dryer (Model I&12); modern in design: is new installation: fuel consumption = 4400 cfh (rated), 2700cfh (operational).
Emission controlled by TEC-H-40 MC (Job No. 305) thermal/catalytic (dual function) incinerator: rated at 4000 scfm at maximum designed temperature (thermal - 1600°F, catalytic - BOOOF): catalytic unit set-up has l-bed: gas consumption = 1520 cfh for BOOoF. 7.8 x lo6 Btu/hr: l-year old, capital cost = .$23000; installation cost = $4000: fuel cost = $650 per month based upon S-day, 2-shift operational week.
135’
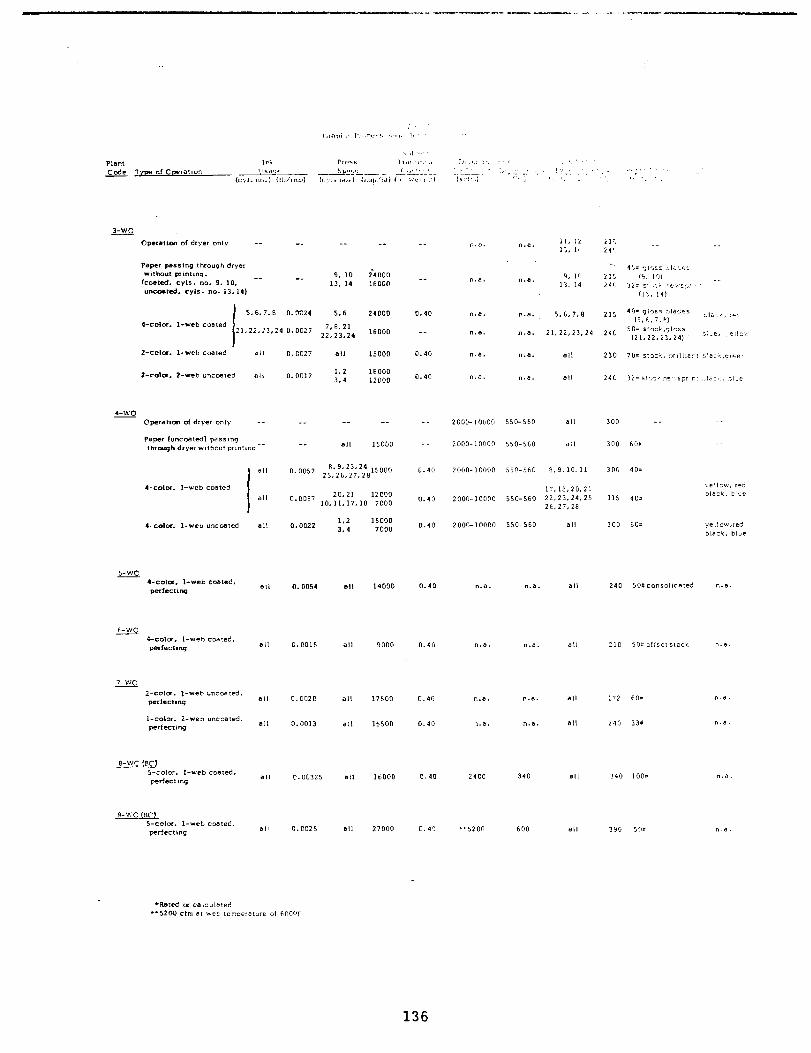
-m...l-l-..“lw.. .---...,-- ,.._.-- I II-_ _. . .,. ~ ,...wLI,..-ll-.
I,, .) 1.. 1 .
(,.I. ;
n.a.
n.a.
n.s.
“.a.
“.a.
n.a.
2000-10000
zooo- 10000
zooo- 10000
2000-10000
2000-10000
n.0.
n.a.
n.n.
n.a.
2400
**5200
3-\1?0
0persrl.n Of dryer cl”lY -- -- -- _-
Paper passing through dryer vlthout pr,nt,ng. 9. 10 is000
koated. -- -- CYlS. no. 9. 10. 13. 14 ~8000 uncoomd. cyir. no. 13.14)
I 5.6.7.8 0.002, 5.6 24000
“.8. 1, li ;. 1:
i 1 ; -- _. i4’
_-
--
0.40
__
0.40
0.40
-_
__
0.40
0.40
0.40
0.40
0.40
0.4C
0.40
0.40
0. 4'3
*.a. 5.6.7, II
n.a. 21.22,23.24
"..3. a,,
4-color. I-web coated 1 21.22.23.24 0.0027 7.8.21
22.23.24 lBOO0
Z-cola. l-web coated a,,
z-c0b.x. z-web ""ccmted ali
0. CC27 a,, 15000
0.0017 1.2 ~8000 3.4 l2DOO
300 __ -_
300 toe _-
__ __ _-
-- a,, 13000
o.oo57 8.9.23.24 25.26.27.28
lsooo 550-560 8,9,10,11
17.18.20.21 sso-560 22.23.24.25
2t.27.20
0.0022
0.0054
0.0015
0.0020
0.0013
0.00325
0.0025
15000 7000
14000
9000
17500
15500
16000
27000
550.560
n.a.
n.a.
“.a.
n.a.
340
600
,-cola. I-wee uncmted 300 to+ yellnw,red bl.3~k. blue
240 F,Oticonsol,dated “.a.
,-WC 2-co,a, l-web unc.c+z:ed,
172 60h ".a.
240 33* ".a.
“.a. 340 loot
ISO 9-MC S-cobr. I-web coated,
390 SDS n.a.
136

- - --- *A..., - - - - - e -I_ w - - m - -.---
Type of Operation Cylinder
No.
11
Operatton of dryer only 12 15 16
Paper passing through dryer 9 without printing 10
Cyls. No. 9, IO-coated paper 13 Cyls. No. 13, 14-uncoated 14
5 I-J 6 W 7 ti
4-color, l-web coated 8 2! 22
**23 l **24
2 P-color, 2-web uncoated 3
4
17
2-color, l-web coated 18 19 20
Flow Rate
(scfm) co (pt-4
co7 bpm)
3900 3900 2320 2320
n.d. 4126 n.d. 3018.
trace 4726 trace 5305
3900 3900 2320 2320
Organics Total Low Boilers* bpd (%I
194 -- 2360 --
327 me 409 --
353 33 203 me 783 _- 624 --
trace 3573 n.d. 3397 n.d. 3526
trace 4240
3900 1346 -- 3900 1688 21 3900 1589 -- 3900 1747 -- 3900 !ll! me 3900 2822 15 3900 916 -- 3900 811 --
trace 2809 trace 2349 trace 3378 trace 4079 trace 3780 trace 4320 n.d. 122 n.d. 278
2320 1646 -- 16 7590 2320 5977 1 trace 8848 2320 1077 -- trace 4529 2320 1050 -- n.d. 4330
5600 524 -- n.d. 3731 5600 710 -- n.d. 3955 5600 605 -- n.d. 2105 5600 4767 -- n.d. 2146
TABiE 3.z
Summary of Analytical Results
[Plant Code No. 3-WO1
CH4 bm)
Eobservedfica lcula ted (data) (ratio)
Efficiency of Trap
(%I
54 1.43/ -- -- 98 37 17.50/ -- -- 100 61 1.45/ -- -- 97 64 1.75/ -- -- 98
58 2.62/ -- -- 99 55 1.50/ -- -- 98 37 3.46/ -- -- 100 45 2.75/ -- -- 99
62 9.97/25.06 0.40 99 48 12.50/25.06 0.50 99 65 11.75/19.26 0.61 98 69 12.90/19.26 0.67 98 62 8.20/19.40 0.42 99 73 20.8/ -- -- 99
6 6.79/19.40 0.35 100 6 6.00/19.40 0.31 100
39 7.26/16.0 49 26.3/ -- 49 4.75/11.75 55 4.64/11.75
97 99 99 99
23 5.57/ -- 25 7.55/ -- 17 6.44/ -- 16 47.9 / --
0.45 --
0.40 0.39
-- -- -- --
98 99
100 100
*Only traps used with cylinders Nos. 2, 6, 9. 22 were evaluated for low boilers - high boilers composition. **Sample suspect, cylinder lost vacuum from time of packing to time of use.
***Sample suspect, found loose fitting next to valve.
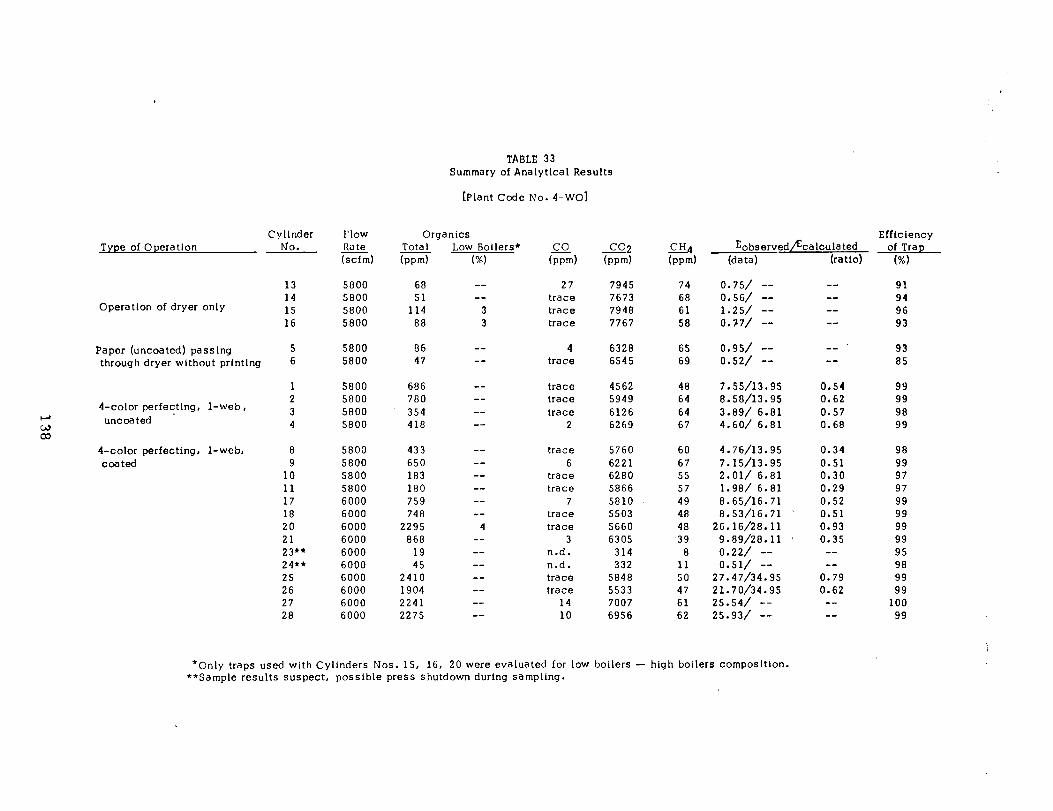
Type of Operation Cylinder
No.
Operation of dryer only
13 5800 68 -- 27 7945 74 0.75/ -- 14 5800 51 -- trace 7673 68 0.56/ -- 15 5800 114 3 trace 7948 61 1.2.5/ -- 16 5800 88 3 trace 7767 58 0.77/ --
Paper (uncoated) passing 5 5800 86 -- 4 6328 65 0.95/ -- through dryer without prtntlng 6 5800 47 -- trace 6545 69 0.52/ --
4-color perfecting, l-web,
5 uncoated ’
co 4-color perfecting, l-web, coated
1 5800 686 -- trace 4562 48 7.55/13.95 2 5800 780 -- trace 5949 64 8.58/13.95 3 5800 354 -- trace 6126 64 3.89/ 6.81 4 5800 418 -- 2 6269 67 4.60/ 6.81
8 5800 433 -- trace 5760 60 4.76/13.95 9 5800 650 -- 6 6221 67 7.15/13.95
10 5800 183 -- trace 6280 55 2.01/ 6.81 11 5800 180 -- trace 5866 57 1.98/ 6.81 17 6000 759 -- 7 5810 49 8.65/16.71 18 6000 748 -- trace 5503 48 8.53/16.71 20 6000 2295 4 trace 5660 48 26.16/28.11 21 6000 868 -- 3 6305 39 9.89/28.11 23** 6000 19 -- n.d. 314 8 0.22/ -- 24** 6000 45 -- n.d. 332 11 0.51/ -- 25 6000 2410 -- trace 5848 50 27.47/34.95 26 6000 1904 -- trace 5533 47 21.70/34.95 27 6000 2241 -- 14 7007 61 25.54/ -- 28 6000 2275 -- 10 6956 62 25.93/ --
FLOW Organics Rate Tota 1 Low Boilers* (scfm) bpd (%I
TABLE 33 Summary of Analytical Results
[Plant Code No. S-W01
c9 (rwd
co2 bpm)
*Only traps used with Cyllnders Nos. 15, 16, 20 were evaluated for low boilers **Sample results suspect, possible press shutdown during sampling.
CHd bpd
Eobserved/Ecalculated Efficiency
of Trap (data) (ra tie) (%I
me 91 -a 94 -- 96 me 93
-- 93 -- 85
0.54 99 0.62 99 0.57 98 0.68 99
0.34 98 0.51 99 0.30 97 0.29 97 0.52 99 0.51 99 0.93 99 0.35 99
-- 95 -- 98
0.79 99 0.62 99
-- 100 -- 99
high boilers composition.
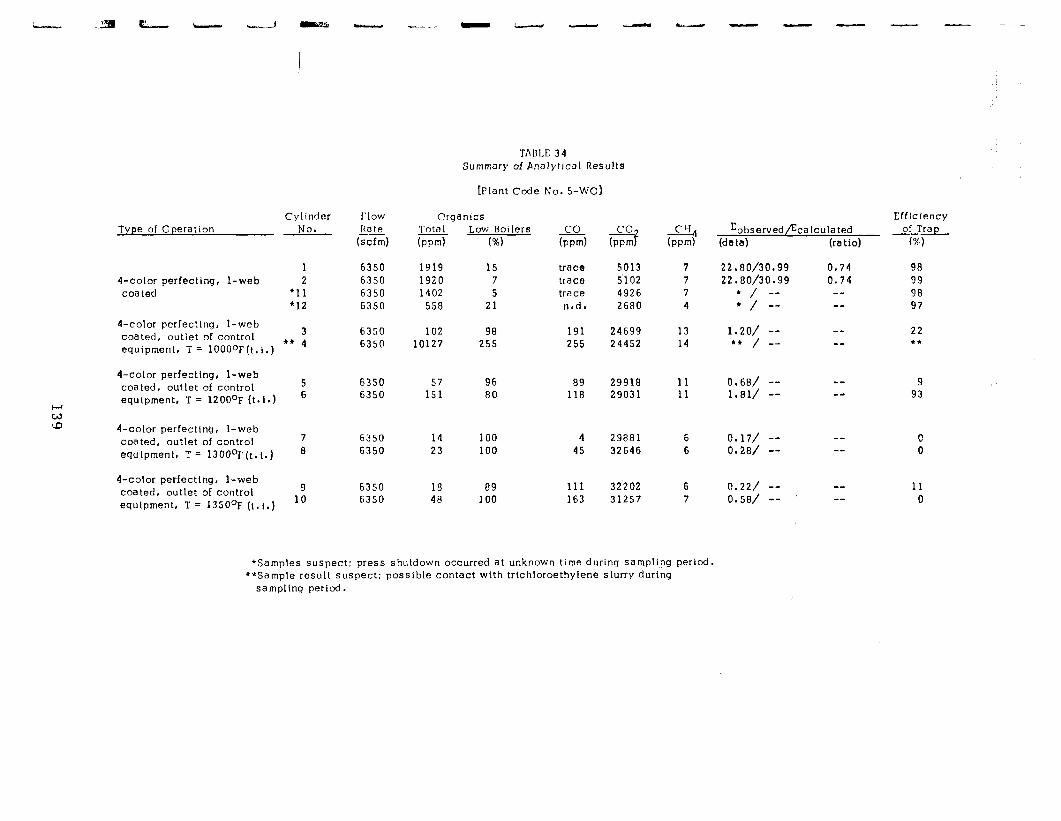
Type of Operation Cylinder
No.
1 4-color perfecting, i-web 2 coated ‘11
*12
4-color perfecting, l-web coated, outlet of control 3
equipment, T = lOOOoF(t. i,) l * 4
4-color perfecting, l-web coated, outlet of control 5
equipment, T = 1200°F (t.1.) ’
z LD 4-color perfecting, l-web
coated, outlet of control 7
equipment, T= 1300°F(t.t.) 8
4-color perfecting, l-web coated, outlet of control 9
equipment, T = 1350°F (t.1.) lo
l-low Organics Rate Tota I Low Boilers
(scfm) (pm) (%I co (mm)
cy, h-wn) 7 7 7 4
Eobserved&alculated (data) (ratio)
Efficiency of Trap
(%)
6350 1919 15 trace 5013 6350 1920 7 trace 5102 6350 1402 5 trace 4926 6350 558 21 n.d. 2680
22.R0/30.99 0.74 98 22.80/30.99 0‘74 99
l / -- me 98
* / -- -- 97
6350 102 98 191 24699 13 1.20/ -- -- 22 6350 10127 255 255 24452 14 *c / -- -- **
6350 57 96 89 29918 11 0.68/ -- -- 9 6350 151 80 118 29031 11 1.81/ -- -.. 93
6350 i4 --^ IUU 4 6350 23 100 45
6 0.171 -- -- 0 6 0.28/ -- -- 0
6350 18 89 111 32202 6 6350 48 100 163 31257 7
0.22/ -- -- 11 0.58/ ' -- -- 0
TABLE 34 Summary of Analytical Results
[Plant Code No. S-W01
*Samples suspect: press shutdown occurred at unknown time during sampling period. **Sample result suspect: possible contact with trtchloroethylene slurry during
sa mpl Ing period.

Type of Operation
4-color, l-web coated
4-color, l-web coated, outlet of control equipment. T = 1000°F (t.i.1
4-color, l-web coated,
w outlet of control equipment,
0” T = 1200°F (t. i. 1
4-color, l-web coated, outlet of control equipment T = 1300OF (t.1.)
Cylinder No.
15 16
*20 *21
19 22
17 18
**13 14
FLOW Rate
(scfm)
5100 5100 5100 5100
5100 5100
5100 5100
5100 5100
TABLE 35 Summary of Analytical Results
[Plant Code No. 6-WO1
Organics Tota I Low Boilers 0
co (%I bwd
2x2 CH4 Eobserved/Ecalculated kw4 (wd (data) (ratlo)
Efficiency of Trap
(%I
297 41 n.d. 3420 8 2.88/5.85 0.49 99 187 56 n.d. 3335 7 1.78/5.85 0.30 95
2 0 n.d. 1215 2 * -- 100 121 24 n.d. 2943 7 * -- 96
18 100 35 22655 23 0.17/ -- -- 0 29 83 24 21643 20 0.28/ -- -- 21
2 0
100 0
100 0
trace 26644 trace 24093
19 9
1 2
0.019/-- -- 0 o.ooo/-- -- --
2321 0
n.d. 32419 n.d. 32157
** -- 1oc o.ooo/-- -- --
*Samples suspect; press shutdown occurred at unknown time during sampling period. **Sample result suspect: possible contact with trichloroethylene slurry during sampling period.
,,
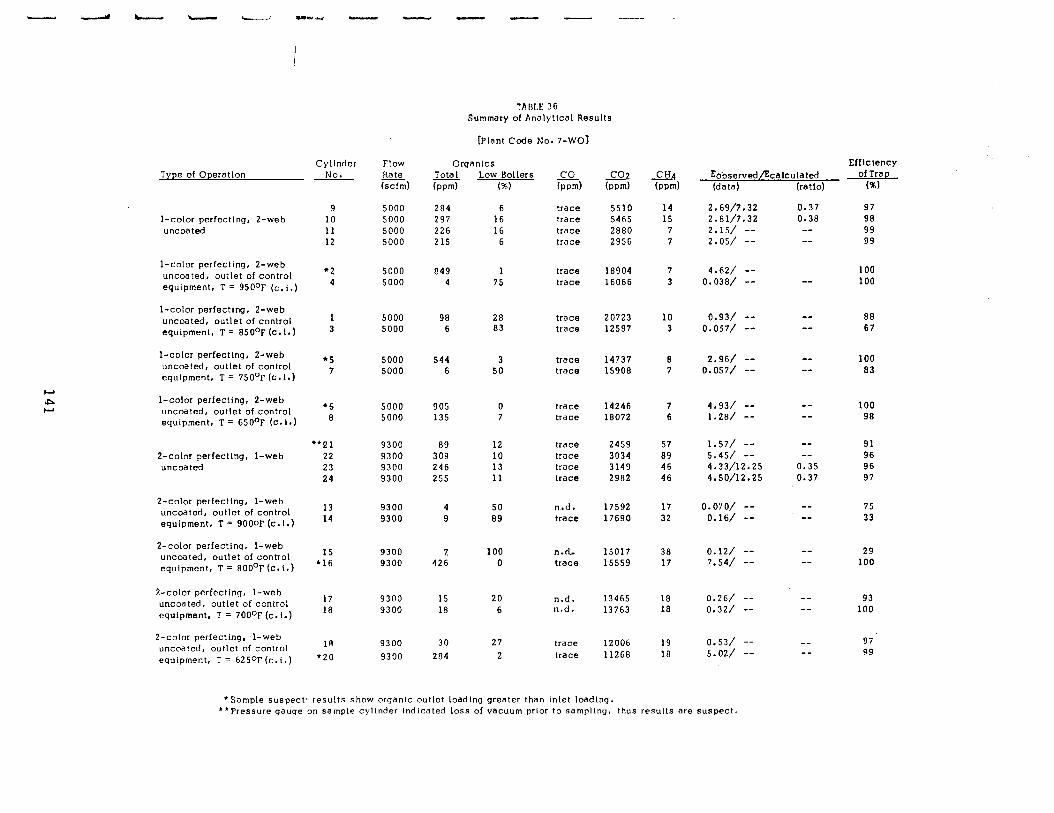
Type of Operation
l-color perfecting, a-web uncoated
l-color perfecting, 2-web uncoated, outlet of controi equipment, T = 95OoF (c. i.)
l-color perfecting. a-web uncoated, outlet of control equipment, T = B50°E (c.i.)
l-color perfecting, Z-web uncoated, outlet of control equipment, T = 75O’F (c.1.)
l-color perfecting, a-web uncoated, outlet of control equipment, T = 650°F (c. I.)
a-color perfecting, l-web uncoated
Z-color perfecting. l-web uncoated, outlet of control equipment, T = 9OOoF (c. I.)
2-color perfecting, l-web uncoated, outlet of control equipment, T = BOOoF (c. i.)
2-color perfecting, l-web uncoated, outlet of control equipment, T = 700°F (c. I.)
2-color perfecting, l-web uncoated, outlet of control equipment, T = 625oF (c.i.)
l Sample suspect results show organic outlet loading greater than inlet loading.
Cylinder No.
9 10 11 12
l 2 4
1 3
*s 7
*El 8
l *i! 1 22 23 24
13 14
15 l 16
17 18
19 *20
Flow Rate (scfm)
5000 5000 5000 5000
5000 5000
5000 5000
so00 5000
5000 5000
9300 9300 9300 9300
9300 9300
9300 9300
9300 9300
9300 9300
TABLE 36 Summary of Analytical Results
[Plant Code No. 7-WOj
Organlcs Tota (w-d
284 297 226 215
Low Boilers (%I
6 16 16 6
co bd
trace trace trace trace
i%
5510 5465 2880 2956
CH4 (pm)
14 15 7 7
EobservedPkaIculated (data) (ratlo)
2.69/7.32 2.81/7.32 2.15/ -- 2.05/ --
0.37 0.38 --
849 1 trace 18904 7 4.62/ -- 4 75 trace 16066 3 0.036/ --
98 28 trace 20723 10 6 83 trace 12597 3
0.93/ -- 0.057/ --
544 3 trace 14737 8 2.96/ -- 6 50 trace 15908 7 0.057/ --
-_
--
905 0 trace 14246 7 135 7 trace 16072 6
4.93/ -- 1.28/ --
-_ 89 12 trace 2459 57 1.57/ -- 309 10 trace 3034 89 5.45/ -- 246 13 trace 3149 46 4.33/12.25 255 11 trace 2962 46 4.50/12.25
-- 0.35 0.37
4 50 n.d. 17592 17 0.070/ -- -_ 9 69 trace 17690 32 0.16/ -- ’ --
7 100 n.ct 15017 426 0 trace 15559
0.26/ -- 0.32/ --
30 27 trace 12006 284 2 trace 11268
38 17
18 18
19 18
0.12/ -- 7.54/ --
15 20 n.d. 13465 18 6 n.d. 13763
0.53/ -- 5.02/ -- --
Efflctency of Trap
(%)
97 98 99 99
100 100
88 67
100 03
100 98
91 96 96 97
75 33
29 100
93 100
97 99
“Pressure gauge on sample cylinder indicated loss of vacuum prior to sampling, thus results are suspect.
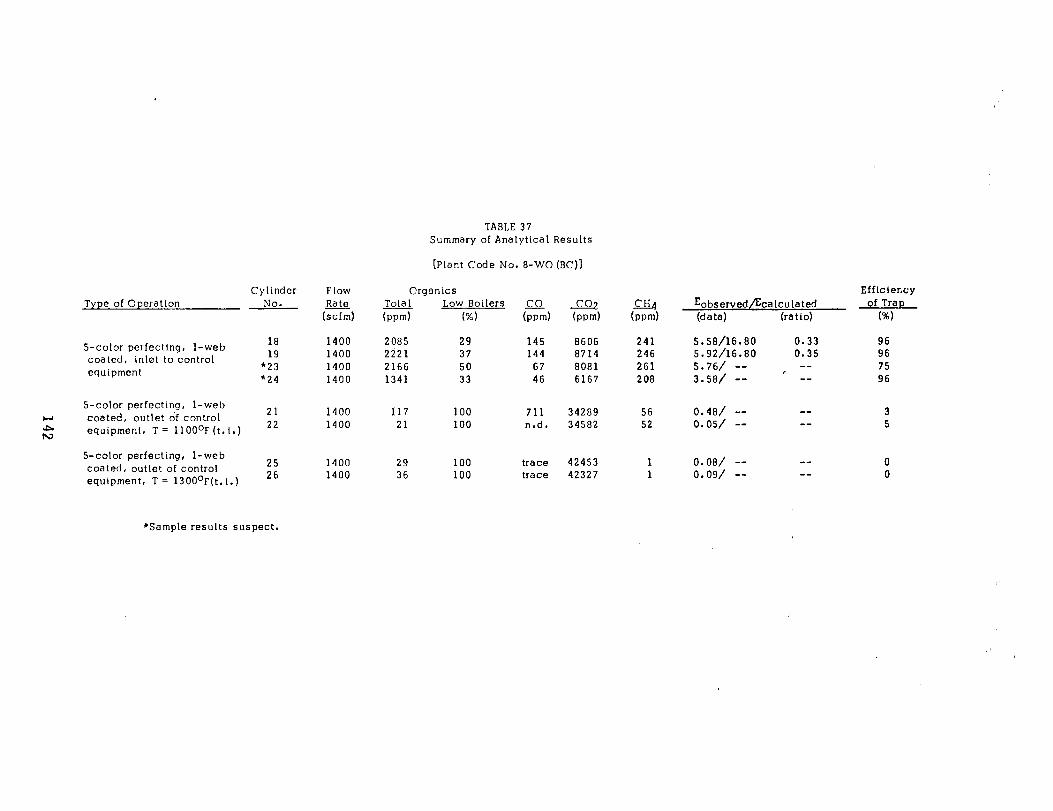
Type of Operation Cylinder Flow Otganics Efflcler,cy
No. Rate Tota I Low Boilers co co? CHa Eobsetved/Ecalculated of Trap (scfm) hwd (%I (w-d hwd bd (data) (ratio) (%I
S-color perfecting, l-web coated, inlet to control equipment
5-color perfecting, l-web t-, coated, outlet df control
e equipmenh T = llOD°F(!.!i)
S-color perfecting, l-web coated, outlet of control equipment, T = 1300°F(t. I.)
18 1400 2085 29 145 8606 241 19 1400 2221 37 144 8714 246
*23 1400 2166 50 67 8081 261 *24 1400 1341 33 46 6167 208
21 1400 22 1400
25 1400 26 1400
TABLE 37 Summary of Analytical Results
(Plant Code No. E-W0 (BC)]
117 21
29 36
100 100
100 100
711 34289 56 n-d. 34582 52
trace 42453 1 trace 42327 1
5.58/16.80 0.33 96 5.92/16.80 0.35 96 5.76/ -- -- 75 3.58/ --
, -- 96
0.48/ -- -- 3 0.05/ -- -- 5
0.08/ -- -- 0 0.09/ -- -- 0
*Sample results suspect.
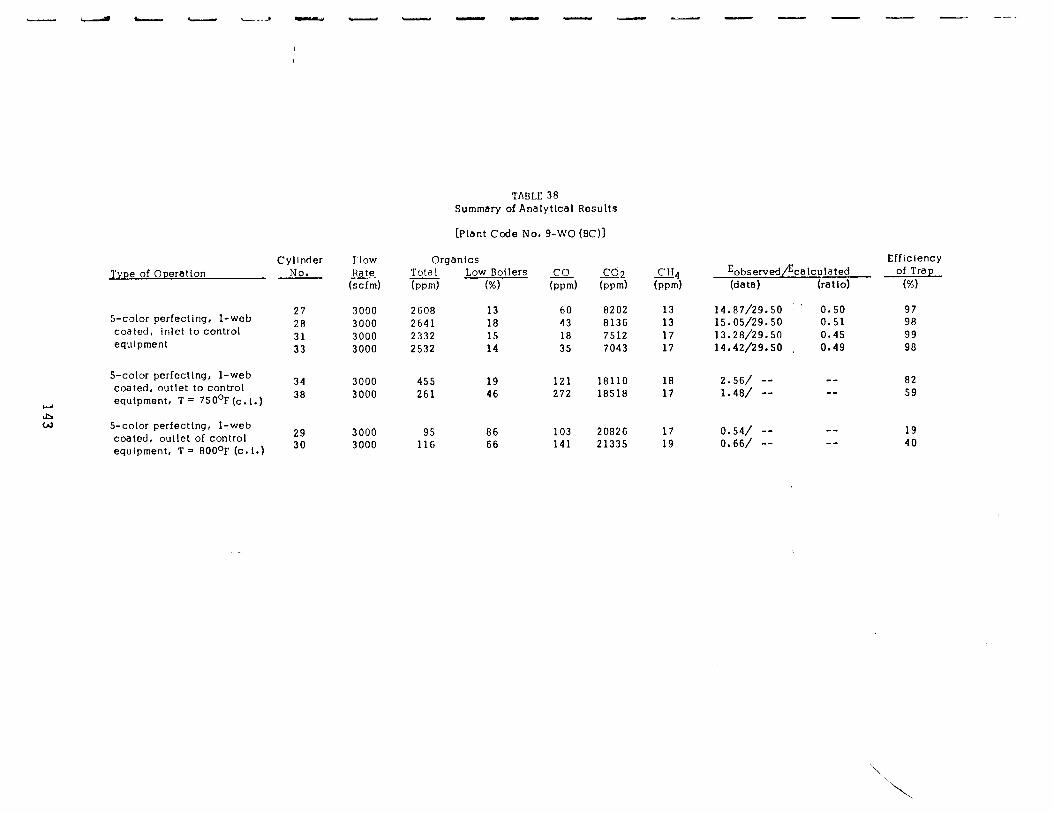
TABLE 38 Summary of Analytical Results
[Plant Code No. 9-WO (BC)]
Type of Opetatlon Cylinder
No.
S-color perfecting, l-web coated, inlet to control equipment
27 28 31 33
S-color perfecting, l-web coated, outlet to control equipment, T = 750°F (c. i.)
5-color petfectlng, l-web coated, outlet of control equipment, T = 8000~ (c. 1.)
34 38
29
3o
Flow Rate (scfm)
3000 3000 3000 3000
3000 3000
3000 3000
Otganlcs Tota I Low Boilers hwd (%I
2608 13 2641 18 2332 15 2532 14
455 19 121 18110 18 2.56/ -- 261 46 272 18518 17 1.48/ --
95 86 io3 20826 1: 0.54,/ =a 116 66 141 21335 19 0.66/ --
co kwd
60 43 18 35
cd2 (pm)
8202 8136 7512 7043
CH4 (wd
13 13 17 17
Eobsetved calculated (data) (tatlo)
Efficiency of Trap
(%I
14.87/29.50 15.05/29.50 13.28/29.50 14.42/29.50
0.50 97 0.51 98 0.45 99 0.49 98
-- 82 -- 59
-- 19 -- 40
\ ‘\.

TABLE 39 Average Low Boiling Percentages for
Various Web Offset Operations
Operational Sample Characteristics Temp.
(OF)
d.f.h.a., coated paper 210-340
Thermal incineration (outlet samples) 1000
1100 1200 1300
d.f.h.a. uncoated. paper 172-240
Catalytic incineration (outlet samples) 625
650 700 750 800 850 900 950
h-v. h.a., coated -pa per 240-390
Catalytic incineration (outlet samples) 750
800
Thermal incineration (outlet samples) 1000
1200 1300 1350
Organics Total Low Boiler bwd kwd
8420 3211
Dryer Low Boiler Temp.
(%I (OF)
38 340-400
4 7 42 89 138 138 100
2 2 100 2386 2386 100
19211 216 11 550-600
3 14 13 4 1040 11 1
3 3 4 12 55 0 18 3 433 8 2 104 32 31
1 3 10 77 85 3 8 1
15912 2150 14 450
71 6 206 2 1 :t 159
29 75
1022!3 10191 100 208 176 85
3 7 37 100 66 64 97
144
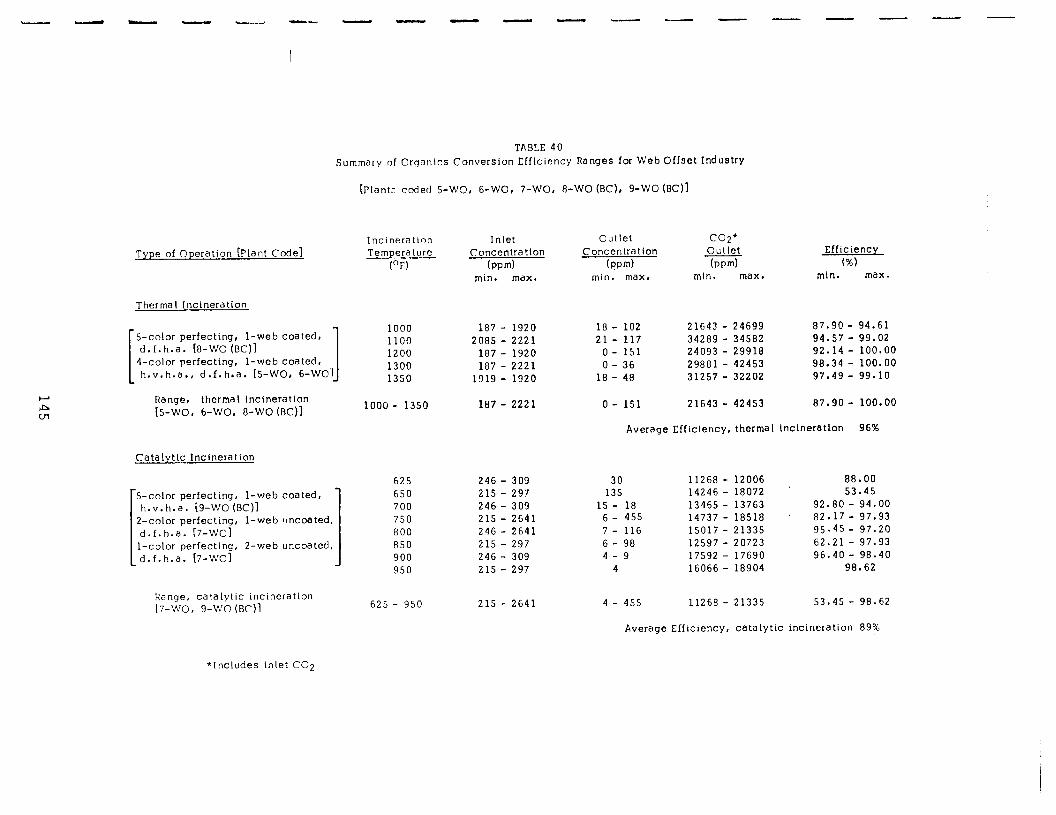
TABLE 40 Summary of Organics Converslon Efficiency Ranges for Web Offset Industry
[Plantr coded 5-WO, 6-WO, 7-WO, 8-WO (BC), 9-WO (EC)]
Type of Operation [Plant Code]
Thermal Incineration
5-color perfecting, l-web coated, d.f.h.a. [E-W0 (BC)]
4-color perfecting, l-web coated. h.v.h.a., d.f.h.a. [5-WO, I 6-WO!
Range, thermal incineration [S-WO, 6-WO, E-W0 (BC)]
Catalyttc Incineration
‘s-color perfecting, l-web coated, h.v.h.a. [S-W0 (BC)]
2-color perfecting, l-web lincoated. d.f.h.a. [7-WO1 l-color perfecting, 2-web uncoated, d.f.h.a. t7-WO1
Range, catalytic incineration [7-wo, g-w0 (l3C)l
Incineration Tempera turc
(OF‘)
1000 187 - 1920 1100 2085 - 2221 1200 187 - 1920 1300 187 - 2221 1350 1919 - 1920
1000 - 1350
625 246 - 309 30 650 215 - 297 135 700 246 - 309 15 - 18 750 215 - 2641 6 - 455 800 246 - 2641 7- 116 850 215 - 297 6- 98 900 246 - 309 4-9 950 215 - 297 4
625 - 950 215 - 2641
Inlet Concentration
(fwm) min. max.
187 - 2221
Outlet Concentration
(pm) min. max.
co2* Outlet (wd
min. max.
Efficiency (%I
min. max.
18 - 102 21643 - 24699 87.90 - 94.61 21- 117 34289 - 34582 94.57 - 99.02
o- 151 24093 - 29918 92.14 - 100.00 0- 36 29881 - 42453 98.34 - 100.00
18 - 40 31257 - 32202 97.49 - 99.10
0 - 151 21643 - 42453 87.90 - 100.00
Averanc! F.fficinncy, thermal lnctneratton 96% z- --- -~-
11268 - 12006 88.00 14246 ’ - 18072 53.45 13465 - 13763 92.80 - 94.00 14737 - 18518 82.17 - 97.93 15017 - 21335 95.45 - 97.20 12597 - 20723 62.21 - 97.93 17592 - 17690 96.40 - 98.40 16066 - 18904 98.62
4 - 455 11268 - 21335 53.45 - 98.62
Average Efficiency, catalytic incineration 89%
*Includes inlet CO2
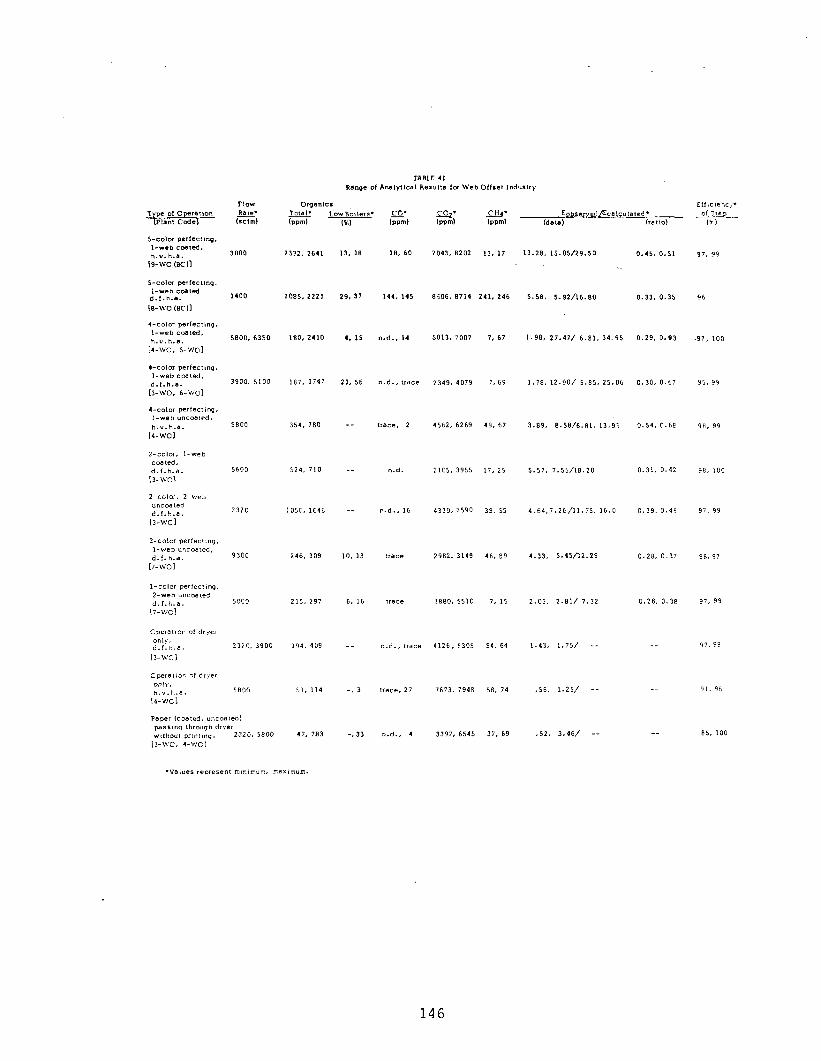
4-color periect,nq. I-web CMled, d.i.h.8. 3900, 5100
[3-wo. b-W01
,-color per‘ectlng. l-web ""coered, h.".h.a. 5800
l4-WOI
*-color. l-web coated, d.f.h.3.
I3-WOI
5600
uncmted d.,.h.a.
1sWC1
2320
*-color perfecting. l-web “nccared, d.f.h.a. 9300
[7-WOI
2-web AcaWd - d.,.h.a. 5000 I7-WC1
2320. 3900
I,-WC1
cperat,sr or dr.,er O”lY# h.“.h.c?. 5800
I4-WC1
Paper (coated, uncoated) passing through dryer wtrtmut prtnt,ng. 2320, 5800
[3-WC. 4-WC,
2332, 2641
2085, 222,
,BO, 2410
187, 1717
354, 780
524. 710
1050.1646
246, 309
215, 297
194, 409
51, 114
17. 783
13. 10
29. 37
4. 15
21. 56
--
__
_-
10. 13
6, 16
--
-* 3
.-. 33
18, 60
144. 145
“.d.. 1.
“.d., trace
trace. 2
“.d.
“.d., 16
trace
trace
rl.d., trace
trace, 27
“.d., 4
7043, 8202 13.17 13.28. 15.05/29.50
eh06.8711 241, 246 5.58. S-92/16.80
5013. 7007 7, 67 1.98. 27.47/ 6.8,. 34.95
2349, 1079 7. 64 1.?8.12.90/ 5.85, 25.06
4562, 6269 48. 67 3.89. 8.58/6.81, 13.95
2105. 3955 17.25 5.57, 7.55/18.20
$330, ,590 39, 55 4.64,i.26/11.?5. 16.0
i1962, 3149 45.89 4.33, 5.4s/l2.25
:2eeo. 5510 7. 15
4126, 5305 54. 64
7673. 7948 59. 74
3397,654s 37, 69
2.05, 2.81/ 7.32
1.43. 1.?5/ --
.56. 1.25/ --
.52, 3.w --
0.45,0.51
0.33. 0.35
0.29, 0.93
0.30. 0.67
0.54, o.Eze
0.31. 0.42
0.39. 0.45
0.28, 0.37
0.28, 0.38
__
__
--
146
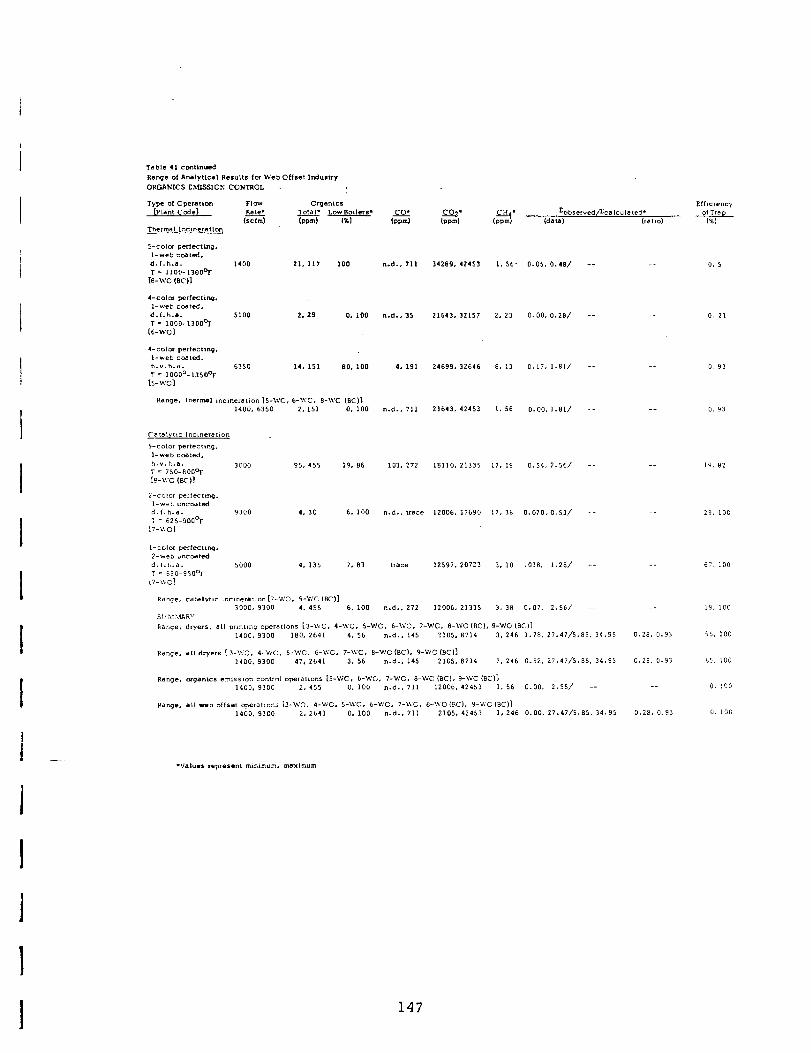
4-cobf perfeclmq. l-web coated. ll.v.tl.a. 6350 14. 151 T = lOOO~-13soor
IS-WC1
100
0. 100
so. 100
Range. lhermal ~ncmeralton b-WC. &WC. B-UC (SC)] 1400. 6350 2.151 0, 100
tl.d.. 3s 21643.32157 2, 23 0.00,0.28/ --
4. 191 21699, 32616 6. 13 0.17, 1.81/ --
“.d., 711 21643. 42453 I. 56 0.00, l.Bl/ --
103. 272 18110. 2133s 17, 19 0.54, 2.w --
n-d.. *race 12006. 17690 17. 38 0.0?0.0.53/ --
trace 12597. 20723 3.10 ,038. 1.28/ --
n.d.. 272 12006.21335 3, 38 0.07, 2.56/ --
lance. dryers. a,, pr,r.tmg operatrons 13.V.C. 4-WC. S-WO, 6-WC, 7-MC. E-WC (BCI, g-WC (SC)] 1400. 9300 180.2641 1. 56 n.d., 145 1105.8714 3,246 1.78. 27.47/5.85. 34.95
mnge. a,~ dr(ers I3-UC, d-WC, 5-WC. &WC, 7-WO, B-WC (BC), 9-W: fBCl1 1400. 9300 47. 2641 3. 56 n.d.. 115 2105.8714 7. 246 0.52, 27.47/5.85, 34.95
Range. orpamcs ern,aaron control operatmns [S-WC. b-WO. ,-WC, B-WC (BCI. 9-WC (BC)] 1100, 9300 2. 455 0. 100 n.d.. 711 12006, 42453 1. 56 0.00, 2.56/ --
Range. aLI web 0**5et operarmns bM’0, ‘I-WC, 5..WC, 6-WC, 7-WC, B-U0 (BC). 9-WC (‘S-J] 1400. 9300 2. 2641 0. 100 “.d.. 711 2105. 42453 1,246 0.00.27.47/5.85. 34.95
0, 21
0. 93
0, 93
__
-_
0.28. 0.93
0.28, 0.93
__
0.28, 0.93
67, 100
iq, 100
95, 100
BS. loo
0. 100
0. 130
i -
147
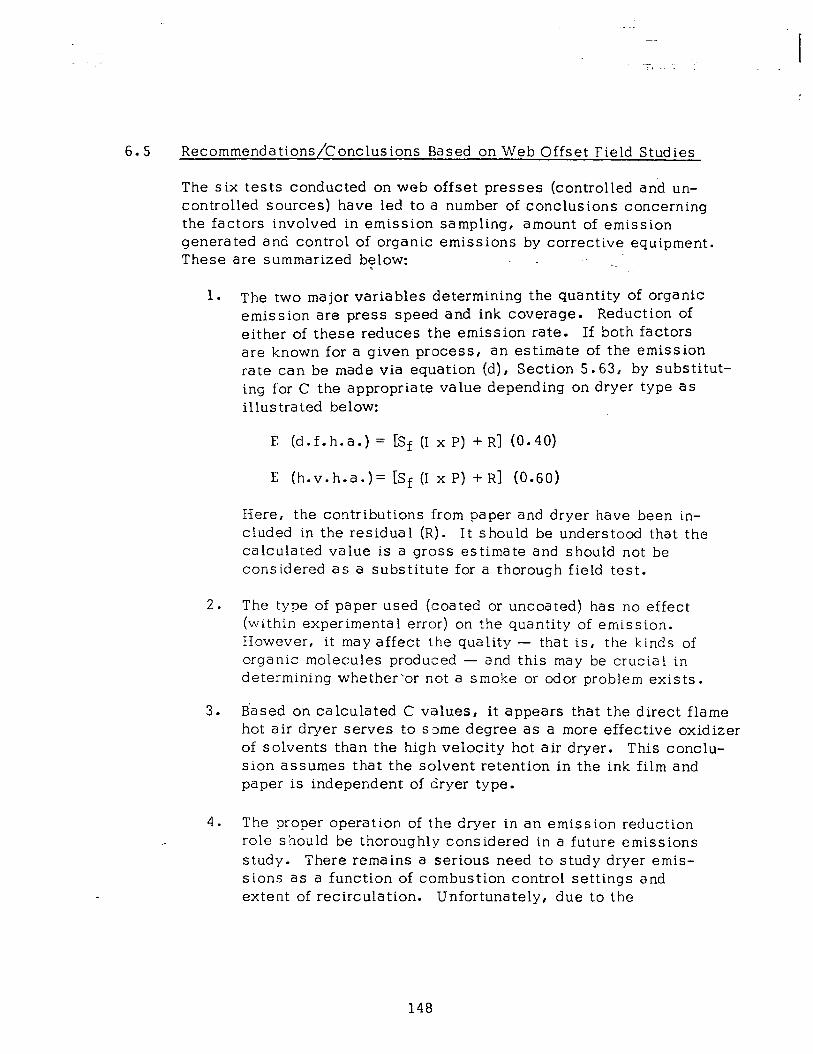
6.5 Recommendations/Conclusions Based on Web Offset Field Studies
The six tests conducted on web offset presses (controlled and un- controlled sources) have led to a number of conclusions concerning the factors involved in emission sampling, amount of emission generated and control of organic emissions by corrective equipment. These are summarized below: - -- .
1. The two major variables determining the quantity of organic emission are press speed and ink coverage. Reduction of either of these reduces the emission rate. If both factors are known for a given process, an estimate of the emission rate can be made via equation (d), Section 5.63, by substitut- ing for C the appropriate value depending on dryer type as illustrated below:
E: (d.f.h.a.) = [Sf (I x p) + R] (0.40)
E (h.v.h.a.)= [Sf (I x P) + R] (0.60)
Here, the contributions from paper and dryer have been in- cluded in the residual (R). It should be understood that the calculated value is a gross estimate and should not be considered as a substitute for a thorough field test.
2. The type of paper used (coated or uncoated) has no effect (within experimental error) on the quantity of emission. However, it may affect the quality - that is, the kinds of organic molecules produced - and this may be crucial in determining whether‘or not a smoke or odor problem exists.
3. Based on calculated C values, it appears that the direct flame hot air dryer serves to s3me degree as a more effective oxidizer of solvents than the high velocity hot air dryer. This conclu- sion assumes that the solvent retention in the ink film and paper is independent of dryer type.
4. The proper operation of the dryer in an emission reduction role should be thoroughly considered in a future emissions study. There remains a serious need to study dryer emis- sions as a function of combustion control settings and extent of recirculation. Unfortunately, due to the
148

I -_.
limited time allotted to a study of the two drying systems, direct flame hot air and high velocity hot air, the degree of emission reduction achievable through the operation of the dryer was not fully evaluated. The extent of recirculation of the gas stream within the various drying sys terns was not evaluated in the program .
In all cases the testing was conducted on equipment running per norma 1 operation. No advance preparation in the form of dryer tune- ups, etc. was made. It remains conceivable that greater amounts of organic material could be oxidized in the dryer to CO2 and H20 than reported in this study, which further indicates the need for regular dryer maintenance or tune-up programs.
5. Based on the systems studied, therma 1 and catalytic incinerators are effective in reducing organics. (In all cases, at llOO- 1200°F for thermal incineration and 700-800°F for catalytic incineration,control units were able to achieve a 95 percent level of organic conversion at the stated incineration tempera- ture . )
6. Based on the emission sampling of both uncontrolled and con- trolled web offset processes, it appears that sampling in quad- ruplicate, that is, two sets of duplicate samples may be necessary. The wide range of emission values obtained in several of the duplicate sample sets as sampled coupled with frequent press interruption .tend to support this recommendation. Furthermore, there exists a greater assurance of reliability of the sampling results if based on four determinations as opposed to two. Familiarity with thle sampling procedure as well as the process under evaluation mlay tend to reduce this requirement with repeated samplings. Initially, however, it is recommender that a minimum of four samples be collected for the process variable to be evaluated.
7. In the absence of concentration gradients, integrated grab sampling is a simple and effective technique for determining the total organic content of an emission. In the presence of concentration gradients, multiple grab samples should be collected in a pre-determined number of equal areas in order to assure representative sampling of the process. It cannot be over-emphasized that sampling should be conducted only at a point of uniform flow and good mixing so as to provide a greater assurance that the sample obtained will be representa- tive of the process under evaluation.
8. In the conduct of evaluating selective process variables (i.e., reduced solvent ink systems) the measurement of the
I 149

contribution of paper and dryer exhaust to the total organic con- tent of the effluent stream cannot be overlooked. Establishment of an adequate background emission level is necessary if one is to be able to distinguish, identify and report on various process modifications as to their effect on the quantity of e.mitted organics. While it has been demonstrated in the field sampling conducted in this program that the contribution from both paper and dryer exhaust are of a minor nature, they should not beover- looked if a detailed evaluation of the process is desired.
9. The work of Carruthers, (74) has shown that the percentage of low-boiling compounds in a web offset emission is higher for direct flame drying than for high velocity type drying, and higher for coated stock than for uncoated. The observation suggest the involvement of a thermal cracking of the hydro- carbons (which produces small, low boiling molecules) would be favored by a coated sheet (where adsorbed molecules would tend to be more exposed than on an uncoated sheet) under high temperatures . Since it is believed that low boilers (74) con- tribute to the odor problem in web offset printing, the per- centage of these compounds in the emission assumes considerable importance.
In Table 39 (see Section 6.4) data is presented which agrees with the observations of Carruthers. For coated stock passing through a direct flame hot air dryer, the percentage of low boilers is 38; this should be compared with 11 percent for un- coated stock. Data from the high velocity hot air dryer (coated paper) showed only 14 percent low boilers - considerably less than the direct flame hot air dryer.
Table 39 (see Section 6.4) also gives percentage low boilers derived from thermal and catalytic incinerators. As might be expected, the thermal incinerator, with its higher operating temperature, gave a higher percentage of low boilers.
10. As a recommendation for further study, we suggest that the organic conversion efficiency of a given air pollution control unit be determined as a function of gas cost, that is, that a plot of efficiency versus cost/hour of press time be made. In the studies conducted in this program an assessment of efficiency in terms of temperature was determined. In view of reported fuel shortages throughout the country and in view of the understandable interest of printers in the economics of this control equipment,, it would be of extreme value to relate whether an efficiency increment, say from 95 to 97 percent would be worth the additional cost and resource burdens.
15 0
In the sampling conducted at the various plants, no single plant metered natural gas separately to the dryer and to the control equipment. It would seem necessary that one be able to measure the input of gas into the system so as to be able to relate it to efficient operation. If a cost versus efficiency study can he con- ducted it should also include an afterburner unit which supplies a majority of the heat for the dryer through a heat exchanger. The feasibility of field application of-this type of system at the present time appears remote.
11. A recent study (94) by J. D. Carruthers, Ambassador College Press, Pasadena, California, has indicated that isopropyl alcohol from Dahlgren type dampening systems may be a contributor to a heatset dryer organic emission. More extensive studies are warranted by these disclosures in terms of in depth evaluation of the contribution of organic products from alcohol dampening systems to the total observed organic emission from a printing press.
151
---..---“ll..--,..- “a,“..-1,..-“... “_, . . ._..... -.- -.,. - e.--
! 7 . 0
7. 1.
7 . 21
7 .2 1
METAL DECORATING FIELD TESTS
Introduction
The fourth task of the Phase II program effort was directed toward the assessment of emissions from both uncontrolled and controlled metal decorating coating and lithographic operations including the operation of ovens containing no processed metallic s beets. The completed task included a study of the individual and net effect of the various oven combustion products, ink coverage, and the different coating weights and solvent percentages upon the ex- hausted emissions.
Experimental Results - Uncontrolled Plants
Plant Test No. 2-MD (Appendix E)
Field studies were conducted at a metal decorating plant which utilized no air pollution control equipment. This testing followed the sampling program outlined in Table 15, Appendix C.
7he sampling procedure previous1.y described in Section 4.0 was followed in the field. Twenty-six samples were collected from a variety of metal decorating operations and were analyzed. All data collected at this plant were coded and assigned an appropri- ate code No. 2-MD,and can be located in Appendix E. Press oper- ating conditions at the time of sampling were recorded. Sheet sizes, milligram weights of coatings, and press speeds were ob- tained for each process line studied. In addition, information was obtained from plant personnel on the percent solvent (by weight) for both coatings and inks utilized during the test.
The results of the tests are presented in Data Sheets Nos. 1 through 5, Appendix E, and in summary Table 42, this section. An error in an equation used by CMUPML in calculating results has decreased the reported calculated total sample volume and increased the cal- culated hydrocarbon content presented on these data sheets (see PML-72-24, .Appendix F, for extent of change).
The twenty-six samples were collected in an attempt to define and evaluate the various levels of emission from specific metal decor- a ting operations . Four samples (numbered 3 through 6 consecu- tively) were collected to determine whether or not emissions from only the heated oven decreased with time (see Table 43, thi.s sec- tion). Tt was found that the total organic content of the stream remained relatively constant over a 40-minute period. Additionally, two samples Nos. 27 and 28, were taken from only a heated coat- ing oven over a 30-minute period with similar results. The
153
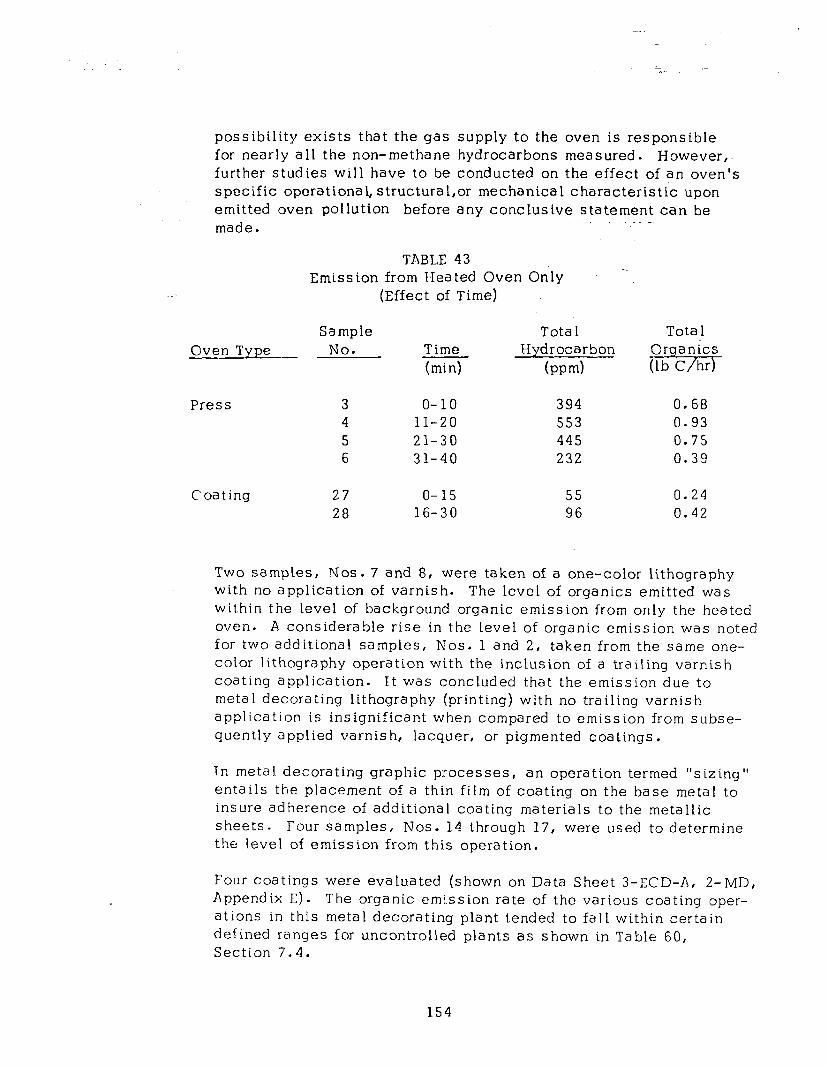
possibility exists that the gas supply to the oven is responsible for nearly all the non-methane hydrocarbons measured. However,. further studies will have to be conducted on the effect of an oven’s specific operational, structural,or mechanical characteristic upon emitted oven pollution before any conclusive statement can be made.
Oven Type -
Press
Coating
TABLE 43 Emission from Hea ted Oven Only
(Effect of Time)
Sample No. Time
(min)
Tota 1 Hydrocarbon
(mm)
3 O-10 394 0.68 4 11-20 553 0.93 5 21-30 445 0.75 6 31-40 232 0.39
27 o-15 55 0.24 28 16-30 96 0.42
Tota 1
e-%7
Two samples, Nos. 7 and 8, were taken of a one-color lithography with no application of varnish. The level of organics emitted was within the level of background organic emission from only the heated oven. A considerable rise in the level of organic emission was noted for two additional samples, Nos. 1 and 2, taken from the same one- color lithography operation with the inclusion of a trailing varnish coating application. It was concluded that the emission due to metal decorating lithography (printing) with no trailing varnish application is insignificant when compared to emission from subse- quently applied varnish, lacquer, or pigmented coatings.
Tn metal decorating graphic processes, an operation termed “sizing” entails the placement of a thin film of coating on the base metal to insure adherence of additional coating materials to the metallic sheets. Four samples, Nos. 14 through 17, were used to determine the level of emission from this operation.
Four coatings were evaluated (shown on Data Sheet 3-ECD-A, 2-MD, Append ix E) . The organic emiission rate of the various coating oper- ations in this metal decorating plant tended to fall within certain defined ranges for uncontrolled plants as shown in Table 60, Section 7.4.
154
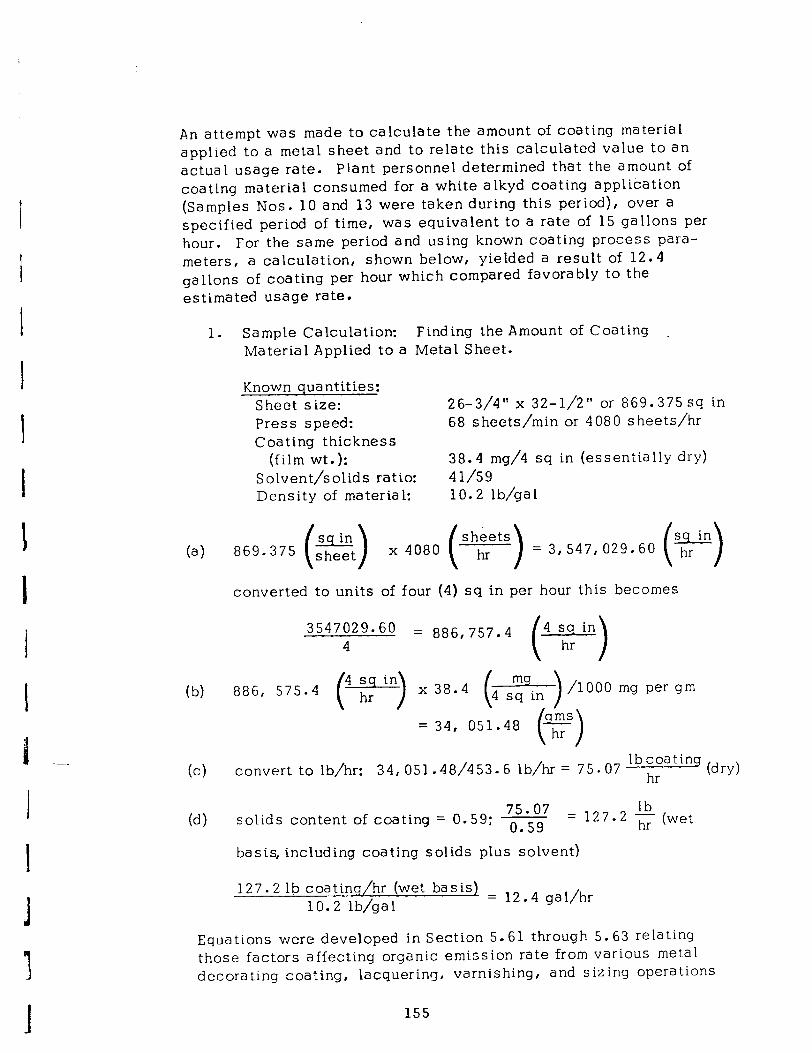
An attempt was made to calculate the amount of coating material applied to a metal sheet and to relate this calculated value to an actual usage rate. Plant personnel determined that the amount of coating materiat consumed for a white alkyd coating application (Samples Nos. 10 and 13 were taken during this period), over a specified period of time, was equivalent to a rate of 15 gallons per hour. For the same period and using known coating process para- meters, a calculation, shown below, yielded a result of 12.4 gallons of coating per hour which compared favorably to the estimated usage rate.
1. Sample Calculation: Finding the Amount of Coating Material Applied to a Metal Sheet.
Known quantities: Sheet size: 26-3/4” x 32-l/2” or 869.375 sq in Press speed: 68 sheets/min or 4080 s heets/hr Coating thickness
(film wt.): 38.4 mg/4 sq in (essentially dry) Solvent/solids ratio: 41/59 Density of material: 10.2 lb/gal
(4 869.375 (z-) x 4080 (shpts) = 3,547,029.60 (y)
converted to units of four (4) sq in per hour this becomes
3547;29.60 = 886, 757.4
(b) 886, 575.4
(cl convert to lb/hr: lb coating
34,051.48/453.6 lb/hr= 75.07 hr (dry)
(d) 75*07 = 127 2 -!!L twet solids content of coating = 0.59: - . 0.59 hr
basis, including coating solids plus solvent)
127.2 lb coating/hr (wet basis) 10.2 lb/gal
= 12.4 gal/hr
Equations were developed in Section 5.61 through 5.63 relating those factors affecting organic emission rate from various metal decorating coating, lacquering, varnishing, and sizing operations
155
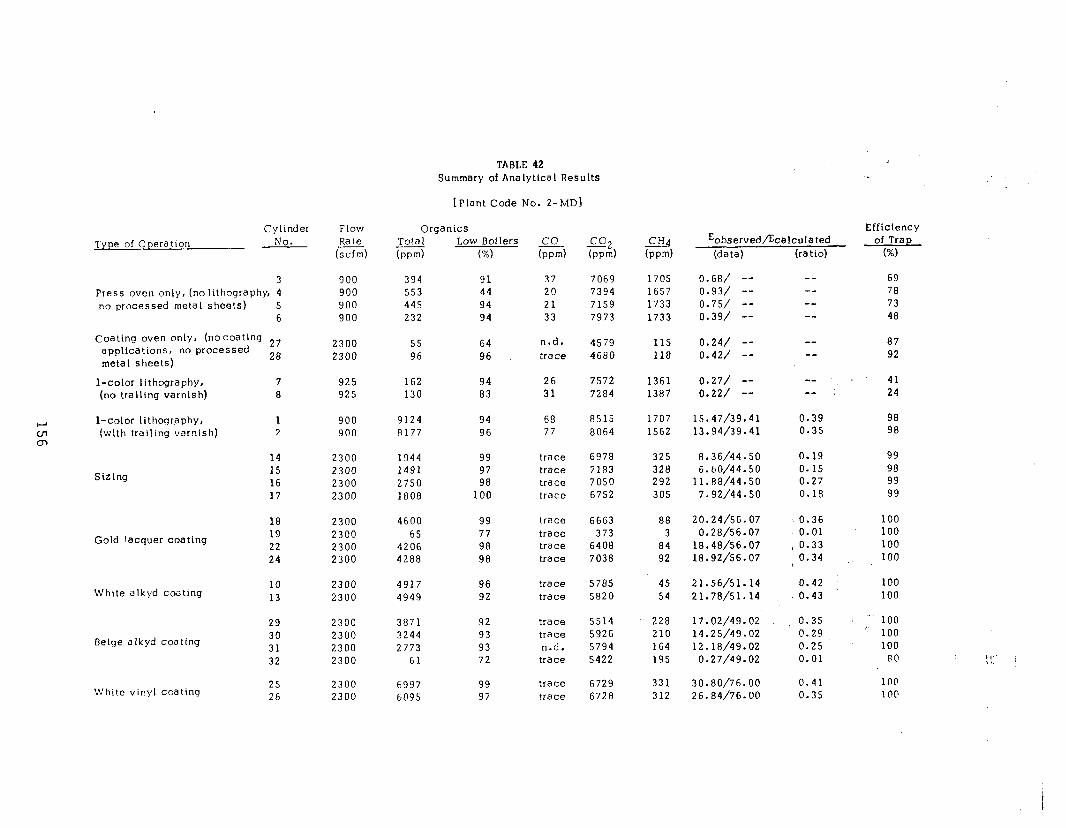
Type of Cperdtion Cylinder
No.
3 900 394 91 37 7069 1705 0.68/ -- -- 69 Press oven only, (no lithography, 4 900 553 44 20 7394 1657 0.93/ -- -- 78 no processed metal sheets) 5 900 445 94 21 7159 1733 0.75/ -- -- 73
6 900 232 94 33 7973 1733 0.39/ -- -- 48
Coating oven only, (nocoating ?7 applications. no processed metal sheets) 28
l-color lithography, 7 (no trailing varnish) 8
2300 55 64 n.d. 4579 115 0.24/ -- 2300 96 96 trace 4680 118 0.42/ --
925 162 94 26 7572 1361 0.27/ -- 925 130 83 31 7284 1387 0.22/ --
-- 87 -- 92
-- 41 -- : 24
0.39 98 0.35 98
0.19 99 0.15 98 0.27 99 0.18 99
v l-color lithogr,aphy, 1 iii (with trallinn . . . . . y urrni+h\ . I. . .._... 2 0
14 15 16 17
18
Gold lacquer coating 19 22 24
White alkyd coating IO 2300 4917 96 trace 5785 45 21.56/51.14 13 2300 4949 92 trace 5820 54 21.78/51.14
29
Beige alkyd coating 30 31 32
White vinyl coating 25 2300 6997 99 trace 6729 331 30.80/76.00 0.41 100 26 2300 6095 9i trace 6728 312 26.84/76.00 0.35 100
Flow Rare
(scfm)
Organics Total Low Boilers co bpm) (%) bpm)
Co, (w-d
CHq bpd
Eobserved/Ecalculated (data) (ratio)
900 9124 94 68 8515 1707 15.47/39.41 900 8177 96 77 8064 1562 13.94/39.41
2300 1944 99 trace 6978 325 8.36/44.50 2300 1491 97 trace 7183 328 6.60/44.50 2300 2750 98 trace 7050 292 11.88/44.50 2300 1808 100 trace 6752 305 7.92/44.50
2300 4600 99 trace 6663 88 20.24/56.07 2300 65 77 trace 373 3 0.28/56.07 2300 4206 98 trace 6408 84 18.48/56.07 2300 4288 98 trace 7038 92 18.92/56.07
2300 3871 92 trace 5514 228 17.02/49.02 2300 3244 93 trace 5926 210 14.25/49.02 2300 2773 93 n.d. 5794 164 12.18/49.02 2300 61 72 trace 5422 195 0.27/49.02
TABLE 42 Summary of Analyttcal Results
[Plant Code No. Z-MD]
Efficiency of Trap
(%)
5 0.36 100 0.01 100
( 0.33 100 0.34 ,, 100 /
0.42 100 0.43 100
- 0.35 100 0.29 I. 100 0.25 100 0.01 P@
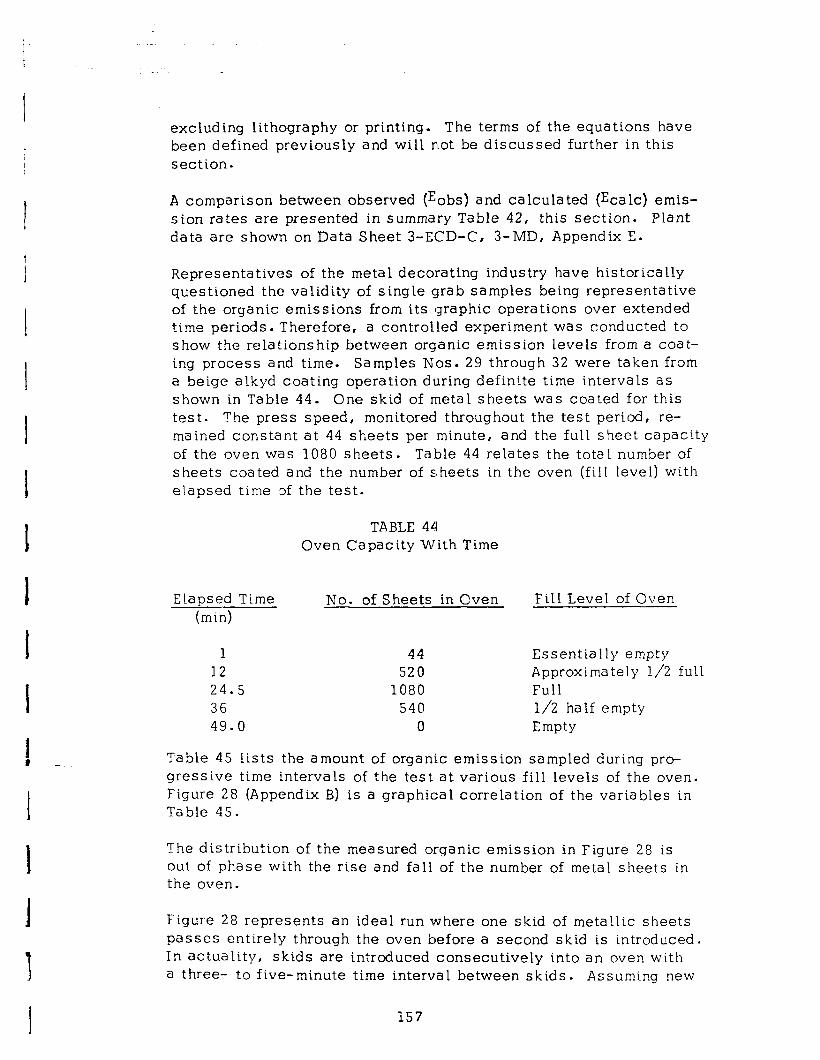
I
1 # -_
1
1
excluding lithography or printing. The terms of the equations have been defined previously and will not be discussed further in this section.
A comparison between observed (Eobs) and calculated (Ecalc) emis- sion rates are presented in summary Table 42, this section. Plant data are shown on Data Sheet 3-ECD-C, 3-MD, Appendix E.
Representatives of the metal decorating industry have historically questioned the validity of single grab samples being representative of the organic emissions from its graphic operations over extended time periods. Therefore, a controlled experiment was conducted to show the relationship between organic emission levels from a coat- ing process and time. Samples Nos. 29 through 32 were taken from a beige alkyd coating operation during definite time intervals as shown in Table 44. One skid of metal sheets was coated for this test. The press speed, monitored throughout the test period, re- mained constant at 44 sheets per minute, and the full sheet capacity of the oven was 1080 sheets. Table 44 relates the total number of sheets coated and the number of sheets in the oven (fill level) with elapsed time lof the test.
TABLE 44 Oven Capacity With Time
Elapsed Time (min)
No. of Sheets in Oven Fill Level of Oven
1 44 Essentially empty 12 520 Approximately l/2 full 24.5 1080 Full 36 540 l/2 half empty 49.0 0 Empty
?able 45 lists the amount of organic emission sampled during pro- gressive time intervals of the test at various fill levels of the oven. Figure 28 (Appendix B) is a graphical correlation of the variables in Table 45.
The distribution of the measured organic emission in Figure 28 is out of phase with the rise and fall of the number of metal sheets in the oven.
Figure 28 represents an ideal run where one skid of metallic sheets passes entirely through the oven before a second skid is introduced. In actuality, skids are introduced consecutively into an oven with a three- to five-minute time interval between skids. Assuming new
i57
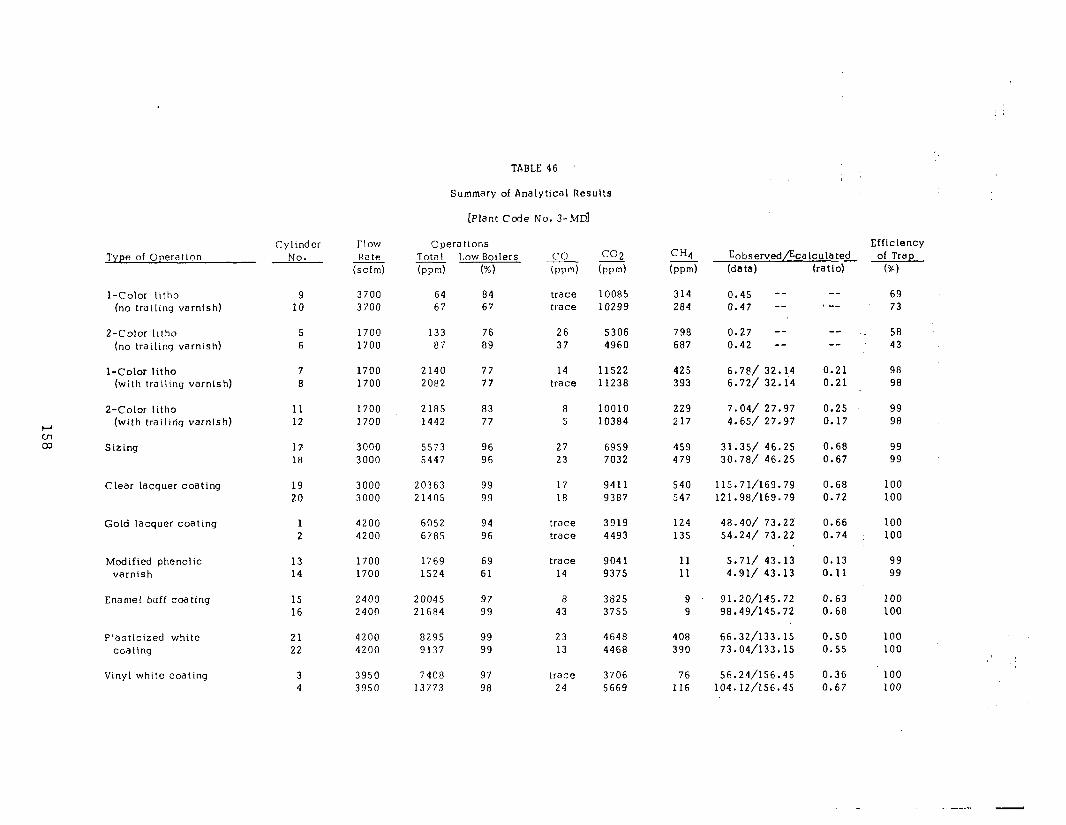
TABLE 46
Summary of Analytical Results
[Plant Code No. 3-MD]
Type of Operation Cylinder
NO. l-low Rate
(scfm)
Operations Tota I Low Boilers CO s CH4 bpd @I bpm) (wd (mm)
Efficiency Sobserved/EcaLculate& of Trap (data) (ratio) (%I
l-Color litho 9 3700 64 84 trace 10085 314 0.45 -- -- 69 (no trailing varnish) 10 3700 67 67 trace 10299 284 0.47 -- > -- 73
2-Color litho 5 1700 133 76 26 5306 798 0.27 -- -- 58 (no trailing varnish) 6 1700 87 89 37 4960 687 0.42 -- -- 43
l-Color litho 7 1700 2140 77 14 11522 425 6.7P/ 32.14 0.21 98 (with trailing varnish) 8 1700 2082 77 trace 11238 393 6.72/ 32. i4 0.21 98
2-Color litho (with trailing varnish)
Sizing
11 1700 2185 83 8 10010 229 7.04/ 27.97 0.25 99 12 1700 1442 77 5 10384 217 4.65/ 27.97 0.17 98
17 3000 5573 96 27 6959 459 31.35/ 46.25 0.68 99 18 3000 5447 96 23 7032 479 30.78/ 46.25 0.67 99
Clear lacquer coating 19 3000 20363 99 17 9411 540 115.71/169.79 0.68 100 20 3000 21405 99 18 9387 547 121.98/169.79 0.72 100
Gold lacquer coating 1 4200 6052 94 trace 3919 124 48.40/ 73.22 0.66 100 2 4200 6785 96 trace 4493 135 54.24/ 73.22 0.74 100
Modified phenolic 13 1700 1769 69 trace 904 1 11 5.71/ 43.13 0.13 99 varnish 14 1700 1524 61 14 9375 11 4.91/ 43.13 0.11 99
Enamel buff coating 15 2400 20045 97 8 3825 9 91.20/145.72 0.63 100 16 2400 21684 99 43 3755 9 98.49/145.72 0.68 100
Plasticized white 21 4200 8295 99 23 4648 408 66.32/133.15 0.50 100 cc3ting 22 4200 9137 99 13 4468 390 73.04/133.15 0.55 100
Vinyl while coating 4
3950 7408 97 trace 3706 76 56.24/156.45 0.36 100 3950 13773 98 24 5669 116 104.12/156.45 0.67 100
I I I I I I -
skids entered the oven every thirty minutes in an actual coating pro- cess, emission levels could be depicted as in Figure 29 (Appendix B), assuming a constant air dilution of emission or constant scfm. Figure 29 represents the curve in Figure 28 repeated over a four-hour period, and depicts high organic emission intervals when the emission from coated metallic sheets from two skids in the oven at the same time were added together. Although organic emission levels fluctu- ated with time, the total emitted organics over an extended time period could be represented by a graphical average.
Sample . No.
29 30 31 32
TABLE 45 Oven Organics Loading With Time
Time Interval Orqanic Loading Fill Level of Oven (min) hwm) (lb C/hr)
2-12 13-23 24-33 34-44
17.02 0 to one-half full 3871 3244 14.25 one- ha If to full 2773 12.18 full to one-half empty
61 0.27 one- half empty to e wty
7.2:2 Plant Test No. 3-MD (Appendix E)
Field studies were again conducted at a metal decorating plant which utilized no air pollution control equipment in an attempt to further evaluate metal decorating operations which were not included in the previous plant test (Plant Code No. 2-MD). Twenty-two samples were collected and analyzed for a variety of metal decorating opera- tions . All data collected at this plant were coded appropriately No. 3-MD. Press operating conditions at the time of sampling were recorded. Sheet size, milligram weight of coating, and coater speed were obtained for each process line studied. In addition, information was obtained on the percent solvent (by weight) for both coatings and inks during the test from plant personnel.
The results of the tests are presented in Data Sheets Nos. 1 through 5, 3-MD, Appendix E, and summa.ry Table 46, this section.
All sample sets taken were in duplicate. Two samples, Nos. 5 and 6, were taken of one-color lithography with no application of varnish, and two samples, Nos. 9 and 10, were taken of two-color lithography with no application of varnish. Generally, the level of organic emission determined by analysis (less than 1.0 lb carbon per hour) was within previously determined background emission levels from a heated oven (see 2-MD, section 7.2 1).
159

.
Four additional samples (Nos. 7 and 8; Nos. 11 and 12) taken of the emission from the same one-color and two-color lithography, respec- tively, with the application of a trailing varnish, produced a con- siderable rise in the output level of organic emission (e.g. 4.0 to 7.0 lb carbon per hour). It was again concluded that the organic emissions due to lithography (printing) in a metal decorating graphics operation,with no trailing varnish applicatioltwas insignificant when compared to the measured levels of emission after applying varnish, lacquer, or pigmented coatings. -.
In addition to duplicate samples of the sizing operation, samples Nos. 17 and 18, six different coating operations were used for evalu- ating levels of organic emission.. Table 47 shows dry film thickness or weight and percentage of solvent for the various coatings used. The emission from these coatings tend to fall within certain ranges for uncontrolled plants as shown in Table 60, Section 7.4.
TABLE 47 Various Coating Variables
Cylinder No. Type of Coatinq
Film Thickness Solvent
b-w/4 w in9 (%9
1 and 2 Gold lacquer 5.5 85.23 13 and 14 Modified phenolic varnish 8.5 70.93 19 and 20 C tear lacquer 16.0 84.64 21 and 22 Plasticized white 37.5 60.62
3 and 4 Vinyl white 41.5 62.66 15 and 16 Enamel buff 47.0 67.54
A comparison between observed (Eobs) and calculated (Ecalc) emission rates is presented in the summary Table 46, this section. Plant data are shown on Data Sheet 3-ECD-C, 3-MD, Appendix E.
7.23 Field Observations
As was the case with the web offset field testing, certain field observa- tions were made by testing personnel during the sampling of the various meta 1 decora ting operations. Little, if any visible emission was de- tected for the lithographic operation, and also when varnish was applied to the printed sheet by means of a trailing coater. However, an odor was detected with the application of varnish, but little, if any, odor was detected from the printing (lithographic) step. Generally, visible emission could be detected for most coatings evaluated, although rarely would the emission level observed be classified as a violation of a visible emission standard.
160
It seemed that a smoky condition resulted when an oven of rather old vintage was being employed by the plant. One would suspect that an oven not periodically subjected to tests for oven flame com- bustion efficiency, could have a condition of incomplete or inefficient oven flame combustion occurring with a resultant higher level of emitted pollution and visible emission. This fact was substantiated by field observations (see Section 7.5, D) when the age and main- tenance record of the oven was available to GATF sampling personnel. On at least two occasions, a comparison was made of the visible emission from identically processed metal sheets in different ovens at different plant locations. It was noted that the plant which em- ployed a regularly scheduled maintenance program was able to contain the level of visible emission within acceptable standards, whereas the plant utilizing an older, unmaintained oven had a higher level of visible emission. This observation led to a tentative conclusion that a properly balanced and maintained oven can yield a lower level of visible emission.
Odor evaluations of the various coatings employed in the metal decor- ating process proved a difficult area to assess. Due to prolonged periods of exposure at or near the exit vicinity of stack emission, the ability of sampling personnel to effectively distinguish various odors and levels of concentrations for the various odors was found to be vir- tually impossible. As was expected, there were distinct odors present when a heavy coverage milligramweight coating with a high percentage of solvent was being run throughan oven. As intheweboffset studies, if it is found desirable to rate various coatings for odor potential, stan- dard methods of odor evaluation should be initiated and employed (e.g. panel of individuals can be formed to evaluate the various odors).
Several of the more pertinent observations made by the testing crew have been recorded on data sheets found in Appendix D, and listed in Section 7.4 and 7.5, along with pertinent conclusions and recommendations based upon available test data. Again, it is hoped that these observations will impar,t some additional insight which does not appear in the other sections of this report.
7.3 Experimental Results - Controlled Plants
7.31 Plant Test No. 4-MD (Appendix E)
Field studies were conducted at a metal decorating plant that con- trolled its organic emission by using thermal incineration. Testing followed the “controlled source” sampling program outlined in Table 15, Appendix C,and included~ two different process coating lines.
i61

Twenty-six samples were collected at various incineration tempera- tures. All data collected were coded No. 4-MD, and the sampling and plant evaluation results are presented in Data Sheets Nos. 1 through 5, 4-MD, Appendix E , and summary Table 48, this section.
Cylinders Nos. 1 through 12 were samples of emission resulting from , the vinyl phenolic lacquer coating operation. The results of the dupli- -- cate samples, Nos. 1 and 2, and Nos. 9 and 10, represented the emission level of the coating process prior to thermal incineration, and an average value of organic emission for-these four samples were utilized in calculations later described in this section: Samples Nos. 3 through 8 and Samples Nos. 11 and 12, represent emission levels at the outlet of the control equipment over a range of incinera- tion temperatures (900°F, lOOO”F, 1200°F and 14OO’F) set by plant personnel using an indicating temperature controller having a thermo- couple inserted into the upper quadrant of the control unit chamber. Concurrent determinations for nitrogen oxides (NO,) were attempted, however, the thickness of the i.ncinerator wall (in excess of 8 inches) prevented the full insertion of the 6-inch detector tube previously used in this type of field evaluation and samples could not be taken.
Table 49 lists incinerator inlet. and outlet organic emission levels and CO2 incinerator outlet emi.ssion levels along with corresponding organics conversion efficiencies and temperatures of incineration. Figure 30, shows the change of organic and CO2 emission levels at the incinerator outlet w’th changes in incinerator temperatures for the vinyl phenolic lacquer coating operation. An increase in incineration temperature is accompanied by a marked decrease in organic emission levels with a correspondinq increase in the level of CO2 e-mission. The organics conversion efficiency reached the 95 percent level at an operational incineration temperature range of 1100 to li!Oo°F.
The overall combustion efficiency of the incinerator (indicated by the amount of CO present in the incinerator outlet exhaust) also increases with increased inc:inera tion temperatures (see summary Table 48, this section). The average percentage of the CO outlet value to the average inlet organic loading value, expressed as ppm cop at 900°F was 25 percent: at 1000°F, 20 percent: and at 1200°F, I. 5 percent. No outlet CO was detected at 14OOOF. It should be noted that an incinerator operating inefficiently because of faulty maintenance or improper temperature settings can exhaust partially oxidized air pollutants (e.g. CO, NO,).
162
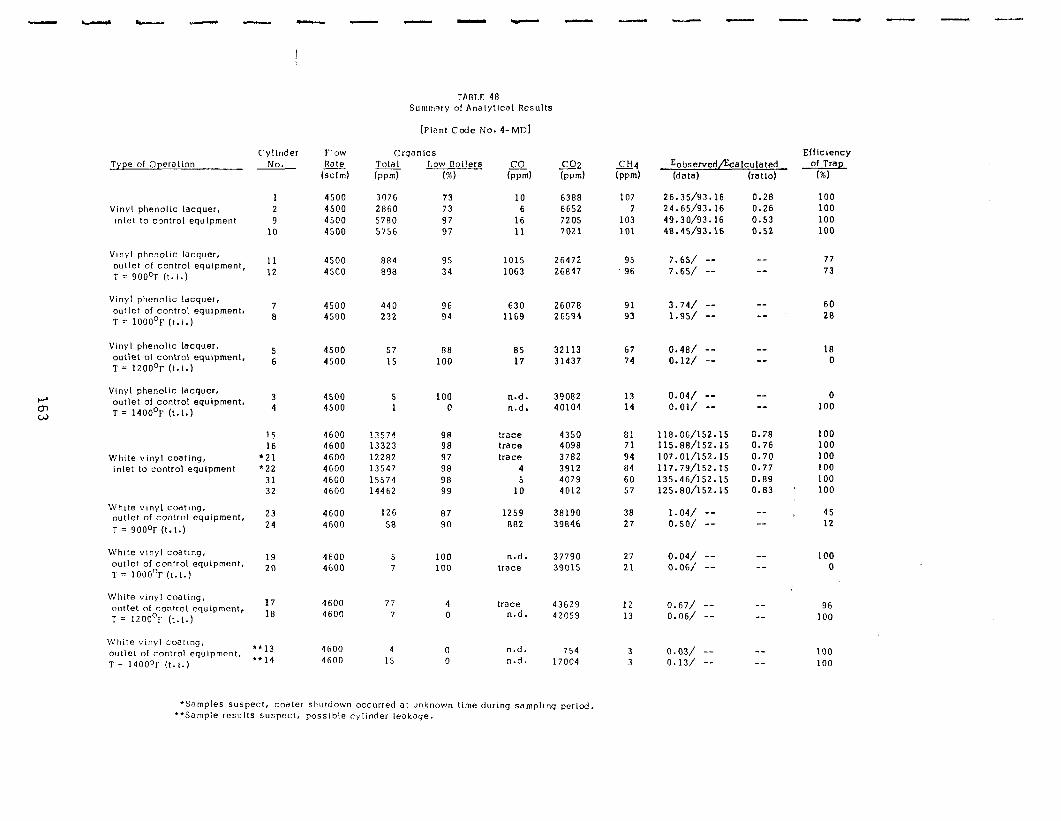
Type of Operation
Vinyl phenolic lacquer, inlet to control equipment
Vinyl phenoltc lacquer, outlet of control equipment, T = 900°F (t. i.)
Vinyl phenolic lacquer, outlet of control equipment, T = 1OOO’F (t.i.)
Vlnyl phenolic lacquer, outlet of control equipment, T = 1200°F (t.1.)
Vinyl phenolic lacquer, outlet of control equlpment, T = 1400°F (t.1.)
White vinyl coating, Inlet to control equipment
White vinyl coating, outlet of control equipment, T = 900°F (t. I.)
White vinyl coating, outlet of control equipment, T = 1000°F (t.l.)
White vinyl coating, outlet of control equipment, T = 1200°f (t.1.)
While vinyl coating, outlet of control equipment, T = 1400°F (t.i.)
Cylinder No.
FIOW Rate
(scfm)
4500 4500 4500 4500
Orqanlcs m (mm) 3076 2860 57RO 5756
Low Boilers (%)
73 73 97 97
co co2 (pm) (pm)
10 6388 6 6652
16 7205 11 7021
CH4 km)
107 7
103 101
Eobserved/%alculated (data) (ratio)
0.28 0.26 0.53 0.52
Efficiency of Trap
(“ml
1 2 9
10
26.35/93.16 24.65/93.16 49.30/93.16 48.45/93.16
100 100 100 100
11 4500 8f34 95 1015 26472 95 7.65/ -- -- 77 12 4500 848 34 1063 26847 96 7.65/ -- -- 73
7 4500 440 96 630 26078 91 3.74/ -- -- 60 8 4500 232 94 1169 26594 93 1.95/ -- -a 28
5 6
4500 4500
57 15
85 32113 67 0.48/ -- -- 18 17 31437 74 0.12/ -- -- 0
3 4
4500 4500
5 1
88 100
100 0
99 98 97 98 98 99
87 90
100 100
4 0
0 0
n.d. 39082 13 0.04/ -- -- 0 n.d. 40104 14 O.Ol/ -- -- 100
15 4600 13574 16 4600 13323
+21 4600 12282 l 22 4600 13547
31 4600 15574 32 4600 14462
trace 4350 s: ::8.06,‘:52.:5 0.78 iO0 trace 4098 71 115.88/152.15 0.76 100 trace 3782 94 107.01/152.15 0.70 100
4 3912 84 117.79/152.15 0.77 100 5 4079 60 135.46/152.15 0.89 100
10 4012 57 125.130/152.1S 0.83 * 100
23 4600 126 24 4600 5R
1259 38190 38 1.04/ -- 882 39846 27 0.50/ --
-- --
-- --
-- --
-- --
45 12
19 20
17 1R
l *13 “14
4600 4600
n.d. 37790 27 0.04/ -- trace 39015 21 0.06/ --
100 0
4600 4600
trace 43629 n.d. 42059
0.67/ -- 0.06/ --
96 100
4600 4600
5 7
77 7
4 1s
n.d. 754 n.d. 17004
12 13
3 3
0.03/ -- 0.13/ --
100 100
TABLIY 48 Summ,ary of Analytical Results
(Plant Code No. 4-MD]
*Samples suspect, coater 51,utdown occurred at unknown time during sampling period. **Sample results suspect, possible cylinder leakage.
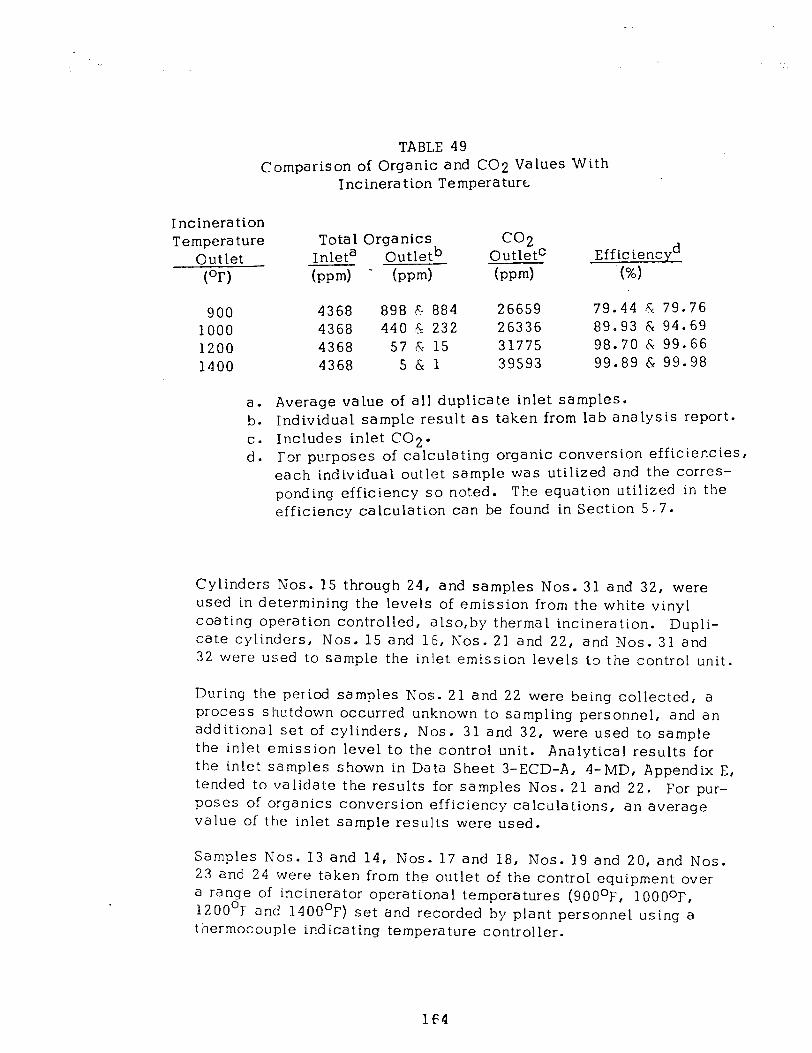
TABL,E 49 Comparison of Organic and CO2 Values With
Incineration Temperature
Tncinera tion Temperature Total Organics
Outlet Inleta Outletb (OF’) - (ppm) * (ppm)-
900 4368 898 h 884 1000 4368 440 S 232 1200 4368 57 cc- 15 1400 4368 5&l
CC2 OutletC Eff ic iencyd bw-4 (%I
26659 79.44 4: 79.76 26336 89.93 & 94.69
& 99.66 & 99.98
31775 98.70 39593 99.89
lica te inlet samples. as taken from lab ana
a. Average value of all dup b. Individual sample result c. Includes inlet CO2.
lysis report.
d. ror purposes of calculating organic conversion efficiencies, each individual outlet sample was utilized and the corres- ponding efficiency so noted. The equation utilized in the efficiency calculation can be found in Section 5.7.
Cylinders Nos. 15 through 24, and samples Nos. 31 and 32, were used in determining the levels of emission from the white vinyl coating operation controlled, also,by thermal incineration. Dupli- cate cylinders, Nos. 15 and 16, Nos. 21 and 22, and Nos. 31 and 32 were used to sample the inlet emission levels to the control unit.
During the period samples Nos. 21 and 22 were being collected, a process shutdown occurred unknown to sampling personnel, and an additional set of cylinders, Nos. 31 and 32, were used to sample the inlet emission level to the control unit. Analytical results for the inlet samples shown in Data Sheet 3-ECD-A, 4-MD, Appendix E, tended to validate the results for samples Nos. 21 and 22. For pur- poses of organics conversion efficiency calculations, an average value of the inlet sample results were used.
Samples Nos. 13 and 14, Nos. 17 and 18, Nos. 19 and 20, and Nos. 23 and 24 were taken from the outlet of the control equipment over a range of incinerator operational temperatures (900°F, 1000°F, 12OO’I and 14OO’F) set and recorded by plant personnel using a thermocouple ind ica ting temperature controller.
164
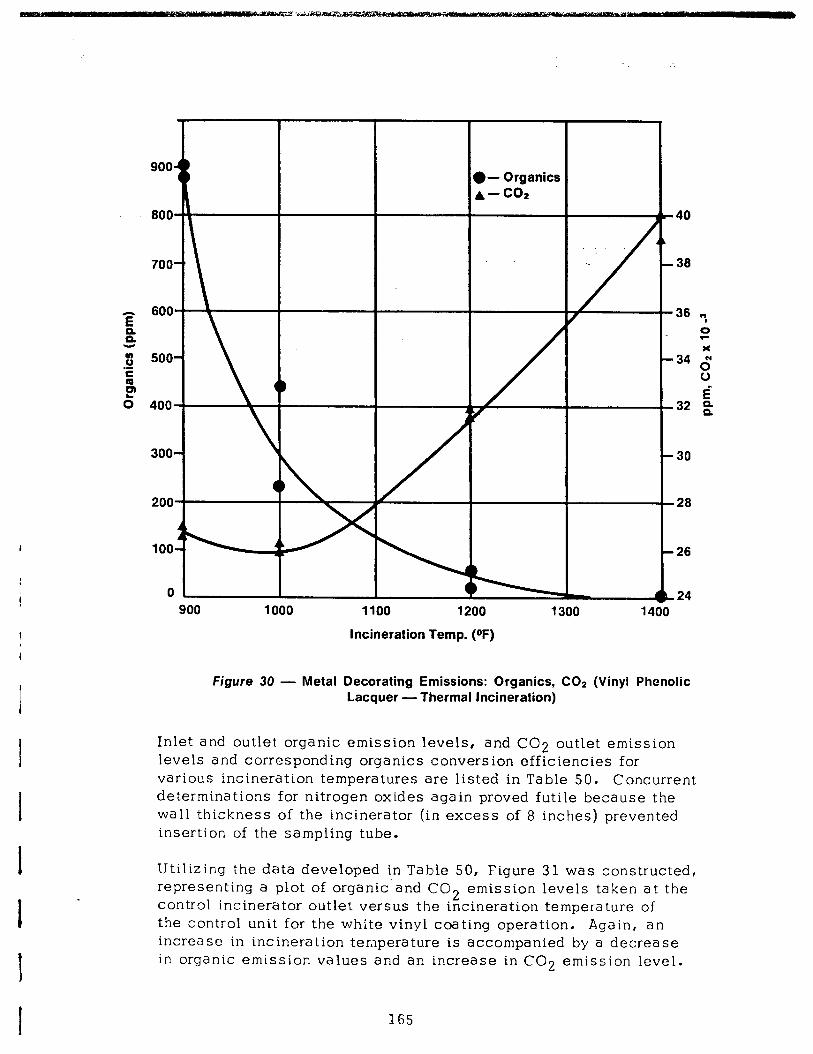
i
-40
-36
-30
-26
-26
-24 1100 1200
Incineration Temp. (OF)
1300 1400
Figure 30 - Metal Decorating Emissions: Organics, CO2 (Vinyl Phcnolic Lacquer - Thermal Incineration)
Inlet and outlet organic emission levels, and CO2 outlet emission levels and corresponding organics conversion efficiencies for various incineration temperatures are listed in Table 50. Concurrent determinations for nitrogen oxides again proved futile because the wall thickness of the incinerator (i.n excess of 8 inches) prevented insertion of the sampling tube.
Utilizing the data developed in Table 50, Figure 31 was constructed, representing a plot of organic’and CO2 emission levels taken at the control incinerator outlet versus the incineration temperature of the control unit for the white vinyl coating operation. Again, an increase in incineration temperature is accompanied by a decrease in organic emission values and an increase in CO2 emission level.
165
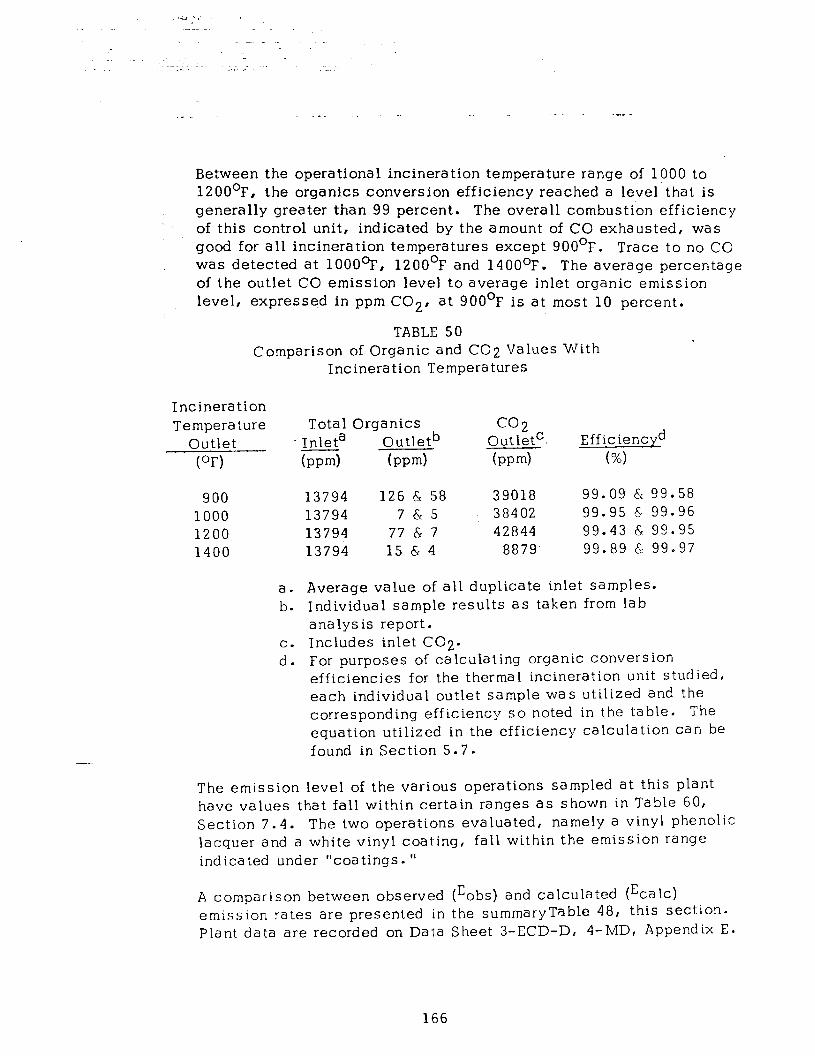
. - - . . . .1. _
Between the operational incineration temperature range of 1000 to 1200°F, the organics conversion efficiency reached a level that is generally greater than 99 percent. The overall combustion efficiency of this control unit, indicated by the amount of CO exhausted, was good for all incineration temperatures except 900°F. Trace to no CC was detected at 1000°F, 1200°F and 14OOOF. The average percentage of the outlet CO emission level to average inlet organic emission level, expressed in ppm CO 2, at 900°F is at most 10 percent.
TABLE 50 Comparison of Organic and CO2 Values With
Incineration Temperatures
Incineration Temperature
Outlet (OF)
Total Organics Inleta Outletb bpm) bpm)
CC2 Outletc. bv-4
Eff ic iencyd (%I
900 13794 126 6 tj8 39018 99.09 6: 99.58 1000 13794 7 & 15 38402 99.95 & 99.96 1200 13794 77 d ‘7 42844 99.43 & 99.95 1400 13794 15 G 4 8879 99.89 & 99.97
a. Average value of all duplicate inlet samples. b. Individual sample results as taken from lab
analysis report. c. Includes inlet C02. d. For purposes of calculating organic conversion
efficiencies for the thermal incineration unit studied, each individual outlet sample was utilized and the corresponding efficiency so noted in the table. The equation utilized in the efficiency calculation can be found in Section 5.7.
The emission level of the various operations sampled at this plant have values that fall within certain ranges as shown in Table 60, Section 7.4. The two operations evaluated, namely a vinyl phenolic lacquer and a white vinyl coating, fall within the emission range indicated under “coatings . ”
A comparison between observed (Eobs) and calculated (Ecalc) emission rates are presented in the summaryTable 48, this section. Plant data are recorded on Data Sheet 3-ECD-D, 4-MD, Appendix E.
166
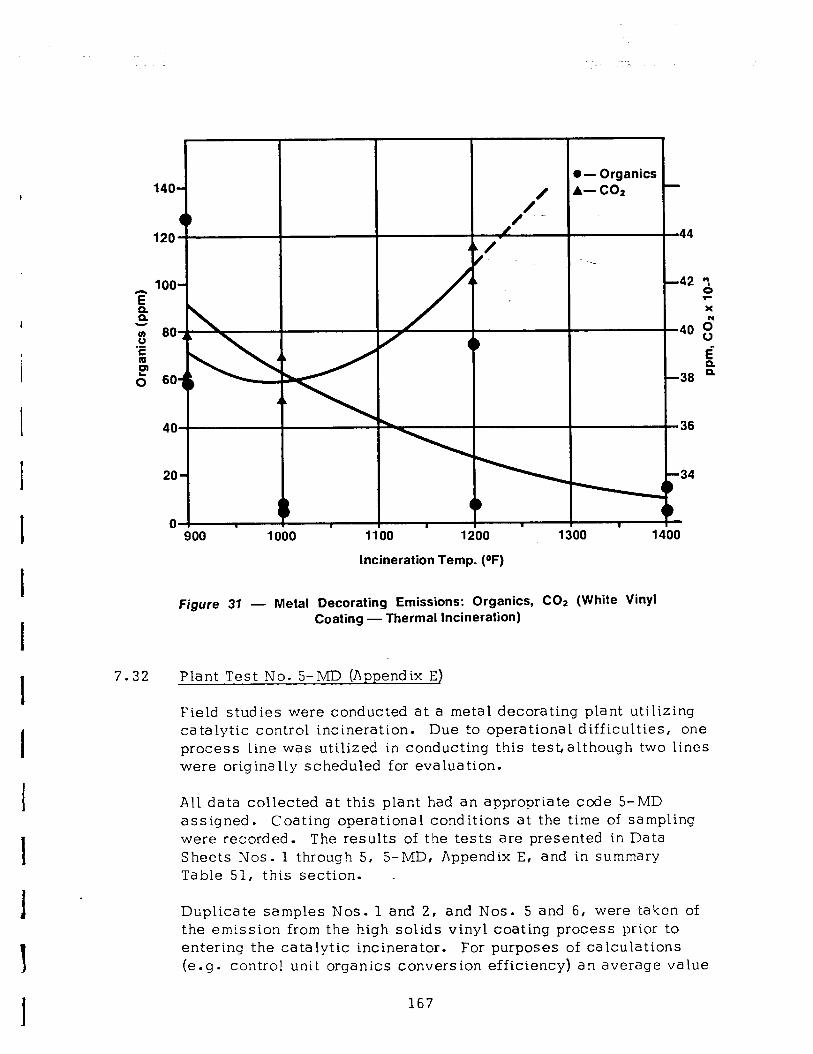
1100 1200
Incineration Temp. (OF)
m-1
-1
--4
Figure 37 - Metal Decorating Emissions: Organics, COz (White Vinyl Coating - Thermal Incineration)
7.32 Plant Test No. S-MD (Appendix E)
Field studies were conducted at a metal decorating plant utilizing catalytic control incineration. Due to operational difficulties, one process line was utilized in conducting this testalthough two lines were originally scheduled for evaluation.
All data collected at this plant had an appropriate code S-MD assigned. Coating operational conditions at the time of sampling were recorded. The results of t!he tests are presented in Data Sheets Nos. 1 through 5, S-MD, Appendix E, and in summary Table 51, this section. .
Dtiplica te samples Nos. 1 and 2, and Nos. 5 and 6, were taken of the emission from the high solids vinyl coating process prior to entering the catalytic incinerator. For purposes of calculations (e-g- control unit organics conversion efficiency) an average value
167
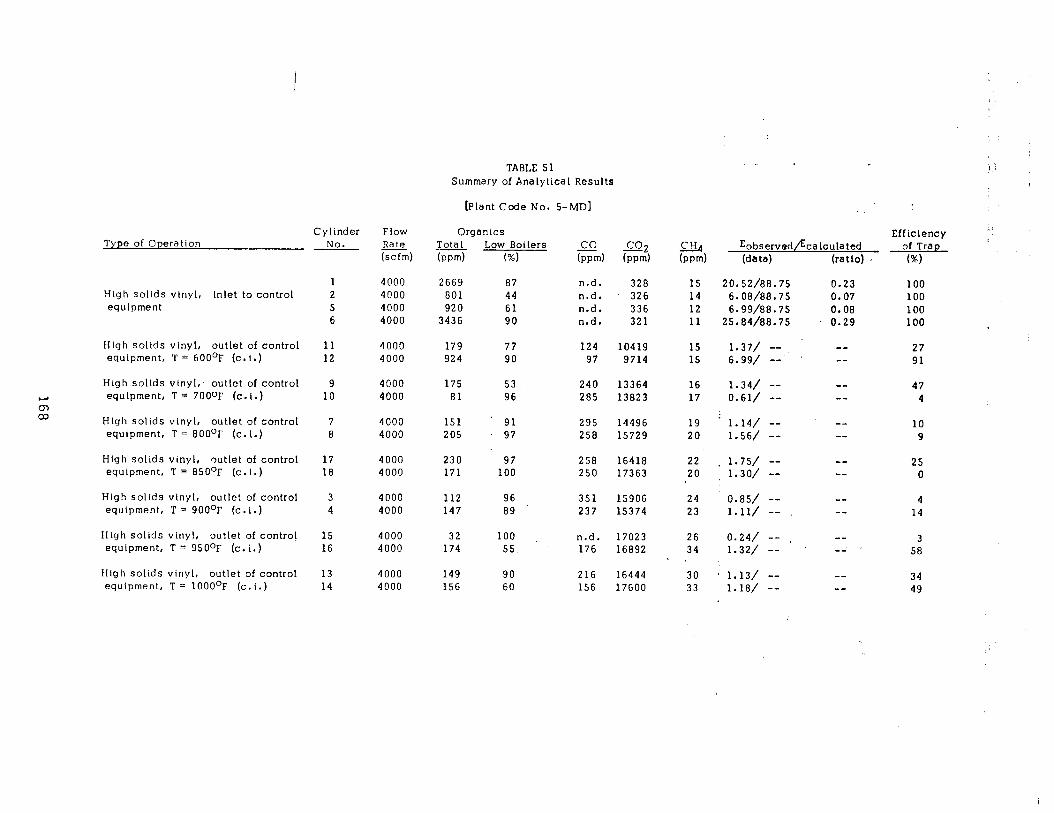
High solids vinyl, Inlet to control equipment
High solids vinyl, outlet of control equipment, T = 600°F (c. 1.)
11 12
High solids vinyl,’ outlet of control
s equipment, T = 700°F (c.i.)
W
9 10
High solids vinyl, outlet of control equrpment, T = 8OOoF (c.t.j
7 8
High solids vinyl, outlet of control equipment, T = 850°F (c.1.)
17 18
Hlgh solids vinyl, outlet of control equipment, T = 900°F (c.t.)
3 4
High solids vinyl, outlet of controt 15 equipment, T = 950°F (c.i.) 16
High solids vinyl, outlet of control equipment, T = 1000°F (c. i.)
13 14
Cylinder No.
Flow Rate (scfm)
4000 4000 4000 4000
4000 4000
4000 4000
4000 4000
4000 4000
4000 4000
4000 4000
4000 4000
TABLE 51 Summary of Analyticat Results
[Plant Code No. S-MD]
Organtcs Tota 1 Low Boilers bd (%I
2669 87 801 44 920 61
3436 90
179 77 924 90
175 53 81 96
151 91 205 97
230 97 171 100
112 96 147 89
32 100 _j 174 55
149 90 156 60
n.d. 328 n.d. 326 n.d. 336 n.d. 321
124 10419 97 9714
240 13364 285 13823
295 14496 258 15729
258 16418 250 17363
351 15906 237 15374
n.d. 17023 176 16892
216 16444 156 17600
CL4 Eobserved/E calculated Efficiency ;’
of Trap bwd (data) (ratlo) . (a)
15 20.52/88.75 0.23 14 6.08/88.75 0.07 12 6.99/88.75 0.08 11 25.04/88.75 . 0.29
.. 15 1.37/ -- 15 6.99/ --
16 1.34/ -- 17 0.61/ --
19 ) 1.14/ -- 20 1.561 --
-- --
-- --
-- --
100 100 100 100
27 91
47 4
10 9
22 1.75/ -- -- , 25 20 1.30/ -- -- 0 (
24 0.85/ -- -- 4 23 l.ll/ -- -- 14
26 0.24/ -- -- , 3 34 1.32/ -- -- 58
30 ’ 1.13/ -- -- 34 33 1.18/ -- -- 49
I
I I
I I I 1 1
for these four samples was utilized although results of duplicate sets of inlet samples indicated a considerable spread of organic emission values (e.g. 801 to 3436 ppm). The values for the non- condensibles (i.e. range of methane emission level - 11 to 15 ppm; range of CO2 emission level - 321 to 336 ppm) for these samples tended to validate the fact that they were duplicate samples.
Samples Nos. 3 and 4, and 7 through 18, were taken consecutively at the outlet of the control equipment over a wide range of incinera- tor operational temperatures (600°F, 700°F, SOOOF, 900°F, 95O’F) monitored and controlled by plant ,personnel using an indicating temperature controller with a thermocouple inserted into the duct immediately after the catalyst bed. The calculated efficiencies tended to fall within a range of 89 to 95 percent. Prior studies by various control agencies have shown similar conversion efficiencies to range from 80 to 95 percent for this type of catalytic control equipment.
Shown in Table 52 are the organics and CO2 emission values and control unit organics conversion efficiencies for various incinera- tion temperatures . Utilizing the data for the high solids vinyl coat- ing operation rn Table 52, Figure 32 was constructed, representing the change of organic and CO2 emission values (taken at incinerator outlet) with change in incineration temperatures of the control unit. An increase in incineration temperature is accompanied by a decrease in organic emission values with a corresponding increase in the emission level of CO2.
At around a 154 ppm outlet emission level, there is a corresponding organics conversion incineration efficiency of 92 percent between 900 to 1OOOoF for this particular control unit. The CO output from the control unit, an indication of the overall control unit’s combustion efficiency, remained fairly constant over the range of incinerator temperatures, and averaged about 15 percent of the inlet organics loading expressed as ppm C02. The average exhaust CO values for the control unit were lower for the 600°F, 950°F and 1000°F incinera- tion temperatures.
Concurrent with each sampling, readings for nitrogen oxides (NO,) were made using a Universal Testing Kit with negative results. Previous samples taken from web offset thermal incinerators (see Sections 6.32 and 6.33) operating at temperatures from 1000 to 1400°F, indicated the presence of NO,, and from web offset catalytic incinerators (see Sections 6.34 and 6.35) operating at temperatures from 625 to 950°F indicated no presence of NOx.
3 1 169
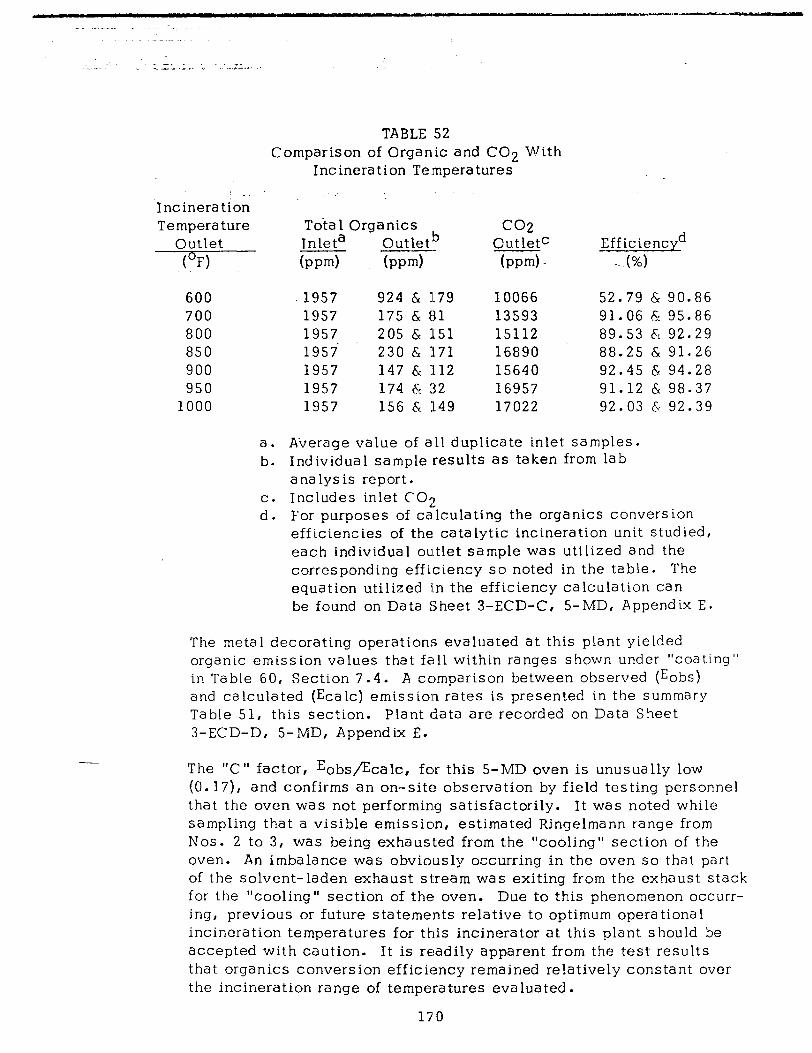
TABLE 52 Comparison of Organic and CO2 With
Incineration Te:mperatures .
Incineration Temperature Tota 1 Orga nits
Outlet Inleta Outlet’b (OF) (pm-4 (ppm)
CO2 Outletc
km-d Efficiencyd
-- (%)
600 '1957 924 & 1179 10066 52.79 & 90.86 700 1957 175 & 81 13593 91.06 6 95.86 800 1957 205 6 151 15112 89.53 6: 92.29 850 1957 230 6 1171 16890 88.25 & 91.26 900 1957 147 & 1112 15640 92.45 6 94.28 950 1957 174 F: 32 16957 91.12 Ey 98.37
1000 1957 156 & I49 17022 92.03 & 92.39
a. Average value of all duplicate inlet samples. b. Individual sample results as taken from lab
analysis report. c. Includes inlet CO2 d. For purposes of calculating the organics conversion
efficiencies of the catalytic incineration unit studied, each individual outlet sample was utilized and the corresponding efficiency so noted in the table. The equation utilized in the efficiency calculation can be found on Data Sheet 3-ECD-C, 5-MD, Appendix E.
The metal decorating operations evaluated at this plant yielded organic emission values that fall within ranges shown under “coating” in Table 60, Section 7.4. A comparison between observed (Eobs) and calculated (Ecalc) emission rates is presented in the summary Table 51, this section. Plant data are recorded on Data Sheet 3-ECD-D, 5-MD, Appendix E.
- The “C” factor, Eobs,&alc, for this 5-MD oven is unusually low (0. I7), and confirms an on-site observation by field testing personnel that the oven was not perf0rmin.g satisfactorily. It was noted while sampling that a visible emission, estimated Ringelmann range from Nos. 2 to 3, was being exhausted from the “cooling” section of the oven. An imbalance was obviously occurring in the oven so that part of the solvent-laden exhaust stream was exiting from the exhaust stack for the “cooling” section of the oven. Due to this phenomenon occurr- ing, previous or future statements relative to optimum operational incineration temperatures for this incinerator at this plant should be accepted with caution. It is readily apparent from the test results that organics conversion efficiency remained relatively constant over the incineration range of temperatures evaluated.
170
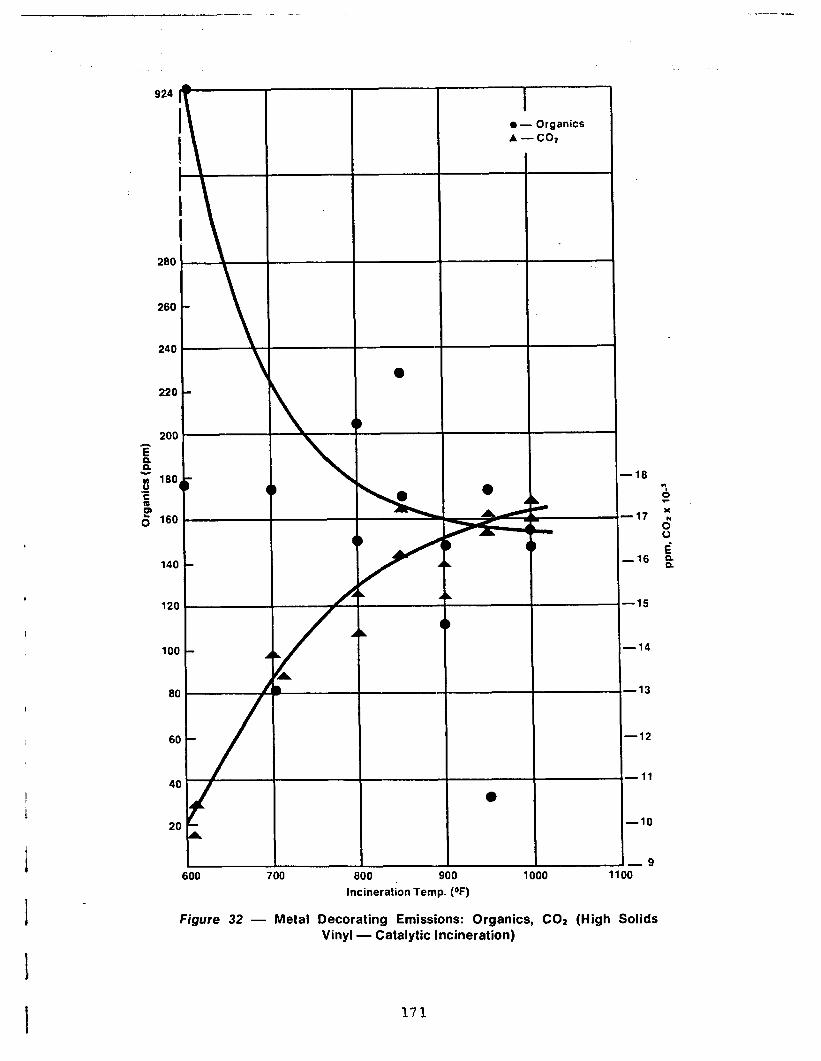
220
200
,-
E 5t 'i 180
5
$ 160
120
100 I--
80
60
l -Organics A-CO,
-18 ? 0 r
-17 :
8
i -16 g
600 700 800 900
lncinerat&nTemp.(°F)
1000 1100
-15
-14
-13
-12
-11
-10
- 9
Figure 32 - Metal Decorating Emissions: Organics, CO2 (High Solids Vinyl - Catalytic Incineration)
171
. .
CMUPML analytical results indicated that the cold trap on the samp- ling unit may not have been functioning properly because of the amount of low-boiling material detected in the cylinders. The type of material under evaluation, namely a high solids vinyl, could have been responsible for these high cylinder organics values. Since all traps were cooled according to standard GATF methods and this phe- nomenon had not occurred on previous sampling trips, there was no reason to suspect the efficiency of the trap in sampling metal decor- ating operations.
7.33 Field Observations
In field evaluations of thermal and catalytic incinerators utilized on metal decorating processes, both types of control units controlled smoke and odor emission equally well. At operational temperatures of 750-800°F for catalysis, and llOO-12000F for thermal type units, no visible emission could be detected.
Odor, on the other hand, was not as easily identifiable, although determinations were conducted at various incineration temperature settings. Generally, it appeared that at lower incineration tempera- tures than those stated above, odor was prevalent to some degree. This would suggest that there is a level to which incineration temp- eratures can be reduced and still effectively eliminate odorous emissions. Local regulatory agencies should thoroughly evaluate odor emission levels at various incineration temperatures before recommending or imposing high temperatures of incineration to eliminate odor.
While the ability to achieve a h.igh degree of organics conversion efficiency with both catalytic and thermal incineration units is certainly feasible, the possibility of introducing additional con- taminants generated as a result of achieving the high degree of organics cleanup cannot be minimized. An attempt has been made throughout this report to recommend for consideration realistic opera tiona 1 standards when using emission control equipment.
7.4 Summary Tables
Summary tables for all metal decorating plants utilized in this Phase II study excluding plants MD-P-l and MD-l, which were primarily used to evaluate, improve and further develop GATF’s method of sampling and analysis, are presented in this section. These summary tables include ranges of analytical results, organics conversion efficiencies of air pollution equipment,
-
and operational characteristics of decorating graphic processes.
172
the various types of meta 1
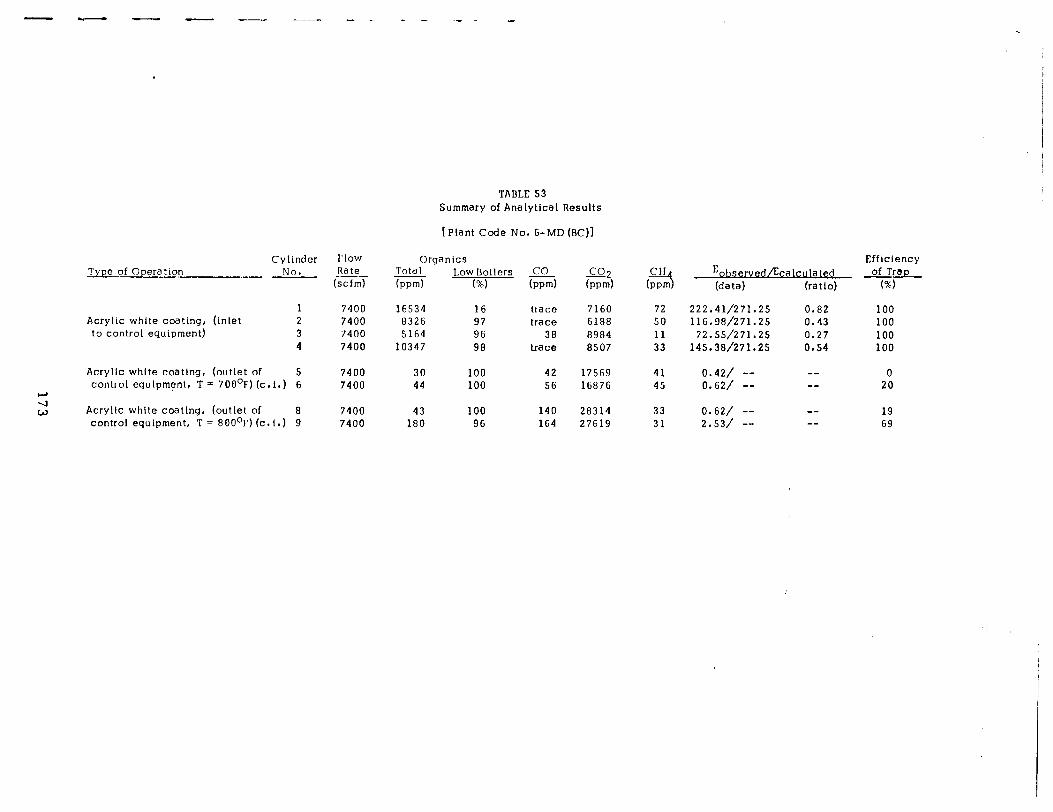
Type of Operation Cylinder
No.
Acrylic white coating, (inlet to control equipment)
Acrylic white coating, (outlet of 5 control equipment, T = 708’F) (c.1.) 6
z 0 Acryltc white coating, (outlet of 8
control equipment, T = 800°F) (c. t.) 9
Flow Rate
(scfm)
7400 7400 7400 7400
7400 30 100 42 17569 41 0.42/ -- -- 0 7400 44 100 56 16876 45 0.62/ -- -- 20
7400 43 100 140 28314 33 0.62/ -- -- 19 7400 180 96 164 27619 31 2.53/ -- -- 69
TABLE 53 Summary of Analytical Results
[Plant Code NO. &MD (BC)]
Organics Total Low Boilers - co bpm) (%I (wd
16534 16 trace 8326 97 trace 5164 96 38
10347 98 trace
co2 (pm1
7160 6188 8984 8507
72 50 11 33
Eob e ved/EcaIculated (da:a; (ratlo)
222.41/271.25 0.82 116.98/271.25 0.43
72.55/271.25 0.27 145.38/271.25 0.54
Efficiency of Trap
(%I
100 100 100 100
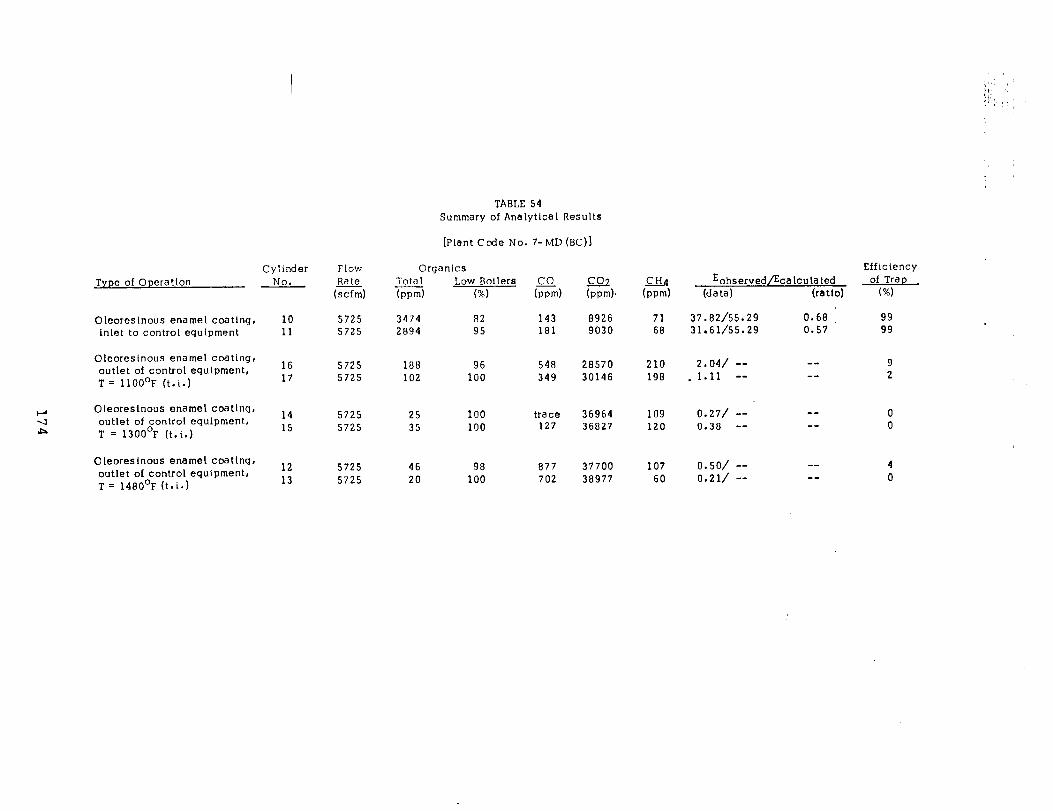
Cylinder Type of Operation No.
Oleoreslnous enamel coating, 10 Inlet to control equipment 11
Oleoresinous enamel coating, outlet of control equipment,
16
T = llOO°F (t.i.) 17
2 Oleoresinous enamel coating, outlet of control equipment,
14
hb T = i300°F it.i.j 15
Oleorestnous enamel coating, outlet of control equipment,
12
T = 1480’F (t-i.) 13
Flow Organics Rate Total Low Boilers
(scfm) (wd (%I
5725 3474 82 5725 2894 95
co bpm) 143 181
a2 (wd
8926 9030
CH4 Eobserved/Eca hula ted bd (data) (ratlo)
Efficiency of TraD
(%I
71 37.82/55.29 0.68 99 68 31.61/55.29 0.57 99
5725 188 96 548 28570 210 2.04/ -- -^ 9 5725 102 100 349 30146 198 . 1.11 -- me 2
5725 25 100 trace 36964 109 0.27/ -- -m 0
5725 35 100 127 36827 120 0.38 -- -- 0
5725 46 98 877 37700 107 0.50/ -- -- 4
5725 20 100 702 38977 60 0.21/ -- -- 0
TABLE 54 Summary of Analytlcal Results
[Plant Code No. 7-MD (BCjl
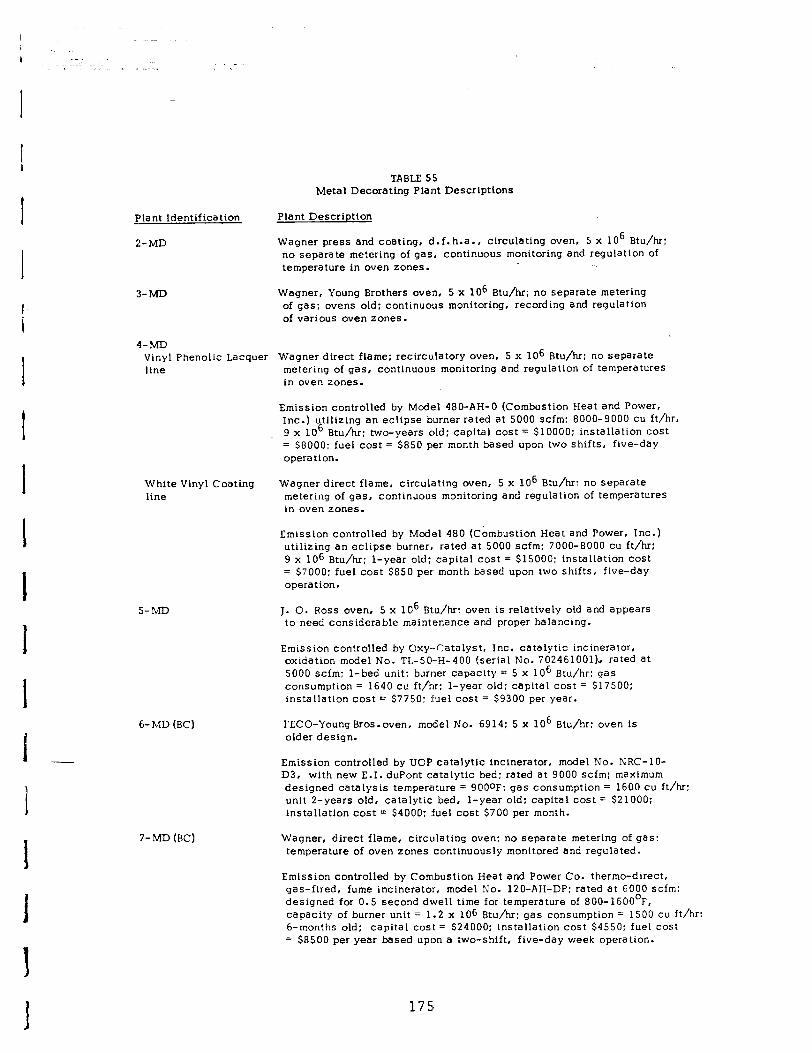
5-MD
6-MD (BCJ
7-MD (BC)
TABLE 55 Metal Decorating Plant Descriptions
_Plant Identification Plant Description
i!- MD Wagner press and coating, d.f.h.a., circulating oven, 5 x lo6 Btu/hr: no separate metering of gas, continuous monitoring and regulation of temperature ln oven zones.
3-MD Wagner, Young Brothers oven, 5 x lo6 Btu/hr; no separate metering of gas: ovens old: continuous monitoring, recording and regulation of various oven zones.
4-MD Vinyl Phenolic Lacquer Wagner direct flame: recirculatory oven, 5 x 10⁶ Btu/hr: no separate line metering of gas, continuous monitoring and regulation of temperatures
in oven zones.
Emission controlled by Model 480-AH-0 (Combustion Heat and Power, Inc.) utilizing an eclipse burner rated at 5000 scfm; 8000-9000 cu ft/hr. 9 x lo6 Btu/hr; two-years old: capital cost = $10000: installation cost = $8000: fuel cost = $850 per month based upon two shifts, five-day operation.
White Vinyl Coating Wagner direct flame, circulating oven, 5 x lo6 Btu/hr: no separate line metering of gas, continuous monitoring and regulation of temperatures
in oven zones.
Emission controlled by Model 480 (Combustion Heat and Power, Inc.) utilizing an eclipse burner, rated at 5000 scfm: 7000-8000 cu ft/hr: 9 x 10⁶ Btu/hr: l-year old; capital cost = $15000; installation cost = $7000: fuel cost $850 per month based upon two shifts, five-day operation.
J. 0. Ross oven, 5 x lo6 Bi.u/hr: oven is relatively old and appears to need considerable maintenance and proper balancing.
Emission controlled by Oxy-Catalyst, Inc. catalytic incinerator, oxidation model No. TL-50-H-400 (serial No. 702461001), rated at 5000 scfm: l-bed unit: burner capacity = 5 x lo6 Btu/hr: gas consumption = 1640 cu ft/hr: l-year old: capital cost = $17500: installation cost = $7750: fuel cost = $9300 per year.
FECO-Young Bros.oven, model No. 6914: 5 x lo6 Btu/hr: oven is older design.
Emission controlled by UOP catalytic incinerator, model No. NRC-lO- D3, with new E.I. duPont catalytic bed: rated at 9000 scfm; maximum designed catalysis temperature = 9000F; gas consumption = 1600 cu ft/hr: unit 2-years old, catalytic bed, l-year old: capital cost = $21000; installation cost = $4000; fuel cost $700 per month.
Wagner, direct flame, circulating oven: no separate metering of gas: temperature of oven zones continuously monitored and regulated.
Emission controlled by Combustion Heat and Power Co. thermo-direct, gas-fired, fume incinerator, model No. 120-AH-DP: rated at 6000 scfm: designed for 0.5 second dwell time for temperature of EOO-1600°F, capacity of burner unit = 1.2 x 10⁶ Btu/hr: gas consumption = 1500 cu ft/hr: 6-months old: capital cost = $24000; installation cost $4550: fuel cost = $8500 per year based upon a two-shift, five-day week operation.
175
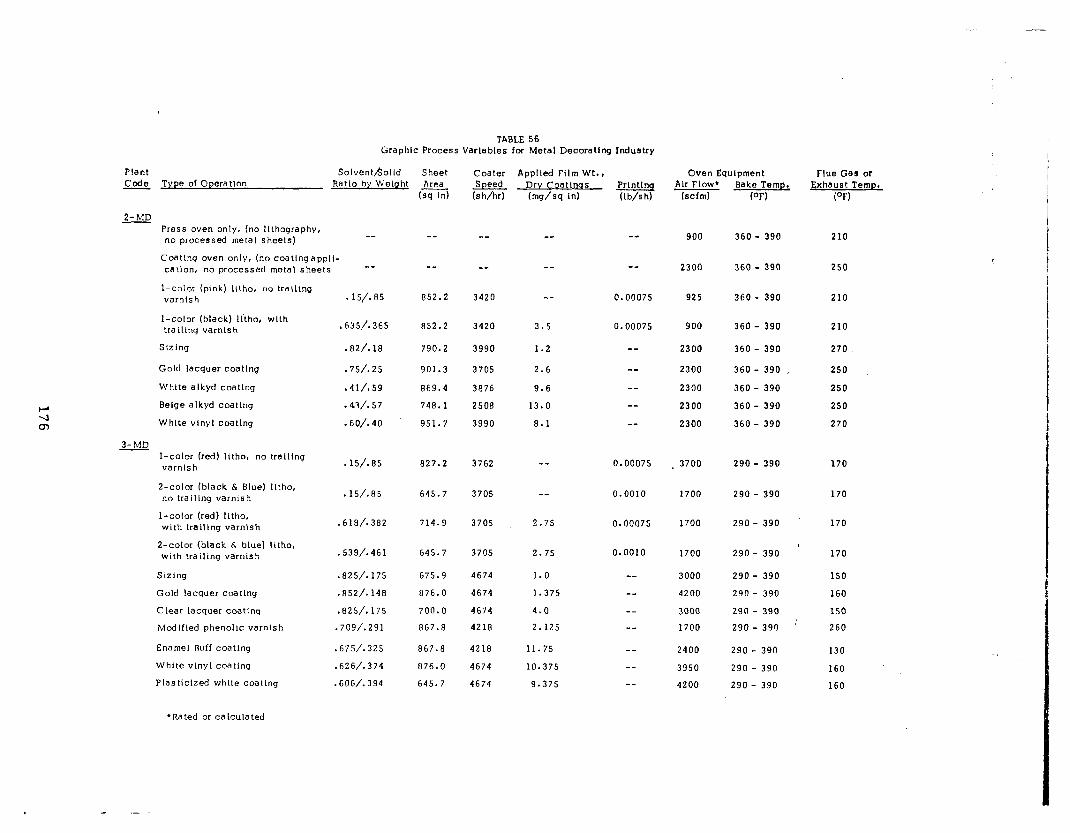
TABLE 56 Graphic Process Variables for Metal Decoratlng Industry
Plant Solvent/Solid Code Type of Operation Ratlo by Welght
2- Press oven only, (no lithography, no processed metal sheets)
--
Coating oven only, (no coatingappli- cation, no processed metal sheets --
l-color (pink) iitho, no trailing varnish . IS/.65
l-color (black) lttho, with trailing varnls h .635/.365
s 12 hg . f32/. 18
Gold lacquer coating . 75/.25
Whtte alkyd coating .41/.59
Beige alkyd coating .43/. 57
Whlte vinyl coating .60/.40
3-MD - l-color (red) litho, no tralltng
varnish .lS/.RS
Z-color (black & Blue) Iltho, no trailing varnish . 15/.85
I-color (red) litho, with trailing varnish .616/.362
Z-color (black & biue) Litho, with trailing varnish .539/.461
Sizing .825/. 175
Gold lacquer coating .852/. 148
Ctear lacquer coating .625/.175
Modified phenolic varnish .709/.291
Enamel Buff coating .675/.325
White vinyl coating .626/.374
Plasticized white coating .606/.394
l Rated or ca lcula ted
Sheet Coater Applted Film Wt., Area Drv Coattncts Speed
(sq in) (s h/W (mg/sq id
-- -- --
_- -_ --
652.2 3420 --
852.2 3420 3.5
790.2 3990 1.2
901.3 3705 2.6
869.4 3676 9.6
746.1 2508 13.0
951.7 3990 8.1
827.2 3762 --
645.7 3705 --
714.9 3705 2.75
645.7 3705 2.75
675.9 4674 1.0
676.0 4674 1.375
700.0 4674 4.0
667.6 4216 2.125
667.6 4218 11.75
676.0 4674 10.375
645.7 4674 9.37s
Prlntlnq Air Flow* Bake Temp. W&h) (scfm) (OF)
--
--
0.00075
0.00075
--
_-
--
--
--
0.00075
0.0010
0.00075
0.0010
--
--
--
--
--
--
--
900
2300
92.5
900
2300
2300
2300
2300
2300
360 - 390
360 - 390
360 - 390
360 - 390
360 - 390
360 - 390 ,
360 - 390
360 - 390
360 - 390
3700
1700
1700
1700
3000
4200
3000
1700
2400
3950
4200
290 - 390
290 - 390
290 - 390
290 - 390
290 - 390
290 - 390
290 - 390
290 - 390
290 - 390
290 - 390
290 - 390
Oven Equipment Flue Gas or Exhaust Temp.
ioF)
210
250
210
210
270
250
250
250
270
170
170
170
, 170
150
160
150
260
130
160
160
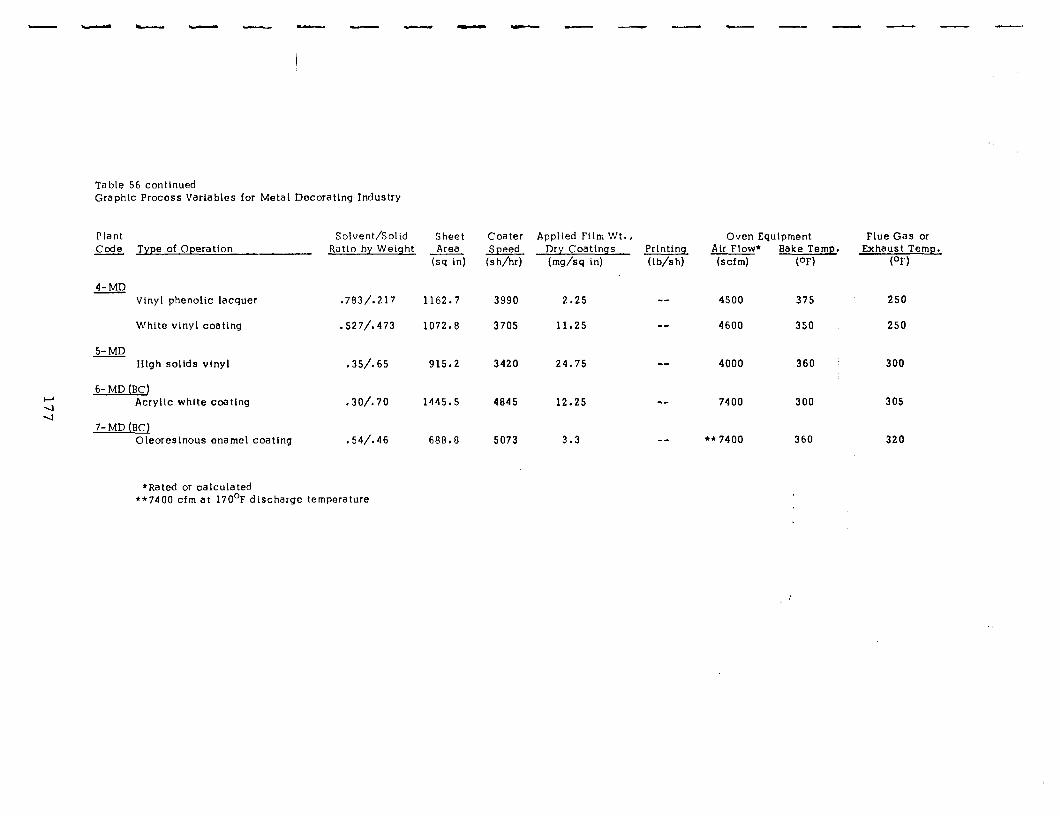
Table 56 conttnued Graphtc Process Variables for Metal Decoratlng Industry
Plant Code Type of Operation
Solvent/Soltd Sheet Coater Applied Film Wt., Oven Equlpment Flue Gas or Ratlo by Weight Area Speed Dry Coatlnss Prlnttnq Air Flow* Bake Temp. Exhaust Temp.
(sq InI (s h/l-d (mg/sq in) (lb/St-d (scfm) (OF) (OF)
4-MD Vinyl phenolic lacquer .783/.217
White vinyl coating .527/.473
5- MD Hlgh sollds vlnyl .35/.65
6- MD (BC)
2 Acrylic white coetlng .30/.70 4
7-MD (BC) Oleoreslnous enamel coating .54/.46
*Rated or calculated **7400 cfm at 170°F discharge temperature
1162.7 3990 2.25 --
1072.8 3705 11.25 w-
915.2
1445.5
688.8
3420 24.75 w.-
4845 12.25 --
5073 3.3 me
4500 375
4600 350
4000 360
7400 300
l * 7400 368
I
250
250
300
305
320
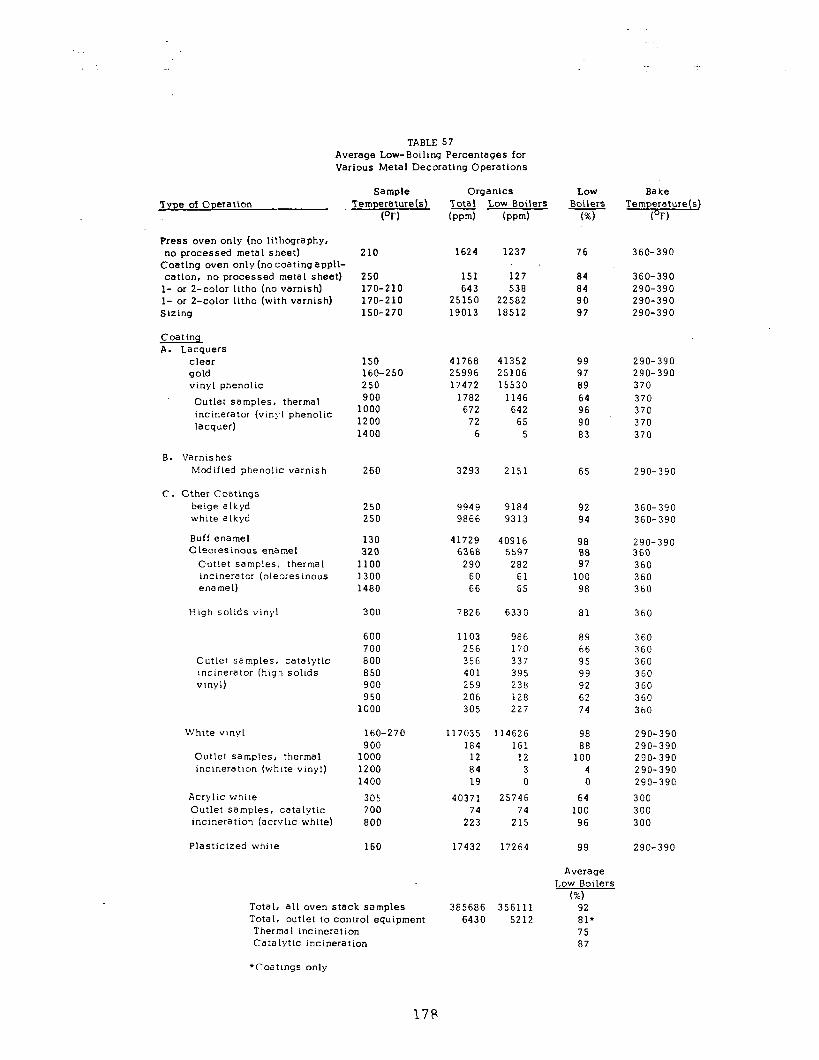
TABLE 57 Average Low-Boiling Percentages for Various Metal Decorating Operations
Type of Operatton
Press oven only (no lithography,
Sample Temperature(s)
(OF)
no processed metal sheet) Coating oven only (no coating appli- cation, no processed metal sheet)
l- or f-color litho (no varnish) l- or Z-color litho (with varnish) Sizing
Coating A. Lacquers
clear gold vinyl phenolic
Outlet samples, thermal incinerator (vtnyl phenolic lacquer)
B. Varnishes Modified phenollc varnish 260
C. Cther Coatings beige alkyd white alkyd
250 250
Buff enamel 130 0 Looresinous enamel 320
Outlet samples, thermal 1100 incinerator (oleoresinous 1300 enamel) 1480
Hugh solids vrnyl 300
Outlet samples, catalytic rncinerator (hlgn soltds vinyl)
White vinyl
Outlet samples, thermal incineratron (whrte vinyl)
Acrylic whrte Outlet samples, catalytic incineration (acrylic white)
160-270 900
1000 1200 1400
305 700 800
Plasticized white 160
210 1624 1237 76
151 127 84 643 538 84
25150 22582 90 19013 18512 97
360-390
250 170-210 170-210 150-270
360-390 290-390 290-390 290-390
150 41768 41352 99 290-390 160-250 25996 25106 97 290-390 250 17472 15530 89 370 900 1782 1146 64 370
1000 672 642 96 370 1200 72 65 90 370 1400 6 5 83 370
3293 2151 65 290-390
92 360-390 94 360-390
98 290-390 88 360 97 360
100 360 98 360
81 360
600 700 800 850 900 950
1000
9949 9184 9866 9313
41729 40916 6368 5597
290 282 60 61 66 65
7826 6330
1103 986 256 170 356 337 401 395 259 238 206 128 305 227
117035 114626 184 161
12 12 84 3 19 0
40371 25746 74 74
223 215
17432 17264
89 360 66 360 95 360 99 360 92 360 62 360 74 360
98 88
100 4 0
64 100
96
99
290-390 290-390 290-390 290-390 290-390
300 300 300
290-390
Average Low Boilers
(%) 92 81' 75 87
Total, all oven stack samples Total, outlet to control equipment Thermal incineration Catalytic incineration
Organics LOW Total Low Boilers Boilers (pm) bpm)
385686 356111 6430 5212
(%)
Bake Temp(er;)ture(s)
*Coatrngs only
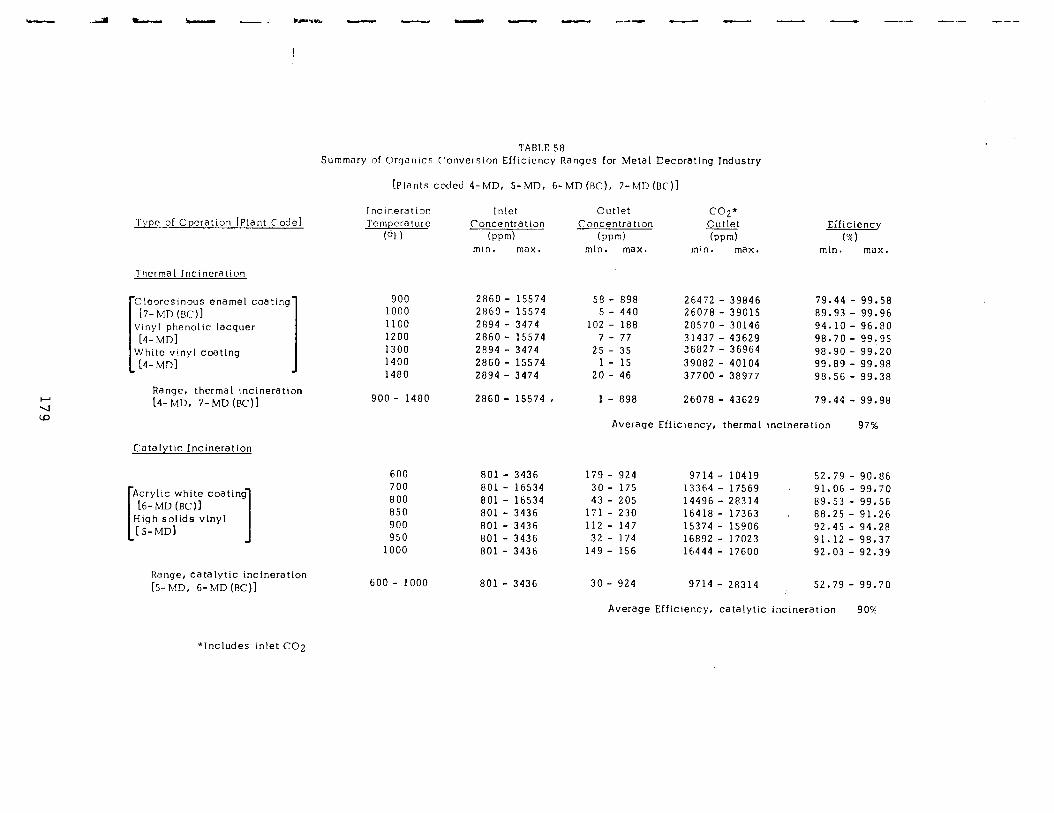
Type of Cperation [Plant Code]
TA 8T.E 5 A Summary of Crqanics C’onverston Efficiency Ranges for Metal Decorating Industry
[Plants coded 4-MD, S-MD, &MD (DC), 7-MD (DC)]
Thermal Incineration
Range, thermal incineration [4-MD. 7-MD (BC)]
Incineration Temperature
WI-)
900 1000 1100 1200 1300 1400 1480
900 - 1480
Inlet Concentration
(pm) mm. max.
2860 - 15574 58 - 898 26472 - 39846 79.44 - 99.58 2860 - 15574 5 - 440 26078 - 39015 89.93 - 99.96 2894 - 3474 102 - 1813 28570 - 30146 94.10 - 96.80 2860 - 15574 7 - 77 31437 - 43629 98.70 - 99.95 2894 - 3474 25 - 35 36827 - 36964 98.90 - 99.20 2860 - 15574 l- 15 39082 - 40104 99.89 - 99.98 2894 - 3474 20 - 46 37700 - 38977 98.56 - 99.38
2860 - 15574 , 1 - 898 26078 - 43629 79.44 - 99.98
Cutlet Concentration
(rwm) min. max.
cc2* Cutlet kwd
mtn. max.
Efficiency (X)
min. max.
Average Efficiency, thermal incineration 97%
Catalytic Incineration
Range, catalytic incineration [S-MD, 6-MD (BC)]
600 801 - 3436 179 - 924 9714 - 10419 52.79 - 90.86 700 801 - 16534 30- 175 13364 - 17569 ~ 91.06 - 99.70 800 801 - 16534 43 - 205 14496 - 28314 89.53 - 99.56 850 801 - 3436 171 - 230 16418 - 17363 88.25 - 91.26 900 801 - 3436 112 - 147 15374 - 15906 92.45 - 94.28 950 801 - 3436 32 - 174 16892 - 17023 91.12 - 98.37
1000 801 - 3436 149 - 156 16444 - 17600 92.03 - 92.39
600 - 1000 801 - 3436 30 - 924 9714 - 28314 52.79 - 99.70
Average Efficiency, catalytic incineration 90%
*Includes inlet CO2
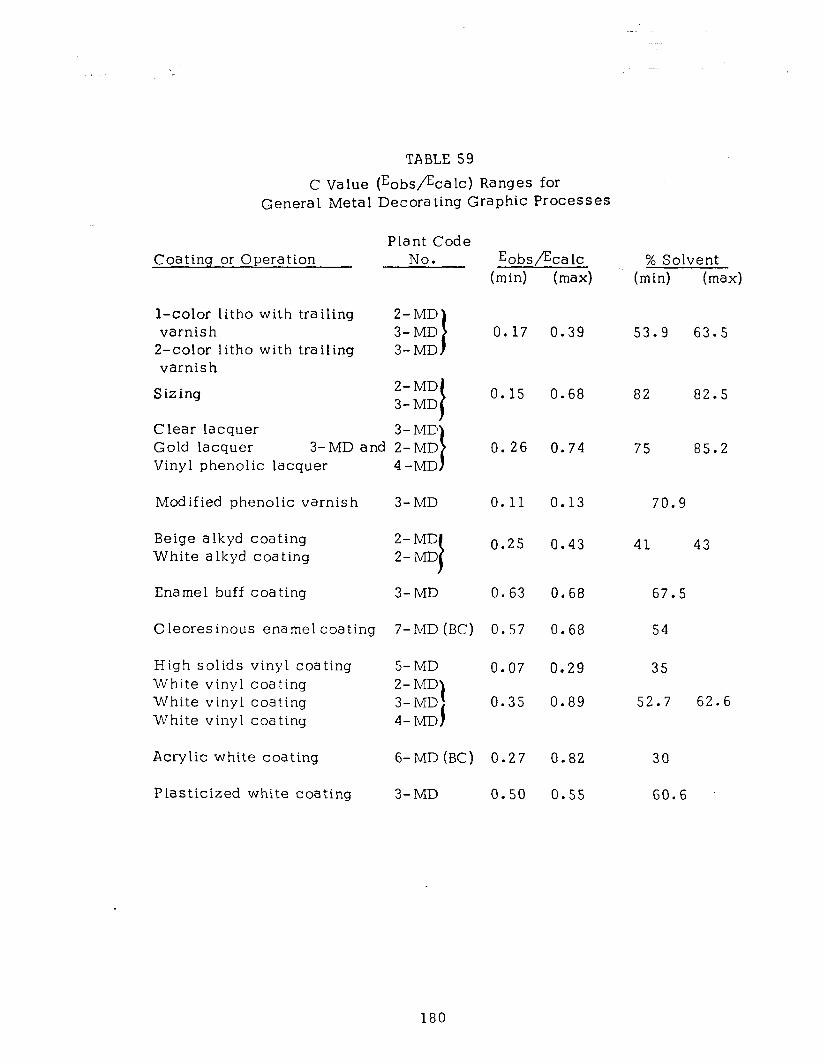
TABLE 59
C Value (Eobs/Ecalc) Ranges for General Metal Decorating Graphic Processes
Coatinq or Operation Plant Code
No.
l-color litho with trailing varnish
2-color litho with trailing varnish
2-MD 3-MD 3-MD
Sizing 2-MD 3-MD
Clear lacquer Gold lacquer 3-MD and Vinyl phenolic lacquer
Modified phenolic varnish 3-MD
Beige alkyd coating 2-MD White alkyd coating 2-MD
Enamel buff coating 3-MD
Robs/&a lc (min) (max)
0.17 0.39
0.15 0.68
0.26 0.74
0.11 0.13
0.25 0.43
0.63 0.68
Oleoresinous enamel coating 7-MD (BC) 0.57 0.68
High solids vinyl coating 5-MD 0.07 0.29 White vinyl coating 2-MD White vinyl coating 3-MD \ 0.35 0.89 White vinyl coating 4- MD I
Acrylic white coating 6-MD (BC) 0.27 0.82
Plasticized white coating 3-MD 0.50 0.55
% Solvent (min) (max)
53.9 63.5
82 82.5
75 85.2
70.9
41 43
67.5
54
35
52.7 62.6
30
60.6
180
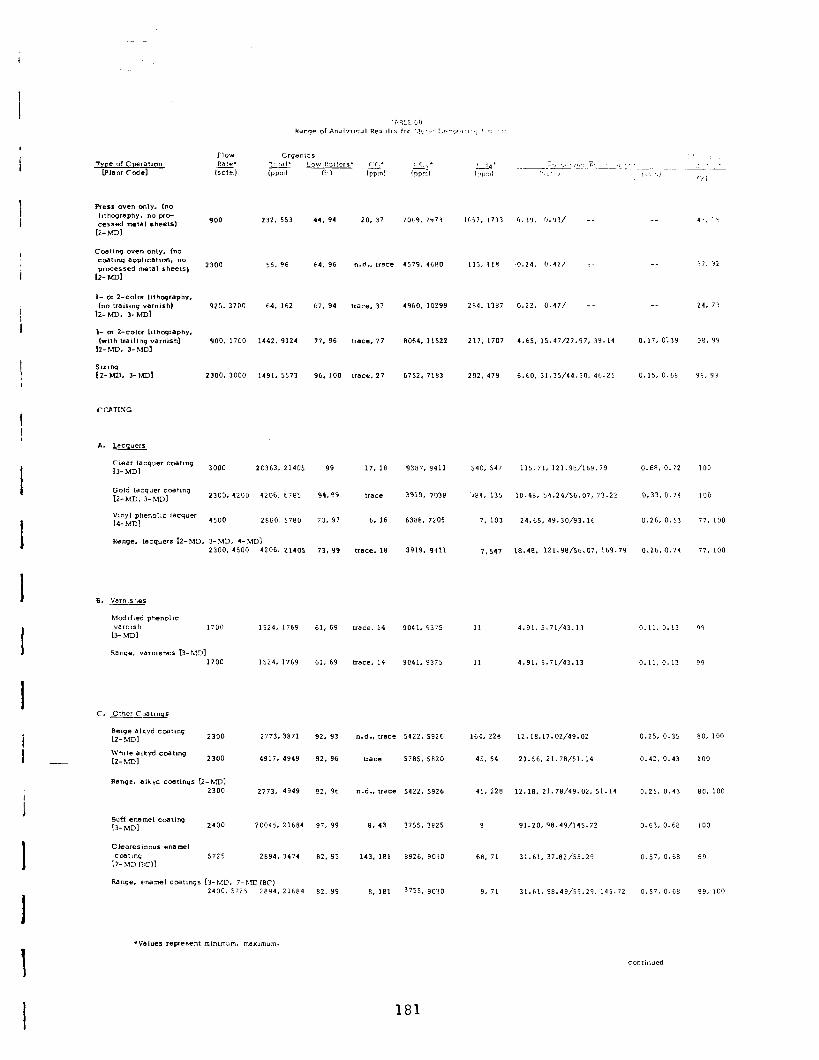
900. 1700 1442. 9124
2300. 3000 1491. 5573
3000 20363. 21405
2300.4200 4206. 6785
44. 94 20, 37
64. 96 “.d., tram
67. 94 trace, 37
77. 96
96. 100
99
94.99
73, 97
Range. Lacquers [Z-MD, 3-MD. 4-iMD1 2300.4500 4206. 21405 73. 99
701.9. 7571
4579, 46HO
4960, 10299
6064. 11522
6752. 7183
9387. 9411
3919. 7D3R
6386, 7205
3919. 9411
264, 1187 0.22, 0.47/ -- -_ 24. 7:
217, ,707 4.65, 15.47/27.97, 39.14 0.17, a:39 95. 99
292.479 6.LO. 31.35/44.50.46.25 0.15. 0.68 99. 99
540, 547 1L5.71,121.98/169.79 0.68,0.72 100
.64, 135 18.48, 54.24/56.07, 73.22 0.33.0.74 ID0
7. 103 24.E5, 49.30/93.16 0.26, 0.53 77. 100
7.547 18.46, 121.98/56.a7, 169.79 0.26.0.74 77. 100
1524. 1769 61. 69 *race. 14 9041. 93.75 11 4.91.5.71/43.13 0.,1,0.*3 99
1524, 1769 61. 69 trace. 14 9041, 93?5 II 4.91, S.i1/43.13 0.11. @.13 99
Range. alkyd cceltl”gs r.2-MD1
2300 2773. 4949 92. 96 n-d.. trace 5422. 5926 45.226 12.lfJ. 21.78/49.02. 51.14 0.25, 0.43 80, 100
i Buff enamel mall”9 I3-MD1 2400 20045. 21664 97.99 6.43 3755. 3625 9 91.20,96.49/145.72 0.63.0.66 LOO
I
Cleoreslnovs enamel rcaat,r.g 5725 2894. 3474 62. 95 143.1e1 8926. 90’30 66, 71 3i.tl. 37.82/55.29 0.57, 0.66 99
Ii- %TD lW)l
Range, enamel c~atmqs [3-MD, 7- h,D (SC) 2400. 572s 2694.21664 62. 99 E. 1e1 3755. 90’10 9, 71 3!.hl, 96.49/55.29. 145.72 0.57. 0.66 99, 100
I
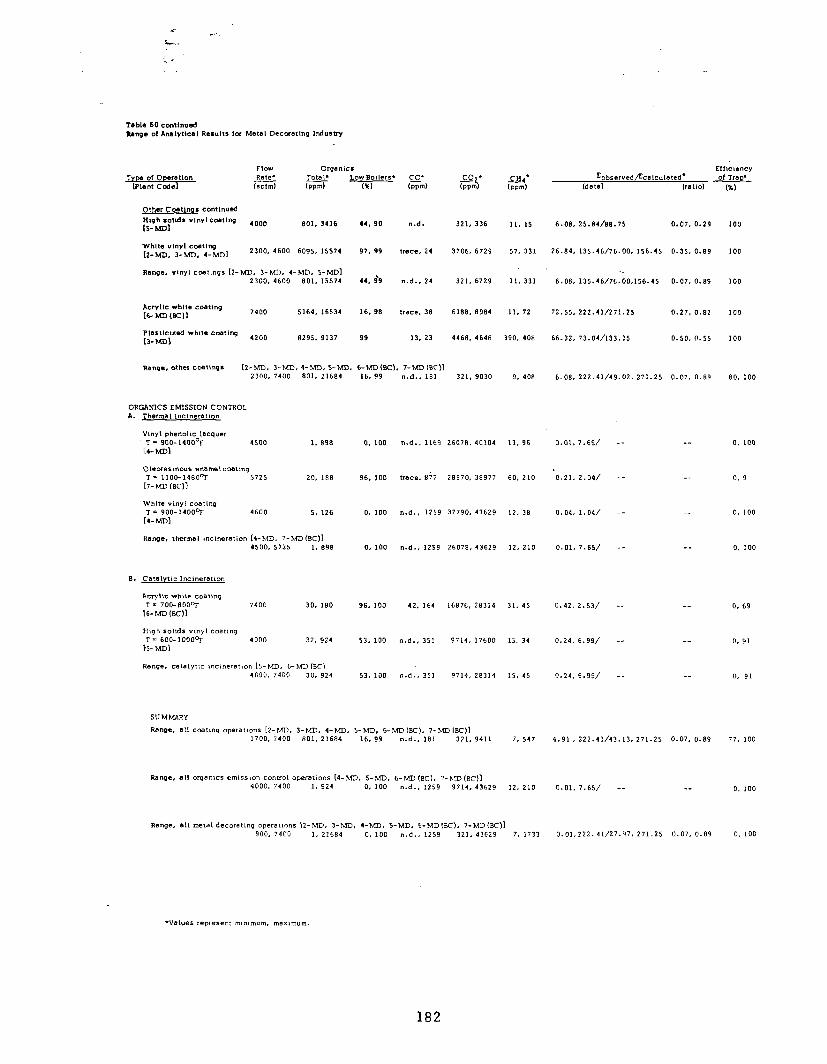
.7
L..
gthw Coatinq‘ contlnud
High solldr vlnylcoatln9 IS-MD1 ,000 801. 3436 44. 90 n.d.
wtl,te “l”Yl coating 12-MD, 3-m. r-MD1 2300, 4600 6095, 15574 97.99 trace, 24
Range, vinyl contmgs [Z-MD, 3-MD. 4-MD, S-MD] 2300. 4600 ED!. 15574 44. $9 n.d.. 24
Acrylle white coathg I~MD(Bcll 7400 5164,,6534 16, 98 trace. 38
PlastiCLzed Yh‘Tll Cc.wl”9 c3- MD1 4200 8295. 9137 99 IS, 23
321, 336 Il. IS 6.08. ZS.E4/88.75 0.07, 0.29
3706, 6729 57,331 26.84,135.46/76.00, 156.45 0.35, 0.89
321. 6729 11. 331
61.98, 8984
4468. 4648
Il. 72
390, 408
6.08. 135.46/76.00,156.45 0.07, 0.89
72.55, 222.4V271.25 0.27. 0.82
66.32.73.04/133.15 o.so. 0.55
Range, other Ooatings [Z-MD. &MD. 4-MD, S-MD. s-MD(BCL 7-nmKKl1 2300, 7400 801. 21684 16, 99 n.d.. 161 32,. 9030
ORGANICS EMISSION CONTROL
‘vinyl phenollc lacquer T - 900- 1400°F
I;4- MD] 4500 1. E98
T’ 1100-1480~r -5725 20, IEE 1:7-MD (EC11
white viny, ccating T - 900-14ooor 4600 5. 126
14-UDI
Hangs, thermal mcmeration [4-MD, I-MD (BC)1 4500. 5725 1. 898
ACIYliC Wh>W casting ‘I = 7OO-800°F 7400 30,1no
b-MD lM31
SUMMARY
aperatlonl IZ-MD. 3-MD, 4-MD, S-MD. 6-MDIBC), 7-MD IEv31 1700, 7400 801, 21684 16, 99 n-d.. 181 321, 9411
0. 100 n.d., 116’3 26078, 40104 13, 96 0.01, 7.65,’ --
96. 100 trace, 8?7 28570, 38977 60, 210 0.21. 2.04/ --
0. 100 n.d., 125!) 37790, 43629 12, 38 0.04, 1.04/ --
0.100 n.d., 1259 26078, 43629 12.210 0.01, 7.65/ --
96. 100 42. 164 16876. 28314 31.45 0.42, 2.53/ -- __ 0. 69
53.~00 n.d., 351 9714.17600 15, 34 0.24, 6.99,’ -_
53. 100 n.d., 351 9714.28314 15. 45
7. 547
12. 210
0.24, 6.99/ --
Range, aII org~nlcs eml~~to” ContfOl a~r~llo”s 14-m. 5-MD. 6-M,, (SC). ?-MD(K)1 4000. 7400 1. 924 0,100 o.d., 1259 9714, 43629
9, 408 6.08, 222.41/49.02.271.25 0.07. 0.89
-- 0. 100
__ 0. 9
__ 0. 100
-- 0. 100
__ 0, 91
-- 0, 91
4.91, 222.41,‘43.13,271.25 0.07, 0.89 77. 100
0.01, 7.65/ -- _-
Range. all metal decorat,” operatwms 12-m. 3-m. 4-m. b-MD, b-MD18C). 7-MD(BC)I 900. 7400 1, 21684 0. 100 n.d.. 1259 321, 43629 7, ,733 0.01,222.41/27.97, 271.25 0.07, 0.89
0. 100
0. 100
182
7.5 Conclusions/Recommendations on Metal Decorating Field Studies
The six plant tests conducted on metal decorating processes (con- trolled and uncontrolled sources) during the Phase !I study have led to a number of conclusions concerning the factors invol.ved in emission sampling, amount of emission generated, and control of organic emissions by corrective equipment. These are summarized below.
A. The speculation that little organics emission was attributable to the high solids ink was verified by results from collected data. Most organics emission is from varnishes, lacquers, sizing and other coating materials which dry by solvent release.
B. The major variables affecting the organics emission from metal decorating coating operatio.ns are the solvent fraction in the coating, coated sheet area, applied film or coating weight (e.g. dry weight, mg per four square inches), and coater speed or sheets coated per hour. All these factors have been corre- lated in a previously derived equation (see Section 5.62, B, and 5.63). This equation can be used to determine expected organics emission rate (Eobs), in lbs carbon per hour, from metal. decor- ating ovens for specific coating operations if the C values (Eobs/%alc) for those ovens are known. It should be noted that if expected organics emission from air pollution control equip- ment is also to be determined, the organics conversion efficiency or range of organics conversion efficiency for the control unit would likewise have to be known (see Table 58, Section 7.4).
c. Summary of analytical results Tables 42, Section 7.21; 46, Section 7.22: 48, Section 7.31; 51, Section 7.32: 53, Section 7.4; and 54, Section 7.4, list the specific C values for the different coating operations at the various plants studied during the Phase II contract period. Table 60, Section 7.4, lists the combined C value ranges for each coating studied, and Table 59 further combines the ranges in Table 60 for general coating cate- gories. Collectively, the C values ranged from 0.01 to 0.89 for all coatings studied. Because of the limited number of emission samples from the different variety of coatings and ovens, no conclusive statements can be made regarding definite C value trends for specific process variables or combinations of process variables.
D. A plot of the change of observed organic emission (Eobs) with calculated organic emission (Ecalc) from new and old ovens sampled during this Phase II study, as shown in Figure 33 and 34 (Appendix B), indicated that the relative age of an oven may affect the observed to calculated emission ratio (C value) or slopes of the plotted curves in Figure 33 and Figure 34, (Append ix B).
183
A least squares linear equation was determined for the data points representing the emission from both newer and older ovens with the the following results:
1. Newer ovens Y-intercept = -6.632 5.76 slope (Eobs/Ecalc) = 0.4812 0.093
2. 0 lder ovens _
Y-intercept = 10.9 slope (Eobs/‘%alc)=
-2.232 0.560 + 0.072
The observed emission rate values (Eobs) were derived from - average recorded values for specifically calculated organic emission rates (Ecalc) as shown in Tables 42, 46, 48, 51, 53, and 54. Figure 33 represents older ovens, and Figure 34 repre- sents the newer ones. A higher slope value indicated higher sampled or observed organic emission values for various calcu- la ted organic emission va lues . One possible explanation for this occurrence is that a certain portion of the volatilized organics from the coated metallic sheets are incinerated in the oven. The efficiency of this incineration process could be greater in newer ovens.
E. It should be noted that another source of difference between Eobs and Ecalc is the fact that decorated metal sheets leaving the oven, although assumed to be essentially 100 percent dry, have been found, through independent investigations of par- ticular coating operations, to hold 7 to 10 percent solvent after 300°F baking (95).
F. Further studies are definitely needed to determine the actual extent that an oven’s operational, structural and mechanical characteristics can affect the level of pollution ultimately emitted from the oven. These studies could compare the variation of emitted pollutants versus various oven burner’s flame control settings, degree and mode that an oven’s air is recirculated through the oven before actually being exhausted to an exit stack, or the extent of vapor incineration that is occurring in the oven itself as possibly indicated by the amount the oven dilution air is recirculated through the oven burners and deter- mined by the possible variation of the level of CO2 exhausted from the oven and sampled from the exit stack with various oven flame levels, oven air recirculation levels,or other variations of an oven’s operational, structural or mechanical characteristics. With regard to this last suggested observation and oven incinera- tion determination via observation of emitted CO2 levels, the oven burner contribution to emitted CO2 would have to be calcu- lated utilizing the methods of combustion engineering.
184
I
I I I 1 I 1 1 -
G. Table 58 is a summary table of organics conversion efficiencies of incineration for air pollution control equipment sampled in this metal decorating Phase II study. For catalytic incineration, the percentages of organics conversion efficiencies ranged from 52.79 percent to 99.70 percent and averaged 90 percent. For thermal incineration, the values of the percentages of organics conversion efficiencies were within a range of 79.44 to 99.98 percent and averaged 97 percent.
From previously described curvesdepicting the change of organics sampled at the outlet of control equipment with change of incineration temperature (see Figures 30 and 31, Section 7.31, and Figure 32, Section 7.32), it became apparent that the organics conversion efficiency of thermal and catalytic incinera- tion increased with increased incineration temperatures. Thermal incineration could be broulgh very close to a 100 percent cleanup of the inlet organics pollution if temperatures were increased to around 14OOOF. However, it became obvious that incineration temperatures used and subsequent quantity of heat used in the incineration process should depend on the degree of organics conversion efficiency or cleanup desired and the overall com- bustion efficiency of the incinerator at the temperature chosen. For example, in Figure 30, Section 7.31 (thermal incineration of vinyl phenolic lacquer, 4-MD) a 90 percent organics conver- sion incineration efficiency (or pollution cleanup) could be obtained around 970°F incineration temperature, 95 percent organics conversion incineration efficiency could be obtained around 1040°F, and a 99 percent organics conversion incinera- tion efficiency could be obtained around 1160’F.
In Figure 31, Section 7.31 (thermal incineration of white vinyl coating, 4-MD) a situation arose where although the emitted organics decreased with increased incineration temperature, the organics conversion incineration efficiency remained around 99 percent. Nine hundred degrees (F) or 14OO’F produced the same high conversion incineration efficiency. For this speci- fic coating operation at this specific plant, temperatures lower than 9OO’F could be used to produce lower conversion efficiency values if the higher efficiency values were not necessary.
In Figure 32, Section 7.32 (Catalytic Incineration of High Solids Vinyl, S-MD) the change of outlet organic emissions with change in incineration temperatures seemed to level off around a 154 ppm outlet emissi.on level, corresponding to an organics conversion incineration efficiency of 92 percent between 900 to 10oO°F. However, 750c’F could be used if only a 90 percent organic emission cleanup was specified as necessary.
185
. : H. In regards to this aspect of organics conversion efficiency, an
important co-determinant in choosing incineration temperature for organic pollution cleanup,as previously mentioned, is the fact that an incinerator operating inefficiently because of faulty maintenance or improper temperature setting can exhaust par- tially oxidized air pollutants (e.g. CO, NO ) that could have a worse environmental affect than exhauste $ organics. For all the thermal incinerators studied, the average percentages of the CO outlet values to the average inlet organic lpading values (an indication of the overalt combustion efficiency of the incin- erator) expressed as ppm CO2 were 10 percent (4-MD), 25 per- cent (4-MD) at 9OO’F: 0 percent (4-MD), 20 percent (4-MD) at 1 OOO°F; 15 percent [7-MD (BC)] at 1 lOOoF; 0 percent (4-MD), 1.5 percent (4-MD) at 12OOOF; 2 percent [7-MD (BC)‘I at 13OOOF; 0 percent (4-MD), 0 percent (4-MD), at 14000F; and 25 percent [7-MD (BC)] at 148OOF. For all catalytic incineration units studied, the ratio percentage for CO outlet values to organics inlet values were about 15 percent at temperatures of 600, 700, 800, 850, 900, 950 and 1000°F for results from plant 5-MD, and were 0.5 percent at 700°F and 1.5 percent at 800°F for results from Plant 6-MD (BC). The ratio values indicated a variety of incineration efficiencies for the two types of incinerators studied. Generally, a temperature could be reached with the thermal incinerators (around 12000F and above) when exhausted CO is at a zero to trace level. However, 7-MD (BC) is an exception, and obviously has incinerator inefficiency problems indicated by the levels of outlet CO exhausted and the high outlet exhaust methane (CH4) levels when compared to inlet CT14 levels for the various incinerator temperatures studied (see summary Table 54, Section 7.4). Most of the other plants’ thermal incinerator outlet exhaust CH4 levels were lower than the inlet levels, and decreased with increased incineration temperatures. For the 7-MID (BC) incinerator, the outlet exhaust methane level was higher than the inlet level, and remained higher than the inlet level even though the value did decrease with incineration temperature. The older catalytic control unit studied had a fairly constant output of CO over a range of set incinerator temperatures revealing a steady level of inefficiency for its incineration combustion process. How- ever, the newer catalytic unit [6-MD (BC)] had a low level of exhaust CO at temperatures samples were taken (7OO’F and 800°F), demonstrating good combustion incineration efficiency.
I. In reporting trap analyses in this study, an arbitrary distinction was made between “low boilers” and “high boilers” (see Section 4.27, C). The “low boilers ” consisted of the total organic con- centration reported when the temperature of the trap in analysis was allowed to rise to room temperature (O°C in earlier work).
186
I -
The “high boilers” consisted of the total organic concentration reported when the trap was heated from room (ambient) tempera- ture to approximately 25O’C.
Representative organic solvents indigenous to metal decorating include solvents that are primarily of the mineral spirits type (Naphtha or Stoddard Solve:nt), xylol (xylene), toluol (toluene) or higher homologs, ketones [such as isophorone, methyl ethyl ketone (MEK), methyl isobutyl k-etone (MIBK), or di- isobutyl ketone], n-butanol,some propanol, various acetates (esters) including Ceilosolve acetate, dimethyl formamide, and various others excluding chlorinated solvents or nitro- paraffins. In typical web offset operations the solvents being used as ink thinners and diluents are primarily alphatic hydro- carbons and glycots and, to a lesser extent, aromatic hydro- carbons, alcohols, esters, ketones and glycol ethers. Gener- ally speaking, the solvents used in metal decorating ink formulations have significantly lower average boiling point ranges than web offset heatset ink solvents.
Table 57 lists total organic emission values and corresponding low boiling fractions for all. metal decorating coatings sampled, individual coatings being grouped according to the approximate temperature of the sampled emission (i.e. outlet samples from pollution control units were segregated from oven stack samples). The average “low boilers” percentage of the com- bined total of organic emission sampled from various ovens for metal decorating operati.ons is 92 percent. For all the organic emission sampled f:rom control equipment outlets, the “low boilers” represented 81 percent, or more specifically, 75 percent for thermal incineration and 87 percent for catalytic incineration.
It should be noted that if the percentage of “low boilers” before incineration is greater than the percentage of “low boilers” after incineration, the possibility existed that the percentage of “low boilers” incinerated is greater than the percentage of “high boilers” incinerated, or the percentage of “low boilers” and “high boilers” incinerated is the same, and “high boilers” were formed in the incineration process . The (opposite conclusions could be noted if the percentage of “low boilers” before incineration was less than the percentage of “low boilers” after incineration (i.e., the percentage of “high boilers” incinerated is greater than the percent- age of “low boilers” incinerated, or the percentage of “low boilers” and “high boilers ” incinerated are the same, and “low boilers” were formed in the incineration process). Of course, factors or a combination of factors affecting the percentage of “low boilers” incinerated or the formation of compounds could be reactivity, temperature, residence time at certain temperatures, concentration,
187

distribution, design and condition of the combustion chamber of incinerator. The percentage of “low boilers” from metal decorat- ing ovens is much greater than “low boiler” percentages from web offset dryers (see Table 39, Section 6.4). The average sampled metal decorating oven “low boilers” percentage is higher than the average ” low boiler” percentage after incineration occurred. Again, because of the limited number of samples taken and general nature of the “Low boiling” - “high boiling” separation, no further definite conclusions or generalizations can be made at this time.
In the earlier sampling of the web offset lithographic process emissions under Task 3 of this Phase II contract work, it be- came readily apparent that the process was a batch process where individual jobs were of a semi-continuous nature. A web of paper for a particular job passing through a varied num- ber of inking units, and, in t:urn, being subjected to one of two drying mechanisms constituted, for sampling purposes, a continuous steady-state type operation,(assuming no press mechanical failures). Certain equations were developed relat- ing known job process parameters to the extent and level of the emission. Generally, duplicate samples obtained at a sampling point where unifor.m flow and good mixing prevailed, provided a reasonable assurance that the sample obtained would be representative of t.he job under evaluation.
Contrasting this earlier wor:k with the evaluation of the metal decorating operations, it was found metallic sheets are fed by press equipment for application of various materials (referred to as coatings) by coaters through long tubular type dryers. The operation is not web type (continuous) but rather sheet-fed. Generally, a skid of material (usually on the order of 1120 sheets) is fed into the dryer by a series of wickets. % here exists,as in any slleet-fed operation, a need for reloading. A new skid of material must be replaced after the completion of the previous skid, and sufficient time must also be allowed for stacking the completely dried metallic sheets at the dis- charge end of the dryer.
This constitutes from a sampling point of view, a non-continuous or unsteady type process for a particular job, since there exists periods between skid changes when sheets are not being intro- duced into the oven. In the controlled experiment previously dis- cussed (Section 7.21), it was shown that sampling must be conducted at specific periods of time during the process operation, and it appears that several grab samples taken at various time intervals during a process operation will be required in order to provide a reasonable assurance that the levels of organic emissions sampled are truly representative of the process under evaluation over extended periods of time. There is the possibility that one
188
large volume of sample could be taken over an extended time period so that the bias that would exist from grab sampling at periods of high or low organic emission levels could be eliminated. However, additional errors could be introduced into sample results when the large volume of sample collected is subjected to the limitations of instrumental analysis and to additional errors caused by the analyst himself due to increased sample handled.
K. It should finally be noted that background oven samples should always be included in a job-process bperation evaluation because of the strong possibility that various background organic pollution levels are present in the oven.
189
.a-
8 . 0 TESTING OF BEST CONTROLLED INSTALLATIONS
8. 1. Introduction
Contained in the federaL Clean Air Amendments of 1970 is a provision for establishing standards of performance for new stationary sources for a group of 30 to 35 industries which includes the graphic arts. Inherent in the regulations for state plans to implement the accom- plishment of ambient standards as set forth. by the above legislation, is the requirement that new industrial plants achieve a standard of emission performance based on the latest available control technol- ogy, processes, operating methods and other alternatives. These performance standards would reflect the degree of emission liniita- tion achievable through the application of the best system of emis- sion reduction taking into account the cost of achieving such a reduction.
Since standards of performance for new stationary sources may be re- quired for new sources in the graphic arts industry, logically acquiring the data necessary to develop these standards was included in the current contract activity and may be used in the ultimate development of standards. Task 5 entitled “Source Testing of Best Controlled Pro- cesses ” was one of the modificat:ions added to the original contract. For a complete description of the contract work conducted under Task 5 refer to the Introduction (p- 8) to this report.
a . Z! Objectives
Work conducted under Task 5 had as its primary goal to provide data so as to reflect a degree of emission limitation achievable through the application of the best system of emission reduction taking into consideration the cost of such control equipment for both the web offset lithographic process utilizing heatset inks and the metal decorating process which employs coatings.
Although primarily aimed at developing data on air pollution control technology already in use by the industry, thermal and catalytic incineration, this contract work did not overlook the changes being investigated in raw materials as well as process modification with new drying systems occurring within the graphic arts industry. These new concepts contain potential solutions to the environmental problems being faced by the indu.stry, and current awareness, a fundamental element of the progr(am (Sections 1 to 3), indicated that it would be timely to include these approaches in Task 1 of the contract effort. An assumption was made at the outset of Task 5 work that these new process variations, whether inks or drying systems, would not be available for testing within the specified contract period.
191
8.3 Backqround for Conduct of Tests
Sections 6 and 7 report studies conducted of thermal and catalytic incineration equipment for the web offset lithographic process and metal decorating process. Sources were chosen by random selec- tion, and at least one thermal and one catalytic incineration installa- tion was examined for each process.
_ _ ._ In order to further characterize the effectiveness of incineration equipment in both the web offset and metal decorating operations, four additional sources, chosen as the most recent control installa- tions were stud ied. These are presented as follows in Table 61.
TABLE 61 Sources Evaluated and Locations in Text
Type of Source Code No.* Locations in Text
Web offset process with thermal incineration
8-WO (BC) AppendixD and Section 6.4
Web offset process with ca ta lytic incineration
9-WO (BC) Appendix D and Section 6.4
Meta 1 decorating process with 6-MD (BC) Append ix E a nd catalytic incineration Section 7.4
Metal decorating process with 7-MD (BC) Appendix E and therma 1 incineration Section 7.4
*Refer to description in data treatment section of report. (BC) accompanying code number indicates a best controlled process.
This additional field sampling and analysis added two months pro- ject time to the contract and was conducted late in the program. Because of time limitations, these controlled sources were not evaluated as extensively as those conducted under Tasks 3 and 4 (Sections 6 and 7).
An extensive preliminary effort -at contacting and screening plants was conducted and four plants selected as a result. Several factors were considered in the choice of these plants. Primary emphasis was placed on the age of the control equipment and attention to maintenance by the plant. In all four plants chosen, the control equipment was between six months and one year old. A secondary
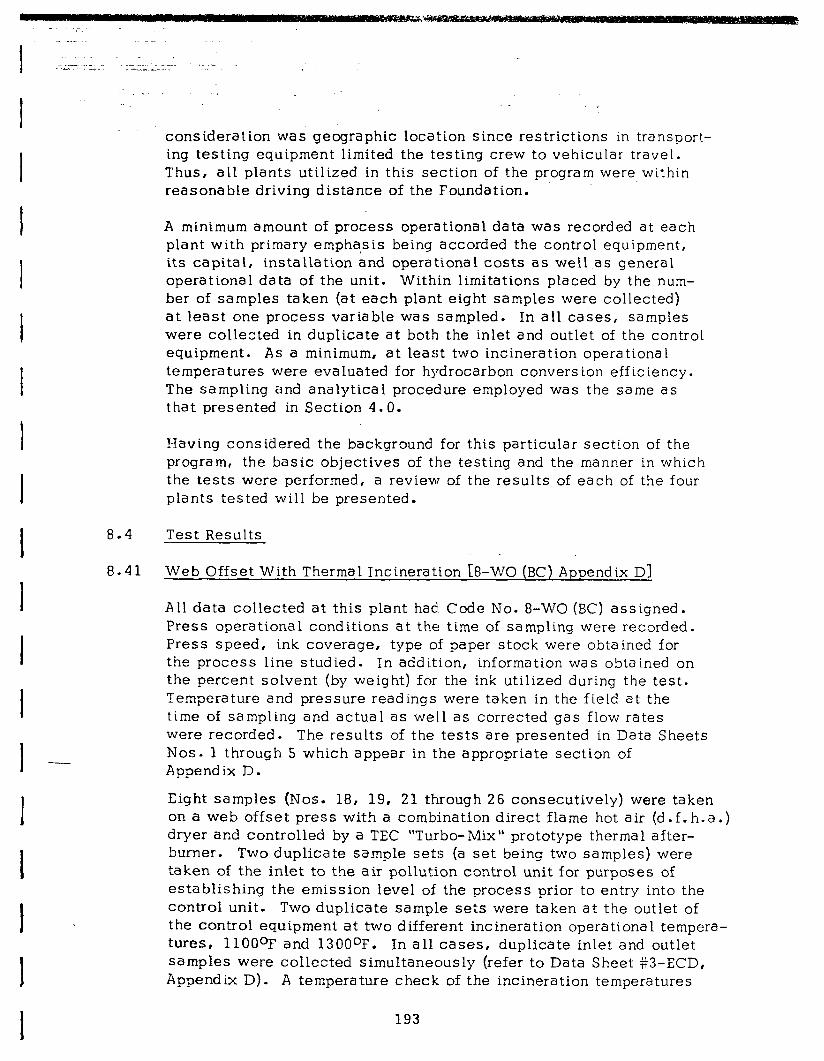
- -
a.4
8.41
consideration was geographic location since restrictions in transport- ing testing equipment limited the testing crew to vehicular travel. Thus, all plants utilized in this section of the program were within reasonable driving distance of the Foundation.
A minimum amount of process operational data was recorded at each plant with primary empha,sis being accorded the control equipment, its capital, installation and operational costs as well as general operational data of the unit. Within limitations placed by the num- ber of samples taken (at each p1an.t eight samples were collected) at least one process variable was sampled. In all cases, samples were collected in duplicate at both the inlet and outlet of the control equipment. As a minimum, at least two incineration operational temperatures were evaluated for hydrocarbon conversion efficiency. The sampling and analytical procedure employed was the same as that presented in Section 4.0.
Having considered the background for this particular section of the program, the basic objectives of t‘he testing and the manner in which the tests were performed, a review of the results of each of the four plants tested will be presented.
Test Results
Web Offset With Thermal Incineration 18-WO (BC) Appendix D1
All data collected at this plant had Code No. 8-WO (BC) assigned. Press operational conditions at the time of sampling were recorded. Press speed, ink coverage, type of paper stock were obtained for the process line studied. In addition, information was obtained on the percent solvent (by weight) for the ink utilized during the test. Temperature and pressure readings were taken in the field at the time of sampling and actual as well as corrected gas flow rates were recorded. The results of the tests are presented in Data Sheets Nos. 1 through 5 which appear in the appropriate section of Appendix D.
Eight samples (Nos. 18, 19, 21 through 26 consecutively) were taken on a web offset press with a combination direct flame hot air (d. f. h. a .) dryer and controlled by a TEC “Turbo-Mix” prototype thermal after- burner. Two duplicate sample sets (a set being two samples) were taken of the inlet to the air pollution control unit for purposes of establishing the emission level of the process prior to entry into the control unit. Two duplicate sample sets were taken at the outlet of the control equipment at two different incineration operational tempera- tures, 1lOOOF and 1300°F. In all cases, duplicate inlet and outlet samples were collected simultaneously (refer to Data Sheet %3-ECD, Appendix D). A temperature check of the incineration temperatures
193
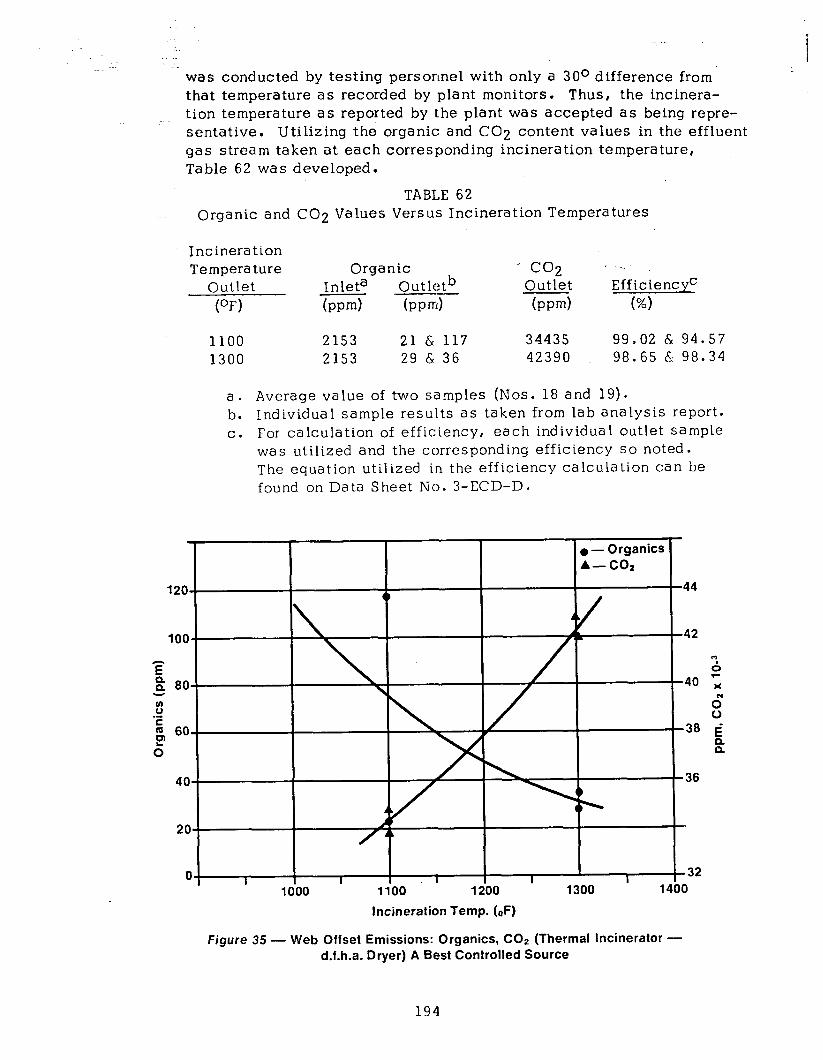
.- ; I
was conducted by testing personnel with only a 30° difference from that temperature as recorded by plant monitors. Thus, the incinera- tion temperature as reported by the plant was accepted as being repre- senta tive . Utilizing the organic: and CO2 content values in the effluent gas stream taken at each corresponding incineration temperature, Table 62 was developed.
TABLE 62 Organic and CO2 Values Versus Incineration Temperatures
Incineration Temperature
Outlet (OF)
Organic ‘CO2 ‘-‘. Inleta Outletb Outlet EfficiencyC bw-d (PPd bpm) (%)
1100 2153 21 6 117 34435 99.02 6 94.57 1300 2153 29 6 36 42390 98.65 & 98.34
a. Average value of two samples (Nos. 18 and 19). b. Individual sample results as taken from lab analysis report. c. For calculation of efficiency, each individual outlet sample
was utilized and the corresponding efficiency so noted. The equation utilized i,n the efficiency calculation can be found on Data Sheet No. 3-ECD-D.
Ol I Ol I I I
1600 ’ 1600 ’ I I I I
ii00 . ii00 . Go0 ’ Go0 ’ 1300 - 1300 . 14bo 14bo
Incineration Temp. (0F) Incineration Temp. (0F)
Figure 35 - Web Offset Emissions: Organics, CO2 (Thermal Incinerator - d.f.h.a. Dryer) A Best Controlled Source
194

-_ Utilizing the data as presented in Table 63, Figure 36 was constructed, representing a plot of the organic and CO2 emission values (at incinera- tor outlet) versus the incineration temperature of the control unit for the process eva lua ted. An increase in incineration temperature is accom- panied by a decrease in organic values with a corresponding increase in the level of C02. At an operational incineration temperature of 750°F- 8OOoF, a 95 percent organic convers ion efficiency wa s noted.
TABLE 63 Organic and CO2 Values Versus Incineration Temperatures
Incineration Temperature. Orga nit
Outletb Outlet Inleta (OF) - (wd (m-4
_
CO2 0 utlet (w-4
EfficiencyC (%I
750 2552 261 & 455 18314 89.80 6: 82,17 800 2552 95 & 116 21085 96.28 & 95.45
a. Average value of all dup’licate inlet samples. b. Individual sample result taken from lab analysis report. c. For calculation of efficiency, each individual outlet
sample was utilized and the corresponding efficiency so noted. The equation utilized in the efficiency calculation can be found on Data Sheet #3-ECD-D.
A-coz
300 22
I I I I
I I
I I I I
700 750 800 850 900 Incineration Temp. (OF)
Figure 36 - Web Offset Emissions: Organics, CO2 (Catalytic Incinera- tor - h.v.h.a. Dryer) A Best Controlled Source
195
_- . , .
: . : : . .
*
Utilizing the data as presented i,n Table 62, Figure 35 was constructed, representing a plot of the organic and CO2 emission values (at incin- erator outlet) versus the incineration temperature of the control unit for the process evaluated. An increase in incineration temperature is accompanied by a decrease in organic values with a corresponding increase in the level of C02= At: an operational incineration tempera- ture of between llOO°F and 1200°F, a 95 percent organic conversion efficiency was noted. The physical arrangement of the sampling location precluded sampling of NOx type emissions.
Data Sheet #3-ECD-C gives a comparison of the calculated and observed emission rates for samples taken from this printing line which employed a direct flame hot air dryer. In this case, the “C” factor (Eobs/Ecalc) of 0.35 compares very favorably with the range of 0.36 to 0.45 reported in previous studies (Section 6.21). For a complete description of the “C” factor see Section 5.63. These data tend to substantiate further that a direct flame hot air dryer serves to some degree as an incinerator of organic solvent.
a.42 Web Offset With Catalytic Incineration [g-W0 (BC) Appendix D1
All data collected at this plant had Code No. 9-WO (BC) assigned. Press operational conditions at the time of sampling were recorded. Press speed, ink coverage, type of paper stock were obtained for the process line evaluated. In addition, information was obtained on the percent solvent (by weight) for the ink utilized during the test. Temperature and pressure readings were taken in the field at the time of sampling and actual as well as corrected gas flow rates were recorded. The results of the tests are presented in Data Sheets Nos. 1 through 5 which appear in the appropriate section of AppendixD.
Eight samples (Nos. 27 through 31, 33, 34 and 38) were taken on a web offset press with a high vel.ocity hot air dryer (h.v. h.a.), and controlled by a TEC System. s combined thermal and catalytic unit (catalytic unit in use during test). Two duplicate sample sets (a set being two samples) were taken Iof the inlet to the unit to establish the emission level prior to entry. Two duplicate sample sets were also taken at the outlet of the control equipment at two operational temperatures, 750°F and 800°F., A temperature check was made by testing personnel with a 20° to 30° difference being noted in read- ings. Thus, the incineration temperature was accepted as that being recorded by plant monitoring equipment. Utilizing the organic analysis obtained with each corresponding incineration temperature, Table 63 was developed as follows.
19 6
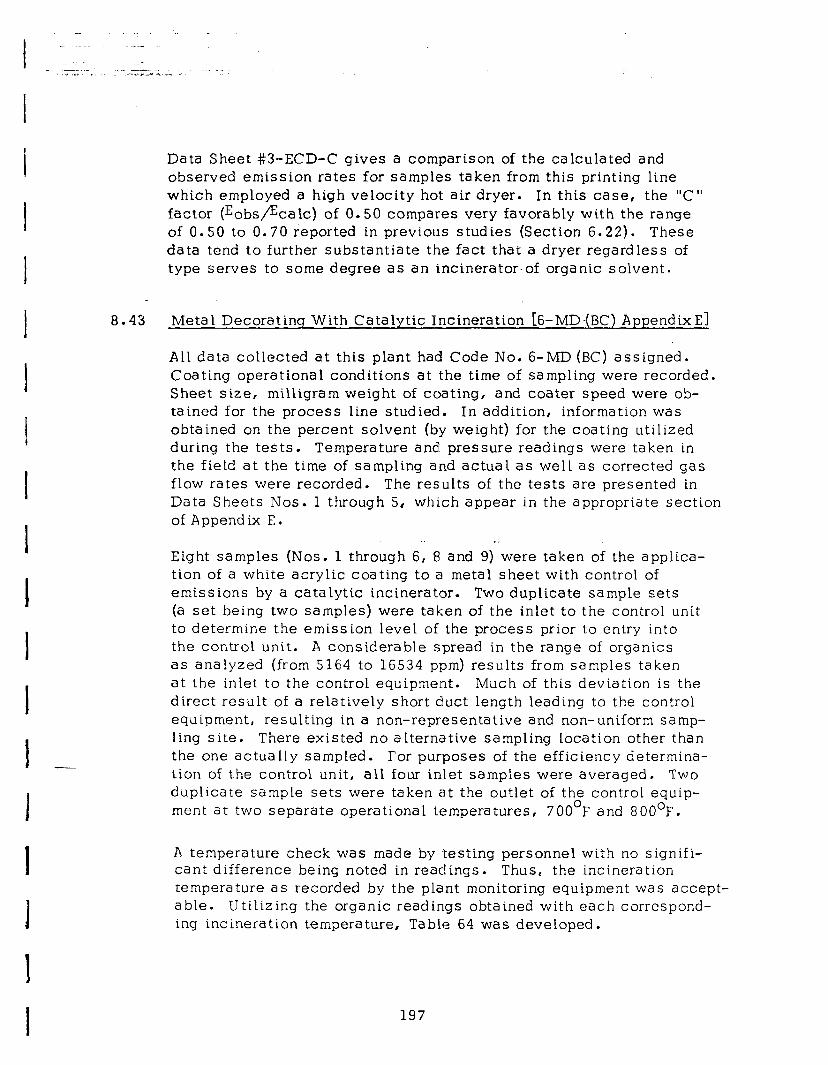
Data Sheet #3-ECD-C gives a comparison of the calculated and observed emission rates for samples taken from this printing. line which employed a high velocity hot air dryer. In this case, the “C” factor (Eobs/%alc) of 0.50 compares very favorably with the range of 0.50 to 0.70 reported in previous studies (Section 6.22). These data tend to further substantiate the fact that a dryer regardless of type serves to some degree as an incinerator-of organic solvent.
a.43 Metal Decorating With Catalytic Incineration [6-MDjBC) AppendixEj
All data collected at this plant had Code No. 6-MD (BC) assigned. Coating operational conditions at the time of sampling were recorded. Sheet size, milligram weight of coating, and coater speed were ob- tained for the process line studied. In addition, information was obtained on the percent solvent (by weight) for the coating utilized during the tests. Temperature and pressure readings were taken in the field at the time of sampling and actual as well as corrected gas flow rates were recorded. The res’ults of the tests are presented in Data Sheets Nos. 1 through 5, whi.ch appear in the appropriate section of Append ix E .
Eight samples (Nos. 1 through 6, 8 and 9) were taken of the applica- tion of a white acrylic coating to a metal sheet with control of emissions by a catalytic incinerator. Two duplicate sample sets (a set being two samples) were taken of the inlet to the control unit to determine the emission level of the process prior to entry into the control unit. A considerable spread in the range of organics as analyzed (from 5164 to 16534 ppm) results from samples taken at the inlet to the control equipment. Much of this deviation is the direct result of a relatively short duct length leading to the control equipment, resulting in a non-representative and non-uniform samp- ling site. There existed no alternative sampling location other than the one actually sampled. For purposes of the efficiency determina- tion of the control unit, all four inlet samples were averaged. Two duplicate sample sets were taken at the outlet of the control equip- ment at two separate operational temperatures, 700°F and 900°F.
A temperature check was made by testing personnel with no signifi- cant difference being noted in readings. Thus, the incineration temperature as recorded by the plant monitoring equipment was accept- able. Utilizing the organic readings obtained with each correspond- ing incineration temperature, Table 64 was developed.
197
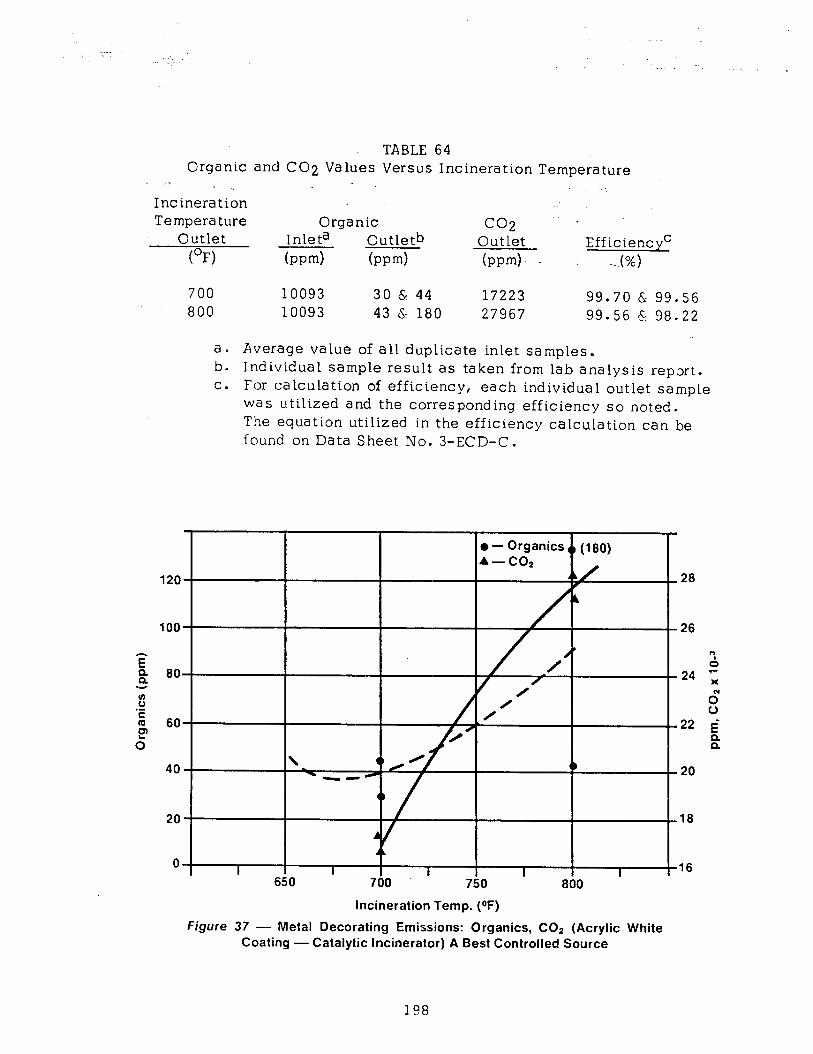
TABLE 64 Organic and CO2 Values Versus Incineration Temperature
: u Incineration Temperature Organic co2 .
Outlet Inleta Outtetb Outlet (OFI
EfficiencyC kwd (pwd kw-d - .A%)
700 10093 30 6 44 17223 99.70 & 99.56 800 10093 4 3 (s: i a 0 27967 99.56 4: 98.22
a. Average value of all duplicate inlet samples. b. Individual sample result as taken from lab analysis report. c. For calculation of efficiency, each individual outlet sample
was utilized and the corresponding efficiency so noted. The equation utilized in the efficiency calculation can be found on Data Sheet No. 3-ECD-C.
650 700 i
0 - Drganics 0 (180) A-CO*
A/ 28
26
18
I I 16 0 800
Incineration Temp. (OF)
Figure 37 - Metal Decorating Emissions: Organics, COz (Acrylic White Coating - Catalytic Incinerator) A Best Controlled Source

I i I I I I i i -
Utilizing the data as presented in Table 64, Figure 37 was constructed, representing a plot of the organic and CO2 emission values (taken at incinerator outlet) versus the incineration temperature of the control unit for the process evaluated. An increase in incineration tempera- ture is not accompanied by the usual decrease in organic values although with increased incineration temperature an increase in the level of CO is noted.
% The range of all four outlet data points, how-
ever, is wit in the range of the sampling method accuracy. As illustrated in Table 64, the organic conversion efficiency exceeded 98 percent when high inlet concentration entered the incinerator. The data point indicating 180 ppm at an incineration temperature of 800°F must be an outlier and if this is the case, then the efficiency of the incinerator remains fairly constant between 700 and 8000F.
A comparison between observed and calculated emission rates is pre- sented on Data Sheet #3-ECD-E. (Plant data necessary for perform- ing the calculation of the various emission rates are shown on Data Sheet #3-ECD-D .) Calculated values were determined using the appropriate equation(s) as shown in Section 5.0.
8.44 Meta 1 Decorating With Thermal Incineration [7-MD (BC) Append ix El
All data collected at this plant had CodeNo. 7-MD (BC) assigned. Coating operational conditions at the time of sampling were recorded. Sheet size, milligram weight of coating and coater speed were ob- tained for the process line studied. In addition, information was obtained on the percent solvent (by weight) for the coating utilized during the tests. Temperature and pressure readings were taken in the field at the time of sampling and actual as well as corrected gas flow rates were recorded.
The results of the tests are presented in Data Sheets Nos. 1 through 5, which appear in the appropriate section of Appendix E.
Eight samples (Nos. 10 through 17) were taken of the application of an oleoresinous enamel coating to a metal sheet controlled by a thermal incinerator. A duplicate set (a set being two samples) was taken of the inlet to the air pollution control unit for purposes of establishing the emission level of the process prior to entry into the control unit. Three duplicate sample sets were taken at the outlet of the control equipment at three separate operational tempera- tures. Cne set was taken at an incineration temperature of 1lOO’F and another at 1300°F and the final set at 1480’F (the maximum attainable temperature of the unit). Temperature, as monitored by testing personnel varied only 10” from temperatures recorded by the plant. Utilizing the organic loadings obtained with each corresponding incineration temperature, Table 65 was developed.
199
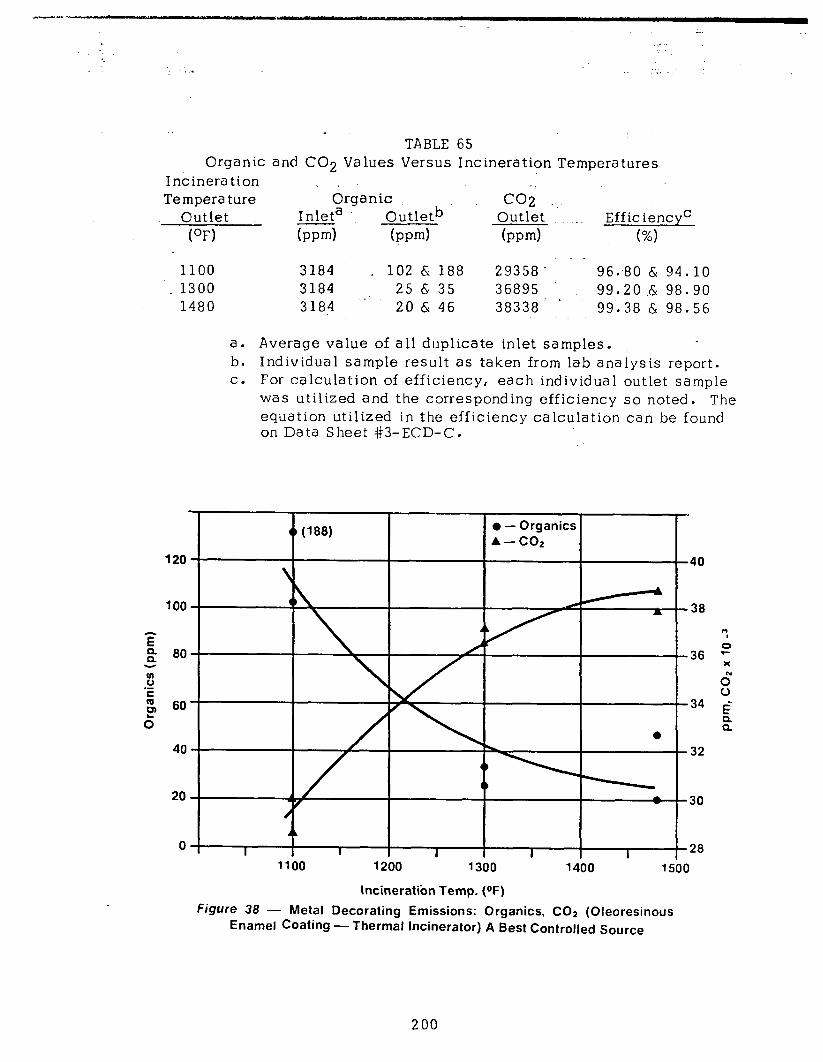
TABLE 65 Organic and CO2 Values Versus Incineration Temperatures
Incineration ~ Temperature Organic
Inleta Outletb co; “.,
Outlet Outlet . Eff ic iencyC (OF’) hm-4 (w-d hwd (%I
1100 3184 1 102 6, 188 29358 - 96.80 & 94.10 1300 3184 _ 25 6 35 36895 99.20 .& 98.90
.’ 1480 ’ 3184 20 & 46 38338’ 99.38 & 98.56
a. Average value of all duplicate inlet samples. b. Individual sample result as taken from lab analysis report. c. For calculation of efficiency, each individual outlet sample
was utilized and the corresponding efficiency so noted. The equation utilized in the efficiency calculation can be found on Data Sheet #3-ECD,-C.
0 - Organics A-CO2
0 Al
I I I I I I 28 1100 1200 1300 1400 1500
lncineratibn Temp. (OF) Figure 38 - Metal Decorating Emissions: Organics, CO2 (Oleoresinous
Enamel Coating - Thermal Incinerator) A Best Controlled Source
200
Utilizing the data as presented in Table 65, Figure 38 was constructed, representing a plot of the organic and CO2 emission values (taken at incinerator outlet) versus the incineration temperature of the control unit for the process evaluated. An increase in incineration tempcra- ture is accompanied by a decrease in organic values with a corres- ponding increase in the level of CO2. At an operational incineration temperature between llOO°F to 1200°F, a 95 percent organic conver- sion efficiency was noted. _ _
A comparison between observed and calculated emission rates is pre- sented on Data Sheet #3-ECD-E. (Plant data necessary for perform- ing the calculation of the various emission rates are shown on Data Sheet #3-ECD-D.) Calculated values were obtained using the appro- priate equation(s) as shown in Section 5.0.
8.5 Discussion of Test Results
The primary goal of this segment of the program was to collect data to determine the degree of cleanup achievable through the applica- tion of the best system(s) of emission reduction and to compare this effectiveness to the cost of such control equipment. Results of the previously discussed field tests (Section 8.4) have provided an initial insight into the degree of emission control achievable.
Shown in Table 66, is a consolidation of much of the data pertinen to relating the cost of such equipment to its effectiveness. Based on the analytical results of the samples taken, the sources tested can be considered as “best controlled processes.” For a further d cussion as to why and how these plants were chosen, the reader should refer back to Section 8.3.
t
is-
There rema in, however, many variables that cannot be fully pre- sented within the limits of the tabular form. For instance, the amount of effluent treated (generally expressed in standard cubic feet per minute) will have a bearing on the capital cost of the equip- ment. Whether heat recycle is utjlized or not will certainly affect the operational costs of the unit. None of the units tested, however, utilized heat recovery, thus, precluding this variable as input to these data. Installation costs of units vary widely depending upon the degree of structural support required, primarily the layout of the building (height, age, etc.). Operational costs will vary widely depending on size of the control unit and the actual temperatures at which incineration is carried out.
It becomes readily apparent from a review of the test results that an organic conversion efficiency of 95 percent is achievable from the units sampled at an incineration temperature of llOO°F to 1200°F
I 201
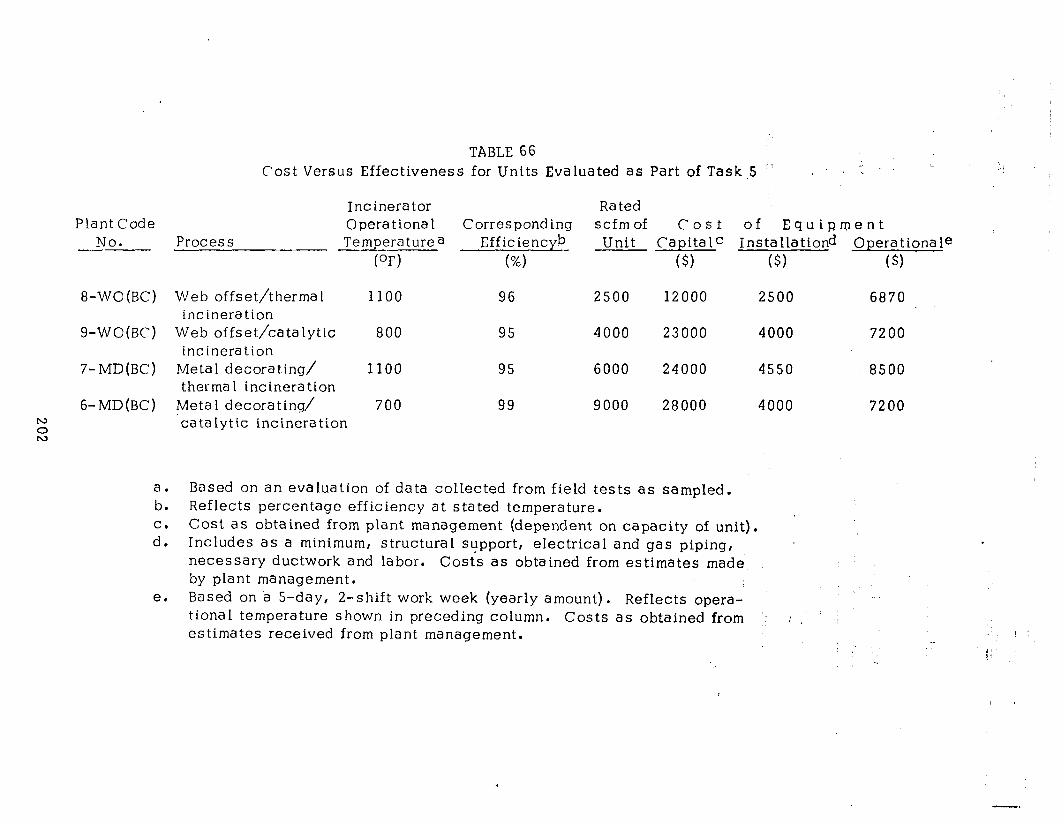
N
0
N
TABLE 66 Cost Versus Effectiveness for Units Evaluated as Part of Task.5 ‘! 1 t . - 8’:
Incinerator Rated Plant Code 0 pera t iona 1 Corresponding scfm of cost of Equipment
No. Process Temperature a Efficiencyb Unit -- Capitalc Installationd Operationale (S)
8-WO(BC) Web offset/therms 1 incineration
9-WO(BC) Web offset/catalytic incineration
7-MD(BC) Metal decorating/ therma 1 incineration
6-MD(BC) Metal decorating/ ‘catalytic incineration
(OF) (%I ($1 (9
1100 96 2500 12000 2500
800 95 4000 23000 4000
1100 95 6000 24000 4550
700 99 9000 28000 4000
6870
7200
8500
7200
a. b. C. d.
e.
Based on an evaluation of data collected from field tests as sampled. Reflects percentage efficiency at stated temperature. Cost as obtained from plant management (dependent on capacity of unit). Includes as a minimum, structural support, electrical and gas piping, necessary ductwork and labor. Costs as obtained from estimates made by plant management. Based on a S-day, 2-shift work week (yearly amount). Reflects opera- tional temperature shown in preceding column. Costs as obtained from ‘. i estimates received from plant management.
-- ---. -.-.-___ --._--.. -- -- _ .-..
for thermal, and 750°F to 850°F for catalytic. Realistically the standards of performance, if established, should reflect an operational temperature range for a given piece of control equipment in addition to the percent organic conversion achievable. Data developed from these field studies could serve very well as that basis. Of note is the fact that in all four plants sampled, the operational cost of the unit (gas consumption) was based upon the operational temperature as shown in Table 66. There remains, therefore, no means by which to evaluate operational costs versus degree of emission reduction (effectiveness) for incineration temperatures other than the incinera- tion temperature as found on Table 66. One should also note that the cost information provided in this segment of the program by various plant managements can be considered as “best available estimates.” In no cases were plant management personnel able to provide exact cost figures relating to the capital, installation and operational costs of the control equipment as evaluated.
For example-, no plant sampled meters natural gas to the control equipment separately. Therefore, such cost data become merely one part of the total fuel operational cost of the plant. In one particular plant, the catalytic unit had undergone maintenance by several con- tractors and no reportable cost data for such maintenance was made available to testing personnel.
8.6 Cost Versus Effectiveness
While it has been clearly demonstrated that a high level of hydro- carbon cleanup is achievable (95 percent or greater) with the control units evaluated in this program, a comparison of cost versus effec- tiveness between the various catalytic and thermal incineration units as evaluated is not as easily demonstrable. As noted in Table 66, the rated scfm of the control unit will affect the capital cost of the equipment somewhat. Installation costs of these units did not vary greatly for in most cases the physical layouts of the plants were similar (one-story buildings, in general). Operational costs of the four units evaluated were amazingly similar despite the dissimilarity of the control units. Thus, any direct relationship of the cost of operation and the efficiency at various incineration temperatures or comparison of catalytic versus thermal is limited due to the small number of units (four) evaluated .in this program.
There are in the literature, however, several specific references to comparative costs of control equipment.
203
Mueller (96) compares in detail the cost of thermat control equip- ment versus the fuel cost for such and further describes this system, inclusive of heat recovery (thermal regenerative system). The author, however, has chosen as his basis for calculation a 16, 000 scfm con- trot unit which generally does not apply for the graphic arts industry. Rarely does the exhaust of a dryer or oven from the web offset and metal decorating process approach the above .mentioned- flow rate.
: Turk, et al (97) present in detail the various control devices as well as systems in use for odor cont.rot. Ca ta lyzed a ir oxidation equipment costs, expressed as system cost: (capital plus 1000 operating hours), has been plotted against varying gas rates (expressed in scfm).
Povey (98) discusses in detail catalytic incineration systems appli- cable to metal decorating and compares them with various other incinerating systems.
Yocum, et al (99) present a comprehensive discussion relating com- parative costs for catalytic and flame afterburners to include item- ized costs as well as extent of waste heat recovered. A table is presented in which a comparison is made of the total costs for installing and operating both catalytic and direct flame afterburners, assuming different heating values for the incoming gas stream along with different levels of heat recovery.
Thornaides (100) presents a detailed cost comparison of thermal and catalytic incinerators assuming a process gas volume of 6000 scfm which is realistic for metal decorating. An interesting feature of this article is a table which provides a comparison of temperatures required to convert combustibles to carbon dioxide and water.
Skinner, et al (101) d.escribe the application of incineration to the emissions discharged from the “web” dryers. A complete cost breakdown of incineration equipment is included along with its opera tiona 1 expense.
In reviewing the above mentioned references, ranges of operating temperatures for the two methods of incineration complete with costs are possible. Table 67 represents a brief synopsis of these data.
2 Cl4

TABLE 67 Ranges of Values for Incinerating Waste Gases
Type of -Incineration
Operating Equipment Temperature cost
(OF) ($/scfm)
Annual Gas cost.
(S/l000 scfm)
Therma 1 1000-1500 1.75-10.0 2.0-7.50 Catalytic 600-900 1.75-7.50> 2.0-4.50
Engineering economics, primarily air pollution control economics are extremely complex and dependent upon several variables. The amount and type of pollution present, the difficulties involved in controlling the specific pollutants and the level of control dictated by local air quality requirements (EPA guidelines to states on hydrocarbon emission called for a 90 percent reduction) wilt affect the total cost of a par- ticular industrial air pollution control system.
There is general agreement that the reportable average breakdown of operating expenses for pollution control equipment is as follows:
Power, fuel and water 43% Materials and parts 11% Ma intena nce labor 15% Disposal of collected wastes 31%
Tota I 100%
Overall, annual operating costs are said to run about a third of the system’s capital cost. This appeared to be the case for several of the systems evaluated in this program. In addition to these direct out-of-pocket operating expenses, there usually results some capital-related fixed costs, such as property taxes, insurance and interest. Many legislative bodies, including the federal govern- ment, are offering special tax amortization for installations of pollution control equipment. These show up as credits against operating costs.
8.7 Conclusion
In relating cost versus effectiveness for a particular system, each parameter that can affect the cost. must be evaluated. A great deal of effort has been expended by air pollution control equipment manu- facturers (particularly thermal and catalytic) to develop data outlin- ing a least expensive operation. The fact remains, however, that each particular system application must be evaluated within the specific parameters for which it is being applied. Many process par- ameters will influence the decision to select one piece of equipment over
205
another. A complete description of the various economic consiclFra- tions involved in the selection of control systems was included in Section 7.0 (Control Techniques) of the Phase I Report (1).
Regardless of how pollution control costs are accounted for, they eventually must show up as increased costs of production, and therefore, reflect a higher selliing price. Industry’s reluctance to initiate extensive air pollution control programs, therefore, lies in the competitive cost advantage for those companies who do not employ comparable control techniques. An unfair profit squeeze results for those firms unable to recover pollution control costs through price increases . Air pollution control, therefore, in order to be fair, should be applied equally to all companies involved.
2 06
1.
2.
3.
4.
5.
6.
7.
E; .
9 .
10.
1 I. .
1 ;! .
1 3 .
BIBLIOGRAPHY
Gadomski, R. R. et al. Evaluations of Emissions and Control Technolo- gies in the Graphic Arts Industries. Ena 1 Tee hnica 1 Report prepared under contract CPA-69-72 for NAPCA. Graphic Arts Technical Foundation, Pittsburgh, Pa., 1970. (NTIS PB 195 770) , _
U. S. Department of Commerce, IT. S. Industrial Outlook 1972, with Projections to 1980. Government Printing Office, 1972, Chapter 7. -_c
ibid, Chapter 6.
Anon. “$8,480 Million in 1980 for Metal Cans, ” Modern Lithography, Vol. 40, No. 3, March 1972, p. 10.
. “Bruno Forecasts the Future of Commercial Printing. ” Graphic Communications Weekly, Vol. 4, No. 42, Nov. 2, 1971, p. 8-9.
David, Mary P. (ed.), Proceedings of the Graphic Arts Technical -- Foundation Conference on Air Quality Control in the Printinq Industry, -- -- Chicago, Nov. 18-19, 1970. Pittsburgh, Pa., GATF, 1971, p. 92.
Surgeon, Walter R. “2 New Ink Systems, ” Graphic Arts Monthly, Vol. 43, No. 9, Sept. 1971, p. 42-44.
Bassemir, Robert W. “Avoiding Solvent Emissions - Solventless Tnks. ” Paper presented at ATChE Meeting, August 29-Sept. 1, 1971, Paper 48e. (Abstracted inAir Pollution Abstracts, Vol. 3, No. 4, April 1972, APTIC No. 36124.)
Burachinsky, Bohdan V. “Litho Inks and Air Quality, ” Modern Lithography, Vol. 38, No. 11, Nov. 1970, p. 56-57.
James A. Wold, Richardson Ink Company, personal communication, July 1971.
Anon. “New Trends in Inks and Drying, ” Canadian Printer K Publisher, Vol. 80, No. 6, June 1971, p. 46, 48, 52.
Carlick, Daniel J. “Dry Off the Press, ” American Ink Maker, Vol. 49, No. 12, Dec. 1971, p. 20-22.
Bock, Ralph F., “Novel Methods for Drying Inks, ” GATF Research Progress No. 86. Pittsburgh, Pa., Graphic Arts Technical Foundation, 1970.
207
:14.
18.
:19.
2 0.
21.
22.
23.
24.
2 5 .
2 6.
Z! 7.
28.
Z! 9 .
‘- ”
Bock, Ralph F. and Rosenberg, Stan.iord ?I., “Models for Economic Evaluation of UV Ink Drying Systems, ” GATF Research Progress No. 89. Pittsburgh, Pa., Graphic Arts Technica 1 Foundation, 1972.
Young, John . “Lately It Was the Computers, Now Inks are Big Research News, ” Canadian Printer and Publisher, Vol. 80, No. 7, July 1971, p. 25-26.
Editorial. “Solvent-Free Inks, ” American Ink Maker, Feb. 1971, p. 21. -.
Anon. “Inks for Web Offset, ” .Modern Lithography, Vol. 39, No. 4, April 1971, p. 28-29.
Woods, D. H. and Hartshorn, I. “Microwave Drying of Inks, ” American Ink Maker, Vol. 48, No. 12, Dec. 1970, p. 39-40, 42, 44, 59-61.
Gerling, John E. “Microwave Drying” [in Japan], American Ink Maker, Vol. 48, No. 4, April 1970, p. 41.
Editorial. “New Methods of Drying Ink, ” American Ink Maker, Vol. 46, No. 10, October 1968, p. 29.
Federal Register, May 22 and October 6, 1970.
Woods, Derek and Hartshorn, Ian. “Microwave Drying for Flexo and Gravure Inks, ” Converter, Vol. 7, NO- 9, Sept. 1970, p. 23-26, 28.
Macey, Kenneth, et al. “Web Offset Drying: Revolution and Evolution, ” Modern Lithography, Vol. 38, No. 4, April 1970, p. 29-30, 33, 50, 52-54.
Johnston, D. R. “Drying of Ink by Radiation, ” Australian Lithographer, Vol. 5, No. 30, July/Aug. 1970,. p. 23.
Trembley, J* F. and Loring, C. M., Jr. “Drying Printing Inks and Coatings by Radio Frequency, ” Tappi, Vol. 52, No. 10, 1969, p. 1847.
Loret, H. C. “Catalyzed Inks: Headache or Cure, ” American Ink Maker, Vol. 47, No. 8, August 1969, p. 24-26, 56-57.
News note. “Bowers Describes New Inks, ” American Ink Maker, Vol. 48, No. 1, Jan. 1970, p. 40.
“‘Smog-Free’ Offset Ink Developed, ” Safety Newsletter, Printing and Publishing Section, National Safety Council, April 1970, p. 4.
News note. “Another Smog-Free Ink Is On The Market, ” Graphic Communications Weekly, Vol. 3, No. 5, Feb. 3, 1970, p. 12.
208

.
1.
=.-C..... ._
__. : -- . . -. 3 0 . News note. “GPI Develops Thermofast Solventless Ink, ” American Ink
Maker, Vol. 48, No. 6, June 1970, p. 47. -. . .
31. Anon. “Solventless Ink to Cut Pollution Announced by GPI, ” Printing News, Vol. 84, No. 23, June 13, 1970, p. 35.
32. “Inks that Do More Than Just Print, “ No. ;O, July 1970, p. 23-24.
Printing Production, Vol. 100, _
_. _ -. 33. News note. “New Ink Cuts Air Pollution, ” Printer’s Digest, Vol. 11,
No. 3, August 1970, p. 10.
34. Anon. “What’s New In Inks, ” Modern Lithography, Vol. 38, No. 11, Nov. 1970, p. 58-59.
35. Sitterly, Eugene F. “The Air Pollution Battle: What It Can Mean To Printers, ” Inland Printer/American Lithographer, Vol. 165, No. 5, August 1970, p. 80, 84.
36. Anon. “Technical View of Solventless Inks Given By Speaker at the Litho Club, ” Printing News, Vol. 85, No. 19, Nov. 7, 1970, p. 12, 14.
37. Sun Chemical Corp./General Printing Ink Division. “Thermofast Web Offset Ink. ” Northlake, Ill., May 1970.
38. News note. “A Smog-Free, Smudge-Free Ink Is Announced By Richardson, ” Graphic Communications Weekly, Vol. 4, No. 3, Jan. 19, 1971, p. 5.
39. Anon. “Inmont Demonstrates UV Curing Ink System, ” Modern Lith- ography, Vol. 39, No. 4, April 1971, p. 27, 34.
4 0 I. News notes. “GARC Tests New Inks,” Graphic Arts Progress, Vol. 18, No. 2, Feb. 1971, p. 7.
4 1 . “Fantastic Four-Color Driography With Solventless Inks, I’ Graphic Communications Weekly, Vol. 4, No. 24, June 15, 1971, p. 3.
42. News release. Kohl and Madden Printing Ink Co., 1971.
43. News note. “New Yeat Reactive Inks, ” American Ink Maker, Vol. 49, No. 7, July 1971, p. 39.
44. “Printing Inks and Air Pollution, ‘I Graphic Communications Weekly, Vol. 5, No. 22, June 6, 1972, p. 3.
209
45. News note. “Develops De-Inking Process, ” American Ink Maker, ., : .-. i. Vol. 50, No. 3, March 1972, p. 42. ‘.I
46.
47.
48.
49.
50.
51.
52.
53.
54.
55.
56.
57.
58.
59.
60.
Nass, Gerald. “Solventless Printing Inks, ” American Ink Maker, Vol. 49, No. 1, Jan. 1971, p. 25, 63.
. .’ News note. “GPI Improves Thermofa s t, ” American Ink Maker, Vol. 49, No. 7, July 1971, p. 39.
“SRI Develops Solventless Non-Polluting- Ink:’ Graphic Communications Weekly, Vol. 4, No. 36, Sept. 21, 1971, p. 11.
,
Robert W. Bassemir et al, U. S. Patent 3,551,235 (1970), “Radiation- Curable Compositions. ”
Gerald I. Nass et al, U. S. Patent 3,558, 387 (1971), “Photopolymer- izable Vehicles. ”
Robert W. Bassemir et al, U. S. Patent 3, 558, 387 (1971), “Radiation- Curable Compositions.”
Sun Chemical Corp. British Patent I, 198,259 (1970), “Photopolymer- izable Vehicles. ”
Robert W. Bassemir et al, U. S. Patent 3,551,246 (1970), “Radiation- Curable Compositions. ”
Sun’s GPI Division Gets Patents for Solventless Ink Line, ” Graphic Communications Weekly, Vol. 4, No. 2, Jan. 12, 1971, p. 5.
Sun Chemical Corp./Suncure Division. “The Suncure System. ” Carlstadt, N. J., no date, 4 p.
“Sun Scales Up Suncure, ” American Ink Maker, Vol. 49, No. 10, Oct. 1971, p. 129.
Anon. “New Inks Cure Printers’ Air Pollution Problems, ” Chemical Week, Vol. 110, No. 10, March 8, 1972, p. 44.
News note. “Chicago Printer Purchases Sun’s UV Drying System, ” Graphic Communications Weekly, Vol. 5, No. 1, Jan. 4, 1972, p. 10.
Anon. “First Suncure System for Web Offset Printing, ” Modern Lithography, Vol. 39, No. 10, Oct. 1971, p. 44.
. “-Iolden Heralds UV Ink As Major Development, ” Graphic Communications Weekly, Vol. 5, No. 11, March 14, 1972, p. 12.
2 :1 0
61 <. News note. “Suncure UV System Not To Profit for Two Years, ” Graphic Communications Weekly, Vol. 5, No. 16, April 18, 1972, p. 6.
Anon. “UV Ink Drying Given Major Test, ” Printing Management, vol. 102, No. 7, April 1972, p. 39.,
62 ,.
63. . “Web Offset Printing and UV Curing Under Production Conditions, ” Modern Lithography, Vol. 40, No. 6, June 1972, p. 14-15.
. “Ultraviolet Ink Curing Setting New Trends, ” Graphic News, Vol. 11, No. 3, March 1972, p. 12, 31.
64.
Paul Whyzmuzis and Harry Linkletter, U. S. Patent 2,406,878 (1946). 65.
66. Inmont Corp. “UV Cure Systems for Packaging Applications” and YJV Cure Ink Systems.” Clifton, N. J., 1971.
67. Bruno, M. H. “UV Inks,” What’s New(s) in Graphic Arts, Vol. 1, No. 1, April 1972, p. 2.
68. Burns, James F., Jr. “Web’s New Pollution Solution, ” Printing Impres- s ions, Vol. 14, No. 7, Dec. 1971, p. lOA-lOB, 10D.
69. “Pilot Installation of UV.. .in New York, ” Printing News, Vol. 88, No. 1, Jan. 8, 1972, p. 5.
70. News note. “Ultra-Violet Ink Curing System Reduces Air Pollution, ” Graphic Communications Weekly, Vol. 5, No. 12, March 21, 1972, p. 11.
71. Bruno, M. H. “UV Curing for Plastic Containers, ” What’s New(s) in Graphic Arts, Vol. 1, No. 2, June 1972, p. 7.
72. News notes. “New Solvent-Free Resin, ” American Ink Maker, Vol. 49, No. 6, June 1971, p. 50.
73.
73a. 74.
“No- lacquer Ink, ” American Ink Maker, Vol. 50, No. 6, June 1972, p. 40.
Printing Management, Vol. 103, No. 5, February 1973, p. 33. Carruthers, J. D. “Web Offset Press Air Pollution: How Serious Is It?“, Inland Printer/American Lithographer, Vol. 167, No. 1, April 1971, p. 50-51.
75. News notes. “Sun Shines Light on Web Dryer/Emission System, ” Graphic Communications Weekly, Vol. 4, No. 28, July 13, 1971, p. 7.
“New Web Drying System, ” American Ink Maker, Vol. 49, No. 8, August 197:1, p. 50.
76.
211
._ _ ~fc_iw-
-37. -; _
News note. Sun Graphic Sys terns. Trade Literature, Addison, Ill., no date.
78. News releases. TEC Systems Inc., DePere, Wis., May 27 and Nov. 5, 1971.
79. News note. “TEC Afterburner Features Turbomix, ” Graphic Communi- cations Weekly, Vol. 5, No. ‘13, March, 1972, p. 14.
80. News release. TEC Systems Inc., DePere, Wis., June 5, 1972. _ _
81. Schuster, James H. “-Gas Curtailment Affects Web Offset Field, ” Printing Management, Vol. 102, No. 10, July 1972, p. 35-37.
82. Reference 6, p. 103.’
83. Anon. “Solvent Vapors Under Fire, ” Environmental Science and Technology, Vol. 5, No. 11, Nov. 1971, p. 1086-1087.
84. Ca lvert, Seymour. “Air Pollution Research Problems, TR-1 Research Committee Survey Report No. l”[Air Pollution Control Association’J, J. Air Pollution Control Association, Vol. 21, No. 11, Nov. 1971, p. 694-701.
85. Krockta, H. and Lucas, R. L. “Information Required for the Selection and Performance Evaluation of Wet Scrubbers, ” J. Air Pollution Control Association, Vol. 22, No. 6, June 1972, p. 459-462.
86. Feder’al Register, Vol. 37, No. 124, June 27, 1972, p. 12644.
86 a.-d. See page 213.
87.
88.
89.
90.
MacPhee, R. D. and Kuramoto, M. “Recommended Test Methods for Organic Solvents and Vapors (Rule 66)“. Air Pollution Control District, County of Los Angeles, April 1968.
Devorkin, H. “Sampling for Compliance with Rule 66”. Paper No. 69-49, presented at the 62nd Annual Meeting, Air Pollution Control Association, New York, June 1969, p. l-30.
Gadomski, R. R., Gimbrone, A. V., and Green, W. J., “Sampling Methodology and Data Treatment, ” Sampling and Analysis of Stack Effluent for Graphic Arts Processes, Part I, G%? Research Progress Report NFz GrapGArts Technical Foundation, Pittsburgh, Pa., 1972. --
Gadomskl, Raymond R., Green, William J. and David, Mary P. “Environmental Control Program, ” GATF Research Department Report of Proqress, 1971. Pittsburgh, Pa., Graphic Arts Technical Foundation, 1972, p. 35-40; p. 41-45.
212
91.
92.
93.
94.
95.
96.
97.
98.
99.
100.
101.
Worthing, Archie G. and Geffner, Joseph, Treatment of Experimental Data, New York, N. Y., John Wiley and Sons, Inc., 1943, p. 205-214: and Shoemaker, David P., and Garland, Carl W., Experiments in Physical Chemistry, New York, N.‘?., McGraw-Hill Book Company, Inc., 1962, pp. 30-34.
Youden, W. J., Statistical Methods for Chemists, New York, N. Y., John Wiley and Sons, Inc., 1951, Chapter 5.
ibid, p. 13-20, 24-29, Chapter 5.
Carruthers, J. D., “Our Experience with Air Pollution C-ontrol ~(1 Los Angeles, Part II”, PAR-lance No. 123, Printing Industries of America, Inc., February 1973.
Hays, D.R. Official Digest, Vol. 36, No. 473, 1963, p. 605-624. _
Mueller, James ?-I., “Cost Comparison for Burning Fumes and Odors, ” Pollution Engineering, Vol. 3, No. 6, Nov./Dee. 1971, p. 18-20.
Turk, A., Haring, R.D. and Okey, R. W. “Odor Control fechnol- WY, ” Environmental Science and Technology, Vol. 6, No. 7, July 1972, p. 602-607.
Povey, J. ?I., “Catalytic Incineration Cuts Metal Lithography Air Pollution, ” Inland Printer/American Lithographer, Vol. 168, No. 2, Nov. 1971, p. 50-53.
?.‘ocum, J. E. and Duffee, R. A., “Controlling Industrial Odors, ” Chemical Engineering, Vol. 77, No. 13, June 15, 1970, p. 164-182.
Thomaides, Lazarus, “Why Catalytic Incineration?“, Pollution Engineering, Vol. 3, No. 3, May/June 1971, p. 32-33.
Skinner, C.F. and Downham, R. E., “Analyzing the Air Pollution Problems of the Printing Industry, ” Technical News Bulletin of Environmental Pollution Control Systems, Oakbrook, Ill. May 4, 1971
86a. Anon. “$500-Million Market for Air Monitors”, Environmental Science and Technology, Vol. 4, No. 8, August 1970, pp. 639-640.
b. Heylin, Michael. “Pollution Control Instrumentation”, Chemical 6: Engineering News, Vol. 49, No. 7, Feb. 15, 1971, pp. 78-81.
c. Maugh, Thomas H., II. “Air Pollu,tion Instrumentation: A Trend Toward Physical Methods”, Science, Vol. 177, No. 4050, August 25, 1972, pp. 685-687.
d. Clean Air and Water News, Vol. 4, No. 26, June 30, 1972, p. 422, reporting on a Frost & Sullivan survey, “The Air Pollution Control Market”.
213
r
.I - 1. r
ADDITIONAL R.EFERENCES . .
Ackerman, Joseph F. “Inks That Cure By Ultraviolet Light, ” Modern Litho- graphy, Vol. 40, No. 3, March 1972, p. 18-20.
Adams, Donald F., editor, “Air Pollution Instrumentation. ” Pittsburgh, Pa., Instrument Society of America, 1.966.
Adams, M.L. “Quantitative Mixed Solvent Analysis by Infrared Spectro- photometry. ” U.S. Army Coating and Chemical Laboratory, Aberdeen Proving Ground, Maryland, May 1969, CFSTI Pub. No. AD 688 588.
Air Pollution Control Field Operations Manual, Public Health Service Publi- cation No. 937, Washington, D-C., U. S. Department of Health, Education and Welfare, 1962.
Air Quality Instrumentation, Vol. I. Instrument Society of America, Pittsburgh, pa., 1972.
American Conference of Governmental Industrial Hygienists, “Air Sampling Instruments for Evaluation of Atmosplheric Contaminants, ” 4th edition, Cincinnati, ACGIH, 1972.
American Industrial Hygiene Association, “Air Pollution Manual: Part 2. Control Equipment. ” Detroit, AIHA, 1968.
Anon. “Odor Panel Smells Trouble, ” Modern Manufacturing, Vol. 1, No. 7, December 1968, p. 164.
Atmospheric Sampling Traininq Course Manual, U. S. Department of Health, Education and Welfare, NAPCA, Research Triangle Park, N.C., 1969.
Bassemir, R. W. “New Technology and the Ink Industry, ” American Ink Maker, Vol. 3, No. 49, March 1971,, p. 24-25, 70.
Bassemir, Robert. “Status of Ink: An Overview of What to Expect in Tomorrow’s Technology,” Printing Magazine, Vol. 95, No. 5, May 1971, p. 50-51, 86.
Carlick, Daniel J. “The Suncure System, ” Penrose Annual, Vol. 64, 1971, p. 168- 170.
Chapman, Robert L., ed., “Environmental Pollution Instrumentation. ” Pittsburgh, Pa., Instrument Society of America, 1969.
Cooper, Hal B. H. and Rossano, August T., “Source Testing for Air Pollu- tion Control. ” Stamford, Conn., Environmental Science Services, 1970.
214
I
Cross, Frank L. “Handbook on Incinerat gnr ion: Guide to Theory, Desi Operation, and Maintenance.” Westport, Conn., Technomic Publishing, 19’72.
de Seversky, Alexander P. U.S. Patent 3,315,445 (1967), “Integrated Mechanical Filter and E ectrostatic Precipitator System for Broad Spectrum Purification. ”
Devorkin, H., Chass, R.L., Fudurich, A.P., and Kanter, C.V. Source Testing Manual, Air Pollution Control District, County of Los Angeles, 1965.
Editorial. “Printing Inks and the Environment, ” American Ink Maker, Vol. 49, No. 3, March 1971, p. 23.
Environmenta 1 Protection Agency, “Standards of Performance for New Sta- tionary Sources, ” Notice of Proposed Rulemaking, _Federal Reqister, 3, No. 159, p. 15704-15722, August 17, 1.971.
Gadomski, Raymond R. and David, MaryP. “Air Pollution Control Program, ” GATF Research Department of Progress, 1969. Graph.ic Arts Technical -- Foundation, Pittsburgh, Par p. 183-196.
Gadomski, Raymond R., Green, William J., and David, Mary P. “Environ- menta 1 Control Program, ” GATF Research Department Report of Progress, 1970. Pittsburgh, Pa., -- Graphic Arts Technical Foundation, p. 77- 103.
Haaland, Harold, H., editor. Methods for Determination of Velocity, Volume, Dust and Mist Content of Gases,‘7th ed., BulletinWPSO. Western -- --- Precipitation Division/Joy Manufacturin.g Co., Calif. 1968.
Hall, H. J. et al. “Research and Development Needs for Air Pollutio Instrumentation, ” Journal Air Pollution Control Association, Vol. 20, December 1970, p. 804-807.
Hankin, J. W. et al. “Microwaver Paper Drying Experience and Anal Tappi, Vol. 53, No. 6, June 1970, p. 1063-1070.
n No. 12,
ysis, ”
Hardison, Leslie C. U. S. Patent 3,63#2,304 (1972), “Catalytic Oxidation of Waste Gas Streams with Fluidizable Subdivided Particles. ”
Herfin, Michael. “Pollution Control Instrumentation, ” Chemical and En.gineering News, Vol. 49, No. 7, Feb. 15, 1971, p. 78-81.
Hodgman, C. D., editor. The Handbook of Chemistry and Physics, The -- Chemical Rubber Publishing Company, Cleveland, Ohio, 44th ed., 1962.
Jenkins, Y. N. “Odor Measurement, ” Field Enforcement Aspects of Air -- -- Pollution Train& Manual, --- U. S. Department of Health, Education and Welfare, NAPCA, Research Triangle Park, N.C. 1968
215
Johnson, K.E. “Coatings, Adhesives, Ecology, ” Modern Lithmjraphy, !/ol. 40, No. 3, March 1972, p. 12-13.
Kaminski, R. K. “Instrumentation for R.ent and Lease, ” Instrumentation Technology, Vol. 19, No. 7, July 1972, p. 59-64.
Karlson, E. L. “Ozone, Friend or Foe ?“, Pollution Engineering, Vol. 4, No. 3, May/June 1972, p. 32-33.
King, William H. “The Monitoring of Hydrogen, Methane, and Hydrocarbons in the Atmosphere, ” Environmental Science and Technology, Vol. 4, No. 12, December 1970, p. 1136-41.
Kreuger, L. B. et al. “Air Pollution: Sensitive Detection of Ten Pollutant Gases by Carbon Monoxide and Carbon Dioxide Lasers,” Science, Vol. 177, No. 4046, July 28, 1972, p. 347-349.
Krotosynski, B. K., and Dravnieks, A. “Systematization of Analytical and Odor Control Data on Odorous Air.” IIT Research Institute, Interna 1 Report (undated) . 37p.
Kudlak, Rudolf. Ringelmann Smoke Chart. Information Circular No. 8333, U. S. Department of Interior, Bureau of Mines. May 1967.
MacPhee, R. D. and Kuramoto, M. “Methods of Organic Solvent Analyses Used in Los Angeles, ” Journal of the Air Pollution Control Association, Vol. 19, No. 6, June 1969, p. 443-446.
Maida, S. Michael. “GTA Probes Gravure Technology, ” American Ink Maker, Vol. 50, No. 6, June 1972, p. 22, 24, 28.
Maker, T-P. “Semi-Quantitative Analysis of Hydrocarbon Mixtures by Gas Chromatography Without Complete Separation of Components, ” Journal of Gas Chromatography, Vol. 14, No. 10, October 1966.
McCann, Roger B. “Note on the Construction of an Hydrocarbon Inducer, ” Journal Air Pollution Control Association, Vol. 21, No. 8, August 1971, p. 502.
McInnes, Alan. “Pre-Pot - The Revolution of Catalyzed Systems, ” Australian Lithographer, Vol. 7, No. 37, Sept./Ott. 1971, p. 28-31.
Middleton, John T. “What G0vernmen.t Expects of Industry, ” Modern Lithography, Vol. 40, No. 5, May 1972, p- 8-10, 46.
Morgan, George B. et al. “Air Pollution Surveillance Systems, ” Science, Vol. 170, No. 3955, Oct. 16, 1970, p. 289-296.
216
.---...........a--
Morrow, N. L. et al “Sampling and Analyzing Air Pollution Sources, ” C hemica 1 Engineering , Vol. 79, No. 2, January 24, 1972, p. 84-98.
Nemoto, Yuhei. “New Solventless Fast-Drying Inks, ” Graphic Arts Japan, vol. 13, 1971-72, p. 38-41.
Nilsen, Joan M. “Next Pollution Problem: How to Monitor Emissions, ” Chemical Engineering, Vol. 78, No. 12, May 31, 1971, p. 30-32.
O’Connor, A. John. “UV Curing - System of the 7p’s, ” Austrailian Lith- ographer, Vol. 7, No. 37, Sept./Ott. 1971, p. 23-27.
. ..:: ..’ Perry, J- H., editor. Chemical Engineers’ Handbook, 3rd ed., McGraw-Hill, New York, 1950.
Preston, Mark D. “Is Dielectric Drying for Coating?“, Modern Converter Vol. 15, No. 1, Jan. 1971, p. 39-41.
Ritchie, Roy. “Microwave Drying, ” Penrose Annual, Vol. 63, 1970, p. :193-196.
Ritchie, Roy and McFarlane, John. “Microwave Drying of Sheet Work, ” Printing Trades Journa 1, No. 1006, December 1970, p. 36-37.
Ruth, Walter E., editor. “Chemical Detection of Gaseous Pollutants; An Annotated Bibliography. ” Ann Arbor, Ann Arbor Science Publishers, 1966.
Ruth, Walter, “Quantitative Analysis of Gaseous Pollutants. ” Ann Arbor, Arbor Science Publishers, 1970.
S.altzman, B. E. “Standardization of Methods for Measurement of Air Pollutants, ” Journal of the Air Pollution Control Association, Vol. 18, No. 5, May 1968, p. 326-329.
Sharp, T.K.R. “Ink and Man’s Environment, ” Color Engineering, Vol. 9, No. 4, July/August 1971, p. 22-23.
Stamulis, Aristides, et al. “The CO2 Pulse Technique for Determining the Condition of Adsorbent Charcoal Beds, ” Journal of the Air Pollution Control Association, Vol. 21, No. 11, ?Jov. 1971., p. 709-712.
Stra han, Robert. “Gravure Inks, Key to IEfficient Printing, ” American Ink Maker, Vol. 49, No. 8, August 1971, p. 25-26, 28.
Souka, A. “New Regenerative Afterburner Design, ” Pollution Engineering, Vol.. 4, No. 3, May/June 1972, p. 45.
Stern, Arthur C., editor. “Air Pollution“ (3 ~01s.) Vol. 1 “Air Pollution and Its Effects: ” Vol. 2 “Analysis, Monitoring and Surveying; ” Vol. 3 “Sources of Air Pollution and Their Control. ” New York, Academic Press, 1968.
217
.- . . ..t , r I-
Thompson, Hugh. “Ozone, Antidote for Water Pollution, ” Pollution Engineering, Vol. 4, No. 3, May/June 1972, p. 34-36.
Tyrrell, John J., U. S. Patent 3,470, 054 (1969). “Method of Process Color. Printing with Water-Base Inks. ”
. : * U. S. Department of Health, Education and Welfare, “Hydrocarbons and Air Pollution: An Annotated Bibliography. ” NAPCA Pub. No. AP-75. Washington, D. C. Government Printing Office, 1970. , _ \ .
U- S. Department of Health, Edcuation and Welfare, National Air Pollution Control Administration, Research Triangle Park, N. C. Source Sampling
Traininq Course Manual, 1970. This manual has been specially prepared for trainees attending a course and is not generally available.
Wartburg, A. F., Pate, J. B. and Lodge, J. P., Jr. “An Improved Gas Sampler for Air Pollutant Analysis, ” Environmental Science and Technology, Vol. 3, No. 8, August 1967, p. 767-768.
Wilks, Paul A., Jr. “Infrared Analysis of Process Emissions, ” Chemical Engineering, Vol. 78, No. 28, December 13, 1971, p. 120, 122, 124.
Anon. “A Printer’s Commitment to a Better Environment, ” Printing Manage- ment, Vol. 102, No. 4, January 1972, p. 30-33.
. -- “Better Inks and Papers for Web Offset Predicted, ” Graphic Communil c:ations Weekly, Vol. 3, No. 7, April 28, 1970, p. 7.
. -- “Instrument Leasing, Rental Expand, ” Chemical and Engineering News, Vol. 49, No. 13, March 29, 1971, p. 37-38.
-- “Pollution: Lasers Analyze Air, ” Vol. 49, No. 28, July 12, 1971, p. 12.
Chemical and Engineering News,
-- “Pollution Measurements Lack Standards, ” Chemical and Engineering News’, Vol. 49, No. 19, May 10, 1971, p. 52-53.
-- No. 9,
“Researchers Seek Pollution-Free Gravure Ink, ” Gravure, Vol. 17, September 1971, p. 10, 12, 30.
. -- “Solventless Inks: What They Are And How They Work, I’ Applied Graphics, Vol. 10, No. 3, March 1971, p. 10.
. a- “UK Debut for UV System, “British Printer, Vol. 84, No. 8, August :1971, p. 49, 51.
-- “Water-Based Gravure Ink Formulated to Fight Air Pollution, ” Graphic Communications Weekly, Vol. 5, No. 21, May 23, 1972, p. 14.
2 1.8
News notes. “In-line Gloss Coating on Flexo and Gravure Presses, ” Graphic Communications Weekly, Vol. 4, No. 50, December 28, 1971, p. 7.
“New S (2. V Inks Lock-In To Celcon and Other Plastics, ‘I Graphic Communications Weekly, Vol. 3, No. 37, September 29, 1970, p. 14.
“Priority Processing Granted 660 Anti-Pollution Inventions, I’ Journal of the Air Pollution Control Association, Vol. 22, No. 5, May 1972, p. 400.
“Qua 1 Analysis: New Pyrolysis Method, ” Chemical and Engineering News, Vol. 48, No. 49, November 23, 1970, p. 11.
“Richardson Reveals New Products: Plastic, Zinc, and Ink, ” Graphic Communications Weekly, Vol. 5, No. 10, March 7, 1972, p. 9.
219
APPENDIX A Air Pollution Control Advi.sory Committee
221
AIR POLLUTION CONTROL ADVISORY COMMITTEE
Anthony J. Allegretti Vice President Engineering W,. F. Hall Printing Company 4600 Diversey Street Chicago, Illinois 60639
Fred Bock Facilities Manager Milprint, Inc. M.ilwaukee, Wisconsin 53201
Gerald L. Brewer UOP Air Correction Division Rokeneke Road Darien, Connecticut 06820
Geoffrey Buckwa lter Graphic Arts Research C ities Service Company Drawer 4 Cranbury, New Jersey 05812
Harvey A. Buntrock Basic Control Systems, Inc. 146 E. Washington Lombard, Illinois 60148
Bohdan Btirachinsky Vice President Tnmont Corporation Central Research Laboratories 1255 Broad Street Cifton, New Jerselr 07015
0. B. Burns, Jr. Administrator Water C- Air Conservation Westvaco Corporation 299 Park Avenue New ?ork, N. L\‘. 10017
Daniel J. Carlick, Manager of Technology and Marketing
Sun Chemical Corporation 135 West Lake Street Northlake, Illinois 60164 . .
Charles W. Cook Vice President The Fawcett Printing Corporation 1900 Chapman Avenue Rockville, Maryland 20852
David A. Cutler 7’riangle Publications, Inc. 400 North Broad Street Philadelphia, Pennsylvania 19101
Warren R. Daum Executive Vice President Gravure Technical Association 60 East 42nd Street New York, New York 10017
Mr. Robert G. Flagg Sun Graphic Systems Div. of Sun Chemical Corporation 59 Industrial Road Addison, Illinois 60101
Ke ith Fry Ass’t. of the Vice President International Paper Company 220 East 42nd Street New York, New York 10017
B. L. Gamble, Director Corporate Technical Development 5 Services
C ontinenta 1 Can Company 1200 West 76th Street Chicago, Illinois 60620
223
Peter Giammanco, Jr. Vice President Central Can Company, Inc. 3200 South Kilbourn Avenue Chicago, Illinois 60623
r /. Mohamad Hassibi Plant Superintendent :Ierbick & Held Printing Co. 111.7 Wolfenda le Street a Pittsburgh, Pennsylvania 15233
Urban Hirsch Bowers Printing Ink Company of California
12727 South Van Ness Avenue Hawthorne, California 90250
George Holme Research Engineer - R. ‘R. Donnelley & Sons Company 2223 Martin Luther King Drive Chicago, Illinois 60616
Alfred Jasser President Anchor Chemical Co., Inc. 500 West John Street Hicksville, New York 11801
Charles Kennedy Director of Development The Colonial Press, Inc. Clinton, Massachusetts 01510
James S. Livingston Charles T. Main, Inc. 441 Stuart Street
- Boston, Massachusetts 02116
William A. Magie, Jr. President Magie Bros. Oil Company 9101 Fullerton Avenue Franklin Park, Illinois 60131
George Mattson Web Offset Section Printing Industries of America, Inc. 17310 N. Lynn Street Arlington, Virginia 22209
Keith Nickoley Executive Vice President Roberts 6 Porter, Inc. 4140 W. Victoria Avenue Chicago, Illinois 60646
George J. Parisi Executive Secretary Flexographic Technica 1 Association 1415 Avenue M Brooklyn, New York 11230
Winslow Parker, Jr. President Parker Meta 1 Decorating Company Howard 6 Ostend Streets Baltimore, Maryland 2 1230
Joseph H. Povey Product Specialist Ma tthey Bishop, Inc. Apparatus System Division Malvern, Pennsylvania 19355
James X. Ryan Genera 1 Manager Printing Industry of Illinois 12 East Grand Avenue Chicago, Illinois 606 11
E:lgin D. Sallee, Corporate Director Environmenta 1 Sciences American Can Company American Lane Greenwich, Connecticut 06830
E. W. Starke Shell Oil Company Cne Shell Plaza, Room 1567 P. 0. Box 2463 Houston, Texas 77001
Jlohn C . Wurst Vice President Henry Wurst, Inc. 1331 Saline Street N. Kansas City, Missouri 64116
224
i
APPENDIX H Figures
225

--c-L - _ - -_ -_
Proje’ct Months 1 2 3 4 5 6 7 8 9 10 11 12 13
Task 1 - Maintain Perspective and Current Awareness I I
pL--- Familiarization with Field Testing Equipment
Task 3 Web Offset Source Tests/Evaluation
Meta 1 Decorating Source Tests/Eva lua tion I Task 4
Fina 1 Report cl
Figure 1 - GATF-EPA Phase II Program (as originally approved by EPA)
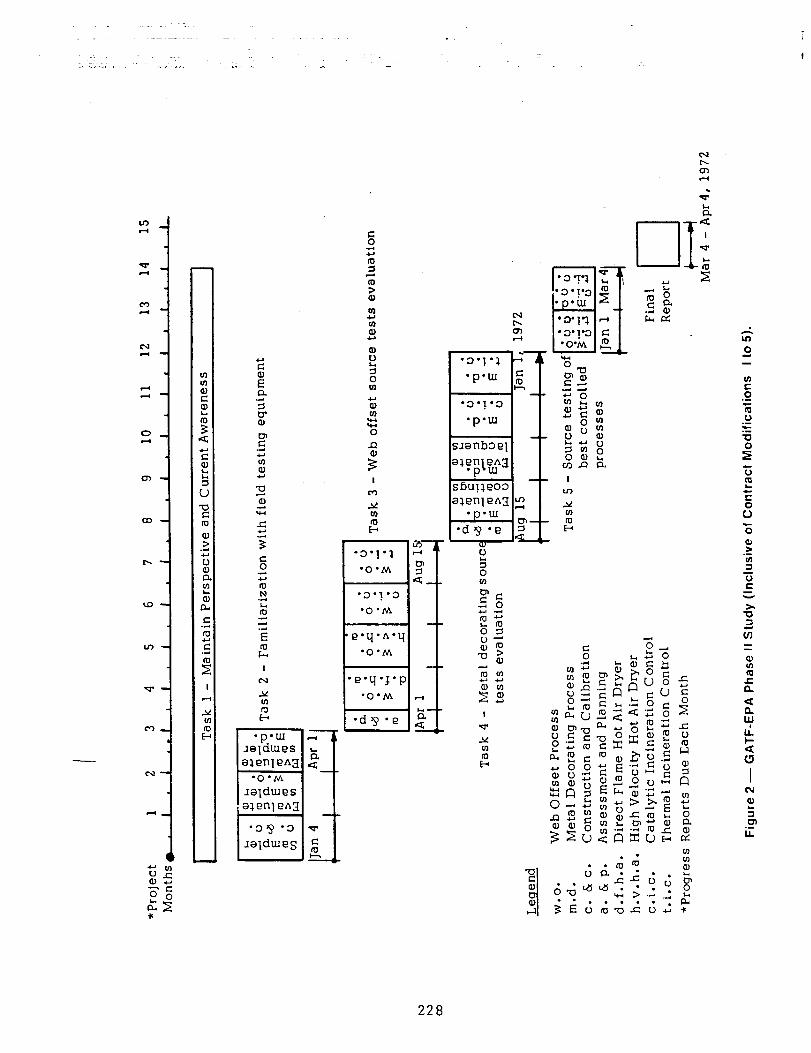
s .r n + E .-
: 4
“a 4
t
m r: 0
I
U-J
Y In
228
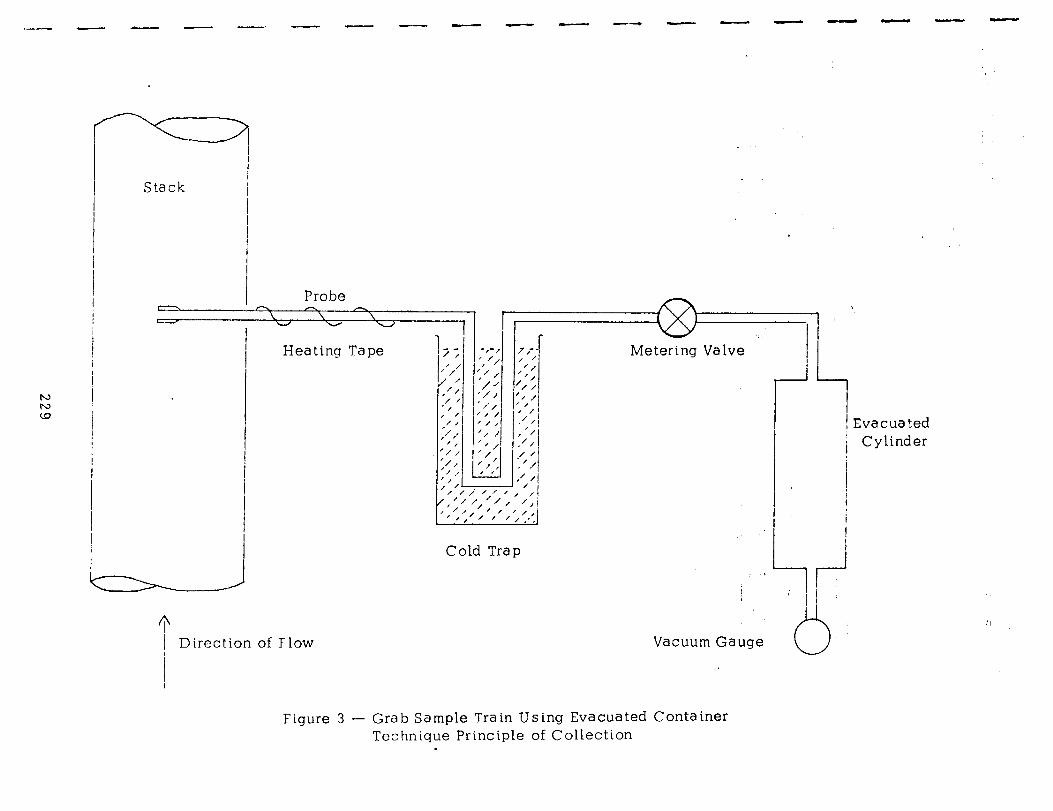
- - w -. - - - I_ c_ - -- c- - - - - -
-
N r4 W I
Stack
- -
I- Probe A - \ \ \ w
I I Heating Tape
1
1 Direction of Flow
v
2- , ’ /
‘/ / /
‘/ ‘/ / ‘/
:/:I ,’ /
‘8 ‘/ / ‘// ‘/ /
1 -1-1 ‘/ , / ,;: // /’ / , , ‘/I ‘/ / ,’ / ‘/ ‘j I I I -
Metering Valve
Vacuum Gauge
Evacuated Cylinder
Figure 3 - Grab Sample Train Using Evacuated Container Technique Principle of Collection
.
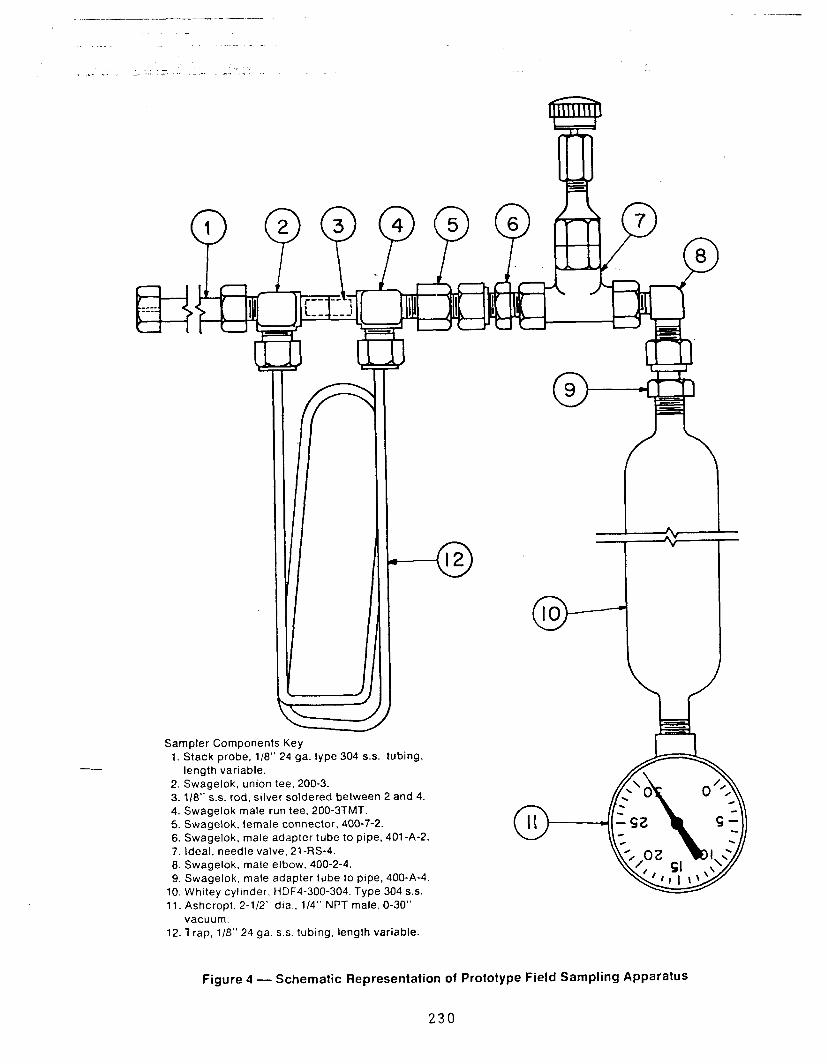
Sampler Components Key 1. Stack probe, l/8” 24 ga. type 304 S.S. tubing,
length variable. 2. Swagelok. union tee, 200-3. 3. 118” S.S. rod, srlver soldered between 2 and 4. 4. Swagelok male run tee, 200-3TMT. 5. Swagelok, female connector, 400-7-2. 6. Swagelok. male adapter tube to pipe, 401-A-2. 7. Ideal, needle valve, 21-RS-4. 8. Swagelok. male elbow, 400-2-4. 9. Swagelok, male adapter tube to pipe, 400-A-4.
10. Whitey cylinder. HDF4-300-304. Type 304 S.S. 11. Ashcropt. 2-l/2” dia., l/4” NPT male, O-30”
vacuum. 12. Trap, l/8” 24 ga. S.S. tubing, length variable.
Figure 4 - Schematic Representation of Prototype Field Sampling Apparatus
230
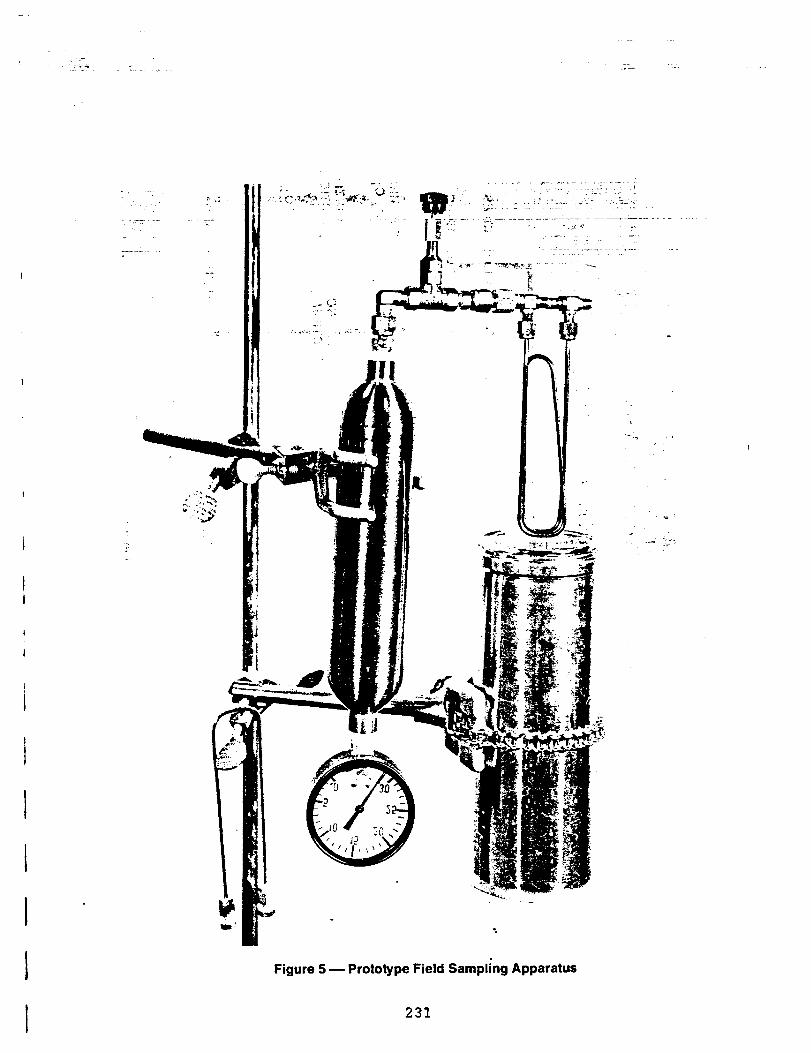
iv - ;- -. -_.-:___-. 2. :
Figure 5 - Prototype Field Sampling Apparatus
231
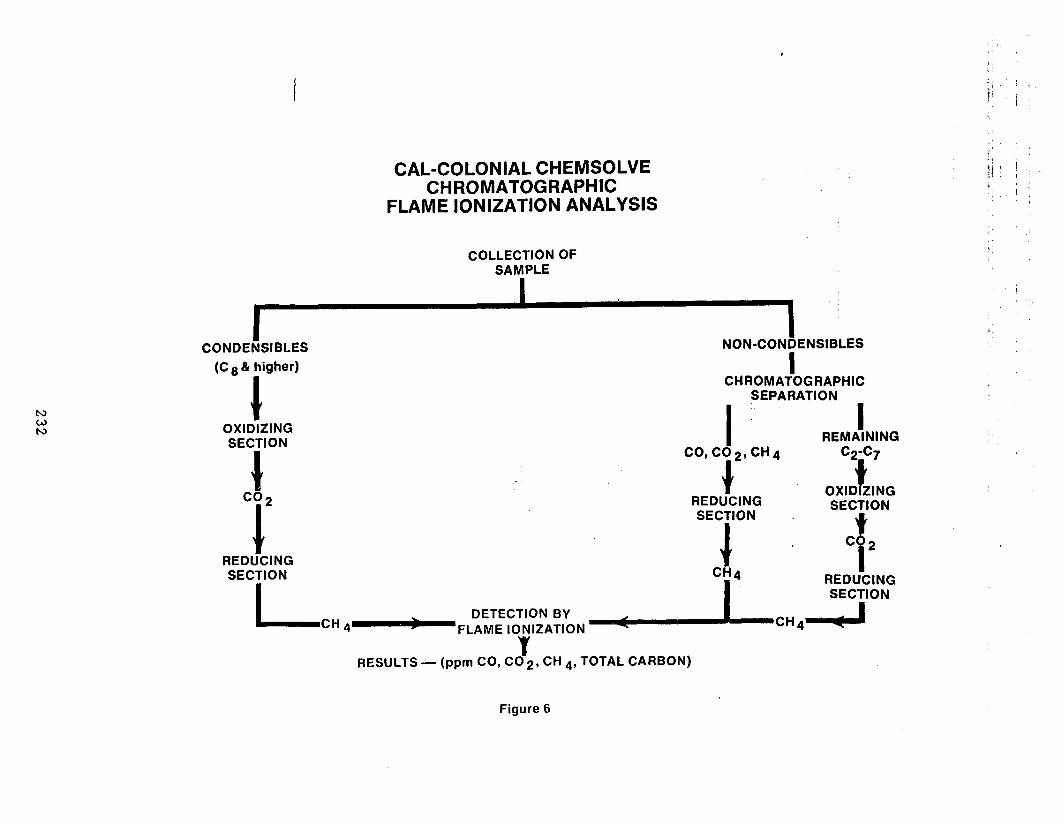
CAL-COLONIAL CHEMSOLVE CHROMATOGRAPHIC
FLAME IONIZATION ANALYSIS
COLLECTION OF SAMPLE
I
CONDENSIBLES (C 6 & higher)
+
NON-CONDENSIBLES
I CHROMATOGRAPHIC
SEPARATION
OXIDIZING I ’
I SECTION REMAINING
t
CO,CO2,CH4
1
c2-c7
CO2 t OXID ZING
I
REDUCING SECTION .
SECTION
REDUCING SECTION
I- CH 4- FL”A’M’E’k$::A:l’oN
Y RESULTS - (ppm CO, C02, CH 4, TOTAL CARBON)
Figure 6
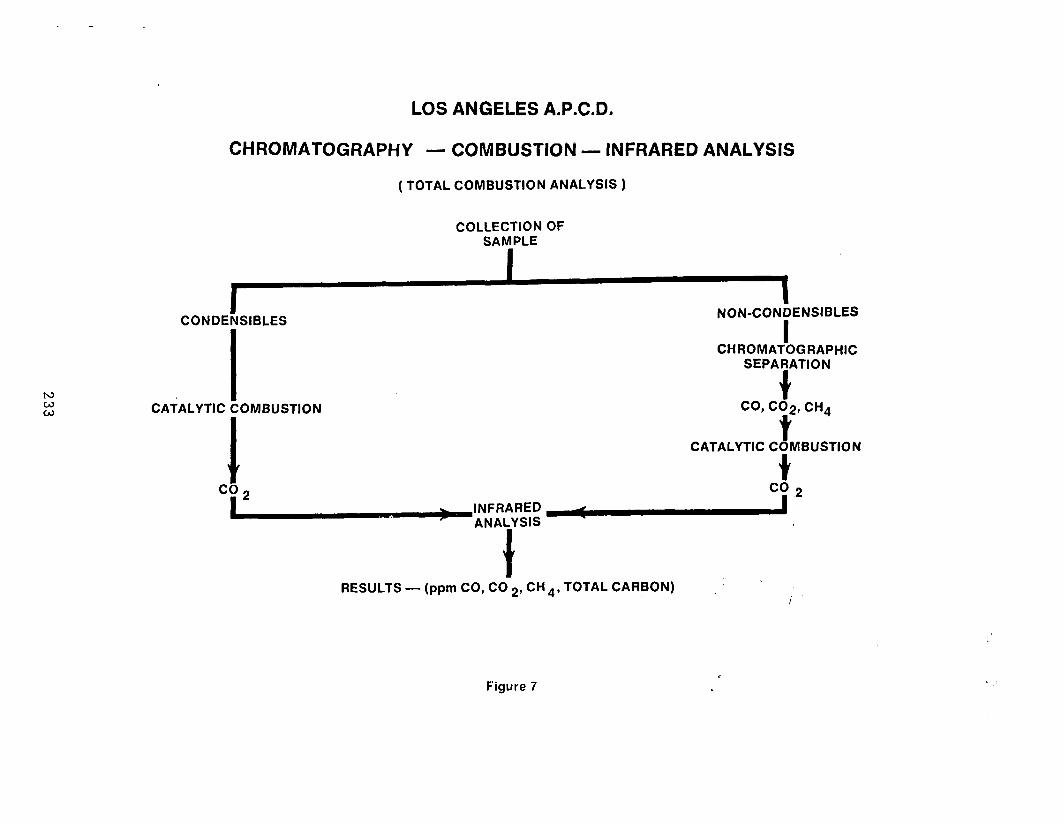
LOS ANGELES A.P.C.D.
N W W
CHROMATOGRAPHY - COMBUSTION - INFRARED ANALYSIS
(TOTAL COMBUSTION ANALYSIS )
COLLECTION OF SAMPLE
I I
CONDENSIBLES NON-CONFENSIBLES
I I
CHROMATOGRAPHIC SEPARATION
f CATALYTIC COMBUSTION CO, CO2, CH4
I CATALYTIC COMBUSTION
f
t RESULTS - @pm CO, CO 2, CH4, TOTAL CARBON)
Figure 7
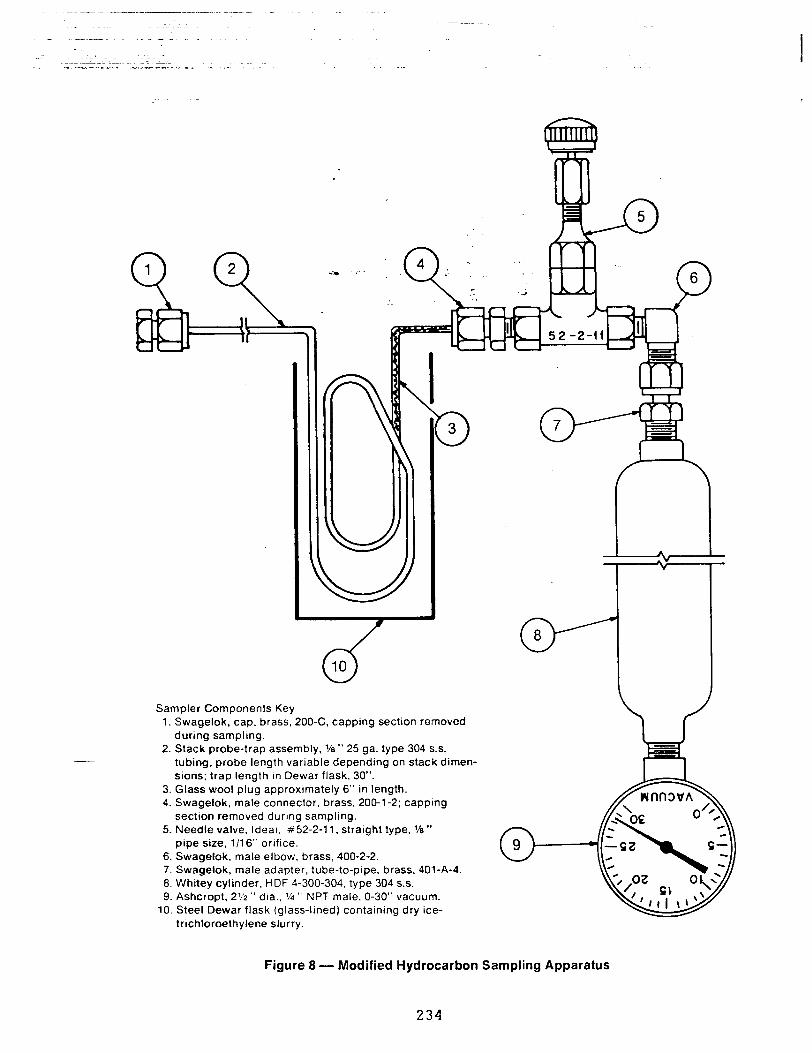
Sampler Components Key 1. Swagelok, cap, brass, 200-C. capping section removed
during sampling. 2. Stack probe-trap assembly, l/e ” 25 ga. type 304 S.S.
tubing, probe length variable depending on stack dimen- sions; trap length in Dewar flask, 30”.
3. Glass wool plug approxrmately 6” in length. 4. Swagelok, male connector, brass, 200-l -2; capping
sectron removed during sampling. 5. Needle valve, Ideal, #52-2-l 1. straight type, r/a”
pipe size. l/16” orifice. 6. Swagelok. male elbow, brass, 400-2-2. 7. Swagelok, male adapter, tube-to-pope, brass, 40.1-A-4. 8. Whitey cylinder, HDF 4-300-304, type 304 S.S. 9. Ashcropt. 2% ” dia., ‘A ” NPT male, O-30” vacuum.
10. Steel Dewar flask (glass-lined) containing dry ice- trichloroethylene slurry.
Figure 8 - Modified Hydrocarbon Sampling Apparatus
234
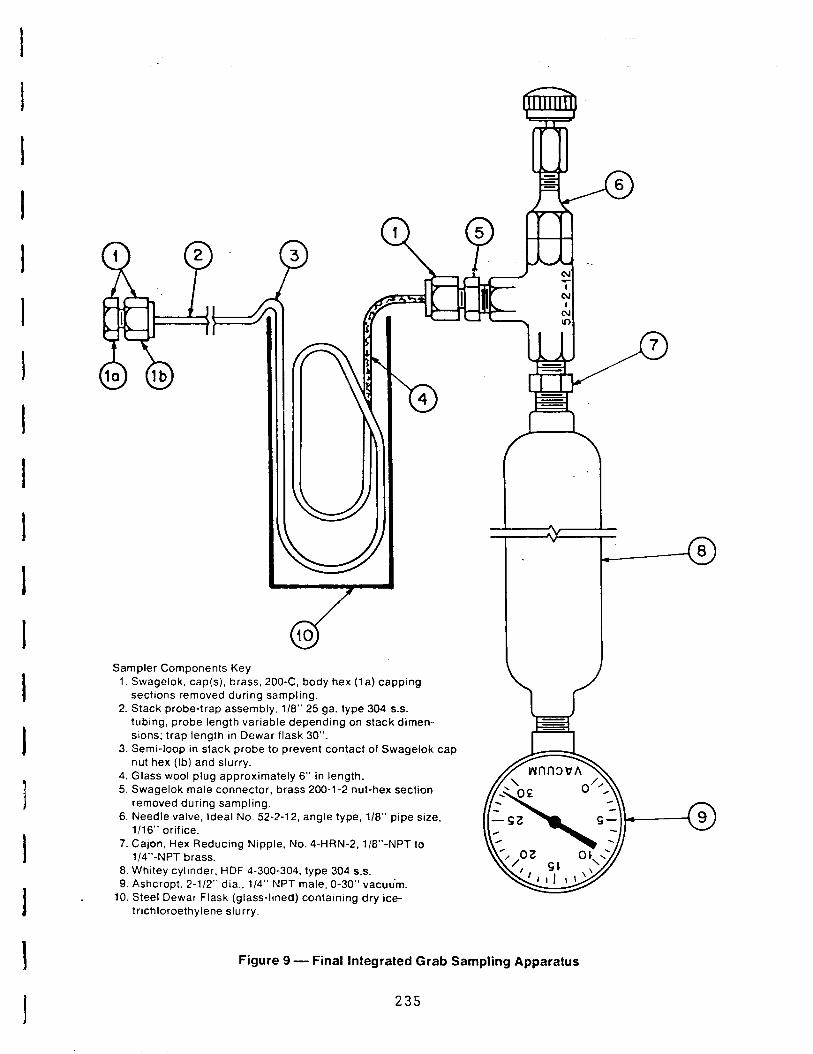
bb la lb
Sampler Components Key 1. Swagelok. cap(s), brass, 200-C, body hex (1 a) capping
sections removed during sampling. 2. Stack probe-trap assembly. l/8” 25 ga. type 304 S.S.
tubing, probe length variable depending on stack dimen- sons; trap length in Dewar flask 30”.
3. Semi-loop in stack probe to prevent contact of Swagelok cap nut hex (lb) and slurry.
4. Glass wool plug approximately 6” in length. 5. Swagelok male connector, brass 200-l-2 nut-hex section
removed during sampling. 6. Needle valve, Ideal No. 52-2-12, angle type, l/8” pipe size,
106” orifice. 7. Cajon, Hex Reducing Nrpple, No. 4-HRN-2. l/8”-NPT to
l/4”-NPT brass. 8. Whitey cylinder, HDF 4-300-304, type 304 S.S. 9. A.shcropt. 2-112” dia., l/4” NPT male, O-30” vacutim.
10. Steel Dewar Flask (glass-lined) containing dry ice- trichloroethylene slurry.
-0 8
Figure 9 - Final Integrated Grab Sampling Apparatus
235
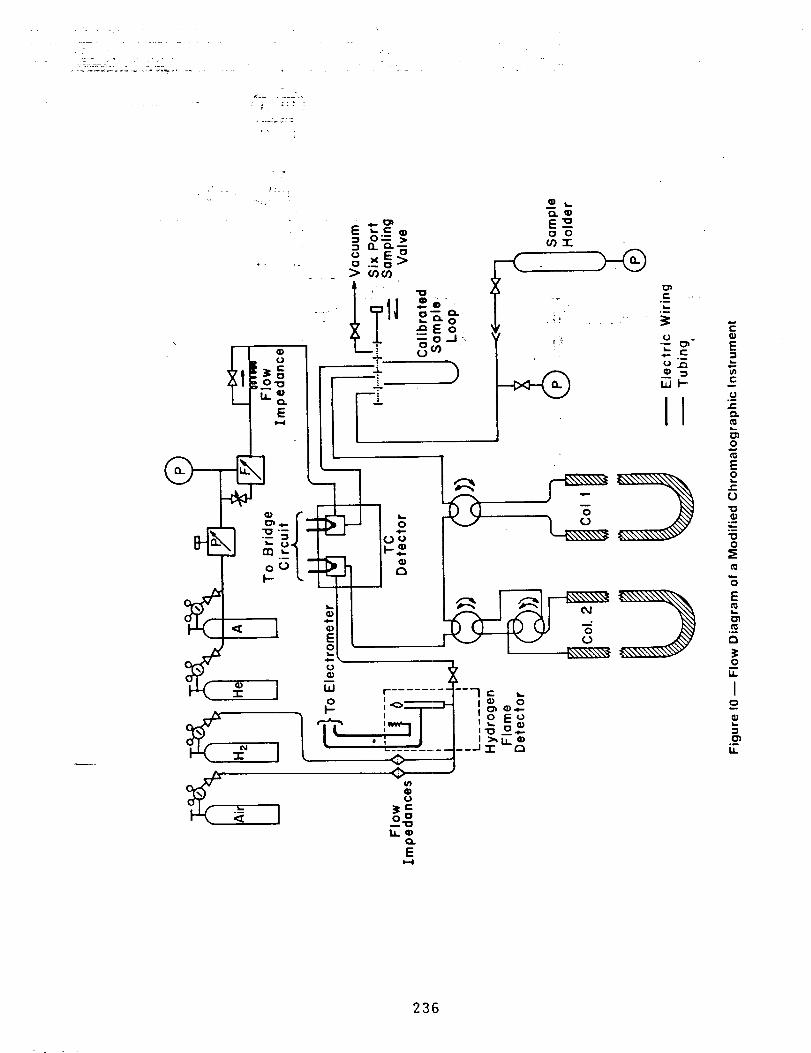
*
.’ !
a4erk I r-, i 1 I n
236

30
__
28
26
24
22
20
IS
16
14
12
6
0 2 4 6 8 IO 12 14 16 18 20
Time (minutes)
Figure 11 - Filling Curve for an Evacuated Cylinder Over a l5-Minute Sampling Period
237

4 6 8 IO 12 14 16 18 20
Time (minutes)
Figure 12 - Filling Curve for an Evacuated Cylinder Over a 20-Minute Sampling Period
238
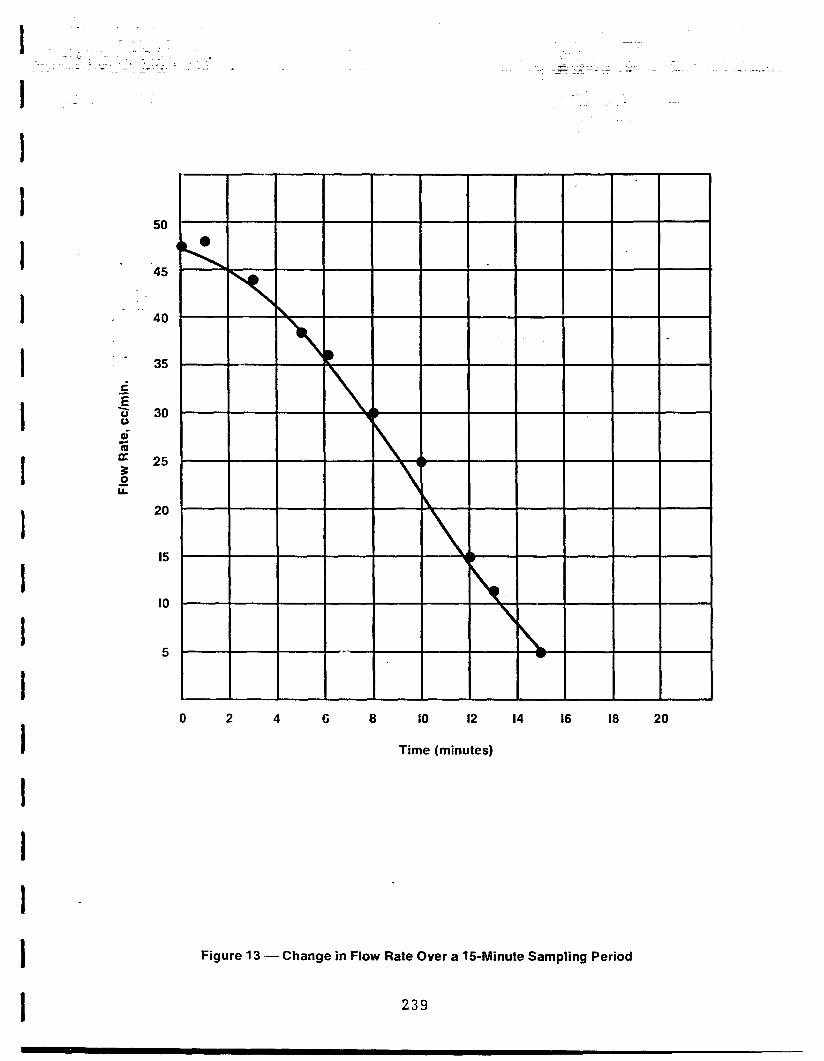
I I 1 I I I I I I I I I I I I I I
u
-
r’ .- E -2 6 fii K
B ii
50
45
40
35
30
25
20
I5
IO
5
0 2 4 6 8 IO I2 I4 I6 I8 20
Time (minutes)
Figure 13 - Change in Flow Rate Over a 1BMinute Sampling Period
239
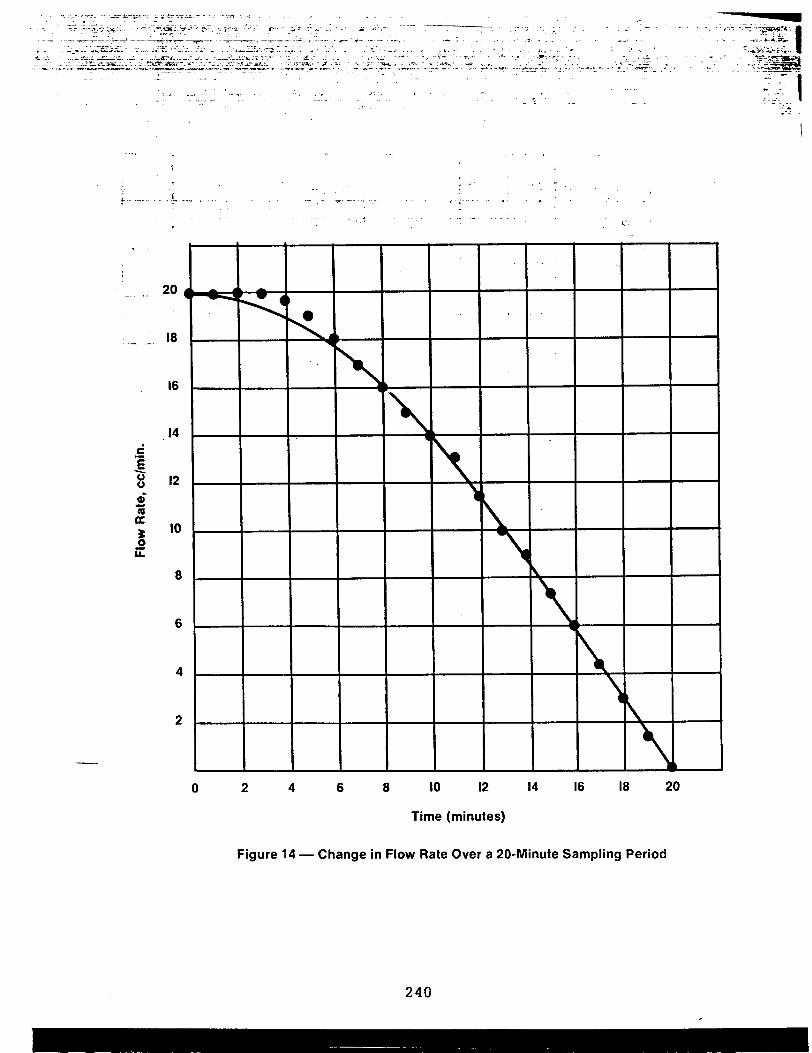
I8
I6
8
6
0 2 4 6 8 IO I2 I4 I6 I8 20
Time (minutes)
Figure 14 - Change in Flow Rate Over a PO-Minute Sampling Period
240

60 .
130 140 150 I60 170 I60 190 200 210 220 230 240
Temp. (CC)
Figure 15 - Probe Temperature (OC) Versus Variac Setting (Static Room Conditions)

MD-P-3
. - T -‘:
To Stack
MD-P-2
Figure 16 - Schematic Representation of Two Samples Collected Simul- taneously Using a Single Probe
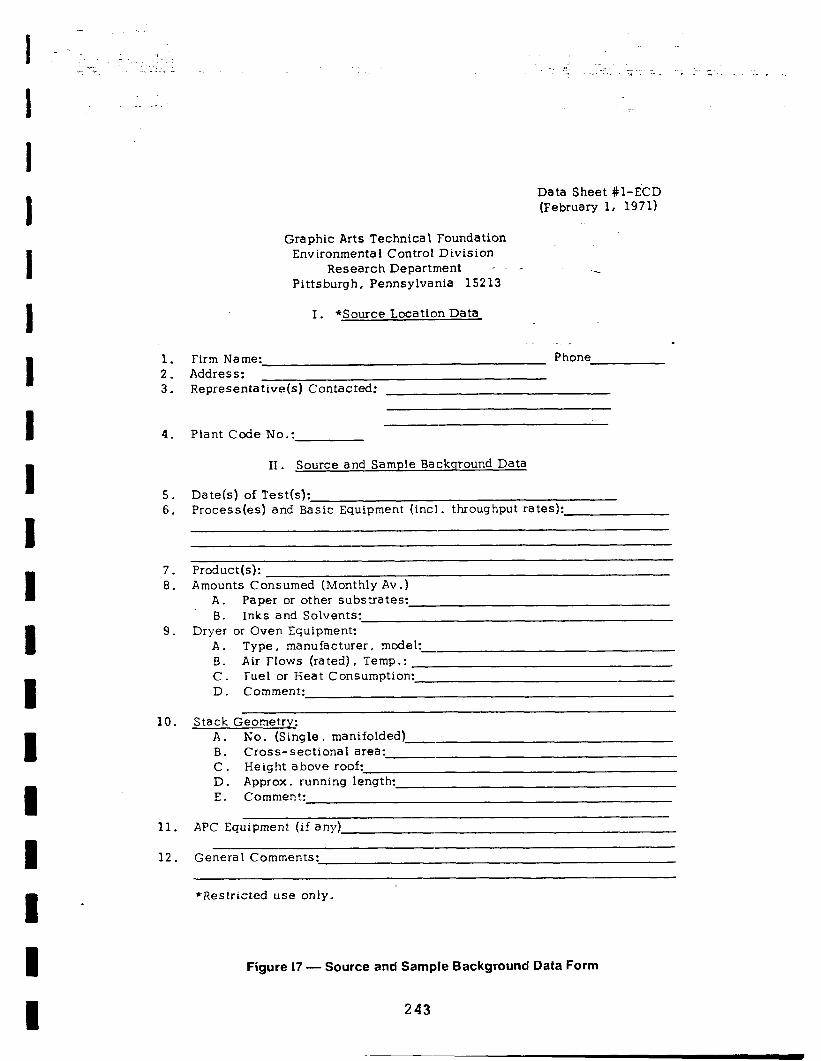
Data Sheet #l-ECD (February 1, 1971)
Graphic Arts Technical Foundation Environmenta 1 Control Division
Research Department - - Pittsburgh, Pennsylvania 15213
--.
I. *Source Location Data
1. Firm Name: Phone 2. Address: 3. Representative(s) Contacted:
4. Plant Code No.:
II . Source and Sample Backqround Data
5. Date(s) of Test(s): 6. Process(es) and Basic Equipment (incl. throughput rates):
7. Product(s): 8. Amounts Consumed (Monthly Av .)
A. Paper or other substrates: - 8. Inks and Solvents:
9. Dryer or Oven Equipment: A. Type, manufacturer, model:
- B. Air Flows (rated), Temp.: C. Fuel or Heat Consumption: D. Comment:
10. Stack Geometry: A. No. (Single, manifolded) B. Cross-sectional area: C. Height above roof: D. Approx. running length: E. Comment:
11. APC Equipment (if any)
12. Genera I Comments:-
*Restricted use only.
Figure 17 - Source and Sample Background Data Form
243
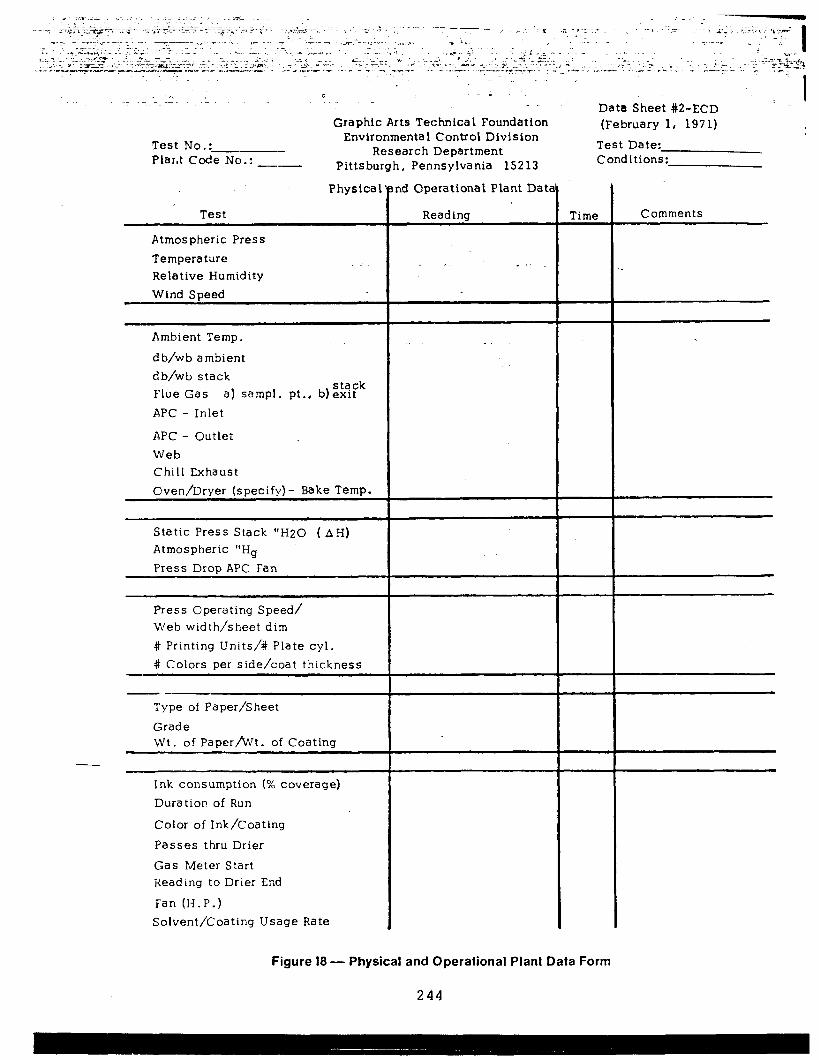
(February 1, 1971)
Test Date: Conditions:
Graphic Arts Technical Foundation
Test No.: Environmental Control Division
- PLar.t Code No.: Research Department
-- Pittsburgh, Pennsylvania 15213
Physical
Test
Atmospheric Press Temperature Relative Humidity Wind Speed
Ambient Temp.
db/wb ambient db/wb stack Flue Gas
stack a) sampl. pt., b)exit
APC - Inlet
APC - Outlet Web Chill Exhaust Oven/Dryer (specify) - Bake Temp.
Static Press Stack “H20 ( AH) Atmospheric “Hg Press Drop APC Fan
- Press Operating Speed/ Web width/sheet dim # Printing Units/# Plate cyl. # Colors per side/coat thickness
-A- Type of Paper/Sheet Grade Wt. of Paper/Wt. of Coating
Ink consumption (% coverage) Duration of Run
Color of Ink/Coating
Passes thru Drier
Gas Meter Start Reading to Drier End
Fan (H-P.) Solvent/Coating Usage Rate
nd Operational Plant Dati
Reading Time Comments
Figure 18 - Physical and Operational Plant Data Form
244
I
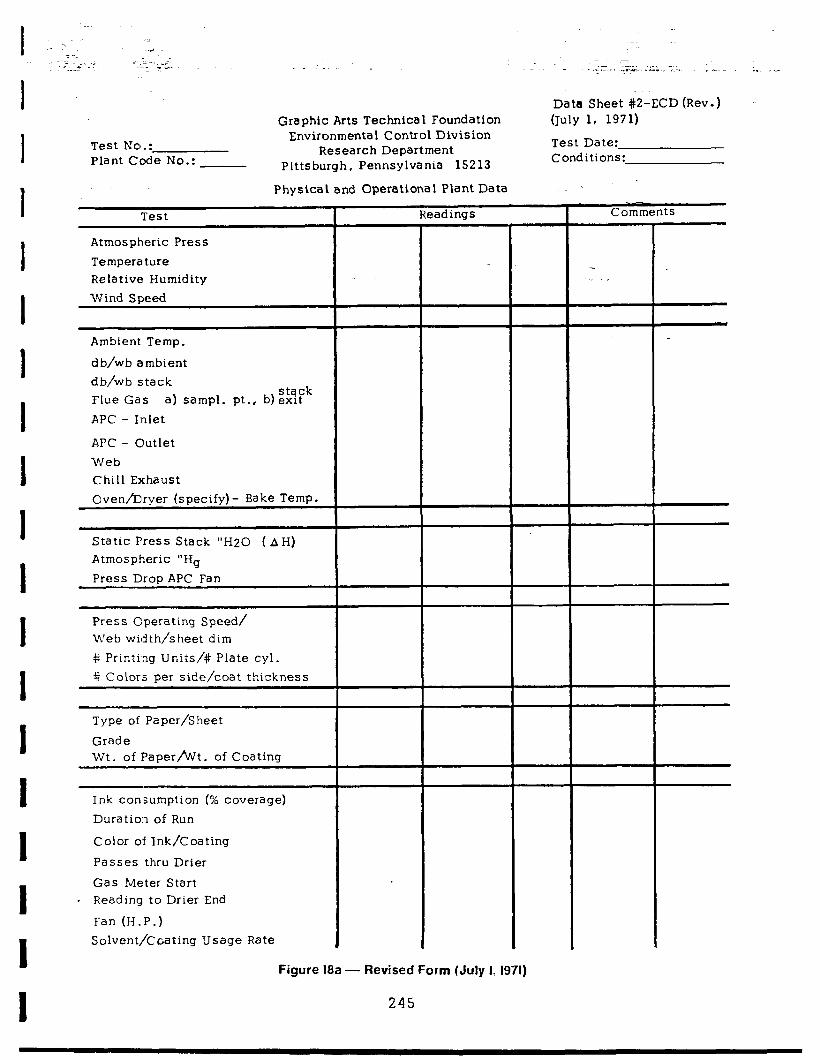
Test No.: Plant Code No.:
Graphic Arts Technical Foundation Environmental Control Division
Research Department Pittsburgh, Pennsylvania 15213
Data Sheet #2-ECD (Rev.) (July 1, 1971)
Test Date: Conditions:
Physical and Operational Plant Data
Test
Atmospheric Press Temperature Relative Humidity Wind Speed
Ambient Temp.
d b/wb ambient db/wb stack Flue Gas
stack a) sampl. pt., b)exit
APC - 1:nlet
APC - Cutlet Web Chill Exhaust Oven/Dryer (specify)- Bake Temp.
Static Press Stack “H20 ( AH) Atmospheric “Hg Press Drop APC Fan
Press Operating Speed/ Web width/sheet dim # Printi:ng Units/# Plate cyl. # Colors per side/coat thickness
Type of Paper/Sheet
Grade Wt. of PaperfWt. of Coating
Ink corxumption (% coverage) Duration of Run
Color of Ink/Coating
Passes thru Drier
Gas Meter Start - Reading to Drier End
Fan (H.P.) Solvent/Coating Usage Rate
l- Readings Comments
Figure 18a - Revised Form (July I. 1971)
245
.
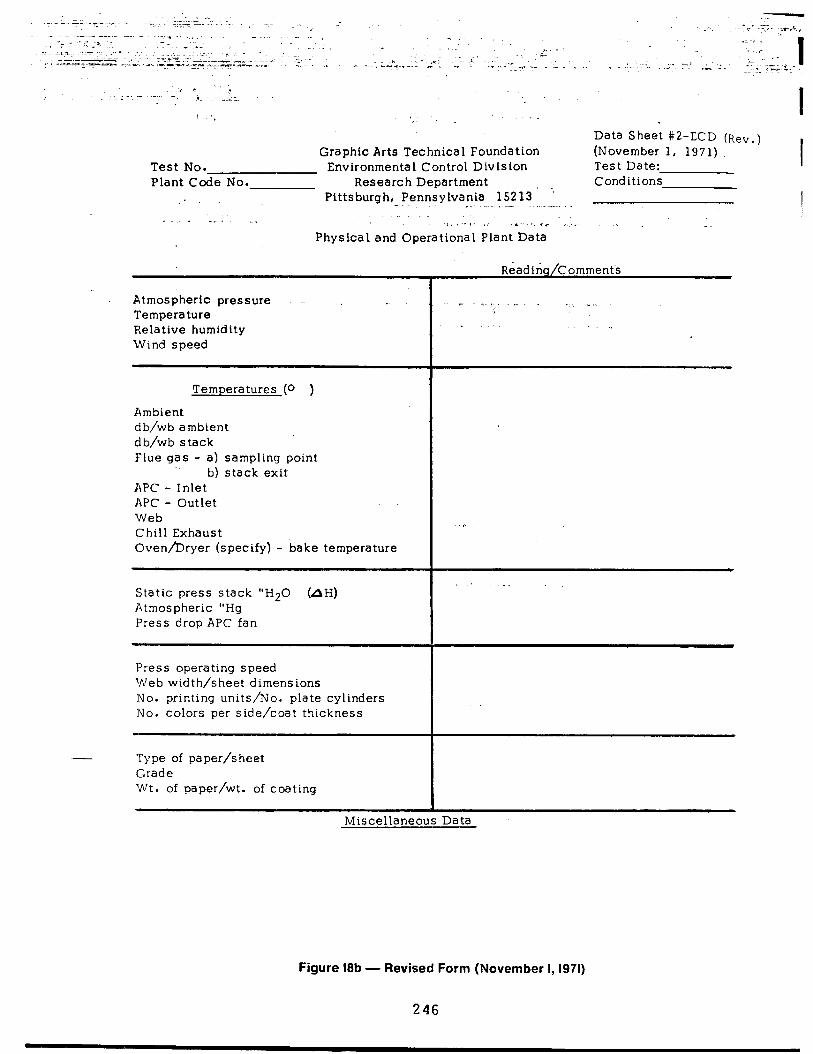
Test No. Plant Code No.
:
Data Sheet #2-ECD (Rev.) Graphic Arts Technical Foundation (November 1, 1971)
Environmental Control Division Test Date: I
Research Department, Conditions Pittsburgh, Pennsylvania 15213 Y --~. __ - -- -... , -_. . 1
I
.‘. , -4 .- .* I_ 7. _. .I _ . .
Physical and Operational Plant Data
Atmospheric pressure Temperature Relative humidity Wind speed
Temperatures (o )
Ambient cib/wb ambient cl b/wb stack Flue gas - a) sampling point
b) stack exit APC - Inlet APC - Outlet \Neb Chill Exhaust Oven/Dryer (specify) - bake temperature
Static press stack “H20 (AH) Atmospheric “Hg Press drop APC fan
Press operating speed Web width/sheet dimensions No. printing units/No. plate cylinders No. colors per side/coat thickness
‘Type of paper/sheet Grade wt. of paper/wt. of coating
R&adi&/Comment%
- ---. r. ,- . _; I_;
. .I
-. .
Miscellaneous Data
Figure 18b - Revised Form (November I, 1971)
246
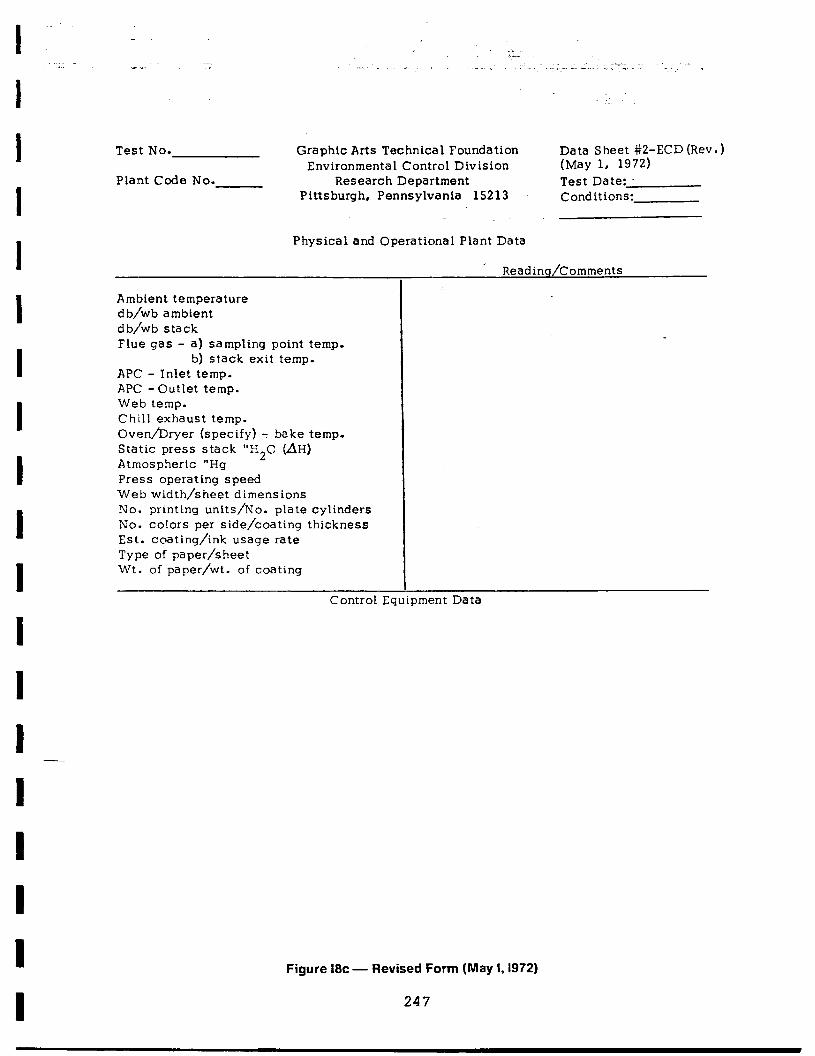
Test No.
Plant Code No.
Graphic Arts Technical Foundation Data Sheet #2-ECD (Rev. ) Environmental Control Division (May 1, 1972)
Research Department Test Date: Pittsburgh, Pennsylvania 15213 Conditions:
I
Physical and Operational Plant Data
Reading/Comments I
I
I
Ambient temperature db/wb ambient db/wb stack Flue gas - a) sampling point temp.
b) stack exit temp. APC - Inlet temp. APC - Outlet temp. Web temp. Chill exhaust temp. Oven/Dryer (specify) -: bake temp. Static press stack “H20 (AH) Atmospheric “Hg Press operating speed Web width/sheet dimensions No. printing units/No. plate cylinders No. colors per side/coating thickness Est. coating/ink usage rate Type of paper/sheet Wt. of paper/wt. of coating
Control Equipment Data
I
Figure 18~ - Revised Form (May I,19721
247
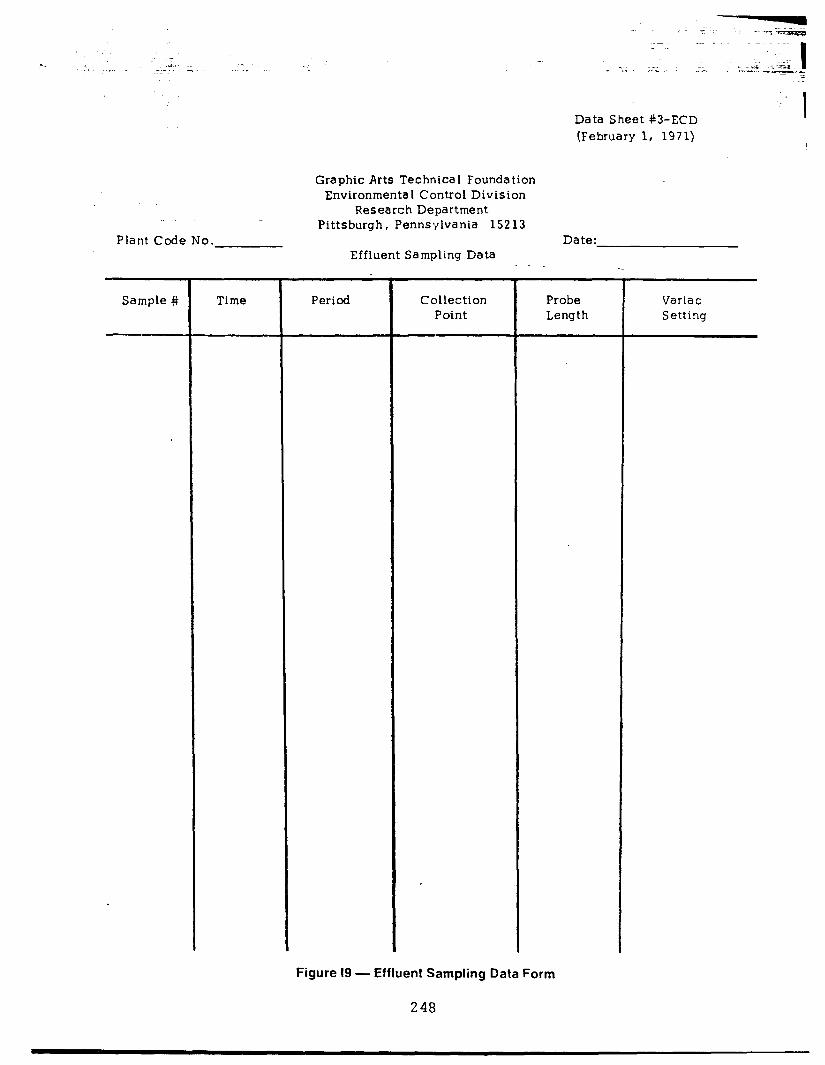
Data Sheet f3-ECD (February 1, 1971)
Plant Code No.
Graphic Arts Technica 1 Foundation Environmental Control Division
Research Department Pittsburgh, Pennsylvania 152 13
Date: Effluent Sampling Data
Sample # Time Period Collection Point
Probe Length
Variac Setting
Figure I9 - Effluent Sampling Data Form
248

1 t t I t I I t I I I I I I I I I I
Plant Code No.
Sample # Time
Graphic Arts Technical Foundation Environmental Control Division
Research Department Pittsburgh, Pennsylvania 15213
Data Sheet #3-ECD (Rev) (July 1, 1971)
Effluent Sampling Data Date:
Period Probe Zonfiguration
Comments
Figure 19a - Revised Form (July I, 1971)
249
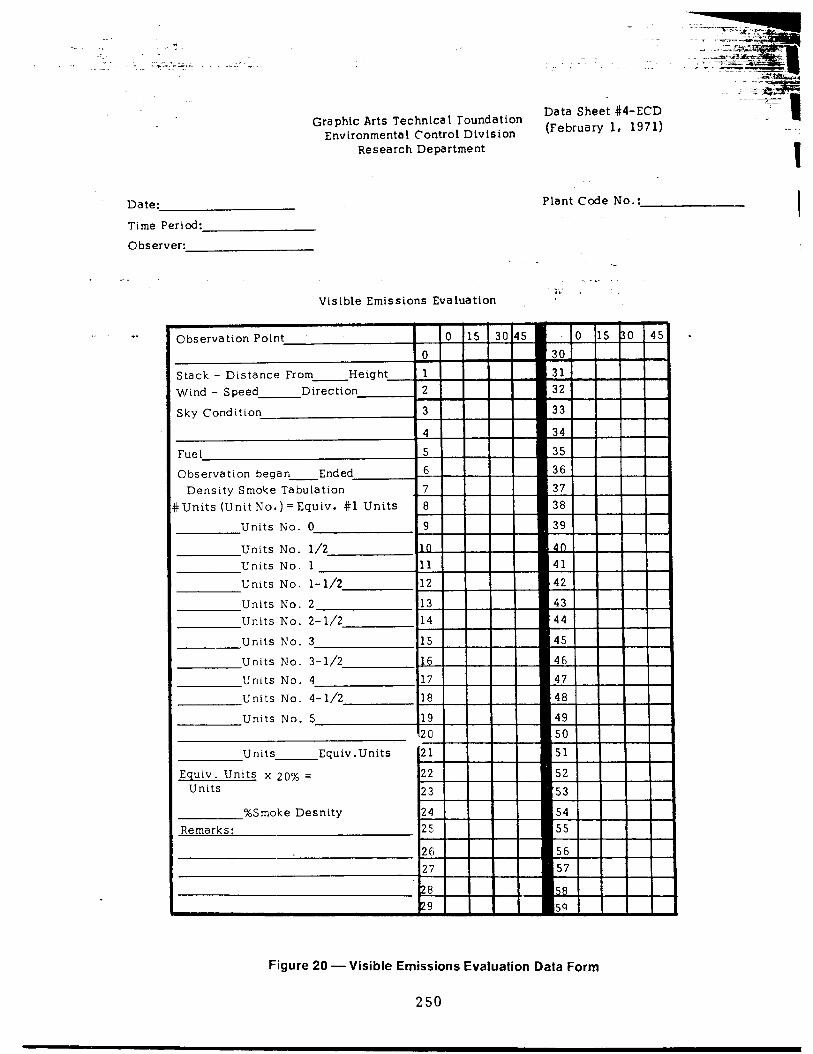
Graphic Arts Technical Foundation Data Sheet #4-ECD
Environmental Control Division (February 1, 1971)
Research Department
Date: Plant Code No.:
Time Period:
0 bserver:
Visible Emissions Evaluation
Observation Point
Stack - Distance From Height Wind - Speed Direction
Sky Condition
Fuel Observation began -Ended
Density Smoke Tabulation IUnits (UnitNo.)=Equiv. #l Units
Units No. 0
Units No. l/2 Units No. 1 Units No. l-1/2
Units No. 2 Units No. 2-l/2
Units No. 3
Units No. 3-l/2 Units No. 4 Units No. 4-l/2
Units No. 5
Units Equiv .Units
Equiv. Units x 20% = Units
%Smoke Desnity Remarks:
27
,”
31
m
32
33
.!]
Figure 20 - Visible Emissions Evaluation Data Form
250
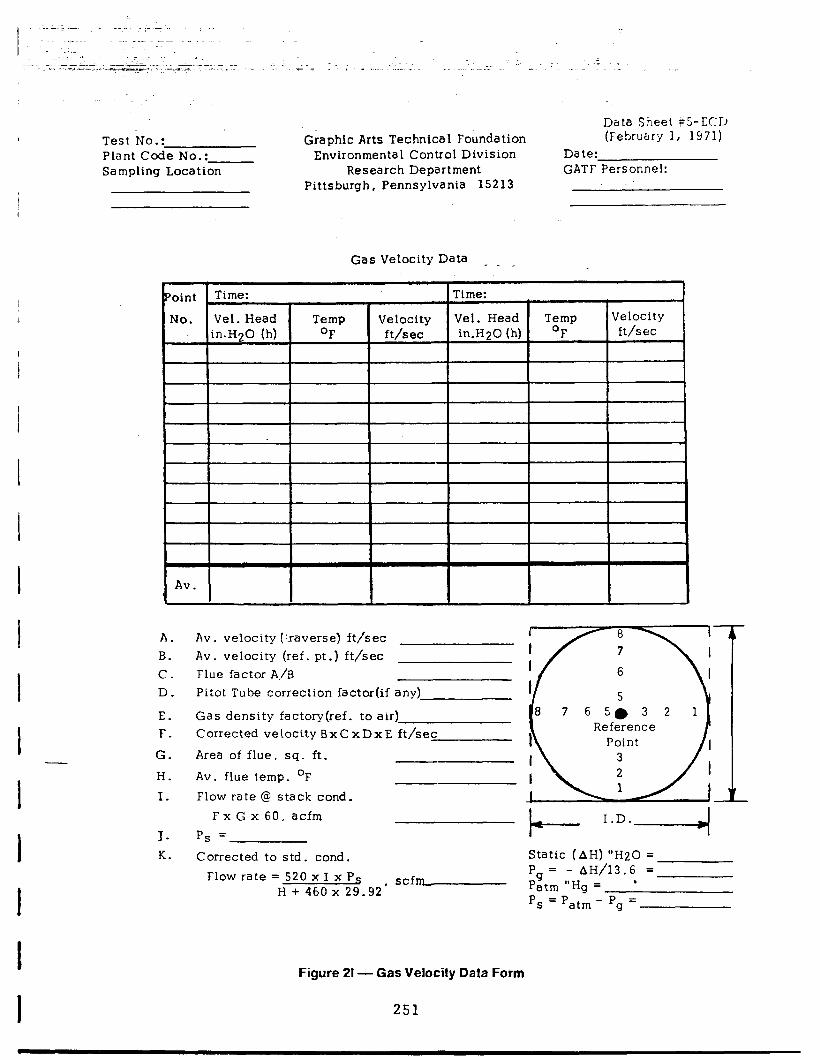
Test IJo.: Plant Code No.: Sampling Location
Graphic Arts Technical Foundation Environmental Control Division
Research Department Pittsburgh, Pennsylvania 15213
Data Sheet e5-CC:D (February 1, 1971)
Date: GATF Personnel:
Gas Velocity Data
A. B. C. D.
E. F.
G.
H.
I.
T- K.
Av. velocity (:.raverse) ft/sec Av. velocity (ref. pt.) ft/sec Flue factor A/B Pitot Tube correction factor(if any) - Gas density factory(ref. to air) Corrected velocity BxCxDxE ft/sec
Area of flue, sq. ft.
Av. flue temp. OF
Flow rate @ stack cond. FxGx60. acfm
P, =
Corrected to std. cond. Flow rate = 520 x I x Ps , scfm,
H + 460 x 29.92
Figure 21- Gas Velocity Data Form
Reference Reference
}= I.D. 4
Static (AH) “H20 = Pg = - AH/13.6 = Patm “Hg = l
P, = Patm - Pg =
~ 251
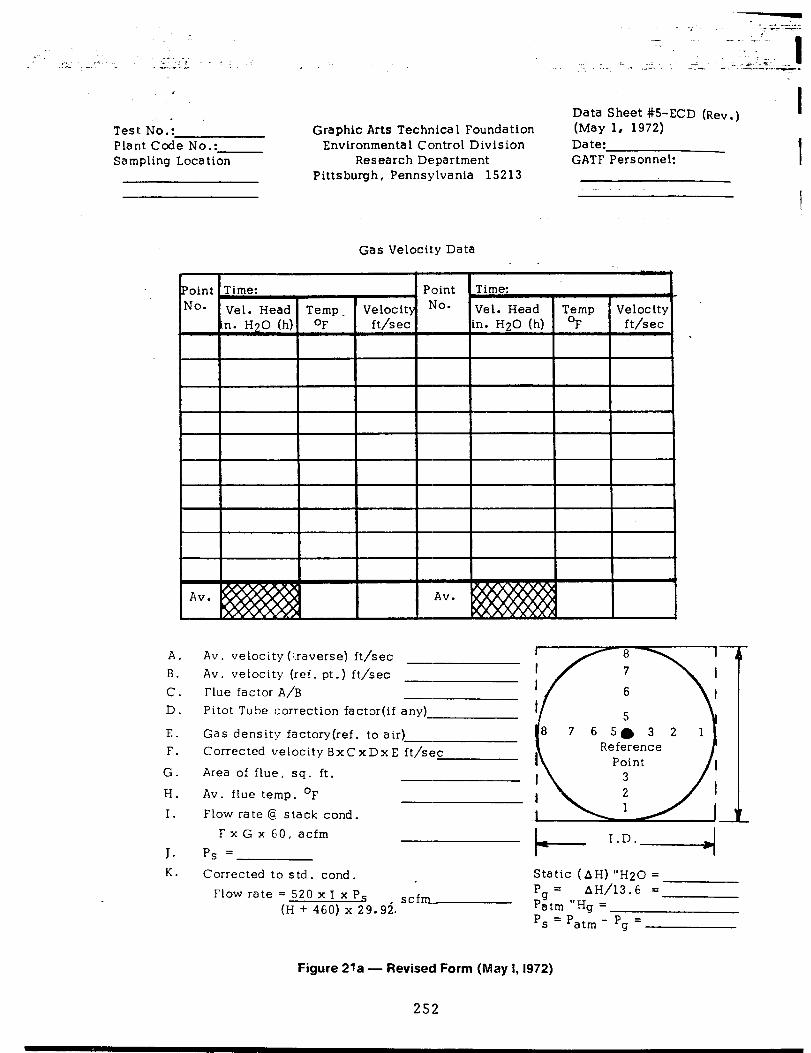
Test No.: Plant Code No.: Sampling Location
A. B. C. D.
E. F.
G.
H. I.
J. K.
Data Sheet #5-ECD (Rev.) I Graphic Arts Technical Foundation (May 1, 1972)
Environmental Control Division Date: Research Department GATF Personnel: I
Pittsburgh, Pennsylvania 15213
I
Gas Velocity Data - _
* ?oint Time: Point Time: No. Vel. Head Temp _ Velocity No. Vel. Head Temp Velocity ’
.n. H20 (h) OF ft/sec in. H20 (h) OF ft/sec
Av. velocity (:.raverse) ft/sec Av. velocity (ref. pt.) ft/sec Flue factor A/B Pitot Tube correction factor(if any)
Gas density factory(ref. to air) Corrected velocity BxCxDxE ft/sec
Area of flue, sq. ft.
Av. flue temp. OF Flow rate @ stack cond.
765.32 1 Reference
FxGx 60, acfm
ps =- Corrected to std. cond.
Flow rate = 520 x I x P, (H + 460) x 29.92. scfm
c; I.D. 4
Static (AH) “H20 = Pg = AH/13.6 = Patm “Hg = P, = Patm - Pg =
Figure 21 a - Revised Form (May I, 1972)
252
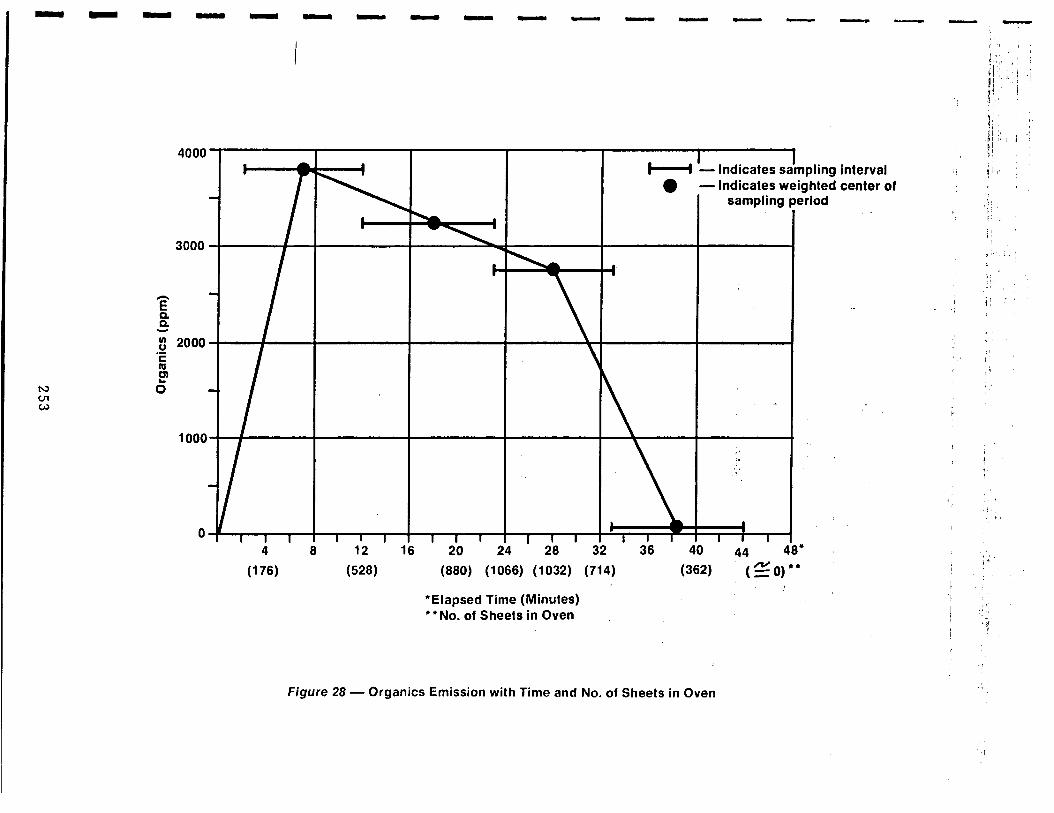
PJ cn w
4000
3000
f B V g 2000 au ii F 0
lOO(
0
- indicates weighted center of 1 pfing interval
sampling sriod
4 8 12 16 20 24 28 32 38 40 44 ’
(176) 628) (880) (1066) (1032) (714) (362) (go)”
“Elapsed Time (Minutes) **No. of Sheets in Oven
Figure 28 - Organics Emission with Time and No. of Sheets in Oven
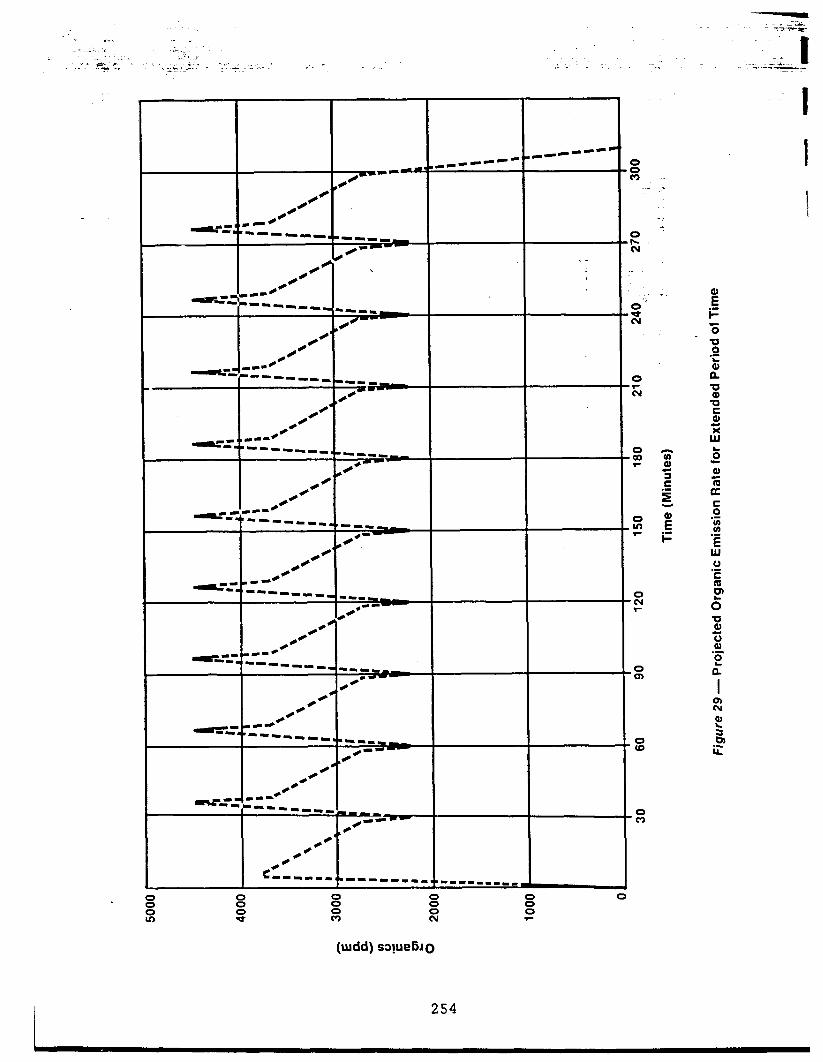
------ /+
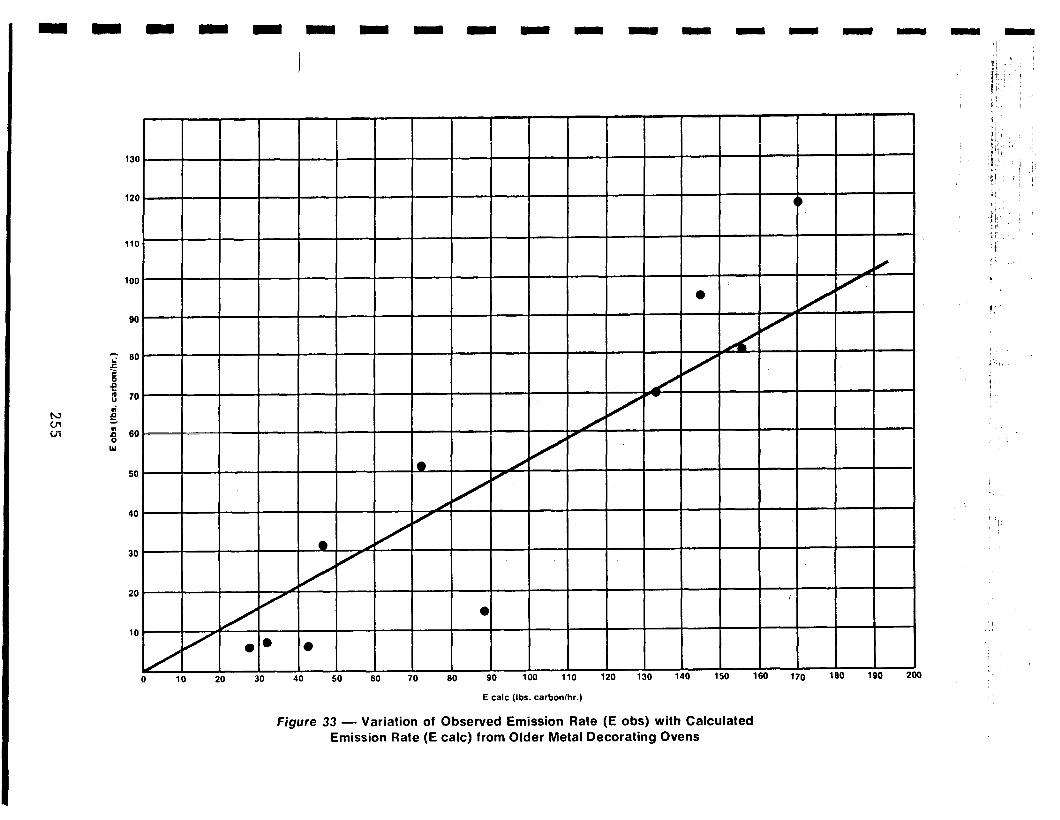
:, ,,
i :1
E talc (Ibs. carbonlhr.)
Figure 33 - Variation of Observed Emission Rate (E obs) with Calculated Emission Rate (E talc) from Older Metal Decorating Ovens
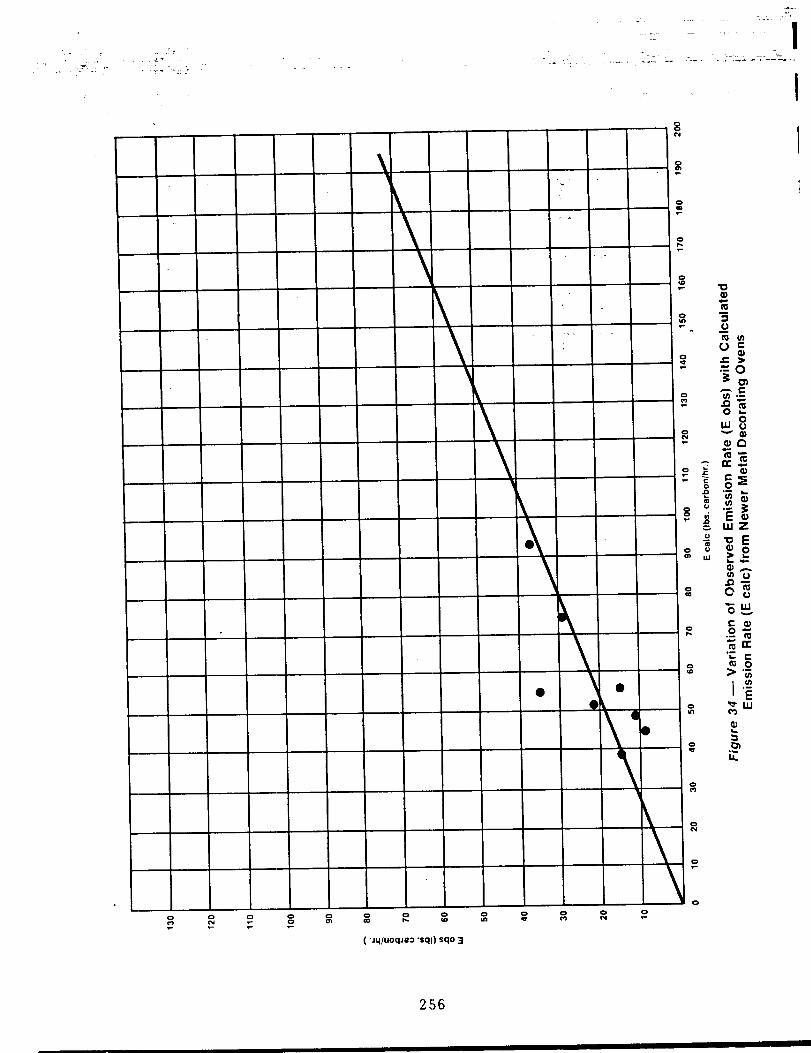
( ‘Jq/uoqJe3 ‘sql) sqo 3
256
APPENDIX C Tables
257
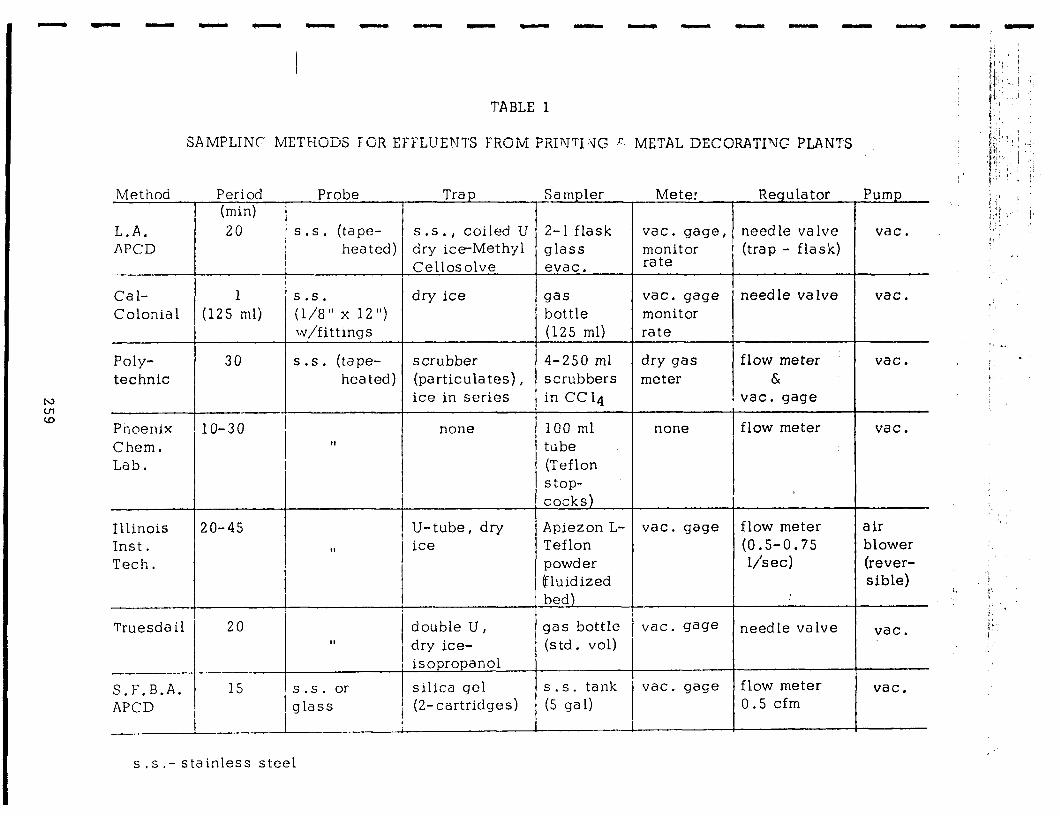
Ca l- Colonia 1 (I25Iml)
s .s, dry ice (l/8” x 12”) w/fittings
Poly- 30 s .s. (tape- scrubber technic hea ted) (particula tes) ,
ice in series
Phoenix lo-30 ! none Chem. 1
II
Lab. I
Illinois 20-45 Inst.
! U-tube, dry
1 II
/ ice
Tech.
-:-~~~-.~
-__
s . s .- stainless steel
Sampler T Mete: Regulator Pump I I
2-l flask vat. glass
gage, 1 needle va lve vat. monitor (trap - flask)
evac. rate I
gas bottle (125 ml)
vat. gage needle valve vat. monitor rate
4-250 ml scrubbers in CC14
dry gas flow meter vat. meter &
, vat. gage
100 ml tube (Teflon stop- cocks)
none I , flow meter ) vat.
Apiezon L- Teflon powder gluidized bed)
gas bottle (std. vol)
flow meter 1
vat. gage air (0.5-0.75 blower l/set) (rever-
sible) I I I
S.S. tank (5 gal)
vat. gage needle va lve vat.
vat. gage flow meter vat. 0.5 cfm
. .
I L
‘/

s
260
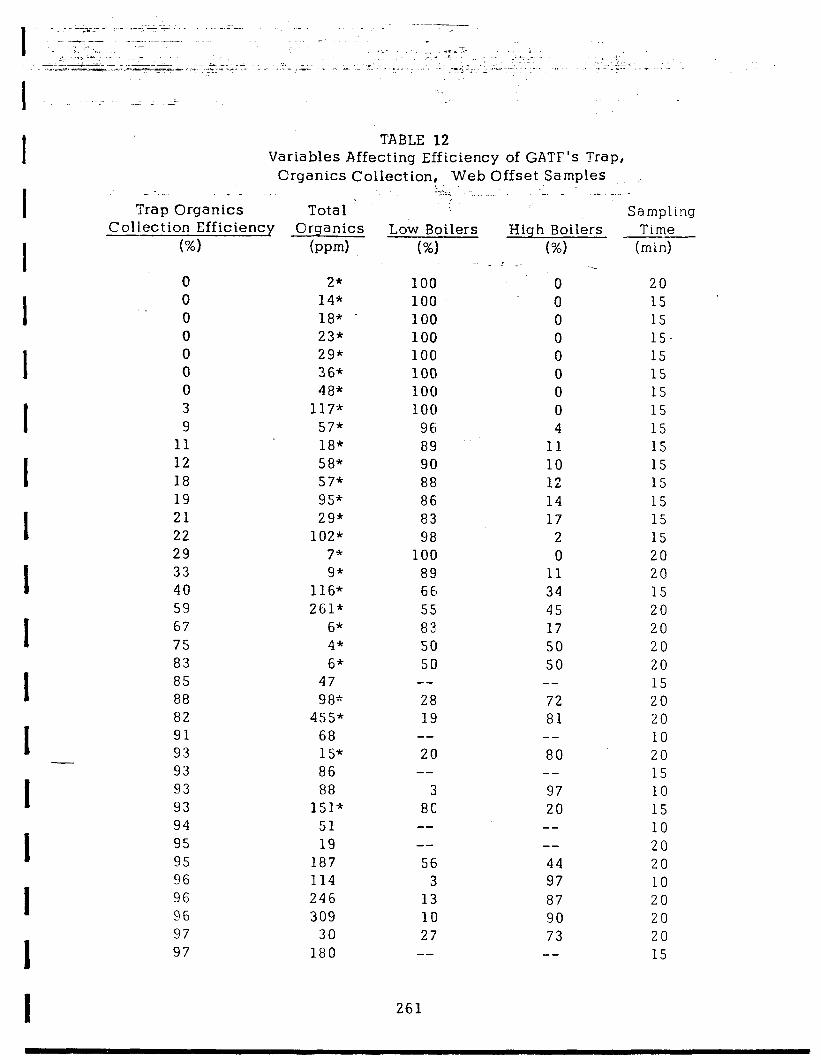
TABLE 12 Variables Affecting Efficiency of GATF’s Trap,
Organics Collection, Web Offset Samples . . _ -_ ._ -
Trap Organics Total ’ Coll.ection Efficiency Organics
(W bpm)
- . . .- -.. _
Sampling
0 2” 0 14” 0 18* - 0 23* 0 29” 0 36” 0 48” 3 117* 9 57*
11 18* 12 58” 18 57* 19 95* 21 29” 22 102* 29 7* 33 9* 40 116* 59 261* 67 6* 75 4* 83 6* 85 47 88 98” 82 455* 91 68 93 15* 93 86 93 88 93 151* 94 51 95 19 95 187 96 114 96 246 96 309 97 30 97 180
Low Boilers High Boilers Time &) (%I (min)
- s
100 100 100 100 100 100 100 1 OCI
96 89 9 0 88 8 6 83 98
100 89 6 6 55 83 50 50
-- -... 0 0 0 0 0 0 0 0 4
11 10 12 14 17
2 0
11 34 45 17 50 50
-- -- 28 72 19 81
-- -- 20 80
-- -- 3 97
801 20 -- -- -- -- 56 44
3 97 13 87 10 90 27 73
-- --
261
20 15 15 15- 15 15 15 15 15 15 15 15 15 15 15 20 20 15 20 20 20 20 15 20 20 10 20 15 10 15 10 20 20 10 20 20 20 15
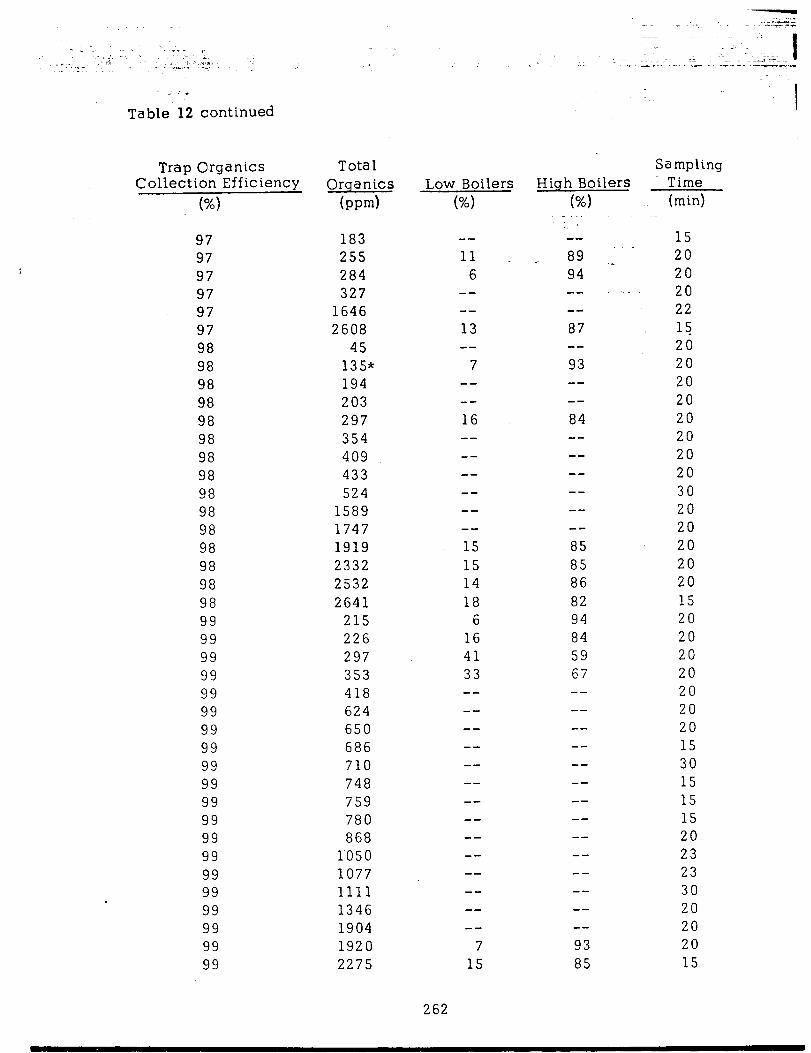
: *
Table- 12 continued
Trap Organics Collection Efficiency
(%I
97 183 -- 97 255 11 _ 97 284 6 97 327 -- 97 1646 -- 97 2608 13 98 45 -- 98 135” 7 98 194 -- 98 203 -- 98 297 16 98 354 -- 98 409 -- 98 433 -- 98 524 -- 98 1589 -- 98 1747 -- 98 1919 15 98 2332 15 98 2532 14 98 2641 18 99 215 6 99 226 16 99 297 41 99 353 33 99 418 -- 99 624 -- 99 650 -- 99 686 -- 99 710 -- 99 748 -- 99 759 -- 99 780 -- 99 868 -- 99 1050 -- 99 1077 -- 99 1111 -- 99 1346 -- 99 1904 -- 99 1920 7 99 2275 15
. *
Total Organics
b-d Low Boilers
w
262
High Boilers (%I
--
89 ._ 94 -- . -- 87 -- 93 -- -- 84 -- -- -- -- -- -- 85 85 86 82 94 84 59 67 -- -- -- -- -- -- -- -- -- -- -- -- -- -- 93 85
Sampling Time (min)
15 20 20 20 22 15 20 20 20 20 20 20 20 20 30 20 20 20 20 20 15 20 20 20 20 20 20 20 15 30 15 15 15 20 23 23 30 20 20 20 15
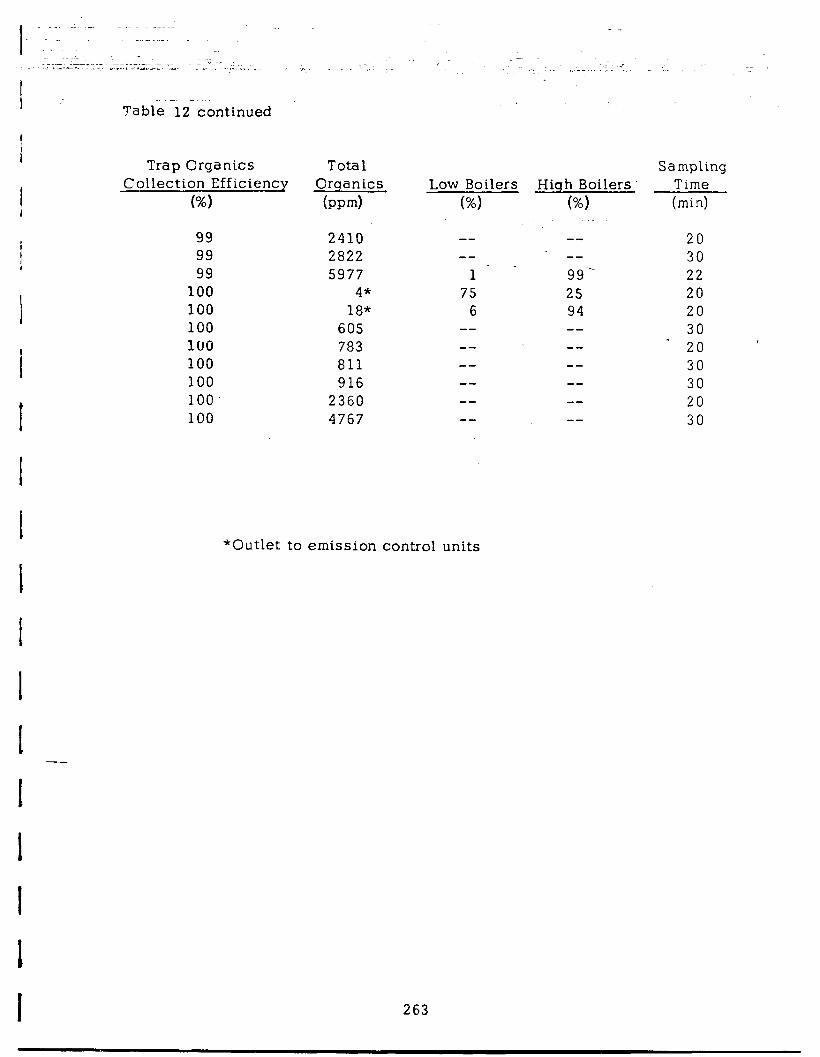
t 1 Trap Organics
Collection Efficiency - (%I
I 99 99 4 99
I 100 100 100
I 100 100 100
I 100 100
Total Orqanics
(w-d
2410 2822 5977
4* 18*
605 783 811 916
2360 4767
Low Boilers High Boilers (%I (%I
-- -- -- --
1. - 99 -- 75 25
6 94
-- --
*Outlet to emission control units
Sampling Time (min)
20 30 22 20 20 30 20 ’ 30 30 20 30
263
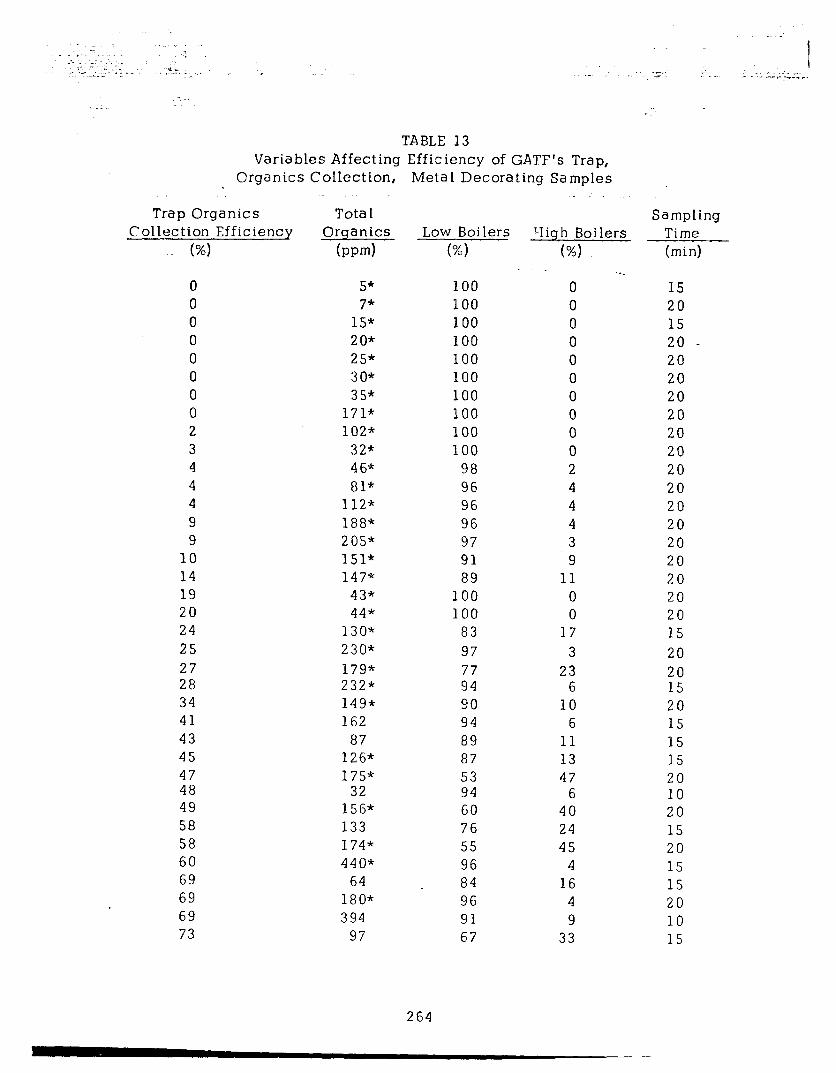
TABLE 13 Variables Affecting Efficiency of GATF’s Trap,
. Organics Collection, Meta 1 Decorating Samples _
Trap Organics Gollection Efficiency
(%I
Tota I Orqanics
(pw-4 Low Boilers
(%I Yigh Boilers
(%I
Sampling Time (min)
0 5* 100 0 - 15 0 7* 100 0 20 0 15* 100 0 15 0 20* 100 0 20 - 0 25* 100 0 20 0 30* 100 0 20 0 35* 100 0 20 0 171” 100 0 20 2 102* 100 0 20 3 32* 100 0 20 4 46” 98 2 20 4 81* 96 4 20 4 132” 96 4 20 9 188-k 96 4 20 9 205” 97 3 20
10 151” 91 9 20 14 147% 89 11 20 19 43* 100 0 20 20 44* 100 0 20 24 130” 83 17 15 25 230* 97 3 20 27 179* 77 23 20 28 232* 94 6 15 34 149* 90 10 20 41 162 94 6 15 43 87 89 11 15 45 126” 87 13 15 47 175* 53 47 20 48 32 94 6 10 49 156* 60 40 20 58 133 76 24 15 58 174* 55 45 20 60 440* 96 4 15 69 64 84 16 15 69 180* 96 4 20 69 394 91 9 10 73 97 67 33 15
264
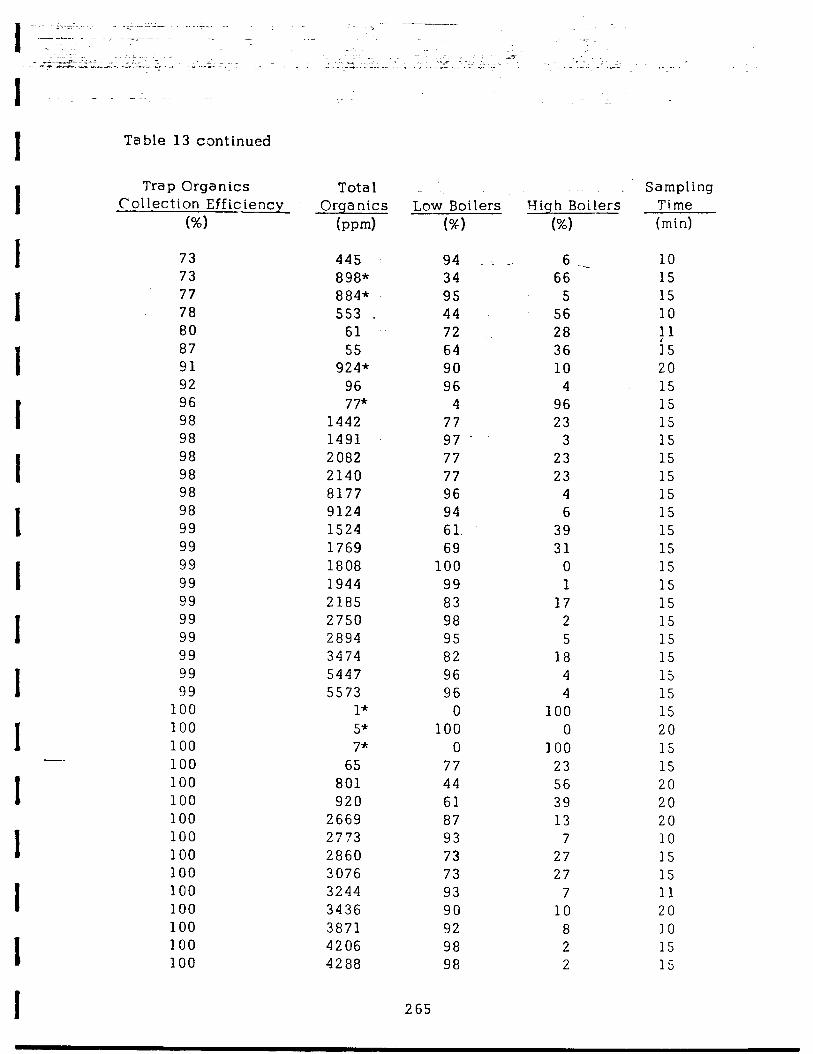
Table 13 continued
Trap Organics Tota 1 Collection Efficiency Orga nits
(%I (pm-d
73 73 77 78 80 87 91 92 96 98 98 98 98 98 98 99 99 99 99 99 99 99 99 99 99
100 100 100
-.. 100 100 100 100 100 100 100 100 100 100 100 100
445 94 _. 6 898* 34 66 884* 95 5 553 . 44 56
61 72 28 55 64 36
924* 90 10 96 96 4 77* 4 96
1442 77 23 1491 97. 3 2082 77 23 2140 77 23 8177 96 4 9124 94 6 1524 61 39 1769 69 31 1808 100 0 1944 99 1 2185 83 17 2750 98 2 2894 95 5 3474 82 18 5447 96 4 5573 96 4
1* 0 100 5" 100 0 7* 0 100
65 77 23 801 44 56 920 61 39
2669 87 13 2773 93 7 2860 73 27 3076 73 27 3244 93 7 3436 90 10 3871 92 8 4206 98 2 4288 98 2
Low Boilers (“/cl
265
Sampling High Boilers Time
(%I (min)
10 15 15 10
P 15 20 15 15 15 15 15 15 15 15 15 15 15 15 15 15 15 15 15 15 15 20 15 15 20 20 20 10 15 15 11 20 10 15 15
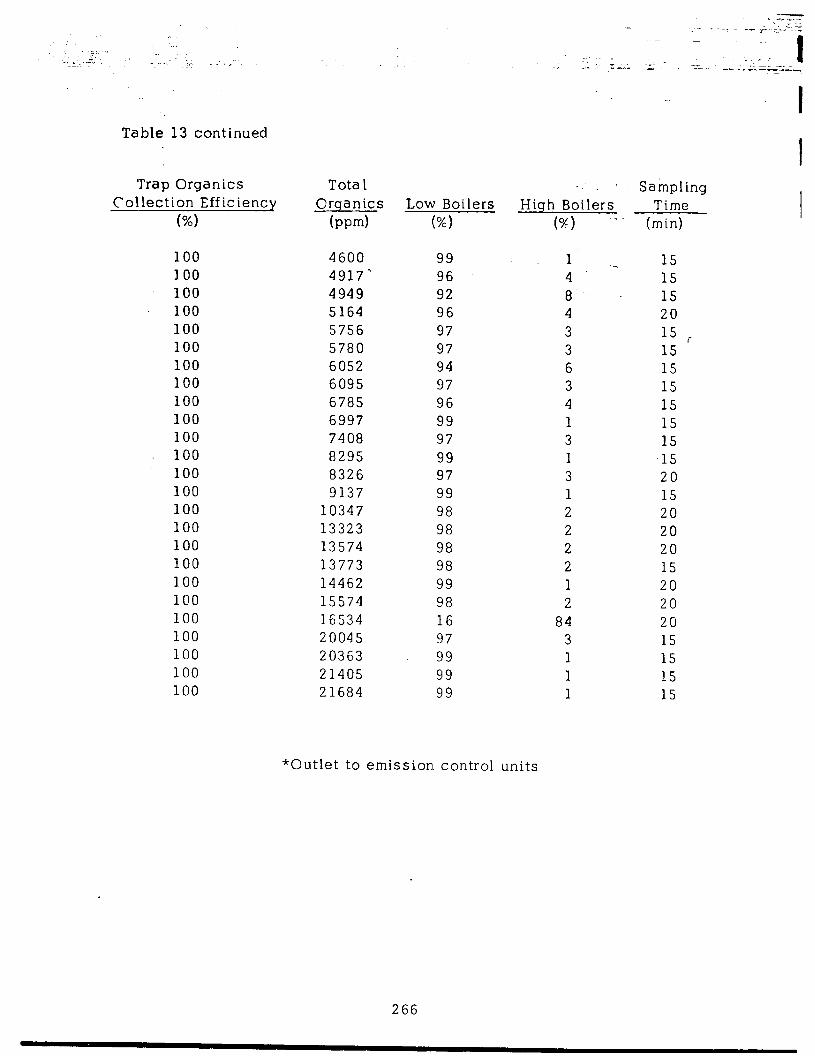
Table 13 continued
Trap Organics Tota 1 : . Sampling Collection Efficiency Orqanics Low Boilers Hiqh Boilers Time
(%I kwd I%) (%) 1 (min)
100 4600 99 100 4917 * 96 100 4949 92 100 5164 96 100 5756 97 100 5780 97 100 6052 94 100 6095 97 100 6785 96 100 6997 99 100 7408 97 100 8295 99 100 8326 97 100 9137 99 100 10347 98 100 13323 98 100 13574 98 100 13773 98 100 14462 99 100 15574 98 100 16534 16 100 20045 97 100 20363 99 100 21405 99 100 21684 99
*Outlet to emission. con
1 -- 4 8. 4 3 3 6 3 4 1 3 1 3 1 2 2 2 2 1 2
84 3 1 1 1
15 15 15 20 15 i 15 15 15 15 15 15 15 20 15 20 20 20 15 20 20 20 15 15 15 15
rol units
266
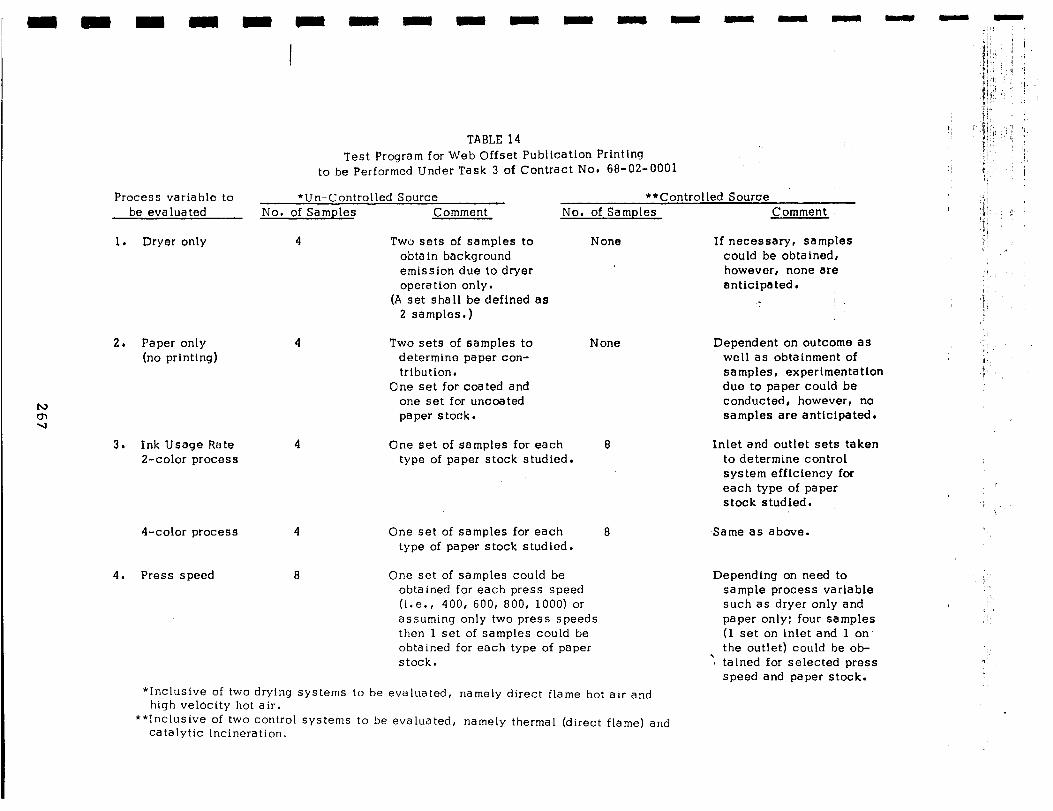
Process variable to *Un-Controlled Source be eva lua ted No. of Samples Comment
1. Dryer only 4 Two sets of samples to obtain background emission due to dryer operation only.
(A set shall be defined as 2 samples.)
2, Paper only (no printing)
3. Ink Usage Rate Z-color process
4-color process
4. Press speed
4 Two sets of samples to determine paper con- tribution.
One set for coated and one set for uncoated paper stock.
TABLE i4 Test Program for Web Offset Publication Printing
to be Performed Under Task 3 of Contract No. 68-02-0001
4
**Controlled Source No. of Samples Comment
One set of samples for each type of paper stock studied.
One set of samples for each type of paper stock studied.
One set of samples could be obtained for each press speed (i.e., 400, 600, 800, 1000) or
None If necessary, samples could be obtained, however, none are anticipated.
1
None Dependent on outcome as well as obtainment of samples, experimentatlon due to paper could be conducted, however, no samples are anticipated.
8 Inlet and outlet sets taken to determine control system efficiency for each type of paper stock studied.
8 Same as above.
Depending on need to sample process variable such as dryer only and paper only: four samples (1 set on inlet and 1 on’ the outlet) could be ob-
: tained for selected press speed and paper stock.
assuming only two press speeds then 1 set of samples could be obtained for each type of paper stock.
*Inclusive of two drying systems to be evaluated, namely direct flame hot air and high velocity hot air.
**InC[USiVe Of two Control systems to be evaluated, namely thermal (direct flame) and catalytic incineration.
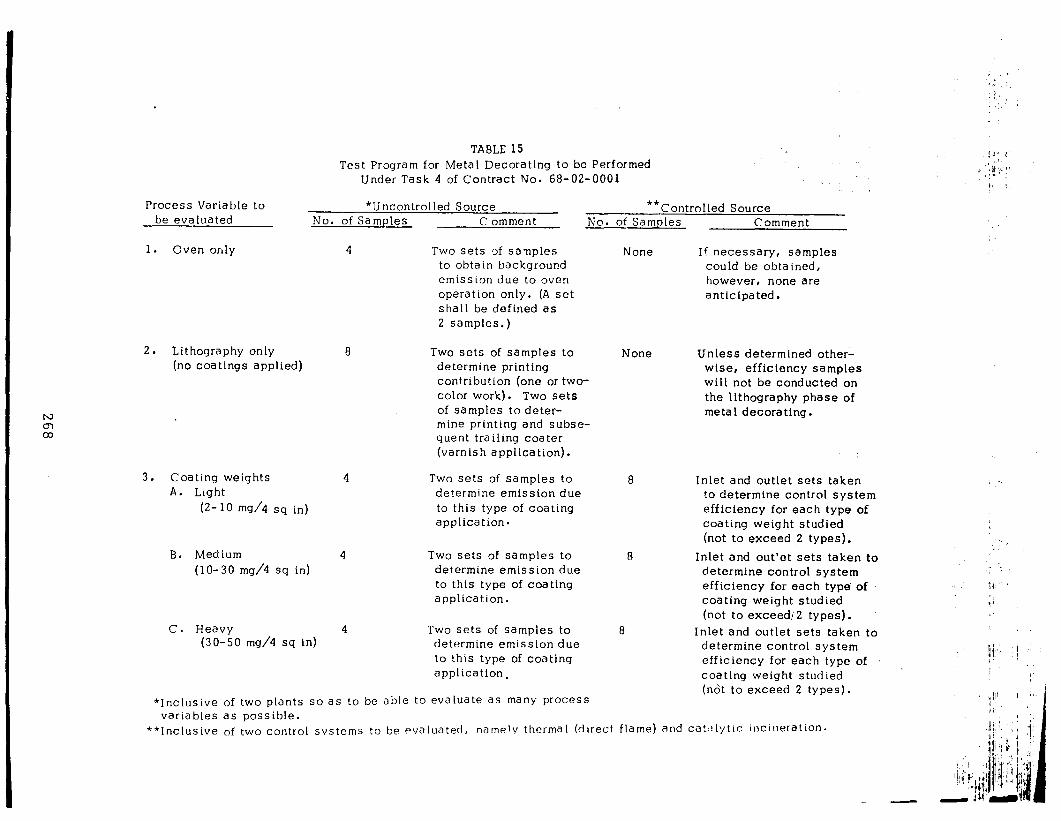
TABLE 15 Test Program for Metal Decorating to be Performed
Under Task 4 of Contract No. 68-02-0001
Process Variable to *Uncontrolled Source be eva lua ted No. of Samples Comment
**Controlled Source No. of Samples Comment
2. Lithography only 8 (no coatings applied)
3. Coating weights A. Light
(2- 10 md4 sq in)
B. Medium 4 Two sets of samples to (lo-30 mg/4 sq in) determine emission due
to this type of coating application.
C. Heavy 4 (30-50 mg/4 sq in)
Two sets of samples to determine emission due to this type of coating application.
1. Oven only 4 Two sets c>f sa-nples to obtain background emission due to oven operation only. (A set shall be defined as 2 samples,)
None If necessary, samples could be obtained, however, none are anticipated.
Two sets of samples to determine printing contribution (one or two- color work). Two sets of samples to deter- mine printing and subse- quent traiiing coater (varnish application).
None Unless determined other- wise, efficiency samples will not be conducted on the lithography phase of meta I decorating .
Two sets of samples to determine emission due to this type of coating application.
*Inclusive of two plants so as to be able to evaluate as many Process variables as possible.
Inlet and outlet sets taken to determine control system efficiency for each type of coating weight studied (not to exceed ‘2 types).
8 Inlet and out’et sets taken to determine control system efficiency for each type of coating weight studied (not to exceed: 2 types).
8 Inlet and outlet sets taken to determine control system efficiency for each type of coating weight studied (not to exceed 2 types).
**Inclusive of two control svstems to be evaluated, namely thermal (direct flame) and catdlytrc incrneration.
,-
APPENDIX D Data Sheets
Web Offset Plants
269
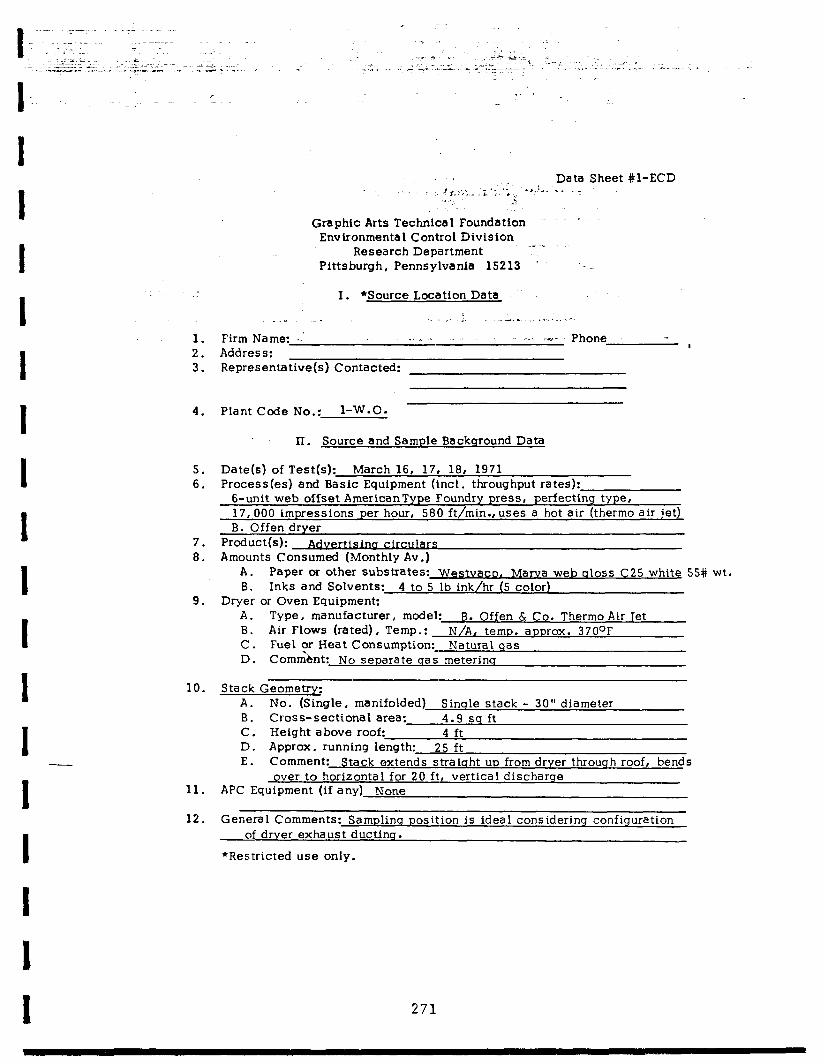
1. 2. 3.
4. Plant Code No.: 1-W.O. -
5. 6.
7. 8.
9.
10.
11.
12.
Data Sheet #l-ECD F ..‘.P.’ .,.L il _ ” ,,,.,-.L ,. A,_ r #- i * Ij 2
Graphic Arts Technical Foundation Environmental Control Division
Research Department d-S- Pittsburgh, Pennsylvania 15213 ’
I. *Source Location Data
__., . . . ,. :. ~...A ..__ _i _._.. _...
Firm Name: -’ .,.* .- ^_,, ,.,... Phone Address:
I
Representative(s) Contacted: -
II. Source and Sample Background Data
Date(s) of Test(s): March 16, 17, 18, 1971 Process(es) and Basic Equipment (tncl. throughput rates):
6-unit web offset AmericanType Foundry press, perfecting type, 17,000 impressions per hour, 580 ft/min.,uses a hot air (therm0 air jet) B. Offen dryer . . PrOdUCt( A&m ClrCu&s
Amounts Consumed (Monthly Av.) A. Paper or other SubStrateS: Westvaco. Marva web aloss C25 white 55# wt. B. Inks and Solvents: 4 to 5 lb ink/hr (5 color)
Dryer or Oven Equipment: A. Type, manufacturer, model: B. Offen & Co. Therm0 Air Tet B. Air Flows (rated), Temp.: N/A, temp. aoprox. 370°F C. Fuel or Heat Consumption: Natural gas D. Comr&nt: No separate qas meterinq
Stack Geometry: A. No. (Single, manifolded) Sinqle stack - 30” diameter B. Cross-sectional area: 4.9 sq ft C. Height above roof: 4 ft D. Approx. running length: 25 ft E. Comment: Stack extends straiqht up from drver throuqh roof, bends
over to horizontal for 20 ft, vertical discharge APC Equipment (if any) None
General Comments: Sampling position is ideal considering configuration of dryer exhaust ductinq.
*Restricted use only.
271

Graphic Arts Technical Foundation Environmental Control Division
Test No.: 1 Plant Code No.:
Research Department 1-w-o. Pittsburgh, Pennsylvania 15213
Test
Physical
Atmospheric Press Temperature iielative Humidity Wind Speed
Plant area 4, I,
_
nd Operational Plant Datt
Reading
29.20 72OF
I- 50% Westerly 15-20 mp
Ambient Temp. db/wb ambient db/wb stack Flue Gas stack a) sampl. pt., b)exit
APC - Inlet
APC - Outlet Web Chill Exhaust Oven/Dryer (specify)- Bake Temp.
4 l°F so/Lo
91/76 250-275
315oF . 6S°F
375oF
Static Press Stack “H20 ( AH) Atmospheric “Hg Press Drop APC Fan
5.0 28.~40
Press Operating Speed 580 ft/min, 17,000 iph Web width/sheet dim 28” (1 web) # Printing Units/# Plate cyt. 5 (perfecting) # Colors per side/coat thickness 5 per side
-- Type of Paper/Sheet Grade Wt. of Paper
Coated
Gloss white 55#
Ink consumption (% coverage) Duration of Run
Color of Ink Passes thru Drier Gas Meter Start Reading to Drier End Fan (H.P.)
4-5 lbfi (approx.) Continuous, several da, 5 colors (see att. sheet
One
Data Sheet #2-ECD
Test Date: March 16, 1971 Conditions: S-color
l-Web
Time 1:oo pn
1:40pn
perfecting
Comments
Overcast intermittent
snow f Lurries
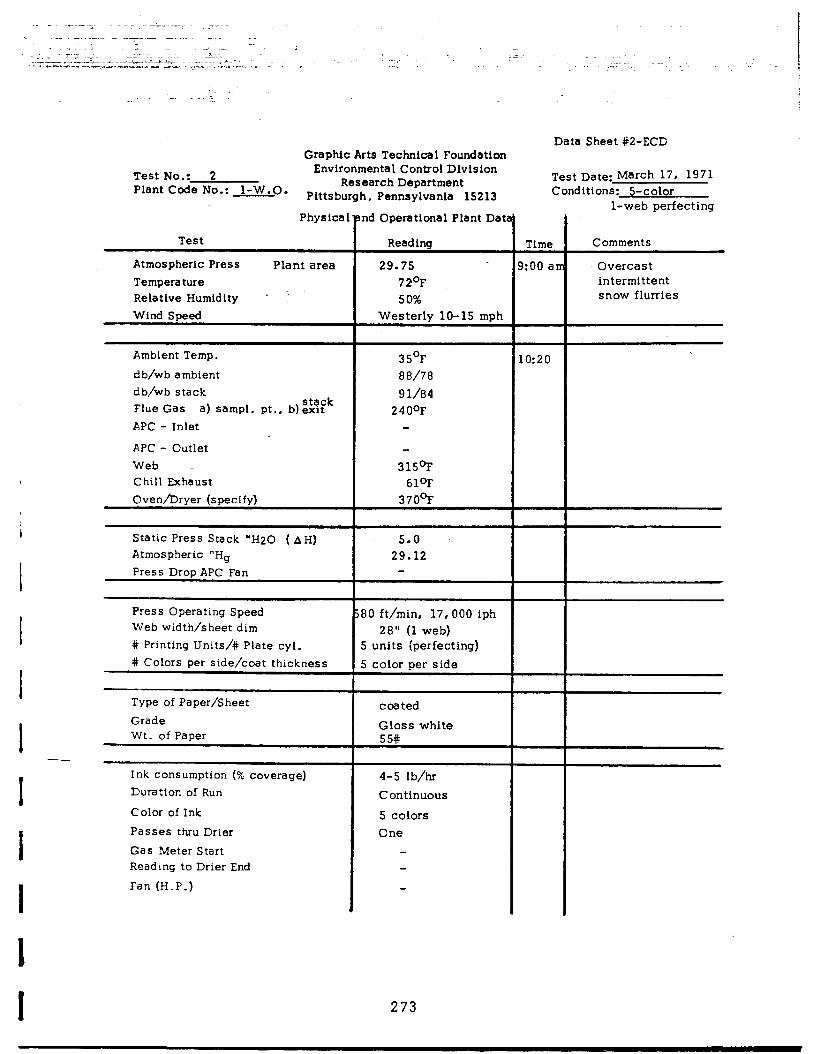
-. ‘5.
Graphic Arts Technical Foundation Data Sheet #2-ECD
I __ I I
Test No.: 2 Environmental Control Division
Plant Code No.: 1-W.O. Research Department
Pittsburgh, Pennsylvanla 15213
Test
Physlca!
Atmospheric Press Plant area Temperature Relative Humidity - Wind Speed
nd Operational Plant Dat
Reading
29.75 72OF 50%
Westerly lo-15 mph
Ambient Temp. db/wb ambient db/wb stack Flue Gas stack
a) sampl. pt., blexit APC - Inlet
APC - Outlet Web Chill Exhaust Cven/Dryer (specify)
3 5’F 88/78 91/84
2400F
315oF 61°P
37oq”
Static Press Stack “H2C (AH) Atmospheric “Hg Press Drop APC Fan
5.0 29.12
Press Operating Speed 30 ft/min, 17,000 iph Web width/sheet dim 28” (1 web) # Printing Units/# Plate cyl. 5 units (perfecting) # Colors per side/coat thickness 5 color per side
Type of Paper/Sheet Grade Wt. of Paper
coated Gloss white 55#
Ink consumption (% coverage) Duration of Run
Color of Ink Passes thru Drier Gas Meter Start Reading to Drier End Fan (H.P.)
4-5 Ib/hr Continuous
5 colors One
Test Date: March 17, I971 Conditions: S-color
Time Comments
kO0 ar Overcast intermittent snow flurries
LO:20
l-web perfecting
273
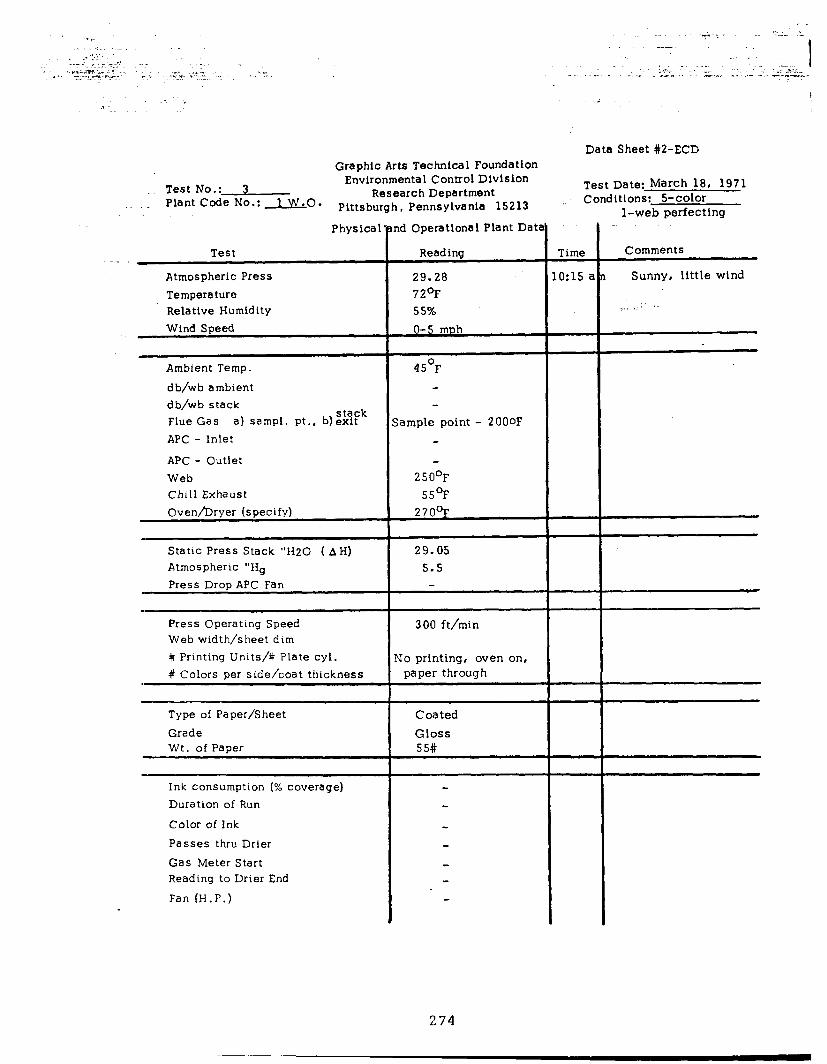
Graphic Arts Technical Foundatlon Environmental Control Dlvlsion
Test No.: 3 _ Plant Code No.: 1 W.0.
Research Department Pittsburgh, Pennsylvania 15213
Physical
Test ._ Atmospheric Press Temperature Relative Humidity Wind Speed
Ambient Temp. db/wb ambient db/wb stack Flue Gas
stack a) sampl. pt., b)exit
APC - Inlet
APC - Outlet Web Chill Exhaust Oven/Dryer (specify)
Static Press Stack “H20 (AH) Atmospheric “Hg Press Drop APC Fan
Press Operating Speed Web width/sheet dim # Printing Units/# Plate cyl. # Colors per side/coat thickness
Type of Paper/Sheet Grade Wt. of Paper
Ink consumption (% coverage) Duration of Run
Color of Ink Passes thru Drier Gas Meter Start Reading to Drier End
Fan (H.P.)
Id Operational Plant Dat?
Reading
29.28 72’F 55% O-5 mph
45’F
ample point - 200oF
250°F 55°F
270OF
29.05 5.S
300 ft/min
Jo printing, oven on, paper through
Coated Gloss 55#
Data Sheet #2-ECD
Test Date: March 18, 1971 ,. Conditions: S-color
Time
0:15 a
l-web perfecting
Comments
Sunny, little wind
_., . ‘.
;! 74
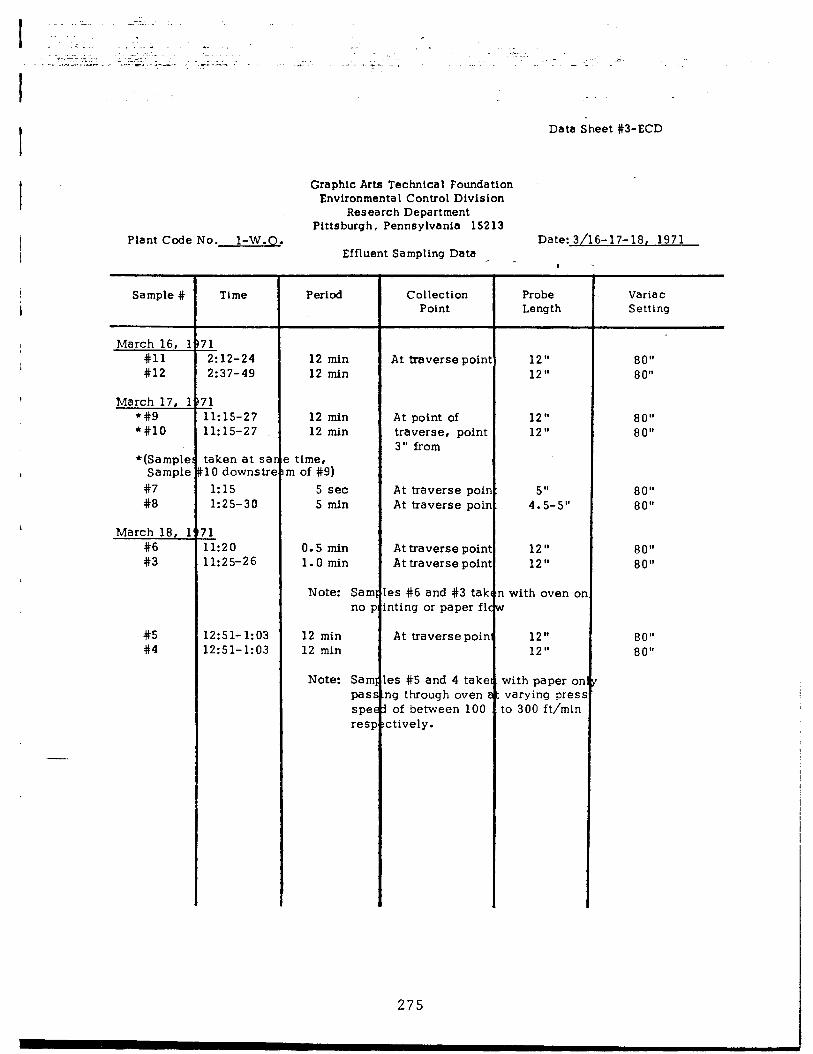
Data Sheet #3-ECD
Graphic Arts Techntcal Foundatlon Environmental Control Dlvlsion
Research Department Pittsburgh, Pennsylvania 15213
Plant Code No. l-W.O. Date: 3/16-17-18, 1971 Effluent Sampling Data
Sample # Time Period
March 16, I #ll #12
March 17, 1 *#9 *#lo
*(Sample Sample
#7 #8
March 18, 1 #6 #3
#5 2:51-1:03 12 min #4 2:51-1:03 12 min
!12-24 2137-49
1 1:15-27 1:15-27
aken at sar 0 downstre 1:15 1:25-30
1 1:20 1:25-26
12 min 12 min
12 min 12 min
! time, n of #9)
5 set 5 min
0.5 min At traverse poini 12 " 80" 1.0 min At traverse poinl 12" 80"
Note: Sam no F
es #6 and #3 tak nting or paper flc
I with oven o:
At traverse poin 12” 80" 12 ” 80"
Note: Sam pas! spec req
es #5 and 4 take lg through oven r of between 100
:tively.
with paper or varying pres :o 300 ft/min
Collection Probe Variac Point Length Setting
At traverse poinl
At point of traverse, point 3” from
At traverse poir 5" 80" At traverse poir 4.5-5" 80"
275
12” 80" 12 ” 80"
12 ” 80" 12 ” 80"

Sample No.
12
11
10
9
8
7
‘6
Coa tinq
S-color
S-color
S-color
S-color
5-color
S-color
Oven on No printing or paper flow
Paper only
Paper only
Oven on No printing or paper flow
*c.c. - Cal-Colonial M.I. - Mellon Instttute
DATA SHEET #3-ECD-A (Analytical results Ln ppm)
Organics Laboratory* CO
M.I. Nil
C.C. 13
M.I. Nil
C.C. 26
M.I. Nil
M-.1. Nil
M.I. Nil
M.I.
M.I.
M.I.
Nil
Nil
Nil
SE4 co, Cylinder
26 4859 4
Nil 5880 120
23 4470 4
13 6780 69
24 3845 6
24 4827 11
11 1082 Nil
Trap
134
149
111
140
62
24 1132 -
Nil 5
9 670 Nil till
3 2228 Nil 441
10 2175 Ntl Nil
Probe
769
102
1396
305 :
1268 .
9
L 10
3
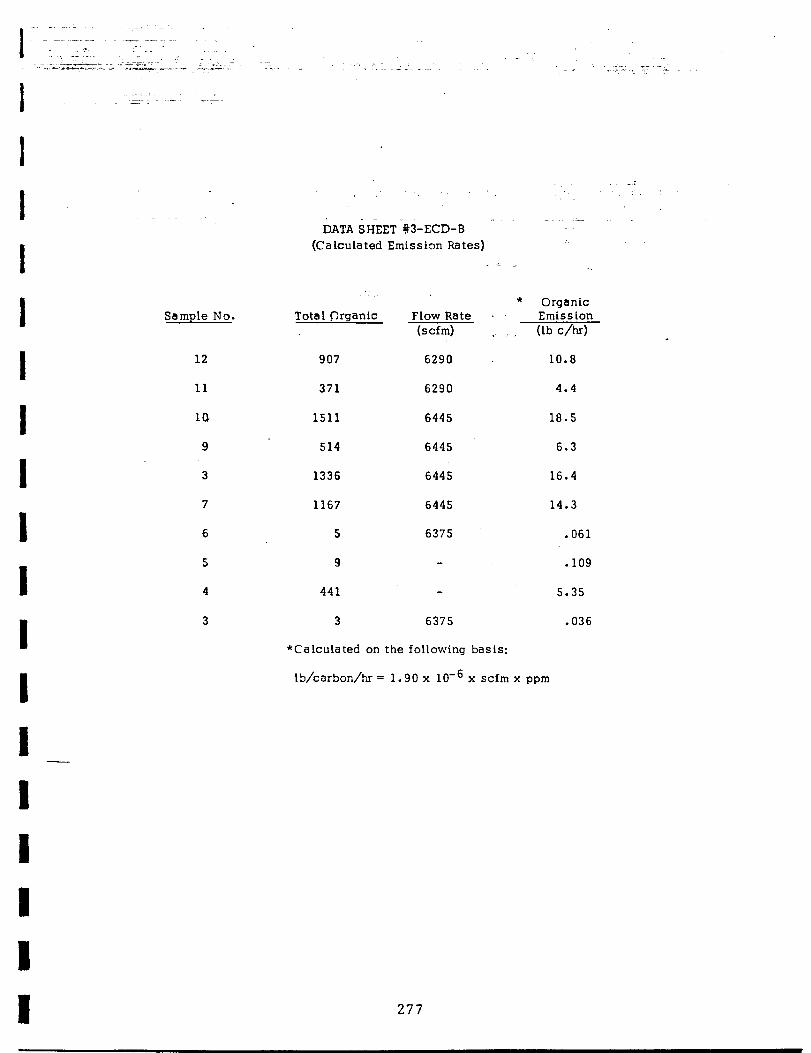
Sample No. Total Organic
12
11
la
9
3
7
6
5
4
3
DATA SHEET ‘#J-ECD-S - - (Calculated Emission Rates)
907
371
1511
514
1336
1167
5
9
441
3
Flow Rate . (scfm)
6290
6290
6445
6445
6445
6445
6375
6375
* Organic Emission (lb c/t-d
10.8
4.4
18.5
6.3
16.4
14.3
.061
. 109
5.35
.036
*Calculated on the following basis:
lb/carbon/hr = 1.90 x low6 x scfm x ppm
277
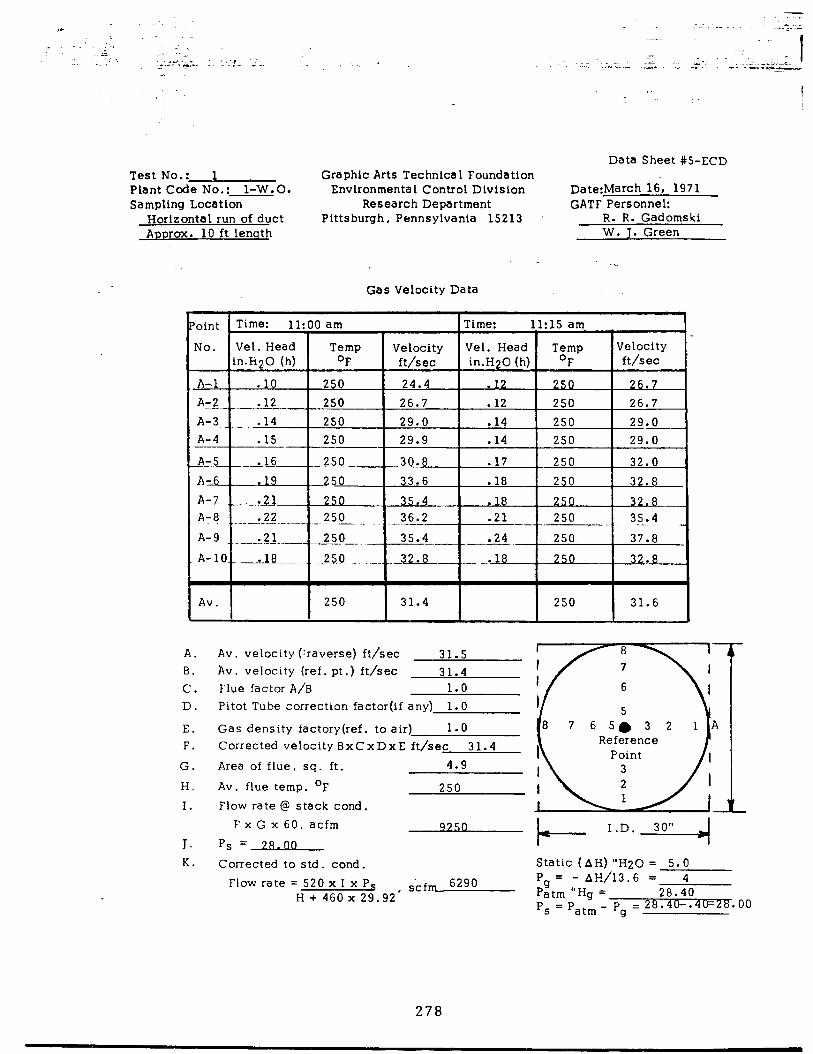
Test No.: 1 Plant Code No.: 1-W.O. Sampltng Location
Horizontal run of duct Approx. 10 ft lenqth
Graphic Arts Technlca 1 Foundation Envtronmental Control Division
Research Department Pittsburgh, Pennsylvania 15213
Data Sheet #5-ECD
Date:March 16, 1971 GATF Personnel:
R. R. Gadomski W. J. Green
--
Gas Velocity Data
‘oint Time: 11:00 am Time: l-l:15 am I I I I I I.
No. Vel. Head Temp Velocity Vel. Head Temp Velocity in.H20 (h) OF ft/sec in.H20 (h) OF ft;/sec
A-.1 . 10 250 24.4 . 250 26.7 A:2 .12 250 26.7 . 12 250 26.7 A-3 .14 250 29.0 .14 250 29.0 _.~_ A-4 .15 250 29.9 . 14 250 29.0
_4-5----,l_S 250. -3-O. 8 . 17 250 32.0 _
A-6 19 250 33.6 . 18 250 32.8-
A-8 .22 250 _
--..-.-. ----
A-z.. I--------.-- _ .21 250 35.4 . 36.2 .21 --
A-9 --Lu...- 256-- 35.4 . -.-- - --.- A-10 .Xj .._. ._. ..2$0 _ -....-Up ____ __* 18
Av. I I 250 I 31.4 I I 250 I 31.6 I
A. Av. velocity (raverse) ft/sec 31.5 B. Av. velocity (ref. pt .) ft/sec 31.4 C. Flue factor A/B 1.0 D. Pitot Tube correction factor(if any) 1.0
E. Gas density factory(ref. to air) 1.0 F. Corrected veloctty BxCxDxE ft/sec 31.4
G. Area of flue, sq. ft. 4.9
H. Av. flue temp. OF 250 I. Flow rate @ stack cond.
J. K.
F x G x 60, acfm
ps =2F(.oo Corrected to s td . cond .
Flow rate = 520 x I x Ps , &fm 6290 H + 460 x 29.92
b I.D.. 30” 4
Static (AH) “H20 = 5.0 P, = - AH/13.6 = 4 =a Patm “Hg = 28.40 - P, = patm - pg = 28.40-.4@2B. - 00
278
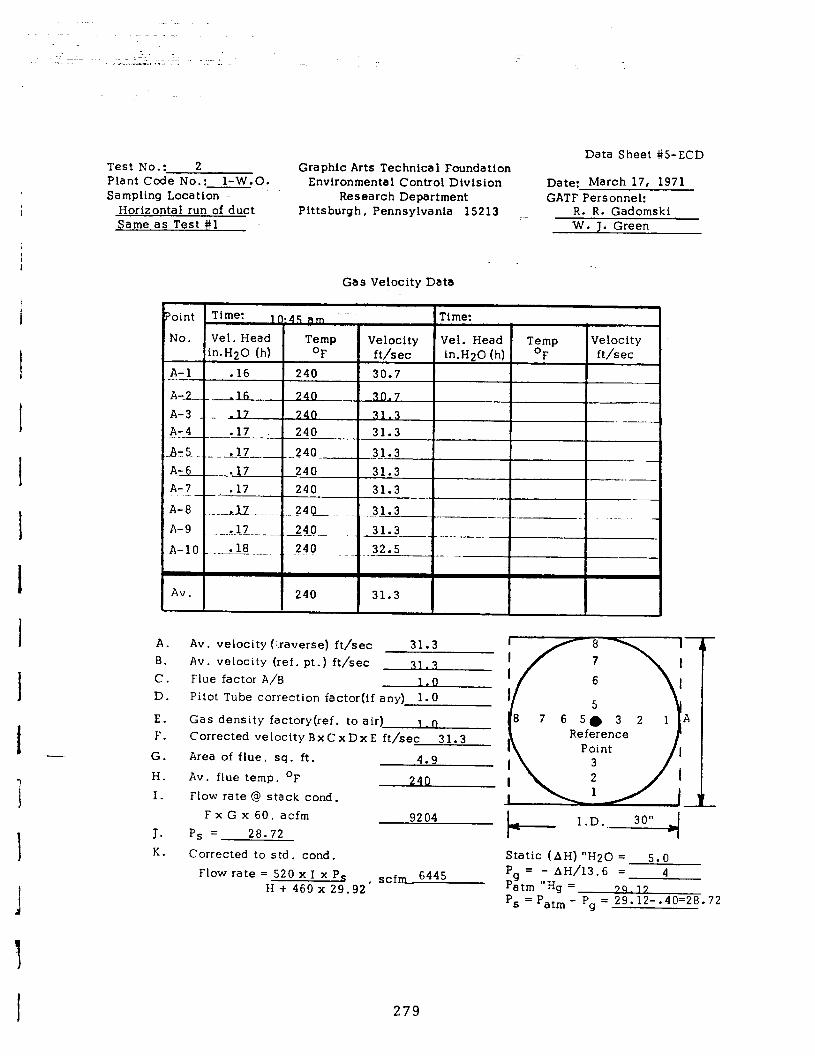
I
Data Sheet #5-ECD Test No.: 2 Graphic Arts Technical Foundation Plant Code No * . . 1-W.O. Environmental Control Dtvision Date: March 17, 1971 Sampling Location .- Research Department GATF Personnel:
Horizontal run of duct Pittsburgh, Pennsylvania 15213 :- R. R. Gadomski Same as Test #l W. J. Green
Gas Velocity Data
A:6 .17 240 31.3 --- A-7 .17 240 31.3 - - A-8 ..I1 .._-.-- _.-.._ 24Ol_ ..31.3- .__~_ _ . _. A-9 ?.LZ -... .-.--- .--a~._~ 31.3 _____ _ ____. A-10 .-z=---. 248 ._._~ -32.5
Av. 240 31.3
A. Av. velocity (:.raverse) ft/sec B. Av. velocity (ref. pt.) ft/sec C. Flue factor A/B D. Pitot Tube correction factor(if any) 1.0
E. Gas density factory(ref. to F. Corrected velocity Bx C x
G. Area of flue, sq. ft. H. Av. flue temp. OF I. Flow rate @ stack cond.
FxGx60, acfm J. P, = 28.72
9204 b I.D.. 30” 4
K. Corrected to std. cond. Static (AH) “H20 = 5.0 Flow rate = 520 x I x Ps , scfm 6445 Pg = - AH/13.6 = 4
H + 460 x 29.92 Patm “Hg = ‘S = patm -
7~~ 17 Pg = 29.12-.40=28.72
279

Data Sheet #5-ECD Test ‘No.: 3 Graphic Arts Technical Foundation Plant Code No.: l-W.O. Envtronmental Control Division Date: Sampling Location Research Department GATF Personnel:
Same as Test #l & #2 Pittsburgh, Pennsylvania 15213 R. R. Gadomski W. 1. Green
Gas Velocity Data
Point Time: lo:30 am Time:
No. Vel. Head Temp Velocity Vel. Head Temp Velocity in.H20 (h) OF ft/sec in.H20 (h) OF ft/sec
A-l .14 200 28.2 1A 3nn 28.2
I I Av. I
200 I 28.2 I I I I A. B. C. D.
E. F.
G. H. I.
J- K.
Av. velocity (‘.raverse) ft/sec 28.2 Av. velocity (ref. pt .) ft/sec 28.2 Flue factor A/B 1.0 Pitot Tube correction factor(if any) 1.0
Gas density factory(ref. to air) ‘1.0 Corrected velocity BxCxDxE ft/sec 28.2
Area of flue, sq. ft. 4.9 Av . flue temp. OF 200 Flow rate @ stack cond.
F x G x 60, acfm 8280 Ps = 28.65
Corrected to std. cond. Static (AH) “H20 = 5.5 Flow rate = 520 x I x P, scfml
Pg = - AH/13.6 = .40 H + 460 x 29.92’ Patm “Hg = 29.05
‘S = ‘atm - Pg = 29.05-40=28.65
280
I I I I I 1 1 I I I 1 I 1 -
Approved
irli\Y ‘t - IS)/ 1 CARNEGIE-MELLON UNWERSITY
.Gl%TF MELLON INSTITUTE RESEARCH SERVICES
Physical Measurements Laboratory (7615-2)
Graphic Arts Fellow Dr. W. Green AceountNo.Technical Foundation
P.O. t3104 Investigation Air Pollution Program
Investigation No. PML 71-205 (I-wo) NATURE
t
Preliminary OF PXOgEW
Date of Report April 30, 1971 REPORT Final xx
The eight stack gas samples which you submitted have been analyzed
by the procedure described in a previous report dated October 2, 1970. The
data are tabulated in the attached table.
Paul R. Eisaman Fellow Physical Measurements Laboratory
PRE:jdf
Form 111
281
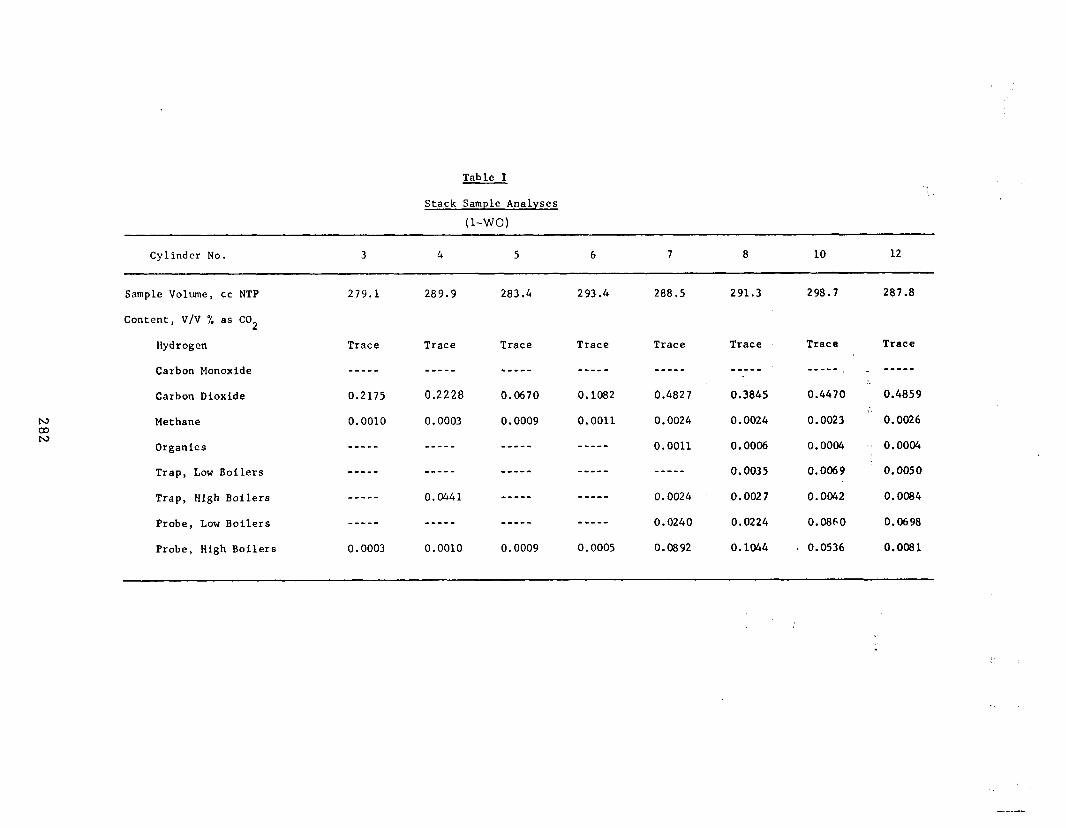
Table I
Stack Sample Analyses
(l-WO)
Cylinder No. 3 4 5 6 7 8 10 12
Sample Volume, cc NTP
Content, V/V % as CO 2
Hydrogen
Carbon Monoxide
Carbon Dioxide
Methane
Organics
Trap, Low Boilers
Trap, High Boilers
Probe, Low Boilers
Probe, High Boilers
279.1 289.9 283.4 293.4 288.5 291.3 298.7 287.8
Trace Trace Trace
-a---
0.2175
0.0010
-----
0.2228
0.0003
----a
-----
m--m-
_--mm
0.0003
_---_
mm---
0.0441
--m-m
0.0010
me---
0.0670
0.0009
*----
----a
-----
--mew
0.0009
Trace Trace
----e ---e-
0.1082 0.4827
0.0011 0.0024
---am 0.0011
----- _--mm
--mm- 0.0024
-SW-- 0.0240
0.0005 0.0892
Trace Trace
--em- ---me,
0.3845 0.4470
0.0024 0.0023
0.0006 0.0004
0.0035 0.0069
0.0027 0.0042
0.0224 0.08~0
0.1044 s 0.0536
Trace
s----
0.4859
' 0.0026
-' 0.0004
0.0050
0.0084
0.0698
0.0081
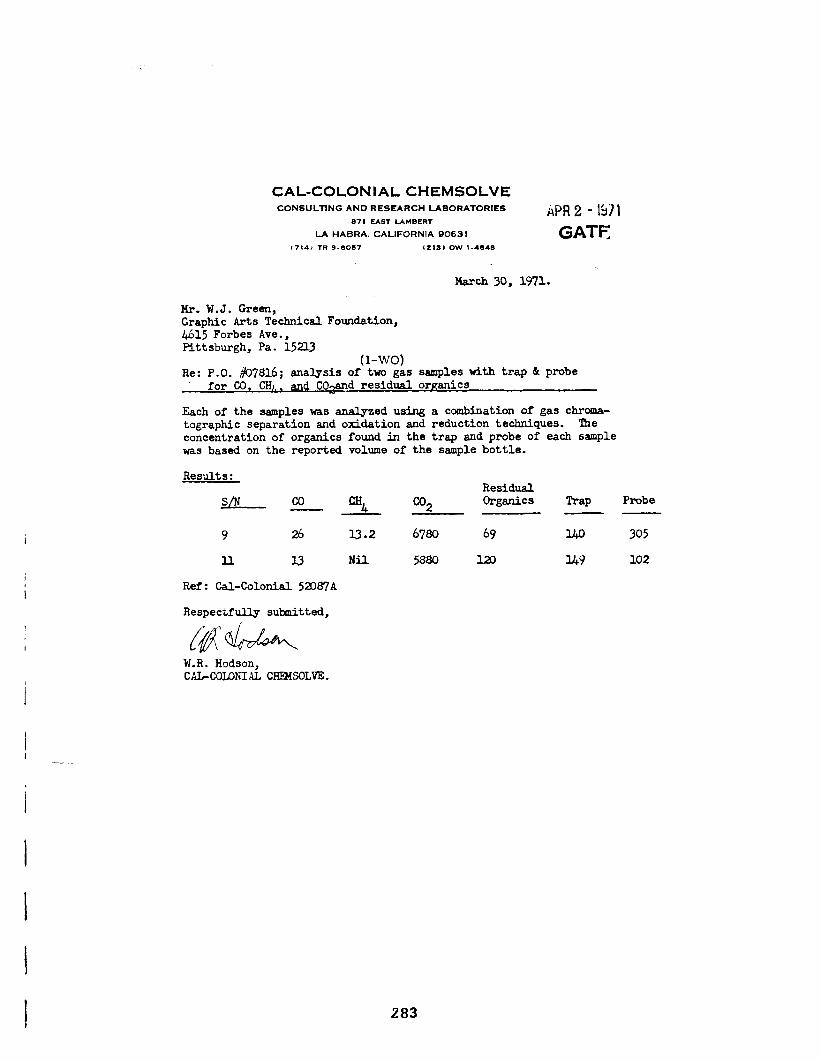
CAL-COLONIAL CHEMSOLVE CONSULllNG AND RESEARCH LABORATORIES iiPR 2 - 1571
871 EAST LAMBERT
LA HABRA. CALIFORNIA 90631 GA-I-F, t714, TR 9.eo57 (213, ow t-41141) _ .
March 30, 1971.
Hr. W.J. Green, Graphic Arts Technical Foundation, 4615 Forbes Ave., Pittsburgh, Pa. 15U3
(l-W01 Re: P.O. #07816; analysis of two gas samples with trap & probe
for CO. CHJ., and CO-d residual ormnics
Each of the samples was analyzed using a combination of gas chmna- tographic separation and oxidation and reduction techniques. The concentration of organics found in the trap and probe of each sample was based on the reported volume of the sample bottle.
Results: Residual
s/NQJ cn4 co2 orgsnics Trap Probe --
9 26 13.2 6780 69 I40 305
ll I.3 Nil 5880 120 l49 102
Ref: Cal-Colonial 5aO87A
Respectfully submitted,
W.R. Hodson, cAL-coImIALccApIsOLm.
283
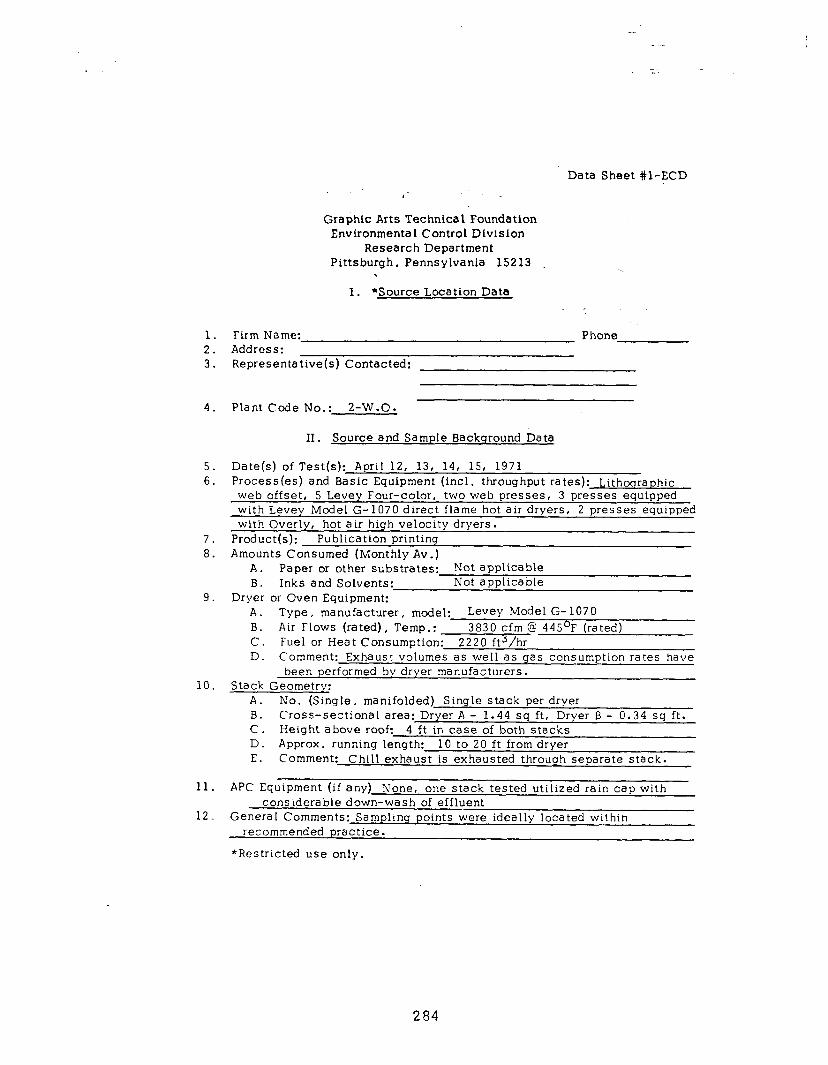
1. 2. 3.
4.
5. 6.
7. 8.
9.
10.
11.
12.
Data Sheet #l-ECD
Graphic Arts Technical Foundation Environmental Control Division
Research Department Pittsburgh, Pennsylvania 15213
I. *Source Location Data
Firm Name: Address:
Phone
Representative(s) Contacted:
Plant Code No.: 2-W-O.
II. Source and Sample Background Data
Date(s) of Test(s): April 12, 13, 14, 15, 1971 Process(es) and Basic Equipment (incl. throughput rates): Lithographic
web offset, 5 Levey Four-color, two web presses, 3 presses equipped with Levey Model G-1070 direct flame hot air dryers, 2 presses equipped with Overly, hot air high velocity dryers.
Product(s): Publication printing Amounts Consumed (Monthly Av.)
A. Paper or other substrates: Not applicable B. Inks and Solvents: Not applicable
Dryer or Oven Equipment: A. Type, manufacturer, model: Levey Model G- 1070 B. Air Flows (rated), Temp.: 3830 cfm @ 445’F (rated) C. Fuel or Heat Consumption: 2220 ftj/hr D. Comment: Exhaust volumes as well as gas consumption rates have
been performed by dryer manufacturers. Stack Geometry:
A. No. (Single, manifolded) Single stack per dryer B. Cross-sectional area: Dryer A - 1.44 sq ft, Dryer B - 0.34 sq ft. C. Height above roof: 4 ft in case of both stacks D. Approx. running length: 10 to 20 ft from dryer E. Comment: Chill exhaust is exhausted through separate stack.
APC Equipment (if any) None, one stack tested utilized rain cap with considerable down-wash of effluent
General Comments: Sampling points were ideally located within recommended practice.
*Restricted use only.
284
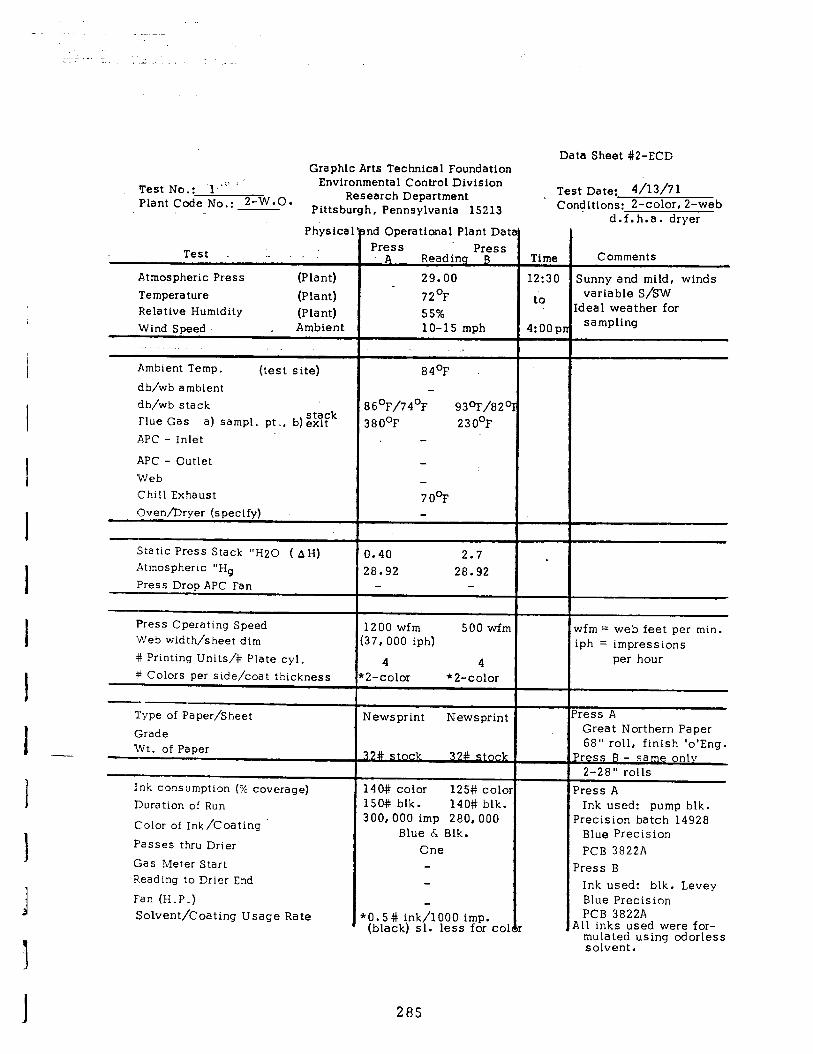
Graphic Arts Technical Foundation Data Sheet #2-ECD
Environmental Control Division Research Department
Pittsburgh, Pennsylvania 15213
Physica
Test. I...
Atmospheric Press (Plant) Temperature (Plant) Relative Humidity (Plant) ‘Wind Speed . Ambient
Ambient Temp. (test site) db/wb ambient db/wb stack Flue Gas stack a) sampl. pt ., b) exit APC - Inlet
APC - Outlet Web (Chill Exhaust Cven/Dryer (specify)
Static Press Stack “H20 ( AH) Atmospheric “Hg Press Drop APC Fan
Press Operating Speed Web width/sheet dim # Printing Units/# Plate cyl. # Colors per side/coat thickness
-. Type of Paper/Sheet Grade Wt. of Paper
Ink consumption (% coverage) Duration of Run
Color of Ink/Coating F’asses thru Drier Gas Meter Start Reading to Drier End Fan (H.P.) Solvent/Coating Usage Rate
rnd Operational Plant Da, Press Press
A Readinq B 29.00 72’F 55% lo-15 mph
. .
84’F
86’F/74’F 93OF/82’ 380°F 230°F
7ooF
0.40 2.7 28.92 28.92
1200 wfm 500 wfn ‘37,000 iph)
4 4 .2-color *2-color
Newsprint Newsprint
140# color 125# co10 lSO# blk. 140# blk. 300,000 imp 280,000
Blue & Blk. One
t0.5# ink/1000 imp. (black) sl. less for co’
Test Date: 4/13/7I Conditions: 2-color, 2-web
Time Comments
12:30
to
4:oou
d.f.h.a. dryer
Sunny and mild, winds variable S/SW
Ideal weather for sampling
wfm = web feet per min. iph = impressions
per hour
Great Northern Paper 68” roll, finish ‘o’Eng.
Press B - same onlv 2-28” rolls
Press A Ink used: pump blk.
Precision batch 14928 Blue Precision PC9 3822A
Press B Ink used: blk. Levey Blue Precision PCB 3822A
All inks used were for- mulated using odorless solvent.
285
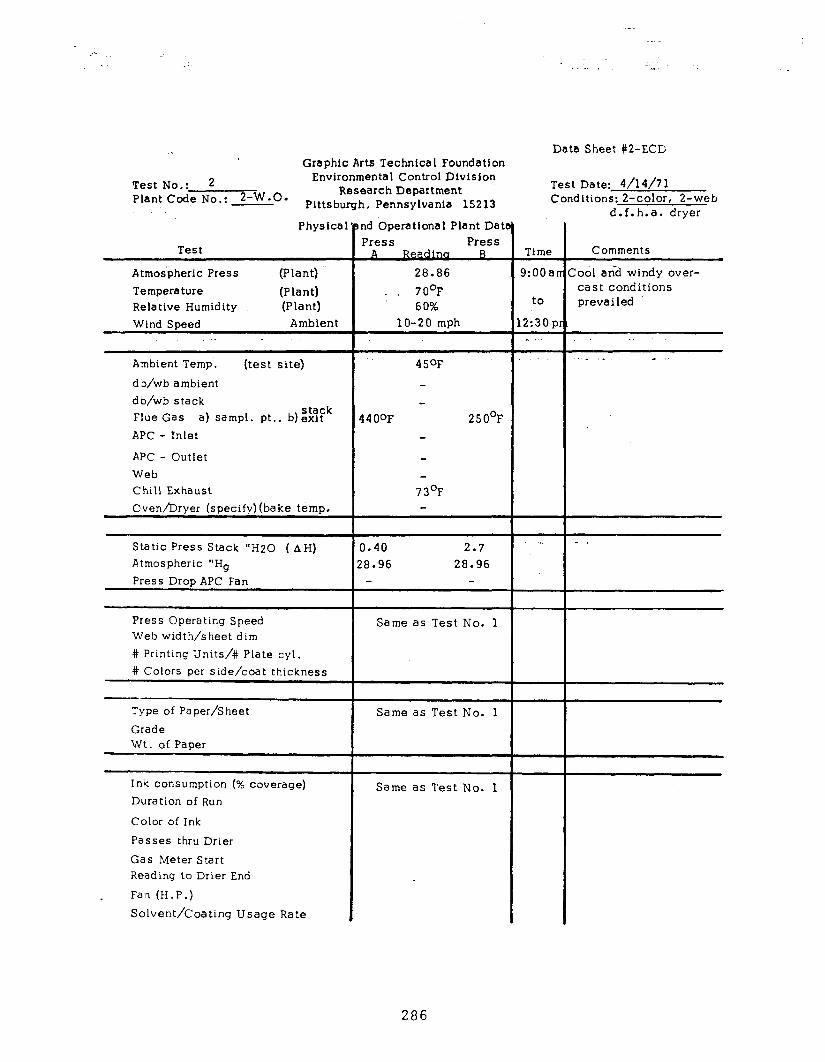
Graphic Arts Technica 1 Foundation
Test No.: 2 Environmental Control Division
Plant Code No.: 2-W-G. Research Department
Pittsburgh, Pennsylvania 15213
Physical
Test
Atmospheric Press (Plant) Temperature (Plant) Relative Humidity (Plant) Wind Steed Ambient
.
Ambient Temp. (test site) db/wb ambient db/wb stack Flue Gas stack
a) sampl. pt., b)exit APC - Inlet
APC - Outlet Web Chill Exhaust Oven/Dryer (specify) (bake temp.
Static PreSS Stack 4’H20 ( AH)
Atmospheric “Hg Press Drop APC Fan
Press Operating Speed Web width/sheet dim # Printing Units/# Plate cyl. # Colors per side/coat thickness
-_ Type of Paper/Sheet Grade W,t. of Paper
Ink consumption (% coverage) Duration of Run
Color of Ink Passes thru Drier Gas Meter Start Reading to Drier End .Fa:n (H.P.) Solvent/Coating Usage Rate
Id Operatlonal Plant Datz Press Press
A Rew R 28.86
. / 70°F 60%
lo-20 mph
450F
14OoF 250°F
73’F
I.40 2.7 8.96 28.96
Same as Test No. 1
Same as Test No. 1
Same as Test No. 1
Data Sheet #2-ECD
Test Date: 4/14/71 Conditions: 2-color, 2-web
d.f.h.a. dryer
Time
9:OOar
to
2:3Op
Comments
Cool and windy over- cast conditions prevailed
_ _.
.” * -
286
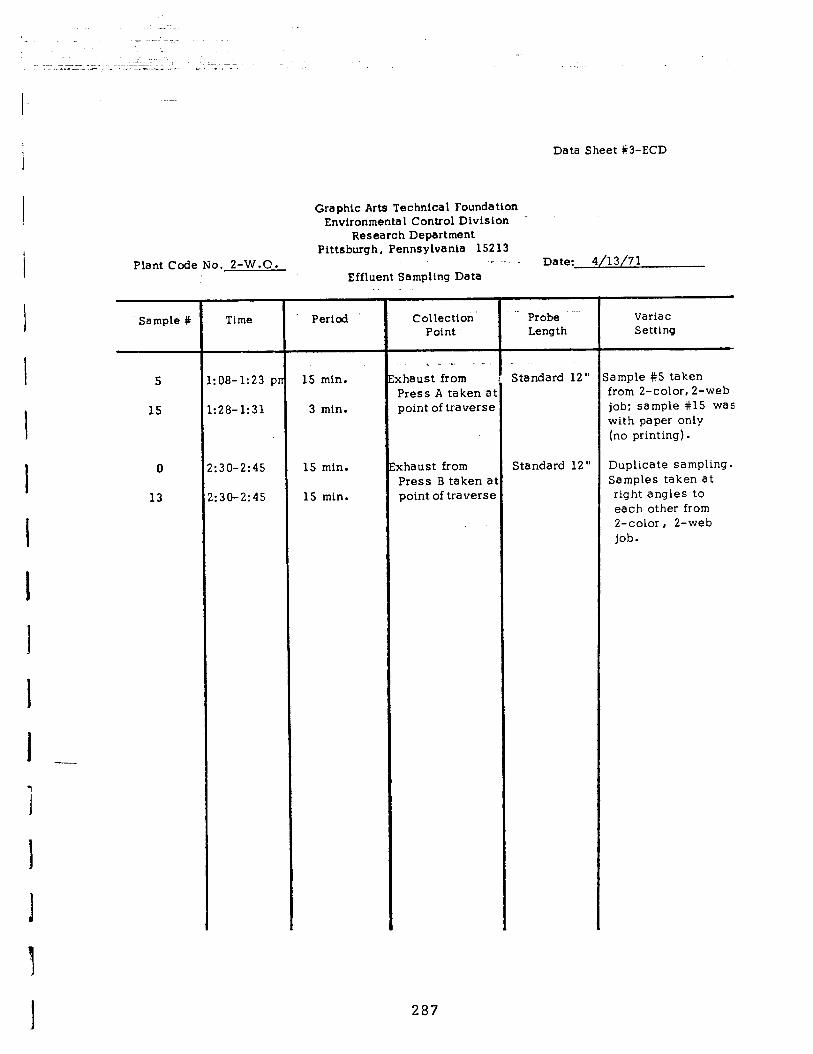
Data Sheet #3-ECD
Plant Code No. 2-W.O.
Graphic Arts Technical Foundation Environmental Control Division
Research Department Pittsburgh, Pennsylvania 15213
_. Date: 4/13/71 Effluent Sampling Data
Sample # Time Period
5
15
0
13
:08-1:23 p: 15 min.
:28-1:31 3 min.
:30-2:45 15 min.
:30-2:45 15 min.
. -
Collection. Point
thaust from Press A taken a point of traverse
vhaust from Press B taken a point of traverst
287
. Probe Length
Standard 12”
Standard 12”
Variac Setting
lample #5 taken from 2-color, 2-web job: sample #15 was with paper only (no printing).
Duplicate sampling. Samples taken at right angles to each other from 2-color, 2-web job.
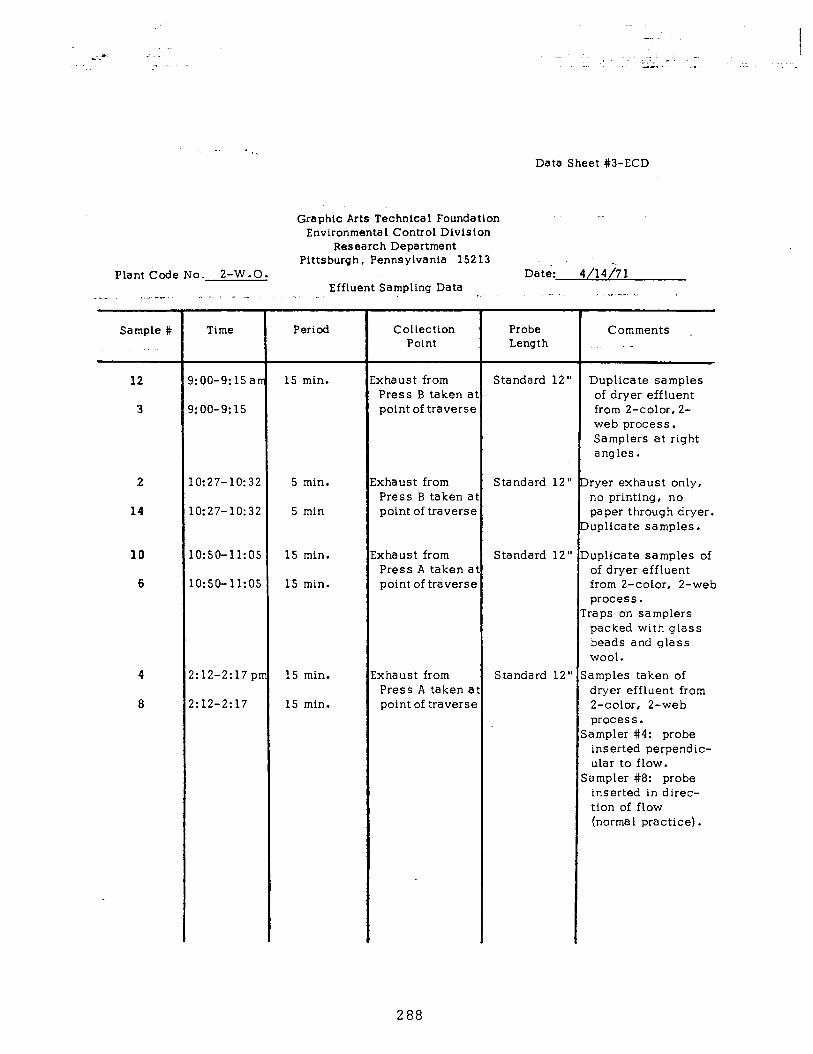
Data Sheet #3-ECD
Graphic Arts Technical Foundation Environmental Control Division
Research Department Pittsburgh, Pennsylvania 15213 :
Plant Code No. 2-W.O. Date: 4/14;71 Effluent Sampling Data -I.. * .- -. . . . I. .,/-.
__-. . . - . . - - 1
Sample # .
12
3
2
14
:0:27-10:
10:27-10:
5 min.
5 min
10 lO:SO-11: 15 min.
6 10:50-11: 15 min.
Time Period
i:oo-9: 15
1:00-9:15
15 min.
!:12-2:17 15 min.
!:12-2:17 15 min.
Collection Probe Point Length
xhaust from Press B taken at point of traverse
:xhaust from Press B taken al point of traverse
:xhaust from Press A taken al
point of traverse
:xhaust from Press A taken a’ point of traverse
Standard 12”
Standard 12”
Standard 12”
Standard 12”
Comments _ L
Duplicate samples of dryer effluent from 2-color, 2- web process. Samplers at right angles.
lryer exhaust only, no printing, no paper through dryer. buplicate samples.
Iuplicate samples of of dryer effluent from 2-color, 2-web process. raps on samplers packed with glass beads and glass wool. amples taken of dryer effluent from 2-color, 2-web process. ampler #4: probe inserted perpendic- ular to flow. ampler #8: probe inserted in direc- tion of flow (normal practice).
288
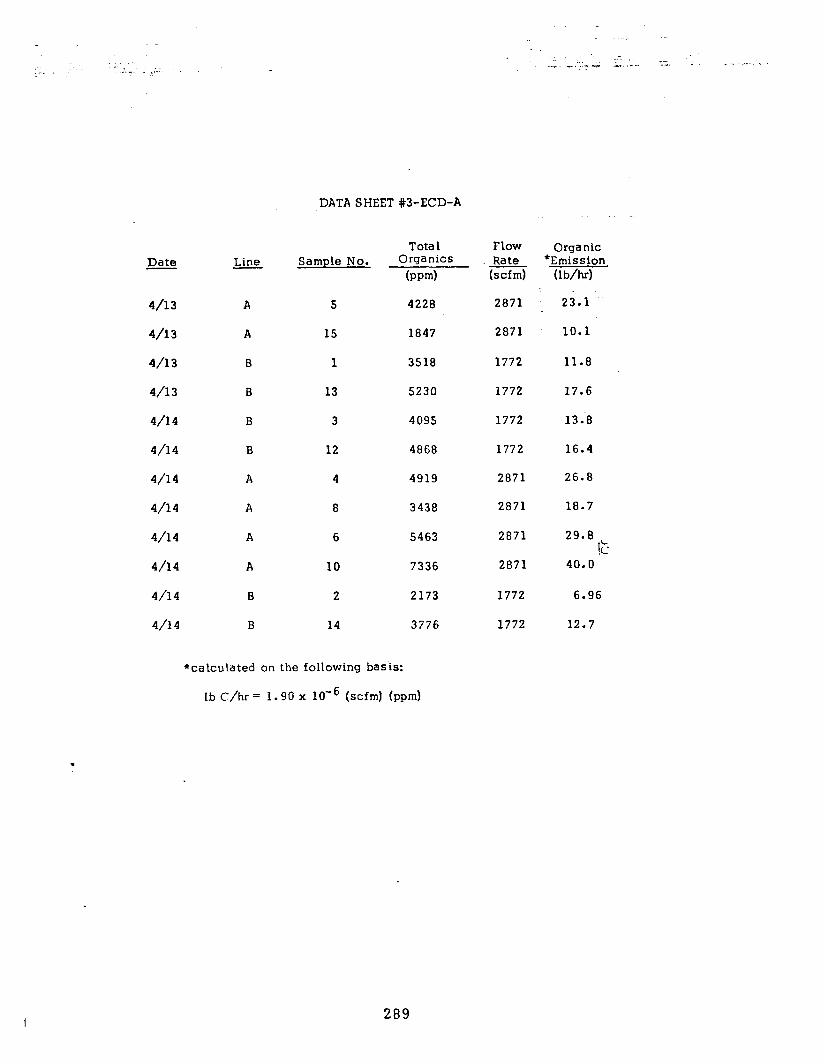
.,
: :. _ .:x
Date
4/13
4/l 3
4/13
4/l 3
4/l 4
4/14
4/14
4/14
4/14
4/14
4/14
4/14
Line
A 5
A 15
B 1
B 13
B 3
B 12
A 4
A 8
A 6
A 10
B 2
B 14
DATA SHEET #3-ECD-A
Sample No. Tota 1 Flow Organic
Organics Rate *Emission (pm-d (scfm) (It+)
4228 2871
1847 2871
3518 1772
5230 1772
4095 1772
4868 1772
4919 2871
3438 2871
5463 2871
7336 2871
2173 1772
3776 1772
23.1
10.1
11.8
17.6
13:8
16.4
26.8
18.7
29.8 !Z
40.0
6.96
12.7
*calculated on the following basis:
Lb C/hr = 1.90 x low6 (scfm) (ppm)
.
289
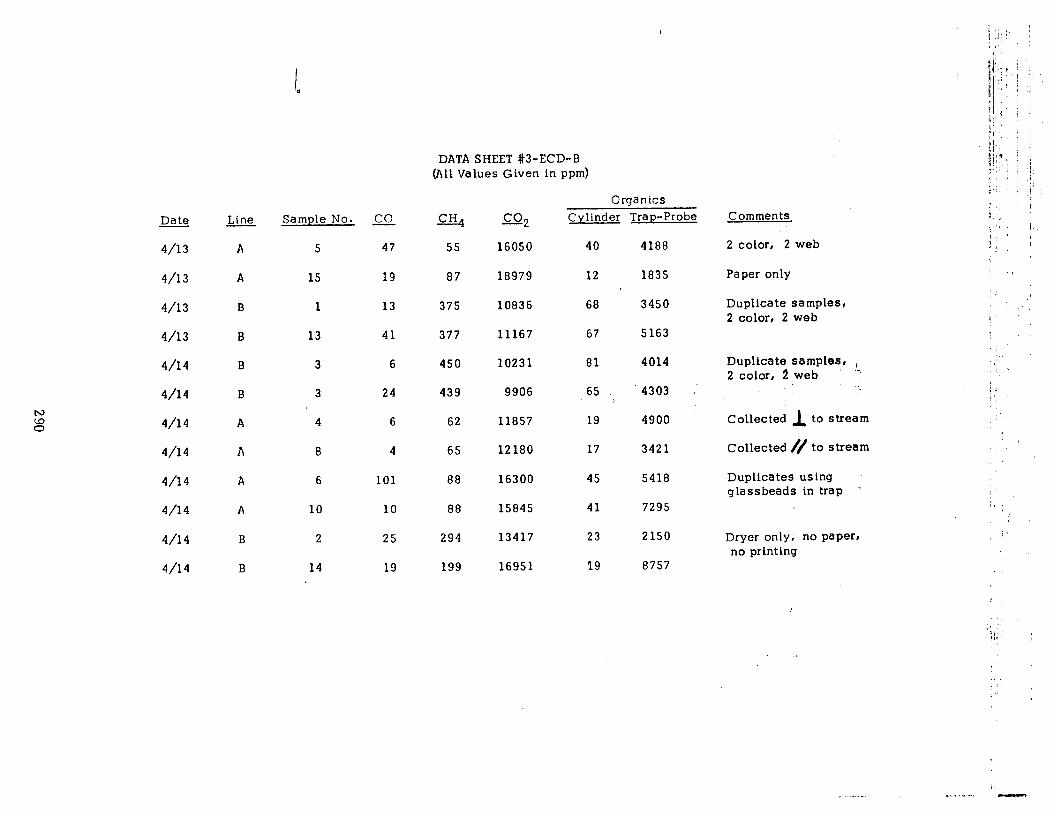
s: 0
Date
4/13
4/l 3
4/l 3
4/13
4/14
4/14
4/l 4
4/14
4/14
4/14
4/l 4
4/14
Line Sample No. g3-
A 5 47
A 15 19
B 1 13
B 13 41
B 3 6
B 3 24
A 4 6
A 8 4
A 6 101
A 10 10
B 2 25
B 14 19
I 9
DATA SHEET #3-ECD-B (All Values Given in ppm)
CH, 55
87
375
377
450
439
62
65
88
88
294
199
co2
Organics Cylinder Trap-Probe
16050
18979
10836
11167
10231
9906
11857
12180
16300
15845
13417
16951
40
12
68
67
81
65
19
17
45
41
23
19
4188
1835
3450
5163
4014
'4303 .
4900
3421
5418
7295
2150
8757
Comments
2 color, 2 web
Paper only
Duplicate samples, 2 color, 2 web
Duplicate samples, ( 2 color, 2 web Y
Collected 1. to stream
Collected // to stream
Duplicates using glassbeads in trap .
Dryer only, no papers no printing
_-_.-. .,_,_-, -
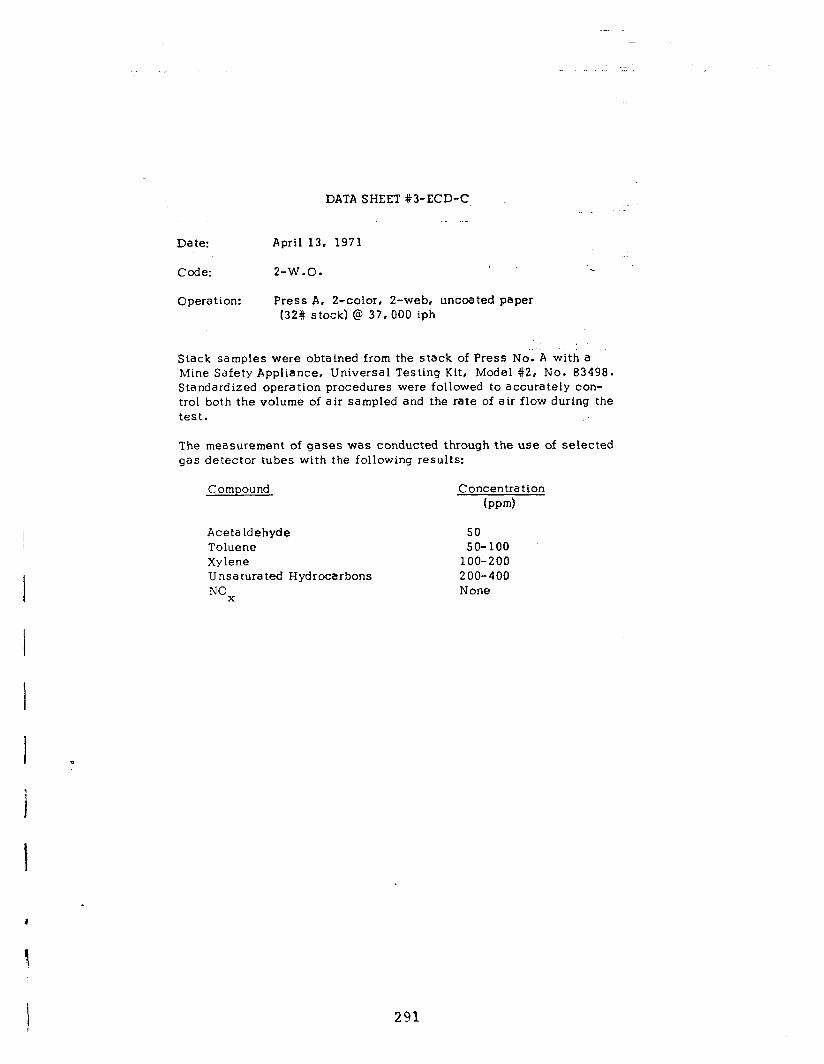
DATA SHEET #3-ECD-C _.. -
Date: April 13, 1971
Code: 2-W.O.
Operation: Press A, 2-color, 2-web, uncoated paper (32# stock) @ 37,000 iph
Stack samples were obtained from the stack of Press No.‘A with a Mine Safety Appliance, Universal Testing Kit, Model #2, No. 83498. Standardized operation procedures were followed to accurately con- trol both the volume of air sampled and the rate of air flow durtng the test.
The measurement of gases was conducted through the use of selected gas detector tubes with the following results:
Compound Concentration (w-d
Aceta ldehyde Toluene Xylene Unsaturated Hydrocarbons
N”X
50 50-100
100-200 200-400 None
291
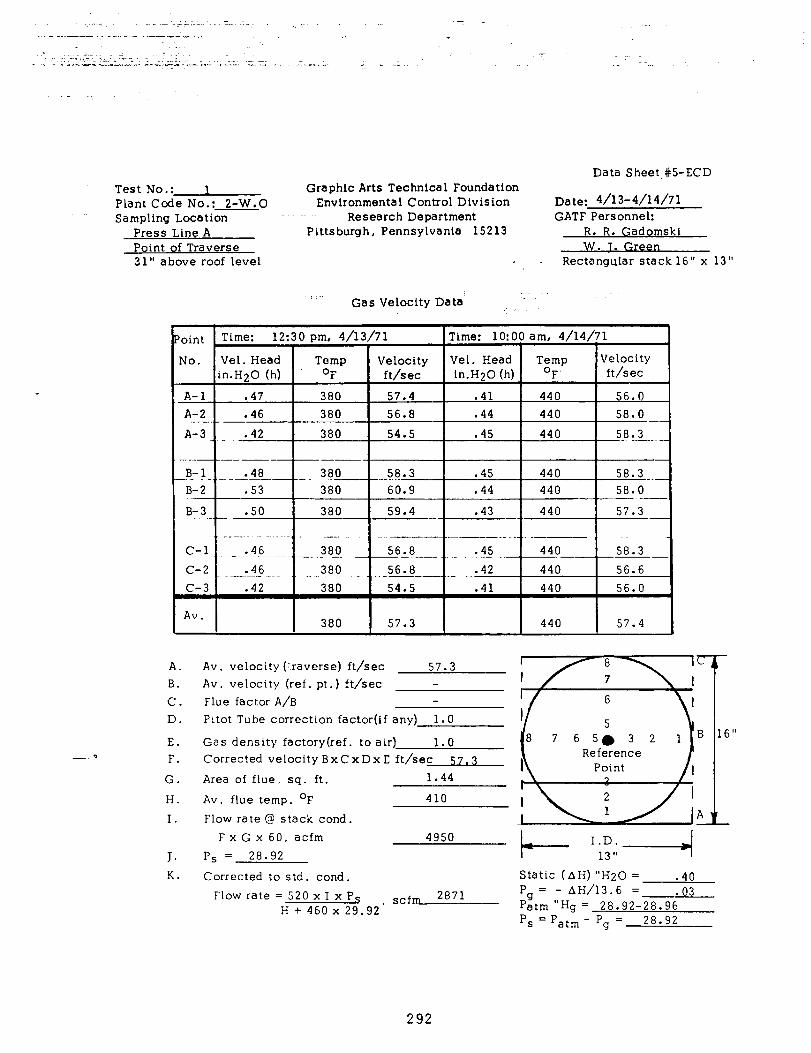
Data Sheet.#S-ECD Test No.: 1 Graphic Arts Technical Foundation Plant Code No.: 2-W.0 Environmental Control Division Date: d/13-4/14/71 Sampling Location .~ Research Department GATF Personnel:
Press Line A Pittsburgh, Pennsylvanta 15213 R. R. Gadomskl Point of Traverse en 3 1” above roof level Rectangular stack 16” x 13”
A. B. C. D.
E. F.
G. H. I.
J. K.
: .. Gas Velocity Data’ ‘- -‘. .’
Av. velocity (yraverse) ft/sec 57.3 Av. velocity (ref. pt.) ft/sec 71
Flue factor A/B Pitot Tube correction factor(if any) 1.0
Gas density factory(ref. to air) 1.0 Corrected velocity BxCxDxE ft/sec 57.3
Area of flue, sq. ft. 1.44
Av. flue temp. OF 410
Flow rate @ stack cond. Fx G x 60, acfm
P, = 28.92
Corrected to std. cond. Static (AH) “H20 = .40
Flow rate = 520 x I x P, , scfm 2871 Pg= - AH/13.6 = .03
H + 460 x 29.92 Patm “Hg = 28.92-28.96 P, = Pat, - Pg = 28.92
292
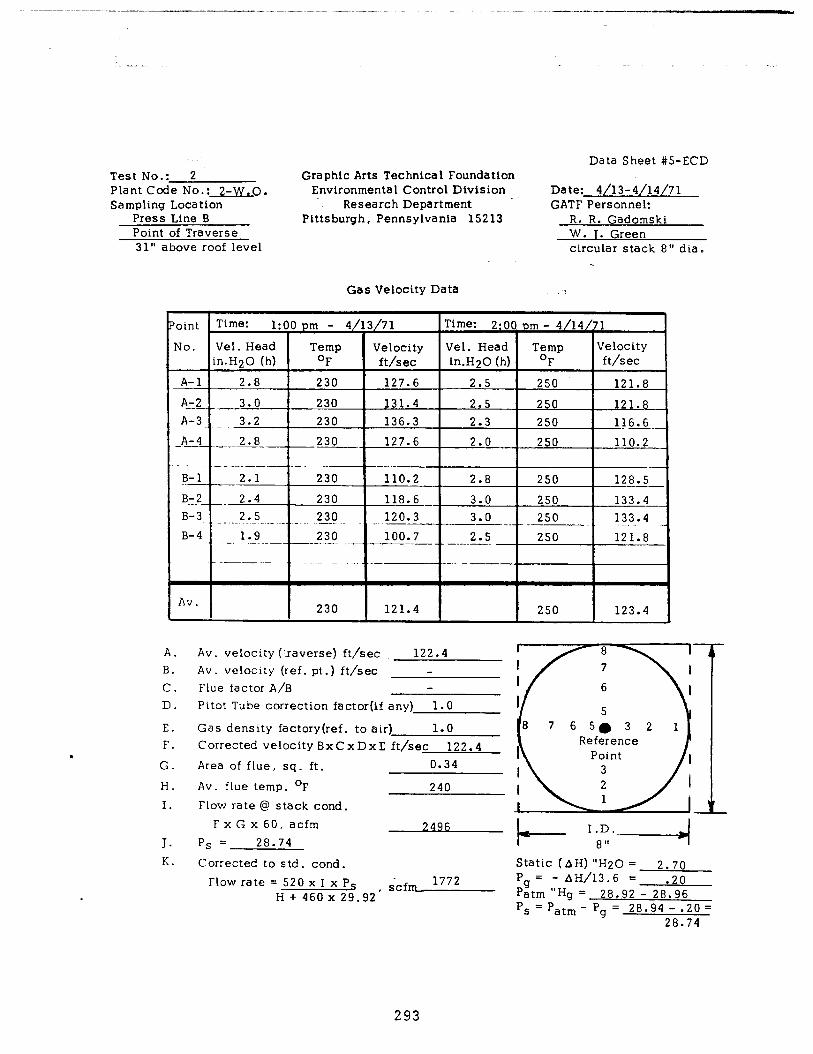
----..- _ ._. _ ._._.. _. _. - .--_- __... - .__-_-
Test No.: 2 Plant Code No.:xC. Sampling Location
Press Line B Point of Traverse 31” above roof level
Graphic Arts Technical Foundation Environmental Control Division
Research Department ’ Pittsburgh, Pennsylvanla 15213
Data Sheet #5-ECD
Date: 4/13-4/14/71 GATF Personnel:
R. R. Gadomski W. T. Green circular stack 8” dia L
Gas Velocity Data -
‘oint Time: 1:00 pm - 4/13/71 1 Time: 2:OO Drn - 4/14/71 I , I I I I
No. Vel. Head Temp Velocity Vel. Head Temp Velocity in.H20 (h) OF ft/sec in.H20 (h) OF ft/sec
A-l 2.8 230 127.6 2.5 250 121.8
A&,-3.0 230 131.4 2.5 250 121.8 A-3- 3.2 230 136.3 2.3 250 _ 116.6
~ke!-.-e.-~2d!. 230 127.6 2.0 250 110.2
-. .- __.. B-l 2.1 230 110.2 2.8 250 - 128.5 -__ B-2_ 2 * 4 230 118.6 3.0 _ 250 133.4 _
B-3 LS t - _._. ___.__ + 250 _ 230 .I _ 120.3?L-J 3.0-J-- -1 !??.-A .J
Av. I I 230 121.4 250 123.4
A
A. Av. velocity (:.raverse) ft/sec 122.4 B. Av. velocity (ref. pt.) ft/sec C. Flue factor A/B D. Pitot Tube correction factor(if any) 1.0
E. Gas density factory(ref. to air) 1.0 F. Corrected velocity BxC x Dx E ft/sec 122.4 G. Area of flue, sq. ft. 0.34
H. Av. flue temp. OF 240 I. Flow rate @ stack cond.
FxGx60, acfm J. P, = 28.74 2496 I-- ‘G.-----I K. Corrected to s td . cond . Static (AH) “H20 = 2.70
Flow rate = 520 x I x P, - , scfIT&z-- Pg = - AH/13.6 = .20
H + 460 x 29.92 Patm “Hg = 28.92 - 28.96 ‘S = ‘atm - P, = 28.94 - .20= >
28.74
293
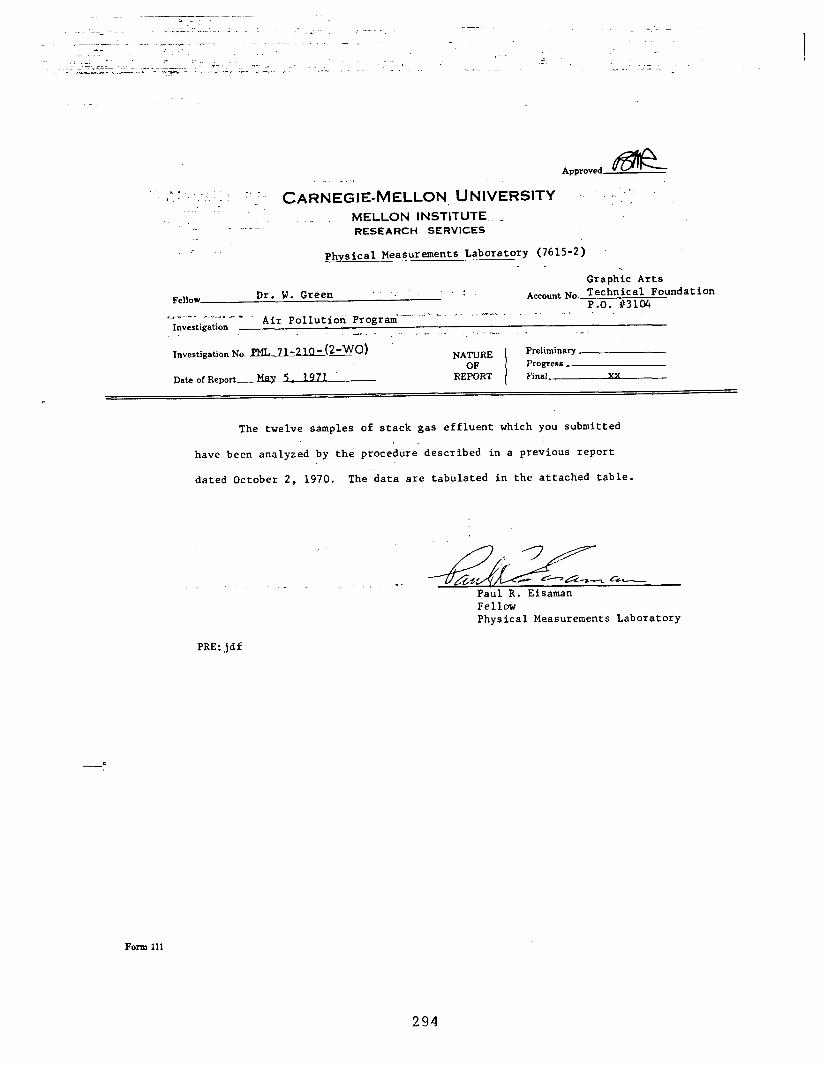
Approved 5 _ *... .- y’y . CARNEGIE-MELLON, UNIVERSITY .’ . ; - I
MELLON INSTITUTE _ _ .,._- RESEARCH SERVICES
._
: Physical Measurements Laboratory (7615-2) . .
Graphic Arts Fellow
Dr.W.Green ” ‘,i Account I,J~. Technical Foundation P.O. #3104 ‘ . . . .._ ,. _M . . . . ..I ,cil.e--- i. 3z - v
Investigation Air Pollutiofi Program’ _“’ w.7. .- .,. ._.. .
Investigation No. PM 71-210- (2-wo)
Date of Report fiY 5 - 1971
’ NATURE OF
REPORT
Preliminary Progress FiIL¶I xx
The twelve samples of stack gas effluent which you submitted
have been analyzed by the procedure described in a previous report
dated October 2, 1970. The data are tabulated in the attached table.
,-
Paul R. Eisaman Fellow Physical Measurements Laboratory
PRE: jdf
Form Ill
294
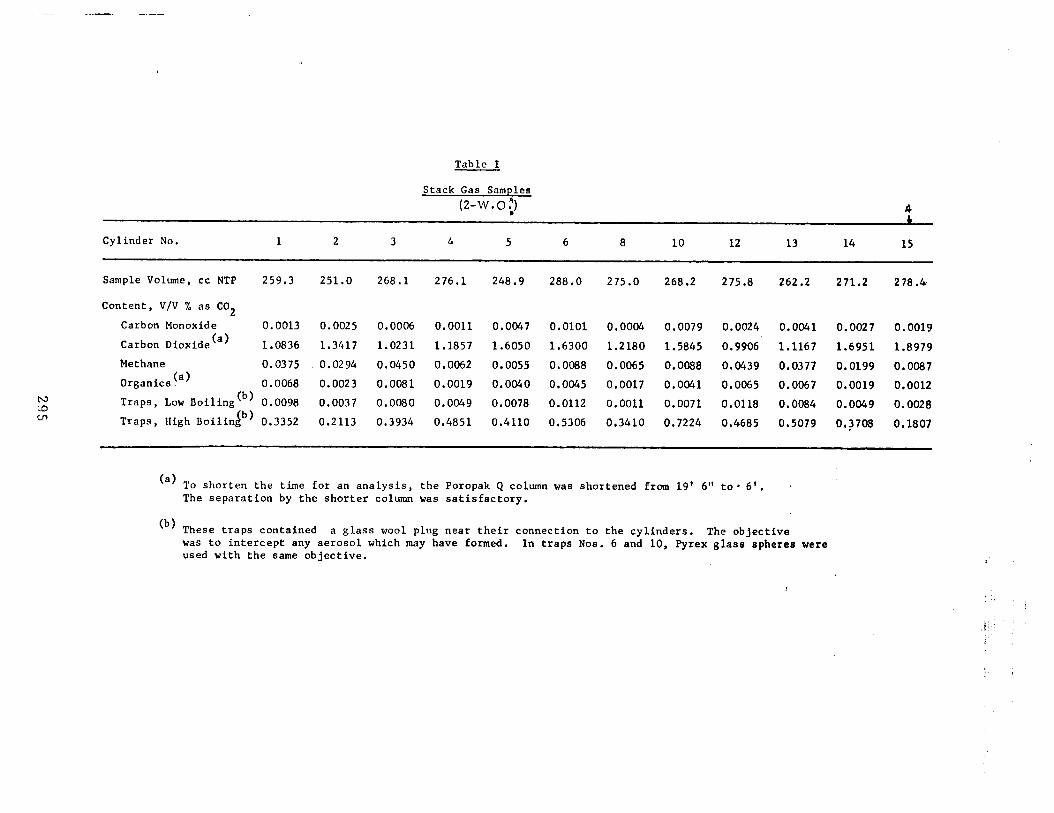
--~ _.- - -- _
Table I
Stack Gas Samples (2-W,Ol) r5
I
Cylinder No. 1 2 3 4 5 6 8 10 12 13 14 15
hY 'Xl cn
Sample Volume, cc NTP 259.3 251.0 268.1 276.1 248.9 288.0 275.0 268.2 275.8 262.2 271.2 278.4
Content, V/V % as CO2
Carbon Monoxide 0.0013 0.0025 0.0006 0.0011 0.0047 0.0101 0.0004 0.0079 0.0024 0.0041 0.0027 0.0019
Carbon Dioxideta) 1.0836 1.3417 1.0231 1.1857 1.6050 1.6300 1.2180 1.5845 0.9906 1.1167 1.6951 1.8979
Methane 0.0375 0.0294 0.0450 0.0062 0.0055 0.0088 0.0065 0.0088 0.0439 0.0377 0.0199 0.0087
Organics!a) 0.0068 0.0023 0.0081 0.0019 0.0040 0.0045 0.0017 0.0041 0.0065 0.0067 0.0019 0.0012 Traps, Low Boiling~~~ 0.0098 0.0037 0.0080 0.0049 0.0078 0.0112 0.0011 0.0071 0.0118 0.0084 O.O@4g 0.0028
Traps, High Boilin 0.3352 0.2113 0.3934 0.4851 0.4110 0.5306 0.3410 0.7224 0.4685 0.5079 0.3708 0.1807
(a) To shorten the time for an analysis, the Poropak Q column was shortened from 19' 6" to. 6'. The separation by the shorter column was satisfactory.
(b) These traps contained a glass wool plug near their connection to the cylinders. The objective was to intercept any aerosol which may have formed. In traps Nos. 6 and 10, Pyrex glass spheres were used with the same objective.
:
Y1 I / /
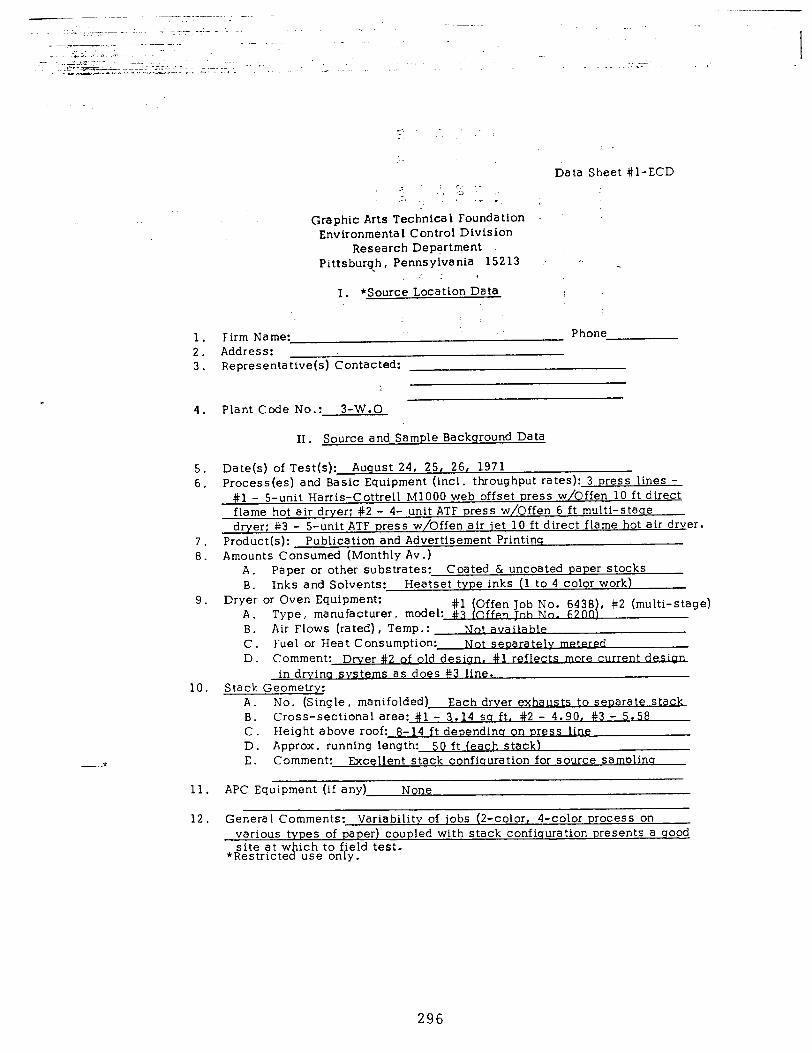
Data Sheet #l-ECD
T. ( - .
Graphic Arts Technical Foundation -~ Environmental Control Division
Research Department Pittsburqh, Pennsylvania 15213 r. _
; I. *Source Location Data
1. Firm Name: Phone 2. Address: 3. Representative(s) Contacted:
f
4. Plant Code No.: 3-w.0
II . Source and Sample Background Data
5. Date(s) of Test(s): August 24, 25, 26, 1971 6. Process (es) and Basic Equipment (incl . throughput rates):
#l - 5-unit Harris-Cottrell Ml000 web offset press w/Offen 10 ft direct flame hot air dryer: #2 - 4- unit ATF press w/Offen 6 ft multi-staae dryer: #3 - 5-unit ATF press w/Offen air jet 10 ft direct flame hot air drver.
7. Product(s): Publication and Advertisement Printinq 8. Amounts Consumed (Monthly Av .)
A. Paper or other substrates: Coated & uncoated paper stocks B. Inks and Solvents: Heatset type inks (1 to 4 color work)
9. Dryer or Oven Equipment: A.
#I (Offen Job No. 6438 , #2 (multi-stage) Type, manufacturer, model: #3 (0~ No. 6~0
B. Air Flows (rated), Temp.: Not avaita C. Fuel or Heat Consumption:Noted D. Comment: Drver #2 of old design, #l reflects more current
in drvina svstems as does #3 line. 10. Stack Geometry:
A. No. (Single, manifolded) Each drver exhausts to senarate stack B. Cross-sectional area: #l - 3.14 sa ft, #2 - 4.90, #3 - 5.58 C. Height above roof: 8-14 ft denendina on Dress line D. Approx. running length: 50 ft (each stack) E. Comment: Excellent stack confiauration for source samnlina
11. APC Equipment (if any) None
12. Genera 1 Comments: Variability of jobs (2-color, 4-color process on various t es of paper) coupled with stack confiquration presents a qood
s;~r~;t$!&et;~li;~d test.
296
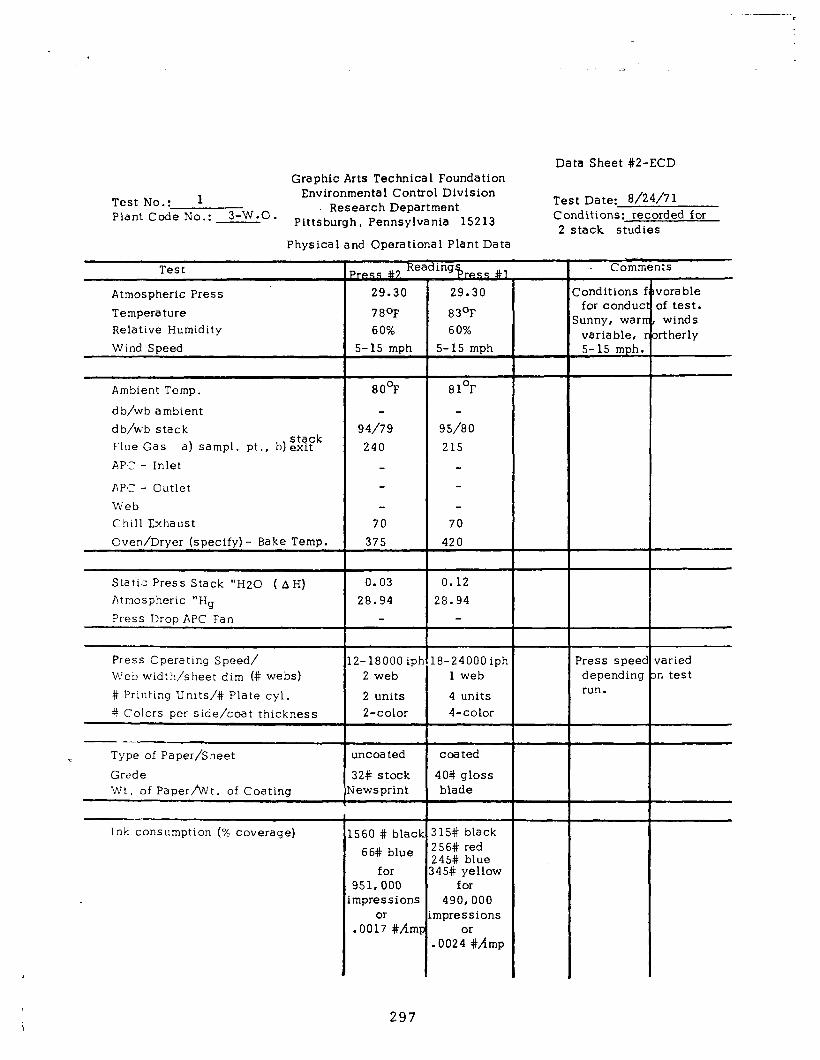
Graphic Arts Technica 1 Foundation Data Sheet #2-ECD
Test No.: 1 Environmental Control Division Test Date: g/24/71
Plant Code No.: 3-W.O. Research Department Pittsburgh, Pennsylvania 15213 Conditions: recorded for
2 stack studies Physical and Operational Plant Data
Test
Atmospheric Press Temperature Relative Humidity Wind Soeed
Ambient Temp.
d b,/wb ambient db/wb stack Flue Gas
stack a) sampl. pt., b)exit
APC ‘- Inlet
APC ‘- Outlet Web Chill Exhaust Oven/Dryer (specify) - Bake Temp.
Static Press Stack ‘OH20 (AH) Atmospheric “Hg Press Drop APC Fan
Press Operating Speed/ M’eb width/sheet dim (# webs) # Printing Units/# Plate cyl. # Colors per side/coat thickness
- -_--
c Type of Paper/Sheet Grade Wt. of Paper/Wt. of Coating
Ink consumption (% coverage)
F 29.30
780F 60%
5-15 mph
29.30
83OF 60%
5-15 mnh
80°F 81°F
94/79 95/80 240 215
70 70
375 420
0.03 0.12 28.94 28.94
2-18000 ipr .8-24000 iph 2 web 1 web
2 units 4 units 2-color 4-color
uncoated
32# stock Iewsprint
coated
40# gloss blade
560 # black 66# blue
for 951,000 mpressions
or .0017 #/imr
{15# black !56# red !45# blue 45# yellow
for 490,000
mpressions or
,0024 #/imp
-- Comments
:onditions for conduc
lunny, war variable, 5-15 mph.
Press speec depending run.
varied on test
i 297
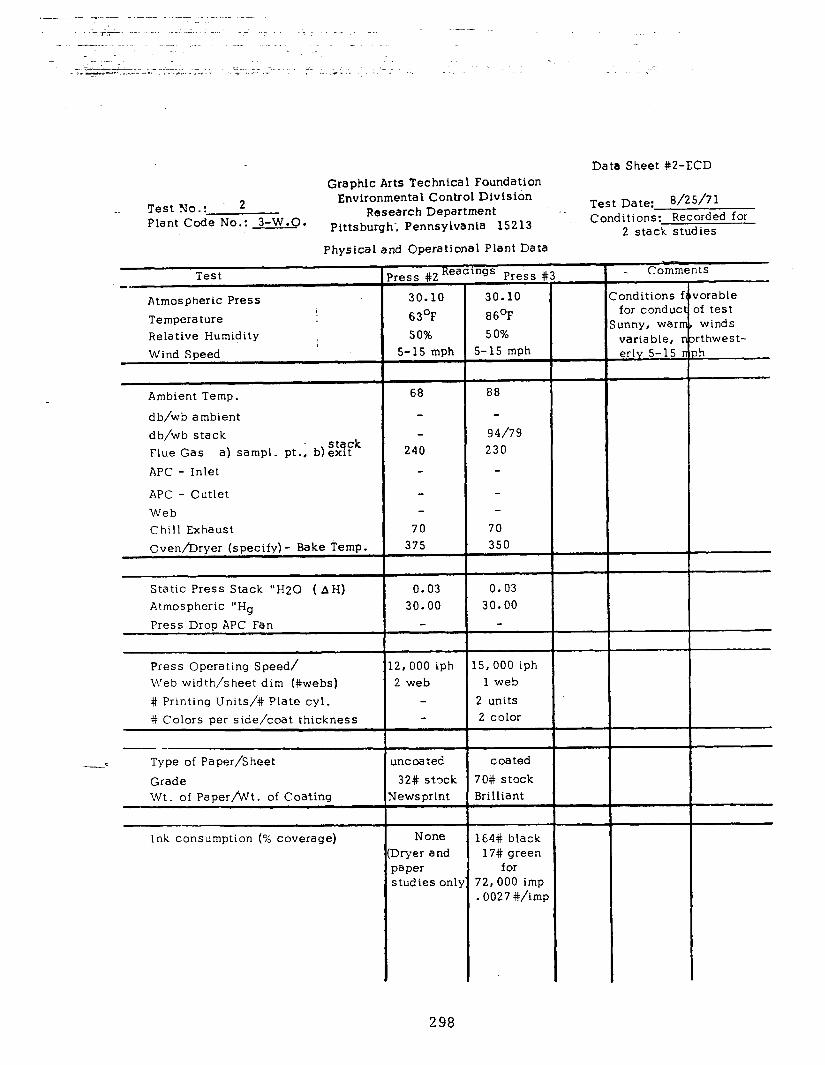
Graphic Arts Technical Foundation Data Sheet #2-ECD
Test No.: 2 Environmental Control Division Test Date: 8/25/71 _~
Plant Code No.: 3-W.9. Research Department
Pittsburgh-, Pennsylvanla 15213 s-m. Cond~i~t~~k ~~~~~~~” for
Physical and Operational Plant Data
Test ‘ress #2 Read’ngs Press #3
Atmospheric Press 30.10 30.10
Temperature 63OF 86OF Relative Humidity 50% 50% Wind Speed 5-15 mph 5-15 mph
Ambient Temp.
db/wb ambient db/wb stack
stack Flue Gas a) sampl. pt.; b)exit APC - Inlet
APC - Outlet Web Chill Exhaust Oven/Dryer (specify) - Bake Temp.
Static Press Stack “H20 ( AH) Atmospheric “Hg Press Drop APC Fan
Press Operating Speed/ Web width/sheet dim (#webs) # Printing Units/# Plate cyl. # Colors per side/coat thickness
Type of Paper/Sheet Grade Wt. of Paper/Wt. of Coating
Ink consumption (X coverage)
68 88
240 94/79 230
70 375
70 350
0.03 30.00
2,000 iph 2 web
.5, 000 iph 1 web
2 units 2 color
rnc oa ted coated 32# stock 70# stock
Iewsprint Brilliant
None Xyer and oaper j tud ies onl}
164# black 17# green
for 72,000 imp .0027 #/imp
- - Comments
Yonditions f for conduc, unny, warn variable, r erlv 5-15 1
vora ble of test
winds xthwest- ph
298
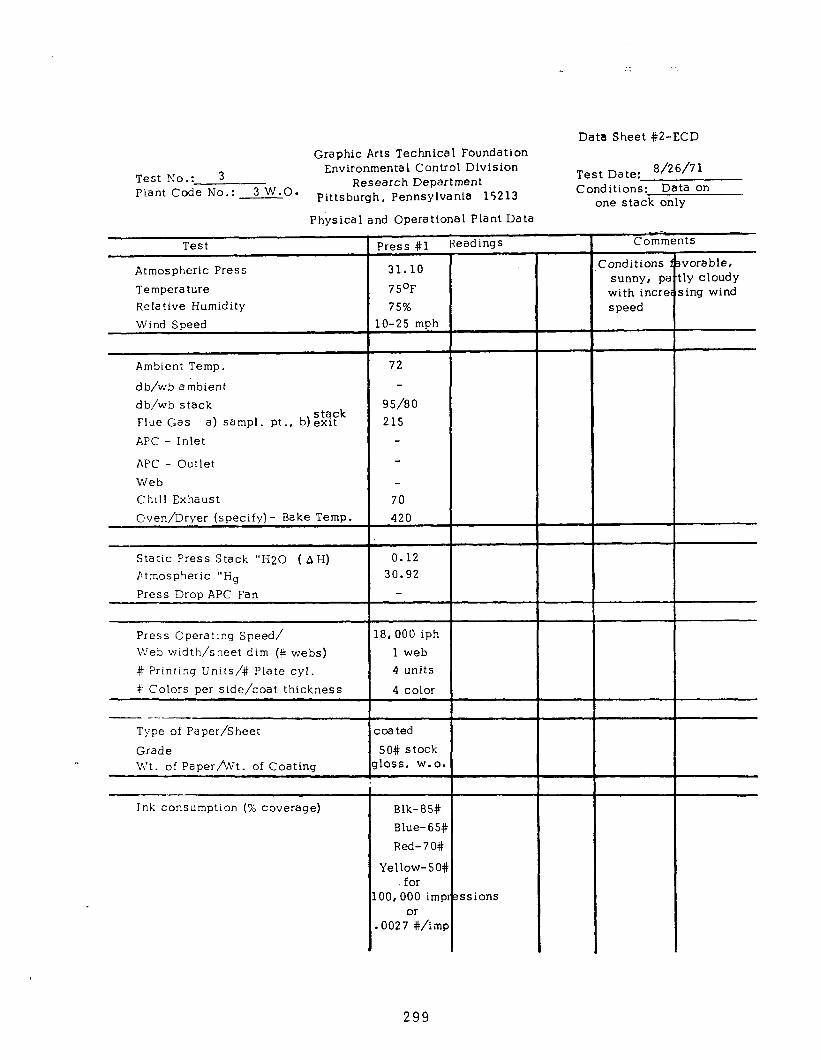
Graphic Arts Technical Foundation Data Sheet #2-ECD
Test No.: 3 Environmental Control Division 8/26/71
Plant Code No.: 3 W.O. Research Department
Test Date:
Pittsburgh, Pennsylvania 15213 Conditions: Data on
one stack only
Test Comments
Atmospheric Press Temperature Relative Humidity
31.10 75OF 75%
lo-25 mph
:onditions sunny, pe with incre speed
lvorable, tly cloudy s ing wind
Wind Speed
Physical and Operational Plant Data
r
Ambient Temp.
db/wb ambient db/wb stack Flue Gas
stack a) sampl. pt ., b) exit
APC - Inlet
72
95/80 215
APC - Outlet Web Chill Exhaust C!ven/Dryer (specify) - Bake Temp.
70 420
Static Press Stack “H2G ( AH) F,tmospheric “Hg Press Drop APC Fan
0.12 30.92
Press Operating Speed/ 18,000 iph Web width/sheet dim (4 webs) 1 web # Printing Unrts/# Plate cyl. 4 units 4: Colors per side/coat thickness 4 color
~ --~ Type of Paper/Sheet Grade Wt. of Papermt. of Coating
coated 50# stock
rloss, w. 0.
Ink consumption (% coverage) Blk-85# Blue-65# Red-70#
Yellow-50# for
00,000 imp or
0027 #/imF
!ssions
299
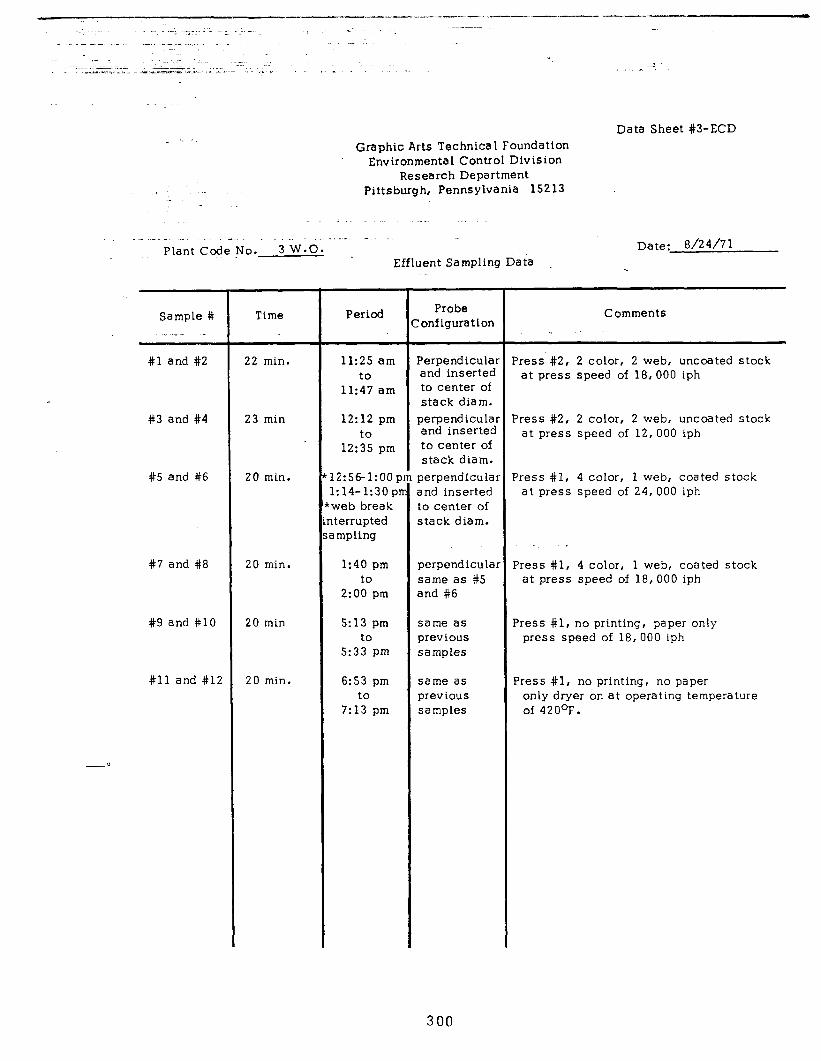
,
._ .-
Graphic Arts Technical Foundation Environmental Control Division
Research Department Pittsburgh, Pennsylvania 15213
Data Sheet #3-ECD
. ._ _ -, ^ _- -- _ _ _ - _ Plant Code No. 3 W.O.
Effluent Sampling Data Date: 8/24/71
Sample # , ._ - .-
#l and #2 22 min.
#3 and #4 23 min
#5 and #6 20 min.
#7 and #8
#9 and #lO
#ll and #12
Time
20 min.
20 min
20 min.
Period
11:25 am to
11:47 am
12:12 pm to
12:35 pm
12:56- 1:00 p 1:14-1:3opr web break lterrupted a mpling
1:40 pm to
2~00 pm
5:13 pm to
5:33 pm
6:53 pm to
7:13 pm
Probe Ionfiguration
Perpendicular and inserted to center of stack diam.
perpendicular and inserted to center of stack diam.
perpendicular and inserted to center of stack diam.
perpendicular same as #5 and #6
same as previous samples
same as previous samples
Comments
Press #2, 2 color, 2 web, uncoated stock at press speed of 18,000 iph
Press #2, 2 color, 2 web, uncoated stock at press speed of 12,000 iph
Press #I, 4 color, 1 web, coated stock at press speed of 24,000 iph
Press #l, 4 color, 1 web, coated stock at press speed of 18,000 iph
Press #I, no printing, paper only press speed of 18,000 iph
Press #I, no printing, no paper only dryer on at operating temperature of 420°F.
300
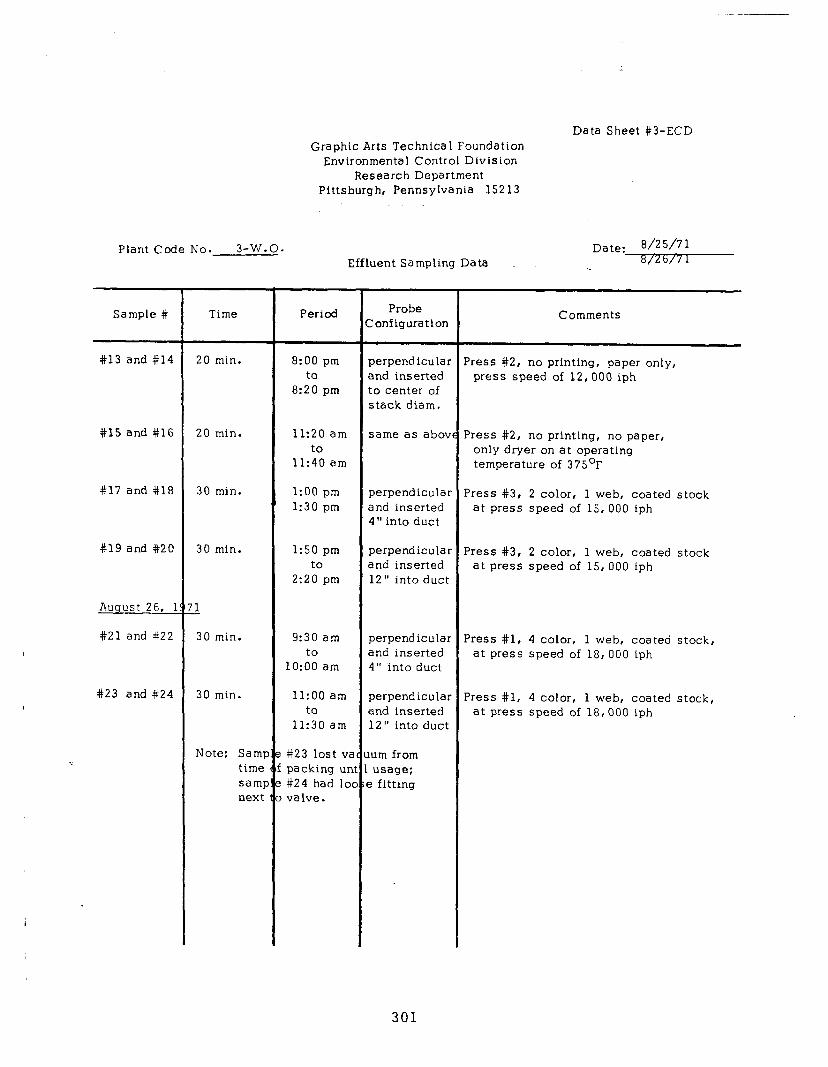
Plant Code No. 3-W.O.
Sample #
#13 and #14
#15 and #16 20 min.
#17 and #lS 30 min.
#19 and #20
Auqust 26, 1
821 and #22
#23 and #24
i
Time
20 min.
30 min.
11
30 min.
30 min.
Note: SamI time samF next
Graphic Arts Technica I Foundation Environmental Control Division
Research Department Pittsburgh, Pennsylvania 15213
Data Sheet #3-ECD
Date: B/25/71 Effluent Sampling Data 8/Z b/7 1
Period
8:00 pm to
8:20 pm
11:20 am to
11:40 am
1:00 pm 1~30 pm
1:50 pm to
2:20 pm
9:30 am to
1O:OO am
11:OO am to
11:30 am
#23 lost VE packing un #24 had lo, valve.
Probe Ionfiguration
perpendicular snd inserted :o center of stack diam.
same as abov
perpendicular and inserted 4” into duct
perpendicular snd inserted 12” into duct
perpendicula and inserted 4” into duct
perpend icula and inserted 12” into duct
turn from usage:
s fitting
Comment5
Press #2, no printing, paper only, press speed of 12,000 iph
Press #2, no printing, no paper, only dryer on at operating temperature of 375’F
Press #3, 2 color, 1 web, coated stock at press speed of 15,000 iph
Press #3, 2 color, 1 web, coated stock at press speed of 15,000 iph
Press #l, 4 color, 1 web, coated stock, at press speed of 18, 000 iph
Press #l, 4 color, 1 web, coated stock, at press speed of 18,000 iph
301
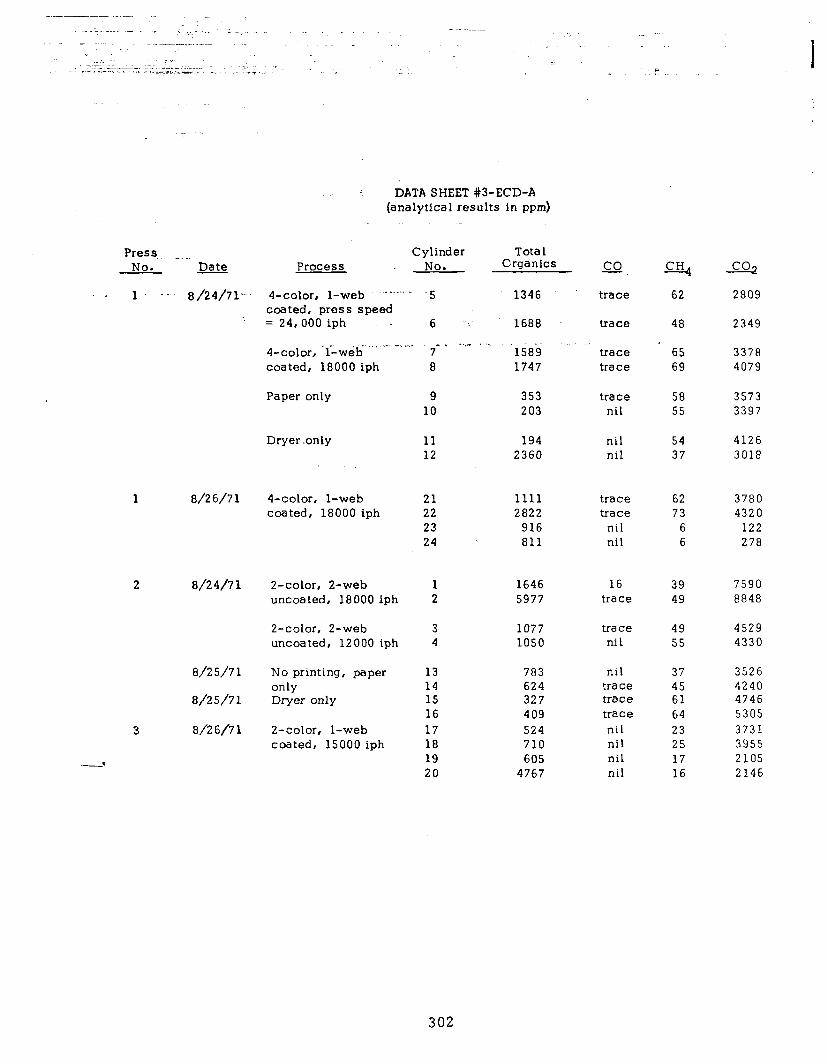
DATA SHEET #3-ECD-A (analytical results in ppm)
Cylinder Tota 1 Process No. Organics
4-color, l-web ,,. _.. . -5 1346
Press _ _. NO. Date a..
trace
trace
trace
CH, -=2 62 2809
coated, press speed = 24,000 iph .
J-color, TfLw&m. .’ - __ coated, 18000 iph
6 i’ 1688 48 2349 . a.
7 8
. .,,. s
‘1589 .- 1747
65 3378 69 4079
Paper only 9 353 trace 58 3573 10 203 nit 55 3397
Dryer .only 11 194 nil 54 4126 12 2360 nil 37 3018
4-color, l-web coated, 18000 iph
21 1111 trace 62 3780 22 2822 trace 73 4320 23 916 nil 6 122 24 811 nil 6 278
2-color, a-web 1 1646 16 39 7590 uncoated, 18000 iph 2 5977 trace 49 8848
Z-color, Z-web 3 1077 trace 49 4529 uncoated, 12000 iph 4 1050 nit 55 4330
No printing, paper only Dryer only
Z-color, l-web coated, 15000 iph
13 783 nil 37 3526 14 624 trace 45 4240 15 327 trace 61 4746 16 409 trace 64 5305 17 524 nil 23 3731 18 710 nil 25 3955 19 605 nil 17 2105 20 4767 nil 16 2146
. 1. -. 8/24/71-
1 8/2 6/7 1
2 8/24/71
8/2 5/7 1
8/25/71
3 a/26/71
302
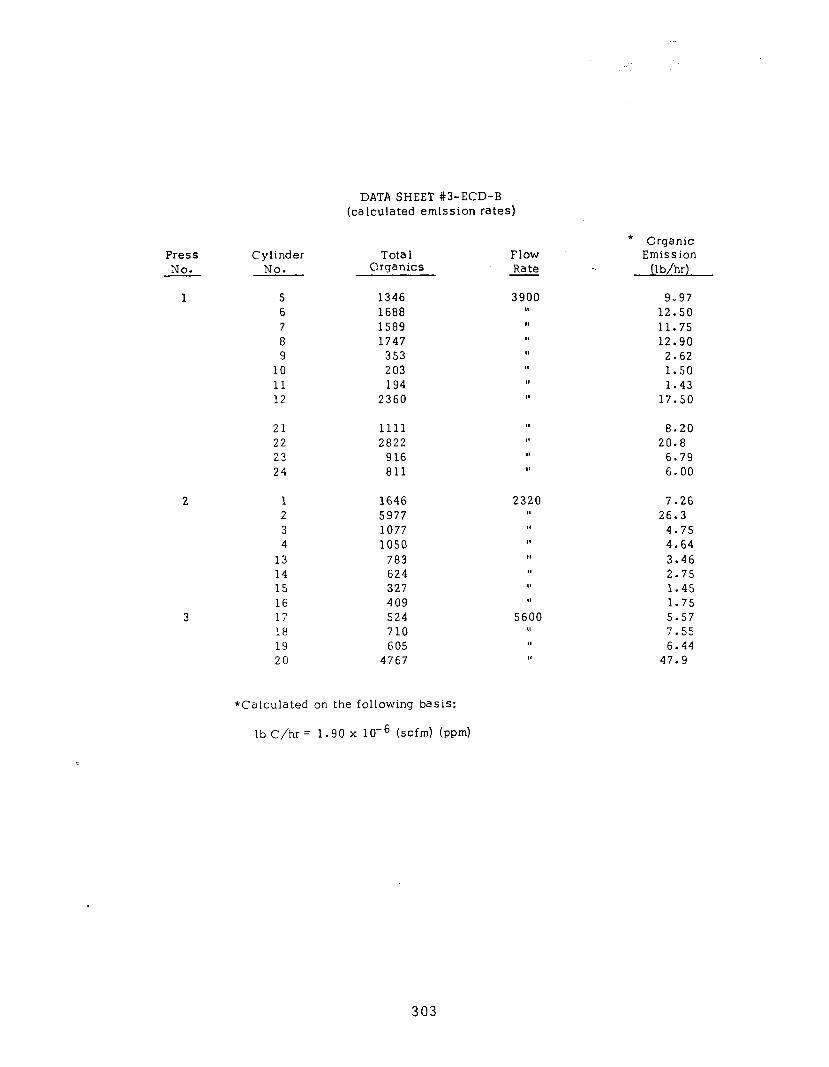
Press Cylinder Tota 1 Flow NO. No. Organics Rate
1
* Organic Emission
(lb/hr)
5 1346 6 1688 7 1589 8 1747 9 353
10 203 11 194 12 2360
9.97 12.50 11.75 12.90 2.62 1.50 1.43
17.50
21 1111 II 8.20 22 2822 II 20.8 23 916 II 6.79 24 811 II 6.00
1 1646 2 5977 3 1077 4 1050
13 783 14 624 15 327 16 409 17 524 18 710 19 605 20 4767
7.26 26.3
4.75 4.64 3.46 2.75 1.45 1.75 5.57 7.55 6.44
47.9
DATA SHEET #3-ECD-B (calculated emission rates)
*Calculated on the following basis:
Ib C/hr= 1.90 x 10s6 (SCfd (PPm)
303

DATA SHEET #3-ECD-C Comparison Calculated and Observed Emission Rates
Press
No.
1
Cylinder(‘) Emission(2) Emission(‘) (Conversion(4)
Factor) No. (calculated) E,bs ./Eta lc. (observed1
5&6 25.06 11.24 .45
1 7&B 19.26 12.32 .63
1 23, 23, 24 19.40 7.00 .36
2 1 16.0 7.26 .454
2 3&4 11.75 4.69 .398
(1) Average value of duplicate samples utilized in calculation. (2) Calculated emission rate inclusive of paper contribution as
determined in previous test series. (3) Based on recorded press data as obtained during test. (4) Fraction of organics not converted to CO2 and H20 in the dryer.
304
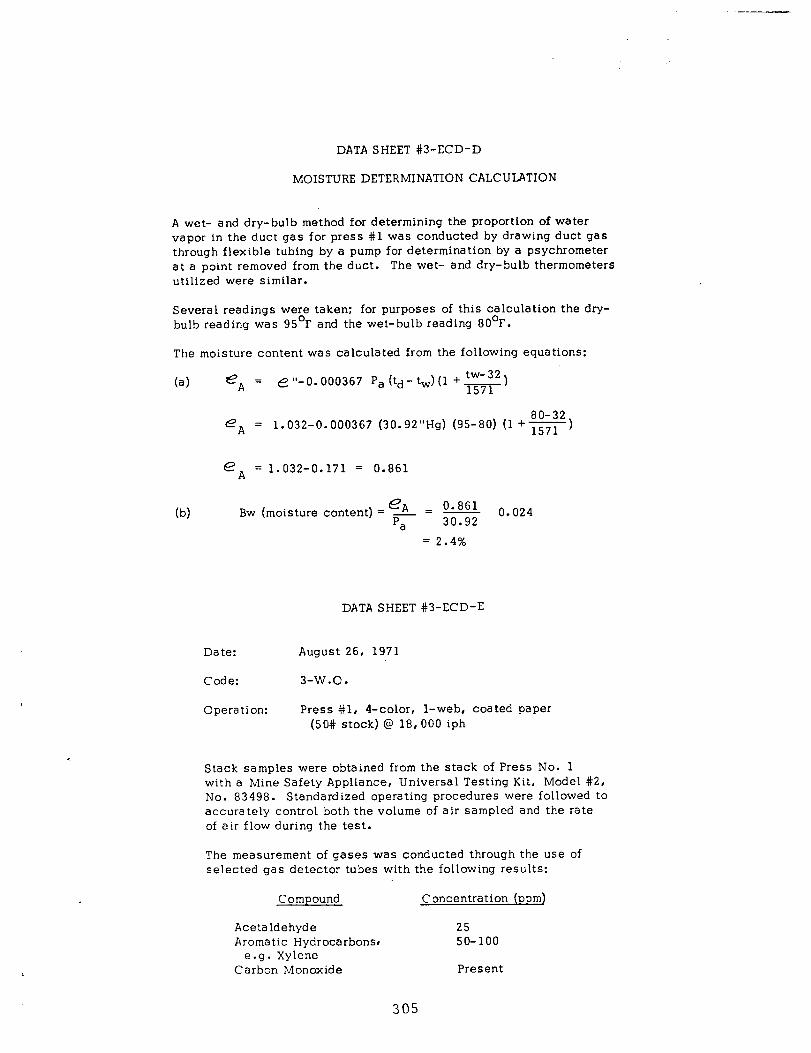
DATA SHEET #3-ECD-D
MOISTURE DETERMINATION CALCULATION
A wet- and dry-bulb method for determining the proportion of water vapor in the duct gas for press #1 was conducted by drawing duct gas through flexible tubing by a pump for determination by a psychrometer at a point removed from the duct. The wet- and dry-bulb thermometers utilized were similar.
Several readings were taken: for purposes of this calculation the dry- bulb reading was 95’F and the wet-bulb reading 80°F.
The moisture content was calculated from the following equations:
(a) Ed = e “-0.000367 pa (td- tw) (1 + g)
80-32 (1 +- 1571 1 @A = 1.032-0.000367 (30.92”Hg) (95-80)
eA = 1.032-0.171 = 0.861
bl CA 0.861 Bw (moisture content) = p = - 0.024 a 30.92
= 2.4%
DATA SHEET #3-ECD-E
Date: August 26, 1971
Code: 3-w-o.
Operation: Press #l, 4-color, l-web, coated paper (50# stock) @ 18,000 iph
Stack samples were obtained from the stack of Press No. 1 with a Mine Safety Appliance, Universal Testing Kit, Model #2, No. 83498. Standardized operating procedures were followed to accurately control both the volume of air sampled and the rate of air flow during the test.
The measurement of gases was conducted through the use of selected gas detector tubes with the following results:
Compound Concentration (ppm)
Acetaldehyde Aromatic Hydrocarbonsr
e.g. Xylene Carbon Monoxide
25 50-100
Present
305
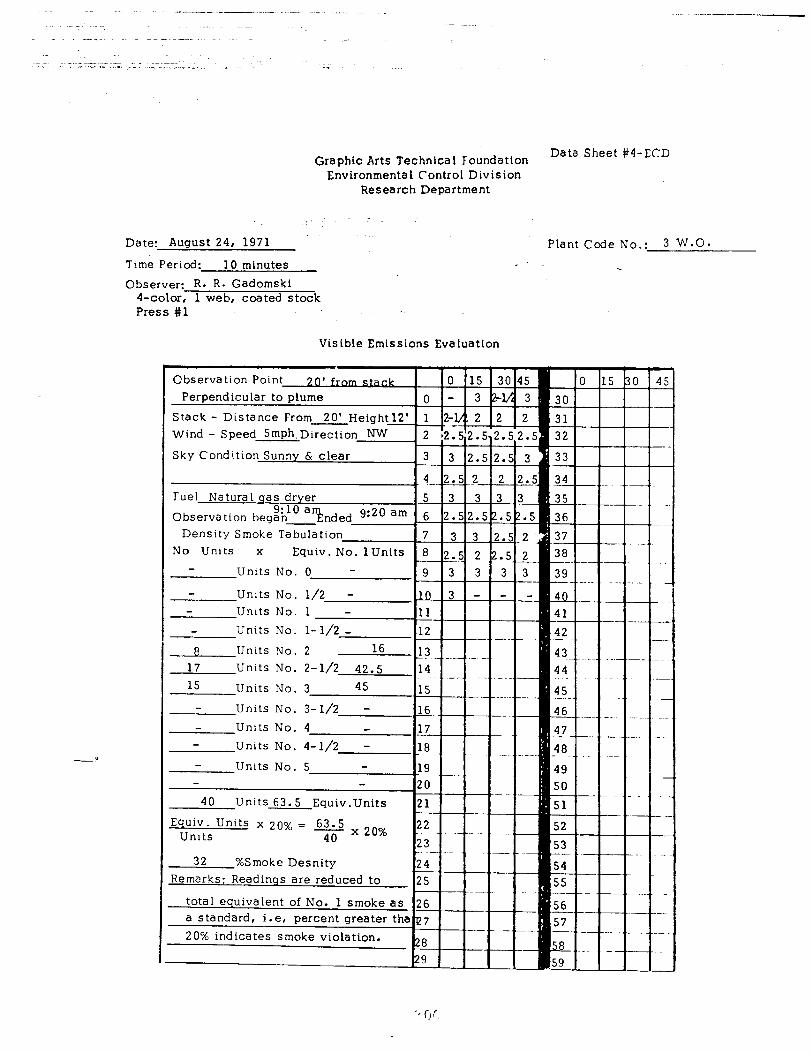
_.-. _,_ -
Graphic Arts Technical Foundation Data Sheet #4-ECD
Environmental Control Division Research Department
. Date: August 24, 1971
Time Period: 10 minutes Observer: R. R. Gadomski
4-color, 1 web, coated stock Press #l
Plant Code No.: 3 W-0.
Visible Emissions Evaluation
Observation Point 20’ from Perpendicular to plume
Stack - Distance From 20’ Height12’ Wind - Speed 5mph.Direction NW
Sky Condition Sunny & clear
Fuel Na tura 1 qas dryer 9:lO a Observation began 3 nded g:20 am
Density Smoke Tabulation No Units x Equiv. No. 1 Units
Units No. 0 -
-Units No. l/2 - Units No. 1 - Units No. l-1/2 -
Units No. 2 9 16 17 Units No. 2-l/2 42.5 15 Units No. 3 45
Units No. 3-l/2 - Units No. 4 Units No. 4-l/2 -
Units No. 5
40 Units 63.5 Equiv.Units
Equiv. Units x 20% = 63.5 Unrts 40 x 20%
32 %Smoke Desnity Remarks: Readinqs are reduced to
total equivalent of No. 1 smoke as a standard, i.e, percent greater tha 20% indicates smoke violation.
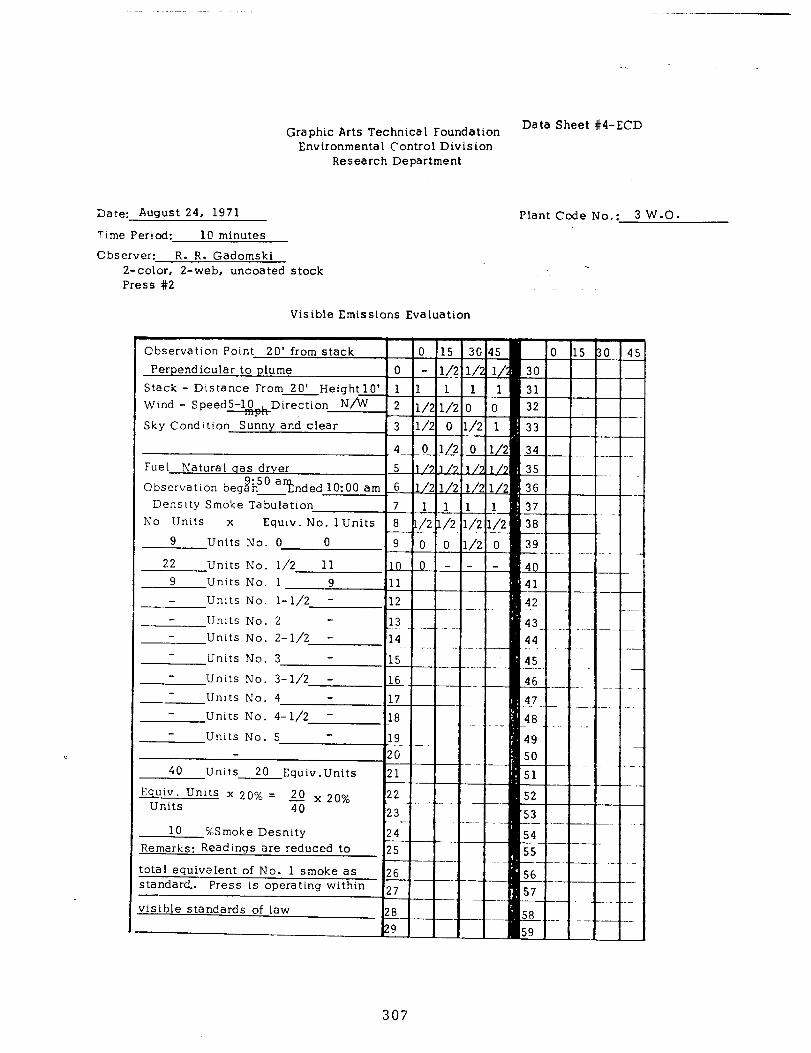
Graphic Arts Technical Foundation Data Sheet #4-ECD
Environmental Control Division Research Department
Date: August 24, 1971
Time Period: 10 minutes
Observer: R. R. Gadomski 2-color, 2-web, uncoated stock Press #2
Plant Code No.: 3 W-0.
Visible Emissions Evaluation
Observation Point 20’ from stack Perpendicular to plume
Stack - Distance From 20’ Height 10’ MIind - Speed5-10 -Direction N/W
Sky Condition Sunny and clear
Fuel Natural gas dryer Observation begihE?nded 10:00 am
Density Smoke Tabulatron No Units x Equiv. No. 1Units
9 Units No. 0 0
22 Units No. l/2 11 9 Units No. 1 9
Units No. l-1/2 -
Units No. 2 - Units No. 2-l/2 -
Units No. 3 -
Units No. 3-l/2 - Units No. 4 Units No. 4-l/2 -
Units No. 5 -
40 Units 20 Equiv .Units Zquiv.
Units Units x 20% = 20 x 20%
40
10 %Smoke Desnity ?emarks: Readings are reduced to
otal equivalent of No. 1 smoke as ;tandard. Press is operating within
risible standards of law
.
2
!I 1
T 7 - 0 LL Ll L /:
/:
- - -
-- -
- -
-
-
- -
15 - l/ - 1
i- r - 1L L! SL
.:: - 0 -
- -
- ..- -
._
-- - -
-
-
- 591 1
10 -
-
-
-
-
--
-
-
-
-
-.
-
-
-
-
-
-.
._
E - - - - -
--
- -
- -
__
_. _ . -
- - -- -
307
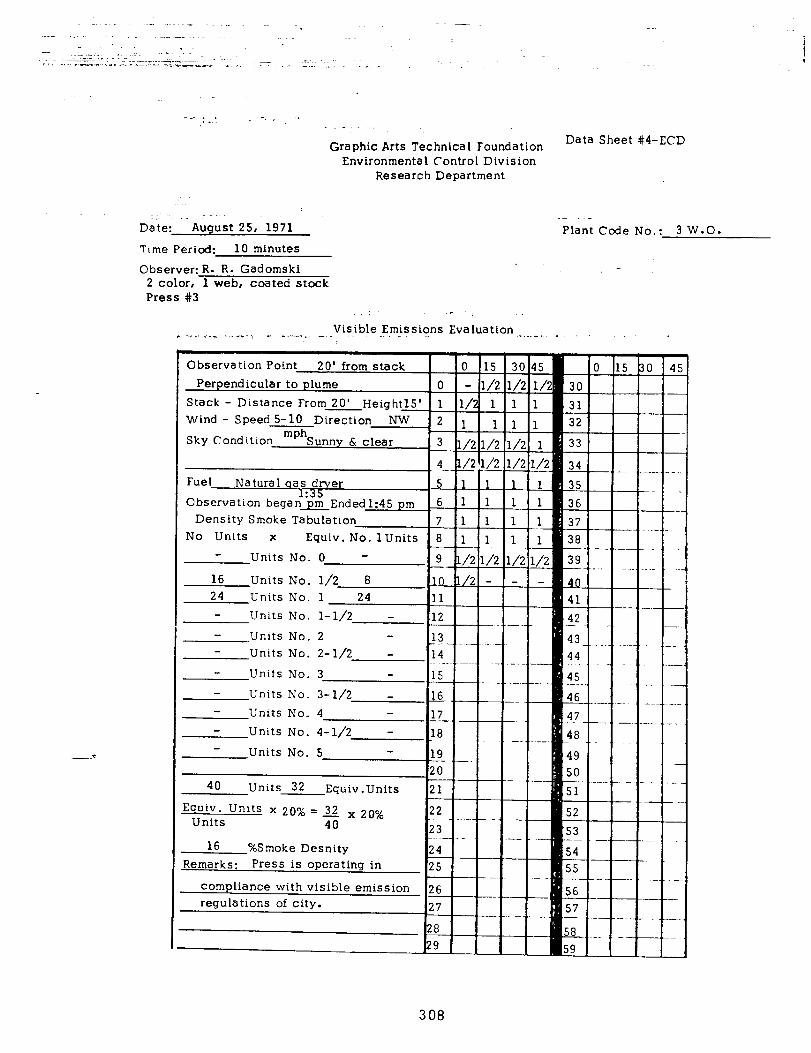
. ..’ -. _ -r
_ .-
Graphic Arts Technical Foundation Data Sheet #4-ECD
Environmental Control Division Research Department
Date: August 25, 1971 Plant Code No.: 3 W.O. Time Period: 10 minutes
Observer: R. R. Gadomski 2 color, 1 web, coated stock Press #3
-
:. Visible Emissions Evaluation . -... ._- -..&I-, . . “. -.-.. -.. .- ^. . .,-.-,,a
Observation Point 20’ from stack Perpendicular to plume
Stack - Distance From 20’ Heightl5’ Wind - Speed 5-10 Direction NW
Sky Condi.tion mph Sunny & clear
Fuel Natural qas dr-ver 1 35
Observation beganLEndedl:45 pm Density Smoke Tabulation
No Units x Equiv. No. 1 Units Units No. 0 -
16 Units No. l/2 8 24 Units No. 1 24
Units No. l-l/Z -
Units No. 2 Units No. 2-l/2 -
Units No. 3
Units No. 3-l/2 _ Units No. 4 Units No. 4-l/2 -
Units No. 5
40 Units 32 Equiv .Units
E;;yti Units x 20% = z x 2o%
16 %Smoke Desnity Remarks: Press is operating in
compliance with visible emission regulations of city.
30 45 l/2 l/: 1 1
1 1
l/2 1 l/2 l/2
1 1 1 1 1 1 1 1
L/2 l/2 - -
-__
-...-- -....._ -_ _ -_- -. .~
-- .-
-- ..-
- -__ ---
_- -
-
_. -. -
.-
-
308
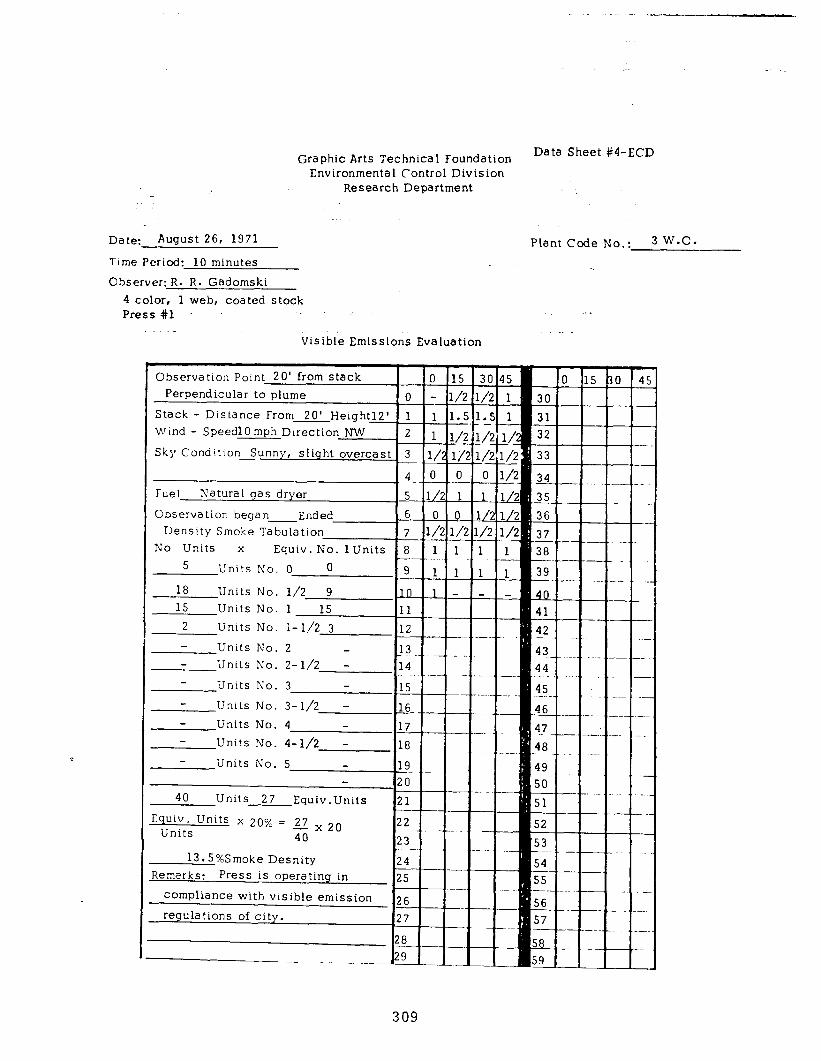
Graphic Arts Technical Foundation Data Sheet #4-ECD
e
Environmental Control Division Research Department
Date: August 26, 1971 PLant Code No.: 3 W.O.
Ttme Period: 10 minutes
Observer: R. R. Gadomski 4 c:olor, 1 web, coated stock Press #l .: I. .
._ Visible Emissions Evaluation
Observation Point 20’ from stack 0 15 Perpendicular to plume 0 - 1/
Stack - Distance From 20’ Heightl2’ 1 1 1. Wind - Speed10 mph Dxection NW 2 1 1/ Sky Condition Sunny, slight overcast 3 l/2 1; _-_
___, 4--L-? Fuel 5 l/2 1 Natural gas dryer
Observation bega 00 6 Density Smoke Tabulation 7 l/2 l/
No Units x Eguiv. No. 1 Units 8 1 1 5 Units No. 0 0 9 1 1 _-
18 Units No. 9 l/2 10 1 - 15 Units No. 1 15 11
2 Units No. l-1/2 3 12 Units No. 2 23 ._~ .-. .- Units No. 2-l/2 - 14 -... Units No. 3 15 Unrts No. 3-l/2 - 16 __ Units No. 4 17 Units No. 4-l/2 - 18 Units No. 5 19
2d - 40 Units 27 21 Equiv .Units
E:;-~~;LJnits. x 20% = 27 x 20 22 40 23 ---- -. .
13.5%Smoke Desnity 24 Remarks: Press is operating in 2.5
compliance with visible emission 26 regulations of city. .27
28
30 45 l/2 1 T 1.5 1
l/2 1 I;&
0 1/ -- 1 1,
l/2 l/ ./2 1/ -..- 1 1
1 1 - -
-.__
-.-._ . _ _ __
^.- _
.-
--- -
0
30 31 32
34 35 36 37 38 --. ___ 39 -_.._._ 40 41 42
43--. - 44
45
46..- 47 48 __ 49 50 51
52 53
54 -__ 55 -_ ___ 56 --- 57
._--
.-._.. ~_
-- .--
. ..__ -
_.-- -. _
_-
-. _-
_..
--_ - -_-
309
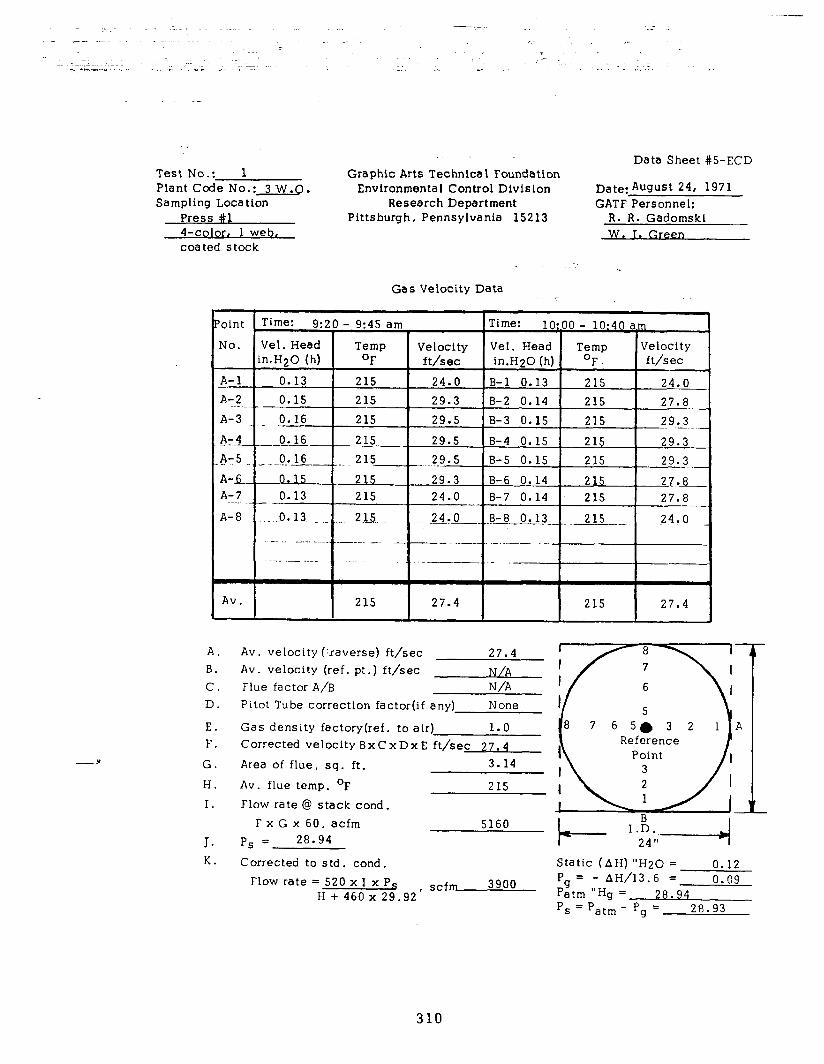
Test No.: 1 Plant Code No.: 3 W.0. Sampling Location
Press #l 4-color, 1 web, coated stock
. .:
F-
. _. -. _ -_ .:_
Graphic Arts Technical Foundation Environmental Control Division
Research Department Pittsburgh, Pennsylvania 15213
Data Sheet #5-ECD
Date: August 24, 1971 GATF Personnel:
R. R. Gadomski W. T. Green
._ . .
Gas Velocity Data
Point
No.
A-l A-2 A-3
A:4- .A-5 _ A?&.- A-7
A-8
Av.
Time: 9:20 - 9:45 am 1 Time: lo:.00 - lo:40 a.m I I 1 I I 1
Vel. Head Temp in.HgO (h) of
0.13 215 0.15 215 -- 0.16 215 --
..~-Gfi 215L- ~~2,~a~-~. 215__
215 215
I -. ____-..-_ + ___. __. -
r ---~ -- ---- t
Velocity Vel. Head Temp ft/sec in.H20 (h) OF
24.0 B-l 0.13 215 29.3 B-2 0.14 215 29.5 B-3 0.15 215
29.5 B-4 0.15 215 __ T-9.5 B-5 0.15 215
29.3 B-6 0.14 215 24.0 B-7 0.14 215 --- 24.0- -B-80.13_- 2 15 _. _
-7 .-.--__ -t---
Velocity ft/sec
24.0 27.8 29.3 __... ~.-_ _ 29.3 29.3 - ._
27..8 27.8
24.0 _
I 215 I
27.4
-P
A. B. C. D.
E. F.
G.
H. I.
J. K.
Av. velocity (:.raverse) ft/sec 27.4 Av. velocity (ref. pt.) ft/sec N/A Flue factor A/B N/A Pitot Tube correction factor(if any) None
Gas density factory(ref. to air) 1.0 Corrected velocity BxCxDxE ft/sec 27.4
Area of flue, sq. ft. 3.14
Av. flue temp. OF 215 Flow rate @ stack cond.
FxGx60, acfm P, = 28.94
Corrected to std. cond.
5160
Flow rate = 520 x I x P, , scfm 3900 H + 460 x 29.92
Static (AH) “H20 = 0.12 Pg = - AH/13.6 = 0.09 Patm “Hg = 28 94 P, = Pat, - Pg = * 28.93
310

Test No.: 2 Plant Code No.: 3W.0. Sampling Location
Press #2 -2-color, 2 web,
uncoated stock
Graphic Arts Technical Foundation Envtronmental Control Division
Research Department Pittsburgh, Pennsylvania 15213
Data Sheet ‘-:-Ef:D
Date: B/24/? 1 GATF Personnel:
R. R. Gadomski W. J. Green
.
Gas Velocity Data
‘oint Time: 1o:so - 11:OO am Time: 11:os - 11:15 am
No. Vel. Head Temp Velocity Vel. Head Temp Velocity in.H20 (h) OF ft/sec in.H20 (h) OF ft/sec
A-l 0.01 240 7.66 B-l 0.02 240 10.85 A-2 0.01 240 7.66 B-2 0.02 240 10.85
A-3 _ 0.015 -240 8.24 B-3 0.02 240 10.85-
A :e__ t.1~ .2!3!!~~~ ____ 10.85 B-4 0.02 240 10.85 a-5. 0.02 240 -. 240 - _._--- ._.__. .w5 B-5 0.024 12.14 -. ._ A-L-. 0.025 240 12.14 B-6 0.03 240 13.30- A-? 0.03 240 13.30 B-7 0.02 240 10.85 ---
-’ A-8 0.02 240 10.85 B-8 0.015 240 8 .2 4.-- -~ . .--. ----. . . -__ __ ._ _ A-9 10.85 B-9 0.01 240 m.0. OZ. ?!!2. 7.66 .._._.. -.- ____.._ .._ A-10 ..-0,_0_15~ 240 8.24 --B-10 0.01 240 7.66
Av. 540 10.06 240 10.32
A.
8. C. D.
E. F.
G.
H. I.
Av. velocity (zraverse) ft/sec 10.19 Av. velocity (ref. pt.) ft/sec N/A Flue factor A/B N/A Pitot Tube correction factor(if any) None
Gas density factory(ref. to air) 1.0 Corrected velocity BxCxDxE ft/sec 10.19 Area of flue, sq. ft. 4.90 Av. flue temp. OF 240 Flow rate @ stack cond.
F x G x 60, acfm J. P, = 78.94
3000
K. Corrected to std. cond. Static (AH) “H20 = 0.03 Flow rate = 520 x I x P, scfm 2320
H + 460 x 29.92’ Pg = - AH/13.6 = .0008 Patm “Hg = 28.94 P, = Patm - Pg = 28.94
311
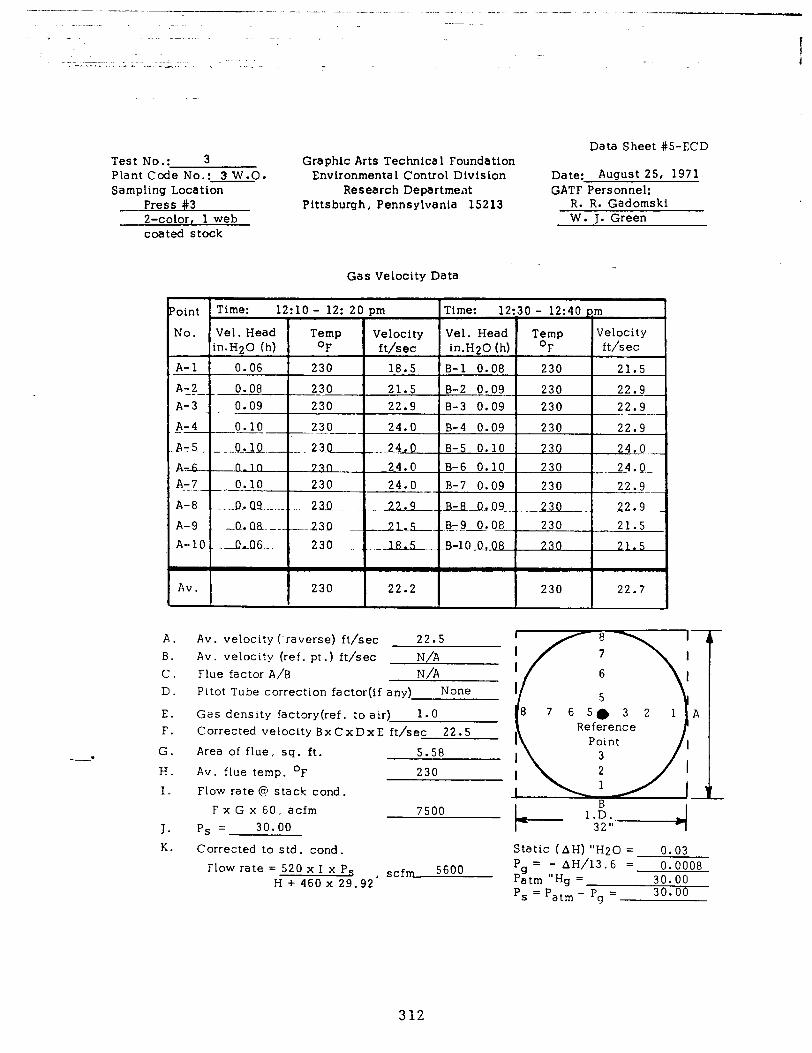
Data Sheet #5-ECD Test No.: 3 Graphic Arts Technical Foundation Plant Code No.: 3 W-0. Environmental Control Division Date: August 25, 1971 Sampling Location Research Departmed GATF Personnel:
Press #3 - _ 2-color, 1 web
coated stock
Pittsburgh, Pennsylvania 15213 R. R. Gadomski W. J. Green
Gas Velocity Data
A. B.
C.
D.
E. F.
G.
H. I.
J. K.
--
Av. I
Av. velocity (‘raverse) ft/sec 22.5 Av. velocity (ref. pt.) ft/sec N/A Flue factor A/B N/A Pitot Tube correction factor(if any) None
Gas density factory(ref. to air) 1.0 Corrected velocity BxCxDxE ft/sec 22.5 Area of flue, sq. ft. 5.58 Av. flue temp. OF 230 Flow rate @ stack cond.
Reference
Fx G x 60. acfm 7500 P, = 30.00
Corrected to std. cond, Flow rate = 520 x I x Ps
H + 460 x 29.92’ scfm 5600
Static (AH) “H20 = 0.03 Pg = - AH/13.6 = 0.0008 Patm “Hg = 30.00 P, = Pat, - Pg = 30.00
312
~35 - 19/1 CARNEGIE-MELLON UNIVERSITY GATE MELLON INSTITUTE
RESEARCH SERVICES
PHYSICALY (7615-2)
Graphic Arts FdOW Dr. William Green (2) Account No.Technicandation
P. 0. II3104 Investigation Air Pollution Program
Investigation No PML 71-228-3,-W.0. NATURE Preliminary September 21, 1971 OF
1 PrOgreW
Date of Report REPORT Final x
The twenty-four samples of stack gas effluent, which you submitted,
have been analyzed by the procedure described in a previous report dated
October 2, 1970. The data are tabulated in the attached table.
Paul R. Eisaman Fellow Physical Measurements Laboratory
PRE:jdf
R&T: 9/29/71
Form 111
313
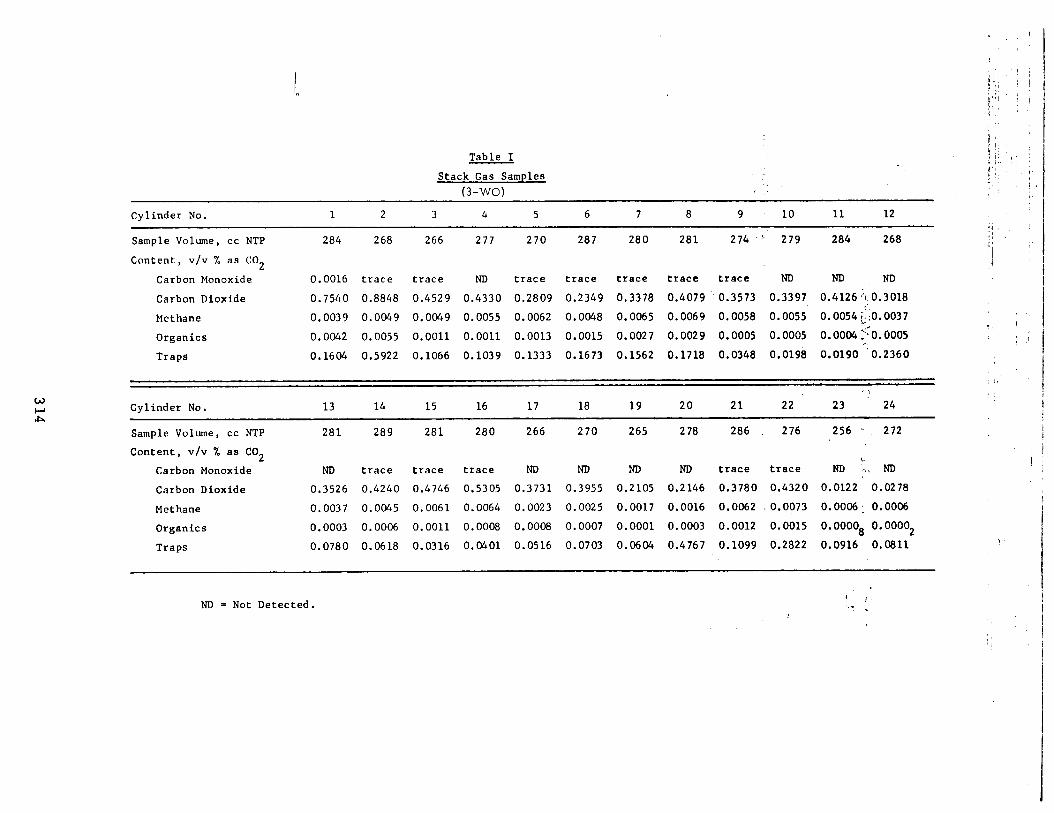
I n
Table I
Stack Gas Samples (3-WO)
Cylinder No. 1 2 3 4 5 6 7 8 9 10 11 12
Sample Volume, cc NTP
Content, v/v % as CO2
Carbon Monoxide
284 268 266 277 270 287 280 281 274 ’ 279 284 268
0.0016 trace trace ND trace trace trace trace trace ND ND ND
Carbon Dioxide 0.7540 0.8848 0.4529 0.4330 0.2809 0.2349 0.3378 0.4079’ 0.3573 0.3397 0.4126’10.3018
Methane 0.0039 0.0049 0.0049 0.0055 0.0062 0.0048 0.0065 0.0069 0.0058 0.0055‘ 0.0054tj’:O.O037
Organic6 0.0042 0.0055 0.0011 0.0011 0.0013 0.0015 0.0027 0.0029 0.0005 0.0005 0.00045::0.0005 r. Traps 0.1604 0.5922 0.1066 0.1039 0.1333 0.1673 0.1562 0.1718 0.0348 0.0198 0.0190 ‘0.2360
Cylinder No.
Sample Volume, cc NTP
Content, v/v % as CO2
Carbon Monoxide
Carbon Dioxide
Methane
Organics
Traps
i i 13 14 15 16 17 18 19 20 21 22 23 24
281 289 281 280 266 270 265 278 286 276 256 r’ 272
ND trace trace trace ND ND ND ND trace trace ND :. ND
0.3526 0.4240 0.4746 0.5305 0.3731 0.3955 0.2105 0.2146 0.3780 0.4320 0.0122 0.0278
0.0037 0.0045 0.0061 0.0064 0.0023 0.0025 0.0017 0.0016 0.0062 0.0!73 0.0006: 0.0006
0.0003 0.0006 0.0011 0.0008 0.0008 0.0007 0.0001 0.0003 0.0012 0.0015 0.0000, 0.0000,
0.0780 0.0618 0.0316 0.0401 0.0516 0.0703 0.0604 0.4767 0.1099 0.2822 0.0916 0.0811
ND = Not Detected.
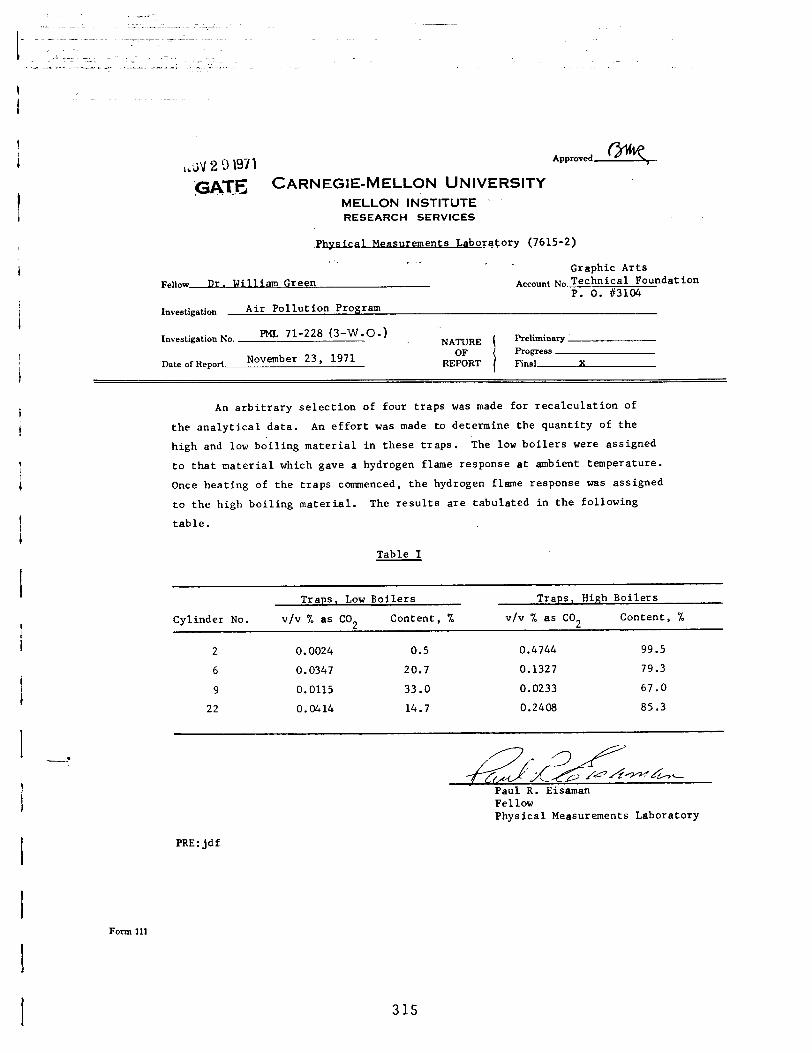
,,i;v 2 9 197 I
‘GM-6 CARNEGIE-MELLON UNIVERSITY MELLON INSTITUTE RESEARCH SERVICES
Approd~
Measurements Laboratory (7615-2)
F~I~W Dr. UlUam Green Graphic Arts
Account MaTechnical Foundation P. 0. 113104
Investigation Air Pollution Program
Investigation No. PML 71-228 (3-W.O.) NATURE Preliminary
Date of Report November 23, 1971 OF 1
progress REPORT Final X
An arbitrary selection of four traps was made for recalculation of
the analytical data. An effort was made to determine the quantity of the
high and low boiling material in these traps. The low boilers were assigned
to that material which gave a hydrogen flame response at ambient temperature.
Once heating of the traps commenced, the hydrogen flame response was assigned
to the high boiling material. The results are tabulated in the following
table.
Table I
Traps, Low Boilers Traps, High Boilers
Cylinder No. v/v % as CO2 Content, % v/v % as CO2 Content, %
2 0.0024 0.5 0.4744 99.5
6 0.0347 20.7 0.1327 79.3
9 0.0115 33.0 0.0233 67.0
22 0.0414 14.7 0.2408 85.3
Paul R. Eisaman Fellow Physical Measurements Laboratory
PRE: jdf
Form 111
315
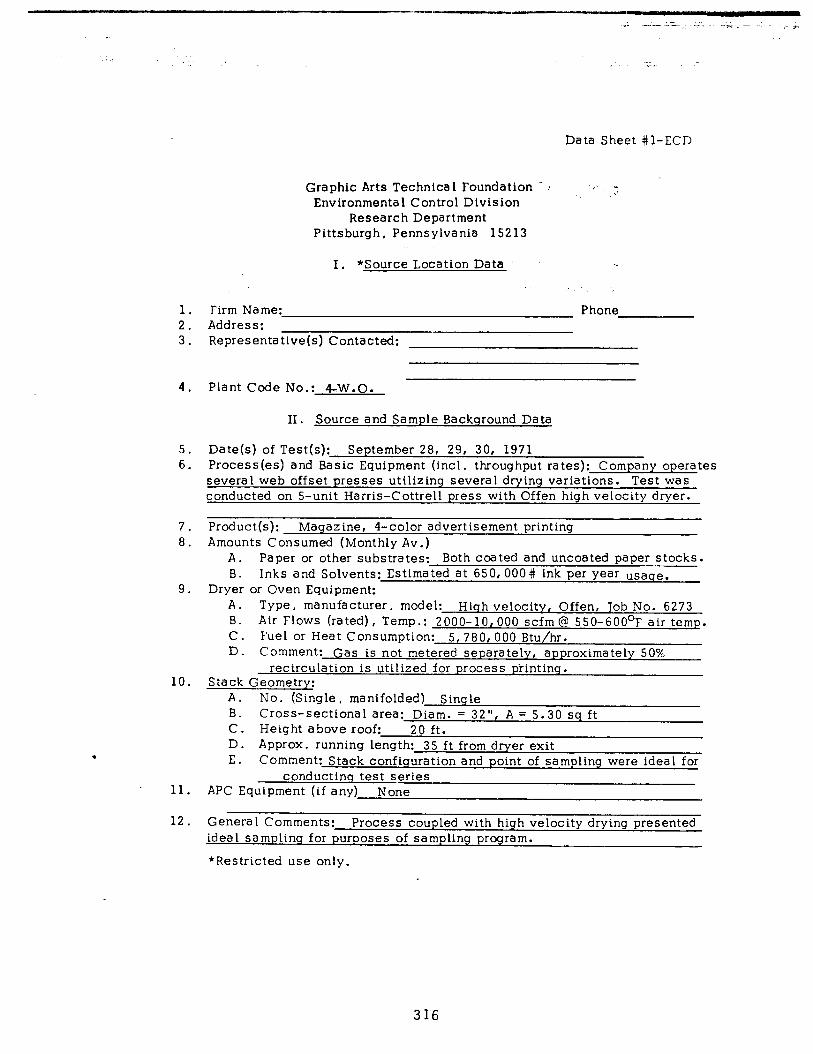
Data Sheet #l-ECD
Graphic Arts Techntcal Foundation ‘. : : : Environmental Control Division
._ __
Research Department Pittsburgh, Pennsylvania 152 13
I. *Source Location Data
‘.
1. Firm Name: Phone 2. Address: 3. Representative(s) Contacted:
4. Plant Code No.: 4-W.O.
II . Source and Sample Background Data
5. Date(s) of Test(s): September 28, 29, 30, 1971 6. Process(es) and Basic Equipment (incl. throughput rates): Company operates
several web offset presses utilizing several drying variations. Test was conducted on S-unit Harris-Cottrell press with Offen high velocity dryer.
7. Product(s): Magazine, 4-color advertisement printing 8. Amounts Consumed (Monthly Av.)
A. Paper or other substrates: Both coated and uncoated paper stocks. B. Inks and Solvents: Estimated at 650,000# ink per year usaqe.
9. Dryer or Oven Equipment:
10.
11.
A. Type, manufacturer, model: Hiqh velocity, Offen, Job No. 6273 B. Air Flows (rated), Temp.: 2000-10,000 scfm @ 550-600°F air temp. C. Fuel or Heat Consumption: 5,780,OOO Btu/hr. D. Comment: Gas is not metered separately, approximately 50%
recirculation is utilized for process printing. Stack Geometry:
No. (Single, manifolded) Sinqle Cross-sectional area: Diam. = 32”, A = 5.30 sq ft Height above roof: 20 ft. Approx. running length: 35 ft from dryer exit Comment: Stack confiquration and point of sampling were ideal for
conductinq test series APC Equipment (if any) None
A. B. C. D. E.
12. Genera 1 Comments: Process coupled with high velocity drying presented ideal samplinq for purposes of sampling program.
*Restricted use only.
316
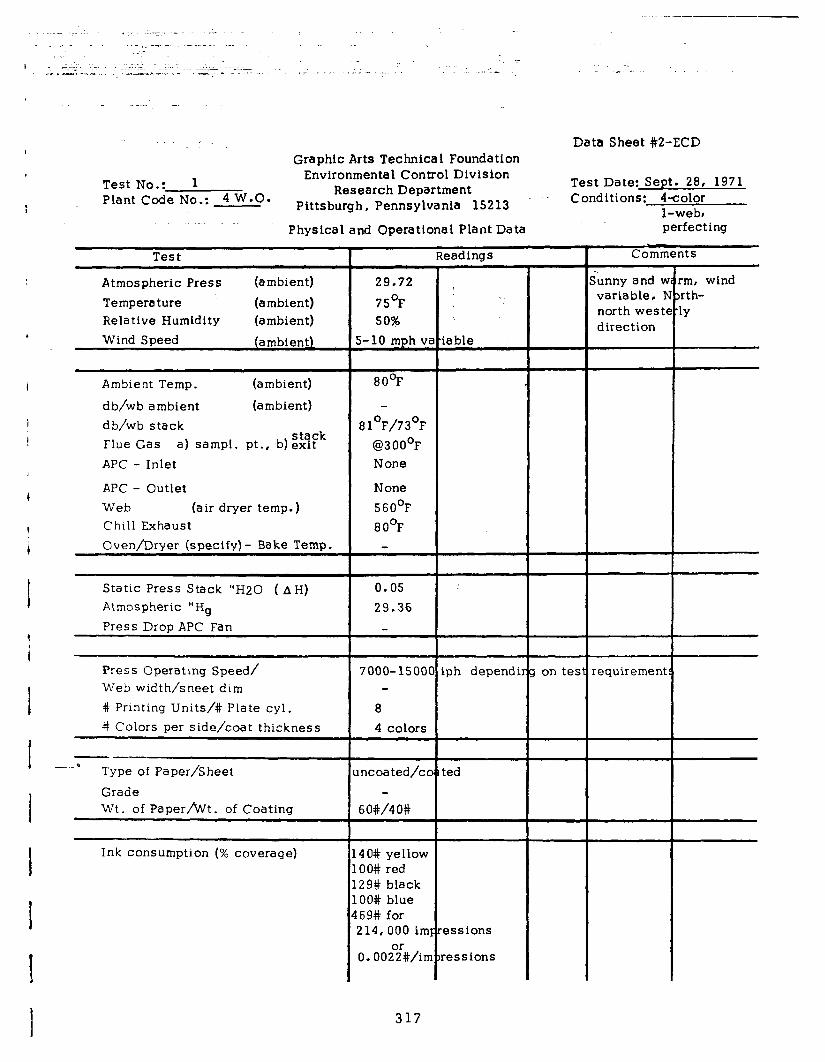
Graphic Arts Technical Foundation Data Sheet #2-ECD
Test No.: 1 E&ronmental Control Division
Research Department Test Date: Sept. 28, 1971
Plant Code No.: 4 W.0. Pittsburgh, Pennsylvania 15213 ’ Conditions: l-color
l-web1 Physical and Operational Plant Data perfecting
Test
Atmospheric Press Temperature Relative Humidity Wind Speed
(ambient)
(ambient) (ambient)
(ambient)
Ambient Temp. (ambient)
db/wb ambient (ambient)
db/wb stack Flue Gas
stack a) sampl. pt., .b) exit
APC - Inlet
APC - Outlet Web (air dryer temp.) Chill Exhaust Oven/Dryer (specify) - Bake Temp.
Static Press Stack “H20 ( AH) Atmospheric “Hg
Press Drop APC Fan
Press Operating Speed/ Web width/sheet dim # Printing Units/# Plate cyl. # Colors per side/coat thickness
-- -* Type of Paper/Sheet
Grade Wt. of Paper/Wt. of Coating
Ink consumption (% coverage)
Readings
29.72
75’F 50%
5-10 mph v#
80°F
81°F/73’F @300’F None
None
56O’F 80°F
0.05 29.36
7000-1500 ph dependi]
8 4 colors
Incoated/cc :ed
60#/40#
40# yellow 00# red 29# black 00# blue 69# for 214,000 im
0. O02°i#/in
.able
sss ions
.essions
on tes
Comments
:unny and v variable, 1 north west’ direction
.equirement
rm, wind lrth- ‘lY
317
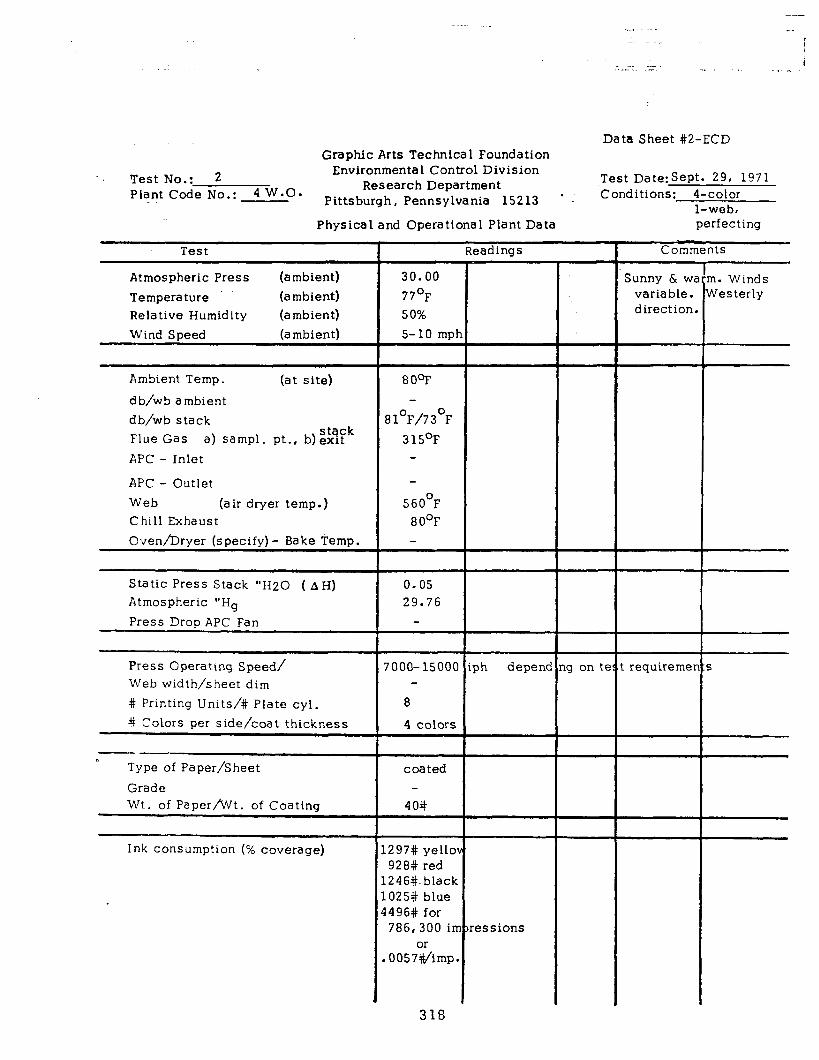
Graphic Arts Technical Foundation
Test No.: 2 Environmental Control Division
Plant Code No.: 4 W.O. Research Department Pittsburgh, Pennsylvania 15213 ’ .’
Physical and Operational Plant Data
Test T
Atmospheric Press (ambient) 30.00
Temperature (ambient) 77’F Relative Humidity (ambient) 50%
Wind Speed (ambient) S-10 mp
Ambient Temp. (at site)
db/wb ambient dh/wb stack Flue Gas stack
a) sampl. pt., b)exit APC - Inlet
APC - Outlet Web (air dryer temp.) Chill Exhaust Oven/Dryer (specify) - Bake Temp.
800F
81°F/73’F
315OF
560°F 8 O°F
Static Press Stack “I-I20 ( AH) Atmospheric “Hg
Press Drop APC Fan
0.05 29.76
Press Operating Speed/ Web width/sheet dim
# Printing Units/# Plate cyl. # Colors per side/coat thickness
8
4 colors
-_ e
Type of Paper/Sheet
Grade Wl:. of Paper/Wt. of Coating
coated
40#
Ink consumption (% coverage) 1
1 1 4
.
.
297# yellc 928# red 246#. black 025# blue !496# for 786,300 ii
0057O$imp
Data Sheet #2-ECD
Test Date:SePt. 29, 1971 Conditions: 4-color
Readings
ph depend ig on te
-essions
l-web, perfecting
Comments T
Sunny & w, variable. direction
requiremel
m. Winds Westerly
5
318
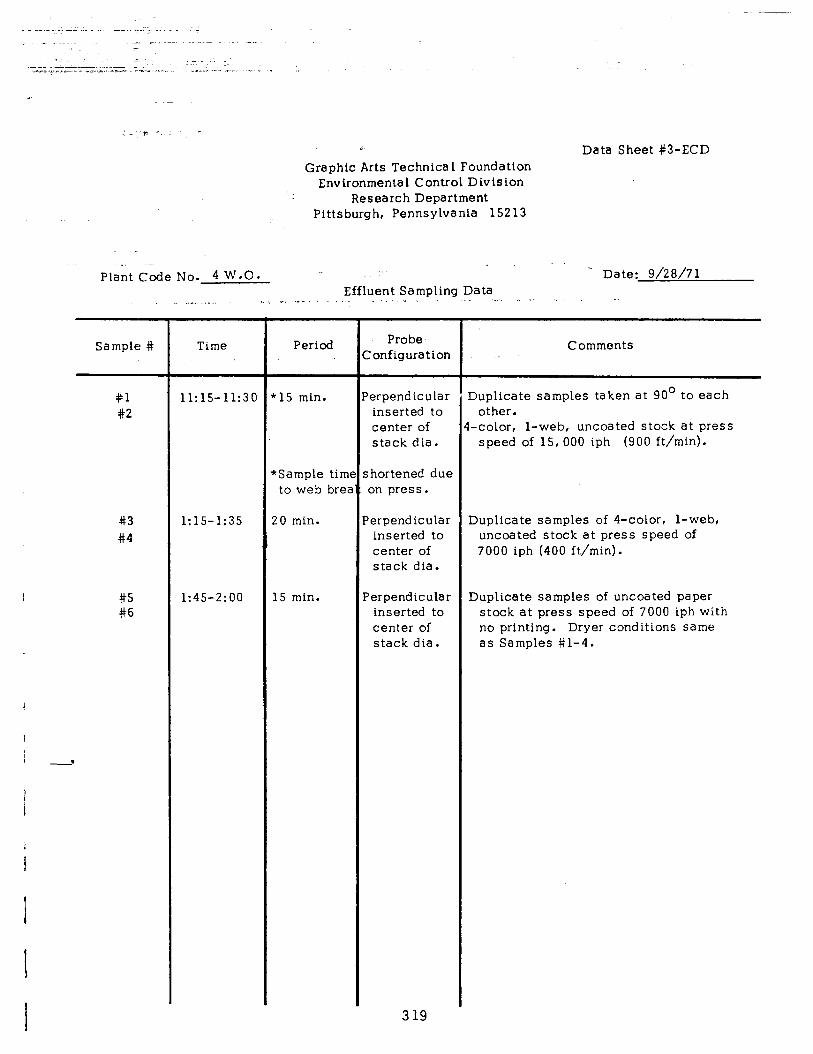
Data Sheet #3-ECD Graphic Arts Technica 1 Foundation
Environmental Control Division Research Department
Pittsburgh, Pennsylvania 15213
Plant Code No. 4 W-0. ‘- -. . Date: g/28/71 Effluent Sampling Data . . . ,. , ._ _ ,. . - . -. - .
Sample #
#l #2
#3 #4
#5 #6
Time
11:15-11:30
1:45-2:00
Period
k15 min.
‘Sample tim to web brew
20 min.
15 min.
Probe ‘onfiguration
‘erpendicular inserted to center of stack dia.
; hortened due on press.
‘erpendicular inserted to center of stack dia.
?erpendicular inserted to center of stack dia.
Comments
Duplicate samples taken at 90’ to each other.
i-color, l-web, uncoated stock at press speed of 15, 000 iph (900 ft/min).
Duplicate samples of 4-color, l-web, uncoated stock at press speed of 7000 iph (400 ft/min).
Duplicate samples of uncoated paper stock at press speed of 7000 iph with no printing. Dryer conditions same as Samples #l-4.
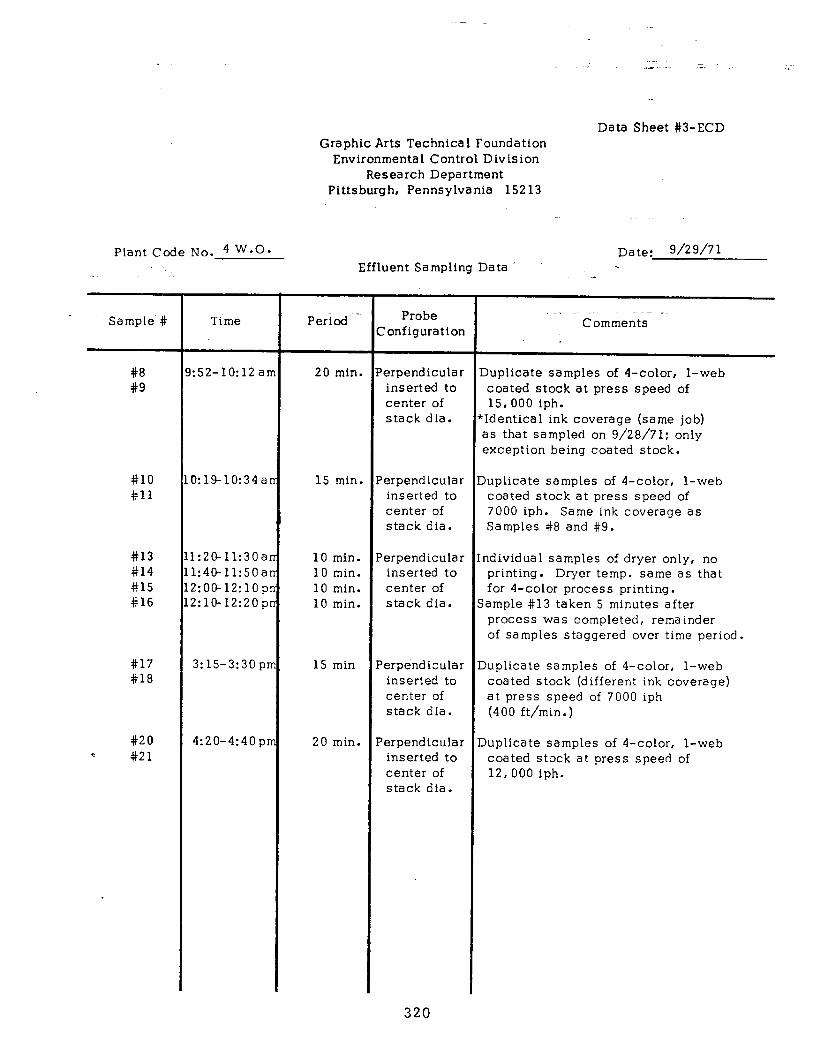
Graphic Arts Technical Foundation Environmental Control Division
Research Department Pittsburgh, Pennsylvania 15213
Data Sheet #3-ECD
Plant Code No. 4 W.0. Date: g/29/71 Effluent Sampling Data
Sample #
#8 #9
#lO #ll
#13 #14 #15 #16
#17 #18
#20 F #21
Time
:52-lo:12 ar 20 min.
0:1410:34al 15 min.
1:20-11:30al 1:4&11:50al z:o[F12:1op! 2:10-12:2op1
3:15-3:30 p:
10 min. 10 min. 10 min. 10 min.
15 min
4:20-4:4Op: 20 min.
Period - Probe Zonfiguration
‘erpendicular inserted to center of stack dia.
‘erpendicular inserted to center of stack dia.
‘erpendicular inserted to center of stack dia.
Perpendicular inserted to center of stack dia.
Perpendicular inserted to center of stack dia.
_- _ Comments
Duplicate samples of 4-color, l-web coated stock at press speed of 15,000 iph.
kIdentical ink coverage (same job) as that sampled on g/28/71; only exception being coated stock.
duplicate samples of 4-color, l-web coated stock at press speed of 7000 iph. Same ink coverage as Samples #8 and #9.
ndividual samples of dryer only, no printing. Dryer temp. same as that for 4-color process printing.
sample #13 taken 5 minutes after process was completed, remainder of samples staggered over time period.
Duplicate samples of 4-color, l-web coated stock (different ink coverage) at press speed of 7000 iph (400 ft/min.)
Duplicate samples of 4-color, l-web coated stock at press speed of 12,000 iph.
320
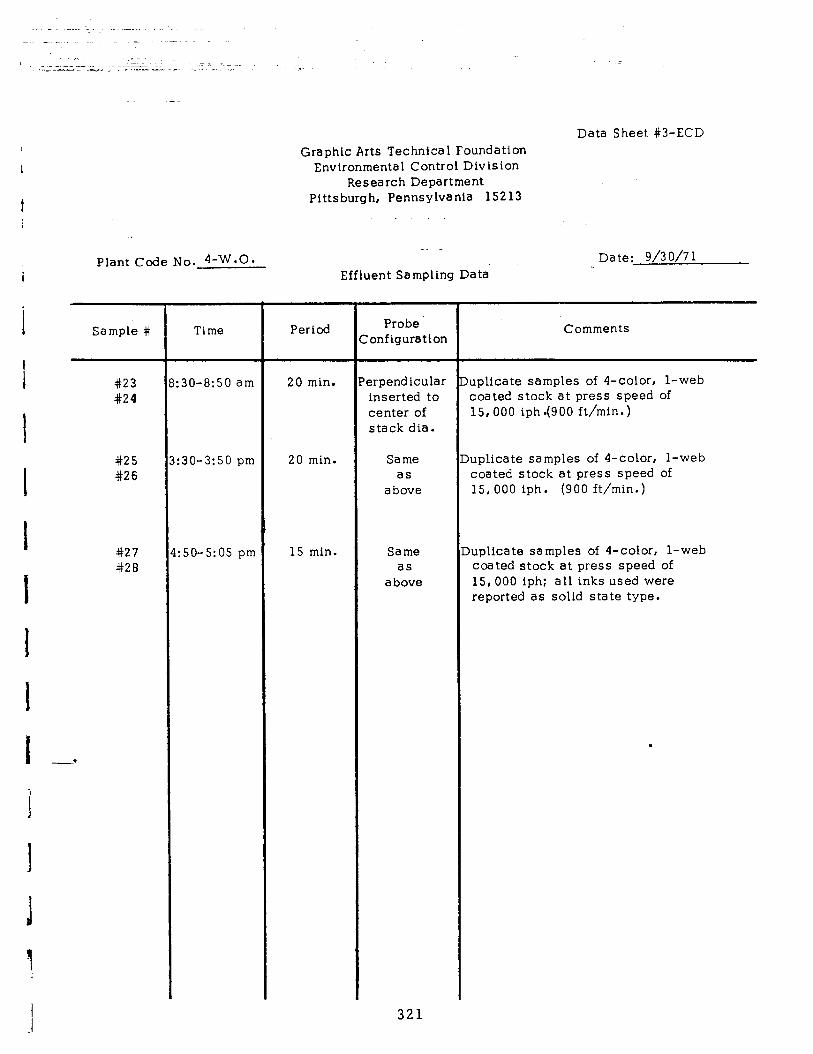
Graphic Arts Technica 1 Foundation Environmental Control Division
Research Department Pittsburgh, Pennsylvania 15213
Data Sheet #3-ECD
Plant Code No. 4-w.0.
Sample #
#23 #24
#25 #26
#27 #28
Time
30-8:50 am 20 min.
:30-3:50 pm 20 min.
:50-5:05 pm 15 min.
Effluent Sampling Data
Period Probe Yonfiguration
erpendicular inserted to center of stack dia.
Same as
above
Same as
above
321
Date: g/30/71
Comments
juplicate samples of 4-color, l-web coated stock at press speed of 15,000 iph .(900 ft/min.)
Duplicate samples of 4-color, l-web coated stock at press speed of 15, 000 iph. (900 ft/min.)
Iuplicate samples of 4-color, l-web coated stock at press speed of 15,000 iph; all inks used were reported as solid state type.
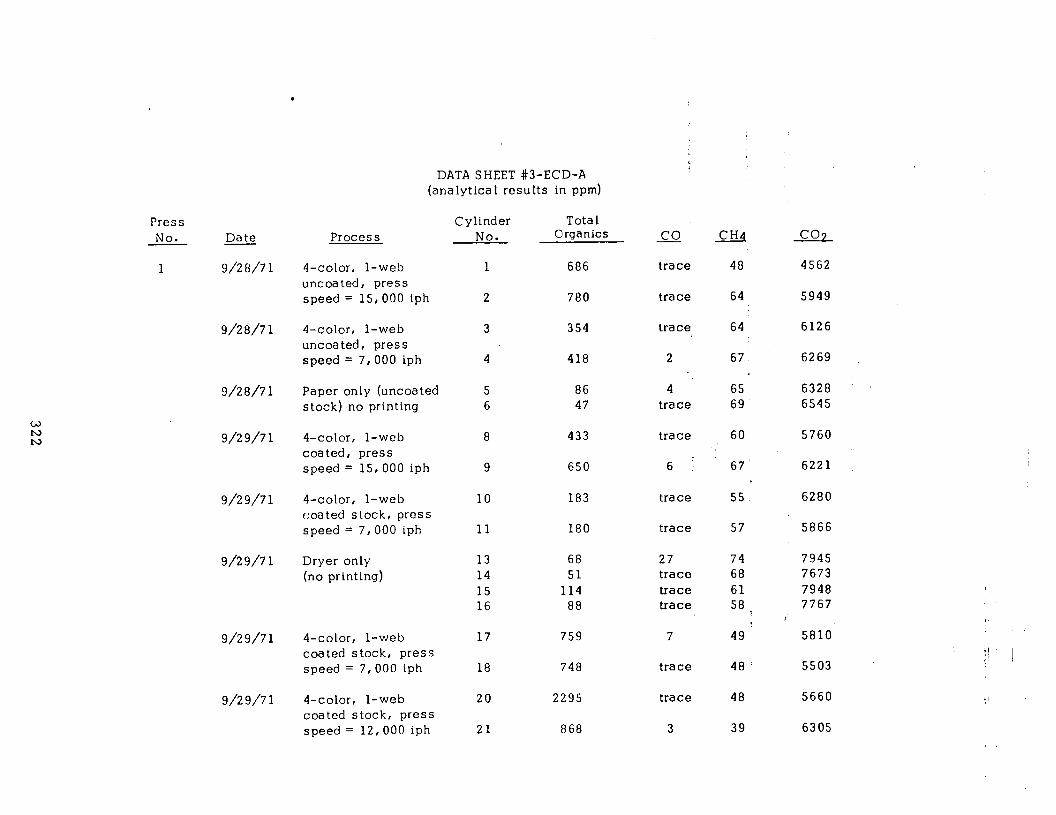
DATA SHEET #3-ECD-A (analytical results in ppm)
Cylinder Total No. Organics
686
co CHq LXL
trace 48 4562
780 trace 64 5949
354 trace 64 6126
4 418 67
Paper only (uncoated 5 86 stock) no printing 6 47
2
4 trace
65 69
6269
6328 : ’ 6545
8 433 trace
6 :
trace
trace
27 trace trace trace
7
60 5760
67 r
55.
6221
10 183 6280
11 180 57 5866
13 68 14 51 15 114 16 88
759
74 68 61 58 i
49
7945 7673 7948 7767
I 5810
18 748 5503
2295 5660
868
trace 48
trace 48
3 39 6305
Press No.
1
Date
g/28/71
Process
4-color, l-web uncoated, press speed = 15,000 iph
4-color, l-web uncoated, press speed = 7,000 iph
4-color, l-web coated, press speed = 15,000 iph
4-color, l-web coated stock, press speed = 7,000 iph
Dryer only (no printing)
1
2
3 g/28/7 1
g/28/7 1
g/29/71
9
g/29/71
g/29/7 1
g/29/71 4-color, l-web coated stock, press speed = 7,000 iph
4-color, l-web coated stock, press speed = 12,000 iph
17
g/29/71 20
21
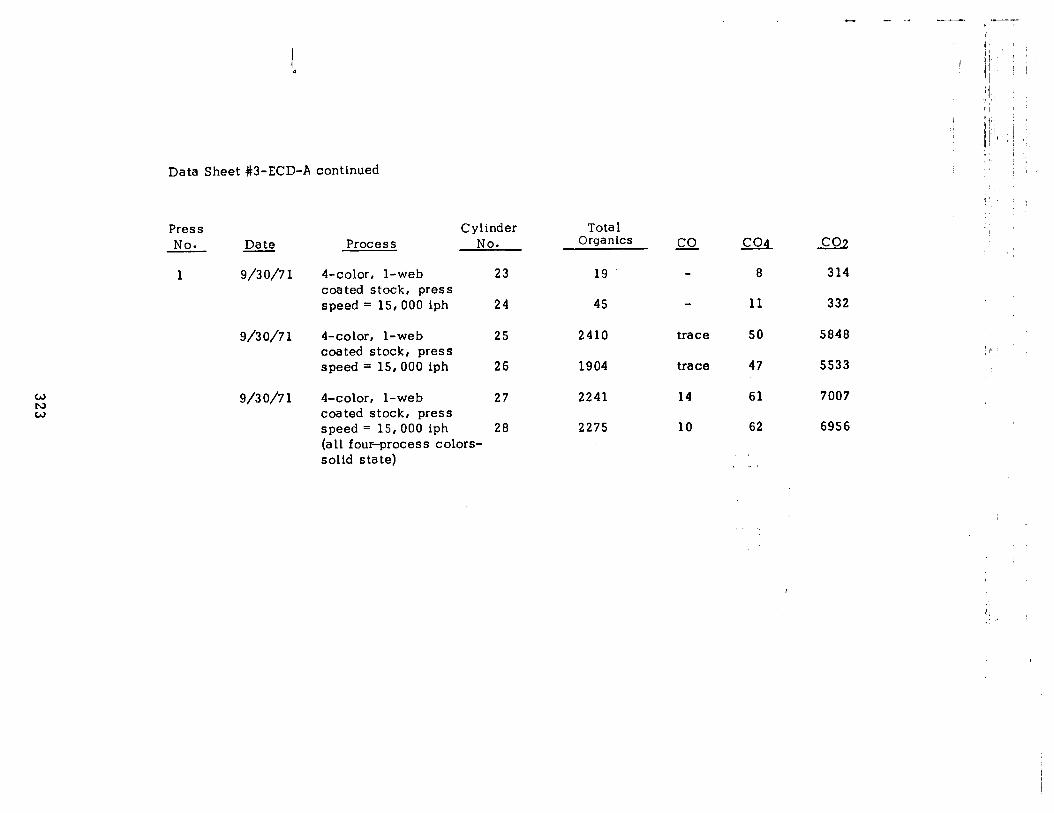
w N W
Data Sheet #3-ECD-A continued
Press Cylinder No. - Date Process No.
1 g/30/7 1 4-color, l-web 23 coated stock, press speed = 15,000 iph 24
g/30/7 1 4-color, l-web 25 coated stock, press speed = 15,000 iph 26
g/30/71 $-color, l-web 27 coated stock, press speed = 15,000 iph 28 (all four-process colors- solid state)
Tota 1 Organics
19
45
2410
1904
2241
2275
trace
trace
14
10
coq co2 8 314
11 332
50 5848
47 5533
61 7007
62 6956
‘, ..,
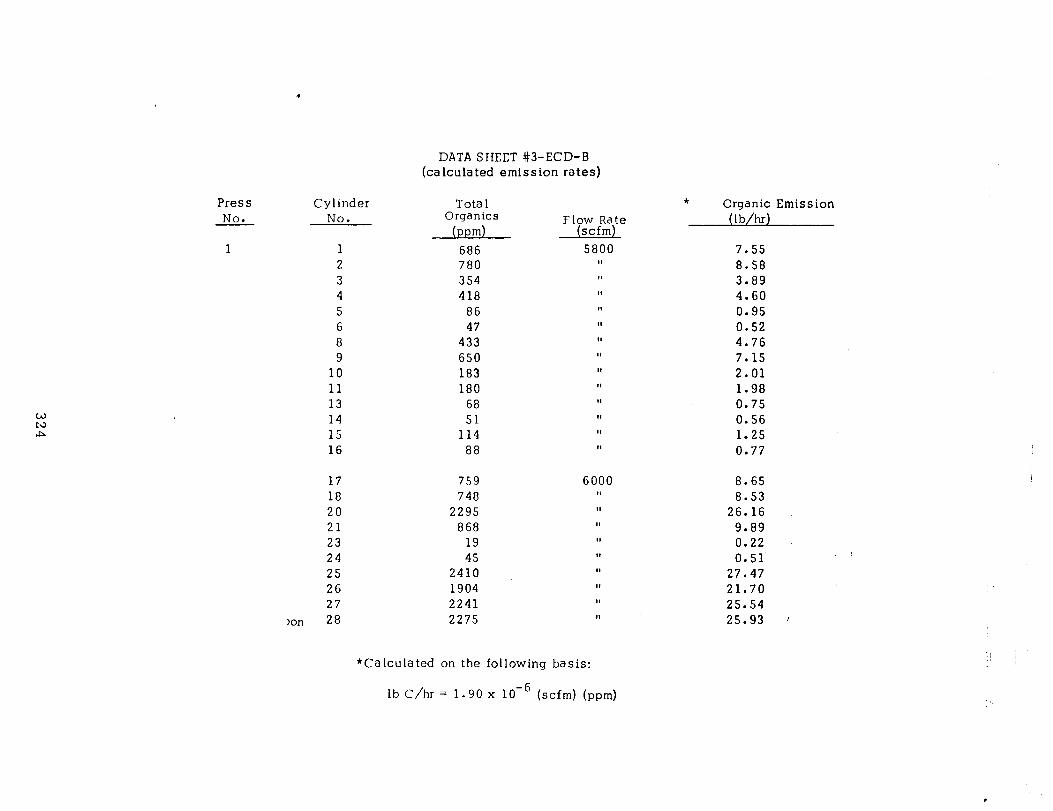
4
DATA SHEET #3-ECD-B (calculated emission rates)
Press Cylinder No. No.
1 1 2 3 4 5 6 8 9
10 11 13 14 15 16
17 18 20 21 23 24 25 26 27
Ion 28
Tota 1 Organics
(ppm) 686 780 354 418
86 47
433 650 183 180
68 51
114 88
759 748
2295 868
19 45
2410 1904 2241 2275
Flow Rate (scfm)
6000
*Calculated on the following basis:
lb C/hr = 1.90 x 10B6 (scfm) (ppm)
* Organic Emission (lb/hr)
7.55 8.58 3.89 4.60 0.95 0.52 4.76 7.15 2.01 1.98 0.75 0.56 1.25 0.77
8.65 8.53
26.16 9.89 0.22 0.51
27.47 21.70 25.54 25.93
,

.
DATA SHEET #3-ECD-C Comparison Calculated and Observed Emission Rates
Cylinder(l) Ink Coverage Press Speed No. lb/imp iph
Type of Emission(2) Emission(3) C onvers ion Factor($) Paper Stock (calculated) (observed) Eobs./Ecalc.
162 0.0022 3&4 0.0022 8&9 0.0022
10 & 11 0.0022
15,000 uncoated 13.95 8.07 0.58 7,000 uncoated 6.81 4.25 0.62
15,000 coated 13.95 5.96 0.43 7,000 coated 6.81 2.00 0.28
17 & 18 20 & 21
W N 25 & 26 WI
0.0057 0.0057 0.0057
(1) (2)
(3) (4)
7,000 coated 16.71 8.59 12,000 coated 28.11 18.03 15,000 coated 34.95 24.59
Average value of duplicate samples utilized in calculation. Calculated emission rate inclusive of paper contribution as determined in previous test series. Based on recorded press data as obtained during test. Fraction of organics not converted to CO2 and H20 in the dryer.
0.51 0.64 0.70
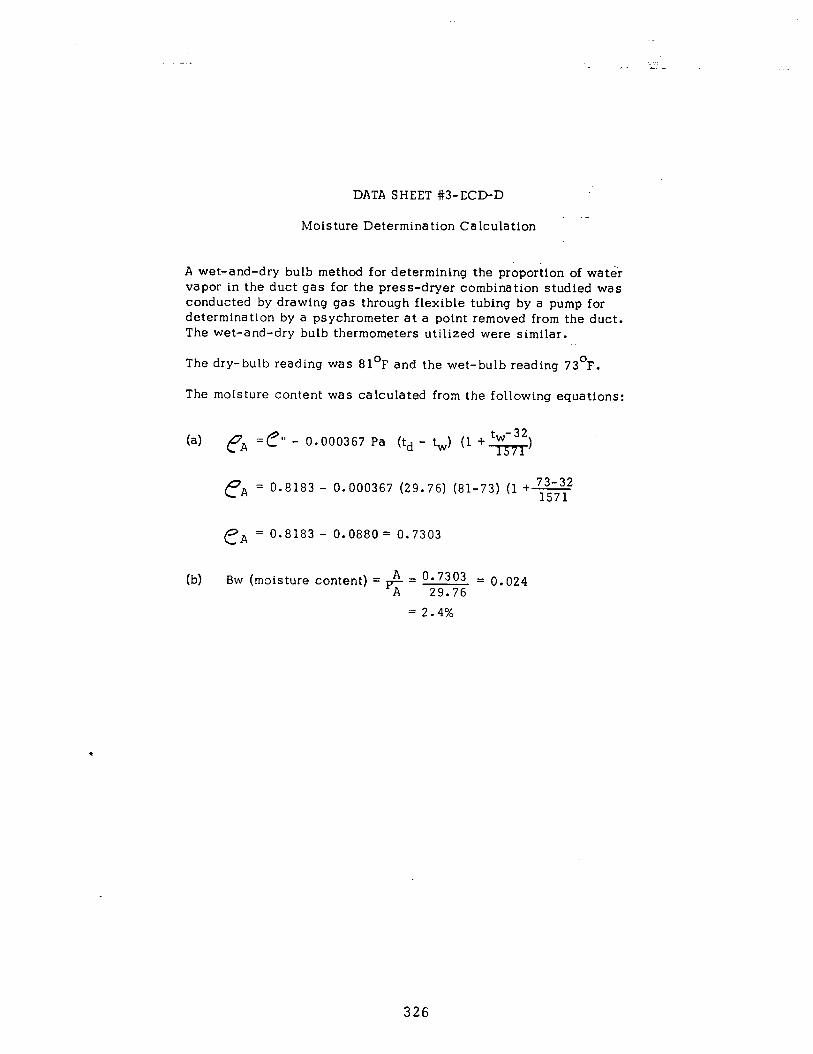
DATA SHEET #3-ECD-D
. Moisture Determination Calculation
A wet-and-dry bulb method for determining the proportion of water vapor in the duct gas for the press-dryer combination studied was conducted by drawing gas through flexible tubing by a pump for determination by a psychrometer at a point removed from the duct. The wet-and-dry bulb thermometers utilized were similar.
The dry-bulb reading was 81°F and the wet-bulb reading 73’F.
The moisture content was calculated from the following equations:
(a) PA =e” - 0.000367 Pa (td - tw) (1 +.g)
?A = 0.8183 - 0.000367 (29.76) (81-73) (1 +9
CA = 0.8183 - 0.0880 = 0.7303
b) Bw (moisture content) = & = O-7303 = 0.024 - A 29.76
= 2.4%
326
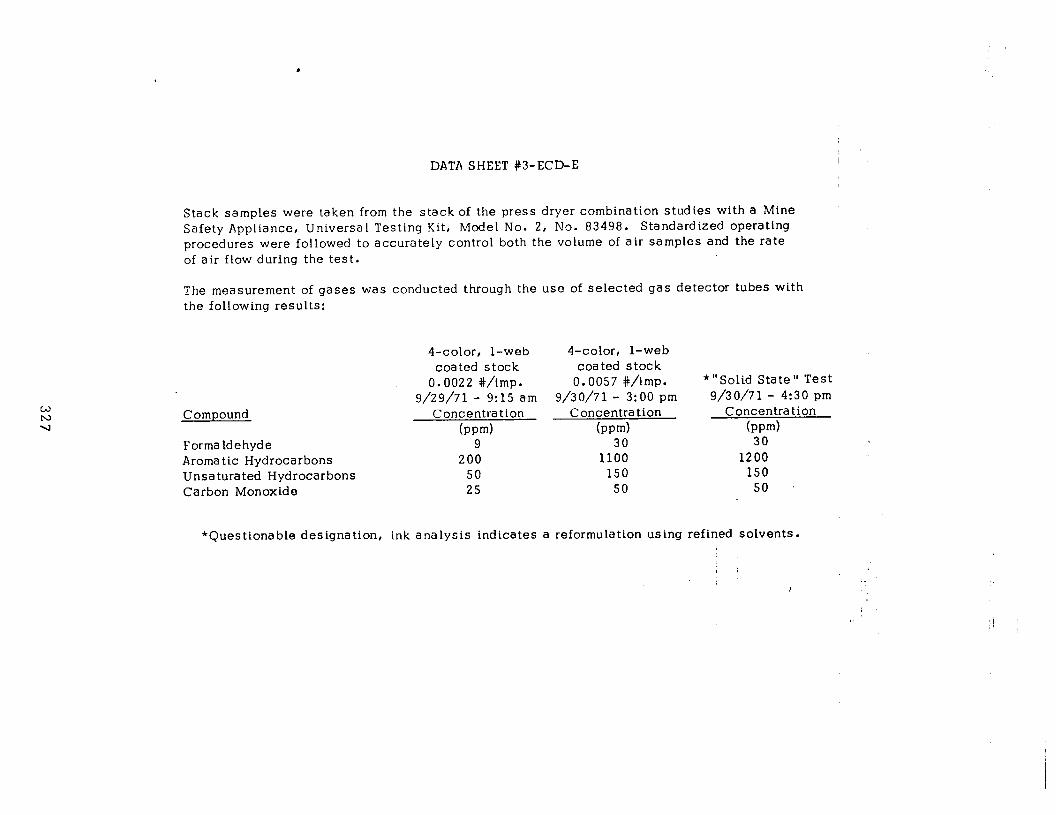
DATA SHEET #3-ECD-E
Stack samples were taken from the stack of the press dryer combination studies with a Mine Safety Appliance, Universal Testing Kit, Model No. 2, No. 83498. Standardized operating procedures were followed to accurately control both the volume of air samples and the rate of air flow during the test.
The measurement of gases was conducted through the use of selected gas detector tubes with the following results:
Compound
Formaldehyde Aroma tic Hydrocarbons Unsaturated Hydrocarbons Carbon Monoxide
4-color, l-web 4-color, l-web coated stock coated stock
0.0022 #/imp. 0.0057 #/imp. g/29/71 - 9:15 am 9/3 o/7 1 - 3:00 pm
Concentration Concentration bwd (mm)
9 30 200 1100
50 150 25 50
‘“Solid State” Test g/30/71 - 4:30 pm
Concentration (wd
30 1200
150 50
*Questionable designation, ink analysis indicates a reformulation using refined solvents.
; i
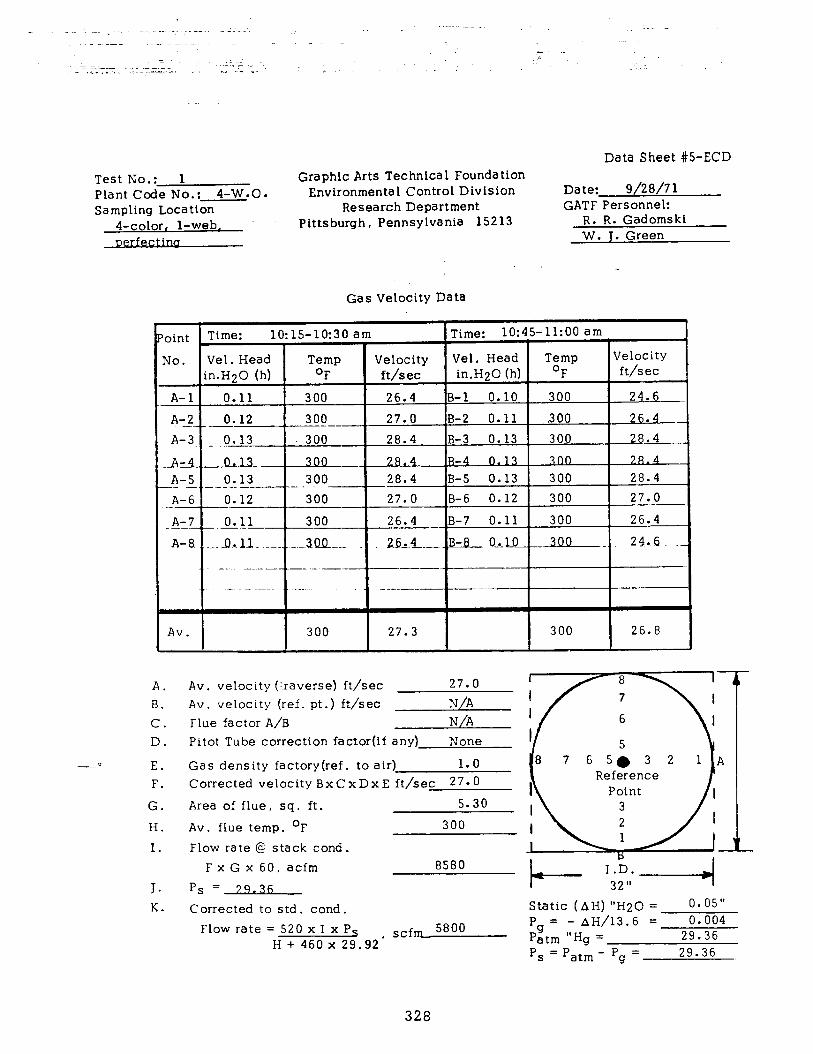
Data Sheet #5-ECD
Test No.: 1 Graphic Arts Technical Foundation Plant Code No.: 4-W.O. Environmental Control Division Date: g/20/71 Sampling Locatton Research Department GATF Personnel:
4-color, l-web. Pittsburgh, Pennsylvania 15213 R. R. Gadomski W. J. Green
Gas Velocity Data
A. Av. velocity (:.raverse) ft/sec 27.0 B. Av. velocity (ref. pt.) ft/sec N/A C. Flue factor A/B N/A D. Pitot Tube correction factor(if any) None
-= E. Gas density factory(ref. to air) 1.0 F. Corrected velocity Bx C x D x E ft/sec 27.0
G. Area of flue, sq. ft. 5.30
H. Av. flue temp. OF 300
I. Flow rate @ stack cond.
J. K.
FxG x 60, acfm
ps =79.36 Corrected to std. cond.
8580
Flow rate = 520 x I x Ps H + 460 x 29.92‘
scfm 5800
Static (AH) “H20 = 0.05” Pg= - AH/13.6 = 0.004 Patm “Hg = 29.36 P, = Pat, - Pg = 29.36
328
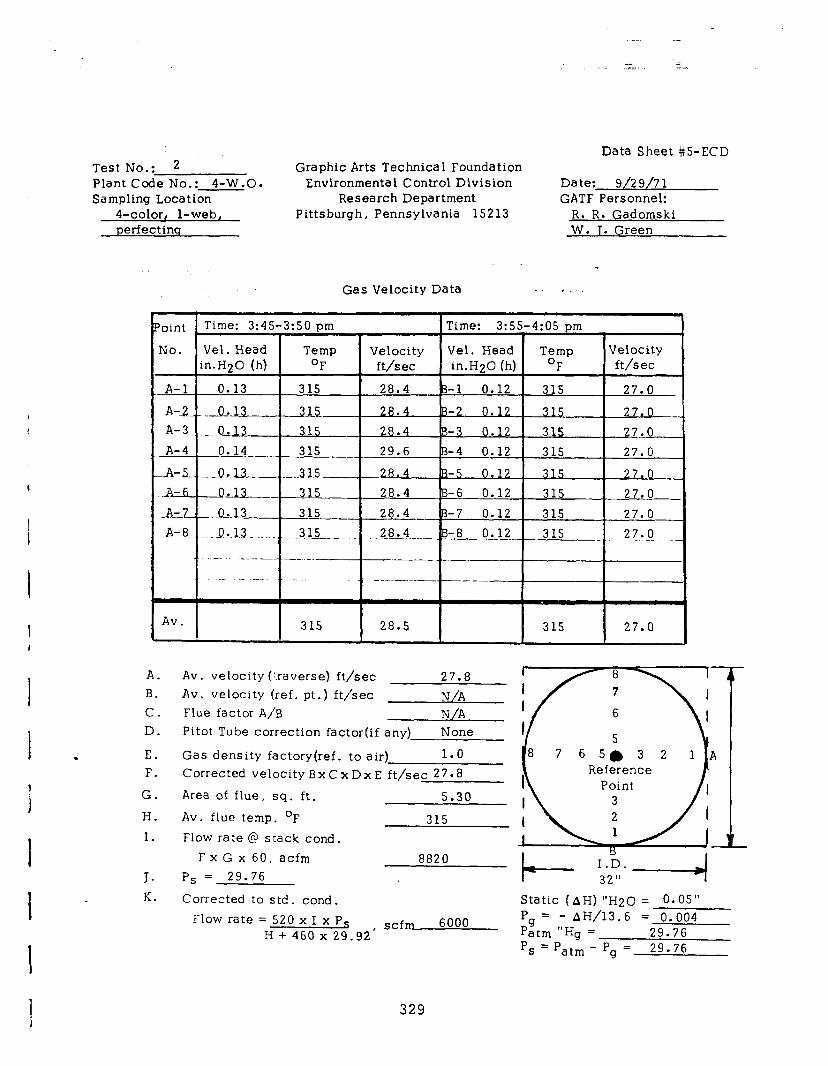
.
Test No..: 2 Plant Code No.: 4-W.O. Sampling Location
4-color, l-web, perfectinq
Graphic Arts Technica 1 Foundation Environmental Control Division
Research Department Pittsburgh, Pennsylvania 15213
Data Sheet #5-ECD
Date: g/29/7 1 GATF Personnel:
R. R. Gadomski W. 1. Green
Gas Velocity Data . .
Av. I I 315 I 28.5 I 315 27.0
A. Av. velocity (:.raverse) ftjsec 27.8 B. Av. velocity (ref. pt.) ft/sec N/A C. Flue factor A/B N/A D. Pitot Tube correction factor(if any) None
E. Gas density factory(ref. to air) 1.0 F. Corrected velocity BxCxDxE ft/sec 27.8
G. Area of flue, sq. ft. 5.30
H. Av. flue temp. OF 315 I. Flow rate @ stack cond.
Fx G x 60, acfm 8820 J. P, = 29.76
K. Corrected to std. cond. Static (AH) “H20 = 0.05”
Flow rate = 520 x I x P, H + 460 x 29.92’
scfm 6000 Pg = - AH/13.6 = 0.004 Patm “Hg = 29.76 ‘s = patm - Pg = 29.76
329
NilV2 -1971 CARNEGIE-MELLON UNIVERSITY _.
MELLON INSTITUTE
GATFl RESEARCH SERVICES
al Labou&ory (7615-2)
Fellow
Investigation Air Pollution Program .. _
Graphic Arts Account ~~~ Technical Foundation
P.O. t3104 -. -
_. ‘pML 7i-233 4-wo)’ .. ~ - ‘j . . Investigation No. NATURE Preliminary
October 25. 1971 OF
I
Pr0gTeaa Data of Report REPORT Final X
The twenty-four samples of stack gas effluent which you submitted,
have been analyzed by the procedure described in a prebloue report dated
October 2, 1970. The data are tabulated in the attached table.
&PA-- Paul R.Eieaman Fellow Physical Measurements Laboratory
PRE: jdf
R&T: 10/29/71 -Q
Form 111
330
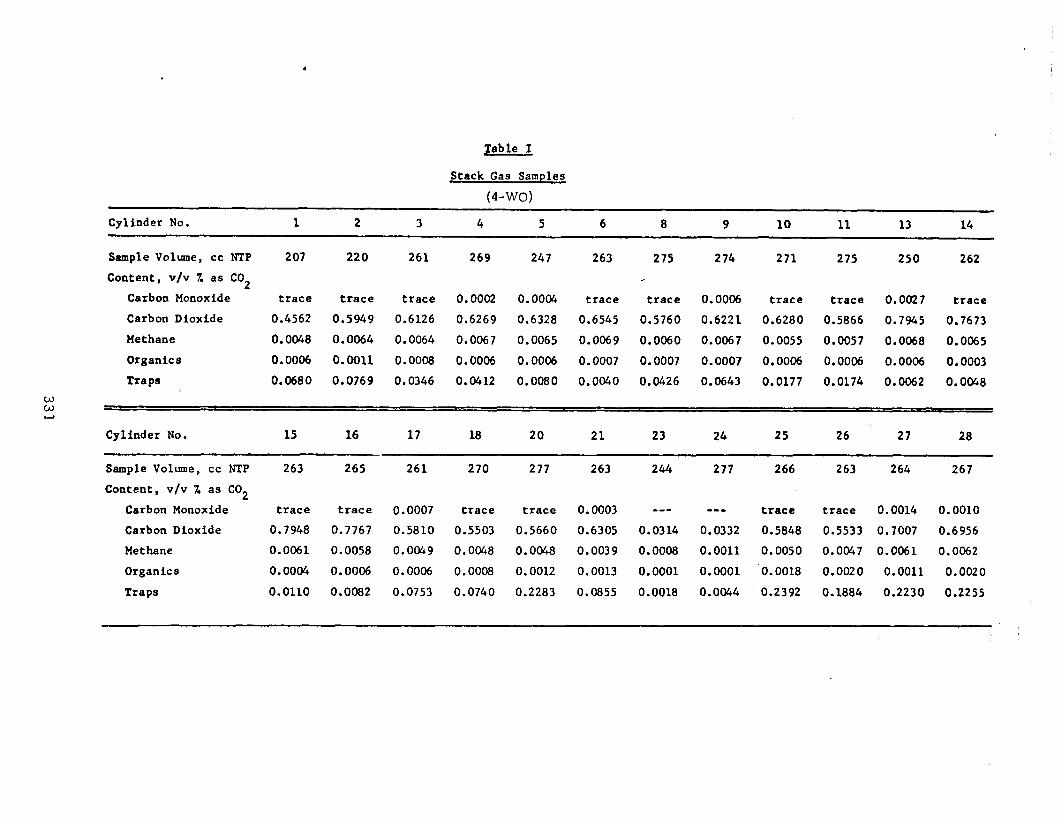
I Table
Stack Gas Samples
(4-WO)
Cylinder No. 2 14
Sample Volume, cc NTP 207 220 261 269 247 263 275 274 271 275 250 262
Content, v/v 7. as CO2
Carbon Monoxide trace trace trace 0.0002 0.0004 trace trace 0.0006 trace trace 0.0027 trace
Carbon Dioxide 0.4562 0.5949 0.6126 0.6269 0.6328 0.6545 0.5760 0.6221 0.6280 0.5866 0.7945 0.7673
Methane 0.0068 0.0064 0.0064 0.0067 0.0065 0.0069 0.0060 0.0067 0.0055 0.0057 O.OM8 0.0065
Organics 0.0006 0.0011 0.0008 0.0006 0.0006 0.0007 0.0007 0.0007 0.0006 0.0006 0.0006 0.0003
Traps 0.0680 0.0769 0.0346 0.0412 0.0080 0.0040 0.0426 0.0643 0.0177 0.0174 0.0062 O.OOG8
is )--r
Cylinder No. 15 16 17 18 20 21 23 24 25 26 27 28
Sample Volume, cc NTP 263 265 261 270 277 263 244 277 266 263 264 267
Content, v/v 7. as CO2
Carbon Monoxide trace trace 0.0007 trace trace 0.0003 --- --- trace trace 0.0014 0.0010
Carbon Dioxide 0.7948 0.7767 0.5810 0.5503 0.5660 0.6305 0.0314 0.0332 0.5848 0.5533 0.7007 0.6956
Methane 0.0061 0.0058 0.0049 0.0048 0.0048 0.0039 0.0008 0.0011 0.0050 0.0047 0.0061 0.0062
Organics 0.0004 0.0006 0.0006 0.0008 0.0012 0.0013 0.0001 0.0001 0.0018 0.0020 0.0011 0.0020
Traps 0.0110 0.0082 0.0753 0.0740 0.2283 0.0855 0.0018 0.0044 0.2392 0.1884 0.2230 0.2255
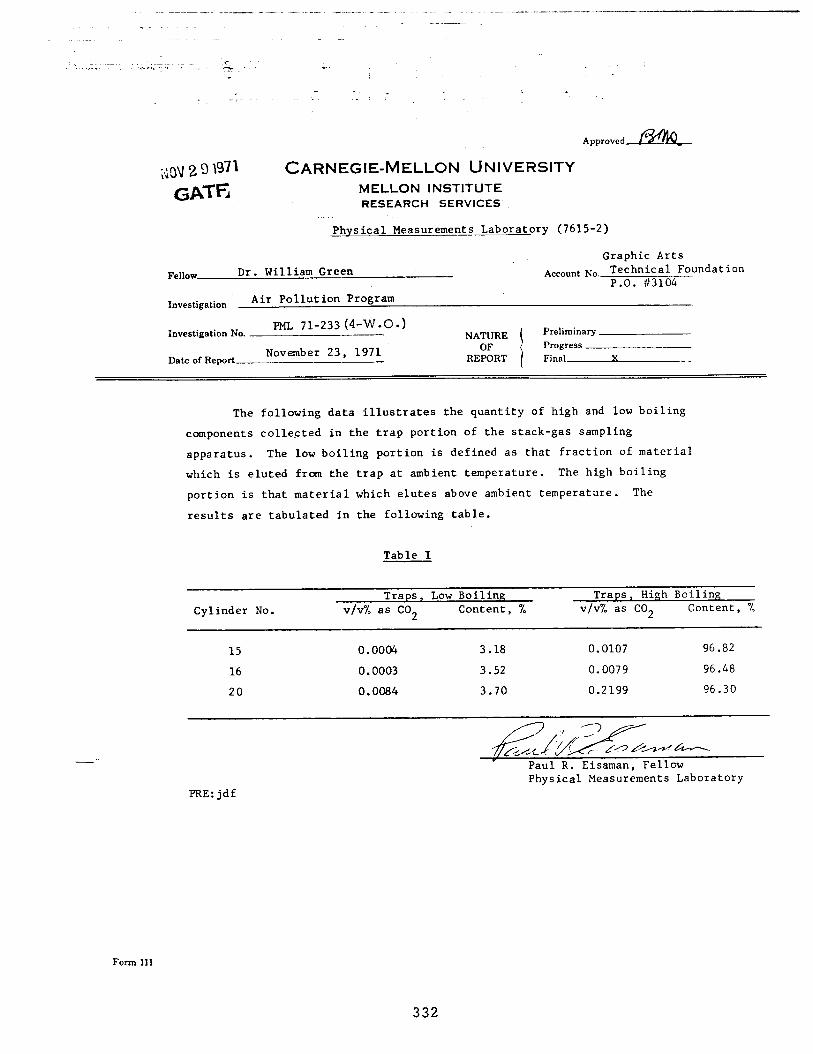
CARNEGIE-MELLON UNIVERSITY MELLON INSTITUTE RESEARCH SERVICES
lJhysica1 Measurements Laboratory (7615-2)
Graphic Arts
Fellow Dr. William Green Account No. Technical Foundation P.O. a3104
Investigation Air Pollution Program
Investigation No.-.- ml, 71-233 (4-w-0.) --
November 23, 1971 Date ofReport -~
NATURE OF
REPORT
Preliminary Progress Final X
The following data illustrates the quantity of high and low boiling
components collected in the trap portion of the stack-gas sampling
apparatus. The low boiling portion is defined as that fraction of material
which is eluted from the trap at ambient temperature. The high boiling
portion is that material which elutes above ambient temperature. The
results are tabulated in the following table.
Table I
Cylinder No.
15
16
20
Traps, Low BoilinP v/v% as CO2 Content, %
0.0004 3.18
0.0003 3.52
0.0084 3.70
Traps, High Boiling v/v% as CO2 Content, %
0.0107 96.82
0.0079 96.48
0.2199 96.30
&/>fd-- Paul R. Eisaman, Fellow Physical Measurements Laboratory
Form 111
PRE:jdf
332
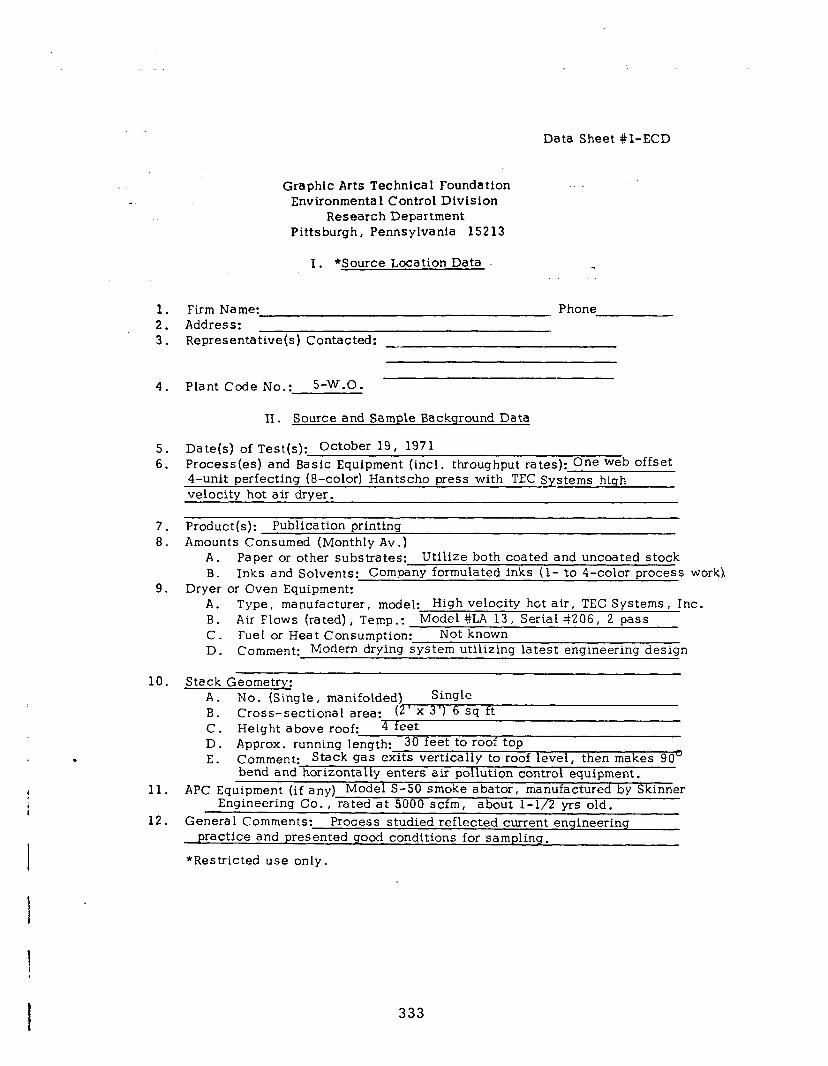
Data Sheet #l-ECD
1. 2. 3.
4.
5. 6.
7. 8.
9.
10.
11.
12.
Graphic Arts Technica 1 Foundation Environmental Control Division
Research Department Pittsburgh, Pennsylvania 15213
I. *Source Location Data
Firm Name: Phone Address: Representative(s) Contacted: -
Plant Code No.: 5-W.O.
II. Source and Sample Background Data
Date(s) of Test(s): October 19, I971 Process(es) and Basic Equipment (incl. throughput rates): One web offset 4-unit perfecting (8-color) Hantscho press with TEC Systems high velocity hot air dryer.
Product(s): Publication printing Amounts Consumed (Monthly Av .)
A. Paper or other substrates: Utilize both coated and uncoated stock B. Inks and Solvents: Company formulated inks (l- to $-color process work),
Dryer or Oven Equipment: A. Type, manufacturer, model: High velocity hot air, TEC Systems, Inc. B. Air Flows (rated), Temp.: Model #LA 13, Serial #206, 2 pass C. Fuel or Heat Consumption: Not known D. Comment: Modem drying system utilizing latest engineering design
Stack Geometry_: A. No. (Single, manifolded) Single B. Cross-sectional area: (2 x 3 ) 6 sq ft C. Height above roof: 4 feet D. Approx. running length: 30 feet to roof top E. Comment: Stack gas exits vertically to roof level, then makes 90°
bend and horizontally enters air pollution control equipment. ApC Equipment (if any) Model S-50 smoke abator, manufactured by Skinner
Engineering Co. , rated at 5000 scfm, about l-1/2 yrs old. Genera 1 Comments: Process studied reflected current engineering
practice and presented good conditions for sampling.
*Restricted use only,
333
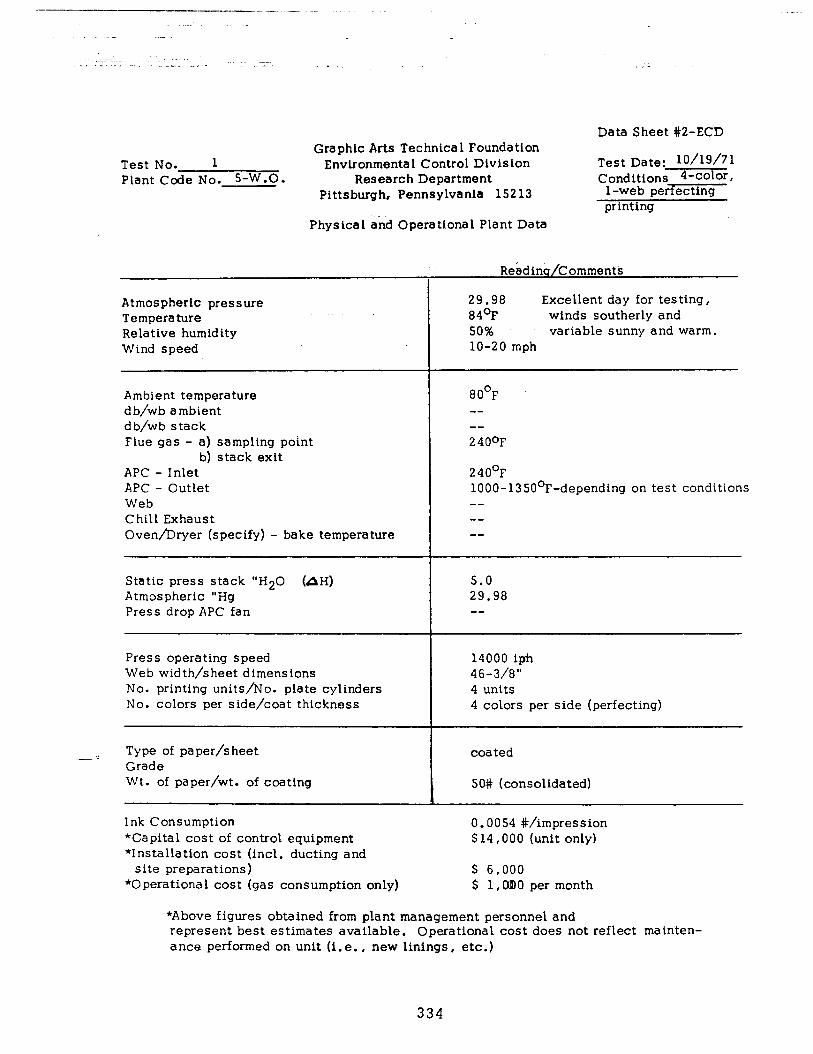
-.---- __-__ _.. . ,.
Data Sheet #2-ECD Graphic Arts Technica 1 Foundation
Test No. 1 Environmental Control Diviston Test Date: IO/lg/71 Plant Code No. S-W.0. Research Department Conditions 4-color,
Pittsburgh, Pennsylvanla 15213 l-web perfecting printing
Physical and Operational Plant Data
Atmospheric pressure 29.98 Excellent day for testing, Temperature 84OF winds southerly and Relative humidity 50% vartable sunny and warm. Wind speed lo-20 mph
Ambient temperature d b/wb ambient db/wb stack Flue gas - a) sampling point
b) stack exit APC - Inlet APC - Outlet Web Chill Exhaust Oven/Dryer (specify) - bake temperature
Static press stack “H20 (LIH) 5.0 Atmospheric “Hg 29.98 Press drop APC fan --
Press operating speed 14000 iph Web width/sheet dimensions 46-3/8” No. printing units/No. plate cylinders 4 units No. colors per side/coat thickness 4 colors per side (perfecting)
Type of paper/sheet Grade
coated
Wt. of paper/wt. of coating SO# (consolidated)
Ink Consumption *Capital cost of control equipment *Installation cost (incl. ducting and
site preparations) *0 perationa 1 cost (gas consumption only)
Regding/Comments
80O~ -- -a 2400F
240°F lOOO-1350°F-depending on test conditions -- -- --
0.0054 #/impression $14,000 (unit only)
$ 6,000 $ 1,fXQO per month
*Above figures obtained from plant management personnel and represent best estimates available. Operational cost does not reflect mainten- ance performed on unit (i., e. , new linings, etc.)
334
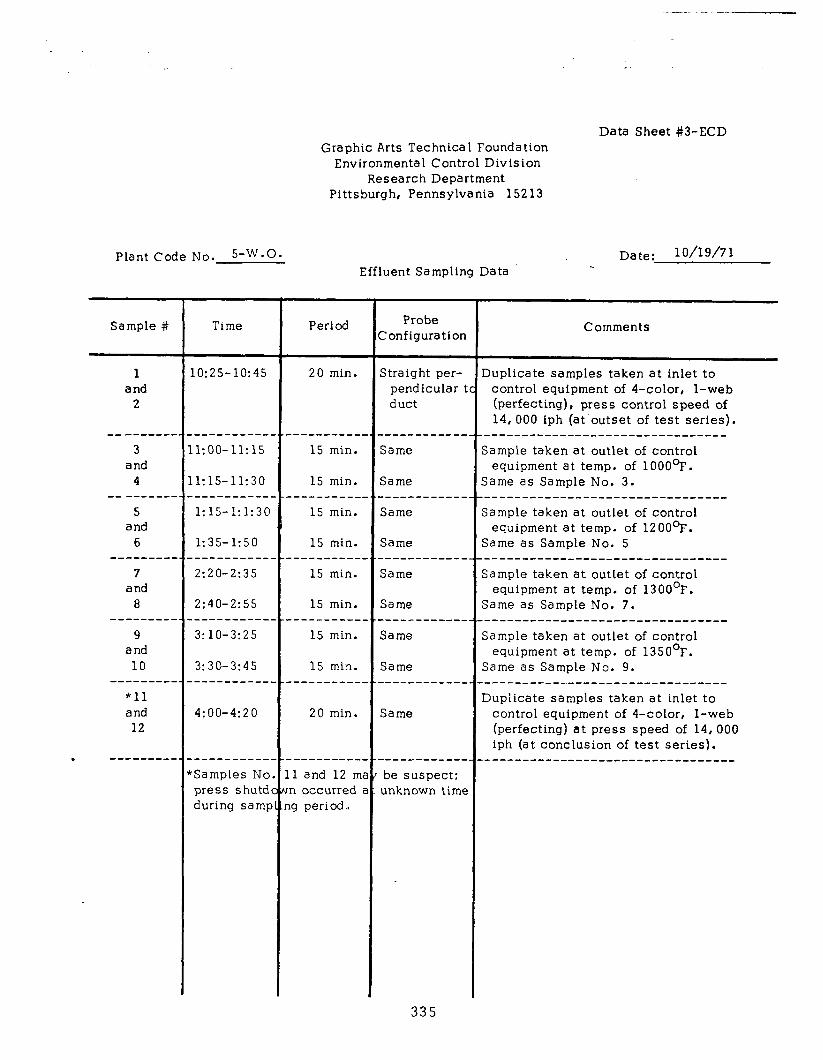
Plant Code No. 5-W.O.
Sample # Time Period
1 and
2
10:25-lo:45 20 min.
-- ------- 3
and 4
-- ---_--- 5
and 6
-_----_-- 7
and 8
-----w-e- 9
and 10
--------_ *11 and 12
,---------- .l:OO-11:15
.1:15-11:30
.---------- 1:15-1:1:3c
1:35-1:50 .------_--_ 2:20-2:35
2:40-2:55 .---------- 3: lo-3:25
3:30-3:45 ,-----m--e-
----------_ 15 min.
15 min. c--------__
15 min.
15 min. ----_----__
15 min.
15 min. -----e-w--_
15 min.
15 min. ---------__
4:00-4:20 20 min. Same
------__-- --------___ ‘Samples NC 11 and 12 rnz press shutd rn occurred i during saml lg period.
Graphic Arts Technical Foundation Environmental Control Division
Research Department Pittsburgh, Pennsylvania 15213
Data Sheet #3-ECD
Effluent Sampl .ing Data Da
-. te: 10/19/71
Probe Configuration
Straight per- pendicular t duct
---_----_--_ Same
Same --__-------- Same
Same ------------ Same
Same ------------ Same
Same --------__-_
--------__-- be suspect: unknown time
Comments
Duplicate samples taken at inlet to control equipment of 4-color, l-web (perfecting), press control speed of 14,000 iph (at outset of test series).
--------------_----------------- Sample taken at outlet of control
equipment at temp. of 1000°F. Same as Sample No. 3. -------------------------------- Sample taken at outlet of control
equipment at temp. of 12OO’F. Same as Sample No. 5 -----------_--_-_--------------- Sample taken at outlet of control
equipment at temp. of 13OO’F. Same as Sample No. 7. ----------------_--------------- Sample taken at outlet of control
equipment at temp. of 135O’F. Same as Sample No. 9. -------------------------------- Dupiicate samples taken at inlet to
control equipment of 4-color, l-web (perfecting) at press speed of 14, 000 iph (at conclusion of test series).
---------------_--_--------------
335
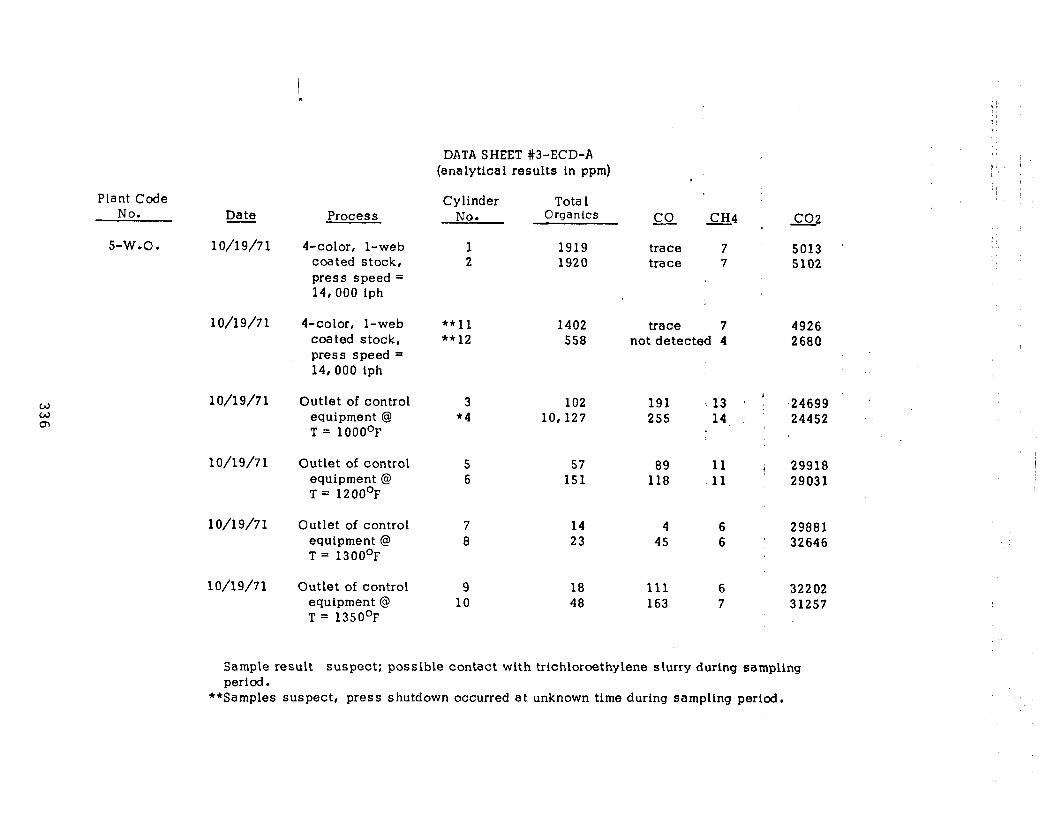
W W 07
Plant Code No.
5-w.0,
Date
1 O/l 9/7 1
10/19/71
1 O/l 9/7 1
10/19/71
10/19/71
1 O/l 9/7 1
Process
4-color, l-web coated stock, press speed = 14,000 iph
4-color, l-web coated stock, press speed = 14,000 iph
Outlet of control equipment @ T = 1000°F
Outlet of control equipment @ T = 12OO’F
Outlet of control equipment @ T = 13OO’F
Outlet of control equipment @ T = 1350’F
DATA SHEET #3-ECD-A (analytical results Ln ppm)
Cylinder Tota 1 NO. Organics
1 1919 2 1920
**11 1402 trace 7 4926 **12 558 not detected 4 2680
3 102 191 13 ,24699 .’ *4 10,127 255 14. 24452
5 57 6 151
7 14 8 23
9 18 10 48
co CH4
trace 7 trace 7
89 11 118 11
4 6 45 6
111 6 163 7
gg2
5013 5102
29918 29031
29881 32646
32202 31257
Sample result suspect: possible contact with trichloroethylene slurry during sampling period.
**Samples suspect, press shutdown occurred at unknown time during sampling period.
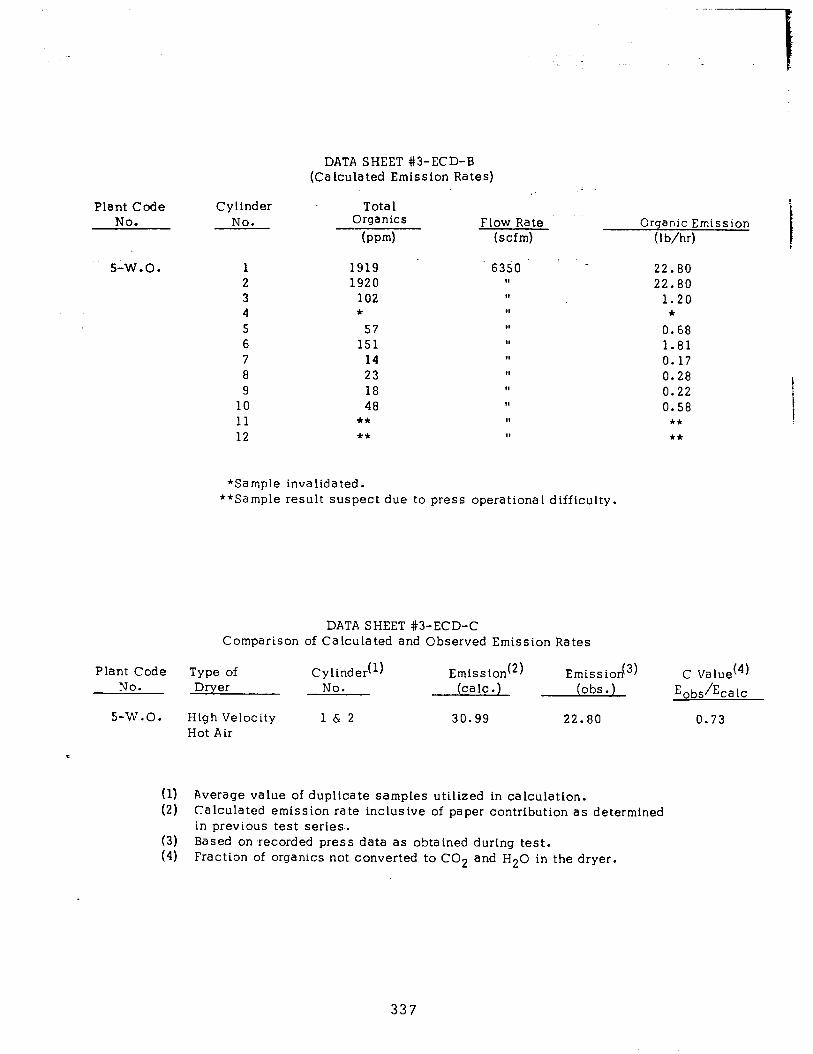
c
-_. .- -7
DATA SHEET #3-ECD-B (Calculated Emission Rates)
Plant Code No.
Cylinder No.
Tota 1 Organics
bpm) Flow Rate
(scfm) Organic Emission
(lb/t-r)
5-W.O. 1 1919 2 1920 3 102 4 * 5 57 6 151 7 14 8 23 9 18
10 48 11 ** 12 **
Plant Code No.
5-W.O.
*Sample invalidated. **Sample result suspect due to press operational difficulty.
22.80 22.80
1.20 *
0.68 1.81 0.17 0.28 0.22 0.58
** l *
DATA SHEET #3-ECD-C Comparison of Calculated and Observed Emission Rates
Type of Dryer
High Velocity Hot Air
Cylinder(‘) Emission(2) No. (talc.)
l&2 30.99
Emission(3) (obs .)
22.80
C Value(4) Eobs/Eca 1C
0.73
(1) Average value of duplicate samples utilized in calculation. (2) Calculated emission rate inclusive of paper contribution as determined
in previous test series. (3) Based on recorded press data as obtained during test. (4) Fraction of organics not converted to CO2 and H2C in the dryer.
337
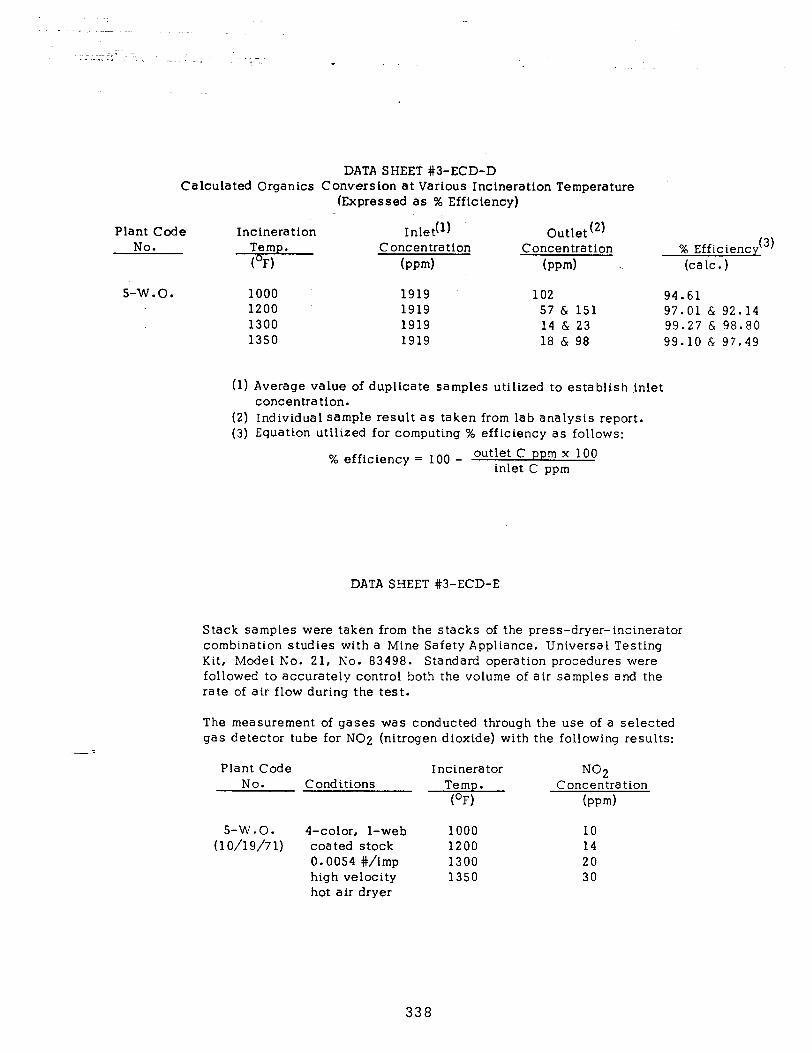
DATA SHEET #3-ECD-D Calculated Organics Conversion at Various Incineration Temperature
(Expressed as % Efficiency)
Plant Code No.
Incineration Inlet(l) Concentration
(mm)
Outlet(2) Concentration
bpm) % Efficiency(3) (talc.)
s-W.O. 1000 1919 102 94.61 1200 1919 57 & 151 97.01 & 92.14 1300 1919 14 & 23 99.27 & 98.80 1350 1919 18 & 98 99.10 & 97.49
(1) Average value of duplicate samples utilized to establish inlet concentration.
(2) Individual sample result as taken from lab analysis report. (3) Equation utilized for computing % efficiency as follows:
% efficiency = 100 - outlet C ppm x 100 inlet C ppm
DATA SHEET #3-ECD-E
Stack samples were taken from the stacks of the press-dryer-incinerator combination studies with a Mine Safety Appliance, Universal Testing Kit, Model No. 21, No. 83498. Standard operation procedures were followed to accurately control both the volume of air samples and the rate of air flow during the test.
The measurement of gases was conducted through the use of a selected gas detector tube for NO2 (nitrogen dioxide) with the following results:
-= Plant Code Incinerator NC2
No. Conditions Temp. Concentration (OF) bpm)
5-W.O. 4-color, l-web 1000 10 (10/19/71) coated stock 1200 14
0.0054 #/imp 1300 20 high velocity 1350 30 hot air dryer
338
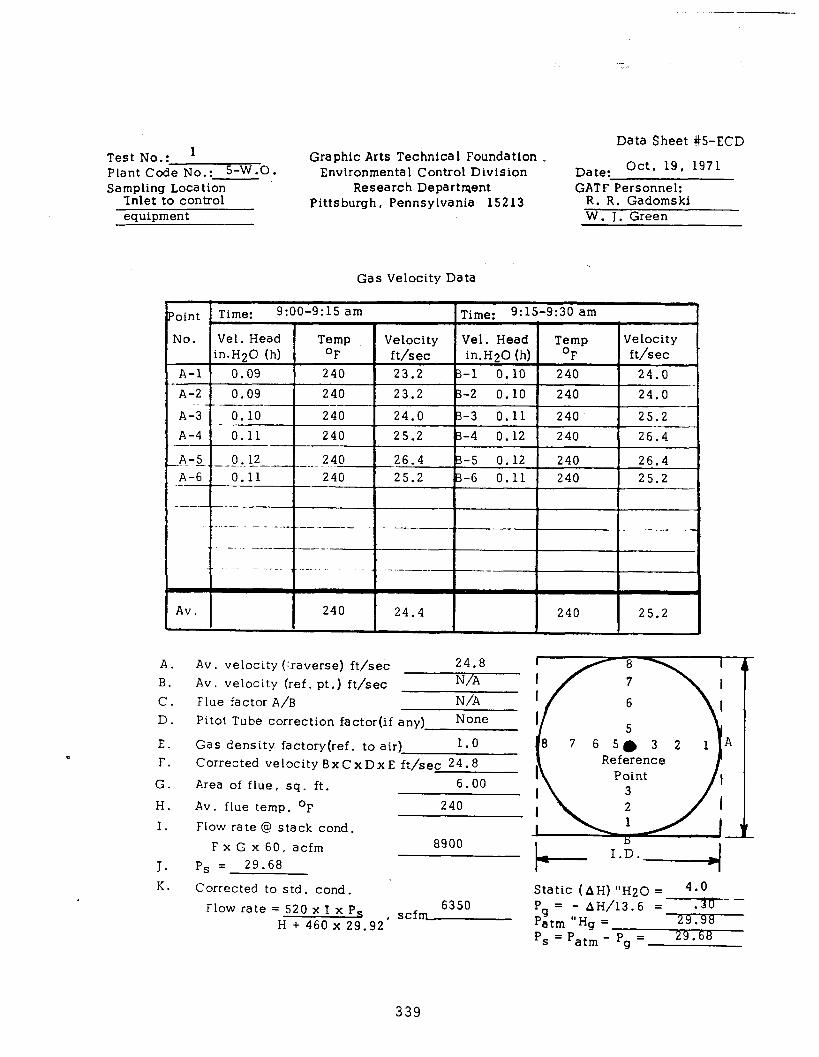
.
Test No.: ’ Plant Code No.: S-W.0. Sampling Location
?nlet to control equipment
Data Sheet #5-ECD Graphic Arts Technical Foundation .
Envlronmental Control Division Date: Oct. 19, 1971
Research Department GATF Personnel: Pittsburgh, Pennsylvania 15213 R. R. Gadomski
W. J. Green
Gas Velocity Data
24.0 p-3 0.11 240 25.2
A-4 1 0.11 240 25.2 -4 0.12 240 26,4 I
Point Time: 9:00-9:15 am 1 Time: 9:15-9:30 am 1
26.4 /B-5 0.12 1 240 1 26.4 -. 1 25.2 B-6 0.11 240 25.2 I
II
Av. I I
240 24.4 240 25.2 1
A. Av. velocity (:.raverse) ft/sec 24.8
B. Av. velocity (ref. pt.) ft/sec N/A
C. Flue factor A/B N/A D. Pitot Tube correction factor(if any) None
E. Gas density factory(ref. to air) 1.0 F. Corrected velocity Bx c x D x E ft/sec 24.6
G. Area of flue, sq. ft. 6.00
H. Av . flue temp. OF 240
1. Flow rate @ stack cond. FxGx60, acfm 8900
J. p, = 29.68
K. Corrected to std. cond.
Flow rate = 520 x I x P, 6350
H + 460 x 29.92 , scf-
Static (AH)I'H~o = 4-O
Pg = - AH/13.6 = .36-- Patm “Hg = . Ps=Patm- P = 29.68
g
339
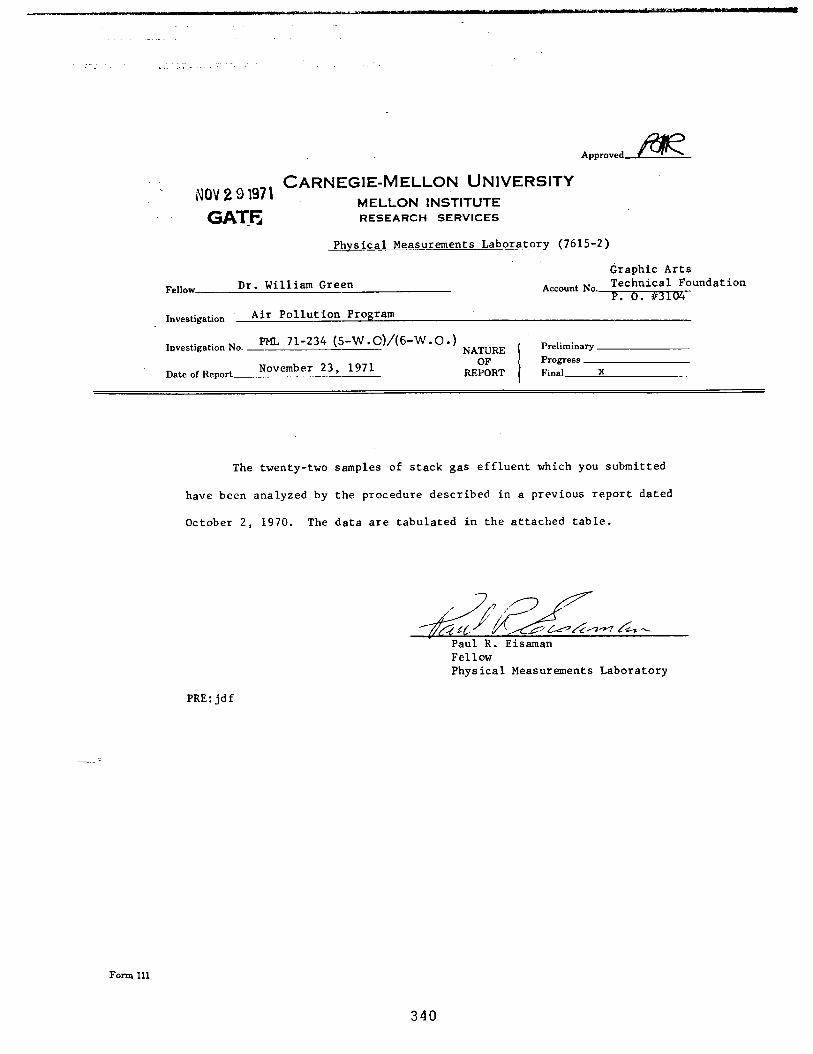
NOV 2 9 1971 CARNEGIE-MELLON UNIVERSITY
MELLON INSTITUTE
GA?!! RESEARCH SERVICES
Physical Measurements LSbOTatOTy (7615-2)
Fellow DT. William Green
Investigation Air Pollution Program
Investigation No. m 71-234 (5-W.O)/(6-W.O.) NATURE
November 23, 1971 OF
Date of Report REPORT -~
Graphic Arts
Account No. Technical Foundation P . 0. 93104
Preliminary Progress Final X
The twenty-two samples of stack gas effluent which you submitted
have been analyzed by the procedure described in a previous report dated
October 2, 1970. The data are tabulated in the attached table.
Paul R. Eisaman Fellow Physical MeaSuTementS Laboratory
PRE:jdf
Form 111
340
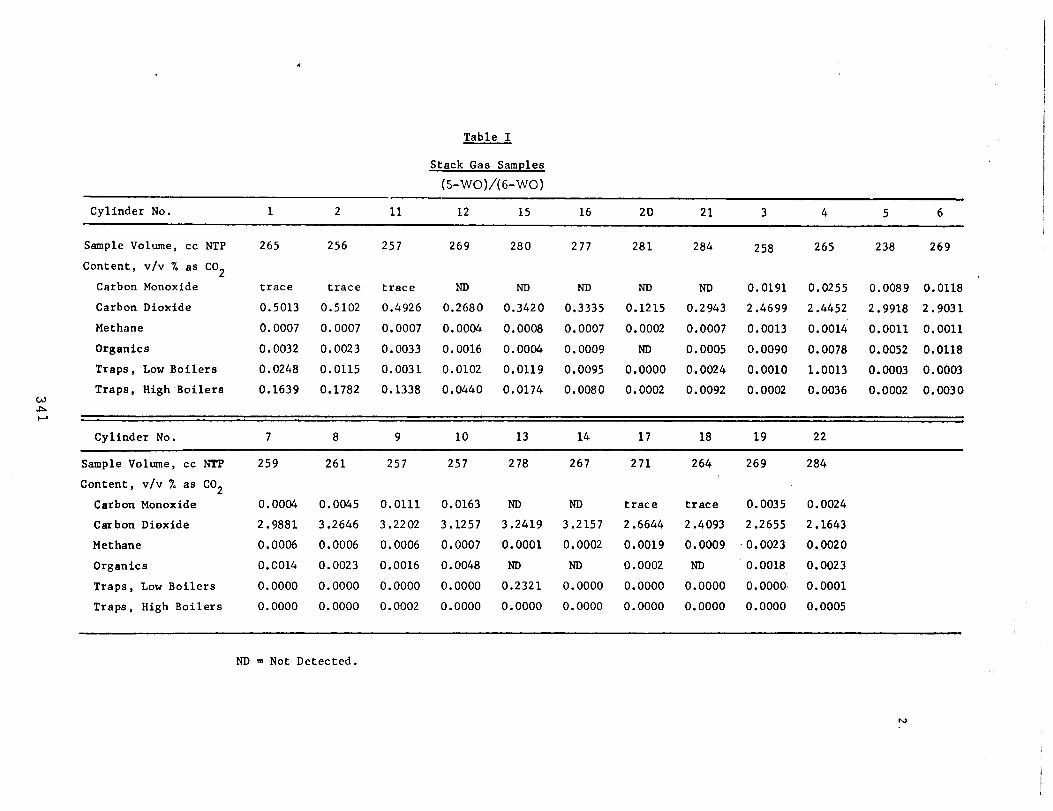
,
Table I
Stack Gas Samples
(S-WO)/( 6-WO)
Cylinder No. 1 2 11 12 15 16 20 21 3 4 5 6
Sample Volume, cc NTP 265 256 257 269 280 277 281 284 258 265 238 269
Content, v/v % as CO2
’ Carbon Monoxide trace trace trace ND ND ND ND ND 0.0191 0.0255 0.0089 0.0118
Carbon Dioxide 0.5013 0.5102 0.4926 0.2680 0.3420 0.3335 0.1215 0.2943 2.4699 2.4452 2.9918 2.9031
Methane 0.0007 0.0007 0.0007 0.0004 0.0008 0.0007 0.0002 0.0007 0.0013 0.0014 0.0011 0.0011
Organics 0.0032 0.0023 0.0033 0.0016 0.0004 0.0009 ND 0.0005 0.0090 0.0078 0.0052 0.0118
Traps, Low Boilers 0.0248 0.0115 0.0031 0.0102 0.0119 0.0095 0.0000 0.0024 0.0010 1.0013 0.0003 0.0003
Traps, High ‘Boilers 0.1639 0.1782 0.1338 0.0440 0.0174 0.0080 0.0002 0.0092 0.0002 0.0036 0.0002 0.0030 w 4 c,
Cylinder No. 7 8 9 10 13 14 17 18 19 22
Sample Volme, cc NTP
Content, v/v % as CO2
Carbon Monoxide
Carbon Dioxide
Methane
Organics
Traps, Low Boilers
Traps, High Boilers
259 261 257 257 278 267 271 264 269 284
0.0004 0.0045 0.0111 0.0163 ND ND trace trace 0.0035 0.0024
2.9881 3.2646 3.2202 3.1257 3.2419 3.2157 2.6644 2.4093 2.2655 2.1643
0.0006 0.0006 0.0006 0.0007 0.0001 0.0002 0.0019 0.0009 .0.0023 0.0020
O.CO14 0.0023 0.0016 0.0048 ND ND 0.0002 NJI 0.0018 0.0023
0.0000 0.0000 0.0000 0.0000 0.2321 0.0000 0.0000 0.0000 0.0000~ 0.0001
0.0000 0.0000 0.0002 0.0000 0.0000 0.0000 0.0000 0.0000 0.0000 0.0005
ND = Not Detected.
N
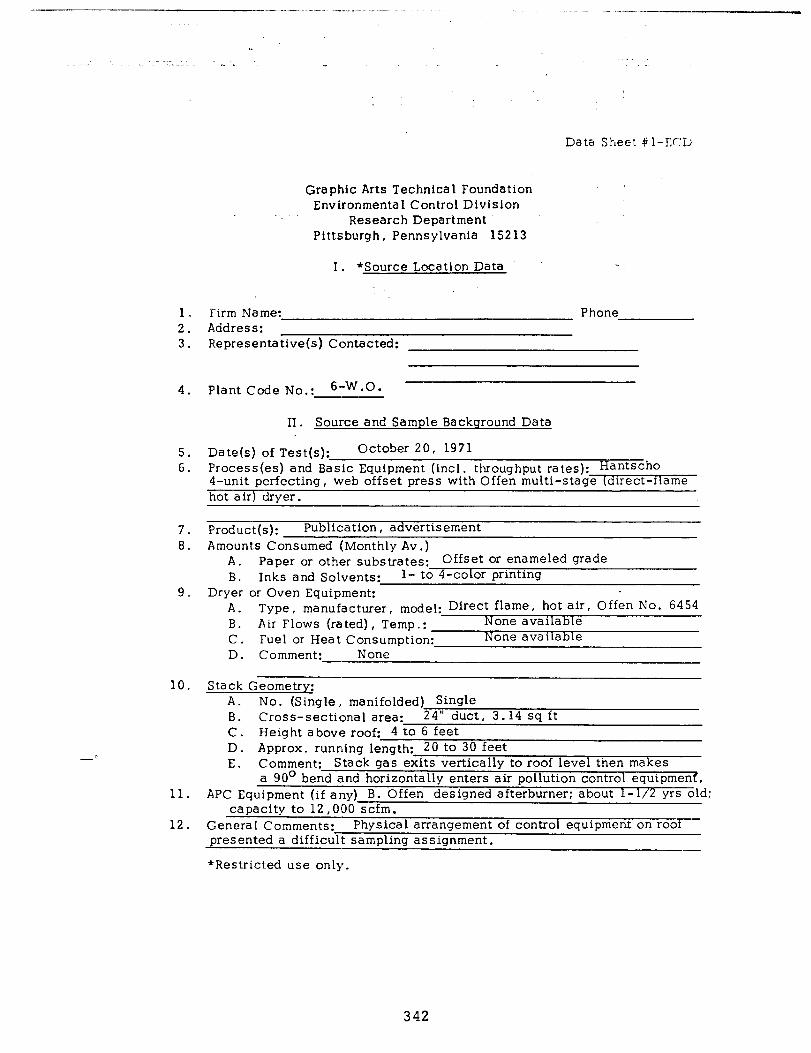
----- --- - .__ ““.. . . . . “_ _ ,. ,- .“._ ._-- _____-
Data Sheet ?+l-CCL,
Graphic Arts Technical Foundation Environmental Control Division
Research Department Pittsburgh, Pennsylvania 152 13
I. *Source Location Data
1. Firm Name: Phone 2. Address: 3. Representative(s) Contacted:
4. Plant Code No.: 6-w*o*
II . Source and Sample Background Data
5. Date(s) of Test(s): October 20, 1971 6. Process(es) and B
4-unit perfecting, web offset press with Offen multi-stage (airect-flame hot air) dryer.
7. Product(s): Publication, advertisement 8. Amounts Consumed (Monthly Av .)
A. Paper or other substrates: Offset or enameled grade B. Inks and Solvents: l- to 4-color printing
9. Dryer or Oven Equipment: A. Type, manufacturer, model: Direct flame, hot air, Offen NO. 6454 B. Air Flows (rated), Temp.: None available C. Fuel or Heat Consumption: None available D. Comment:- None
10. Stack Geometry:
11.
12.
A. No. (Single , manifolded) Single B. Cross-sectional area: 24” duct, 3.1, 4 SC ft C. Height above roof: 4 to 6 feet D. Approx. running length: 20 to 30 feet E. Comment: Stack gas exits vertically to roof level then makes
a 90° bend and horizontally enters air pollution control equipmenl. APC Equipment (if any) B. Offen designed afterburner: about l-1/2 yrs old;
capacity to 12,000 scfm. Genera I Comments: Physical arrangement of control equipment on roof presented a difficult sampling assignment.
*Restricted use only.
342
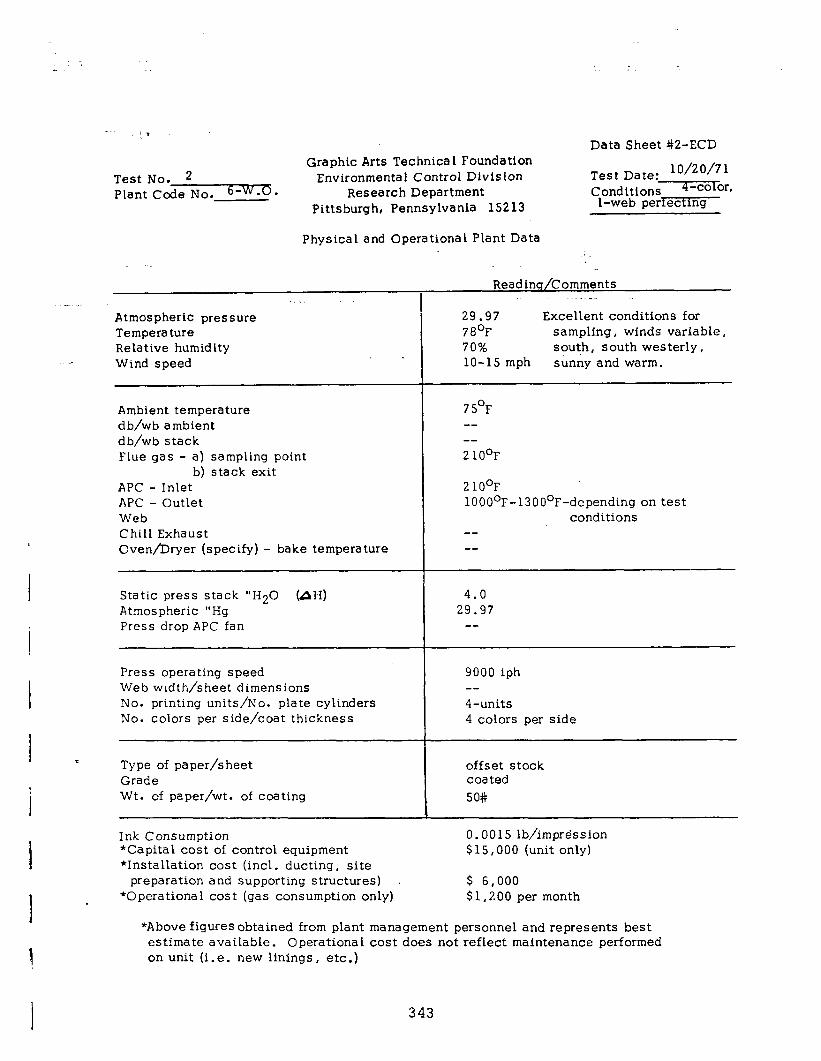
Graphic Arts Technical Foundation Test No. 2 Environmental Control Division Plant Code No. 6-W.0. Research Department
Pittsburgh, Pennsylvania 15213
Physical and Operational Plant Data
_
Readinq/Comments _. _. I _. __
Atmospheric pressure Temperature Relative humidity Wind speed
29.97 Excellent conditions for 78’F sampling, winds variable, 70% south, south westerly, lo-15 mph sunny and warm.
Ambient temperature d b/wb ambient db/wb stack Flue gas - a) sampling point
b) stack exit APC - Inlet APC - Outlet Web Chill Exhaust Oven/Dryer (specify) - bake temperature
75’F -- -- 2 lOoF
2 lOoF 1000°F-13000F-depending on test
conditions --
i --
Static press stack “H20 (AH) Atmospheric “Hg Press drop APC fan
I 4.0
29.97
Press operating speed 9000 iph Web width/sheet dimensions -- No. printing units/No. plate cylinders 4-units No. colors per side/coat thickness 4 colors per side
e Type of paper/sheet Grade Wt. of paper/wt. of coating
offset stock coated 50#
Ink Consumption *Capital cost of control equipment *Installation cost (incl. ducting , site
0.00 15 lb/impression $15,000 (unit only)
preparation and supporting structures) . $ 6,000 *Operational cost (gas consumption only) $1,200 per month
*Above figures obtained from plant management personnel and represents best estimate available. Operational cost does not reflect maintenance performed on unit (i.e. new linings, etc.)
343
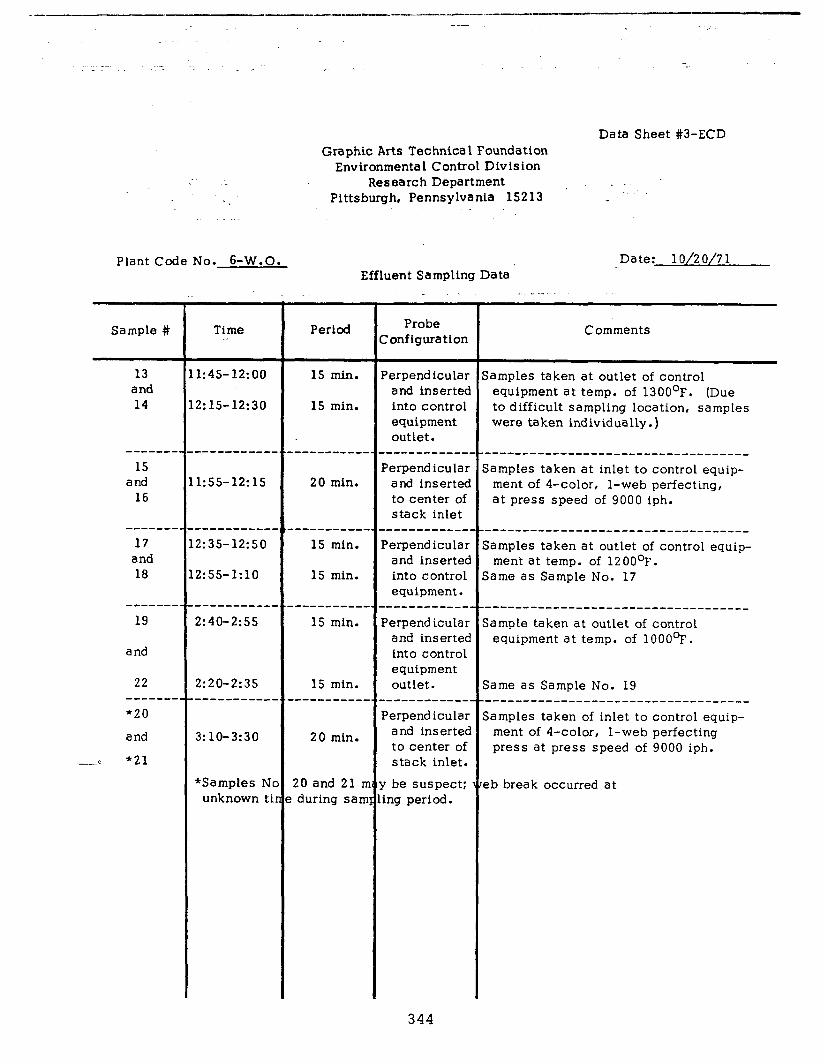
Graphic Arts Technical Foundation Data Sheet #3-ECD
. .
Environmental Control Division Research Department
Pittsburgh, Pennsylvania 15213
Plant Code No. 6-W.O. Effluent Sampling Data ’
Date: 1 o/2 o/7 1 . .
_ .- .
Sample #
13 and 14
----a--
15 and
16
-e---e-
17 and 18
Bc-----
19
and
22 --m--w- *20
and
--i f21
Time .I
1:45-12:00 15 min.
2:15-12:30 15 min.
1:55-12: 15 20 min.
----------. ------___- 7.:35-12:50 15 min.
2:55-lr10 15 min.
------e--m 15 min.
2:20-2:35 ---m-m ---_.
15 min. --------me
3: lo-3:30 20 min.
*Samples N unknown t
20 and 21 I during san
Period Probe Yonfiguration
‘erpend icular and inserted into control equipment outlet.
-----------m ‘erpend icular and inserted to center of stack inlet
-----------m ‘erpendicular and inserted into control equipment.
--------__-_ ‘erpend icular and inserted into control equipment outlet.
‘erpend icular and inserted to center of stack inlet.
I be suspect: ing period.
Comments
samples taken at outlet of control equipment at temp. of 13OO’F. (Due to difficult sampling location, samples were taken individually.)
----_------------_----------------- samples taken at inlet to control equip-
ment of 4-color, l-web perfecting, at press speed of 9000 iph.
----------------------------------- samples taken at outlet of control equip-
ment at temp. of 12OOOF. same as Sample No. 17
----------------------------------- Sample taken at outlet of control
equipment at temp. of 1000°F.
same as Sample No. 19 ----------------------------------- samples taken of inlet to control equip-
ment of 4-color, l-web perfecting press at press speed of 9000 iph.
eb break occurred at
344
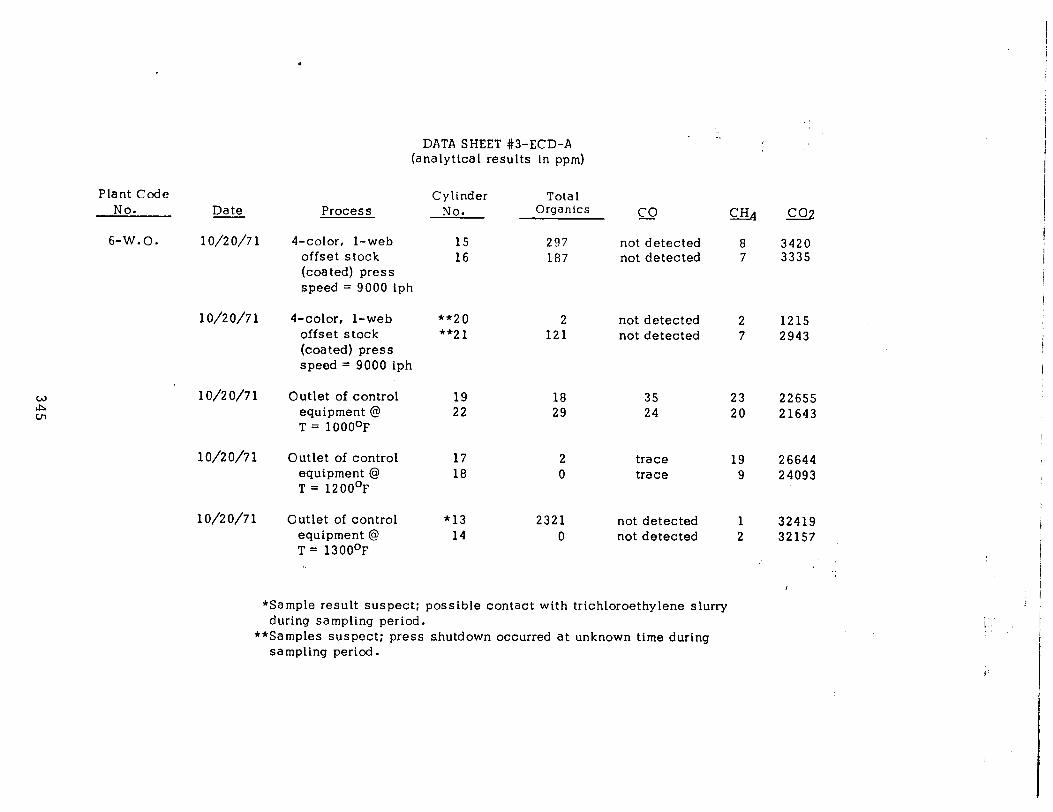
.
10/20/71
1 o/2 o/7 1
10/20/71
Plant Code No. Date Process
6-W.O. 1 o/2 o/7 1
10/20/71
4-color, l-web offset stock (coated) press speed = 9000 iph
4-color, l-web offset stock (coated) press speed = 9000 iph
Outlet of control equipment @ T = 1000°F
Outlet of control equipment @ T = 12OO’F
Outlet of control equipment @ T = 130O’F
DATA SHEET #3-ECD-A (analytical results in ppm)
Cylinder Total No. Organics CO -
15 297 not detected 8 16 187 not detected 7
**20 2 not detected 2 1215 **21 121 not detected 7 2943
19 18 35 23 22655 22 29 24 20 21643
17 2 trace 19 26644 18 0 trace 9 24093
*13 2321 not detected 1 32419 14 0 not detected 2 32157 :,
*Sample result suspect: possible contact with trichloroethylene slurry during sampling period.
**Samples suspect; press shutdown occurred at unknown time during sampling period.
co2
3420 3335
,.
i’
/ ! !
i i, i
I
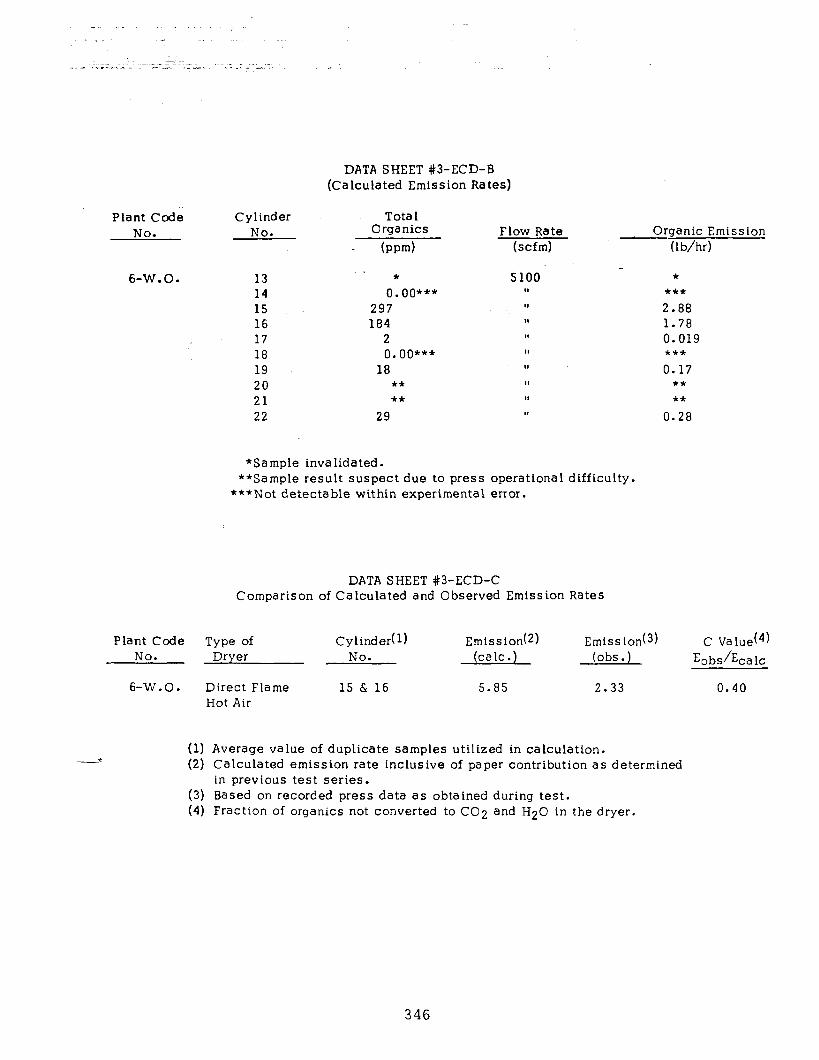
Plant Code Cylinder No. No.
6-W.O. 13 14 15 16 17 18 19 20 21 22
DATA SHEET #3-ECD-B (Calculated Emission Rates)
Tota 1 Organics
hwm) Flow Rate
(scfm)
* 0. oo***
297 184
2 0. oo***
18 **
5100 * *** 2.88 1.78 0.019 *** 0.17
** **
29 II 0.28
Organic Emission (lb/hr)
*Sample invalidated. **Sample result suspect due to press operational difficulty.
***Not detectable within experimental error.
DATA SHEET #3-ECD-C Comparison of Calculated and Observed Emission Rates
Plant Code Type of Cylinder(l) Emission(2) Emission(3) C Value(4) No. Dryer No. (talc .) .) (obs Eobs/Eca lc
6-W.O. Direct Flame 15 & 16 5.85 2.33 0.40 Hot Air
(1) Average value of duplicate samples utilized in calculation. (2) Calculated emission rate inclusive of paper contribution as determined
in previous test series. (3) Based on recorded press data as obtained during test. (4) Fraction of organics not converted to CO2 and H20 in the dryer.
346
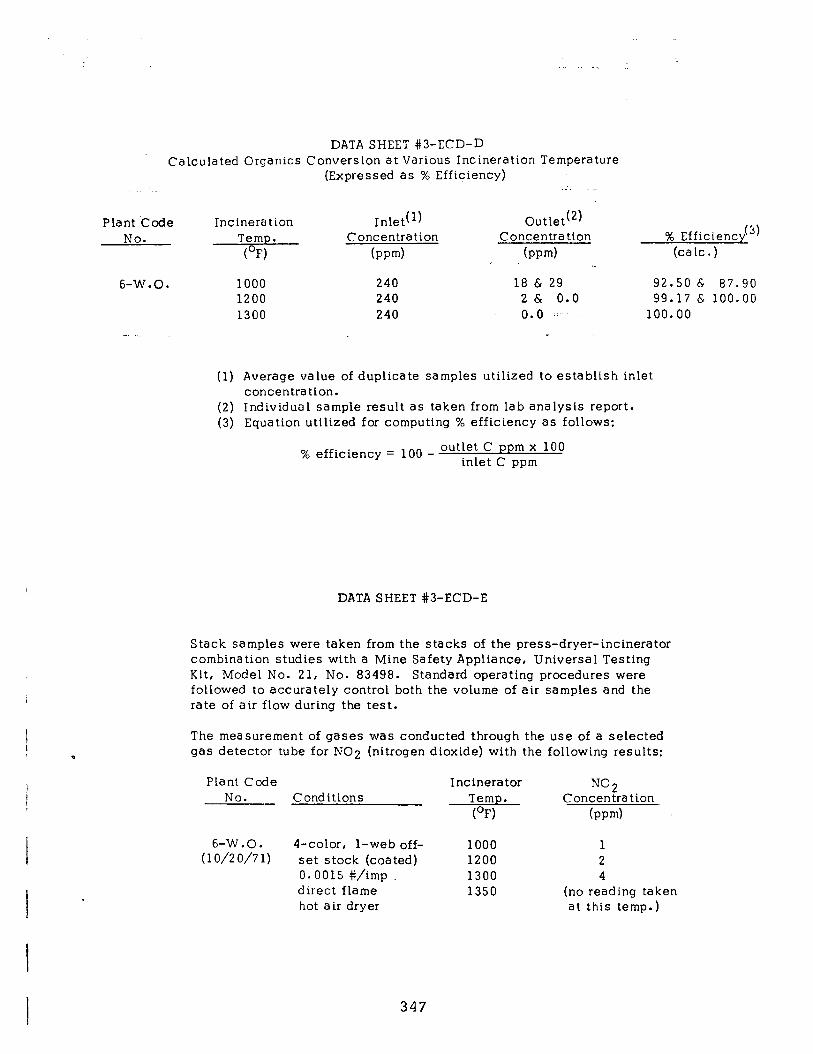
DATA SHEET #3-ECD-D Calculated Organics Conversion at Various Incineration Temperature
(Expressed as % Efficiency) : _.
Plant Code No.
Incineration Inlet(l) Temp. Concentration (OF’) bpm)
Outlet(2) Concentration
bpm) -.
% Efficiency(l) (talc.)
6-W.O. 1000 240 18 & 29 92.50 & 87.90 1200 240 2& 0.0 99.17 & 100.00 1300 240 0.0 .: 100.00
-.
(1) Average value of duplicate samples utilized to establish inlet concentration.
(2) Individual sample result as taken from lab analysis report. (3) Equation utilized for computing % efficiency as follows:
% efficiency = 100 - outlet C ppm x 100 inlet C ppm
DATA SHEET #3-ECD-E
Stack samples were taken from the stacks of the press-dryer-incinerator combination studies with a Mine Safety Appliance, Universal Testing Kit, Model No. 21, No. 83498. Standard operating procedures were followed to accurately control both the volume of air samples and the rate of air flow during the test.
The measurement of gases was conducted through the use of a selected gas detector tube for NO2 (nitrogen dioxide) with the following results:
Plant Code Incinerator Conditions
NC2 No. Temp. Concentration
(OFI hvm)
6-W.O. 4-color, l-web off- 1000 1 (10/20/71) set stock (coated) 1200 2
0.0015 #/imp 1300 4 direct flame 1350 (no reading taken hot air dryer at this temp.)
347
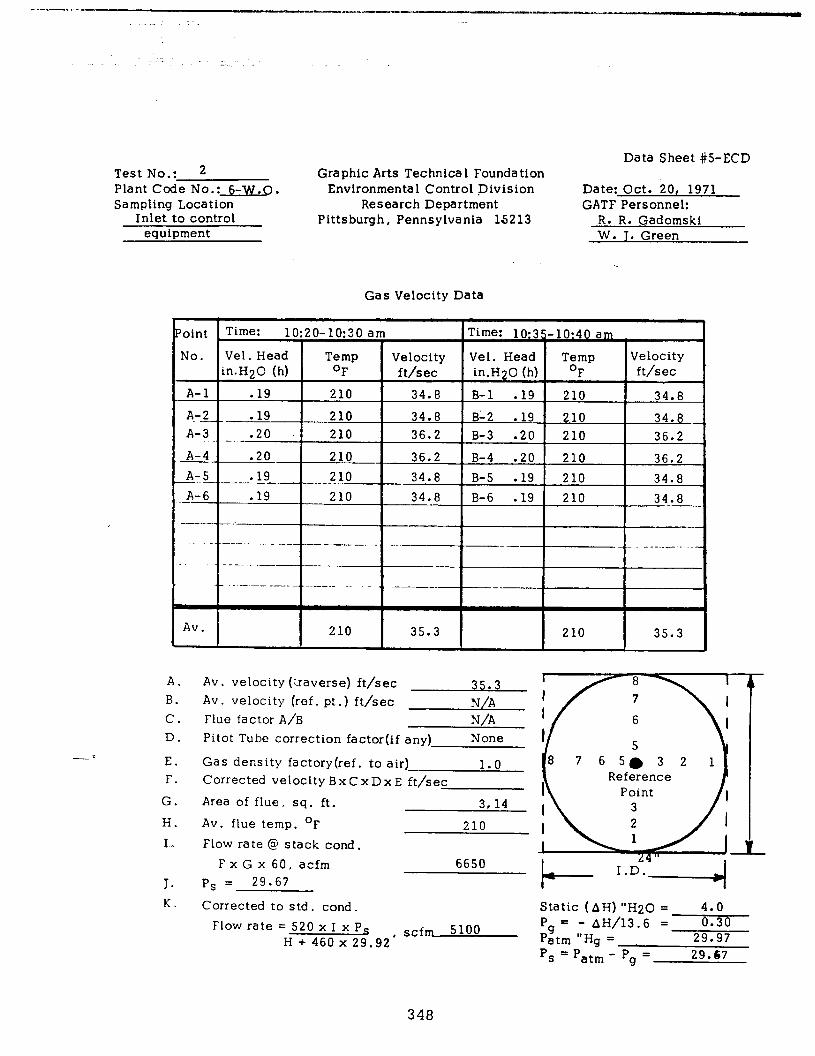
^ _ .
Test No.: 2 Plant Code No.: 6-W.Q* Sampling Location
Inlet to control equipment
Graphic Arts Tee hnica 1 Foundation Environmental Control Division
Research Department Pittsburgh, Pennsylvania 15213
Data Sheet #5-ECD
Date: Oct. 20, 1971 GATF Personnel:
R. R. Gadomski W. T. Green
Gas Velocity Data
J-6 .19 210 34.8 B-6 .19 210 34.8
:-
-.--- ___. ___ . .__
__-
Av. 210 35.3 210 35.3
-*
A. B. C. D.
E. F.
G.
H.
1.
J. K.
Av. velocity (:.raverse) ft/sec Av. velocity (ref. pt.) ft/sec Flue factor A/B Pitot Tube correction factor(if any)
Gas density factory(ref. to air) Corrected velocity BxCxDxE ft/sec
Area of flue, sq. ft.
Av. flue temp. OF
765.32 1 Reference
Flow rate @ stack cond.
FxGx 60, acfm Ps = 29.67
Corrected to std. cond. Static (AH) “H20 = 4.0
Flow rate = 520 x I x Ps 5100 Pg = - AH/13.6 = 0.30
H + 460 x 29.92’ scfm Patm “Hg = 29.97
P, = Patm - Pg = 29.67
348

CARNEGIE-MELLON UNIVERSITY NUV2~lY;/1 MELLON INSTITUTE
.GA?E RESEARCH SERVICES
Physical Measurements Laboratory (7615-2)
Fellow Dr. William Green Graphic Arts
Account No. Technical Foundation . . or
Investigation Air Pollution Program
Investigation No. PML 71-234 (s-wo)/( 6-WO) NATURE Preliminary
November 23, 1971 OF
I
Progress Date of Report - REPORT Final X
The twenty-two samples of stack gas effluent which you submitted
have been analyzed by the procedure described in a previous report dated
October 2, 1970. The data are tabulated in the attached table.
~~~~ , Y
Paul R. Eisaman Fellow Physical Measurements Laboratory
PRE:jdf
Form 111
349
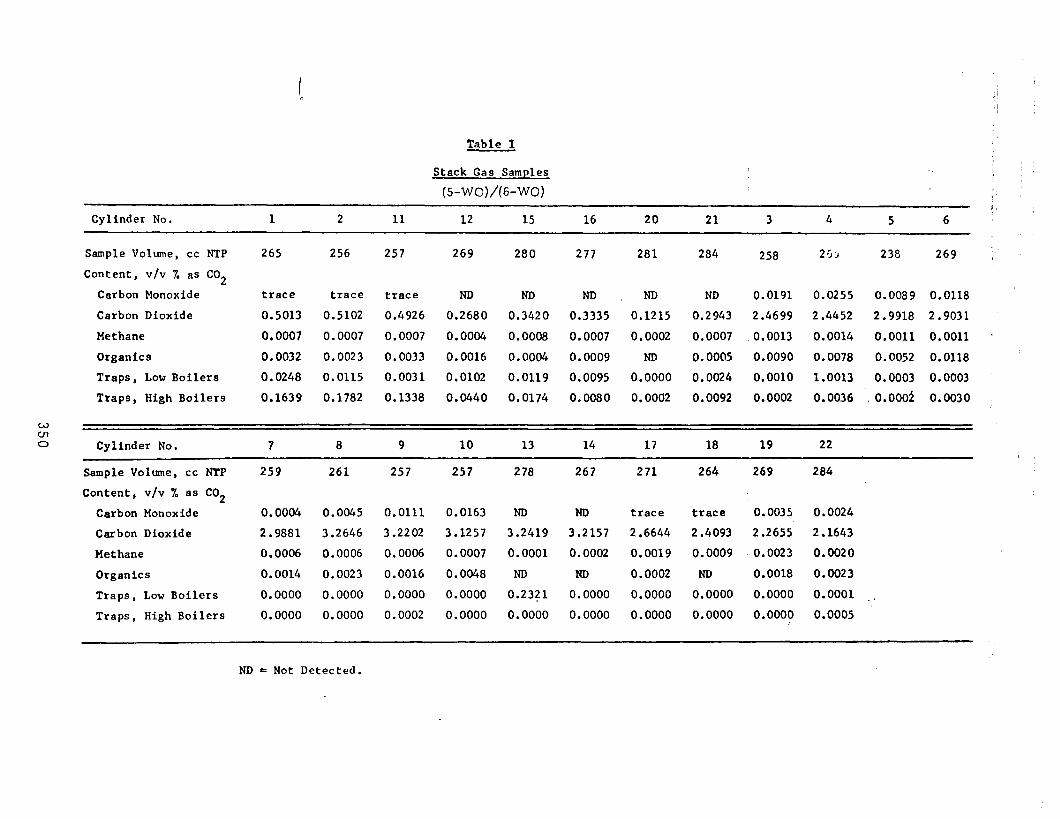
Table I
Stack Gas Samples
(S-WO)/(S-wo)
Cylinder No. 1 2 11 12 15 16 20 21 3 4 5 6
Sample Volume, cc NTP
Content, v/v 7. as CO2
Carbon Monoxide
Carbon Dioxide
Methane
Organics
Traps, Low Boilers
Traps, High Boilers
265
trace
0.5013
0.0007
0.0032
0.0248
0.1639
256 257 269 280 277 281 284 258 25) 238 269
trace trace ND ND ND ND ND 0.0191 0.0255 0.0089 0.0118
0.5102 0.4926 0.2680 0.3420 0.3335 0.1215 0.2943 2.4699 2.4452 2.9918 2.9031
0.0007 0.0007 0.0004 0.0008 0.0007 0.0002 0.0007 0.0013 0.0014 0.0011 0.0011
0.0023 0.0033 0.0016 0.0004 0.0009 ND 0.0005 0.0090 0.0078 0.0052 0.0118
0.0115 0.0031 0.0102 0.0119 0.0095 0.0000 0.0024 0.0010 1.0013 0.0003 0.0003
0.1782 0.1338 0.0440 0.0174 0.0080 0.0002 0.0092 0.0002 0.0036 o.oool 0.0030
w
z Cylinder No. 7 8 9 10 13 14 17 18 19 22
Sample Volume, cc NTP 259 261 257 257 278 267 271 264 269 284
Content, v/v % as CO2
Carbon Monoxide
Carbon Dioxide
Methane
Organics
Traps, Low Boilers
Traps, High Boilers 0.0000 0.0000 0.0002 0.0000 0.0000 0.0000 0.0000 0.0000 0.0000 0.0005
0.0004 0.0045 0.0111 0.0163 ND ND trace trace 0.0035 0.0024
2.9881 3.2646 3 -2202 3.1257 3.2419 3.2157 2.6644 2.4093 2.2655 2.1643
0.0006 0.0006 0.0006 0.0007 0.0001 0.0002 0.0019 0.0009 0.0023 0.0020
0.0014 0.0023 0.0016 0.0048 ND ND 0.0002 ND 0.0018 0.0023
0.0000 0.0000 0.0000 0.0000 0.23?1 0.0000 0.0000 0.0000 0.0000 0.0001 _,
ND = Not Detected.
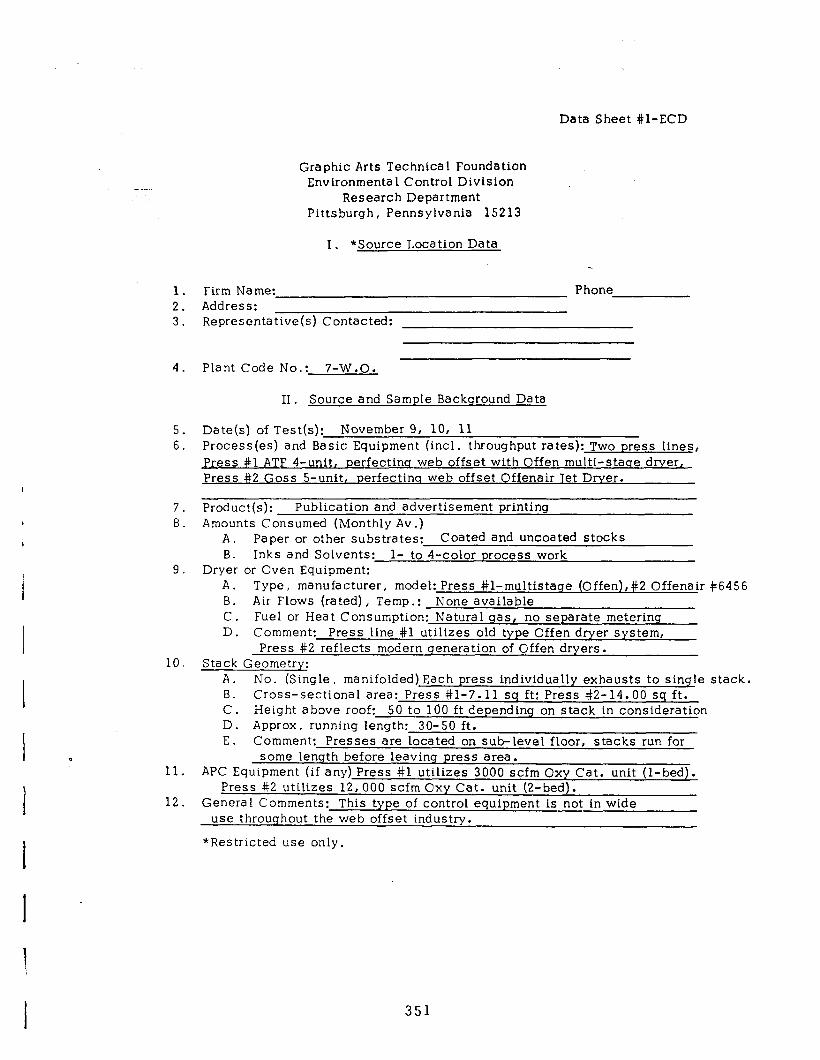
Data Sheet #l-ECD
F
Graphic Arts Technical Foundation Environmenta 1 Control Division
Research Department Pittsburgh, Pennsylvania 15213
I. *Source Location Data
1. Firm Name: Phone 2. Address: 3. Representative(s) Contacted:
4, Plant Code No.: 7-W.O.
II . Source and Sample Backsround Data
5. Date(s) of Test(s): November 9, 10, 11 6. Process(es) and Basic Equipment (incl. throughput rates): Two press lines,
Press #l ATF 4-unit, perfectinq web offset with Offen multi-staqe drver, Press #2 Goss S-unit, perfectins web offset Offenair Tet Drver.
7. Product(s): Publication and advertisement printing 8. Amounts Consumed (Monthly Av .)
A. Paper or other substrates: Coated and uncoated stocks B. Inks and Solvents: l- to 4-color process work
9. Dryer or Oven Equipment: A. Type, manufacturer, model: Press #1-multistaqe (Offen),#2 Offenair #6456 B. Air Flows (rated), Temp.: None available C. Fuel or Heat Consumption: Natural gas, no separate metering D. Comment: Press line #l utilizes old type Cffen dryer system,
Press #2 reflects modern qeneration of Offen dryers. 10, Stack Geometry:
A. No. (Single, manifolded) Each press individually exhausts to single stack. B. Cross-sectional area: Press #l-7.11 sq ft: Press #2-14.00 sq ft. C. Height above roof: 50 to 160 ft depending on stack in consideration D. Approx. running length: 30-50 ft. E. Comment: Presses are located on sub-level floor, stacks run for
some length before leaving press area. 11. APC Equipment (if any) Press #l utilizes 3000 scfm Oxy Cat. unit (l-bed).
Press #2 utilizes 12,000 scfm Oxy Cat. unit (2-bed). 12. General Comments: This type of control equipment is not in wide
use throughout the web offset industry.
*Restricted use only.
351
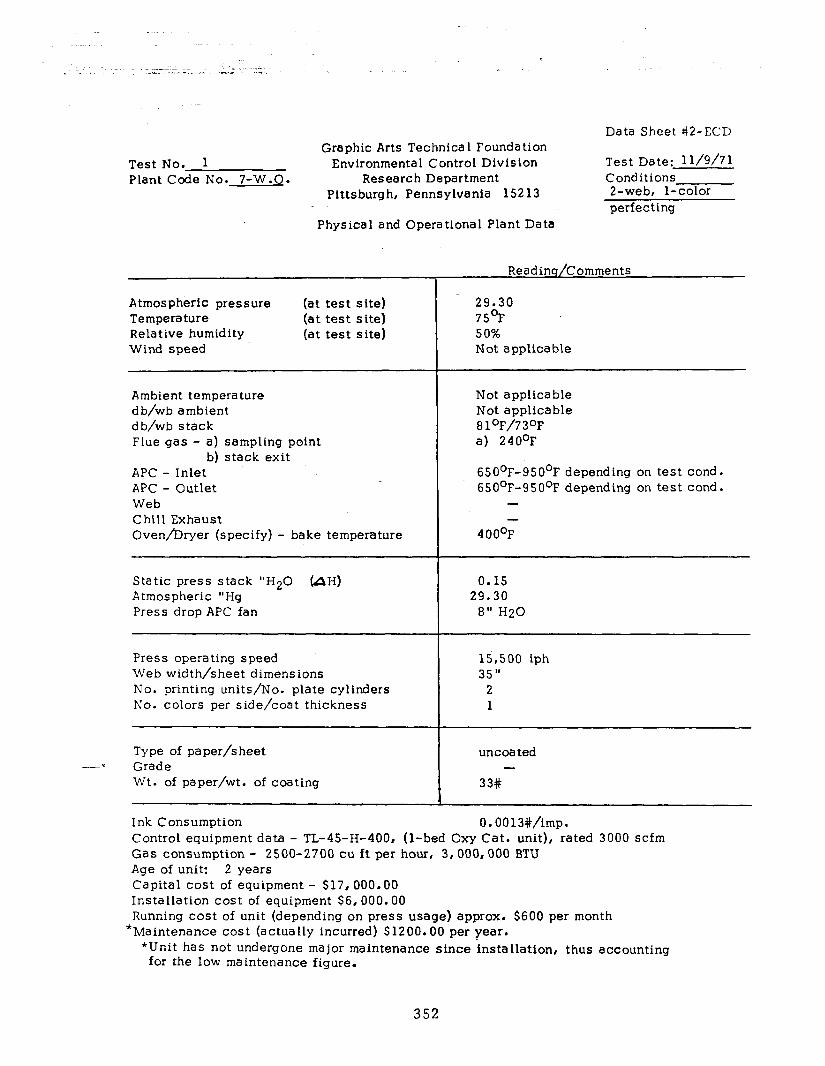
Data Sheet #2-ECD Graphic Arts Technical Foundation
Test No. 1 Environmental Control Division Test Date: 1 l/9/71 Plant Code No. 7-W.O. Research Department Conditions
Pittsburgh, Pennsylvania 152 13 2-web, l-color perfecting
Physical and Operational Plant Data
Atmospheric pressure Temperature Relative humidity Wind speed
(at test site) (at test site) (at test site)
Readinq/Comments
29.30 75’F 50% Not applicable
Ambient temperature db/wb ambient db/wb stack Flue gas - a) sampling point
b) stack exit APC - Inlet APC - Outlet Web Chill Exhaust
Not applicable Not applicable 81°F/730F a) 240°F
650°F-950°F depending on test cond. 650°F-950°F depending on test cond.
-
Oven/Dryer (specify) - bake temperature 400’F
Static press stack “H20 (LIH) 0.15 Atmospheric “Hg 29.30 Press drop APC fan 8" H20
Press operating speed Web width/sheet dimensions No. printing units/No. plate cylinders No. colors per side/coat thickness
15,500 iph 35 ”
2 1
Type of paper/sheet -* Grade
Wt. of paper/wt. of coating
uncoated
33#
O.O013#/imp. Ink Consumption Control equipment data - TL-45-H-400, (l-bed Oxy Cat. unit), rated 3000 scfm Gas consumption - 2500-2700 cu ft per hour, 3,000,OOO BTU Age of unit: 2 years Capital cost of equipment - $17,000.00 Installation cost of equipment $6,000.00 Running cost of unit (depending on press usage) approx. $600 per month
*Maintenance cost (actually incurred) $1200.00 per year. *Unit has not undergone major maintenance since installation, thus accounting
for the low maintenance figure.
352
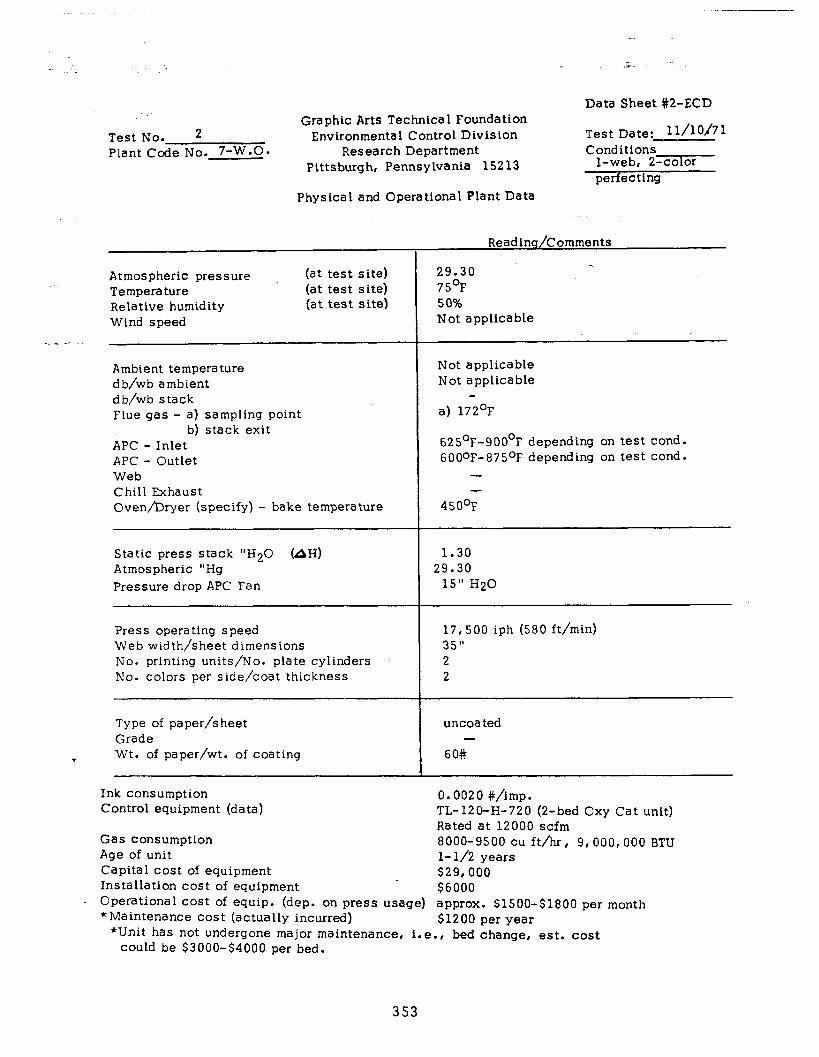
Data Sheet #2-ECD Graphic Arts Technical Foundation
Test No. 2 Environmental Control Division Test Date: 11/10/71 Plant Code No. 7-W.0. Research Department Conditions
Pittsburgh, Pennsylvania 15213 l-web, 2-color perfecting
Physical and Operational Plant Data
Atmospheric pressure Temperature Relative humidity Wind speed
(at test site) (at test site) (at test site)
29.30 75’F 50% Not applicable
_ “.
Ambient temperature db/wb ambient db/wb stack Flue gas - a) sampling point
b) stack exit APC - Inlet
Not applicable Not applicable
a) 172’F
625’F-900°F depending on test cond. 600oF-875OF depending on test cond.
- APC - Outlet Web Chill Exhaust Oven/Dryer (specify) - bake temperature 450’F
Static press stack “H20 (AH) 1.30 Atmospheric “Hg 29.30 Pressure drop APC Fan 15” H20
Press operating speed Web width/sheet dimensions No. printing units/No. plate cylinders No. colors per side/coat thickness
17,500 iph (580 ft/min) 35” 2 2
Type of paper/sheet Grade
w Wt. of paper/wt. of coating
Ink consumption Control equipment (data)
uncoated -
SO#
Gas consumption Age of unit Capital cost of equipment Installation cost of equipment
0.0020 #/imp. TL-120-H-720 (2-bed Oxy Cat unit) Rated at 12000 scfm 8000-9500 cu ft/hr, 9,000,OOO BTU l-1/2 years $29,000 $6000
Readins/Comments
. Operational cost of equip. (dep. on press usage) approx. $1500-$1800 per month *Maintenance cost (actually incurred) $1200 per year
*Unit has not undergone major maintenance, i.e., bed change, est. cost could be $3000-$4000 per bed.
353
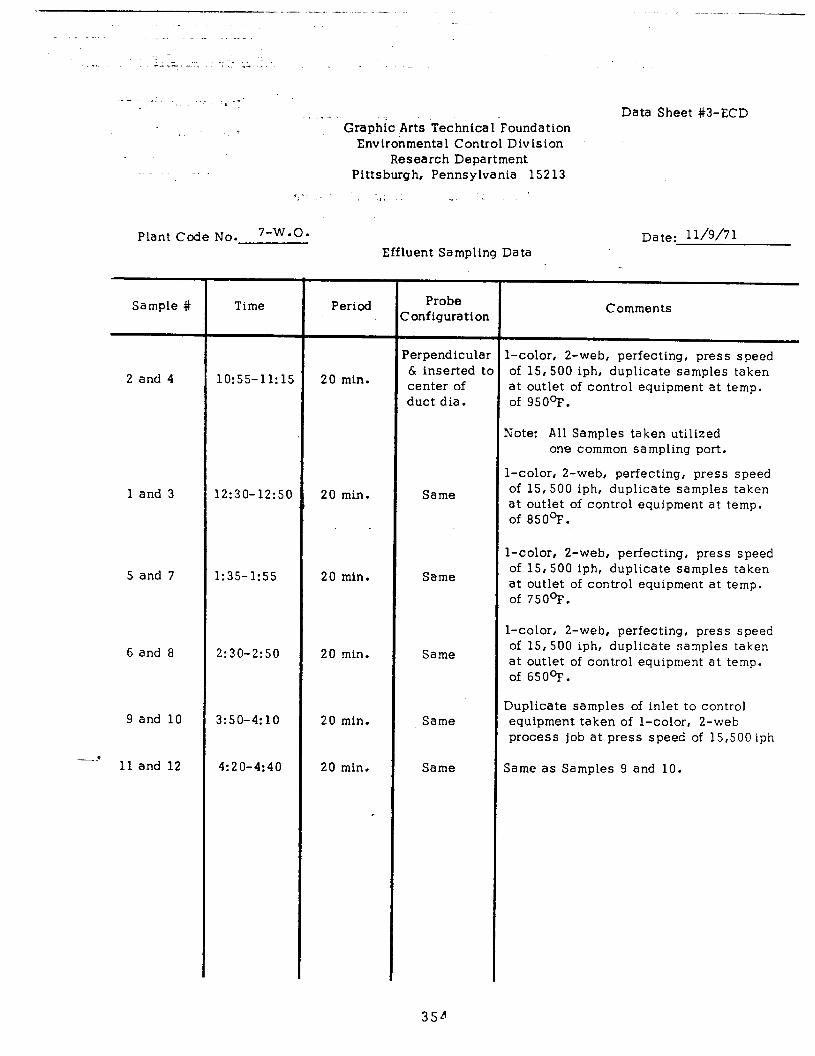
--.- .I_ 6
. :-‘
., 7 Graphic Arts Technical-Foundation Data Sheet #3-ECD
Environmental Control Division Research Department
Pittsburgh, Pennsylvania 15213
Plant Code No. 7-W.O. Date: 11/g/71
Sample #
2 and 4
1 and 3
5 and 7
6 and 8
9 and 10
-F 11 and 12
Time
~~~-
10:55-11:15
12:30-12:50
1:35-1:55
2:30-2:50
3:50-4:lO
4:20-4:40
Effluent Sampling Data
Period
20 min.
20 min.
20 min.
20 min.
20 min.
20 min.
Probe Zonfiguration
Perpendicular & inserted to center of duct dia.
Same
Same
Same
Same
Same
Comments
l-color, 2-web, perfecting, press speed of 15,500 iph, duplicate samples taken at outlet of control equipment at temp. of 95O’F.
Note: All Samples taken utilized one common sampling port.
l-color, 2-web, perfecting, press speed of 15,500 iph, duplicate samples taken at outlet of control equipment at temp. of 85O’F.
l-color, 2-web, perfecting, press speed of 15,500 iph, duplicate samples taken at outlet of control equipment at temp. of 750’F.
l-color, 2-web, perfecting, press speed of 15,500 iph, duplicate samples taken at outlet of control equipment at temp. of 650°F.
Duplicate samples of inlet to control equipment taken of l-color, 2-web process job at press speed of 15,500 iph
Same as Samples 9 and 10.
35n
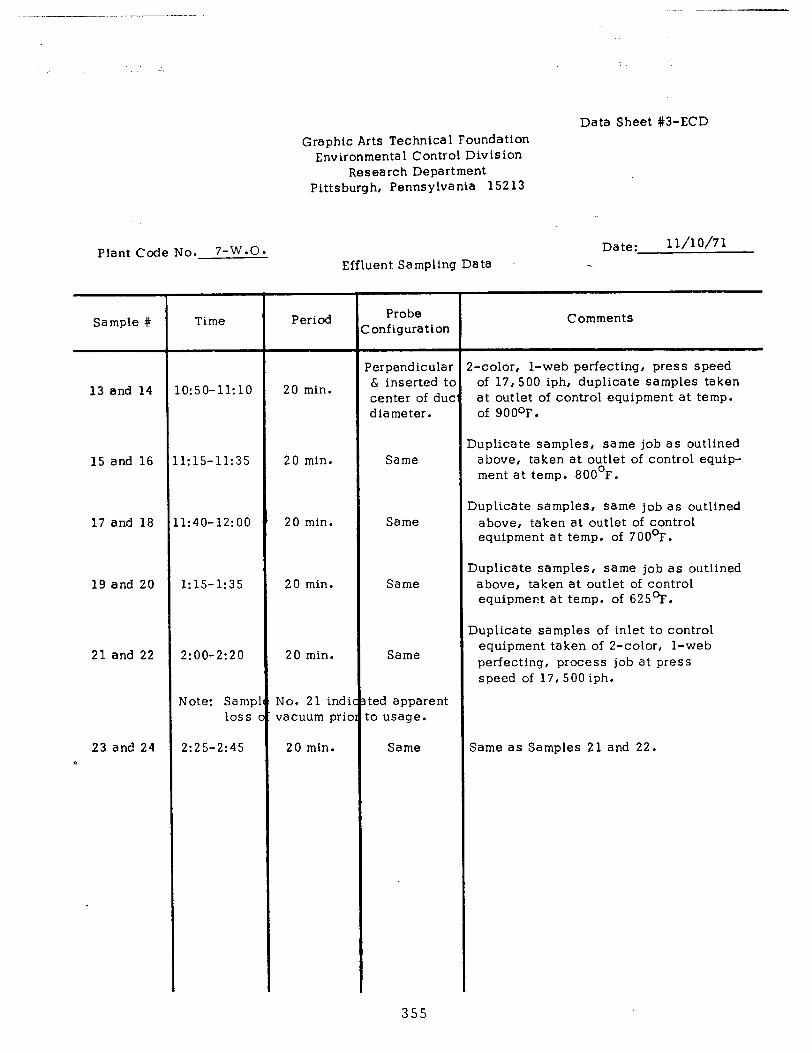
Plant Code No. 7-W.O.
Sample #
13 and 14
15 and 16 1:15-11:35
17 and 18 1:40-12:00
19 and 20 1:15-1:35
21 and 22
23 and 24 P
Time
0:50-11:lO
2:00-2:20
Vote: Samp loss
2:25-2:45
Data Sheet #3-ECD Graphic Arts Technical Foundation
Environmental Control Division Research Department
Pittsburgh, Pennsylvania 15213
Effluent Sampling Data Date: 1 l/l o/7 1
Period
20 min.
20 min.
20 min.
20 min.
20 min.
No. 21 indi vacuum pric
20 min.
Probe Yonfiguration
‘erpendicular & inserted tc center of due diameter.
Same
Same
Same
Same
ted apparent :o usage.
Same
Comments
!-color, l-web perfecting, press speed of 17,500 iph, duplicate samples taken at outlet of control equipment at temp. of 900°F.
duplicate samples, same job as outlined above, taken at outlet of control equip- ment at temp. 8OOOF.
Duplicate samples., same job as outlined above, taken at outlet of control equipment at temp. of 700’F.
Duplicate samples, same job as outlined above, taken at outlet of control equipment at temp. of 625oF.
Duplicate samples of inlet to control equipment taken of 2-color, l-web perfecting, process job at press speed of 17,500 iph.
Same as Samples 21 and 22.
355
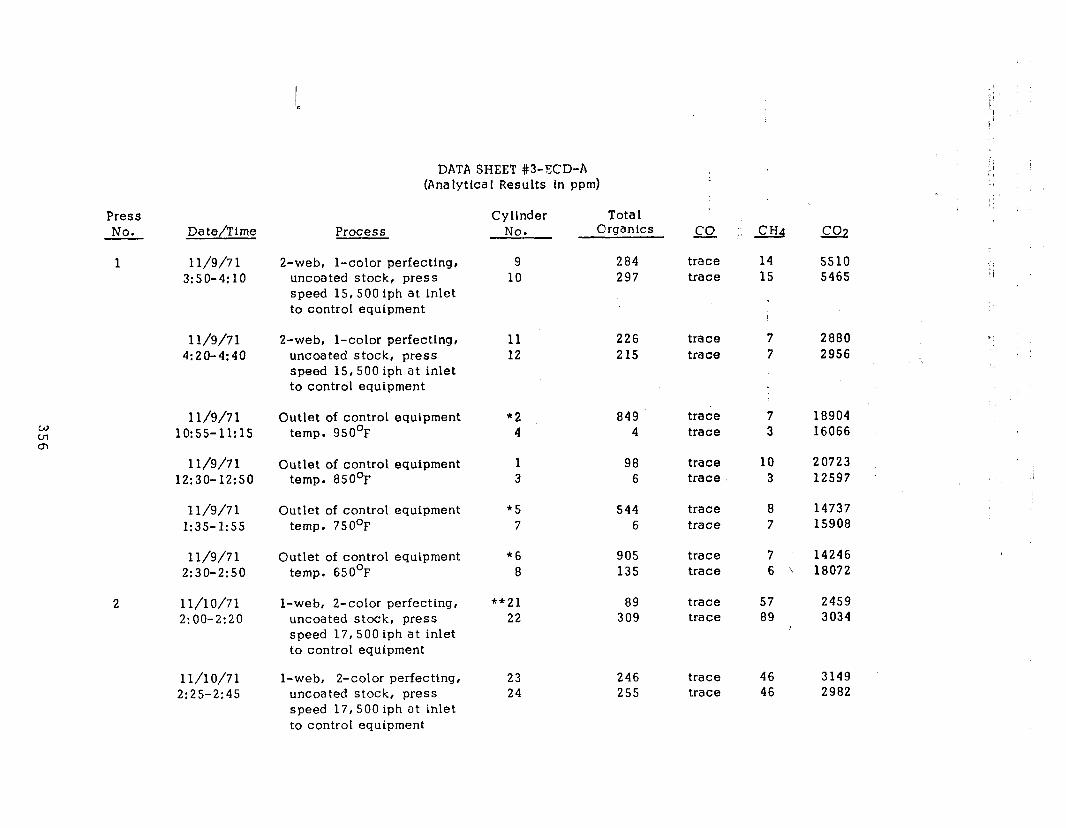
Press No.
1
Date/Time
1 l/9/71 3:50-4:lO
1 l/9/71 4:20-4:40
2
1 l/9/71 Outlet of control equipment *2 849 10:55-11:15 temp. 950°F 4 4
1 l/9/71 Outlet of control equipment 1 98 12:30-12:50 temp. 850’~ 3 6
1 l/9/71 Outlet of control equipment 1:35-I:55 temp. 750°F
Outlet of control equipment temp. 650°F
l-web, 2-color perfecting, uncoated stock, press speed 17,500 iph at inlet to control equipment
*5 7
*6 8
**21 22
544 6
1 l/9/71 2:30-2:50
905 135
11/10/71 2:00-2:20
89 309
11/10/71 2:25-2:45
DATA SHEET #3-XD-A (Ana lytica 1 Results in ppm)
2-web, l-color perfecting, uncoated stock, press speed 15,500 iph at inlet to control equipment
Cylinder No.
9 10
Tota 1 Organics
284 297
Process
P-web, l-color perfecting, uncoated stock, press speed 15,500 iph at inlet to control equipment
l-web, 2-color perfecting, uncoated stock, press speed 17,500 iph at inlet to control equipment
m
trace trace
11 12
226 trace 215 trace
CHq 14 15
! I
7 7
5510 5465
2880 2956
t
trace trace
trace trace
trace trace
trace trace
trace trace
7 18904 3 16066
10 20723 3 12597
8 14737 7 15908
7 6 \
57 89
14246 18072
2459 3034
23 246 trace 46 3149 24 255 trace 46 2982
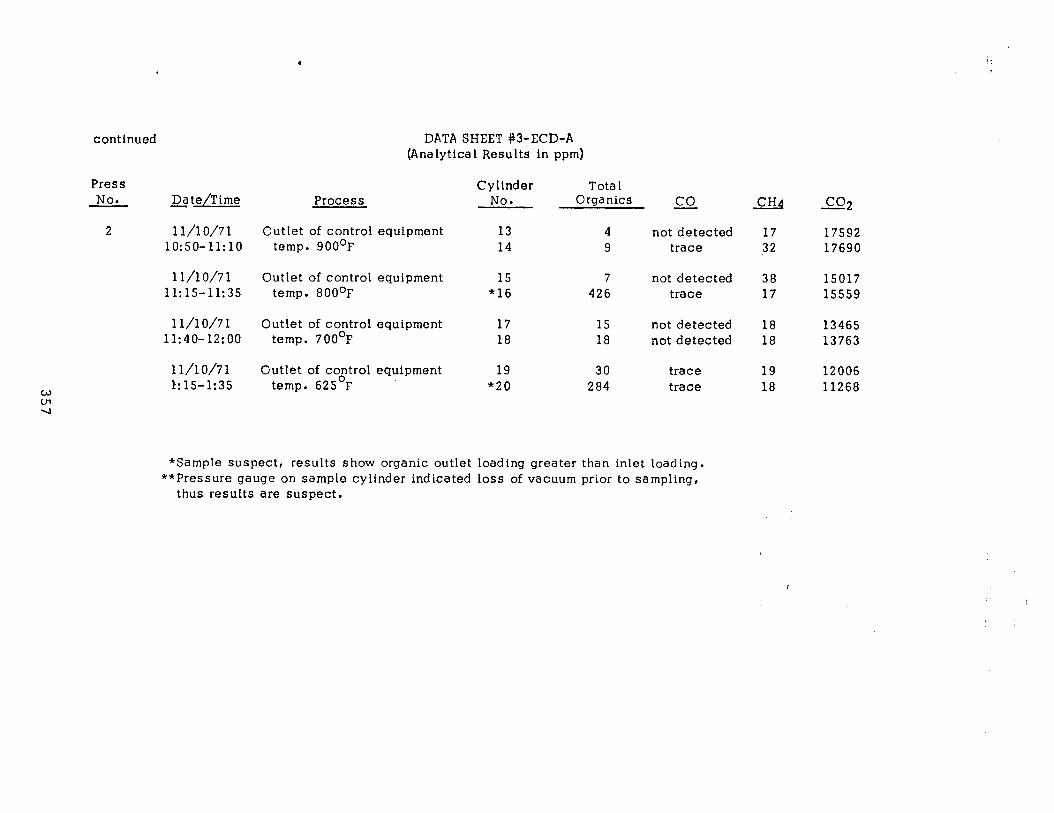
continued
Press No. Date/Time
2 1 l/l o/7 1 10:50-11:lO
11/10/71 11:15-11:35
11/10/71 Outlet of control equipment 17 15 not detected 18 13465 11:40-12:OO temp. 700°F 18 18 not detected 18 13763
11/10/71 l:15-1:35
DATA SHEET #3-ECD-A (Analytical Results in ppm)
Cylinder Total Process No. Organics a
Outlet of control equipment 13 4 not detected temp. 900°F 14 9 trace
Outlet of control equipment temp. 800°F
15 *16
7 not detected 38 426 trace 17
Outlet of control equipment temp. 625’~
19 *20
30 trace 19 12006 284 trace 18 11268
L&l
17 17592 32 17690
co2
15017 15559
*Sample suspect, results show organic outlet loading greater than inlet loading. **Pressure gauge on sample cylinder indicated loss of vacuum prior to sampling,
thus results are suspect.
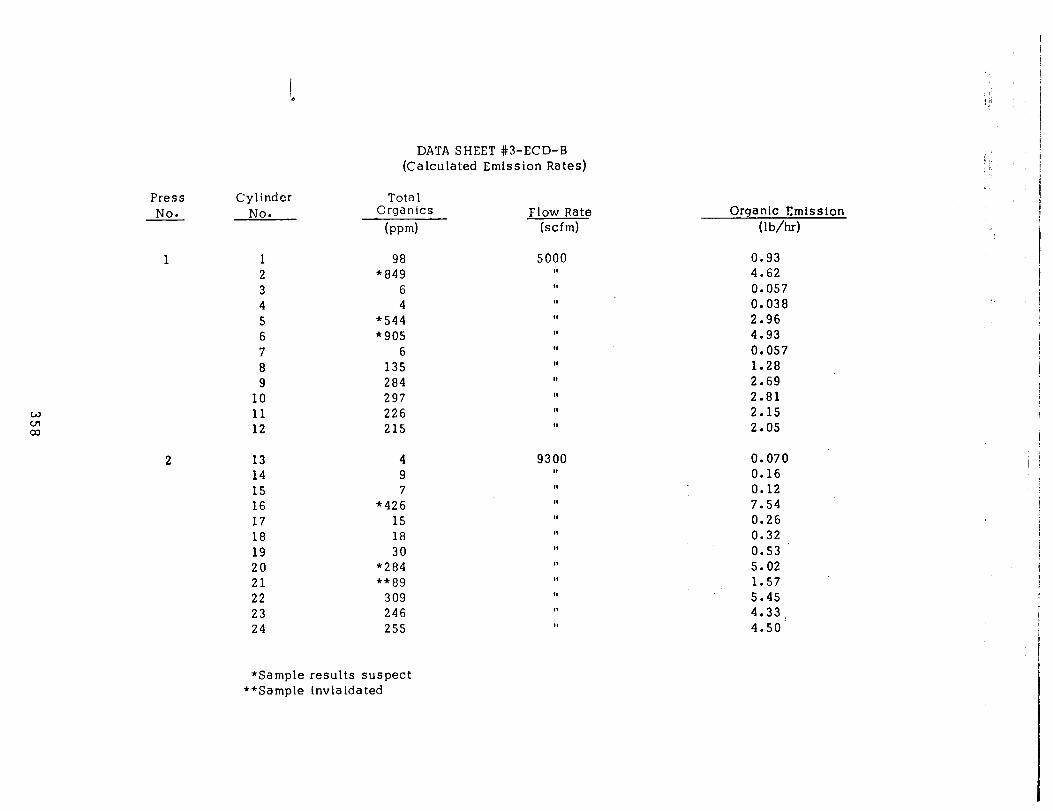
DATA SHEET #3-ECD-B (Calculated Emission Rates)
Press Cylinder No. No.
Tota 1 Organics
(pm-d Flow Rate
(scfm)
1 1 98 2 *849 3 6 4 4 5 *544 6 “905 7 6 8 135 9 284
10 297 11 226 12 215
13 4 14 9 15 7 16 *426 17 15 18 18 19 30 20 *284 21 **89 22 309 23 246 24 255
*Sample results suspect **Sample invlaidated
Organic Emission (lb/hd
0.93 4.62 0.057 0.038 2.96 4.93 0.057 1.28 2.69 2.81 2.15 2.05
0.070 0.16 0.12 7.54 0.26 0.32 0.53 5.02 1.57 5.45 4.33: 4.50
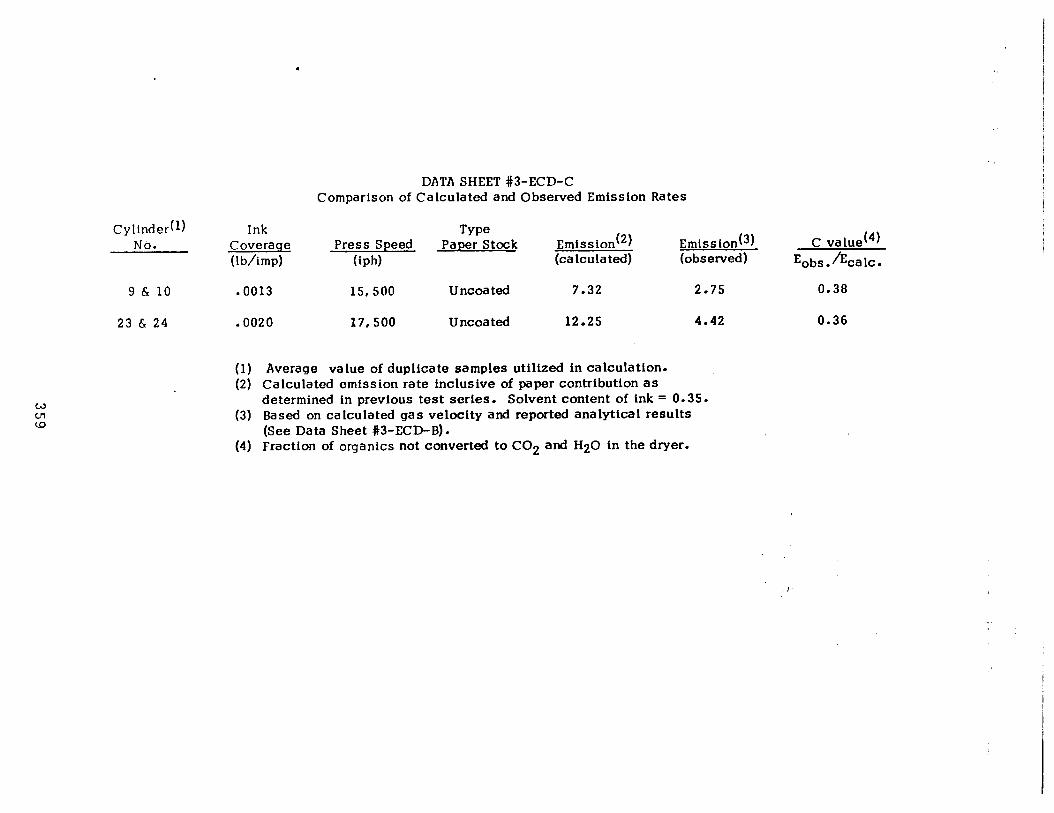
DATA SHEET #3-ECD-C Comparison of Calculated and Observed Emtsston Rates
Cylinder(l) No.
Ink Coveraqe (lb/imp)
Press Speed (id-d
Type Paper Stock Emission(2)
(calculated) Emiss tori(3) C value(4) (observed) E obs.iEcalc.
9 & 10 .0013 15,500 Uncoated 7.32 2.75 0.38
23 & 24 .0020 17,500 Uncoated 12.25 4.42 0.36
(1) Average value of duplicate samples utilized in calculation. (2) Calculated emission rate inclusive of paper contribution as
determined in previous test series. Solvent content of ink = 0.35. (3) Based on calculated gas velocity and reported analytical results
(See Data Sheet #3-ECD-B). (4) Fraction of organics not converted to CO2 and H20 in the dryer.
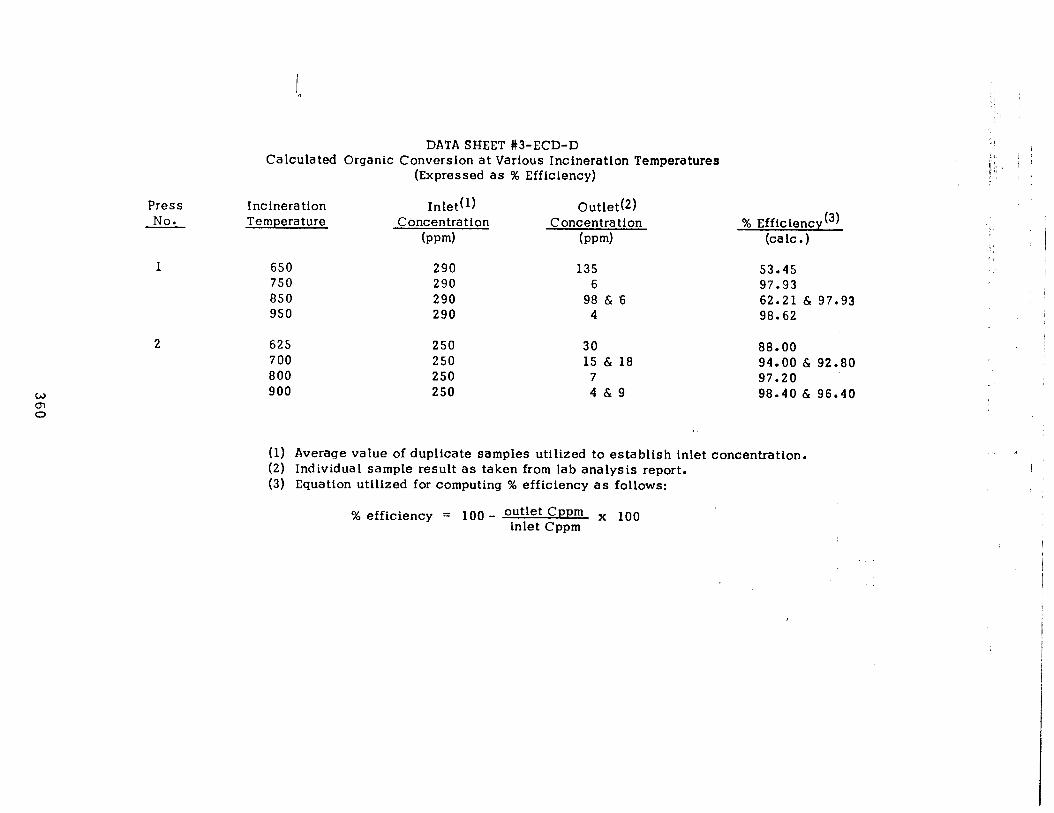
Press No.
1
2
W 0, 0
DATA SHEET #3-ECD-D Calculated Organic Conversion at Various Incineration Temperatures
(Expressed as % Efficiency)
Incineration Temperature
650 750 850 950
Inlet(l) Outlet(2) Concentration Concentration
bpm) (mm)
290 135 290 6 290 98 & 6 290 4
% Efficiencyt3) (talc.)
53.45 97.93 62.21 & 97.93 98.62
625 250 30 88.00 700 250 15 & 18 94.00 & 92.80 800 250 7 97.20 900 250 4&9 98.40 & 96.40
(1) (2) (3)
Average value of duplicate samples utilized to establish inlet concentration. Individual sample result as taken from lab analysis report. Equation utilized for computing % efficiency as follows:
% efficiency = 100 - Outlet Cppm x 100 inlet Cppm
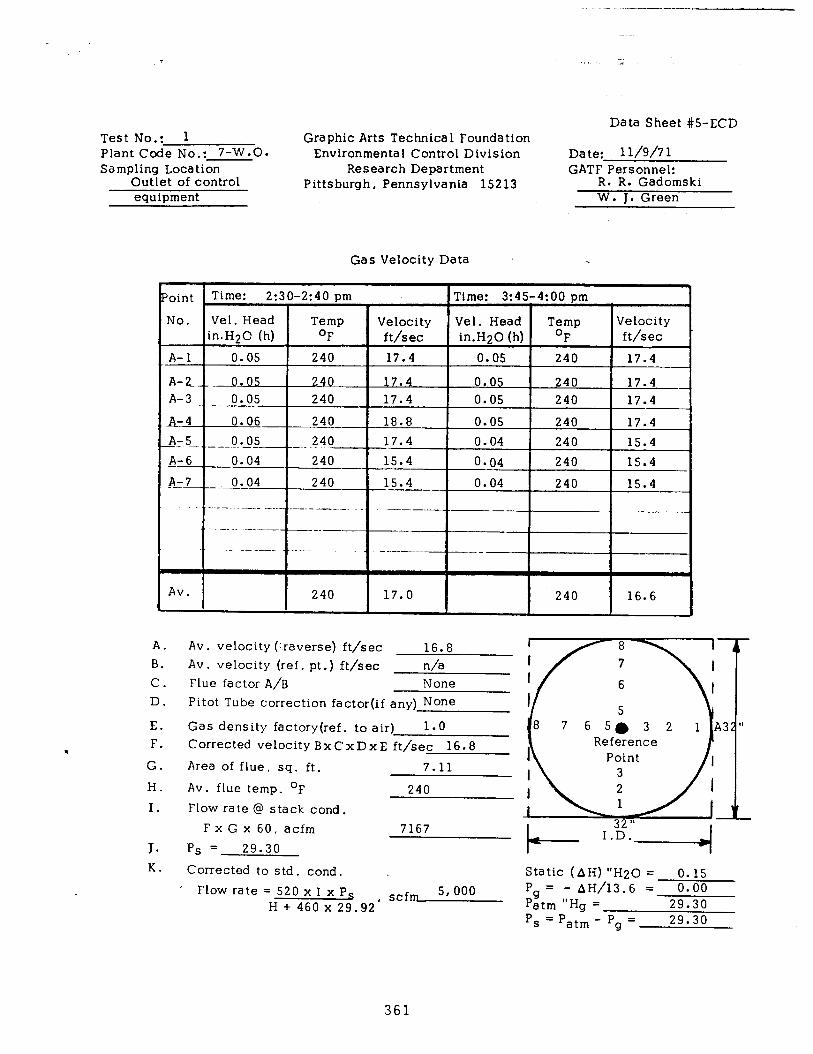
Test No.: 1 Plant Code No.: 7-W.0. Sampling Location
Outlet of control equipment
Graphic Arts Technical Foundation Environmental Control Division
Research Department Pittsburgh, Pennsylvania 15213
Data Sheet #5-ECD
Date: 1 l/9/7 1 GATF Personnel:
R. R. Gadomski W. J. Green
Gas Velocity Data .
--
Av. 240 17.0 240 16.6
A. Av. velocity (raverse) ft/sec 16.8 B. Av. velocity (ref. pt .) ft/sec n/a C. Flue factor A/B None D. Pitot Tube correction factor(if any) None
E. Gas density factory(ref. to air) 1.0 F. Corrected velocity BxCxDxE ft/sec 16.8
G. Area of flue, sq. ft. 7.11
H. Av. flue temp. OF 240 I. Flow rate @ stack cond.
F x G x 60, acfm 7167 J. Ps = 29.30 K. Corrected to std. cond.. . Static (AH) “H20 = 0.15
I Flow rate = 520 x I x P, scfm 5,000 Pg= - AH/13.6 = 0.00
H + 460 x 29.92’ Patm “Hg = 29.30 P, = Pat, - Pg = 29.30
361
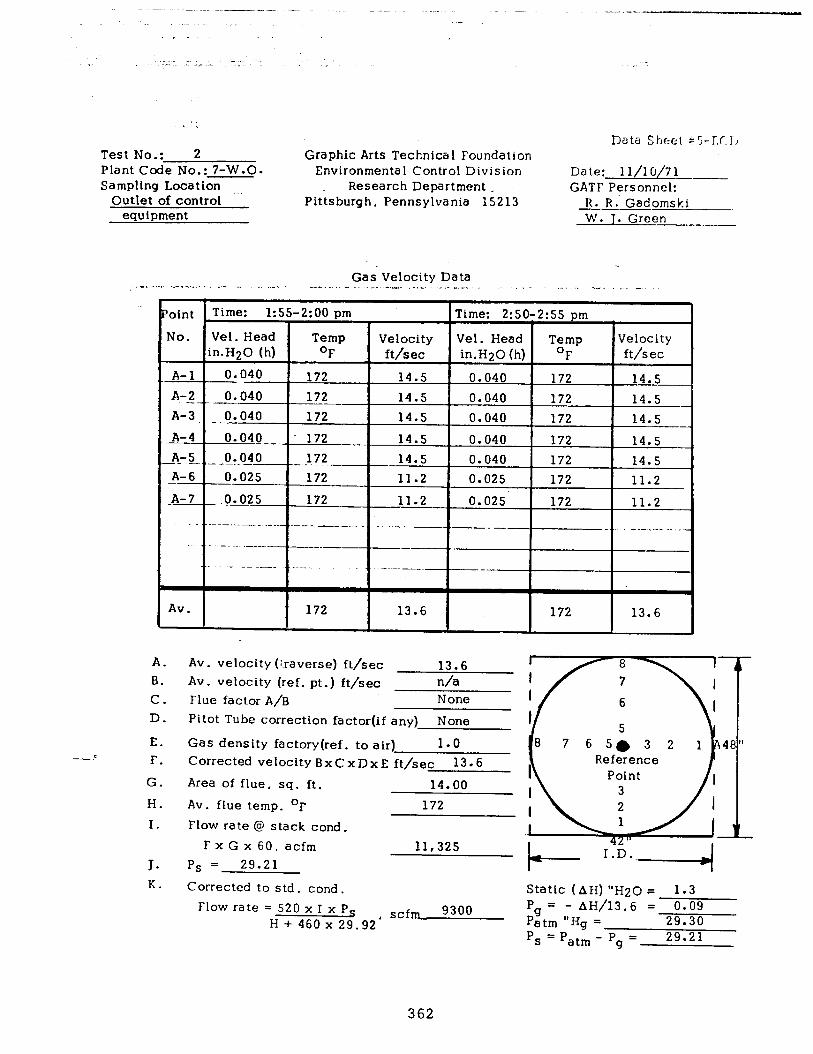
. . . :
Test No.: 2 Plant Code No.: 7-W.O. Sampling Location
Outlet of control -’ equipment
Graphic Arts Technical Foundation Environmental Control Division
Research Department ~ Pittsburgh, Pennsylvania 15213
Data Sheet PS-IX,?)
Date: 1 l/l o/71 GATF Personnel:
R. R.. Gadomski W. J. Green
Gas Velocity Data _ _. . . -- ._ _ ,. _- -7*. - ” _-, ._,, _. . _ _- s._. - . . . . __‘ , ., _
‘oint Time: 1:55-2:00 pm Time: 2:50:2:55 pm
No. Vel. Head Temp Velocity Vel. Head Temp Velocity in.H20 (h) OF ft/sec in.H20 (h) OF ft/sec
A-l 0.040 172 14.5 0.040 172 14.5
A-2 2040 172 14.5 0.040 172 14.5 _
A-3. -,CI.O40 172 14.5 0.040 172 14.5
A-4 0.040 172 14.5 0.040 172 14.5
-PC-L. --!LEc- --.A?? 14.5 _ 0.040 172 14.5
A-6 0.025 172 11.2 0.025 172 11.2
p-7 ..0.02 5 172 11.2 0.025 172 11.2
- - ----- .-.__ ..- --.._ ____ --- -
. -..-_ -__
Av. 172 13.6 172 13.6
3.6 A. Av. velocity (:&averse) ft/sec 1: B. Av. velocity (ref. pt.) ft/sec n/a C. Flue factor A/B None
D. Pitot Tube correction facto&f any) None
E. Gas density factory(ref. to air) 1.0 F. Corrected velocity BxCxDxE ft/sec 13.6
G. Area of flue, sq. ft. 14.00
H. Av. flue temp. OF 172
I. Flow rate @ stack cond. FxGx60, acfm 11,325
J. P, = 29.21
r
K. Corrected to std. cond. Static (AH) “H20 = 1.3 Flow rate = 520 x I x P,
H + 460x 29.92’ scfm 9300 Pg = - AH/13.6 = 0.09
Patm “Hg = 29.30 P, = Patm - Pg = 29.21
362
CARNEGIE-MELLON UNIVERSITY MELLON INSTITUTE RESEARCH SERVICES
Physical Measurements Laboratory (7615-2)
Fellow Mr. Ray Gadomski (2) Graphic Arts
Account ~,Technical Foundation P.O. 03104
Investigation Air Pollution Program
Investigation No. Pm 71-234-7-wao. - NATURE Preliminary
Date of Report December 23, 1971 OF Progress
- REPORT Final X
The twenty-four samples of stack gas effluent which you submitted
have been analyzed by the procedure described in a recent report dated
December 17, 1971. The data are tabulated in the attached table.
&??.zc+- Paul R. Eisaman Fellow Physical Measurements Laboratory
PRE:jdf
R&T: l/4/72
t
Foxm 111
363

Table I
Stack Gas Samples
Plant Code No. 7-W.O.
Cylinder No. 9 10 11 12 21 22 23 24 1 2 3 4 /
I
Sample Volume, ccNTP 272 271 274 268 289 272 246 265 ' '265 255 263 272
Content, v/v % as CO2
Carbon Monoxide trace trace m-m trace trace trace trace trace j trace trace trace trace
Carbon Dioxide 0.5510 0.5465 0.2880 0.2956 0.2459 0.3034 0.3149 0.2982 2.0723 1.8904 112597 1.6066
Methane 0.0014 0.0015 0..0007 0.0007 0.0057 0.0089 0.0046 0.0046 0.0010 0.0007 0.0003 0.0003
Organics 0.0008 0.0007 0.0003 0.0002 0.0008 0.0012 0.0009 0.0008 0.0012 0.0002 0.0002 0.0000
Traps, Low Boilers 0.0009 0.0040 0.0033 0.0011 ' 0.0003 0.0020 0.0024 0.0019 0.0015 0.0003 0.0003 0.0003
Traps, High Boilers 0.0267 0.0250 0.0190 0.0202 0.0078 0.0277 0.0213 0.0228 0.0071 0.0844.; 0.0001 0.0001
W 0-l 9
Cylinder No. 5 6 7 8 13 14 15 16 17 18 19 20
Sample Volume,cc NTP 246 271 276 273 244 239 144 236 -. 261 226 .1 262 260
Content, v/v % as CO2 :
Carbon Monoxide trace trace trace I
trace --- trace --- trace i --- -__ trace trace
Carbon Dioxide 1.4737 1.4246 1.5908 1.8072 1.7592 1.7690 1.5017 1.5559 1.3465 1.3763 1.2006 1.1268 I
Methane 0.0008 0.0007 0.0007 0.0006 0.0017 0.0032 0.0038 0.0017 0.0018' " 0.0018 0.0019 0.0018 I
Organics 0.0001 0.0000 0.0001 0.0003 0.0001 0.0006 0.0005 0.0000 0.0001 0.0000 0.0001 0.0002 I
Traps, Low Boilers 0.0014 0.0001 0.0002 0.0007 0.0001 0.0002 0.0002 0.0001 .0.0002 0.0001 0.0007 0.0003 i
Traps, High Boilers 0.0529 0.0904 0.0003 0.0125 0.0002 0.0001 0.0000 0.0425 0.0012) 0.0017 0.0022 0.0279

Data Sheet #I-ECD
1. 2. 3.
4.
5. 6.
7. 8.
9.
10.
Graphic Arts Technical Foundation Environmenta I Control Division
Research Department Pittsburgh, Pennsylvania 15213
I. *Source Location Data
Firm Name: Address: Representative(s) Contacted:
Phone
Plant Code No.: 8-WO (BC)
II. Source and Sample Background Data
Date(s) of Test(s): June 13, 1972 Process(es) and Basic Equipment (incl. throughput rates): S-unit, Hanscho Mark II web offset perfecting press with WPE combination direct flame and hot air dryer utilizinq 3-6 ft dryer boxes and controlled by a TEC Syste therma 1 afterburner. Product(s): Publication Printinq Amounts Consumed (Monthly Av .)
A. Paper or other substrates: Not applicable _ B. Inks and Solvents: Not applicable
Dryer or Oven Equipment: A. B. C. D.
Type, manufacturer, model: WPE combination type Air Flows (rated), Temp.: 2400 scfm @ discharge temp. 340°F Fuel or Heat Consumption: l,ZOO,OO Btu/hr
pe design and is no lonser Comment: Dryer represents old tyl commercially manufactured.
Stack A. B. C. D. E.
‘ms
.
365
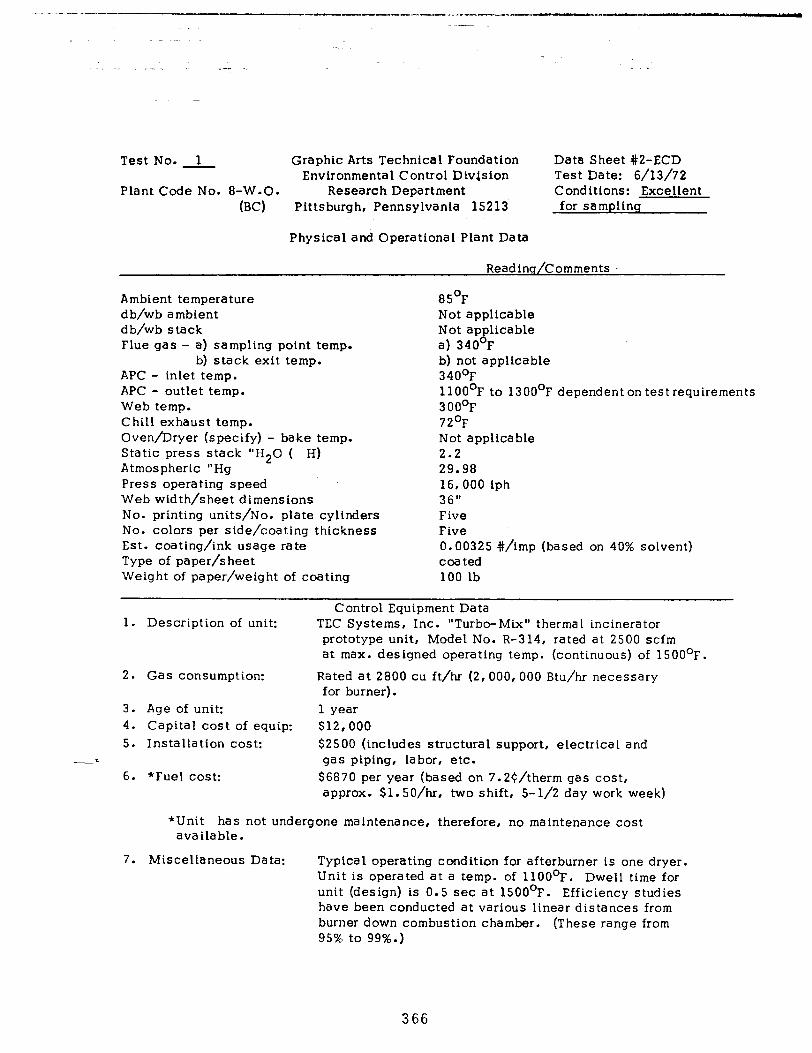
P---,-,“--- ..-. -1111,-m,.,*.-..-. *.1-..1 .-C..lls--.,--“---Y
.I - _
Test No. 1 Graphic Arts Technical Foundation Data Sheet #2-ECD Environmental Control Division Test Date: 6/13/72
Plant Code No. 8-W.O. Research Department Conditions: Excellent (EC) Pittsburgh, Pennsylvania 15213 for sampling
Physical and Operational Plant Data
Readinq/Comments .-
Ambient temperature db/wb ambient db/wb stack Flue gas - a) sampling point temp.
b) stack exit temp. APC - inlet temp. APC - outlet temp. Web temp. Chill exhaust temp. Oven/Dryer (specify) - bake temp. Static press stack “HZ0 ( H) Atmospheric “Hg Press operating speed Web width/sheet dimensions No. printing units/No. plate cylinders No. colors per side/coating thickness Est. coating/ink usage rate Type of paper/sheet Weight of paper/weight of coating
85’F Not applicable Not applicable a) 340°F b) not applicable 340’F 1 lOOoF to 13OO’F dependent on test requirements 300’F 72’F Not applicable 2.2 29.98 16,000 iph 36” Five Five 0.00325 #/imp (based on 40% solvent) coated 100 lb
Control Equipment Data 1. Description of unit: TEC Systems, Inc. “Turbo-Mix” thermal incinerator
prototype unit, Model No. R-314, rated at 2500 scfm at max. designed operating temp. (continuous) of 15OO’F.
2. Gas consumption: Rated at 2800 cu ft/hr (2,000,OOO Btu/hr necessary for burner).
3. Age of unit: 1 year 4. Capital cost of equip: $12,000 5. Installation cost: $2500 (includes structural support, electrical and
-f gas piping, labor, etc. 6. *Fuel cost: $6870 per year (based on 7.2$/therm gas cost,
approx. $l.SO/hr, two shift, 5-l/2 day work week)
*Unit has not undergone maintenance, therefore, no maintenance cost available.
7. Miscellaneous Data: Typical operating condition for afterburner is one dryer. Unit is operated at a temp. of 11OO’F. Dwell time for unit (design) is 0.5 set at 15OO’F. Efficiency studies have been conducted at various linear distances from burner down combustion chamber. (These range from 95% to 99%.)
366
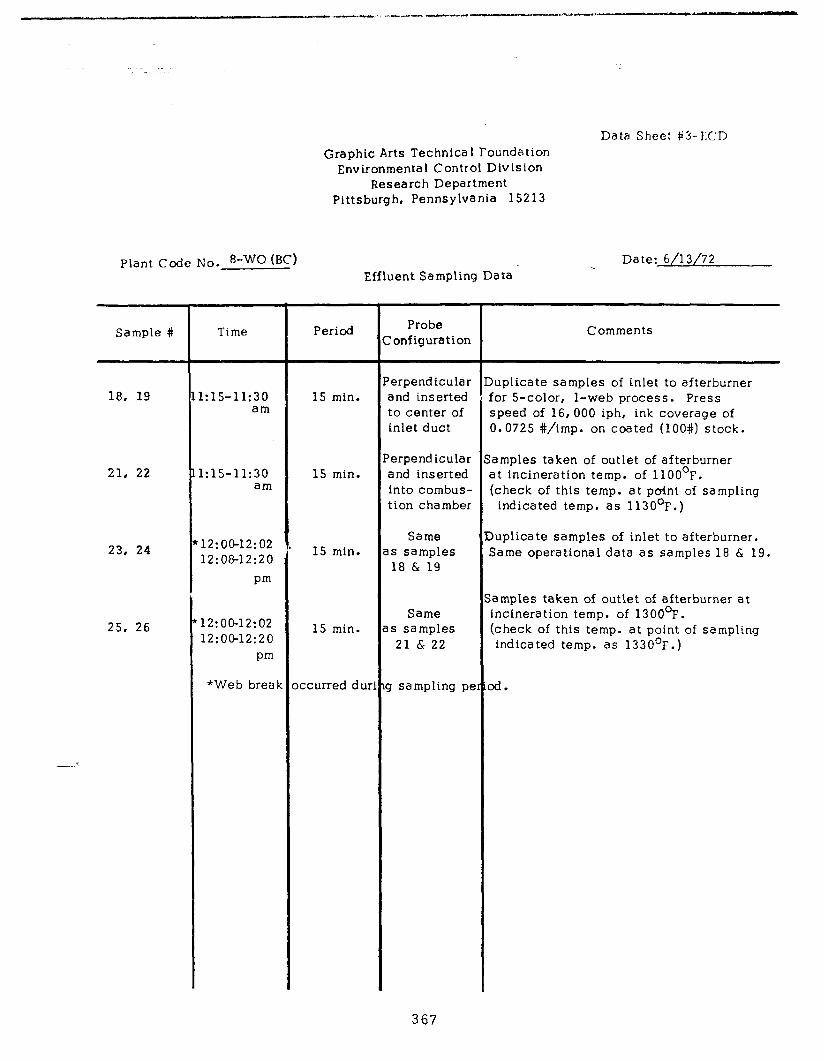
Graphic Arts Technica I I’oundstion Environmental Control Division
Research Department Pittsburgh, Pennsylvania 15213
Data Sheet P3-CCD
Plant Code No. E-WC (SC) Effluent Sampling Data
Date: 6/l 3/72
Sample # Time Period
18, 19
21, 22
23, 24
25, 26
.:15-11:30 am
15 min. ‘erpendicular Duplicate samples of inlet to afterburner and inserted for S-color, l-web process. Press to center of speed of 16, 000 iph, ink coverage of inlet duct 0.0725 #/imp. on coated (lOO#) stock.
.:15-11:30 am
15 min. ‘erpendicular jamples taken of outlet of afterburner and inserted at incineration temp. of 11OO’F. into combus- (check of this temp. at point of sampling tion chamber indicated temp. as 113O’F.)
12:00-12:02 12:08-12:20
pm
15 min. Same
IS samples 18 & 19
3uplicate samples of inlet to afterburner. Same operational data as samples 18 & 19.
12:00-12:02 12:00-12:20
pm
15 min. Same
s samples 21 & 22
;amples taken of outlet of afterburner at incineration temp. of 13OO’F. (check of this temp. at point of sampling indicated temp. as 1330’F.)
*Web break xcurred d ur 3 sampling pe od.
Probe Yonfiguration
Comments
367
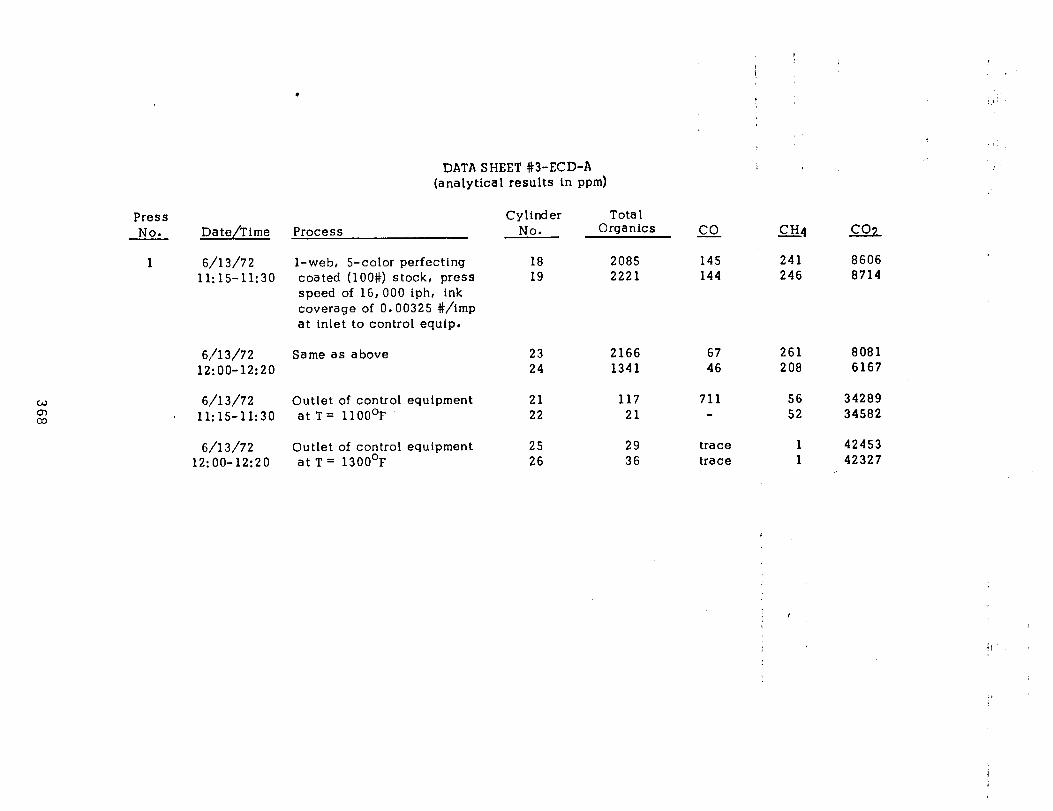
I
i
.
Press No. Date/Time Process
1 6/l 3/72 11:15-11:30
6/l 3/72 12:00-12:20
6/l 3/72 Outlet of control equipment 21 117 . 11:15-11:30 atT= llOO°F 22 21
6/l 3/72 Outlet of control equipment 25 29 trace 1 42453 12:00-12:20 at T = 13OO’F 26 36 trace 1 42327
DATA SHEET #3-ECD-A (analytical results in ppm)
l-web, S-color perfecting coated (lOO#) stock, press speed of 16,000 iph, ink coverage of 0.00325 #/imp at inlet to control equip.
Same as above
Cylinder No.
18 19
Total Organics
2085 2221
23 2166 24 1341
a
145 144
67 46
711
CH4 co:!
241 8606 246 8714
261 8081 208 6167
56 34289 52 34582
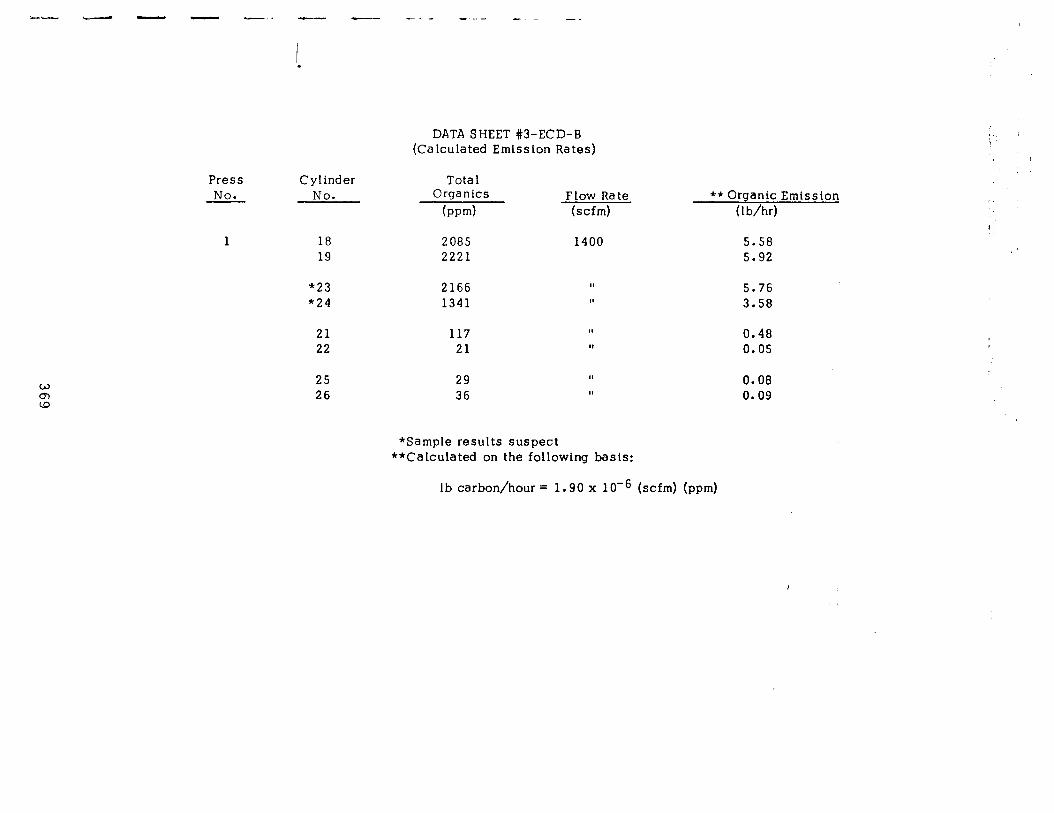
-u L w - -1 - - --- --- - - __
I c
Press Cylinder No. No.
1 18 2085 1400 5.58 19 2221 5.92
*23 2166 II 5.76 *24 1341 II 3.58
21 117 II 0.48 22 21 I, 0.05
25 29 II 0.08
26 36 II 0.09
DATA SHEET #3-ECD-B (Calculated Emlsslon Rates)
Tota 1 Organics
bpd Flow Rate (scfm)
** Organic Emission (lb/hr)
*Sample results suspect **Calculated on the following basis:
lb carbon/hour = 1.90 x 10D6 (scfm) (ppm)

.
DATA SHEET #3-ECD-C Comparison of Calculated and Observed Emtssion Rates
Cylinder(‘) Ink Type No. Coverage Press Speed Paper Stock Emission(‘) Emissiont3) C Valuef4)
(lb/imp) (iphI (ca lc) lobs) Eobs/Eca lc
18, 19 0.00325 16,000 coated 16.80 5.75 0.35
(1) Average value of duplicate samples utilized in calculation. (2) Calculated emission rate inclusive of background contribution
due to dryer and paper. Solvent content of ink - 0.40. (3) Based on calculated gas velocity and reported analytical
results (see Data Sheet #3-ECD-B). (4) Fraction of organics not converted to CO2 and H20 in
the dryer.
DATA SHEET #3-ECD-D Calculated Organic Conversion at Various Incineration Temperatures
(Expressed as % Efficiency)
Press No.
Incineration Inlet Temperature Concentration(l)
(OF) (pm)
Outlet Concentrationt2)
bpm) % Efficiencyt3)
(ca lc)
1 1100 2153 21 & 117 99.02 & 94.57 1300 2153 29 & 36 98.65 h/98.34
(1) Average value of duplicate samples utilized to establish inlet concentration. (2) Individual sample result as taken from lab analysis report. (3) Equation utilized for computing % efficiency as follows:
% efficiency = 100 - outlet C ppm x 1oo inlet C ppm
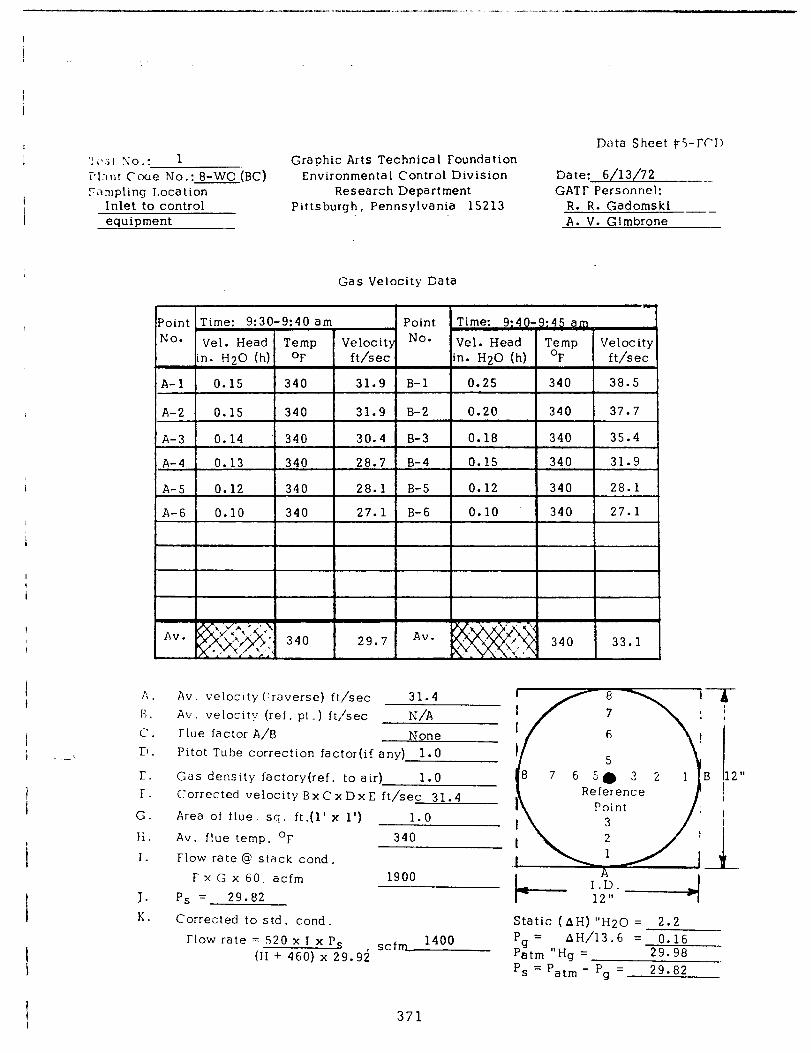
I
I i --..
Data Sheet p5-rCD ‘!,‘.<I x0.: 1 Graphic Arts Technical Foundation I’hnt Cooe No .: 8-WO (BC) Environmental Control Division Date: 6/13/72 -- _-. Yampling Location Research Department GATF Personnel:
Inlet to control Pittsburgh, Pennsylvania 15213 R. R. Gadomski -- equipment A. V. Gimbrone _
A .
13 .
c.
rj .
E. r.
G.
Ii.
I.
J.
K.
Gas Velocity Data
Av. velocity (‘raverse) ft/sec Av. velocity (ref. pt.) ftjsec rlue factor A/B Pitot Tube correction factor(if
31.4 N/A
None any) 1.0
Gas density factorylref. to air) 1.0 7 6 “0 3 2 Corrected velocity BxCxDxC ft/sec 31.4 Reference
Area of flue, sq. ft.(l’ x 1’) 1.0 Av. flue OF temp. 340 -1 FLOW rate @ stack cond.
F x G x 60, acfm
P, = 29.82
1900
Corrected to std. cond. Static (AH) “H20 = 2.2 Flow rate = 520 x I x Ps
(H + 460) x 29.92 scf 1400 Pg = AH/13.6 = 0.16 -
Patm “Hg = 29.98 P, = Patm - Pg = 29.82
371
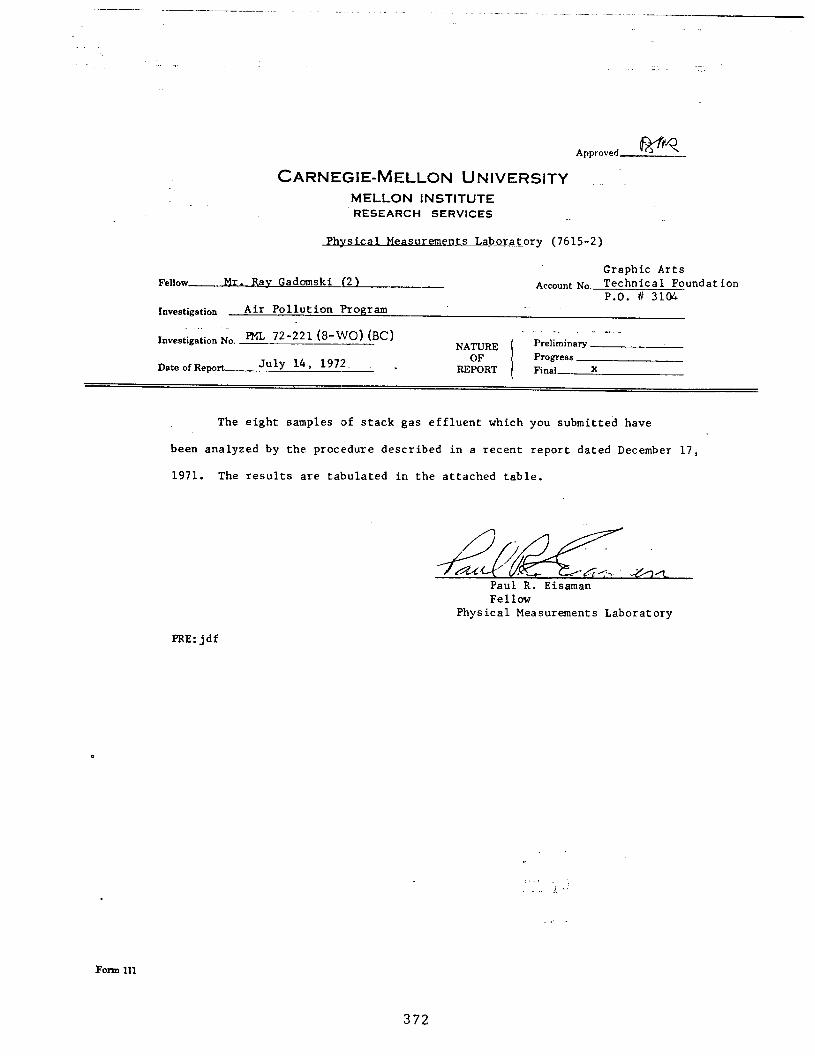
CARNEGIE-MELLON UNIVERSITY .m MELLON INSTITUTE RESEARCH SERVICES
easurements Laboratory (7615-2)
Graphic Arts Fellow Mr. Rav Gadomski (2) Account No, Technical Foundation
P.O. F 3104
Investigation Air Pollution Program
Investigation No. Em 72-221(8-WO) (BC) . ._ __.~ NATURE Preliminary
Date of Report July 14, 1972, - OF
/
Progress REPORT Final X
The eight samples of stack gas effluent which you submitted have
been analyzed by the procedure described in a recent report dated December 17,
1971. The results are tabulated in the attached table.
9zcif2j~a4 . Fellow
Physical Measurements Laboratory
PlZE:jdf
372
.,.. ‘. . ,:-
. -

1 Table
Stack Gas Samples
Code 8-W.O.-BC
Cylinder No. 18 19 23 24 21 22 25 26
Sample Volume, cc NTP 270 268 249 258 278 261 260 254
Content, v/v % as CO2
Carbon Monoxide
Carbon Dioxide
Methane
Organics
0.0145 0.0144 0.0067 0.0046 0.0711 ------ trace trace
0.8606 0.8714 0.8081 0.6167 3.4289 3.4582 4.2453 4.2327
0.0241 0.0246 0.0261 0.0208 0.0056 0.0052 0.0001 0.0001
0.0082 0.0086 0.0545 0.0056 0.0113 0.0020 0.0029 0.0036
Traps, Low Boilers 0.0517 0.0739 0.0542 0.0388 0.0004 0.0001 0.0000 0.0000
Traps, High Boilers 0.1486 0.1396 0.1079 0.0897 0.0000 0.0000 0.0000 0.0000
373

Data Sheet #l-ECD
Graphic Arts Technica 1 Foundation Environmental Control Division
Research Department Pittsburgh, Pennsylvania 152 13
I. *Source Location Data - . _ , - __ _ _ _ _ _ _ ._ -. __ . -
. . . _. - .-- 1. 2. 3.
Firm Name: - . -. Phone Address: Representative(s) Contacted:
4. Plant Code No.: 9-WO (BC)
5. 6.
7. 8.
9.
10.
11.
12.
II . Source and Sample Background Data
Date(s) of Test(s): June 27, 1972 Process(es) and Basic Equipment (incl. throughput rates): Harris-Cottrell, MlOOO, S-unit web offset press with TEC Systems high velocity hot air dryer controlled by catalytic combustion unit.
Product(s): Circulars, advertisement printing Amounts Consumed (Monthly Av .)
A. Paper or other substrates: Not available B. Inks and Solvents: Not available
Dryer or Oven Equipment: A. Type, manufacturer, model: TEC Systems, Inc. Model LA-12 B. Air Fbws (rated), Temp.: 5200 cfm @ web temp. - 600O~ C. Fuel or Heat Consumption:4400 cfh (rated), 2700 cfh (operational) D. Comment: System represents more modern concept of drying installa-
tion relatively new. Stack Geometry:
A. No. (Single, manifolded) Single B. Cross-sectional area: 1.55 sq ft C. Height above roof: 2 ft D. Approx. running length: 18 ft E. Comment: Stack extends straight up from dryer then makes 90° bend
prior to entry into afterburner. APC Equipment (if any) TEC Systems combined thermal 6 catalytic unit,
Model TEC-H-40 MC (Cat. unit in use during field tests) Genera L Comments: Sampling was conducted within recommended practice.
*Restricted use only.
374
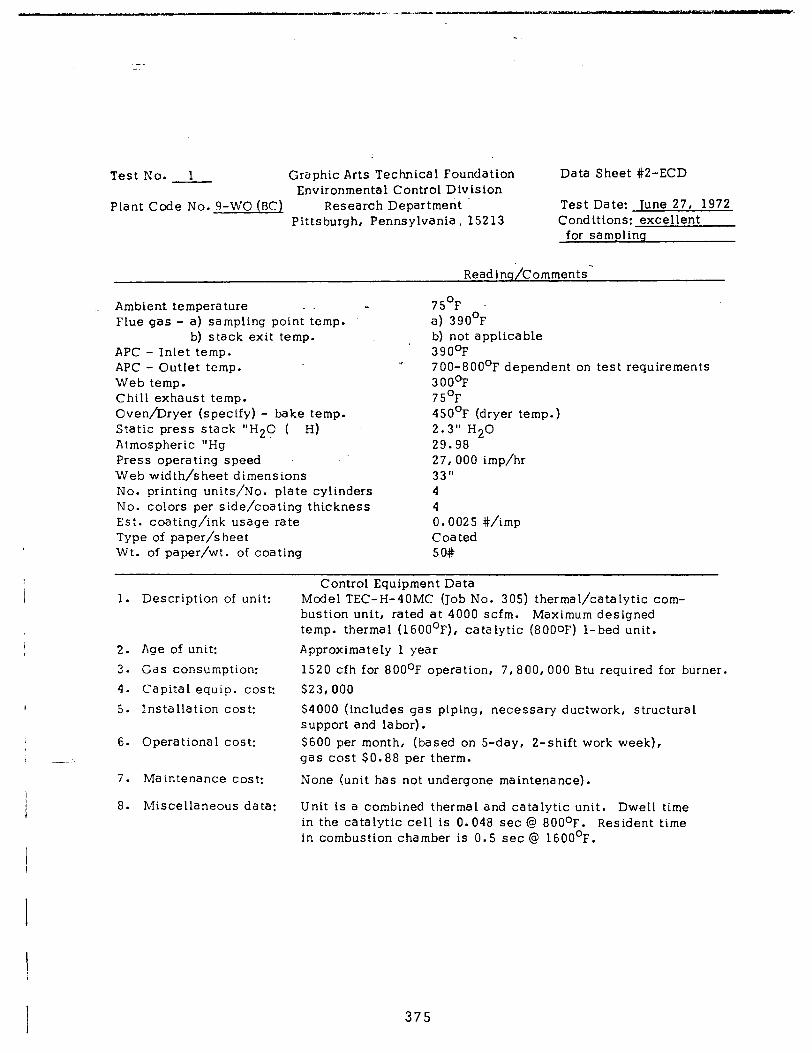
Test No. 1 Graphic Arts Technical Foundation Data Sheet .#2-ECD Environmental Control Division
Plant Code No. 9-WO (BC) Research Department Test Date: Tune 27, 1972 Pittsburgh, Pennsylvania. 15213 Conditions: excellent
for sampling
Reading/Comments-‘
Ambient temperature . 75’F Flue gas - a) sampling point temp. a) 390°F
b) stack exit temp. b) not applicable APC - Inlet temp. 390°F APC - Outlet temp. v 700-800°F dependent on test requirements Web temp. 300’F Chill exhaust temp. 75’F Oven/Dryer (specify) - bake temp. 450’F (dryer temp.) Static press stack “H2C ( H) 2.3” H20 Atmospheric “Hg 29.98 Press operating speed 27,000 imp/hr Web width/sheet dimensions 33 ” No. printing units/No. plate cylinders 4 No. co!ors per side/coating thickness 4 Est. coating/ink usage rate 0.0025 #/imp Type of paper/sheet C oa ted Wt. of paper/wt. of coating 50#
1. Description of unit:
2. Age of unit:
3. Gas consumption: 4. Capital equip. cost: 5. Installation cost:
6. Operational cost:
7. Maintenance cost:
8. Miscellaneous data:
Control Equipment Data Model TEC-H-40MC (Job No. 305) thermal/catalytic com- bustion unit, rated at 4000 scfm. Maximum designed temp. thermal (1600°F), catalytic (8000F) l-bed unit. Approximately 1 year
1520 cfh for 800°F operation, 7,800,OOO Btu required for burner. $23,000 $4000 (includes gas piping, necessary ductwork, structural support and labor) . $600 per month, (based on S-day, 2-shift work week), gas cost $0.88 per therm.
None (unit has not undergone maintenance).
Unit is a combined thermal and catalytic unit. Dwell time in the catalytic cell is 0.048 set @ 800°F. Resident time in combustion chamber is 0.5 set @ 1600’F.
375
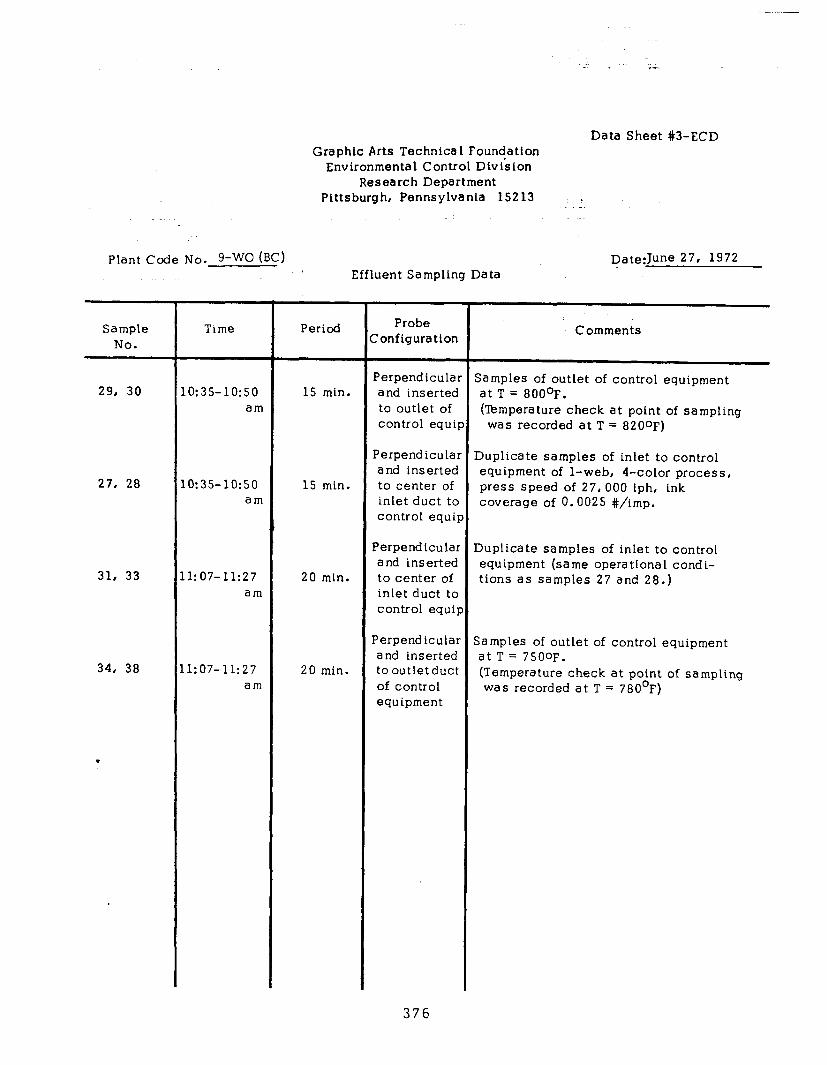
Data Sheet #3-ECD Graphic Arts Technica 1 Foundation
Environmental Control Division Research Department
Plttsburgh, Pennsylvania 15213 ! .
Plant Code No. g-WC (BC)
Sample No.
29, 30
27, 28
31, 33
34, 38
.
Time
0:35-10:50 am
0:35-10:50 am
1:07-11:27 am
1:07-11:27 am
Date:June 27, 1972 Effluent Sampling Data
Period
15 min.
15 min.
20 min.
20 min.
Probe Ionfiguration
?erpendicular and inserted to outlet of control equip
Ferpendicular a nd inserted to center of inlet duct to control equip
Perpendicular and inserted to center of inlet duct to control equip
Perpendicular and inserted to outlet duct of control equipment
Comments
samples of outlet of control equipment at T = 800°F. (Temperature check at point of sampling was recorded at T = 8200F)
Iuplicate samples of inlet to control equipment of l-web, 4-color process, press speed of 27, 000 iph, ink coverage of 0.0025 #/imp.
Duplicate samples of inlet to control equipment (same opera tiona 1 cond i- tions as samples 27 and 28.)
Samples of outlet of control equipment at T = 75OoF. (Temperature check at point of sampling was recorded at T = 78O’F)
376

Plant Code No.
9-WO (BC)
Date/Time
6/27/72 10:35-10:50am
6/27/72 11:07-11:27am
6/27/72 11:07-11:27am
6/27/72 10:35-10:50am
DATA SHEET #3-ECD-A (Analytical Results in ppm)
Process Cylinder Tota 1
No. Organics co CH4 - CC2
l-web, 5-color per- fecting coated (50#) stock, press speed 27, 000 iph, ink coverage 0.0025 #/imp at inlet to control equipment.
Same as above
Outlet of control equip. at T= 750’F
Outlet of control equip. at T= 800°F
27 2608 60 13 8202 28 2641 43 13 8136
31 2332 18 17 7512 33 2532 35 17 7043
34 455 121 18 18110 38 261 272 17 ia5ia
29 95 103 17 20626 30 116 141 19 21335
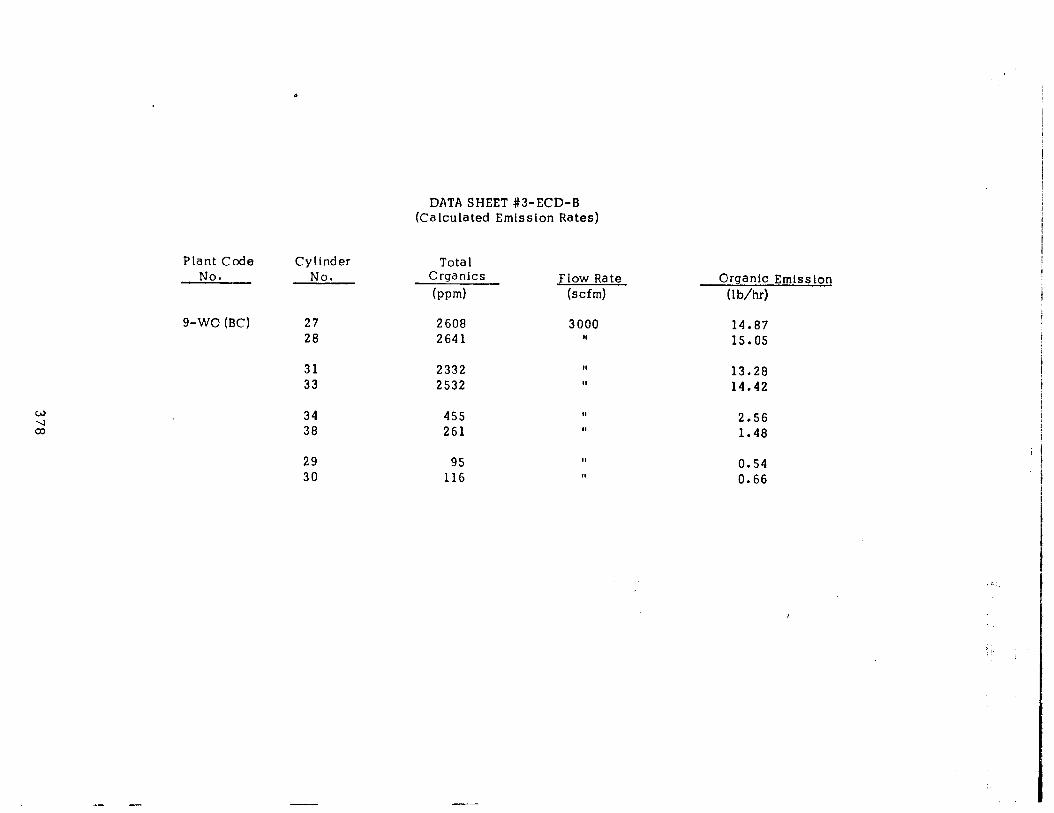
Plant Code Cylinder No. No.
9-WO (BC) 27 2608 3000 14.87 28 2641 I, 15.05
31 2332 II 13.28 33 2532 II 14.42
34 455 II 2.56 38 261 II 1.48
29 95 II
30 116 II
DATA SHEET #3-ECD-B (Calculated Emission Rates)
Tota 1 Organics (mm)
Flow Rate (scfm)
Organic Emlsston (lb/hd
0.54 0.66
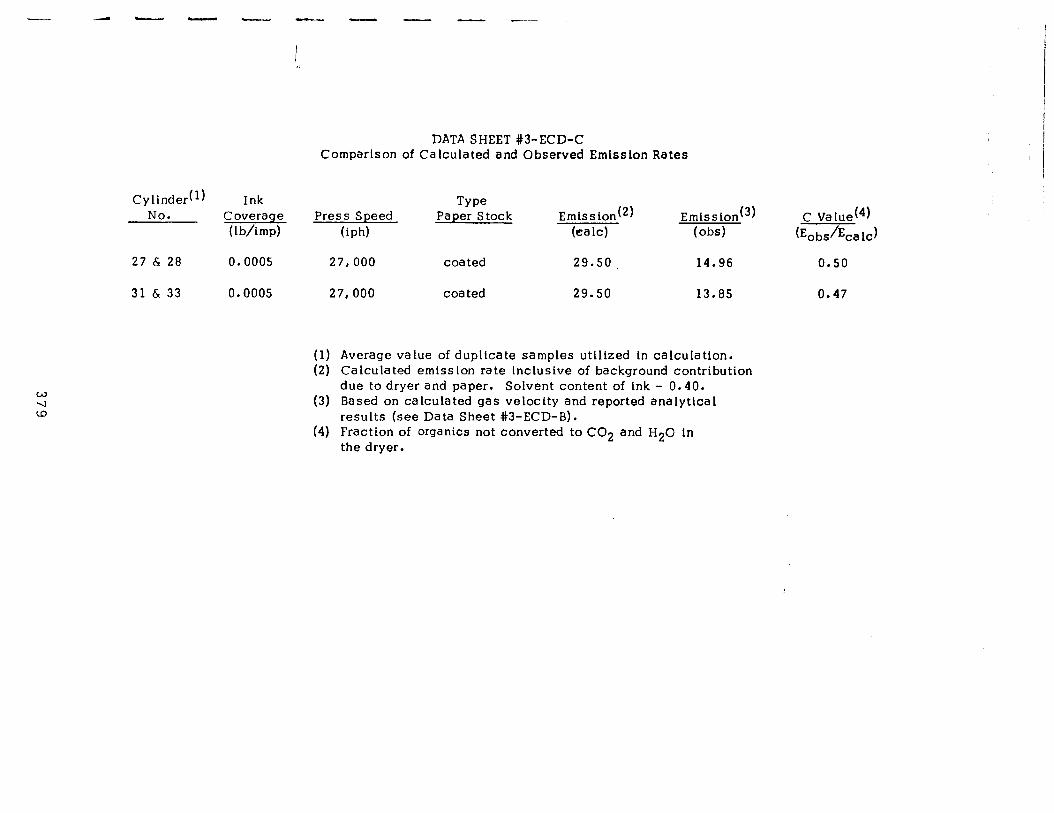
~4 - - - - - - - c-
I,
DATA SHEET #3-ECD-C Comparison of Calculated and Observed Emission Rates
Cylinder(l) Ink Type No. Coverage Press Speed Paper Stock Emtssion(2) Emlsslon(3) C Value(4)
(lb/imp) (id-d (ea lc) (of-1 (Eobs/Eca lc)
27 6 28 0.0005 27,000 coated 29.50, 14.96 0.50
31 & 33 0.0005 27,000 coated 29.50 13.85 0.47
(1) Average value of duplicate samples utilized in calculation. (2) Calculated emission rate inclusive of background contribution
due to dryer and paper. Solvent content of ink - 0.40. (3) Based on calculated gas velocity and reported analytical
results (see Data Sheet #3-ECD-B). (4) Fraction of organics not converted to CO2 and H20 in
the dryer.
I I
! I
/ / 1
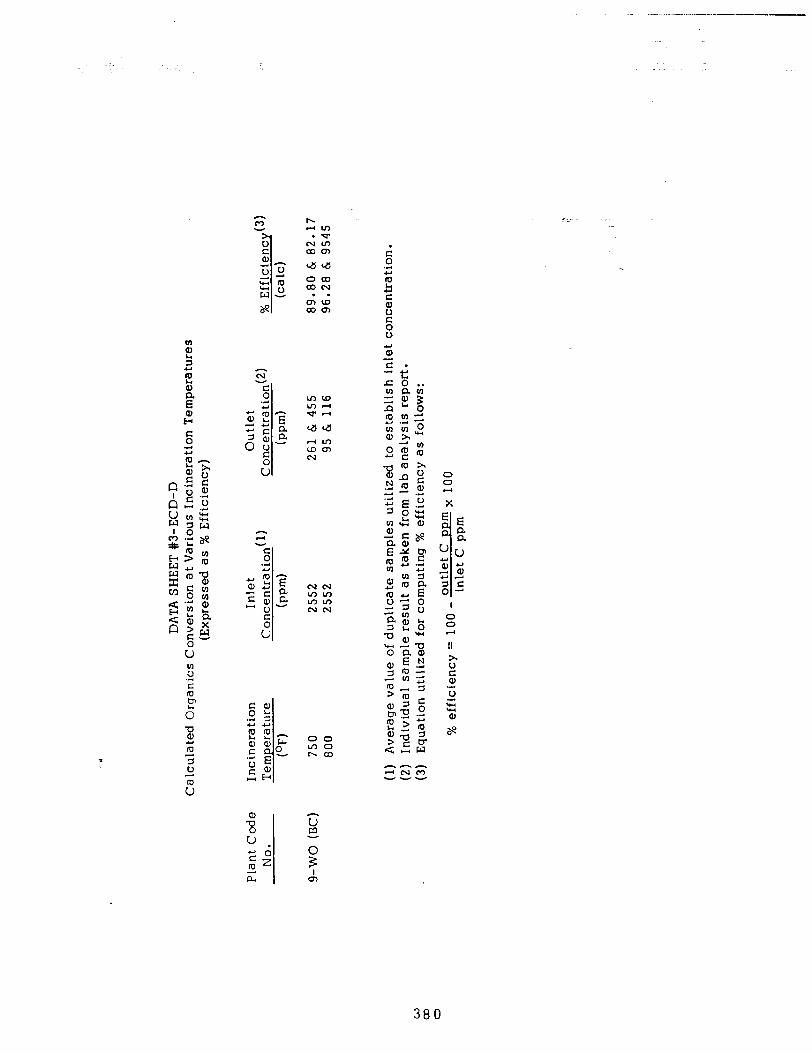
380
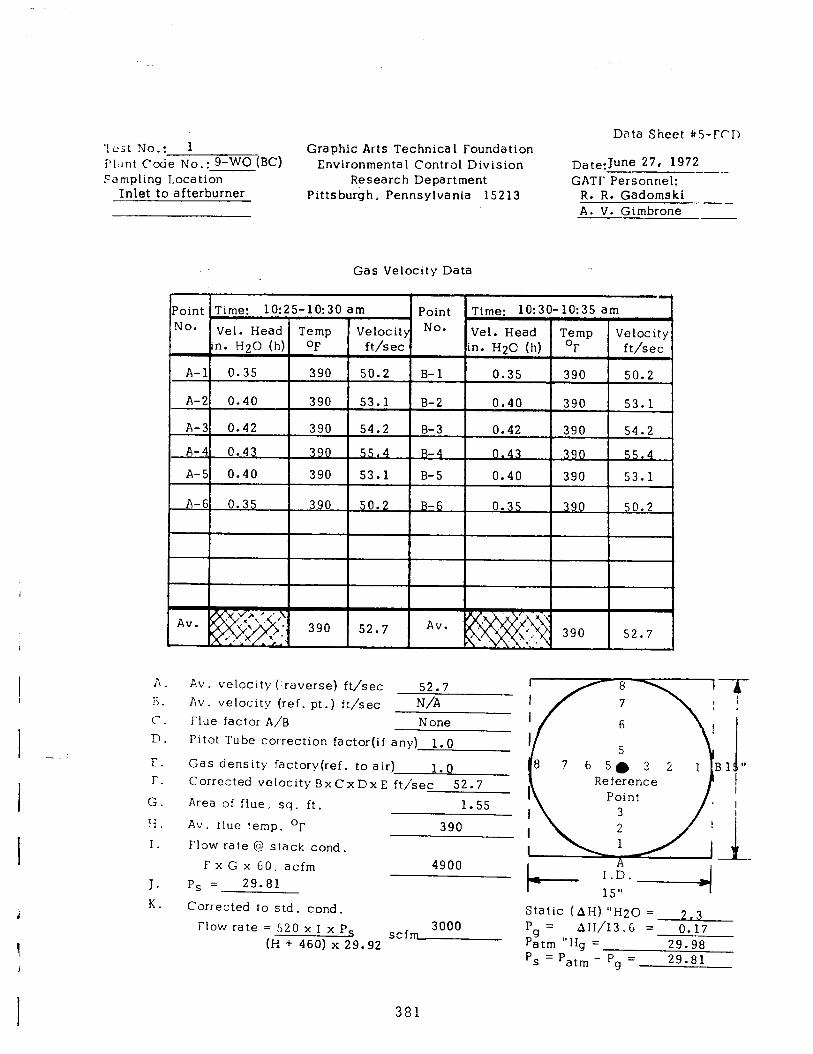
Data Sheet Its-FCD ‘li2;t No.: 1 Graphic Arts Technical Foundation Pi:jnt Co&e No.: 9-WG BC) Environmental Control Division DatezJUIle 27, 1972 -_- Sampling Location Research Department GATF Personnel:
Inlet to afterburner Pittsburgh, Pennsylvania 15213 R. R. Gadomski -- __- -- A. V. Gimbrone
Gas Velocity Data
A . Av. velocity (‘t-averse) ft/sec 52.7 li. Av. velocity (ref. pt.) ft/sec N/A c. Flue factor A/B None D. Pitot Tube correction factor(if any) 1.0
f. I-.
G.
Ii.
I.
Gas density factory(ref. to air) 1.0 Corrected velocity BxCxDxE ft/sec 52.7
Area of flue, sq. ft.
Av. flue temp. OF
Flow rate @ stack cond.
J. K.
FxG x 60. acfm
ps =. 29.81
Corrected to std. cond.
Flow rate = 520 x I x P, 3000
(H + 460) x 29.92 scfw
7 6 5a 3 2 Reference
Point
Static (AH) “H2C = Pg = Patm “Hg = 29.98 p, = Pat, - Pg = 29.81
381
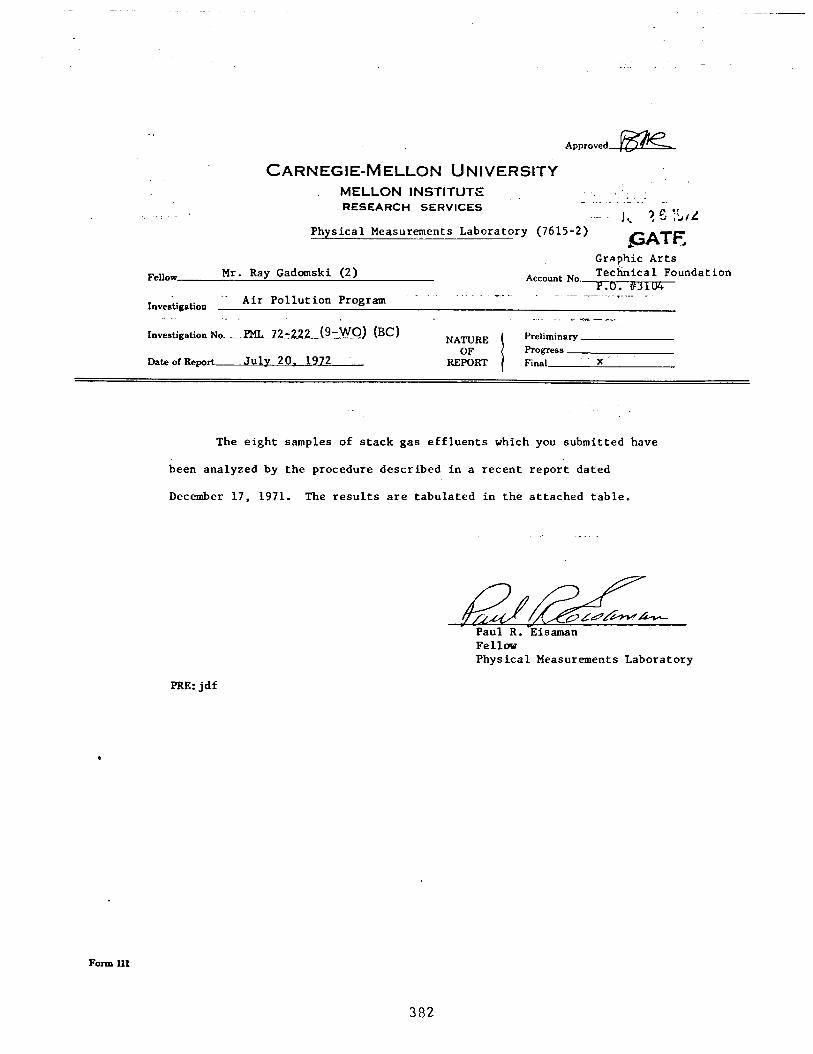
CARNEGIE-MELLON UNIVERSITY MELLON INSTITUTE i. . RESEARCH SERVICES
_ . .
-.-~ -1, ? cj ‘i/L
Physical Measurements Laboratory (7615-2) FATE
Fellow Mr. Ray Gadomski (2) Graphic Arts
Account No. Technical Foundation . . 04
Investigation .' Air Pollution Program
- .c
InvestigatioaNo.PML 72-222 (9-&O) (BC) NAmRE OF
-'.
.L s. I ,,.,,
Preliminary
DateofReport- July 20. 1972 REPORT I
Progress Final X
The eight samples of stack gas effluents which you submitted have
been analyzed by the procedure described in a recent report dated
December 17, 1971. The results are tabulated in the attached table.
Paul R. Eisaman Fellow Physical Measurements Laboratory
Form 111
PRE:jdf
382
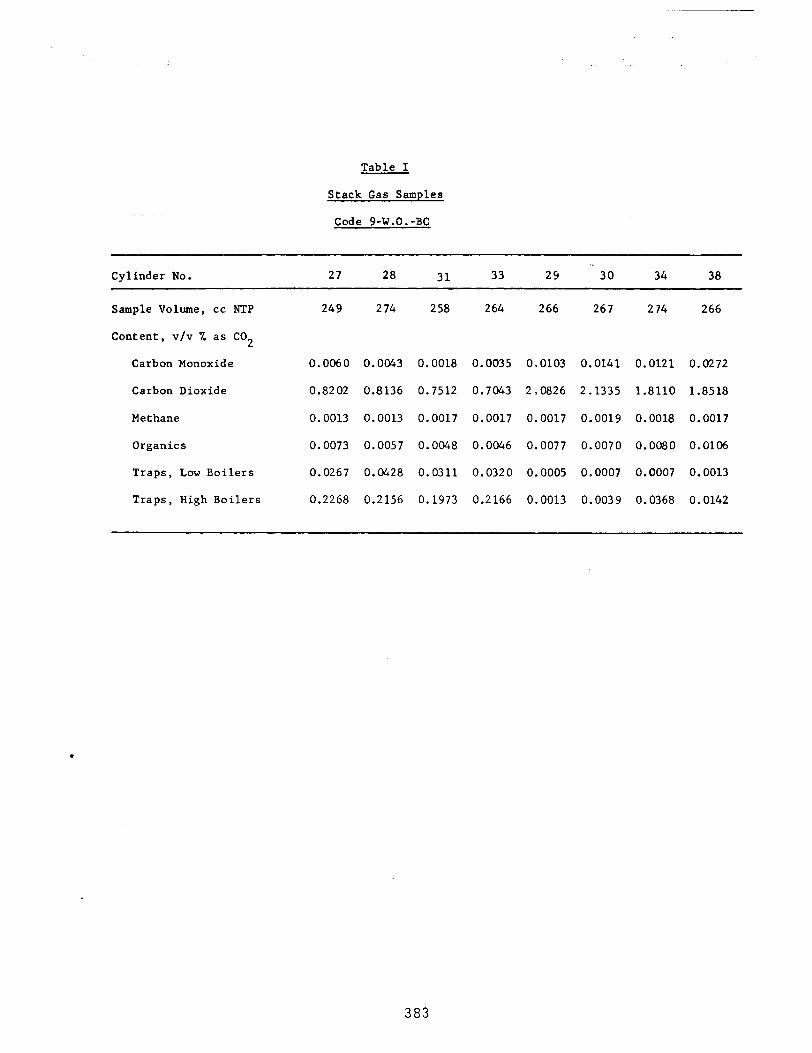
Table I
Stack Gas Samples
Code 9-W.O.-BC
Cylinder No. 27 28 31 33 24 30 34 38
Sample Volume, cc NTP
Content, v/v % as CO2
Carbon Monoxide
Carbon Dioxide
Methane
Organics
Traps, Low Boilers
Traps, High Boilers
249 274 258 264 266 267 274 266
0.0060 0.0043 0.0018 0.0035 0.0103 0.0141 0.0121 0.0272
0.8202 0.8136 0.7512 0.7043 2.0826 2.1335 1.8110 1.8518
0.0013 0.0013 0.0017 0.0017 0.0017 0.0019 0.0018 0.0017
0.0073 0.0057 0.0048 0.0046 0.0077 0.0070 0.0080 0.0106
0.0267 0.0428 0.0311 0.0320 0.0005 0.0007 0.0007 0.0013
0.2268 0.2156 0.1973 0.2166 0.0013 0.0039 0.0368 0.0142
l
383
APPENDIX E Data Sheets
Meta 1 Decorating Plants
385
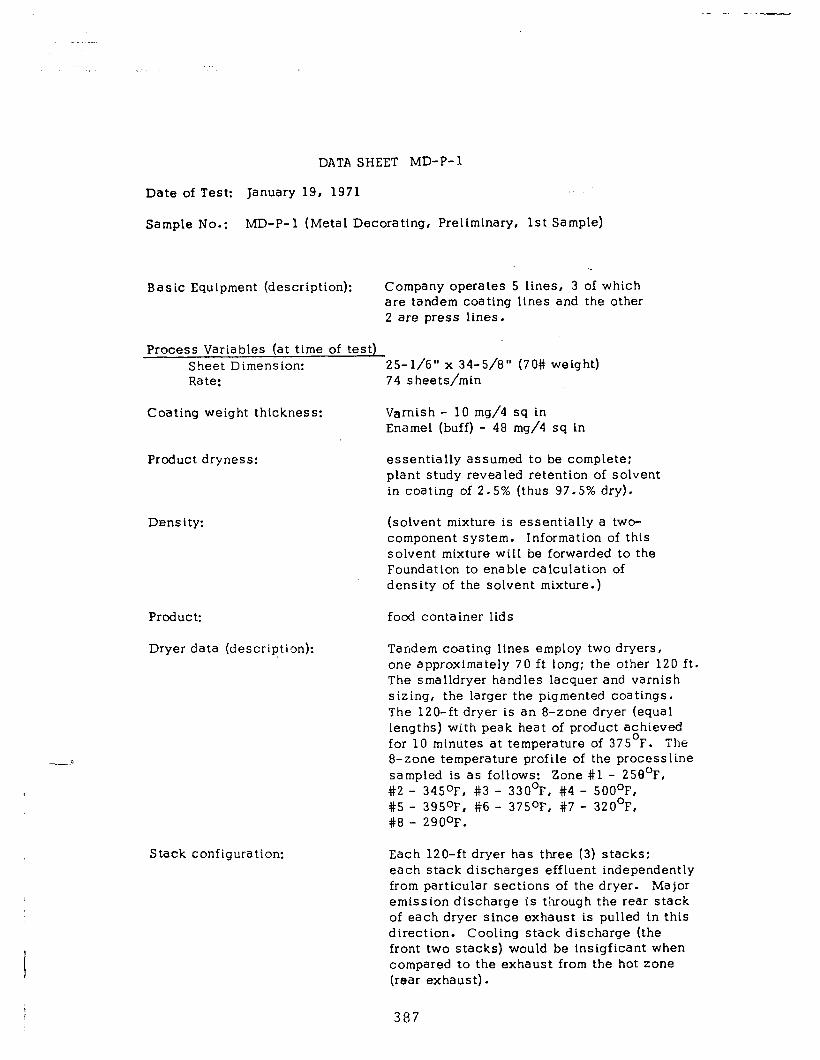
DATA SHEET MD-P-l
Date of Test: January 19, 1971
Sample No. : MD-P-l (Metal Decorating, Preliminary, 1st Sample)
Basic Equipment (description): Company operates 5 lines, 3 of which are tandem coating lines and the other 2 are press lines.
Process Variables (at time of test) Sheet Dimension: 25-l/6” x 34-5/a” (70# weight) Rate: 74 s heets/min
Coating weight thickness: Varnish - 10 mg/4 sq in Enamel (buff) - 48 mg/4 sq in
Product dryness: essentially assumed to be complete: plant study revealed retention of solvent in coating of 2.5% (thus 97.5% dry).
Density: (solvent mixture is essentially a two- component system. Information of this solvent mixture will be forwarded to the Foundation to enable calculation of density of the solvent mixture.)
Product: food container lids
Dryer data (description): Tandem coating lines employ two dryers, one approximately 70 ft long: the other 120 ft. The smalldryer handles lacquer and varnish sizing, the larger the pigmented coatings. The 120-ft dryer is an a-zone dryer (equal lengths) with peak heat of product achieved for 10 minutes at temperature of 375’F. The a-zone temperature profile of the processline sampled is as follows: Zone #l - 258’F, #2 - 34S°F, #3 - 330°F, #4 - SOO’F, #5 - 39S°F, #6 - 375oF, #7 - 320°F, #8 - 290°F.
Stack configuration: Each 120-ft dryer has three (3) stacks: each stack discharges effluent independently from particular sections of the dryer. Major emission discharge is through the rear stack of each dryer since exhaust is pulled in this direction. Cooling stack discharge (the front two stacks) would be insigficant when compared to the exhaust from the hot zone (rear exhaust).
387
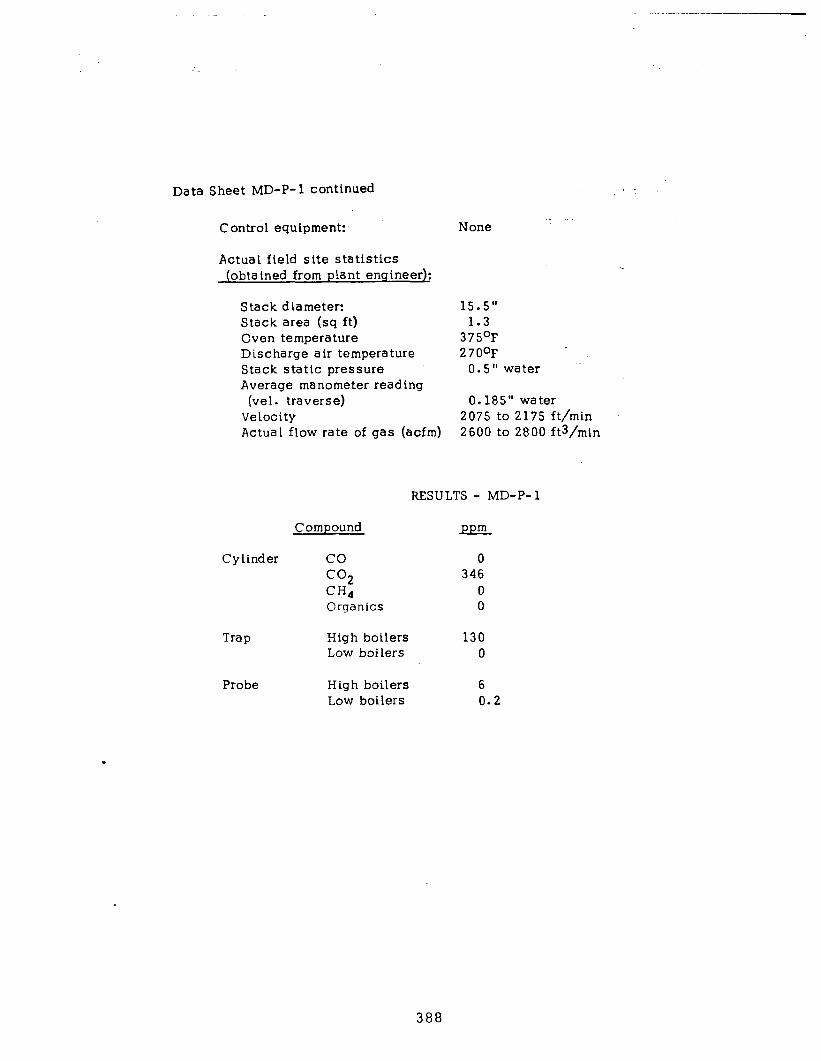
Data Sheet MD-P-l continued # I
Control equipment:
Actual field site statistics (obta tned from plant engineer):
Stack diameter: Stack area (sq ft) Oven temperature Discharge air temperature Stack static pressure Average manometer reading
(vet. traverse) Velocity Actual flow rate of gas (acfm)
None
15.5” 1.3
375’F 270°F
0.5” water
0.185” water 2075 to 2175 ft/min 2600 to 2800 ft3/min
RESULTS - MD-P-l
Compound ppm
Cylinder co
co2 CH4 Organics
0 346
0 0
Trap
Probe
High boilers 130 Low boilers 0
High boilers 6 Low boilers 0.2
388

Data Sheet #l-ECD
Graphic Arts Technica 1 Foundation Environmental Control Division
Research Department Pittsburgh, Pennsylvania 15213
I. *Source Location Data
1. Firm Name: Phone 2. Address: 3. Representative(s) Contacted:
4. Plant Code No.: l-MD
5. 6.
7. 8.
9.
10.
--
11.
12.
II. Source and Sample Background Data
Date(s) of Test(s): Ianuary 19, 1971, Feb. 22, 23, 24, 1971 Process(es) and Basic Equipment (incl. throughput rates): 5 lines
3 Tandem coatinq lines; 2 printinq lines 2 ovens per coatinq line, liqhter wt. coatinqs applied on front oven,, pismented heavier coatinqs in rear
Product(s): closures Amounts Consumed (Monthly Av.)
A. Paper or other substrates: Not applicable B. Inks and Solvents: See Data Sheet #2-ECD -.
Dryer or Oven Equipment: A. Type, manufacturer, model: Wagner, Younq Bros . B. Air Flows (rated), Temp.: See data sheets #2 & #5 C. Fuel or Heat Consumption: Est. 5 x 10⁶ btu/hr per oven D. Comment: No separate metering of gas, ovens are old, only temp.
of oven zones continuously recorded Stack Geometry:
A. No. (Single, manifolded) 2 stacks per oven B. Cross-sectional area: C - I.30 sq ft. D - 1.75 sq ft. E - 1.70 sq. ft. C. Height above roof:&ch stack extends 10 ft above roof level D. Approx. running length: 20 ft from ton of oven E. Comment: Front stack on oven used as exhaust for cooling sections,
rear stack is main exhaust of effluent APC Equipment (if any) None, each stack tested utilized rain caps: considerable
down-wash of effluent General Comments: Samplinq points were ideally located within recommended
practice.
*Restricted use only.
389
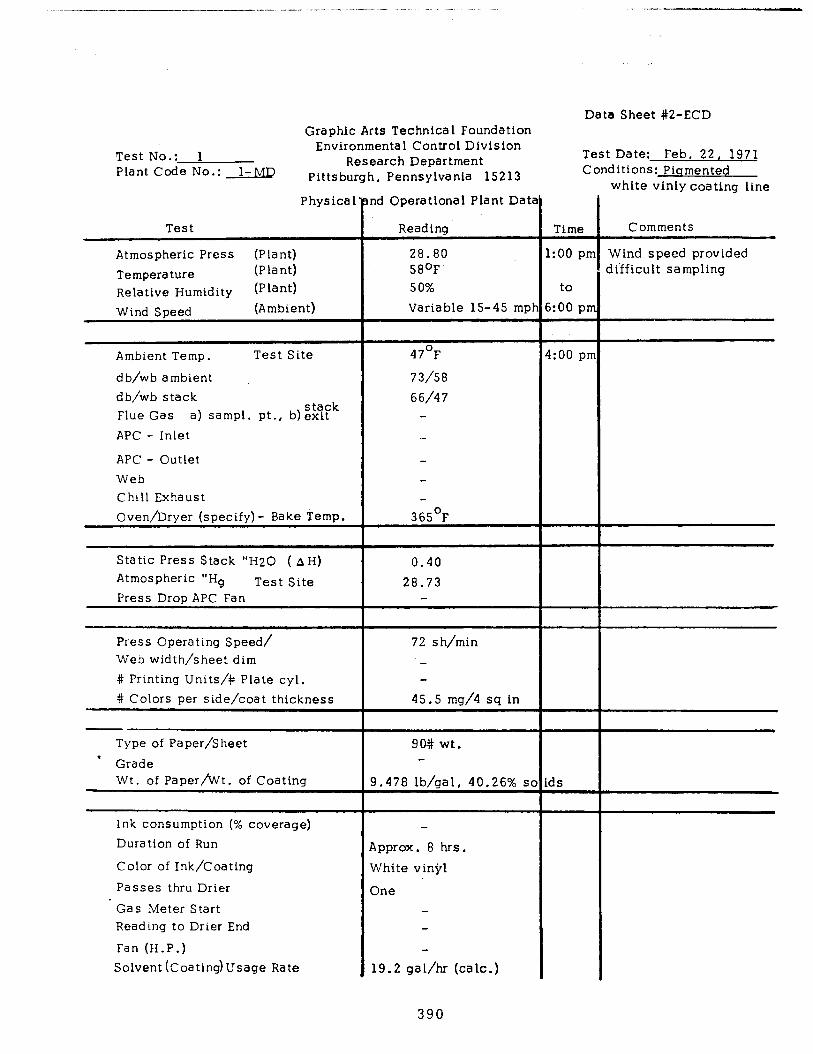
______ --- ______________._ _I__ _” _ “... .._.^ . .._ . _
Test No.: 1 Test Date: Feb. 22, 1971 Plant Code No.: l-MT) Conditions: Pigmented
Physical
Test
Atmospheric Press (Plant)
Temperature (Plant)
Relative Humidity (PLant) Wind Speed (Ambient)
Ambient Temp. Test Site
d b/wb ambient db/wb stack Flue Gas
stack a) sampl. pt., b)exit
APC - Inlet
APC - Outlet Web Chill Exhaust Oven/Dryer (specify) - Bake Temp.
Static PreSS Stack “H20 ( AH) Atmospheric “Hg Test Site Press Drop APC Fan
Press Operating Speed/ Web width/sheet dim # Printing Units/# Plate cyl. # Colors per side/coat thickness
Type of Paper/Sheet
’ Grade Wt. of Paper/Wt. of Coating
Ink consumption (% coverage) Duration of Run
Color of Ink/Coating
Passes thru Drier
Gas Meter Start Reading to Drier End
Fan (H-P.) Solvent (Coating)Usage Rate
Id Operational Plant Date
Reading’
28.80 58OF 50% Variable 15-45 mpl
47’F
73/58
66/47
365O~
0.40
28.73
72 sh/min
45.5 mg/4 sq in
90# wt.
3.478 -lb/gal, 40.26% SC
\pprox . 8 hrs .
Nhite vinyl
3ne
19.2 gal/fir (talc.)
390
Data Sheet #P-ECD
Time Comments
.:oo pn
to
i:oo pn
I:00 pn
ds
white vinly coating line
Wind speed provided difficult sampling

Data Sheet #2-ECD Gra phlc Arts Technica 1 Foundation
Environmental Control Division Test No.: 2 Plant Code No.: l-MD
Research Department Pittsburgh, Pennsylvania 15213
Physical
Test
Atmospheric Press (Plant) Temperature (Plant) Relative Humidity (Plant) Wind Speed ’ - (Ambient)
Ambient Temp.
db/wb ambient db/wb stack
stack Flue Gas a) sampl. pt., b)exit
APC - Inlet
APC - Outlet Web Chill Exhaust Oven/Dryer (specify) - Bake Temp.
Static Press Stack “H20 ( AH) Atmospheric “Hg
Press Drop APC Fan
Press Operating Speed/ Web width/sheet dim # Printing Units/# Plate cyl. # Colors per side/coat thickness
-- Type of Paper/Sheet
Grade Wt. of Paper/Wt. of Coating
Ink consumption (% coverage) Duration of Run
Color of Ink/Coating
Passes thru Drier
Gas Meter Start Reading to Drier End
Fan (H.P.) Solvent(Coating) Usage Rate
nd Operational Plant Dati
Reading
28.58
52’F 47%.
Variable lo-20 mph
35’F
63/54’F 57/43OF
2 75’F
375OF
0.40 28.90
30 sh/min
5 mg/4 sq in
75# wt.
7.95 lb/gal (14.77% sol
Approx. 8 hr.
Gold lacquer
One
9.44 gal/hr
391
Test Date: Feb. 23, 1971 Conditions: Gold lacauer
Time
.:OO pm
to i:OO pm
1:oo pn
coating line
Comments
High winds, precipita- tion in form of snow throughout test
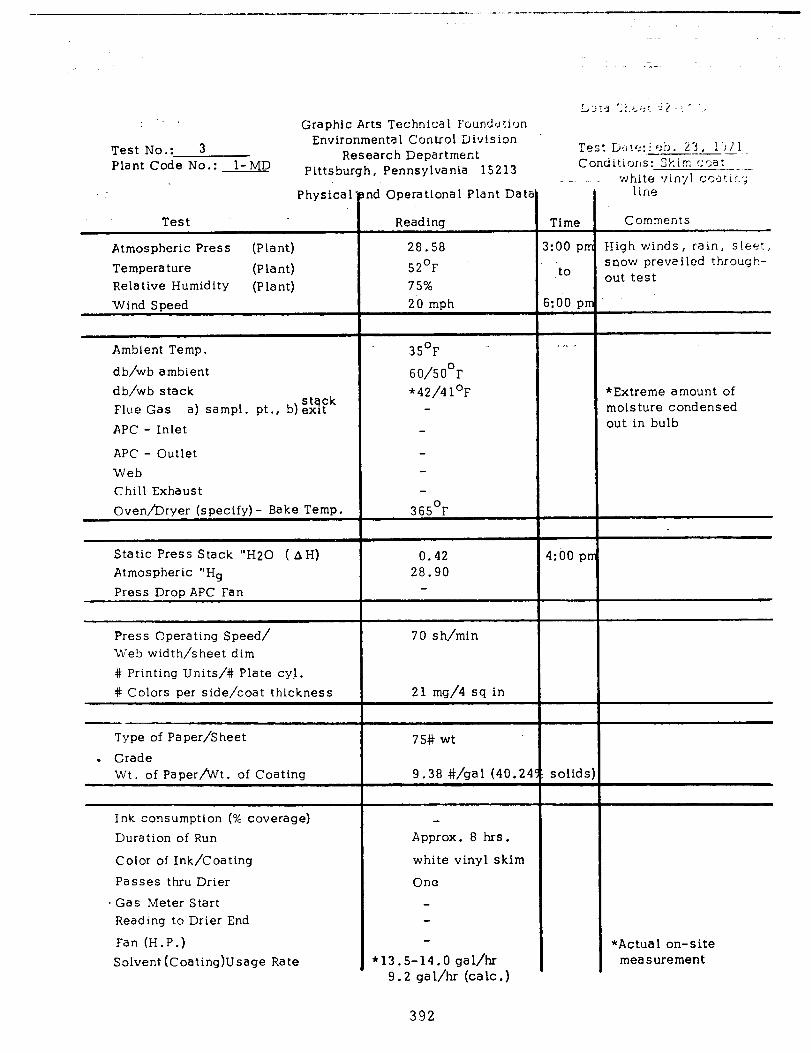
--- --.----..- *” ,--.-.,_-_, “lllt”, ..“_*. __,_-. _ .I. ...“.-I ,-_-.- “---“-
Graphic Arts Technical Foundsl?ion
Test No.: 3 Environmental Control Division
Plant Code No.: l-MD Research Department
Pittsburgh, Pennsylvania 15213
Physical
Test
Atmospheric Press (Plant) Temperature (Plant) Relative Humidity (Plant) Wind Speed
Ambient Temp.
d b/wb ambient db/wb stack Flue Gas
stack a) sampl. pt., b)exit
APC - Inlet
APC - Outlet Web Chill Exhaust Oven/‘Drver (specify) - Bake Temp.
Static Press Stack “H20 ( AH) Atmospheric “Hg
Press Drop APC Fan
Press Operating Speed/ Web width/sheet dim # Printing Units/# Plate cyl. # Colors per side/coat thickness
Type of Paper/Sheet
c Grade Wt. of PaperfWt. of Coating
Ink consumption (% coverage) Duration of Run
Color of Ink/Coating
Passes thru Drier
. Gas Meter Start Reading to Drier End
Fan (H.P.) Solvent (Coating)Usage Rate
id Operational Plant Dat
Read ina
28.58
52’F 75% 20 mph
35’F
60/50°F *42/4 1°F
365’F
0.42 28.90
70 sh/min
21 mg/4 sq in
75# wt
9.38 #/aal (40.21
Approx. 8 l-us.
white vinyl skim
One
*13.5-14.0 gal/hr 9.2 gal/hr (talc.)
Test D,!cj:!c;b 23 !‘j/‘l .--L--.-l--. Conditions: Skim r:5at --
__ - white ,,in./l co,Jtir’;
Time Comments
:oo pn
io
‘~00 pn
:oo p1
solids
line
-ligh winds, rain, sleet, snow prevailed through- >ut test
kExtreme amount of moisture condensed out in bulb
*Actua 1 on- site measurement
392

Data Sheet #3-ECD
Graphic Arts Technica 1 Foundation Environmental Control Division
Research Department Pittsburgh, Pennsylvania 15213
Plant Code No. l-MD Effluent Sampling Data
--
Sample #
Feb. 22,
MD-P-2
MD-P-3
Feb. 23,
MD-P-4
MD-P-5
MD-P- 6
Time
l!
,:Ol-5:15
:Ol-5:15
z_1
:07-5:21
:07-5:21
:55-3:07
Period
14 min
14 min
14 min
14 min
12 min
Collection Point
Coating line D Same as vel. trr NO flow obstruc-
tion
Coating line D Same as 2 & 5
Same
Coating line E Existing hole in stack. Good lot
Date: Feb. 22, 23, 1971
Probe Length
9” in stack ,9 ” hea ted
Same
9” in stack 9” heated
Same
9” in stack 9” hea ted
Variac Setting
80
80
80
80
80
393
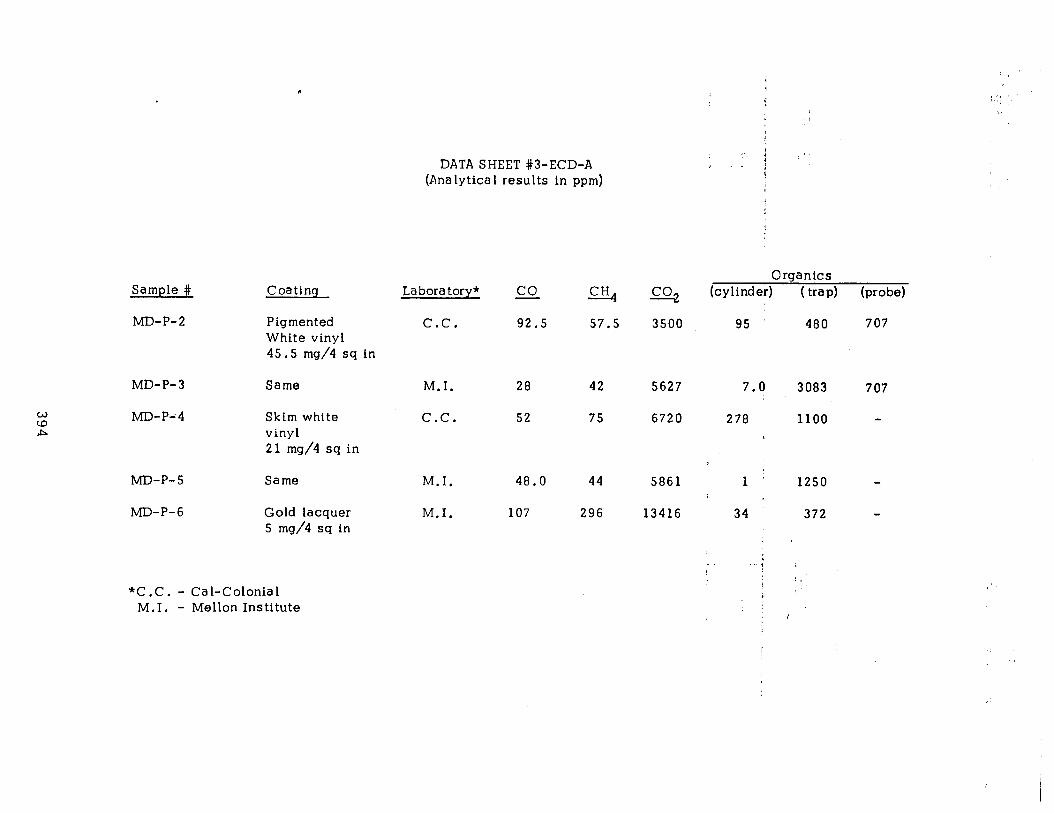
Sample #
MD-P-2
MD-P- 3
MD-P-4
MD-P- 5 Same M.I. 48.0 44 5861 1 1250 -
MD-P-6 Gold lacquer 5 mg/4 sq in
M.I. 107 296 13416 34 372 -
Coating
Pigmented White vinyl 45.5 mg/4 sq in
Same
Sklm whtte vinyl 21 mg/4 sq in
DATA SHEET #3-ECD-A (Analytical results in ppm)
Laboratory*
C.C.
co
92.5
M.I. 28
C.C. 52
-4 57.5
Organtcs
=2 (cylinder) ( tra d (probe)
3500 95 480 707
42 5627 7.0
75 6720 278
*c.c. - Cal-Colonial M.I. - Mellon Institute
3083 707
1100 -
,
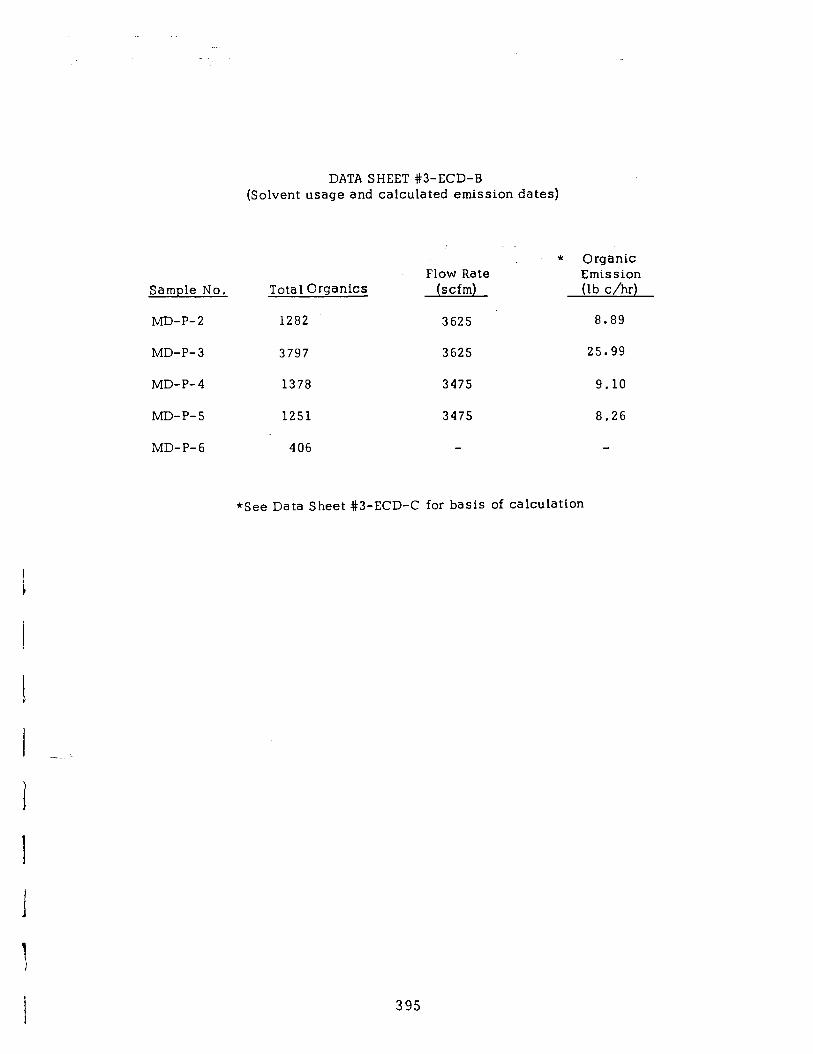
DATA SHEET #3-ECD-B (Solvent usage and calculated emission dates)
Sample No. Total OrganiCS
MD-P-2 1282
* Organic Flow Rate Emission
(scfm) (lb c/hr)
3625 8.89
MD-P- 3 3797 3625 25.99
MD-P-4 1378 3475 9.10
MD-P-5 1251 3475 8.26
MD-P-6 406
*See Data Sheet #3-ECD-C for basis of calculation
395
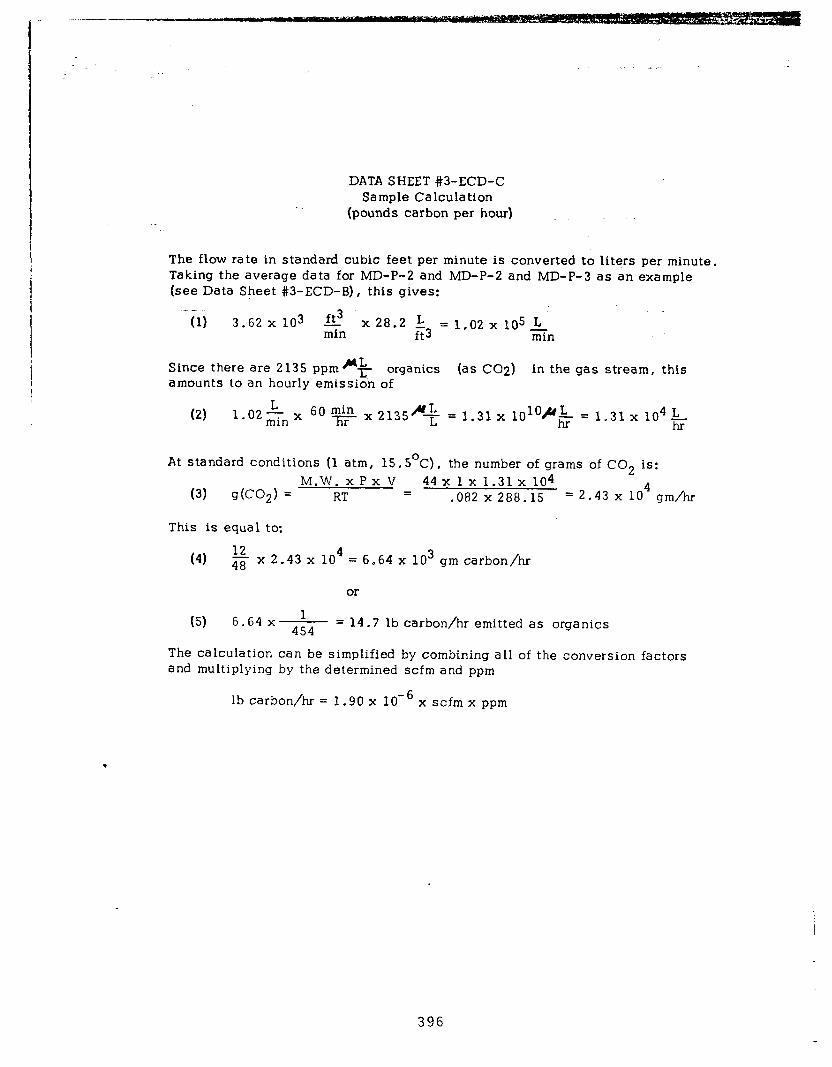
DATA SHEET #3-ECD-C Sample Calculation
(pounds carbon per hour)
The flow rate in standard cubic feet per minute is converted to liters per minute. Taking the average data for MD-P-2 and MD-P-2 and MD-P-3 as an example (see Data Sheet #3-ECD-B), this gives:
-71, 3.62~10~ e x 28.2 L = 1.02 x 10⁵ L min ft3 ii&
Since there are 2135 pprn*& organics (as C02) in the gas stream, this amounts to an hourly emission of
(2) 1.02&x ‘O e x 2135fi- = 1.31 x l(+O+ = 1.31 x 10⁴k
At standard conditions (1 atm, 15,5’C), the number of grams of CO2 is: M.W. x P x V 44 x 1 x 1.31 x 104
(3) dco2) = RT = .082 x 288.15 = 2.43 x lo4 gm/hr
This is equal to:
(4) +f x2.43x lo4 = 6.64 x lo3 gm carbon/hr
or
(5) 6.64x ’ 454
= 14.7 lb carbon/hr emitted as organics
The calculation can be simplified by combining all of the conversion factors and multiplying by the determined scfm and ppm
lb carbon/hr = 1.90 x 10v6 x scfm x ppm
396
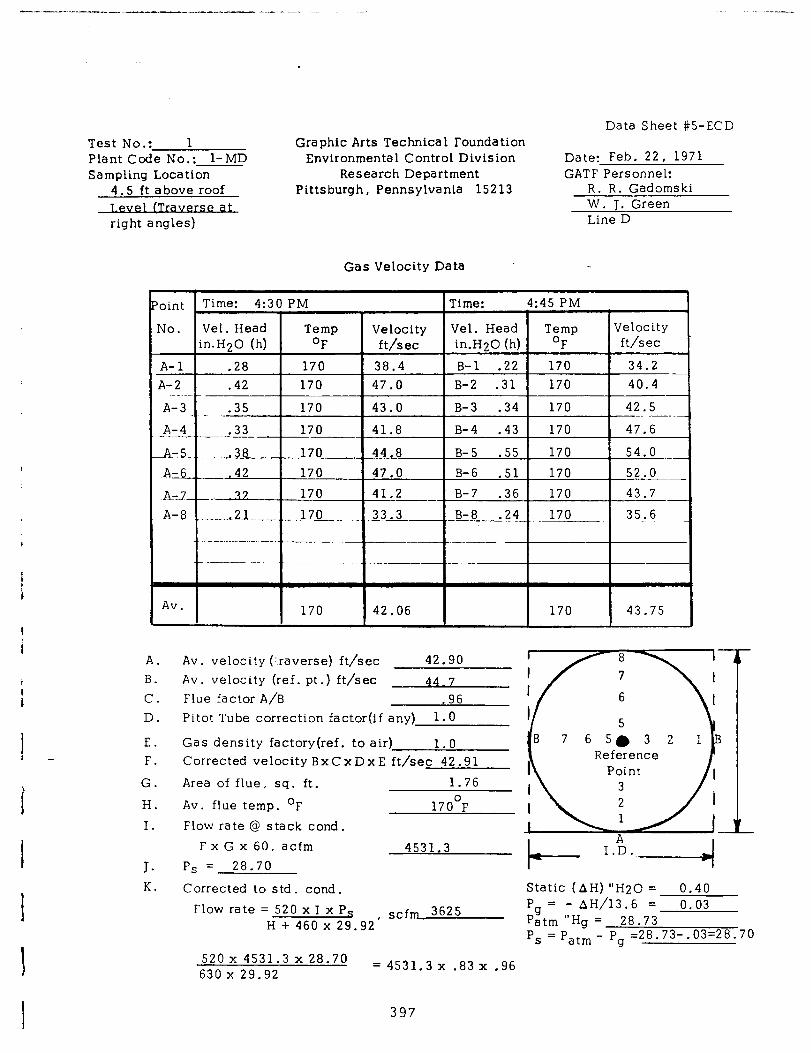
Test No.: 1 Plant Code No.: l-MD Sampling Location
4.5 ft above roof e at
right angles)
Graphic Arts Technical Foundation Environmental Control Division
Research Department Pittsburgh, Pennsylvanta 15213
Data Sheet #5-ECD
Date: Feb. 22, 1971 GATF Personnel:
R. R. Gadomski W. J. Green Line D
Gas Velocity Data
Point ?oint
No. No.
A-l A-l A-2 A-2
A-3 A-3
A-4 A-4 -_-_ -_-_
4-5. 4-5.
ALzfi ALzfi
A?7 A?7 A-8 A-8
I Av. Av.
1 i
A.
I
B. C. D.
I E.
I - F.
I
G.
H.
I.
I T. K.
I
Time: 4:30 PM Time: 4:45 PM I I I I I
Vel. Head Temp Velocity Vel. Head Temp Velocity in.H20 (h) OF ft/sec in.H20 (h) OF ft/s ec
.28 170 38.4 B-l -22 170 34.2 - .42 170 47.0 B-2 .31 170 40.4
.35 170 43.0 B-3 .34 170 42.5 - . -. -_-_ --ii?- 170 41.8 B-4 .43 170 47.6
- .-_. 28 -170 4P.33 B-5 .55 170 54.0 _ _-- -__
-.42 170 47.0 B-6 .51 170 52 -- 0
-:- -. z 170 41.2 B-7 .36 170 43.7
_-_._ c2L..- B-8 .,._ .170_ 33 3 __ _._ 2--- .2!-v 170 ._ 35,s
--_ . . -..--_ -_ -.
_ _---_ ---. _
I
170 42.06 170 43.75
Av. velocity (:.raverse) ft/sec 42.90 Av. velocity (ref. pt.) ft/sec 44.7 Flue factor A/B .96 Pitot Tube correction factor(if any) 1.0
Gas density factory(ref. to air) 1.0 Corrected velocity BxCxDxE ft/sec 42.91
Area of flue * sq. ft. 1.76
Av. flue temp. OF 170’F Flow rate @ stack cond.
FxGx60, acfm Ps = 28.70
Corrected to std. cond.
4531.3
Flow rate = 520 x I x P, , scfm 3625 H + 460 x 29.92
520 x 4531.3 x 28.70 = 630 4531.3 x .83x .96 x 29.92
397
7 65@3 2 1B
Static (AH) “H20 = 0.40 Pg = - AH/13.6 = 0.03 Pat, “Hg = 28.73 ‘s = patm - pg =28.73-.03=28.70
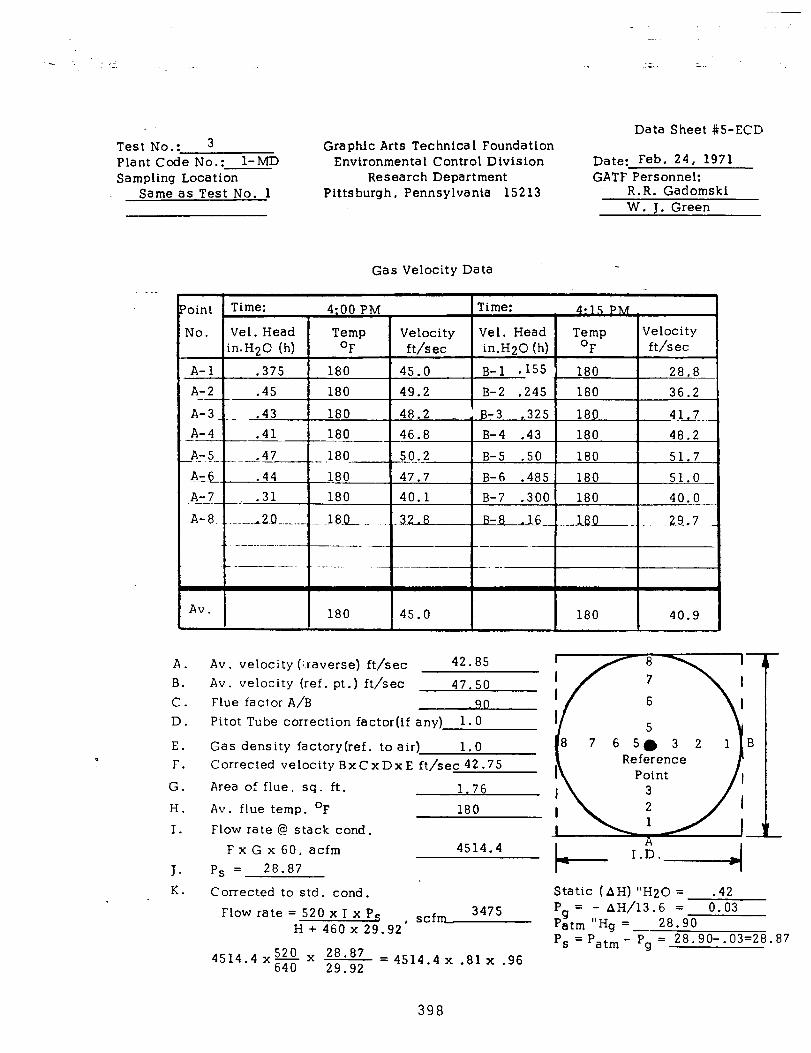
Test No.: 3 Graphic Arts Technlca 1 Foundation Plant Code No.: l-MD Environmental Control Division Sampling Location Research Department
Same as Test No. 1 Pittsburgh, Pennsylvania 15213
Data Sheet #5-ECD
Date: Feb. 24, 1971 GATF Personnel:
R.R. Gadomski W. J. Green
Gas Velocity Data
A. Av. velocity (:.raverse) ft/sec B. Av. velocity (ref. pt .) ft/sec C. Flue factor A/B D. Pitot Tube correction factor(if any)
E. Gas density factory(ref. to air) F. Corrected velocity BxCxDxE ft/sec 42.75
G. Area of flue, sq. ft.
H. Av. flue temp. OF
I. Flow rate @ stack cond.
F x G x 60, acfm J. P, = 28.87
K. Corrected to std. cond.
Flow rate = 520 x I x Ps H + 460 x 29.92’
scfmz.
4514.4 x% x 28-87 = 29.92
4514.4 x .81 x -96
Static (AHI "H70 = .42 Pg = -. AH;13 .-6- = 0.03 Patm “Hg =- 28.90
ps = Patm - Pg = 28.90-.03=28. 87
398
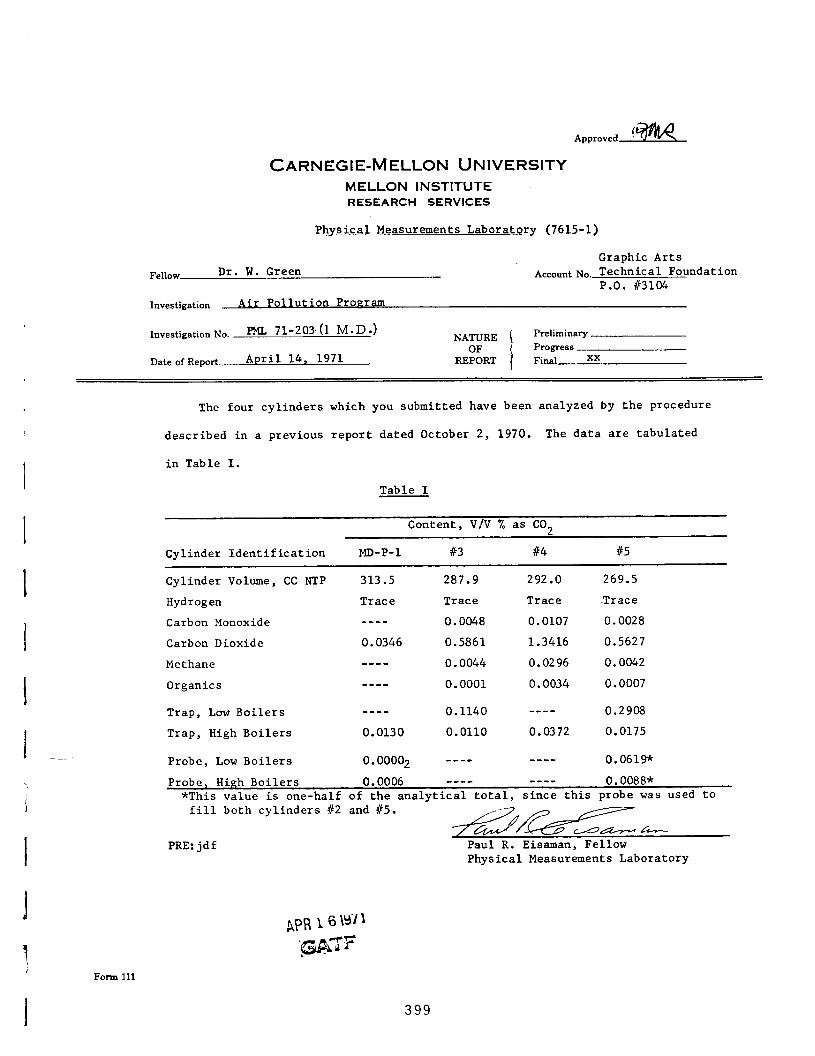
CARNEGIE-MELLON UNIVERSITY MELLON INSTITUTE
RESEARCH SERVICES
Physical Measurements Laboratory (7615-1)
Fellow Dr. W. Green
Investigation Air Pollution Program
Graphic Arts Account No, Technical Foundation
P.O. 83104
Investigation No. m 71-203,(1 M.D.) NATURE Preliminary
OF Progress Date of Report- April 14, 1971 REPORT Final xx
The four cylinders which you submitted have been analyzed by the procedure
described in a previous report dated October 2, 1970. The data are tabulated
in Table I.
Table I
Content, V/V % as CO2
Cylinder Identification MD-P-l #3 #4 #5
I I I i -
Cylinder Volume, CC NTP 313.5 287.9 292.0 269.5
Hydrogen Trace
Carbon Monoxide ----
Carbon Dioxide 0.0346
Methane ----
Organics -w-w
Trace Trace -Trace
0.0048 0.0107 0.0028
0.5861 1.3416 0.5627
0.0044 0.0296 0.0042
0.0001 0.0034 0.0007
Trap, Low Boilers ---e 0.1140 ---- 0.2908
Trap, High Boilers 0.0130 0.0110 0.0372 0.0175
Probe, Low Boilers 0.00002 ---- ---- 0.0619
Probe, High Boilers 0.0006 ---- ---- 0.0088* *This value is one-half of the analytical total, since this probe was used to
fill both cylinders 112 and f5. j--7- /3 /====-
PRE:jdf Paul R. Eisaman, Fellow Physical Measurements Laboratory
Form 111
399
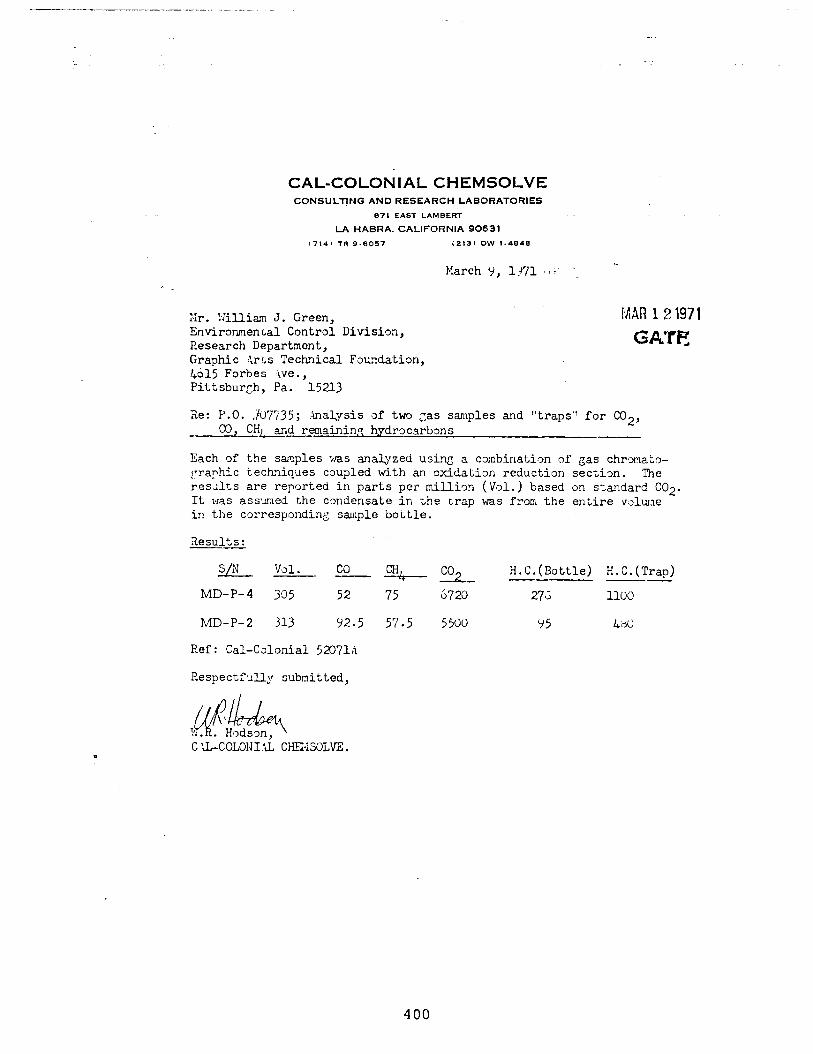
CAL-COLOtiIAL CHEMSOLVE CONSULT!NG AND RESEARCH LABORATORIES
871 EAST LAMBERT
LA HABRA. CALIFORNIA 90631
t7141 TR 9.6017 i213) ow 1.4848
5 March 9, 13.~1 .: "
Iir. William J. Green, MAR 12 1971
Environmental Control Division, Research Department, Graphic g1rr.s Technical Foundation, !+015 Forbes Ave., Pittsburgh, Pa. 15213
Re: P.O. ,/c-17735; ;Inalysis of two Gas samples and "traps" for CO2, CO, CHLgd remain&y? h.ydrocarbons
Each of the samples VAS analyzed using a combination of gas chmmato- graphic tech?iqiles coupled with an oxidation reduction section. The results are reported in parts per million (Vol.) based on standard CO2. It was assmed the condensate in the crap was from the entire volwae in the corresponding sample bor;tle.
Results:
s/x Vol. co 2 WV H.C.(Bottle) H.C.(Trap) --- MD-P-4 305 52 75 6720 27; 1100
MD-P-2 313 Y2.5 57.5 5 500 Y5 460
Ref: Cal-Colonial 52371A
Respectfully subnitted,
400
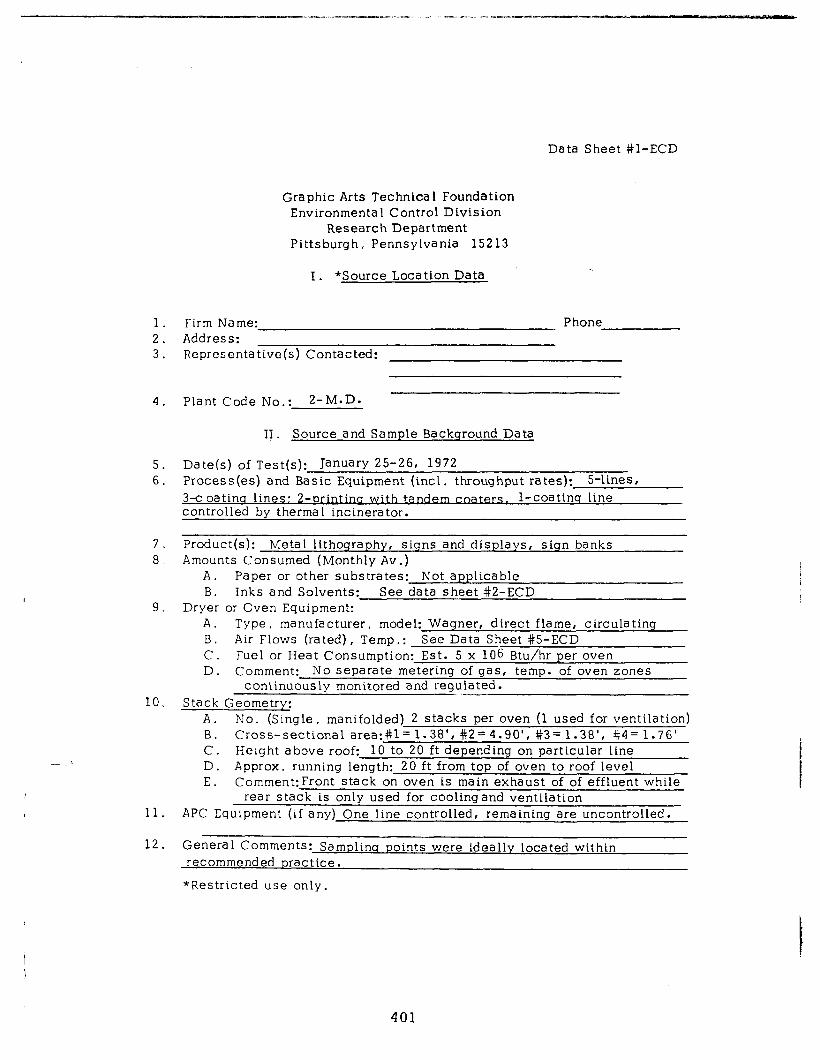
Data Sheet #l-ECD
Graphic Arts Technica 1 Foundation Environmental Control Division
Research Department Pittsburgh, Pennsylvania 15213
I. *Source Location Data
1. Firm Name: Phone 2. Address: 3. Representative(s) Contacted:
4. Plant Code No.: 2-M.D.
11 . Source and Sample Background Data
5. Date(s) of Test(s): January 25-26, 1972 6. Process(es) and Basic Equipment (inch. throughput rates): 5-lines,
3-c oatina lines: 2-printina with tandems. l-coatinq line controlled by thermal incinerator.
7. Product(s): Metal lithography, siqns and displays, siqn banks 8. Amounts Consumed (Monthly Av .)
A. Paper or other substrates: Not applicable B. Inks and Solvents: See data sheet #2-ECD
9. Dryer or Oven Equipment: A. Type, manufacturer, model: Wagner, direct flame, circulating B. Air Flows (rated), Temp.: See Data Sheet #5-ECD C. Fuel or Heat Consumption: Est. 5 x 10⁶ Btu/hr per oven D. Comment: No separate metering of gas, temp. of oven zones
continuously monitored and regulated. 10. Stack Geometry:
A. No. (Single, manifolded) 2 stacks per oven (1 used for ventilation) B. Cross-sectional area:#1=1.38’, #2=4.90’, #3=1.38’, #4= 1.76’ C. Height above roof: 10 to 20 ft depending on particular line D. Approx. running length: 20 ft from top of oven to roof level E. Comment:Front stack on oven is main exhaust of of effluent while
rear stack is only used for coolingand ventilation 11. APC Equipment (if any) One line controlled, remaining are uncontrolled.
12. General Comments: Samplina points were ideally located within recommended practice.
*Restricted use only.
401
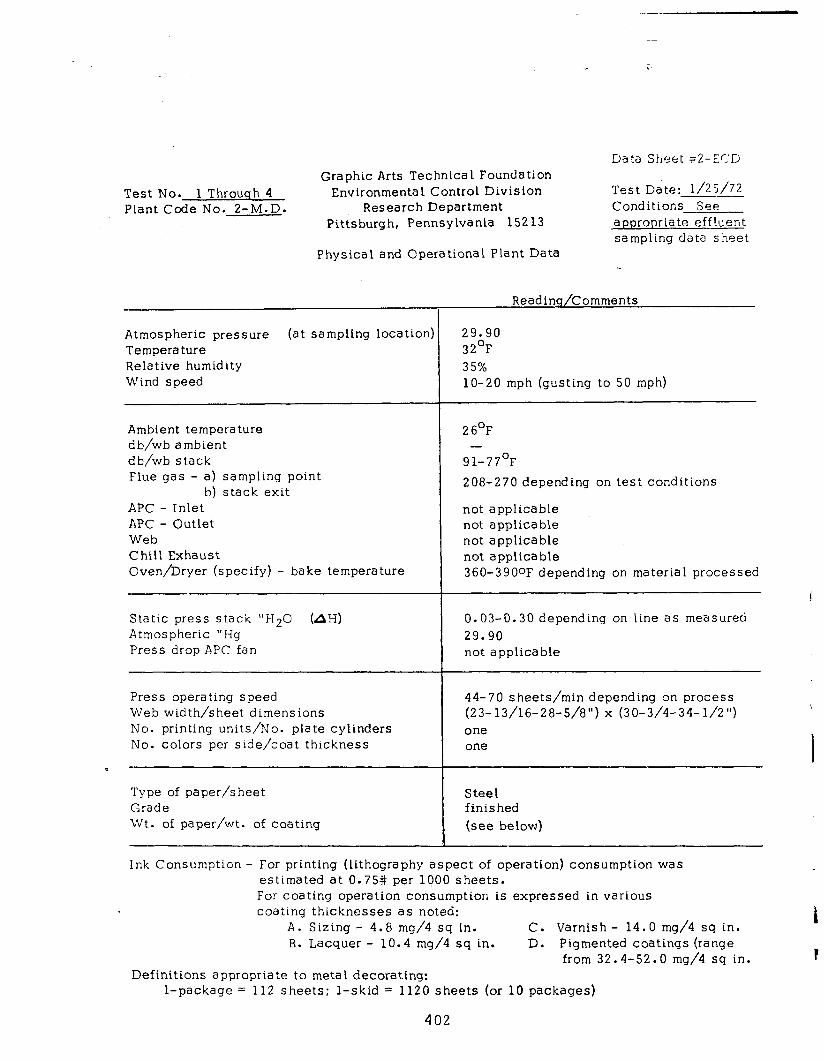
Test No. 1 Throuah 4 Plant Code No. 2-M.D.
Graphic Arts Technical Foundation Environmental Control Division
Research Department Pittsburgh, Pennsylvania 15213
Physical and Operational Plant Data
Data Sheet 72-ErJIj
Test Date: l/25/72 Conditions See appropriate effluent sampling data sheet
Readins/Comments
29.90 32’F 35% lo-20 mph (gusting to 50 mph)
26OF -
91-77’F
208-270 depending on tes t conditions
not applicable not applicable not applicable not applicable 360-3900F depending on material processed
Atmospheric pressure (at sampling location) Temperature Relative humidity Wind speed
Ambient temperature db/wb ambient db/wb stack Flue gas - a) sampling point
b) stack exit APC - Inlet APC - Outlet Web Chill Exhaust Oven/Dryer (specify) - bake temperature
Static press stack “H20 (AH) 0.03-0.30 depending on line as measured Atmospheric “Hg 29.90 Press drop APC fan not applicable
Press operating speed 44-70 sheets/min depending on process Web width/sheet dimensions (23-13/16-28-5/8”) x (30-3/4-34-l/2”) No. printing units/No. plate cylinders one No. colors per side/coat thickness one
*
Type of paper/sheet Grade Wt.. of paper/wt. of coating
Steel finished (see below)
Ink. Consumption - For printing (lithography aspect of operation) consumption was estimated at 0.75# per lQO0 sheets. For coating operation consumption is expressed in various coating thicknesses as noted:
A. Sizing - 4.8 mg/4 sq in. C. Varnish - 14.0 mg/4 sq in. B. Lacquer - 10.4 mg/4 sq in. D. Pigmented coatings (range
from 32.4-52.0 mg/4 sq in. Definitions appropriate to metal decorating:
l-package = 112 sheets: l-skid = 1120 sheets (or 10 packages)
!
& t
402

Data Sheet #3-ECD _. - --..,,: , Graphic Arts Technica 1 Foundation
Environmental Control Division I Research Department
.. 1- A;‘> 8 Pittsburgh, Pennsylvania 15213 __ !. ’ ;
, -- _~
Plant Code No. 2-MD
, - .-
Sample # b
::
-----
#3 #4
f i -----
#7 #8
--_--
#lO #13
.--_-
. . . . a-_ .s
Time
.1:20-11:35
m----w--
1:50-12:00 2:00-12:lO 2:10-12:20 2:20-12:30 ----__-_
-------- 10 min 10 min 10 min 10 min
-----m---
1:55-2:10 15 min
--B-e---
2:15-2:30
Date: l/25/72 Effluent Sampling Data.
.,_* ..- Period
_.. _ 15 min
15 min
.__. _ Probe
:onfiguration
‘erpend icular and centered on stack diameter
---------
Same as 3 bove
-----e--w
Same as above
-------mm
Same as 3 bove
403
- .
Comments
Samples taken of l-color (black) Lithography with trailing varnish coating application. Press speed of 60 sht/min; sheet size-26-7/8”x 31-7/8” (25# basic wt).
Varnish-VDGSOS-2 (63.5% solvent) 14.0 mg/4 sq in
Ink-black-D-15722 (40% solvent) consumption (est.) .75# per 1000 shts. Press Line #l
----------------------- Samples staggered over 40 minute period to obtain background emissions of press oven only. Press Line #l
-----_-------_--------- Samples taken of l-color (pink) Lithography with no trailing varnish coating operation. Press speed of 60 shts/min. Ink consumption (est.) at 0.75# per 1000 shts. Sheet size-26-7/8”x 31-7/8” Press Line #3
------------_---__-_---
Samples taken of white. (12183) alkyd coating. Press speed of 68 sh/min: sheet size-26-3/4”x32-l/2”; 80# basic wt. 38.4 mg/4 sq in: (41% solvent) density of 10.2#/gal.
*Actual usage rate of material deter- mined on location as 15 gal/hr.
Coating Line #4

1‘ . .
Graphic Arts Technical Foundation Environmental Control Division
Research Department Pittsburgh, Pennsylvania 15213
Data Sheet #3-ECD
Plant Code No. 2-MD Effluent Sampling Data
Date: l/25/72
. . ^- e- . .-- _. . c . -.. . . . .
Sample #
-.-... --
#14 #15
---- #16 #17
Time Period
2:50-3:05
-------me
3:10-3~25
15 min
----_-__
15 min
Probe Zonfiguration . .
Perpendicular and centered on stack diameter
-- ----___ Same as above
Comments ....,,,.C.l-. ,.a.
Samples taken of sizing (8463-002). Press speed of 70 sh/min: sheet size 25-3/8” x 30-3/4”; 80# basic wt. 4.8 mg/4 sq in: (82% solvent), density of 7.38#/gal.
Coating Line #2 -----------------_-_--- -- - Same as samples #14 & 15 Coating Line #2
404
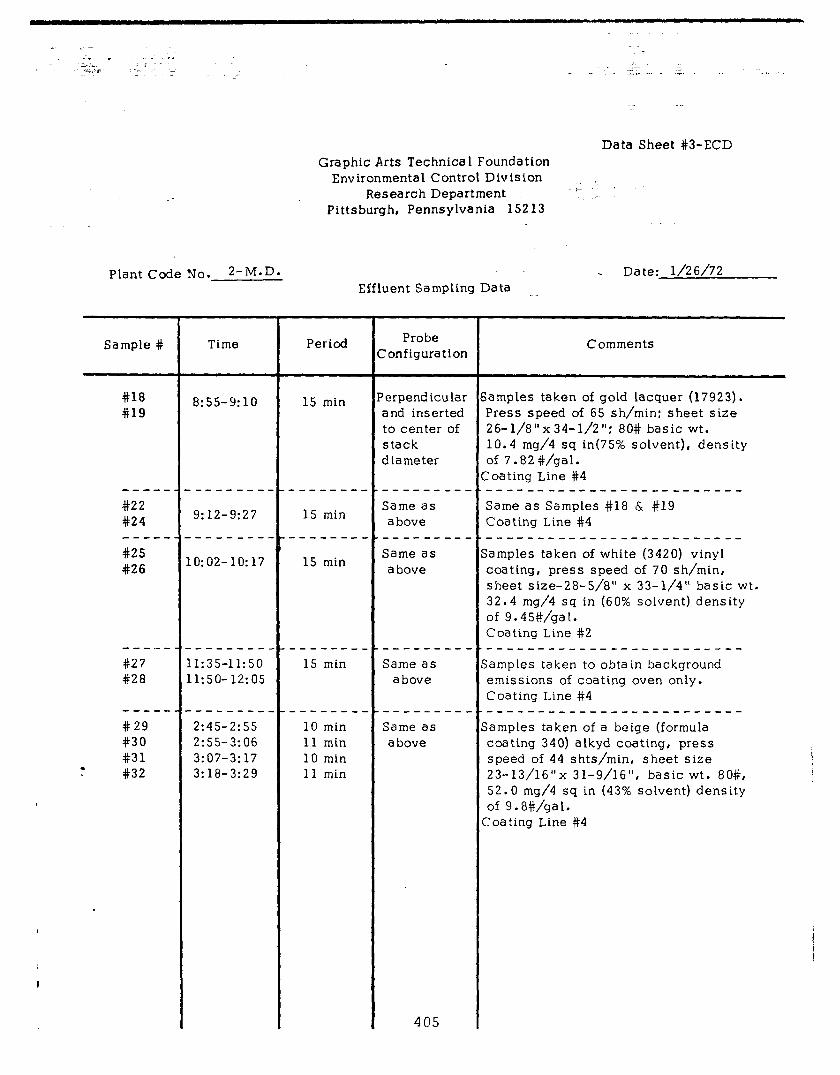
Data Sheet #3-ECD Graphic Arts Technica 1 Foundation
Environmental Control Division Research Department + :_
Pittsburgh, Pennsylvania 15213
Plant Code No. 2-M.D. Date: l/26/72
Sample #
#18 #19
--a--
#22 #24 -----
#25 #26
e-e._- -0e----e_
#27 11:35-11:50 #28 11:50- 12:05
----- #29 #30 #31 . #32
Time
8:55-9:lO
.-----em-
9:12-9:27 .--_-_---
10:02-lo:17
------__ 15 min
.--w--e__ ------_- 2:45-2:55 10 min 2:55-3~06 11 min 3:07-3:17 10 min 3:18-3:29 11 min
Effluent Sampling Data
Period
15 min
---w---e
15 min ---m---m
15 min
Probe Zonfiguration
‘erpend icular and inserted to center of stack diameter
---e--e-- --de ----- -_---- -_-_-_---- Same as Same as Samples #18 & #19 above Coating Line #4
---a-o__- Same as above
------------------------- iamples taken of white (3420) vinyl coating, press speed of 70 sh/min, sheet size-28-5/a” x 33-l/4” basic wt. 32.4 mg/4 sq in (60% solvent) density of 9.45#/gal. Coating Line #2
_-----_-- Same as
above
--_-----_ Same as above
405
Comments
lamples taken of gold lacquer (17923). Press speed of 65 sh/min: sheet size 26-1/8”x34-l/2”; 80# basic wt. 10.4 mg/4 sq in(75% solvent), density of 7.82#/gal. Ioating Line #4
--------_-_---__-_------- jamples taken to obtain background emissions of coating oven only. Coating Line #4 ------------------------- ;amples taken of a beige (formula coating 340) alkyd coating, press speed of 44 shts/min, sheet size 23-13/16”x 31-g/16”, basic wt. 80#, 52.0 mg/4 sq in (43% solvent) density of 9.8#/gal. 30ating Line #4
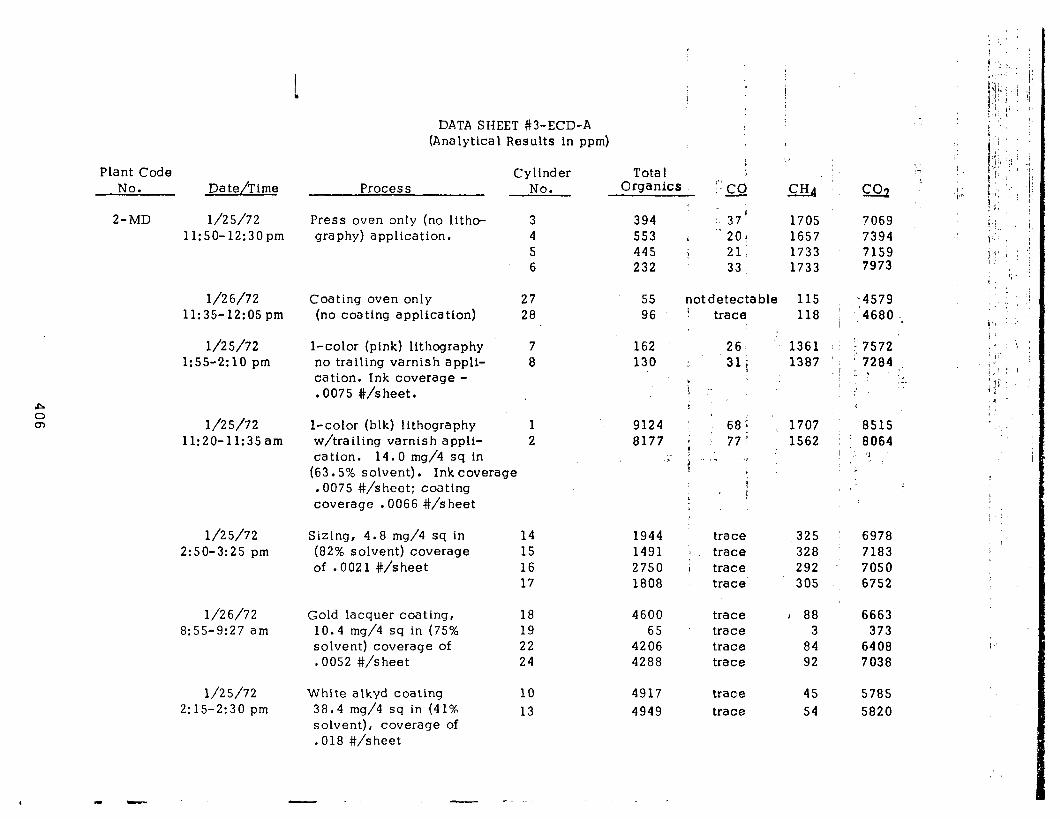
DATA SHEET #3-ECD-A (Analytical Results in ppm)
Process Cylinder
No.
i , Tota 1
Organics r-s ix4
Plant Code No. Date/Time
2-MD l/25/72 11:50-12:30pm
CA Press oven only (no litho- 3 394 graphy) application. 4 553
5 445 6 232
2 _ .
37i 1705 ,. , 201 1657
21 :. 1733 33 :. 1733
7069 7394 7159 7973
Coating oven only 27 55 (no coating application) 28 96
not detectable 115 trace
l-color (pink) lithography 7 no tralling varnish appli- 8 cation. Ink coverage - .0075 #/sheet.
162 130
26 3li
, I * :
118 I
1361 I 1387 li
,:4579 ,468O .
: 7572 7284 l:
: . . .
2,
l-color (blk) lithography 1 w/trailing varnish appli- 2 cation. 14.0 mg/4 sq tn
(63.5% solvent). Ink coverage .0075 #/sheet: coating coverage . 0066 #/sheet
9124 8177
1707 1562
I
‘8515 8064 ‘1
i.
Sizing, 4.8 mg/4 sq in (82% solvent) coverage of .0021 #/sheet
14 1944 trace ,325 6978 15 1491 1 trace 328 7183 16 2750 ; trace 292 7050 17 1808 trace 305 6752
Gold lacquer coating, 18 4600 trace I 88 6663 10.4 mg/4 sq in (75% 19 65 1 trace 3 373 solvent) coverage of 22 4206 trace 84 6408 . 0052 #/sheet 24 4288 trace 92 7038
White alkyd coating 38.4 mg/4 sq in (41% solvent), coverage of
10 13
4917 trace 45 5785 4949 trace 54 5820
l/2 6/72 11:35-12:05 pm
l/25/72 1:55-2: 10 pm
4
0
tn l/25/72 11:20-11:35am
l/25/72 2:50-3:25 pm
l/26/72 8:55-9:27 am
l/25/72 2: 15-2:30 pm
. 018 #/sheet
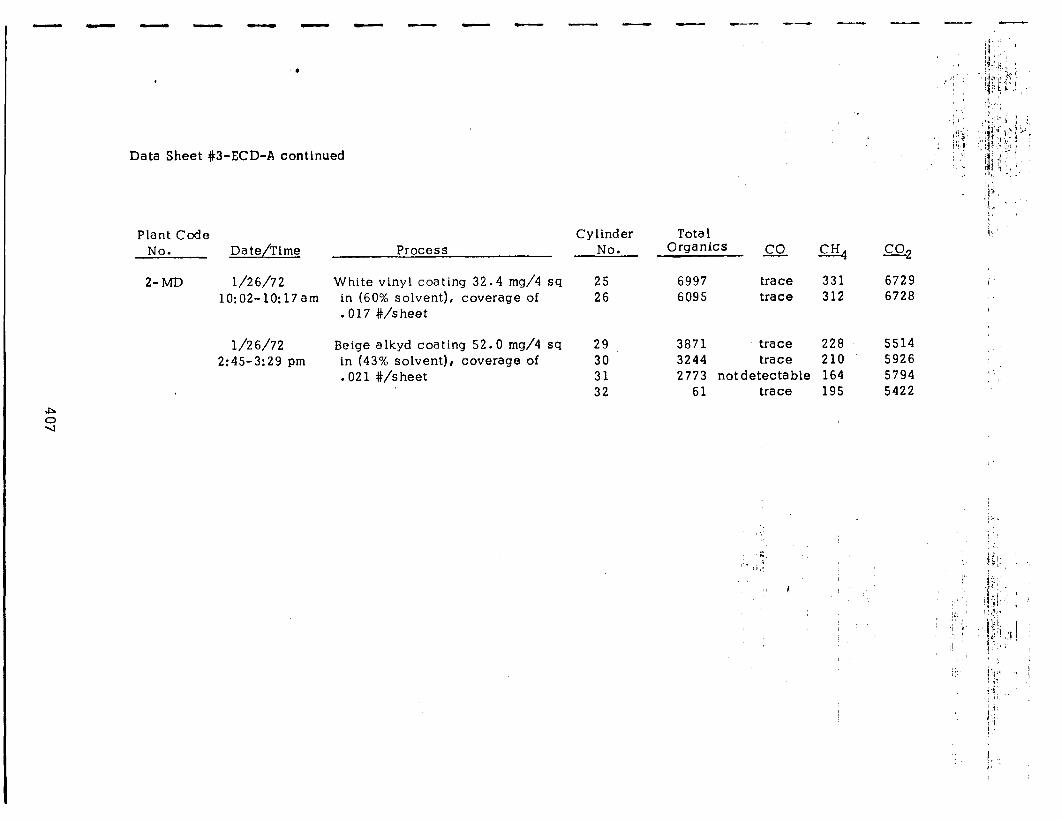
- - i_l___- ----w---v- - _L t- c- -
Data Sheet #3-ECD-A continued
Plant Code No. Date/Time Process
2-MD l/26/72 White vinyl coating 32.4 mg/4 sq 10:02-10:17am in (60% solvent), coverage of
.017 #/sheet
l/2 6/72 Beige alkyd coating 52.0 mg/4 sq 2:45-3:29 pm in (43% solvent), coverage of
. 02 1 #/sheet
Cylinder Tota 1 No. Organics CC
25 6997 trace 26 6095 trace
29 3871 trace 30 3244 trace
CH, 331 312
228 210
31 2773 notdetectable 164 32 61 trace 195
i.
co,
6729 i 6728
5514 5926 5794 5422
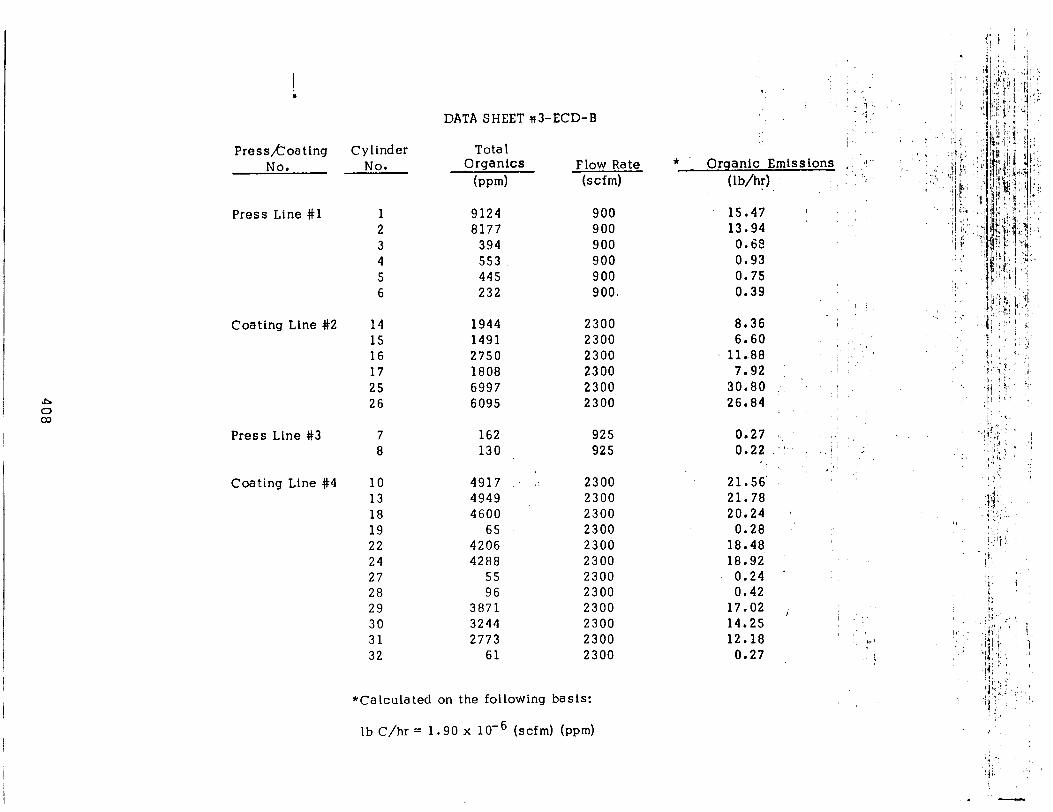
. * Organic Emisslons ; ,* !
(lb/h:), :’ ‘ “I
Presskoating Cylinder No. No.
DATA SHEET tr3 -ECD-B
Total Organfcs
hvm) Flow Rate (scfm)
15.47 1 9124 900 2 8177 900 3 394 900 4 553 900 5 445 900 6 232 900.
Press Line #l
14 1944 2300 15 1491 2300 16 2750 2300 17 1808 2300 25 6997 2300 26 6095 2300
7 162 925 8 130 925
10 4917 2300 13 4949 2300 18 4600 2300 19 65 2300 22 4206 2300 24 4288 2300 27 55 2300 28 96 2300 29 3871 2300 30 3244 2300 31 2773 2300 32 61 2300
13.94 0.68 0.93 0.75 0.39
8.36 6.60
11..88 7.92
30.80 26.84
0.27 I, 0.22 ‘.!?.
”
21.56’ 21.78 20.24 ,
0.28 18.48 18.92
0.24 . 0.42
17.02 , 14.25 12.18
0.27
Coating Line #2
1 L-2 0 W
Press Line #3
Coating Line #4
‘i
1, : ‘1% i ::
*Calculated on the following basis:
lb C/hr = 1.90 x 10e6 (scfm) (ppm)
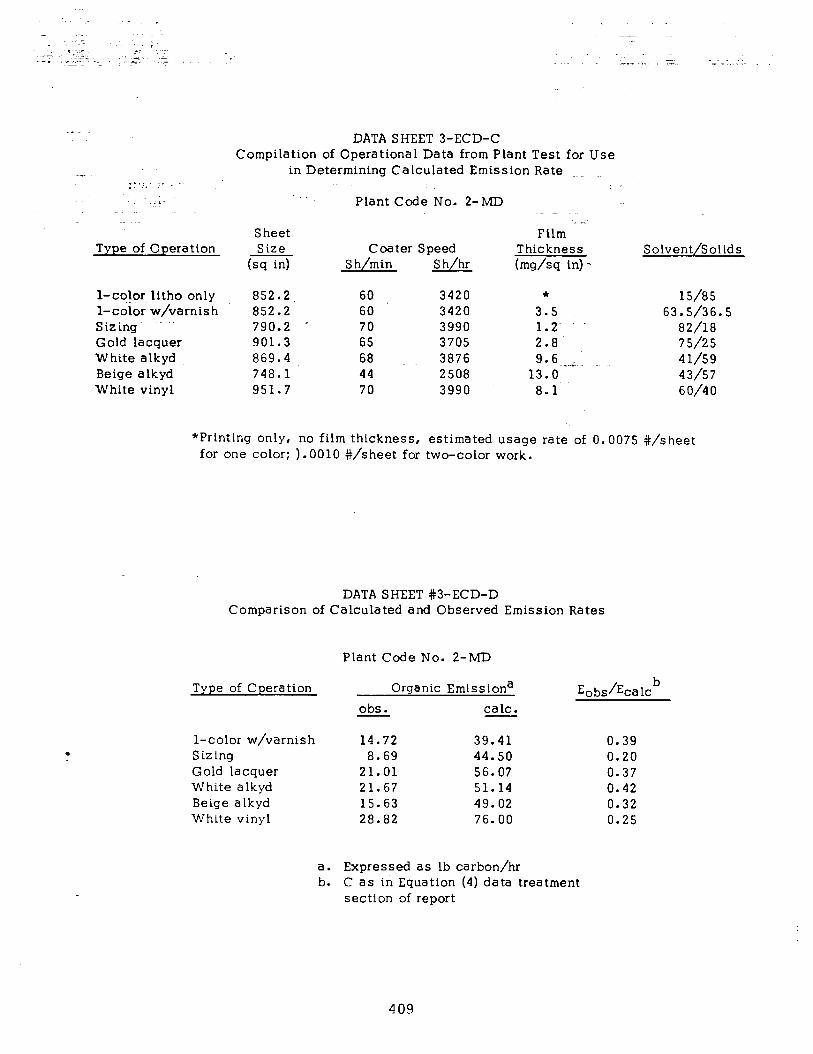
-- “::& -, .,
., . . ..L.
_~
._
Type of Operation
DATA SHEET 3-ECD-C Compilation of Operational Data from Plant Test for Use
in Determining Calculated Emission Rate .: :
Plant Code No. 2-MD
Sheet FL&‘- Size Coater Speed Thickness
(sq in) S h/min h/hr S hdsq in) -
*Printing only, no film thickness, estimated usage rate of 0.0075 #/sheet
Solvent/Solids
l-cq!or- litho only l-color w/varnish Sizing ._’ Gold lacquer White alkyd J3eige alkyd White vinyl
852.2, 60 3420 * 15/85 852.2 60 3420 3.5 63.5/36.5 790.2 * 70 3990 1.2. ’ 82/18 901.3 65 3705 2.8 75/25 869.4 68 3876 9.6 : 41159 748.1 44 2508 13.0~“‘“‘~~ 43/57 951.7 70 3990 8.1 60/40
t
for one color: ).OOlO #/sheet for two-color work.
DATA SHEET #3-ECD-D Comparison of Calculated and Observed Emission Rates
Plant Code No. 2-MD
Type of Operation
l-color w/varnish Sizing Gold lacquer White a lkyd Beige alkyd White vinyl
Organic Emissiona
obs. talc.
14.72 39.41 8.69 44.50
21.01 56.07 21.67 51.14 15.63 49.02 28.82 76.00
Eobs/Eca Icb
0.39 0.20 0.37 0.42 0.32 0.25
a. Expressed as lb carbon/hr b. C as in Equation (4) data treatment
section of report
409

. Data Sheet #5-ECD Test No.: - Graphic Arts Technical Foundation Plant Code No.: 2-M.D. , Environmental Control Division Date: l/25/72 Sampling Location Research Department GATF Personnel:
Jress Line *1 Pittsburgh, Pennsylvania 15213 R. R. Gadomski W. T. Green
’ .._ #., ‘; Gas Velocity Data
Point
No.
3
4 I- 5 --_ --
-6
Av. I 210 I 13.5 I I 210 I 13.9
-
A. B. c. D.
E. F.
G.
H.
I.
Av. velocity (rraverse) ft/sec 13.7 Av. velocity (ref. pt.) ft/sec da Flue factor A/B n/a Pitot Tube correction factor(if any) 1.0
Gas density factory(ref. to air) l*O Corrected velocity Bx C x D x E ft/sec 13.7
Area of flue, sq. ft. 1.38
Av. flue temp. OF 210
Flow rate @ stack cond.
FxG x 60, acfm 1150 J. Ps= 29.90
K. Corrected to std. cond.
Flow rate = 520 x I x P, scfm 900 H + 460 x 29.92’
Static (AH)~I~cI = 0.03 Pg = - AH,‘13.6 = -- Patm “Kg = 29.90 pS = patm - pg = 29.90
,
410
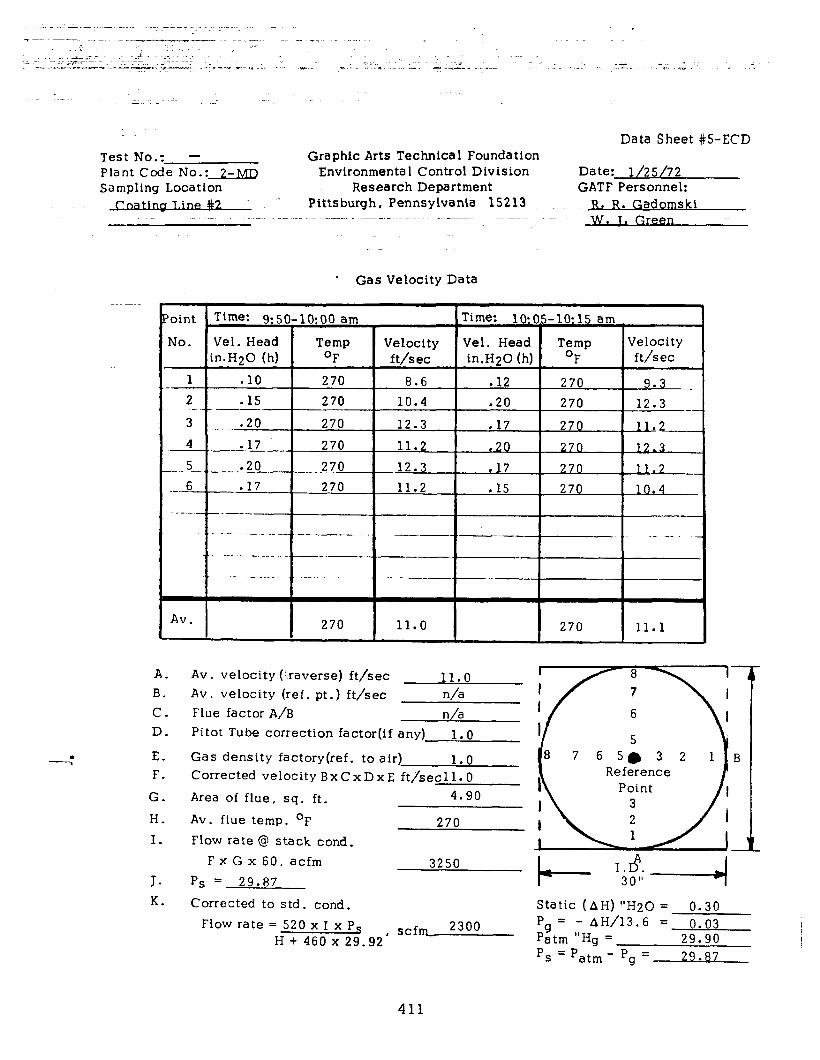
Data Sheet #5-ECD Test No.: - Graphic Arts Technical Foundation Plant Code No.: 2-m Environmenta 1 Control Division Date: l/25/72 Sampling Location
wT.ine2 ~’ Research Department GATF Personnel:
Pittsburgh, Pennsylvania 15213 ___ R. R. Gadomski _~ --~ -...
. Gas Velocity Data
oint Time: g:so-lo:00 am Time: 10:05-lo:15 am _
No. Vel. Head Temp Velocity Vel. Head Temp Velocity in.H20 (h) OF ft/sec in.HgO (h) OF ft/sec
1 .lO 270 8.6 .12 270 9.3 2 .15 270 10.4 .20 270 -._- _-- 12.3 __
3 -20 270 ._ . 12.3 .17 270 11.2 4 .17 270 11.2 .20 270 3
-._ 5 20 270 !--.- -..- ___ _____. -12.3 .17 270 11.2
.- 6 .17 270 _ 11.2 .15 270 10.4
Av. I I 270 11.0 270 11.1
A. Av. velocity (:.raverse) ft/sec 11.0 B. Av. velocity (ref. pt.) ft/sec n/a C. Flue factor A/B n/a D. Pitot Tube correction factor(if any) 1.0
E. Gas density factory(ref. to air) 1.0 F. Corrected velocity Bx C x D x E ftlsecl 1.0
G. Area of flue, sq. ft. 4.90
H. Av. flue temp. OF 270 I. Flow rate @ stack cond.
J-
FxGx60. acfm
P, = 29.87 3250
K. Corrected to std. cond. Static (AH) “H20 = 0.30 Flow rate = 520 x I x P, scfrn 2300 Pg = - AH/13.6 = 0.03 I
H + 460 x 29.92’ Patm “Hg = 29.90 I Ps =Patm- Pg = 7.9.87
411
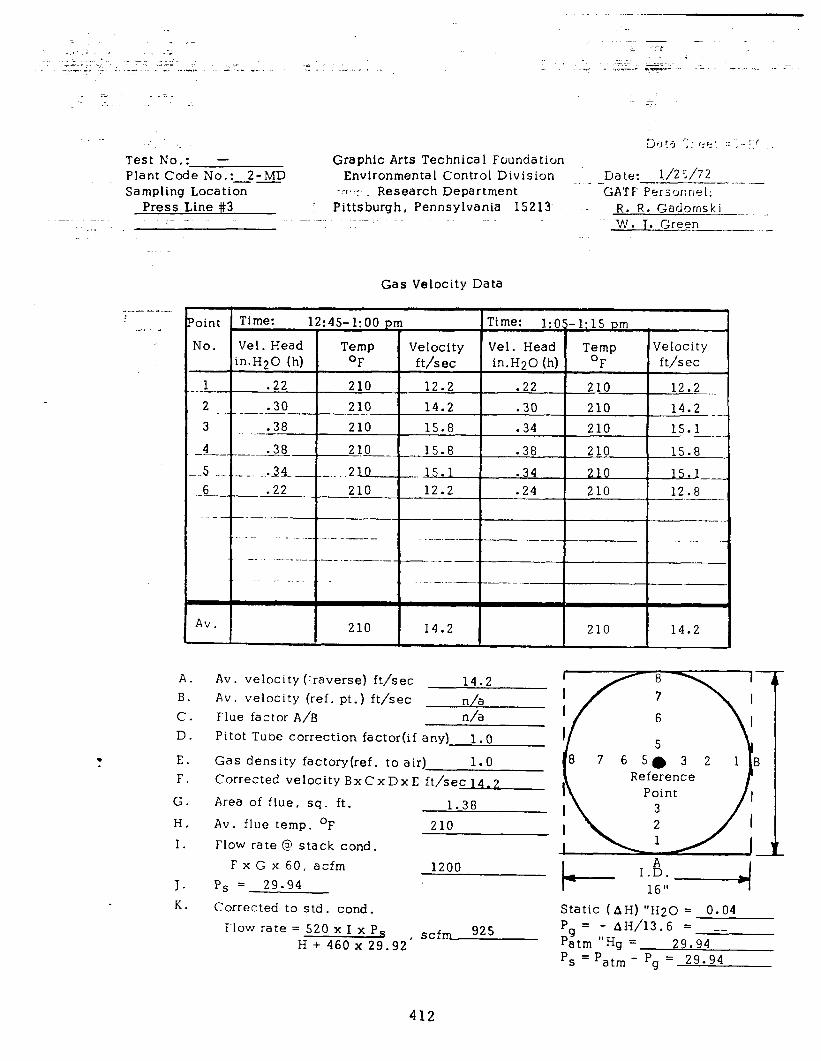
:.. F
Test No.: - Graphic Arts Technica I Foundation Plant Code No.:~-MD Environmental Control Division Date: l/2 :/72 Sampling Location -
-_-._ . .‘, ..: y . Research Department GATF PersfJf:fiF~:
Press Line #3 Pittsburgh, Pennsylvania 15213 ~- R. R. Gadomski ---
- ~~ _. _. ~~ ~~~~~ .~ . . . W. I. Green --___- -_
Gas Velocity Data
- -- . - -. - - ._ .-_. -. ___-__ -- _
-. .-------- ..--. - ..-- - -----_-
Av. 210 14.2 210 14.2
A. B. c. D.
E. F.
G.
H.
I.
J. K.
Av. velocity (Traverse) ft/sec 14.2 Av. velocity (ref. pt.) ft/sec n/a Flue factor A/B n/a Pitot Tube correction factor(if any) 1.0
Gas density factory(ref. to air) 1.0 Corrected velocity BxCxDxE ft/sec 14.2
Area of flue, sq. ft. 1.38 Av. flue temp. OF 210 Flow rate @ stack cond.
FxG x 60, acfm P, = 29.94
Corrected to s td . cond.
1200
Flow rate = 520 x I x Ps H + 460 x 29.92’
scfm 925
Static (AH) “H20 = 0.04 Pg = - AH/13.6 = __ Patm “Hg = 29.94 ‘S = ‘atm - pg = 29.94
412
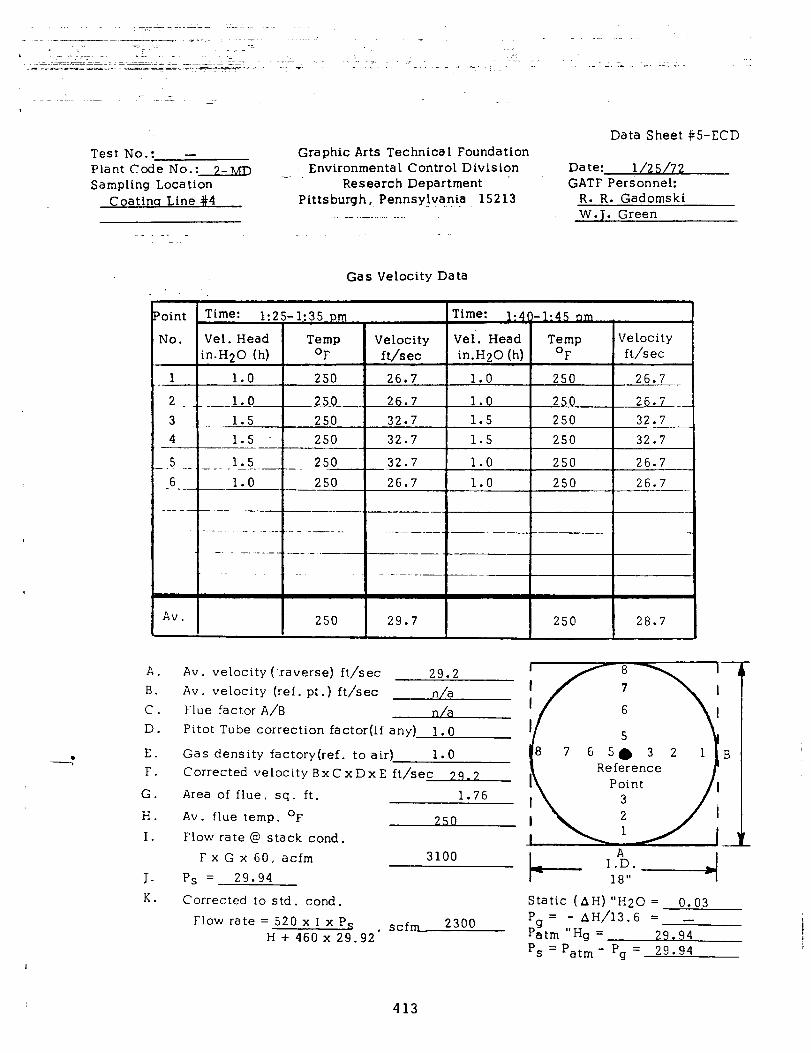
Data Sheet #5-ECD Test No.: - Graphic Arts Technical Foundation Plant Code No.: 2-m Environmental Control Division Date: l/25/72
- Sampling Location Research Department ’ GATF Personnel:
Coatincr Line #4 Pittsburgh, Pennsy!vania 15213 R. R. Gadomski W.J. Green
Gas Velocity Data
-6 1.0 250 26.7 1.0 250 26.7 --
__- - -- .___ - --
-. - -- --_. - -___ __
. -. . _. ._ _ __ __
Av. 250 29.7 250 28.7
A. Av. velocity (‘.raverse) ft/sec 29.2 B. Av. velocity (ref. pt.) ft/sec / C. Flue factor A/B LL- D. Pitot Tube correction factor(if any) 1.0
E. Gas density factory(ref. to air) 1.0 F. Corrected velocity BxCxDxE ft/sec 79.2
G. Area of flue, sq. ft. 1.76
H. Av. flue temp. OF
A
I. Flow rate @ stack cond.
F x G x 60, acfm 3100
J. P, = 29.94
K. Corrected to std. cond.
Flow rate = 520 x I x Ps scfm 2300 H + 460 x 29.92’
Static (AH) “H20 = 0. _- Pg = - AH/l3.6 = - Patm “Hg = 29.94 ‘s = Patm - pg = 29.94
413
CARNEGIE-MELLON UNIVERSITY :>.. ._ . . MELLON INSTITUTE ._
_- . ..~ - _ .~ RESEARCH SERVICES _ ~-.i-L--em FEB-~ 431972 Physical Measurements Lgbsm.tory (7615-2) GA-I-F
Graphic Arts
Fellow Mr. Ray Gadomski (2) ACcoUntNo,>chnical Foundation Px-KK-- ^.. - ~_- ~
Invcstipation Air Pollution Program -. - - -- -~ - - _... -
-
Investigation No. PML 72-2 O1 wm) --
Date ofRcport-e February 18, 1972
NATURE Preliminary OF
REPORT I
PrOgreSS Final X
The twenty-six samples of stack gas effluent which you submitted
have been analyzed by the procedure described in a recent report dated
December 17, 1971. The data are tabulated in the attached table.
Fellow Physical Measurements Laboratcry
.
1
Fonn 111
PRE:jdf
R&T: 2/23/72
414
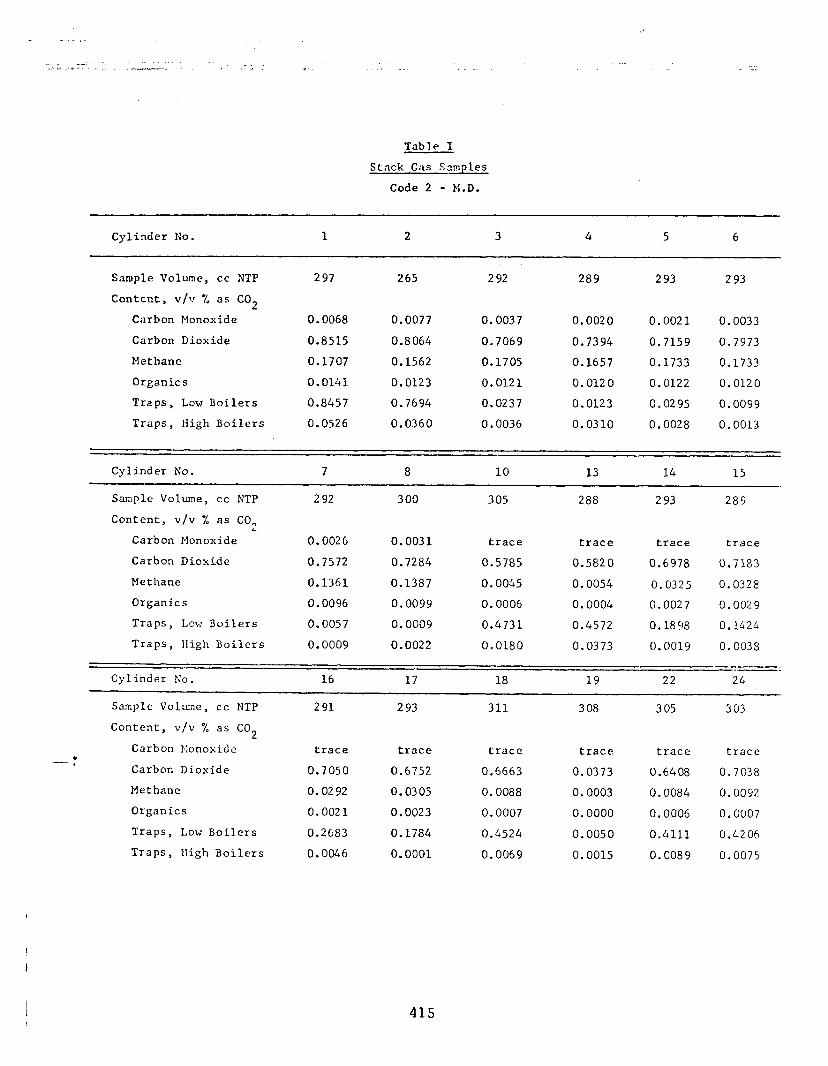
--:
Table I
Stack Gas Samples
Code 2 - M.D.
Cylinder No. 1 2 3 4 5 6
Sample Volume, cc NTP 297 265 292 289 293 293
Content, v/v % as CO 2
Carbon Monoxide 0.0068 0.0077 0.0037 0.0020 0.0021 0.0033
Carbon Dioxide 0.8515 0.8064 0.7069 0.7394 0.7159 0.7973
Methane 0.1707 0.1562 0.1705 0.1657 0.1733 0.1733
Organics 0.0141 0.0123 0.0121 0.0120 0.0122 0.0120
Traps, Low Boilers 0.8457 0.7694 0.0237 0.0123 0.0295 0.0099
Traps, High Boilers 0.0526 0.0360 0.0036 0.0310 0.0028 0.0013
Cylinder No. 7 8 10 13 14 15
Sample Volume, cc NTP 292 300 305 288 293 289
Content, v/v % as CO 2
Carbon Monoxide 0.0026 0.0031 trace trace trace trace
Carbon Dioxide 0.7572 0.7284 0.5185 0.5820 0.6978 0.7183
Methane 0.1361 0.1387 0.0045 0.0054 0.0325 0.0328
Organics 0.0096 0.0099 0.0006 0.0004 0.0027 0.0029
Traps, Low Boilers 0.0057 0.0009 0.4731 0.4572 0.1898 0.1424
Traps, High Boilers 0.0009 0.0022 0.0180 0.0373 0.0019 0.0038
---- _-- Cylinder No. 16 17 18 19 22 24
Sample Volume, cc NTP 291 293 311 308 305 303
Content, v/v % as CO 2
Carbon Monoxide trace trace trace trace trace trace
Carbon Dioxide 0.7050 0.6752 0.6663 0.0373 0.6408 0.7038
Methane 0.0292 0.0305 0.0088 0.0003 0.0084 0.0052
Organics 0.0021 0.0023 0.0007 0.0000 0.0005 0.0007
Traps, Low Boilers 0.2683 0.1784 0.4524 0.0050 0.4111 0.4206
Traps, High Boilers 0.0046 0.0001 0.0069 0.0015 0.0089 0.0075
415
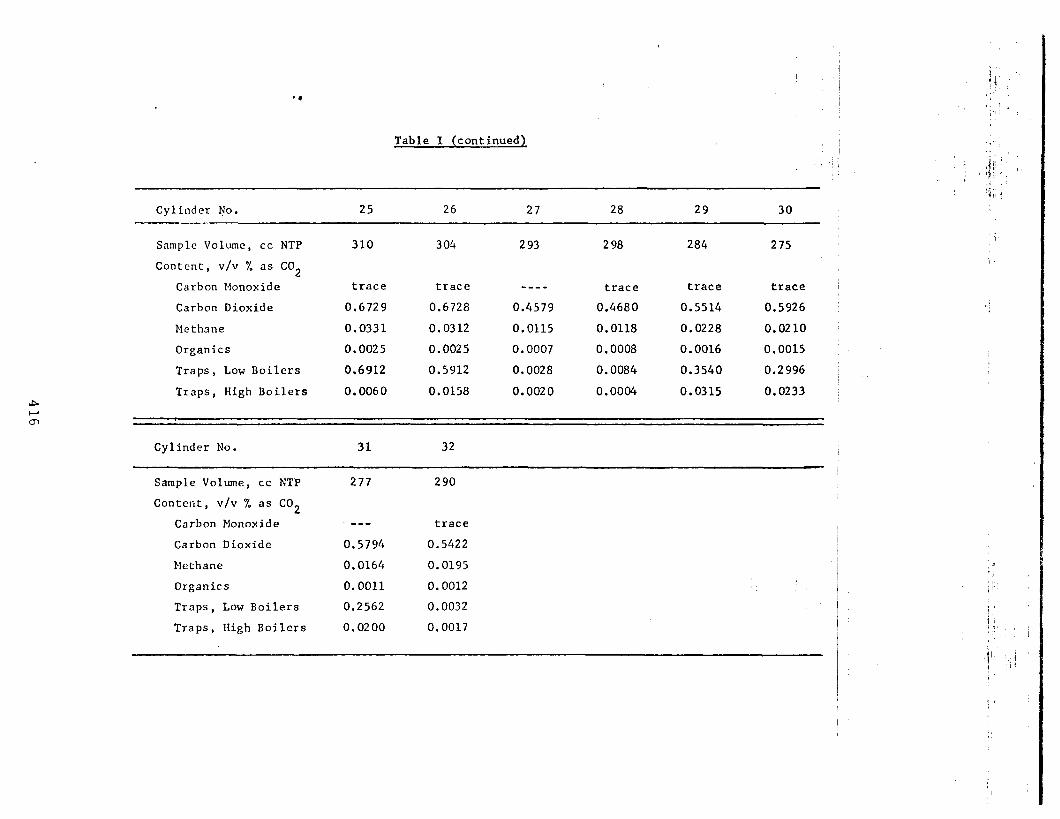
Table I (continued1
8’ I
Cylinder Ijo. 25 26 27 28 29 30
Sample Volume, cc NTP
Content, v/v % as CO2
Carbon Monoxide
Carbon Dioxide
Methane
Organics
Traps, Low Boilers
Traps, High Boilers
310 304 293 298 284 275
trace trace --mm trace trace trace
0.6729 0.6728 0.4579 0.4680 0.5514 0.5926
0.0331 0.0312 0.0115 0.0118 0.0228 0.0210
0.0025 0.0025 0.0007 0.0008 0.0016 0.0015
0.6912 0.5912 0.0028 0.0084 0.3540 0.2996
0.0060 0.0158 0.0020 0.0004 0.0315 0.0233
Cylinder No. 31 32 !
Sample Volume, cc NTP
Content, v/v % as CO2
Carbon Monoxide
Carbon Dioxide
Methane
Organics
Traps, Low Boilers
Traps, High Boilers
277 290
we- trace
0.5794 0.5422
0.0164 0.0195
0.0011 0.0012
0.2562 0.0032
0.0200 0.0017
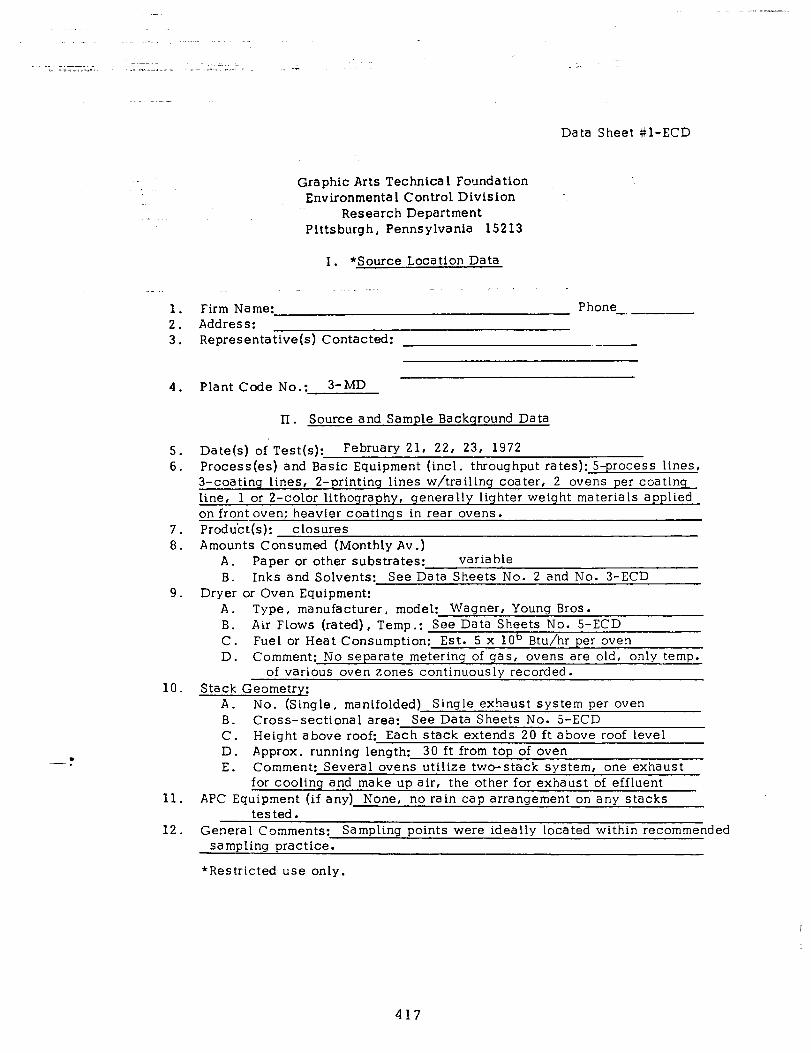
Data Sheet #l-ECD
Graphic Arts Technical Foundation Environmental Control Division
Research Department Pittsburgh, Pennsylvania 15213
I. *Source Location Data
1. Firm Name: Phone -. L 2. Address: 3. Representative(s) Contacted:
. -~ .
4. Plant Code No.: 3-MD
II. Source and Sample Background Data
5. Date(s) of.Test(s): February 21, 22, 23, 1972 6. Process(es) and Basic Equipment (incl. throughput rates): 5-process lines,
3-coating lines, 2-printing lines w/trailing coater, 2 ovens per coatinq line, 1 or 2-color lithography, generally lighter weight materials applied on front oven: heavier coatings in rear ovens.
7. Product(s): closures 8. Amounts Consumed (Monthly Av .)
A. Paper or other substrates: variable B. Inks and Solvents: See Data Sheets No. 2 and No. 3-ECD
9. Dryer or Oven Equipment: A. Type, manufacturer, model: Wagner, Young Bras. B. Air Flows (rated), Temp.: See Data Sheets No. S-ECD C. Fuel or Heat Consumption: Est. 5 x 10b Btu/hr per oven D. Comment: No separate metering of gas, ovens are old, only temp.
of various oven zones continuously recorded. 10. Stack Geometry:
A. No. (Single, manifolded) Single exhaust system per oven B. Cross-sectional area: See Data Sheets No. 5-ECD C. Height above roof: Each stack extends 20 ft above roof level D. Approx. running length: 30 ft from top of oven E. Comment: Several ovens utilize two-stack system, one exhaust
for cooling and make up air, the other for exhaust of effluent Il. APC Equipment (if any) None, no rain cap arrangement on any stacks
tested. 12. General Comments: Sampling points were ideally located within recommended
samolina nractice.
*Restricted use only.
417
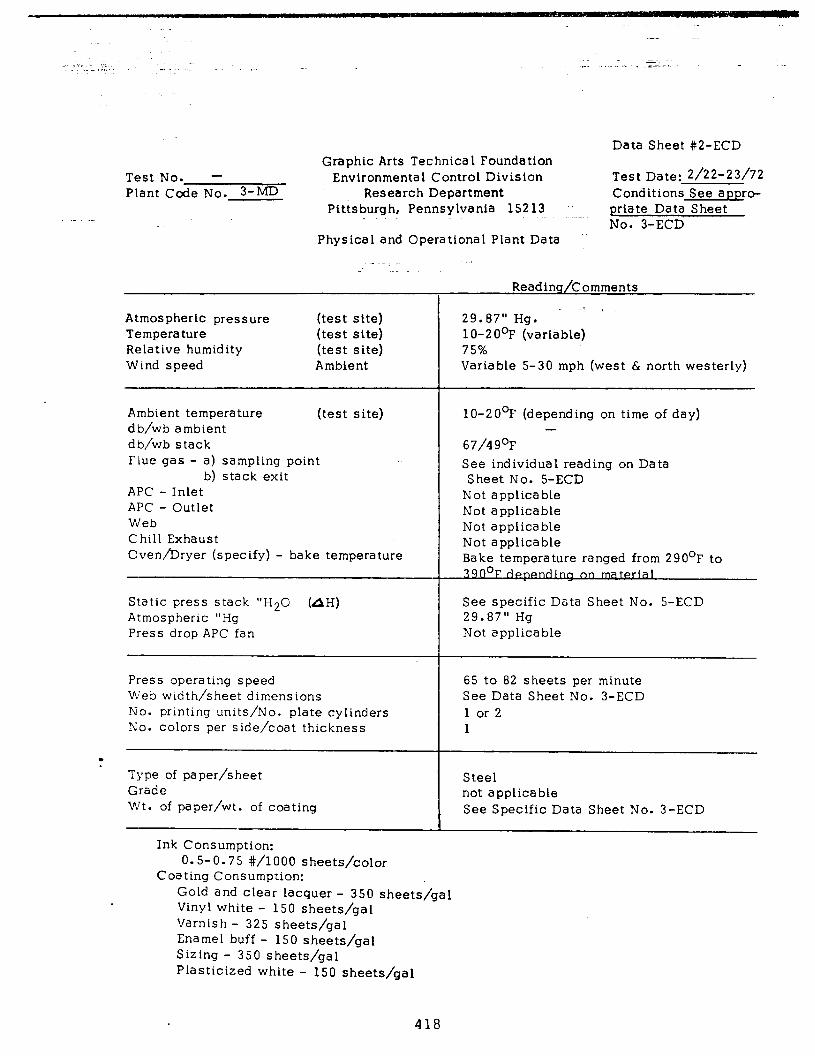
Data Sheet #2-ECD
Test No. - Plant Code No. 3-MD
Graphic Arts Technical Foundation Environmental Control Division
Research Department Pittsburgh, Pennsylvania 15213
Test Date: 2/22-23/72 Conditions See appro- priate Data Sheet No. 3-ECD
Physical and Operational Plant Data .,~
_’
Atmospheric pressure Temperature Relative humidity Wind speed
(test site) (test site) (test site) Ambient
29.87” Hg. - ’ lo-20°F (variable) 75% Variable S-30 mph (west & north westerly)
Ambient temperature (test site) db/wb ambient db/wb stack Fiue gas - a) sampling point
b) stack exit APC - Inlet APC - Outlet Web Chill Exhaust Oven/Dryer (specify) - bake temperature
lo-20°F (depending on time of day) -
67/49’F See individual reading on Data Sheet No. 5-ECD
Not applicable Not applicable Not applicable Not applicable Bake temperature ranged from 290°F to
Static press stack “H20 (AH) Atmospheric “Hg Press drop APC fan
See specific Data Sheet No. 5-ECD 29.87” Hg Not applicable
Press operating speed 65 to 82 sheets per minute Web width/sheet dimensions See Data Sheet No. 3-ECD No. printing units/No. plate cylinders 1 or 2 No. colors per side/coat thickness 1
. Type of paper/sheet Grade
Steel not applicable
Wt. of paper/wt. of coating See Specific Data Sheet No. 3-ECD
Ink Consumption: 0.5-0.75 #/lo00 sheets/color
Coating Consumption: Gold and clear lacquer - 350 sheets/gal Vinyl white - 150 sheets/gal Varnish - 325 sheets/gal Enamel buff - 150 sheets/gal Sizing - 350 sheets/gal Plasticized white - 150 sheets/gal
Reading/Comments
418

Graphic Arts Technical Foundation Environmental Control Division
Research Department Pittsburgh, Pennsylvania 15213
Data Sheet #3-ECD
Plant Code No. 3-MD
Sample #
#l #2
#3 #4
#9 #lO
#7 #8
#S #6
Time
30-9:45 15 min
:30-10:45 15 min
:oo-11:lS 15 min
:30-11:45 15 min
:45-2:00 15 min
Effluent Sampling Data
Date: Feb. 22, 1972
Period Probe ‘onfiguratlon
‘erpendicular and inserted to center of stack diameter
Same as above
Same as 3 bove
Same as above
Same as above
419
Comments
Duplicate samples of a gold lacquer, film wt. 5.5 mg/4 sq in (P5.23%) solvent.
Press speed - 82 s heets/min Sheet size - 876.02 sq in Oven cap. - 800 sheets
Line No. E
Duplicate samples of a vinyl white coating, film wt. 41.5 mg/4 sq(62.66%) Press speed - 82 s heets/min Sheet Dimensions - same as above Oven cap. - 1200 sheets
Line No. F
Duplicate samples of a l-color (red) lithography (15%) with no varnish application.
Press speed - 66 sheets/min Sheet dimensions - 827.22 sq in Cven cap. - 1700 sheets
Line No. B
Duplicate samples of a l-color (red) lithography w/varnish application. Film wt. 11.0 mg/4 sq in (61.76%) Press speed - 65 sheets/min Sheet dimen. - 714.91 sq in
Line No. A
Iuplicate samples of a 2-color (black & blue) lithography (15%) w/no varnish application
Press speed - 65 sheets/min Sheet dimen. - 645.72 sq in
Line No. A
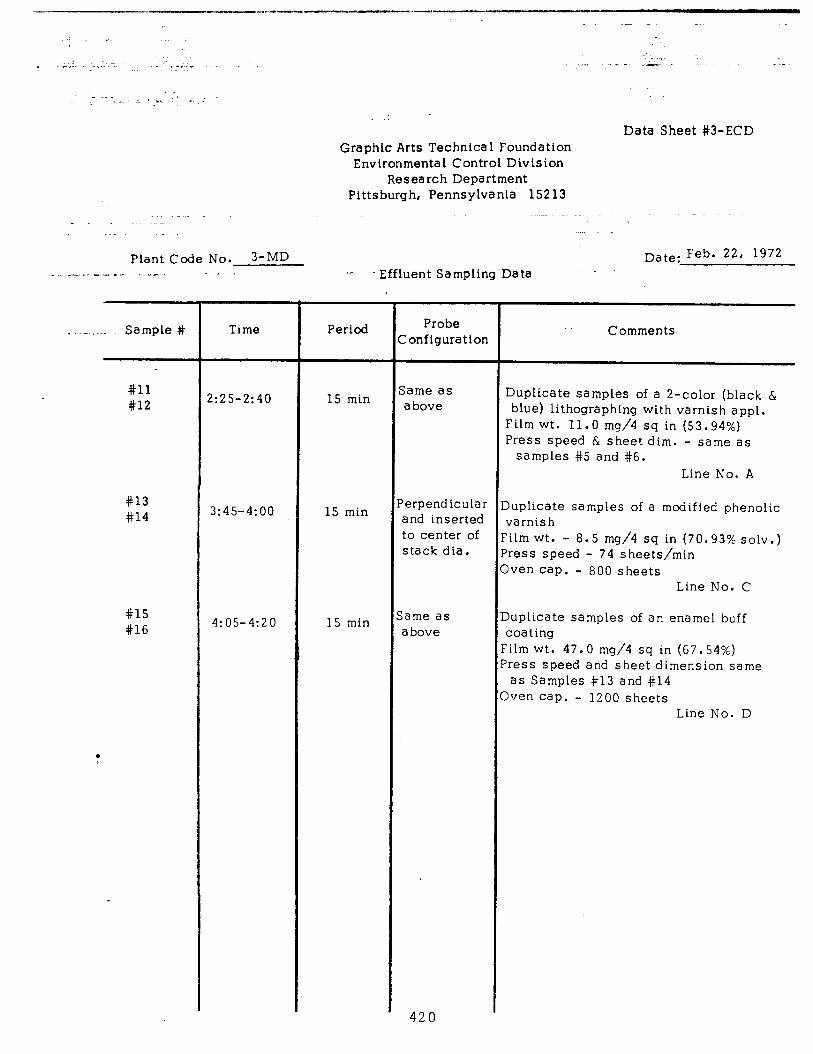
-- ---------Is*-.-.L . . . -._I_-- -1111
:
~1 -L. _- . _ - --.~ _ .- . _“._. ~. .- .~ __,. __ . _*_. -.
. i - 2. ! -a- : .-
.
Graphic Arts Technica 1 Foundation Environmental Control Division
Research Department Pittsburgh, Pennsylvania 15213
Data Sheet #3-ECD
Plant Code No. 3-MD _ _I_ . - I . . . - . .
. .
Date: Feb. 22, 1972 ,.- - Effluent Sampling Data
. -. . Sample #
#ll #12
#13 #14
#lS #16
.
Time
!:25-2:40 15 min
3:45-4:oo 15 min
4:05-4:20 15 min
Period Probe Zonfiguration
Same as above
‘erpend icular and inserted to center of stack dia.
iame as above
420
Comments
3uplicate samples of a 2-color (black & blue) lithographing with varnish appl.
?ilm wt. 11.0 mg/4 sq in (53.94%) ?ress speed 6 sheet dim. - same as
samples #5 and #S. Line No. A
juplicate samples of a modified phenolic Jarnis h ilm wt. - 8.5 mg/4 sq in (70.93% solv.) ress speed - 74 s heets/min 1ver-i cap. - 800 sheets
Line No. C
Uplicate samples of an enamel buff 3oa ting ilm wt. 47.0 mg/4 sq in (67.54%) ress speed and sheet dimension same as Samples #13 and #14 iven cap. - 1200 sheets
Line No. D
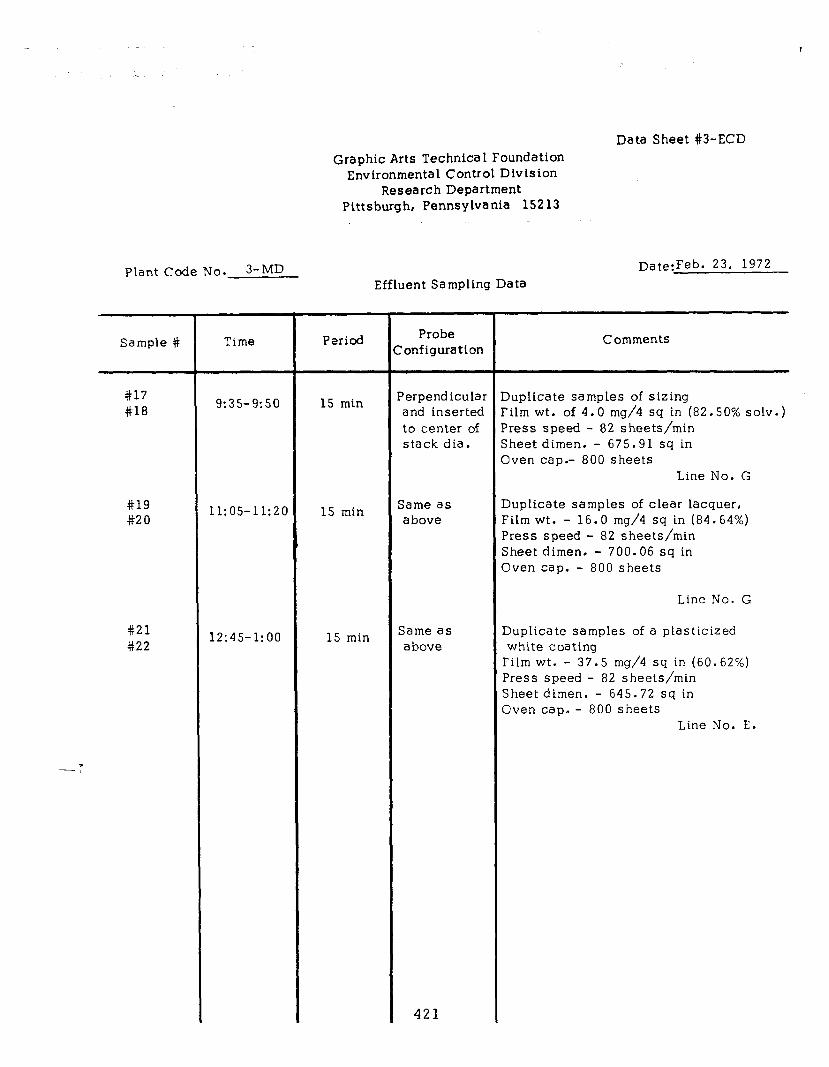
Data Sheet #3-ECD Graphic Arts Technica 1 Foundation
Environmental Control Divtsion Research Department
Pittsburgh, Pennsylvania 152 13
Plant Code No. 3-MD
Sample #
#17 #18
#19 #20
#21 #22
----:
Time
9:35-9:so
11:05-11:20
12:45-1:oo
Date:Feb. 23, 1972
Effluent Sampling Data
Period
15 min
15 min
15 min
Probe Ionfiguration
Perpendicular and inserted to center of stack dia.
Same as above
Same as above
421
Comments
Duplicate samples of sizing Film wt. of 4.0 mg/4 sq in (82.50% solv.) Press speed - 82 s heets/min Sheet dimen. - 675.91 sq in Oven cap.- 800 sheets
Line No. G
Duplicate samples of clear lacquer, Film wt. - 16.0 mg/4 sq in (84.64%) Press speed - 82 sheets/min Sheet dimen. - 700.06 sq in Oven cap. - 800 sheets
Line No. G
Duplicate samples of a plasticized white coating
Film wt. - 37.5 mg/4 sq in (60.62%) Press speed - 82 s heets/min Sheet dimen. - 645.72 sq in Oven cap. - 800 sheets
Line No. E.
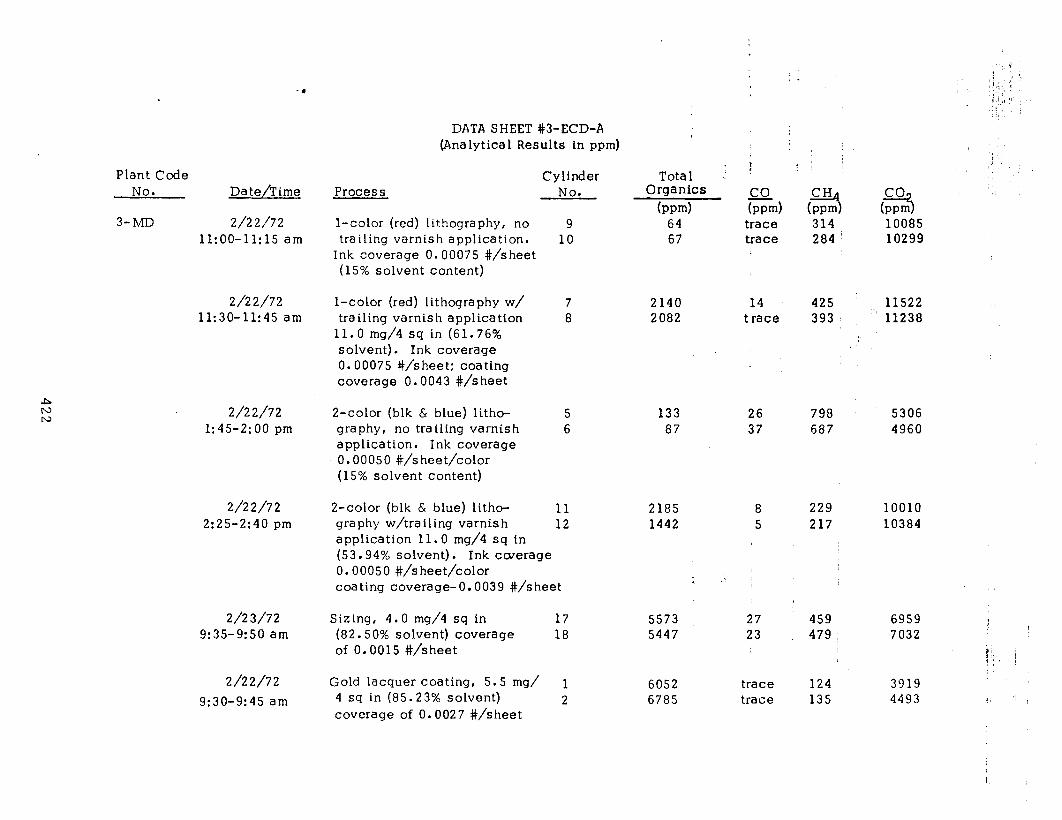
Plant Code No.
3-MD
Da te/T ime
2/22/72 ll:OO-11:15 am
2/22/72 11:30-11:45 am
2/2 2/72 1:45-2:OO pm
2/22/72 2:25-2:40 pm
2/23/72 9:35-9:50 am
2/22/72
9:30-9:45 am
DATA SHEET #3-ECD-A (Ana lytica 1 Results in ppm)
Process Cylinder
No.
l-color (red) lithography, no trailing varnish application.
Ink coverage 0.00075 #/sheet (15% solvent content)
l-color (red) lithography w/ trailing varnish application
11.0 mg/4 sq in (61.76% solvent). Ink coverage 0.00075 #/sheet: coating coverage 0.0043 #/sheet
2-color (blk & blue) litho- graphy, no trailing varnish application. Ink coverage 0.00050 #/sheet/color (15% solvent content)
2-color (blk & blue) litho- graphy w/trailing varnish application 11.0 mg/4 sq in
9 10
bpm)
64 67
trace 314 trace 284
(3 10085 10299
7 2140 14 425 11522 8 2082 trace 393 11238
5 133 26 798 5306 6 87 37 687 4960
11 2185 8 229 10010 12 1442 5 217 10384
(53.94% solvent). Ink cwerage 0.00050 #/sheet/color coating coverage-O.0039 #/sheet
Sizing, 4.0 mg/4 sq in (82.50% solvent) coverage of 0.0015 #/sheet
17 5573 18 5447
Gold lacquer coating, 5.5 mg/ 1 4 sq in (85.23% solvent) 2 coverage of 0.0027 #/sheet
6052 trace 124 3919 6785 trace 135 4493
Tota 1 Organics
27 459 23 479
6959 7032
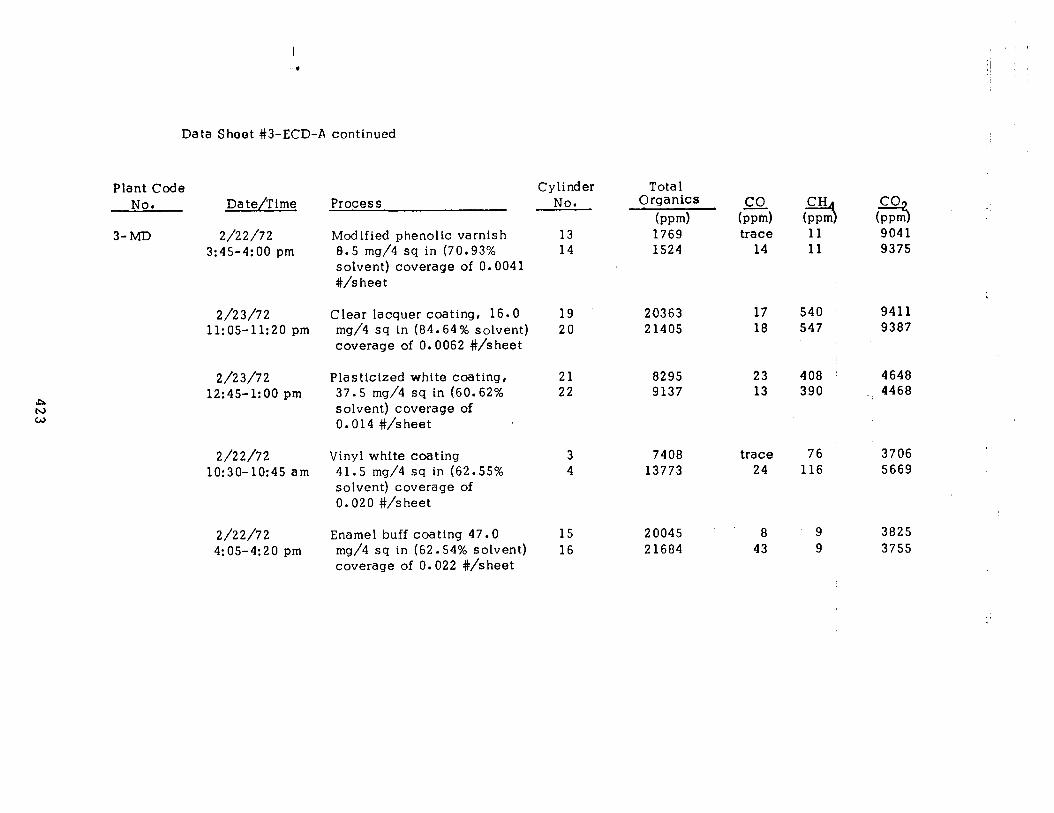
I -a
Data Sheet #3-ECD-A continued
4 h) W
Plant Code No. Date/TLme
3-MD 2/22/72 3:45-4:OO pm
2/23/72 11:05-11:20 pm
2/23/72 12:45-1:OO pm
2/22/72 10:30-lo:45 am
2/22/72 4:05-4:20 pm
Process Cylinder Tota 1
No. Organics
Modified phenolic varnish 8.5 mg/4 sq in (70.93% solvent) coverage of 0.004 1 #/sheet
Clear lacquer coating, 16.0 mg/4 sq in (84.64% solvent) coverage of 0.0062 #/sheet
Plasticized white coating, 37.5 mg/4 sq in (60.62% solvent) coverage of 0.014 #/sheet
Vinyl white coating 41.5 mg/4 sq in (62.55% solvent) coverage of 0.020 #/sheet
Enamel buff coating 47.0 mg/4 sq in (62.54% solvent) coverage of 0.022 #/sheet
13 14
19 20363 17 540 9411 20 21405 18 547 9387
21 22
3 4
15 20045 a 9 3825 16 21684 43 9 3755
bpd
1769 1524
8295 23 408 4648 9137 13 390 4468
7408 trace 76 3706 13773 24 116 5669
trace 14
(3 9041 9375
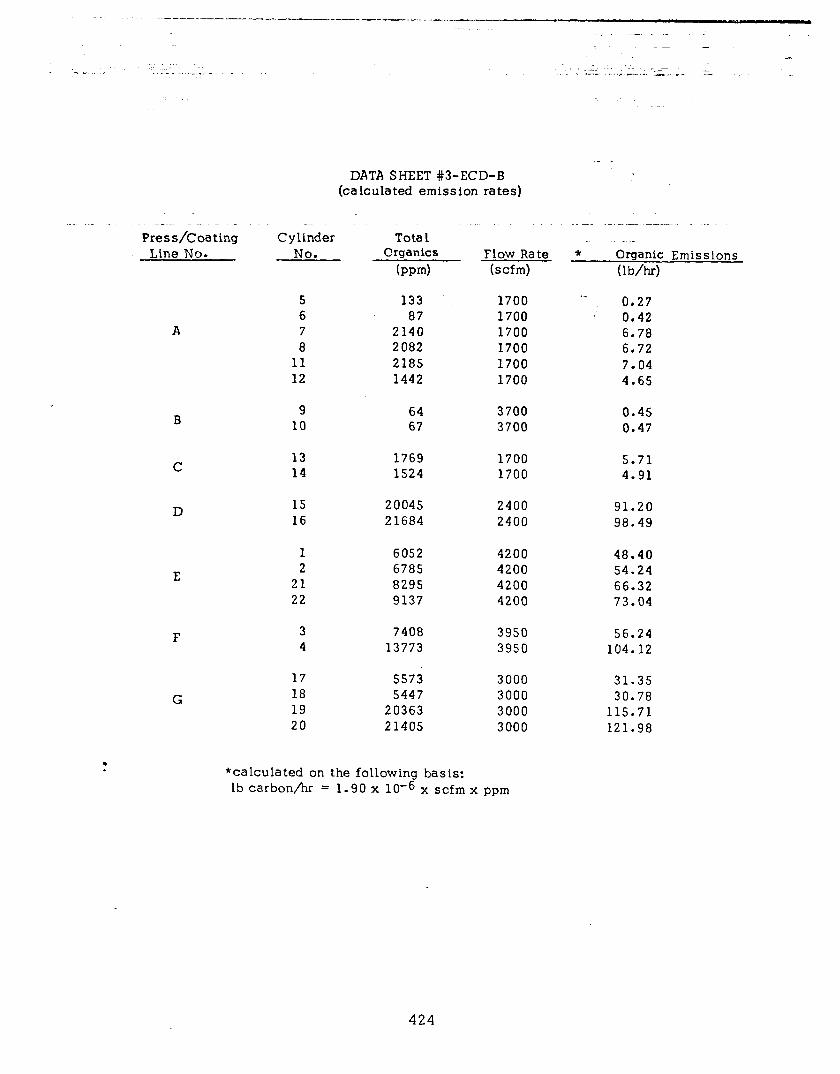
-----------I-.---..--.---. “,--.--.m- -..-.. -..,_.(l--.-.-,“ll.---.,.---
:.
. .
. .;. . . .;;. _ .
- ~. ~_; -~
I--_ L ..- r.____. _ __ -.- -
DATA SHEET #3-ECD-B (calculated emission rates)
.- -
Press/Coating Cylinder Line No. No.
Tota 1 Organics
(rvm)
Flow Rate * (scfm)
_ _ Organic Emissions (lb/hr)
5 133 1700 .- 0.27 6 87 1700 0.42
A 7 2140 1700 6.78 8 2082 1700 6.72
11 2185 1700 7.04 12 1442 1700 4.65
B
C
D
G
9 64 3700 0.45 10 67 3700 0.47
13 1769 1700 5.71 14 1524 1700 4.91
15 20045 2400 91.20 16 21684 2400 98.49
1 6052 4200 48.40 2 6785 4200 54.24
21 8295 4200 66.32 22 9137 4200 73.04
3 4
7408 13773
17 5573 3000 31.35 18 5447 3000 30.78 19 20363 3000 115.71 20 21405 3000 121.98
3950 3950
56.24 104.12
*calculated on the following basis: lb carbon/hr = 1.90 x 10e6 x scfm x ppm
424
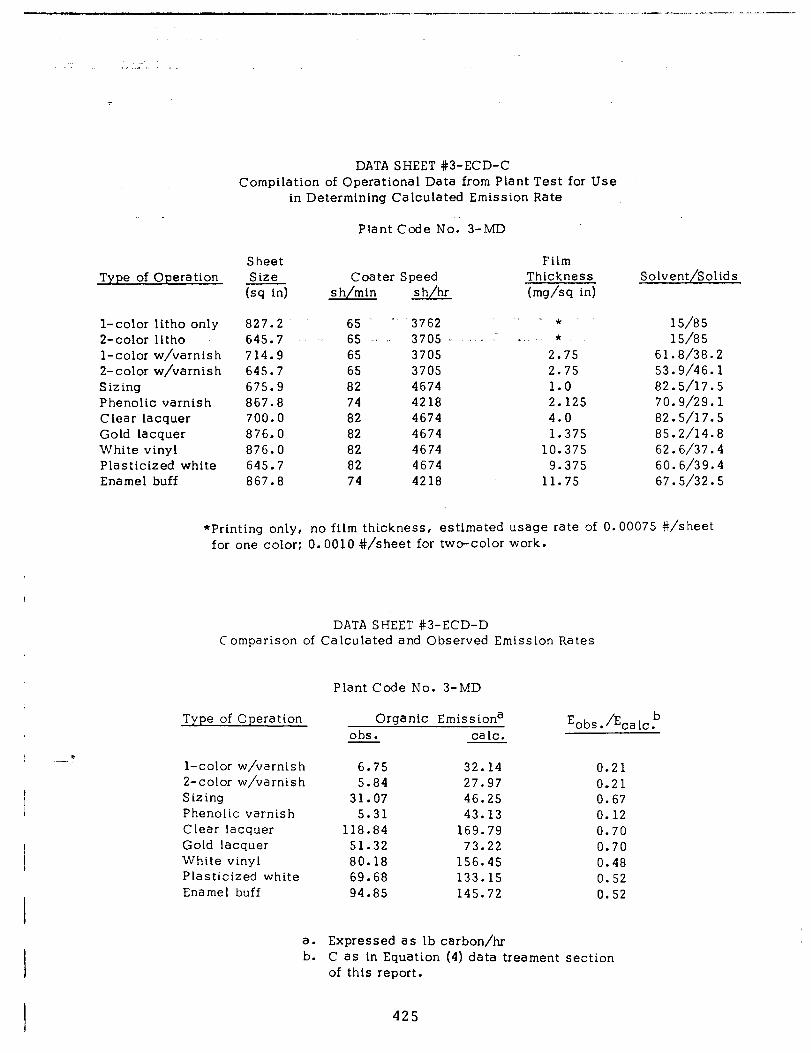
Type of Operation
l-color litho only 827.2 65 ’ 3762 Z-color litho 645.7 65 . . . 3705 ” l-color w/varnish 714.9 65 3705 2-color w/varnish 645.7 65 3705 Sizing 675.9 82 4674 Phenolic varnish 867.8 74 4218 Clear lacquer 700.0 82 4674 Gold lacquer 876.0 82 4674 White vinyl 876.0 82 4674 Plasticized white 645.7 82 4674 Enamel buff 867.8 74 4218
DATA SHEET #3-ECD-C Compilation of Operational Data from Plant Test for Use
in Determining Calculated Emission Rate
Plant Code No: 3-MD
Sheet Size
h in) Coater Speed
h/min s h/hr s
Film Thickness (mg/sq id
” - *
-... *
2.75 2.75 1.0 2.125 4.0 1.375
10.375 9.375
11.75
Solvent/Solids
15/85 15/85
61.8/38.2 53.9/46.1 82.5/17.5 70.9/29.1 82.5/17.5 85.2/14.8 62.6/37.4 60.6/39.4 67.5/32.5
*Printing only, no film thickness, estimated usage rate of 0.00075 #/sheet for one color; 0.0010 #/sheet for two-color work.
DATA SHEET #3-ECD-D Comparison of Calculated and Observed Emission Rates
Plant Code No. 3-MD
Type of Operation
l-color w/varnish 6.75 32.14 0.21 2-color w/varnish 5.84 27.97 0.21 Sizing 31.07 46.25 0.67 Phenolic varnish 5.31 43.13 0.12 Clear lacquer 118.84 169.79 0.70 Gold lacquer 51.32 73.22 0.70 White vinyl 80.18 156.45 0.48 Plasticized white 69.68 133.15 0.52 Ena me 1 buff 94.85 145.72 0.52
a. b.
Organic Emissiona obs. talc.
E obs .iEca 1cb
Expressed as lb carbon/hr C as in Equation (4) data treament section of this report.
425

t
Test No.: 1 Graphic Arts Technical Foundation Plant Code No.: ~-MD Environmental Control Division Sampling Location Research Department-
Llne A Pitt&burgh, Pennsylvania 15213
Data Sheet Its-ECD
Date: Feb. 22, 1972 GATF Personnel:
R. R. Gadomski A. V. Gimbrone
Gas Velocity Data
A. B. C. D.
. E. F.
G.
H.
I.
J- K.
l 170 23.5 170 24.9
Av. velocity (‘raverse) ft/sec 24.2 Av. velocity (ref. pt.) ft/sec n/a Flue factor A/B n/a Pitot Tube correction factor(if any) none
Gas density factory(ref. to air) 1.0 Corrected velocity Bx C x D x E ft/sec 24.2 Area of flue, sq. ft. 1.38 Av. flue temp. OF 170
Flow rate @ stack cond.
FxGx60, acfm P, = 29.87
Corrected to std. cond.
2 100
Flow rate = 520 x I x P, H + 460 x 29.92
, scfm 1700
765.32 1 765.32 1
Static (AH) “H20 = 0.02 Pg = - AH/l3.6 = 0 Patm “Hg = 29.87
‘S = patm - Pg = 29.87
426
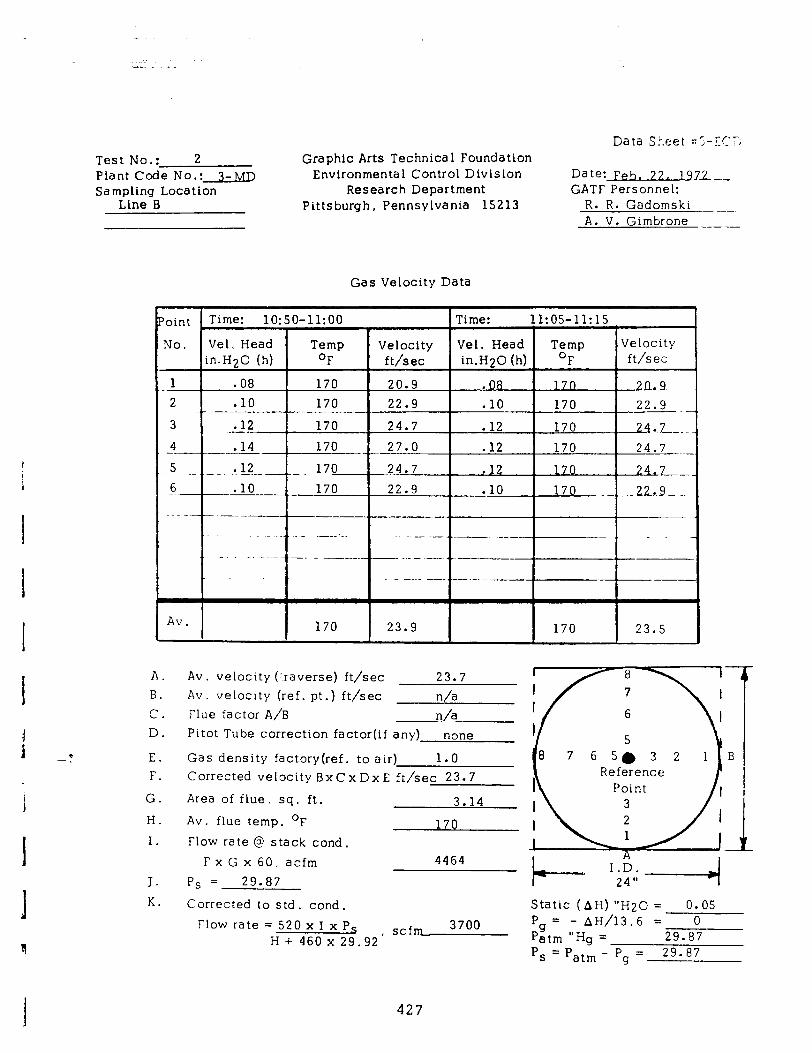
I
Test No.: 2 Plant Code No.: 3-m Sampling Location
Line B
--
Graphic Arts Technical Foundation Environmental Control Division
Research Department Pittsburgh, Pennsylvania 15213
Data Stieet =;-ECr,
Date: Feb. 72, 1972 GATF Personnel:
R. R. Gadomski A. V. Gimbrone
Gas Velocity Data
A. B. C. D.
E. F.
G.
H.
I.
J
Av. velocity (:.raverse) ft/sec 23.7 Av. velocity (ref. pt.) ft/sec n/a Flue factor A/B ---2n/a Pitot Tube correction factor(if any) none
Gas density factory(ref. to air) 1.0 Corrected velocity BxCxDxE ft/sec 23.7
Area of flue, sq. ft. 3.14 Av. flue temp. OF 170 Flow rate @ stack cond.
FxGx60. acfm Ps = 29.87
4464
1 8 I 7
5 7 6 5@ 3 2
Reference Point
K. Corrected to std. cond. Static (AH) “H20 = 0.05 Flow rate = 520 x I x Ps scfm 3700 Pg = - AH/13.6 = 0
H + 460 x 29.92’ Patm “Hg = 29.87 P, = Patm - Pg = 29.87
I 427
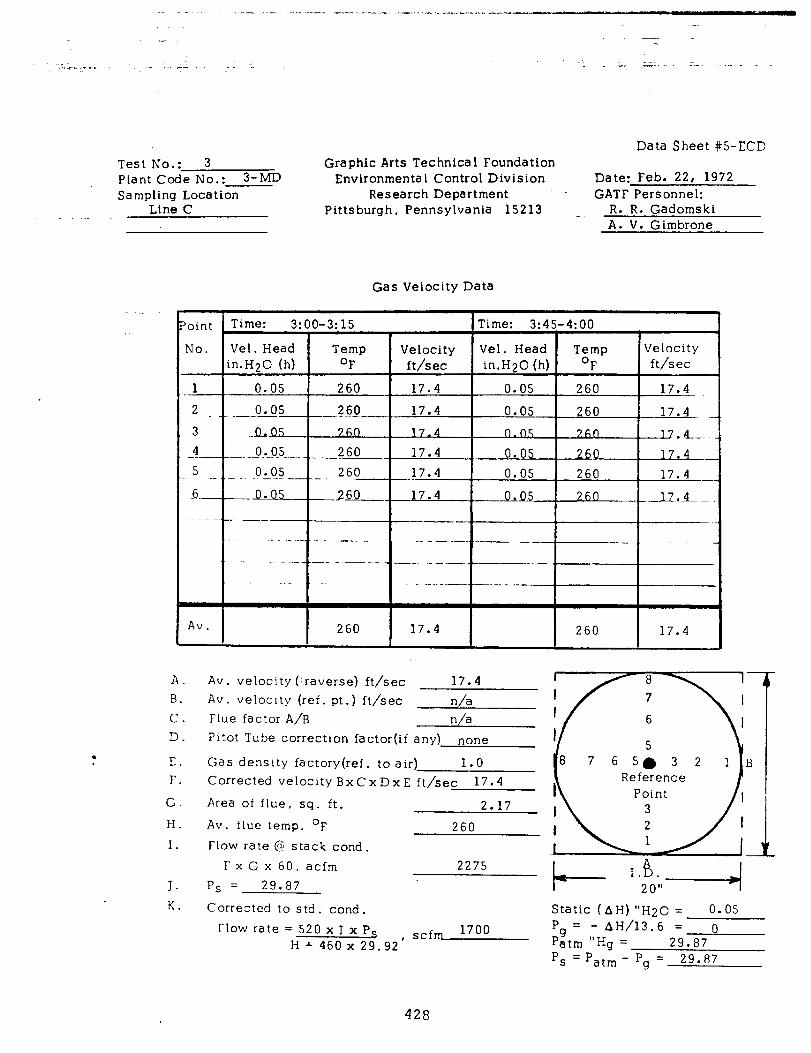
Test No.: 3 Plant Code No.: 3-MD Sampling Location
Ltne C
Data Sheet #5-ECD Graphic Arts Technica 1 Foundation
Environmental Control Division Date: Feb. 22, 1972 Research Department GATF Personnel:
Pittsburgh, Pennsylvania 15213 _ R. R. Gadomski A. V. Gimbrone
Gas Velocity Data
A. Av. velocity (‘raverse) ft/sec 17.4 B. Av. velocity (ref. pt.) ft/sec n/a C. Flue factor A/B n/a D. Pitot Tube correction factor(if any) none
E. Gas density factory(ref. to air) 1.0 F. Corrected velocity BxCxDxE ft/sec 17.4
G. Area of flue, sq. ft. 2.17 H. Av. flue temp. OF 260 I. Flow rate @ stack cond.
J- K.
F x G x 60, acfm P, = 29.87
Corrected to std. cond.
2275
Flow rate = 520 x I x P, H + 460 x 29.92’
scfm 1700
Static (AH) “I-I20 = 0.05 Pg = - AHh3.6 = 0 Patm “Hg = 29.87 ‘S = patm - pg = 29.87
428
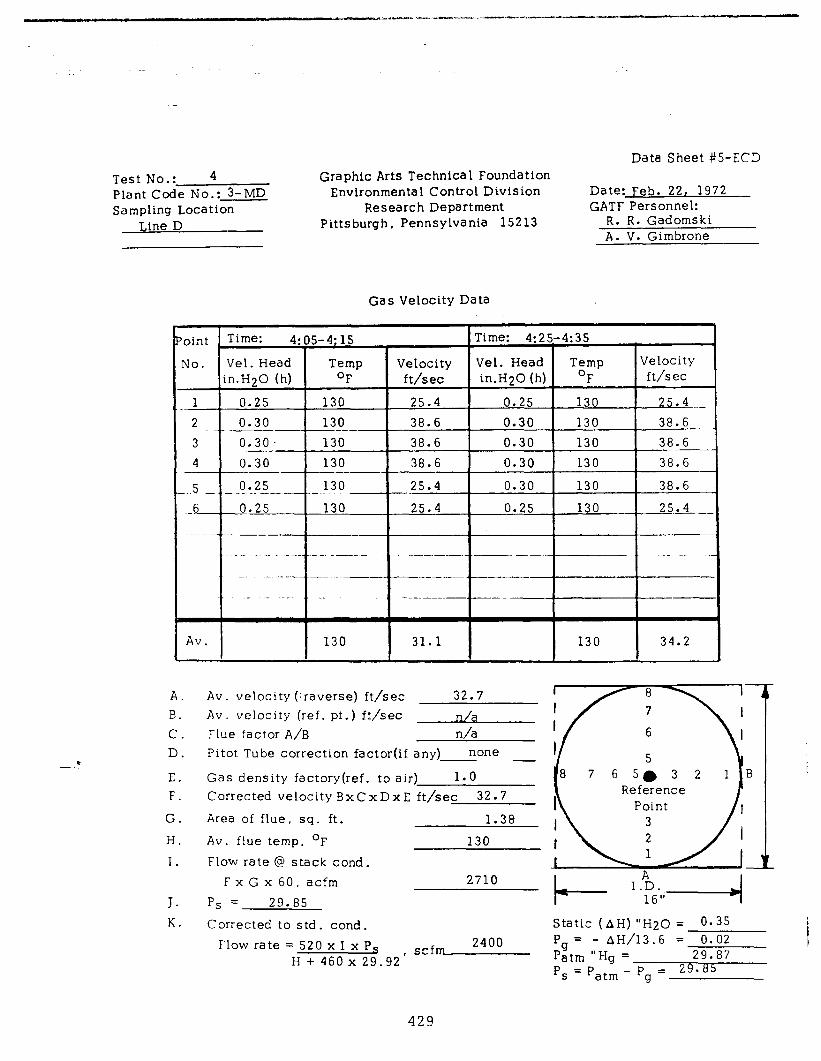
Test No.: 4 Graphic Arts Technical Foundation Plant Code No.: 3-MD Environmental Control Division Sampling Location Research Department
Line D Pittsburgh, Pennsylvania 15213
Data Sheet PS-ECD
Date: Feb. 22, 1972 GATF Personnel:
R. R. Gadomski A. V. Gimbrone
Gas Velocity Data
oint Time: 4:05-4:15
\JO. Vel. Head Temp in.H20 (h) OF
1 0.25 130 2 0.30 130 - .__ _--- --- 3 0.30. 130 4 0.. 30 130 ---
. ..5 _0,25-- -- .- -_-- 130
-6 0.25 130
Time: 4:25.-4:35
Velocity Vel. Head Temp ft/sec in.H20 (h) OF
25.4 0.25 130 38.6 0.30 130
38.6 0.30 130
38.6 0.30 130
25.4 0.30 130
25.4 0.25 130
Velocity ft/sec
25.4 .._ 38.6 __
38.6 -_- 38.6
38.6
2 5.L.
-.-._-.-.-_-
Av. 130 31.1 130 34.2
A. B. c. D.
E. F.
G.
H.
I.
J- K.
Av. velocity (raverse) ft/sec Av. velocity (ref. pt.) ft/sec Flue factor A/B Pitot Tube correction factor(if any) none
Gas density factory(ref. to air) Corrected velocity Bx C x D x E ft/sec Reference
Area of flue, sq. ft.
Av. flue temp. OF
Flow rate @ stack cond.
FxGx60, acfm
Ps = 29.85
Corrected to std. cond.
2710 A
Flow rate = 520 x I x Ps , scfrrl-z%- H + 460 x 29.92
Static (AH) “I320 = 0.35 Pg = - AH/13.6 = 0.02 Patm “Hg = 29.87 P, = Pat, - Pg = 29.85
429
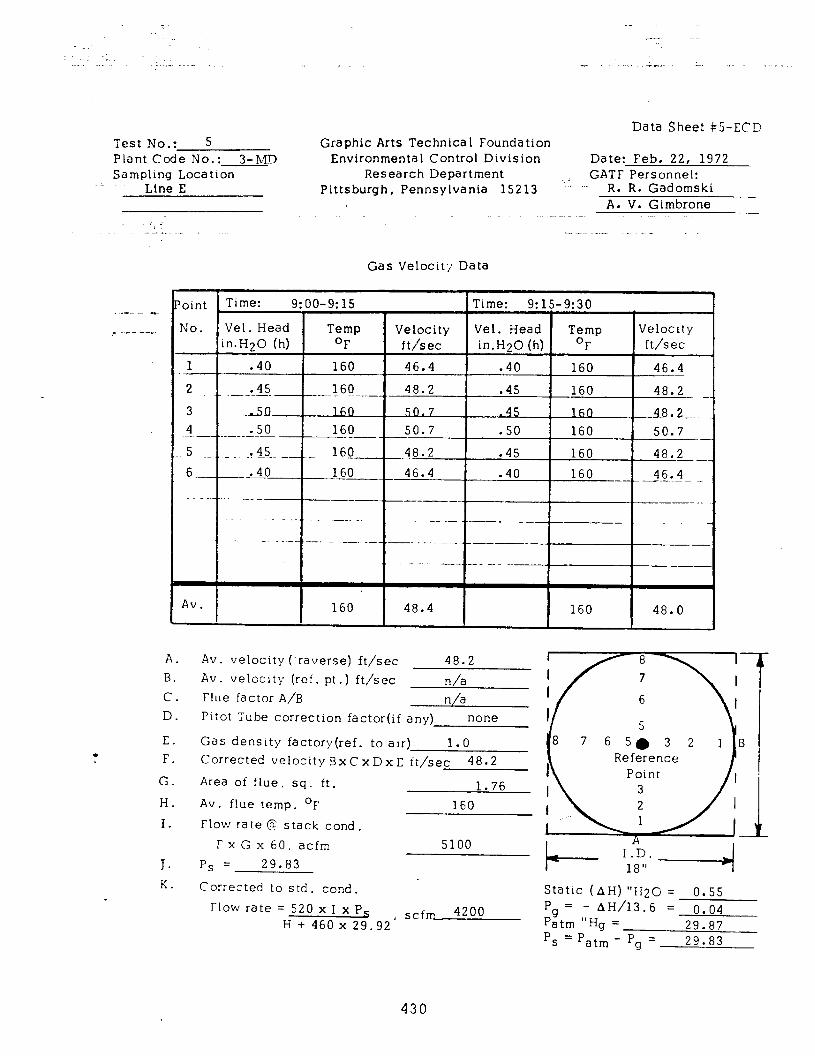
Test No.: 5 Plant Code No.: 3-MD Sampling Location
Line E
Data Sheet #5-ECC Graphic Arts Technical Foundation
Environmental Control Division Date: Feb. 22, 1972 Research Department
Pittsburgh, Pennsylvania 15213 Y’~ ... GATF Personnel:
R. R. Gadomski A. V. Gimbrone
i .
Gas Velocity Data
,- I.- --“_
‘oint Time: 9:00-9: 15 Time: 9: 15-9:30 ,
No. Vel. Head Temp Velocity Vet. Head Temp Velocity in.H20 (h) OF ftjs ec in.H20 (h) OF ft/s ec
1 .40 160 46.4 .40 160 46.4
2 .._ w-45 -160 48.2 .45 160 48.2 ____ _
3 AD 160 50.7 45 160 48. 2-m 4 .50 160 50.7 . 50 160 50.7 ---
5 ._ - _ : $5.. __I._ 16_0 ..38.2 .45 160 48.2-
5 ,40 160 46.4 .40 ---_- 160 .A&?- _
----_--_- -___ _ --- .-. _ ._-_ __ -
Av. 160 48.4 160 48.0
A. B. C. D.
E. . F.
G.
H.
I.
J. K.
Av. velocity (.raverse) ft/sec 48.2 Av. velocity (ref. pt.) ft/sec n/a Flue factor A/B n/a Pitot Tube correction factor(if any) none
Gas density factory(ref. to air) 1.0 Corrected velocity Bx C x D x E ft/sec 48.2
Area of flue, sq. ft. 1.76 Av. flue temp. OF 160 FLOW rate @ stack cond.
Fx G x 60, acfm P, = 29.83
Corrected to std. cond.
5100
rlow rate = 520 x I x P, scf 4200 H + 460 x 29.92’
Reference
Static (AH) “H20 = 0.55 Pg = - AH/13.6 = 0.04 Patm “Hg = 29.87 P, = Patm - Pg = 29.83
430
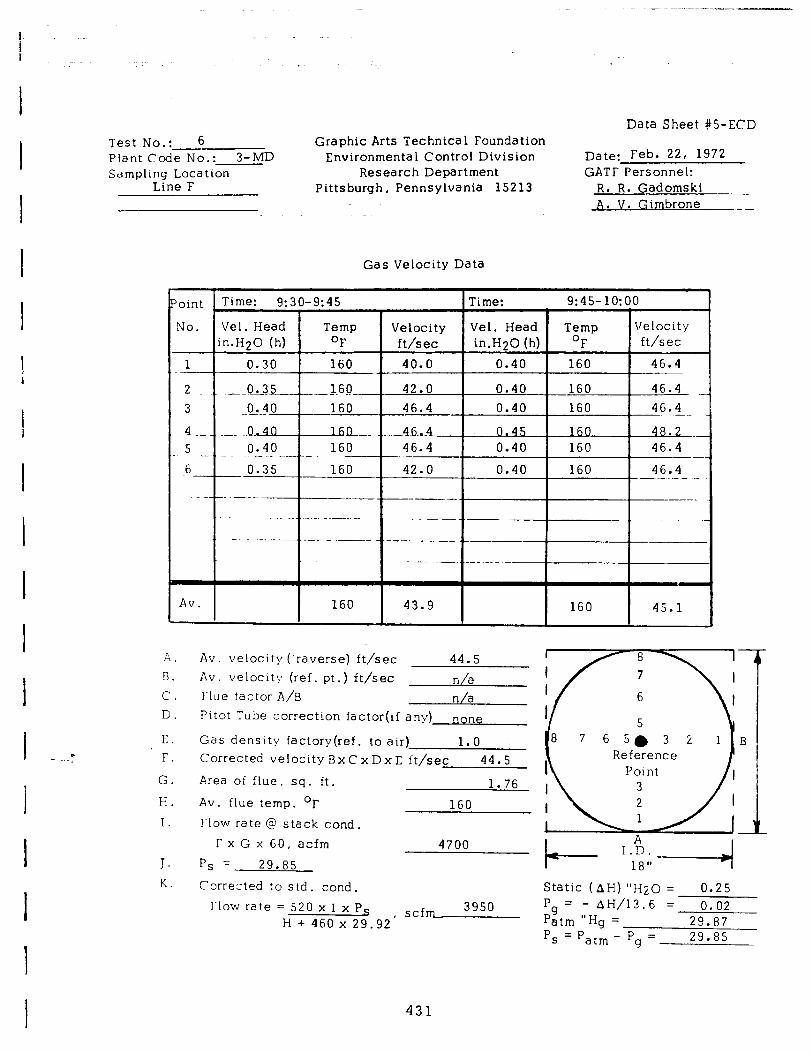
I I I I I I 1 I I I I I I I 1 I I 1 I
Test No.: 6 Plant Code No.: 3-MD Sampling Location
Line F
Graphic Arts Technical Foundation Environmental Control Division
Research Department Pittsburgh, Pennsylvania 15213
Data Sheet #5-ECD
Date: Feb. 22, 1972 GATF Personnel:
R. R. Gadomski A. V. Gimbrone
Gas Velocity Data
A. B. c. 0.
E. F.
G.
H.
I.
J. K.
‘oint Time: 9:30-9:45
No. Vel. Head Temp in.H20 (h) OF
1 0.30 160
2 ,- --0,35 --_l6OL- 3 &4 0 160
._4--...--.-!I. 16&-w- 5 0.40 160 ._. .-- -_-----. -_ 6 0.35 160
---_
1 Time:
43.9 I I 160 I 45.1
Av. velocity (‘raverse) ft/sec 44.5 Av. velocity (ref. pt .) ft/sec n/a Flue factor A/B n/a
I 8 I 7 I 6
Pitot Tube correction factor(if any) none I 5
Gas density factory(ref. to air) 1.0 8 765.32 1 B Corrected velocity Bx C x Dx E ft/sec
Area of flue, sq. ft.
Av. flue temp. OF 160 Flow rate @ stack cond.
FxGx60, acfm 4700 P, = 29.85
Corrected to std. cond. Static (AH) “H20 = 0.25 Plow rate = 520 x I x P, , scfm 3950 Pg = - AH/13.6 = 0.02
H + 460 x 29.92 Patm “Hg = 29.87 P, = Patm - Pg = 29.85
431
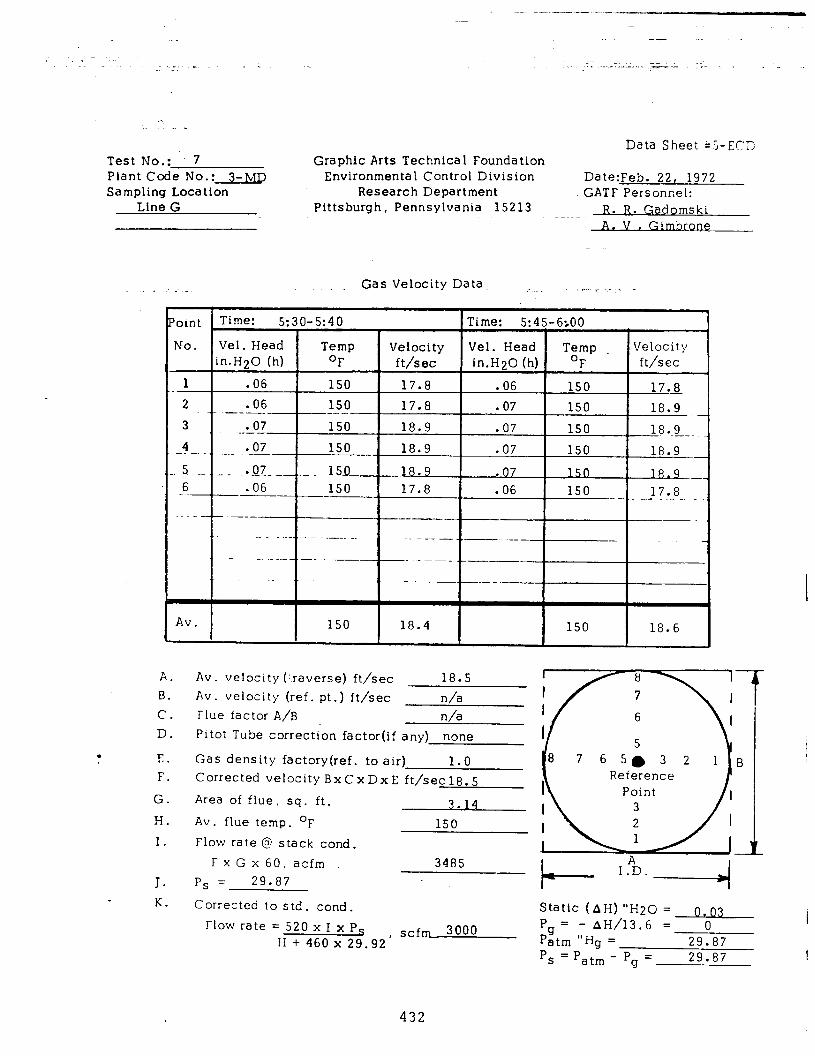
Test No.: 7 Plant Code No.: 3-b~ Sampling Location
Line G -
Data Sheet &S-EC? Graphic Arts Tee hnica 1 Foundation
Environmental Control Division Date:Feb. 2-2, 1972 Research Department GATF Personnel:
Pittsburgh, Pennsylvania 15213 R. R. C,adomski A. V . Gimh rOnep
_ Gas Velocity Data- _- ,... ,. __ . _
.
A. B. C. D.
E. F.
G.
H.
I.
J. K.
Av. velocity (‘raverse) ft/sec 18.5 Av. velocity (ref. pt.) ft/sec n/a Flue factor A/B n/a PItot Tube correction factor(if any) none
Gas density factory(ref. to air) 1.0 Corrected velocityBxCxDxE ft/sec18.5
Area of flue, sq. ft. 3 14 . Av. flue temp. OF 150 Flow rate @ stack cond.
Fx G x 60, acfm P, = 29.87
3485
Corrected to std. cond.
Flow rate = 520 x I x P, H + 460 x 29.92’
scfm 3000
432
Reference Point
/ i I
3
Static (AH) “H20 = Pg = - AH/13.6 = Patm “Hg = 29.87 P, = Patm - Pg = 29.87
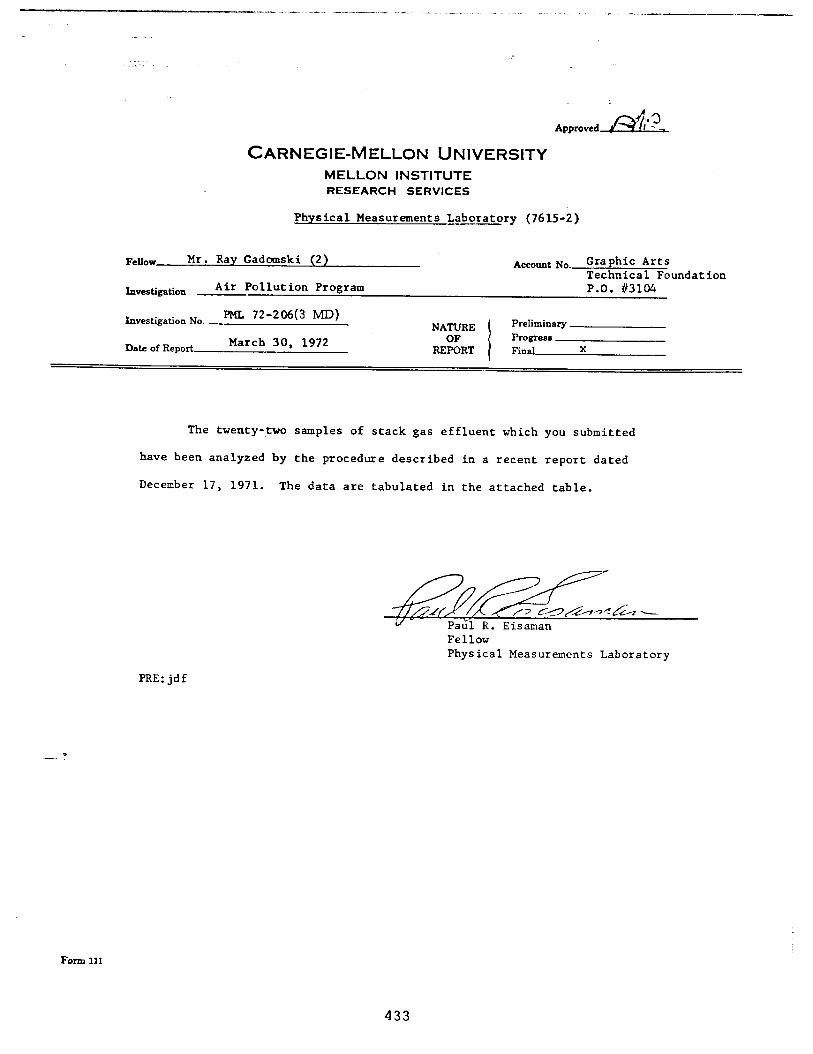
” 1-. . . ._ . . . - ._ - - -_._. -_* . . . . - . . I . I , * . ^, . . . - . ._-___-~____
CARNEGIE-MELLON UNIVERSITY MELLON INSTITUTE RESEARCH SERVICES
Physical Measurements Laboratory (7615-2)
Fellow Mr. Ray Gadomski (2)
InVtStigfltiOll Air Pollution Program
Account No. Graphic Arts Technical Foundation P.O. 413104
Investigation No. PMI. 72-206(3 MD) NATURE
Date of Report March 30, 1972 OF REPORT I
Preliminary progTC!SS Final X
The twenty-two samples of stack gas effluent which you submitted
have been analyzed by the procedure described in a recent report dated
December 17, 1971. The data are tabulated in the attached table.
Fellow Physical Measurements Laboratory
PRE:jdf
433
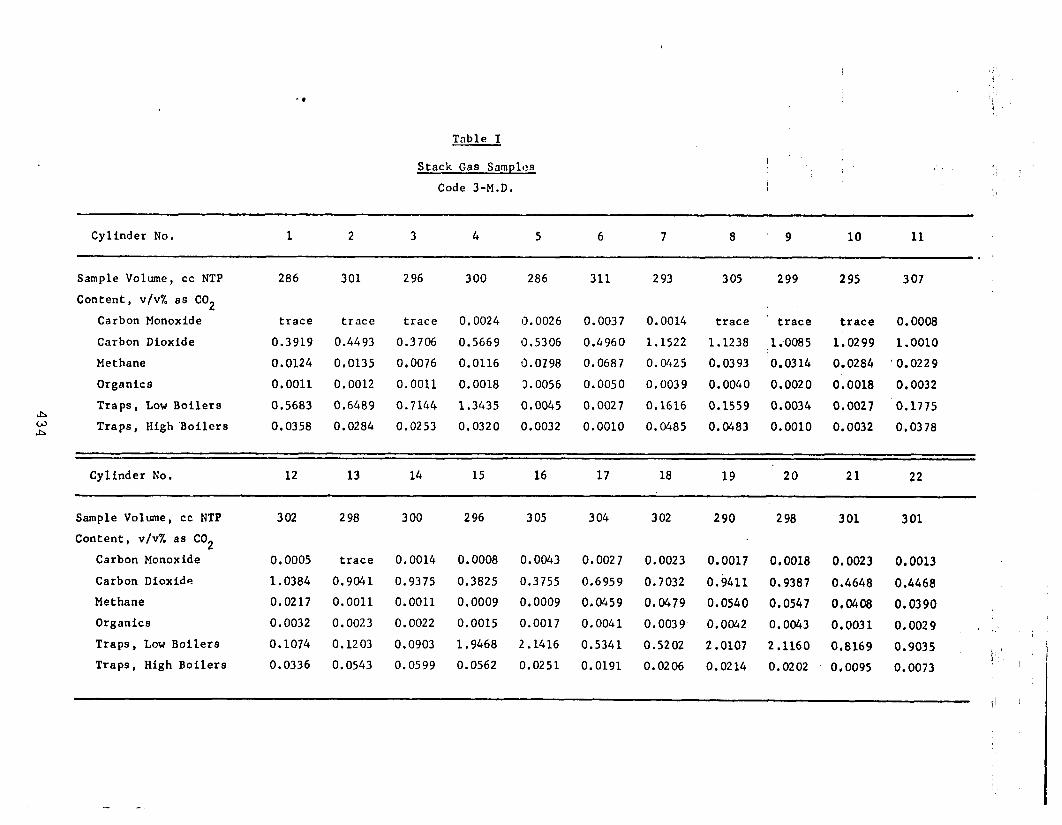
Table I
Stack Gas Samplrz I ‘,
Code 3-M.D. / :
Cylinder No. 1 2 3 4 5 6 7 8 9 10 11
.
Sample Volume, cc NTP 286 301 296 300 286 311 293 305 299 295 307
Content, v/v% as CO2
Carbon Monoxide trace trace trace 0.0024 11.0026 0.0037 0.0014 trace trace trace 0.0008
Carbon Dioxide 0.3919 0.4493 0.3706 0.5669 0.5306 0.4960 1.1522 1.1238 ,1.0085 lr0299 1.0010
Methane 0.0124 0.0135 0.0076 0.0116 9.0198 0.0687 0.0425 0.0393 0.0314 0.0284 1 0.0229
Organics 0.0011 0.0012 0.0011 0.0018 3.0056 0.0050 0.0039 0.0040 0.0020 0.0018 0.0032
h Traps, Low Boilers 0.5683 0.6489 0.7144 1.3435 0.0045 0.0027 0.1616 0.1559 0.0034 0.0021 0.1775
: Traps, High ‘Boilers 0.0358 0.0284 0.0253 0.0320 0.0032 0.0010 0.0485 0.0483 0.0010 0.0032 0.0378
Cylinder No. 12 13 14 15 16 17 18 19 20 21 22
Sample Volume, cc NTP
Content, v/v% a6 CO2
Carbon Monoxide
Carbon Dioxide
Methane
Organics
Traps, Low Boilers
Traps, High Boilers
302 298 300 296 305 304 302 290 298 301 301
0.0005 trace 0.0014 0.0008 0.0043 0.0027 0.0023 0.0017 0.0018 0.0023 0.0013
1.0384 0.9041 0.9375 0.3825 0.3755 0.6959 0.7032 0.9411 0.9387 0.4648 0.4468
0.0217 0.0011 0.0011 0.0009 0.0009 0.0459 0.0479 0.0540 0.0547 0.0408 0.0390
0.0032 0.0023 0.0022 0.0015 0.0017 0.0041 0.0039, 0.0042 0.0043 0.0031 0.0029
0.1074 0.1203 0.0903 1.9468 2.1416 0.5341 0.5202 2.0107 2.1160 0.8169 0.9035
0.0336 0.0543 0.0599 0.0562 0.0251 0.0191 0.0206 0.0214 0.0202 0,0095 0.0073
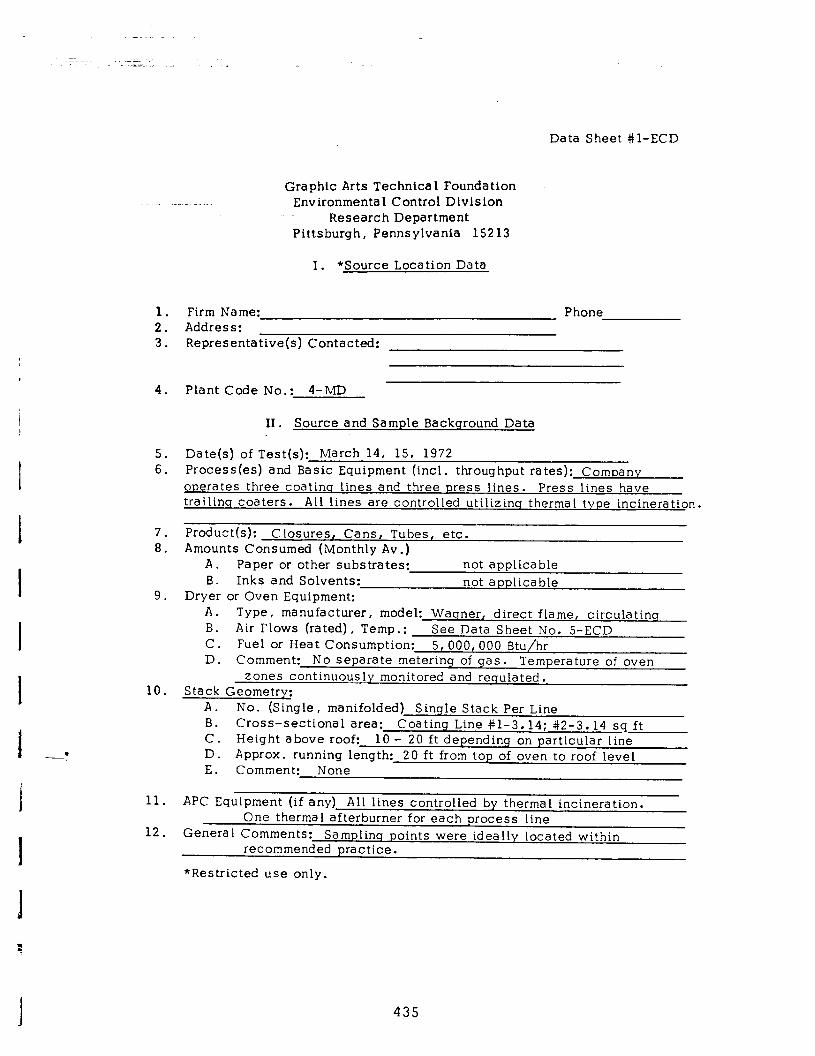
I . -,
Data Sheet #l-ECD
Graphic Arts Technica 1 Foundation Environmental Control Division
Research Department Pittsburgh, Pennsylvania 15213
I. *Source Location Data
1. Firm Name: Phone 2. Address: 3. Representative(s) Contacted:
4. Plant Code No.: 4-MD
II. Source and Sample Background Data
5. Date(s) of Test(s): March 14, 15, 1972 6. Process(es) and Basic Equipment (incl. throughput rates): Company
operates three coatins lines and three press lines. Press lines have trailinq coaters. All lines are controlled utilizinq thermal type incineration.
7. Product(s): Closures, Cans, Tubes, etc. 8. Amounts Consumed (Monthly Av .)
A. Paper or other substrates: not applicable B. Inks and Solvents: not applicable
9. Dryer or Oven Equipment: A. Type, manufacturer, model: Wasner, direct flame, circulatinq B. Air Flows (rated), Temp.: See Data Sheet No. 5-ECD C. Fuel or Heat Consumption: 5, 000,000 Btu/hr D. Comment: No separate metering of gas. Temperature of oven
zones continuously monitored and requlated. 10. Stack Geometry:
A. No. (Single, manifolded) Single Stack Per Line B. Cross-sectional area: Coating Line #l-3.14; #2-3.14 sq ft C. Height above roof: 10 - 20 ft depending on particular line D. Approx. running length: 20 ft from top of oven to roof level E. Comment: None
11. APC Equipment (if any) All lines controlled by thermal incineration. One thermal afterburner for each process line
12. General Comments: Samolinq points were ideally located within recommended practice.
*Restricted use only.
I 435
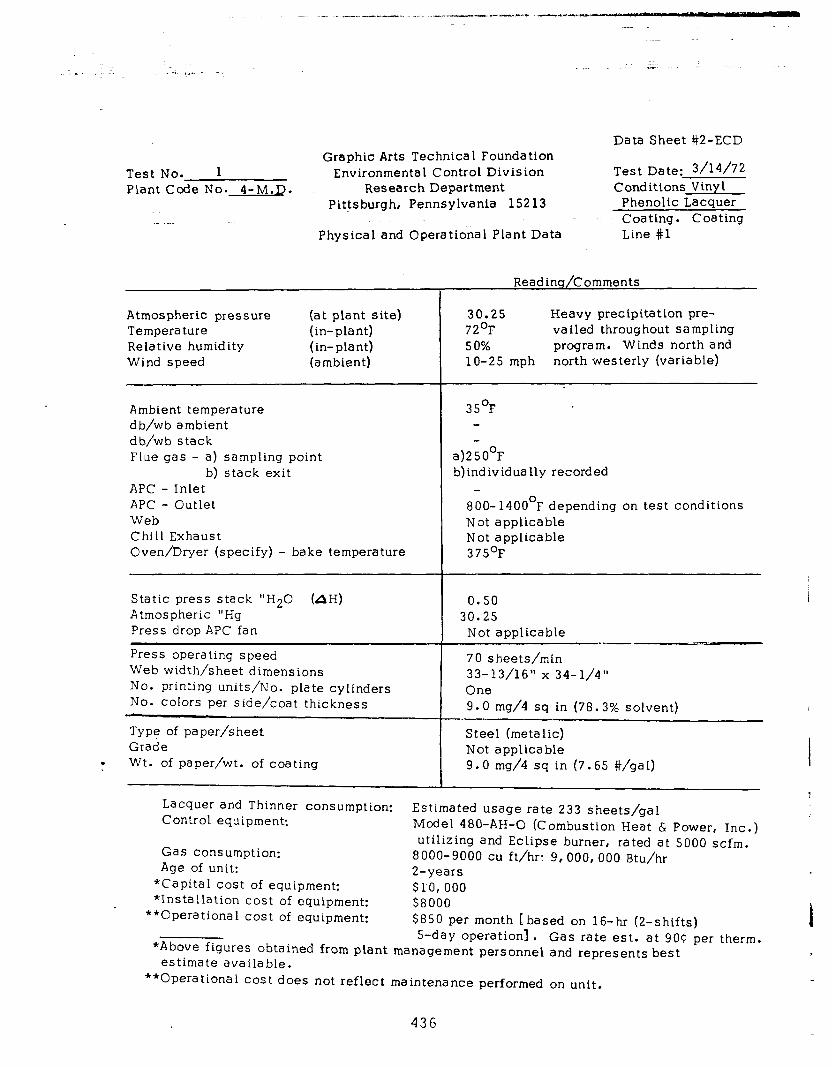
g.. ..--. -_ l.,i.^ _
Data Sheet #2-ECD Graphic Arts Technical Foundation
Test No. I Environmental Control Division Test Date: 3114172
Plant Code No. 4-M.D. Research Department Conditions Vinyl Pittsburgh, Pennsylvania 152 13 Phenolic Lacquer
Coating. Coating Physical and Operational Plant Data Line #l
Atmospheric pressure Temperature Relative humidity Wind speed
(at plant site) (in-plant) (in-plant) (ambient)
30.25 Heavy precipitation pre- 72’F va iled throughout sampling 50% program. Winds north and lo-25 mph north westerly (variable)
Ambient temperature db/wb ambient db/wb stack
35’F
Flue gas - a) sampling point b) stack exit
APC - Inlet APC - Outlet Web
a)250°F b)individually recorded
Chill Exhaust Oven/Dryer (specify) - bake temperature
800- 14OO’F depending on test conditions Not applicable Not applicable 375’F
Static press stack “H20 (AH) 0.50 Atmospheric “Hg 30.25 Press drop APC fan Not applicable
Press operating speed Web width/sheet dimensions No. printing units/No. plate cylinders NO. colors per side/coat thickness
7 0 s heets/min 33-13/16” x 34-l/4” One 9.0 mg/4 sq in (78.3% solvent)
Type of paper/sheet Grade
Steel (metalic) Not applicable
. Wt. of paper/wt. of coating 9.0 mg/4 sq in (7.65 #/gal)
Reading/Comments
Lacquer and Thinner consumption: Control equipment:
Estimated usage rate 233 sheets/gal Model 480-AH-0 (Combustion Heat & Power, Inc.)
Gas consumption: utilizing and Eclipse burner, rated at 5000 scfm.
Age of unit: 8000-9000 cu ft/hr: 9,000,OOO Btu/hr 2-years
*Capital cost of equipment: $10,000 *Installation cost of equipment: $8000
**Cperational cost of equipment: $850 per month [based on 16-hr (2-shifts) i S-day operation]. Gas rate est. at 9OC per therm.
*Above figures obtained from plant management personnel and represents best r estimate available.
**Operational cost does not reflect maintenance performed on unit.
436

-
r,-Jr.;r y;i:L1e.. _. ., -’ I -
Graphic Arts Technical Fotindation Test No. 2 Environmental Control Division Test LJclte* . *;/1;/75
Plant Code No. 4-M.D. Research Department crjnrJit13rl.7, ‘.‘.‘:iiC? _-._---_-. Pittsburgh, Pennsylvania 15213 vinyl cr,;2t!r!g,
Coating Line +2 Physical and Cperational Plant Data
Reading/Comments
30.15 70 65% 5-15 mph (variable)
38’F
a) 250°F b) individually recorded
800-165O’F depending on test conditions not applicable not applicable 350OF
Atmospheric pressure (at plant site) Temperature (in-plant) Relative humidity (in-plant) Wind speed (ambient)
Ambient temperature d b/&b ambient db/wb stack Flue gas - a) sampling.point
b) stack exit APC - Inlet APC - Outlet Web Chill Exhaust even/Dryer (specify) - bake temperature
Static press stack “H20 (AH) Atmospheric “Hg Press drop APC fan
0.65
Press operating speed Web width/sheet dimensions No. printing units/No. plate cylinders No. colors per side/coat thickness
Type of paper/sheet Grade M’t. of paper/wt. of coating
30.15 not applicable
- 65 sheets/minute 33-l/8” x 34-3/8” one 45 mg/4 sq in (52.7% solvent)
___-_.-----.--. ~.--- _- - -- Steel Finished 45 mg/4 sq in (10.0 #/gal)
. -- . Coating Consumption: Control equipment:
Estimated usage rate 125 sheets/gal. Model 480 (Combustion Heat h Power, Inc.) utilizing an Eclipse burner, rated 5000 scfm
Gas consumption: Age of unit:
7000-8000 cu ft/hr or 9,000, 000 Btu/hr l-year
*Capital cost of equipment: $15,000 *Installation cost of equipment: $7000
**Operational cost of equipment: $850 per month[ based on 16-hr (2-shifts) S-day operation]. Gas rate est. at 9OC per therm.
*Above figures obtained from plant management personnel and represents best estimate available.
**OPerational cost does not reflect maintenance performed on unit.
437
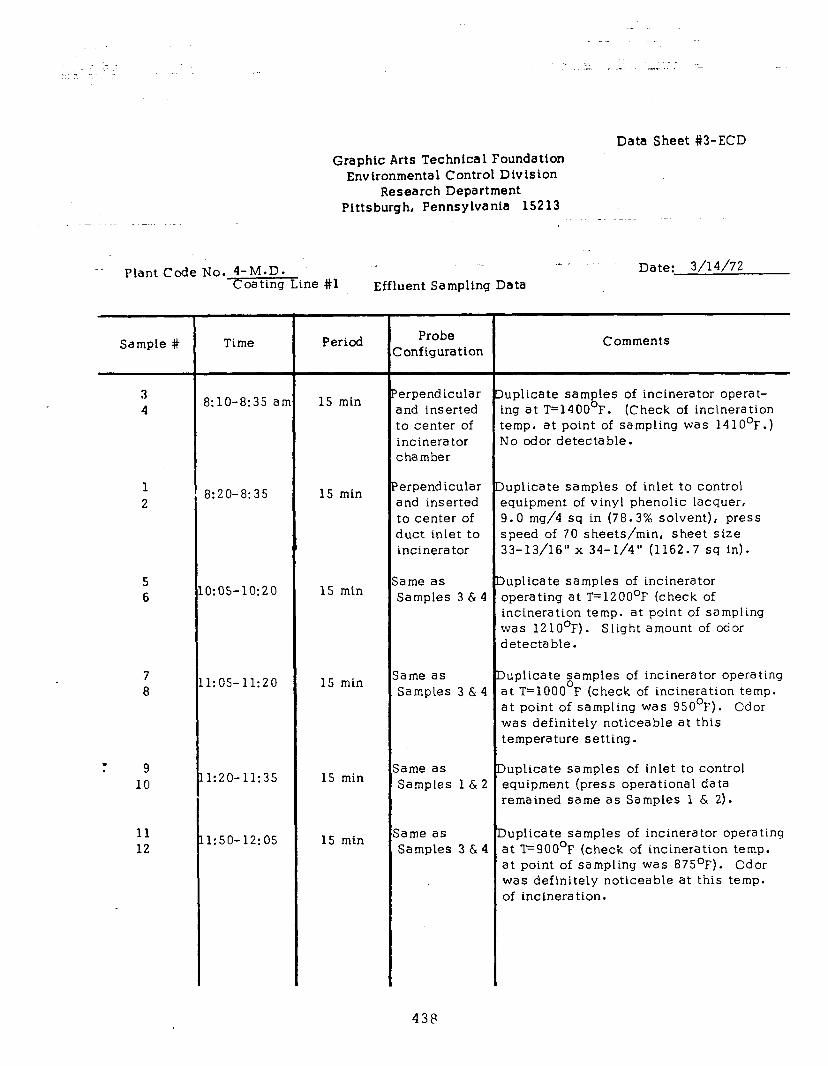
Graphic Arts Technical Foundation Environmental Control Division
Research Department Pittsburgh, Pennsylvanta 15213
Data Sheet #3-ECD
.L 1~. .~ Plant Code No. 4-M-D.
Coating Line #l Effluent Sampling Data Date: 3/14/72
Sample #
3 4
1 2
5 6
7 8
. . 9 10
11 12
Time
I:lO-8:35 ar 15 min
3:20-8:35 15 min
3:05-lo:20 15 min
1:05-11:20 15 min
1:20-11:35 15 min
1:50-12:05 15 min
Period Probe Ionfiguration
erpend icular snd inserted :o center of incinerator chamber
erpendicular Iuplicate samples of inlet to control and inserted equipment of vinyl phenolic lacquer, to center of 9.0 mg/4 sq in (78.3% solvent), press iuct inlet to speed of 70 sheets/min, sheet size incinerator 33-13/16” x 34-l/4” (1162.7 sq in).
ame as Samples 3 & 4
ame as Samples 3 6 4
‘ame as Samples 1 & 2
lame as Samples 3 & 4
Comments
Iuplicate samples of incinerator operat- ing at T=1400°F. (Check of incineration temp. at point of sampling was 141O’F.) No odor detectable.
Iuplicate samples of incinerator operating at T=1200°F (check of incineration temp. at point of sampling was 121O’F). Slight amount of odor detectable.
Iuplicate samples of incinerator operating at T=lOOO F (check of incineration temp. at point of sampling was 95O’F). Cdor was definitely noticeable at this temperature setting.
Iuplicate samples of inlet to control equipment (press operational data remained same as Samples 1 6 ‘2).
>uplicate samples of incinerator operating at l?900°F (check of incineration temp. at point of sampling was 875OF). Odor was definitely noticeable at this temp. of incineration.
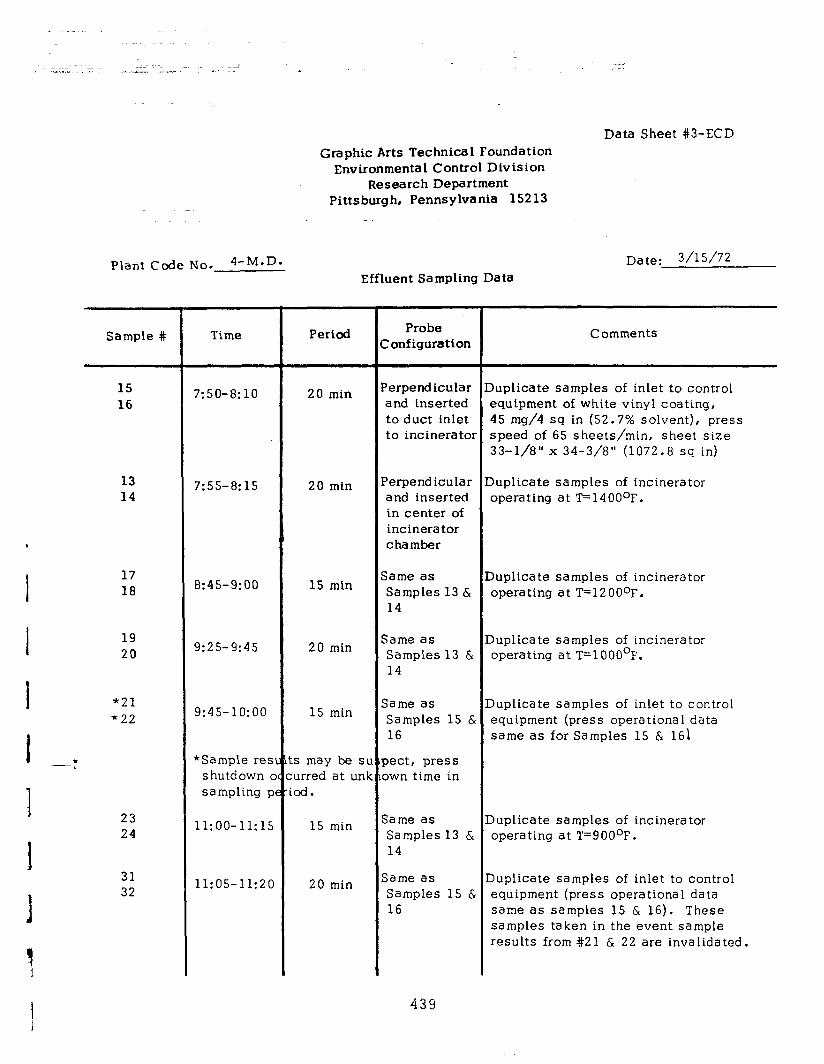
Graphic Arts Technical Foundation Environmental Control Division
Research Department Pittsburgh, Pennsylvania 15213
Data Sheet #3-ECD
Plant Code No. 4-M.D.
Sample #
15 16
13 14
17 18
19 20
f21 ‘22
23 24
31 32
Time
7:50-8:10 20 min
7:55-8:15 20 min
8:45-9:00 15 min
9:25-9:45
9:45-lo:oo
*Sample res’ cl shutdown c K
sampling p’ e:
ll:OO-11:lS
11:05-11:20 20 min
Effluent Sampling Data
Period
20 min
15 min
:s may be SL lurred at unk .od.
15 min
Probe Ionfiguration
Comments
‘erpendicular and inserted to duct inlet to incinera tax
Iuplicate samples of inlet to control equipment of white vinyl coating, 45 mg/4 sq in (52.7% solvent), press speed of 65 sheets/min, sheet size 33-l/8” x 34-3/8” (1072.8 sq in)
‘erpend icular and inserted in center of incinerator chamber
Iuplicate samples of incinerator operating at T=1400°F.
;ame as Samples 13 & 14
Iuplicate samples of incinerator operating at T=1200°F.
jame as Samples 13 & 14
Iuplicate samples of incinerator operating at T=lOOO°F.
;ame as Iuplicate samples of inlet to control Samples 15 & equipment (press operational data 16 same as for Samples 15 6 161
)ect , press )wn time in
;ame as Samples 13 & 14
Iuplicate samples of incinerator operating at T=900°F.
jame as Samples 15 6 16
Iuplicate samples of inlet to control equipment (press operational data same as samples 15 6 16). These samples taken in the event sample results from #21 6, 22 are invalida ted m
439
Date: 3/15/72
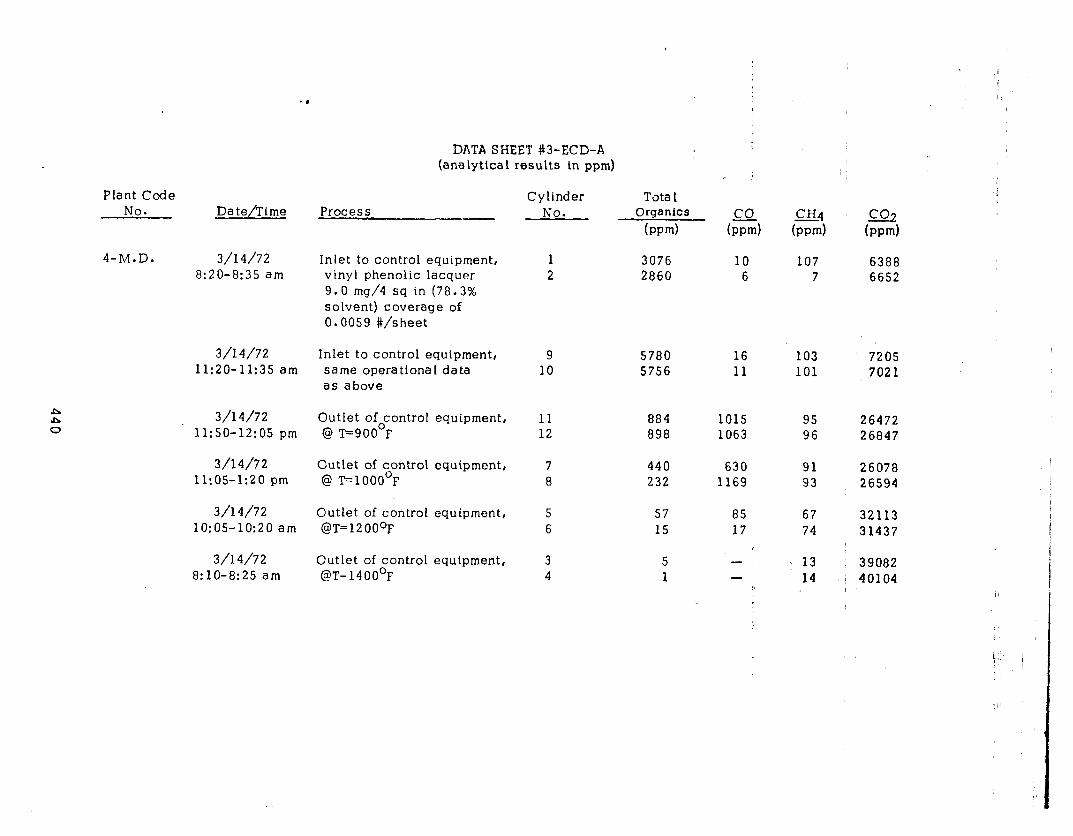
Plant Code No. Date/Time Process
4-M.D.
Cylinder No.
Tota 1 Organics
(pm)
3/l 4/72 8:20-8:35 am
Inlet to control equipment, vinyl phenolic lacquer 9.0 mg/4 sq in (78.3% solvent) coverage of 0.0059 #/sheet
1 3076 2 2860
co (ppm)
10 6
CH4 CGA
5x2 (Pwd
107 6388 7 6652
3/l 4/72 11:20-11:35 am
Inlet to control equipment, same opera tiona 1 data as above
9 5780 16 103 7205 10 5756 11 101 7021
3/14/72 11:50-12:OS pm
Outlet of control equipment, @ T=900°F
11 884 1015 95 26472 12 898 1063 96 26847
3/14/72 Outlet of control equipment, 7 440 @ T=lOOO’F
630 91 26078 11:05-1:20 pm 8 232 1169 93 26594
3/l 4/72 Outlet of control equipment, 5 57 85 67 32113 10:05-lo:20 am @T=1200°F 6 15 17 74 31437
3/14/72 8: lo-8:25 am
Outlet of control equipment, @T-1400’F
3 4
5 1
- -
13 14
39082 ! 40104 I I
DATA SHEET #3-ECD-A (analytical results in ppm)
i
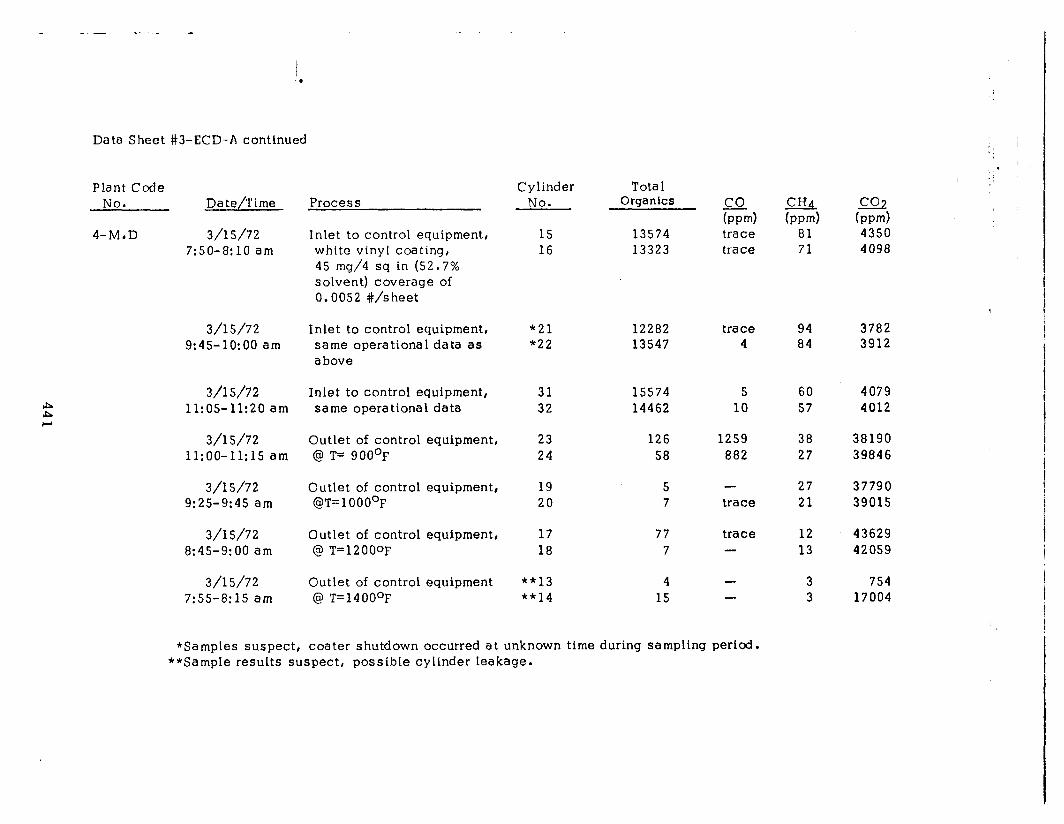
Data Sheet #3-ECD-A continued
Plant Code No. Da &/Time
4-M.D 3/15/72 7:50-8:10 am
3/l S/72 9:45-10:00 am
3/l S/72 Inlet to control equipment, 31 15574 11:05-11:20 am same operational data 32 14462
3/l 5/72 Outlet of control equipment, 23 126 ll:OO-11:15 am @ T= 900°F 24 58
3/l S/72 9:25-9:45 am
Outlet of control equipment, @T=l OOO’F
19 20
5 7
3/l 5/72 Outlet of control equipment, 17 77 8:45-9:00 am @ T=l2OOoF 18 7
3/l 5/72 7:55-8: 15 am
Outlet of control equipment @ T=1400°F
**13 **14
4 15
Process
Inlet to control equipment, white vinyl coating, 45 mg/4 sq in (52.7% solvent) coverage of 0.0052 #/sheet
Inlet to control equipment, same operational data as above
Cylinder Tota 1 No. Organics
15 13574 16 13323
CO (ppm)
c&l.
bpm)
trace 81 trace 71
co% hwd 4350 4098
*21 12282 trace 94 3782 “22 13547 4 84 3912
5 10
1259 882
60 4079 57 4012
38 38190 27 39846
trace
trace -
27 37790 21 39015
43629 42059
-
12 13
3 3
754 17004
*Samples suspect, coater shutdown occurred at unknown time during sampling period. **Sample results suspect, possible cylinder leakage.
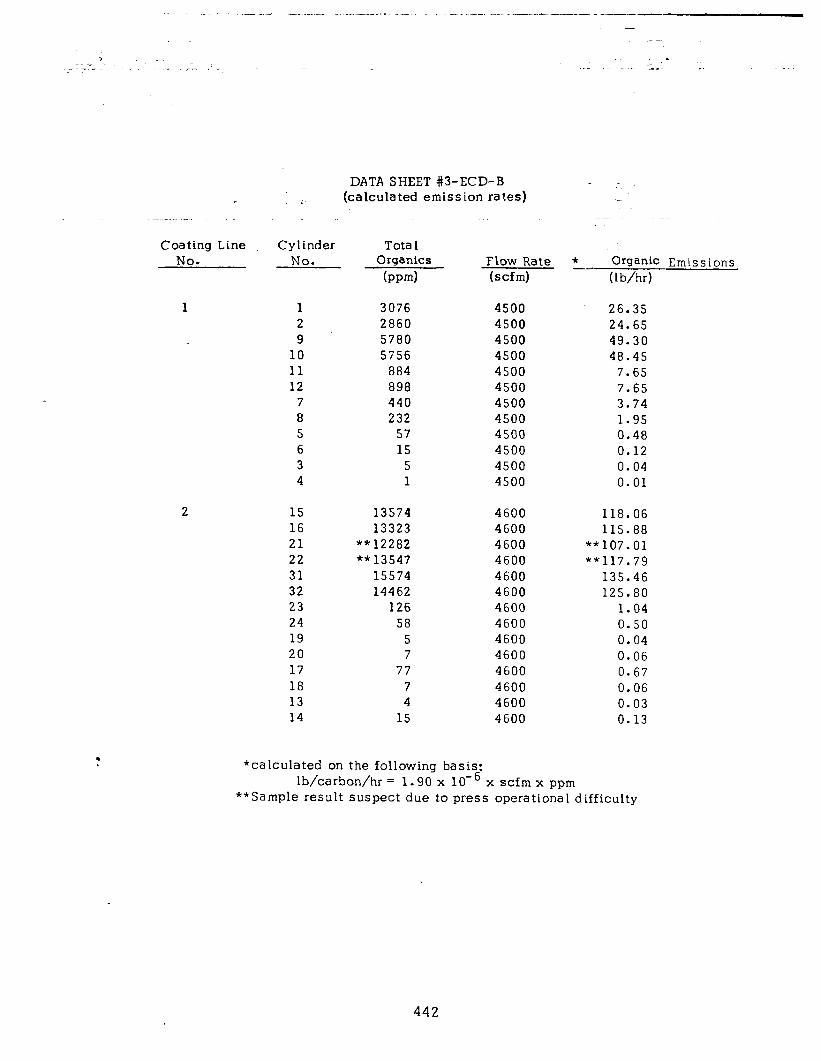
-- ____ - ..___._, .-... -.-._ ..-..-. .-.. 1- -. -.. -. -.. (. .1 .,.-. . . . .-...-.--- I. -..... ---~
.
DATA SHEET #3-ECD-B (calculated emission rates)
.-.
Coating Line Cylinder No. No.
1 1 3076 4500 26.35 2 2860 4500 24.65 9 5780 4500 49.30
10 5756 4500 48.45 11 884 4500 7.65 12 898 4500 7.65
7 440 4500 3.74 8 232 4500 1.95 5 57 4500 0.48 6 15 4500 0.12 3 5 4500 0.04 4 1 4500 0.01
15 13574 4600 118.06 16 13323 4600 115.88 21 ** 12282 4600 **107.01 22 ** 13547 4600 **117.79 31 15574 4600 135.46 32 14462 4600 125.80 23 126 4600 1.04 24 58 4600 0.50 19 5 4600 0.04 20 7 4600 0.06 17 77 4600 0.67 18 7 4600 0.06 13 4 4600 0.03 14 15 4600 0.13
*calculated on
Tota 1 Organics
(ppm) Flow Rate * Organic Emissions (scfm) ( 1 b/t-r)
the following basis: c lb/carbon/hr = 1.90 x lo-” x scfm x ppm
**Sample result suspect due to press operational difficulty
442
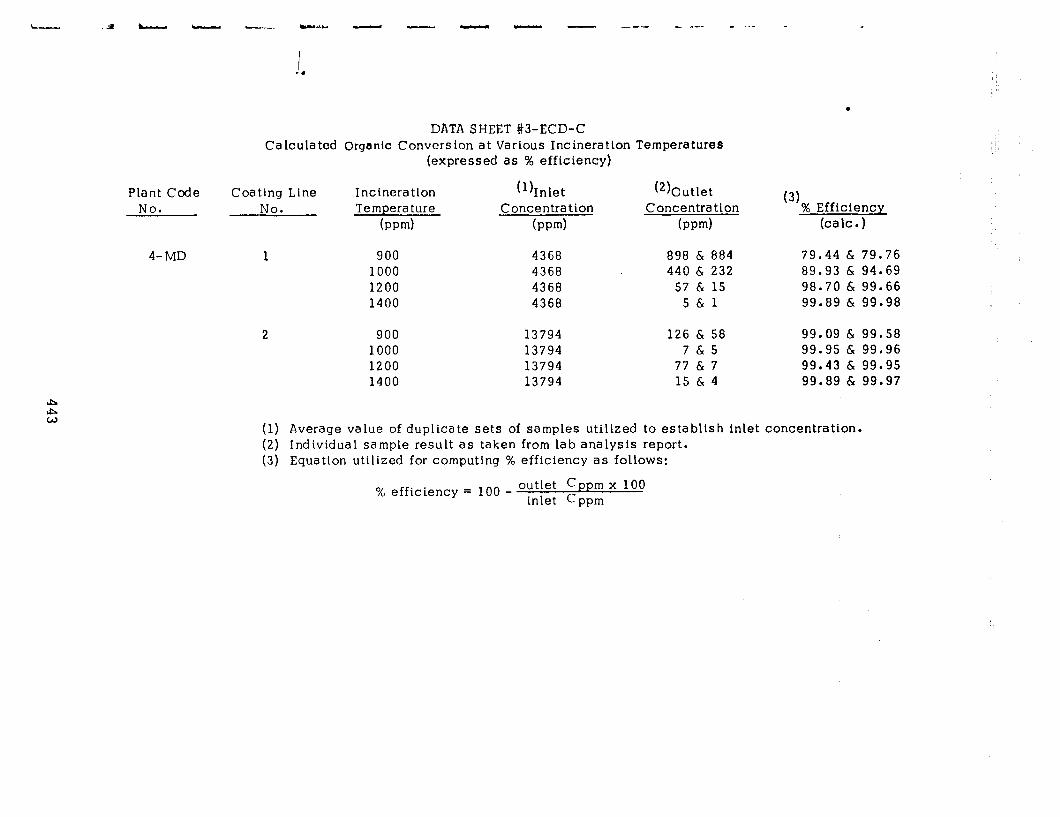
.
DATA SHEET #3-ECD-C Calculated Organic Conversion at Various Incineration Temperatures
(expressed as % efficiency)
Plant Code Coating Line No. No.
Incineration Temperature
bpd
(1) Inlet Concentration
(mm)
(2)0utlet Concentration
(rwm)
(3) % Efficiency
(talc.)
4-MD 1 900 4368 898 & 884 79.44 & 79.76 1000 4368 440 & 232 89.93 & 94.69 1200 4368 57 & 15 98.70 & 99.66 1400 4368 5&l 99.89 & 99.98
900 13794 126 & 56 99.09 & 99.58 1000 13794 7&5 99.95 & 99.96 1200 13794 77 & 7 99.43 & 99.95 1400 13794 15 & 4 99.89 & 99.97
(1) Average value of duplicate sets of samples utilized to establish inlet concentration. (2) Individual sample result as taken from lab analysis report. (3) Equation utilized for computing % efficiency as follows:
% efficiency = 100 - outlet Cppm x 100 inlet Cppm
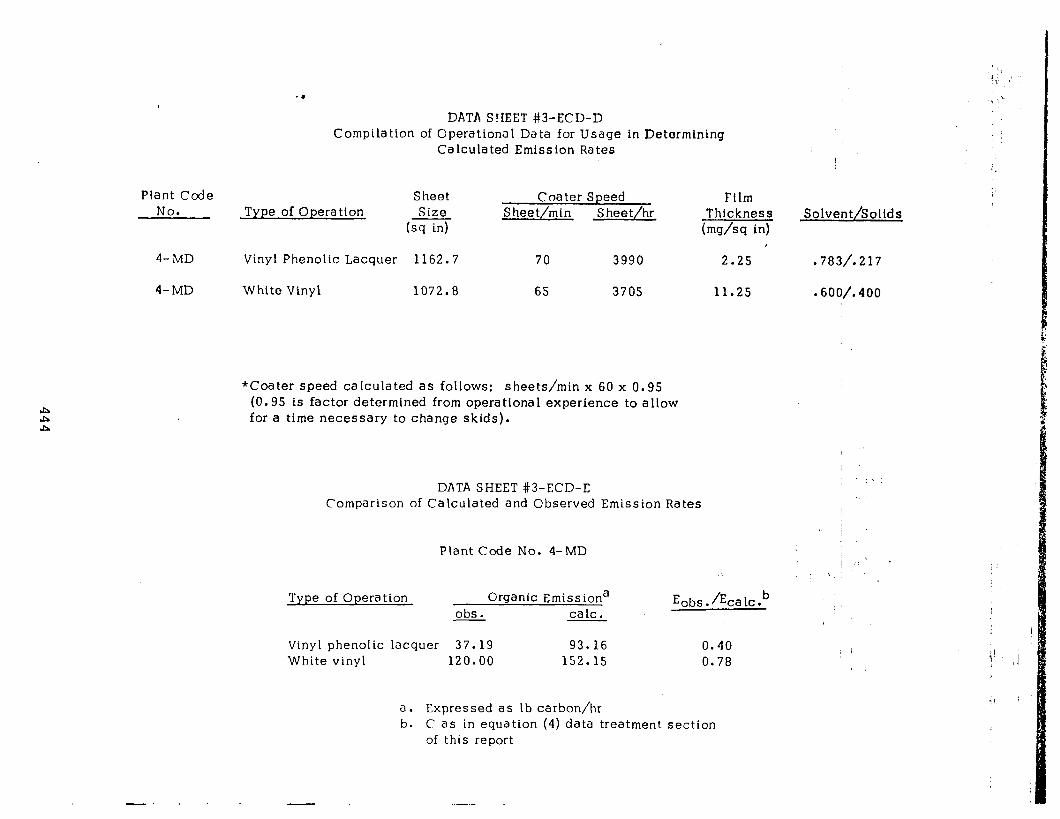
b
4
4
DATA SHEET #3-ECD-D Compilatlon of Operational Data for Usage in Determining
Calculated Emission Rates
Plant Code Sheet Coater Speed Film No. Type of Operation Size S heet/hr S heet/min Thickness Solvent/Solids
(sq in) hdsq in) ,
4-MD Vinyl Phenolic Lacquer 1162.7 70 3990 2.25 .783/.217
4-MD White Vinyl 1072.8 65 3705 11.25 .600/. 400
*Coater speed calculated as follows: sheets/min x 60 x 0.95 (0.95 is factor determtned from operational experience to allow for a time necessary to change skids).
DATA SHEET #3-ECD-E Comparison of Calculated and Observed Emission Rates
Z’.
Plant Code No. 4-MD
Type of Operation Organic Emissiona obs. talc.
Eobs. &a lc .b 1 i’
Vinyl phenolic lacquer 37.19 93.16 0.40 White vinyl 120.00 152.15 0.78
a. Expressed as lb carbon/hr b. C as in equation (4) data treatment section
of this report
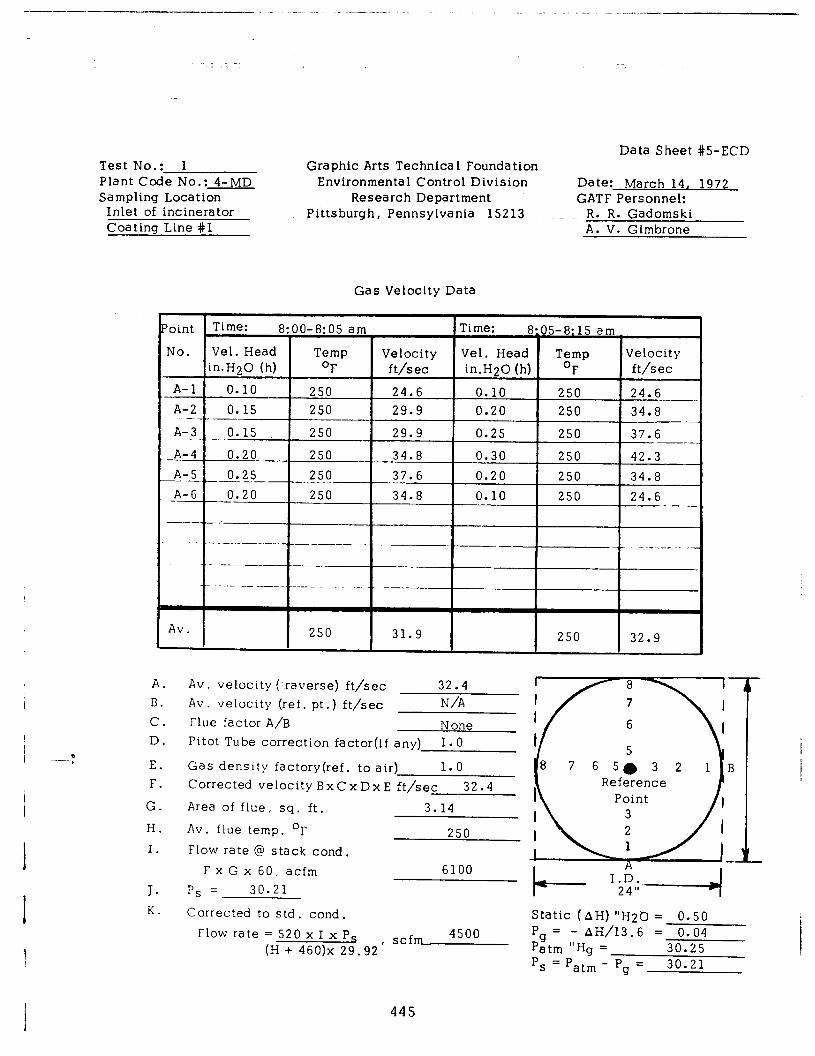
-- ----- .-----._ ^ ̂ . ..- .” _^ - - . _..., ___-l_l-
Test No.: 1 Plant Code No.: 4-MD Sampling Location
Inlet of incinerator Coating Line #l
Data Sheet #5-ECD Graphic Arts Technica 1 Foundation
Environmental Control Division Date: March 14, 1972 Research Department GATF Personnel:
Pittsburgh, Pennsylvania 15213 R. R. Gadomski A. V. Gimbrone
/ --.”
A. B. c. D.
E. F.
G.
H.
I.
J.
Gas Velocity Data
-A-6 0.20 250 34.8 0.10 250 24.6
- :- --.-..-. - . ..--.--- -_-__-_ _. __ -- -_ _.-._-.- . -- _.- _ __.. __. _-
-
Av. 250 31.9 250 32.9
Av. velocity (ITaverse) ft/sec 32.4 Av. velocity (ref. pt .) ft/sec N/A Flue factor A/B None Pitot Tube correction factor(if any) 1.0
Gas density factory(ref. to air) 1.0 Corrected velocity Bx C x Dx E ft/sec 32.4
Area of flue, sq. ft. 3.14
Av. flue temp. OF 250 Flow rate @ stack cond.
FxGx 60, acfm
ps =. 30.21
6100
765.32 1
K. Corrected to std. cond. Static (AH) “H20 = 0.50 Flow rate = 520 x I x P,
(H + 460)x 29.92’ scfm 4500 Pg = - AH/13.6 = 0.04
Patm “Hg = 30.25 P, = Patm - Pg = 30.21
445
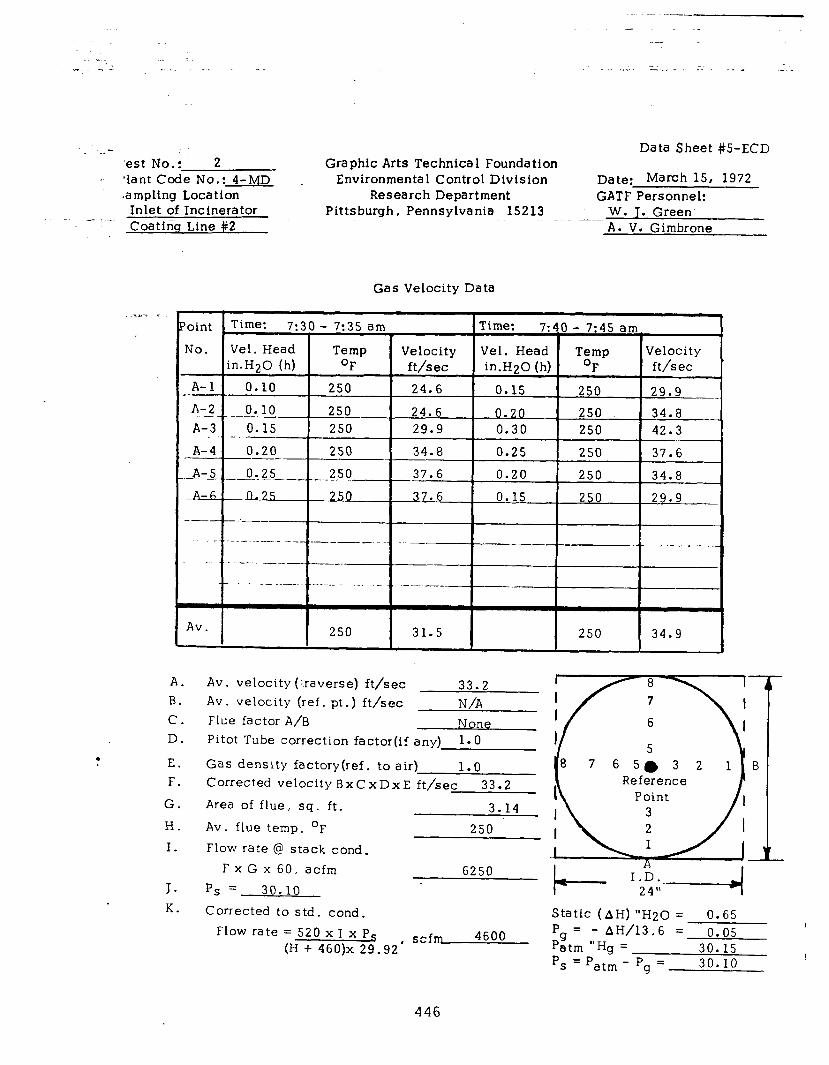
est No.: 2 Graphic Arts Technica 1 Foundation lant Code No.: 4-MD Environmental Control Division a mpling Location Research Department Inlet of Incinerator Pittsburgh, Pennsylvania 15213 -.. Coating Line #2
Gas Velocity Data
-.. .-- -
-
..: .,.-- __ ._.^
Data Sheet #5-ECD
Date: March 15, 1972 GATF Personnel:
W. J. Green. A. V. Gimbrone
A. B. C. D.
E. F.
G.
H.
I.
J- K.
Av. velocity (:.raverse) ft/sec 33.2 Av . velocity (ref. pt.) ft/sec N/A Flue factor A/B None Pitot Tube correction factor(if any) l-0
Gas density factory(ref. to air) 1.0 Corrected velocity BxCxDxE ft/sec 33.2
Area of flue, sq. ft. 3.14
Av. flue temp. OF 250 Flow rate @ stack cond.
F x G x 60, acfm Ps = 30.10
Corrected to std. cond.
6250
Flow rate = 520 x I x P, scfm 4600 (H + 460)x 29.92’
765@32 1
Static (AH) “H20 = 0.65 Pg = - AH/13.6 = 0.05 Patm “Hg = 30.15 P, = Patm - Pg = 30.10
446
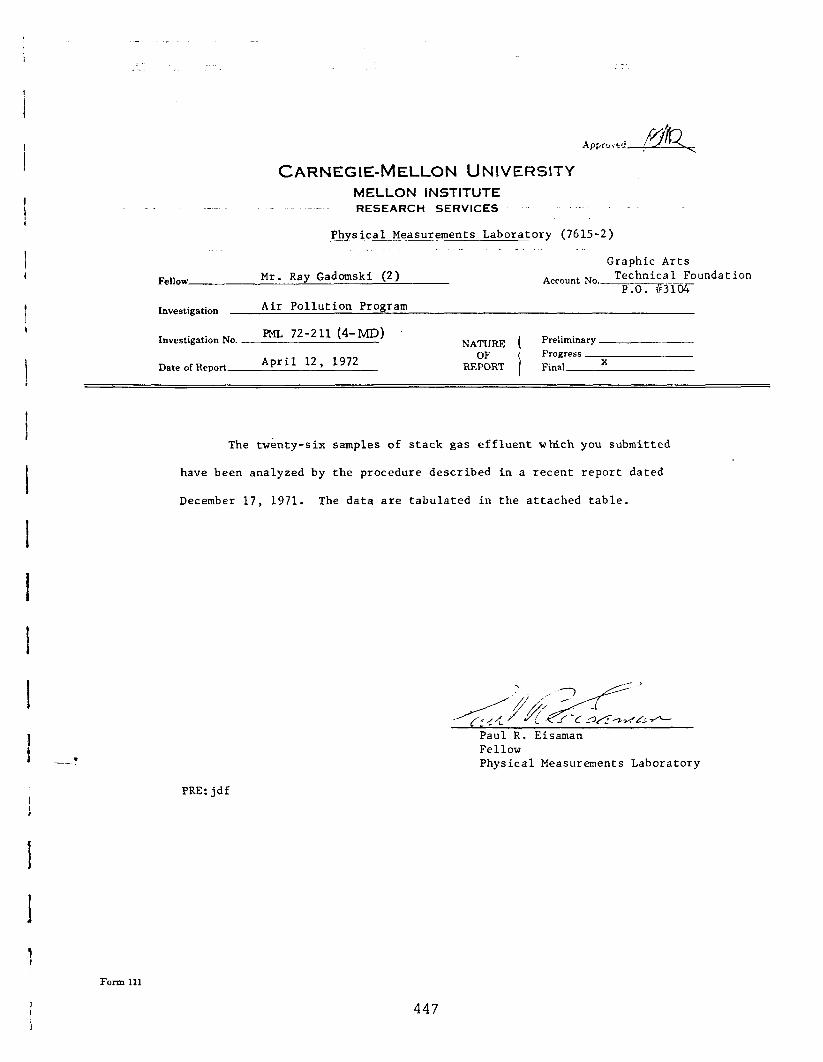
CARNEGIE-MELLON UNIVERSITY MELLON INSTITUTE RESEARCH SERVICES
Jhysical Measurements Laboratory (7615-2) _.
Graphic Arts
Fellow- Mr. Ray Gadomski (2) Technical Foundat ion Account No.- P .K-mzG-
Investigation Air Pollution Program
Investigation No. PML 72-211 (4-MD)
Date of Report April 12, 1972
NATURE OF
REPORT
Preliminary Progress Final X
The twenty-six samples of stack gas effluent which you submitted
have been analyzed by the procedure described in a recent report dated
December 17, 1971. The data are tabulated in the attached table.
Paul R. Eisaman Fellow Physical Measurements Laboratory
PRE:jdf
Form 111
447
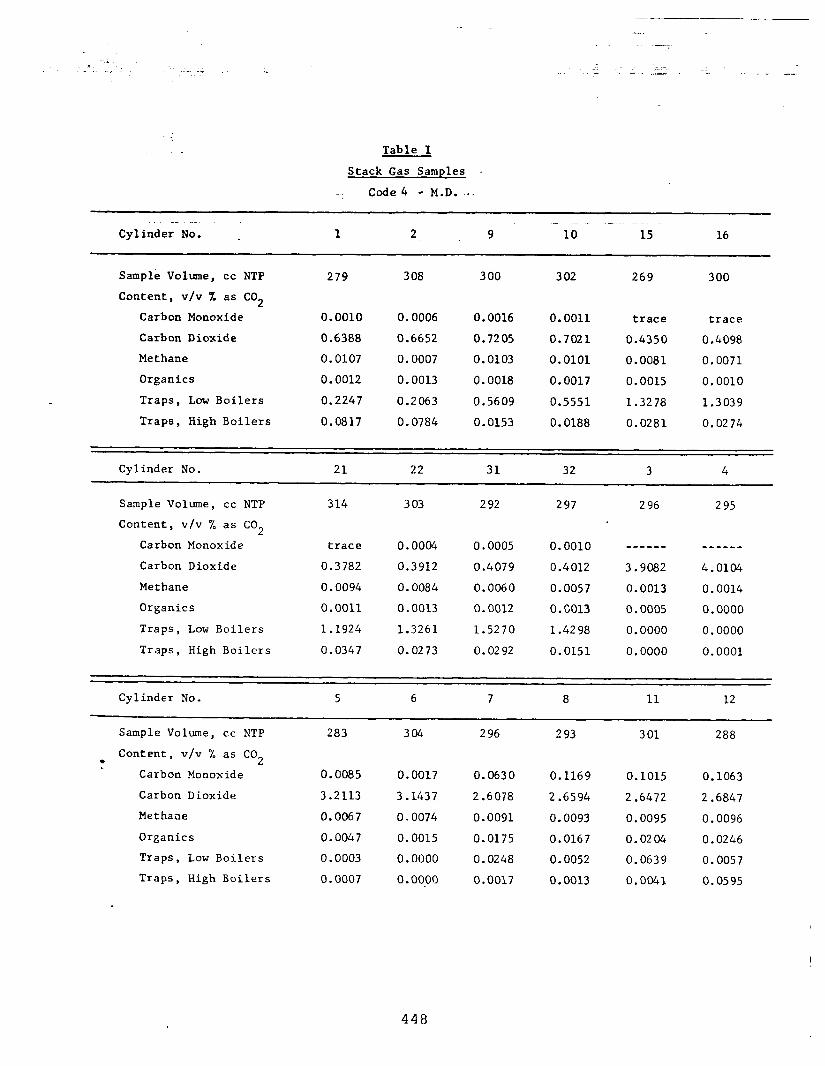
- -.
I --.
Table I
Stack Gas Samples
-. Code 4 - M.D. -.
Cylinder No. 1 2 9 10 15 16
Sample Volume, cc NTP
Content, v/v 9. as CO2
Carbon Monoxide
Carbon Dioxide
Methane
Organics
Traps, Low Boilers
Traps, High Boilers
279 308 300 302 269 300
0.0010 0.0006 0.0016 0.0011 trace trace
0.6388 0.6652 0.7205 0.7021 0.4350 0.4098
0.0107 0.0007 0.0103 0.0101 0.0081 0.0071
0.0012 0.0013 0.0018 0.0017 0.0015 0.0010
0.2247 0.2063 0.5609 0.5551 1.3278 1.3039
0.0817 0.0784 0.0153 0.0188 0.0281 0.0274
Cylinder No. 21 22 31 32 3 4
Sample Volume, cc NTP 314 303 292 297 296 295
Content, v/v % as CO 2
Carbon Monoxide trace 0.0004 0.0005 0.0010 ------ ------
Carbon Dioxide 0.3782 0.3912 0.4079 0.4012 3.9082 4.0104
Methane 0.0094 0.0084 0.0060 0.0057 0.0013 0.0014
Organics 0.0011 0.0013 0.0012 o.co13 0.0005 0.0000
Traps, Low Boilers 1.1924 1.3261 1.5270 1.4298 0.0000 0.0000
Traps, High Boilers 0.0347 0.0273 0.0292 0.0151 0.0000 0.0001
Cylinder No. 5 6 7 8 11 12
Sample Volume, CC NTP 283 304 296 293 301 288
Content, v/v % as CO . 2
Carbon Monoxide 0.0085 0.0017 0.0630 0.1169 0.1015 0.1063
Carbon Dioxide 3.2113 3.1437 2.6078 2.6594 2.6472 2.6847
Methane 0.0067 0.0074 0.0091 0.0093 0.0095 0.0096
Organics 0.0047 0.0015 0.0175 0.0167 0.0204 0.0246
Traps, Low Boilers 0.0003 0.0000 0.0248 0.0052 0.0639 0.0057
Traps, High Boilers 0.0007 0.0000 0.0017 0.0013 0.0041 0.0595
448
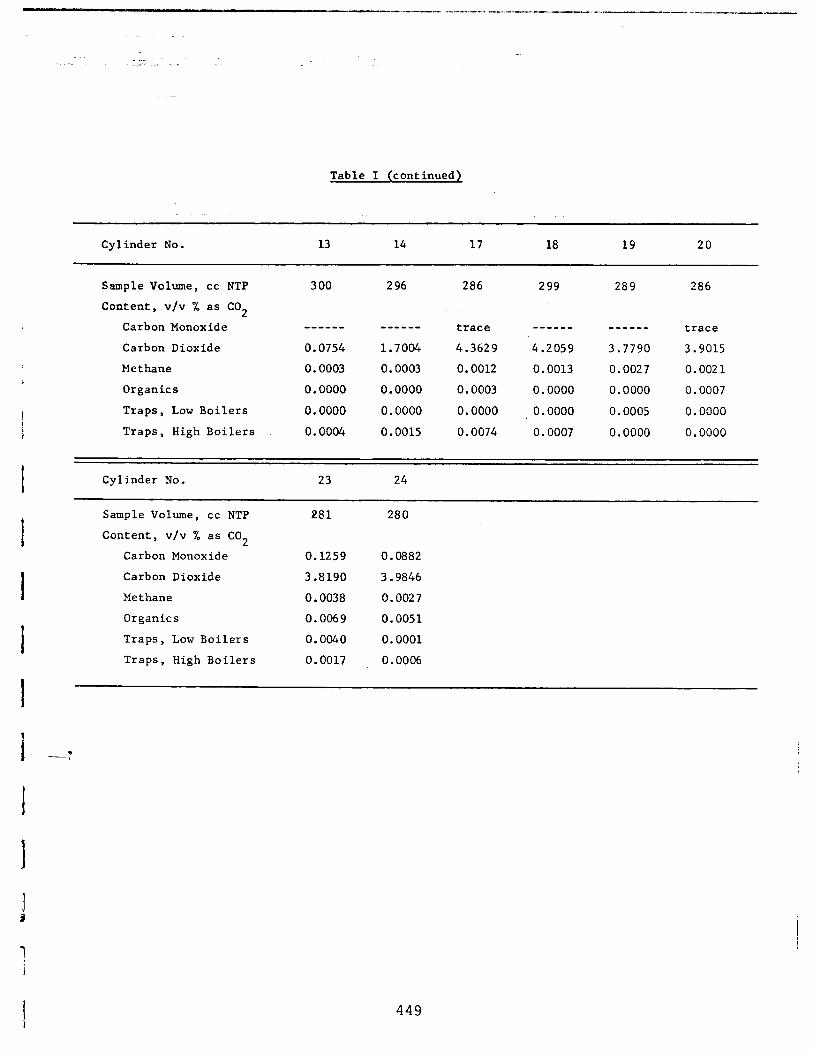
Table I (continued)
Cylinder No. 13 14 17 18 19 20
Sample Volume, cc NTP
Content, v/v % as CO2
Carbon Monoxide
300 296 286 299 289 286
------ ------ trace ------ ------ trace
Carbon Dioxide 0.0754 1.7004 4.3629 4.2059 3.7790 3.9015
Methane 0.0003 0.0003 0.0012 0.0013 0.0027 0.0021 i
Organics 0.0000 0.0000 0.0003 0.0000 0.0000 0.0007
I Traps, Low Boilers 0.0000 0.0000 0.0000 0.0000 0.0005 0.0000
1 Traps, High Boilers 0.0004 0.0015 0.0074 0.0007 0.0000 0.0000
I Cylinder No. 23 24
I
cc NTP
Sample Volume, 2
281 280
Content, v/v % as CO
Carbon Monoxide 0.1259 0.0882
I Carbon Methane Dioxide 3.8190 3.9846
0.0038 0.0027
Organics 0.0069 0.0051
I Traps, Low Boilers 0.0040 0.0001
Traps, High Boilers 0.0017 0.0006
I --:
1
449
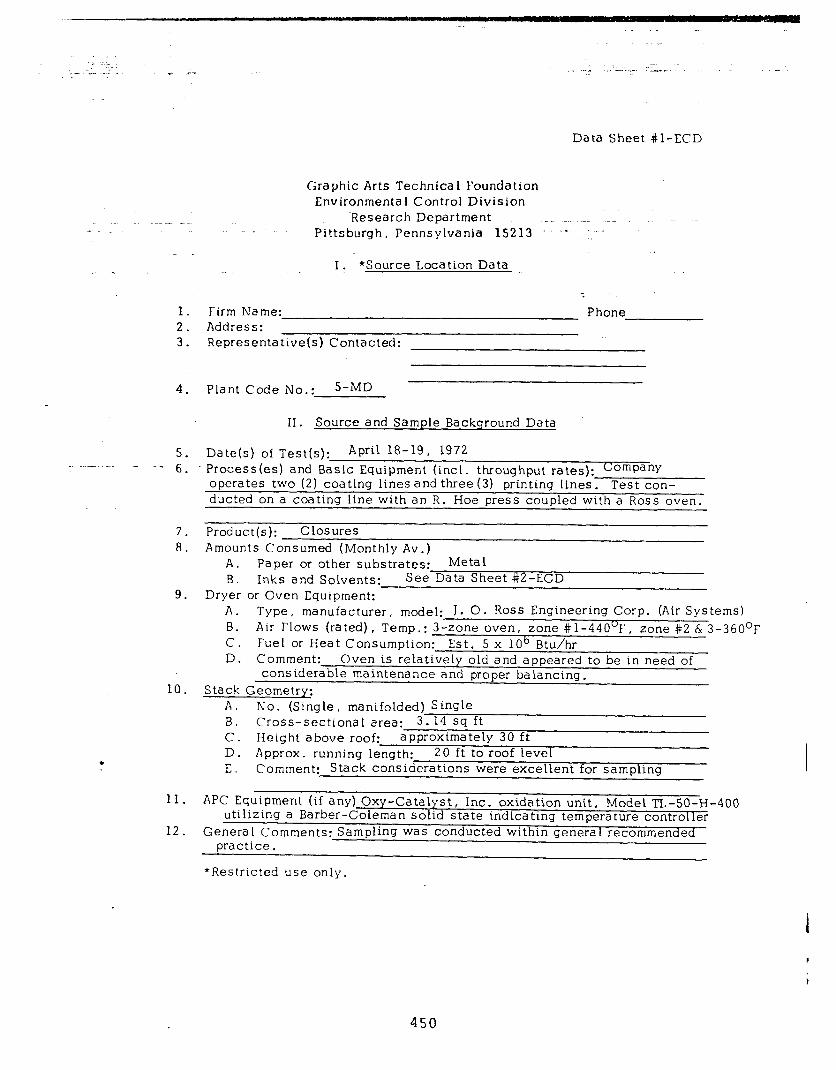
1. 2. 3.
4. Plant Code No.: 5-MD
5. -- 6.
7. 8.
9.
10.
.
11.
12.
Data Sheet #l-ECD
Graphic Arts Technica 1 Foundation Environmenta 1 Control Division
Research Department Pittsburgh, Pennsylvania 15213 --’ .- ‘;-
I. *Source Location Data
Firm Name: Address: Representative(s) Contacted:
: Phone
II . Source and Sample Background Data
Date(s) of Test(s): April 18-19, 1972 Processles) and Basic Equipment (i operates two (2) coating lines and three (3) printing lines. Test con- ducted on a coating line with an R. Hoe press coupled with a Ross oven.
Product(s): Closures Amounts Consumed (Monthly Av.)
A. Paper or other substrates: Metal B. Inks and Solvents: See Data Sheet #2-ECD
Dryer or Oven Equipment: A. B. c. D.
Stack A. B. c. D. E.
Type I manufacturer, model: J. 0. Ross Engineering Corp. (Air Syst Air Flows (rated), Temp.: 3-zone o ven, zone #l-440°F, zone #2 & 3 --~~ Fuel or Heat Consumption: Est. 5 x 10⁷ Comment: Oven is relatively old and appeared to be in need of considerable maintenance and proper balancing.
Geometry: No. (Single, manifolded) Single Cross-sectional area: 3. I4 sq ft Height above roof: approximately 30 ft Approx. runnina lenath: 20 ft to roof level CWomment: Stack considerations were excellent for sampling
:ems) ‘-3600F
APC Equipment (if any) Oxy-Catalyst, Inc. oxidation unit, Model ‘K-50-H-400 utilizing a Barber-Coleman solid state indicating temperature controller
General Comments: Sampling was conducted within general recommended practice.
*Restricted use only.
I
450
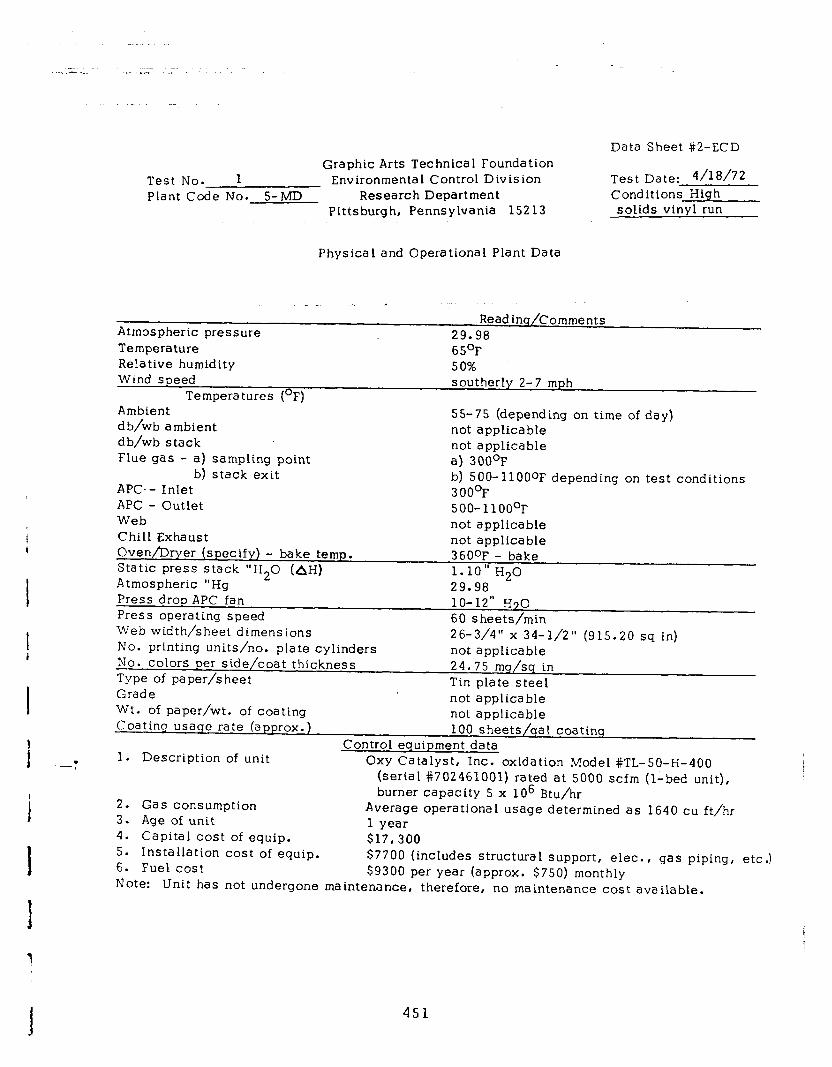
Data Sheet #2-ECD Graphic Arts Technical Foundation
Test No. 1 Environmental Control Division Test Date: 4/19/72
Plant Code No. 5-MD Research Department Conditions High Pittsburgh, Pennsylvania 15213 solids vinyl run
Physical and Operational Plant Data
Atmospheric pressure Temperature Relative humidity
I .
Read inq/Comments 29.98 65’F 50%
Wind speed Temperatures (OF)
southerly 2-7 mph
Oven/Dryer (specify) - bake temp.
Ambient db/wb ambient
Static press stack “H,O (AH)
db/wb stack Flue gas - a) sampling point
b) stack exit APC. - Inlet APC - Outlet Web Chill Exhaust
55-75 (depending on time of day) not applicable not applicable a) 300°F b) SOO-11OOoF depending on test conditions 300’F 500-11OO’F not applicable not applicable
Atmospheric “Hg b Press drop APC fan Press operating speed Web width/sheet dimensions No. printing units/no. plate cylinders
360oF -- bake
:- 29.98 -‘ 1.10” H-0
10-12” H70 60 s heets/min 26-3/4” x 34-l/2” (! -- _- -_ ___, not anplicable
915.20 su in1
No. colors per side/coat thickness Type of paper/sheet
. . --- 24.75 mg/sq in Tin plate steel
Grade Wt. of paper/wt. of coating
not gpplica ble
Coating usaqe rate (approx.) not applicable 100 s heets/qa 1 coa tinq
Control equipment data . 1. Description of unit Oxy Catalyst, Inc. oxidation Model #TL-50-H-400
(serial #702461001) rated at 5000 scfm (l-bed unit),
2. Gas consumption burner capacity 5 x lo6 Btu/hr
3. Age of unit Average operational usage determined as 1640 cu ft/hr 1 year
4. Capital cost of equip. $17,300 5. Installation cost of equip. 6. Fuel cost
$7700 (includes structural support, elec., gas piping, etc.) $9300 per year (approx. $750) monthly
Note: Unit has not undergone maintenance, therefore, no maintenance cost available.
451
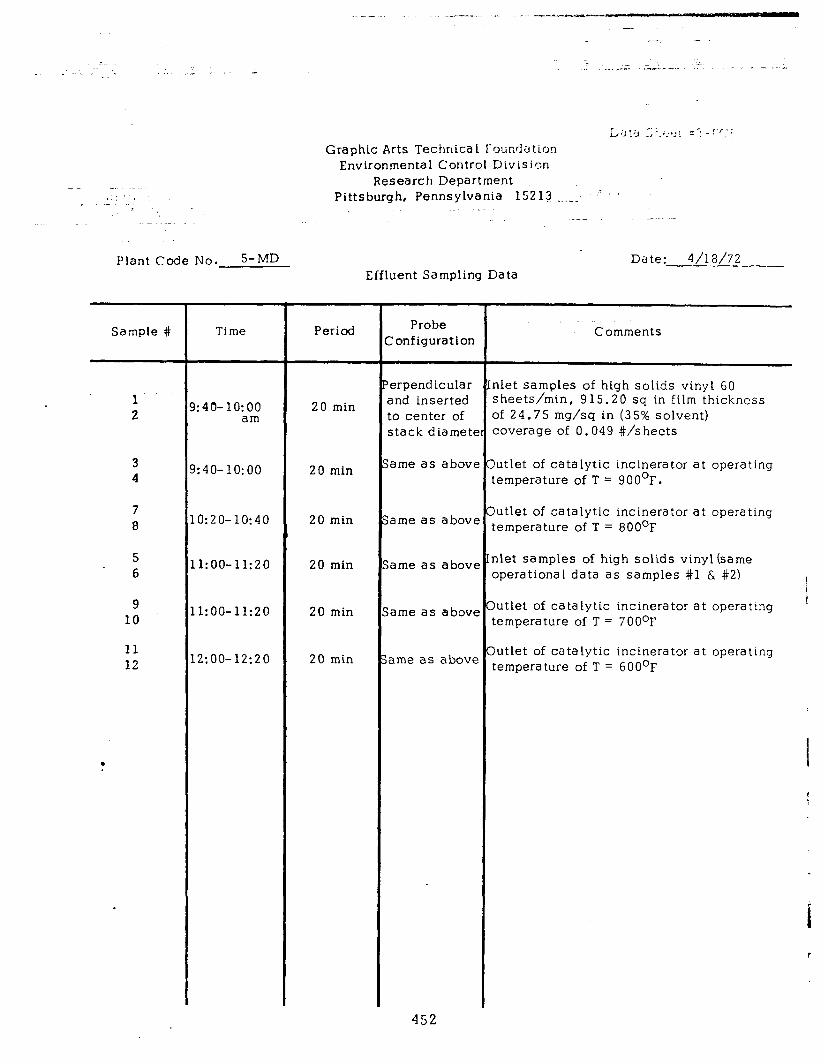
_- _.. ,: I ._ ..- .-
i .:.
L ;j !;, ” ; -, ..I‘:: z-; _ _ :‘r :
Graphic Arts Technica 1 Foundation Environmental Control Division
Research Department Pittsburgh, Pennsylvania 15213.-,.-.. ,m ’
_ .~
Plant Code No. S-MD Effluent Sampling Data
Date: 4/18/n
Sample # Time
1 2
3 4
7 8
5 6
9 10
11 12
l:40-IO:00 am
1:40-lo:oo
0:20-lo:40
.l:OO-11:20
.l:OO-11:20
.2:00-12:20
Period
20 min
20 min
20 min
20 min
20 min
20 min
Probe Ionfiguration
erpendicular nlet samples of high solids vinyl 60 and inserted sheets/min, 915.20 sq in film thickness to center of of 24.75 mg/sq in (35% solvent) stack diamete coverage of 0.049 #/sheets
ame as above jutlet of catalytic incinerator at operating temperature of T = 900’F.
ame as above
‘ame as abow
ame as above
ame as above
Comments
jutlet of catalytic incinerator at operating temperature of T = BOOoF
nlet samples of high solids vinylisame operational data as samples #l 6, #2) I
jutlet of catalytic incinerator at operating i
temperature of T = 700°F
)utlet of catalytic incinerator at operating temperature of T = 600°F
452
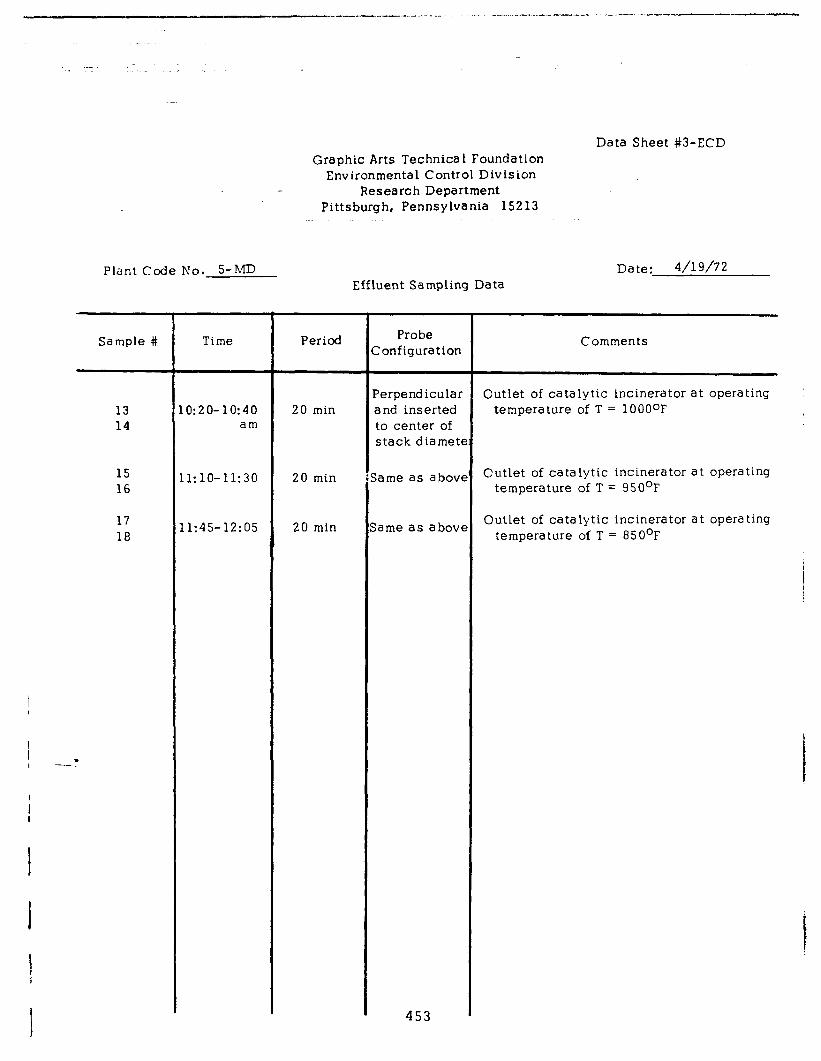
Graphic Arts Technica 1 Foundation Environmental Control Division
Research Department Pittsburgh, Pennsylvania 15213
Data Sheet #3-ECD
Plant Code No. S-MD Date: 4/19/72 Effluent Sampling Data
Sample # Time Period
13 0:20-lo:40 14 am
15 16
l:lO-11:30 20 min lame as above
17 18
1:45-12:OS 20 min ;ame as abow
i . I -,
20 min
Probe ‘onfiguration
?erpendicular and inserted to center of stack diametc
453
Comments
Outlet of catalytic incinerator at operating temperature of T = 1OOOoF
t operating Outlet of catalytic incinerator a temperature of T = 950°F
Outlet of catalytic incinerator at operating temperature of T = 85O’F
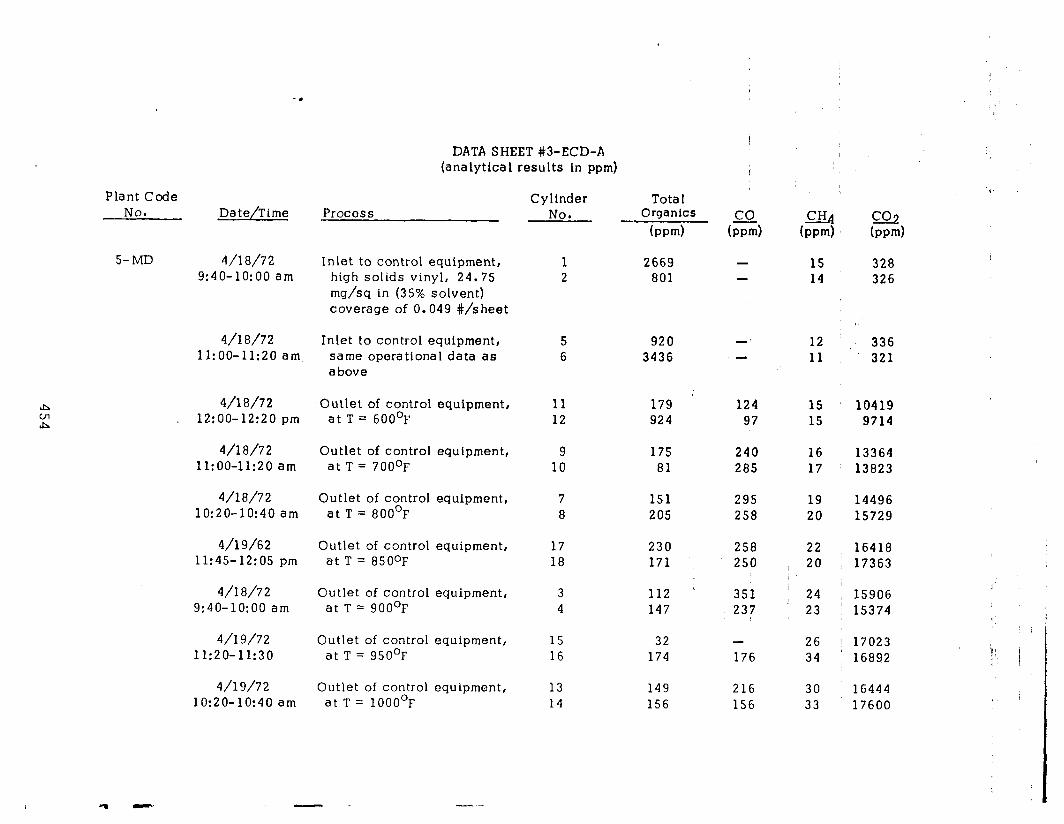
. .
Plant Code No. Date/Time Process
S-MD 4/l 8/72 9:40-10:00 am
4/i a/72 ll:OO-11:20 am
4/18/72 12:00-12:20 pm
4/l 8/72 ll:OO-11:20 am
Outlet of control equipment, 11 179 124 15 10419 at T = 600°F 12 924 97 15 9714
Outlet of control equipment, 9 175 240 16 13364 at T = 700°F 10 81 285 17 13823
4/18/72 Outlet of control equipment, 7 151 295 19 14496 10:20-lo:40 am at T = 800°F a 205 258 20 15729
4/19/62 Outlet of control equipment, 17 230 11:45-12:OS pm at T = 850°F 18 171
258 250
351 237
22 / 20 : I ; 24 1 ; 23
26 34
16418 17363
4/l 8/72 Outlet of control equipment, 3 112 9:40-10:00 am at T = 900°F 4 147
15906 15374
4/l 9/72 Outlet of control equipment, 15 32 - 11:20-11:30 at T = 950°F 16 174 176
17023 16892
4/19/72 Outlet of control equipment, 13 14
149 216 156 156
30 16444 33 17600
DATA SHEET #3-ECD-A (analytical results in ppm)
Inlet to control equipment, high solids vinyl, 24.75 mg/sq in (35% solvent) coverage of 0.049 #/sheet
Inlet to control equipment, same operational data as above
10:20-lo:40 am at T = 1000°F
Cylinder No.
Tota 1 Organlcs
bwd
1 2669 2 801
5 920 6 3436
-
-’
al4 hwd
cG2 bd
15 328 14 326
12 11
336 321

I I 1 I I I I I I I I I I -.-@
DATA SHEET #3-ECD-B (calculated emission rates)
Coating Line Cylinder Tota 1 No. No. Organics Flow Rate * Organic Emissions
bpm) (scfm) Wdhd
5- MD 1 2669 4000 20.52 2 801 II 6.08 5 920 8, 6.99 6 3436 11 25.84
11 179 II 1.37 12 924 1, 6.99
9 175 II 1.34 10 81 I, 0.61
7 151 11 1.14 8 205 II 1.56
17 230 II 1.75 18 171 0 1.30
. 3 112 I, 0.85 4 147 II 1.11
15 32 II 0.24 16 174 II 1.32
13 149 II 1.13 14 156 II 1.18
*calculated on the following basis:
lb carbon/hr = 1.90 x 10m6 x scfm x ppm
455
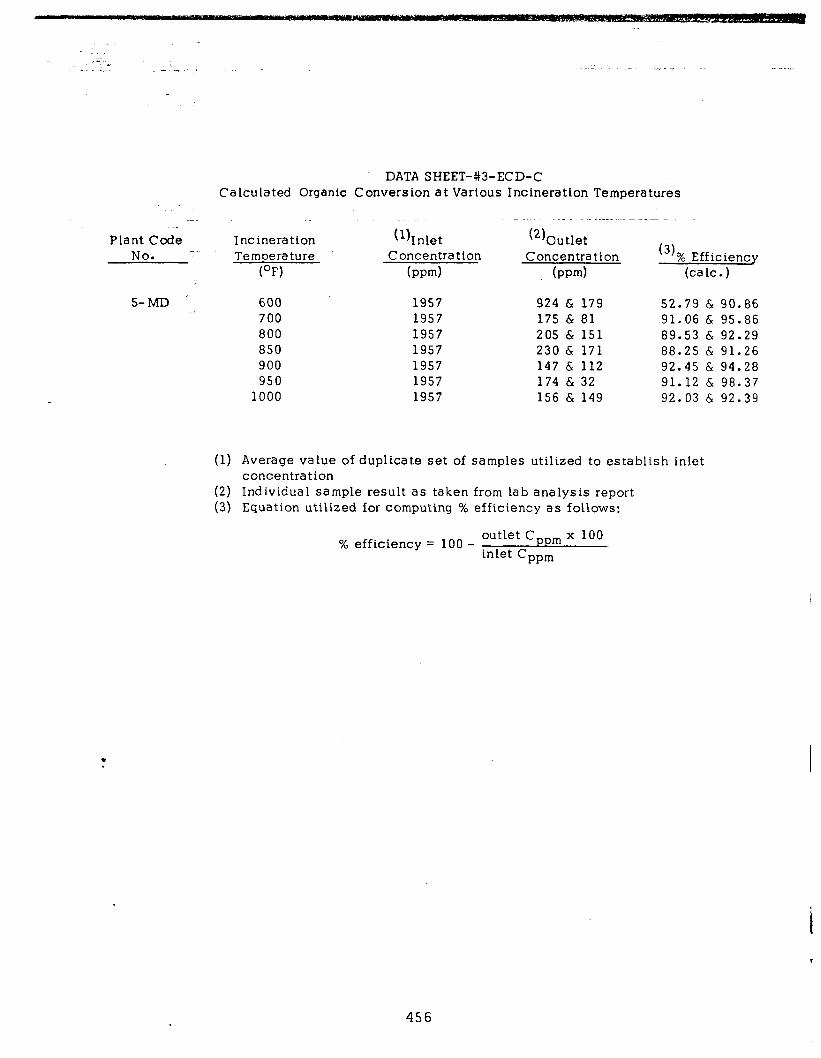
DATA SHEET-#3-ECD-C Calculated Organic Conversion at Various Incineration Temperatures
Plant Code No. ---
Incineration (1) Inlet Temperature Concentration
(OF) (pm)
(2) Outlet Concentration
bpm)
(3) % Efficiency (talc.)
S-MD ’ 600 1957 924 & 179 52.79 & 90.86 700 1957 175 & 81 91.06 & 95.86 800 1957 205 & 151 89.53 & 92.29 850 1957 230 & 171 88.25 & 91.26 900 1957 147 & 112 92.45 & 94.28 950 1957 174 &.32 91.12 & 98.37
1000 1957 156 & 149 92.03 & 92.39
(1) Average value of duplicate set of samples utilized to establish inlet concentration
(2) Individual sample result as taken from lab analysis report (3) Equation utilized for computing % efficiency as follows:
% efficiency = 100 - outlet C mx 100 inlet Cppm
456
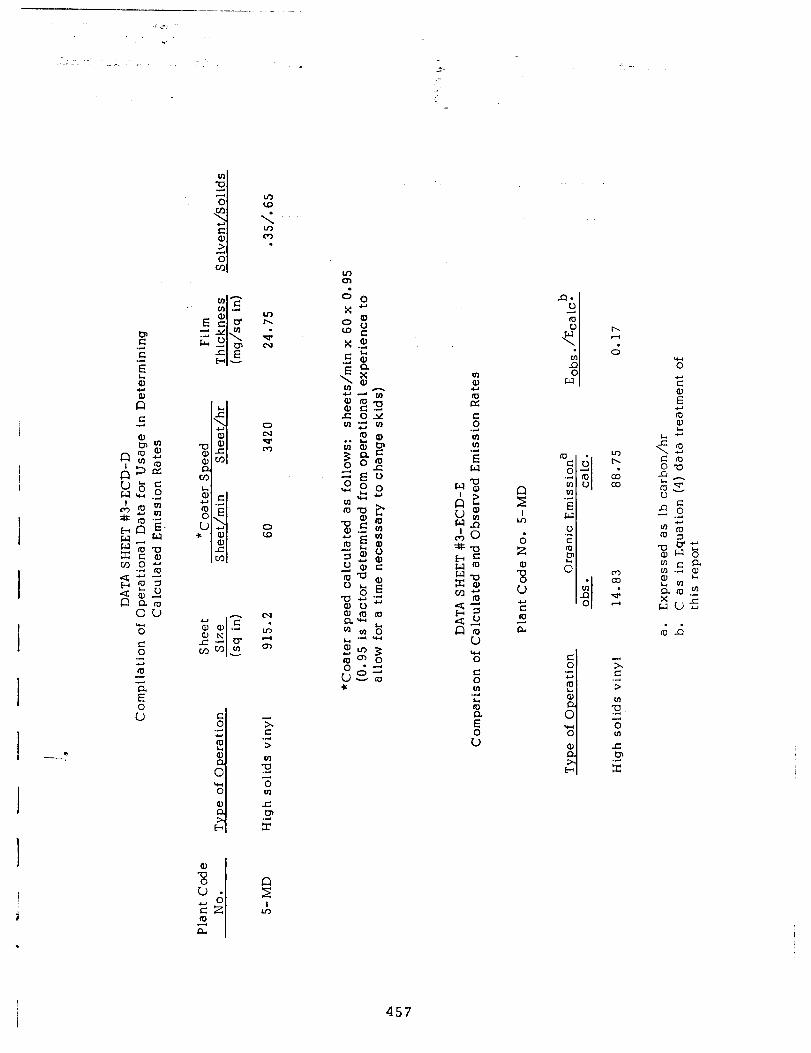
I I I
I I --” I 1
457
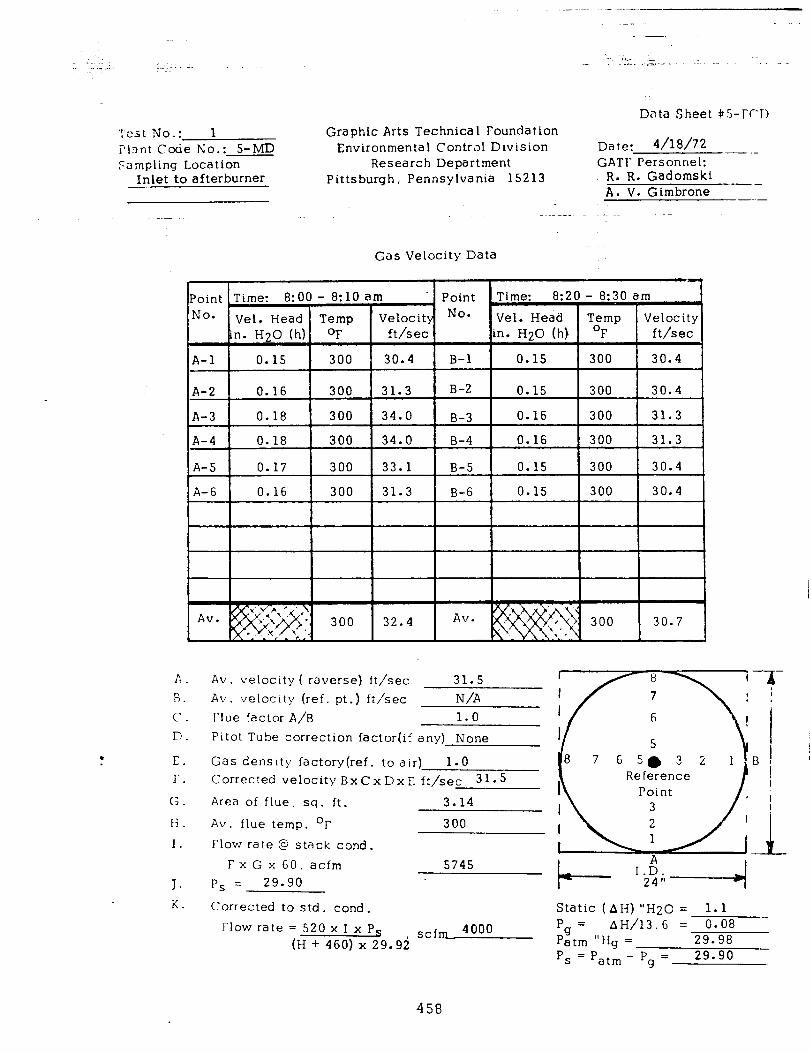
,__ ,_ .._.. -. .-
Data Sheet +S-rrr) '!csl No.: 1 Graphic Arts Technical Foundation Pl?jnt Code No * 5-m * *- Environmental Control Division Fampling Location Research Department
Inlet to afterburner Pittsburgh, Pennsylvania 15213
Date: 4/18/72 -_- GATI’ Personnel:
R. R. Gadomski - A. V. Gimbrone -
A .
F3.
c .
r) _
E.
r.
G.
Ii _ I. J. K.
Gas Velocity Data
Av. velocity ( raverse) ft/sec 31.5 Av. velocity (ref. pt.) ft/sec N/A I‘lue factor A/B 1.0 Pitot Tube correction factor(if any) None
Gas density factory(ref. to air) 1.0 Corrected velocity BxCxDxC ft/sec 31.5
Area of flue, sq. ft. 3.14
Av. flue temp. OF 300
Flow rate 0 stack cond. F x G x 60, acfm
Ps = 29.90 5745
Corrected to std. cond.
Flow rate = 520 x I x P, (H + 460) x 29.9i scf
m 4000
Static (AH) “H20 = 1.1 Pg = AH/13.6 = 0.08 Patm “Hg = 29.98 P, = Patm - Pg = 29.90
458
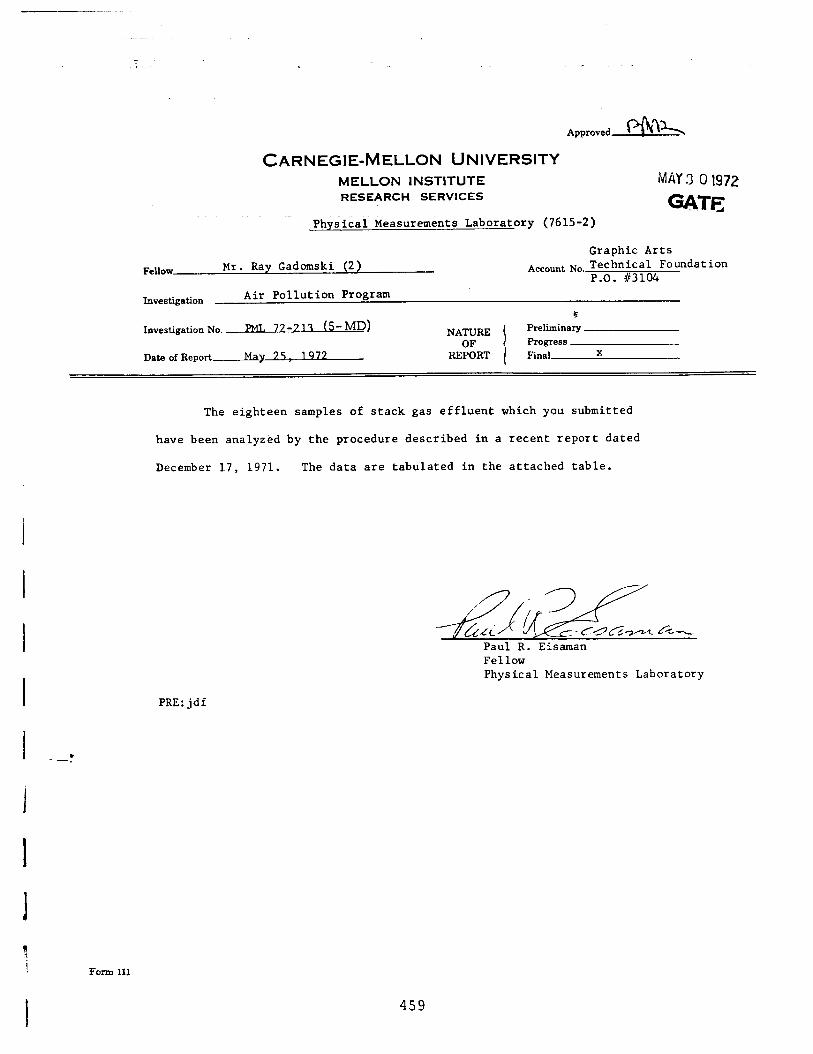
CARNEGIE-MELLON UNIVERSITY MELLON INSTITUTE MAY .3 o 1972 RESEARCH SERVICES
Physical Measurements Laboratory (7615-2)
Fellow Mr. Ray Gadomski (2)
Graphic Arts Account No. Technical Foundation
P.O. 83104
Investigation Air Pollution Program
Investigation No. ---Bs 77-7 12 (5- MD)
Date of Report-w
NATURE OF
REPORT
ii Preliminary Progress Final X
, I
I
I
I
I ---I 1
I
1 \ I
Form 111
The eighteen samples of stack gas effluent which you submitted
have been analyzed by the procedure described in a recent report dated
December 17, 1971. The data are tabulated in the attached table.
Paul R. Eisaman Fellow Physical Measurements Laboratory
PRE:jdf
459
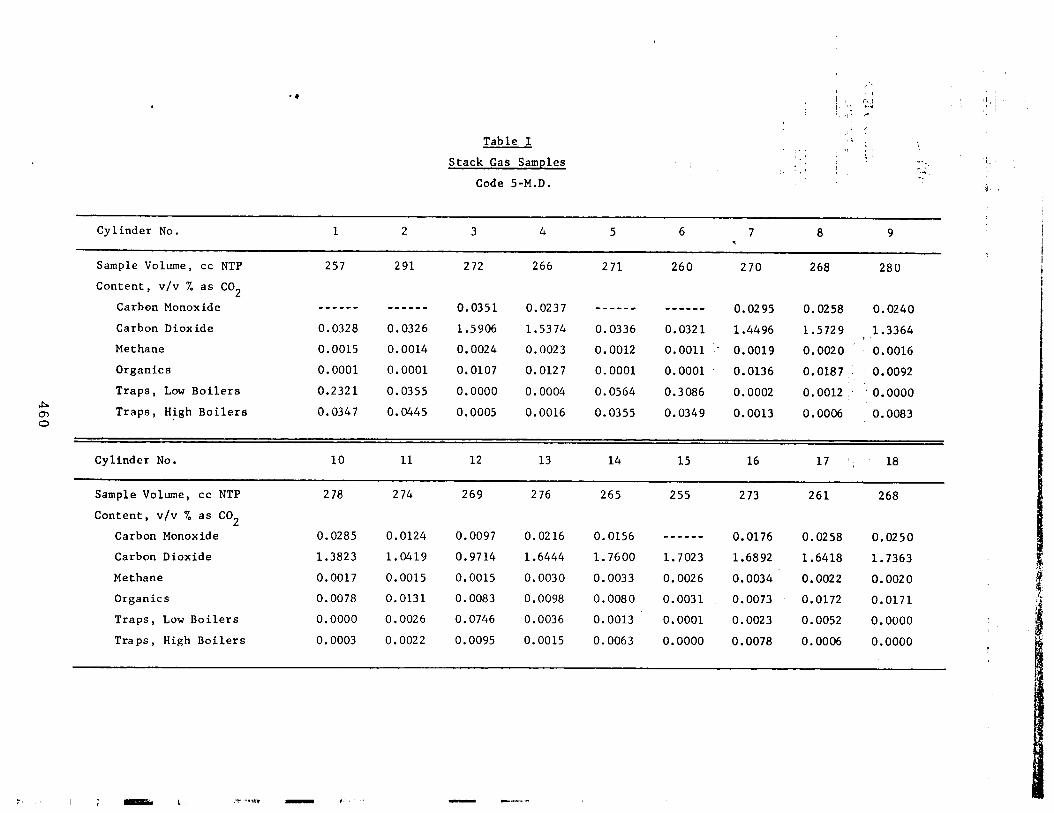
Stack Gas Samples
Code 5-M.D.
Cylinder No. 1 2 3 4 5 6 7 8 9 3
Sample Volume, cc NTP
Content, v/v % as CO2
Carbon Monoxide
Carbon Dioxide
Methane
257 291 272 266 271 260 270 268 280
----em ------ 0.0351 0.0237 ---m-s m---mm 0.0295 0.0258 0.0240
0.0328 0.0326 1.5906 1.5374 0.0336 0.0321 1.4496 1.5729 1.3364 ,
0.0015 0.0014 ’ 0.0024 0.0023 0.0012 0.0011 - 0.0019 0.0020 0.0016
Organics 0.0001 0.0001 0.0107 0.0127 0.0001 0.0001 0.0136 0.0187; 0.0092
Traps, Low Boilers 0.2321 0.0355 0.0000 0.0004 0.0564 0.3086 0.0002 0.0012 ,’ ’ 0.0000 A cn Traps, High Boilers 0.0347 0.0445 0.0005 0.0016 0.0355 0.0349 0.0013 0.0006 0.0083 0
Cylinder No.
Sample Volume, cc NTP
Content, v/v % as CO 2
Carbon Monoxide
Carbon Dioxide
Methane
Organics
Traps, Low Boilers
Traps, High Boilers
10 11 12 13 14 15 16 17 ‘; 18
278 274 269 276 265 255 273 261 268
0.0285 0.0124 0.0097 0.0216 0.0156 ------ 0.0176 0.0258 0.0250
1.3823 1.0419 0.9714 1.6444 1.7600 1.7023 1.6892 1.6418 1.7363
0.0017 0.0015 0.0015 0.0030 0.0033 0.0026 0.0034 0.0022 0.0020
0.0078 0.0131 0.0083 0.0098 0.0080 0.0031 0.0073 0.0172 0.0171
0.0000 0.0026 0.0746 0.0036 0.0013 0.0001 0.0023 0.0052 0.0000
0.0003 0.0022 0.0095 0.0015 0.0063 0.0000 0.0078 0.0006 0.0000
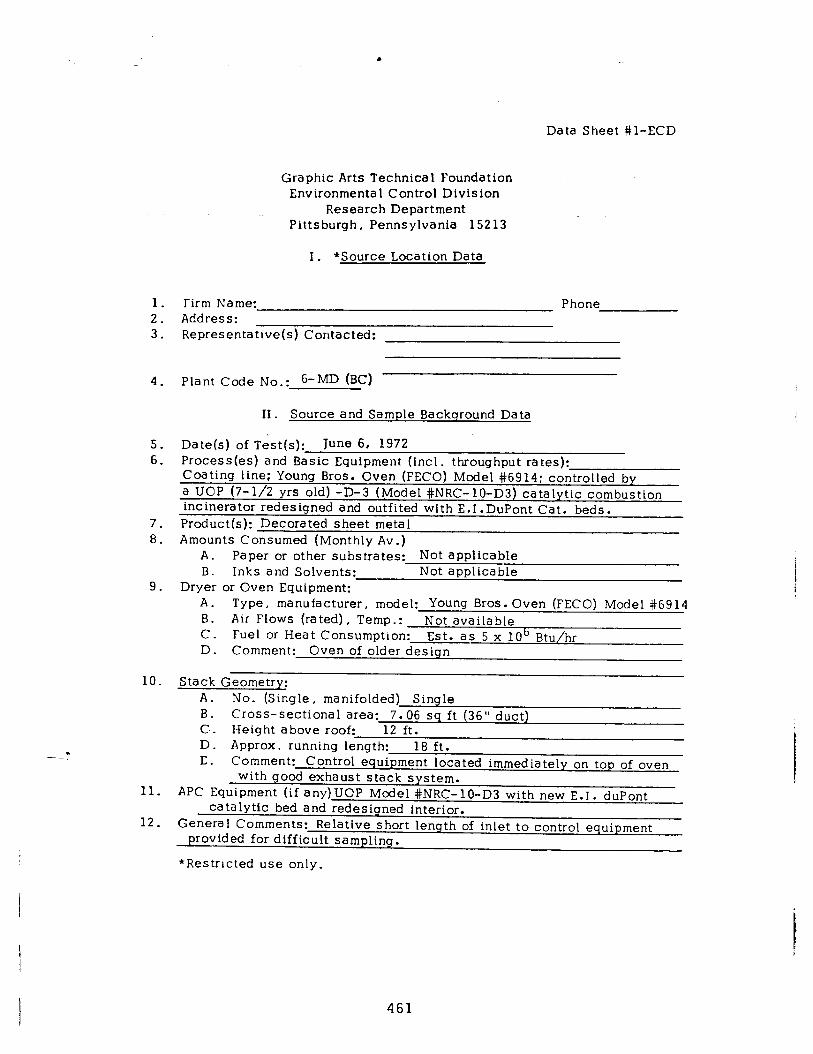
.
Data Sheet #l-ECD
Graphic Arts Technical Foundation Environmental Control Division
Research Department Pittsburgh, Pennsylvania 15213
I. *Source Location Data
1. Firm Name: Phone 2. Address: 3. Representative(s) Contacted:
4. Plant Code No.: 6-MD (BC)
II . Source and Sample Backqround Data
5. 6.
7. 8.
9.
10.
11.
12.
Date(s) of Test(s): June 6, 1972 Process(es) and Basic Equipment (incl. throughput rates): Coating line: Young Bros. Oven (FECO) Model #6914: controlled by a UOP (7-l/2 yrs old) -D-3 (Model #NRC-lo-D3) catalytic combustion incinerator redesigned and outfited with E.1 .DuPont Cat. beds. Product(s): Decorated sheet metal Amounts Consumed (Monthly Av .)
A. Paper or other substrates: Not applicable B. Inks and Solvents: Not applicable
Dryer or Oven Equipment: A. B. C. D.
Type, manufacturer, model: Young Bros. Oven (FECO) Model #6914 Air Flows (rated), Temp.: Not available Fuel or Heat Consumption: Est. as 5 x 10b Btu/hr Comment: Oven of older design
Stack Geometry: A. No. (Single, manifolded) Single B. Cross-sectional area: 7.06 sq ft (36” duct) c . Heis ht above roof: 12 ft. D. Appiox. running Id=: 18 ft. E. Comment: Control equipment lot . :ated immediately on top of oven
with good exhaust stack system. APC Equipment (if any)UOP Model #NRC-lo-D3 with new E.I. duPont
catalytic bed and redesigned interior. General Comments: Relative short length of inlet to control equipment
provided for difficult sampling.
*Restricted use only.
461
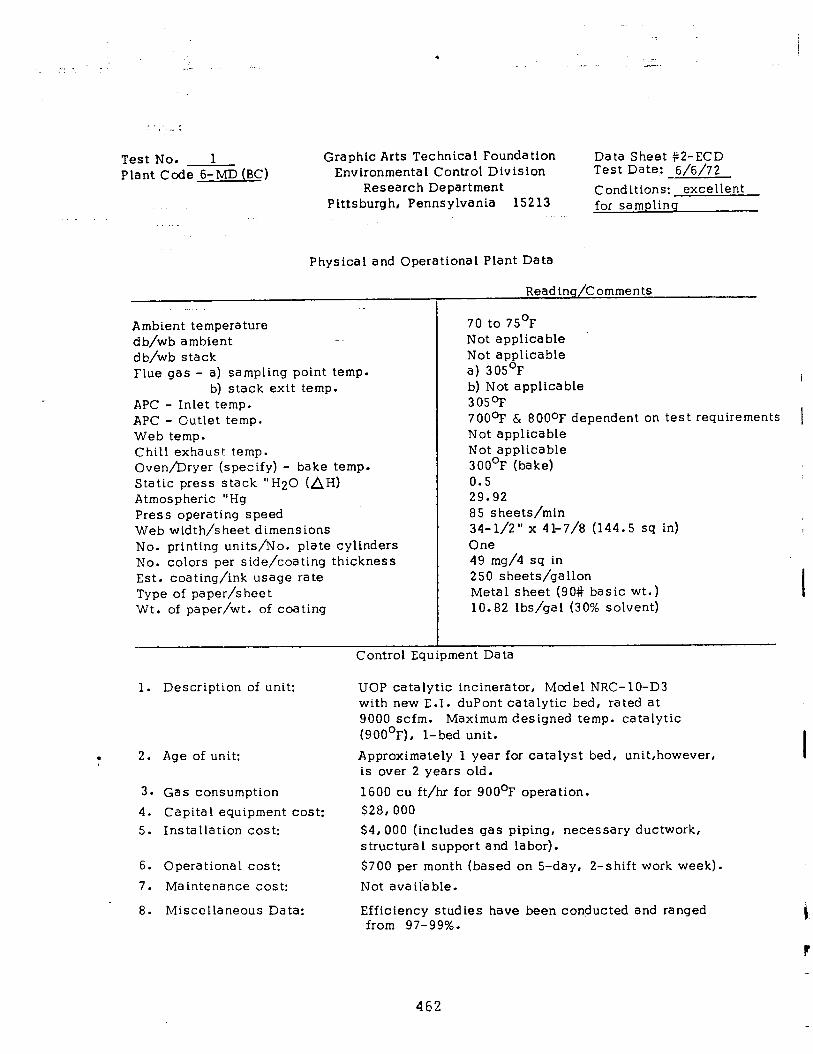
Test No. 1 Plant Code 6-MD (BC)
Graphic Arts Technical Foundation Data Sheet #2-ECD Environmental Control Division Test Date: 6/6/72
Research Department Condttlons: excellent Pittsburgh, Pennsylvania 15213 for sampling
Physical and Operational Plant Data
Ambient temperature db/wb ambient d b/wb stack Flue gas - a) sampling point temp.
b) stack exit temp. APC - Inlet temp. APC - Outlet temp. Web temp. Chill exhaust temp. Oven/Dryer (specify) - bake temp. Static press stack “H20 (AH) Atmospheric “Hg Press operating speed Web width/sheet dimensions No. printing units/No. plate cylinders No. colors per side/coating thickness Est. coating/ink usage rate Type of paper/sheet Wt. of paper/wt. of coating
1. Description of unit:
. 2. Age of unit:
3. Gas consumption 4. Capital equipment cost: 5. Installation cost:
6. Operational cost:
7. Ma intena nce cost:
8. Miscellaneous Data:
Reading/Comments
I
t requirements I
70 to 75’F Not applicable Not applicable a) 305’F b) Not applicable 305OF 700°F 6 8000F dependent on tes Not applicable Not applicable 300°F (bake) 0.5 29.92 85 sheets/min 34-l/2” x 41-7/8 (144.5 sq in) One 49 mg/4 sq in 250 sheets/gallon Metal sheet (90# basic wt.) 10.82 lbs/gal (30% solvent)
Control Equipment Data
UOP catalytic incinerator, Model NRC-lo-D3 with new E.I. duPont catalytic bed, rated at 9000 scfm. Maximum designed temp. catalytic (900°F), l-bed unit.
Approximately 1 year for catalyst bed, unit,however, is over 2 years old.
1600 cu ft/hr for 900°F operation. $28,000 $4,000 (includes gas piping, necessary ductwork, structural support and labor).
$700 per month (based on S-day, 2-shift work week).
Not avaiiable.
Efficiency studies have been conducted and ranged from 97-99%.
462
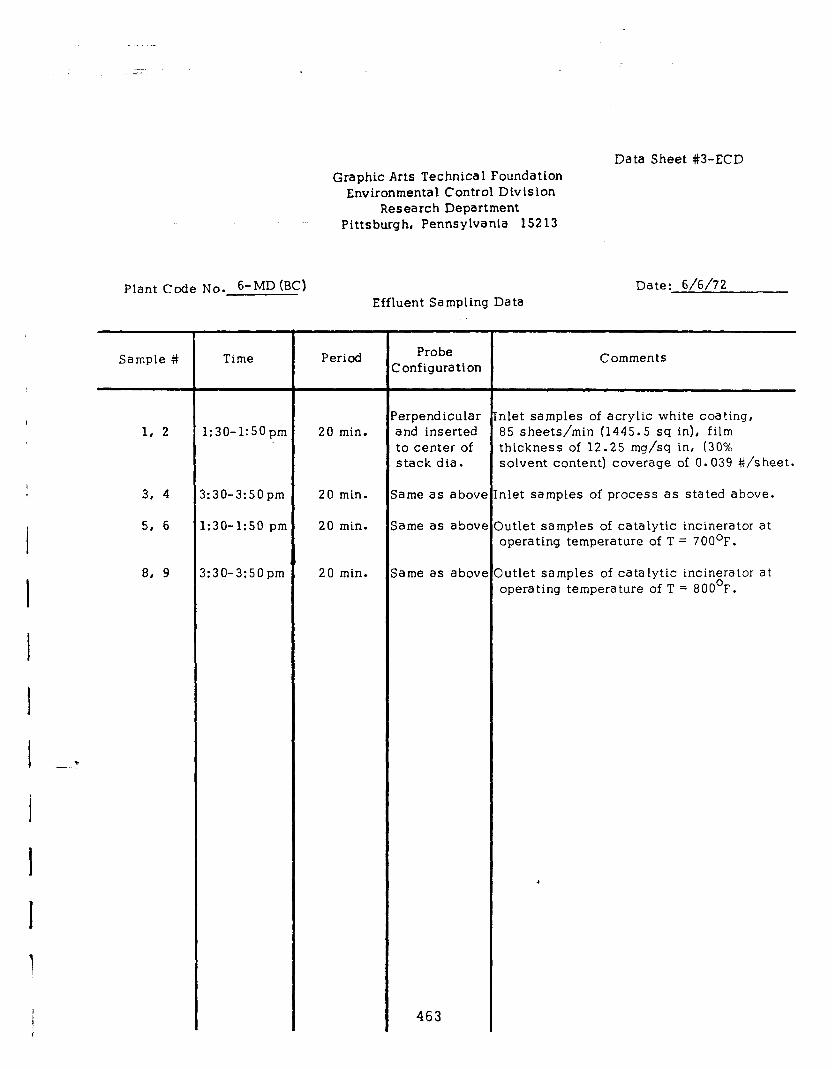
1, 2
3, 4
5, 6
1:30-3:50 pm
,:30-1:50 pm
20 min. lame as above
20 min. lame as abov
8, 9 1:30-3:SOpm 20 min. lame as abovi
Plant Code No. 6-MD (BC) Date: 6/6/72
Sample # Time Period
1:30-1:SOpm
Graphic Arts Technical Foundation Environmental Control Division
Research Department Pittsburgh, Pennsylvania 15213
Data Sheet #3-ECD
Effluent Sampling Data
20 min.
Probe Ionfiguration
‘erpendicular nlet samples of acrylic white coating, and inserted 85 sheets/min (1445.5 sq in), film to center of thickness of 12.25 mg/sq in, (30% stack dia. solvent content) coverage of 0.039 #/sheet.
nlet samples of process as stated above.
3utlet samples of catalytic incinerator at operating temperature of T = 7OO’F.
Iutlet samples of catalytic incinerator at operating temperature of T = 800°F.
463
Comments
.
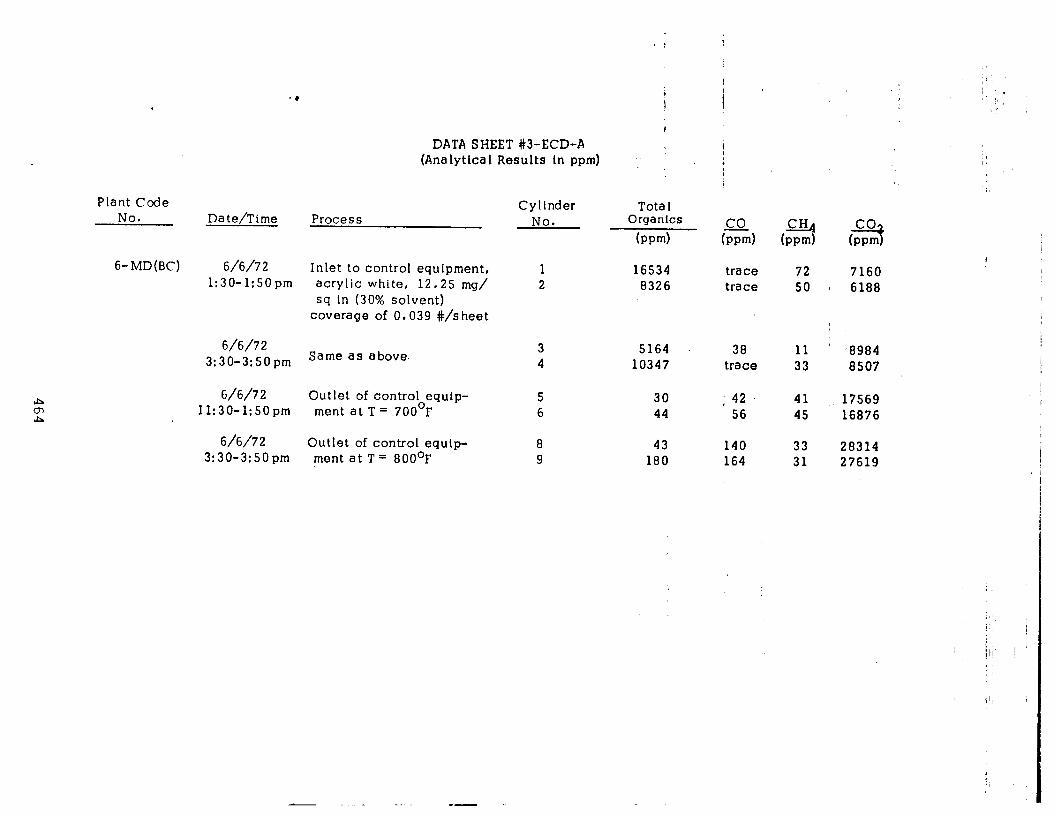
Plant Code No. Date/Time Process
6- MD(BC) 6/6/72 1:30-1:SOpm
( :
DATA SHEET #3-ECD-A (Analytical Results Ln ppm) ,
6/6/7 2 3:30-3:SOpm
6/6/7 2 Outlet of control equip- 5 ment at T= 700°F
30 I 42 41 11:30-1:SOpm
17569 6 44 56 45 16876
Inlet to control equipment, acrylic white, 12.25 mg/ sq in (30% solvent)
coverage of 0.039 #/sheet
Same as above.
6/6/7 2 Outlet of control equip- 8 43 140 3:30-3:SOpm ment at T= 800°F 9 180 164
Cylinder No.
Tota 1 Organics
hmd CHI kv-4 (-3
1 16534 2 8326
(2% trace trace
72 7160 50 6188
3 5164 . 38 11 8984 4 10347 trace 33 8507
33 28314 31 27619
!
,
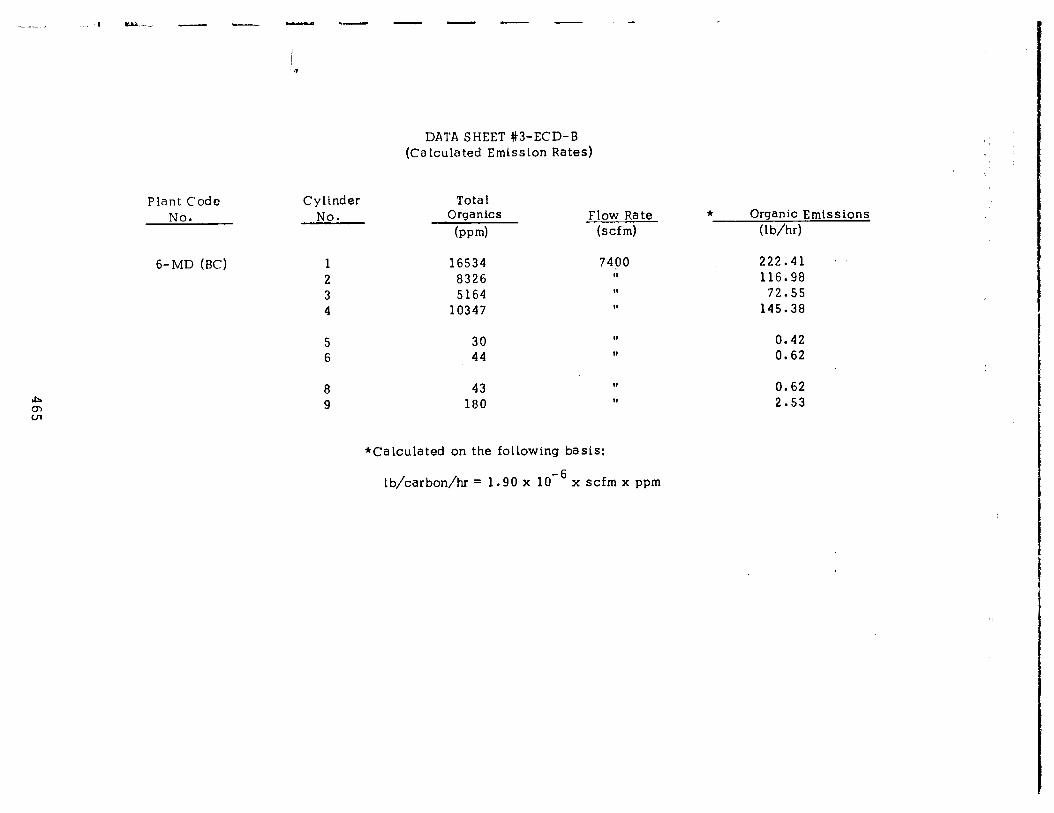
DATA SHEET #3-ECD-B (Calculated Emission Rates)
4
03
CJl
Plant Code Cylinder No. No.
6-MD (BC)
Tota 1 Organlcs
bpm) Flow Rate
(scfm)
1 16534 7400 222.41 2 8326 II 116.98 3 5164 II 72.55 4 10347 II 145.38
5 30 II 0.42 6 44 11 0.62
8 43 II 0.62 9 180 II 2.53
*Calculated on the following basis:
* Organic Emissions (lb/hd
lb/carbon/x = 1.90 x 10e6 x scfm x ppm
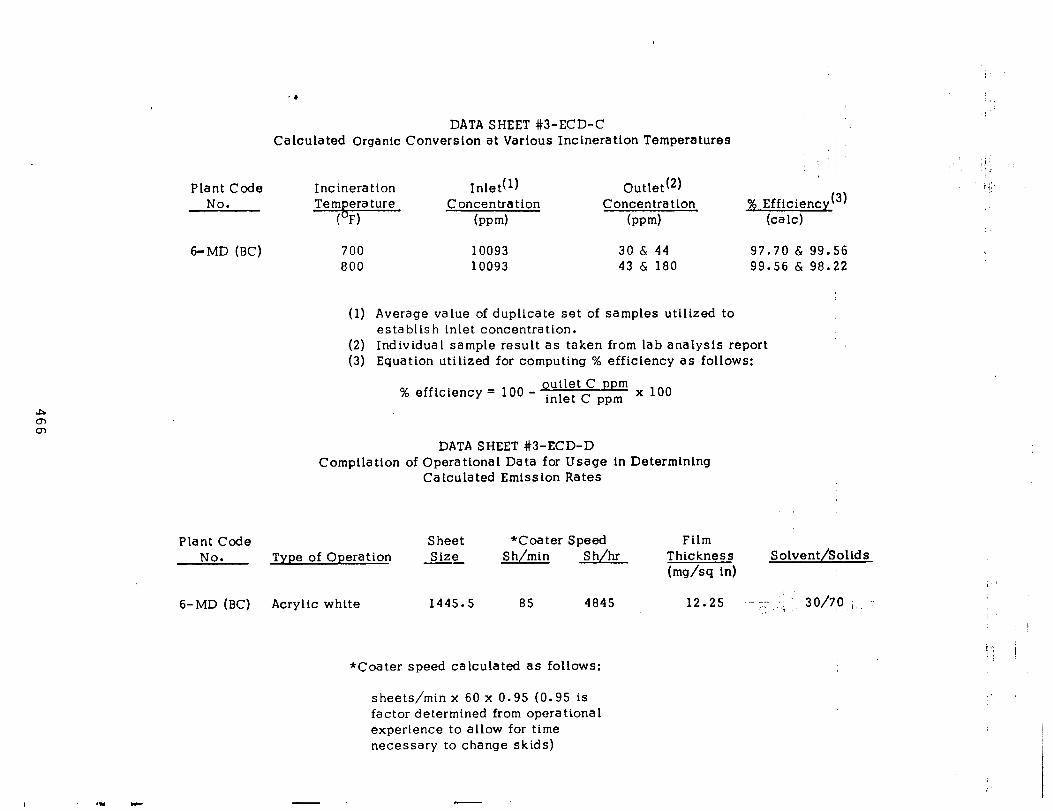
-*
DATA SHEET #3-ECD-C Calculated Organic Conversion at Various Incineration Temperatures
Plant Code No.
6-MD (BC)
Incineration Inlet(l) Temperature Concentration
(OF) bw-4
700 10093 800 10093
Outlet(2) Concentra tlon
(rwd
30 & 44 43 & 180
(1) Average value of duplicate set of samples utilized to establish inlet concentration.
% Efficiency(3) (ca lc)
97.70 & 99.56 99.56 & 98.22
(2) Individual sample result as taken from lab analysis report (3) Equation utilized for computing % efficiency as follows:
outlet C % efficiency = 100 - inlet c pppPm m x 100
DATA SHEET #3-ECD-D Compilation of Operatlonal Data for Usage ln Determtntng
Calculated Emission Rates
Plant Code Sheet *Coater Speed Film No. Type of Operation Size S h/hr S h/min Thickness Solvent/Solids --
h/w in)
6-MD (BC) Acrylic whlte 1445.5 85 4845 12.25 .I- :;;‘ :; ’ 30/79 i -; _I
*Coater speed calculated as follows:
I
sheets/minx 60 x 0.95 (0.95 is factor determined from operational experience to allow for time necessary to change skids)

------ ..__ - ..-._ _-. ---..--- _ . . -.._- ^,“_” . ..- . “. _-_. I __... -_ ._..--. ..ll,ll-“-.,“.-.---- I.^-___I__
DATA SHEET #3-ECD-E Comparison of Calculated and Observed Emission Rates
Type of Operation
Acrylic white -
a. b.
Plant Code No. 6-MD (BC)
Organic Emis s iona obs. - talc. .
139.44 271.25
Eobs/Ecalcb
0.47
Expressed as lb carbon/hr C as in equation (4) data treatment of this report
. --.
467
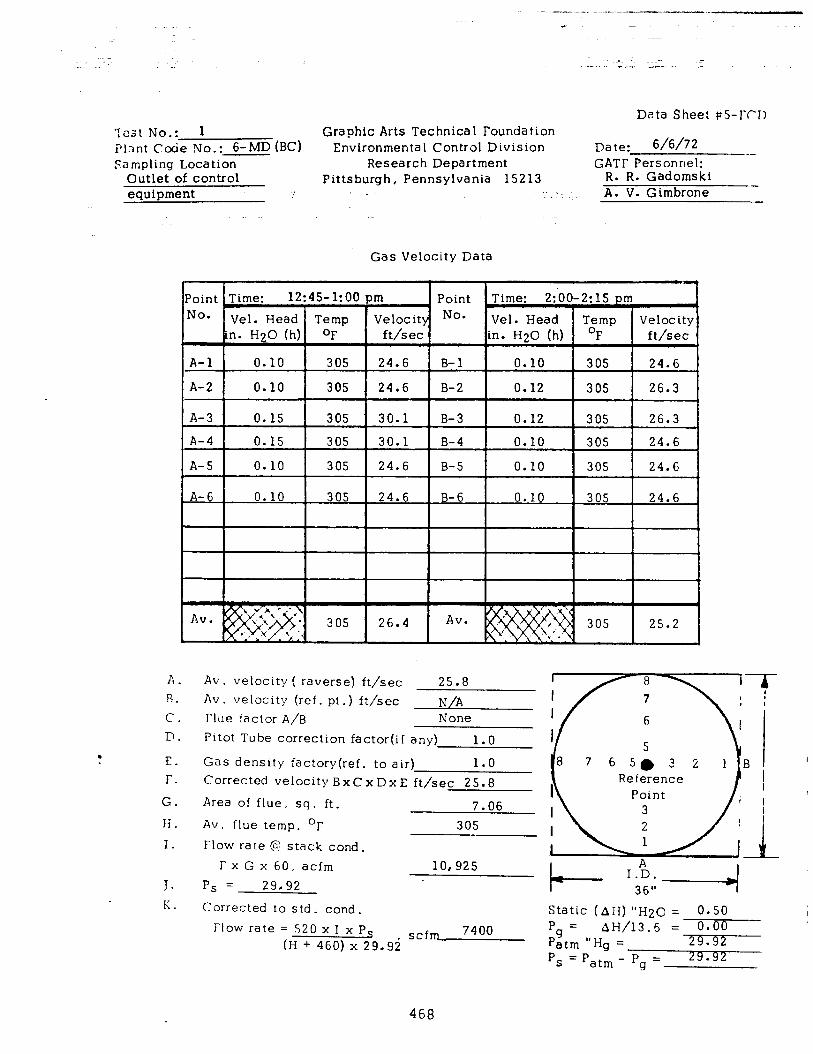
.-.__- -. ..,_ _.-_--__I_ -
.~
-7 -
Data Sheet p5-FfD ‘rest No.: 1 Graphic Arts Technical Foundation Plant Code No . 6-MD (BC) . . Environmental Control Division Date: 6/6/72
Sampling Coca tion Research Department GATF Personnel: -- Outlet of control Pittsburgh, Pennsylvania 15213 R. R. Gadomski
- equipment ..‘! .,. A. V. Gimbrone
Gas Velocity Data
-t Point Time: 12:45-1:00 pm Point Time: 2:‘00-2: 15 pm No. Vel. Head Temp Velocity No* Vel. Head Temp Velocity
in. H20 (h) OF ft/sec in. H20 (h) OF ft/sec
A-l 0.10 305 24.6 B-l 0.10 305 24.6
A-2 0.10 305 24.6 B-2 0.12 305 26.3
A. B. c-. D.
E. f.
G.
Ii. 1.
J. K.
Av. velocity ( raverse) ft/sec 25.8 Av. velocity (ref. pt.) ftjsec N/A rlue factor A/B None PItot Tube correction factor(if any) 1.0
Gas density factory(ref. to air) 1.0 Corrected velocity BxCxDxE ft/sec 25.8
Area of flue, sq. ft. 7.06 Av. flue temp. Or 305 Flow rate @ stack cond.
FxG x 60, acfm P, = 29.92
10,925
Corrected to std. cond _
Flow rate = 520 x I x P, m 7400 (H + 460) x 29.9i scf
Static (AH) “H20 = 0.50 Pg = AH/13.5 = 0.00 Patm “Hg = . P, = Pat, - Pg = 29.82
468
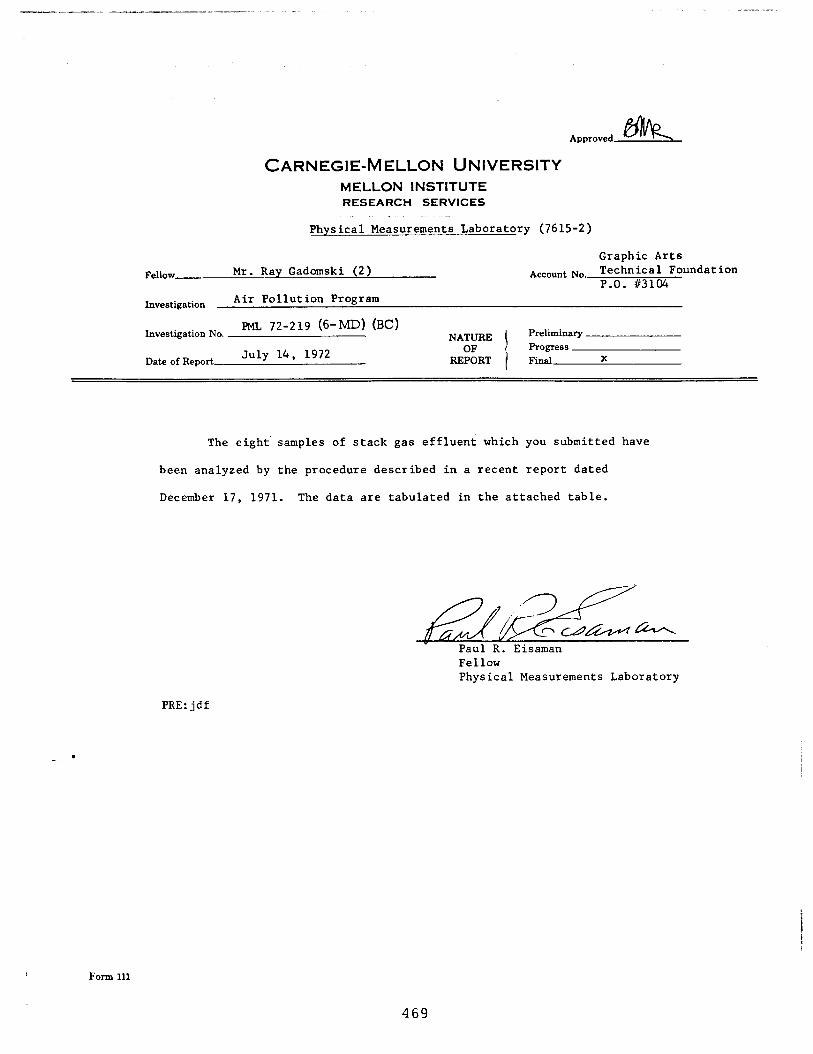
.__---_-_
CARNEGIE-MELLON UNIVERSITY MELLON INSTITUTE RESEARCH SERVICES
Physical Measurements Laboratory (7615-2)
Fellow Mr. Ray Gadomski (2) Graphic Arts
Account No. Technical Foundation P-0. t3104
Investigation Air Pollution Program
Investigation No. m 72-219 (6-MD) (EC)
Preliminary Progress
Date of Report- July 14, 1972 Final X
The eight samples of stack gas effluent which you submitted have
been analyzed by the procedure described in a recent report dated
December 17, 1971. The data are tabulated in the attached table.
Fellow Physical Measurements Laboratory
PRE:jdf
Form 111
469
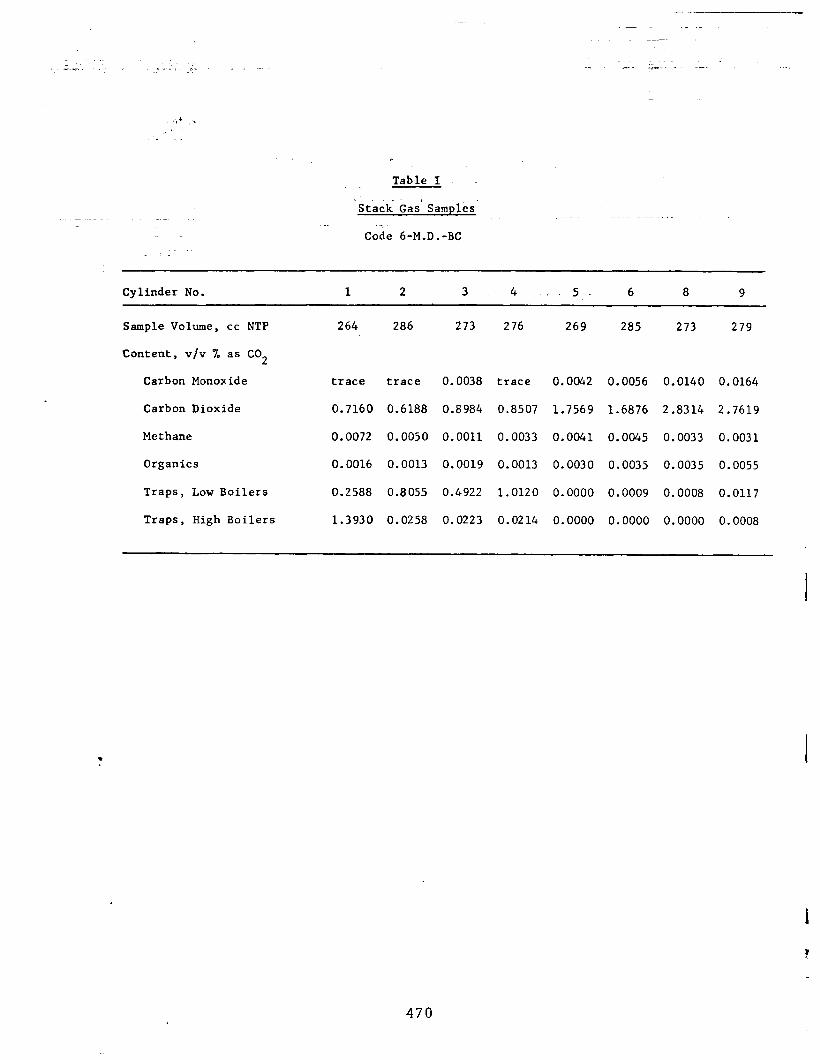
Table I
St&k Gas' Samples.
Code 6-M.D.-BC
Cylinder No. 1 2 3 4 ., 5. 6 8 9
Sample Volume, cc NTP
Content, v/v % as CO2
Carbon Monoxide
Carbon Dioxide
Methane
Organics
Traps, Low Boilers
Traps, High Boilers
264 286 273 276 269 285 273 279
trace trace 0.0038 trace 0.0042 0.0056 0.0140 0.0164
0.7160 0.6188 0.8984 0.8507 1.7569 1.6876 2.8314 2.7619
0.0072 0.0050 0.0011 0.0033 0.0041 0.0045 0.0033 0.0031
0.0016 0.0013 0.0019 0.0013 0.0030 0.0035 0.0035 0.0055
0.2588 0.8055 0.4922 1.0120 0.0000 0.0009 0.0008 0.0117
1.3930 0.0258 0.0223 0.0214 0.0000 0.0000 0.0000 0.0008
470
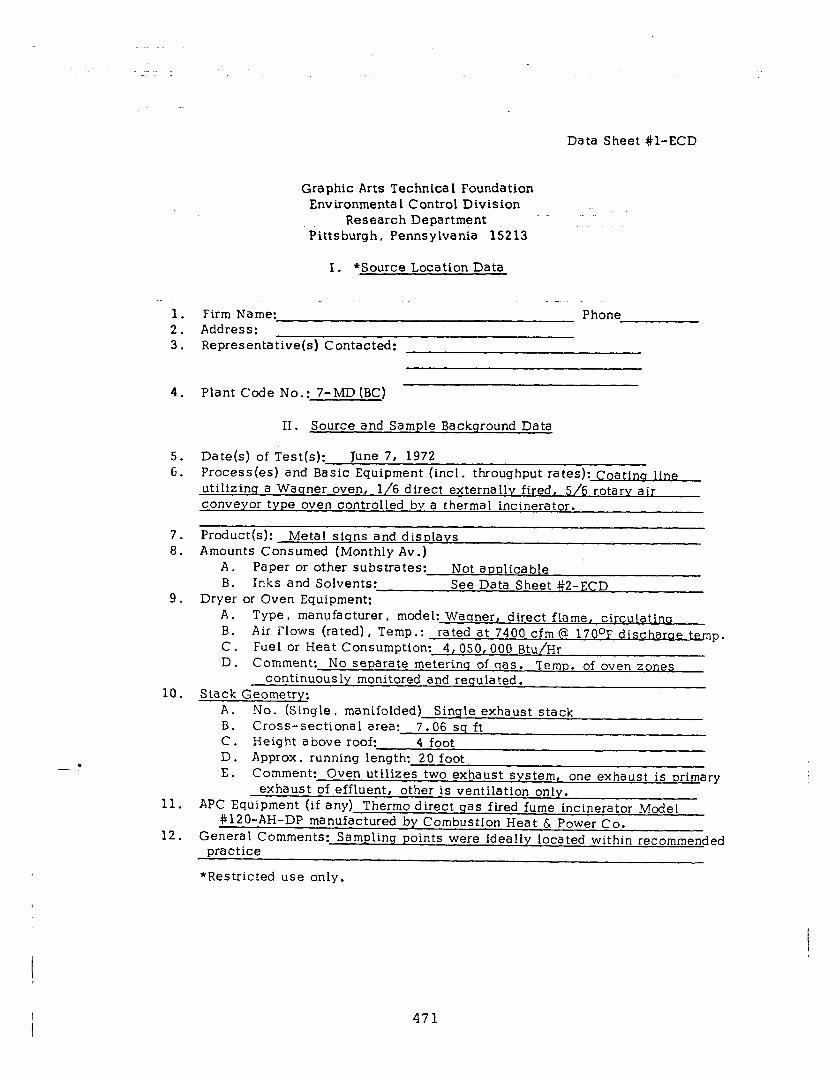
Data Sheet #l-ECD
Graphic Arts Technica 1 Foundation Environmental Control Division
Research Department Pittsburgh, Pennsylvania 15213
I. *Source Location Data
_. .~.
1. Firm Name: Phone 2. Address: 3. Representative(s) Contacted:
4. Plant Code No.: 7-MD (BC)
II . Source and Sample Backqround Data
5. Date(s) of Test(s): June 7, 1972 6. Process(es) and Basic Equipment (incl. throughput rates): Coat’we
utilizing a Waqner oven, l/6 direct externally fired, 5/6 rotary air conveyor type oven controlled bv a thermal incinerator.
7. Product(s): Metal signs and displavs 8. Amounts Consumed (Monthly Av .)
A. Paper or other substrates: Not applicable B. Inks and Solvents: See Data Sheet #2-ECD
9. Dryer or Oven Equipment: A. Type, manufacturer, model: Waqner, direct flame, circulatino B. Air Flows (rated), Temp.: rated at 7400 cfm @ 170°F discharoe tern C. Fuel or Heat Consumption: 4,050,OOO Btu/Hr
Pa
D. Comment: No separate meterinq of qas. Temp. of oven zones continuously monitored and requ la ted.
10. Stack Geometry: A. No. (Single, manifolded) Single exhaust stack B. Cross-sectionat area: 7.06 sq ft C. Height above roof: 4 foot D. Approx. running length: 20 foot E. Comment: Oven utilizes two exhaust system, one exhaust is primary
exhaust of effluent, other is ventilation only. 11. APC Equipment (if any) Therm0 direct qas fired fume incinerator Model
#120-AH-DP manufactured by Combustion Heat 6, Power Co. 12. General Comments: Sampling points were ideally located within recommended
practice
*Restricted use only.
471
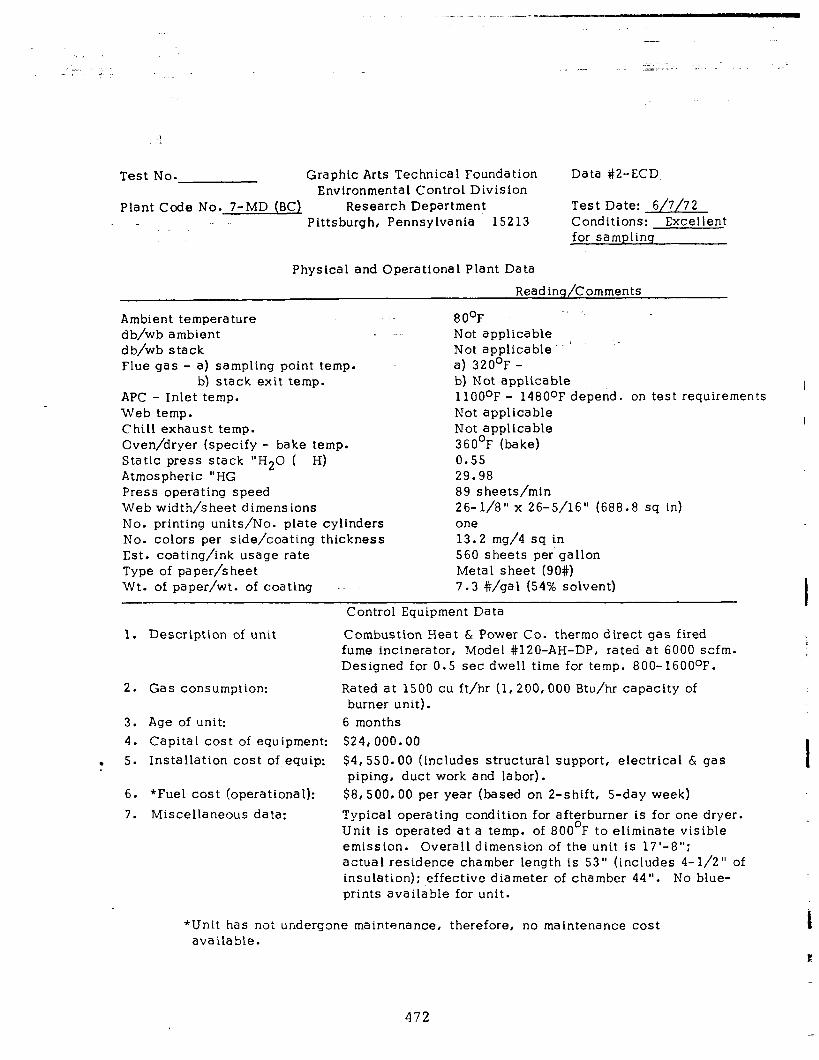
Test No. Graphic Arts Technica 1 Foundation Data #2-ECD Environmental Control Division
Plant Code No. 7-MD (BC) Research Department Test Date: 6/7/72 Pittsburgh, Pennsylvania 15213 Conditions: Excellent
for sampling
Physical and Operational Plant Data
Reading/Comments
Ambient temperature 8 O°F db/wb ambient Not applicable db/wb stack Not applicable ’ ” Flue gas - a) sampling point temp. a) 320’F -
b) stack exit temp. b) Not applicable I APC - Inlet temp. 1lOOOF - 14800F depend. on test requirements Web temp. Not applicable Chill exhaust temp. Not applicable
t
Oven/dryer (specify - bake temp. 360°F (bake) Static press stack “H20 ( H) 0.55 Atmospheric “HG 29.98 Press operating speed 89 sheets/min Web width/sheet dimensions 26-l/8” x 26-S/16” (688.8 sq in) No. printing units/No. plate cylinders one No. colors per side/coating thickness 13.2 mg/4 sq in Est. coating/ink usage rate 560 sheets per gallon Type of paper/sheet Metal sheet (90#) Wt. of paper/wt. of coating .- 7.3 #/gal (54% solvent)
I Control Equipment Data
1. Description of unit Combustion Heat & Power Co. therm0 direct gas fired fume incinerator, Model #120-AH-DP, rated at 6000 scfm. Designed for 0.5 set dwell time for temp. 800-16OOOF.
2. Gas consumption: Rated at 1500 cu ft/hr (1,200,OOO Btu/hr capacity of burner unit).
3. Age of unit: 6 months 4. Capital cost of equipment: $24,000.00
. 5. Installation cost of equip: $4,550.00 (includes structural support, electrical & gas I piping, duct work and labor).
6. *Fuel cost (operational): $8,500.00 per year (based on 2-shift, S-day week) 7. Miscellaneous data: Typical operating condition for afterburner is for one dryer.
Unit is operated at a temp. of 800°F to eliminate visible emission. Overall dimension of the unit is 17’-8”; actual residence chamber length is 53” (includes 4-l/2” of insulation): effective diameter of chamber 44”. No blue- prints available for unit.
*Unit has not undergone main.tenance, therefore, no maintenance cost I available.
r
472
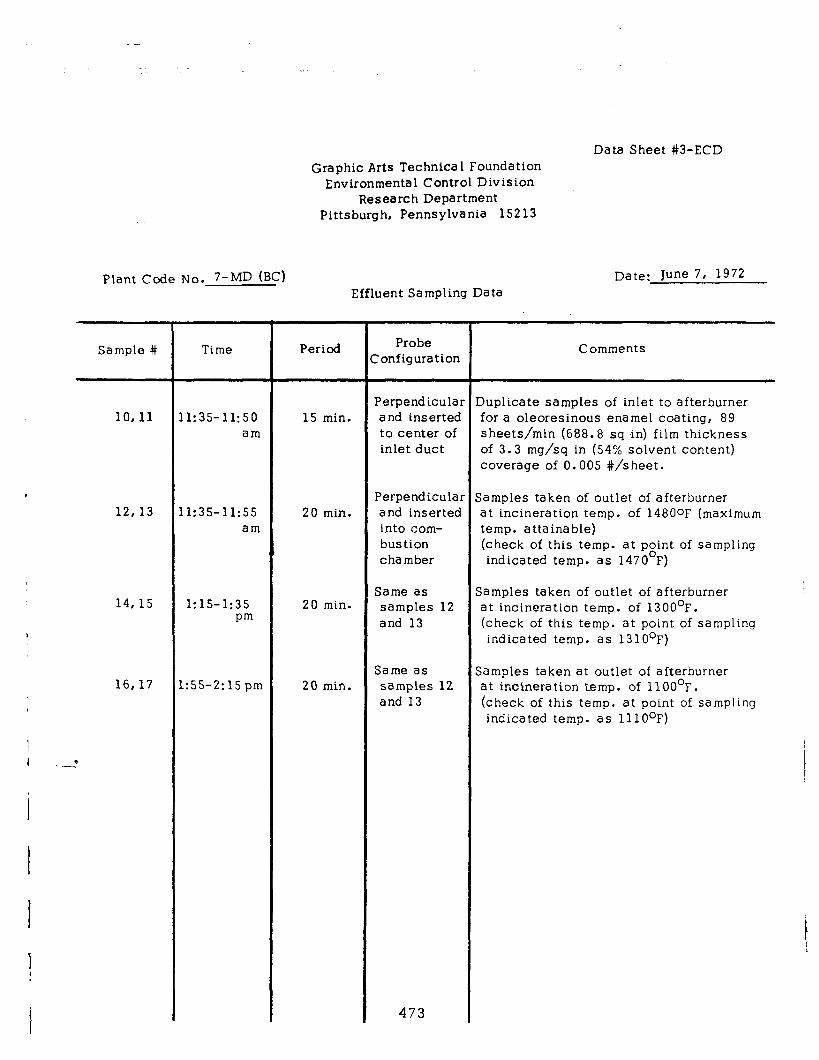
Sample #
Perpendicular Duplicate samples of inlet to afterburner 10,ll 11:35-11:50 15 min. and inserted for a oleoresinous enamel coating, 89
am to center of sheets/min (688.8 sq in) film thickness inlet duct of 3.3 mg/sq in (54% solvent content)
coverage of 0.005 #/sheet.
Perpendicular Samples taken of outlet of afterburner 12,13 11:35-11:55 20 min. and inserted at incineration temp. of 14800F (maximum
am into com- temp. attainable) bustion (check of this temp. at point of sampling chamber indicated temp. as 147O’F)
Same as Samples taken of outlet of afterburner 14,15 1:15-1:35 20 min.
pm samples 12 at incineration temp. of 13OO’F. and 13 (check of this temp. at point of sampling
indicated temp. as 131OOF)
Same as Samples taken at outlet of afterburner 16,17 L:55-2: 15 pm 20 min. samples 12 at incineration temp. of 11OO’F.
and 13 (check of this temp. at point of sampling indicated temp. as lllO°F)
Time Period
Graphic Arts Technica 1 Foundation Environmental Control Division
Research Department Pittsburgh, Pennsylvania 15213
Data Sheet #3-ECD
Probe Zonfiguration
Plant Code NO. 7-MD (BC) Effluent Sampling Data
Date: guile 7, 1972
Comments
473

DATA SHEET #3-ECD-A (Analytical Results in ppm)
Plant Code Cylinder No. Date/Time Process No.
7-MD (BC) 6/7/72 11:35-1l:SOam
6/7/7 2 Outlet of control equip. 16 188 1:55-2: 15 pm at T= 1lOO’F 17 102
6/7/72 Outlet of control equip. 1: 15-1:35 pm at T= 13OO’F
6/7/72 Outlet of control equip. 11:35-11:55am at T = 148O’F
Inlet to control equip. oleoresinous enamel, 3.3 mg/sq in (54 % solvent) coverage of 0.005 #/sheet
Tota 1 Organics
hwd
10 3474 11 2894
14 15
12 13
25 35
46 20
! .?
!
CH4 co:! bpm) (rwm)
71 8926 68 9030
548 yg
trace 127
210 ‘28570 198 38146
109 36964 120 36827
877 107 37700 702 60 38977
. .
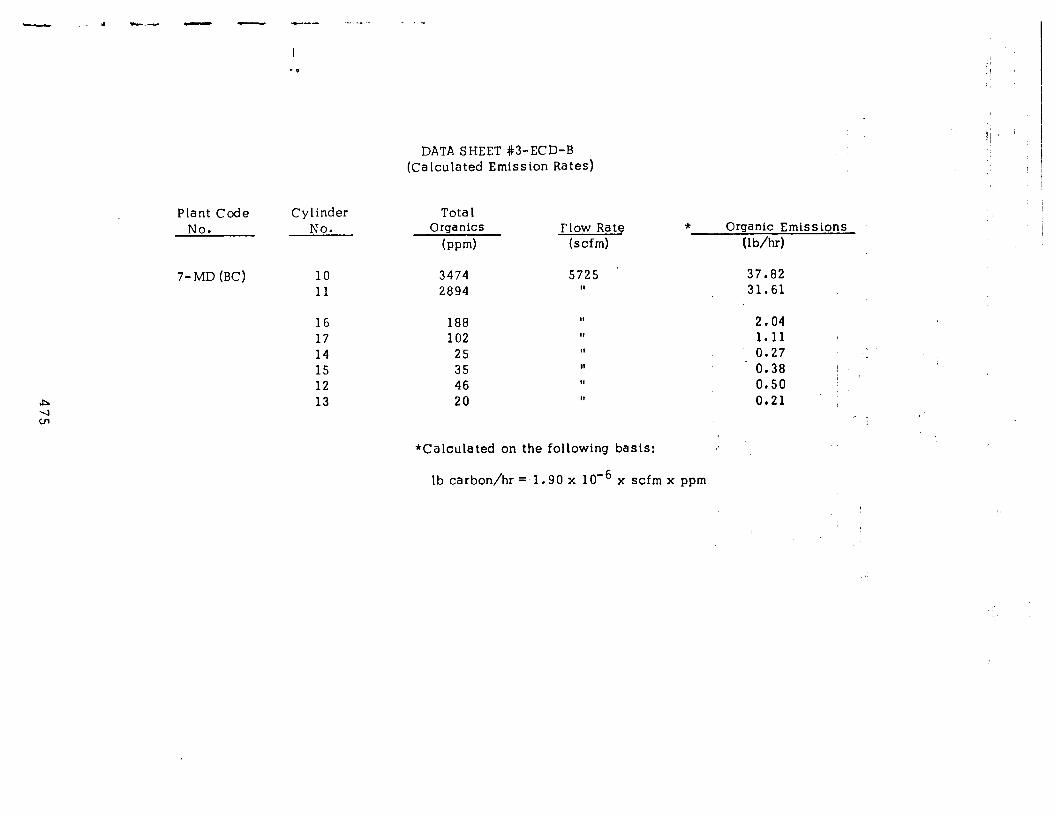
- . Y - - - -’ -.__-- - .-
Plant Code Cylinder No. No.
7-MD (BC) 10 3474 5725 37.82 11 2894 II 31.61
16 188 17 102 14 25 15 35 12 46 13 20
DATA SHEET #3-ECD-B (Calculated Emission Rates)
Ii, ’ /
1
Tota 1 Organics
bpd Flow Ratg
(scfm) * Organic Emissions
Zlbhr)
2.04 1.11 0.27 0.38 0.50 0.21
: , 1
*Calculated on the following basts:
lb carbon/hr = 1.90 x 10e6 x scfm x ppm
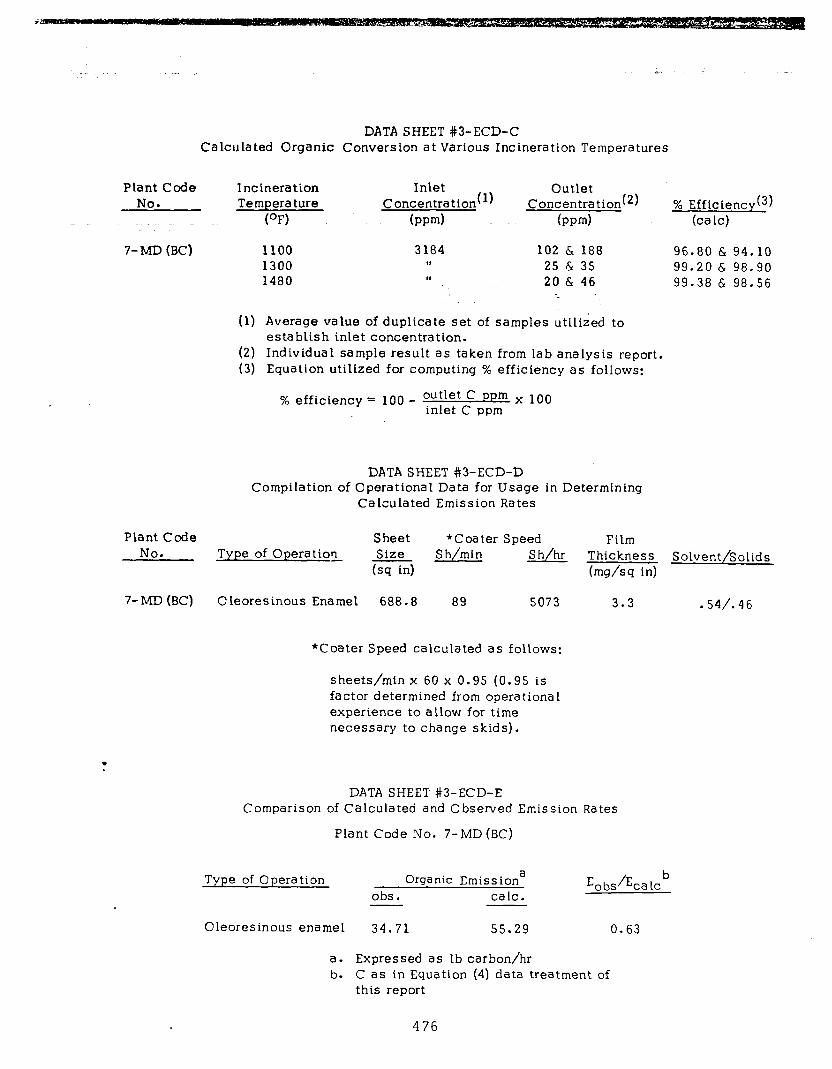
DATA SHEET #3-ECD-C Calculated Organic Conversion at Various Incineration Temperatures
Plant Code No.
7-MD (BC)
Plant Code No.
7- hm (BC)
Incineration Inlet Temperature Concentration(l) ConZ1LltZtion(2) % Efficiency13)
(OF) (ppm) km) (ca lc)
1100 3184 102 & 188 96.80 & 94.10 1300 I, 25 r; 35 99.20 & 98.90 1480 I, 20 & 46 .~ 99.38 & 98.56
“-
(1) Average value of duplicate set of samples utilized to establish inlet concentration.
(2) Individual sample result as taken from lab analysis report. (3) Equation utilized for computing % efficiency as follows:
% efficiency = 100 - outlet C ppm x I88 inlet C ppm
DATA SHEET #3-ECD-D Compilation of Operational Data for Usage in Determining
Calculated Emission Rates
Sheet *C oa ter Speed Film Type of Operatiox Size h/min S Sh/hr Thickness Solvent/Solids
(sq in) (mg/sq in)
Oleoresinous Enamel 688.8 89 5073 3.3 . 54/. 46
*Coater Speed calculated as follows:
sheets/min x 60 x 0.95 (0.95 is factor determined from opera tiona 1 experience to allow for time necessary to change skids).
DATA SHEET #3-ECD-E Comparison of Calculated and Obsenred Emission Rates
Plant Code No. 7-MD (BC)
Type of Operation Organic Emissiona E ohs,
Obs/Eca lcb talc.
Oleoresinous enamel 34.71 55.29 0.63
a. Expressed as lb carbon/hr b. C as in Equation (4) data treatment of
this report
476
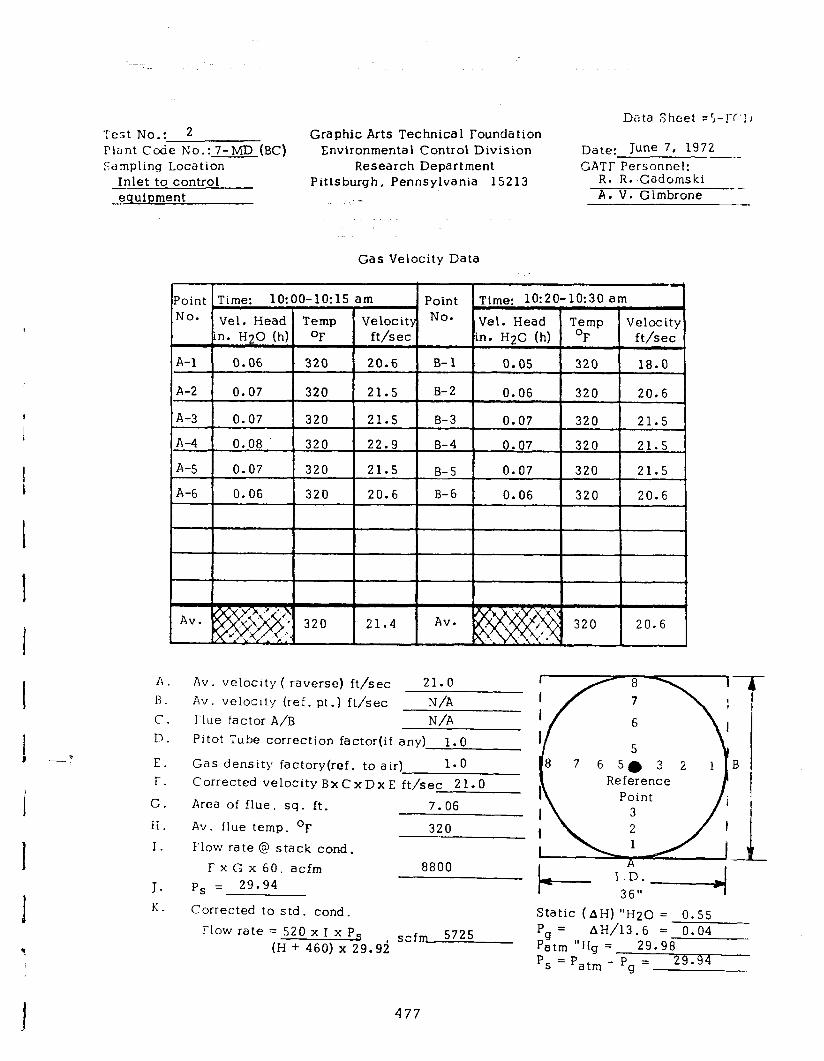
1 -Y
Data Sheet r’,-I‘T’IJ
Test No.: 2 Graphic Arts Technical Foundation Plant Code No.: 7-MD (BC) Environmental Control Division Date: June 7, 1972 Sampling Location Research Department GATE Personnel: --
Inlet to control Pittsburgh, Pennsylvania 15213 R. R. Gadomski - equipment ::- A. V. Gimbrone - -
Gas Velocity Data
A.
i3 .
c. D.
E. I-.
G.
II.
I.
J. K.
Point Time: lO:OO-lo:15 am Point Time: 10:20-lo:30 am No. Vel. Head Temp Velocity Noo Vel. Head Temp Velocity
in. H20 (h) OF ft/sec in. H20 (h) OF ft/sec
A-l 0.06 320 20.6 B-l 0.05 320 18.0
A-2 0.07 320 21.5 B-2 0.06 320 20.6 . A-3 A-3 0.07 0.07 320 320 21.5 21.5 B-3 B-3 0.07 0.07 320 320 21.5 21.5
A-4 A-4 1 0.08 1 320 0.08 320 22.9 22.9 B-4 B-4 0.07 0.07 320 320 21.5 21.5
A-5 A-5 0.07 0.07 320 320 21.5 21.5 B-5 B-5 0.07 0.07 320 320 21.5 21.5
A-6 A-6 0.06 0.06 320 320 20.6 20.6 B-6 B-6 0.06 0.06 320 320 20.6 20.6
Av. velocity ( raverse) ft/sec 21.0 Av. velocity (ref. pt.) ft/sec N/A Flue factor A/B N/A Pitot Tube correction factor(if any) 1.0
Gas density factory(ref. to air) 1.0 Corrected velocity BxCxDxE ft/sec 21.0
Area of flue, sq. ft. 7.06
Av. flue temp. OF 320 Flow rate @ stack cond.
FxG x 60. acfm P, = 29.94
Corrected to std. cond .
8800
rlow rate = 520 x I x Ps (H + 460) x 29.92 scf
m 5725
Static (AH) “H20 = 0.55 Pg = AH/l3.6 = 0.04 Patm “Hg = 29.98 P, = Pat, - Pg = 29.94
1 477
. .
“L. -.- t.-.-I..~-- -m-.-m --
.-
- Approved~ / CARNEGIE-MELLON UNIVERSITY
. MELLON INSTITUTE .__ .-- - RESEARCH SERVICES
Physical Measurements Laboratory (7615-2) -~
Fellow Mr. Ray Gadomski (2)
Graphic Arts Account NoTechnical Foundation
Investigation Air Pollution Program r
. .
PML 72-220 (7-MD) (BC) Investigation No. -
July 14, 1972 Date of Report-
NATURE
I
Preliminary
OF Progress .' REPORT Final X
The eight samples of stack gas effluent which you submitted have
been analyzed by the procedure described in a recent report dated
December 17, 1971. The results are tabulated in the attached table.
$!5i2&4eLs Paul R. Eisaman Fellow Physical Measurements Laboratory
. PRE:jdf
Form 111
4 78
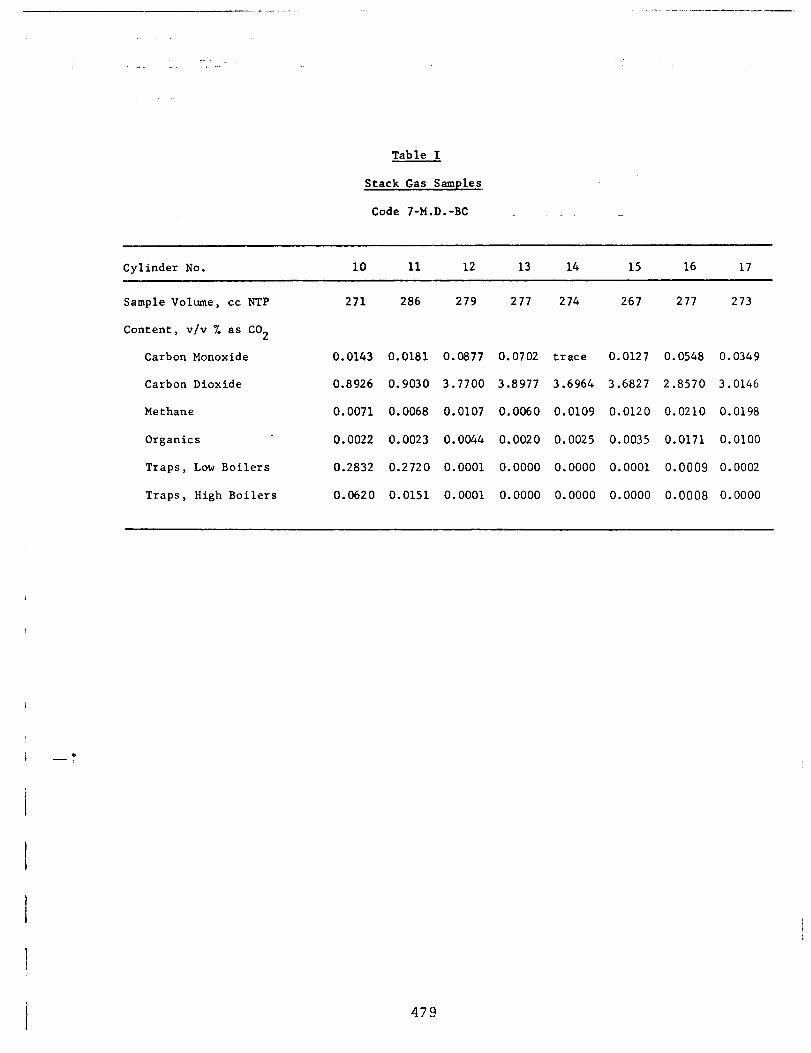
_ _ .__ ____- ___-
Table I
Stack Gas Samples
Code 7-M.D.-BC
Cylinder No. 10 11 12 13 14 15 16 17 -
Saunple Volume, cc NTP 271 286 279 277 274 267 277 273
Co,ntent, v/v % as CO2
Carbon Monoxide
Carbon Dioxide
0.0143 0.0181 0.0877 0.0702 trace 0.0127 0.0548 0.0349
0.8926 0.9030 3.7700 3.8977 3.6964 3.6827 2.8570 3.0146
Methane 0.0071 0.0068 0.0107 0.0060 0.0109 0.0120 0.0210 0.0198
Organics 0.0022 0.0023 0.0044 0.0020 0.0025 0.0035 0.0171 0.0100
Traps, Low Boilers 0.2832 0.2720 0.0001 0.0000 0.0000 0.0001 0.0009 0.0002
Traps, High Boilers 0.0620 0.0151 0.0001 0.0000 0.0000 0.0000 0.0008 0.0000
I
i --?
47 9
3-v ._ -s---.2-.
- : _-. . - .
i
480
APPENDX F
Carnegie Mellon University Mellon Institute
Physical Measurements Laboratory Reports
481
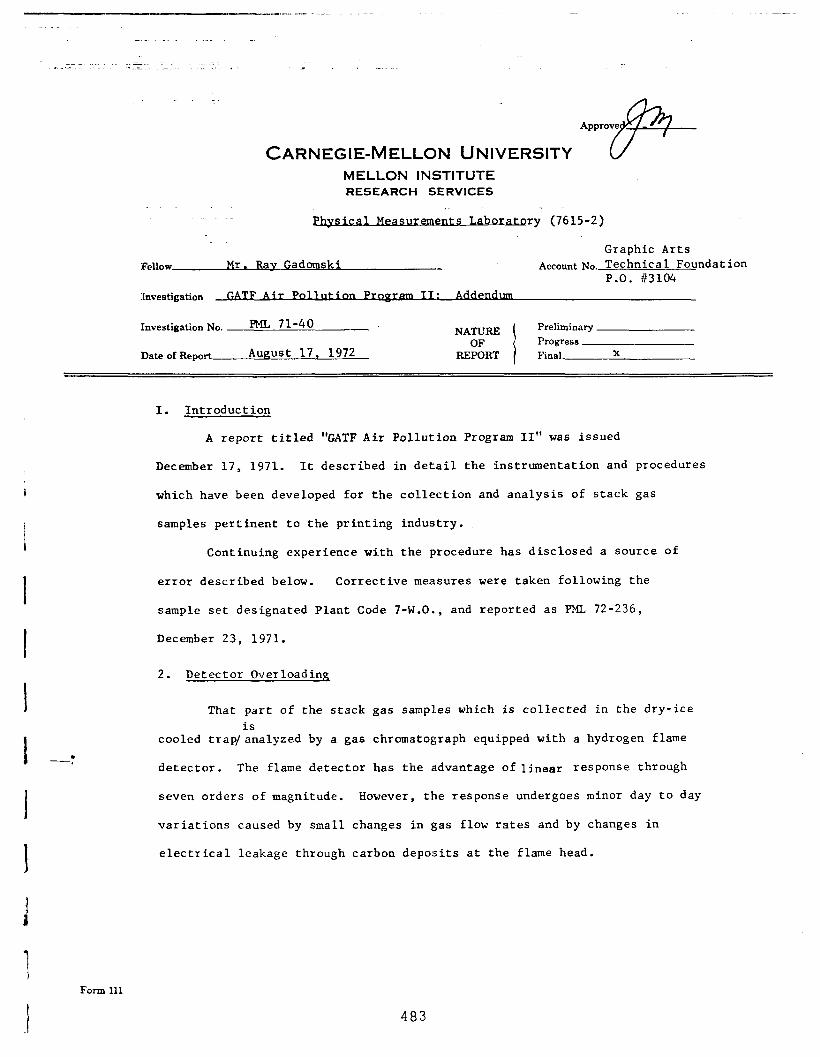
,__,_” -._. .“_._ .-
Approve
CARNEGIE-MELLON UNIVERSITY e MELLON INSTITUTE RESEARCH SERVICES
.-
r; (7.615-2)
Graphic Arts
Fellow Mr. Rav Gadomski Account~o. Technical Foundation P-0. #3104
. !hvestigation GATP PragramlL Add-
Investigation No. FPlL 71-40
Date of Report August 17, 1972
NATURE OF
REPORT
Preliminary Progress Final X
I -:
I. Introduction
A report titled "GATF Air Pollution Program II" was issued
December 17, 1971. It described in detail the instrumentation and procedures
which have been developed for the collection and analysis of stack gas
samples pertinent to the printing industry.
Continuing experience with the procedure has disclosed a source of
error described below. Corrective measures were taken following the
sample set designated Plant Code 7-W.O., and reported as PML 72-236,
December 23, 1971.
2. Detector Overloading
That part of the stack gas samples which is collected in the dry-ice
is cooled trap/analyzed by a gas chromatograph equipped with a hydrogen flame
detector. The flame detector has the advantage of linear response through
seven orders of magnitude. However, the response undergoes minor day to day
variations caused by small changes in gas flow rates and by changes in
electrical leakage through carbon deposits at the flame head.
Form 111
483
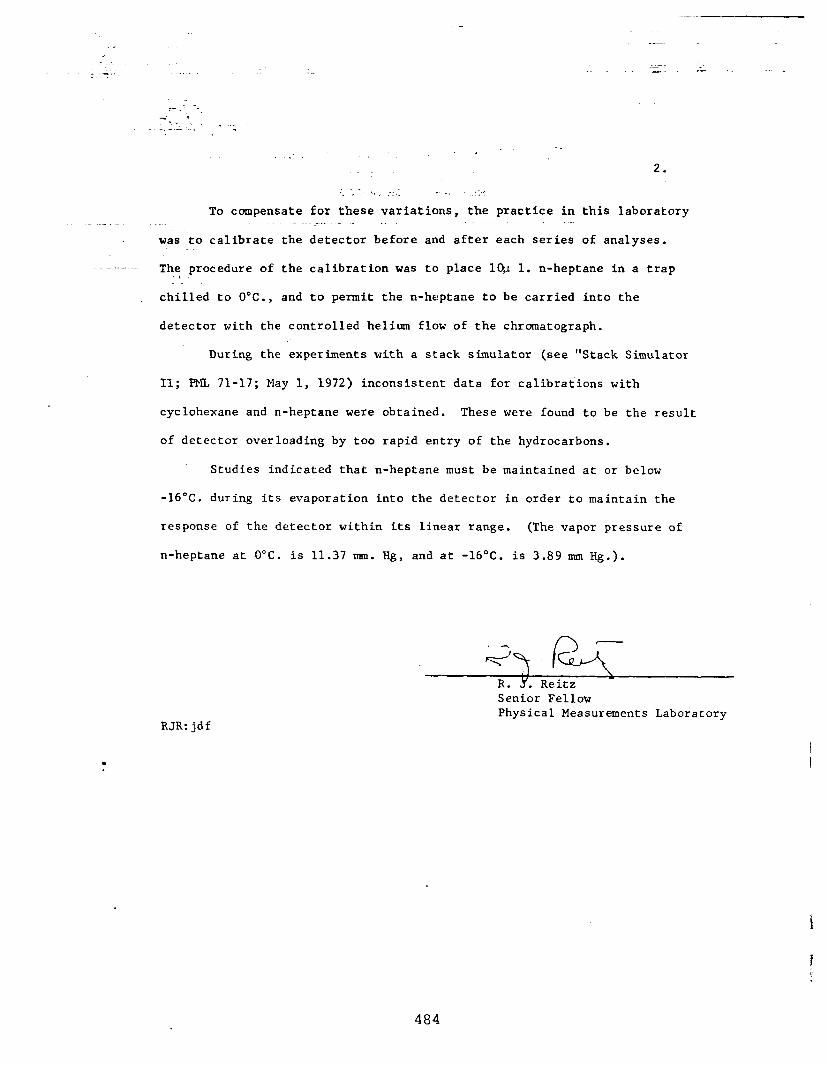
:- -._
._ ‘. _-I ._ r . .
To compensate for these variations, the practice in this laboratory
was to calibrate the detector before and after each series of analyses.
- The procedure of the calibration was to place 1% 1. n-heptane in a trap I
chilled to O'C., and to permit the n-heptane to be carried into the
detector with the controlled helium flow of the chromatograph.
During the experiments with a stack simulator (see "Stack Simulator
II; PNL 71-17; May 1, 1972) inconsistent data for calibrations with
cyclohexane and n-heptane were obtained. These were found to be the result
of detector overloading by too rapid entry of the hydrocarbons.
Studies indicated that n-heptane must be maintained at or below
-16°C. during its evaporation into the detector in order to maintain the
response of the detector within its linear range. (The vapor pressure of
n-heptane at 0°C. is 11.37 mm. Hg, and at -16°C. is 3.89 mm Hg.).
- R. Y. Reitz Senior Fellow Physical Measurements Laboratory
.
RJR:jdf
484
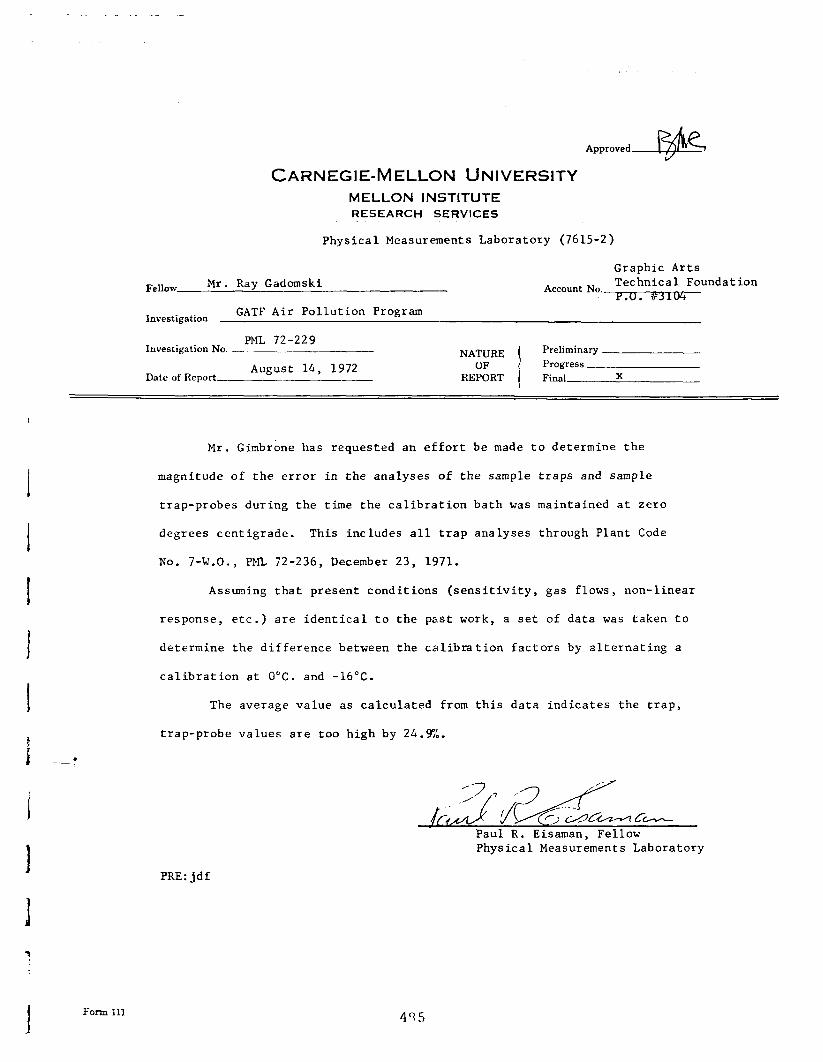
*ppro”edAgik CARNEGIE-MELLON UNIVERSITY
MELLON INSTITUTE RESEARCH SERVICES
Physical Measurements Laboratory (7615-2)
Fellow Mr. Ray Gadomski
Investigation GATF Air Pollution Program
PML 72-229 Investigation No. _____
Date of Report August 14, 1972
-.
NATURE OF
REPORT
Graphic Arts
Account No. Technical Foundation
. . 104
Preliminary Progress Final X
Mr. Gimbrbne has requested an effort be made to determine the
magnitude of the error in the analyses of the sample traps and sample
trap-probes during the time the calibration bath was maintained at zero
degrees centigrade. This includes all trap analyses through Plant Code
No. 7-W-O., PML 72-236, December 23, 1971.
Assuming that present conditions (sensitivity, gas flows, non-linear
response, etc.) are identical to the past work, a set of data was taken to
determine the difference between the calibration factors by alternating a
calibration at 0°C. and -16°C.
The average value as calculated from this data indicates the trap,
trap-probe values are too high by 24.!3%.
Physical Measurements Laboratory
PRE:jdf
Form 111 4ss
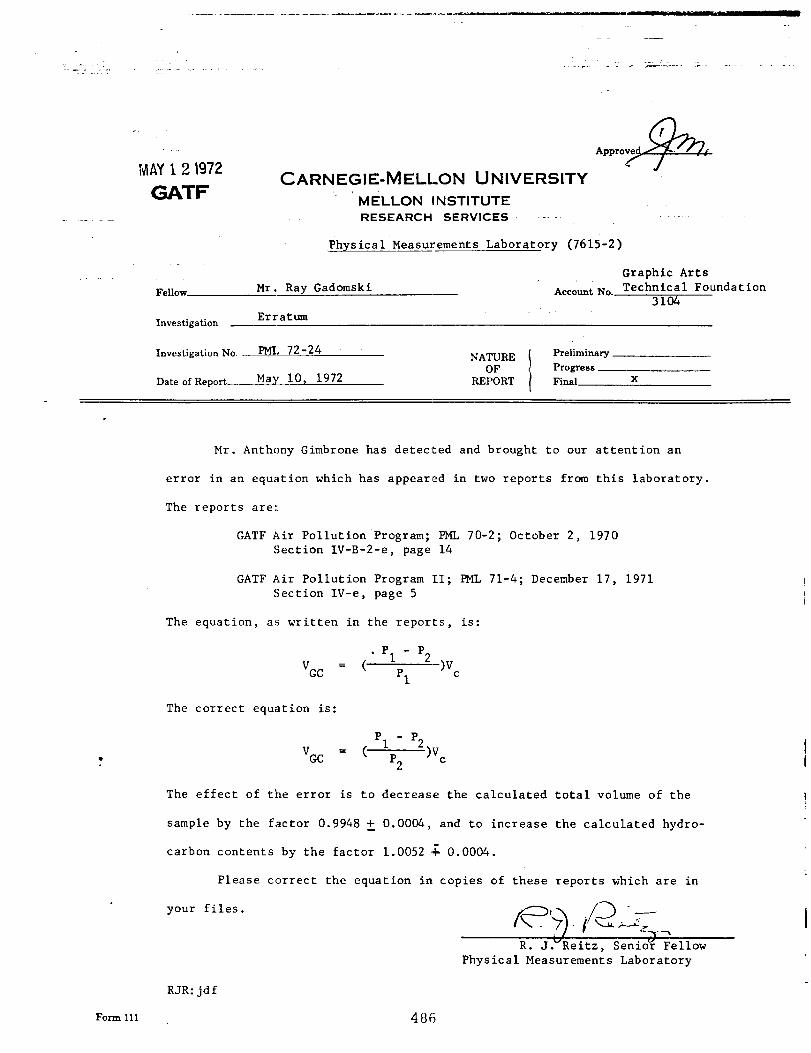
. I. MAY 12 1972
GATF CARNEGIE-MELLON UNIVERSITY
4?= Approve
w MELLON INSTITUTE RESEARCH SERVICES
Physical Measurements Laboratory (7615-2)
Fellow Mr. Ray Gadomski Graphic Arts
Account No. Technical Foundation 3104
Erratum Investigation -
Investigation No. - PMI, 72-24
Date of Report May 10, 1972
NATURE OF
REPORT i
Preliminary Progress Final X
Mr. Anthony Gimbrone has detected and brought to our attention an
error in an equation which has appeared in two reports from this laboratory.
The reports are:
GATF Air Pollution Program; PML 70-2; October 2, 1970 Section IV-B-2-e, page 14
GATF Air Pollution Program 'II; lWL 71-4; December 17, 1971 Section IV-e, page 5
The equation, as written in the reports, is:
v =( . P1 - P2
GC p1
->vc
The correct equation is:
'GC = ( p1 - p2
p2 )“C
The effect of the error is to decrease the calculated total volume of the
sample by the factor 0.9948 +_ 0.0004, and to increase the calculated hydro-
carbon contents by the factor 1.0052 $ 0.0004.
Please correct the equation in copies of these reports which are in
your files.
R. J."Reitz, SenioLf Fellow Physical Measurements Laboratory
RJR:jdf
Form 111 4 86

CARNEGIE-MELLON UMVERSITY ' MELLO INSTITUTE i .: . __ ;, RESEARCH tT..RVICES
Graphic Arts Fc~hw _ __ Dr .Gr..!.Schaeffer- Accoud No._Te_chnicai hundation
1 : ; _.. .Li ._ 3104 Inwsli~alion Stack Simulator
,.
Inves:igcdion No. _ PML 71-17 NATURE Preliminary -
OF Progresr X
DarcoTReport July 27, 1971 REPORT Find
I * Introduction
At a meeting on May 19, 1971, this laboratory was asked to construct
a device which would provide an air stream containing known quantities of
hySroczrbons and which would be suitable for testing stack gas sampling
rates.
An error in design occurred which was elusive, but which has been
idcntificd and corrected.
.r -f .A.&. Dcsiyn
During the meeting,agreemcn~ was reached on a provIsiona ~.cL~.LJ: tc,
supply the synthetic stack gas. The major flow would bc obtained !'rolr. B
large high pressure cylinder of air containing 10 ppm each of oltthalle and
burane to be purchased from a commercial source. The major hydrocarbon
content would be supplied by a small flow of nitrogen which was saturated
at a selected sub-ambient temperature with an appropriate hydrocarbon
(e.g. cyclohexane).
1 Form ‘11: 487
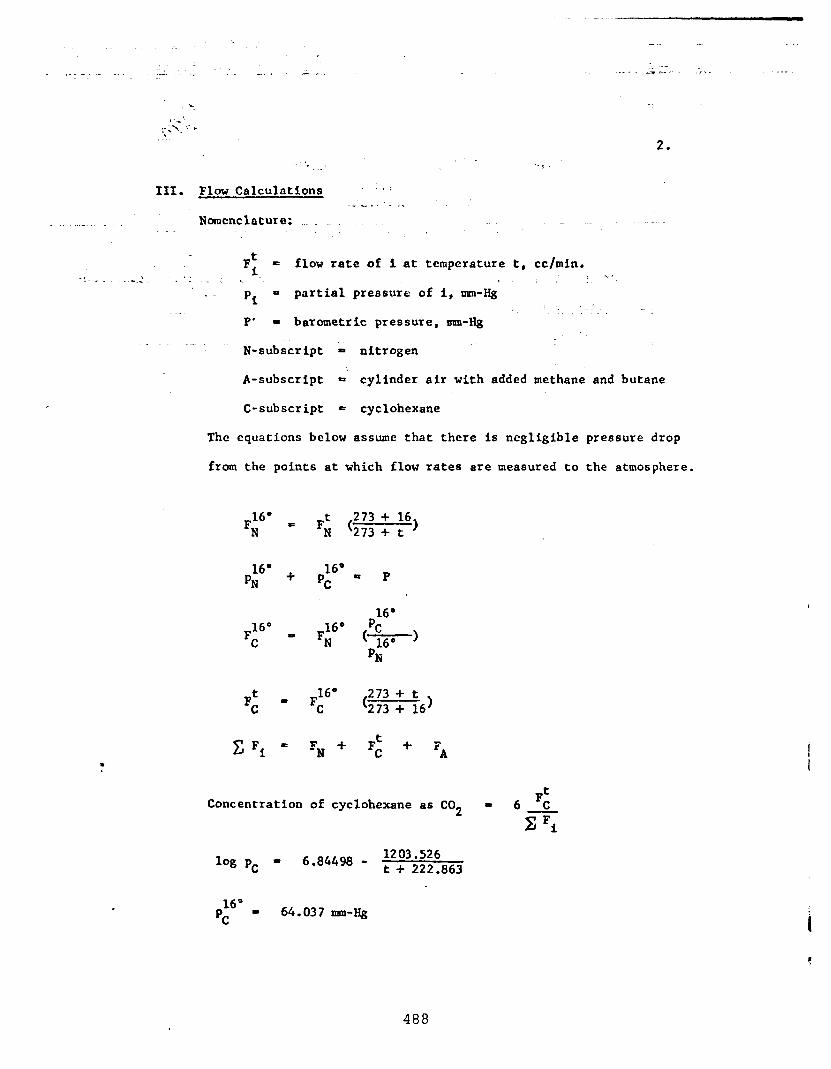
_--_--
_x
:’ :,- :.: ,
2 2.
- . . . . . ~
III. Flow Calculations ::. -- ._.. : . .
Nomenclature:
t Fi
- flow rate of i at temperature t, cc/min. . *. .': _ _ I '. .._. i _ , . . _ ._. -;,
Pi - partial pressure of i, mm-Hg
P' - barometric pressure, nnn-Hg
N-subscript - nitrogen
A-subscript =' cylinder air with added methane and butane
C-subscript = cyclohexane
The equations below assume that there is negligible pressure drop
from the points at which flow rates are measured to the atmosphere.
l
16O = FN
16' + PN
16" FC -
F; ( 273 + 16 273 + t 1
NO 0 p pc
16' FN
F16° C
CFf = FN +
16' PC
(- 16' ) PN
( 273 + t 273 + 16)
t Fc + FA
F: Concentration of cyclohexane as CO2 = 6 -
2 Fi
1% PC - 6.84498 - :',"';;;",,, .
16" I pC
64.037 nan-Hg
488
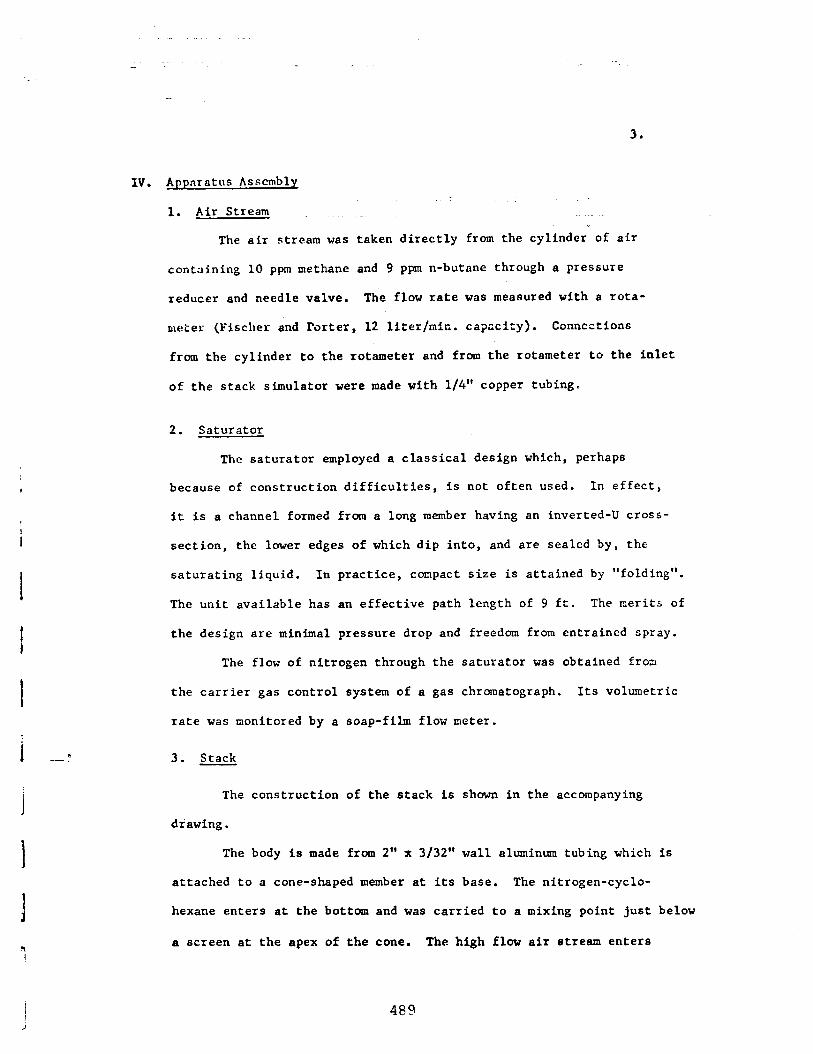
3.
IV. Apparatus Assembly
1
1. Air Stream
The air stream was taken directly from the cylinder of air
containing 10 ppm methane and 9 ppm n-butane through a pressure
reducer and needle valve. The flow rate was measured with a rota-
meter (Fischer and I’orter, 12 liter/nit. capacity). Conncrtions
from the cylinder to the rotameter and from the rotameter to the inlet
of the stack simulator were made with l/4” copper tubing.
2. Saturator.
The saturator employed a classical design which, perhaps
because of construction difficulties, is not often used. In effect,
it is a channel formed from a long member having an inverted-U cross-
section, the lower edges of which dip into, and are sealed by, the
saturating liquid. In practice, compact size is attained by “folding”.
The unit available has an effective path length of 9 ft. The merits of
the design are minimal pressure drop and freedom from entrained spray.
The flow of nitrogen through the satusator was obtained fros
the carrier gas control system of a gas chromatograph. Its volumetric
rate was monitored by a soap-film flow meter.
3. Stack
The construction of the stack is shown in the accompanying
drawing.
The body is made from 2” x 3/32” wall aluminum tubing which is
attached to a cone-shaped member at its base. The nitrogen-cyclo-
hexane enters at the bottom and was carried to a mixing point just below
a screen at the apex of the cone. The high flow air stream enters I
489
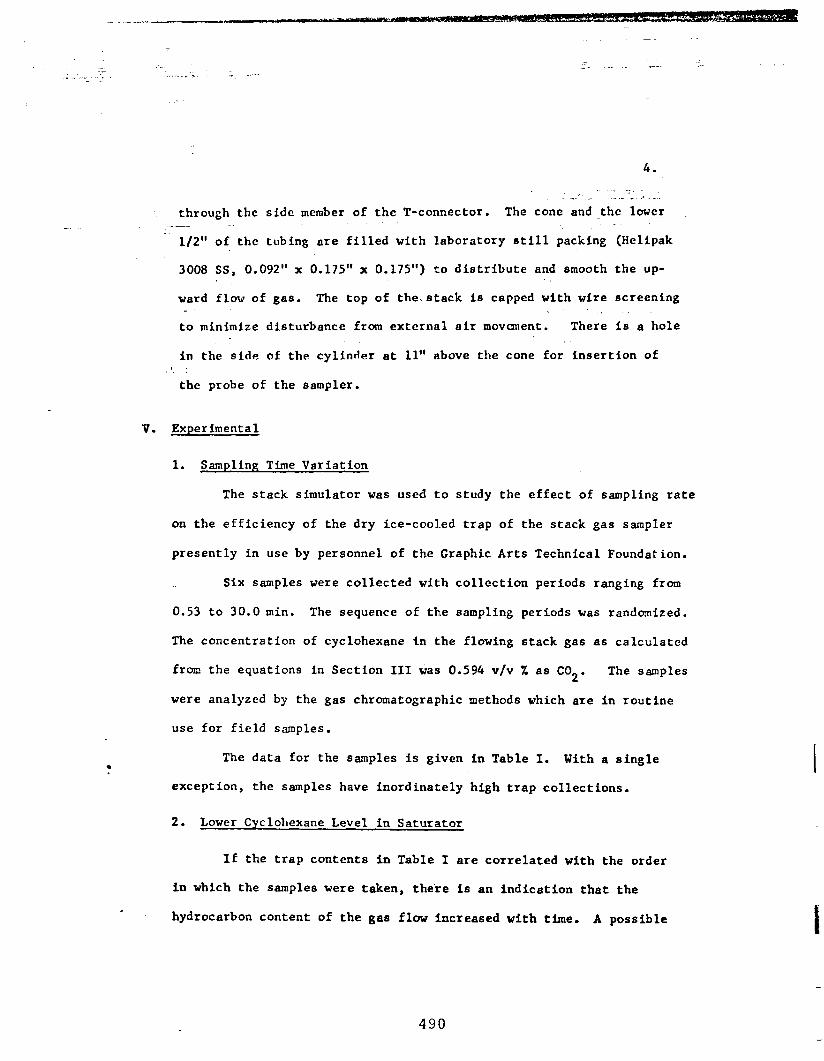
4.
__’ _ ._ ,_ _ I _
through the side member of the T-connector. The cone and _thc lower
l/2” of the tubing are filled with ‘laboratory still packing
3008.SS, 0.092” x 0.175” x 0.175”) to distribute and smooth
ward flow of gas. The top of the. stack is capped with wire .- ._
to minimize disturbance from external air movaent. There
(Helipak
the up-
screening
is a hole
in the side of the cylinder at 11” above the cone for insertion of
the probe of the sampler.
P. Experimental
.
1. Sampling Time Variation
The stack simulator was used to study the effect of sampling rate
on the efficiency of the dry ice-cooled trap of the stack gas sampler
presently in use by personnel of the Graphic Arts Technical Foundation.
Six samples were collected with collection periods ranging from
0.53 to 30.0 min. The sequence of the sampling periods was randomized.
The concentration of cyclohexane in the flowing stack gas as calculated
from the equations in Section III was 0.594 v/v X as C02. The samples
were analyzed by the gas chromatographic methods which are in routine
use for field samples.
The data for the samples is given in Table I. With a single
except ion, the samples have inordinately high trap collections.
2. Lower Cyclohexane Level in Saturator
If the trap contents in Table I are correlated with the order
in which the samples were taken, there is an indication that the
hydrocarbon content of the gas flow increased with time. A possible
490
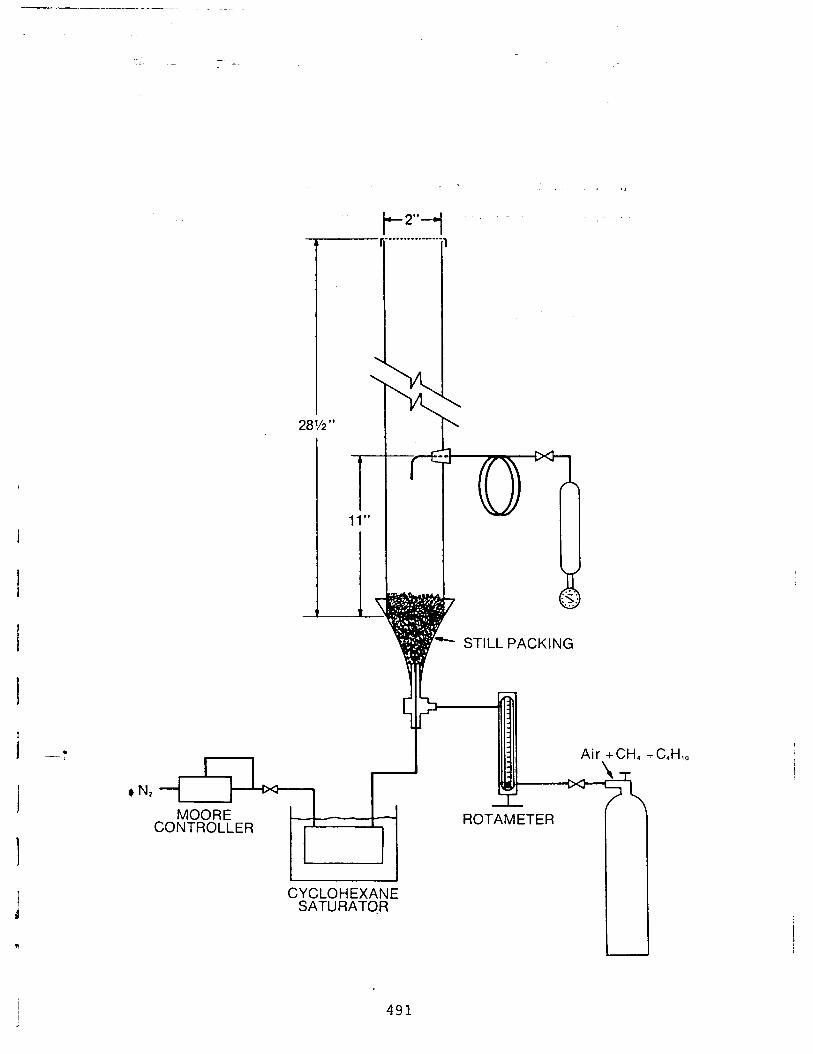
28% ”
.
T- 11”
7 1 1
STILL PACKING
ROTAMETER
\
CYCLOHEXANE SATURATQR
491
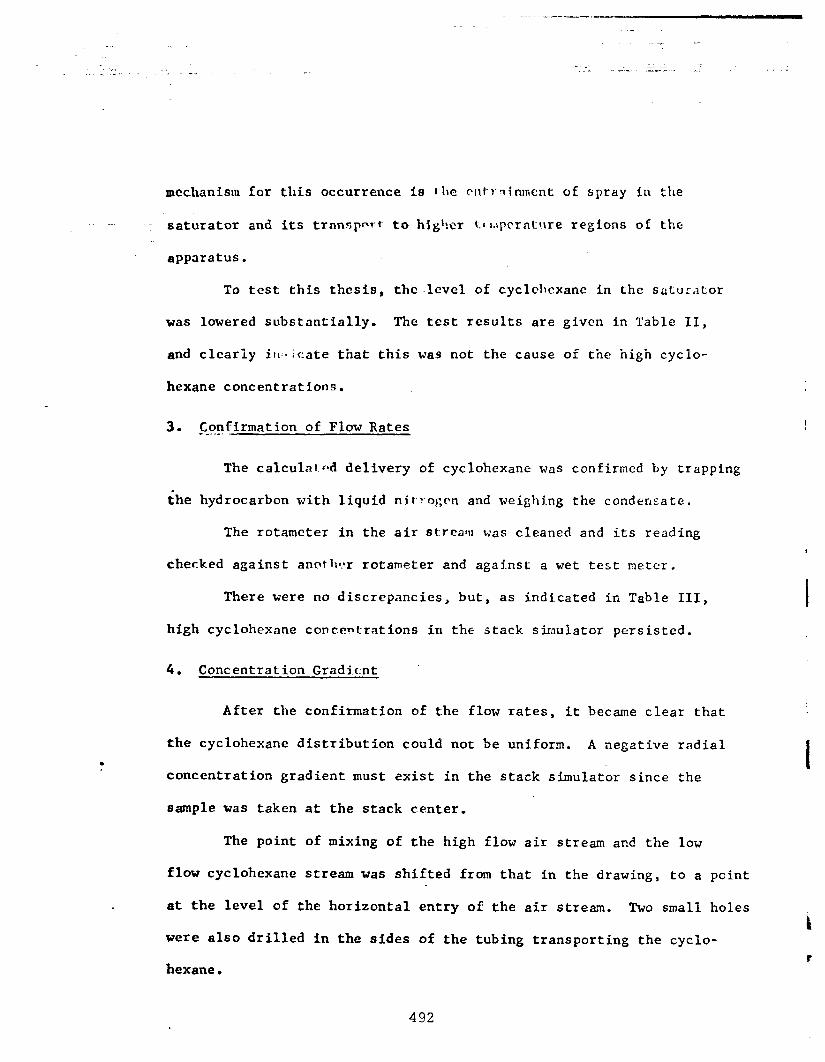
. . --_-I- . - - - , -
.
mechanism for this occurrence is f-he clll-r7inmcnt of spray
saturator and its transp--t- to hig+cr CIIOtpcratllre regions
apparatus.
in the
of the
To test this thesis, the .lcvel of cyclobcxane in the saturator
was lowered substantially. The test results are given in Table II,
and cleariy itl:a icate that this was not the cause of the high cyclo-
hexane concentrations.
3. Confirmation of Flow Rates a -.--.
The calculnt:*d delivery of cyclohexane was confirmed by trapping . the hydrocarbon with liquid nityogen and weighing the condensate.
The rotamcter in the air st:rca*!l was cleaned and its reading
checked against anoth*:r rotameter and agai.nst a wet test meter.
There were no discrepancies, but, as indicated in Table III,
high cyclohexane concentrations in the stack simulator persisted.
4. Concentration Gradi.c:nt
After the confirmation of the flow rates, it became clear that
the cyclohexane distribution could not be uniform. A negative radial
concentration gradient must exist in the stack simulator since the
sample was taken at the stack center.
The point of mixing of the high flow air stream and the low
flow cyclohexane stream was shifted from that in the drawing, to a point
at the level of the horizontal entry of the air stream. Two small holes
were also drilled in the sides of the tubing transporting the cyclo-
hexane.
492
The analysis of two samples taken after this modification
arc shown in Table IV. The agreement with the calculated concentration
is satisfactory.
VI . Slumi\ary
Although it has taken a greater effort than was envisioned, a stack
simulator is now available to test the efficiency of trap collection.
'P. R. Eisanlan Fellow
n .----+
Senior Fellow Physical Measurements Laboratory
RJR:jdf
493
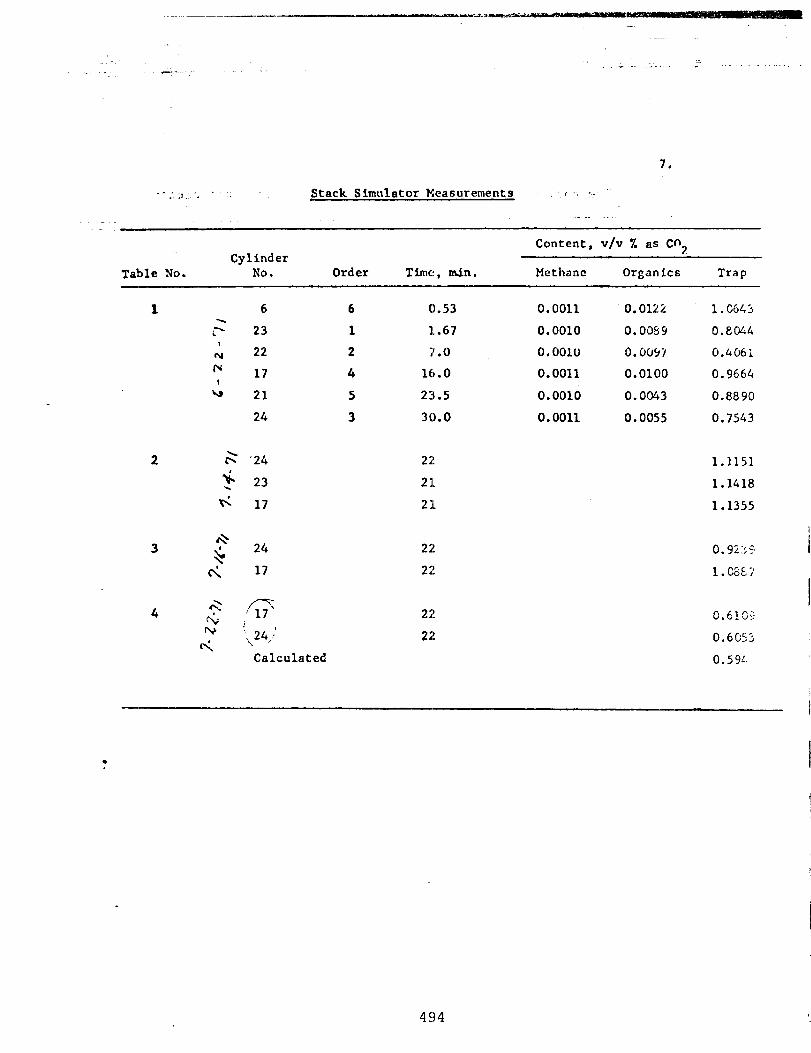
7.
_- :.:I:-. , . Stack Simulator Keasurements 1 .L ,..
Table No. Cylinder
NO.
Content, v/v % a.5 cn2
Order Time, min. Methane Organic6 Trap
1 6 .
,- 23
24
2
3
.2 ‘24
9 23
d 17
c? +
24
c; 17
h‘ 4 * i\ jG-7 F3
i ‘.\24;.’
Calculated
6 0.53
1 I..67
2 7.0
4 16.0
5 23.5
3 30.0
2i!
21
21
22
2i!
2;!
2i!
0.0011 0.0122 l.C6&3
0.0010 O.OCb4 0.8044
0.0010 0. WI’/ 0.4061
0.0011 0.0100 0.9664
0.0010 0.0043 0.8890
0.0011 0.0055 0.7543
1.1151
1.1418
1.1355
0.92::s
l.Ci;&?
0.6155
0 605; .
0.59L.
-
l
494
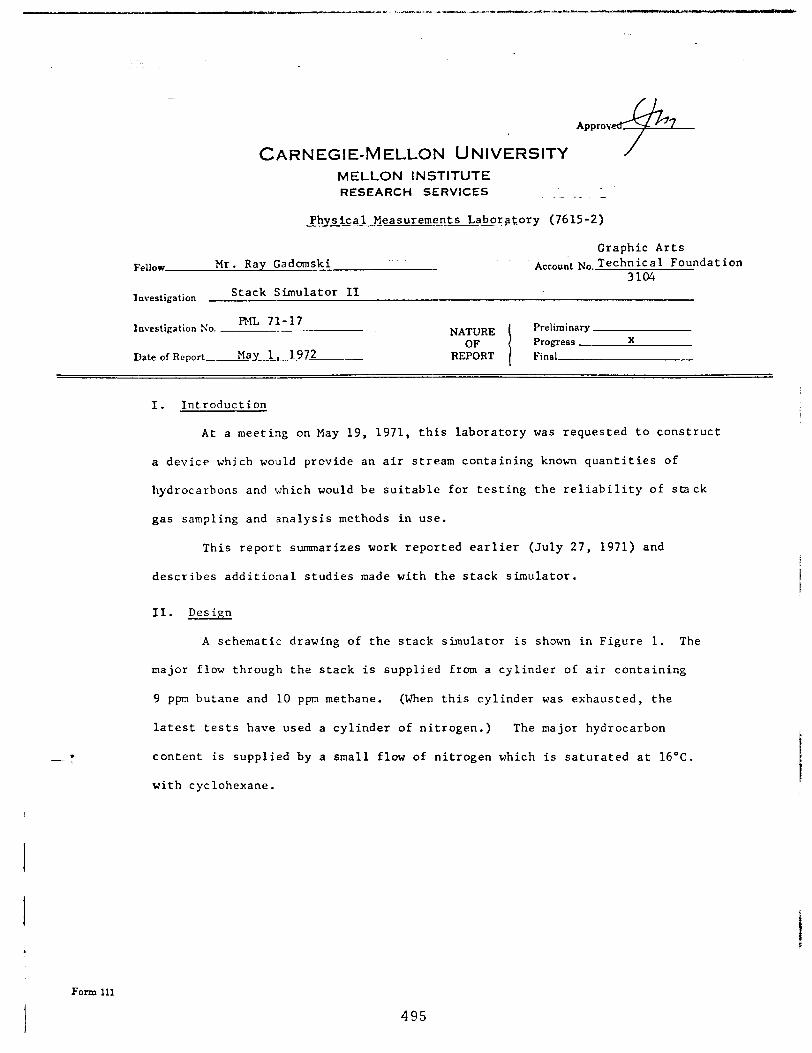
CARNEGIE-MELLON UNIVERSITY / MELLON INSTITUTE RESEARCH SERVICES .-._ _
Physical Measurements Laborat_ory (7615-2)
Fellow Mr. Ray Gadomski
lovesligation Stack Simulator II
Investigation No. PML 71-17
Date of Report May 1. 1972 _
NATURE OF
REPORT
Graphic Arts Account No.Technical Foundation
3104
Preliminary Progress X
Final
I. Introduction
At a meeting on May 19, 1971, this laboratory was requested to construct
a device which would provide an air stream containing known quantities of
hydrocarbons and which would be suitable for testing the reliability of stack
gas sampling and #analysis methods in use.
This report summarizes work reported earlier (July 27, 1971) and
describes additional studies made with the stack simulator.
II. Design
A schematic drawing of the stack simulator is shown in Figure 1. The
major flow through the stack is supplied from a cylinder of air containing
9 ppm butane and 10 ppm methane. (When this cylinder was exhausted, the
latest tests have used a cylinder of nitrogen.) The major hydrocarbon
content is supplied by a small flow of nitrogen which is saturated at 16°C.
with cyclohexane.
495
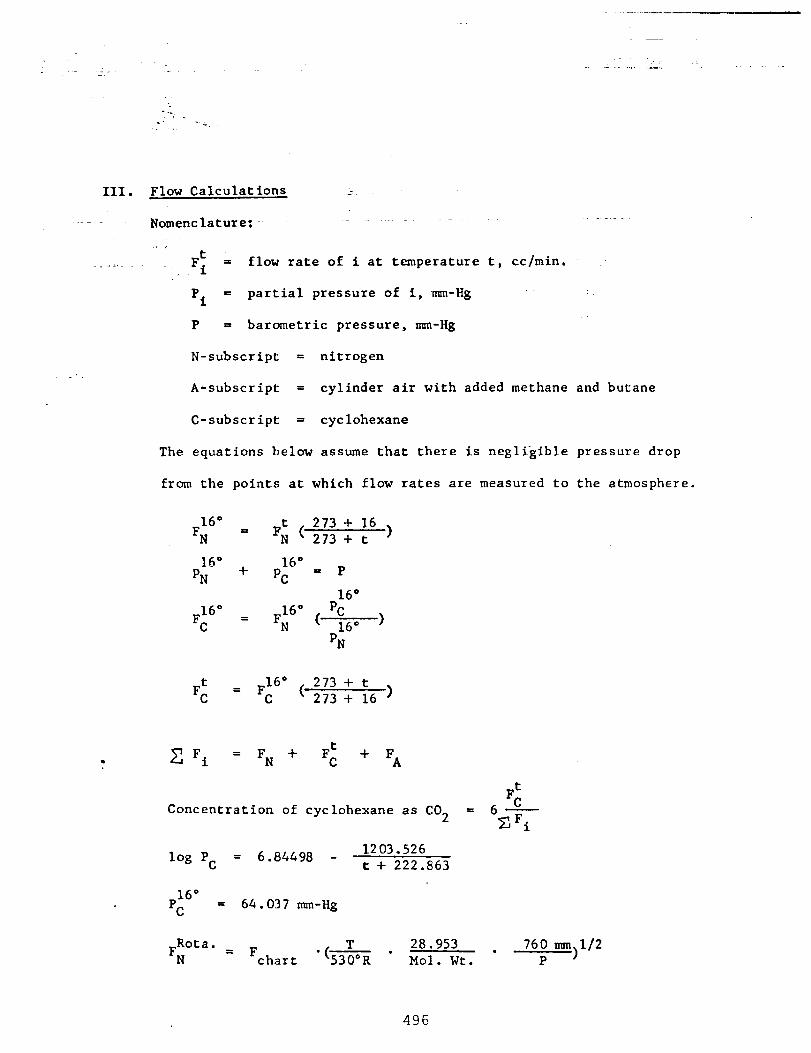
- i;
.’ --< _
III. Flow Calculations _‘
Nomenclature:-
t __11.- , Fi = flow rate of i at temperature t, cc/min.
pi = partial pressure of i, mm-Hg
P = barometric pressure, mm-Hg
N-subscript = nitrogen .
A-subscript = cylinder air with added methane and butane
C-subscript = cyclohexane
The equations below assume that there is negligible pressure drop
from the points at which flow rates are measured to the atmosphere.
16" FN =
lhD + PN
16" = FC
273 + 16 273 + t 1
16” = p pC
16" FN
16"
( PC 16" )
pN
t FC
F16° 273 + t = c ( 273 + 16 1
z Fi = FN + FE + FA
t Concentration of cyclohexane as CO2 = FC 6 -
CFi
1% PC = 6.84498 - 1203.526 t + 222.863
16" pC = 64.037 mm-Hg
Rota. = FN
F 28.953 chart
.(--A- . 530"R Mol. Wt. '
760 mm+/2 P
496

STILL PACKING
I + N, I
hA Y-4
MOORE - CONTROLLER ROTAMETER
CYCLOHEXANE SATURATOR
CA-i,, N2
497
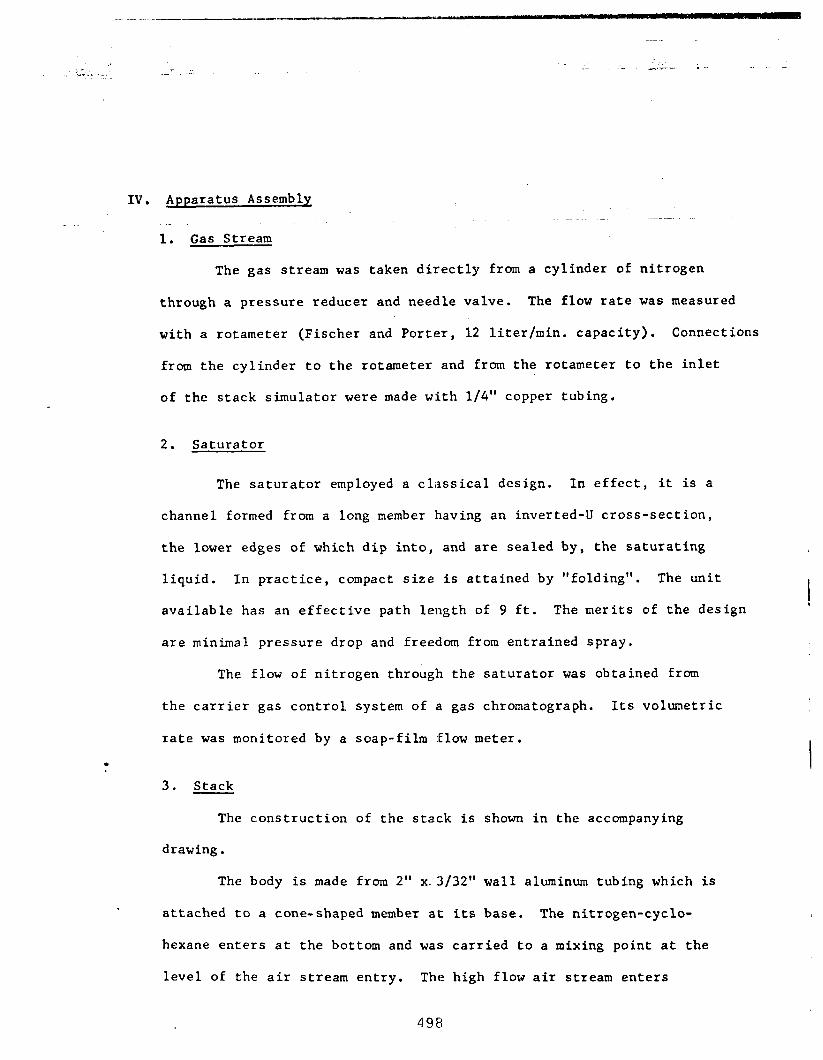
IV. Apparatus Assembly
1. Gas Stream
The gas stream was taken directly from a cylinder of nitrogen
through a pressure reducer and needle valve. The flow rate was measured
with a rotameter (Fischer and Porter, 12 liter/min. capacity). Connections
from the cylinder to the rotameter and from the rotameter to the inlet
of the stack simulator were made with l/4" copper tubing.
2. Saturator
The saturator employed a classical design. In effect, it is a
channel formed from a long member having an inverted-U cross-section,
the lower edges of which dip into, and are sealed by, the saturating
liquid. In practice, compact size is attained by "folding". The unit
available has an effective path length of 9 ft. The merits of the design
are minimal pressure drop and freedom from entrained spray.
The flow of nitrogen through the saturator was obtained from
the carrier gas control system of a gas chromatograph. Its volumetric
rate was monitored by a soap-film :flow meter. . I
3. Stack
The construction of the stack is shown in the accompanying
drawing.
The body is made from 2" x.3/32" wall aluminum tubing which is
attached to a cone-shaped member at its base. The nitrogen-cyclo-
hexane enters at the bottom and was carried to a mixing point at the
level of the air stream entry. The high flow air stream enters
498
---,l--l.,l, ,- .._-, -_. ----.1--1- “,. _” -.. ,_I,_ ” -_. .- ,. ..“---_----. .- . . . . . ..-_.w--
through the side member of the T-connector. The cone and the lower l/2"
of the tubing are filled with laboratory still packing <Helipak 3008 SS,
0.092" x 0.175" x 0.175") to distribute and smooth the upward flow of gas.
The top of the stack is capped with wire screening to minimize disturbance
from external air movement. There is a hole in the side of the cylinder
at 11" above the cone for insertion of the probe of the sampler.
V. ge-examination of Earlier Data
In the first progress report for this study (Stack Simulator, July 27,
1971, Table Nos. 1, 2, and 3), excessively high trap-contents were obtained.
The data for these analyses have been re-examined, but the most plausible
explanation is still the assumption that a negative radial concentration
gradient in the stack was the major cause of the high trap analyses.
VI. ,Interim Tests
Analysis of samples taken from the stack simulator continued. Results
were obtained for the CO2 equivalent of the trap contents which ranged from
0.459 to 0.750 v/v %.
The major source of error did not become apparent until the trap
clontents of two samples were calculated using calibration factors obtained
bloth with cyclohexane and with n-heptane:
Standard n-Heptane Cyclohexane
Trap 20 0.5120 0.6755
Trap 22 0.5227 0.6897
499
The interpretation of these data is that the higher volatility of cyclo- -/ ._ , . .--... - r~
hexane relative either to n-heptane or to a field sample had not been
compensated. Both the cyclohexane from the stack simulator traps and from . .
the calibrations were randomly overloading the hydrogen flame detector I
of the chromatograph. ,
The normal procedure for the injection of trap samples into the
chromatograph is first to cool the trap to -78” and to hold at this
temperature until the recorder returns to base line. The dry ice trap
is then replaced by ordinary
temperature as is necessary.
has been cooled first in dry
of .the injection.
ice, and is finally heated to as high a
For c:alibration with n-heptane, the trap
ice and then taken to 0” for the completion
Further tests were made with both cyclohexane and with n-heptane.
They indicate that cyclohexane should not be evaporated into the chromatograph I
at a temperature higher than -31”, and that n-heptane should be held at -16”.
VI‘I. Latest Stack Simulator Samples
.
1. Carrier Gas
In all previous stack simulator experiments, the carrier gas was I obtained from a cylinder of air containing 9 ppm butane and 10 ppm methane. This cylinder of air was exhausted by the last previous set of measurements. Water pumped nitrogen was substituted for it in the latest tests which are reported here.
2. Methane Analyses
Since methane was not in the present carrier gas, the analyses obtained for the nine previous cylinder samples which were analyzed are substituted here: i
11, 10, 10, 11, 10, 11, 10, 10, 10: Avg. 10.3 ppm F Supplier’s analysis: 10 Pm
500
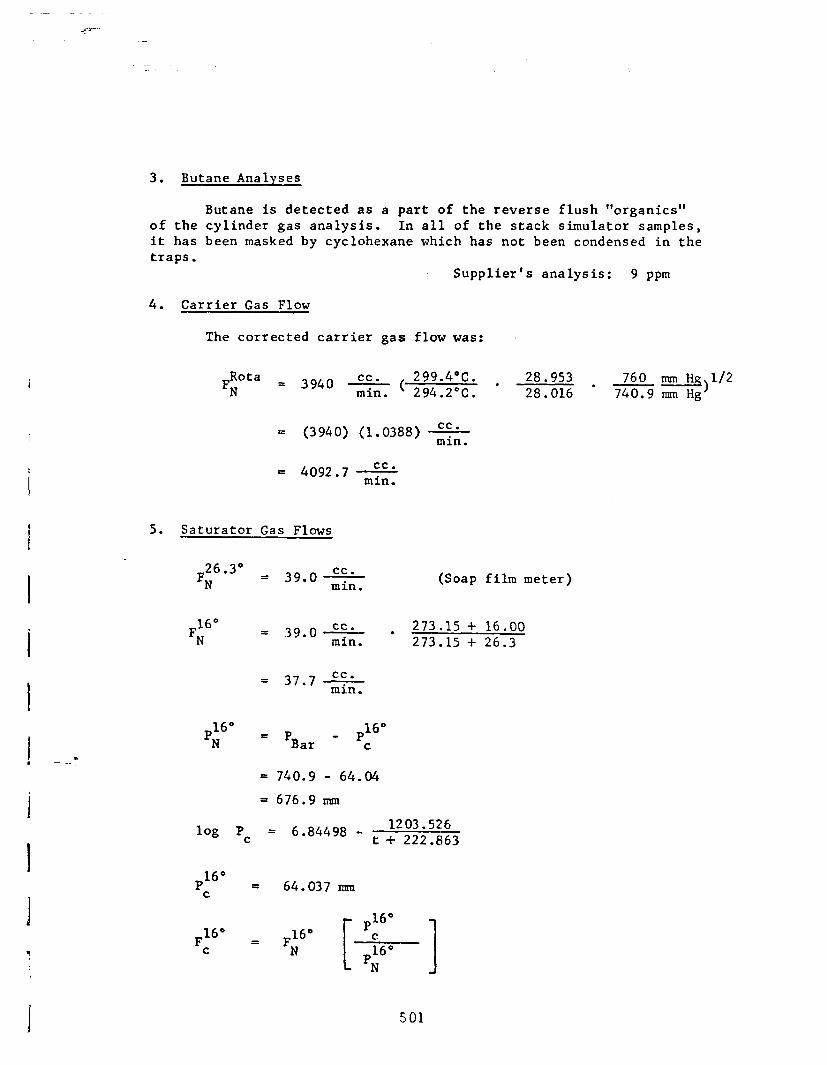
3.
Of
it
Butane Analyses
Butane is detected as a part of the reverse flush "organics" the cylinder gas analysis. In all of the stack simulator samples, has been masked by cyclohexane which has not been condensed in the
traps. Supplier's analysis: 9 wm
4. Carrier Gas Flow
The corrected carrier gas flow was:
Rota FN
= 3940 cc. 299.4OC. ( 294.2"C. '
28.953 min. 28.016 *
760 mm H&)1/2 740.9 mm Hg
= (3940) (1.0388) cc. min.
= 4092.7 cc. min.
5. Saturator Gas Flows
. . 26.3O
FN = 39.0 cc.
min. (Soap film meter)
16" FN = 39.0 cc. min. 273.15 l 16.00 273.15
+ + 26.3
= 37.7 cc. min.
16” = pN 'Bar
- pl6" C
= 740.9 - 64.04
= 676.9 nun
log P C
= 6.84498 - t :',4';';;, .
p16" = C
64.037 mm
F16° p16"
= F16" C N [ 1 p;6a
N
501
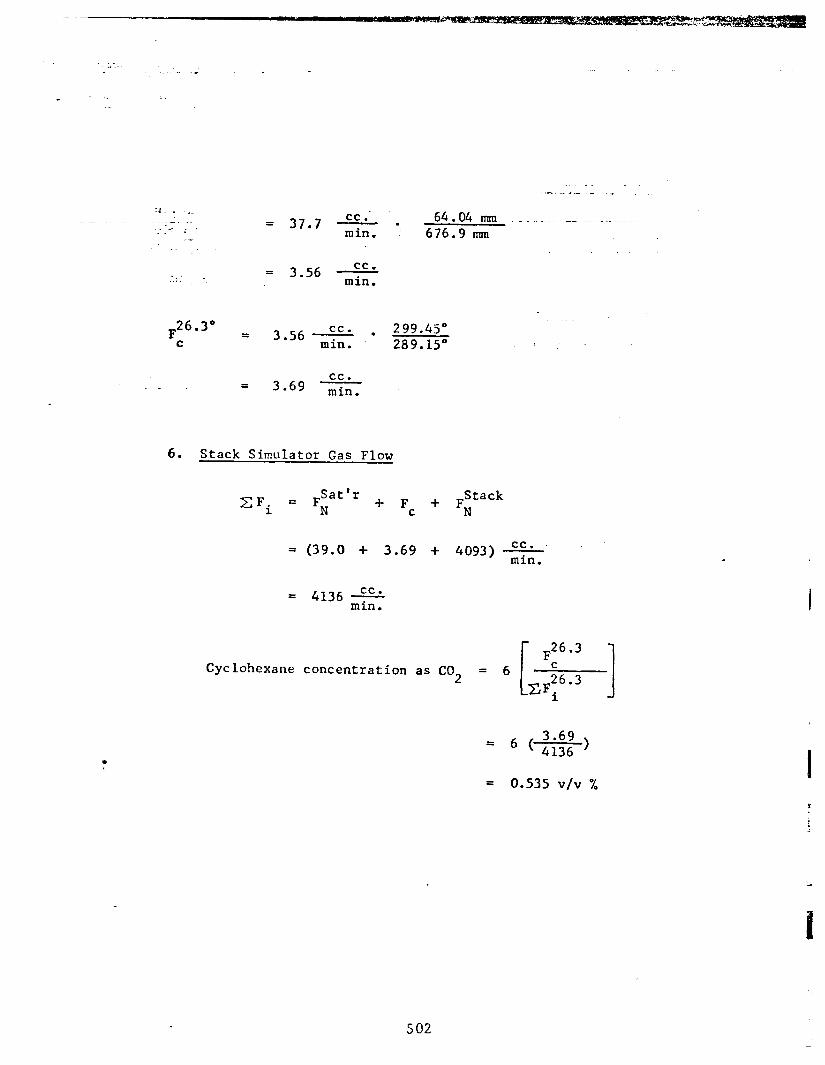
~-.._z- - . . ._ 2. _ 1.
= 37.7 cc. . 64.04 mm _ -.~ ~- ~~~ --.-~-~~ t.-- _ ., . min. 676.9 mm _-
. - I 3.56 cc. ,.i. . min.
F26.3" I 3.56 cc. l
299.45O
C min. 289.15"
= 3.69 cc min.
6. Stack Simulator Gas Flow
CFi = Fiattr + F Stack C
-+- FN
= (39.0 + 3.69 t 4093) cc, min.
= 4136 cc. min.
F26.3 Cyclohexane concentration as CO2 = 6 c 1 2c6.3
TZFi
3.69 = ' ( 4136
)
c
I = 0.535 v/v %
502
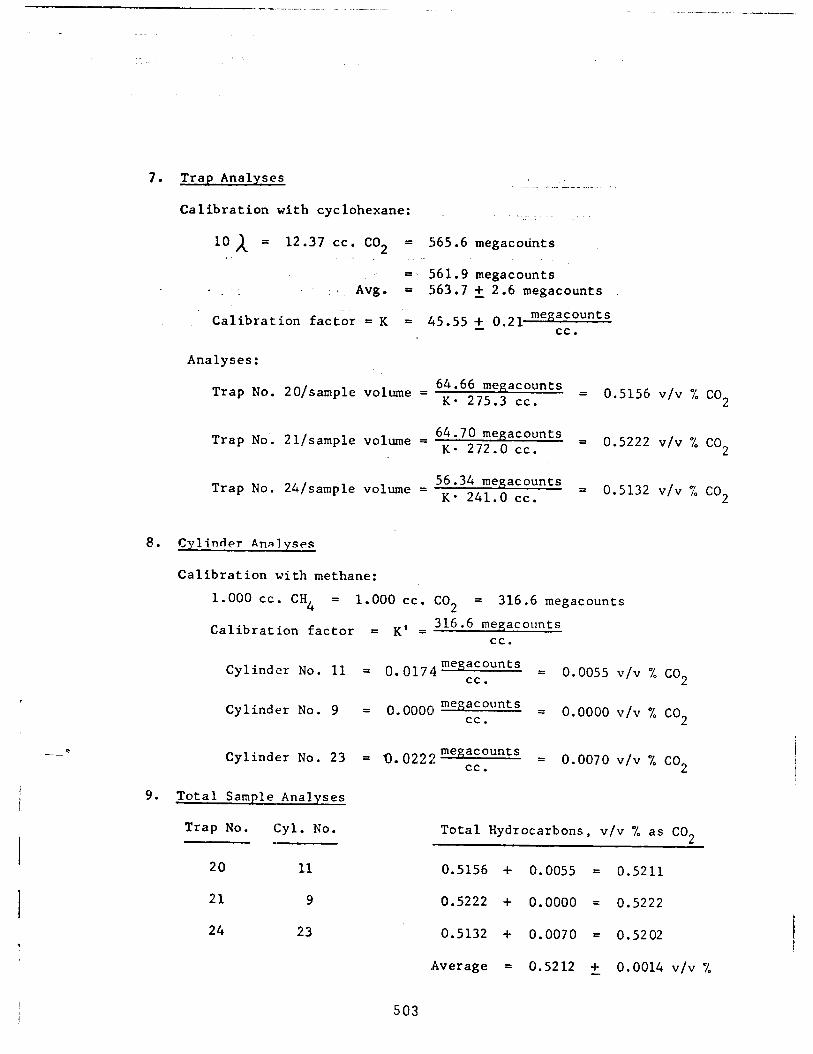
-,-- ..--..._._.._ __
c --
7. Trap Analyses
Calibration with cyclohexane:
1oA = 12.37 cc. CO2 = 565.6 megacodnts
I. Avg. = 561.9 megacounts = 563.7 +, 2.6 megacounts
Calibration factor = K = 45.55 +, 0.21 meg~~ounts .
Analyses:
64.66 me acounts Trap No. 20/sample volume = K. 275 5 cc . . = 0.5156 v/v % CO2
Trap No. 2l/sample volume = 64.70 megacounts K . 272 o cc . . = 0.5222 v/v % CO2
56.34 me acounts Trap No. 24/sample volume = K. 241 "0 cc . . = 0.5132 v/v % co2
8. Cylinder Analyses
Calibration with methane:
1.000 cc. CH4 = 1.000 cc. co2 = 316.6 megacounts
Calibration factor = K’ = 316.6 megacounts cc.
Cylinder No. 11 = 0.0174meR~~ounts = . 0.0055 v/v % co2
Cylinder No. 9 = 0.0000~ megacounts cc . = 0.0000 v/v % co2
Cylinder No. 23 = 0.0222meg~~ounts = 0.0070 V/V % co2 .
9. Total Sample Analyses
Trap No. Cyl. No.
20 11
21 9
24 23
Total Hydrocarbons, v/v % as CO,
0.5156 + 0.0055 = 0.5211
0.5222 + 0.0000 = 0.5222
0.5132 + 0.0070 = 0.5202
Average = 0.5212 + 0.0014 v/v %
503
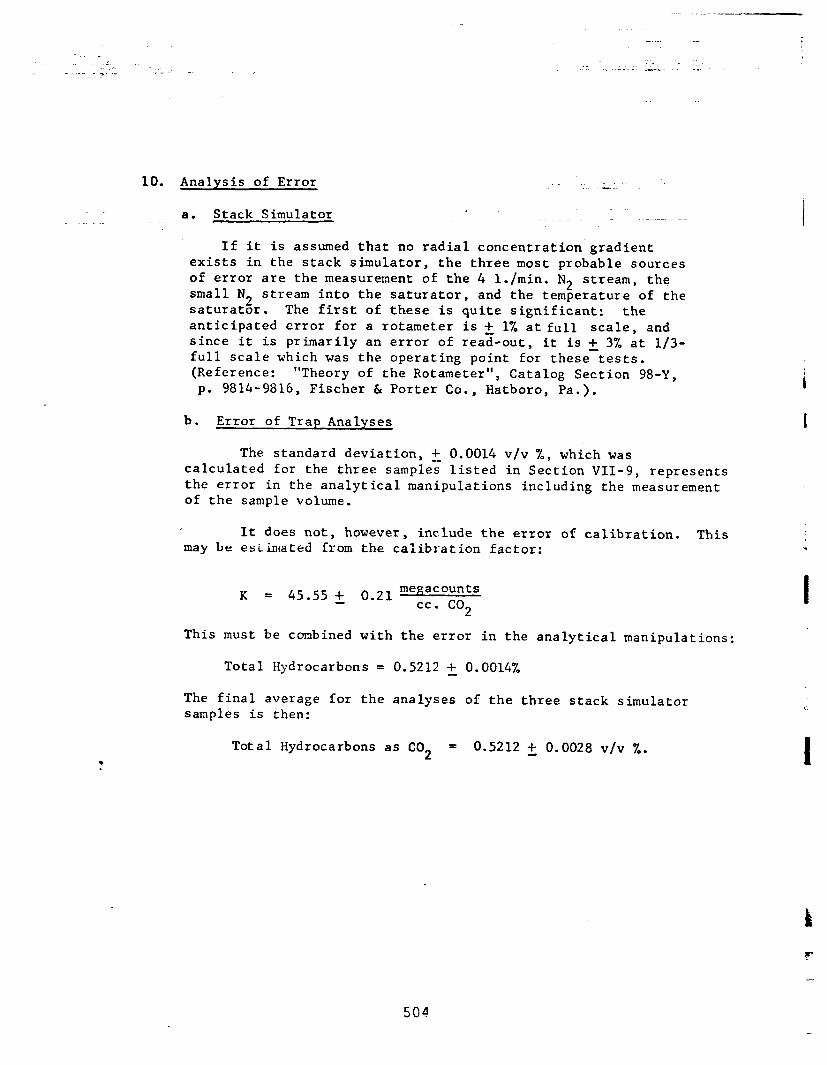
10. Analysis of Error . -.__
a. Stack Simulator -
If it is assumed that no radial concentration-gradient exists in the stack simulator, the three most probable sources of error are the measurement of the 4 l./min. N2 stream, the small N 2 stream into the saturator, and the temperature of the saturator. The first of these is quite significant: the anticipated error for a rotameter is +, 1% at full scale, and since it is primarily an error of read-out, it is + 3% at l/3- full scale which was the operating point for these-tests. (Reference: "Theory of the Rotameter", Catalog Section 98-Y, p. 9814-9816, Fischer & Porter Co., Hatboro, Pa.).
b. Error of Trap Analyses
The standard deviation, +, 0.0014 v/v %, which was calculated for the three samples listed in Section VII-g, represents the error in the analytical manipulations including the measurement of the sample volume.
It does not, however, include the error of calibration. This may Le esiintated from the calibration factor:
K = 45.55 +, 0.21 me;-fo;;ts 2
This must be combined with the error in the analytical manipulations:
Total Hydrocarbons = 0.5212 + 0.0014%
The final average for the analyses of the three stack simulator samples is then:
Total Hydrocarbons as CO2 = 0.5212 2 0.0028 v/v %.
i
I
\. I
504
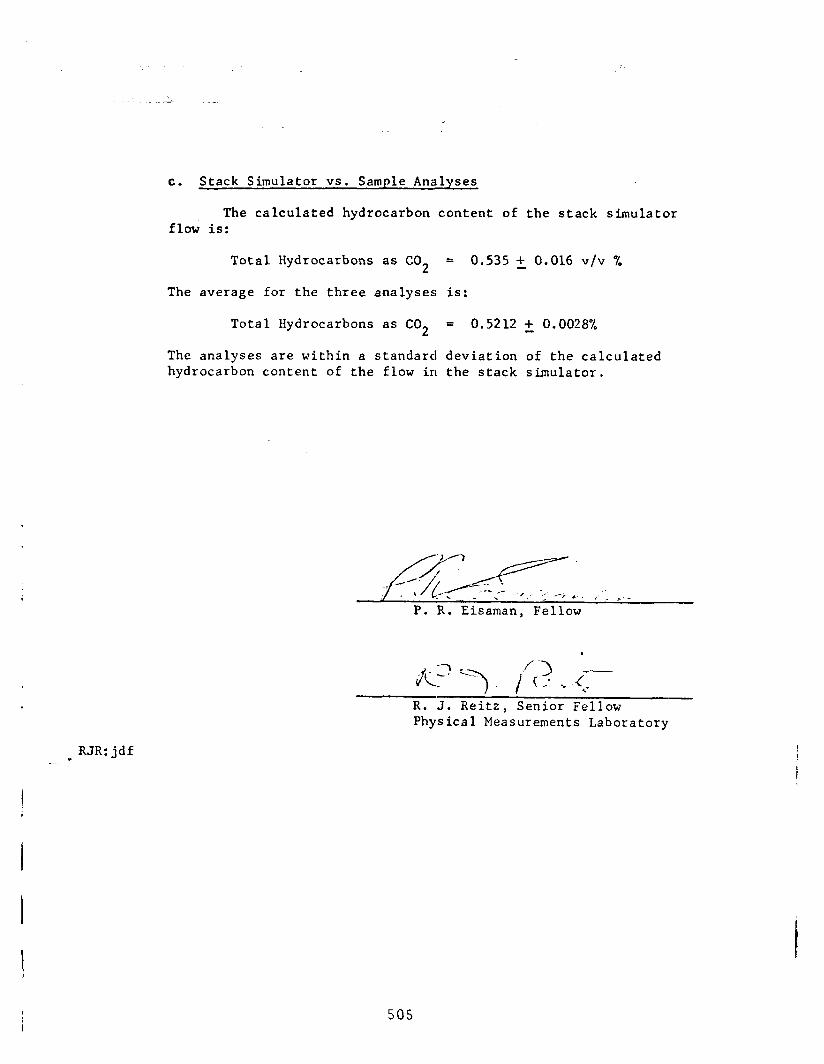
c. Stack Simulator vs. Sample Analyses
The calculated hydrocarbon content of the stack simulator flow is:
Total Hydrocarbons as CO2 = 0.535 2 0.016 v/v %
The average for the three analyses is:
Total Hydrocarbons as CO2 = 0.5212 +, 0.0028%
The analyses are within a standard deviation of the calculated hydrocarbon content of the flow in the stack simulator.
R. J. Reitz, Senior Fellow Physical Measurements Laboratory
* RJR: jdf -
505
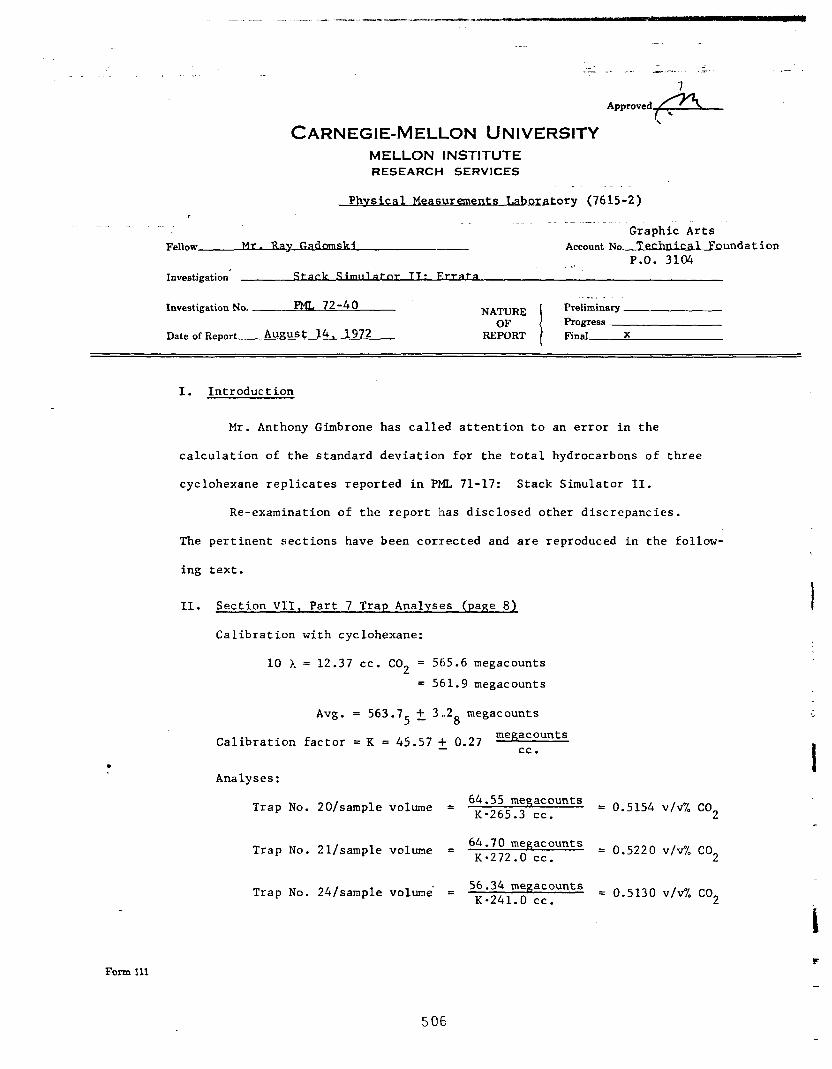
‘\
CARNEGIE-MELLON UNIVERSITY MELLON INSTITUTE RESEARCH SERVICES
. . _
Physical Measurw Labaratory (7615-2) r
- - Graphic Arts
Fellow Mr. Rav uk5 Account No.---T..dhnicalundation P.O. 3104 =*
Investigation’ -Stnrk .Slmularnr TT Errat;l .
Investigation No. - F!“% 72-40
Date of Report August 14, 1972
.-,..
NATURE
I
Preliminary
OF Progress REPORT Final X
.
Form 111
I. Introduction
Mr. Anthony Girnbrone has called attention to an error in the
calculation of the standard deviation for the total hydrocarbons of three
cyclohexane replicates reported in PML 71-17: Stack Simulator II.
Re-examination of the report has disclosed other discrepancies.
The pertinent sections have been corrected and are reproduced in the follow-
ing text.
II. Section VII, Part 7 Trap Analyses (page 8)
Calibration with cyclohexane:
10 A= 12.37 cc. CO2 = 565.6 megacounts
= 561.9 megacounts
Avg. = 563.75 2 3*2g megacounts
Calibration factor = K = 45.57 j: 0.27 megacounts
cc.
Analyses:
Trap No. 20/sample volume = 64.55 megacounts
K-265.3 cc.
Trap No. Zl/sample volume = 64.70 megacounts
K.272.0 cc.
Trap ‘No. 24/sample volume- = 56.34 megacounts
K-241.0 cc.
= 0.5154 v/v% co2
= 0.5220 v/v% CO2
= 0.5130 v/v% co2
I
506
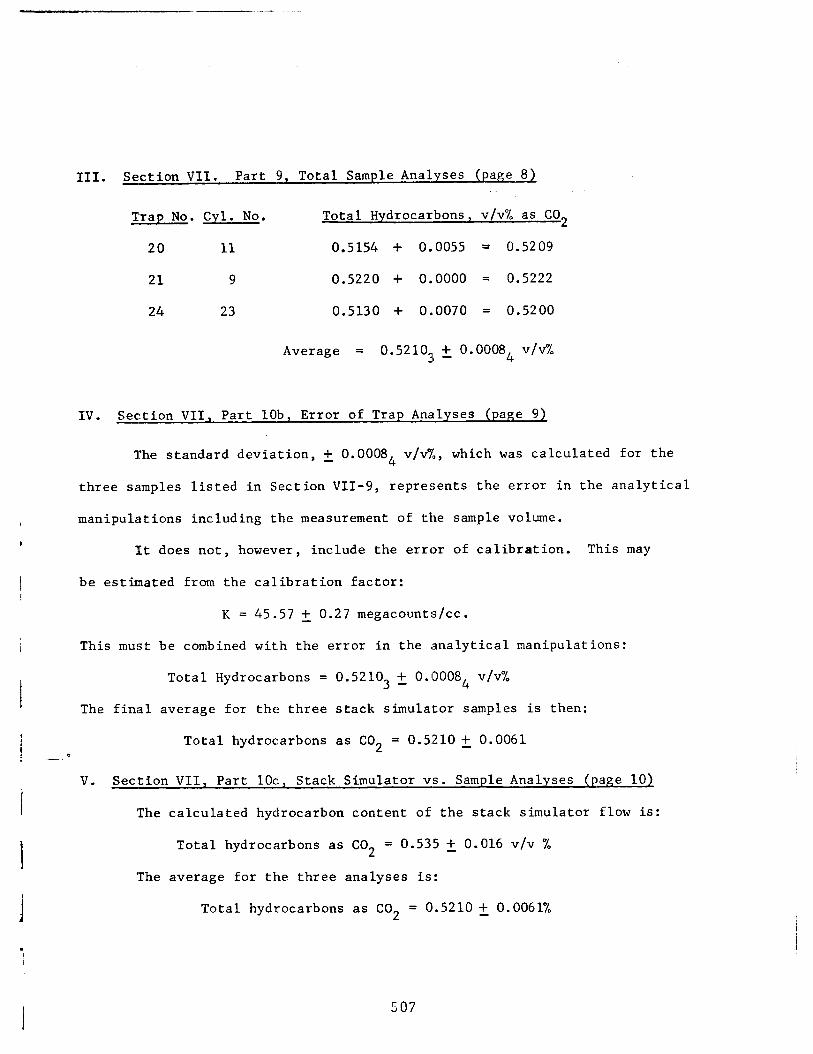
III. Section VII. Part 9, Total Sample Analyses (page 8)
Trap No. Cyl. No. Total Hydrocarbons, v/v% as CO2
20 11 0.5154 + 0.0055 = 0.5209
21 9 0.5220 + 0.0000 = 0.5222
24 23 0.5130 + 0.0070 = 0.5200
Average = 0.52103 +, 0.00084 v/v%
IV. Section VII, Part lob, Error of Trap Analyses (page 9)
The standard deviation, + 0.00084 v/v%, which was calculated for the
three samples listed in Section VII-g, represents the error in the analytical
manipulations including the measurement of the sample volume. 1 31t does not, however, include the error of calibration. This may
I be estimated from the calibration factor:
K = 45.57 +, 0.27 megacounts/cc.
This must be combined with the error in the analytical manipulations:
Total Hydrocarbons = 0.52103 f 0.00084 v/v%
The final average for the three stack simulator samples is then:
Total hydrocarbons as CO2 = 0.51210 +, 0.0061
V. Section VII, Part lOc, Stack Simulator vs. Sample Analyses (pave 10)
The calculated hydrocarbon content of the stack simulator flow is:
Total hydrocarbons as CO2 = 0.535 +, 0.016 v/v %
The average for the three analyses is:
Total hydrocarbons as CO2 = 0.5210 +, 0.0061%
.
507
The analyses are within a standard deviation of-the calculated
content of the flow in the stack simulator. .
I \
R. J. Reitz Senior Fellow Physical Measurements Laboratory
RJR:jdf
.
5 00
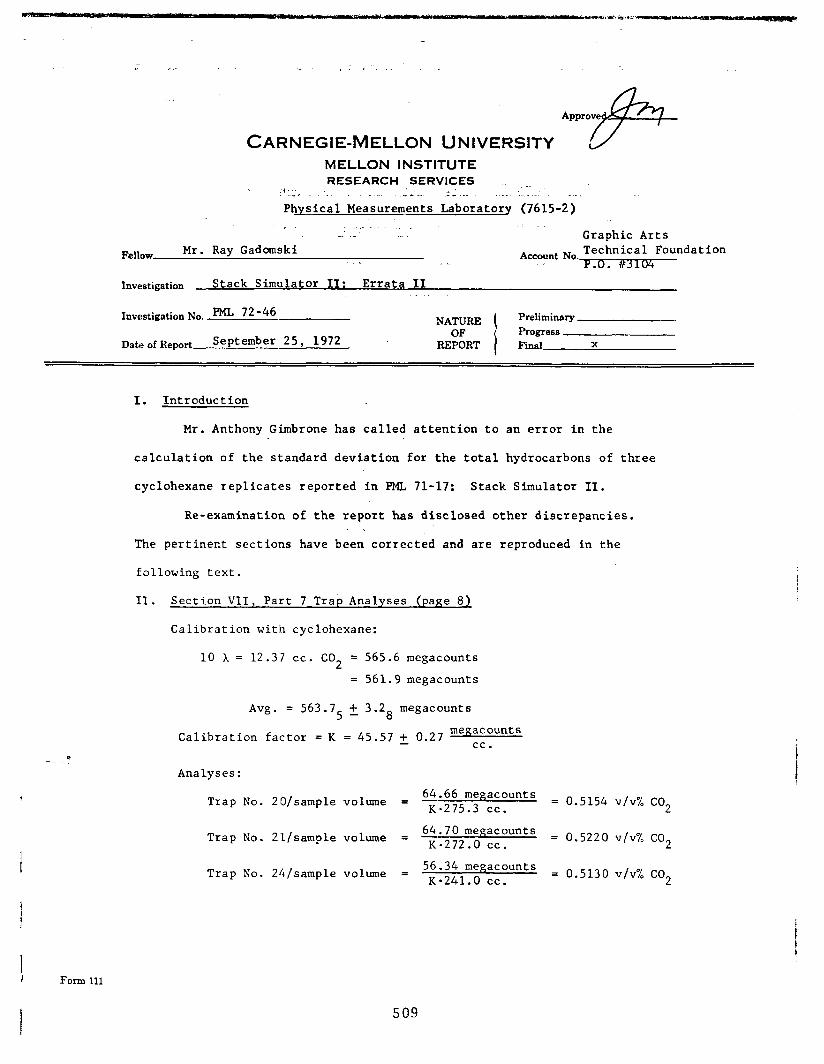
CARNEGIE-MELLON UNIVERSITY MELLON INSTITUTE RESEARCH SERVICES _.
p.. : _ , . _ - .:- __ ‘..I..’ .._.
Physical Measurements Laboratory (7615-2)
. . Graphic Arts
Fellow Mr. Ray Gadomski AccountNo Technical Foundation I ,~ . . 104
Investigation Stack Simulator II: Errata II ._
Investigation No. PML 72-46 NATURE
i
Preliminary
OF Progress DateofReport September 25, 1972 REPORT Final X
a -.
I. Introduction
Mr. Anthony Gimbrone has called attention to an error in the
calculation of the standard deviation for the total hydrocarbons of three
cyclohexane replicates reported in PML 71-17: Stack Simulator II.
Re-examination of the report has disclosed other discrepancies.
The pertinent sections have been corrected and are reproduced in the
following text.
II. Section VII, Part 7 Trap Analyses (page 8)
Calibration with cyclohexane:
10 h = 12.37 cc. CO2 = 565.6 megacounts
= 561.9 megacounts
Avg. = 563.75 +_ 3.28 megacounts
Calibration factor = K = 45.57 + 0.27 meg~~ounts .
Analyses:
64.66 me acounts Trap No. 2Q/sample volume = x.2,5 3gcc . .
= 0.5154 V/v% co2
Trap No. 22/sample volume = 64.70 megacounts
K-272.0 cc. = 0.5220 v/v% co2
Trap No. 24/sample volume = 56.34 megacounts
K-241.0 cc. = 0.5130 v/v% co2
I I Form 111
509
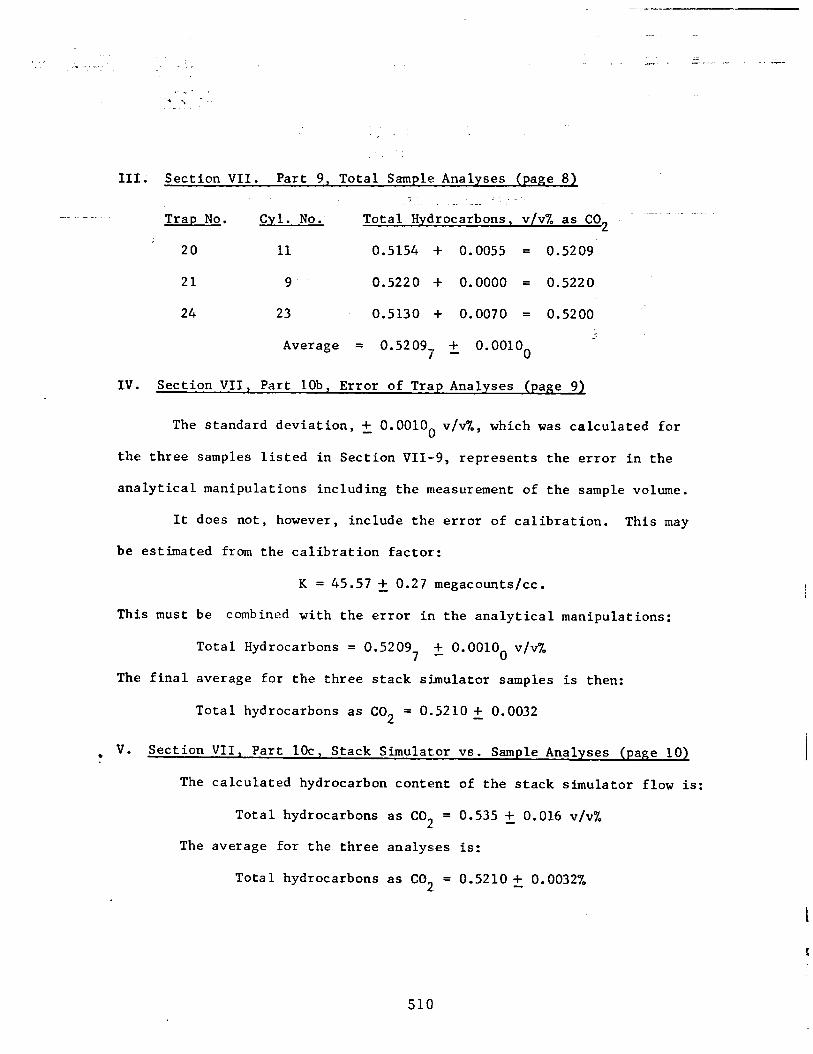
III. Section VII. Part 9, Total Sample Analyses (page 8)
Trap No. Cyl. No. Total Hydrocarbons, v/v% as CO2
20 11 0.5154 + 0.0055 = 0.5209
21 9 0.5220 + 0.0000 = 0.5220
24 23 0.5130 + 0.0070 = 0.5200.
Average = o.520g7 +_ o.ooloo
IV. Section VII, Part lob, Error of Trap Analyses (page 9)
The standard deviation, +, O.OOIOo v/v%, which was calculated for
the three samples listed in Section VII-g, represents the error in the
analytical manipulations including the measurement of the sample volume.
It does not, however, include the error of calibration. This may
be estimated from the calibration factor:
K= 45.57 +, 0.27 megacounts/cc.
This must be combined with the error in the analytical manipulations:
Total Hydrocarbons = 0.5209 7 +, o.ooloo v/v"/.
The final average for the three stack simulator samples is then:
Total hydrocarbons as CO2 = 0.5210 + 0.0032
. IT- Section VII, Part lOc, Stack Simulator vs. Sample Analyses (page 10)
. The calculated hydrocarbon content of the stack simulator flow is:
Total hydrocarbons as CO2, = 0.535 +, 0.016 v/v%
The average for the three analyses is:
Total hydrocarbons as CO2: = 0.5210 +, 0.0032%
510
,_-- . - - . _..1_““““._ - . . - . - - - _
~.
.
The analyses are within a standard deviation of the calculated
content of the flow in the stack simulator.
i
R. J.'JReitz Senior Fellow
Physical Measurements Laboratory
RJR:jdf
511
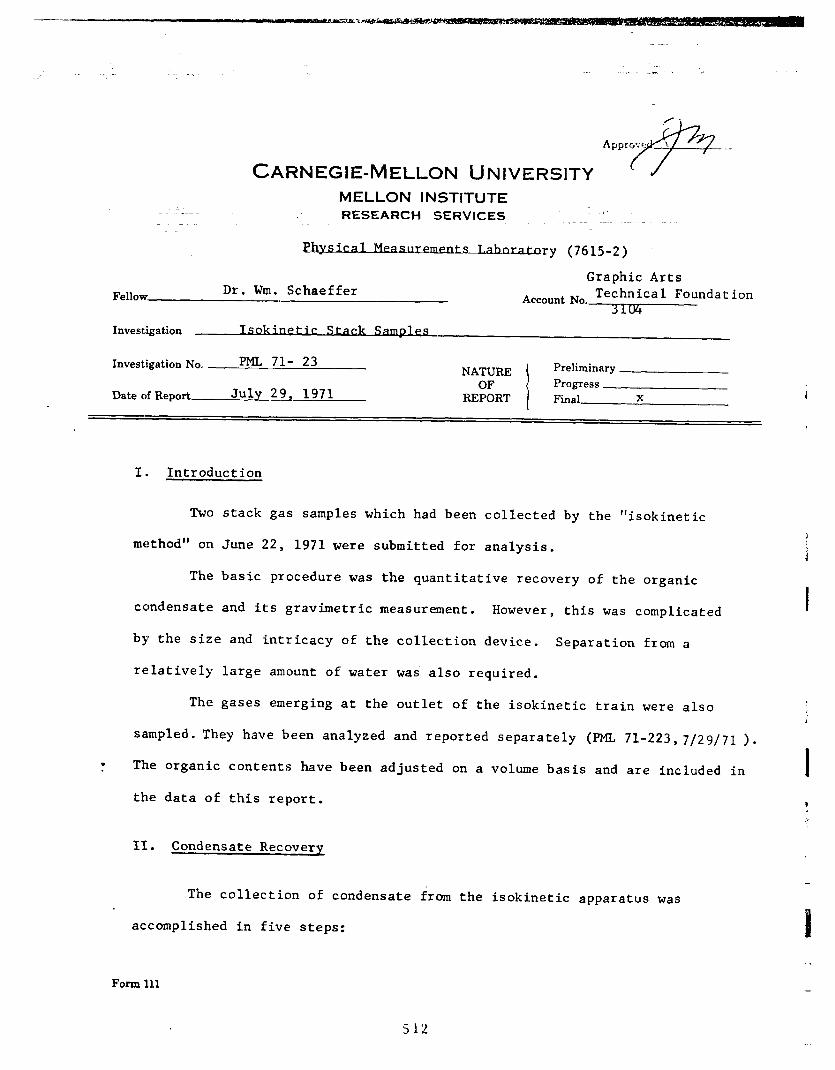
. - . . ._ . I
. _-
.y
ApprGW \
CARNEGIE-MELLON UNIVERSITY p-
MELLON INSTITUTE __- - RESEARCH SERVICES
ts Tahnxatnry (7615-2)
Fellow Dr. Wm. Schaeffer - Graphic Arts
Technical Foundation Account N"-3TPr-
Investigation . . I S Ohl&t 1 C S tack
Investigation No. PML 71- 23
Date of Report July 29, 1971
NATURE OF
REPORT
Preliminary Progress Final X
I. Introduction
Two stack gas samples which had been collected by the "isokinetic
method" on June 22, 1971 were submitted for analysis.
The basic procedure was the quantitative recovery of the organic
condensate and its gravimetric measurement. However, this was complicated
by the size and intricacy of the collection device. Separation from a
relatively large amount of water was also required.
The gases emerging at the outlet of the isokinetic train were also
sampled. They have been analyzed and re,ported separately (F'ML 71-223,7/29/71 ).
. The organic contents have been adjusted on a volume basis and are included in
the data of this report.
II. Condensate Recovery
The collection of condensate irom the isokinetic apparatus was
accomplished in five steps: II
, .
Form 11.1 -
512
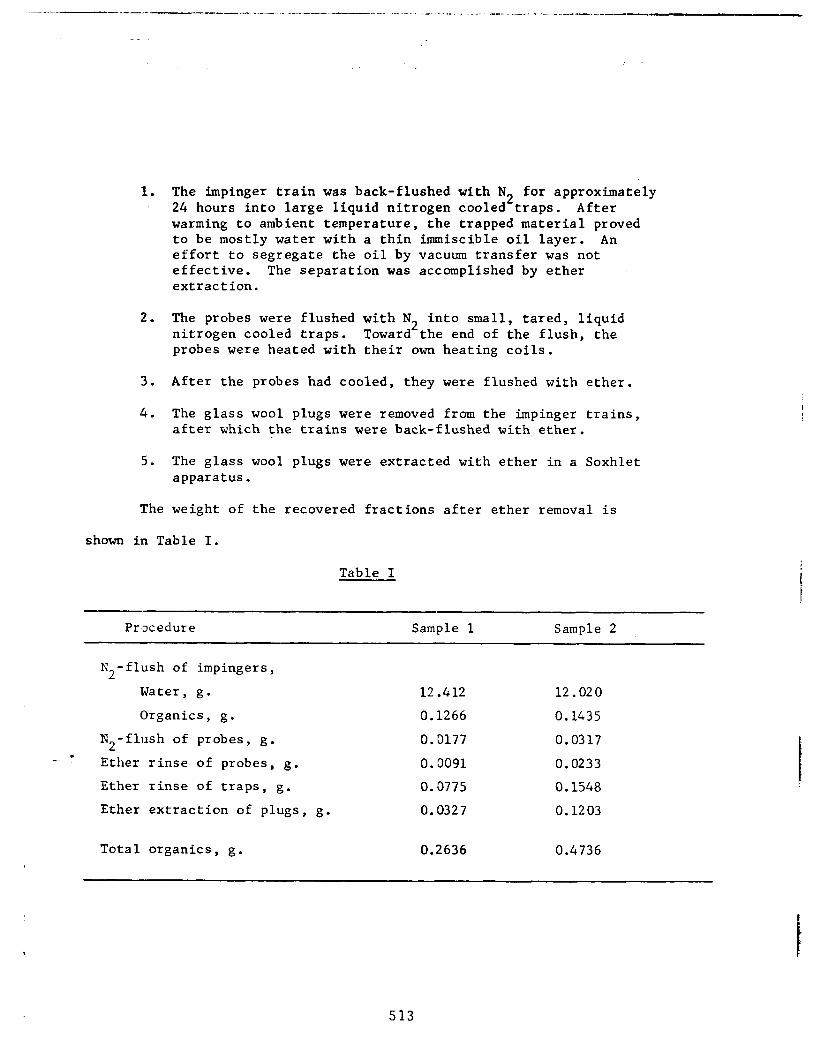
--I_ - - - - - - . _, - . __...I.._. .-.--__. . - . - - ” “ ” - ._. , “ . , , . . ” _-,.-- . - . - . - - ^_-- _._---
1. The impinger train was back-flushed with N2 for approximately 24 hours into large liquid nitrogen cooled traps. After warming to ambient temperature, the trapped material proved to be mostly water with a thin immiscible oil layer.. An effort to segregate the oil by vacuum transfer was not effective. The separation was accomplished by ether extraction.
2. The probes were flushed with N2 into small, tared, liquid nitrogen cooled traps. Toward the end of the flush, the probes were heated with their own heating coils.
3. After the probes had cooled, they were flushed with ether.
4 . The glass wool plugs were removed from the impinger trains, after which the trains were back-flushed with ether.
5. The glass wool plugs were extracted with ether in a Soxhlet apparatus.
The weight of the recovered fractions after ether removal is
shown in Table I.
Table I
Procedure Sample 1 Sample 2
N2-flush of impingers,
Water, g. 12.412 12.020
Organics, g. 0.1266 0.1435
N2-flush of probes, g. 0.0177 0.0317 t Ether rinse of probes, g. 0.~0091 0.0233
Ether rinse of traps, g. 0.0775 0.1548
Ether extraction of plugs, g. 0.10327 0.1203
Total organics, g. 0.2636 0.4736
513
The organic content of the gas samples taken of the effluent
from the impinger train indicate that 0.0641 g. and 0.0357 g. of
organic carbon content should be added to Samples 1 and 2 respectively.
R. J. Reitz Senior Fellow
Physical Measurements Laboratory
RJR:jdf
514
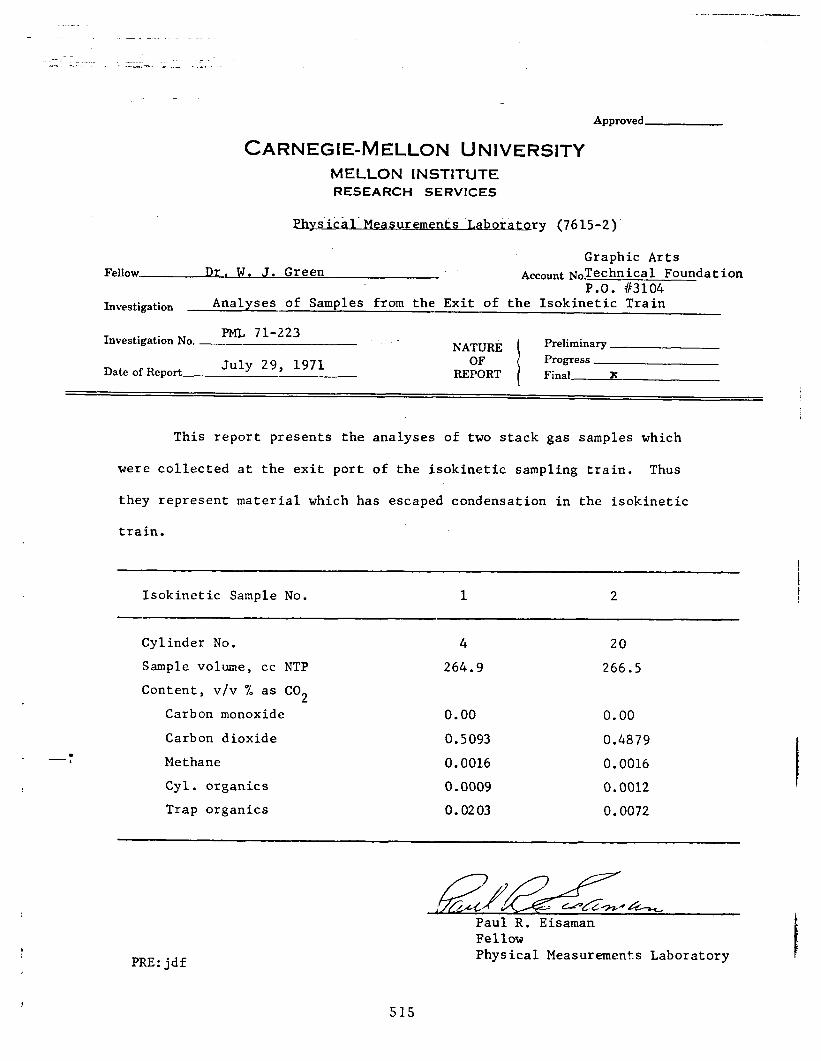
.-..-_..-_-
Approved
CARNEGIE-MELLON UNIVERSITY MELLON INSTITUTE RESEARCH SERVICES
. Physical Measu rements T,aboratory (7615-2)
Graphic Arts Fellow. Dr. W. J. Green Account No.TeChniCal Foundation
P.O. f3104 Investigation Analyses of Samples from the Exit of the Isokinetic Train
Investigation No, PML 71-223
NATURE
I
Preliminary
July 29, 1971 OF Progress Date of Report REPORT Final x
This report presents the analyses of two stack gas samples which
were collected at the exit port of the isokinetic sampling train. Thus
they represent material which has escaped condensation in the isokinetic
train.
Isokinetic Sample No. 1 2 j
--:
Cylinder No.
Sample volume, cc NTP Content, v/v % as CO 2
Carbon monoxide
Carbon dioxide Methane Cyl. organics Trap organics
4 20
264.9 266.5
0.00 0.00
0.5093 0.4879
0.0016 0.0016
0.0009 0.0012
0.0203 0.0072
Paul R. Eisaman Fellow Physical Measurements Laboratory t PRE:jdf
515
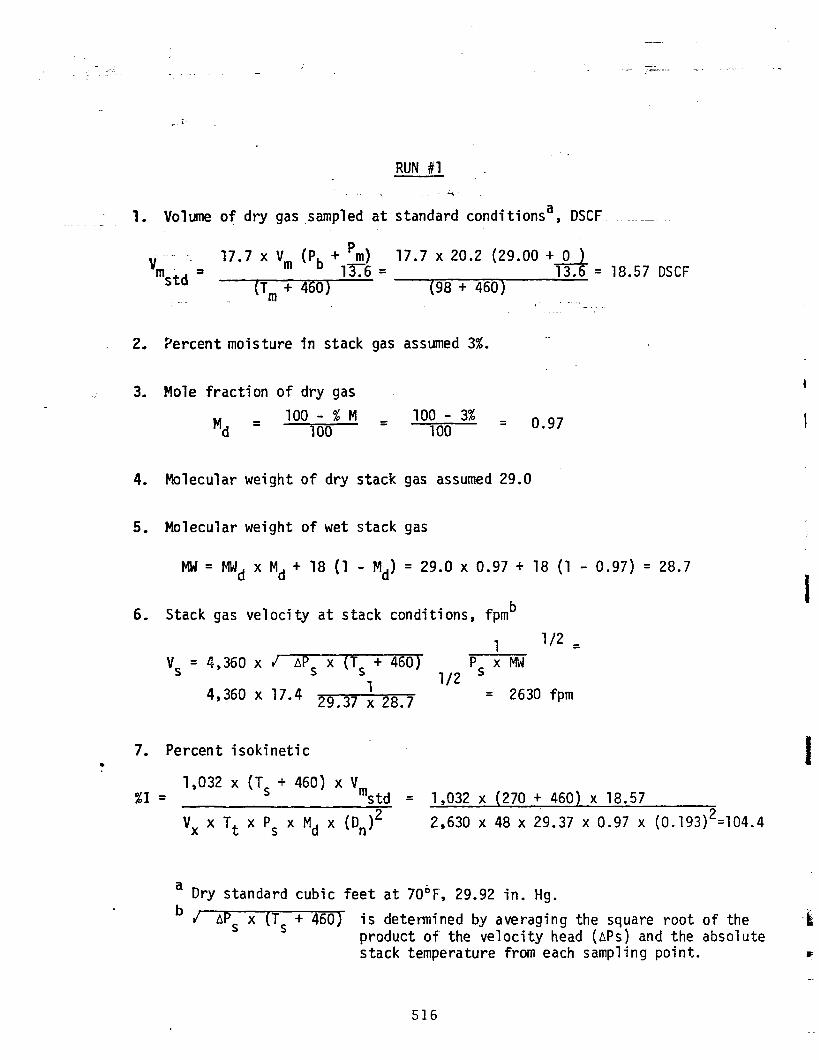
--
RUN #1
'-.
1. Volume of dry gas sampled at standard conditionsa, DSCF
v 17.7 x mstd =
vm (Pb + Pm) 17.7 x 20.2 (29.00 + lr6 =
+ 0 3.6 = 18.57 DSCF
(Tm + 460) (98 + 460) . _ 1 :-,-...
2, Percent moisture in stack gas assumed 3%. -.
3. Mole fraction of dry gas
Md = lOO-%M = loo-3% = 100 100 0.97
4. Molecular weight of dry stack gas assumed 29.0
5, Molecular weight of wet stack gas
Ml4 = Mwd x Md + 18 (1 - Md) = 29.0 x 0.97 + 18 (1 - 0.97) = 28.7
6, Stack gas velocity at stack conditions, fpmb I
1 112 =
vS = 4,360 x d APs x Us + 460)1
l/2 Ps x Mw
4y360 ' 17*4 1 29.37 = x 28.7 2630 fpm
7, Percent isokinetic .
%I = 1,032 x (Ts -I- 460) x V
mstd = 1,032 x (270 + 460) x 18.57
V, x Tt x Ps x Md x (Dn)2 2,630 x 48 x 29.37 x 0.97 x (0.193)2=104.4
a Dry standard cubic feet at 70”F, 29.92 in. Hg.
b 1, APs x (Ts + 460) is determined by averaging the square root of the 4 product of the velocity head (APs) and the absolute stack temperature from each sampling point. l
516
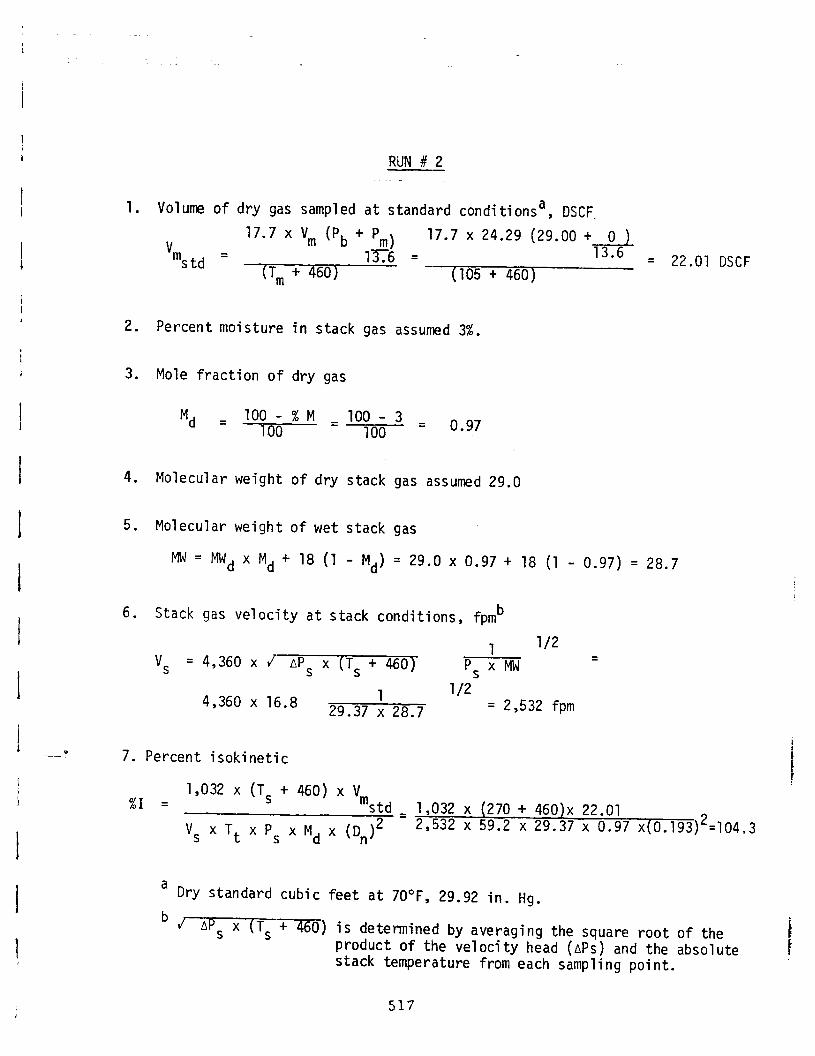
RiJN # 2 --
1. Volume of dry gas sampled at standard conditionsa, DSCF.
17.7 x vm (Pb + P V d
17.7 x 24.29 (29.00 + 0 )
mstd = 13.6 = 13.6 (T, + 460) (105 + 460)
= 22.01 DSCF
2. Percent moisture in stack gas assumed 3%.
3. Mole fraction of dry gas
Md = '";o; % M = '";o~ 3 = 0.97
4. Molecular weight of dry stack gas assumed 29.0
5. Molecular weight of wet stack gas
Mw= MWd x Md + 18 (1 - Md) = 29.0 x 0.97 + 18 (1 - 0.97) = 28.7
6. Stack gas velocity at stack conditions, fpmb
1 l/2
vS = 4,360 x w’ APS x (Ts + 460) Ps x MW =
4,360 l/2
x 16.8 1 29.37 = x 28.7 2,532 fpm
7. Percent isokinetic
%I = 1,032 x (Ts + 460) x Vm
std
v, X Tt X Ps X Md X (Dn)2
= 1,032 x (270 + 460)x 22.01 2,532 x 59.2 x 29.37 x 0.97 x(O.193)2=1O4.3
a Dry standard cubic feet at 70°F, 29.92 in. Hg.
bd AP S x (Ts + 460) is determined by averaging the square root of the
product of the velocity head (APs) and the absolute 1
stack temperature from each sampling point. 1
517
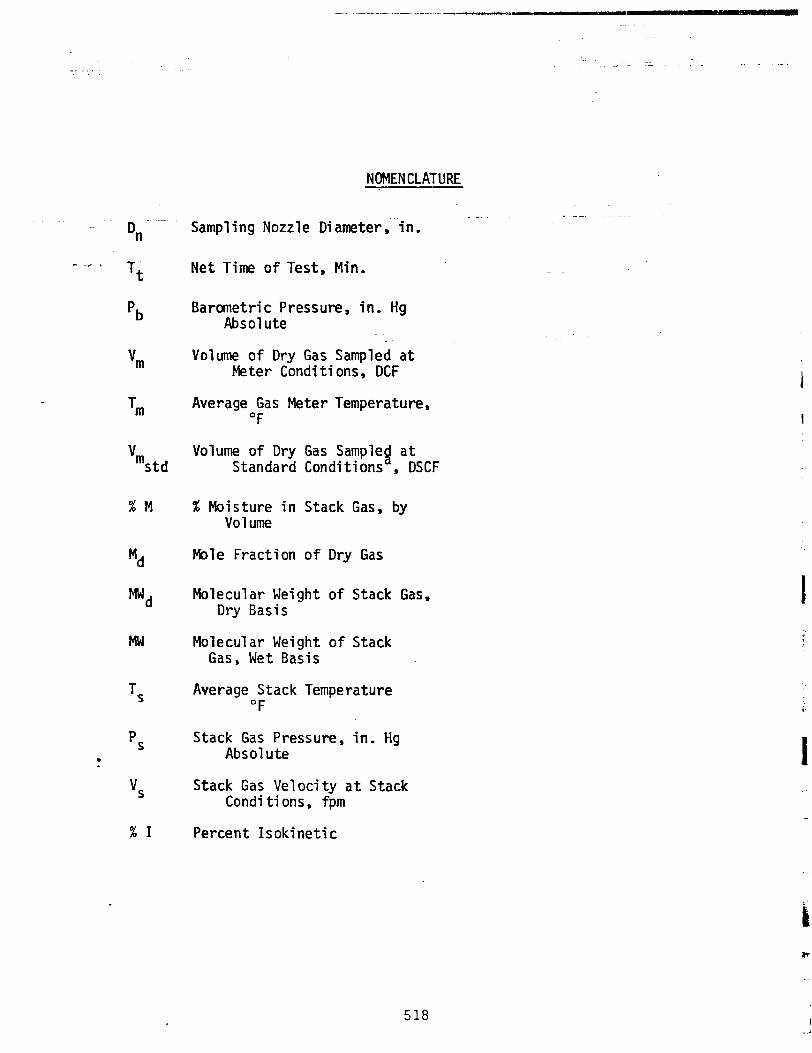
_.
NOMENCLATURE
- Dn Sampling Nozzle Diameter, in. --~ -~
Tt Net Time of Test, Min.
'b Barometric Pressure, in. Hg Absolute
rll Volume of Dry Gas Sampled at Meter Conditions, DCF
Tm Average Gas Meter Temperature, "F
V mstd
Volume of Dry Gas Sampleg at Standard Conditions , DSCF
%M % Moisture in Stack Gas, by Volume
Md Mole Fraction of Dry Gas
MNd Molecular Weight of Stack Gas, Dry Basis
Mw Molecular Weight of Stack Gas, Wet Basis
TS Average Stack Temperature
"F
p:s Stack Gas Pressure, in. Hg . Absolute I
% Stack Gas Velocity at Stack Conditions, fpm
%I Percent Isokinetic
t
I
518
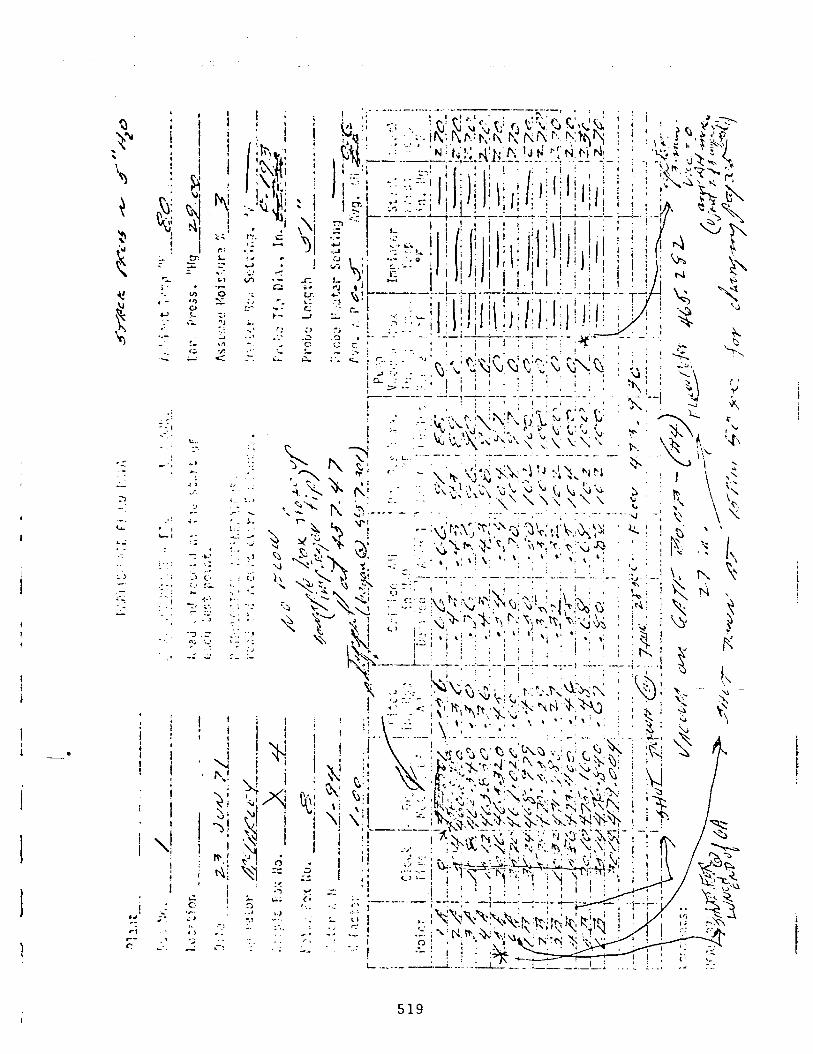
i,
--
._
._ )
. .
. :
._
.- 1 I _.. -‘1 L.. *:
7 ;i :- ;-
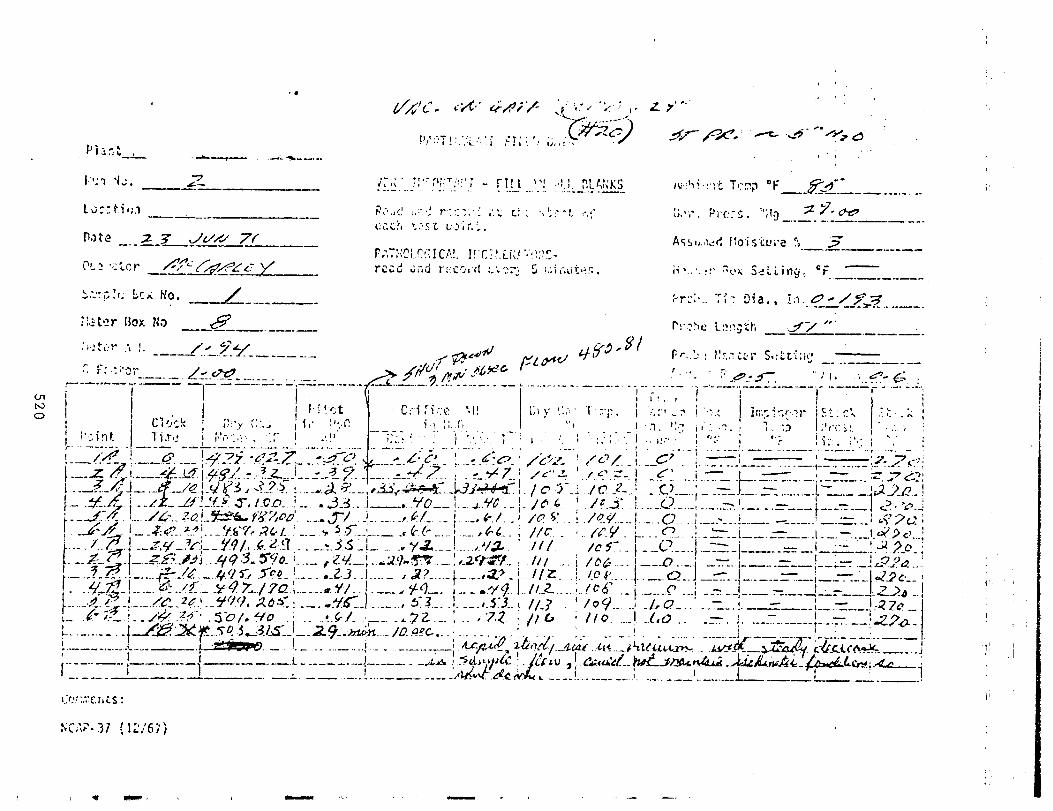
. . . . . C’ .,. ..- !‘,’ :i , ! :. .:i.” *
-‘~&..-~
__. : . . ,P! I ‘. ’ U‘S! ‘. ./
!L:2 ,; II - tci No. --_/ -.--- --- liiCt?r lkx ?d:, 8 -- ----. ---_- : il? t;: r i: ‘, -/..~-.‘Y ------___. : F: .I ;3;- -.--. __ tlz.ee, .__._^ . -- ,F’---.-- __” -- ---.--..--L’
I 1 ,----.-en..
0-l i I
.r-c j -i - f d’ i - . I . CL : ..-.
. 'I.: I.Ip, i !. ";-' ; ,.-
*- i * II, .
; ": ; .,,' _ ___'. -- .- ...---- ..--_.-. .‘, .._. -.
-1 1 P'% 7 -9; . - . -_- -___ _ _. I +-- . . ._,..- L.. ..A': L. !
- . - . _-.._ _.__
-,k
-.: _---._ '6.1
. . . . . ..-.
- - 7ccZ]
I- . ‘J.2, f ---+
1’
- .,. - e t -_
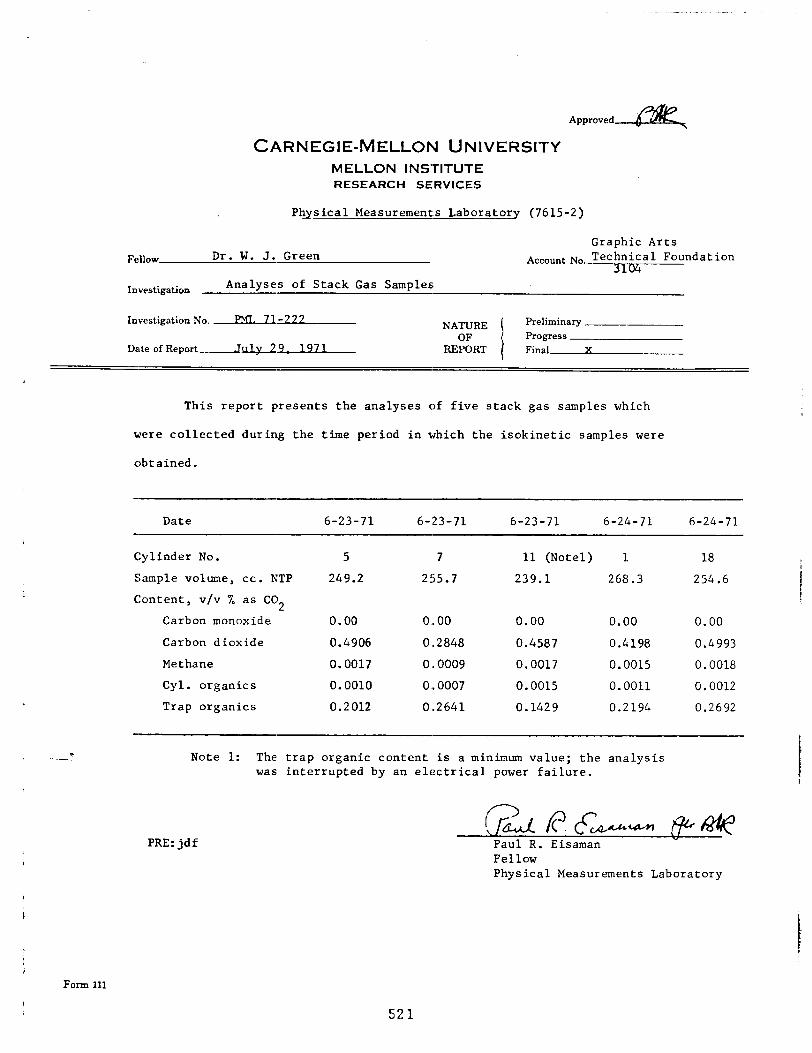
CARNEGIE-MELLON UNIVERSITY MELLON INSTITUTE RESEARCH SERVICES
Physical Measurements Laboratory (7615-2)
Graphic Arts
Fellow Dr. W. J. Green Technical Foundation Account No.-
Investigation Analyses of Stack Gas Samples
Investigation No. --.-mLJl-222~
Date of Report-a
NATURE OF
REPORT
Preliminary Progress Final X
c . -
This report presents the analyses of five stack gas samples which
were collected during the time period in which the isokinetic samples were
obtained.
Date 6-23-71 6-:23-71 6-23-71 6-24-71 6-24-71
Cylinder No. 5 7 11 (Notel) 1 18
Sample volume, cc. NTP 249.2 255.7 239.1 268.3 254.6
Content, v/v % as CO 2
Carbon monoxide 0.00 0.00 0.00 0.00 0.00
Carbon dioxide 0.4906 O-2848 0.4587 0.4198 0.4993
Methane 0.0017 0 ,I 0009 0.0017 0.0015 0.0018
Cyl. organics 0.0010 0..0007 0.0015 0.0011 0.0012
Trap organics 0.2012 0..2641 0.1429 0.2194 0.2692
Note 1: The trap organic content is a minimum value; the analysis was interrupted by an electrical power failure.
PRE:jdf 1% I? &Lm+- ,+ akfy
Paul R. Eisaman Fellow Physical Measurements Laboratory
Form 111
521
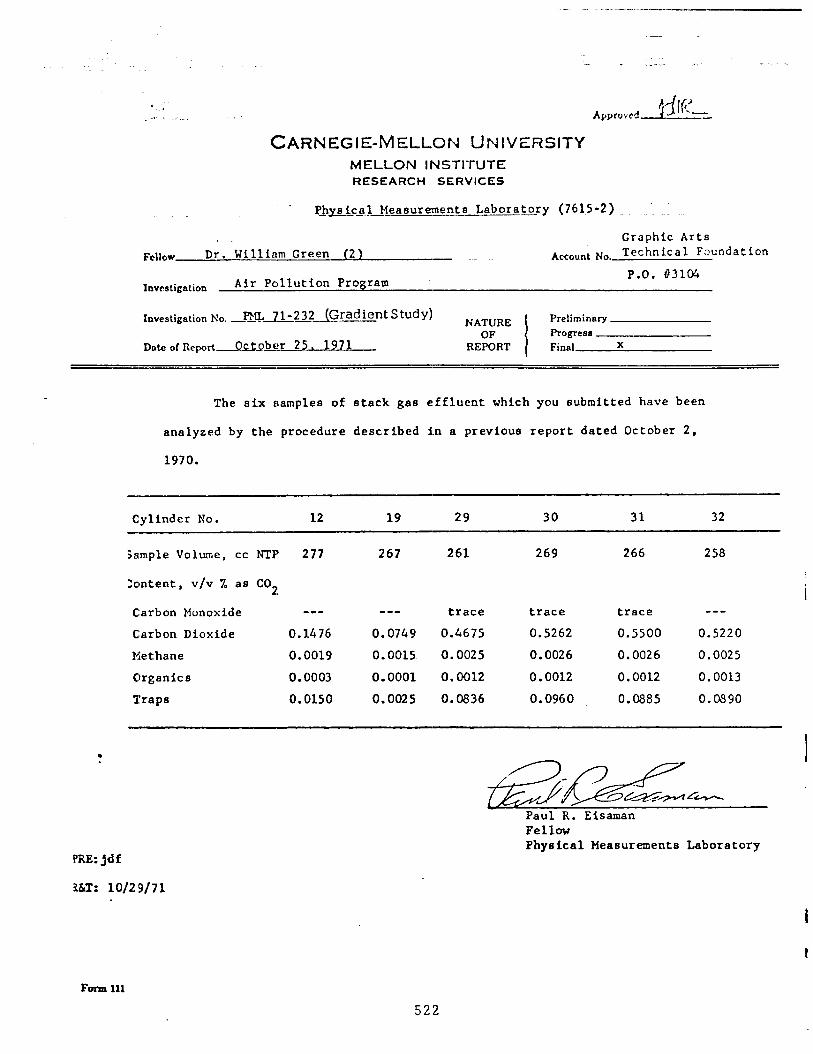
_ ____ -. .---
CARNEGIE-MELLON UNIVERSITY MELLON INSTITUTE RESEARCH SERVICES
- Physical Measurements Laboratory (7615-2)
Graphic Arts FcIlow Dr. William Green (2) Account No. Technical Foundation - .~
Air Pollution Program P.O. c/3104 Investigation
Investigation No. 2Ytt 71-232 (Gradient Study)
Dnt.e of Report>Obel.!
NATURE OF
REPORT I
Preliminary Progress Final X
The six samples of stack gas effluent which you submitted have been
analyzed by the procedure described i.n a previous report dated October 2,
1970.
-
Cylinder No. 12 19 29 30 31 32
Sample Volume, cc NTP 277 267 261 269 266 258
Zontent, v/v 7. as CO2
C:arbon Monoxide es- --- trace trace trace e-w
Carbon Dioxide 0.1476 0.0749 0.4675 0.5262 0.5500 0.5220
Methane 0.0019 0.0015 0.0025 0.0026 0.0026 0.0025
Organics 0.0003 0.0001 0.0012 0.0012 0.0012 0.0013
Traps 0.0150 0.0025 0.0836 0.0960 0.0885 0.0890
.
PRE: jdf
I&T: 10/29/71
Fonn 111
522
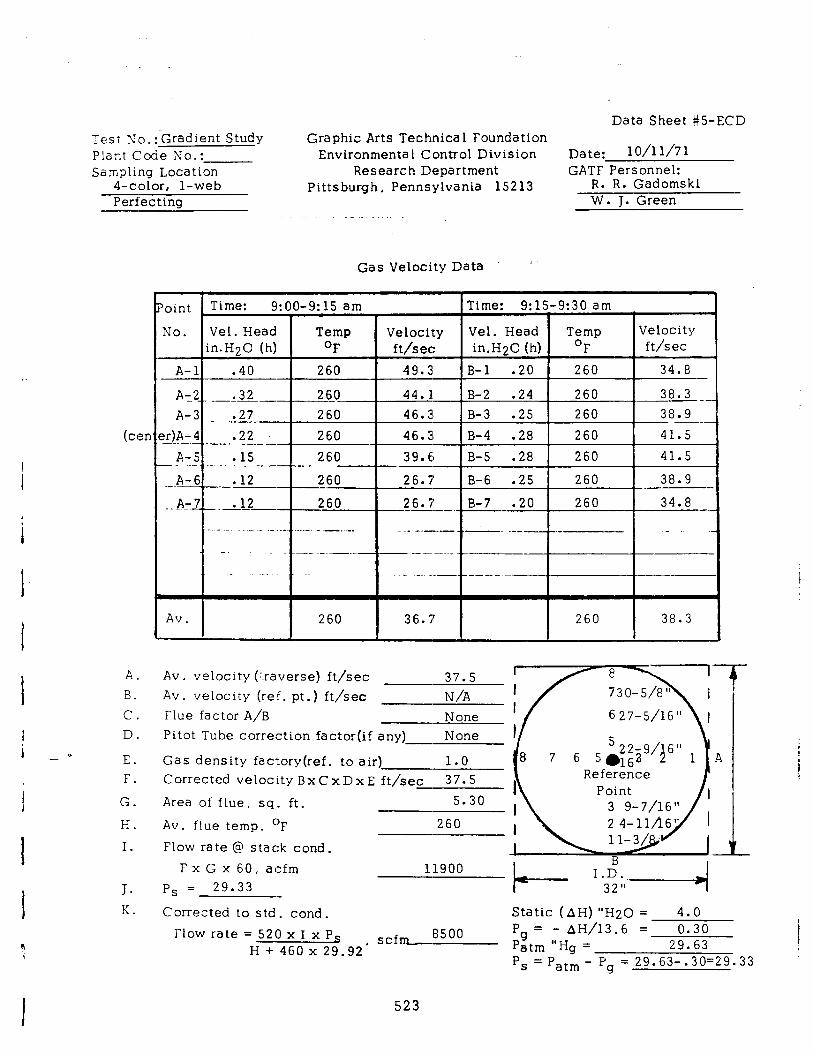
Data Sheet #5-ECD
-
?es t No. :-Gradient Study Plant Code No.: Sampling Location
4-c~otor, l-web Perf’ecting
Graphic Arts Technica 1 Foundation Environmental Control Division
Research Department Pittsburgh, Pennsylvania 15213
(ten
A. B. c. D.
c E. F.
G.
H. I.
J. K.
Gas Velocity Data
Date: 10/l l/71 GATF Personnel:
R. R. Gadomski W. T. Green
Point Time: 9: 00-9: 15 am Time: 9:15-9:30 am _
No. Vel. Head Temp Velocity Vel. Head Temp Velocity in.H20 (h) OF ft/sec in.H20 (h) OF ft/s ec
A-l .40 260 49.3’ B-l .20 260 34.6
A.:‘Z wAL 260 44.1 B-2 .24 260 _ 38.3 __ A-3 .,Z 260 46.31 B-3 .25 260 38.9 -
,’ er)A- 4 .22 260 46.3; B-4 .28 260 41.5 I ----- A-5 .15 260 39.6 B-5 .28 260 41.5 - - ..-. _- ---- _. - - .--. -
.-.A-6 . 12 260 26.7 B-6 .25 260 38.9 ----- _ AT2 .12- 260 26.7 B-7 .20 260 34.8 _ _
.- -.-- -. - .- - .-.. . . --- --. -.-_ . -.-. -.- __-_.-. ._- -. .- -- --.._---- -- ~_._._ .----._ _.
..- -. ..-.---.__ _
I Av . I I 260 I 36.7 I I 260 I 38.3 I
Av. velocity (:.raverse) ft/sec 37.5 Av. velocity (ref. pt.) ft/sec N/A Flue factor A/B None Pitot Tube correction factor(if any) None
Gas density factory(ref. to air) 1.0 Corrected velocity BxCxDxE ft/sec 37.5 - Area of flue, sq. ft. 5.30
Av. flue temp. “F 260
Flow rate @ stack cond. FxGx60, acfm 11900
Ps = 29.33
Corrected to std. cond. Flow rate = 520 x I x Ps , scfrrl-8500
H + 460 x 29.92
7 6 5 &ij”‘$” 1 Reference
Static (AH) “H20 = 4.0 Pg = - AH/13.6 = 0.30 Patm “Hg = 29.63 ‘s = Patm - Pg = 29.63-.30=29.33
523
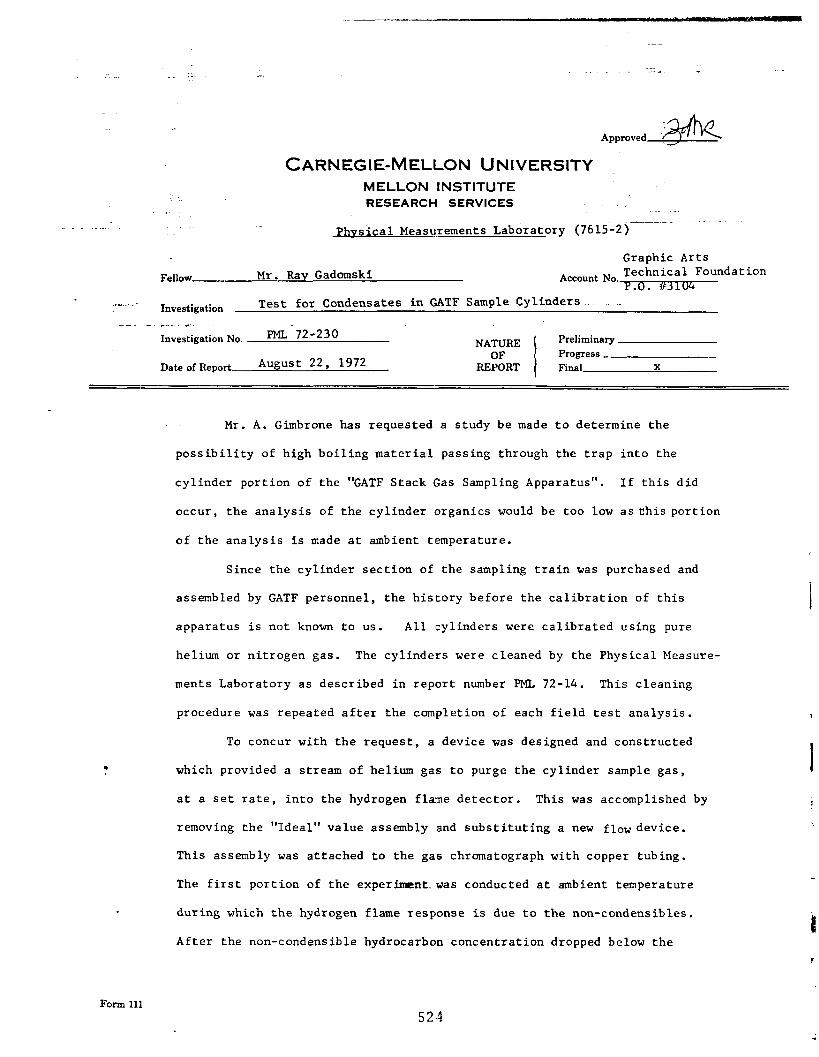
. ~_ . .: _. ,. _ ~---
.I Appro”ed2j&!c
CARNEGIE-MELLON UNIVERSITY MELLON INSTITUTE RESEARCH SERVICES .~
.----.-- ~-~ -- Jhvsical Measurements Laboratory (7615-2) -
Fellow Mr. Ray Gadomski
Graphic Arts Account No,Technical Foundation
. . lW+
2.3 .~.. Investigation Test for Condensates in GATF Sample Cylinders .
- .- - -__ ._ P&72-230 Investigation No.---- NATURE Preliminary
August 22, 1972 OF Progress
Date of Report REPORT Final X
.
Mr. A. Gimbrone has requested a study be made to determine the
possibility of high boiling material passing through the trap into the
cylinder portion of the "GATF Stack Gas Sampling Apparatus". If this did
occur, the analysis of the cylinder lorganics would be too low as this portion
of the analysis is made at ambient temperature.
Since the cylinder section of the sampling train was purchased and
assembled by GATF personnel, the history before the calibration of this
apparatus is not known to us. All (cylinders were calibrated using pure
helium or nitrogen gas. The cylinders were cleaned by the Physical Measure-
ments Laboratory as described in rep'ort number PML 72-14. This cleaning
procedure was repeated after the completion of each field test analysis.
To concur with the request, a device was designed and constructed
which provided a stream of helium gas to purge the cylinder sample gas,
at a set rate, into the hydrogen flame detector. This was accomplished by
removing the "Ideal“ value assembly and substituting a new flowdevice.
This assembly was attached to the gas chromatograph with copper tubing.
The first portion of the experinrent:was conducted at ambient temperature
during which the hydrogen flame response is due to the non-condensibles.
After the non-condensible hydrocarbon concentration dropped below the
Form 111 524
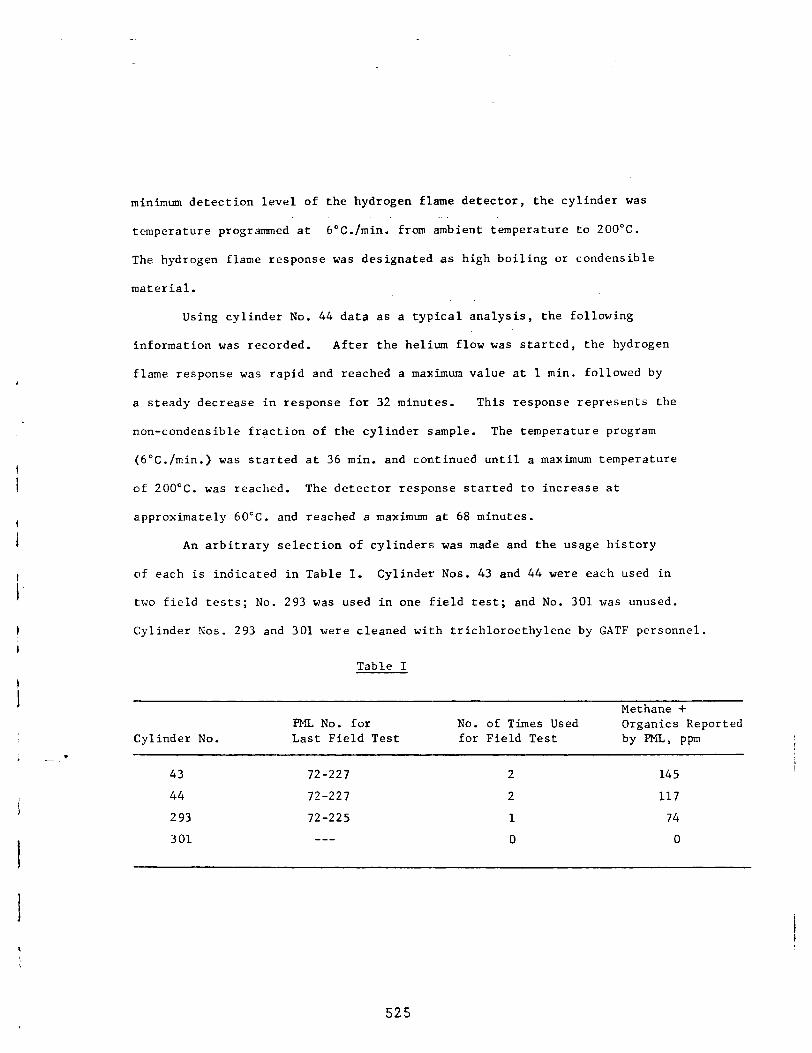
minimum detection level of the hydrogen flame detector, the cylinder was
temperature programmed at 6"C./min. from ambient temperature to 200°C.
The hydrogen flame response was designated as high boiling or condensible
material.
Using cylinder No. 44 data as a typical analysis, the following
information was recorded. After the helium flow was started, the hydrogen
flame response was rapid and reached a maximum value at 1 min. followed by
a steady decrease in response for 32 minutes. This response represents the
non-condensible fraction of the cylinder sample. The temperature program
(6“C./min.) was started at 36 min. and continued until a maximum temperature
of 200°C. was reached. The detector response started to increase at
approximately 60°C. and reached a maximum at 68 minutes.
An arbitrary selection of cylinders was made and the usage history
of each is indicated in Table I. Cylinder Nos. 43 and 44 were each used in
two field tests; No. 293 was used in one field test; and No. 301 was unused.
Cylinder Nos. 293 and 301 were cleaned with trichloroethylene by GATF personnel.
Table I
Cylinder No.
43
44
293
301
PML No. for No. of Times Used Last Field Test for Field Test
72-227 2
72-227 2
72-225 1
--- 0
Methane + Organics Reported
by m, ppm
145
117
74
0
525

1
. . . /, I.. .
The results of the
condensibles are reported
the sample gas present in
high boiling organics are
analysis are tabulated in Table II. The non- / I
as "ppm as CO2" using the corrected volume of
the cylinder at the time of the analysis. The
reported as the equivalent of n-heptane which
would be present as liquid in the cylinder section of the sampling train.
Table II
Cylinder No. Non-Condensibles, High Boiling Organics, Ppm as CO2 ml. as n-heptane
43 84 0.0014 I
44 89 0.0015 i 293 56 0.0006
301 0 0.0019 I
An exact material balance between the two analyses cannot be expected.
The hydrogen flame response is related to the composition of the gas stream.
In a normal analysis, the hydrogen flame responds to helium carrier plus
pure organics. In these analyses, ,the hydrogen flame responds to helium I
carrier plus a mixture of inorganics and organics which alter the flame
sensitivity. Some loss is also expected when changing the cylinder
configuration to accommodate the purging device and the connectors to the gas
chromatographic unit.
--
526
The high boiling organics or cylinder residue has a low vapor pressure
at ambient temperature since it is not substantially removed by evacuation
at pressures less than one micron. The presence of this residue would not
contribute to the previous values reported for the cylinder analyses.
Paul R. Eisaman Fellow Physical Measurements Laboratory !
PRE:jdf
527
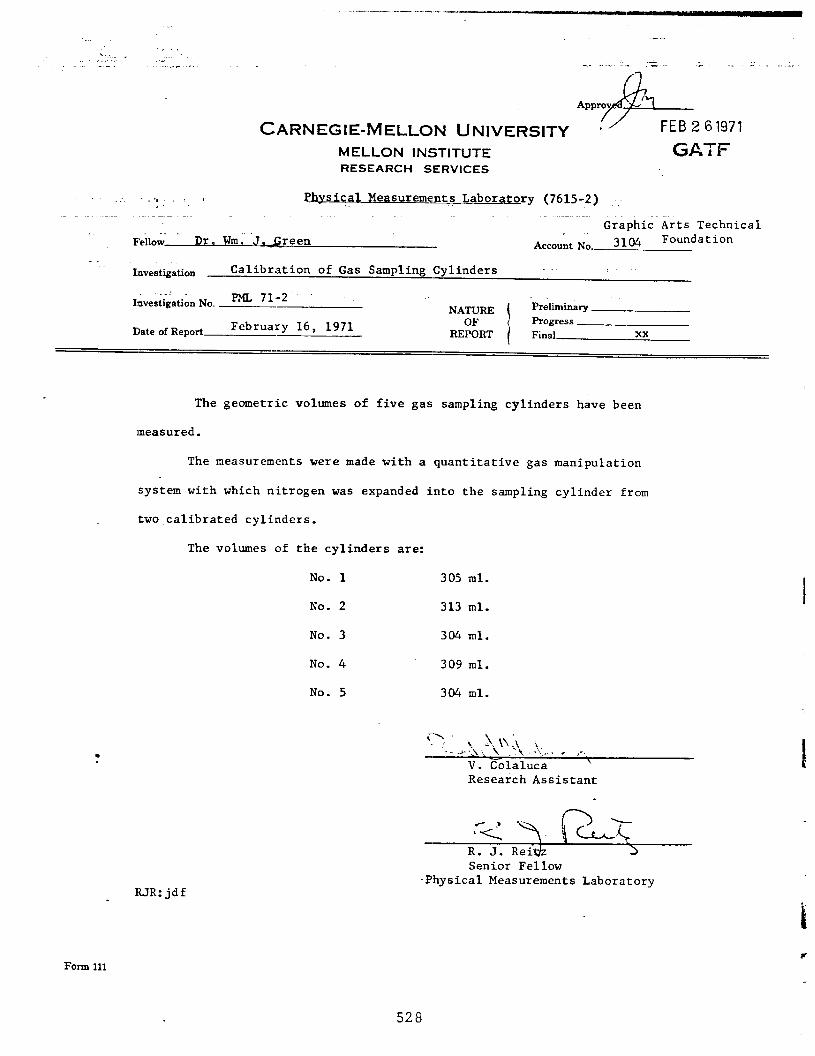
..-_-- --. - ---“_ .---. - -..-_,
ApprT+%iG 61971 CARNEGIE-MELLON UNIVERSITY * MELLON INSTITUTE GA-i-F RESEARCH SERVICES
__, -_., .: I PhYsical Measurements Laboratory (7615-2)
Graphic Arts Technical .
Fell& -. Dr. Wmi'J. G reen Account No. 3104 Foundation
- Investigation Calibration of Gas Sampling Cylinders ..
_-i . Investigation No. PML 71-2
13ate of Report February 16, 1971 NATURE ( Preliminaj
OF Progress REPORT i Final xx
The geometric volumes of five gas sampling cylinders have been
measured.
The measurements were made with a quantitative gas manipulation
.system with which nitrogen was expanded into the sampling cylinder from
'two calibrated cylinders.
The volumes of the cylinders are:
No. 1 305 ml.
No. 2 313 ml.
No. 3 304 ml.
No. 4 309 ml.
No. 5 304 ml.
.
‘
<Y ._.i,.>,.,-\\“i),. ;:.. . .:. , , , ,-.
V. Colaluca \
Research Assistant
R. J. Reidz :,
RJR:jdf
Senior Fellow -Physical Measurements Laboratory
Form 111
528
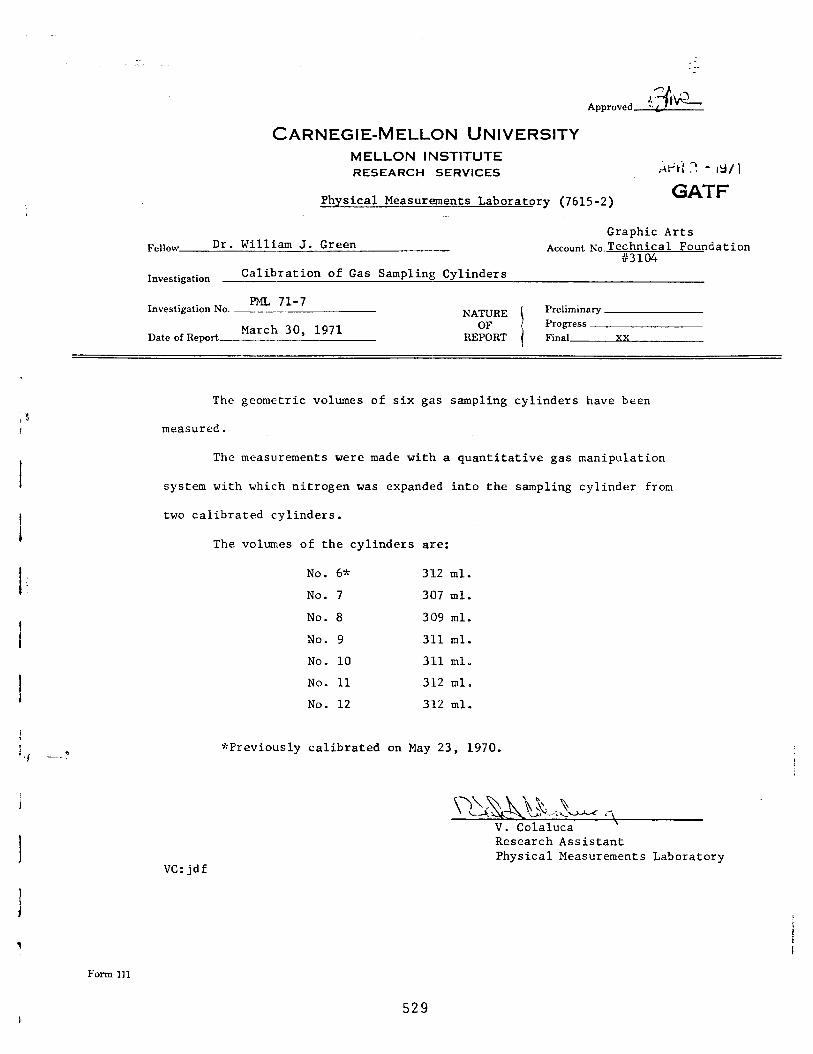
Approved
CARNEGIE-MELLON UNIVERSITY MELLON INSTITUTE RESEARCH SERVICES
Physical Measurements Laboratory (7615-2)
Graphic Arts
Fellow Dr. William J. Green - Account ~~.Technical Foundation #3104
Investigation Calibration of Gas Sampling Cylinders
Investigation No. PML 71-7
___ NATURE Preliminary
March 30, 1971 OF Progress Date of Report REPORT Final xx
The geometric volumes of six gas sampling cylinders have been
measured.
VC:jdf
The measurements were made with a quantitative gas manipulation
system with which nitrogen was expanded into the sampling cylinder from
two calibrated cylinders.
The volumes of the cylinders are:
No. 6* 3!12 ml.
No. 7 307 ml.
No. 8 309 ml.
No. 9 3111 ml.
No. 10 3:Ll ml.
No. 11 3112 ml.
No. 12 3:12 ml.
$:Previously calibrated on May 23, 1970.
Research Assistant Physical Measurements Laboratory
529
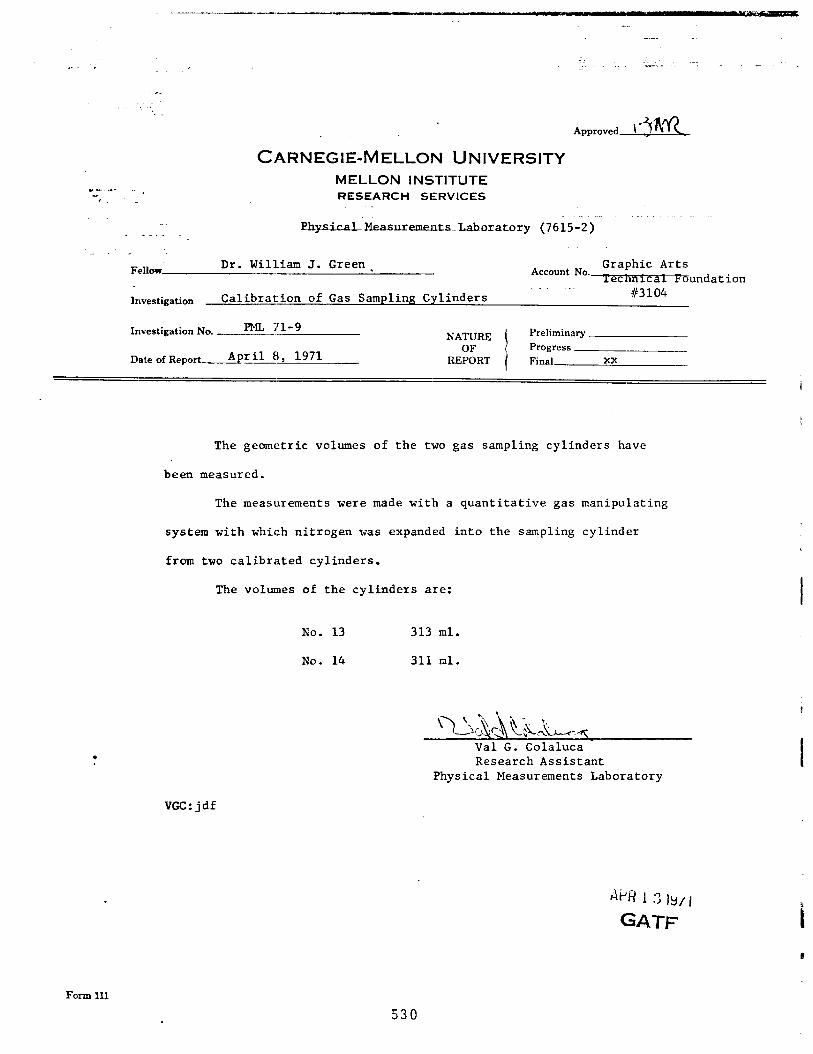
--. ------,l-..-l-_--- I_---
-..
.-. _ . ---
Approved&c
CARNEGIE-MELLON UNIVERSITY MELLON INSTITUTE -...-. . . .
-r RESEARCH SERVICES
EhpicdlMeasuxementslahoratary (7615-2)
Fellow Dr. William J. Green. Account No.
Graphic Arts recnnrcal k:aundation
-. -- Investigation Calibration of Gas Sampling Cylinders #I3104
PML 71-9 Investigation No. _____
April 8, 1971 Date of Report
NATURE OF
REPORT
Preliminary Progress Final xx
i
The geometric volumes of the two gas sampling cylinders have
been measured.
The measurements were made with a quantitative gas manipulating
system with which nitrogen was expanded into the sampling cylinder
from two calibrated cylinders.
The volumes of the cylinders are:
No. 13 313 ml.
No. 14 311 ml.
Val G. Colaluca Research Assistant
Physical Measurements Laboratory
VGC:jdf
Form 111 530
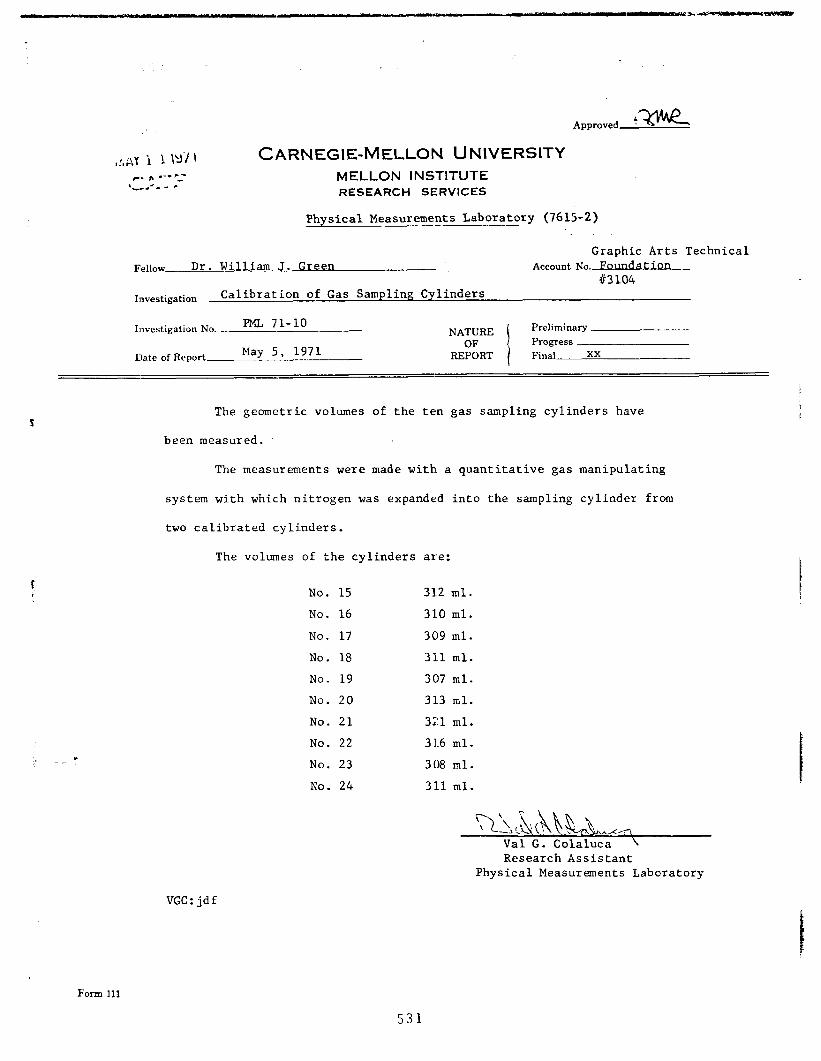
Approved Gee
CARNEGIE-MELLON UNIVERSITY MELLON INSTITUTE RESEARCH SERVlCES
Physical Measurements Laboratory (7615-2) -
Graphic Arts Technical
Fellow Dr. WilliaJ. Green Account No.Foundatlon 83104
hvestigation Calibration of Gas Sampling Cylinders
hvestigation No. PML 71-10 -. NATURE Preliminary
Date of Report May 5, 1971 OF Progress
REPORT i
Final xx
The geometric volumes of the ten gas sampling cylinders have t
been measured.
The measurements were made with a quantitative gas manipulating
system with which nitrogen was expanded into the sampling cylinder from
two calibrated cylinders.
The volumes of the cylinders are:
No. 15
No. 16
No. 17
No. 18
No. 19
No. 20
No. 21
No. 22
No. 23
No. 24
31.2 ml.
31.0 ml.
309 ml.
31.1 ml.
307 ml.
31.3 ml.
321 ml.
31.6 ml.
308 ml.
31.1 ml.
Val G. Colaluca 1 Research Assistant
Physical Measurements Laboratory
VGC: jdf
531
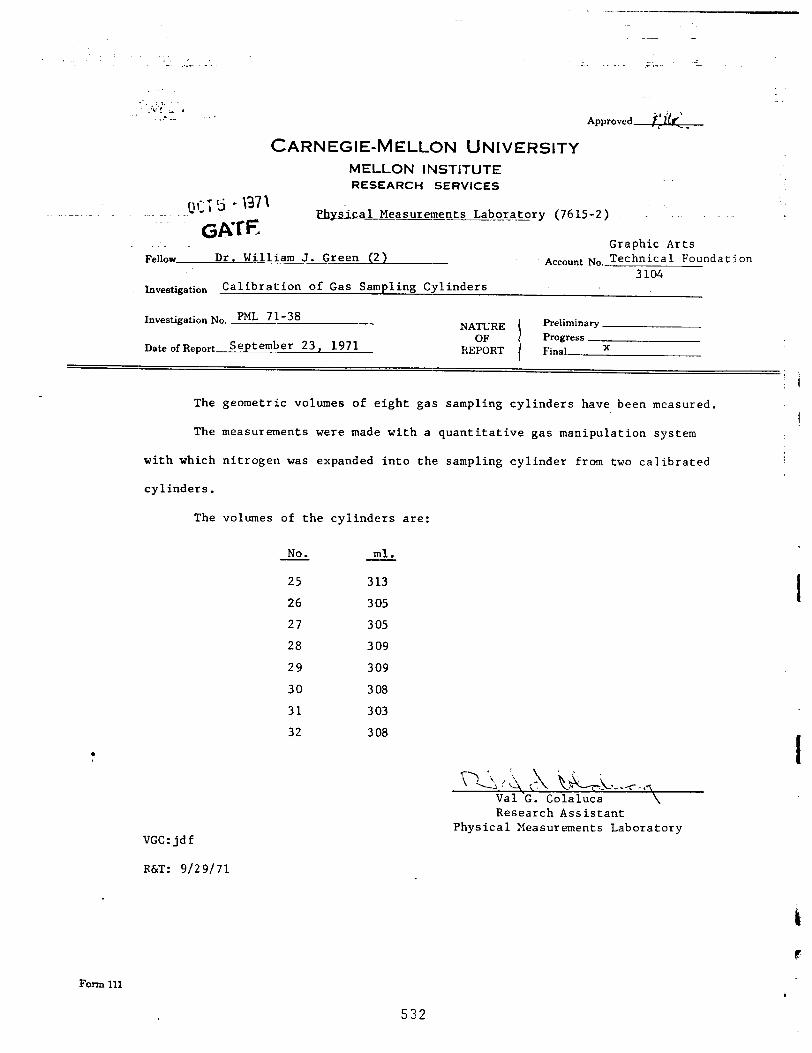
Approved t: 2;iP< _
CARNEGIE-MELLON UNIVERSITY MELLON INSTITUTE RESEARCH SERVICES
Physical Measurements Laboratory (7615-2) ~.________
Graphic Arts Fellow Dr. William J. Green (2) - Account No. Technical Foundation
3104 Investigation Calibration of Gas Sampling Cylinders
Investigation No. -!?!!L?-~~
DateofDeport September 23, 1971
NATURE OF
REPORT
Preliminary Progress Final X
The geometric volumes of eight gas sampling cylinders have been measured.
The measurements were made with a quantitative gas manipulation system
with which nitrogen was expanded into the sampling cylinder from two calibrated
cylinders.
I
The volumes of the cylinders are:
& &
25 313
26 305
27 305
28 309
29 309
30 308
31 303
32 308
.
‘\ * \ Q !.d :1\ &&//.,
Val G. Colaluca \ Research Assistant
Physical Measurements Laboratory VGC:jdf
R&T: g/29/71
Form 111
532
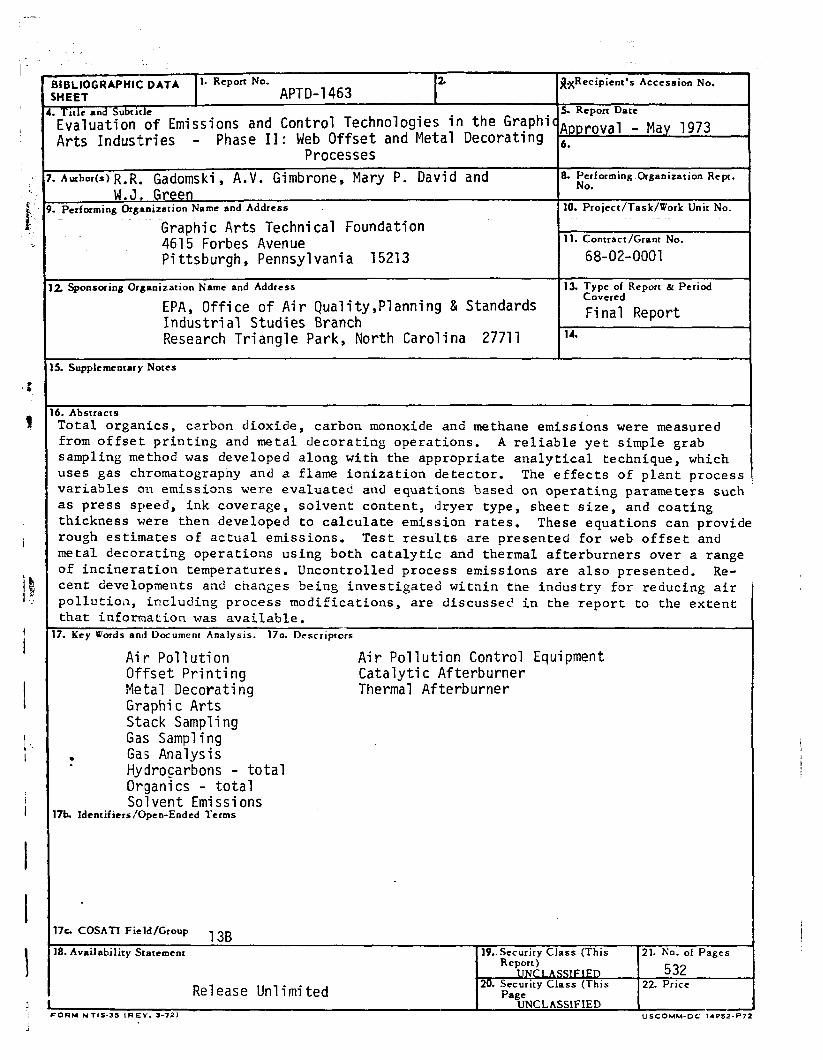
[XRecipient’s Accession No. 3IBLIOCRAPHIC DATA 1. Report No. 2
itlEE APTD-1463 ji
T’ dS b’l
E$;"ati\i'if Emissions and Control Technologies in the Graphic; E Arts Industries - Phase II: Web Offset and Metal Decorating
Processes
i. Report Date
\pproval - May 1973 i.
I Awhods)R.R,, Gadomski, A.V. Gimbrone, Mary P. David and W.J.. Green
f
, performing Or8,anizstion Name and Address
Graphic Arts Technical Foundation 4615 Forbes Avenue
I. l’yforming Organization Rept. .
IO. Project/Task/Work Unit No.
11. Contract/Grant No.
Pittsburgh, Pennsylvania 15213 68-02-0001
2. Sponsoring Orlaniration Name and Address
EPA, Office of Air Quality,Planning 81 Standards Industrial Studies Branch Research Triangle Park, North Carolina 27711
13. Type of Report & Period Covered
Final Report 14.
5. Supplementary Notes
6. Abstracts Total organics, carbon dioxide, carbon monoxide and methane emissions were measured from offset printing and metal decorating operations. A reliable yet simple grab sampling method was developed along with the appropriate analytical technique, which uses gas chromatography and a flame ionization detector. The effects of plant process variables on emissions were evaluated and equations based on operating parameters such as press speed, ink coverage, solvent content, dryer type, sheet size, and coating thickness were then developed to calculate emission rates. These equations can provide rough estimates of actual emissions. Test results are presented for web offset and metal decorating operations using both catalytic and thermal afterburners over a range of incineration temperatures. Uncontrolled process emissions are also presented. Re- cent developments and changes being investigated within the industry for reducing air pOllutioil, including process modifications, are discussed in the report to the extent that information was available.
17. Key Words and Document Analysis. 170. Descriptors
Air Pollution Of,fset Printing Metal Decorating Graphic Arts St(ack Sampling Gals Sampling
Air Pollution Control Equipment Catalytic Afterburner Thermal Afterburner
. Gas Analysis L Hyldrocarbons - total Organics - total Solvent Emissions
17b. Identifiers/Open-Ended Terms
17~ COSATl Field/Group 13~
18. Availability Statement
Release Unlimited
‘ORM NTIS-3s IREV’. 3-72)
19.. Security Class (This Report)
21. No. of Pages
UNCUIFIED 532 20. Security Class (This 22. Price
Page UNCLASSIFIED --
USCOMH-DC 14P52-P7,


