Embed Size (px)
Citation preview


Undergraduate Research JournalVolume 9 Spring 2015Undergraduate Research JournalVolume 9 Spring 2015
Contents
Journal Staff vii Acknowledgments viii
Research Reviewers vii Letter from the Editor ix
ii
Economics
2 Shall We Share a Ride, Wildcats?: CVM Study of the Willingness of Weber State University Students to Accept Ride-Sharing
Jung-hee Lee
14 Inflation and Unemployment in Greece: An Examination of Phillips Curve
Qiheng Wu & Bora Song
Medical Laboratory Science
26 Variance of Toxin Producing Clostridium Botulinum in Utah Honey
Tamara Fox & Laura Tucker
36 Prevalence of ABO Blood Type and Diabetes Mellitus Type 1
Tyler Rushforth, Joshua Lloyd, & Hayley Steed
42 Prevalence of Antibiotic-resistant Staphylococcus Aureus Found Among Weber State Students
Richard Scott, Ahmed Mohammed, & Michael Smith
49 Use of Common Household Desiccants as an Alternative to Poison Ivy Block
Daniel Shallbetter & James Mauchley
57 Hospital Cost Efficiency and Compliancewith Laboratory Algorithms
Jace Stoker, Derek Smith, & Kelsey Johnson

iii
63 Synergistic Effects of Essential Oils and Antimicrobials Against Bacterial Pathogens Ryan Wilcox, Tyler Webb & Dana Larsen
Microbiology
76 Sequencing and Annotation of Novel Plasmids in Lactobacillus Curvatus
Jordan Hendricks
86 Isolation of Lactobacillus Wasatchii from Aged Cheddar Cheese
Lauren Montierth
93 Isolation and Preliminary Antibiotic Production Screening of Soil-Isolated Actinomycete Colonies on Actinomycete and Nutrient Agar Tanoya Poulsen
Physics
104 Results in Search for Exotic Cosmic-Ray Air-Shower Events
Nathan Waugh
Social Work
116 Adjunct Faculty Attitudes of Diversity
Nathan Brown, Jamie Hill, & Madeline Smith
Sociology
126 Uncovering Attitudes Towards Water at Weber State University
Kassandra Sqrow, Timothy Gibbs, Mercedes Anto, Zack Bjerregaard,
Nathan Brown, Somsak Hendricks, James Nielson, & Rachel Sweet

iv
Travel Abstracts
136 Justified Suspicion of Ontology-Speak Dwight Adams
137 Irene Ryan Scholarship Competition Camrey Bagely
138 Perceptions on Intimate Partner Violence in Same-Sex Relationships Heidi Bell
139 Microbial Screening of Potable Water Sources in Guatemala Emma Bentley
140 Adjunct Faculty Attitudes about Diversity Study Nathan Brown
141 Toothbrush Sanitization: A Comparison of Two Methods Chelsea Burr
143 The Seven Furies of Developmental Math Anneli Byrd
144 Edge Effect on Mycorrhizal Infection Occurence
in Gutierrezia Sarothrae [Asteraceae] Shannon Call
145 “What Is Passed Down” Roundtable Presentation Reginald Carlisle, Kyle Poppitz & Garrett Jayro
146 Effects of Glucose on Proteus Mirabilis Scott Chamberlain
147 Lack of Song in Females Does Not Drive Sexual Dimorphism in Syringeal Muscle Composition
Linsey Christensen

v
148 Performance at Conference Austin Packer & Jacob Dame
149 The Renaissance Witch and the Roman Catholic Church: Social Power and Control of the Supernatural Christianna Disque
150 The Effects of Two Behavioral Interventions on Off-Task Behavior Taylee Elescano
151 Adjunct Faculty Inclusion and Job Satisfaction Jamie Hill
152 Co-occurance of Gall-forming Aphids and Fungal Endophytes on Hybrid Cottonwood Tree
Julia Hull
153 Down Syndrome Family Education Night: Community and Class Service Learning
Alexis Jensen-Bowen
154 Human Papillomavirus Risk Awareness Among Dental Hygiene Professionals
Kimberly Karpowitz
156 Representing State of Utah to Compete in
MTNA Southwest Division Competition Ling-Yu Lee
158 Through-space Interactions within Nonclassical Norbornenyl Carbocations, a Computational Analysis Byron Millet
159 Irene Ryan Auditions at the Kennedy Center American College Theatre Festival
Kacee Neff

160 Attitudes Toward Obesity and Their Effect on Discrimination in the Hiring Process
Hendrik Ombach & Lyndsi Drysdale
161 Developing an Intervention for Post-Concussion using Baseline Data
Jolin Petersen
163 She Loves Me: A Confectionary Challenge William Peterson
165 Determining Late Holocene Environmental Conditions for the Bobcat Rockshelter, Idaho
Dusty Pilkington
166 Irene Ryan Scholarship Competition Tanner Rampton
167 Outcomes and Complications of Capsule Endoscopy in a Community Gastroenterology Practice
Jordan Smith & Chad Gonzales
169 Internet Usage, Personality, Narcissism, and Motivations for Facebook Usage
Corbin J. Standley, Crystal Garcia, Kaitlin Staker, & Lyndsi Drysdale
170 Religiosity, Personality, and Attitudes Toward Homosexuality Corbin Standley
171 Irene Ryan Scholarship Competition
Nicole Waite
172 Love Related Behaviors and Marital Satisfaction
in the United States and Ecuador Michelle Washburn
vi

Faculty & Staff Advisors
Kyle Spainhower Editor-in-Chief
Carly Milligan Assistant Editor
Tess Woodward Layout & Graphic Design
John F. Cavitt Presidential Distinguished Professor & Director, Office of Undergraduate Research
Erin Bryner Office Manager, Office of Undergraduate Research
Journal Staff
Faculty ReviewersToby Nishikawa
Craig Oberg
Kathy Payne
David Read
Todd Baird
Matthew Nicholaou
Scott Rogers
Student ReviewerAvery Pince
Ryan Rowe
Becky Jo Gesteland
Doris Stevenson
Matthew Domek
Michelle Culumber
Kenton Cummins
Rhett Zollinger
vii

Acknowledgements
viii
The articles featured in Ergo are peer reviewed by a committee of students and faculty from Weber State University. The staff and faculty advisors for Ergo would like to thank the reviewers for volunteering their time and expertise and contributing to the production of this research journal. The success of this journal would not be possible without the commitment of everyone involved.
We would also like to acknowledge Yaeko Bryner, Stephen & The Mr. & Mrs. Denkers Family Foundation, The George S. & Dolores Dore Eccles Foundation, The Kem & Carolyn Gardner Foundation, Richard R., II & Karen W. Fairbanks, The Ralph Nye Charitable Foundation, PSI CHI, and Gloria Z. Wurst. Their generous financial support of WSU undergraduate research students has enabled the creation of powerful and unique learning opportunities that continue to impact those involved long after the projects are completed.

Letter from the Editor
Dear Reader,
Thank you for choosing to read Ergo Volume Nine. The selections for this year’s publication serve as excellent representatives for the tremendous work that my fellow WSU students can do. Keep this in mind while you read through Ergo, and let their dedication inspire you to make the most of your experience at WSU.
As editor, I have had the opportunity to work with outstanding individuals that deserve recognition and thanks. Erin Bryner and Kathy Payne provided valuable input and assistance in the editing process. Tess Woodward’s creativity is unmatched. Design layout is second nature to her. Carly Milligan is a great networker and stayed on top of correspondences. I am also in debt to faculty members and student reviewers who took time out of their busy schedules to review submissions. Thanks to each of you for contributing to the success of Ergo.
Lastly, I would like to thank Dr. John Cavitt and the Office of Undergraduate Research for providing me with the opportunity to be editor of Ergo. This has been a great experience to grow academically and professionally that I will never forget. I encourage you to get involved with undergraduate research while you attend WSU.
Kindest Regards,
Kyle Spainhower Editor-in-chief
ix


2
Shall We Share a Ride, Wildcats?: CVM Study of the Willingness of Weber State University Students to Accept Ride-Sharing
Jung-hee Lee
Faculty Mentor: Cliff Nowell
Abstract
This article reports on the willingness to accept (WTA) carpooling with a binary logistic regression analysis using the methodology of contingent valuation method (CVM). This study measures how much Weber State University students are willing to accept the introduction of a car-sharing system with a detailed survey. To demonstrate the amount of WTA car-sharing, 5 different levels of compensation ($0, $25, $50, $75, and $250) were offered respondents (n = 181) enrolling for the current semester. The mean WTA was $56.55. And the marginal effect of a main interested predictor, price, was 0.0013, meaning as one dollar increases, there is an increase in the possibility for a respondent to participate in car-sharing by 0.13%.
Keywords: willingness to pay, willingness to accept, car-pooling/car sharing, contingent valuation method (CVM), binary logistic regression.

3
IntroductionSince the late 1970s, the air pollutants from rapid worldwide industrialization have increased. The main factor in climate change is greenhouse gases and the costs to resolve social and natural damages and recover air quality have resulted in a negative social welfare. Especially, in the Utah area, Logan had the worst air pollution nationwide on January 15, 2004 (Malek et al., 2006). Overall, Utah’s continuously serious smog problem can be reasoned to be caused by two main factors: fuel-burning and auto fuel consumption. The Utah Division of Air Quality has been trying to prevent air pollution from reaching unhealthy levels, especially in Salt Lake City, Weber, and Davis Counties (MafflyBrian, 2013). Strict regulations to prohibit wood burning have been implemented so that residents have been provided real-time air quality information with a free smart app in order to encourage them to stops wood burning voluntarily.
While there have been efforts to cut down the amount of fuel burned in order to reduce the level of greenhouse emissions in Utah, there has not been any measure taken to reduce auto fuel consumption, which is mainly due to a high number of cars emitting greenhouse gases on the road. This study tries to evaluate the willingness to accept (WTA) and/or willingness to pay (WTP) for a car-sharing system by Weber State University (WSU) students, who are mainly located in one of the Utah counties in dire straits with a dangerous level of air pollution. Hence, we formulate the following research question: how much are WSU students willing to accept and/or pay for carpooling? This paper will test if as the price that carpooling participants will get paid by WSU goes up, the willingness of WSU students to participate in a carpooling system will go up
Economics

4
as well. To test this hypothesis, we arranged a sampling survey at WSU, and used the Contingent Valuation Method (CVM) to find out the value of carpooling.
Background
One effective effort to reduce greenhouse gases is, carpooling, also known as car-sharing or ride-sharing, which has been used by both the private and public sectors. A carpooler, as defined in this paper, is anyone who shares car journeys with more than one person in one private vehicle. According to Kendall’s studies (1975), the maximum potential benefits of carpooling include up to 10% savings in auto fuel consumption. In addition, we could expect a decrease in the usage of privately owned cars from the increase in average auto occupancy for work-trip per auto from 1.2 passengers to 2.5, which is average carpool occupancy.
Literature ReviewWhether there is a disparity between WTP and WTA has been controversial in literature. Tversky and Kahneman (1991) emphasized the effects of loss aversion, which means “The pain of a given loss is greater than the pleasure of an equivalent gain” (page 1047). The difference in psychological perception causes the disparity of WTP and WTA, but Mansfield (1999) set up a new bit function with modified procedures, which controlled some few factors interrupting a true measurement in WTP and WTA, to demonstrate weak support for loss aversion. Moreover, Hanemann (1994) mentioned in his paper, the values of WTP and WTA could be closer to one another when it comes to consideration of public goods, not priced private goods as in ordinary markets. Hanemann found that comparison between
Lee

5
the two welfares of WTP and WTA of public goods is more likely to be subject to the substitution effect rather than an income effect because, naturally, public or environmental goods are an imperfect substitute. In other words, an unpleasant change of environmental quality results in an infinitely large difference of welfares compared to the other situation in a private good market where individuals give up some pleasure and the quantity of a good for other pleasures or goods.
Theoretical Assumption on WTP/WTA
Figure 1 shows the different indifference curves for an individual. In this figure, U1 represents the highest level of utility. This figure also shows the budget constraint of the individual. The budget constraint is flat because Y, which represents environmental quality, is free for all quantities, P(y)=0. The budget constraint is given by Y ≥ P(x) * xo + P (y) * yo, where Y is income, P(x) and P(y) are prices, and xo and yo are the number of units of the goods purchased. The slope of budget line is given by - dy = P(y).
Because the numerator P(y) would be zero, the value of the fraction equals zero. Thus, the budget line is horizontal and located at Y=xo. On this budget line, individual’s utility depends only on environmental quality. The more environmental quality improves, the further to the right on the budget line the individual will be (Folmer & Gabel, 2000).
Let’s assume one situation that I am going to ask subjects to answer through the survey for the present paper. This assumption starts with the individual at point A. If the environmental quality is improved, he moves to point B. However, at point B he will move to point C in oder to remain
— —dx P(x)
Economics

6
his initial utility constant since both points A and C are on the same indifferent curve, Uo Hence we can measure how much the improvement of environmental quality is valued by measuring the distance between point B and C. In other words, we can express the WTP of a person with a measure of income. On the other hand, let’s assume point A moves to point D. Similarly, in order to stay at the same level of initial utility, a person will move his position from D to E. However, the willingness to pay of this shift would be negative. In fact, this shift from D to E would be achieved by paying the person who willingly accepts the deterioration of environment. In this case, an individual needs to be compensated if the quality of the environment decreases from A to D. Calculating the vertical line between D and E would show the amount of compensation required to maintain the same level of utility.
MethodsFor a measurement of the WTA, Herik’s (2012), Galarraga’s (2010), and Moon (2004) WTA questions are used in the survey. Kennedy (2001) and Partnership Research (2007) additionally regarded an individual’s level of environmental recognition as a significant independent variable when valuing WTA. Also, general commuting habits in Toth’s (2012) and Ciari’s (2012) carpooling survey questionnaires and demographic descriptions in Chilton’s (2011) were used in the survey.
Empirical Model and Analysis
In order to test my hypothesis, a binary logistic regression model was used. The purpose of the study is to analyze a correlation between people’s willingness to participate in a carpooling system and different prices. However, as explained above,
Lee

7
additional 25 other variables were also included as followed: Yi = ß0 + ß1XPrice + ß2XRecycling + ß3XPublicTransportation + ß4XAirQuality +...+ ßnXn
where Yi = 1 when the i-th person would say “yes” to participate in carpooling and Yi = 0 if they would not.
The sample of WSU students was taken in a period of November 5-20, 2013, in public places or general classes. A total of 181 WSU students participated in survey, including undergraduates and graduates.
ResultsSince a main predictor of interest in this study is price, surveys were administered with 5 different prices ($0, $10, $25, $50, $75, and $250) while all other aspects of the survey were held constant in all surveys.
With the results from the first binary logistic regression with 25 variables, we could test the hypothesis that paying people to carpool will increase the number of carpoolers. With the positive coefficient on price of 0.0052, the relationship between the direction of the variable price and dependent variable Yi
is positively correlated. In other words, as price goes up the willingness to accept carpooling also goes up. With the p-value of the predictor price, 0.07, we can reject the null hypothesis at the highest confidence level of 92.3% in a two-tailed test while at the highest confidence level of 96.15% in a one-tailed test.
However, some variables on the regression with a z-score of less than 1.0 in absolute value do not have a strong correlation with dependent variable, Yi, which may cause statistical interpretation issues. After eliminating 18 variables with relatively small z-value, we proceed to the second regression and the result is shown in Table 2 under Equation 2.
Economics

8
From the second regression, we can find that the p-value of a main predictor, price, increases from 0.07 to 0.09 while the p-values of the rest of the independent variables decrease. Using the second equation with only 7 variables, we can deduce the number of estimated students who are willing to participate in a car- sharing system. Using WSU’s total headcount of students (Kowalewski, 2012), the estimate of the number of WSU students who are willing to participate in a car-sharing system at different price levels is shown in Figure 2.
DiscussionThis study measured the WTA for carpooling at WSU by using a binary logistic model. The marginal effect of a main predictor, price, indicates that if there is an increase in price by $1, people are more willingly to accept carpooling by 0.13%. After the elimination of 18 less-correlated variables, we can assume that at the price of zero to compensate students, over 70% of WSU students (18,460) would be already willing to participate in a car-sharing program and at the average price asked for survey candidates for this paper, which is $56.55, about 73% of the students (19,718) are willing to accept the car-sharing system.
As one way to improve this research in the future, potential researchers may increase the sample size and evaluate a pilot program to pay students to carpool. The current sample represents only 0.67% of the WSU population. Because of the sensitiveness of z-value depending on a sample size, an extended work with a large number of samples may improve the results of the current study.
Moreover, using hypothetical questions on WTA may generate unreliable responses but results still suggest organizing a
Lee

9
carpooling at WSU may be both inexpensive and effective. Regardless of the exact level of precision of my estimates, it is important to note that no matter what method was used, a culture of carpooling has not been popular in the Western area of the United States historically. Cities of Western U.S. such as Los Angeles have mostly grown after World War II. Compared with the rest part of the U.S., East Coast areas such as Boston or New York City already experienced a big portion of growth in transportation before the war. The less densely populated Western area’s transportation system has not grown as much as those in the Eastern Coast have. That is, future investigation may improve a carpooling study by carrying on more research in the area with mass transit, especially in the East Coast area.
ReferencesAkimoto, H. (2003). Global Air Quality and Pollution. Science, 1716-1719.
Chilton, S., Jones-Lee, M., McDonald, R., & Metcalf, H. (2011). Eliciting reliable willingness-to- accept responses. Newcastle Discussion Papers in Economics, 1-17.
Ciari, F. (2012). Why do people carpool: Results from a Swiss survey. Swiss Transport Research Conference, 1-24.
Folmer, H., & Gabel, H. (2000). Principles of environmental and resources economics: a guide for students and decision-makers. Northampton: Edward Elgar Publishing, Inc.
Galarraga, O., Sosa-Rubi, S. G., Infante, C., Gertler, P. J., & Bertozzi, S. M. (2010). Willingness to accept conditional economic incentives to reduce HIV risks among men who have sex with men in Mexico City. Department of Community Health , 1-49.
Hanemann, M. (1994). Valuing the environment through contingent valuation. Journal of Economic Perspectives, 19-43.
Economics

10
Kendall, D. (1975). Carpooling: status and potential. U.S. Department of Transportation Report, DOT- TSC-OST-75-23.
Kennedy, N. S. (2001). Reservation prices and willingness to accept price offers for nonindustrial forest landowners in Western Virginia. Thesis submitted to the faculty of Virginia Tech in partial fulfillment of the requirements for the degree of Master of Science in Forestry, 1-72.
Kowalewski, J. (2012, October 12). WSU’s fall enrollment sets another milestone. Retrieved from Weber State University: http://www.weber.edu/
Maffly, B. (2013, November 4). Revamped Utah air quality index debuts this winter. The Salt Lake Tribune.
Malek, E., Davis, T., Martin, R., & Silva, P. (2006, February). Meteorological and environmental aspects of one of the worst national air pollution episodes (January, 2004) in Logan, Cache Valley, Utah, USA. Atmospheric Research, 108-122.
Mansfield, C. (1999). Despairing over disparities: explaining the difference between willingness to pay and willingness to accept. Environmental and Resource Economics, 219-234.
Moon, W., Rimal, A., & Balasubramanian, S. K. (2004). Willingness-to-accept and willingness-to-pay for GM and non-GM food: UK consumers. Selected Paper Presented at Annual Meeting of American Agricultural Economics Association, Denver, Colorado, 1-26.
Partnership Research. (2007). MTC-RTP 2035 - Visioning Resident Survey.
Toth, C. (2012). Carpooling and carsharing in Hungary: barriers, possibilities, potentials. A thesis submitted to the Department of Environmental Sciences and Policy of Central European University in part fulfillment of the Degree of Mater of Science, 1-106.
Tversky, A., & Kahneman, D. (1991). Loss aversion in riskless choice: a reference-dependent model’. Quarterly Journal of Economics, 1039-1061.
Lee

11
Figure 1. Graphic demonstration of WTP/WTA.
Table 1. Distribution of the respondent and response.
SHALL WE SHARE A RIDE, WILDCATS? 1
Figure 1. Graphic demonstration of WTP/WTA
Price ($) Yes (%) No (%) Total
0 13 (0.65) 7 (0.35) 20 10 21 (0.58) 15(0.42) 36 25 17(0.49) 18 (0.51) 35 50 22 (0.61) 14 (0.39) 36 75 22 (0.61) 14 (0.39) 36 250 13 (0.72) 5 (0.28) 18
108 (0.60) 73 (0.40) 181
(Students)
26
25
24
23
22
21
20
19
18 0
Estimated Carpoolers
50
100
150
200
250($)
Thou
sand
s SHALL WE SHARE A RIDE, WILDCATS? 1
Figure 1. Graphic demonstration of WTP/WTA
Price ($) Yes (%) No (%) Total
0 13 (0.65) 7 (0.35) 20 10 21 (0.58) 15(0.42) 36 25 17(0.49) 18 (0.51) 35 50 22 (0.61) 14 (0.39) 36 75 22 (0.61) 14 (0.39) 36 250 13 (0.72) 5 (0.28) 18
108 (0.60) 73 (0.40) 181
(Students)
26
25
24
23
22
21
20
19
18 0
Estimated Carpoolers
50
100
150
200
250($)
Thou
sand
s Economics

12
Table 2. Logistic Regression Table.
SHALL WE SHARE A RIDE, WILDCATS? 1
Equation 11 Equation 22
Variable Estimated Coefficient
P-value Marginal Effect (%)
Estimated Coefficient
P-value
Intercept -1.82 0.25 -1.43 0.14 Price ($) 0.0052 0.07 0.13 0.0041 0.09 Recycling 0.3325 0.17 8.094 0.4008 0.04 Public Transportation 0.0336 0.89 0.818 Air Quality -0.018 0.95 -0.43 Traffic Congestion 0.5975 0.04 14.54 0.6792 0.00 Parking Lot -0.187 0.43 -4.57 -0.2942 0.18 Driving Alone -1.053 0.07 -25.6 -0.9926 0.00 Carpooling 1.4390 0.02 35.03 Bus -0.964 0.10 -23.4 Frontrunner 1.7505 0.13 42.61 Bike 0.1078 0.93 2.625 Walk 0.6496 0.25 15.81 Motorcycle -21.34 0.99 -519.5 Other -1.696 0.32 -41.4 Miles to School 0.0282 0.86 0.688 Miles to Work 0.0271 0.84 0.660 Home-type 0.0491 0.87 1.196 Kids -0.190 0.30 -4.64 Year of School -0.240 0.20 -5.85 -0.1519 0.30 Work-status 0.0231 0.94 0.564 Age 0.0245 0.57 0.598 Gender -0.558 0.11 -13.5 0.5972 0.07 Marriage 0.7518 0.13 18.30 Ethnicity -0.066 0.58 -1.60 Income ($) 0.1089 0.37 2.652
!!!
* Note: According to the equation for marginal effect, Pi * (1 - Pi) * ßi = , Pi means the probability to say “yes” to a carpooling suggestion.
dYi—dXi
1 Yi = ß0 + ß1XPrice + ß2XRecycling + ß3XPublicTransportation + ß4AirQuality +...+ß25Xincome
2 Yi = ß0 + ß1XPrice + ß2XRecycling + ß3XTrafficCongestion + ß4XParkingLot +ß5XDrivingAlone+ ß6XYearOfSchool + ß6XYearOfSchool + ß7XGender
Lee

13
Figure 2. Estimated number of carpoolers at various prices.
SHALL WE SHARE A RIDE, WILDCATS? 1
.
18000
19000
20000
21000
22000
23000
24000
25000
26000
0 50 100 150 200 250
Estimated Carpoolers
Estimated Carpoolers
($)
(Students)
Economics

14
Inflation and Unemployment in Greece: An Examination of Phillips Curve
Qiheng Wu & Bora Song
Faculty Mentor: Nazneen Ahmad
Abstract
This paper studies the relationship between inflation rate and unemployment rates in Greece. The relationship between the variables appears to be negative both before and after the country adopted euro. Our results, therefore, suggests that Phillips curve relationship holds for Greece both before and after the country adopted euro.
Keyword: Greece, Philips Curve, Inflation, Unemployment JEL Classification: E31, E24
IntroductionUnemployment and inflation are two major national issues disliked by the public. The link between unemployment and inflation is termed as the Phillips curve, named after A.W. Phillips.1 The Phillips curve suggests that there is a tradeoff relationship between unemployment and inflation implying low unemployment is usually accompanied by high inflation. This paper aims to investigate whether the Phillips curve relationship holds for Greece.

15
Greece is one of the poorer members of the European Union (henceforth EU2). Greece joined the EU in 1981, however adopted the euro on January 1, 2001. In order to fulfill the requirements of adopting the euro the Greek government had to undertake actions to adopt a tough austerity program, making deep cuts in public spending to within the limits needed for membership of the single currency for EU, the euro.3 As a consequence of the policies undertaken by the Greek government, Greek inflation decreased, but employment rate increased every month since 2009 (Woods). The Greek policies also made the economy unstable in some ways. According to the National Statistical Service of Greece, the average annual GDP growth rate in Greece before 2001 was between 0 to 2%. After 2001, the annual GDP growth started to fluctuate within a wider range, sometimes even experiencing a negative rate. According to a recent report, the unemployment rate of Greece was as high as 26.4%, and the inflation rate was negative. These statistics provide the motivation of this study.
In this paper, we look into the trends in inflation and unemployment in Greece during 1989-2012. We split our sample period into two sub-periods. The first sub-period spans from 1989 to 2000, i.e. years before Greece adopted the euro,
1 A.W. Phillips Alban William Housego Phillips (18 Nov. 1914 –4 Mar. 1975), a New Zealand economist who is famous for his discover of the reverse between wage and unemployment, which is lately developed as a reverse relation between unemployment and inflation.2 EU: abbreviation of European Union3 “Greece joins eurozone.” BBC News.<http://news.bbc.co.uk/2/hi/business/1095783.stm>
4 A.W. Phillips, “The Relationship between Unemployment and the Rate of Change of Money Wages in the United Kingdom, 1861-1957,” Economica, November 1958
Economics

16
and the second sub-period spans from 2001 to 2012, i.e., years after Greece joined the EU. Despite changes in the economic situation before and after Greece joined the euro, our study finds that the negative unemployment-inflation relationship in the country remained stable. Therefore we suggest that inflation and unemployment in Greece fit Phillips curve story both before and after the country entered the EU.
The structure of the paper is as follows. Section two reviews relevant literature, section three discusses data and sample periods, section four presents the methodology, section five discusses results, and section six concludes.
Literature Review
Many researchers have observed the inflation-unemployment link in many countries at different times. The proponent of the Phillips curve, A.W. Phillips (1958), found an inverse relationship between wages and unemployment in Great Britain during 1861 to 1957.4 Besso's (2010) study, conducted on Cameroon, shows the Phillips curve relationship holds; however, the study also claims the influence of inflation on unemployment is weak.5 Fitzgerald (2013) and Nicolini (2013), on the other hand, suggest that the Phillips curve does not always hold for different time periods in the United States. During some specific time periods, the relationship between inflation and unemployment could be positive, which conflicts the Phillips curve even though the result of the overall period
Wu & Song
5 C. R. Besso (2010), “Phillips Curve, case study in Cameroon: evaluation of fundamental assumptions," MPRA Paper No. 35614, posted December 2011
6 T. J. Fitzgerald and J. P. Nicolini, “Is There A Stable Phillips Curve After All?” Economic Policy Papers, November 2013

17
followed the Phillips curve actually.6 Laxon’s (1999) research shows there is a convexity in the Phillips curve of the U.S.7
Data and Sample Period
The sample period of our study spans from 1989 to 2012. For inflation rates, the monthly CPI inflation rates (yearly basis) are obtained from inflation.eu8. For unemployment rates, we use the yearly rates for every month as we were unable to find monthly data for Greece’s unemployment rates. The unemployment rates are collected from the Federal Reserve Bank of St. Louis.
With a quick glance on figures 1 and 2 it becomes obvious that dynamic linkage between inflation and unemployment trends in Greece have changed since the country adopted the euro. From pre to post euro period inflation in Greece decreased while the unemployment rate has increased. Table 1 indicates that for the entire sample period the average inflation rate was 6.9% with a standard deviation of 5.69. The average inflation rate in our second sub-sample period was much lower. On the other hand, the average unemployment rate for the entire sample period is 10.48%, which is lower than the average unemployment rate in the second sub-sample period. One interesting result reported in table 1 is that for our entire sample period as well the sub-sample periods, the correlation coefficient between the inflation rate and the unemployment rate are negative.
7 Laxton, Douglas, Rose D., Demosthenes T. “The U.S. Phillips Curve: The Case for Asymmetry.” Journal of Economic Dynamics and Control: Volume 23, Issues 9–10, September 1999, Pages 1459–1485.8 www.inflation.eu
Economics

18
MethodsFrom the correlation coefficient reported in table 1, and also from figure 3, it appears that the inflation rate and the unemployment rate in Greece are negatively related as predicted by the Phillips curve. However, to confirm our result we conduct a regression analysis where we use the unemployment rate as a dependent variable and the inflation rate as the independent variables. Below we specify the model:
Inflation rate= β0+ β1 Unemployment rate+ μ (1)
We test the following hypothesis:
H0: β1=0
H1: β1≠0
If a change in unemployment rate does not have any impact on inflation rate β1 should be zero. A negative sign on β1 would indicate that an increase in unemployment rate reduces inflation rate.
ResultsRegression results for equation 1 for our sample period as well as sub-sample periods are reported in table 2. As panel A in table 2 suggests, for the overall sample period, our regression equation can be specified as below:
Inflation rate=14.3-0.702 Unemployment rate (1989-2012)
The above equation suggests that a one point increase in the rate of unemployment decreases the inflation rate by 0.702. The t statistic for unemployment rate is -8.67, and p-value is 0.000. Our result, therefore, is consistent with the simple Phillips curve prediction
Wu & Song

19
that unemployment and inflation are negatively related.
The regression results for the first sub-sample period are presented in panel B. Given our result the regression equation can be specified as below:
Inflation rate=41.8-3.36 Unemployment rate (1989-2000)
The above equation implies that from 1989 to 2000, a one point increase in the unemployment rate causes a 3.36 point decrease in inflation rate. This equation’s t statistic is -22.79, and p-value is 0.000.
Lastly, using the results reported in panel C, for our second sub-sample period, the regression equation can be specified as below:
Inflation rate=4.19-0.0847 Unemployment rate (2001-2012)
After Greece adopted the euro in 2001, we find the unemployment-inflation tradeoff relationship stayed consistent. The equation indicates that if the unemployment rate increases by one point, the inflation rate decrease 0.00847 point. The p-value (0.000) confirms that our result is statistically significant.
Conclusion and policy implication
This paper looks into the relationship between the inflation rate and the unemployment rates in Greece before and after the country adopted the common currency for the EU, the euro. We find that for the entire sample period and also for the sub-periods of our study the unemployment rate and the inflation rate in Greece fits the simple Philips curve story that there is a tradeoff relationship between the inflation and the unemployment rate. We, therefore, conclude that the inflation-
Economics
20
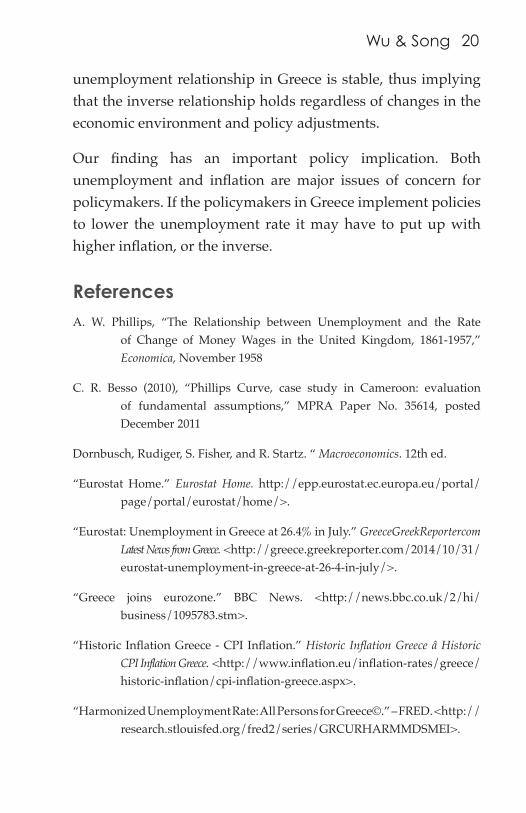
unemployment relationship in Greece is stable, thus implying that the inverse relationship holds regardless of changes in the economic environment and policy adjustments.
Our finding has an important policy implication. Both unemployment and inflation are major issues of concern for policymakers. If the policymakers in Greece implement policies to lower the unemployment rate it may have to put up with higher inflation, or the inverse.
ReferencesA. W. Phillips, “The Relationship between Unemployment and the Rate
of Change of Money Wages in the United Kingdom, 1861-1957,” Economica, November 1958
C. R. Besso (2010), “Phillips Curve, case study in Cameroon: evaluation of fundamental assumptions,” MPRA Paper No. 35614, posted December 2011
Dornbusch, Rudiger, S. Fisher, and R. Startz. “ Macroeconomics. 12th ed.
“Eurostat Home.” Eurostat Home. http://epp.eurostat.ec.europa.eu/portal/page/portal/eurostat/home/>.
“Eurostat: Unemployment in Greece at 26.4% in July.” GreeceGreekReportercom Latest News from Greece. <http://greece.greekreporter.com/2014/10/31/eurostat-unemployment-in-greece-at-26-4-in-july/>.
“Greece joins eurozone.” BBC News. <http://news.bbc.co.uk/2/hi/business/1095783.stm>.
“Historic Inflation Greece - CPI Inflation.” Historic Inflation Greece â Historic CPI Inflation Greece. <http://www.inflation.eu/inflation-rates/greece/historic-inflation/cpi-inflation-greece.aspx>.
“Harmonized Unemployment Rate: All Persons for Greece©.” – FRED. <http://research.stlouisfed.org/fred2/series/GRCURHARMMDSMEI>.
Wu & Song

21
Laxton, Douglas, Rose D., Demosthenes T. “The U.S. Phillips Curve: The Case for Asymmetry.” Journal of Economic Dynamics and Control: Volume 23, Issues 9–10, September 1999, Pages 1459–1485.
T. J. Fitzgerald and J. P. Nicolini, “Is There A Stable Phillips Curve After All?” Economic Policy Papers, November 2013
Trading Economics. Web: http://www.tradingeconomics.com/greece
Woods, Shelby. (n.d.): n. pag. GREEK SOVEREIGN DEBT CRISIS. Web. <http://jsis.washington.edu/hellenic/file/ShelbyWoods/Thesiscopy.pdf>.
Kotios Angelos, George Pavlidis, and George Galanos. “Intereconomics: Greece and the Euro: The Chronicle of an Expected Collapse.” Intereconomics. Web.
Figure 1.
Economics

22
Figure 2.
Figure 3. Relationship of Inflation and Unemployment
Wu & Song

23
Table 1. Summary Statistics.
Economics

24Wu & Song
Table 2. Regression results.


26
Variance of Toxin Producing Clostridium Botulinum in Utah Honey
Tamara Fox & Laura Tucker
Faculty Mentor: Matthew J. Nicholaou
Abstract
Clostridium botulinum has been implicated in cases of infant botulism across the United States. It is recommended that infants under the age of one year not be fed honey because of the presence of C. botulinum spores. This study had two aims: to determine whether honey produced in small and large apiaries in Utah contain varying amounts of toxin producing C. botulinum and to determine whether these spores can be detected through a multiplex polymerase chain reaction (PCR) without first culturing the organism. Clostridium perfringens was used as a control organism in the proof of concept experiments. C. perfringens were isolated from the control honey sample, lysed through superheating, DNA was extracted, multiplex PCR and gel electrophoresis were performed proving that detection without culturing is possible. A multiplex PCR detected toxin gene controls 62A, Clovis (A, B), l7B, Beluga E, and PCF using primers specific for Clostridia species, and toxins A, B, E, and F. Honey samples were collected from hives maintained in Utah and were tested for the presence of toxin producing strains of C. botulinum.

27
IntroductionThe current method of detection for C. botulinum in honey involves culturing the organism and then testing for the toxins it produces either through PCR or mouse lethality assay. Because of the high CDC Category A bioterrorism agent, a lab must have a high biohazard level and federal permission to culture this organism. In honey C. botulinum remains in spore form producing no toxins and would be safe to test in the clinical lab if a method could be used that did not require culturing of the organism. It has been estimated that up to 25% of honey samples contain C. botulinum spores. (Al-Waili,Salam, Al-Ghamdi, & Ansari, 2012) C. botulinum poses minimal risk to adults and children over one year of age, yet in children under the age of one C. botulinum will produce a potent neurotoxin resulting in infant botulism. Botulinum toxin can have various deleterious effects on the host including; mild hypotonia, paralysis, and sudden death. (Koepke, Sobel, & Arnon, 2008) The toxins most likely to be the cause of infant botulism include: A, B, E, and F. (Lindstrom, 2006) While a few nationwide surveys have been conducted on this issue none have been focused in the state of Utah and none have tested between large and small hive operations. We hypothesized that larger apiaries would have a higher levels of contamination than backyard hives because of the greater potential for interaction between bees whose hives are within close proximity to one another as well as the increase in bee population. This study compared C. botulinum spores present in honey from large and small apiaries in Utah using a multiple PCR for the detection of specific botulism toxin genes.
Medical Laboratory Science

28
Methods
Honey Samples
At least eight ounces of honey was donated by 31 beekeepers from around the state of Utah in the 2013 harvest season. All participants were also required to answer a short survey that discussed the type of hive, number of hives, species of bee and location of the hive from which the sample was harvested.
Multiplex PCR
Primers to detect Clostridium toxins A, B, E and F were designed from a previous study. (De Medici et al., 2009) (Table 1.) Genus-specific primers were designed for Clostridium I 6S rRNA. (Rekha, R. et al., 2006) Control genomic DNA samples for C. botulinum toxin producing strains were provided by Kristin M. Marshall , Ph.D. of the US Food and Drug Administration. A temperature and magnesium chloride gradient was performed to determine the optimal temperature and magnesium chloride concentration using a multiplex PCR. Which is shown in lane 3 of Figure 1.
Spore Isolation in Saline Suspension
SBA plates were inoculated with lyophilized C. perfringens in CAMPY jars at 37° C for 24 hours then refrigerated at 2 - 8°C for 24 hours. Sporulation was then verified using malachite green spore stain. (Figure 2.) In order to verify spores could be lysed, two tubes were filled with saline and inoculated with organism until reaching a 0.5 & 1.0 McFarland turbidity standard. To obtain pure spore samples a Qiagen DNA extraction kit was used. The washes were saved instead of discarded as per standard protocol. The washes were centrifuged for five minutes at 8,000 rpms and decanted before being placed in an
Fox & Tucker

29
autoclave for 30 min at 126° C to lyse the spores and release the DNA. This DNA was then reconstituted with 0.9% sterile saline and run through a second DNA extraction. PCR was then performed on the pre-autoclaved washes and the DNA extracted from the autoclaved washes. Results were visualized through gel electrophoresis. (Figure 3.A)
Spore Isolation in Honey Suspension
To determine if DNA can be detected from a honey sample inoculated with C. perfringens spores. Raw honey was dissolved at a 1:1 ratio with distilled water. Then 100 uL of a McFarland 3 spore solution was added to 125 uL of dissolved honey. This mixture was then centrifuged for 30 minutes at 12,000 rpms. The supernatant was discarded and the pellet re-suspended with 200 uL of saline. DNA extraction was performed as previously described on the spore saline mixture discussed above. 16s rRNA PCR was performed on extraction and washes. (Figure 3.B)
Large Scale Honey Sample Processing
To determine if spore isolation could be performed from a large scale (~200g) sample, 224 g of honey was dissolved in 240 mL of DI water and mixed with 1.0 mL of a McFarland 3 C. perfringens spore mixture. This was aliquoted into two 200 mL tubes and centrifuged at 10,000 rpms for 30 min. in an industrial Sorvall centrifuge. The supernatant was poured off and the pellets were reconstituted with 2 mL of sterile saline. This suspension was extracted for DNA using the standard Qiagen blood/tissue protocol and tested using multiplex PCR described above.
Medical Laboratory Science

30
Utah Honey Sample Testing
224 g of honey was dissolved in 240 mL of DI water. This was aliquoted into two 200 mL tubes and centrifuged at 10,000 rpms for 30 min in an industrial Sorvall centrifuge. The supernatant was poured off and the tubes were autoclaved. The pellets were reconstituted with 2 mL of sterile saline. The suspension was then combined into 15 mL tubes and vortexed. 200 uL of each honey sample were processed through the DNA Qiagen kit. Multiplex PCR was performed on C. perfringens, toxins A, B, E, and F, multiplex positive control, E. coli as the negative and the DNA extractions from the honey samples. This was all followed by a water blank. (Figure 4). The amplified DNA was visualized through gel electrophoresis using SYBR green fluorescent dye.
ResultsDue to its lethal nature, culturing Clostridium botulinum was not advisable so C. perfringens was sporulated for use during the proof of concept. To optimize the multiplex PCR assay for the detection of C. botulinum toxins, a temperature and annealing gradient was performed. (Figure 1.) The optimal magnesium concentration and annealing temperature was 61°C and 2.0 mM respectively for the five primer pairs used in the multiplex assay.
To prove spores could be lysed using a standard autoclave, C. perfringes spores were isolated from a homogenous mixture of bacteria and spores using a modified Qiagen DNA extraction procedure shown in Figure 2. The washes were negative for DNA confirming that the column retained all of the DNA from the lysed bacterial cells. The autoclaved sample was positive for Clostridium showing that the spores passed through the columns into the wash solution and that autoclaving it released
Fox & Tucker

31
the DNA from the spore. This process was repeated after adding the C. perfringens spores to dissolved honey and verified our results. (Figure 2.B) This same method was used with a larger volume of honey and our control organism. The Clostridium gene was not isolated.
31 honey samples were centrifuged, autoclaved , extracted and then amplified through PCR. The controls failed and there was DNA detected in one sample lane.
DiscussionThis study is one of the first to research the prevalence of C. botulinum in Utah honey and to isolate and detect the spores directly from the honey without culturing. A multiplex PCR was optimized for the detection of C. botulinum toxins A, B, E, and F. Bacterial spores were successfully isolated and lysed which could have application in the clinical laboratory setting. The lack of amplification from the large volume experiments may be due to a DNA concentration level below the limit of detection for the multiplex assay. The failure of controls while testing the honey samples may indicate that the gradients need to be re-optimized and then repeat the testing.
The limitations of this study include inability to culture the target organism and low DNA concentrations. Future work will be done to optimize the multiplex PCR. Further studies could quantify DNA levels in honey and lower the detection limit for PCR assays.
Medical Laboratory Science

32
ReferencesAl-Waili, N., Salom, K., Al-Ghamdi, A., & Ansari, M. J. (2012). Antibiotic,
pesticide, and microbial contaminants of honey: human health hazards. The Scientific World Journal. doi: 10.1 100/2012/930849
Dahlenborg, M., Borch, E., & Radstro, P. (2001). Development of a combined selection and enrichment PCR procedure for Clostridium botulinum types B , E , and F and its use to determine prevalence in fecal samples from slaughtered pigs. Applied and Environmental Microbiology, 67(10) 4781-4788. doi :l 0.1128/AEM.67. l 0.4781-4788.2001
Amon, Stephen S. (1980). Honey, infant botulism, and the sudden infant death syndrome.Western Journal of Medicine, 132(1), 58-59.
Koepke, R., Sobel, J., & Amon, S. S. (2008). Global occurrence of infant botulism, 1976-2006. Pediatrics, 122(1), e73-e82. doi: l O. l 542/peds.2007-1 827
Lindstro, M. (2006). Laboratory Diagnostics of Botulism, 19(2), 298-314. doi: 10.1 128/CMR. l 9.2.298
Lindstrom, M., Keto, R., Markkula, A., Nevas, M., Hielm, S., & Korkeala, H. (200l). Multiplex PCR Assay for Detection and Identification of Clostridium botulinum Types A, B, E, and F in Food and Fecal Material. Applied and Environmental Microbiology, 67(12), 5694-5699. doi:l O.l 128/AEM .67.12.56
University of Georgia. Endospores. Retrieved from http://pscantie.myweb .uga .edu/sta in.html
Fox & Tucker

33
Figure 1. Multiplex PCR Optimization for Toxin Detection. A MgC12+
(1.0 - 3.0 mM) and annealing temperature gradient (53.0 - 63.0° C) were performed simultaneously to find optimal PCR conditions. (Box) Optimal amplification determined to be 2.0 mM MgCl2+ and 61.0° C.
Table 1. Primers used for PCR amplification of type A, B, E, F, and Clostridium.
v anance 01 l oxm nooucmg L.t oscnaium 001u11num m u tan ttoney
Medical Laboratory Science

34
Figure 2. Malachite Green - Spore Stain. C. perfringens spores (arrows) at conditions outlined in methods.
Figure 3. Confirmation of Lysed Spores. (A) l 6s rRNA Clostridium specific PCR products from extracted spore lysate suspended in saline: 1. negative primer control (E. coli), 2. positive primer control (C. perfringens), 3. wash-1, 4. wash-2, 5. autoclaved wash DNA extract, 6. negative PCR control (H20). (B) l 6s rRNA Clostridium specific PCR products from extracted spore lysate suspended in honey : 1. negative primer control (E. coli), 2. positive primer control (C. perfringens), 3. pellet DNA extraction, 4. supernatant DNA extraction, 5. pellet DNA extraction -wash, 6. supernatant DNA extraction -wash, 7. autoclaved pellet DNA extraction - wash, 8. autoclaved supernatant DNA extraction -wash, 9. negative PCR control (H20).
Fox & Tucker

35
Figure 4. Multiplex PCR for Detection of Clostridium Species and Toxin Genes in Utah Honey Samples. 1. Positive primer control (C. perfringens), 2. Toxin A, 3. Toxin B, 4. Toxin E, 5. Toxin F, 6. multiplex control containing 62A, Clovis (A, B), l 7B, Beluga E, PCF, 7. E. coli, 8-19. honey samples.
v i:ll l r1uuu1,; 111is
! I
Medical Laboratory Science

36
Prevalence Of ABO Blood Type and Diabetes Mellitus Type 1
Tyler Rushforth, Joshua Lloyd, & Hayley Steed
Faculty Mentor: Janet Oja
Abstract
Studies have shown that an individual’s ABO blood type can influence one’s likelihood of certain diseases. Our research sought to determine if there is a correlation between an individual’s ABO blood type and risk of type 1 diabetes mellitus. Finding a correlation would be beneficial by providing insight into which populations are at greater risk for becoming diagnosed with diabetes. This could help lead to earlier detection of type 1 diabetes mellitus of future patients. To accomplish this research, 81 blood samples were obtained from individuals that are known type 1 diabetics ranging in age from 5-25 years. Gel technology was the primary method used to determine the forward ABO blood type. Using the chi-squared test and the fisher test for statistical analysis, the ABO blood types obtained from the diabetic group were compared to a control group of 69 non-diabetic Weber State University students. No significant correlations were observed between ABO blood type and type 1 diabetes mellitus.
IntroductionType 1 diabetes mellitus, otherwise known as juvenile diabetes, results from an autoimmune mediated destruction of insulin-producing cells of the pancreas. This occurs when the body’s

37
immune system produces antibodies against its own cells because they are seen as a foreign material. These antibodies then attack the beta cells of the pancreas which produce insulin. If left untreated, juvenile diabetes is eventually fatal. Although not curable, juvenile diabetes can be controlled through proper monitoring of blood sugar, use of insulin, diet, and exercise.
Currently, much research is being done to identify possible causes of this autoimmune response, in hopes of finding a way to prevent or even cure this disease.
Blood types are identified by which antigens are or are not present on red blood cells. It is this principle that is fundamental to determining blood types of individuals. This research sought to determine if there was statistically significant correlation between blood type and diabetes mellitus type 1.
The chromosome for the diabetes allele and the blood type allele are different but if crossing over occurs they could influence each other. Research has found that there are multiple alleles associated with diabetes mellitus. In 2002 research found that at least twenty separate chromosomes are associated with diabetes mellitus (Pociot 2002). Large association has been found with the HLA gene located on chromosome 6. Meanwhile the chromosome associated with blood type is chromosome 9. If a statistically significant correlation is found further research could be done to determine if crossing over is occurring.
Other research has been done that is similar in nature, but was pertaining to type 2 diabetes, or has been in significantly different geographical locations. Research among type 2 diabetics has shown that there is a negative association between blood group A and O, implying that those with A and O blood
Medical Laboratory Science

38
type have a smaller chance of diabetes mellitus type 2 (Kamil, Al-Jamal, & Yusoff, 2010) (Macafee, 1963). However, research dealing with type 1 and type 2 diabetes mellitus tends to show that those with a blood type of A+ and O- are significantly higher among diabetics than non-diabetics (Okon, 2008). Through this study, the researchers strived to verify if this trend was true and to further research for this life changing disease. Finding a significant difference between these two groups would have major implications for further research in determining causes or risks for type 1 diabetes mellitus.
The researchers used two sample groups, one comprised of known type 1 diabetes mellitus patients and a control group comprised of students from Weber State University. The null hypothesis of this study was that there is not a statistically significant difference in the proportions of blood types between the diabetic (experimental) group and the non-diabetic (control) group. The alternative hypothesis was that there is a statistically significant difference in the proportions of blood types between these two groups.
Materials and MethodsFor this project the researchers recruited participants with type 1 diabetes mellitus, from Mountain Vista Medicine, located in South Jordan, Utah. Since most of the participants were between 8 to 16 years of age, each minor that chose to participate did so with written consent which they signed along with consent signed by a parent or legal guardian. The control group was obtained during this time as well, which was comprised of students from Weber State University, who are not diabetic. The age difference between the experimental group and the control group did not affect the results because blood type does not change with age.
Rushforth et al.

39
For the blood sample collection, which began in early January, researchers obtained the specimens through standard venipuncture procedures. Following this, researchers typed the blood samples which were obtained. Researchers primarily used gel card technology to determine ABO and Rh blood types of the participants. The blood specimens obtained from the research participants were blood typed using standard serological procedures using Anti-A and Anti-B sera (Koley, 2008). For those who felt uncomfortable giving a blood sample by venipuncture, a fingerstick method was used to obtain the blood sample, and anti-sera were immediately used to type the individual’s blood. All blood samples taken by venipuncture were typed at the Weber State University Health Science building.
Once these samples had been collected and blood types had been determined, a comparison was made between these two groups using statistical analysis. The chi-squared test was used to determine if there was a statistically significant difference between the occurrences of blood types in the control group compared to that of the experimental group. Care was taken in an attempt to limit variables which could confound our results of this study. For example, steps were taken to ensure that the two samples did not have a significant difference in size (numbers of participants), gender, ethnicity, and geographical location. For this research, age was not a confounding variable because blood types do not vary with age.
ResultsThe results in table 1 show the distribution of the blood types among the diabetic group and the control group. Chi-squared and fisher statistical testing were used to determine if there was a correlation between blood types and diabetes mellitus. Four
Medical Laboratory Science

40
different comparisons were used: O versus not O, A versus not A, A+ versus not A+ and O+ versus not O+. No comparisons were done using AB or B blood types because of the small sample size among those individual groups. Table 2 shows the Chi-square analysis and the odds ratio associated with O verse not O, A versus not A, A+ versus not A+ and O+ versus not O+.
DiscussionData found in table 2 shows that overall there is no statistically significant correlation between blood type and diabetes mellitus. Although table 2 does show that with an odds ratio of 1.148 individuals with O+ blood type have greater odds of having type 1 diabetes verse those not O+. All other odd ratios were less than 1 which is associated with lower odds of having diabetes mellitus type 1.
ReferencesKamil, M., Al-Jamal, H. A., & Yusoff, N. M. (2010). Association of ABO blood
groups with diabetes mellitus. Libyan Journal of Medicine.
Koley, S. (2008). The distribution of the ABO blood types in patients with diabetes mellitus. Anthropologist, 129-132.
Macafee, A. L. (1963). Blood groups and diabetes mellitus. Journal of Clinical Pathology, 39- 41.
Okon, U. A. (2008). The relative incidence of diabetes mellitus in ABO/Rhesus blood groups in South-Eastern Nigeria. Nigerian journal of physiological sciences, 1-3.
Pociot, F. Genetics of type 1 diabetes mellitus. Genes and Immunity, 2002: 235-249.
Rushforth et al.

41
Table 1. Prevalence of ABO Blood Type and Diabetes Mellitus Type 1
Table 2. (Chi-square Analysis)
PREVALENCE OF ABO BLOOD TYPE AND DIABETES MELLITUS TYPE 1
Table 1(Blood Types) Diabetic
Group Control Group
Frequencies of Diabetic Group
Frequencies of Control Group
A+ 27 27 0.33 0.39 A-‐ 5 5 0.06 0.07 B+ 5 1 0.06 0.01 B-‐ 4 0 0.05 0.00 AB+ 1 1 0.01 0.01 AB-‐ 0 1 0.00 0.01 O+ 32 25 0.40 0.36 O-‐ 7 9 0.09 0.13 Rh + 65 54 0.80 0.78 Rh -‐ 16 15 0.20 0.22
ABO blood types obtained from diabetic patients from Mountain Vista Clinic
and a control group comprised of students from Weber State University.
Table 2 (Chi-‐square Analysis) Diabetic Control P-‐Value Odds
Group Group
O+ 32 25 0.808 1.148 Not O+ 49 44 O 39 34 0.8 905 0.956 Not O 42 35 A 32 32 0.495 0.756 Not A 49 37 A+ 27 27 0.571 0.799 Not A+ 54 42 Four comparisons made using chi-‐squared analysis and Fisher
testing.
Ratio
PREVALENCE OF ABO BLOOD TYPE AND DIABETES MELLITUS TYPE 1
Ratio
Table 2 (Chi-‐square Analysis) Diabetic Control P-‐Value Odds
Group Group
O+ 32 25 0.808 1.148 Not O+ 49 44 O 39 34 0.8 905 0.956
Not O 42 35 A 32 32 0.495 0.756
Not A 49 37 A+ 27 27 0.571 0.799
Not A+ 54 42 Four comparisons made using chi-‐squared analysis and Fisher
testing.
Medical Laboratory Science

42
Prevalence of Antibiotic-resistant Staphylococcus Aureus Found Among Weber State Students
Richard Scott, Ahmed Mohammed, & Michael Smith
Faculty Mentor: Matthew Nicholaou
Abstract
Staphylococcus aureus (STA) is a bacterium that can cause life-threatening infections and some strains have resistance to antibiotics. Our study looked at the prevalence of antibiotic-resistant STA isolates collected from Weber State students and checked for a correlation with hospital/healthcare exposure. These samples were collected from nasal passages, where STA is commonly found as normal flora, then cultured using standard microbiology techniques. Antimicrobial resistance was determined using Minimum Inhibitory Concentration (MIC) panels commonly used in clinical laboratories. Based on our findings, the STA isolates were categorized into two groups: resistant and susceptible. Pathogenicity was determined using Polymerase Chain Reaction (PCR) to differentiate our samples at the genetic level, confirming if any are Methicillin-Resistant Staphylococcus aureus (MRSA) through detection of the mecA gene. 31 of 74 samples received were confirmed to be STA and 42% of the isolates were found to have antibiotic resistance. No correlation was found between hospital exposure and drug resistant strains (p = 0.237). An odds ratio of 3.37 (95% CI, 0.48-40.36) showed a possible trend towards increased odds of a resistant strain in the hospital exposed group but was also not statistically significant.

43
IntroductionSTA is a bacterium that is normal flora of the skin and upper respiratory system. Research has shown that up to 20% of the human population is colonized with STA (Kluytmans, Van Belkum, & Verbrugh, 1997). With the introduction of penicillin in the mid-1940s research shows that by 1950, 50% of all STA strains had become resistant (Livermore, 2000). One year after the introduction of a new drug, Methicillin, the first MRSA strain was encountered (Livermore, 2000).
This study assessed the prevalence, pathogenicity, and drug resistance of STA found among Weber State students. Also, we will be looking for a correlation with the amount of time spent in a healthcare setting and the pathogenicity/drug resistance of the individual carriers; we expect to find more drug-resistant strains correlating to longer hospital exposure.
Methods
Sample collection and survey data
74 samples were collected from the nasal passages of Weber State University students. Sterile nasal swabs were inserted into both nostrils approximately a half-inch deep and rotated five times in each nostril to ensure adequate contact of the entire area.
Culture and Organism Identification
Samples were plated onto sheep blood agar (SBA) and manitol salt agar (MSA) plates. SBA plates are used to detect hemolysis while MSA is a selective media for STA. Culture plates were incubated for an initial 24-hour period at 37 degrees Celsius in a 5% CO2 incubator for the SBA and 0% CO2 incubator for the MSA. After 24 hours, any observed β-hemolytic reaction on the SBA
Medical Laboratory Science

44
and a mannitol-positive reaction on MSA, indicated by a pink-to-yellow color change with the agar, were subjected to further testing. Catalase tests and spot/overnight coagulase tests were used to examine all colonies in question. All Staphylococcus spp. are catalase producers, but a defining characteristic of STA is the production of a coagulase enzyme. Positive test results are noted as follows: catalase tests are positive when rapid bubbling is seen when a bacterial colony is added to a 3-5% hydrogen peroxide solution; spot-coagulase tests are positive when a bacterial colony forms small clumps when added to rabbit plasma; overnight coagulase tests are positive when rabbit plasma turns gel-like after a bacterial colony is added and incubated at 37 degrees Celsius overnight. Some strains of STA have weaker coagulase reactions, so colonies producing negative spot coagulase results were again tested using the overnight method.
Susceptibility testing
Antimicrobial susceptibility was performed using a Microscan system. All STA isolates were subcultured onto SBA plates to ensure the viability of the organisms, incubated overnight, and then inoculated onto a POS Combo 20 MIC panel using the guidelines from Siemens Company. Purity plates were made for each sample from the inoculant to certify that the sample was not contaminated. After 24 hours of incubation, all panels were read using an Autoscan to determine the antimicrobial susceptibility. The control for the antimicrobial susceptibility was ATCC 292 I 3STA strain.
Multiplex PCR
Multiplex PCR was performed on all STA isolates to detect the following two genes: the 16S ribosomal RNA gene
Scott et al.

45
(rRNA) found in all Staphylococcus spp and the mecA gene which is responsible for the resistance to Methicillin. Using QIAGEN DNA extraction kits, the DNA from each isolate was extracted along with a confirmed positive MRSA sample from a local hospital as a control for both the 16S rRNA and mecA gene. Primer forward (5’-AACTCTGTTATTAGG GAAGAACA-3’) and primer reverse (5’-CCACCTTCCTCCGG TTTGTCACC-3‘) were used to detect the 16S rRNA gene (McClure, et al., 2006). The mecA gene was detected using primer forward (5’-GTAGAAATGACTGAA CGTCCGATAA-3’) and primer reverse (5’-CCAATTCCACATTGT TTCGGTCTAA-3‘) (McClure, et al., 2006). Both primers were tested separately by PCR to find the optimal MgCl concentration and annealing temperature gradient. A 2 millimole (mM) MgCl at an annealing temperature range from 50 - 59.5° C were the optimal values for both primers. PCR optimization was again run with the two primers combined, and the optimal results were determined to be 2 mM MgCl at an annealing temperature of 55° C. All isolates were run with the thermocycling condition set at 94° C for 7 min, followed by 34 cycles of 94° C for 1 min, 55.5° C for 1 min, 72° C for 1 min, and then a final extension at 72° C for 5 minutes. As a final step, gel electrophoresis was used to test all samples that been run by the PCR and the band sizes that were detected were 756 and 310 base pairs for 16S rRNA and mecA genes, respectively.
ResultsStatistical Analysis
All participants completed a survey that asked for information about their age, race, academic major, and any experience working in a hospital/healthcare setting (Table 1). One of
Medical Laboratory Science

46
the participants failed to complete the survey, their sample was discarded, bringing the total number of participants to 74. Of these 74 samples, 31 isolates were confirmed to be STA, two of which were flagged as MRSA during the antimicrobial susceptibility testing. The STA isolates were categorized into two groups, resistant or susceptible, based on the drug susceptibility data obtained from our MIC panels. These groups were then stratified by hospital exposure (Table 2).
A calculation of the data showed that out of the 31 isolates 42% showed drug resistance while 58% did not. Using a statistical program called R Studio, a Fisher’s Exact test was performed to see if there was any correlation between hospital exposure and the antimicrobial resistance of the bacteria. No correlation was found between hospital exposure and drug-resistant strains (p = 0.237). An odds ratio of 3.37 (95% CI, 0.48 -40,36) showed a possible trend towards increased odds of a resistant strain in the hospital exposed group but was also not statistically significant.
DiscussionOne interesting finding was that although our antimicrobial susceptibility tests showed that two isolates were flagged as MRSA, one was mecA positive and one was negative (Figure 1). This sample that was shown to be mecA negative also had an interesting MSA reaction in that it was mannitol-negative. Literature searches indicated at MRSA can be mannitol-negative and recently microbiologists have been finding a mutation with the mecA gene in MRSA isolates.
The Fisher’s Exact test showed a possible increasing trend of having a resistant strain of STA with hospital exposure (3-times more likely), yet lacked statistical significance. This lack of a
Scott et al.

47
statistical significance is possibly due to our limited sample size. Collecting more samples would give us more data to see if the difference is, in fact, significant or not. Future studies would also include checking for a linear relationship with the amount of time spent in a hospital/healthcare setting and an increase in carrying a more resistant strain. In addition, we are interested in the pathogenicity and virulence of the bacterium and want to test for the Panton Valentine leukocidin (PVL) gene. The PVL gene codes for a cytotoxin that destroys leukocytes and is commonly found on various strains of community-acquired MRSA (Boyle-Vavra & Daum, 2007). What we would like to see is among all positive STA we found, how many are carrying the PVL gene and what does it mean: Could healthcare workers have an increased chance of carrying these more pathogenic strains? If so, they could be acting as a transport mechanism between hospitals and the community.
ReferencesBoyle-Vavra, S., & Daum, R. S. (2007). Community-acquired methicillin-
resistant Staphylococcus aureus: the role of Panton-Valentine leukocidin. Laboratory Investigation, 87, 3-9.
Kluytmans, J., Van Belkum, A., & Verbrugh, H. (1997, July). Nasal carriage of Staphylococcus aureus: epidemiology, underlying mechanisms, and associated risks. Clinical Microbiology Review, 505-520.
Livermore, D. M. (2000, Nov). Antibiotic resistance in staphylococci. International Journal of Antimicrobial Agents, 16 (Supplement 1 ), 3-10.
McClure, J.-A., Conly, J. M., Lau, V., Elsayed, S., Louie, T., Hutchins, W., & Zhang, K. (2006, March). Novel multiplex PCR assay for detection of the staphylococcal. Journal of Clinical Microbiology, 1141-1144.
Medical Laboratory Science

48
Table 1. Demographics of Participants.
Table 2. Resistant and susceptible S. aureus strains by hospital exposure.
Figure 1. Multiple PCR screening for 16S rRNA & mecA genes found in S. aureus isolates.
Gender
MaleFemale
Age Range(years)
19-4119-52
No. of Participants
2945
HospitalExposed
2135
HospitalUnexposed
810
Hospital Exposure
ExposedUnexposed
No. of Resistant to Antibiotics
112
No. of Susceptible to Antibiotics
117
Resistant strains are those that showed resistance or intermediate-resistance with the MIC panels. Groups were defined as greater than or equal to one year of hospital exposure for the exposed group and less than one year for the unexposed
Scott et al.
Lane 1, ATCC 29213, positive control for 16S geneLane 3, MRSA clinic isolate 1, positive control for 16S gene and mecA geneLane 4, N. gonorrhea, negative control for 16S and mecA genesLane 5-6, isolates flagged as oxacillin resistantLane 7-16, isolates not flagged as oxacillin resistantLane 17, MRSA clinic isolates 2Lane 18, MRSA clinic isolates 3

49
Use of Common Household Desiccants as an Alternative to Poison Ivy Block
Daniel Shallbetter & James Mauchley
Faculty Mentor: Matthew Nicholaou
Abstract
Contact dermatitis due to exposure with members of the Toxicodendron family (including poison ivy and poison oak) is a major problem for those who live in forested areas around the world. Quanternium-18-bentonite is a known preventative agent of contact dermatitis due to these plants. This chemical acts as a desiccant, absorbing any fluid it comes in contact with, including the oil urushiol, which is the causative agent in contact dermatitis. All around us however, are many desiccants that have the exact same absorbing capabilities. Is it possible for another more accessible desiccant to have similar effects of absorption of urushiol oil? Our plan was to test the absorbency of common household desiccants against that of quanternium-18-bentonite, and test any residual liquid for the presence of urushiol by UV spectroscopy, to find if another desiccant can prove as effective as the known treatment.
Introduction
Contact dermatitis is a condition encountered when human skin comes in contact with leaves of the Toxicodendron family, also known as the poison sumac family. Individuals that frequent the natural habitat of such plants are most susceptible.
Medical Laboratory Science
50
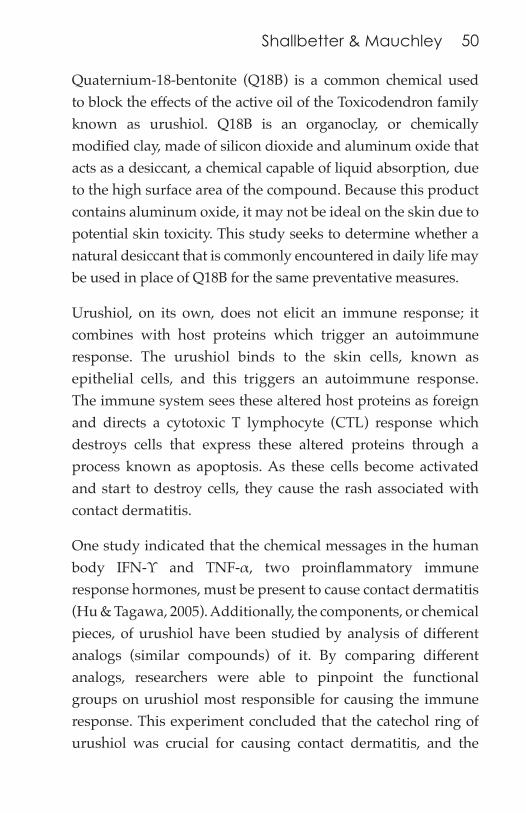
Quaternium-18-bentonite (Q18B) is a common chemical used to block the effects of the active oil of the Toxicodendron family known as urushiol. Q18B is an organoclay, or chemically modified clay, made of silicon dioxide and aluminum oxide that acts as a desiccant, a chemical capable of liquid absorption, due to the high surface area of the compound. Because this product contains aluminum oxide, it may not be ideal on the skin due to potential skin toxicity. This study seeks to determine whether a natural desiccant that is commonly encountered in daily life may be used in place of Q18B for the same preventative measures.
Urushiol, on its own, does not elicit an immune response; it combines with host proteins which trigger an autoimmune response. The urushiol binds to the skin cells, known as epithelial cells, and this triggers an autoimmune response. The immune system sees these altered host proteins as foreign and directs a cytotoxic T lymphocyte (CTL) response which destroys cells that express these altered proteins through a process known as apoptosis. As these cells become activated and start to destroy cells, they cause the rash associated with contact dermatitis.
One study indicated that the chemical messages in the human body IFN-Υ and TNF-α, two proinflammatory immune response hormones, must be present to cause contact dermatitis (Hu & Tagawa, 2005). Additionally, the components, or chemical pieces, of urushiol have been studied by analysis of different analogs (similar compounds) of it. By comparing different analogs, researchers were able to pinpoint the functional groups on urushiol most responsible for causing the immune response. This experiment concluded that the catechol ring of urushiol was crucial for causing contact dermatitis, and the
Shallbetter & Mauchley

51
carbon chain only changed the severity of the reaction (Byers, Castagnoli, & Epstein, 1979). There has also been a clinical trial on the use of Q18B as a preventative measure against contact dermatitis. Q18B was tested on a human test group with a history of contact dermatitis. This was done by placing patches imbedded with either Q18B or a placebo alternative on the forearms of individuals, and then applying a trace of urushiol. The participants with the Q18B developed no or less severe reactions (Marks, Fowler, Sheretz, & Rietschel, 1995). A study on organoclays, such as Q18B, showed that organoclays modified with aluminum oxide had significant toxicity to earthworms as the concentration of organoclay increased (Sarkar, Megharaj, Shanmuganathan, & Naidu, 2013). Q18B is composed of three simple ingredients aluminum oxide, silicon dioxide, and water. These components act together to form a desiccant, which is an effective agent for absorbing humidity from the air. Bentonites are super fine clays that can be extracted from the earth. Desiccants can come in many forms, from simple table salt to the sugar used in cooking. These are chemicals that are much less expensive and much more available to the public than a bottled variety of foreign clay.
Materials and MethodsA 1% solution of 3-pentadecylphenol was mixed using 95% ethanol as the solvent. This was used throughout the experiment as an urushiol alternative due to the inaccessibility of poison ivy during the winter and early spring when this experiment took place and the chemical similarities that 3-pentadecylphenol has to urushiol. Pasture pipets were then prepared using glass wool as a plug. Then a weighed portion of each desiccant was poured in each pipette. The desiccants used in this experiment
Medical Laboratory Science

52
were table salt, table sugar, silicon dioxide, bentonite, and calcium sulfate. Bentonite instead of Q18B was used because we were unable to locate any Q18B; it had previously been taken off of shelves due to problems from ingestion. A simple pipet with a glass wool plug but no compound was used as a negative control, to compare the absorbance of the pipet, to that of the desiccants. All tests were performed in triplicate, on two separate runs on two different days to better analyze the accuracy of the testing. The pipettes with added desiccant were then weighed to find the initial mass of them. The pipettes were then placed suspended over culture tubes for collection of the filtered solution. (see figure 1) 2mL of the 3-pentadecylphenol solution was placed in each pipette. The solution was allowed to pass through the desiccant and each was timed as the solution passed. The pipettes were allowed to dry overnight and were weighed the following day for comparison of weight.
The culture tubes with filtrate were then taken to an Ultra Violet (UV) Spectrophotometer for analysis of the 3-pentadecylphenol concentration. This was done with a UV spectrophotometer in the Chemistry department on the Weber State University campus. The compound was in a high concentration for the instrument so the filtered solutions were diluted in a 1:21 dilution with the same reagent alcohol for analysis. Running the change of mass and the absorbance data through R studio, two ANalysis Of VAriance (ANOVA) were run; one on the change of mass and one on the absorbances. These were executed to compare the averages of all the different desiccants.
ResultsThe times on the desiccants had so much variability that we were uncertain that any of the results were accurate. Comparison
Shallbetter & Mauchley

53
can be seen in figure 3. The only significant difference seemed to be that the particle size of the desiccant affected passage of solution. Both calcium sulfate and bentonite were fine grain desiccants and salt and sugar were very coarse while silicon dioxide was intermediate in size. The average change in mass of the tubes seemed to be constant between all samples tested. An ANOVA was preformed to determine if any statistical difference resided between samples. The ANOVA gave an F value of 0.4319 and a P value of 0.7843. With a set alpha level of 0.05, this ANOVA tells us that all the data is similar. Initial analysis on the UV spectrophotometer showed two strong peaks: one at around 200 nm, the other between 250 and 300 nm. It was later determined that the stronger of the two peaks at 200nm was actually the absorbance of the plastic cuvette used with the UV spectrophotometer. The samples were rerun again under a narrower wavelength with crystal cuvettes to exclude the peak from before. The absorbance values were statistically compared with another ANOVA test to determine if any of the sample concentrations had a statistically significant difference in concentration than that of the other samples. At an alpha level of 0.05, the P value was 0.2794 and the F value was 1.3275. This indicates that there is no statistically significant difference between concentrations. Therefore, we must accept the null hypothesis that the alternative desiccants are just as effective as the known treatment.
DiscussionThe goal of this study was to find if an alternative desiccant can be just as effective as Q18B as a poison ivy block. It was found that there was some data of interest.
Medical Laboratory Science

54
Analysis of the data suggests that there is no difference in change of mass between any of the desiccants used in this experiment when run through the column, as seen in figure 2. This may indicate that all of the alternatives work as well as bentonite does.
The time of passage appeared to be greatly affected by the size of particle of the desiccant, with larger granules allowing a more free passage of solution than the fine grain desiccants. This data was highly variable however and did not tell much other than possibly how long the urushiol would be kept off the skin. This may be the main functionality of the desiccant bentonite which almost consistently took longer than any other desiccant to filter the 3-pentadecylphenol solution.
Although these results do not definitively state that these desiccants will work they suggest that there is a significant absorption of the compound with any desiccant and therefore they might be used as an alternative. However, the time of passage may play a role in why bentonite is such an effective poison ivy block due to the time it takes for the urushiol oil to penetrate to the skin with this protective barrier to prevent entry. To better determine this, further experimentation would be required, with an in vivo test.
ReferencesByers, V. S., Castagnoli, N., & Epstein, W. L. (1979). In vitro studies of poison
oak immunity, 64(November), 1449–1456.
Hu, T. W. D., & Tagawa, Y. (2005). IFN-Y and TNF-a are involved in urushiol-induced contact hypersensitivity in mice, (March 2004), 18–24.
Shallbetter & Mauchley

55
Marks, J. G., Fowler, J. F., Sheretz, E. F., & Rietschel, R. L. (1995). Prevention of poison ivy and poison oak allergic contact dermatitis by quaternium-18 bentonite. Journal of the American Academy of Dermatology, 33(2 Pt 1), 212–6. Retrieved from http://www.ncbi.nlm.nih.gov/pubmed/7622647
Sarkar, B., Megharaj, M., Shanmuganathan, D., & Naidu, R. (2013). Toxicity of organoclays to microbial processes and earthworm survival in soils. Journal of Hazardous Materials, 261, 783–800.
Figure 1. General Setup of the apparatus in this Experiment. The pasture pipet was suspended over a tube for collection of the sample. This was plugged, as shown by the circular object in the pipette. The desiccant was then added. Finally the solution was added.
DESICCANT AVERAGE TIME (MIN)
MIN TIME (MIN) MAX TIME (MIN)
BENTONITE >100 >100 >100 CASO4 41.56 7.95 >90
DEXTROSE 1.082 0.56 2.25 NONE 0.323 0.05 1.283 NACL 2.157 0.583 7.8 SIO2 20.68 0.35 55.6
Medical Laboratory Science

56
Figure 2. Variation in the Change of Mass of Pipets. This shows the various changes in mass of all pipettes tested. The negative controls weight gain for each day’s samples were averaged then subtracted from the original change to account for the action of the tube and glass wool. This line and point graph shows there is no significant difference in any of the desiccant’s change of mass.
Figure 3. The time it took for 2mL of 3-pentadecylphenol to filter through each tube. The Bentonite CaSO4 and SiO2 were smaller particles and allowed less filtration than the large grains of sugar and salt.
DESICCANT AVERAGE TIME (MIN)
MIN TIME (MIN) MAX TIME (MIN)
BENTONITE >100 >100 >100 CASO4 41.56 7.95 >90
DEXTROSE 1.082 0.56 2.25 NONE 0.323 0.05 1.283 NACL 2.157 0.583 7.8 SIO2 20.68 0.35 55.6
DESICCANT AVERAGE TIME (MIN)
MIN TIME (MIN) MAX TIME (MIN)
BENTONITE >100 >100 >100 CASO4 41.56 7.95 >90
DEXTROSE 1.082 0.56 2.25 NONE 0.323 0.05 1.283 NACL 2.157 0.583 7.8 SIO2 20.68 0.35 55.6
Shallbetter & Mauchley

57
Hospital Cost Efficiency and Compliance with Laboratory Algorithms
Jace Stoker, Derek Smith, & Kelsey Johnson
Faculty Mentor: Matthew Nicholaou
Abstract
The United States of America has the highest healthcare costs in the world, yet not necessarily the best quality of care. In 2012, the average American spent $8,233 in healthcare expenditures, and evidence presented herein supports the notion that a significant portion of these expenditures come from unnecessary laboratory testing ordered by physicians (Kane 2012). This project was designed to evaluate the dollar amount spent on improperly ordered laboratory reflex testing. A laboratory reflex-testing algorithm is used to determine whether or not additional testing on abnormal results is warranted. Urinalysis with microscopy testing from 2013 was collected from McKay-Dee hospital. These data were used to calculate the additional costs of unwarranted microscopic testing. In the year 2013 McKay-Dee accrued a staggering costs of $116,127.20 on unwarranted urine reflex testing. The costs analysis was stratified by test volume and paid technical time. Comparisons were made between the different areas of the hospital to evaluate where the bulk of unnecessary reflex testing occurs. The majority of unwarranted urinalysis with microscopy tests (n=7,917), ordered by physicians, took place in the emergency room.
Medical Laboratory Science

58
Introduction
Physicians use laboratory testing for diagnostics and rely heavily on laboratory results in making proper judgments regarding a patient’s treatment. Proper use of laboratory testing can have a significant impact on the physician’s efficiency and effectiveness in treating a patient. This research was designed to examine the relationship between efficiency of compliance with laboratory algorithms and the overall impact it can have on healthcare costs. Many studies have shown that “3-5% of a hospitals budget” is represented in laboratory testing (Van Cott, 2013). Other studies have shown that by reducing unnecessary reflex testing healthcare costs can be significantly reduced. In one study researchers “estimated that...annual cost of reflex testing would be $57,000 (38,000 tests at $1.50 per test) and the cost of at least 1 additional technicians’ salary would be $48,000, for a minimal total cost of $105,000 per year to our HMO” (Froom and Barak, 2012).
Routine urinalysis testing is performed at McKay-Dee hospital by an instrument called the Iris. An algorithm is applied to the urinalysis process which allows the instrument to do additional testing if abnormal results appear- additional tests are referred to as reflex tests. Reflex analysis provides physicians with relevant laboratory test results without the need to order additional individual tests to arrive at a definitive diagnosis (MacMillan, Soderberg, Laposata, 2001). The central algorithm that was analyzed in this research was urinalysis with reflex to microscopy. Reflex to microscopic analysis is added if any of the following occur; abnormal appearance, positive protein, hemoglobin, nitrite, or leukocyte esterase, any trace results (other than trace protein) are considered to be positive. The unnecessary cost occurs when the physician orders a urine
Stoker et al.

59
with microscopic (UAWM) without letting the instrument use its specific algorithm to reflex when an abnormal value results. This research was done to evaluate the number and cost of how many urine samples were ordered with microscopy that initially had normal urinalysis (UA) results.
MethodsData Collection
Urinalysis with microscopy test results were collected from McKay-Dee hospital. These data were used to evaluate the cost of performing unwarranted urine reflex testing. The research included urinalysis with microscopic results from the entire year of 2013. A total of 14,685 patients that had urinalysis with microscopic testing were evaluated. A panel of five criteria was used to indicate if the reflex test was warranted or not. The specific urine criteria used included: urine appearance, nitrite, hemoglobin, leukocyte esterase, and protein.
Cost Analysis
Simple calculations were used to determine the cost differences between a urinalysis, and a urinalysis with microscopy. These differences in costs were the main emphasis in determining how much money was spent on unwarranted urinalysis testing in 2013. The cost of one urinalysis test in 2013 was $31.75. The cost of one urinalysis with reflex to microscopy was $43.18. The difference in cost between the two tests was $11.43. Every unwarranted reflex test that was ordered was then multiplied by the difference in cost between the two tests in order to reach a total dollar amount spent for the year on unnecessary reflex testing. After calculating the cost of the unwarranted tests performed, an additional cost of technical wage was included
Medical Laboratory Science

60
to reach a total that was spent for the year on unwarranted reflex testing. At an entry-level technician wage of $20.61 per hour and 3 minutes to perform each microscopic analysis, an additional $1.03 was included for each unnecessary reflex test. In the year 2013 McKay Dee accrued a staggering cost of $116,127.20 of unwarranted urine reflex testing.
Identification of Warranted vs. Unwarranted Testing
A standard operating procedure was used to identify all reflexive tests that were ordered correctly or incorrectly. The standard operating procedures states that if any of the five criteria (i.e. abnormal appearance, protein, leukocyte esterase, hemoglobin, nitrite) come up positive in the urinalysis dipstick, a reflex to microscopy is needed. These five criteria were looked at with each patient. If any one of these five criteria came up positive, or abnormal in the screen, the test was counted as a correctly ordered urine reflex test. When all five criteria had negative results, the urinalysis with microscopy was accounted for as an improperly ordered urine reflex test. Other comparisons were also made in order to evaluate whether unnecessary reflex testing occurred more with in house patients, outpatients, or orders that came from the emergency room.
ResultsAs expected, 63% of the urinalysis with microscopy tests ordered were not necessary (Figure 2). Of the total number of unwarranted reflex tests ordered, 84.9% (n=7,917) of them came from the emergency room (Figure 3). The total spent on unwarranted urine reflex tests was $116,127.20 (Table 1).
Stoker et al.

61
DiscussionThe number of unwarranted to warranted reflexive tests ordered was considerable. McKay-Dee ordered a total of 9,320 urine reflex tests improperly. This meant that the hospital accrued a cost of $116,127.20 on unnecessary reflex testing. This research supports the notion that a significant portion of hospital expenditures comes from unnecessary laboratory testing. Although this cost may seem minimal in the overall healthcare world, this study was but only one focused area of the hospital with one specific test. The comparison of unwarranted tests that were ordered in different areas of the Hospital clearly shows that the Emergency Room is by far the largest contributor.
With the amount of unwarranted urine reflex testing being performed every day, we can assume physicians need additional training on how to properly follow urinalysis testing algorithms. If proper testing algorithms were followed on a daily basis, hospitals across the world would dramatically reduce the amount of unnecessary costs accrued in the laboratory. There are few limitations to the study such as, only one hospital and test was evaluated, and only one year of data was collected. Other reflex tests will be looked at over a longer period of time to observe if similar costs are being accrued in the hospital due to improper physician ordering.
AcknowledgementsWe would like to thank Weber State University Department of Research and Intermountain Healthcare for approving this research. Much appreciations to our mentors Dr. Matthew J. Nicholaou and Melanie Ploharz for their time and expertise. We would also like to thank McKay Dee laboratory for providing us with the data and resources necessary for this project.
Medical Laboratory Science

62
References
Frooni, P., & Barak, M. (2012). Cessation of dipstick urinalysis reflex testing and physician ordering behavior. American journal of clinical pathology, 13 7(3), 486-9. doi:10.1309/AJCPLJFSS62YBAWN
Kane, J. (2012, Oct 22). Health cost: How the U.S. compares with other countires. Retrieved from http://www.pbs.org/newshour/rundown/2012/10/health-costs-how -the-us-compares-with-other-countries.html
MacMillan, D. H., Soderberg, B. L., & Laposata, M. (2001). Regulations regarding reflexive testing and narrative interpretations in laboratory medicine. American journal of clinical pathology, 116 Suppl, S129-S132. doi: 10.1309/RG7D-YE9L- 3XGT-DKT6
Van Cott, E. M. (2013). Laboratory test interpretations and algorithms in utilization management. Clinica chimica acta; international journal of clinical chemistry. doi: 10.1016/j.cca.2013.09.025
Stoker et al.

63
Synergistic Effects of Essential Oils and Antimicrobials Against Bacterial Pathogens
Ryan Wilcox, Tyler Webb, & Dana Larsen
Faculty Mentors: Scott Wright & Matthew Nicholaou
Abstract
Drug resistant strains of bacterial pathogens have become a rising concern within the medical community due to the overuse of antimicrobials. A significant amount of research is currently being performed to enhance the effectiveness of antimicrobial treatments. Essential oils have been shown in previous studies to have antimicrobial properties; however, little research has been done to show the synergistic effects of essential oils with current antimicrobial treatments. The goal of this study was to investigate the potential synergistic effects of five essential oils in conjunction with antimicrobials used in the clinical treatment of resistant bacterial pathogens. Hence, five essential oils of known concentrations were tested against four species of bacterial pathogens using a macrodilution method and the minimum inhibitory concentration (MIC) each essential oil was measured. The initial antimicrobial resistance profile was then measured for the bacterial species using an AutoScan® instrument. Varying dilutions of essential oils were added to antimicrobial micro scan plates that contain standardized concentrations of 20-24 frequently used antimicrobials. The new MIC of the antimicrobials was then

64
determined and compared to the original antimicrobial resistance profile. The results showed improved effects of certain antimicrobials against different bacterial pathogens when combined with essential oils. These results could potentially have an impact on improving the clinical effectiveness of antimicrobial therapy.
Introduction
Drug resistant strains of bacterial pathogens have become a rising concern within the medical community due to the misuse or overuse of antimicrobials (Datta et al., 2012). Antimicrobials are often misused when physicians prescribe antibiotics for infections that do not benefit from antibiotics, such as the common cold, which is viral in origin and is not affected by any antibacterial agent. Another potential issue arises with patients that do not complete the prescribed course for antibiotic therapy. For instance, when a patient stops taking his or her prescribed antibiotic early because the symptoms improve. Situations like these can potentially create a selective gradient by killing all the susceptible bacteria while allowing those that are resistant against the antimicrobial to continue to reproduce and become the predominant population (Bauman, 2011).
A significant amount of research is currently being performed to enhance the effectiveness of antimicrobial treatments. Essential oils have been shown in previous research to have antimicrobial properties (Buckner et al., 2011); however, little to no research has been done to investigate any synergistic effects of essential oils when combined with antimicrobial therapy (Fadli et al., 2011). This synergistic effect is demonstrated when certain antimicrobials with different modes of action are used together to force the bacteria to cope with two potential inhibitors instead of one, therefore improving the antimicrobial effect. Many
Wilcox et al.

65
commonly used antimicrobials, such as vancomycin, which is used to treat Methicillin Resistant Staphylococcus aureus (MRSA) infections, have adverse side effects, especially in higher concentrations. If essential oils prove to have a synergistic effect with antimicrobial drugs, the oils could effectively lower the required dosage of antimicrobials and thus reduce potential side effects.
Materials and MethodsThe five essential oils used in this study included cinnamon, eucalyptus, lavender, oregano and ginger. These oils were selected based on other research that demonstrated these oils had some antimicrobial effect (Becerril & Gómez-Lus, 2012). The species of bacteria chosen were Pseudomonas aeruginosa, Acinetobacter baumannii, Enterococcus faecalis and a strain of Staphylococcus aureus that is methicillin resistant (MRSA). These species were chosen because of the increased prevalence of resistant strains being isolated in the clinical setting as well as the severity of diseases that they cause (Mine et al., 2011).
MIC of the Essential Oils
The first step involved determining the minimum inhibitory concentration (MIC) of each of the oils using a macrodilution method. Standard concentrations were made in Columbia broth utilizing Tween 80 to emulsify the oils into solution. The concentrations chosen were 0.05%, 0.10%, 0.25%, 0.50%, 0.75% and 1.0%. Concentrations above this level were ruled out because of the difficulty of getting the oil into solution. This resulted in a group of 25 tubes, five sets for each oil, containing the concentrations noted above. Each set was inoculated with 20 μL of a 1.0 McFarland standard of each organism. The broths were then incubated for 24 hours at 37˚C.
Medical Laboratory Science

66
After incubation, each set of tubes was visually examined for turbidity or other evidence of growth. The first concentration that lacked growth was determined to be the MIC of that oil for that organism. Results were confirmed by plating each set of tubes on sheep blood agar (SBA) plates in a pie-plate formation and checking for growth after a 24-hour incubation period. Each concentration was plated on a separate wedge allowing for easy visual identification of the MIC.
Initial Antimicrobial Resistance
Antimicrobial susceptibilities are commonly measured using Microscan™ MIC panels. These panels contain various concentrations of 20 to 24 different antimicrobial drugs each in a different “well”. The panels are inoculated with a 30 ml bottle of saline containing a standard concentration of the organism in question and incubated at 37˚C for 24 hours. The panel is then placed in the Microscan™ instrument, which uses light to measure the turbidity in each well, to determine whether or not growth is present. The first well without growth is interpreted by the analyzer as the MIC level for that individual drug.
A panel was set up for each of the four organisms based on their Gram reaction. The panels were incubated and read after 24 hours in order to get the initial level of resistance to each drug for each organism.
Combination of Oils and Antimicrobials
In order to investigate any synergistic effects between essential oils and conventional antimicrobials, the two were tested together using a modification to the procedure described above. The 30 ml saline bottle used to inoculate the panels was modified to contain the MIC of each oil determined in step one. The changes are summarized in Table 1.
Wilcox et al.

67
A modified bottle was prepared for each oil and organism combination using a concentration below the determined MIC. The concentration of the oil had to be below the MIC so that any changes in measured resistance patterns could be attributed to synergy, and not the lethal effects of a concentration greater than the MIC. Each modified bottle was used to inoculate a panel that was then read after 24 hours of incubation at 37˚C. This entire process was repeated in triplicate in order to minimize changes due to random chance or researcher error.
Determining the Changes in MIC
Repeating the panels in triplicate resulted in three values for the “new” MIC. This posed a problem for the researchers in the event that all three values did not match each other. It was difficult to determine which result was valid and which was random error. A simple set of three rules was developed to aid the researchers in deciding which value to accept while still avoiding as much bias as possible. These rules are noted below:
1. If all three values match each other, the value obtained is accepted as valid.
2. If two of the values match and the third is only one cutoff away from the other, accept the matching value.
3. If none of the values match each other or two match and the third is more than one cutoff away, reject that value and exclude it from analysis.
Using these rules a new MIC value for each antimicrobial and oil combination was obtained and compared to the initial resistance profile to look for changes or patterns.
Medical Laboratory Science

68
ResultsFor ease of analysis and to observe trends, all of the drugs were sorted into drug classes based on their modes of action. The classes and the drugs they contain are summarized in Table 2.
The new MIC values from the oils and antimicrobials in combination were compared to the initial antimicrobial resistance levels. The fold change difference, being the amount of cutoffs or wells the new value changed from the original, was calculated using the initial values as a baseline.
DiscussionThe results obtained by combining the essential oils with the antimicrobials vary according to the class of drug. Using the rules established, it was determined which oils were considered synergistic, additive and antagonistic with each antimicrobial. If there was a two-fold decrease in the resistance from the initial run then that change was determined to be synergistic. If there was only a one-fold change then that change was determined to be additive.
It was found that each oil had a different effect on each organism. Cinnamon, at a concentration of 0.05%, greatly decreased the resistance of MRSA and Enterococcus faecalis to the penicillin drug class. While cinnamon was effective in these cases, it had little to no effect on Pseudomonas aeruginosa.
Ginger had a small synergistic effect with penicillin when used against MRSA. Ginger also had a similar synergistic affect when used in combination with sulfonamides and third generation cephalosporins against Acinetobacter baumannii. Ginger had little to no effect on most other antimicrobials.
Wilcox et al.

69
Lavender was similar to ginger. It had a slight synergistic effect with penicillins and carbepenems when used against Enterococcus faecalis. It was also effective with penicillins against MRSA. However, it actually made a meropenem, a carbepenem class drug, almost 3 times less effective. This could be due to inactivation or binding of the drug by something in the oil.
Eucalyptus had a strong synergistic effect with gentamicin against Acinetobacter baumannii and first generation cephalosporins against Pseudomonas aeruginosa.
Some limitations were encountered while performing this research. Oregano had to be excluded because it caused interference by clouding the antimicrobial wells and producing false high values. On the other hand, cinnamon completely inhibited Acinetobacter baumannii from growing, even at extremely low concentrations. Due to limited time and resources, each organism was only run in triplicate. Having the time and resources to perform more runs would provide more reliable results regarding the synergistic effects of essential oils and antimicrobials. It is also unknown if the concentrations of essential oils would be toxic to human cells. Further research should be done to establish safe levels of essential oils when used in the human body.
ReferencesBauman, Robert W., (2011). Microbiology with diseases by taxonomy. San
Francisco, CA: Pearson Education.
Becerril, R., Nerín, C., & Gómez-Lus, R. (2012). Evaluation of bacterial resistance to essential oils and antibiotics after exposure to oregano and cinnamon essential oils. Foodborne Pathogens and Disease, 9(8), 699–705.
Medical Laboratory Science

70
Buckner, P., Gomm, K., Jones, S., Pollard, K. (2011). Antimicrobials vs. homeopathic remedies. ERGO, 5, 20-25.
Datta, S., Wattal, C., Goel, N., Oberoi, J. K., Raveendran, R., & Prasad, K. J. (2012). A ten year analysis of multi-drug resistant blood stream infections caused by Escherichia coli & Klebsiella pneumoniae in a tertiary care hospital. The Indian Journal of Medical Research, 135(6), 907–12.
Fadli, M., Chevalier, J., Saad, A., Mezrioui, N.-E., Hassani, L., & Pages, J.-M. (2011). Essential oils from moroccan plants as potential chemosensitisers restoring antibiotic activity in resistant gram-negative bacteria. International Journal of Antimicrobial Agents, 38(4), 325–30. doi:10.1016/j.ijantimicag.2011.05.005
Mine, Y., Higuchi, W., Taira, K., Nakasone, I., Tateyama, M., Yamamoto, T., Uezato, H., et al. (2011). Nosocomial outbreak of multidrug-resistant USA300 methicillin-resistant Staphylococcus aureus causing severe furuncles and carbuncles in Japan. The Journal of Dermatology, 38(12), 1167–71.
Wilcox et al.

71
Figure 2. Synergistic Effects of a Four Fold Change or Greater. The numbers represent different bacterial drugs and oil combinations. One equals MRSA, cinnamon/penicillin combination. Two equals MRSA, cinnamon/clindamycin combination. Three equals MRSA, lavender/clindamycin combination. Four equals A.baumannii, eucalyptus/gentamicin combination.
Modifications to Microscan™ Saline Bottles
Table 1: Modifications
Chart 1: Synergistic Effects of a Four Fold Change or Greater. The numbers represent different bacterial drugs and oil combinations. One equals MRSA, cinnamon/penicillin combination. Two equals MRSA, cinnamon/clindamycin combination. Three equals MRSA, lavender/clindamycin combination. Four equals A.baumannii, eucalyptus/gentamicin combination.
0
1
2
3
4
5
6
7
8
9
1 2 3 4
0.10% 0.25% 0.50% 1.00%Oil 30 μL 75 μL 150 μL 300 μL
Organism 50 μL 50 μL 50 μL 50 μLTween 150 μL 150 μL 150 μL 150 μL
Saline Removed 230 μL 275 μL 350 μL 500 μLTotal Volume 30 ml 30 ml 30 ml 30 ml
Medical Laboratory Science
Figure 1. Modifications to Microscan™ Saline Bottles.
Modifications to Microscan™ Saline Bottles
Table 1: Modifications
Chart 1: Synergistic Effects of a Four Fold Change or Greater. The numbers represent different bacterial drugs and oil combinations. One equals MRSA, cinnamon/penicillin combination. Two equals MRSA, cinnamon/clindamycin combination. Three equals MRSA, lavender/clindamycin combination. Four equals A.baumannii, eucalyptus/gentamicin combination.
0
1
2
3
4
5
6
7
8
9
1 2 3 4
0.10% 0.25% 0.50% 1.00%Oil 30 μL 75 μL 150 μL 300 μL
Organism 50 μL 50 μL 50 μL 50 μLTween 150 μL 150 μL 150 μL 150 μL
Saline Removed 230 μL 275 μL 350 μL 500 μLTotal Volume 30 ml 30 ml 30 ml 30 ml

72Wilcox et al.
Table 2: Drug Classes
Oil Drug Class Organism Cinnamon Aminoglycoside Enterococcus Cinnamon Penicillin Enterococcus Cinnamon Aminoglycoside MRSA Cinnamon Cephalosporin MRSA Cinnamon Other MRSA Cinnamon Penicillin MRSA Ginger Penicillin MRSA
Lavender Aminoglycoside Acinetobacter Lavender Cephalosporin Acinetobacter Lavender Aminoglycoside Enterococcus Lavender Penicillin Enterococcus
AmikacinAmoxicillin/ K Clav Aminoglycosides GentamicinAmpicillin Tobramycin
Penicillins Ampicillin/SulbactamOxacillinPenicillin Carbapenems Ertapenem
ImipenemCefazolin Merpenem
Cefalosporins CertriaxoneRifampin
AmpicillinAminoglycoside Gentamicin Penicillins Ampicillin/Sulbactam
Piperacillin/tazobactamMacrolid Erythromycin Piperacillin
Monobactam AztreonamCarbapenems Imipenem
Meropenem Fluoroquinolones CiprofloxacinLevofloxacin
DaptomycinLinezolid Sulfonamides Trimethoprim/Sulfa
Other SynercidClindamycin CephalosporinsVancomycin First Generation Cefazolin
Cephalothin
Fluoroquinolones Second Generation CefotetanCiprofloxacin CefoxitinLevofloxacin CefuroximeMoxifloxacin
Third Generation CefotaximeSulfonamides Trimethoprime/Sulfa Cefotaxime/K Clavulanate
CeftazidimeCeftazidime/K ClavulanateCeftriazone
Fourth Generation Cefepime
Other TetracylcineChloramphenicol
Nitrofuran Nitrofurantoin
Gram Negative PanelGram Positive Panel
Lavender Aminoglycoside MRSA Lavender Cephalosporin MRSA Lavender Other MRSA Lavender Penicillin MRSA Lavender Cephalosporin Pseudomonas Eucalyptus Gentamicin Acinetobacter Eucalyptus Cephalosporin Acinetobacter Eucalyptus Penicillin MRSA Eucalyptus Cephalosporin Pseudomonas Oregano Aminoglycoside Enterococcus Oregano Aminoglycoside MRSA
Table 3: Synergistic Effects of a Two Fold Change or Greater
*Carbepenems drug class showed antagonistic effects with all essential oils tested.
Table 3. Synergistic Effects of a Two Fold Change or Greater*Carbepenems drug class showed antagonistic effects with all essential oils tested.

73 Medical Laboratory Science
Table 2: Drug Classes
Oil Drug Class Organism Cinnamon Aminoglycoside Enterococcus Cinnamon Penicillin Enterococcus Cinnamon Aminoglycoside MRSA Cinnamon Cephalosporin MRSA Cinnamon Other MRSA Cinnamon Penicillin MRSA Ginger Penicillin MRSA
Lavender Aminoglycoside Acinetobacter Lavender Cephalosporin Acinetobacter Lavender Aminoglycoside Enterococcus Lavender Penicillin Enterococcus
AmikacinAmoxicillin/ K Clav Aminoglycosides GentamicinAmpicillin Tobramycin
Penicillins Ampicillin/SulbactamOxacillinPenicillin Carbapenems Ertapenem
ImipenemCefazolin Merpenem
Cefalosporins CertriaxoneRifampin
AmpicillinAminoglycoside Gentamicin Penicillins Ampicillin/Sulbactam
Piperacillin/tazobactamMacrolid Erythromycin Piperacillin
Monobactam AztreonamCarbapenems Imipenem
Meropenem Fluoroquinolones CiprofloxacinLevofloxacin
DaptomycinLinezolid Sulfonamides Trimethoprim/Sulfa
Other SynercidClindamycin CephalosporinsVancomycin First Generation Cefazolin
Cephalothin
Fluoroquinolones Second Generation CefotetanCiprofloxacin CefoxitinLevofloxacin CefuroximeMoxifloxacin
Third Generation CefotaximeSulfonamides Trimethoprime/Sulfa Cefotaxime/K Clavulanate
CeftazidimeCeftazidime/K ClavulanateCeftriazone
Fourth Generation Cefepime
Other TetracylcineChloramphenicol
Nitrofuran Nitrofurantoin
Gram Negative PanelGram Positive Panel
Table 2. Drug classes.

74Wilcox et al.
Table 2: Drug Classes
Oil Drug Class Organism Cinnamon Aminoglycoside Enterococcus Cinnamon Penicillin Enterococcus Cinnamon Aminoglycoside MRSA Cinnamon Cephalosporin MRSA Cinnamon Other MRSA Cinnamon Penicillin MRSA Ginger Penicillin MRSA
Lavender Aminoglycoside Acinetobacter Lavender Cephalosporin Acinetobacter Lavender Aminoglycoside Enterococcus Lavender Penicillin Enterococcus
AmikacinAmoxicillin/ K Clav Aminoglycosides GentamicinAmpicillin Tobramycin
Penicillins Ampicillin/SulbactamOxacillinPenicillin Carbapenems Ertapenem
ImipenemCefazolin Merpenem
Cefalosporins CertriaxoneRifampin
AmpicillinAminoglycoside Gentamicin Penicillins Ampicillin/Sulbactam
Piperacillin/tazobactamMacrolid Erythromycin Piperacillin
Monobactam AztreonamCarbapenems Imipenem
Meropenem Fluoroquinolones CiprofloxacinLevofloxacin
DaptomycinLinezolid Sulfonamides Trimethoprim/Sulfa
Other SynercidClindamycin CephalosporinsVancomycin First Generation Cefazolin
Cephalothin
Fluoroquinolones Second Generation CefotetanCiprofloxacin CefoxitinLevofloxacin CefuroximeMoxifloxacin
Third Generation CefotaximeSulfonamides Trimethoprime/Sulfa Cefotaxime/K Clavulanate
CeftazidimeCeftazidime/K ClavulanateCeftriazone
Fourth Generation Cefepime
Other TetracylcineChloramphenicol
Nitrofuran Nitrofurantoin
Gram Negative PanelGram Positive Panel

75

76
Sequencing and Annotation of Novel Plasmids in Lactobacillus Curvatus
Jordan Hendricks
Faculty Mentor: Craig Oberg
Abstract
Lactobacillus curvatus, a non-starter lactic acid bacteria (NSLAB), is rapidly becoming the most prevalent NSLAB found in strains of aged Cheddar cheese. Plasmids often carry genes that confer advantageous traits so we are trying to determine if plasmids supply a survival advantage to Lb. curvatus in cheese. Plasmids were isolated from two different strains of Lb. curvatus, one from Weber State University (WSU-1), and one from a Wisconsin low fat cheese (LFC-1), using several methods. WSU-1 contained 7 plasmids while LFC-1 contained 4 plasmids. Two plasmids from WSU-1 and LFC-1 match in size with another plasmid found in both appearing to be very close in size. Some genetic characteristics found on the plasmids that may have significance are anti-toxins, anti-toxin resistance, and cation transport.
Introduction
Approximately 3 billion pounds of Cheddar cheese is produced in the U.S. each year. Cheddar cheese gets its desirable flavor from both the bacteria used as starter cultures and from bacteria unintentionally introduced during manufacture.

77 Microbiology
Starter bacteria, primarily Lactococcus lactis, ferments lactose, a sugar found in milk, into lactic acid and causes proteolysis, the breakdown of milk proteins, which also contributes to flavor development. Other bacteria called non-starter lactic acid bacteria, are also found in the cheese and become the dominant bacteria as cheese ages. In the last 5 years one NSLAB, Lactobacillus curvatus, has gone from only being detected in small numbers to being the most dominant NSLAB in Cheddar cheese (N. A. Fitzsimons, T. M. (1999)).
Lactobacillus curvatus is now routinely isolated from aged Cheddar cheese throughout the U. S. The goal of our research project is to learn more about this specific NSLAB and what genetic attributes have allowed Lb. curvatus to become the dominant NSLAB. Specifically we wanted to determine if it had plasmids and then analyze their genes. Plasmids, small circular DNA molecules similar to mini-genomes, are non-essential to Lb. curvatus’ overall survival but could carry genes that provide Lb. curvatus with a competitive advantage in the aging cheese environment. Based on previous preliminary genome annotations for Lb. curvatus, genes for bacteriocin (antibiotic) production, or unusual substrate utilization may be on these plasmids.
Researchers from Weber State University and Utah State University recently sequenced the genomes of two strains of the Lb. curvatus. Preliminary data indicated each strain might contain at least two large plasmids. Previous to this study, individual plasmids for each strain have not been isolated or analyzed. In addition, Lb. curvatus plasmids have not been characterized, sequenced, or annotated. This project provides a unique opportunity to characterize these plasmids then determine if genome sequence data can be correlated to

78Hendricks
individual plasmids. Understanding the genotype of these plasmids could provide us with important information concerning genes that allow Lb. curvatus an advantage in the cheese environment. In addition, it could provide some insight into how these Lb. curvatus strains might affect the cheese flavor, an important characteristic that could be significant to cheese companies which rely on consistent cheese production and reproducible flavor development profiles.
Methods
Plasmid Isolation
Several plasmid isolation methods (B. Alberts, A. J. (2002)) (Trevors, J. T. (1984)) were used along with agarose gel electrophoresis and ethidium bromide staining techniques to determine the number of plasmids in each strain. Two strains of Lactobacillus curvatus were studied, WSU-1, a strain isolated at Weber State University, and LFC-1, a strain isolated from a low fat cheese at the University of Wisconsin cheese plant. Cultures were maintained in MRS (de Man, Rogosa and Sharpe) broth tubes and checked for purity on MRS agar plates. Initially, a plasmid isolation kit was used (GenElute Plasmid Miniprep Kit, Sigma-Aldrich) with mixed results. The Anderson Lysis method was then used and was more effective, producing observable plasmid bands using agarose gel electrophoresis gel (Anderson). Plasmid size determinations were made using a semi log graph and using a gene ruler (Thermo Scientific GeneRuler 1kb DNA Ladder).
Cesium Chloride Density Gradient Plasmid Purification
In order to eliminate genomic DNA in the plasmid isolation, a cesium chloride density gradient was used which removed

79 Microbiology
nicked and linear plasmids, as well as contaminating genomic DNA. This protocol leaves only the intact plasmids (CCC form) to provide clearer electrophoresis gel images (Oberg, C. Cesium-chloride).
Sequence Analysis
To analyze the complete genome of the two Lb. curvatus strains for possible contigs (sections of DNA based on the computers’ ability to separate different sequences) derived from plasmid DNA, several software programs were used. The genome was filtered to find the plasmid genes and then found specific proteins and qualities that the plasmids possessed. The complete genome sequence had already been determined and tentatively assembled. Using the NCBI (National Center for Biotechnology Information (2014)) database and RAST (Rapid Annotations using Subsystems Technology) (Aziz RK, B. D. (2008)), individual Lb. curvatus contigs from both strains were put into a BLAST (National Center for Biotechnology Information (2014)) search to look for similar sequences in other LAB plasmids. When a contig was found to match a LAB plasmid, that plasmid sequence was then compared to all the Lb. curvatus contigs to determine which other contigs might be derived from plasmids instead of genomic DNA. Once these Lb. curvatus contigs were identified, they were compared to the size of the specific plasmids in each strain and their annotated proteins were examined. When specific proteins were identified on the plasmid derived-contigs their possible functionality was examined.

80Hendricks
Results
Plasmid Isolation
Initially, a commercial plasmid isolation kit was used, but Lb. curvatus plasmid DNA was difficult to detect by agarose gel electrophoresis so a more laborious method was then used. The Anderson Lysis (Anderson) method was employed through the remainder of the project because it produced better observable plasmid DNA bands during the agarose gel separation. Since some bands may have been hidden by contaminating genomic DNA and there were two bands that appeared very close in size to each other on the gel, cesium chloride density gradient centrifugation was used to remove both nicked and linear plasmids, and genomic DNA fragments to reduce the shadow bands. This method resulted in the isolation of only intact plasmid DNA (CCC form) producing clearer electrophoresis gel images.
Electrophoresis gel results showed 7 plasmids in Lb. curvatus WSU-1 and 4 plasmids in Lb. curvatus LFC-1 with their approximate sizes shown in Table 1. Figure one shows the electrophoresis gel that was produced from using the cesium chloride density gradient method. Well A contains the plasmids for Lb. curvatus WSU-1, while well B contains plasmids for Lb. curvatus LFC-1. Similarities, at least in size, of plasmids exist between the largest plasmids in both Lb. curvatus strains as well as in the smallest plasmids of WSU-1 and LFC-1. Plasmids were matched with contigs based upon the sizes and the specific characteristics of the contigs that contain plasmid specific genes like plasmid open reading frames. These plasmids could contain the genes responsible for Lb. curvatus’ success as a NSLAB. To identify unique genes on any of the plasmids RAST and NCBI, online search software, were used to analyze the sequences.

81 Microbiology
Table 1 shows the different plasmid sizes by approximation determined by a semi logarithmic graph based on the known values of the gene ruler. WSU-1 showed plasmid sizes of about 40, 26, 22, 7, 2.2, 2, and 1.25 kilo base pairs. LFC-1 showed plasmid sizes of about 46, 37, 2, and 1.25 kilo base pairs. The plasmids are varied in size and the larger plasmids are quite large in respect to most plasmids. Table 2 shows the contigs that were found to have plasmid type characteristics. They were matched roughly upon size expecting a degree of error.
Conclusion and DiscussionFor the 2 strains of Lb. curvatus that were studied it was determined that WSU-1 and LFC-1 did contain similar genes that are believed to be from plasmids. The sizes of the plasmids now have confident estimates with good indications to some of the contigs that may correlate. The more difficult task will be to try to piece these contigs with sizes that don’t match up. These plasmids could have become fragmented in the sequencing process. Most interesting in the discovery of the contigs with plasmid characteristics was of a pair of contigs, each from a separate strain that contained very similar genes that coded for an anti-toxin part of a toxin-antitoxin system and a cation transport (L. K. Ozimek, G. E. (2004)). It may still be unclear on how exactly these bacteria are affecting the consistent cheese quality or the reproducibility of the flavor profiles.
AcknowledgmentsI would like to thank my mentor Dr. Oberg for his great guidance and patience. I would also like to thank the Microbiology Department for allowing me to use the equipment and supplies for this project. I also thank Dr. Culumber and Dr. Taylor Oberg for their advice and instructions.

82Hendricks
ReferencesAnderson. (n.d.). Anderson Lysis Procedure. Protocol.
Anderson, D. a. (1983). Isolation of plasmid DNA from Gram-positive bacteria (Lactococcus lactis). Appl. Environ Micro.
Aziz RK, B. D. (2008). Rapid Annotations using Subsystems Technology. Retrieved from RAST (Rapid Annotations using Subsystems Technology): www.rast.nmpdr.org/rast.cgi
B. Alberts, A. J. (2002). Isolating, Cloning, and Sequencing DNA. New York: Garland Science.
Broadbent J. R., B. C. (2013). Microbiology of Cheddar cheese made with different fat contents using a Lactococcus lactis single-strain starter. Pub Med, 4212-4222.
National Center for Biotechnology Information (2014). blast.ncbi.nlm.nig.gov. Retrieved from Basic Local Alignment Search Tool: www.blast.ncbi.nlm.gov
L. K. Ozimek, G. E. (2004). Mutational analysis of the role of calcium ions in the Lactobacillus reuteri strain 121 fructosyltransferase (levansucrase and inulosucrase) enzymes. Haren: Elsevier B.V.
M. De Angelis, A. C. (2001). Characterization of Non-Starter Lactic Acid Bacteria from Italian Ewe Cheeses Based on Phenotypic, Genotypic, and Cell Wall Protein Analyses. Applied Environmental Microbiology, 2011-2020.
Muriana, K. G. (1994). Purification and partial amino acid sequence of curvaticin FS47, a heat-stable bacteriocin produced by Lactobacillus curvatus FS47. Applied Environmental Microbiology, 2191-2195.
N. A. Fitzsimons, T. M. (1999). Phenotypic and Genotypic Characterization of Non-Starter Lactic Acid Bacteria in Mature Cheddar Cheese. Applied Environmental Microbiology, 3418-3426.
NASS, U. (2007, April 27). United States Department of Agriculture. Retrieved March 30, 2014, from http://www.nass.usda.gov/Charts_and_Maps/Dairy_Products/cheese.asp.
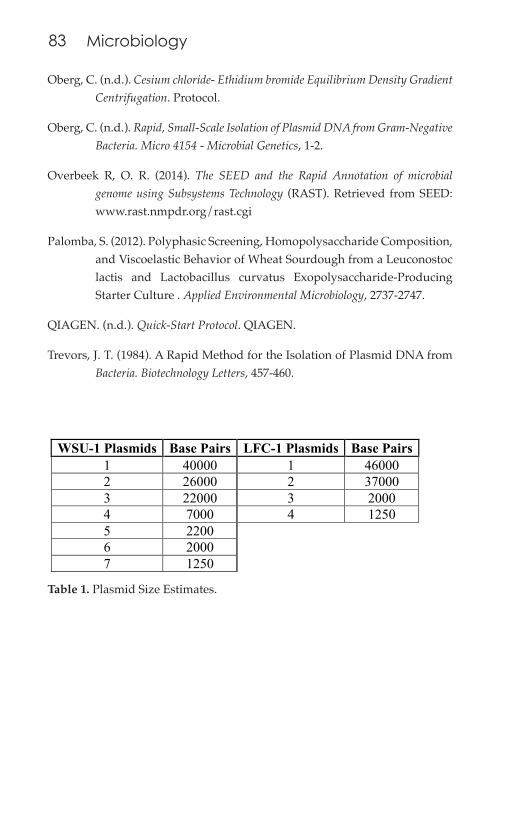
83
Oberg, C. (n.d.). Cesium chloride- Ethidium bromide Equilibrium Density Gradient Centrifugation. Protocol.
Oberg, C. (n.d.). Rapid, Small-Scale Isolation of Plasmid DNA from Gram-Negative Bacteria. Micro 4154 - Microbial Genetics, 1-2.
Overbeek R, O. R. (2014). The SEED and the Rapid Annotation of microbial genome using Subsystems Technology (RAST). Retrieved from SEED: www.rast.nmpdr.org/rast.cgi
Palomba, S. (2012). Polyphasic Screening, Homopolysaccharide Composition, and Viscoelastic Behavior of Wheat Sourdough from a Leuconostoc lactis and Lactobacillus curvatus Exopolysaccharide-Producing Starter Culture . Applied Environmental Microbiology, 2737-2747.
QIAGEN. (n.d.). Quick-Start Protocol. QIAGEN.
Trevors, J. T. (1984). A Rapid Method for the Isolation of Plasmid DNA from Bacteria. Biotechnology Letters, 457-460.
Table 1. Plasmid Size Estimates.
Microbiology
Characteristics WSU-1 Contigs WSU-1 Plasmids Immunoreactive
Protein, 10 (45239 bp) 1 (40000 bp)
Anti-toxin, Putative Replication Initiation
Protein, Cation Transporting ATPase
36 (15,667 bp) 2 (26000 bp)
Maltose O-Acetyl Transferase, Transcription
Regulator
65 (9036 bp) 3 (22000 bp)
Undetermined 4 (7000 bp) Electron Transfer Ubiquinone, DNA Damage Inducible
106 (2,588 bp) 5 (2200 bp)
Replication Associated Protein
109 (1874 bp) 6 (2000 bp)
Transposase 120 or 121 (1146-1073 bp)
7 (1250 bp)
Characteristics LFC-1 Contigs LFC-1 Plasmids Undetermined 1 (46000 bp)
Chromosome Plasmid Partitioning Protein
20 (17489 bp) 2 (37000 bp)
Anti-toxin, Cation Transport
63 (8678 bp) Undetermined
Chromosome Plasmid Partitioning Protein, Replication Initiation
Protein
133 ( 4777bp) 3 (2000 bp)
Lac X Protein Plasmid 261 (1315 bp) 4 (1250 bp) Plasmid Replication
Initiation Protein 287 (831 bp) Undetermined
WSU-1 Plasmids Base Pairs LFC-1 Plasmids Base Pairs 1 40000 1 46000 2 26000 2 37000 3 22000 3 2000 4 7000 4 1250 5 2200 6 2000 7 1250

84
Characteristics WSU-1 Contigs WSU-1 Plasmids Immunoreactive
Protein, 10 (45239 bp) 1 (40000 bp)
Anti-toxin, Putative Replication Initiation
Protein, Cation Transporting ATPase
36 (15,667 bp) 2 (26000 bp)
Maltose O-Acetyl Transferase, Transcription
Regulator
65 (9036 bp) 3 (22000 bp)
Undetermined 4 (7000 bp) Electron Transfer Ubiquinone, DNA Damage Inducible
106 (2,588 bp) 5 (2200 bp)
Replication Associated Protein
109 (1874 bp) 6 (2000 bp)
Transposase 120 or 121 (1146-1073 bp)
7 (1250 bp)
Characteristics LFC-1 Contigs LFC-1 Plasmids Undetermined 1 (46000 bp)
Chromosome Plasmid Partitioning Protein
20 (17489 bp) 2 (37000 bp)
Anti-toxin, Cation Transport
63 (8678 bp) Undetermined
Chromosome Plasmid Partitioning Protein, Replication Initiation
Protein
133 ( 4777bp) 3 (2000 bp)
Lac X Protein Plasmid 261 (1315 bp) 4 (1250 bp) Plasmid Replication
Initiation Protein 287 (831 bp) Undetermined
WSU-1 Plasmids Base Pairs LFC-1 Plasmids Base Pairs 1 40000 1 46000 2 26000 2 37000 3 22000 3 2000 4 7000 4 1250 5 2200 6 2000 7 1250
Hendricks
Table 2. Contigs Characteristics with Possible Plasmids Sizes in Base Pair Units.

85
Microbiology
Figure 1. An electrophoresis gel containing the plasmids from WSU-1 in well A, and LFC-1 in well B. Well C contains a DNA ladder (gene ruler) with the band sizes of 20, 10, 7, 5, 4, 3, 2, 1.5, 1, 0.7, 0.5 kilobase pairs. Well D is another DNA ladder from HIND III.

86
Isolation of Lactobacillus Wasatchii from Aged Cheddar Cheese
Lauren Montierth
Faculty Mentors: Craig Oberg & Michele Culumber
Abstract
A relatively new species of a non-starter lactic acid bacteria (NSLAB), called Lactobacillus wasatchii, has been identified in northern Utah. This bacteria has been linked to gas formation in the latter stages of cheddar cheese ripening. This gas formation causes swelling of packaging and splitting of the cheese making it unfit for consumer use. By testing various cheddar cheeses for the presence of this organism, the prevalence of this organism can be determined. Fourteen different cheddar cheeses from around the world were tested using a selective media and incubation protocol for this organism and NSLAB bacteria from each cheese were isolated. Results show that Lb. wasatchii was not detected indicating that it may only be prevalent in northern Utah.
Introduction
To produce cheese, starter lactic acid bacteria (SLAB) are intentionally added to milk, converting milk’s lactose sugar to lactic acid. This conversion reduces the pH of the milk assisting in protein coagulation and body and flavor development. During the ripening stage of cheese, non-starter lactic acid bacteria (NSLAB) begin to accumulate and after several months dominate the cheese flora. Non-starter lactic acid bacteria are

87 Microbiology
present in the cheese due to contamination from the processing equipment or production environment (Peterson and Marshall, 1990), and are initially found in low numbers. NSLABs are a major contributor to the overall taste and texture of the cheese following ripening. During cheese ripening, the environment of the cheese changes and becomes harsher. The pH will decrease from ~6 to 5.0-5.3, the salt concentration increases due to the loss of water, and there is no lactose left. The NSLAB are typically oligotrophic and able to adapt to the changing environment of the cheese better than the SLAB. NSLABs will start to accumulate to cell densities of 107 to 108 CFU/g after 3 to 9 months of ripening (Peterson and Marshall 1990). The prevalence and type of NSLABs can be hard to monitor and control, and as such can cause undesirable defects in the cheese. Particular species of NSLAB that cause undesirable changes in flavor and texture in cheddar cheese are obligate heterofermentative (OHF) lactobacilli. These species are less common to find than other types of NSLABs in cheddar cheese, which are primarily mesophilic facultative heterofermentative lactobacilli (Jordan and Cogan, 1993; Crow et al., 2001). However, it is the OHF lactobacilli that have been associated with the undesirable flavors and textures, and even gas production in cheese.
One such OHF Lactobacillus species that has been suspected to cause an undesirable defect in cheddar cheese is the newly discovered NSLAB, Lb. wasatchii, which was isolated from a sample of blown cheddar cheese (Oberg et al. 2014). After a long aging step, gas production in the cheese packaging accumulated to cause the cheddar cheese to appear blown from the inside. This bacteria was the suspected causative agent of the late gas production.

88Montierth
Lb. wasatchii has been identified as a Gram-positive, rod-shaped, non-spore forming Lactobacillus species. The colonies Lb. wasatchii forms on MRS agar, which appear after a long period of incubation, are punctiform to small in size and white in color. This species has been known to readily utilize ribose (Oberg et al. 2014) so media supplemented with ribose was used to attempt to isolate this species.
Presence of this organism in cheddar cheese could mean the possibility of the cheese becoming blown or split during the latter stages of aging. This would make the cheese unfit for consumers and could potentially cause a major problem in the manufacturing of cheddar cheese. The goal of this research is to determine the types of the non-starter lactic acid bacteria, Lb. wasatchii, in cheddar cheeses from the United States, New Zealand, Australia and Ireland. Samples are taken from cheeses that did not show any sign of blowing to determine if the bacteria is present in cheeses exhibiting normal behavior.
Methods
Isolation Method for Lb. wasatchii
Cheddar cheeses from Utah, Vermont, Wisconsin, New Zealand, Australia and Ireland were collected to test for presence of Lb. wasatchii. These cheeses showed no indication of late gas production. Cheese samples were cut into 11 gram pieces and each placed in a stomacher bag with 99 mL of sterile 2% sodium citrate. The bags were placed in the stomacher machine and ran at 230 rpm for 3 minutes. A dilution series was then made from the subsequent mixture and spread plates were done to give 102 through 106 dilutions. Each dilution was plated on MRS agar supplemented with 1.5% ribose and on MRS agar

89
supplemented with 1.5% ribose and vancomycin (2 μg/mL of agar); SLAB are susceptible to vancomycin whereas NSLABs are not. Inoculated plates then went into gas pack jars and incubated anaerobically at room temperature.
Rapidly developing colonies were marked after 2 days of anaerobic growth to differentiate from the slow growing NSLABs. Another gas pack was inserted and the plates were left to incubate at room temperature for another 5 days. Colonies after this time period were then marked as slow-growing NSLABs and propagated in MRS broth supplemented with 1.5% ribose. Colonies of interest that matched the appearance of Lb. wasatchii colonies were punctiform to small (0.05-1mm in diameter) and white in color with a circular shape, entire margin, and smooth texture. To find extremely slow-growing NSLABs, plates were left in a room temperature environment for up to 4 weeks, and new isolates, if any, were propagated in MRS broth supplemented with 1.5% ribose.
DNA Extraction and 16S rRNA Identification
Genomic DNA was extracted using MoBio Ultra Clean Microbial DNA extraction kit for each of the isolates. Following DNA extraction, 16S rRNA gene was amplified by PCR, using 27F and 1429R primers. Samples were sent to the Idaho State Molecular Research Core Facility in Pocatello, Idaho to be sequenced. These sequences were analyzed by the Ribosomal Database Project and NCBI BLAST to determine genus and species of bacteria, and compared to the known Lb. wasatchii 16S rRNA sequence to see if the DNA from the isolates matched this DNA.
Microbiology

90
ResultsEighty-three isolates that fit the growth and colony profile for Lb. wasatchii were collected from 15 different cheddar cheeses produced in four different countries. None of the isolates appeared as colonies on the selective media until after at least 2 days with the majority appearing as small colonies after at least 5 days of incubation.
Though some bacterial isolates were duplicates, all 83 isolates were matched against the known Lb. wasatchii sequence to determine similarities (Table 1). None of the isolates matched the sequence for Lb. wasatchii with more than a 93% similarity. Isolates were closely related to common SLAB and NSLABs, including Lb. paracasei, Lb. curvatus, and Lb. casei.
ConclusionLb. wasatchii was not found among the 83 isolates from the 15 cheese samples. There are several reasons Lb. wasatchii was not found in these cheese samples. Lb. wasatchii was previously identified only in cheese samples with gas defects. The cheeses sampled here were all normal, with no gas defects. If Lb. wasatchii is a causative agent of gas defects, it might not be present in normal cheese. Even in gassy cheese, Lb. wasatchii has only been found at low cell densities (Oberg et al. 2014). We simply may not have sampled enough colonies to find Lb. wasatchii, particularly if it is at concentrations two logs or more under the sampled plates. If that is the case, other molecular techniques will be needed to find Lb. wasatchii in cheese. Finally, this organism was first isolated in Northern Utah, and may be specific to this region. Future studies will focus on more local and regional cheeses that exhibit late gas formation. We will also attempt using culture-independent
Montierth
91
methods to increase sampling efficiency and increase the likelihood of finding Lb. wasatchii.
We did observe that similar species of lactobacilli are found in cheeses from around the world. This indicates that the environment of the aged cheddar cheese is similar enough to support a common cohort of microorganisms. Lb. wasatchii has some unique biochemical pathways, including the ability to use ribose as a substrate in heterofermentative metabolism (Oberg et al. 2014). It may be so specialized to the environment of aged cheddar cheese that it may not be easily distributed. Other lactic acid bacteria are probably more common in the milk and, thus, are more likely to survive in aged cheddar cheese.
References
Crow, V. L., B. Curry, & Hayes, M. (2001) The ecology of nonstarter lactic acid bacteria (NSLAB) and their use as adjuncts in New Zealand Cheddar. Int. Dairy J. 11, 275-283.
Jordan, K. N. & Cogan, T. M. (1993) Identification and growth of non-starter lactic acid bacteria in Irish Cheddar Cheese. Irish J. Agric. Food Res. 32, 47-55).
National Center for Biotechnology Information (2014). Blast.ncbi.nlm.nig.gov. Retrieved from basic local alignment search tool: www.blast.ncbi.nlm.gov.
Oberg, C. J., T. S. Oberg, M. D. Culumber, F. Ortakci, J. R. Broadbent, and D. J. McMahon. 2014. Lactobacillus wasatchii sp. Nov., a non-starter lactic acid bacteria isolated from aged Cheddar cheese. Int J Syst Evol Microbiol. (submitted).
Peterson, S. D. & Marshall, R. T. (1990) Nonstarter lactobacilli in Cheddar cheese: a review. J. Dairy Sci., 73, 1395-1410.
Ribosomal Database Project (2014). http://rdp.cme.msu.edu/index.jsp. Retrieved from Seqmatch: rdp.cme.msu.edu/seqmatch/seqmatch_intro.jsp.
Microbiology

92
Table 1. Cheese samples and the isolates that matched parameters as potential Lb. wasatchii isolates (duplicate isolates for each cheese are not listed) based on their growth pattern and colony morphology.
Montierth
Cheese Sample Isolates from 1.5% ribose MRS
Isolates from 1.5% ribose MRS w/ vancomycin
Devondale Aussie Farmer Co-op (Australia)
Lactobacillus paracasei Lactobacillus curvatus Lactobacillus casei
Lactobacillus paracasei
Coon Tasty (Australia) Lactococcus lactis Lactobacillus paracasei Kerrygold Blarney Castle, (Ireland)
Lactobacillus casei Lactobacillus paracasei
Kerrygold Reserve Cheddar (Ireland)
Lactobacillus curvatus Lactobacillus graminis
Lactobacillus rhamnosus
Sargento Tastings (New Zealand)
Lactobacillus rhamnosus Lactobacillus rhamnosus
Cache Valley Natural Extra Sharp Cheddar (USA)
Lactobacillus paracasei Lactobacillus casei
Lactobacillus paracasei
Sharp Cracker Barrel (USA)
Lactobacillus curvatus Lactobacillus graminis
Lactobacillus curvatus
Cache Valley Natural Sharp Cheddar (USA)
Lactococcus lactis Lactobacillus curvatus
Great Ocean Road, (Australia)
Lactococcus lactis Lactobacillus paracasei Lactobacillus casei
Lactobacillus paracasei
Sargento Tastings Aged Wisconsin Cheddar (USA)
Lactococcus lactis Lactobacillus curvatus Lactococcus lactis
Cracker Barrel Vintage Cheddar Extra Sharp, (Australia)
Lactobacillus paracasei Lactobacillus paracasei Lactobacillus casei
Kroger All Natural Cheese Sharp Cheddar (USA)
Lactococcus lactis
Organic Valley Family of Farms Organic Raw Sharp Cheddar (USA)
Lactobacillus curvatus Lactobacillus paracasei
Lactobacillus curvatus
Sargento Tastings Aged Vermont White Cheddar (USA)
Lactobacillus curvatus Lactobacillus curvatus

93
Isolation and Preliminary Antibiotic Production Screening of Soil-Isolated Actinomycete Colonies on Actinomycete and Nutrient Agar
Tanoya Poulsen
Faculty Mentor: Michelle Culumber
Abstract
Actinomycetes are important bacteria that could be a source of new antibiotics to use in medicine and agriculture. They are most commonly found in the soil, although they can be found in freshwater and on plants. The aim of this experiment was to isolate Actinomycete colonies from Utah soils and screen them for possible antibiotic production against gram-positive, Staphylococcus aureus, and gram-negative, Escherichia coli. Several Actinomycete-like colonies were isolated and showed antibiotic activity against the test bacteria. For some colonies, antibiotic activity changed when the colonies were grown on low nutrient media. Antibiotic activity improved on the lower nutrient media. This is probably due to the fact that fewer nutrients mean more competition with other bacteria so the Actinomycete creates antibiotic compounds to kill off the competition. Thus, changing the type of medium could improve the detection of novel antibiotic compounds. The results obtained from this experiment are preliminary and open queries into possible lines of research into these remarkable bacteria.

94Poulsen
IntroductionActinomycetes are a diverse group of gram-positive, aerobic, mesophilic, chemo-organotrophs found in soil (El-Tarabily and Sivasithamparam). They have a branched and filamentous growth pattern and many produce fungi-like spores (Enclyopedia Britannica). Actinomycetes, especially those of the genus Streptomyces, produce antibiotics and geosmin, the characteristic “dirt” smell of soil (Meganathan). Many have been found to be important plant growth promoters and biocontrol agents for fungal plant pathogens (El-Tarabily and Sivasithamparam). The first goal of this experiment was to collect soil samples from various locations and isolate Actinomycetes on two different agars, comparing the colony morphologies on each of the two agars.
Nearly two-thirds of antibiotics have been isolated from Actinomycetes (Pandey, Imran and Butola). Most come from the genera Streptomyces and Micromonospora. Actinomycetes are routinely screened for these bioactive compounds that can be useful in fighting against human, plant, and animal diseases (Nanjwade, Chandrashekhara and Gondavavarj). Antibiotics are used in developing tissue culture techniques, in pharmacology for developing medicines against other bacteria, and in agricultural against plant and fungal pathogens (Nanjwade et. al., 2010). Given different nutrients, the Actinomycetes, like some plants, may produce different antibiotics and change their morphology giving them an advantage over other bacteria. The second goal of this experiment was to evaluate the production of antibiotics against gram-negative (Escherichia coli) and gram-positive (Staphylococcus aureus) bacteria on media with different concentrations of nutrients.
95 Microbiology
Methods
Soil Samples
Soil samples were obtained from six different locations in Utah. Three locations were in Logan, UT and three locations were in Layton, UT. The six locations were: from Fir roots in Green Canyon, Logan, UT (R); a dry riverbed in Green Canyon, Logan, UT (B); a pond in King Nature Park, Logan, UT (P); an apple and peach orchard in Layton, UT (O); a vegetable garden in Layton, UT (V); and a bag of Moisture Mix potting soil in Layton, UT (M). Samples were diluted and were plated initially on Actinomycete agar.
Media
Three different agars were used to isolate the Actinomycetes. Actinomycete Agar (AA) contains, per L: 15.0 g agar, 4.0 g sodium propionate, 2.0 g sodium caseinate, 0.5 g K2HPO4, 0.1 g Asparagine, 0.1 g MgSO47H2O, 1.0 mg FeSO47H2O, and 5.0 g glycerol (Atlas). Nutrient Agar (NA) contains, per L: 5.0 g pancreatic digest of gelatin, 3.0 g beef extract , 15.0 g of agar (Hardy Diagnostics). Diluted, 1/10, Nutrient Agar (1/10 NA) contains, per L: 0.8 g nutrient broth (pancreatic digest of gelatin and beef extract), and 15.0 g of agar (Hardy Diagnostics).
Actinomycete Growth Conditions
Colonies were grown aerobically at 30°C for 2-3 days. When growth was observed they were moved to 4°C and stored for up to 2 weeks. Actinomycete-like colonies were identified based on appearance. Actinomycetes generally appear dull or powdery, may have a filamentous appearance, and are generally tough when picked from the plate. Suspected Actinomycete cultures were quantified on the dilution plates and transferred to either AA or NA, for isolation and storage.

96Poulsen
Other Organisms
E. coli and S. aureus were used as representative gram-negative and gram-positive organisms to test the isolated Actinomycetes for the production of antibiotic compounds. They were grown on NA.
Antibiotic Test
To test for antibiotic production, a horizontal streak of the Actinomycete being tested was plated on AA or NA along with vertical streaks of E. coli and S. aureus touching the Actinomycete (Figure 1). Antibiotic production was positive if there was a clearing between the Actinomycete streak and the streaks of the other bacteria.
ResultsThe Actinomycete-like colonies grew very slowly. Based on the literature and previous experience, the soil dilutions were incubated at 30°C (El-Tarabily and Sivasithamparam), however, at this temperature other bacteria and fungi grew faster than the Actinomycetes. The plates were transferred to 4°C to slow the growth of the competing bacteria and fungi. The Actinomycetes grew better at this temperature and colonies were characterized and enumerated. Colony characteristics were described after 2 weeks of growth at 4°C. There was a pervasive brown fungus or mold that took over the plates after 2 weeks. Colonies were periodically transferred to new media in an effort to try to isolate the colonies away from the mold.
Suspected Actinomycetes were select based on colony morphology. Actinomycetes colonies are usually tough, dry or powdery in appearance, and have filamentous growth. No Actinomycete colonies were isolated from soil samples O, V,

97 Microbiology
and P. Colonies from B, R, and M produced Actinomycete-like colonies summarized in Table 1. The soils had between 2.7x10⁴ Actinomycete-like cfu/g, in the potting soil, to 1.4x10⁶ cfu/g in the dry riverbed. Actinomycete-like colonies with unique appearance were selected for further isolation and study. Colonies with designations of 1a, 1b, etc. are different colonies that were taken from the same plate (e.g. B 10-2) (Table 2). The colony morphology and gram-stain reactions were recorded for each of the cultures on the different media. Interestingly, neither the colony morphology nor gram-stain reaction was always consistent across the different media.
There were two kinds of positive results for the antibiotic test. The first was a true clearing between the Actinomycete and the other bacteria. The second was a complete takeover of S. aureus and/or E. coli by the Actinomycete isolate. A complete takeover was characterized by the Actinomycete colony growing on top of either the S. aureus and/or E. coli bacteria with no halo of clearing. Most plates showed this complete takeover rather than a definite clearing.
In the collection of Actinomycete cultures tested, several produced antibiotics against one or more of the test organisms. Table 3 summarizes the data from the antibiotic test. Curiously, some of the Actinomycetes changed the bacteria yellow. Other times the Actinomycete culture overgrew on the plate (Figure 1). Only one culture (1B) showed no antimicrobial activity in this assay. Four cultures showed different activity based on the type of media used. These four cultures (in the shaded boxes in Table 3) changed there antibiotic activity on different media. Colony 2a B when tested for antibiotics on AA didn’t produce antibiotics against E. coli, however, when tested for antibiotic on NA it began to produce antibiotics against E. coli. Colony 2c B switched the

98Poulsen
bacteria it produced antibiotics against on the different agars. Colony B did the same as Colony 2c B. Colony 2 R did the same as Colony 2a B only with S. aureus instead of E. coli.
DiscussionThe colonies seemed to grow best on the nutrient agars (1/10 NA and NA). The AA didn’t seem to be selective enough for just Actinomycetes and faster growing bacteria and fungi would take over the plates before the Actinomycetes could grow. However, the total number of Actinomycete-like colonies was high on both types of agar, and a collection of diverse colonies was isolated. Actinomycetes could not be isolated from soils O, V, or P because of the overgrowth of contaminating fungi. Future experiments could include an anti-fungal compound in the medium; however, this could also inhibit Actinomycete growth because they have fungi-like growth structures such as hyphae.
There was no clear trend in antibiotic production between the two media (Table 3). However, some cultures did have different antibiotic activity on the different media (shaded cultures in Table 3). It might be that the different nutrients in the agar influence if an antibiotic is produced or the type of antibiotic produced. This could be because nutrients in the media change the chemical metabolites produced by the culture. For example, nutrient broth is a complex medium because it contains many nutrients that aren’t fully characterized; one or more of these nutrients could be what the Actinomycete needs in order to produce antibiotics. Antibiotic production could also be caused by competition for nutrients present in the medium. The fewer nutrients available for growth could cause competition for resources and the Actinomycetes could be producing antibiotics to give them an advantage over other bacteria.

99 Microbiology
Further experimentation could be done on other agars and against different gram-negative and gram-positive bacteria. Some of the antibiotic-positive cultures actually took over the test strains on the plate (Figure 1). This is an atypical result for an antibiotic assay, where we expect to find zones of clearing. It was also not general swarming behavior expected if the organism was just growing on the medium. Instead, it appears that the isolate was either growing along the S. aureus and E. coli streaks or on top of them. It could be that these organisms are not actually Actinomycetes, but perhaps a predatory bacterium. DNA analysis and microscopy should be done to identify the isolates. Although not what I was looking for in this study, these cultures would be interesting to study further.
In this study I isolated several soil bacteria and demonstrated their antibiotic-producing activities against S. aureus and E. coli on different media. Using different types of media could be an important strategy for identifying antibiotic-producing organisms. Cultures may or may not produce antibiotics, or the same, antibiotics under different nutrient conditions, so studies that use only one type of medium may be missing the metabolic diversity of the cultures.
ReferencesAtlas, Ronald M. Handbook of Microbiological Media. Boca Raton: CRC Press, 2000.
El-Tarabily, Khaled A. and Krishnapillai Sivasithamparam. Non-streptomycete actinomycetes as biocontrol angents of soil-borne fungal plant pathogens and as plant growth promoters. Soil Biology and Biochemistry (2006): 1505-1520.

100Poulsen
Enclyopedia Britannica. Actinomycete. 15 October 2014. <http://www.britannica.com/EBchecked/topic/4401/actinomycete>.
Meganathan, R. What Causes the Characteristic Smell of Soil? 15 October 2014.<http://www.bios.niu.edu/meganathan/smell_of_soil.shtml>.
Nanjwade, Basavaraj K., et al. Production of antibiotics from soil-isolated actinomycetes and evaluation of their antimicrobial activities. Tropical Journal of Pharmaceutical Research (2010): 373-377.
Pandey, Amit, et al. Isolation and characterization of actinomycetes from soil and evaluation of antibacterial activities of actinomycetes Against Pathogens. International Journal of Applied Biology and Pharmaceutical Technology (2011): 384-388.
1
Figures and Tables:
Figure 1. Example of how the Antibiotic Test was run. The E. coli and S. aureus strains (vertical lines) needed to touch the Actinomycete (horizontal line) so that the zone of inhibition from the antibiotic produced by the Actinomycete could be seen. However, some of the antinomycete-like colonies took over the entire colony rather than just produce antibiotic against it. Table 1. Actinomycete Enumeration on AA Sample Location Actinomycete Concentration (per gram of soil)
R Logan, UT 8.0 x 10⁵ cfu/g B Logan, UT 1.4 x 10⁶ cfu/g M Layton, UT 2.7x10⁴ cfu/g
Figure 1. Example of how the Antibiotic Test was run. The E. coli and S. aureus strains (vertical lines) needed to touch the Actinomycete (horizontal line) so that the zone of inhibition from the antibiotic produced by the Actinomycete could be seen. However, some of the Actinomycete-like colonies took over the entire colony rather than just produce antibiotic against it.

101
1
Figures and Tables:
Figure 1. Example of how the Antibiotic Test was run. The E. coli and S. aureus strains (vertical lines) needed to touch the Actinomycete (horizontal line) so that the zone of inhibition from the antibiotic produced by the Actinomycete could be seen. However, some of the antinomycete-like colonies took over the entire colony rather than just produce antibiotic against it. Table 1. Actinomycete Enumeration on AA Sample Location Actinomycete Concentration (per gram of soil)
R Logan, UT 8.0 x 10⁵ cfu/g B Logan, UT 1.4 x 10⁶ cfu/g M Layton, UT 2.7x10⁴ cfu/g
1
Table 2. Colony Morphology on AA, NA, 1/10 NA*
Isolate Dilution Morphology on AA Morphology on NA Morphology on 1/10 NA *
1a B 10-2 Bumpy, transparent (color of media), flat
Flat, shiny, transparent N/A
1b B 10-2 Dusty, brownish, white, raised, round
NG N/A
2a B 10-2 Shiny, flat, cream to yellow
Tan, shiny, flat N/A
2b B 10-2 Yellow, white edges, shiny, flat
Tan, flat, dull N/A
2c B 10-2 Yellow, shiny white edges, flat
Flat, transparent, dull N/A
B 10-2 Shiny, white, flat, raised edges
Shiny, white, flat Gray, shiny, fanned growth pattern
1 B 10-3 Tan, flat, dry, white edges Flat, dull, cream N/A
2 B 10-3 Shiny, tan, flat Tan, dull, flat N/A B 10-3 Yellow with white edges,
dull Flat, white, dull Brownish gray,
ringed 1 R 10-1 Gray, flat, dry White, flat, dry Gray,
filamentous, raised, dry
2 R 10-1 Dusty, dry, brown Shiny, cream, translucent
N/A
1 R 10-3 Flat, dull, cream Shiny, light brown, slimy
Gray with white edges, dry, flat
2 R 10-3 Bumpy, flat, transparent with white edges
Flat, dull, cream N/A
1 M 10-1 Shiny, cream, round NG N/A 2 M 10-1 Brown, bumpy, dull, flat White, dry, flat N/A M 10-1 Dull, white, flat Dull, white, flat, Dull, white, flat NG= no growth, N/A=test wasn’t applied to the isolate. *Not all colonies grow on all the agars. Only colonies that grew on all three agars were tested further.
Table 1. Actinomycete Enumeration on AA
Table 2. Colony Morphology on AA, NA and 1/10 NA*
NG=no growth, N/A=test wasn’t applied to the isolate.
*Not all colonies grow on all the agars. Only colonies that grew on all three agars were further.
Microbiology

102
3
Table 3. Antibiotic Production and Gram Stain
Isolate Dilution Antibiotic
Production on AA Gram Stain on AA
Antibiotic Production on NA Gram Stain on NA
S. aureus E. coli S. aureus E. coli
1a B 10-2 + - Gram negative** + - Gram positive
1b B 10-2 NG N/A N/A N/A
2a B 10-2 + - Gram
negative** + + Gram positive
2b B 10-2 + - Gram positive + - Gram positive
2c B 10-2 + - Gram positive - + Gram positive B 10-2 + + Gram positive + + Gram positive
1 B 10-3 - - Gram positive - - Gram positive
2 B 10-3 + + Gram negative** + + Gram negative**
B 10-3 + - Gram positive - + Gram positive
1 R 10-1 + + Gram negative** + + Gram positive
2 R 10-1 - + Gram positive - + Gram positive 1 R 10-3 - + Gram positive - + Gram positive 2 R 10-3 - + Gram positive + + Gram positive 1 M 10-1 NG N/A N/A N/A
2 M 10-1 + + Gram positive + + Gram positive Gram negative**
M 10-1 + + Gram negative** + + Gram positive
+=antibiotic production, -=no antibiotic production, NG=No growth, N/A=test wasn’t applied to the isolate. Shading indicates differences in antibiotic production between AA and NA media. **Sometimes Actinomycetes stain gram-variable. They are, generally, gram positive.
Table 3. Antibiotic Production and Gram Strain
+=antibiotic production, -=no antibiotic production, NG=No growth, N/A=test wasn’t applied to the isolate. Shading indicates differences in antibiotic production between AA and NA media.
**Sometimes Actinomycetes stain gram-variable. They are, generally, gram positive.
Poulsen

103

104
Results In Search For Exotic Cosmic-Ray Air-Shower Events
Nathan Waugh
Faculty Mentor: Tabetha Hole
Abstract
The Telescope Array experiment in western Utah searches for ultra-high-energy cosmic rays, which are particles of extraterrestrial origin
with energies of 1018 eV or more.1 These particles are ultra-relativistic nuclei that, on interaction with Earth’s atmosphere, create showers of relativistic daughter particles. These showers should progress through the atmosphere with speeds near c, and observations so far confirm this expectation. However, velocity fits to telescope detector data can return subluminal cases, which are expected to result from limited detector resolution and event misreconstructions. We have developed an event quality measure that can estimate the statistical significance of these slower-than-c cases. Our results indicate a low probability of real subluminal events in fluorescence detector data from Telescope Array.
Introduction
Cosmic rays (CRs) are ultra-relativistic particles of extraterrestrial origin that, on interaction with Earth’s atmosphere, create air showers of relativistic daughter particles and electromagnetic emissions, which can be directly and indirectly detected by surface detectors (SDs) and fluorescence 1 http://telescopearray.org/

105
detectors (FDs), respectively. Of particular interest are ultra-high-energy cosmic rays (UHECRs), which are CRs with an incident energy of 1018 eV or more. Since CR flux decreases by a factor of 1000 for every order-of-magnitude increase in CR energy, large detector areas are required for detection of UHECR on reasonable timescales.
Telescope Array (TA) is one of the world’s largest CR collaborations, with participants from Japan, the United States, Russia, South Korea, and Belgium. Its nearly 780 square kilometers of detection area are based near Delta, Utah, with maintenance and support activities coordinated through the CR research group at the nearby University of Utah. The majority of this area is covered by a grid of SDs, which detect the passage of particles and transmit via scintillation through fiber-optic cables to an array of photomultiplier tubes (PMTs). Three FDs detect ultraviolet fluorescence emitted by passing air showers, with some overlap in FD fields of view. Our analysis looked only at two of the FDs, called Black Rock Mesa (BRM) and Long Ridge (LR), and only at events that were seen by both detectors.
Each FD is comprised of a set of mirrors with corresponding sets of PMTs; these sets are called “cameras”. The mirror reflects an image of the sky into the PMTs, which provide angles and times (and thus angular speeds) for statistically significant signals. If two FDs see the same event, absolute CR track orientations and positions can be deduced from the known geometry of the detectors; this is called stereo detection. The information necessary to provide angular shower speeds and shower positions relative to the detector can be combined to yield linear shower speeds with respect to Earth’s surface.
Physics

106
PurposeCosmic-ray air showers are expected to propagate through the atmosphere at speeds very nearly that of light, and experimental observations so far confirm this expectation. However, events are sometimes seen in data that appear to violate this trend. While superluminal events are not expected to represent real phenomena, valid subluminal events might occur. We explore these subluminal events by developing a statistical analysis for event velocity distributions in both real and simulated data and comparing the results of both data sets, with the goal of determining the likelihood that any given slow event might be an artifact of detector observation or event reconstruction.
Methods and AnalysisCalculations for CRs are derived geometrically (figure 1). Since CR air showers should travel near c, velocity fits to reconstructed CR detector data typically use a form that assumes speed-of-light velocities:
where ti is the time at which light from a CR air shower reaches the ith PMT; Rp is the distance of closest approach of the shower to the detector, measured with the detector at the origin; t0 is the time at which the shower path intersects the path specified by the vector associated with Rp; ψ is the angle between the shower and the ground within the shower-detector plane; and αi is the projection of the ith PMT’s viewing angle onto the shower-detector plane. However, since subluminal events may appear, we use the modified form:
Waugh

107
where all parameters are as described above, with the only difference being that non-c speeds β = v/c are now allowed. 2
This modified fitting equation was applied to reconstructed data from stereo events. All calculations were done in the CERN-built data analysis program ROOT.3 For each event, the values Rp and ψ were fed directly from the stereo reconstruction into ROOT and held fixed, while the parameters t0 and β were allowed to vary as needed by the fitter. ROOT’s default chi-squared fitting procedure was used for all fits.
Each fit result was assigned a value indicating whether the fit was bad or good. Any event that satisfied good fit status for both BRM and LR FD detector data had its velocity fit results averaged over both sites. This was done for over 4000 observed events and nearly 15000 simulated events. Cumulative results for simulated and real site-averaged stereo event data were compiled into velocity histograms for analysis (figures 2 and 3).
A key result of the histogram analysis is that simulated data, which only uses speed-of-light events, shows a speed distribution about c. This indicates that the velocity fitting process itself introduces additional uncertainty to the reconstructed data. Thus, a quality measure was needed to determine how likely it is that any velocity fit to reconstructed data would show subluminal events occurring purely as a result of the data reconstruction and fitting procedures. Working in angle-squared-time space, we derived a combinatoric analysis of the form:
2 The derivations of these equations are omitted to save space. However, they can be derived from the geometry depicted in figure 1, with some application of trigonometric identities to obtain the forms shown.3 http://root.cern.ch/drupal/
Physics

108
Q=1-P, n is the number of “good” tubes in an event signal, and N is the total number of tubes involved in “good” cameras for that event. 4 The resulting parameter S measures the probability that an event of a given velocity could appear in a histogram of fitted velocity values as a result of artifacts in event detection or reconstruction. As the proportion of good tubes in an event signal increases, S should decrease, and this is exactly what is seen (figures 4 and 5). Because of its combinatoric form, we refer to the parameter S as “entropy”. Plots of entropy versus speed for both simulated and observed data are shown at the end of this report (figures 6 and 7).
ConclusionsFigures 3 and 6 demonstrate that a finite distribution of measured speeds about c is expected even when reconstructing purely light-speed data in simulation. Subluminal sources should manifest in observational data as an excess beyond this expected distribution. No such excess is observed (figures 2 and 7). We conclude that it is unlikely that any slow events observed in detector data so far are the result of anything other than detector noise, reconstruction error, and finite resolution of velocity fits. Further work will constrain these results more precisely.
Waugh
4 The numerical values in P are experimental event-viewing parameters specific to TA’s FDs.

109
AcknowledgmentsThe author would like to thank the National Science Foundation for funding, as well as the University of Utah and its CR group for their data and support. In particular, the author thanks Dr. Douglas Bergman and Dr. Thomas Stroman for their endless help and guidance over the course of this research.
Figure 1. Geometry of stereo detection.
Physics

110
Figure 2. Velocity histogram for real data.
Waugh

111
Figure 3. Velocity histogram for simulated data.
Physics

112
Figure 4. Likelihood of occurrence by artifact of a given velocity for real data.
Waugh

113
Figure 5. Likelihood of occurrence by artifact of a given velocity for simulated data.
Physics

114
Figure 6. Plot of entropy versus speed for simulated data.
Figure 7. Plot of entropy versus speed for real data.
Waugh

115
116
Adjunct Faculty Attitudes of Diversity
Nathan Brown, Jamie Hill, & Madeline Smith
Faculty Mentor: Kerry Kennedy
Abstract
Diversity has been an important topic in higher education for many years. Administrators, faculty, and students within higher education have all been able to voice their opinions regarding diversity. However, to our knowledge, this was the first study to focus specifically on the opinions of adjunct faculty. The purpose of this study was to discover the attitudes of adjunct faculty about diversity at Weber State University (WSU). It also sought to understand if diverse experience had an impact on attitudes toward diversity, as well as to compare relationships between student and adjunct faculty attitudes about diversity on the same campus. This study found its adjunct faculty sample lacking experience with, but not openness to diversity. The sample perceived that WSU provided resources for diverse opportunities even though they had less diverse experience after coming to the university. Minority groups from the sample were no more likely to incorporate diversity into their curriculum than non-minority groups, and religion had no impact on experience with or openness to diversity. This study found that adjunct faculty perceived there were more opportunities that are diverse for students than for themselves and they were unlikely to incorporate diversity into their curriculum. Lastly, outlined in this study are recommendations for improving the campus diversity climate and suggestions for future studies.

117
IntroductionAn educational environment that is open to all types of diversity is important to everyone not only to ensure against discrimination and marginalization, but also to provide the most enriching education for everyone involved. In conjunction with the Center for Diversity and Unity, we sought to examine the diversity climate on our campus among adjunct faculty. To our knowledge, this was the first study to focus specifically on adjunct faculty, as it is a considerably underrepresented population. The purpose of this study was to discover the attitudes of adjunct faculty about diversity at WSU. It also sought to understand if diverse experience had an impact on attitudes toward diversity, as well as to compare relationships between student and adjunct faculty attitudes about diversity on the same campus.
Queensborough Community College (n.d.) said this about diversity:
The concept of diversity encompasses acceptance and respect. It means understanding that each individual is unique, and recognizing our individual differences. These can be along the dimensions of race, ethnicity, gender, sexual orientation, socio-economic status, age, physical abilities, religious beliefs, political beliefs, or other ideologies. It is the exploration of these differences in a safe, positive, and nurturing environment. It is about understanding each other and moving beyond simple tolerance to embracing and celebrating the rich dimensions of diversity contained within each individual. (para. 1) We used this definition of diversity for our research.
Social Work

118
Methods
Defining Diversity Among the Professorate
In an attempt to answer these two questions, Hon et al. (1999) conducted a study: what diversity meant to faculty and how they could open diversity as a topic for discussion that was empowering to everyone. Those questions gave them a purpose for their study, which was to define diversity and promote an open dialogue about diversity issues. By far, the most important findings of the Hon et al. (1999) study concerned the faculty’s preferred definition of diversity. Responses suggested that faculty had different opinions about what made up a diverse faculty on top of the traditional race, ethnicity, and gender criteria. These findings were important to our study as they raised our awareness about the need for a comprehensive, universal definition of diversity, in addition to providing valuable comparison criteria.
Faculty Perceptions and Commitment to Teaching Diversity.
The purpose of a study conducted by Smolen et al. (2006) on faculty at College of Education (COE) schools was to answer the question: what are the diverse characteristics, perceptions, beliefs, and commitment to diversity of COE faculty in teacher education programs in four urban institutions with stated multicultural agendas. The findings of this study created the perception that faculty with more diverse backgrounds would have added openness to diversity and be more likely to incorporate diversity into their curriculum.
Weber State University Students
A study conducted on students at WSU by Bonney et al. (2013) sought to gauge student openness to diversity and diverse
Brown et al.

119
interactions. The overall findings of their study showed well-defined openness to diversity in the student body. They also found that people who grew up in Utah had less experience with diversity. Lastly, students who reported an LDS religious affiliation, had much less experience with diversity but they reported being open to it. These findings were important to our study as they provided valuable comparison criteria between students and adjunct faculty on the same campus. Furthermore, the Bonney et al. (2013) study used an openness/experience scale, and a definition of diversity that were an excellent fit for our study as they increased comparison validity.
Hypotheses1. Adjunct professors are open to diversity. 2. Adjunct professors have experience with diversity. 3. Adjunct professors feel WSU is providing resources for diverse opportunities. 4. Adjunct professors have less experience with diversity since coming to WSU.
Sample
Our non-probability sample included the 662 adjunct professors in eight colleges at WSU. In conjunction with the Center for Diversity and Unity at WSU, we sent the instrument electronically to the sampling frame through university e-mail. The Center for Diversity and Unity provided six $25 gift cards to the WSU bookstore as incentive for adjunct professors to respond. Each respondent had an equal chance of receiving a gift card. We chose to use a cross-sectional study design for available adjunct professors to answer.
Social Work

120
MeasurementIn order to measure our variables, we chose to use a modified version of the College Student Experiences Questionnaire (CSEQ) used by Gonyea et al. (2003). The CSEQ has proven reliable over time and through replication. For our purposes, we modified the questions and directed them toward adjunct faculty instead of students. We also chose the CSEQ because of previous research at WSU conducted by Bonney et al. (2013). We felt that using the same instrument would increase the validity of comparison between the two studies. In addition to the CSEQ, we chose to modify and use survey questions from the Association of Independent Colleges and Universities of Pennsylvania (AICUP) campus diversity survey instrument (Marywood University, 2014). We chose to use the AICUP survey because of its face validity and its incorporation of specific ethnic and racial categories to build a comprehensive picture of diversity (Hon et al., 1999). Also included in our survey instrument were standard demographic questions.
ResponseOf the 662 surveys sent out, 141 returned for a gross response rate of 21.3%. After cleaning the 14 blank and 13 partial surveys, 114 surveys were useable for a net response rate of 17.2%. We used SPSS for Windows to perform descriptive and inferential analysis. Of the respondents 45 (39.5%) were male and 69 (60.5%) were female. Of the race categories, an overwhelming majority, 102 (89.5%), were white. Since there were so few respondents who identified as a race other than white, we collapsed the remaining race categories into “other” with which 12 (10.5%) respondents identified. As with the race category, an overwhelming number of respondents belonged
Brown et al.

121
to the LDS religion. Therefore we collapsed religion into three categories LDS, “none”, and “other”, accounting for 62 (60.2%), 12 (11.7%), and 29 (28.2%) respectively. Eleven peoples chose not to respond to this question. Of the respondents 13 (11.4%) were single, 90 (78.9%) were married, 10 (8.8%) divorced, and 1 (0.9%) was widowed.
ResultsFor our first hypothesis that adjunct professors are open to diversity, we chose to compare the mean response of 23.57 to a neutral response of 21.00 as we felt that was a valid indicator of overall openness. There was a statistically significant difference between our response and a neutral response (t (114) = 8.19, p = 0.00) which confirmed hypothesis one. However, we should mention that our mean response of 23.57, while indicative of a response that was more positive than neutral, was less than a positive response of 28.00.
We also chose to compare the mean result of 18.36 from our second hypothesis that adjunct professors would have experience with diversity to a neutral response of 17.50 to indicate overall experience with diversity. There was not a statistically significant difference between our mean result and a neutral response (t (114) = 1.84, p = 0.06). Consequently, we could not confirm hypothesis two.
Relating to hypothesis three, we used the questions, “WSU provides diverse opportunities for students” and “WSU provides diverse opportunities for adjunct faculty”. There was statistical significance (Kendall’s Tau B = 0.58, p = 0.00) indicating overall concurrence with the two statements which confirmed hypothesis three.
Social Work

122
We confirmed our fourth hypothesis that stated adjunct professors would have less experience with diversity since coming to WSU. To measure this we asked two questions about contact with 13 different demographic categories from the AICUP survey. One question asked about how much contact respondents had with each group prior to coming to WSU. The other question asked about how much contact respondents had with each group while at WSU. We collapsed all groups to get an overall comparison and found (t (114) = -4.12, p = 0.00) a statistically significant difference which indicated less experience. We also compared the groups individually and found statistical significance for 6 of the 13 groups indicating less experience with these groups in particular. They were African Americans (t (114) = -5.13, p = 0.00), Asians / Pacific Islanders (t (114) = -3.82, p = 0.00), Chicanos / Latinos / Hispanics (t (114) = -3.872, p = 0.00), openly Gay / Lesbian / Bisexual (t (114) = -2.28, p = 0.02), Intersex / Transgender (t (114) = -2.35, p = 0.02), persons with a disability (t(114)= -3.92, p =0.00). Categories that showed no statistical significance between experience prior to and after coming to WSU were: American Indians (t (114) = -1.74, p = 0.08), Whites / Caucasians (t(114)=-0.62,p=0.53), Non-Native English Speaking (t (114) = -1.63, p = 0.10).
Discussion
Many of our hypotheses were based on findings from the Bonney et al. (2013) study conducted on the WSU student body. Similar to the student body, we hypothesized that adjunct faculty would be open to diversity and that was indeed what we found at WSU. Our question about experience with
Brown et al.

123
diversity was based on the Hon et al. (1999) study. We divided our question about experience with diversity into several specific racial/ethnic categories to facilitate a comprehensive definition of diversity. The hypothesis that adjunct faculty would be from places other than Utah led us to believe that they would have less experience with diversity since coming to WSU, which aligns with the Smolen et al. (2006) and Bonney et al. (2013) studies. That hypothesis was correct overall but varied depending on the specific aspect of diversity measured. We felt that the Bonney et al. (2013) study’s findings of overall openness to diversity at Weber State could be an indicator that there were resources for diverse opportunities on campus, and that was exactly the case.
ConclusionIt was reassuring to discover that adjunct professors felt WSU was providing diverse opportunities for students, even though they were less optimistic about those same opportunities for themselves. It was discouraging however to discover that adjunct faculty did not promote attendance at out of class diversity related events and activities. Unfortunately, we overlooked the potential importance of a Mayhew & Grunwald (2006) finding, which isolated faculty attendance at diverse activities as the biggest indicator of their likelihood to incorporate diversity related content into their curriculum. Adjunct professors may have felt excluded from invitation to on-campus, diversity related events and activities. Future studies may want to investigate faculty perceptions of inclusivity in campus event invitations as an indicator of attendance at those events, with follow up to see how many adjunct professors actually attend diversity-focused events. Other studies could consider the proportion of adjunct
Social Work

124
faculty who teach online classes and measure if that has any impact on diverse interactions with students. Finally, in an effort to understand the diversity climate on campus completely, it may be valuable to consider the perceptions of non-teaching, university staff in regards to diversity.
ReferencesBonney, L., Miller, H., Oliver, K., Berg, N., Larkin, V., Hendershot, W.,
Kennedy, K., & Bartruff, B. (2013). Wildcat nation: Open to diversity?. Journal of the Utah Academy of Sciences, Arts, and Letters, 90, 207–224.
Gonyea, R. M., Kish, K. A., Kuh, G. D., Muthiah, R. N., & Thomas, A. D. (2003). College student experiences questionnaire: Norms for the fourth edition. Bloomington, IN: Indiana University Center for Postsecondary Research, Policy, and Planning.
Hon, L., Weigold, M., & Chance, S. (1999). The meaning of diversity among the professoriate. Journalism & Mass Communication Educator, 54(1), 51-68.
Marywood University. (2014). AICUP campus diversity survey instrument [PDF document]. Retrieved from http://www.marywood.edu/instresearch/documents/AICUPCamDiv.pdf
Mayhew, M. J., & Grunwald, H. E. (2006). Factors contributing to faculty incorporation of diversity-related course content. Journal Of Higher Education, 77(1), 148-168. Queensborough Community College. (n.d.). Definition for diversity. Retrieved from http://www.qcc.cuny.edu/diversity/definition.html
Smolen, L. A., Colville-Hall, S., Xin, L., & Mac Donald, S. (2006). An empirical study of college of education faculty’s perceptions, beliefs, and commitment to the teaching of diversity in teacher education programs at four urban universities. Urban Review, 38(1), 45-61. doi:10.1007/s11256-005-0022-2
Weber State University. (2014, February 19). Diversity Initiative. Retrieved from http://www.weber.edu/DiversityOffice/diversityinitiative.html
Brown et al.

125

126
Uncovering Attitudes Towards Water at Weber State University
Kassandra Sqrow, Timothy Gibbs, Mercedes Anto,
Zack Bjerregaard, Nathan Brown, Somsak Hendricks,
James Nielson, & Rachel Sweet
Faculty Mentor: Carla Trentelman
Abstract
The purpose of this study was to investigate the relationship between attitudes WSU stakeholders hold about water and water use practices. Various stakeholders on WSU campus participated in one of nine focus groups. Focus group participants were asked about their views on water and water conservation, both in general and at WSU. Data were coded and analyzed for themes and patterns. Participants reported having a concern for water conservation, however were unaware of water-saving practices. Attitudes toward water and water conservation were found to have a modest influence on personal water use.
Introduction
The research presented in this paper was conducted by students in Dr. Carla Trentelman’s Environment and Society class (SOC 3300) at Weber State University (WSU) during spring semester, 2014. Under the direction and supervision of Dr. Trentelman and Dr. Dan Bedford, student researchers conducted a series of focus groups with various WSU stakeholders. The objective was to gain an understanding of stakeholders’ attitudes, beliefs,

127
and perceptions held about water and water use at WSU. The benefits for WSU and the campus community include an increased understanding of stakeholders’ attitudes towards water and towards WSU’s use and attempts at water conservation. The findings provide ideas for improved water management at WSU, as well as information about sustainability and environmental literacy among different stakeholders for WSU’s Energy and Sustainability Office (ESO), Facilities Management (FM), administration, and others involved in water policy decisions and implementation at WSU. The information may lead to improved water quality for downstream users, or improved water conservation resulting in greater availability of water downstream, for other users, and ecosystems. This study will also be part of a template created for other campuses wanting to examine their own campus water issues. The research also provides an improved understanding of water decision-making that benefits iUTAH, a National Science Foundation-supported program of research, education, and outreach aimed at understanding water issues across the state.
Background
Research suggests that Utah, along with other states in western North America, will have an increasing demand for water, due to predicted population growth and climate change (e.g. Bedford, 2014; IPCC, 2013; Gillies et al., 2012; UDWR, 2008). The five-year program, iUTAH, considers both physical and social science aspects to study Utah’s current and plausible future water vulnerabilities, management practices, and sustainability. In partnering with iUTAH, we studied social science aspects of water usage here at WSU. This connects with a national push to incorporate sustainability in a more
Sociology

128
meaningful and concrete fashion into university life (e.g. Sharp, 2009). Our research follows an important objective for iUTAH in measuring “the most important drivers of water use behavior of households, farmers/irrigators and local water management organizations (e.g., attitudes, perceptions, social networks, institutions, and climate)” (iUTAH, 2013, p. 11).
A brief exploratory study of water use at Weber State conducted fall 2013 discovered a good deal of conservation work going on at WSU. In interviews with WSU staff involved in water management, a strong interest was expressed in the attitudes WSU stakeholders have about management practices. This leads to the purpose of this study, to uncover attitudes WSU stakeholders hold about water, since one can argue that attitudes are “fundamental to environmental solutions” (Heberlein, 2012, pg. 5).
Research questionsThe research questions addressed in this study are:
1) How do people at Weber State University think about water?
2) What are their beliefs, perspectives, and attitudes about water, water use, and conservation?
3) How do various stakeholders affiliated with campus view water and water issues, both in general and in terms of water issues at WSU?
4) How do these beliefs, perspectives, and attitudes inform institutional and personal decision-making about water use and management?
Sqrow et al.

129
MethodsTeams of three students conducted a series of nine focus groups under the direction of both supervising professors. Focus groups included questions on water in general, water conservation, water at WSU, getting the word out about water conservation, and summary closing points. For variety, different WSU stakeholders were targeted. Student, faculty, staff, and governance bodies participated in the study. Each focus group consisted of participants, or stakeholders, from one of these groups. Focus groups included two groups each of students, faculty, and staff members, all from different colleges and staff divisions, as well as three homogeneous groups from various campus governance bodies.
Focus group members were recruited primarily through email. Where email was not successful, fliers were distributed to faculty and staff members and hung in buildings of the targeted student group. A ten-dollar gift card and a free meal served during each focus group were provided as incentive. Groups ranged from 2 to 11 participants.
Each focus group was audio recorded and then transcribed. Transcriptions were coded by general topics and then analyzed by looking for themes that emerged from the data.
DiscussionThe preliminary findings presented here detail participants’ attitudes about water and water conservation. The perspectives expressed by focus group participants provide an initial understanding of the attitudes of some members of the WSU community.
Sociology

130
Participants’ perspectives about water use and conservation
Participants were asked if they felt there was a need to conserve water. All felt water conservation was important. It was suggested that reducing water usage and/or recycling water is a way to conserve water on a large scale. On an individual level, participants commented that water conservation included showering less, recycling water, and turning off water while washing hands and brushing teeth. Overall, all agreed that water conservation is important because it gives us “life”. Many participants were aware of a water shortage, but they did not feel the effects of it and were uncertain on the question of future water availability.
WSU Stakeholders’ view of water on campus
Many had positive perceptions of WSU’s indoor water usage or felt like WSU was improving in this area. Automatic sinks, dual flush toilets, and water bottle refill stations were mentioned most. However, the availability of these technologies in the buildings where students or faculty spent most of their time determined how much they knew about them. Indoor water conservation efforts were most recognizable for many of our participants, which gave participants a positive perception of WSU’s indoor water usage.
On the other hand, participants had negative perceptions of WSU’s outdoor water use. This correlated with a lack of knowledge about the conservation efforts being made outdoors. Many participants mentioned lawns being watered at unsuitable times (e.g. midday and while it is raining), or sprinklers spraying sidewalks or roads. Several mentioned how the over watering of lawns is the first impression for
Sqrow et al.

131
students and faculty. This negative impression was reported as overpowering the indoor efforts that are being noticed. Most participants also perceived the duck pond as being wasteful, unaware that it is a holding pond for irrigation water. These negative perceptions of WSU’s outdoor water usage does not represent the university as being a leader in water conservation, which many said WSU should be.
Overall, many participants reported that they are unaware of WSU’s water usage practices, which appeared to influence participants’ views on water and water conservation. Because of this, they felt that WSU could improve. Many staff member participants had a general idea of WSU’s efforts, but did not see results or changes made with policies.
Getting the word out about WSU’s water conservation
Participants were asked how WSU could get the word out about water conservation efforts. A few participants said Weber State could monitor the campus’s water usage and use this information to help teach others about conservation. It was suggested that a link to the Dashboard website could be put on WSU’s home webpage to inform people that monitoring is taking place. Another idea was to send emails about water conservation. However, some said it was an ineffective way to relay information. An additional suggestion made to help inform people about water conservation efforts was to post signage in areas where conservation measures have been implemented. Signs stating its purpose and how much water is being saved can help inform students and faculty on campus on what is being done in terms of water. Lastly, participants mentioned how professors could design water conservation-
Sociology

132
related assignments or research projects for their classes. A wide variety of disciplines could do this (e.g. business, humanities, the sciences including social sciences, etc.). Classes and/or assignments created around water conservation on campus could be used to educate students on campus as well as help spread the word about WSU’s conservation efforts.
Most Important Points
When participants were asked what they considered the most important topic discussed in the group, nearly every focus group mentioned the importance of water conservation at WSU campus and beyond. In terms of institutional water use and management, participants supported xeriscaping and felt that WSU needs to conserve water in landscaping. Excessive water used in landscaping was their main water-related concern on campus.
Many offered ideas of cognitive and technological solutions to help with water conservation in Utah, for example, educating the public on current water issues and teaching water saving practices. However, accessibility of water is preventing many participants from conserving individually. Most suggestions given on conserving water were mainly structural/technological changes instead of personal conservation efforts. Technological advances offer water saving solutions without people having to think about their own water usage.
With WSU water conservation, participants believe WSU needs to use their role as an educational institution and become a leader in water conservation. Weber can incorporate water availability topics in classes and use the assets of the Student Body Representatives to help WSU better educate other students. In order to let students and the community
Sqrow et al.

133
understand what WSU is doing to conserve water, Weber has to broadcast all efforts.
Study Limitations
These findings represent our focus group participants, rather than all of Weber State stakeholders. Focus group turnouts did not always adequately represent groups of stakeholders. Additionally, participants were aware the study focused on water when recruited and may already had interest in water issues. However, the information gathered will help WSU’s water conservation efforts.
ConclusionsParticipants reported that there is a need to conserve water both on campus and on an individual level. Many reported not being fully aware of WSU’s current water conservation efforts, however indoor water saving technologies (i.e. dual flush toilets) has given many the perception that Weber is making an effort to conserve water. On the other hand, WSU’s outdoor water use was reported as giving participants a negative perception of WSU’s water use. Overall, participants understood that water is an essential resource, but are unaware of water saving practices and future water availability.
ReferencesBedford, D. (2014). Climate change and the future of Great Salt Lake. Pp.
80-97 in Crimmel, H. (ed.), Desert Water: The Future of Utah’s Water Resources. Salt Lake City, UT: University of Utah Press.
Gillies, R. R., Wang, S. Y., & Booth, M. R. (2012). Observational and synoptic analyses of the winter precipitation regime change over Utah. Journal of Climate, 25(13), 4679-4698.
Sociology

134
Heberlein, T.A. (2012). Navigating Environmental Attitudes. New York, NY: Oxford University Press.
Intergovernmental Panel on Climate Change. (2013). Climate Change 2013: The Physical Science Basis. Working Group I Contribution to the IPCC 5th Assessment Report. Cambridge, UK: Cambridge University Press.
iUTAH. (2013). Strategic Plan for 2012-2017. Retrieved October 22, 2013 from: http://iutahepscor.org/resources/documents/iUTAH_StrategicPlan_final_accepted_25Apr13.pdf
Sharp, L. (2009). Higher education: The quest for the sustainable campus. Sustainability: Science, Practice, & Policy 5(1), 1-8.
Utah Division of Water Resources. (2008). Drought in Utah: Learning from the past—preparing for the future. Utah State Water Plan. Retrieved October 14, 2013, from: http://www.water.utah.gov/DroughtReport/Drought2008A.pdf.
Sqrow et al.

135

136
Justified Suspicion of Ontology-Speak Dwight Adams
Mentor: Robert Fudge
Undergraduate Conference in Philosophy
Eastern Michigan University - Ypsilanti, Michigan (March 7–9, 2014)
Abstract
This paper attempts to dissolve Rudolf Carnap’s argument for the meaninglessness of ontology found in “Empiricism, Semantics, and Ontology” while showing that Carnap’s argument nevertheless contributed to ontological discourse. After posing Carnap’s argument as itself a linguistic framework of the same type his theory describes, two questions are asked about it: Is it true, and is it useful? The former question yields unsatisfactory results due to contradiction and implausibility. Answering the latter question in the affirmative seems arbitrary. Answering it in the negative destroys Carnap’s system because he rests the sole value of linguistic frameworks on their usefulness. Furthermore, if Carnap’s framework is true, it would constantly be subjected to utility comparisons, allowing it to cease to have ontological significance from one moment to the next depending on whether it or an ontological claim were more useful to hold. Nevertheless, Carnap’s argument contributes to our overall understanding of ontological discourse and serves as a warning to those who uncautiously ascribe ontological significance to strictly linguistic artifacts.
Adams

137
Irene Ryan Scholarship Competition Camrey Bagely
Mentor: Jennifer Kokai
Kennedy Center American College Theatre Festival
St. George, Utah (February 9–15, 2014)
Abstract
I was nominated to compete for the Irene Ryan Scholarship at the Kennedy Center American College Theatre Festival this February. I received this nomination for my playing the role of “Caitlin” in Mockingbird last spring. This festival will allow me to compete for scholarship money, attend workshops, further develop myself as an artist, and bring positive recognition to the university. It will also allow me to research what kind of material works best for me as an actress and how I can present myself in a memorable way in a short amount of time. A travel grant would help me to accomplish these goals.
Bagely

138
Perceptions on Intimate Partner Violence in Same-Sex Relationships Heidi Bell
Mentor: Pepper Glass
Pacific Sociological Association Meeting
Portland, Oregon (March 26–31, 2014)
Abstract
Intimate partner violence (IPV) has been researched in heterosexual relationships, but little is known about it in homosexual relationships. This study aims to understand if the sexual orientation of an IPV victim affects judgment towards that victim. Students read through one of four scenarios featuring fictional IPV cases and answered questionnaires. While previous studies show the effects of bias for same-sex couples, these findings are often intertwined with assumptions regarding the gender-stereotypes of victimization. In contrast, this study adds a genderless scenario of IPV to test these perceptions. On several measures, the mean scores of victims of same-sex IPV were perceived with less sympathy and discouraged institutional intervention when compared to opposite-sex and genderless scenarios but did not reach statistical significance in all measures. Understanding the biases, attitudes, and stereotypes surrounding IPV in same-sex relationships can help the public, legislators, LGBT advocates, and service providers better address this social problem.
Bell

139
Microbial Screening of Potable Water Sources in Guatemala Emma Bentley
Mentor: Craig Oberg
American Society for Microbiology General Meeting 2014
Boston, Massachusetts (March 16–21, 2014)
Abstract
Transmission of infectious diseases by fecally contaminated water represents a reoccurring health risk for the local population and has serious implications for travelers from developed nations. The presence of coliforms in water is an indicator of fecal contamination and, possibly, the presence of fecally transmitted pathogens. In this study, the degree of microbial, along with fecal, contamination in potable water, specifically designated for drinking, was determined by screening 27 samples collected in four different locations across Guatemala (Guatemala City, Chulac, El Estor, and Flores). Samples were taken in October 2013 of water from a wide variety of potable water sources, both urban and rural, from commercial facilities to single dwelling spigots. Sarwles were plated on Aerobic Count, Enterobacteriaceae, and E. coli/Coliform PetrifilmsTM. Inoculated PetrifilmsTM were incubated at ambient temperatures for 48 h then enumerated. Results showed that 92% of the potable water sources contained bacteria, 48% of samples contained coliforms, 15% contained E. coli and 71% were positive for Enterobacteriaceae, indicative of Salmonella contamination. Coliform counts ranged from 0 to greater than 1.6 x 10² per ml of potable water. Confirmation of E. coli/Enterobacteriaceae required harvesting isolates from the individual Petrifilms. Three methods were used: aseptic scraping, picking colonies and stamping with Rodac plates. The use of Rodac plates resulted in the greatest level of recovery. Thirty isolates, representing the 4 different sampling areas, were confirmed on EMB agar and by 16S rRNA sequencing. These results indicate that potable sources, particularly in rural areas, could be a significant source of fecal pathogen transmission to its consumers.
Bentley

140
Adjunct Faculty Attitudes about Diversity Study Nathan Brown
Mentor: Kerry Kennedy
The Annual Conference of the Utah Academy of
Sciences, Arts, and Letters
St. George, Utah (April 11, 2014)
Abstract
Diversity has been an important topic in higher education for many years. Administrators, faculty, and students within higher education have all been able to voice their opinions regarding diversity. However, to our knowledge, this was the first study to focus specifically on the opinions of adjunct faculty. The purpose of this study was to discover the attitudes of adjunct faculty about diversity at Weber State University (WSU). It also sought to understand if diverse experience had an impact on attitudes toward diversity, as well as to compare relationships between student and adjunct faculty attitudes about diversity on the same campus. This study found its adjunct faculty sample lacking experience with, but not openness to diversity. The sample perceived that WSU provided resources for diverse opportunities even though they had less diverse experience after coming to the university. Minority groups from the sample were no more likely to incorporate diversity into their curriculum than non-minority groups, and religion had no impact on experience with or openness to diversity. This study found that adjunct faculty perceived there were more opportunities that are diverse for students than for themselves and they were unlikely to incorporate diversity into their curriculum. Lastly, outlined in this study are recommendations for improving the campus diversity climate and suggestions for future studies.
Brown
141
Toothbrush Sanitization: A Comparison of Two Methods Chelsea Burr
Mentor: Frances Mcconaughy
American Dental Hygienists’ Association’s Center for Lifelong
Learning, 91st Annual Session
Caesars Palace - Las Vegas, Nevada (June 18–20, 2014)
Abstract
Objective: This research study was designed to evaluate the sanitization of toothbrushes, contaminated with oral microorganisms using the UV sanitizer and a 1200-watt microwave.
Background & Problem Statement: Bacteria are transferred to a toothbrush each time it is used. While not all oral bacteria are pathogenic, bacteria related to caries, gingivitis, and periodontitis are transmissible among toothbrushes in close contact. Toothbrush care and maintenance is an important consideration in sound oral hygiene (ADA, 2011) and finding a low-cost and effective method of toothbrush disinfection has been identified by other researchers as an important step in minimizing the bacterial load on toothbrushes. The purpose of this study was to compare the ultraviolet light (UV) and microwave to determine which sanitization method was most efficient in reducing bacteria on a contaminated toothbrush.
Methodology: Research participants consisted of 40 individuals assigned to experimental or control groups. Each participant was given a toothbrush and instructed to brush for one week. Ten unused toothbrushes under went analysis to assess pre-existing bacterial contamination. Ten of the 40 sample toothbrushes were not sanitized, serving as a control. The experimental toothbrushes were cut in half, sanitized, plated on sheep blood agar and CNA/MAC plates, and incubated for 24 hours. The colony forming units (CFU) were obtained by visual inspection.
Burr

142
Results: New toothbrushes cultured before the stait of the study resulted in minimal contamination of a single SBA plate. After sanitization procedures and analysis of findings were completed, results of the mean CFU counts showed that there was a clinically significant difference between the control and experimental groups. The UV sanitization procedures resulted in a lower mean CFU count (M = 5,071) than the microwave experimental group (M = 8,821). However, the t-test between the experimental groups was not statistically significant.
Conclusion: The results indicate there is toothbrush microbial contamination with everyday usage and that both UV sanitization and microwave methods are effective in reducing microbial contamination. The results of this study conflict with the only known similar study. Therefore, further studies are needed to determine which method of toothbrush sanitization is most effective.
Burr

143
The Seven Furies of Developmental Math Anneli Byrd
Mentor: Kent Kidman
The 21st International Conference on Learning
Lander College for Women at Touro College, New York City,
New York (July 14–17, 2014)
Abstract
This self-evaluative case study proposes seven ‘furies’, or sources of frustration, that can help remedial math instructors to become aware of blockers for their struggling students. Students of mathematics of all ages can suffer from math anxiety. The underlying causes of math anxiety are numerous and varied (Ashcraft, 2002). Regardless the reasons, the intense negative reaction to math seems greater to the sufferer since all students are required to take math. College students who suffer from anxiety tend to feel that their instructors do not realize, nor care, about their plight. This study uses a qualitative phenomenology research model to collect data (Bogdan & Biklen, 1992) in order to examine the journal, math anxiety literature, an online math course with ancillary materials to answer the following research question: How can one person’s experience with a new online remedial math course inform online teaching practices? Using constant comparative methodology to triangulate the above data sources, the researcher created seven categories, labeled the Seven Furies, that underlie difficulty in the course that can potentially inform mathematical teaching practices to help math instructors to be more empathetic to their struggling learners.
Byrd

144
Edge Effect on Mycorrhizal Infection Occurence in Gutierrezia Sarothrae [Asteraceae] Shannon Call
Mentor: Barbara Wachocki
Botanical Society of America
Boise, Idaho (June 27–30, 2014)
Abstract
Mycorrhizas have a mutualistic relationship between fungi and vascular plants. Mycorrhizal associations are important for plants as they provide minerals, especially phosphorous, and water, while the plant provides carbohydrates for the fungi. Trail edges affect plant community diversity by altering water runoff, soil moisture, or encouraging invasive species growth. Because trail edges impact plant communities, I hypothesize mycorrhizal colonization frequency may decrease as distance to a trail edge decreases. To test this hypothesis, Gutierrezia sarothrae [Asteraceae], a woody shrub native to the western United States, was sampled from two similar sites and at three distances from hiking trails and mycorrhizal colonization frequency was determined. Plant samples were collected one meter, ten meters and twenty meters from the edge of a hiking trail. Roots were cleared, and stained with trypan blue. Statistical difference was determined using chi-square analysis. There was a significant difference in mycorrhizal associations between 1-meter to 10-meters (p<0.0 1) and 10-meters to 20-meter s (p<0.005). There was no difference between roots at 1-meter and 20-meters (p>0.9). Mycorrhizal infection was highest in plants located 10-meters from the trail. After the study was completed, old aerial photographs were discovered showing the existence ten years previously of an old hiking trail which had since been abandoned, thus adding further support to the hypothesis. Results showed differential mycorrhizal colonization frequency, suggesting a negative response near trail edges. Understanding how mycorrhizas respond to disturbance can help managers understand the effects of recreational land use on plant communities.
Call

145
“What Is Passed Down” Roundtable Presentation Reginald Carlisle, Kyle Poppitz, & Garrett Jayrod
Mentor: Laura Stott
Sigma Tau Delta 2014 International Convention
Savannah, Georgia (February 25–March 2, 2014)
Abstract
We grow up listening to our parents’ music. What effect does that have on our generation? What passes from one generation to the next? How does that show up in culture and literature? It’s Sigma Tau Delta’s 901 birthday. What is being passed down to us? We will establish a context for the discussion based on the idea of things getting passed from one generation to the next. Then we will play a game commonly known as telephone (or gossip) where we pass a message from one attendee to the next until we get to the end. We can then talk about how much of the original message remains. Then we will quickly discuss the culture and literature of the twenties. We will introduce Truman Capote, an author born in 1924, which, if he were still alive, would make him the same age as Sigma Tau Delta. We will talk about what remains of the twenties culture and ideas in his work. At this point, we will talk about how this generational process shows in our own work and we will take questions. This discussion should be lively and fill the remaining time. The panel will consist of five differently aged participants. This is to present different views of how this generational process has happened through time. Also, it allows us to relate to more of our audience, as our example will also vary in time.
Carlisle et al.

146
Effects of Glucose on Proteus Mirabilis Scott Chamberlain
Mentor: Scott Wright
American Society for Clinical Laboratory Science
Houstin, Texas (July 30–August 2, 2013)
Abstract
Diabetes mellitus patients have an increased risk of urinary tract infections, presumably due to increased saccharides in their urine. Proteus mirabilis is a common pathogen of the urinary tract and research has shown media supplemented with 4% glucose enhances P. mirabilis biofilm formation, suggesting glucose availability plays an important role in P. mirabilis uropathogenesis. Another feature of P. mirabilis is cyclic swarming motility. To investigate if glucose availability also enhances swarming motility, two clinically isolated strains were grown on sheep-blood agar with and without 4% glucose. Swarming motility was measured from the center inoculum outwards in millimeters every hour for 24 hours, repeated in triplicate. Multivariate linear regression analysis showed in the presence of glucose, P. mirabilis swarmed significantly (p=5.8lxl0-24) less distance horizontally over a 24 hour period compared to strains on non-glucose media. More strains are currently being assessed, but preliminary results show glucose is associated with less horizontal growth over a 24 hour period. These results seem to contradict those shown in biofilm production. The difference between these could be due to an increased vertical growth during consolidation phase on glucose supplemented media, and should be investigated.
Chamberlain

147
Lack of Song in Females Does Not Drive Sexual Dimorphism in Syringeal Muscle Composition Linsey Christensen
Mentor: Ron Meyers
Society for lntegrative & Comparative Biology
Austin, Texas (January 3–7, 2014)
Abstract
The avian syrinx uses four pairs of intrinsic muscles to control song production. Previous work in our lab using immunohistochemistry revealed two fiber types, fast and superfast. Superfast fibers are rare fibers found in sound-producing animals and contract up to 250 Hz in songbirds. We studied songbird species from different families to understand the role of superfast fibers in singing. Male songbirds typically sing more complex songs than females, who may sing (European Starlings, Sturnus vulgaris; White-crowned Sparrows, Zonotrichia leucophrys; House Sparrows, Passer domesticus; Red-winged Blackbirds, Agelaius phoeniceus; Yellow-headed Blackbirds, X. xanthocephalus), both sexes had similar composition with superfast fibers outnumbering fast. In two Estrildids where males sing and females do not (Zebra Finches, Taeniopygia guttata; Bengalese Finches, Lonchura domestica), males possess a greater percentage of superfast fibers than females (80% in males, 25% in females). This difference in fiber percentage supports the hypothesis that superfast fibers are important in singing. However, two other species with sexually dimorphic singing behavior (Brewer’s Sparrows, Spizella breweri; Brown-headed Cowbirds, Molothrusater), had superfast fibers outnumbering fast in both males and females. These findings suggest that singing does not account for the occurrence of superfast fibers in the syrinx and the presence of these fibers is likely a taxonomic factor. Our lab is currently investigating other Estrildids to test that hypothesis. Further investigation is needed to determine if superfast fibers are necessary for other non-singing functions.
Christensen

148
Performance at Conference Austin Packer & Jacob Dame
Mentor: Viktor Uzur
Music Teachers National Association
Santa Barbara, California (January 2–4, 2015)
Abstract
Every year the Music Teachers National Association (MTNA) holds a performance competition for musicians ranging from elementary aged children to college aged students. It begins with a statewide competition, and then moves on to a regional, then national level competition. Austin Packer, a Cello Performance major at Weber State University, participated in MTNA’s Utah Young Artist Competition in September of 2014 receiving the first place award. As a result, Packer was invited to participate in the Southwest Regional Competition for MTNA held on January 4th at the University of California in Santa Barbara, CA. The Southwest Region consisted of the winners from California, Arizona, Hawaii, and other states in the Southwest region of the United States. Starting many months prior to the Utah competition and subsequently the Southwest competition, Packer dedicated countless hours, sometimes reaching up to 6 hours a day, of personal practice on his instrument. Further more, he was under the constant and direct private instruction of Dr. Viktor Uzur, Professor of Cello at Weber State University. As a result of such dedicated work, Packer was awarded the Alternate (2nd place) position at the Southwest Regional Competition in the Young Artist division of the MTNA competition. This is a great honor to be given to anyone. Although this is a great accomplishment, Packer will not be continuing to the National competition held in March of this year in Las Vegas, Nevada, however he is grateful for the opportunity he had to perform and work towards this achievement. Regardless of the outcome, Packer is happy with the progress he has made as a cellist and as a musician thanks to his participation in the MTNA regional competition and knows it will contribute greatly to his career.
Packer & Dame

149
The Renaissance Witch and the Roman Catholic Church: Social Power and Control of the Supernatural Christianna Disque
Mentor: Francis Stephen
Phi Alpha Theta Regional Conference (March 2014)
Abstract
The witch is a subject that fascinates many historians. This paper is partly a historiographical discussion about the origin of Renaissance witchcraft. The paper is also an exploration of the power that can be wielded if society leaves something unhindered. Both witches and the Catholic Church held aspects of this societal power, and the connection of those powers to Renaissance witchcraft and the witch craze are explored. It includes contemporary views and interdisciplinary 20th and 21st century interpretations regarding the source of the Renaissance witch’s power. It also explores the changing society that witches were embedded in, and the problems caused for witches by these changes. The society relied on non-church power to sustain certain elements of life, and the Church wanted exclusive access to supernatural powers. This paper follows the debate between societal power and Church power that was common during the Renaissance, and has been continued by many modern historians who have the benefit of hindsight. Source materials include works by Deborah Willis, Barbara Rosen, Wallace Notestein, Norman Cohn, Richard Horsley, Jeffery Burton Russell, Kurt Seligmann and James I of England.
Disque

150
The Effects of Two Behavioral Interventions on Off-Task Behavior Taylee Elescano
Mentor: Natalie Williams
Association for Behavior Analysis 40th Annual Convention
Chicago, Illinois (May 24–26, 2014)
Abstract
This project presents data from two function-based behavioral interventions that were implemented to decrease the occurrences of off-task behavior by two fourth grade students with moderate disabilities. Off-task was defined as any occurrence of the following: out of seat, vocal verbal non content related statements to adults or peers, eyes away from the teacher or text at the time of the observation or playing with items not related to the current lesson. The students were engaging in this behavior in order to escape unwanted tasks and/or gain peer and adult attention. A reversal design was used to verify the effectiveness of the intervention selected. For Chris, whose behavior was maintained both by escape and attention, response cost was implemented using an ABAB design. During baseline his off-task behavior occurred an average of six times during a 15-minute observation. During intervention the students’ average off-task behaviors decreased to 1.5 occurrences. During the return to baseline, the average off-task behaviors increased well above the initial baseline phase to an average of 11 occurrences. The final implementation phase resulted in an average of 1.68 occurrences of off-task behavior. For David, whose behavior was escape motivated an ABA design was implemented using a self-monitoring system with the MotivAider®. During baseline, this student averaged 11 occurrences of off-task behavior and during intervention averaged 4 occurrences. Data collected during the return to baseline resulted in an average of 11.3 occurrences of off-task behavior.
Elescano

151
Adjunct Faculty Inclusion and Job Satisfaction Jamie Hill
Mentor: Kerry Kennedy
American Association of Social and Behavioral Sciences
Las Vegas, Nevada (February 8–11, 2015)
Abstract
Adjunct faculty are an essential part of university teaching and are often underrepresented at higher education institutions. Research about student inclusion and tenured (or tenure-track) faculty is much more prolific. This research is based on previous research that indicated that adjunct faculty feel the students have diverse opportunities, but that adjunct faculty do not feel included in these opportunities. A 25 question survey was given to adjunct faculty members at a western higher education institution to measure job satisfaction and inclusion. Questions were both quantitative and qualitative in nature. Preliminary results indicate that the University, as a whole, defines expectations for adjunct faculty but does not do a good job of including adjunct faculty as part of a department through invitations to faculty meetings and explaining benefits. Further, adjunct faculty do not feel recognized for their efforts. Most feel that faculty in their department are available for assistance but do not take an active interest in their success. Overall, adjunct faculty indicated that they are satisfied with their experiences teaching at the university level.
Hill

152
Co-occurance of Gall-forming Aphids and Fungal Endophytes on Hybrid Cottonwood Tree Julia Hull
Mentor: Ron Deckert
Botanical Society of America
Boise, Idaho (July 25–31, 2014)
Abstract
Endophytes are fungi that live within aerial portions of plants for most or all of their life cycle without causing visible signs of disease. Gall forming aphids, Pemphigus betae, are highly competitive over gall site selection, forming galls on the leaves of narrowleaf cottonwoods and their hybrids. he favored gall location overlaps with areas of highest endophyte probability. I hypothesized that a negative correlation would exist between endophyte infection and aphid galling on leaves of backcross hybrid cottonwood trees. I tested my hypothesis by obtaining samples of six backcross hybrid cottonwood trees along the Weber River in Weber County, Utah from 10 July to 17 July 2013. I took leaf samples of galled and ungalled leaves and the corresponding twigs from the current year and the previous year. Samples were surface sterilized using ethanol and bleach, aseptically plated onto potato dextrose agar, and were allowed four weeks to incubate at room temperature. Samples were scored every other day for endophytes. At the end of four weeks, data were collected and statistical analysis was performed via t test (Microsoft Excel) and a chi-squared test. My hypothesis was rejected. I found significantly more endophytes associated with galled leaves than in leaves without galls. Possibly, either the aphids are attracted to the areas with high endophyte infections or the aphids themselves are introducing endophytes into the leaves.
Hull

153
Down Syndrome Family Education Night: Community and Class Service Learning Alexis Jensen-Bowen & Emilie Butler
Mentor: Shirley Dawson & Patrick Leytham
Council for Exceptional Children, Teacher Education Division
Indianapolis, Indiana (November 4–8, 2015)
Abstract
The attitudes and concerns of rural general and special education pre-service teachers are important factors to consider when designing and delivering coursework in the university setting. The purpose of this study was to investigate the impact of undergraduate coursework on their attitudes and concerns regarding inclusion.
Jensen-Bowen & Butler
154
Human Papillomavirus Risk Awareness Among Dental Hygiene Professionals Kimberly Karpowitz
Mentor: Frances Mcconaughy
The American Dental Hygienists’ Association Center for Life
Long Learning 91st Annual Session
Caesars Palace - Las Vegas, NV (June 18–20, 2014)
Abstract
Objective: The purpose of this project was to assess dental professionals’ knowledge of human papillomavirus (HPV) related oral cancer and their knowledge of screening protocols for HPV related oral cancer. Background and Problem Statement: The majority of oral cancers have previously been related to tobacco and alcohol use and dental professionals are well versed in screening practices for these cancers. However, traditional oral cancer screenings are of limited value in detecting human papillomavirus (HPV) related oral cancer that now requires a different approach (Duval, 2013). Moreover, lesion location, risk factors and population affected vary for each type of cancer (Fried, 2013; D’Souza eta!, 2007). While the prevalence of tobacco/alcohol related oral cancer has dropped in recent years, HPV-related oral cancer is increasing. Dental hygienists need to be aware of the prevalence, risk factors, assessment and screening strategies for HPV associated head and neck cancer. However, little is known about practicing dental hygienists knowledge of clinical and educational practices regarding the screening of HPV related head and neck cancer. Methodology: A survey research design was used in this study and targeted Registered Dental Hygienists (RDH) and members of the Utah Dental Hygienists’ Association. Participants responded to an online survey, using
Karpowitz

155
forced choice responses that focused on their knowledge of HPV related head and neck cancer. Results, including demographic data of the participants and results from the survey were tabulated and analyzed examining the frequencies of responses.
Results: Responses were capped at 100 due to time constraints. The results indicated that 85% of dental hygienists described their knowledge level of HPV related head and neck cancer as medium to very low. Over half of the dental hygienists reported attending a continuing education course or have read a journal article regarding HPV related head and neck cancer. Notably, only 6%(n=6) were aware that screening procedures for tobacco & alcohol use and HPV-related head and neck cancers are different. Eighty-six percent of the hygienists acknowledged a need for continuing education courses addressing HPV-related head and neck cancer.
Conclusion: There appears to be some confusion regarding the distinctions between tobacco & alcohol oral cancers and HPV-related head & neck cancer. Therefore, continuing education courses on this topic merit consideration.
Keywords: Oral Cancer, Human Papillomavirus, Screening.
Karpowitz

156
Representing State of Utah to Compete in MTNA Southwest Division Competition Ling-Yu Lee
Mentor: Yu-Jane Yang
Music Teacher National Association
Southwest Division Competition
Santa Barbara, California (January 2–4, 2015)
Abstract
On October 25th, I participated in the Music Teacher National Association (MTNA) Steinway Young Artist State of Utah Collegiate Piano Competition and won the first place. As a winner of the MTNA state of Utah Piano competition, I have been asked to represent Utah, as well as Weber State University to compete in the MTNA southwest division competition, which will be at University of California, Santa Barbara - Santa Barbara, California on January 2-4 of 2015. The southwest division competition is one of the seven divisions in the U.S. The six states that are included in the southwest division are Arizona, California, Hawaii, Nevada, New Mexico, and Utah.
MTNA is a music organization founded in 1876 with the purpose of advancing the value of music studying for professional teachers, as well as the performing opportunities for musicians with different age groups and levels. The MTNA competition is held annually and by participating in this competition, I will have opportunities to associate with musicians from other states. Furthermore, I will have the experience not only in performing at a division level venue, enhance my personal performance ability, but also learn and be inspired by other contestants.
I will be performing a program of 40-minute repertoire including pieces written by composers from various time period. The pieces I have prepared are as follow: Prelude and Fugue in B minor,
Lee

157
book 2 by J. S. Bach (1685-1750), Sonata in F minor Op. 57 by Beethoven (1770-1827), Etude Op. 10 No. 1 and Nocturne Op. 27 No. 2 by Chopin (1810-1849), Islamey Orierital Fantasy by Balakirev (1837-1910) and Desperate measures by Muczynski (1929-2010). In preparation for this competition, my professor, Dr. Yu-Jane Yang, and I have devoted many hours into lessons for higher level of artistry in my performing and are continuing in practicing for the division competition in prospect of qualifying for the national competition which will be held in Las Vegas, Nevada in March, 2015.
Lee

158
Through-space Interactions within Nonclassical Norbornenyl Carbocations, a Computational Analysis Byron Millet
Mentor: Laine Berhoust
Utah Academy of Science, Arts, & Letters
Dixie State University - St. George, Utah (April 11–12, 2014)
Abstract
The relative solvolysis rates of norbornenyl derivatives have been of interest due to enhanced reactivity relative to the historic anti-7-norbornene. It has been suggested that through-space interactions between adjacent 7∏-bonds is the source for many of the observed enhancements. This explanation has also been disputed owing to similar enhancements for compounds without adjacent 7∏-bonds. We report on our current computational study of eleven norbornenyl compounds using the Becke, three-parameter, Lee-Yang-Parr hybrid density functional method to evaluate the effects of through-space interactions on the stability of the resulting carbocations. It was found that eight of the studied compounds are predicted to undergo molecular inversion wherein the 7∏-bonds that were adjacent in the crystal structure move away from each other, precluding the possibility of interactions through space. Molecular orbital analysis of the three non-inverting carbocations shows strong evidence for through-space interactions. The effects of these interactions were correlated with empirical solvolysis rates.
Millet

159
Irene Ryan Auditions at the Kennedy Center American College Theatre Festival Kacee Neff
Mentor: Jenny Kokai
Kennedy Center American College Theatre Festival
Dixie State College - St. George, Utah (February 10–14, 2015)
Abstract
Scholars in the theatrical arts are constantly faced with the challenge of assigning academic achievement to a subjective performance. How can students best demonstrate their growth as artists? In an effort to answer this question, The Kennedy Center American College Theatre Festival holds regional and national conferences each year to provide students the opportunity to present their work and compete against other students for scholarships and recognition. One facet of the festival is the Irene Ryan audition. During the school year, participating colleges submit their shows for an adjudication in which KCACTF respondents choose Irene Ryan nominees. These nominees can then attend the festival to present two scenes and a monologue to showcase their work and be awarded scholarships for said work. As one of nine Irene Ryan nominees from Weber State University, I will attend KCACTF this February to audition for the scholarship. In my scenes and monologue, I will strive to present my very best work, representative of the high-quality theatre program offered by Weber State. Through my participation, I hope to gain a better understanding of myself as an actor by exploring my type in my selected scenes. The Irene Ryans are also an excellent opportunity to practice presenting myself effectively in front of a variety of audience and venue types. Above all else, I will conduct myself as an ambassador for the university, seeking to paint a positive picture of Weber State and all it has to offer to prospective students.
Neff

160
Attitudes Toward Obesity and Their Effect on Discrimination in the Hiring Process Hendrik Ombach & Lyndsi Drysdale
Faculty Mentor: Todd Baird
Abstract
This study aimed to look at the effects of obesity, sex, personality perception, and discrimination in the hiring process. Recent findings suggest that individuals are discriminated against for being obese when applying for jobs and women have long been discriminated against in the workplace. This study looked to combine the two variables (obese vs. nonobese and male vs. female) as well as employer (participant) BMI and their perceived personalities of the applicants to measure relationships in the degree of negative attitudes toward obese persons. The participants in the study were students at Weber State University. They were given a job description and a resume for one of four applicants. All resumes were exactly alike, except for the weight and sexes of the applicant were manipulated. Photoshop was used to alter their weight to control for outside variables affecting attitudes toward the applicants. The resume was shown to the participant and the participant then rated how likely they were to hire, consider the person for a leadership position, and suggested starting salary. Participants filled out the Big Five Personality scale on how they perceive the personalities of the applicants. Afterwards they filled out the Attitudes Toward Obese Persons Scale to assess their overall attitudes towards obese individuals. The study showed no significant difference in likeliness to hire, leadership consideration, or salary based on whether the person was obese or not. Obese participants showed more positive scores than nonobese individuals on the Attitudes Toward Obese Persons scale, which is contradictory to past findings that obese persons show similar discriminatory towards obese individuals as nonobese individuals do. Compared to past findings, Weber State students show significantly less levels of discrimination in the workforce than other studies, suggesting a possible shift in negative attitudes toward obese individuals or a need to better control outside variables.
Ombach & Drysdale

161
Developing an Intervention for Post-Concussion using Baseline Data Jolin Petersen
Mentor: Jordan Hamson-Utley
Rocky Mountain Athletic Trainers’ Association Symposium
Provo, Utah (April 10–13, 2014)
Abstract
Context: Current post-concussion treatment is highly variable across sport settings and within the NCAA college setting. A common focus of treatment is to minimize symptoms, which is correlated with the return to play evaluation. Common symptoms include visual disturbances, headaches, and difficulty sleeping and/or experiencing quality sleep. Another common theme in post-concussion care is limiting activity; resting following a concussion has been correlated with symptom resolution.
Objective: To determine baseline data in a healthy college-aged population including sleep quality, sleep quantity , average daily activity on a college campus, and average activity at rest while confined to a home setting. This data aids in developing a post-concussion treatment protocol by quantifying “rest” as a step count and by examining the average sleep quality that college-students achieve.
Design: Observational , gathering of normal daily activity and sleep patterns. Setting: College campus, Ogden, Utah. Patients or Other Participants: Nineteen (n=16 females; n=5 males) healthy college-aged participants (26.7± 6.2 yrs; 169.5±11.Scm; 78.2±25.2kg) with no current concussion.
Main Outcome Measures: Sleep quality (measured by restlessness or number of awake times during the seeping bout), sleep quantity (measured by total hours asleep in the bout), average daily activity as a college student (measured by step count) an limited activity being confined to the home (measured by step count of six trips around the house for daily living activities). The Fitbit
Petersen

162
Flex was utilized to collect all sleep and step data. Descriptive statistics were utilized to illustrate values of the variables collected. Results: Average daily activity for college-aged participants was 6781.5±2548.17 steps. Average daily activity when confined to the home was 662.8±48.5 steps. Average sleep quantity was 7.12±0.88 hrs. Average restlessness at night was 26.5±6.10 times awakened. Conclusions: Understanding activity levels of college students is an important step in developing a comprehensive post-concussion care plan. Using the Fitbit Flex watch is an inexpensive way to implement a step count limit by notifying the athlete when they have reached a certain step count (through vibration alarm), indicative of “enough activity” for that day. Assessing the quantity and quality of sleep that the athlete is achieving post-concussion may also be correlated with symptom resolution.
Petersen

163
She Loves Me: A Confectionary Challenge William Peterson
Mentor: Catherine Zublin
Kennedy Center American College Theatre Festival.
Region VIII (KCACTF)
St. George, Utah (February 10–15, 2014)
Abstract
She Loves Me, by Joe Masteroff, with lyrics by Sheldon Harnick, and music by Jerry Bock, is a musical about love – its follies, pleasures, surprises, and sweetness. The story begins outside an upscale parfumerie in the city of Budapest, Hungary, where we are introduced to two characters, George Novack and Amalia Balash – co-workers, but secretly dear friends and, later, lovers by pen-pal – who are constantly at odds with one another. The plot revolves around their experiences in coming to terms with their affection for one another, and the struggles other characters face in their relationship as it relates to love.
Going into the production process of this show, it became apparent that sweetness, joy, and love needed to be a driving aspect of the design process. Jim Christian, director, expressed his overarching concept for the production – namely, “She Loves Me is a confection”. Bearing this concept in mind, I proceeded to design lighting which would enhance the audience’s awareness of the sweetness in their lives and the lives of the characters.
A warm palette of colors was chosen, which would simultaneously convey accurately the atmospheres of excitement, love, romance, betrayal, and affection, as well as compliment the work of the other designers. Deep and lush reds, pinks, and violet were used to convey romance, intrigue, and love in the scene at the Café Imperiale a mecca of romance in the first act. Cool blue and lavender toners from two box boom positions in a lower degree angle were employed to fill in shadows and assist in portraying an evening glow.
Peterson

164
In addition to the romantic needs of the production, there were three distinct seasonal changes which needed to occur. Having done research of the approximate color temperature of the sun at mid-day in summer, autumn, and fall, I was able to, through careful color and toner mixing, create unique looks for each of the three different seasons. Warm amber marginally cooled down with a cold blue reflected the bright, warm feeling of noon-day summer sun. Warm amber saturated with a touch of light orange conveyed the warmer glow of autumn. From autumn, a stark shift into winter was accomplished by fading most of the amber, increasing the intensity of the cold blue and adding a no color wash of the PARs in the backlight system.
Given the overall concept of She Loves Me being a confection, I was emotionally attentive to the needs of each number and accurately convey ‘sweetness’ everywhere it is found in this production. The result is a beautiful, sensitive production which leaves the audience feeling warm and good. The process of lighting design – from initial familiarization with the script, historical research, consolidation of inspiration, technical drafting of paperwork, lighting focus, cueing and revising, all the way to opening night - is emotionally invigorating, technically challenging, and immensely satisfying.
Peterson

165
Determining Late Holocene Environmental Conditions for the Bobcat Rockshelter, Idaho Dusty Pilkington
Mentor: Julie Rich
Association of American Geographers Annual Meeting 2014
Tampa Convention Center - Tampa, Florida (April 7–12, 2014)
Abstract
Bobcat Rockshelter is a Northern Shoshone camp in Skull Canyon, Idaho, first excavated in 1960 by Idaho State University’s Earl Swanson. The site was a hunting base, with butchered remains of large/small game animals. The site was further excavated summer 2012, uncovering eight distinct strata. Historical remnants constrain the depositional timing for strata 1 through 3 to >1850. Strata 4, 6 and 8 are fluvial sediments,while 5 and 7 are colluvium from a limestone overhang . Optically Stimulated Luminescence (OSL) provided age control on strata 4 through 8. Depositional timing for these strata was compared to regional proxy data provided by others to determine climatic conditions for the Bobcat Rock shelter. Stratum 4 age estimates indicate deposition between 952-1312 AD. Dendrochronology data from Yellowstone National Park (YNP) and aeolian activity at nearby St. Anthony Dunes indicate drought conditions while stratum 4 was being emplaced. Stratum 5 was stratigraphically incoherent, due to impartial sediment bleaching. Stratum 6 was emplaced between 532-1372 AD, a period correlating with a drought episode detected in YNP archeological records, enhanced accretion at St. Anthony Dunes, and tree-ring data indicating Four Corners drought ~700-900 AD. Stratum 7 age-estimates ranged from 422-842 AD, which generally correlate with drought activity ~699-823 AD, determined from California sequoia dendrochronology . OSL dates for stratum 8 ranged from 658 BC-58 AD, a period when Wyoming Basin cave middens indicate a mesic climatic. Varying climatic conditions likely influenced Shoshone lifestyles at the Bobcat Rockshelter during the time when strata 4 through 8 were emplaced.
Pilkington

166
Irene Ryan Scholarship Competition Tanner Rampton
Mentor: Jenny Kokai
Kennedy Center American College Theatre Festival
Dixie State College - St. George, Utah (February 9–15, 2015)
Abstract
An actor cannot learn solely by doing. Seeing and experiencing are also key factors in the growth of a successful actor. This spring, I will be doing all of those things by participating in the Irene Ryan Scholarship Competition at the Kennedy Center American College Theatre Festival at Dixie State University. Along with performing and testing material I have selected, I will also be viewing other nominee’s auditions and discovering what works well. Because this festival is out of town and a piece of my material requires a musical accompanist, a Research Travel Grant would help immensely.
Rampton

167
Outcomes and Complications of Capsule Endoscopy in a Community Gastroenterology Practice Jordan Smith & Chad Gonzales
Mentor: Chad Gonzales
Western Student Medical Research Forum
Monterey, California (January, 23–25, 2014)
Abstract
Purpose of study: Capsule endoscopy (CE) is used to diagnose small bowel pathology and has favorable diagnostic yield when compared to other available technologies. Primary indications for CE include obscure gastrointestinal bleeding in adults, suspected Crohn’s disease, and small bowel tumors. While CE has been successful in this regard, there are relatively few studies that evaluate outcomes specific to a small community private practice environment. Methods used: Between 2007 and 2012, 265 patients underwent CE testing in a community GI clinic. A retrospective chart review of these patients was conducted. Electronic and paper medical records were analyzed for demographic information, CE indications, pertinent findings and interventions. Sub-group analysis was performed.
Summary of results: CE was performed for evaluation of iron deficiency anemia in 65.7% of patients, occult GI bleeding (39.3%), rectal bleeding (31.7%), abdominal pain (20.7%) and diarrhea (18.11%). Overall diagnostic yield was 82.3%. The most common findings were gastritis (34%), artery venous malformations (AVMs) (19.9%), small bowel ulcers or erosions (9.9%) and miscellaneous (18.5%). 17.7% of studies were normal. Relevant pathological findings were identified in patients with iron deficiency anemia
Smith & Gonzales

168
(72.9%), occult GI bleeding (76.9%), rectal bleeding (76.2%) and abdominal pain (80%).
Complications due to capsule retention occurred in 3 patients (1.1%) all of whom had Crohn’s disease with small bowel strictures, ulcers or erosions. The capsule passed spontaneously in 2 patients by 3 weeks. The capsule was retained for 3 months in the other patient with known Crohn’s and was removed by surgery. Capsule transit to the colon was delayed in 18 patients (6.8%) affecting completeness of the study. NSAID discontinuation was recommended in 21.5% of patients. Additional diagnostic studies were recommended in 23% of patients. Iron replacement therapy in 12.3% of patients.
Conclusions: Wireless CE in community GI practice is a useful study in evaluation of small bowel pathology with high diagnostic yield. CE is safe with very few complications. Capsule retention was infrequent occurring in only 1% of patients. Abnormally slow capsule transit occurred in 5% of studies and impacted completeness of the study.
Smith & Gonzales

169 Standley
Internet Usage, Personality, Narcissism, and Motivations for Facebook Usage Corbin J. Standley, Crystal Garcia, Kaitlin Staker,
& Lyndsi Drysdale
Mentor: Shannon McGillivray
Utah Conference on Undergraduate Research
Dixie State College - St. George, Utah (February 27, 2015)
Rocky Mountain Psychological Association Conference
Boise, Idaho (April 9-11, 2015)
Abstract
The extant research suggests that there are relationships between differing personality types and Internet and Facebook usage (e.g., Buffardi & Campbell, 2008; Ross, et al., 2009). To that end, the present study aims to determine which personality traits, including narcissistic traits, predict Internet and Facebook usage. In addition, it examines specific motivations for continued and consistent use of the social media site, including the types of activities one engages in while using Facebook. Participants completed a 94-item survey measuring narcissism, the Big Five Personality dimensions, Facebook usage, specific activities (e.g., unfriending, blocking others), and motivations (including emotional motivations) for using Facebook. Analyses revealed significant relationships between hours spent on Facebook and the Agreeableness and Neuroticism personality dimensions. The Openness dimension was also found to be significantly correlated with unfriending people due to controversial posts. Lastly, those scoring higher on the Narcissism scale were more likely to feel angry as a result of being unfriended.

170
Religiosity, Personality, and Attitudes Toward Homosexuality Corbin Standley
Faculty Mentor: Theresa Kay
Abstract
The extant research regarding the relationship between religious affiliation and attitudes toward homosexuality is extensive, yet shallow. While some research suggests a significant positive correlation between religiosity and negative attitudes toward homosexuality (Ingelhart, 2000), other studies show different results dependent on religious motivations, affiliations, and activity (Besen & Zicklin, 2007; Burris, 1999). To that end, the current study examined the interplay between religiosity, personality dimensions, and attitudes toward homosexuality. A correlational survey methodology was utilized attempting to measure religious activity and motivations, personality dimensions, and attitudes toward various policy areas as relevant to homosexuality (including marriage, adoption, and military service). Initial analyses reveal a significant negative correlation between public and private religious practice and positive attitudes toward homosexuality such that those scoring higher on the religious practice scales report more conservative views of homosexuality. Moreover, findings reveal a strong positive correlation between the Openness to Experience personality dimension and positive attitudes toward homosexuality such that those expressing more openness exhibited more liberal views toward homosexuality. The results of this study will lead to a better understanding of the ways in which religious affiliation and religious activity differ in regard to attitudes toward homosexuality. Further, implications concerning personality traits in relation to such attitudes can be drawn from these results.
Standley

171
Irene Ryan Scholarship Competition Nicole Waite
Mentor: Jenny Kokai
Kennedy Center American College Theatre Festival
Dixie State College - St. George, Utah (February 9–15, 2015)
AbstractMy name is Niki Waite and I will be competing at the Kennedy Center American College Theater Festival. I am a senior in the Musical Theatre Program at WSU. I got an Irene Ryan nomination for my performance as Ilona Ritter in WSU’s production of She Loves Me in the fall of 2014. It is a huge honor to compete at this festival. I get to compete for scholarship money, learn what theatre material works best for me, and gain more knowledge in the performing arts. “Actors, who should pride themselves on their singularity, are forever trying to be someone else. It isn’t necessary for you, the actor, to like yourself-self-love isn’t easy come by for most of us but you must learn to trust who you are. There is no one else like you” (Shurtleff 3). I hope to learn what kind performer I could become in this competition. I feel like I have been learning to trust myself as a performer throughout my years at WSU. By competing in this acting competition I will be able to showcase my talent by doing two scenes and a monologue. This past semester I have been preparing to compete at this competition. A travel grant would help me get to this wonderful competition and further my education as an actor.
Waite

172Washburn
Love Related Behaviors and Marital Satisfaction in the United States and Ecuador Michelle Washburn
Mentor: Paul Schvaneveldt
National Council on Family Relations
San Antonio, Texas (November 6–9, 2013)
Abstract
This study is focused on the communication of love and how that in turn relates to marital satisfaction among 462 individuals (120 matched Ecuadorian couples and 111 matched U.S. couples). There are several ways in which partners express love to each other, such as shared activities and events, verbal expression of emotions and love, behavioral activities, sharing of gifts and/or notes, and physical expressions of love. Chapman (2004) theorized that when couples perceive that their partner expresses love in their preferred love expression type, or ”love language,” then relationship satisfaction would be higher. Previous research among Ecuadorian couples found that individuals with greater levels of emotional expressivity reported higher levels of marital satisfaction (Ingoldsby, Horlacher, & Schvaneveldt, 2005). It was hypothesized that greater levels of congruency between expression of love by one’s spouse and one’s preference for receiving love messages would result in higher marital satisfaction. Conversely, a mismatch with high importance and low expression would result in lower levels of marital satisfaction. Marital satisfaction was measured by the Seven-Item Short Form of the Dyadic Adjustment Scale (Hunsley, et al., 2001). Expression and preference of love related behaviors was measured by the Measures of Expressions of Love rating scale (Goff, et al., 2007). Both scales exhibit high levels of reliability. A one-way analysis of variance (ANOVA) was conducted to identify differences, if any would be found, in levels of marital satisfaction for men and women by a match in preferred

173
love language and their partner’s expression of behaviors related to that love language, a mismatch, or when both report lower levels in preferences and expressions of love. Results found support for the hypotheses. Implications for educators, therapists, and cultural studies professionals will be discussed. It is hypothesized that a couple that places high importance on a love language that is expressed frequently (a match) will result in higher marital satisfaction opposed to a mismatch with high importance and low expression. Having low levels of both importance and expression are also explored in relation to marital satisfaction.
Washburn


