Embed Size (px)
Citation preview
1 2 3 4 5 6 7 8 9 10 11 12 13 14 15 16 17 18 19 20 21 22 23 24 25 26 27 28 29 30 31 32 33 34 35 36 37 38 39 40 41 42 43 44 45 46 47 48 49 50 51 52 53 54 55 56 57 58 59 60 61 62 63 64 65
Leyla Zhuhadar, Olfa Nasraoui
Knowledge Discovery and Web Mining Lab
Department of Computer Engineering and Computer Science
University of Louisville, KY 40292, USA.
Robert Wyatt
The Office of Distance Learning
Division of Extended Learning and Outreach
Western Kentucky University, KY 42101, USA.
Visual Knowledge Representation of
Conceptual Semantic Networks
Springer
ManuscriptClick here to download Manuscript: Visual_Knowledge_Representation_of_Conceptual_Semantic_Networks.psClick here to view linked References
1 2 3 4 5 6 7 8 9 10 11 12 13 14 15 16 17 18 19 20 21 22 23 24 25 26 27 28 29 30 31 32 33 34 35 36 37 38 39 40 41 42 43 44 45 46 47 48 49 50 51 52 53 54 55 56 57 58 59 60 61 62 63 64 65
Abstract This article presents methods of using visual analysis to visually represent large amounts of massive,
dynamic, ambiguous data allocated in a repository of learning objects. These methods are based on the semantic
representation of these resources. We use a graphical model represented as a semantic graph. The formalization
of the semantic graph has been intuitively built to solve a real problem which is browsing and searching for
lectures in a vast repository of colleges/courses located at Western Kentucky University1. This study combines
Formal Concept Analysis (FCA) with Semantic Factoring to decompose complex, vast concepts into their prim-
itives in order to develop knowledge representation for the HyperManyMedia2 platform. Also, we argue that
the most important factor in building the semantic representation is defining the hierarchical structure and the
relationships among concepts and subconcepts. In addition, we investigate the association between concepts
using Concept Analysis to generate a lattice graph. Our domain is considered as a graph, which represents the
integrated ontology of the HyperManyMedia platform. This approach has been implemented and used by online
students at WKU3.
1.1 Introduction
This study combines Formal Concept Analysis (FCA) with Semantic Factoring to construct and develop a
multilingual ontology. In a nutshell, it answers the following question: “How is it possible to visualize an
ontology graph which represents knowledge and reasoning of a massive, ambiguous, and vast set of documents
using minimum vocabulary?” The model is built upon a variety of principles that we adopt. First, we use Zipf’s
law: “The Principle of Least Effort [36]”, Zipf found a clearcut correlation between the number of words and
the frequency of their usage, it is presented as r · f = c, where r is the word’s rank in a document and f its
frequency of occurrence. We rely on this significant finding by minimizing the amount of effort we put to create
the user ontology. The most frequent vocabulary that represent the corpus in our domain (E-learning) is used.
In this sense, we observe the most frequent keywords searched by users, this information is obtained from the
users’ logs. Our assumption is the following: “if we capture the most frequent words used by an online user,
then adding these words to the user ontology, the information retrieval model would provide the user with the
most relevant documents in both languages. Second, we use the concept of “ Collocation”, which proved to be
important in areas, such as machine translation and information retrieval [18]. Manning and Scutze [18] divided
the “Collocation Concept” into three categories: (1) compounds, such as “semantic web”, (2) phrasal verbs,
such as “turn on”, and (3) stock phrases, such as “ Introduction to Literature”. The third type is what we used
in constructing our ontology. Since our users (students) spent 80% of their time searching for topics related to
the following categories: (1) course name, (2) lecture name, and (3) professor name. Therefore, constructing an
ontology that consists of collocations (e.g., “Game Theory for Managers”) would increase the precision. Third,
we used personalization to decrease the ambiguity of semantic search. Each user activity on to the system
defines his/her area of interest (college/courses), therefore, a unique ontology is generated for each user. As a
consequence, the search terms used by a user are governed by his domain of interest (e.g., if a user is searching
for the keyword “History”, if he is enrolled in Mathematics, the system should retrieve course “History of
Mathematics”, but if he is enrolled in the college of History, the same keyword search will retrieve the course
“History of Civilization”). The effectiveness of our model comes from the synergy between all the previous
principles.
Before diving into the theory and the methodology of implementing the system, let us begin with some de-
scriptive definition of the system: HyperManyMedia is an information retrieval system that utilizes an ontology
based model and provides semantic information. This approach uses two different types of ontologies, a global
ontology model that represents the whole E-learning domain (content-based ontology), and a learner-based on-
tology model that represents the learner’s profile. The implementation of the ontology model is separate from
1 http//HyperManyMedia.wku.edu2 HyperManyMedia: We proposed this term to refer to any educational material on the web (hyper) in a format that could be a
multimedia format (image, audio, video, podcast, vodcast) or a text format (HTML webpages, PHP webpages, PDF, PowerPoint)3 http://www.wku.edu
1 2 3 4 5 6 7 8 9 10 11 12 13 14 15 16 17 18 19 20 21 22 23 24 25 26 27 28 29 30 31 32 33 34 35 36 37 38 39 40 41 42 43 44 45 46 47 48 49 50 51 52 53 54 55 56 57 58 59 60 61 62 63 64 65
the design of the information retrieval system. The architecture of the HyperManyMedia system can provide,
manage, and collect data that permits high levels of adaptability and relevance to the learner’s profile. To achieve
this objective, an approach for personalized search is implemented that takes advantage of the Semantic Web
standards (RDF and OWL) to represent the content and the user profiles.
The main focus of this paper is the visual representation of the ontology that allows learners to navigate
the system visually. The main objective of this research was to provide the user (learner) with a visual search
engine to summarize the entire domain (E-learning). This can be considered as a tool to help visualize concepts
and subconcepts. This visual exploration of documents enables users to have an overall view of the entire
repository, without even clicking on the resources and reading each document. When a user types a query on the
visual search engine, the visual search engine dynamically matches the query with the whole visual ontology
(concepts, subconcepts, etc). The visual search engine presents all the sectors (concepts/subconcepts) that share
the typed letters using different colors than the unmatched concepts. Therefore, the user can find what he/she is
looking for immediately. As the user adds more letters to his/her query, the number of matched sectors narrows
down to the most similar concepts in the ontology.
The primary contribution to the State of the Art made in this research is in the reuse of the domain ontology
to build visual search facets, where the hierarchic ontology structure was converted into a lattice (graph) and
presented as nodes and edges, where the final representation of the graph is provided to users as sectors and
subsectors.
The rest of this paper is divided into the following sections:
Section 2 (Background and Related Work): We give an overview of visual analytics, applications, and related
work.
Section 3 (Methodology): This section presents the semantic domain structure and the representation of the
semantic domain.
Section 4 (Implementation): This section presents the process of building the HyperManyMedia ontology,
then adding the ontology to the search engine. It ends with designing a visual ontology search engine.
Section 5 (Evaluation): In this section, we test the usability of the visual search engine.
Section 6 (Conclusion): In this section, we present the novelty of our research and our contribution.
1.2 Background and Related Work
In the section, we introduce the definition of visual analytics, then we define several visual applications, and
finally discuss related work and the significance of our visual analytic methods and techniques.
1.2.1 Visual Analytics
Everyday, data is produced with unprecedented rates in variety of fields, examples include scientific data, in-
ternet information, data management systems, business and marketing data, etc. Visual analytics is the bridge
between the human eyes and the machine, it facilitates the process of: a) discovering hidden knowledge, b)
summarizing data, c) representing data in a manner that the human cognitive system can perceive, d) helping
users find needed information as fast as possible, or e) allowing users to interact with huge amounts of data
easily and efficiently.
Thomas and Cook define visual analytics as “the science of analytical reasoning facilitated by interactive
visual interfaces [27]”. Visual analytics differs from other analytics applications by its capability to simplify
complex data to provide users with quick, focused representations where users can interact with data, find the
important features they are looking for, and translate the data into a visual aspect that their cognitive reasoning
process can decipher in a fast manner [27]. However, visualization tools rely on methods driven from data
mining, statistics, or mathematics, etc. As a consequence, designing an effective visualization tool is not an
easy process, since summarizing data involves filtering out part of the data, choosing some features at the
1 2 3 4 5 6 7 8 9 10 11 12 13 14 15 16 17 18 19 20 21 22 23 24 25 26 27 28 29 30 31 32 33 34 35 36 37 38 39 40 41 42 43 44 45 46 47 48 49 50 51 52 53 54 55 56 57 58 59 60 61 62 63 64 65
expense of others, and zooming into specific aspects in the data. Choosing the right parameters for filtering data
is a deceiving process that involves varieties of methods. Therefore, an efficient visualization tool should have
a flexible, interactive, dynamic interface in which users have the capability of changing those parameters and
deciding which features to filter-out and which ones to keep.
1.2.2 Visual Analytic Applications
There are several visual analytic applications, each dedicated to a specific purpose. The following list is not
an exhaustive list of applications, but it provides an overview about the most recent areas of research where
visualization became essential:
a) Topic summarization: e.g., understanding newspaper articles, stories, reporting events, investigating crime
reports, finding patterns in blogs, following the development of political campaigns, or observing topic trends
in the bibliography of research approaches [7, 3, 25];
b) Visual Analysis of Social Networks: e.g., analyzing dynamic groups memberships in temporal social net-
works by using graphical representations [10, 12, 17, 6, 29];
c) Visual Clustering Analysis: e.g., using data mining techniques to find patterns in data to generate group of
data based on (dis)similarity. Several visualization tools have been developed in this domain and gained great
popularity, to mention some [21, 2, 28, 5, 30];
d) Semantic Visual Analysis: e.g., visual analysis of webpage/documents based on the semantic representation
of text in a “semantic graph” [23, 8, 9, 22, 31], or exploring data in folksonomy systems based on a hierarchical
semantic representation, “semantic cloud or tags” [11, 14, 24, 23, 4, 15, 16, 22, 26].
1.2.3 Related Work
Our research focuses on (c) and (d) categories, where each category assists in representing, visually, a huge,
massive, dynamic, ambiguous data allocated in a repository of learning objects. We noticed that there was a
high overlap between our work and several other related efforts, due to the fact that our research is built upon
several areas of research, spanning knowledge extraction based on the hierarchical semantic representation,
cluster analysis, and finally visual analysis.
Recently, there has been significant of interest in using visual analytics in variety of research fields, for
example [23, 22] used visual analysis to present documents as a semantic directed graph, in this approach, Delia,
et al took advantage of natural language processing to define named entities/co-referenced entities where triplets
(subject, predicate, object) were extracted using the Penn Treebank parser for each sentence in the document
and then associated to WordNet, finally a summarization of the documents was provided using machine learning
techniques. Another work was introduced in [29] in which a visual analytics tool was used to present data as an
interactive graph, it provides the visualization of social networks to explore communities across time, a major
interesting feature in this tool is the capability to provide relations among communities, events, or evolution
of neighborhoods. The similarity with our work lies in the usage of a graph to represent documents, however,
the major difference is that our approach is based on the semantic representation of a graph in real time and
we use the visual analytics tool not only to summarize the data, but also allow the user to browse the data and
retrieve documents. [9] extented their previous work in [23, 22] to a question/answering based semantic graphs,
where the sentences that have been extracted from the documents using natural language processing techniques
were saved and used to implement a question answering system and it was used as an interface for search. Aras,
Siegel, et al presents a new approach of extracting semantics from popular folksonomy systems to visually
explore the data using hierarchical semantic representation [1].
Our approach starts with a similar concept to the work presented in [23, 22] by converting documents into
a semantic directed graph, however, our approach is a web-based application, that evolves dynamically in real
time. In addition, we rely on the semantic relationship between entities more than the representation of sentences
1 2 3 4 5 6 7 8 9 10 11 12 13 14 15 16 17 18 19 20 21 22 23 24 25 26 27 28 29 30 31 32 33 34 35 36 37 38 39 40 41 42 43 44 45 46 47 48 49 50 51 52 53 54 55 56 57 58 59 60 61 62 63 64 65
in the documents. The idea is to present the hierarchical structure of concepts and subconcepts as a semantic
graph. Also we use information retrieval techniques in order to retrieve documents related to the users’ interest,
moreover, we use clustering analysis to add additional subconcepts to the directed graph.
1.3 Methodology
1.3.1 Semantic Representation of HyperManyMedia
1.3.1.1 Formal Context Representation
The section is concerned with the representation of the semantic model (semantic set). Kavouras and Kokla[13]
defines a formal context, SG (Simple Conceptual Graph) as a triple (D, δ , α) where D is a set of objects and δ
is a set of attributes and α defines the relationship between D and δ .
For example let us build a model (D, δ , α) satisfying G, which in our case represents a semantic representation
of the HyperManyMedia domain.
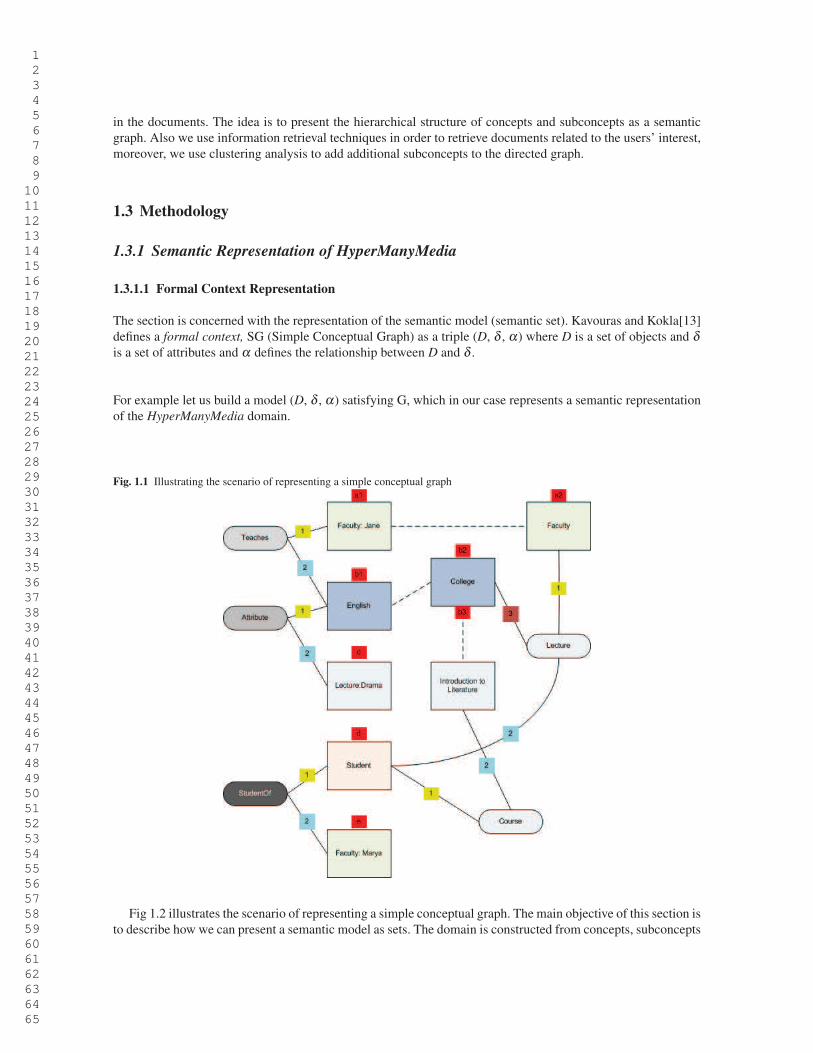
Fig. 1.1 Illustrating the scenario of representing a simple conceptual graph
Fig 1.2 illustrates the scenario of representing a simple conceptual graph. The main objective of this section is
to describe how we can present a semantic model as sets. The domain is constructed from concepts, subconcepts
1 2 3 4 5 6 7 8 9 10 11 12 13 14 15 16 17 18 19 20 21 22 23 24 25 26 27 28 29 30 31 32 33 34 35 36 37 38 39 40 41 42 43 44 45 46 47 48 49 50 51 52 53 54 55 56 57 58 59 60 61 62 63 64 65
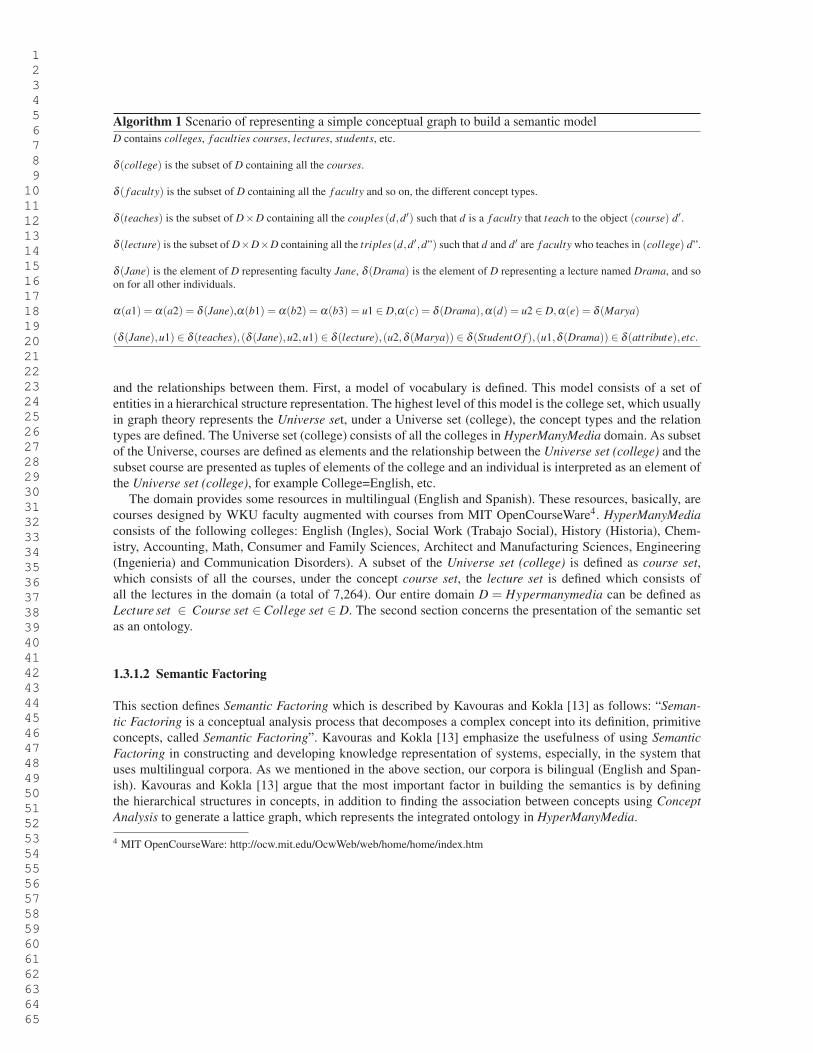
Algorithm 1 Scenario of representing a simple conceptual graph to build a semantic model
D contains colleges, f aculties courses, lectures, students, etc.
δ (college) is the subset of D containing all the courses.
δ ( f aculty) is the subset of D containing all the f aculty and so on, the different concept types.
δ (teaches) is the subset of D×D containing all the couples (d,d′) such that d is a f aculty that teach to the object (course) d′.
δ (lecture) is the subset of D×D×D containing all the triples(d,d′,d”) such that d and d′ are f aculty who teaches in (college) d”.
δ (Jane) is the element of D representing faculty Jane, δ (Drama) is the element of D representing a lecture named Drama, and so
on for all other individuals.
α(a1) = α(a2) = δ (Jane),α(b1) = α(b2) = α(b3) = u1 ∈ D,α(c) = δ (Drama),α(d) = u2 ∈ D,α(e) = δ (Marya)
(δ (Jane),u1) ∈ δ (teaches),(δ (Jane),u2,u1) ∈ δ (lecture),(u2,δ (Marya)) ∈ δ (StudentO f ),(u1,δ (Drama)) ∈ δ (attribute),etc.
and the relationships between them. First, a model of vocabulary is defined. This model consists of a set of
entities in a hierarchical structure representation. The highest level of this model is the college set, which usually
in graph theory represents the Universe set, under a Universe set (college), the concept types and the relation
types are defined. The Universe set (college) consists of all the colleges in HyperManyMedia domain. As subset
of the Universe, courses are defined as elements and the relationship between the Universe set (college) and the
subset course are presented as tuples of elements of the college and an individual is interpreted as an element of
the Universe set (college), for example College=English, etc.
The domain provides some resources in multilingual (English and Spanish). These resources, basically, are
courses designed by WKU faculty augmented with courses from MIT OpenCourseWare4. HyperManyMedia
consists of the following colleges: English (Ingles), Social Work (Trabajo Social), History (Historia), Chem-
istry, Accounting, Math, Consumer and Family Sciences, Architect and Manufacturing Sciences, Engineering
(Ingenieria) and Communication Disorders). A subset of the Universe set (college) is defined as course set,
which consists of all the courses, under the concept course set, the lecture set is defined which consists of
all the lectures in the domain (a total of 7,264). Our entire domain D = Hypermanymedia can be defined as
Lecture set ∈ Course set ∈College set ∈ D. The second section concerns the presentation of the semantic set
as an ontology.
1.3.1.2 Semantic Factoring
This section defines Semantic Factoring which is described by Kavouras and Kokla [13] as follows: “Seman-
tic Factoring is a conceptual analysis process that decomposes a complex concept into its definition, primitive
concepts, called Semantic Factoring”. Kavouras and Kokla [13] emphasize the usefulness of using Semantic
Factoring in constructing and developing knowledge representation of systems, especially, in the system that
uses multilingual corpora. As we mentioned in the above section, our corpora is bilingual (English and Span-
ish). Kavouras and Kokla [13] argue that the most important factor in building the semantics is by defining
the hierarchical structures in concepts, in addition to finding the association between concepts using Concept
Analysis to generate a lattice graph, which represents the integrated ontology in HyperManyMedia.
4 MIT OpenCourseWare: http://ocw.mit.edu/OcwWeb/web/home/home/index.htm
1 2 3 4 5 6 7 8 9 10 11 12 13 14 15 16 17 18 19 20 21 22 23 24 25 26 27 28 29 30 31 32 33 34 35 36 37 38 39 40 41 42 43 44 45 46 47 48 49 50 51 52 53 54 55 56 57 58 59 60 61 62 63 64 65
1.4 Implementation
The HyperManyMedia search engine is an extended version of Nutch5 search engine, which is an open source
information retrieval system. We modified Nutch by adding plugins to support a multi-model search interface,
such as metadata search [33, 34] and semantic search [32, 35] mechanisms. This paper is concerned with our
visual search interface that recently has been added to HyperManyMedia: A Visual Ontology-based Interface.
The following sections describe the implementation of this interface.
1.4.1 Building Multilingual HyperManyMedia Ontology
1.4.1.1 Introduction
The general research field of Multi-language Information Retrieval (MLIR) can be categorized into four major
areas introduced by Peters, Braschler, et al [20] as follows: (a) Multilingual Retrieval, (b) Bilingual Retrieval,
(c) Monolingual Retrieval, and (d) Domain Specific Retrieval. According to Oard and Dorr [19], there are three
different approaches to build a Multi-Language Information Retrieval system: (1) Text Translation Approach,
(2) Thesaurus-based Approach, and (3) Corpus-based Approach. The approach that we followed is a synergistic
approach between (1) The Thesaurus-based Approach and (2) The Corpus-based Approach:
1. The Thesaurus-based Approach
Thesaurus based text retrieval allows the learners to explore more information during the searching process.
The information retrieval system is capable of bringing more insight about the system in a way similar to a
multilingual dictionary, but with visualized hints which can be considered as a powerful tool. We consider our
thesaurus-based approach to be what is called a “controlled vocabulary” approach, since the semantic search
is provided to the user/learner as a hierarchical structure. From the beginning, the search engine presents the
concept of “college” as an upper-level concept and the right-side interface shows the user the subclasses and
the multilingual synonyms, assuming that the user is not aware of the semantic concept, and with time, will
understand the relationship between entities and he/she will be ready to formulate her own query terms. We
consider this approach to be a kind of query expansion.
2. Corpus-based Approach
Our approach can also be considered as Term Vector Translation, which is defined by Oard and Dorr as
follows: “statistical multilingual text retrieval techniques in which the goal is to map statistical information
about term use between languages... techniques which map sets of t f id f term weights from one language
to another [19]”. We used a query translation method to retrieve multilingual documents with expansion
techniques for phrasal translation. Our search engine uses the Vector Space Model to match the query term
with the indexed documents.
This study uses Protégé6, an open source ontology editor and knowledge-based framework that supports two
ways of modeling ontologies: (1) Protégé-Frames, and (2) Protégé-OWL editors to design and build the structure
of the HyperManyMedia ontology. Our current ontology consists of ~32,000 lines of code7.
1.4.1.2 Multilingual Ontology Design
The platform consists of vast resources of Colleges/Courses/Lectures. Table 1.1 shows a summary of Hyper-
ManyMedia resources. The main question is how to design an ontology that can summarize the whole domain?
5 http://lucene.apache.org/nutch/6 http://protege.stanford.edu/7 http://www.wku.edu/~leyla.zhuhadar/semanticowl.owl
1 2 3 4 5 6 7 8 9 10 11 12 13 14 15 16 17 18 19 20 21 22 23 24 25 26 27 28 29 30 31 32 33 34 35 36 37 38 39 40 41 42 43 44 45 46 47 48 49 50 51 52 53 54 55 56 57 58 59 60 61 62 63 64 65
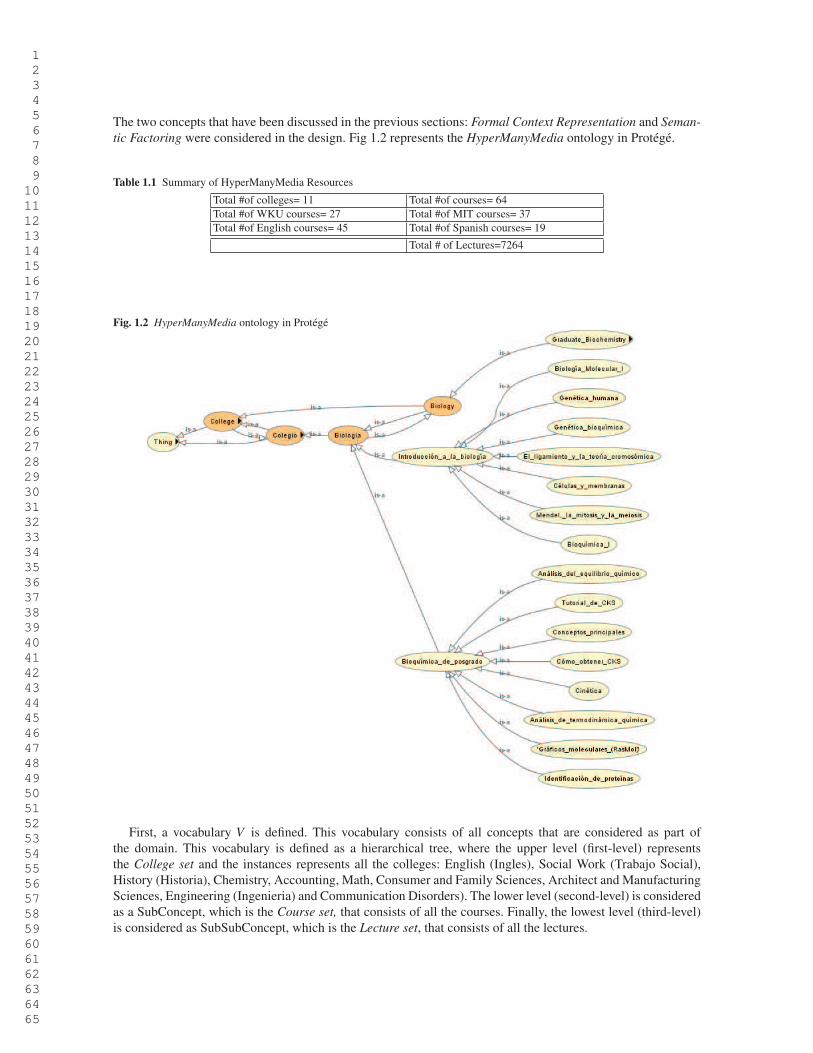
The two concepts that have been discussed in the previous sections: Formal Context Representation and Seman-
tic Factoring were considered in the design. Fig 1.2 represents the HyperManyMedia ontology in Protégé.
Table 1.1 Summary of HyperManyMedia Resources
Total #of colleges= 11 Total #of courses= 64
Total #of WKU courses= 27 Total #of MIT courses= 37
Total #of English courses= 45 Total #of Spanish courses= 19
Total # of Lectures=7264
Fig. 1.2 HyperManyMedia ontology in Protégé
First, a vocabulary V is defined. This vocabulary consists of all concepts that are considered as part of
the domain. This vocabulary is defined as a hierarchical tree, where the upper level (first-level) represents
the College set and the instances represents all the colleges: English (Ingles), Social Work (Trabajo Social),
History (Historia), Chemistry, Accounting, Math, Consumer and Family Sciences, Architect and Manufacturing
Sciences, Engineering (Ingenieria) and Communication Disorders). The lower level (second-level) is considered
as a SubConcept, which is the Course set, that consists of all the courses. Finally, the lowest level (third-level)
is considered as SubSubConcept, which is the Lecture set, that consists of all the lectures.
1 2 3 4 5 6 7 8 9 10 11 12 13 14 15 16 17 18 19 20 21 22 23 24 25 26 27 28 29 30 31 32 33 34 35 36 37 38 39 40 41 42 43 44 45 46 47 48 49 50 51 52 53 54 55 56 57 58 59 60 61 62 63 64 65
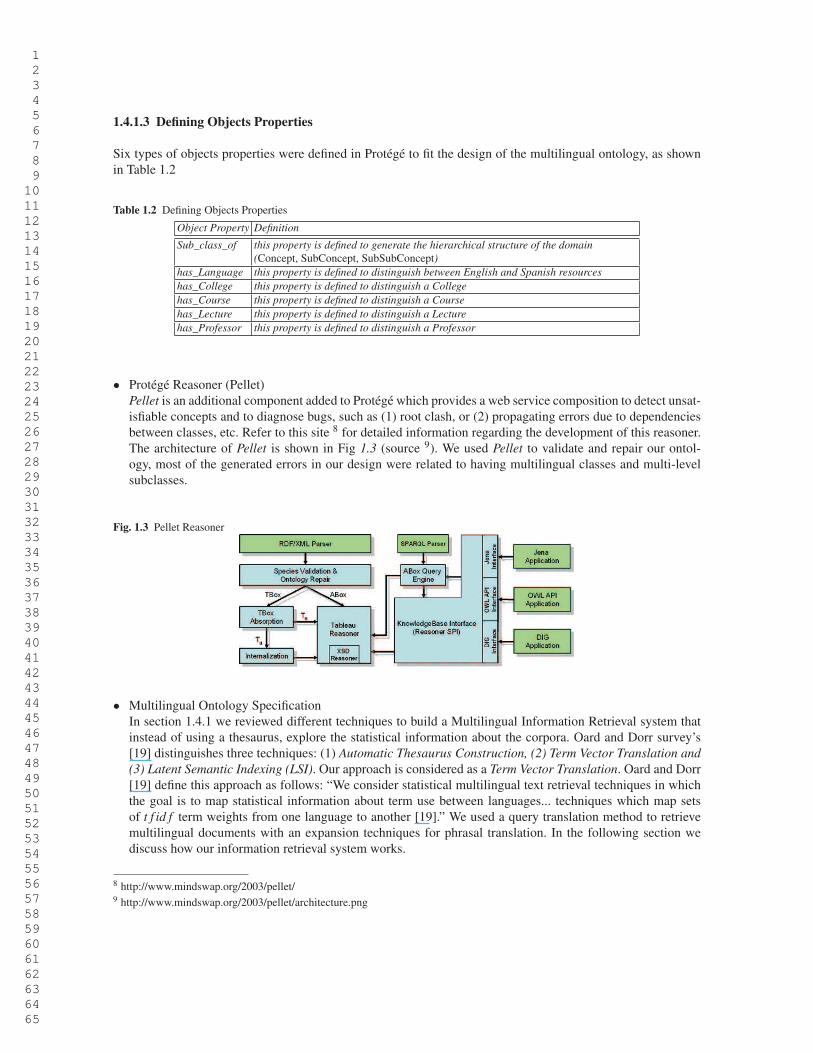
1.4.1.3 Defining Objects Properties
Six types of objects properties were defined in Protégé to fit the design of the multilingual ontology, as shown
in Table 1.2
Table 1.2 Defining Objects Properties
Object Property Definition
Sub_class_of this property is defined to generate the hierarchical structure of the domain
(Concept, SubConcept, SubSubConcept)
has_Language this property is defined to distinguish between English and Spanish resources
has_College this property is defined to distinguish a College
has_Course this property is defined to distinguish a Course
has_Lecture this property is defined to distinguish a Lecture
has_Professor this property is defined to distinguish a Professor
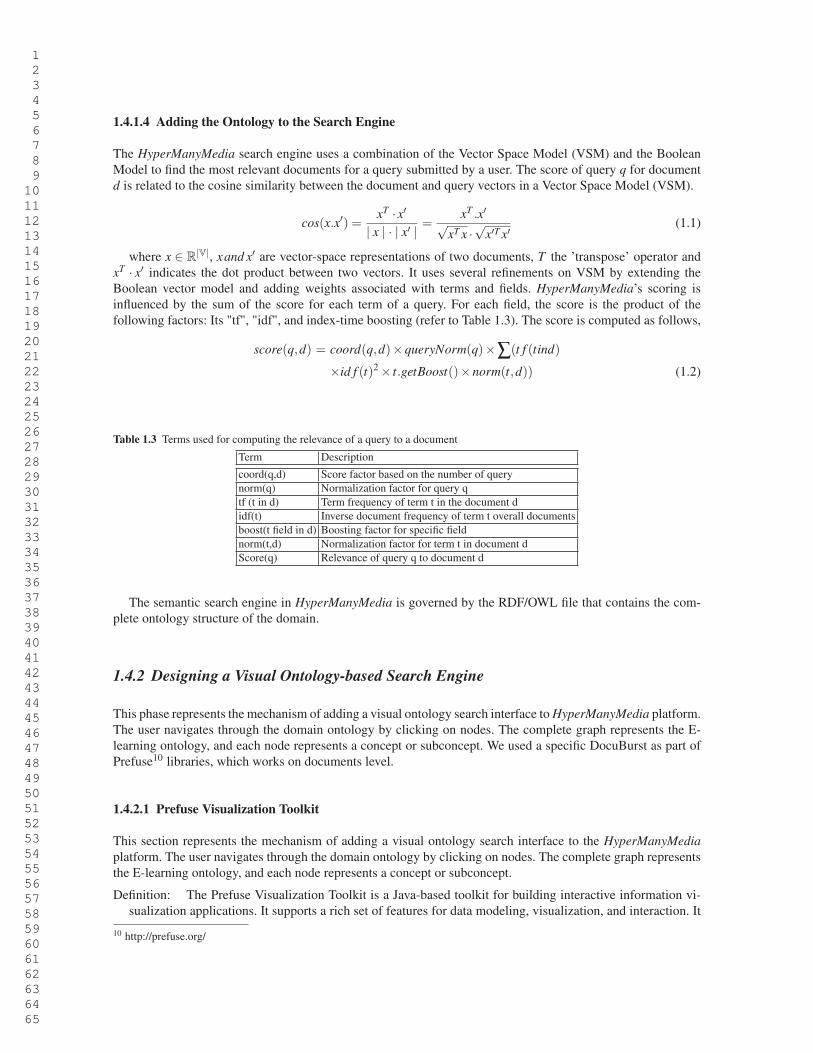
• Protégé Reasoner (Pellet)
Pellet is an additional component added to Protégé which provides a web service composition to detect unsat-
isfiable concepts and to diagnose bugs, such as (1) root clash, or (2) propagating errors due to dependencies
between classes, etc. Refer to this site 8 for detailed information regarding the development of this reasoner.
The architecture of Pellet is shown in Fig 1.3 (source 9). We used Pellet to validate and repair our ontol-
ogy, most of the generated errors in our design were related to having multilingual classes and multi-level
subclasses.
Fig. 1.3 Pellet Reasoner
• Multilingual Ontology Specification
In section 1.4.1 we reviewed different techniques to build a Multilingual Information Retrieval system that
instead of using a thesaurus, explore the statistical information about the corpora. Oard and Dorr survey’s
[19] distinguishes three techniques: (1) Automatic Thesaurus Construction, (2) Term Vector Translation and
(3) Latent Semantic Indexing (LSI). Our approach is considered as a Term Vector Translation. Oard and Dorr
[19] define this approach as follows: “We consider statistical multilingual text retrieval techniques in which
the goal is to map statistical information about term use between languages... techniques which map sets
of t f id f term weights from one language to another [19].” We used a query translation method to retrieve
multilingual documents with an expansion techniques for phrasal translation. In the following section we
discuss how our information retrieval system works.
8 http://www.mindswap.org/2003/pellet/9 http://www.mindswap.org/2003/pellet/architecture.png
1 2 3 4 5 6 7 8 9 10 11 12 13 14 15 16 17 18 19 20 21 22 23 24 25 26 27 28 29 30 31 32 33 34 35 36 37 38 39 40 41 42 43 44 45 46 47 48 49 50 51 52 53 54 55 56 57 58 59 60 61 62 63 64 65
1.4.1.4 Adding the Ontology to the Search Engine
The HyperManyMedia search engine uses a combination of the Vector Space Model (VSM) and the Boolean
Model to find the most relevant documents for a query submitted by a user. The score of query q for document
d is related to the cosine similarity between the document and query vectors in a Vector Space Model (VSM).
cos(x.x′) =xT · x′
| x | · | x′ | =xT
.x′√xT x ·
√x′T x′
(1.1)
where x ∈ R|V|, xand x′ are vector-space representations of two documents, T the ’transpose’ operator and
xT · x′ indicates the dot product between two vectors. It uses several refinements on VSM by extending the
Boolean vector model and adding weights associated with terms and fields. HyperManyMedia’s scoring is
influenced by the sum of the score for each term of a query. For each field, the score is the product of the
following factors: Its "tf", "idf", and index-time boosting (refer to Table 1.3). The score is computed as follows,
score(q,d) = coord(q,d)×queryNorm(q)×∑(t f (tind)
×id f (t)2× t.getBoost()×norm(t,d)) (1.2)
Table 1.3 Terms used for computing the relevance of a query to a document
Term Description
coord(q,d) Score factor based on the number of query
norm(q) Normalization factor for query q
tf (t in d) Term frequency of term t in the document d
idf(t) Inverse document frequency of term t overall documents
boost(t field in d) Boosting factor for specific field
norm(t,d) Normalization factor for term t in document d
Score(q) Relevance of query q to document d
The semantic search engine in HyperManyMedia is governed by the RDF/OWL file that contains the com-
plete ontology structure of the domain.
1.4.2 Designing a Visual Ontology-based Search Engine
This phase represents the mechanism of adding a visual ontology search interface to HyperManyMedia platform.
The user navigates through the domain ontology by clicking on nodes. The complete graph represents the E-
learning ontology, and each node represents a concept or subconcept. We used a specific DocuBurst as part of
Prefuse10 libraries, which works on documents level.
1.4.2.1 Prefuse Visualization Toolkit
This section represents the mechanism of adding a visual ontology search interface to the HyperManyMedia
platform. The user navigates through the domain ontology by clicking on nodes. The complete graph represents
the E-learning ontology, and each node represents a concept or subconcept.
Definition: The Prefuse Visualization Toolkit is a Java-based toolkit for building interactive information vi-
sualization applications. It supports a rich set of features for data modeling, visualization, and interaction. It
10 http://prefuse.org/
1 2 3 4 5 6 7 8 9 10 11 12 13 14 15 16 17 18 19 20 21 22 23 24 25 26 27 28 29 30 31 32 33 34 35 36 37 38 39 40 41 42 43 44 45 46 47 48 49 50 51 52 53 54 55 56 57 58 59 60 61 62 63 64 65
provides optimized data structures for tables, graphs, and trees, a host of layout and visual encoding tech-
niques, and support for animation, dynamic queries, integrated search, and database connectivity.
1.5 Evaluation
1.5.1 Evaluation Methodology
Section 1.3, provides a description of our methodology of designing and implementing a visual knowledge
representation of a graphical model to solve a real problem of browsing and searching for lectures in a vast
repository of colleges/course. It combines Formal Concept Analysis (FCA) with Semantic Factoring to de-
compose complex, vast concepts into their primitives in order to develop a knowledge representation for the
HyperManyMedia platform. The main objective of this section is to test the usability of the Visual search en-
gine.
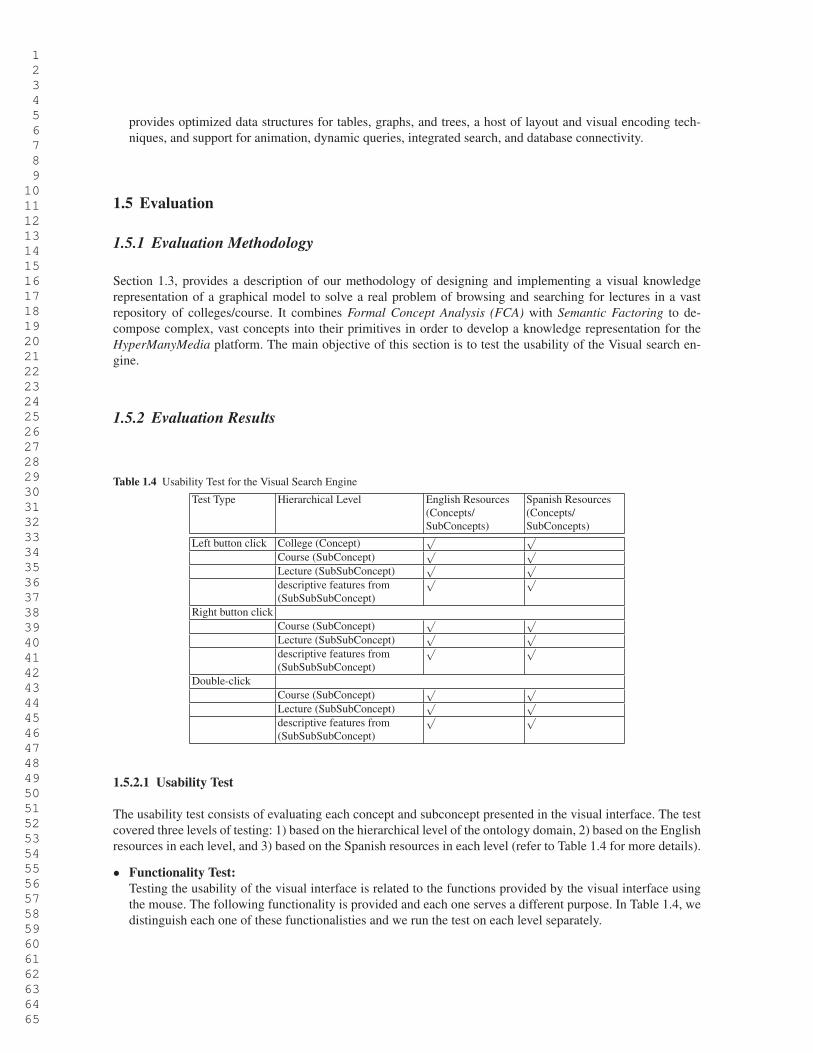
1.5.2 Evaluation Results
Table 1.4 Usability Test for the Visual Search Engine
Test Type Hierarchical Level English Resources
(Concepts/
SubConcepts)
Spanish Resources
(Concepts/
SubConcepts)
Left button click College (Concept)√ √
Course (SubConcept)√ √
Lecture (SubSubConcept)√ √
descriptive features from
(SubSubSubConcept)
√ √
Right button click
Course (SubConcept)√ √
Lecture (SubSubConcept)√ √
descriptive features from
(SubSubSubConcept)
√ √
Double-click
Course (SubConcept)√ √
Lecture (SubSubConcept)√ √
descriptive features from
(SubSubSubConcept)
√ √
1.5.2.1 Usability Test
The usability test consists of evaluating each concept and subconcept presented in the visual interface. The test
covered three levels of testing: 1) based on the hierarchical level of the ontology domain, 2) based on the English
resources in each level, and 3) based on the Spanish resources in each level (refer to Table 1.4 for more details).
• Functionality Test:
Testing the usability of the visual interface is related to the functions provided by the visual interface using
the mouse. The following functionality is provided and each one serves a different purpose. In Table 1.4, we
distinguish each one of these functionalisties and we run the test on each level separately.
1 2 3 4 5 6 7 8 9 10 11 12 13 14 15 16 17 18 19 20 21 22 23 24 25 26 27 28 29 30 31 32 33 34 35 36 37 38 39 40 41 42 43 44 45 46 47 48 49 50 51 52 53 54 55 56 57 58 59 60 61 62 63 64 65
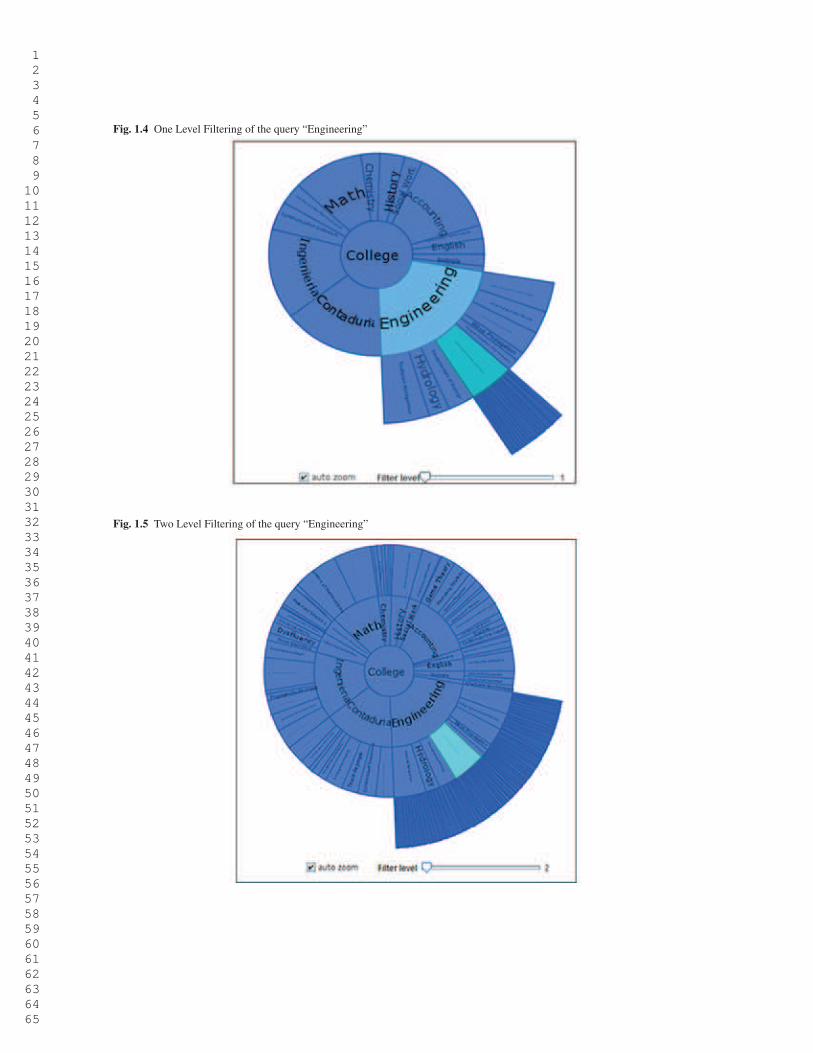
Fig. 1.4 One Level Filtering of the query “Engineering”
Fig. 1.5 Two Level Filtering of the query “Engineering”
1 2 3 4 5 6 7 8 9 10 11 12 13 14 15 16 17 18 19 20 21 22 23 24 25 26 27 28 29 30 31 32 33 34 35 36 37 38 39 40 41 42 43 44 45 46 47 48 49 50 51 52 53 54 55 56 57 58 59 60 61 62 63 64 65
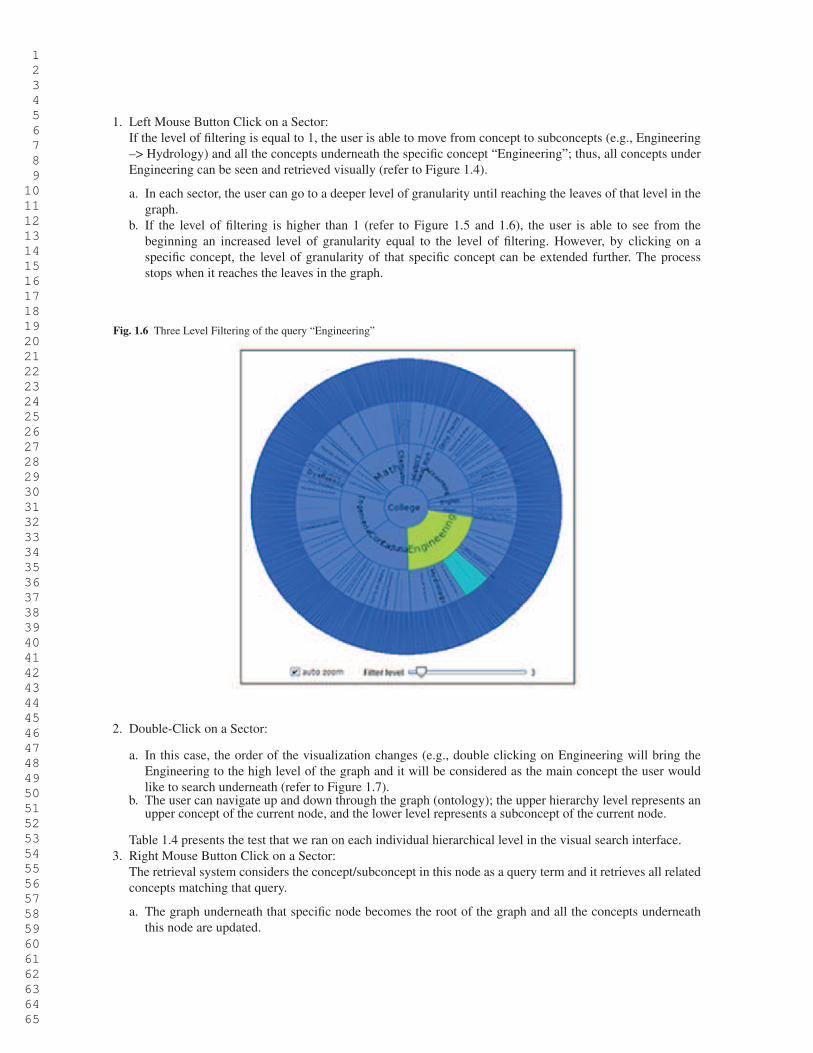
1. Left Mouse Button Click on a Sector:
If the level of filtering is equal to 1, the user is able to move from concept to subconcepts (e.g., Engineering
–> Hydrology) and all the concepts underneath the specific concept “Engineering”; thus, all concepts under
Engineering can be seen and retrieved visually (refer to Figure 1.4).
a. In each sector, the user can go to a deeper level of granularity until reaching the leaves of that level in the
graph.
b. If the level of filtering is higher than 1 (refer to Figure 1.5 and 1.6), the user is able to see from the
beginning an increased level of granularity equal to the level of filtering. However, by clicking on a
specific concept, the level of granularity of that specific concept can be extended further. The process
stops when it reaches the leaves in the graph.
Fig. 1.6 Three Level Filtering of the query “Engineering”
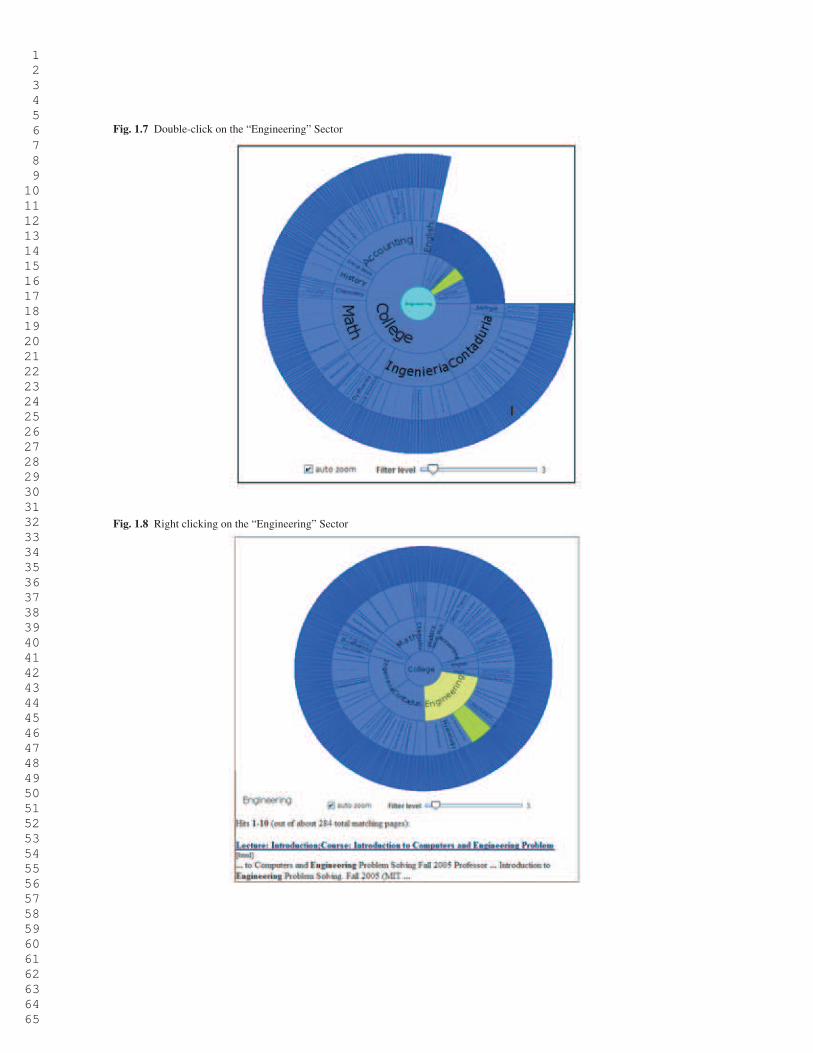
2. Double-Click on a Sector:
a. In this case, the order of the visualization changes (e.g., double clicking on Engineering will bring the
Engineering to the high level of the graph and it will be considered as the main concept the user would
like to search underneath (refer to Figure 1.7).b. The user can navigate up and down through the graph (ontology); the upper hierarchy level represents an
upper concept of the current node, and the lower level represents a subconcept of the current node.
Table 1.4 presents the test that we ran on each individual hierarchical level in the visual search interface.
3. Right Mouse Button Click on a Sector:
The retrieval system considers the concept/subconcept in this node as a query term and it retrieves all related
concepts matching that query.
a. The graph underneath that specific node becomes the root of the graph and all the concepts underneath
this node are updated.
1 2 3 4 5 6 7 8 9 10 11 12 13 14 15 16 17 18 19 20 21 22 23 24 25 26 27 28 29 30 31 32 33 34 35 36 37 38 39 40 41 42 43 44 45 46 47 48 49 50 51 52 53 54 55 56 57 58 59 60 61 62 63 64 65
Fig. 1.7 Double-click on the “Engineering” Sector
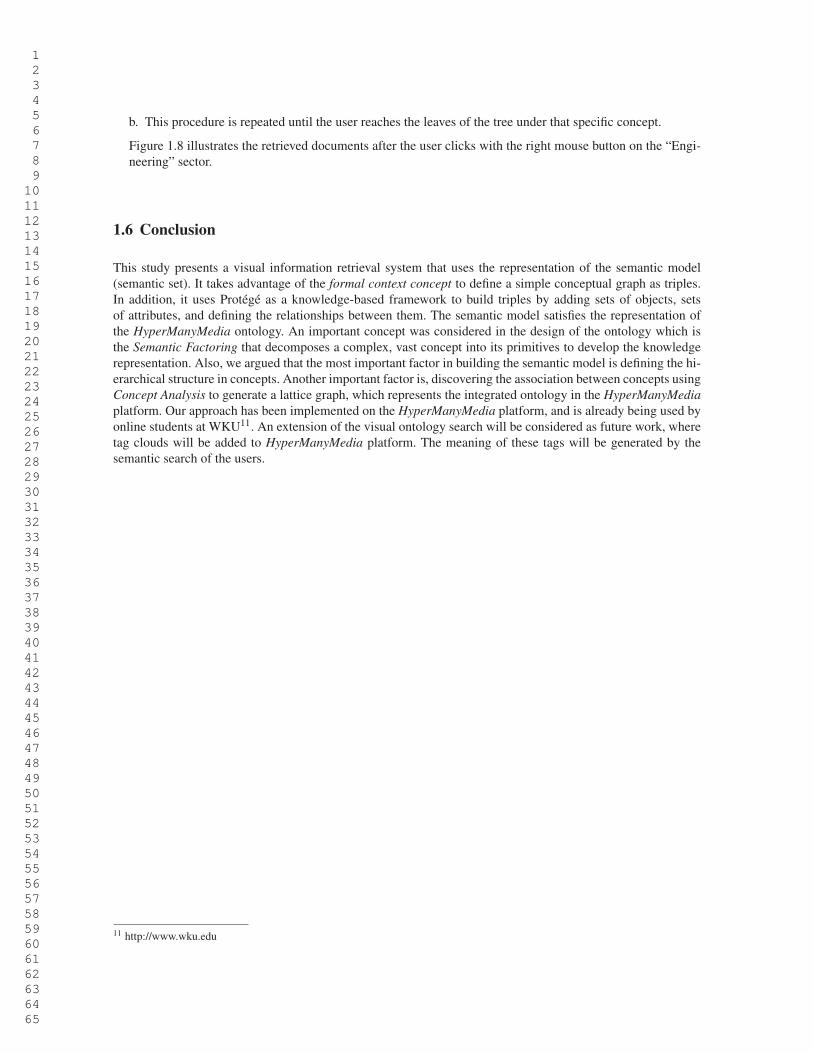
Fig. 1.8 Right clicking on the “Engineering” Sector
1 2 3 4 5 6 7 8 9 10 11 12 13 14 15 16 17 18 19 20 21 22 23 24 25 26 27 28 29 30 31 32 33 34 35 36 37 38 39 40 41 42 43 44 45 46 47 48 49 50 51 52 53 54 55 56 57 58 59 60 61 62 63 64 65
b. This procedure is repeated until the user reaches the leaves of the tree under that specific concept.
Figure 1.8 illustrates the retrieved documents after the user clicks with the right mouse button on the “Engi-
neering” sector.
1.6 Conclusion
This study presents a visual information retrieval system that uses the representation of the semantic model
(semantic set). It takes advantage of the formal context concept to define a simple conceptual graph as triples.
In addition, it uses Protégé as a knowledge-based framework to build triples by adding sets of objects, sets
of attributes, and defining the relationships between them. The semantic model satisfies the representation of
the HyperManyMedia ontology. An important concept was considered in the design of the ontology which is
the Semantic Factoring that decomposes a complex, vast concept into its primitives to develop the knowledge
representation. Also, we argued that the most important factor in building the semantic model is defining the hi-
erarchical structure in concepts. Another important factor is, discovering the association between concepts using
Concept Analysis to generate a lattice graph, which represents the integrated ontology in the HyperManyMedia
platform. Our approach has been implemented on the HyperManyMedia platform, and is already being used by
online students at WKU11. An extension of the visual ontology search will be considered as future work, where
tag clouds will be added to HyperManyMedia platform. The meaning of these tags will be generated by the
semantic search of the users.
11 http://www.wku.edu
1 2 3 4 5 6 7 8 9 10 11 12 13 14 15 16 17 18 19 20 21 22 23 24 25 26 27 28 29 30 31 32 33 34 35 36 37 38 39 40 41 42 43 44 45 46 47 48 49 50 51 52 53 54 55 56 57 58 59 60 61 62 63 64 65
References
1. H. Aras, S. Siegel, and R. Malaka. Semantic Cloud: An Enhanced Browsing Interface for Exploring Resources in Folksonomy
Systems.
2. I. Assent, R. Krieger, E. M
"uller, and T. Seidl. VISA: visual subspace clustering analysis. ACM SIGKDD Explorations Newsletter, 9(2):5–12, 2007.
3. Enrico Bertini and Denis Lalanne. Surveying the complementary role of automatic data analysis and visualization in knowledge
discovery. In VAKD ’09: Proceedings of the ACM SIGKDD Workshop on Visual Analytics and Knowledge Discovery, pages
12–20, New York, NY, USA, 2009. ACM.
4. C. Bizer, T. Heath, and T. Berners-Lee. Linked data–the story so far. International Journal On Semantic Web and Information
Systems, 2009.
5. F. Bourennani, K.Q. Pu, and Y. Zhu. Visual integration tool for heterogeneous data type by unified vectorization. In Proceedings
of the 10th IEEE international conference on Information Reuse & Integration, pages 132–137. Institute of Electrical and
Electronics Engineers Inc., The, 2009.
6. R. Bourqui, F. Gilbert, P. Simonetto, F. Zaidi, U. Sharan, and F. Jourdan. Detecting structural changes and command hierarchies
in dynamic social networks. 2009.
7. R. Choudhary, S. Mehta, A. Bagchi, and R. Balakrishnan. Towards characterization of actor evolution and interactions in news
corpora. Lecture Notes in Computer Science, 4956:422, 2008.
8. C. Collins. DocuBurst: Document content visualization using language structure. In Proceedings of IEEE Symposium on
Information Visualization, Poster Session. Baltimore. Citeseer, 2006.
9. L. Dali, D. Rusu, B. Fortuna, D. Mladenic, and M. Grobelnik. Question Answering Based on Semantic Graphs. Proceedings
of Semantic Search at WWW2009, Madrid, Spain, 2009.
10. P.A. Gloor and Y. Zhao. Tecflow-a temporal communication flow visualizer for social networks analysis. In CSCW’04 Work-
shop on Social Networks. Citeseer.
11. P. Heymann, D. Ramage, and H. Garcia-Molina. Social tag prediction. In Proceedings of the 31st annual international ACM
SIGIR conference on Research and development in information retrieval, pages 531–538. ACM, 2008.
12. H. Kang, L. Getoor, and L. Singh. Visual analysis of dynamic group membership in temporal social networks. ACM SIGKDD
Explorations Newsletter, 9(2):13–21, 2007.
13. M. Kavouras and M. Kokla. Theories of geographic concepts: ontological approaches to semantic integration. CRC, 2007.
14. H.L. Kim, J.G. Breslin, S.K. Yang, and H.G. Kim. Social semantic cloud of tag: Semantic model for social tagging. Lecture
Notes in Computer Science, 4953:83, 2008.
15. S.R. Kruk, S. Decker, and L. Zieborak. Jeromedl-adding semantic web technologies to digital libraries. Lecture Notes in
Computer Science, 3588:716–725, 2005.
16. S.R. Kruk, T. Woroniecki, A. Gzella, and M. Dabrowski. JeromeDL–a Semantic Digital Library. Semantic Web Challenge-
ISWC/ASWC, 2007.
17. Y.R. Lin, H. Sundaram, and A. Kelliher. Summarization of social activity over time: people, actions and concepts in dynamic
networks. 2008.
18. C.D. Manning, H. Schütze, and MIT Press. Foundations of statistical natural language processing. MIT Press, 1999.
19. Douglas W. Oard and Bonnie J. Dorr. A survey of multilingual text retrieval. 1996.
20. C. Peters, M. Braschler, and J. Gonzalo. Advances in cross-language information retrieval: third workshop of the Cross-
Language Evaluation Forum, CLEF 2002, Rome, Italy, September 19-20, 2002: revised papers. Springer Verlag, 2003.
21. M. Rasmussen and G. Karypis. gcluto: An interactive clustering, visualization, and analysis system. CSE/UMN Technical
Report: TR# 04, 21, 2008.
22. D. Rusu, B. Fortuna, M. Grobelnik, and D. Mladenic. Semantic Graphs Derived From Triplets With Application In Document
Summarization. Informatica Journal, 2009.
23. Delia Rusu, Blaz Fortuna, Dunja Mladenic, Marko Grobelnik, and Ruben Sipos. Document visualization based on semantic
graphs. Information Visualisation, International Conference on, 0:292–297, 2009.
1 2 3 4 5 6 7 8 9 10 11 12 13 14 15 16 17 18 19 20 21 22 23 24 25 26 27 28 29 30 31 32 33 34 35 36 37 38 39 40 41 42 43 44 45 46 47 48 49 50 51 52 53 54 55 56 57 58 59 60 61 62 63 64 65
18 References
24. J. Stan and P. Maret. Bridging the Gap Between Semantic Technologies and Social Networks: Semantic Tagging Networks.
2009.
25. I. Subasic and B. Berendt. Web mining for understanding stories through graph visualisation. In Proceedings of the 2008
Eighth IEEE International Conference on Data Mining, pages 570–579. IEEE Computer Society, 2008.
26. M. Szomszor, C. Cattuto, H. Alani, K. O Hara, A. Baldassarri, V. Loreto, and V.D.P. Servedio. Folksonomies, the semantic
web, and movie recommendation.
27. J.J. Thomas and K.A. Cook. Illuminating the path: The research and development agenda for visual analytics. IEEE Computer
Society, 2005.
28. S. Vadapalli and K. Karlapalem. Heidi matrix: nearest neighbor driven high dimensional data visualization. In Proceedings of
the ACM SIGKDD Workshop on Visual Analytics and Knowledge Discovery: Integrating Automated Analysis with Interactive
Exploration, pages 83–92. ACM, 2009.
29. X. Yang, S. Asur, S. Parthasarathy, and S. Mehta. A visual-analytic toolkit for dynamic interaction graphs. pages 1016–1024,
2008.
30. L. Zhuhadar and O. Nasraoui. Personalized cluster-based semantically enriched web search for e-learning. 2008.
31. L. Zhuhadar, O. Nasraoui, and R. Wyatt. Visual Ontology-Based Information Retrieval System. In Proceedings of the 2009
13th International Conference Information Visualisation, pages 419–426. IEEE Computer Society, 2009.
32. Leyla Zhuhadar and Olfa Nasraoui. Semantic information retrieval for personalized e-learning. Tools with Artificial Intelli-
gence, 2008. ICTAI ’08. 20th IEEE International Conference on, 1:364–368, Nov. 2008.
33. Leyla Zhuhadar, Olfa Nasraoui, and Robert Wyatt. A comparsion study between generic and metadata search engines in an
e-learning environment. In IKE, pages 500–505, 2008.
34. Leyla Zhuhadar, Olfa Nasraoui, and Robert Wyatt. Metadata domain-knowledge driven search engine in "hypermanymedia"
e-learning resources. In CSTST ’08: Proceedings of the 5th international conference on Soft computing as transdisciplinary
science and technology, pages 363–370, New York, NY, USA, 2008. ACM.
35. Leyla Zhuhadar, Olfa Nasraoui, and Robert Wyatt. Dual representation of the semantic user profile for personalized web search
in an evolving domain. In Proceedings of the AAAI 2009 Spring Symposium on Social Semantic Web, Where Web 2.0 meets
Web 3.0, pages 84–89, 2009.
36. G.K. Zipf. Human behavior and the principle of least effort. Hafner New York, 1972.