Embed Size (px)
Citation preview
Trinity UniversityDigital Commons @ Trinity
Library Faculty Research Coates Library
2006
Visual Information Literacy Via Visual Means:Three HeuristicsBenjamin R. HarrisTrinity University, [email protected]
Follow this and additional works at: https://digitalcommons.trinity.edu/lib_facultyPart of the Library and Information Science Commons
This Post-Print is brought to you for free and open access by the Coates Library at Digital Commons @ Trinity. It has been accepted for inclusion inLibrary Faculty Research by an authorized administrator of Digital Commons @ Trinity. For more information, please contact [email protected].
Repository CitationHarris, B.R. (2006). Visual information literacy via visual means: Three heuristics. Reference Services Review, 34(2), 213-221. doi:10.1108/00907320610669452
1
Visual Information Literacy Via Visual Means:
Three Heuristics
Benjamin R. Harris
Reference/Instruction Librarian
Elizabeth Huth Coates Library
Trinity University
One Trinity Place
San Antonio, TX 78212-7200
Ph: 210 999 8160
Fax: 210 999 8182
E-mail: [email protected]

2
The Author:
Benjamin R. Harris holds the position of Reference/Instruction Librarian at Trinity
University’s Elizabeth Huth Coates Library in San Antonio, Texas, USA.
Category:
General Review
Abstract:
Purpose:
To offer definitions and application scenarios for three interdisciplinary heuristics
designed to encourage a more holistic view of texts with the objective of raising
awareness and enhancing the information literacy of student researchers.
Design/Methodology/Approach:
Based on the thesis that visual texts and images should be considered in information
literacy theory and practice, a selection of three visual heuristics found to be useful in
instruction session situations are explained and described in a practical teaching situation.
Findings:
These three heuristics can be used in a number of ways for different audiences to
encourage critical thinking about the context, components, and the communication
process involved in presenting texts used by students (from books, to journal and
newspaper articles, and web sites).
Research Limitations/Implications:
There are other useful heuristics that have not been considered within the scope of this
study. Other readers and researchers may locate and discuss other means by which these
ends can be achieved.
Practical Implications:
An appendix includes a number of scenarios utilizing these heuristics that might be
applicable within almost any information literacy session regardless of course topic.
However, these heuristics can be applied to course topics if appropriate. Suggestions are
also included along with the discussion of each instructional strategy.
Originality/Value:
A number of texts in the professional literature have discussed whether or not visual
literacy and images should be considerations for information literacy advocates. Few
have offered specific interdisciplinary examples that might be used to experiment with or
achieve such an aim.

3
Visual Information Literacy Via Visual Means:
Three Heuristics
Introduction
While the terms “information” and “information literacy” are meant to encompass
the world of information, images and visually dominant texts are rarely included within
their realms. In the academy, alphabetic text remains hegemonic after 500 years of the
dominance of print discourse. In the streets, on screens, across our webs, the visual is
primary. Icons erase words from desktops, textbooks for all ages have become drenched
in images, and the ad-related phrase “sex sells” rarely refers to well ordered paragraphs.
Today’s information seekers use computers, televisions, and telephones---almost
simultaneously---in what seems to be an almost constant swirl of search-find-search
again activity.
The reality of the contemporary information economy is that images are in higher
circulation and higher demand than words and print. This should not suggest that we
create an opposing hierarchy where images rule words, but understanding the shifting
relationship between word and image at this juncture in information literacy theory is
imperative. While few have questioned the fact that verbal and alphabetic literacies must
be learned, a lack of sensitivity to (or fear of) images and visual texts has obscured the
need for instruction in reading images. As images become ever-present in the
communication of information between entities, communities, and individuals, librarians
and related professionals must consider the visual in any discussion of information
literacy.
4
The topic of information literacy and its kinship with images and visual
components of texts has received little attention in the professional literature. Embracing
the possibilities of technology and learning, James W. Marcum has written that to
separate visual information from traditional alphabetic information is short-sighted when
considering the opportunities provided to libraries and their patrons with advancing
technology. Traditional print culture, in which images were less easily reproduced, has
been decentered in favor of the current visual culture. Marcum advocates that librarians
understand and make use of developments in our “visual ecology,” contending that
“libraries must be transformed into multi-media based services in order to grasp the
ephemeral but omnipresent interactivity, to perceive the totality of today’s visual
ecology, and to manage continuous media that today’s culture will not be lost” (Marcum,
201). Such a call to action has direct implications for information literacy advocates, and
only three years after Marcum’s text appeared, the feasibility of creating digital
repositories seems to have given his words greater weight.
More recently, Nerissa Nelson contends that visual literacy instruction is outside
of the librarian’s instructional focus. According to Nelson, “unlike the concept of
information literacy, the concept of visual literacy revolves around the content analysis of
images, their meaning, not so much about the technical skills of finding them and their
qualitative evaluation in terms of authenticity, currency, etc.” (Nelson, 8). While
Nelson’s argument includes resources supporting the depth of the visual literacy
definition, the stipulative and static way that information literacy is defined within her
argument is troublesome. Concepts and theory that attempt to refine information literacy

5
to a discrete set of tasks is reductive in light of the changing, advancing, fast-fingered
world of information and the media of delivery through which information is traveling.
Further, information literacy is not “mutually exclusive” in relation to the other
literacies. Functional reading literacy, print literacy, media literacy, visual literacy, and
the new “multimodal” literacies discussed in some disciplines all interact along with
information literacy strategies. While information literacy instruction is grounded on
certain faculties and an understanding about how information works, it must remain open
and adaptable as technologies and their users change and advance.
Still, it is true that few students graduating today will ever be required to submit a
visual argument to their instructor, and they may never be asked to find, evaluate, or use
images in the course of their studies. The default one inch margined text in 12 point font
reigns supreme in student-produced work (for the moment). However, one of the
characteristics of information literacy as a concept is that its acquisition will lead to
lifelong learning and knowledge formation for individuals receiving instruction. Since
most of our students will come in contact with millions of images during the course of
their life, and will rarely encounter an 8-page essay written in Microsoft Word with an
APA bibliography, lifelong continuous learning is enhanced with a consideration of the
multi-textual and highly visual character of information production and presentation.
Such re-visions must occur in our professional literature related to the theory and practice
of information literacy, and should also occur in our classrooms, our webbed locales and
our brick & mortar spaces.
After speaking on the necessity and value of integrating the visual in information
literacy instruction at the 2004 ACRL conference, a number of audience members and

6
web attendees asked how to make this happen. The desire was there, but the theory and
experience has yet to find its place although it has been a topic of interest and concern in
disciplines across academic subjects. Communications scholars, artists and art historians,
writing instructors, and others have been examining the developing relationship between
word and image (a 100 year old affair spurred by the economical reproduction of images
and text that include images). Drawing on the theory of varying disciplines involved in
these topics offers routes toward manageable and still effective instructional strategies
that recognize the complexities of contemporary texts and multiple literacies required to
read them.
The Visual in the Classroom
It may seem like an inordinate task for information literacy instructors to include
discussion or instruction on images within an already swollen battalion of tasks and
processes, often condensed into one or two meetings with a class or group of individuals.
One cannot expect such a shift to be easy. And yet, as visuals continue to enter the
classroom (as well as the written text) at an ever-increasing rate, teachers must find
efficient methods for dealing with the influence of the visual.
Interdisciplinary heuristics function as useful tools to assist instructors and
students in understanding how information is constructed and received within specific
contexts. In addition, these heuristics have been theorized in visual terms, reinforcing the
pedagogical benefits of using teaching methods that consider visual learners and learning
while also encouraging a deeper understanding of the matrix of relationships that are
involved in the textual moment. When faced with the text, readers are rarely dealing with
7
alphabetic images only (and after all, words are actually images that represent sound).
While previously considered in relation to the construction and transmission of
“traditional” informational forms, these heuristics are equally suited to the
contextualization and interrogation of visual texts. They encourage consideration of
images as information, but they are not specific to visual texts. As opposed to including
visual images or visual literacy in information literacy instruction, these heuristics refrain
from excluding them.
Vickery’s Model of Information Transfer
A linear heuristic commonly used by instructors in the social sciences (including
library studies) for thinking about the communication process is available in the work of
B.C. Vickery. Vickery’s model of information transfer focuses on the method through
which textual messages are transmitted and suggests that there will be a variation in the
information event from person to person, even though the information involved in the
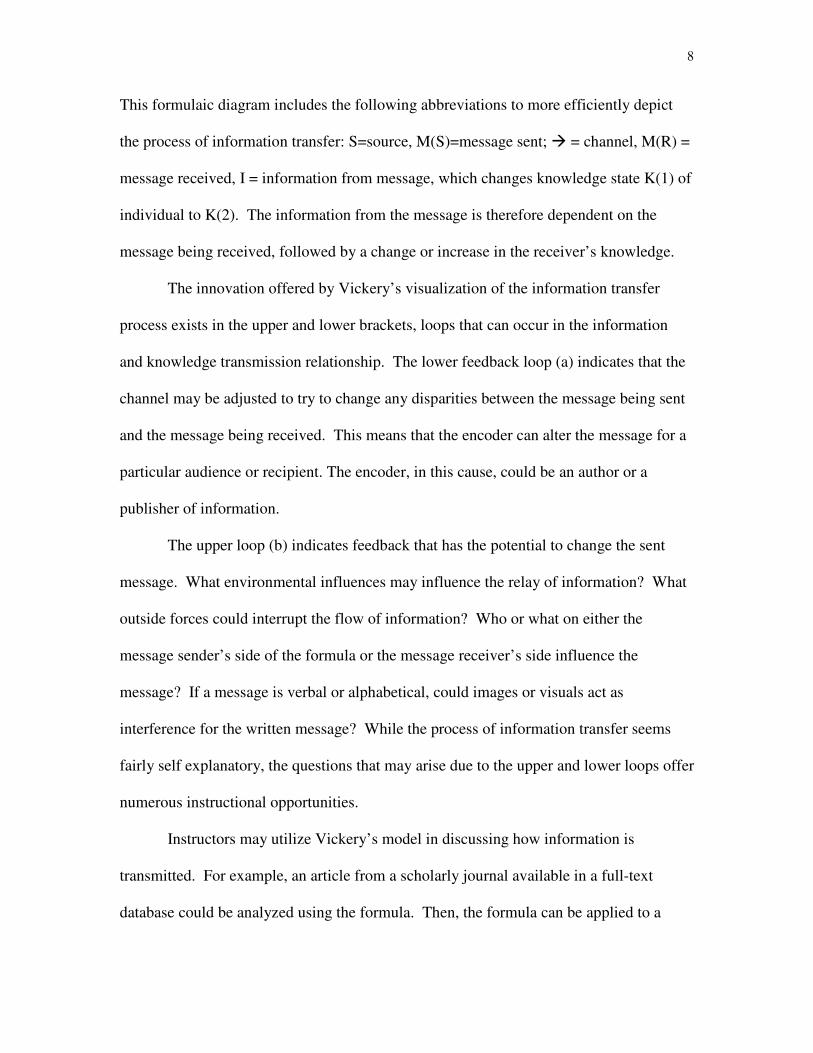
process is the same. Vickery’s formula traces the steps and influences that are involved
in the transfer of textual messages (Vickery and Vickery, 42):
Fig. 1: Vickery’s Model of Information Transfer
_________b______________
| |
S � M(S) � M(R) � I + K(1) � K(2)
|_______|
a
8
This formulaic diagram includes the following abbreviations to more efficiently depict
the process of information transfer: S=source, M(S)=message sent; � = channel, M(R) =
message received, I = information from message, which changes knowledge state K(1) of
individual to K(2). The information from the message is therefore dependent on the
message being received, followed by a change or increase in the receiver’s knowledge.
The innovation offered by Vickery’s visualization of the information transfer
process exists in the upper and lower brackets, loops that can occur in the information
and knowledge transmission relationship. The lower feedback loop (a) indicates that the
channel may be adjusted to try to change any disparities between the message being sent
and the message being received. This means that the encoder can alter the message for a
particular audience or recipient. The encoder, in this cause, could be an author or a
publisher of information.
The upper loop (b) indicates feedback that has the potential to change the sent
message. What environmental influences may influence the relay of information? What
outside forces could interrupt the flow of information? Who or what on either the
message sender’s side of the formula or the message receiver’s side influence the
message? If a message is verbal or alphabetical, could images or visuals act as
interference for the written message? While the process of information transfer seems
fairly self explanatory, the questions that may arise due to the upper and lower loops offer
numerous instructional opportunities.
Instructors may utilize Vickery’s model in discussing how information is
transmitted. For example, an article from a scholarly journal available in a full-text
database could be analyzed using the formula. Then, the formula can be applied to a
9
print version of the text featuring images (either images within or related to the text or
advertising images that accompany the print version). A quick review of the differences
in the two formulas would offer students suggestions for thinking about (1) receiving
information through varying delivery media and (2) how the images included in one
medium relate to the readers knowledge in a different way than images provided (or
removed) from an alternative medium.
A comparative view using Vickery’s model of information transfer would
accomplish a number of aims. First, students would think about how information is
transmitted and received. Second, students would think about the influence of the
authority (both author and information provider) of the information in relation to an
eventual audience. And finally, this strategy is a quick way to encourage critical readers
to think about how images are involved in their readings. Still, Vickery’s critics tend to
cite his linear form as being too reductive or simplistic. The following example suggests
a less linear fashion of looking at texts and communicative relationships.
The Communication Triangle
Designed to facilitate discourse study, or “the study of the situational uses of the
potential of the language,” James L. Kinneavy’s communication triangle is a heuristic
common to the rhetoric/writing classroom (Kinneavy, 22). Kinneavy’s triangle consists
of four points that encapsulate the textual relationship: the encoder (or writer), the
decoder (or reader), the reality (or the culture, time, and situation of the decoder in
relation to the text), and the signal (or text). Kinneavy’s construction is not entirely new,
since different disciplines had formerly used similar visual devices to try to understand
10
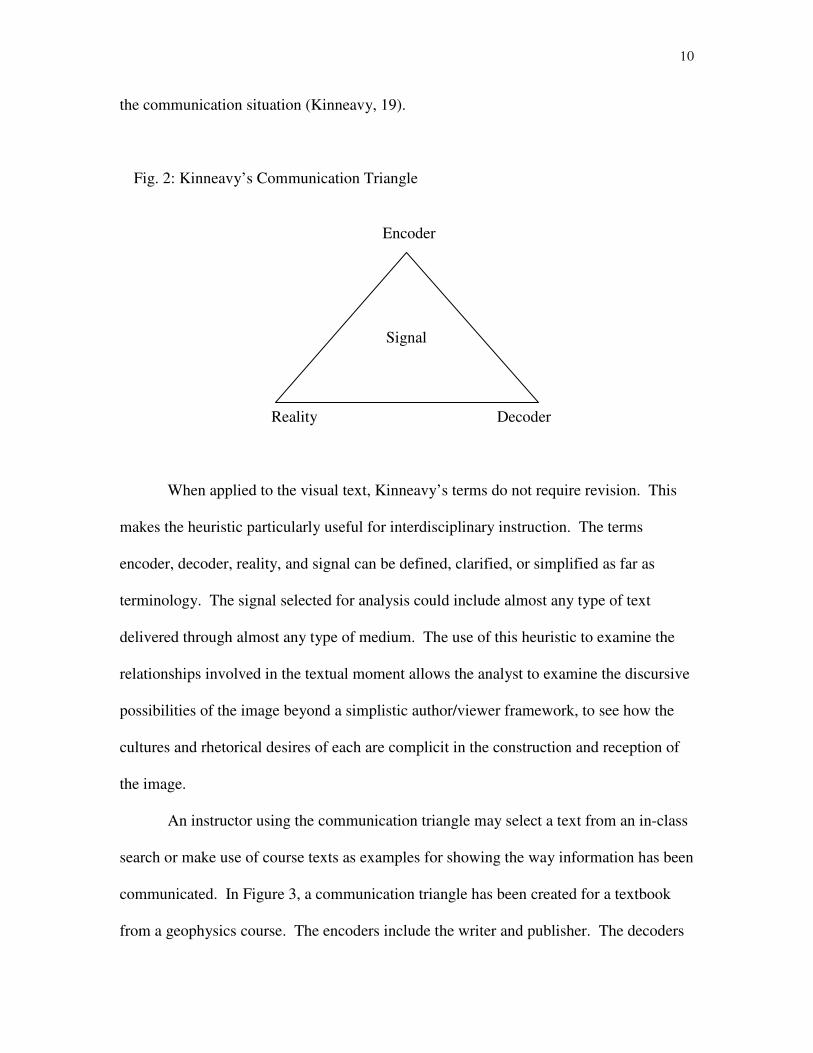
the communication situation (Kinneavy, 19).
Fig. 2: Kinneavy’s Communication Triangle
Encoder
Reality Decoder
When applied to the visual text, Kinneavy’s terms do not require revision. This
makes the heuristic particularly useful for interdisciplinary instruction. The terms
encoder, decoder, reality, and signal can be defined, clarified, or simplified as far as
terminology. The signal selected for analysis could include almost any type of text
delivered through almost any type of medium. The use of this heuristic to examine the
relationships involved in the textual moment allows the analyst to examine the discursive
possibilities of the image beyond a simplistic author/viewer framework, to see how the
cultures and rhetorical desires of each are complicit in the construction and reception of
the image.
An instructor using the communication triangle may select a text from an in-class
search or make use of course texts as examples for showing the way information has been
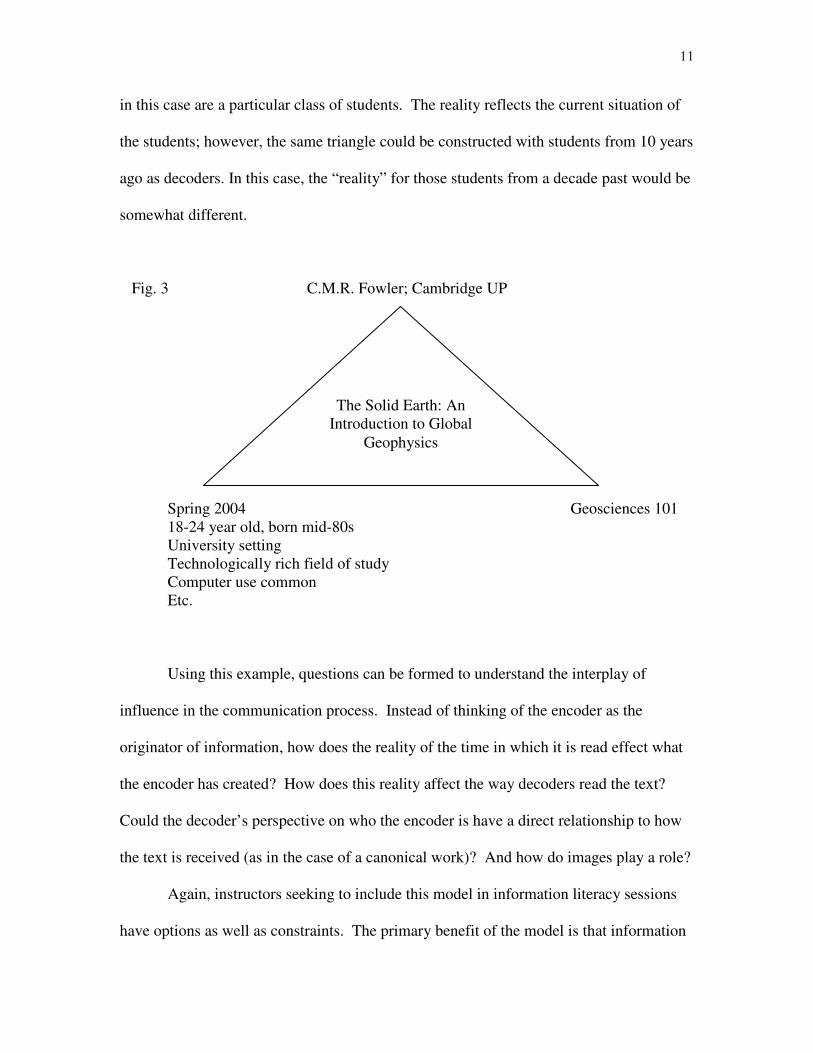
communicated. In Figure 3, a communication triangle has been created for a textbook
from a geophysics course. The encoders include the writer and publisher. The decoders
Signal
11
in this case are a particular class of students. The reality reflects the current situation of
the students; however, the same triangle could be constructed with students from 10 years
ago as decoders. In this case, the “reality” for those students from a decade past would be
somewhat different.
Fig. 3 C.M.R. Fowler; Cambridge UP
Spring 2004 Geosciences 101
18-24 year old, born mid-80s
University setting
Technologically rich field of study
Computer use common
Etc.
Using this example, questions can be formed to understand the interplay of
influence in the communication process. Instead of thinking of the encoder as the
originator of information, how does the reality of the time in which it is read effect what
the encoder has created? How does this reality affect the way decoders read the text?
Could the decoder’s perspective on who the encoder is have a direct relationship to how
the text is received (as in the case of a canonical work)? And how do images play a role?
Again, instructors seeking to include this model in information literacy sessions
have options as well as constraints. The primary benefit of the model is that information
The Solid Earth: An
Introduction to Global
Geophysics

12
flows on a continuing current. Editors of the textbook in Fig. 3 may use decoder
reception and changes in the reality (time, culture, location, etc.) when creating a new
edition of the text. Changes in decoder learning styles due to the reality of the times may
require considerations such as more images. Textbooks, as well as other texts, include
images in a way that would have been unfamiliar to students 10 years ago—even more so
for students from two decades past.
Kinneavy’s model requires readers to think critically about the information and
how it is presented based on outside influences. It requires readers to consider context in
the evaluation of sources, and can be utilized to encourage readers to think about how the
relationship between images and alphabetic text is shaped not only by the author or
authorial agency, but by the needs and desires of readers. While Vickery requires critical
thinking about how different media of delivery can change the information found by the
seeker, Kinneavy’s triangle requires that readers consider how the time and context in
which texts are produced or read relate to the message.
Relational Mapping
Relational mapping is a common teaching and learning strategy that seeks to
depict relationships between things, ideas, or people through visual means. As a more
common heuristic, often experienced by students in their elementary grades and up, it can
be more easily adapted to new situations and discussions. For thinking about the
relationship between images as information and alphabetic text as information, relational
maps are useful in a very different manner than either of the prior models.
13
Information literacy instructors, and others, are challenged to encourage readers to
think about the sources that they use as they locate, select, and use information. For
many information seekers, the tunnel-vision that accompanies the work of searching for
certain facts, figures, or information components to fulfill a specific need can blind them
to the information source itself. One of the benefits of evaluating sources, aside from
encouraging critical thinking about source selection, is that it requires the researcher to
consider where the information is coming from and how it has been presented.
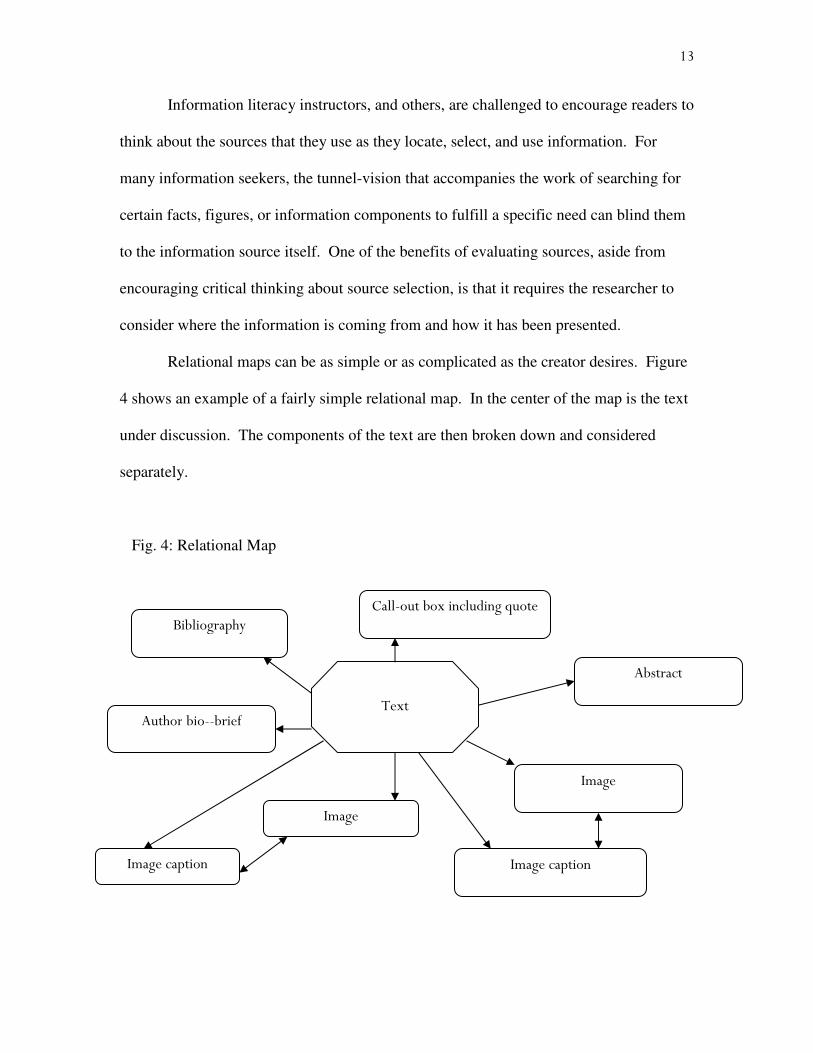
Relational maps can be as simple or as complicated as the creator desires. Figure
4 shows an example of a fairly simple relational map. In the center of the map is the text
under discussion. The components of the text are then broken down and considered
separately.
Fig. 4: Relational Map
Image
Bibliography
Abstract
Call-out box including quote
Author bio--brief
Text
Image caption
Image
Image caption
14
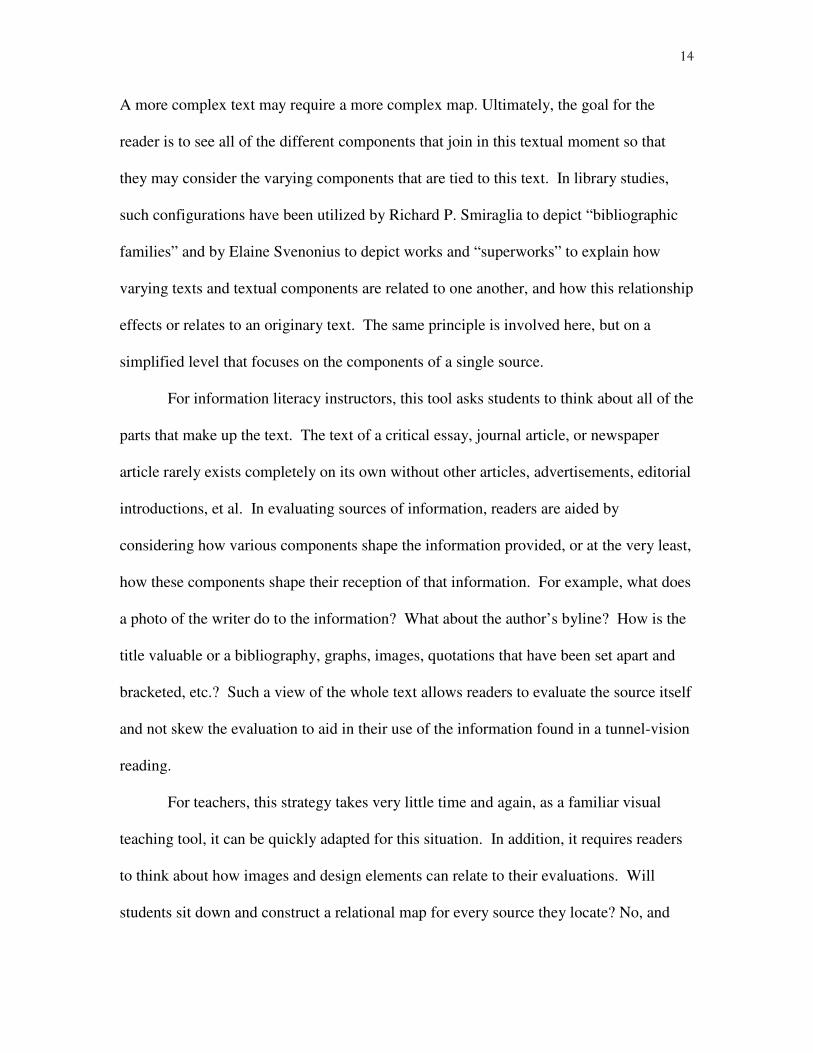
A more complex text may require a more complex map. Ultimately, the goal for the
reader is to see all of the different components that join in this textual moment so that
they may consider the varying components that are tied to this text. In library studies,
such configurations have been utilized by Richard P. Smiraglia to depict “bibliographic
families” and by Elaine Svenonius to depict works and “superworks” to explain how
varying texts and textual components are related to one another, and how this relationship
effects or relates to an originary text. The same principle is involved here, but on a
simplified level that focuses on the components of a single source.
For information literacy instructors, this tool asks students to think about all of the
parts that make up the text. The text of a critical essay, journal article, or newspaper
article rarely exists completely on its own without other articles, advertisements, editorial
introductions, et al. In evaluating sources of information, readers are aided by
considering how various components shape the information provided, or at the very least,
how these components shape their reception of that information. For example, what does
a photo of the writer do to the information? What about the author’s byline? How is the
title valuable or a bibliography, graphs, images, quotations that have been set apart and
bracketed, etc.? Such a view of the whole text allows readers to evaluate the source itself
and not skew the evaluation to aid in their use of the information found in a tunnel-vision
reading.
For teachers, this strategy takes very little time and again, as a familiar visual
teaching tool, it can be quickly adapted for this situation. In addition, it requires readers
to think about how images and design elements can relate to their evaluations. Will
students sit down and construct a relational map for every source they locate? No, and
15
this should be qualified within the instruction period. These visual imprints for thinking
about sources may not become habitual tools in the lives of researching students, but a
greater awareness of the text has been raised.
Raising Awareness
These heuristics offer three ways of looking at texts that offer avenues for the
consideration of visual images. Vickery’s model focuses on the system of information
transmission and medium of delivery; Kinneavy’s communication triangle considers
context of creation and reception of the text; and relational mapping considers the greater
components of the text. It should be reiterated that it may not only be challenging due to
time limitations but also difficult in relation to topical requirements in library instruction
to offer extended focus on images. However, they must not be excluded, and since they
are omnipresent in the texts and tools we introduce in the classroom, to disregard them is
exclusion. These strategies allow instructors to broach the subject of how information is
created, sent, and received in an inclusive manner that would recognize the multimodal
character of contemporary publishing.
It is exactly the work of raising awareness as well as consciousness that makes
information literacy a concept that can extend beyond students lives as students. And
still, stipulative definitions of information literacy that confine it to a limited series of
tasks seem to prevail in some circles. Arguments against considering images as
information will continue. Some of these arguments may stem from pedagogical theory
that encourages library instructors to attach instruction directly to course content. This is
a worthy aim in maintaining student engagement and faculty support of library
16
instruction. Consequently, raising awareness about information literacy and a greater
comprehension of the information economy is an added value that can be easily
constructed into instruction session curricula. While students may not always be
information literate, we should not underestimate their information savvy and miss
opportunities to enhance their prior knowledge with new considerations. In one-shot
teaching and similar situations, raising awareness can often be as valuable as extensive
instruction of greater depth.
In addition to serving as methods for introducing how visual images ARE
information, these heuristics also enfranchise visual learners who may be set apart from
instruction that is exclusively verbal or alphabetic. Introducing these topics through
visual methods such as a linear formula and triangular or map-like constructions presents
an alternative to verbal lecture or PowerPoint instruction. And every learner is a visual
learner in some capacity and in varying degrees. Strategies such as the three discussed
here recognize this and enhance continuing work to diversify the library instruction
environment.
Further, these strategies may be introduced and discussed at different points in the
sequence of a single session or multiple sessions. Making connections between the
entities and communicative situations that influence critical readings and use of texts can
be connected to explaining the difference between popular and scholarly journals, the
impact of the peer review process, the difference between seeing a text in its print or
electronic context, as well as other topics commonly introduced in information literacy
sessions. (See the appendix for active learning applications of these heuristics.)
17
Revising practices for offering standard information literacy instruction sessions
are the not the only fronts on which the profession is dealing with the influence of
images. For those disciplines that utilize images in the classroom and in student work,
teaching- librarians may offer instruction related to image databases such as ARTstor and
digital image libraries online. Discussions related to the location, selection, evaluation,
and use of images have expanded beyond the arts and communications disciplines to
other academic spheres now challenged to integrate images into their curriculum. The
influence of the visual will increase. Where this influence will take us, or where we will
go with it, remains to be seen.
18
Appendix: Integration Strategies
The following integration strategies for the heuristics discussed in the text have been
found to be efficient and effective when introducing these formulas and models in the
library instruction classroom. Note that a brief explanation of the heuristic must
accompany its use, but that such an explanation should be included only by way of
guiding the class. Vickery’s model, the communication triangle, and relational mapping
are best utilized in an application rather than extended definition.
A. During discussions on the availability of electronic journals and print journals,
introduce Vickery’s model to explain how reader reception is different when a text is read
in print or online. Ask students to consider the points in the flow of information that
would be different based on medium. Discuss the impact of an article including images
and an article without images to further illustrate this point.
B. Locate and review a newspaper article that includes a captioned photograph, but
present the class with only the text on their first viewing. Then show the newspaper
article in its original context with the captioned photograph intact. Ask students to
consider which points on Vickery’s model of information transfer are altered by these
two different viewings.
C. In a discussion on the range or depth of a particular text, introduce the communication
triangle to explain why texts are geared to certain audiences. Select a text that would be
appropriate to course topics and determine if the class is an intended audience for the text
by using the triangle.
19
D. In discussing the value of publication dating in different disciplines (i.e., science
journals focus on more recent evidence as opposed to history journals who would
continue to use older sources), use the communication triangle to look at different
editions of a work and determine if the most recent edition of that text is necessary.
E. Present the class with only the text of a short article (an overhead projector or similar
device would be most appropriate for this activity). Slowly add the other components
that accompany the information, such as images, titles, author information, etc. while
asking students to offer critical thinking on how the article is changed by the added
components. Upon completion, quickly construct a relational map that accomplishes the
same breakdown of components in less time.
F. Introduce the home page of a website to the class. Ask students to list all of the
components seen above the fold on the home page. As students answer, create a
relational map that shows the various components. Ask students to evaluate the page and
then rank the components based on importance for (1) readers of the site and (2) students
using the site as a research source. The use of images on the website’s home page may
be a focus of inquiry.
20
References
Fowler, C.M.R., (2005) The Solid Earth: An Introduction to Global Geophysics,
Cambridge University Press, Cambridge.
Harris, B.R., (2005) “’Big Picture’ Pedagogy: The Convergence of Word and Image
Information Literacy Instruction,” Currents and Convergence: Navigating the
Rivers of Change: Proceedings of the ACRL 12th
National Conference, ALA, Chicago.
Kinneavy, J.L., (1971) A Theory of Discourse: The Aims of Discourse, University of
Texas Press, Austin.
Marcum, J.W. (2002) “Beyond Visual Culture: The Challenge of Visual Ecology,”
Libraries and the Academy, 2, 2, 189-2-6.
Nelson, N., (2004) “Visual Literacy and Library Instruction: A Critical Analysis,”
Education Libraries, 27, 1, 5-10.
Smiraglia, R.P., (2001) The Nature of “A Work”: Implications for the Organization
of Knowledge, Scarecrow Press, Lanham.
Svenonius, E., (2000) The Intellectual Organization of Information, MIT Press,
Cambridge.
Vickery, B.C., and Vickery, A., (1987) Information Science in Theory and Practice.
Butterworths, London.