Embed Size (px)
Citation preview
IRJMST Vol 5 Issue 6 [Year 2014] ISSN 2250 – 1959 (0nline) 2348 – 9367 (Print)
International Research Journal of Management Science & Technology http://www.irjmst.com Page 203
VENTURE CAPITAL IN INDIA
Dr. Suraj Kumar
Lecturer,
Department of Commerce,
S.K.R.College,Barbigha,
Distt.:-Sheikhpura(Bihar)
Investment Environment
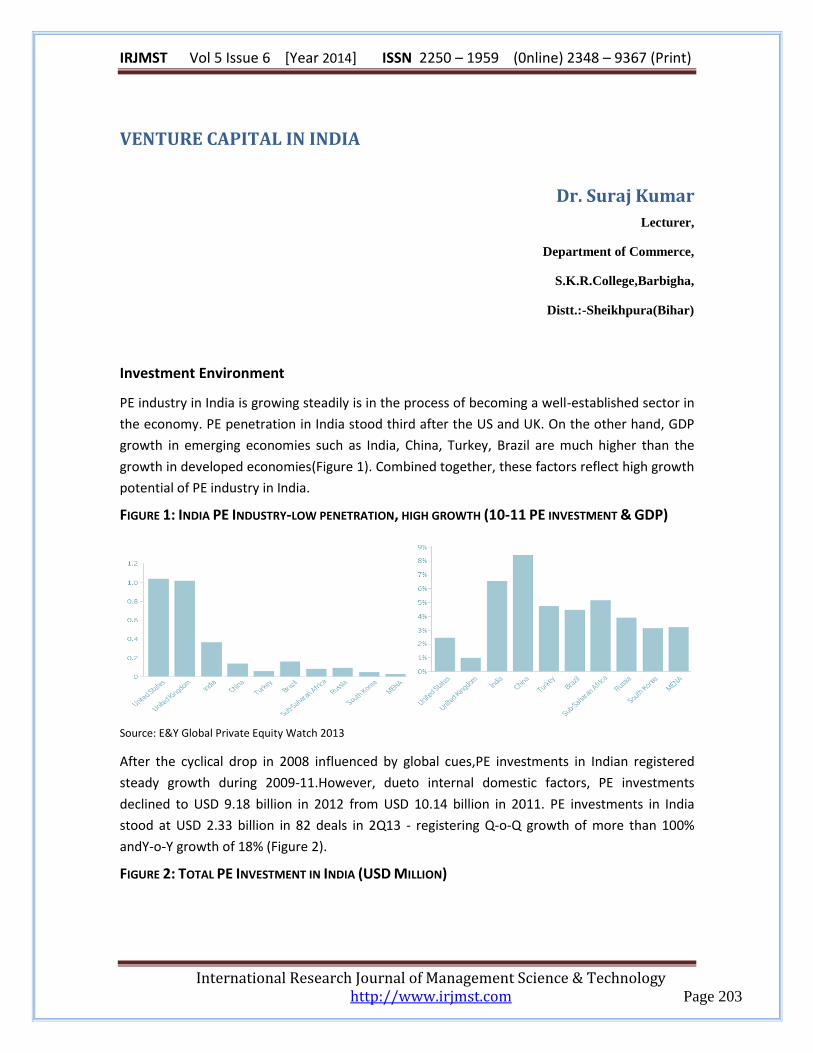
PE industry in India is growing steadily is in the process of becoming a well-established sector in
the economy. PE penetration in India stood third after the US and UK. On the other hand, GDP
growth in emerging economies such as India, China, Turkey, Brazil are much higher than the
growth in developed economies(Figure 1). Combined together, these factors reflect high growth
potential of PE industry in India.
FIGURE 1: INDIA PE INDUSTRY-LOW PENETRATION, HIGH GROWTH (10-11 PE INVESTMENT & GDP)
Source: E&Y Global Private Equity Watch 2013
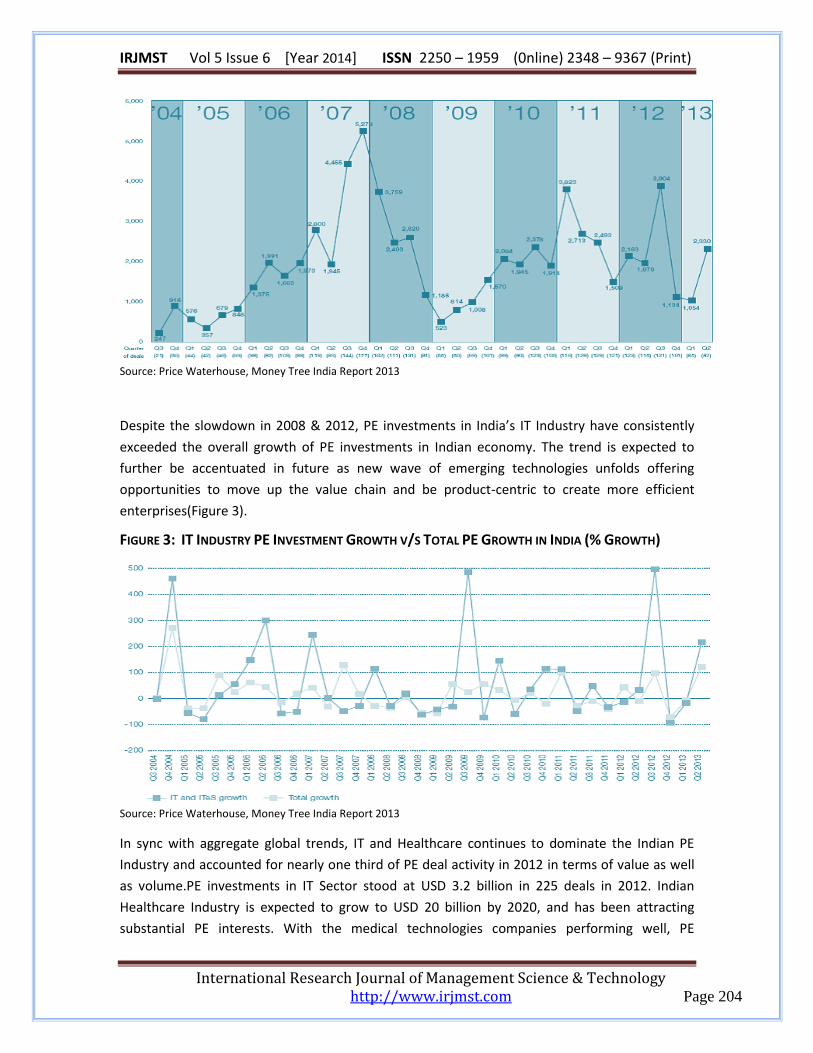
After the cyclical drop in 2008 influenced by global cues,PE investments in Indian registered
steady growth during 2009-11.However, dueto internal domestic factors, PE investments
declined to USD 9.18 billion in 2012 from USD 10.14 billion in 2011. PE investments in India
stood at USD 2.33 billion in 82 deals in 2Q13 - registering Q-o-Q growth of more than 100%
andY-o-Y growth of 18% (Figure 2).
FIGURE 2: TOTAL PE INVESTMENT IN INDIA (USD MILLION)
IRJMST Vol 5 Issue 6 [Year 2014] ISSN 2250 – 1959 (0nline) 2348 – 9367 (Print)
International Research Journal of Management Science & Technology http://www.irjmst.com Page 204
Source: Price Waterhouse, Money Tree India Report 2013
Despite the slowdown in 2008 & 2012, PE investments in India’s IT Industry have consistently
exceeded the overall growth of PE investments in Indian economy. The trend is expected to
further be accentuated in future as new wave of emerging technologies unfolds offering
opportunities to move up the value chain and be product-centric to create more efficient
enterprises(Figure 3).
FIGURE 3: IT INDUSTRY PE INVESTMENT GROWTH V/S TOTAL PE GROWTH IN INDIA (% GROWTH)
Source: Price Waterhouse, Money Tree India Report 2013
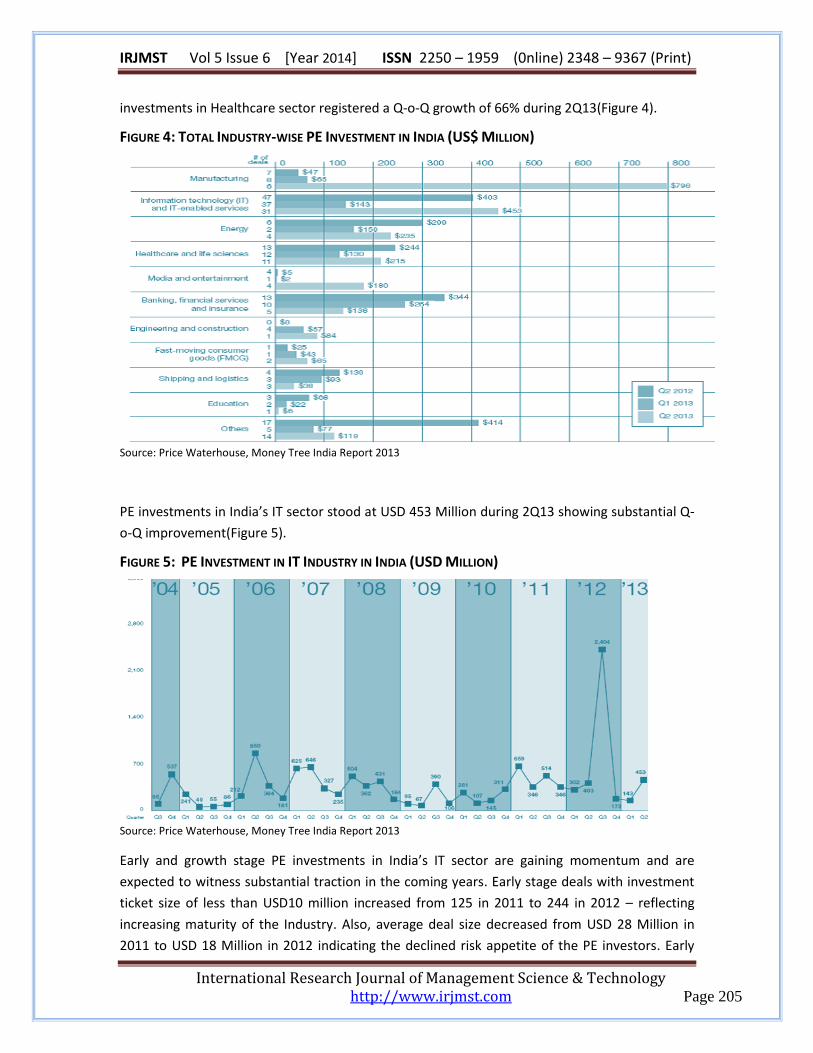
In sync with aggregate global trends, IT and Healthcare continues to dominate the Indian PE
Industry and accounted for nearly one third of PE deal activity in 2012 in terms of value as well
as volume.PE investments in IT Sector stood at USD 3.2 billion in 225 deals in 2012. Indian
Healthcare Industry is expected to grow to USD 20 billion by 2020, and has been attracting
substantial PE interests. With the medical technologies companies performing well, PE
IRJMST Vol 5 Issue 6 [Year 2014] ISSN 2250 – 1959 (0nline) 2348 – 9367 (Print)
International Research Journal of Management Science & Technology http://www.irjmst.com Page 205
investments in Healthcare sector registered a Q-o-Q growth of 66% during 2Q13(Figure 4).
FIGURE 4: TOTAL INDUSTRY-WISE PE INVESTMENT IN INDIA (US$ MILLION)
Source: Price Waterhouse, Money Tree India Report 2013
PE investments in India’s IT sector stood at USD 453 Million during 2Q13 showing substantial Q-
o-Q improvement(Figure 5).
FIGURE 5: PE INVESTMENT IN IT INDUSTRY IN INDIA (USD MILLION)
Source: Price Waterhouse, Money Tree India Report 2013
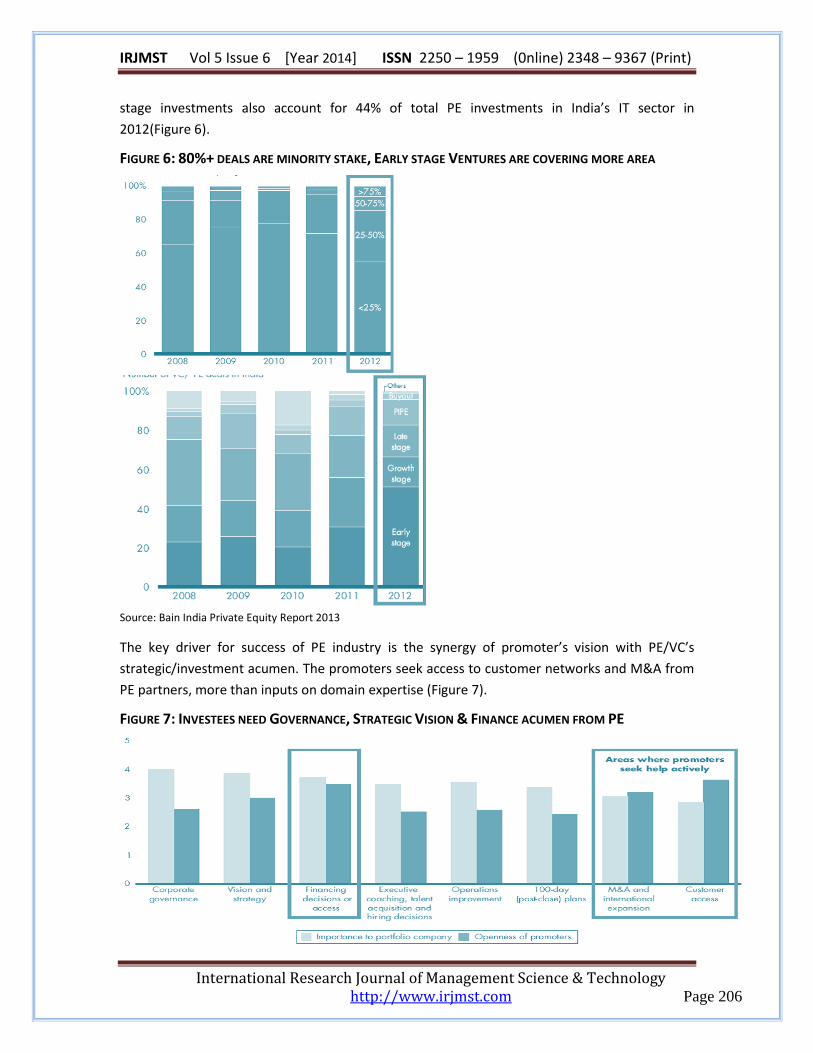
Early and growth stage PE investments in India’s IT sector are gaining momentum and are
expected to witness substantial traction in the coming years. Early stage deals with investment
ticket size of less than USD10 million increased from 125 in 2011 to 244 in 2012 – reflecting
increasing maturity of the Industry. Also, average deal size decreased from USD 28 Million in
2011 to USD 18 Million in 2012 indicating the declined risk appetite of the PE investors. Early
IRJMST Vol 5 Issue 6 [Year 2014] ISSN 2250 – 1959 (0nline) 2348 – 9367 (Print)
International Research Journal of Management Science & Technology http://www.irjmst.com Page 206
stage investments also account for 44% of total PE investments in India’s IT sector in
2012(Figure 6).
FIGURE 6: 80%+ DEALS ARE MINORITY STAKE, EARLY STAGE VENTURES ARE COVERING MORE AREA
Source: Bain India Private Equity Report 2013
The key driver for success of PE industry is the synergy of promoter’s vision with PE/VC’s
strategic/investment acumen. The promoters seek access to customer networks and M&A from
PE partners, more than inputs on domain expertise (Figure 7).
FIGURE 7: INVESTEES NEED GOVERNANCE, STRATEGIC VISION & FINANCE ACUMEN FROM PE
IRJMST Vol 5 Issue 6 [Year 2014] ISSN 2250 – 1959 (0nline) 2348 – 9367 (Print)
International Research Journal of Management Science & Technology http://www.irjmst.com Page 207
Source: Bain India Private Equity Report 2013
SECTOR FOCUS
After a decade of protracted growth, Indian economy is witnessing a slowdown initiated by
global financial crisis which was further exacerbated due to domestic issues including lack of
economic reforms. Due to structural issues and high twin deficits (high fiscal deficit coupled with
high current account deficit), India economy is going through a phase of macroeconomic
uncertainties.
The recovery was expected to be paced much faster, and with the improvement in global
financial Sector, a lot is now expected to rest on resumption in the domestic investment and
growth in industrial segment, leading to higher consumption demand. Indian economy is
expected to recover from the current phase of slowdown by FY14 and gather momentum by
2015.
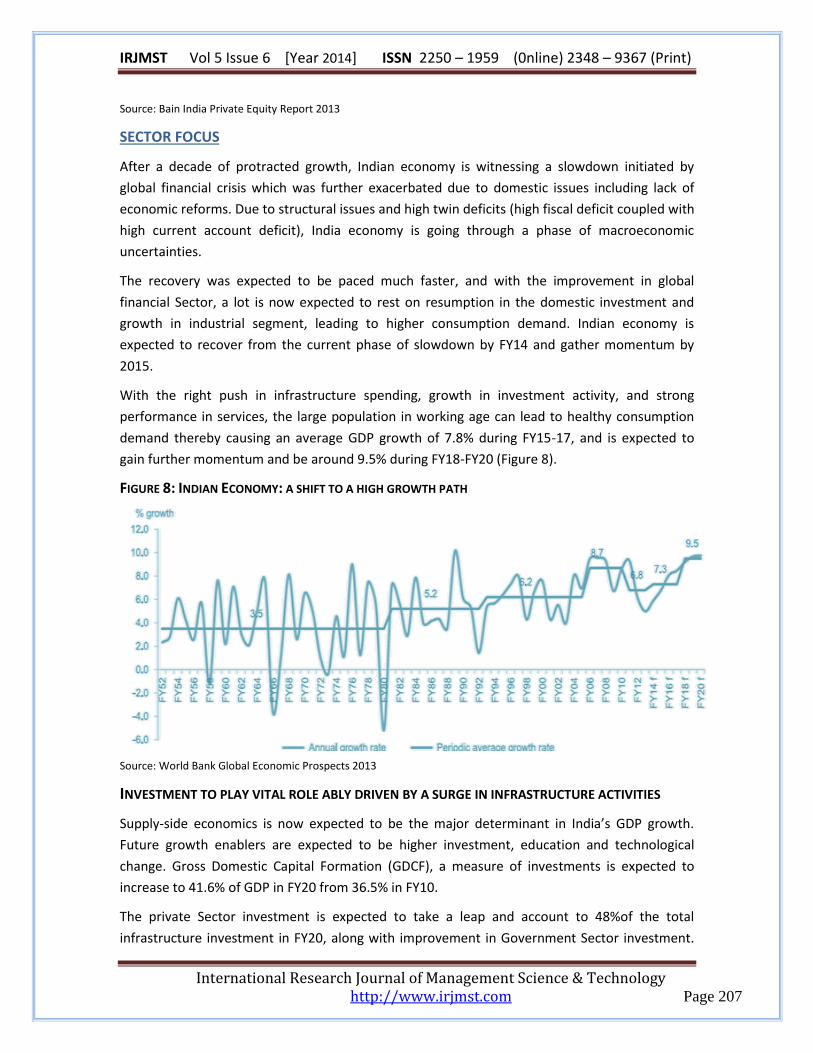
With the right push in infrastructure spending, growth in investment activity, and strong
performance in services, the large population in working age can lead to healthy consumption
demand thereby causing an average GDP growth of 7.8% during FY15-17, and is expected to
gain further momentum and be around 9.5% during FY18-FY20 (Figure 8).
FIGURE 8: INDIAN ECONOMY: A SHIFT TO A HIGH GROWTH PATH
Source: World Bank Global Economic Prospects 2013
INVESTMENT TO PLAY VITAL ROLE ABLY DRIVEN BY A SURGE IN INFRASTRUCTURE ACTIVITIES
Supply-side economics is now expected to be the major determinant in India’s GDP growth.
Future growth enablers are expected to be higher investment, education and technological
change. Gross Domestic Capital Formation (GDCF), a measure of investments is expected to
increase to 41.6% of GDP in FY20 from 36.5% in FY10.
The private Sector investment is expected to take a leap and account to 48%of the total
infrastructure investment in FY20, along with improvement in Government Sector investment.
IRJMST Vol 5 Issue 6 [Year 2014] ISSN 2250 – 1959 (0nline) 2348 – 9367 (Print)
International Research Journal of Management Science & Technology http://www.irjmst.com Page 208
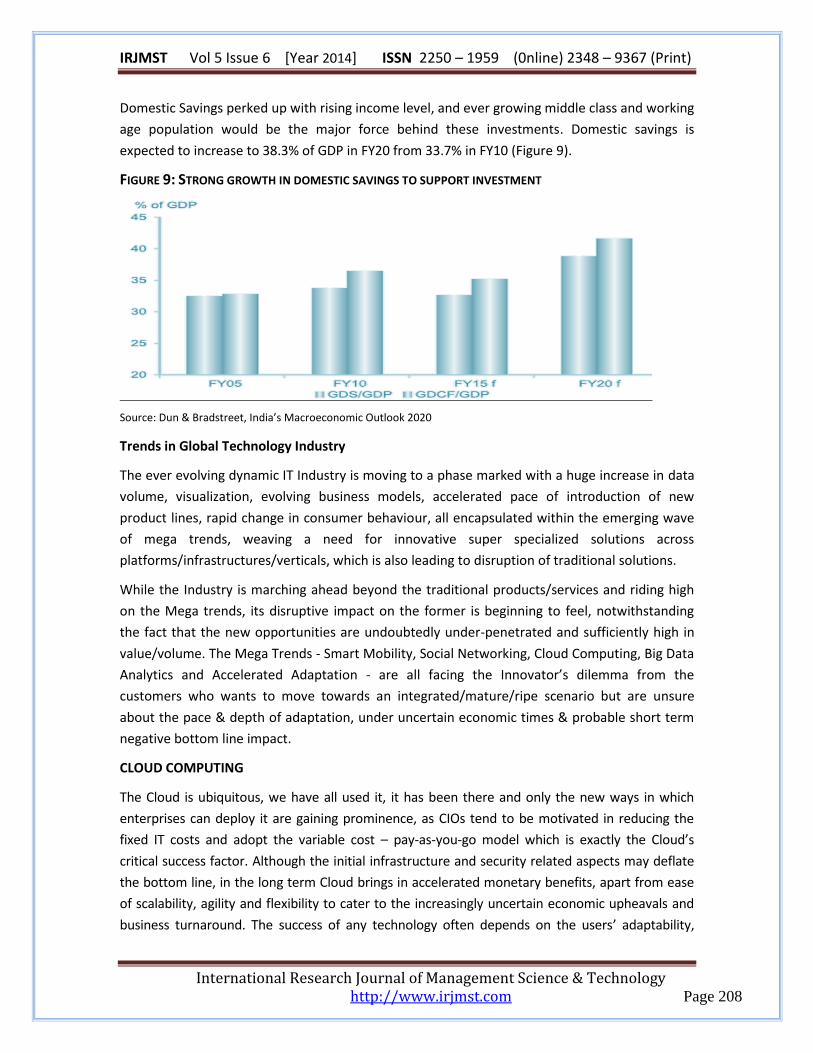
Domestic Savings perked up with rising income level, and ever growing middle class and working
age population would be the major force behind these investments. Domestic savings is
expected to increase to 38.3% of GDP in FY20 from 33.7% in FY10 (Figure 9).
FIGURE 9: STRONG GROWTH IN DOMESTIC SAVINGS TO SUPPORT INVESTMENT
Source: Dun & Bradstreet, India’s Macroeconomic Outlook 2020
Trends in Global Technology Industry
The ever evolving dynamic IT Industry is moving to a phase marked with a huge increase in data
volume, visualization, evolving business models, accelerated pace of introduction of new
product lines, rapid change in consumer behaviour, all encapsulated within the emerging wave
of mega trends, weaving a need for innovative super specialized solutions across
platforms/infrastructures/verticals, which is also leading to disruption of traditional solutions.
While the Industry is marching ahead beyond the traditional products/services and riding high
on the Mega trends, its disruptive impact on the former is beginning to feel, notwithstanding
the fact that the new opportunities are undoubtedly under-penetrated and sufficiently high in
value/volume. The Mega Trends - Smart Mobility, Social Networking, Cloud Computing, Big Data
Analytics and Accelerated Adaptation - are all facing the Innovator’s dilemma from the
customers who wants to move towards an integrated/mature/ripe scenario but are unsure
about the pace & depth of adaptation, under uncertain economic times & probable short term
negative bottom line impact.
CLOUD COMPUTING
The Cloud is ubiquitous, we have all used it, it has been there and only the new ways in which
enterprises can deploy it are gaining prominence, as CIOs tend to be motivated in reducing the
fixed IT costs and adopt the variable cost – pay-as-you-go model which is exactly the Cloud’s
critical success factor. Although the initial infrastructure and security related aspects may deflate
the bottom line, in the long term Cloud brings in accelerated monetary benefits, apart from ease
of scalability, agility and flexibility to cater to the increasingly uncertain economic upheavals and
business turnaround. The success of any technology often depends on the users’ adaptability,
IRJMST Vol 5 Issue 6 [Year 2014] ISSN 2250 – 1959 (0nline) 2348 – 9367 (Print)
International Research Journal of Management Science & Technology http://www.irjmst.com Page 209
rather than on the idea itself and Cloud computing is being liked, adopted and increasingly
invested in by enterprises.
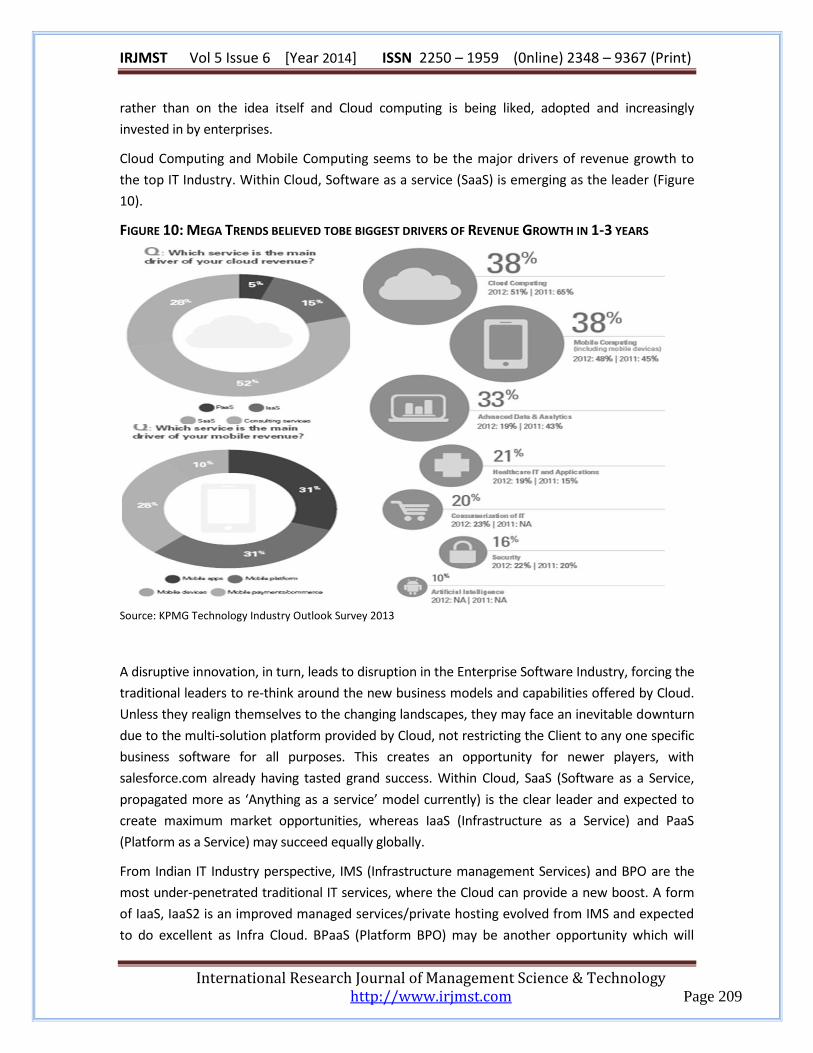
Cloud Computing and Mobile Computing seems to be the major drivers of revenue growth to
the top IT Industry. Within Cloud, Software as a service (SaaS) is emerging as the leader (Figure
10).
FIGURE 10: MEGA TRENDS BELIEVED TOBE BIGGEST DRIVERS OF REVENUE GROWTH IN 1-3 YEARS
Source: KPMG Technology Industry Outlook Survey 2013
A disruptive innovation, in turn, leads to disruption in the Enterprise Software Industry, forcing the
traditional leaders to re-think around the new business models and capabilities offered by Cloud.
Unless they realign themselves to the changing landscapes, they may face an inevitable downturn
due to the multi-solution platform provided by Cloud, not restricting the Client to any one specific
business software for all purposes. This creates an opportunity for newer players, with
salesforce.com already having tasted grand success. Within Cloud, SaaS (Software as a Service,
propagated more as ‘Anything as a service’ model currently) is the clear leader and expected to
create maximum market opportunities, whereas IaaS (Infrastructure as a Service) and PaaS
(Platform as a Service) may succeed equally globally.
From Indian IT Industry perspective, IMS (Infrastructure management Services) and BPO are the
most under-penetrated traditional IT services, where the Cloud can provide a new boost. A form
of IaaS, IaaS2 is an improved managed services/private hosting evolved from IMS and expected
to do excellent as Infra Cloud. BPaaS (Platform BPO) may be another opportunity which will
IRJMST Vol 5 Issue 6 [Year 2014] ISSN 2250 – 1959 (0nline) 2348 – 9367 (Print)
International Research Journal of Management Science & Technology http://www.irjmst.com Page 210
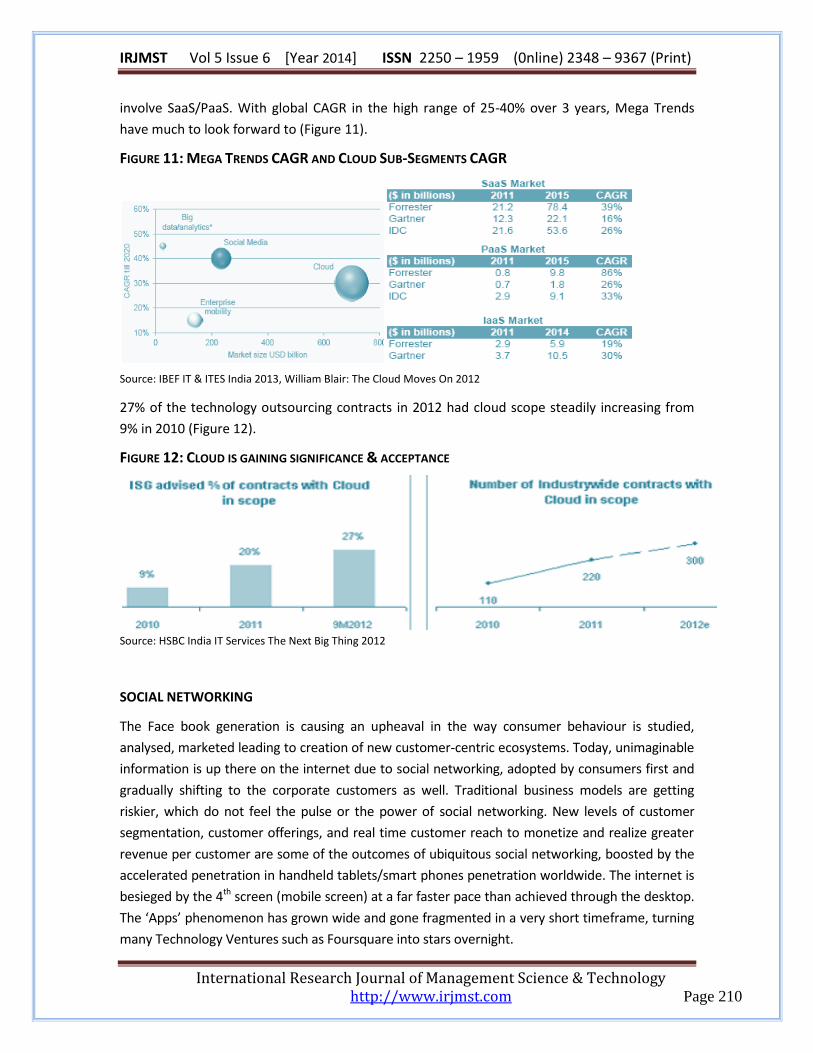
involve SaaS/PaaS. With global CAGR in the high range of 25-40% over 3 years, Mega Trends
have much to look forward to (Figure 11).
FIGURE 11: MEGA TRENDS CAGR AND CLOUD SUB-SEGMENTS CAGR
Source: IBEF IT & ITES India 2013, William Blair: The Cloud Moves On 2012
27% of the technology outsourcing contracts in 2012 had cloud scope steadily increasing from
9% in 2010 (Figure 12).
FIGURE 12: CLOUD IS GAINING SIGNIFICANCE & ACCEPTANCE
Source: HSBC India IT Services The Next Big Thing 2012
SOCIAL NETWORKING
The Face book generation is causing an upheaval in the way consumer behaviour is studied,
analysed, marketed leading to creation of new customer-centric ecosystems. Today, unimaginable
information is up there on the internet due to social networking, adopted by consumers first and
gradually shifting to the corporate customers as well. Traditional business models are getting
riskier, which do not feel the pulse or the power of social networking. New levels of customer
segmentation, customer offerings, and real time customer reach to monetize and realize greater
revenue per customer are some of the outcomes of ubiquitous social networking, boosted by the
accelerated penetration in handheld tablets/smart phones penetration worldwide. The internet is
besieged by the 4th screen (mobile screen) at a far faster pace than achieved through the desktop.
The ‘Apps’ phenomenon has grown wide and gone fragmented in a very short timeframe, turning
many Technology Ventures such as Foursquare into stars overnight.
IRJMST Vol 5 Issue 6 [Year 2014] ISSN 2250 – 1959 (0nline) 2348 – 9367 (Print)
International Research Journal of Management Science & Technology http://www.irjmst.com Page 211
SMART MOBILITY
Perhaps it would not be an exaggeration to state that smart mobility was a new paradigm shift
created out of the growth in social networking, which rode high initially on the computer and
subsequently spread to the 4th screen as well. It gave a push to another sector also in doing so, as
the smart phones, notebooks and tablets continues to proliferate, garner market share and
overtake the penetration of internet through mobile rather than computer (Figure 13).
The personalization of information, instant access, interaction as and when desired would only
grow as people expect more of it with time, and gradually it would move to a space where
Telecom and Content Players create disruptive business models to monetize the opportunity.
BYOD (Bring your own device) is a concept picking up with the MNCs as employees demand
greater flexibility to match their personal preferences, as the gamut of choice keeps increasing,
creating serious security solutions for the enterprises to manage the BYOD. This will also in turn
encourage Cloud, to enable the enterprises to offer multiple solutions rather than tying all
employees to singular experience.
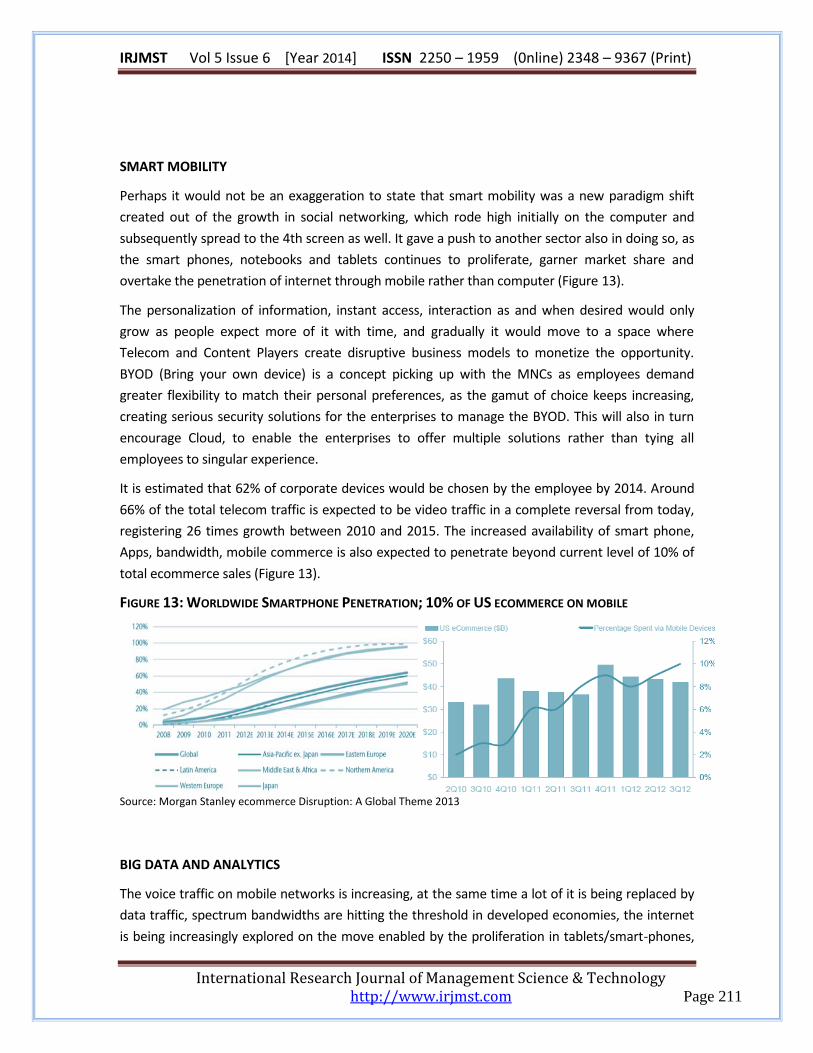
It is estimated that 62% of corporate devices would be chosen by the employee by 2014. Around
66% of the total telecom traffic is expected to be video traffic in a complete reversal from today,
registering 26 times growth between 2010 and 2015. The increased availability of smart phone,
Apps, bandwidth, mobile commerce is also expected to penetrate beyond current level of 10% of
total ecommerce sales (Figure 13).
FIGURE 13: WORLDWIDE SMARTPHONE PENETRATION; 10% OF US ECOMMERCE ON MOBILE
Source: Morgan Stanley ecommerce Disruption: A Global Theme 2013
BIG DATA AND ANALYTICS
The voice traffic on mobile networks is increasing, at the same time a lot of it is being replaced by
data traffic, spectrum bandwidths are hitting the threshold in developed economies, the internet
is being increasingly explored on the move enabled by the proliferation in tablets/smart-phones,
IRJMST Vol 5 Issue 6 [Year 2014] ISSN 2250 – 1959 (0nline) 2348 – 9367 (Print)
International Research Journal of Management Science & Technology http://www.irjmst.com Page 212
social networking is a boon for consumer behaviour, the internet itself is flooded with more and
more information and generic web search is becoming tougher for a lay person, and in this
changing environment where data is exploding, here, there, everywhere; today’s enterprise has to
deal with more information about its customers, competitors and markets than ever before.
As data flows across the world, as boundaries vanish, analysing this internal and external data is
becoming critical to beat the competition, to differentiate, to visualize ‘insights’ to drive better
business decision-making, to make sense out of this sea of data. While there are opportunities,
challenges are on its way, opening huge growth opportunities in domains such as Security, Risk
Management and Analytics.
The Big Data is looked at from the ‘Three V’ perspective – Volume, Velocity and Variety. To give an
indication, USA is expecting to spend USD 1 billion merely on Web Analytics software in 2014.
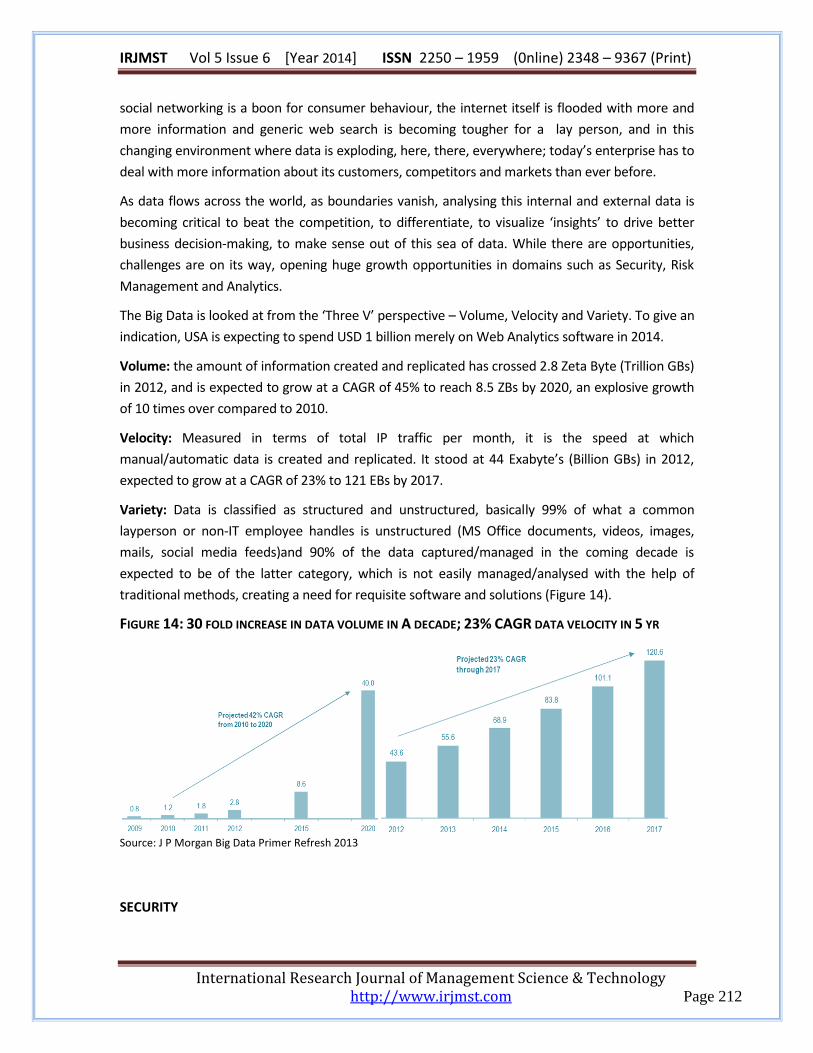
Volume: the amount of information created and replicated has crossed 2.8 Zeta Byte (Trillion GBs)
in 2012, and is expected to grow at a CAGR of 45% to reach 8.5 ZBs by 2020, an explosive growth
of 10 times over compared to 2010.
Velocity: Measured in terms of total IP traffic per month, it is the speed at which
manual/automatic data is created and replicated. It stood at 44 Exabyte’s (Billion GBs) in 2012,
expected to grow at a CAGR of 23% to 121 EBs by 2017.
Variety: Data is classified as structured and unstructured, basically 99% of what a common
layperson or non-IT employee handles is unstructured (MS Office documents, videos, images,
mails, social media feeds)and 90% of the data captured/managed in the coming decade is
expected to be of the latter category, which is not easily managed/analysed with the help of
traditional methods, creating a need for requisite software and solutions (Figure 14).
FIGURE 14: 30 FOLD INCREASE IN DATA VOLUME IN A DECADE; 23% CAGR DATA VELOCITY IN 5 YR
Source: J P Morgan Big Data Primer Refresh 2013
SECURITY
IRJMST Vol 5 Issue 6 [Year 2014] ISSN 2250 – 1959 (0nline) 2348 – 9367 (Print)
International Research Journal of Management Science & Technology http://www.irjmst.com Page 213
With the proliferation of BYOD, Smart Mobility, Cloud and increasing data complexity and size, the
risks to an enterprise would grow multi-fold both internally and externally. As these concepts tend
to take away great degree of control away from the Enterprise and involve additional stakeholders
in the capture/share/manage stages of Big Data, Companies and Governments would be required
to enforce robust security mechanism. Security will find its haven in this new mega trend as it is
expected to be viewed as an unavoidable cost of doing effective business.
ECOMMERCE
While Mega trends are disruptive in nature, e-commerce differs in its evolutionary nature in
APAC markets, wherein it promotes a new stimulating incremental socio-economic model. APAC
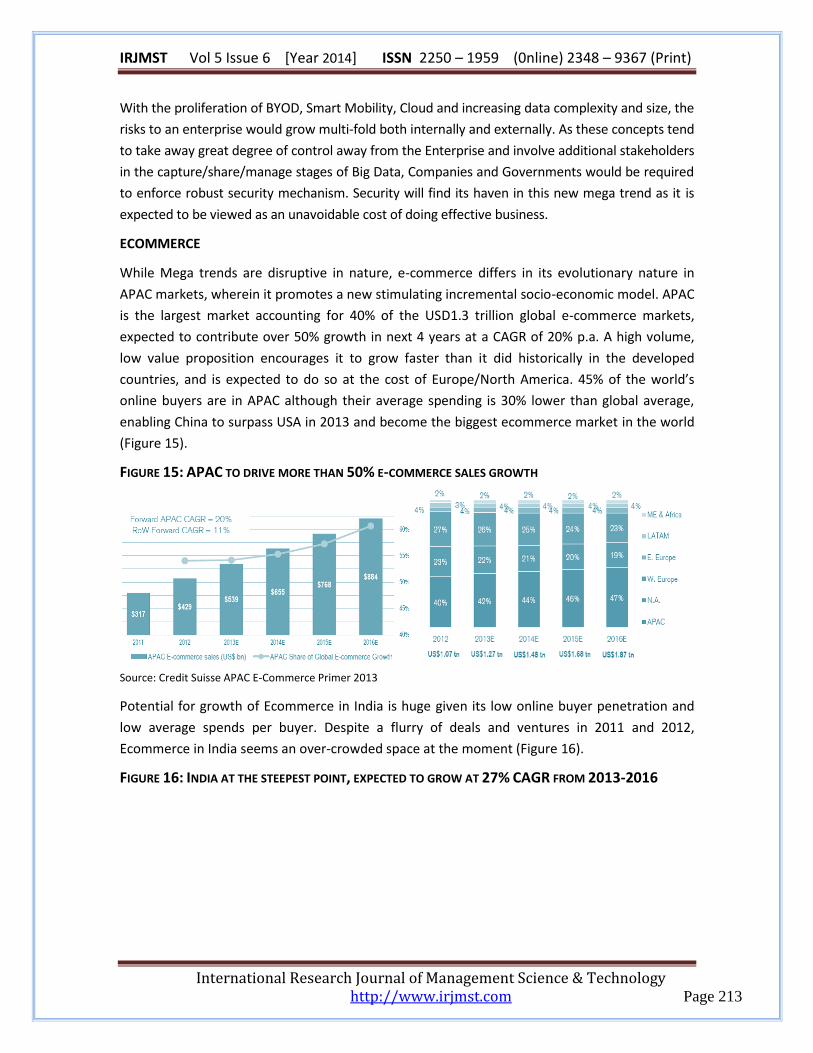
is the largest market accounting for 40% of the USD1.3 trillion global e-commerce markets,
expected to contribute over 50% growth in next 4 years at a CAGR of 20% p.a. A high volume,
low value proposition encourages it to grow faster than it did historically in the developed
countries, and is expected to do so at the cost of Europe/North America. 45% of the world’s
online buyers are in APAC although their average spending is 30% lower than global average,
enabling China to surpass USA in 2013 and become the biggest ecommerce market in the world
(Figure 15).
FIGURE 15: APAC TO DRIVE MORE THAN 50% E-COMMERCE SALES GROWTH
Source: Credit Suisse APAC E-Commerce Primer 2013
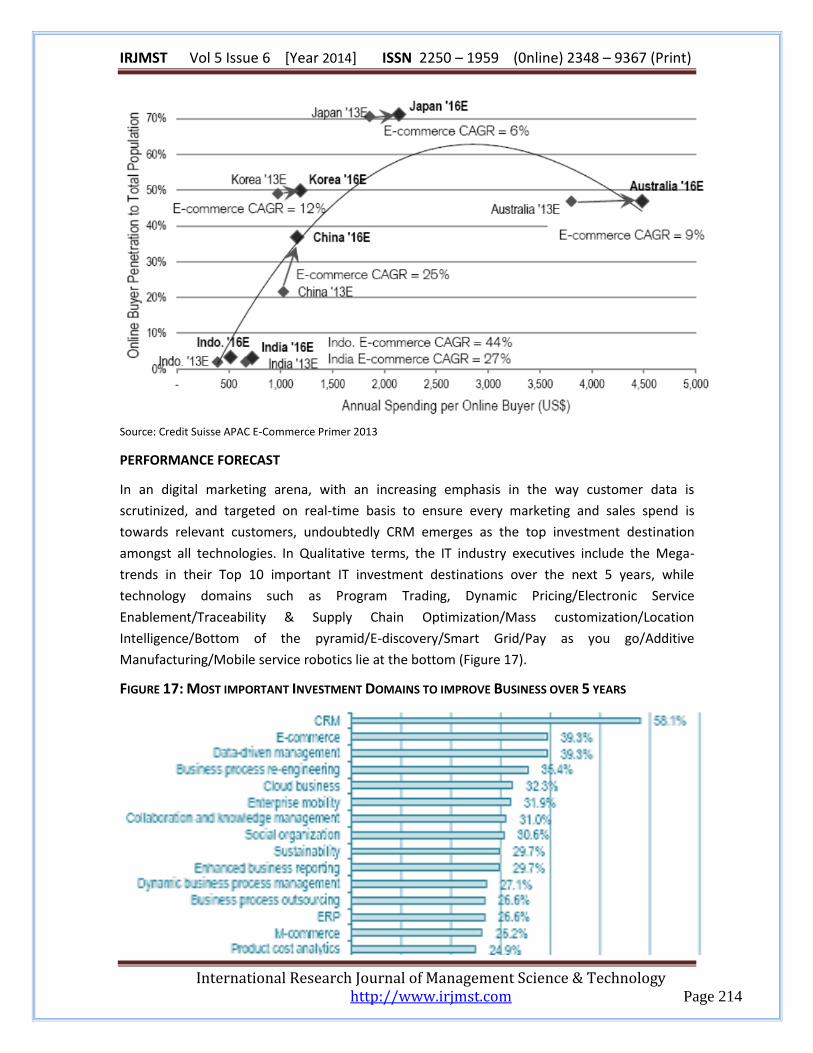
Potential for growth of Ecommerce in India is huge given its low online buyer penetration and
low average spends per buyer. Despite a flurry of deals and ventures in 2011 and 2012,
Ecommerce in India seems an over-crowded space at the moment (Figure 16).
FIGURE 16: INDIA AT THE STEEPEST POINT, EXPECTED TO GROW AT 27% CAGR FROM 2013-2016
IRJMST Vol 5 Issue 6 [Year 2014] ISSN 2250 – 1959 (0nline) 2348 – 9367 (Print)
International Research Journal of Management Science & Technology http://www.irjmst.com Page 214
Source: Credit Suisse APAC E-Commerce Primer 2013
PERFORMANCE FORECAST
In an digital marketing arena, with an increasing emphasis in the way customer data is
scrutinized, and targeted on real-time basis to ensure every marketing and sales spend is
towards relevant customers, undoubtedly CRM emerges as the top investment destination
amongst all technologies. In Qualitative terms, the IT industry executives include the Mega-
trends in their Top 10 important IT investment destinations over the next 5 years, while
technology domains such as Program Trading, Dynamic Pricing/Electronic Service
Enablement/Traceability & Supply Chain Optimization/Mass customization/Location
Intelligence/Bottom of the pyramid/E-discovery/Smart Grid/Pay as you go/Additive
Manufacturing/Mobile service robotics lie at the bottom (Figure 17).
FIGURE 17: MOST IMPORTANT INVESTMENT DOMAINS TO IMPROVE BUSINESS OVER 5 YEARS
IRJMST Vol 5 Issue 6 [Year 2014] ISSN 2250 – 1959 (0nline) 2348 – 9367 (Print)
International Research Journal of Management Science & Technology http://www.irjmst.com Page 215
Source: Credit Suisse Marketo 2013
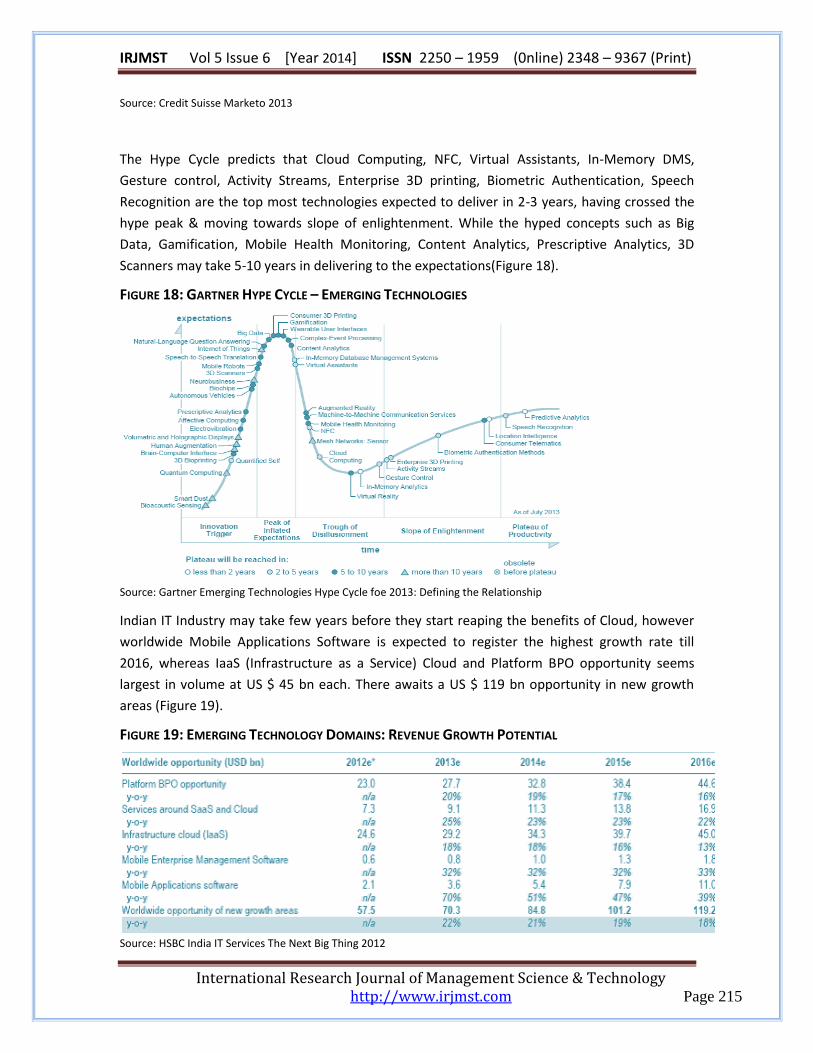
The Hype Cycle predicts that Cloud Computing, NFC, Virtual Assistants, In-Memory DMS,
Gesture control, Activity Streams, Enterprise 3D printing, Biometric Authentication, Speech
Recognition are the top most technologies expected to deliver in 2-3 years, having crossed the
hype peak & moving towards slope of enlightenment. While the hyped concepts such as Big
Data, Gamification, Mobile Health Monitoring, Content Analytics, Prescriptive Analytics, 3D
Scanners may take 5-10 years in delivering to the expectations(Figure 18).
FIGURE 18: GARTNER HYPE CYCLE – EMERGING TECHNOLOGIES
Source: Gartner Emerging Technologies Hype Cycle foe 2013: Defining the Relationship
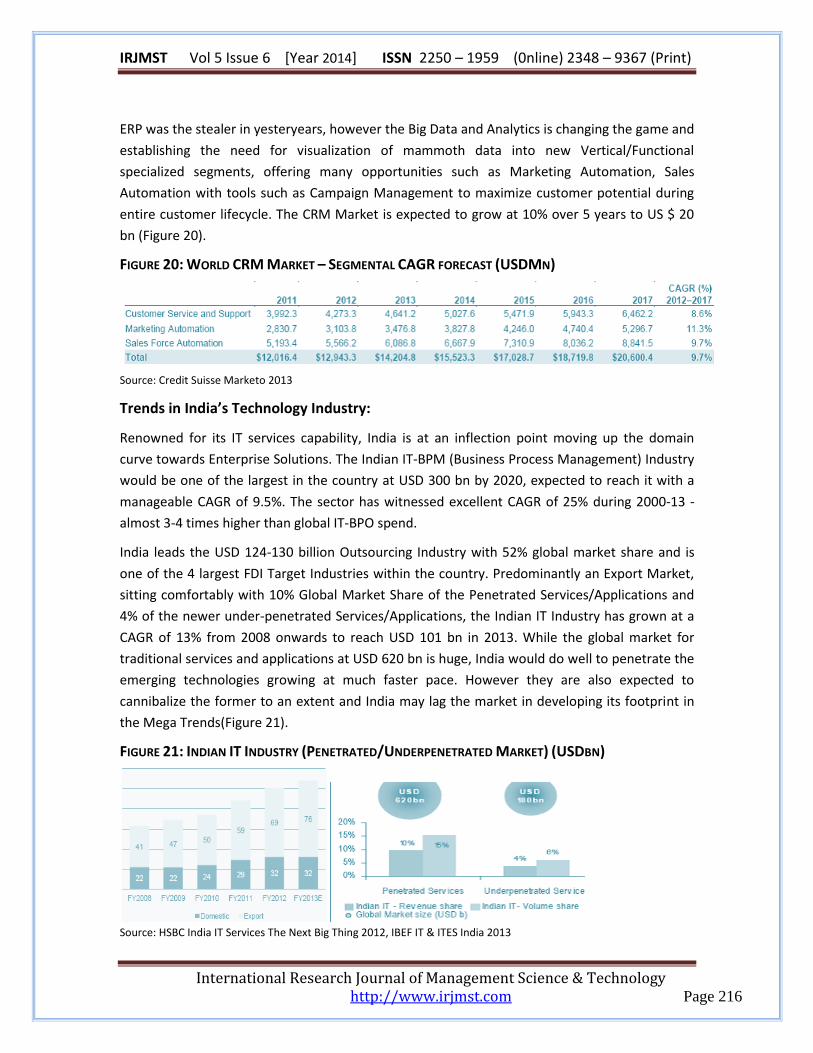
Indian IT Industry may take few years before they start reaping the benefits of Cloud, however
worldwide Mobile Applications Software is expected to register the highest growth rate till
2016, whereas IaaS (Infrastructure as a Service) Cloud and Platform BPO opportunity seems
largest in volume at US $ 45 bn each. There awaits a US $ 119 bn opportunity in new growth
areas (Figure 19).
FIGURE 19: EMERGING TECHNOLOGY DOMAINS: REVENUE GROWTH POTENTIAL
Source: HSBC India IT Services The Next Big Thing 2012
IRJMST Vol 5 Issue 6 [Year 2014] ISSN 2250 – 1959 (0nline) 2348 – 9367 (Print)
International Research Journal of Management Science & Technology http://www.irjmst.com Page 216
ERP was the stealer in yesteryears, however the Big Data and Analytics is changing the game and
establishing the need for visualization of mammoth data into new Vertical/Functional
specialized segments, offering many opportunities such as Marketing Automation, Sales
Automation with tools such as Campaign Management to maximize customer potential during
entire customer lifecycle. The CRM Market is expected to grow at 10% over 5 years to US $ 20
bn (Figure 20).
FIGURE 20: WORLD CRM MARKET – SEGMENTAL CAGR FORECAST (USDMN)
Source: Credit Suisse Marketo 2013
Trends in India’s Technology Industry:
Renowned for its IT services capability, India is at an inflection point moving up the domain
curve towards Enterprise Solutions. The Indian IT-BPM (Business Process Management) Industry
would be one of the largest in the country at USD 300 bn by 2020, expected to reach it with a
manageable CAGR of 9.5%. The sector has witnessed excellent CAGR of 25% during 2000-13 -
almost 3-4 times higher than global IT-BPO spend.
India leads the USD 124-130 billion Outsourcing Industry with 52% global market share and is
one of the 4 largest FDI Target Industries within the country. Predominantly an Export Market,
sitting comfortably with 10% Global Market Share of the Penetrated Services/Applications and
4% of the newer under-penetrated Services/Applications, the Indian IT Industry has grown at a
CAGR of 13% from 2008 onwards to reach USD 101 bn in 2013. While the global market for
traditional services and applications at USD 620 bn is huge, India would do well to penetrate the
emerging technologies growing at much faster pace. However they are also expected to
cannibalize the former to an extent and India may lag the market in developing its footprint in
the Mega Trends(Figure 21).
FIGURE 21: INDIAN IT INDUSTRY (PENETRATED/UNDERPENETRATED MARKET) (USDBN)
Source: HSBC India IT Services The Next Big Thing 2012, IBEF IT & ITES India 2013
IRJMST Vol 5 Issue 6 [Year 2014] ISSN 2250 – 1959 (0nline) 2348 – 9367 (Print)
International Research Journal of Management Science & Technology http://www.irjmst.com Page 217
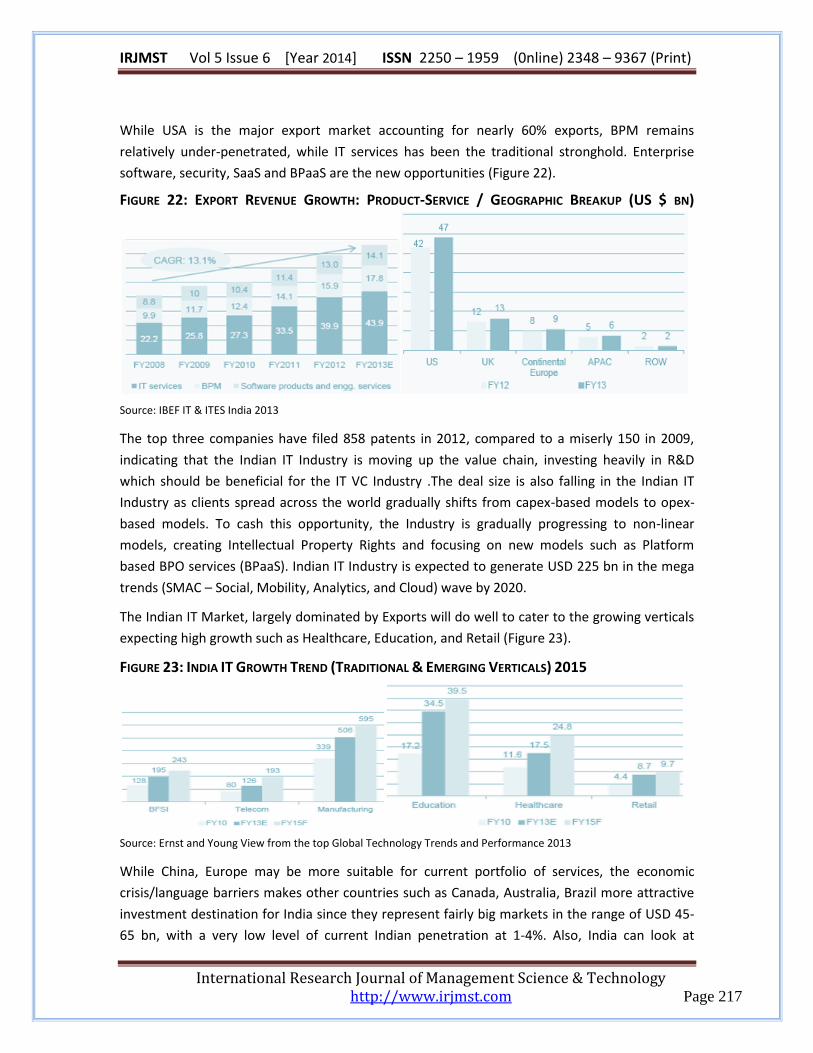
While USA is the major export market accounting for nearly 60% exports, BPM remains
relatively under-penetrated, while IT services has been the traditional stronghold. Enterprise
software, security, SaaS and BPaaS are the new opportunities (Figure 22).
FIGURE 22: EXPORT REVENUE GROWTH: PRODUCT-SERVICE / GEOGRAPHIC BREAKUP (US $ BN)
Source: IBEF IT & ITES India 2013
The top three companies have filed 858 patents in 2012, compared to a miserly 150 in 2009,
indicating that the Indian IT Industry is moving up the value chain, investing heavily in R&D
which should be beneficial for the IT VC Industry .The deal size is also falling in the Indian IT
Industry as clients spread across the world gradually shifts from capex-based models to opex-
based models. To cash this opportunity, the Industry is gradually progressing to non-linear
models, creating Intellectual Property Rights and focusing on new models such as Platform
based BPO services (BPaaS). Indian IT Industry is expected to generate USD 225 bn in the mega
trends (SMAC – Social, Mobility, Analytics, and Cloud) wave by 2020.
The Indian IT Market, largely dominated by Exports will do well to cater to the growing verticals
expecting high growth such as Healthcare, Education, and Retail (Figure 23).
FIGURE 23: INDIA IT GROWTH TREND (TRADITIONAL & EMERGING VERTICALS) 2015
Source: Ernst and Young View from the top Global Technology Trends and Performance 2013
While China, Europe may be more suitable for current portfolio of services, the economic
crisis/language barriers makes other countries such as Canada, Australia, Brazil more attractive
investment destination for India since they represent fairly big markets in the range of USD 45-
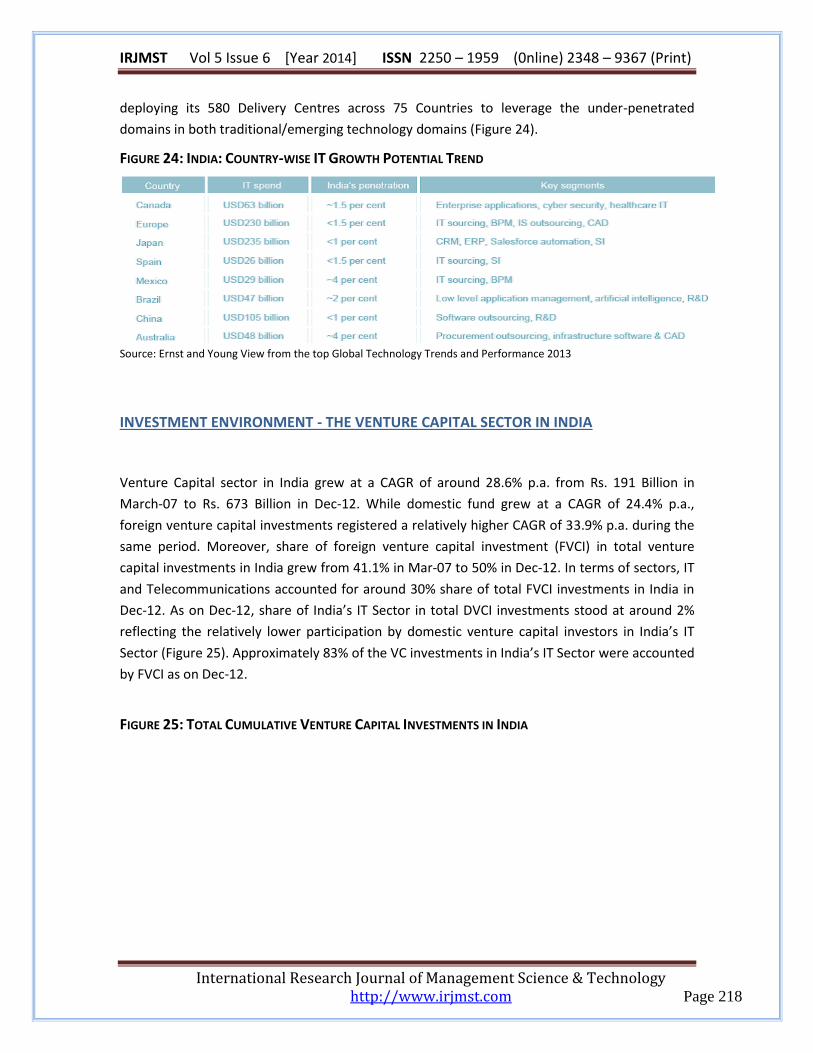
65 bn, with a very low level of current Indian penetration at 1-4%. Also, India can look at
IRJMST Vol 5 Issue 6 [Year 2014] ISSN 2250 – 1959 (0nline) 2348 – 9367 (Print)
International Research Journal of Management Science & Technology http://www.irjmst.com Page 218
deploying its 580 Delivery Centres across 75 Countries to leverage the under-penetrated
domains in both traditional/emerging technology domains (Figure 24).
FIGURE 24: INDIA: COUNTRY-WISE IT GROWTH POTENTIAL TREND
Source: Ernst and Young View from the top Global Technology Trends and Performance 2013
INVESTMENT ENVIRONMENT - THE VENTURE CAPITAL SECTOR IN INDIA
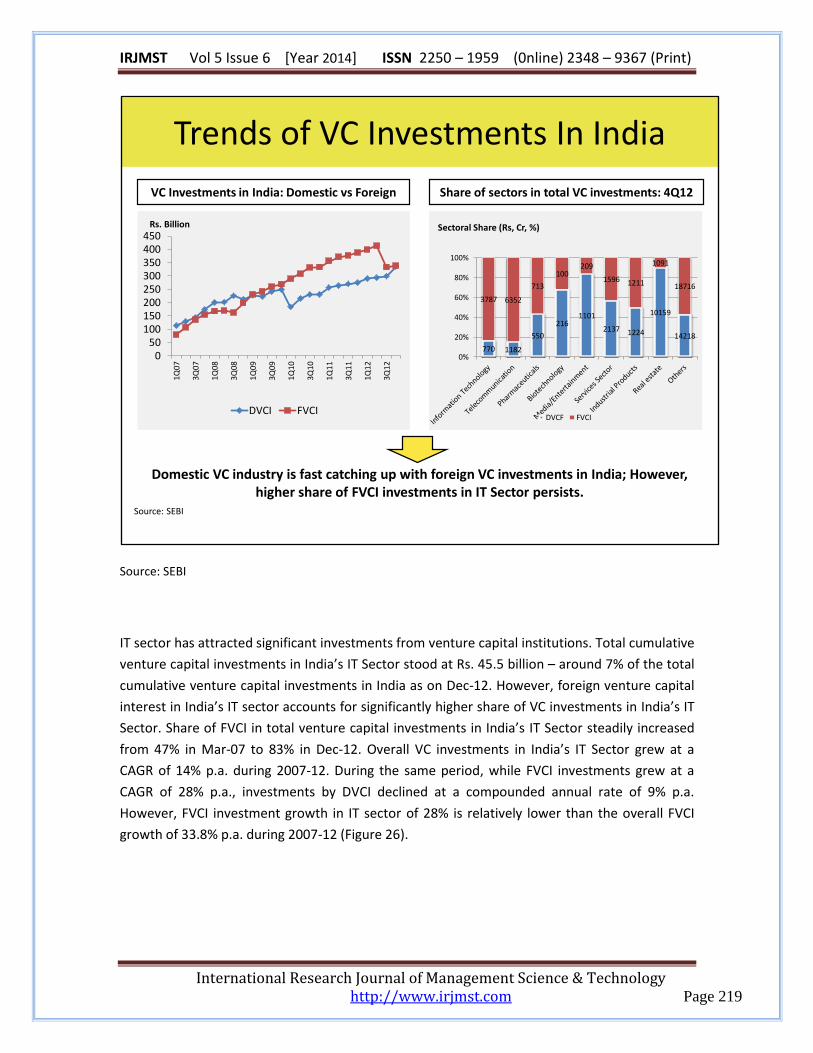
Venture Capital sector in India grew at a CAGR of around 28.6% p.a. from Rs. 191 Billion in
March-07 to Rs. 673 Billion in Dec-12. While domestic fund grew at a CAGR of 24.4% p.a.,
foreign venture capital investments registered a relatively higher CAGR of 33.9% p.a. during the
same period. Moreover, share of foreign venture capital investment (FVCI) in total venture
capital investments in India grew from 41.1% in Mar-07 to 50% in Dec-12. In terms of sectors, IT
and Telecommunications accounted for around 30% share of total FVCI investments in India in
Dec-12. As on Dec-12, share of India’s IT Sector in total DVCI investments stood at around 2%
reflecting the relatively lower participation by domestic venture capital investors in India’s IT
Sector (Figure 25). Approximately 83% of the VC investments in India’s IT Sector were accounted
by FVCI as on Dec-12.
FIGURE 25: TOTAL CUMULATIVE VENTURE CAPITAL INVESTMENTS IN INDIA
IRJMST Vol 5 Issue 6 [Year 2014] ISSN 2250 – 1959 (0nline) 2348 – 9367 (Print)
International Research Journal of Management Science & Technology http://www.irjmst.com Page 219
Source: SEBI
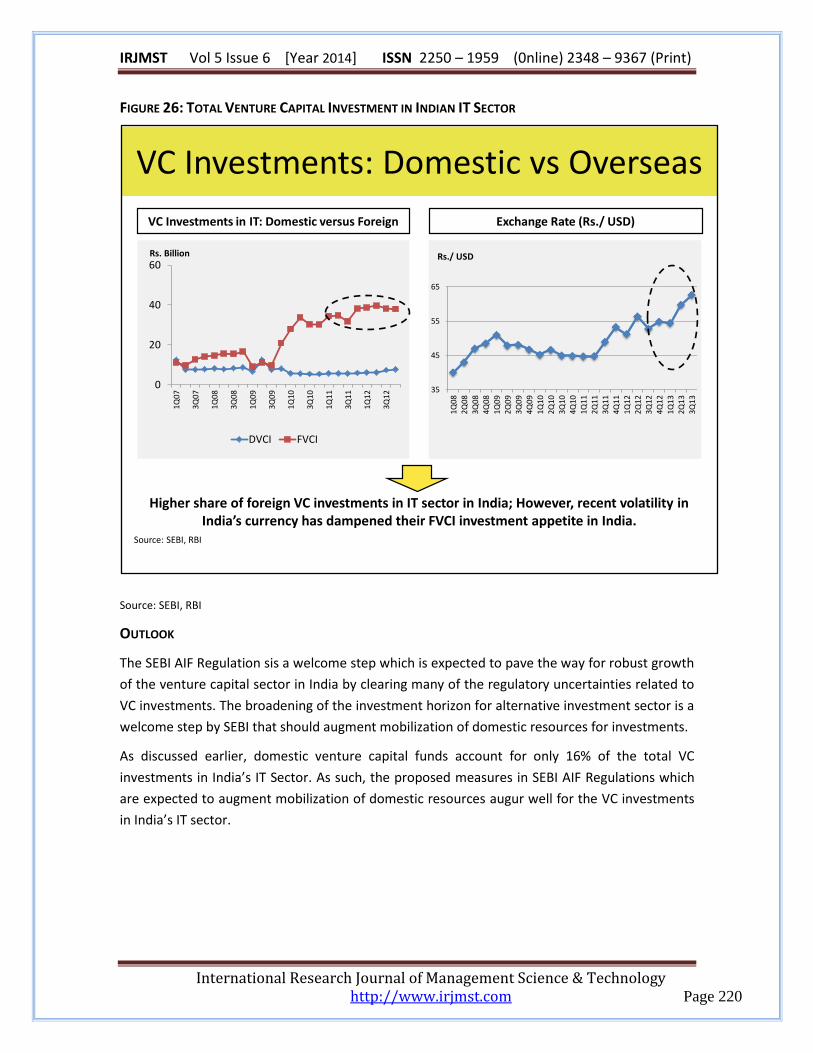
IT sector has attracted significant investments from venture capital institutions. Total cumulative
venture capital investments in India’s IT Sector stood at Rs. 45.5 billion – around 7% of the total
cumulative venture capital investments in India as on Dec-12. However, foreign venture capital
interest in India’s IT sector accounts for significantly higher share of VC investments in India’s IT
Sector. Share of FVCI in total venture capital investments in India’s IT Sector steadily increased
from 47% in Mar-07 to 83% in Dec-12. Overall VC investments in India’s IT Sector grew at a
CAGR of 14% p.a. during 2007-12. During the same period, while FVCI investments grew at a
CAGR of 28% p.a., investments by DVCI declined at a compounded annual rate of 9% p.a.
However, FVCI investment growth in IT sector of 28% is relatively lower than the overall FVCI
growth of 33.8% p.a. during 2007-12 (Figure 26).
Trends of VC Investments In India
VC Investments in India: Domestic vs Foreign
Source: SEBI
Share of sectors in total VC investments: 4Q12
Domestic VC industry is fast catching up with foreign VC investments in India; However, higher share of FVCI investments in IT Sector persists.
770 1182
550
2161101
2137 1224
10159
14218
3787 6352
713
100209
1596 1211
1091
18716
0%
20%
40%
60%
80%
100%
Sectoral Share (Rs, Cr, %)
DVCF FVCI
050
100150200250300350400450
1Q07
3Q07
1Q08
3Q08
1Q09
3Q09
1Q10
3Q10
1Q11
3Q11
1Q12
3Q12
Rs. Billion
DVCI FVCI
IRJMST Vol 5 Issue 6 [Year 2014] ISSN 2250 – 1959 (0nline) 2348 – 9367 (Print)
International Research Journal of Management Science & Technology http://www.irjmst.com Page 220
FIGURE 26: TOTAL VENTURE CAPITAL INVESTMENT IN INDIAN IT SECTOR
Source: SEBI, RBI
OUTLOOK
The SEBI AIF Regulation sis a welcome step which is expected to pave the way for robust growth
of the venture capital sector in India by clearing many of the regulatory uncertainties related to
VC investments. The broadening of the investment horizon for alternative investment sector is a
welcome step by SEBI that should augment mobilization of domestic resources for investments.
As discussed earlier, domestic venture capital funds account for only 16% of the total VC
investments in India’s IT Sector. As such, the proposed measures in SEBI AIF Regulations which
are expected to augment mobilization of domestic resources augur well for the VC investments
in India’s IT sector.
VC Investments: Domestic vs Overseas
VC Investments in IT: Domestic versus Foreign
Source: SEBI, RBI
Exchange Rate (Rs./ USD)
Higher share of foreign VC investments in IT sector in India; However, recent volatility in India’s currency has dampened their FVCI investment appetite in India.
35
45
55
65
1Q08
2Q08
3Q08
4Q08
1Q09
2Q09
3Q09
4Q09
1Q10
2Q10
3Q10
4Q10
1Q11
2Q11
3Q11
4Q11
1Q12
2Q12
3Q12
4Q12
1Q13
2Q13
3Q13
Rs./ USD
0
20
40
60
1Q07
3Q07
1Q08
3Q08
1Q09
3Q09
1Q10
3Q10
1Q11
3Q11
1Q12
3Q12
Rs. Billion
DVCI FVCI


