Embed Size (px)
Citation preview

Vascular access surveillance
Date written: November 2006Final submission: March 2008Author: Kevan Polkinghorne
GUIDELINES
Arteriovenous graft (AVG)a. Regular Access Blood Flow (Qa) or Doppler ultrasound stenosis (DUS) screening increases the detection of
AVG stenosis compared to dynamic venous pressure (DVP)/clinical examination. (Level II evidence)b. Regular Qa screening with pre-emptive angioplasty does not reduce AVG thrombosis or prolong AVG survival.
(Level I & II evidence)c. Whether regular DUS screening with pre-emptive angioplasty reduces AVG thrombosis or prolongs survival is
not known. (mixed results, Level I & II evidence)d. Whether regular Qa or DUS screening coupled with pre-emptive surgical repair reduces AVG thrombosis or
prolongs survival is not known.e. Regular static venous pressure (SVP) screening with pre-emptive angioplasty does not reduce AVG thrombosis
or prolong survival. (Level II evidence)
Arteriovenous fistula (AVF)a. Regular Qa screening increases the detection of AVF stenosis compared to clinical examination/low arterial
pressure/recirculation alone. (Level II evidence)b. Regular Qa screening with pre-emptive repair (either angioplasty or surgery) reduces AVF thrombosis (Level I
& II evidence) and may prolong AVF survival. (Level II evidence)
SUGGESTIONS FOR CLINICAL CARE
(Suggestions are based on Level III and IV evidence)
AVG
• There is no evidence (Level I or II) to refute or supportDVP-based screening
AVF
• Screening with DVP has little or no role (Opinion)• There is no evidence (Level I or II) to refute or supportDUS-based screening• Optimal Qa thresholds, frequency of monitoring andcost effectiveness have not yet been determined
BACKGROUND
The development of progressive vascular access stenosiswith the subsequent failure of the access (thrombosis and/orrevision) contributes significant morbidity to patients onhaemodialysis. The maintenance of vascular access inhaemodialysis patients is estimated to account for at least25% of all hospital admissions in the USA1,2 and 18% inCanada.3 The total annual global cost of vascular access
morbidity has been estimated to account for 14% to 17% ofall spending on haemodialysis per year at risk.4Costs are alsohigher for catheters and AVG compared to AVF.3–5 Finally,the use of catheters is also associated with higher morbidityand mortality compared to the use of AVF.6–8 Therefore, theability to identify a vascular access at risk for failure throughthe detection of a significant access stenosis is considered animportant clinical goal as the identified vascular accesscould ideally be repaired electively to prevent failure andinterruption to the dialysis treatment.The objectives of this guideline are to review the evi-
dence that vascular access surveillance or screening for sig-nificant vascular access stenosis, with subsequent electiverepair, will improve vascular access survival. For a screeningprogramme to be successful, two important elements areneeded. Not only should the screening test be efficient atdetecting the presence of an underlying significant stenosis,it should also be subsequently demonstrated that correctionof the stenosis results in a reduction in vascular accessthrombosis rates and/or prolongs access survival.
SEARCH STRATEGY
Databases searched: MeSH terms and text words for hae-modialysis were combined with MeSH terms and text words
NEPHROLOGY 2008; 13, S1–S11 doi:10.1111/j.1440-1797.2008.00992.x
© 2008 The AuthorJournal compilation © 2008 Asian Pacific Society of Nephrology

for arteriovenous shunt surgical, arteriovenous fistula andcombined with MeSH terms and text words for pathologicconstriction, stenosis, thrombosis, graft occlusion and bloodflow velocity. The search was carried out in Medline (1966– August, Week 4, 2007). The Cochrane Renal Group TrialsRegister was also searched for trials not indexed in Medline.Date of search: 31 August 2007.
WHAT IS THE EVIDENCE?
A large number of methods have been advocated as ascreening test for vascular access stenosis. These includepressure measurements such as dynamic venous pressure(DVP) and static venous pressure (SVP), using dopplerultrasound to screen for an underlying stenosis (DUS), andthe measurement of vascular access blood flow (Qa). Inorder to interpret the rationale for these techniques, anunderstanding of the haemodynamics of both normal andstenotic AVG and AVF is essential.
Vascular access haemodynamics
In AVF, blood flow in radiocephalic AVF is approximately700 to 1100 mL/min while in upper arm AVF, flows aremuch higher, ranging from 1100 to 2000 mL/min but canalso reach over 3 L/min.9–11 Blood flow in normal AVG is600–800 mL/min in straight grafts from the radial artery,rising to approximately 1000 mL/min for forearm loops.12–14
Upper arm AVG blood flow is higher and can reach up to3000 mL/min.15
Although the range of blood flow in AVF is similar toAVG, the relationship between pressure and flow is not.16,17
Arteriovenous grafts, by their very nature, have only onedraining outlet (the venous anastomosis). Most of the arte-rial pressure in AVG is dissipated across the two anasto-moses,18 with the pressure gradient generated larger than inAVF (around 40%) [Figure 1]. It follows that any obstruc-tion to outflow from the AVG will result in an increase inthe intra-access pressure with a corresponding reduction inblood flow (Figure 2).16
In the radiocephalic AVF the blood returns to the heartby multiple collaterals and not just the main draining vein.Intra-access pressure in AVF falls to around 20% in theearliest segment of the AVF with the drop in pressure overthe rest of the AVF remaining low (about 10%) [Figure 1].As a result of the low resistance and presence of the collat-eral veins, a venous stenosis can cause a reduction in bloodflow but without the corresponding increase in access pres-sure (Figure 2).16 This relationship becomes important whenusing pressure measurements to detect stenosis in AVF.Whether this relationship persists in AVF in the upper armposition has not been examined. However, given the moredistal location it is possible that the pressure/flow relation-ship is more like AVG.Based on the knowledge of access haemodynamics,
access surveillance can be performed by using either pres-sures or blood flow as a surrogate marker to detect thepresence of stenosis or by directly screening for the presenceof a stenosis itself.
Blood flow screening: techniques
Vascular access blood flow can be measured by a number ofdifferent techniques but is broadly categorised into thoseusing indicator dilution techniques, or those directly esti-mating Qa using either Doppler ultrasound or magneticresonance imaging (MRA).19 Krivitski elegantly describedand validated the application of dilution principles tomeasure vascular access blood flow.20,21 According to thedilution method, blood flow (Q) is given by:
Q V S=
where V is the amount of injected indicator that com-pletely mixes in the blood flow stream Q; S is the areaunder the dilution curve which is equal to the averageconcentration of indicator in the blood multiplied by theduration of the curve. By reversing the dialysis blood lines(inducing access recirculation) and measuring both theblood flow in the tubing and the changes in ultrasoundvelocity induced by a saline bolus (using ultrasound probesattached to the blood line) access blood flow (Qa) isequal to:
Qa Qb Sv Sa= ∗ −( )1
where Qb is the venous line blood flow and Sv/Sa is theratio of areas under the dilution curves recorded by matchedarterial (Sa) and venous dilution sensors generated by thesaline bolus injection. The above equation can then berewritten into the now widely recognised form:
Qa Qb 1 R= ∗ −( )1
where R is the fractional access recirculation caused bythe reversal of the dialysis lines. Following the initial des-cription of the technique by Krivitski using saline as theindicator, others demonstrated the measurement of accessblood flow based on different blood properties such aselectrical impedance (conductivity),22 optical properties(haemocrit)23,24 and temperature.25 Newly developed recenttechniques include the variable flow Doppler method,26 thetranscutaneous flow monitor 27 and the glucose pump test,28
which do not require the reversal of the dialysis lines toperform the measurements.The ultrasound dilution velocity method is the
most well-validated method for measuring access bloodflow20,21,29,30 and is considered to be the gold standardmethod.14,31 Following the initial description of the method,using both bench and animal models of haemodialysis,20,21
four factors have been identified that directly influence theaccuracy of the measurements.30,32 Firstly, thorough mixingof the indicator is required, which is influenced by both thedistance between and orientation of the needles where thearterial needle must be placed in the direction of the incom-ing flow. In AVF, the two needles must be in sequence orseries with the arterial needle in the main branch of theAVF. Secondly, the second pass of the indicator due tocardiopulmonary recirculation will produce errors if it is
The CARI GuidelinesS2

incorporated into the measurement. Cardiopulmonary recir-culation (CPR) increases as Qa increases (CPR = Qa/CO)and if incorporated, will cause an underestimation of thetrue Qa value. Thirdly, the reversal of the blood lines that isrequired to perform the measurement will also influence theaccess blood flow result. Using mathematical modelling andcomparing to the flow measured directly by an implantedtransit-flow probe, Qa determined by the dilution methodwas found to underestimate the true access flow by anaverage of 40–60 mL/min.30 Others have also confirmedthese both theoretically by using haemodynamic calcula-tions and in vitro, in a bench model of haemodialysis.33
Finally, Qb must be measured accurately as readings fromthe dialysis blood pump have been shown to overestimatedelivered Qb flow by between 10% to 20%.34 The ultra-sound dilution method is the only method that directlymeasures Qb instead of using the dialysis blood pump read-ings. In addition, injection of the fluid bolus into a venousport close to the access can also cause significant errors inthe Qb measurement and therefore the Qa estimate. Thiswas eliminated by moving the bolus injection to prior to thevenous bubble trap.As the dilution techniques are performed while the
patient is undergoing the haemodialysis treatment, the hae-modynamic state of the patient at the time of the test caninfluence the result of the test.35–37 Therefore, it is recom-mended that flow measurements be performed only in thefirst 1.5 hours into the treatment when the blood pressure isusually stable.Doppler ultrasound measures blood flow velocity and
not blood flow directly. In order to determine blood flow,cross-sectional area needs to be estimated. The estimatedflow can be inaccurate due to the operator dependence ondetermining the blood velocity, and subject error in esti-mating the cross sectional error and the Doppler angle.38–40
Four studies have compared Qa determined by ultrasounddilution to that by ultrasound.29,41–43 Three compared flowby correlation coefficients only and thus did not assessagreement between the methods.29,41,42 The fourth studyhowever, was well performed, comparing the two methodswith the intraclass correlation coefficients (ICC) andBland and Altman limits of agreement.43 The investigatorsused the same ultrasound machine to estimate flow by con-ventional Doppler and quantitative colour velocity index(CVI-Q), which is not as operator dependant and isassociated with less error.42,43 Compared to ultrasound dilu-tion, convention Doppler performed very poorly with anICC of 0.10 and demonstrated significant bias with anincreasing difference between the two as the mean Qaincreased. Qa estimated using CVI-Q faired better withthe ICC 0.56 and no systematic bias on the Bland andAltman plot.Access flow can also be measured by MRA. However as
this technique is expensive and cannot be performed duringdialysis it is impractical as a screening tool. Nevertheless,two studies have assessed MRA, comparing it to dye dilutiontechniques,44 and ultrasound dilution.45All studies used cor-relation coefficients to compare the techniques, with coef-ficients ranging from 0.84 to 0.86.
Blood flow surveillance: randomised controlled trials
Prospective studies have established an association betweenQa and the risk of thrombosis and/or the presence of astenosis.46–51 The risk of thrombosis differs depending onaccess type, with AVG at risk of thrombosis at higher flows(cut offs 500 to 750 mL/min)46,47 compared to AVF wherethresholds are lower (300 to 500 mL/min).50
Five RCTs including a total of 520 patients have exam-ined the effect of Qa surveillance and pre-emptive repair(angioplasty in the majority of studies) on vascular accessthrombosis rates (Table 1).52–56 Overall, the RCTs are ofvariable quality and used different monitoring frequenciesand flow thresholds for the triggering of investigation. Notethat all trials measured Qa using ultrasound dilution.Follow-up ranged from6months to 5 years. One further RCTexamined the ability of Qa surveillance to detect AVF steno-sis but was not powered to assess AVF outcomes.48 This studydemonstrated that the addition of Qa monitoring doubledthe detection of a significant AVF stenosis compared to thecontrol group although this did not reach statistical signifi-cance (HR 2.27, 95% CI 0.85, 5.98, P = 0.09).Sands et al.54 assessed both SVP and Qa surveillance.
Both AVF and AVG were included in the study with resultspresented separately. A significant reduction in thrombosisrates in both AVG (2.5 vs 0.2 per patient years, P < 0.01)and AVF (0.27 vs 0.17 per patient years, P < 0.05) was seen.However, although there were two separate interventiongroups (SVP and Qa screening), the two groups were com-bined in the presentation of the results. Thus, it is difficultto determine which method provided the benefit. In addi-tion, both the AVG and AVF control groups had an unusu-ally high thrombosis rate, which magnified the benefit seenin this small study.Smits et al.55 in two separate studies, compared either Qa
surveillance alone or Qa surveillance and DVP to DVPalone in patients with AVG. The primary end-point in thestudy was defined as a thrombotic episode without a preced-ing positive test. This unfortunately lead to the exclusion of21 of the 42 thrombotic episodes which occurred after apositive screening test but before the planned intervention,thus reducing the power of the study. No difference was seenbetween the thrombosis rates between the two groups ineach of the studies.Ram et al.53 performed an RCT in AVG with three arms
– a control group (clinical examination and DVP), amonthly Qa surveillance group and a 3-monthly ultrasoundstenosis screening group. Results of the ultrasound arm arediscussed below. Intervention rates in the Qa group weresignificantly higher in the screening group compared to thecontrol, indicating that screening detected ‘significant’AVG stenoses. However, despite this, the thrombosis ratewas significantly higher in the Qa group compared to thecontrol group (0.91 vs 0.68 per patient years, P = 0.02), theresults largely driven by multiple thromboses in threeAVGs.53Overall, the two-year graft survival was no differentbetween the groups. Moist et al. 52 also compared clinicaland DVP to monthly Qa surveillance in AVG alone. Similarto the previous study, despite the significantly higher rate in
Vascular Access S3

intervention in the Qa group, no significant difference wasseen in the thrombosis rates between the two groups. Inboth these studies, assessment of the vascular access wasperformed blind to the surveillance assignment.Finally, Tessitore et al.56 examined subjects with stenotic
AVF. Blood flow was measured using ultrasound dilution ona 3-monthly basis. Randomisation was by coin toss andthere was no blinding of surveillance allocation. Arterio-venous fistula failure, which included thrombosis and accessabandonment, was significantly longer in the Qa groupcompared to the control group (HR for failure control vstreatment = 3.93, 95% CI 1.42, 10.93). Specific thrombosisrates were not reported. The same group also reported afurther RCT which randomised functioning but stenoticAVF to angioplasty or no treatment. This study also dem-onstrated significantly improved AVF survival with theangioplasty procedure.57
Doppler ultrasound stenosis screening: randomisedcontrolled trials
Doppler ultrasound is a non-invasive procedure that inaddition to the measurement of Qa can provide anatomicinformation on the vascular access. As such, it has beenadvocated as a screening technique to identify accesses atrisk of thrombosis by identifying the anatomic presence of asignificant stenosis. The main disadvantage is that itrequires specialised equipment, skill, and is expensive.Six RCTs53,58–62 assessing the effect of DUS screening for
stenosis combined with either angioplasty or surgical repairon access thrombosis and survival have been performed(Table 2). All trials excluded AVF.Mayer et al.60 randomised70 patients with newPTFEAVGto either 3-monthly clinicalexaminations or 3-monthlyDoppler ultrasound examinationin the first year and subsequent yearly examinations. Ultra-sound screening resulted in a significantly longer secondaryAVG patency at 6 months post-AVG implantation but thisdid not persist at 12 months of follow-up. This was not at thecost of more frequent re-operations in the surveillance groupwhere 77% of the control group required reoperation versus43% in the surveillance group. In addition, the number ofsecondary procedures was significantly less in the surveil-lance group (0.7 versus 1.6 per patient, P = 0.05). The higherprocedure rate in the control group was accounted for by amuch higher thrombosis rate compared to the surveillancegroup (42 versus 2, respectively). All interventions in thisstudy were surgical.Lumsden et al.58 screened all patients for the presence of
a significant (>50%) stenosis, randomising those with asignificant stenosis detected (confirmed on angiogram) toreceive either prophylactic angioplasty or observation.Ultrasound scanning was continued every 2 months. Both6- and 12-month patency rates were no different betweenthe two groups. Subsequent to the initial report, Martinet al.63 presented a sub-analysis assessing only new AVGenrolled in the study. Only 21 patients from the original 64patients had new AVG, 8 in the treatment group, 13 in thecontrol group. In this subgroup, there was a significant pro-
longation of AVG patency (P = 0.035) and a reduction inthrombosis rate in the treatment group (0.10 versus 0.44thrombosis per patient-dialysis year).In the study by Ram et al.53 patients were randomised to
3-monthly DUS screening. The ultrasound screening grouphad the highest pre-emptive angioplasty rate and a trend to alonger thrombosis-free survival (P = 0.10). However, neitherevent-free survival nor 2-year AVG survival (62% versus64%) were significantly better in the ultrasound group.Malik et al.59 randomised 192 subjects to either regular
ultrasound examinations performed every 3 months in addi-tion to ‘traditional screening’ (consisting of regular accessexamination, DVP monitoring and access flow) or the tra-ditional screening only. Blood flow was also calculated usingthe velocity readings from the ultrasound assessments. Sub-jects were referred for intervention if a ‘significant stenosis’(not defined in the paper) was detected with or without adecrease in blood flow or if a ‘non-significant stenosis’ wasdetected with a blood flow decrease of >25%. Thus the studytested a combination of stenosis screening and blood flowreductions. Subjects in the ultrasound screening group had asignificantly longer access patency compared to the usualscreening group (P < 0.001) with a higher rate of interven-tions (2.1 versus 1.3 per graft).Robbins et al.61 randomised 126 patients with AVG to
either regular 4-monthly ultrasound surveillance in additionto clinical monitoring or to clinical monitoring alone forAVG stenosis. While the frequency of pre-emptive graftangioplasty was 64% higher in the ultrasound group (1.05 vs0.64 events per patient-year, P < 0.001) due to an increasein the detection of AVG stenosis, the cumulative graft sur-vival was similar (median survival 38 versus 37 months forthe ultrasound and control groups, respectively, P = 0.93).The thrombosis rates were also not different (0.67 vs 0.78per patient-year ultrasound and control groups, respectively,P = 0.37).Finally, Sands et al.62 prospectively randomised 55
patients to screening with colour flow Doppler ultrasound.Patients with stenosis 350% underwent angiography 1angioplasty. The ultrasound group had a significantly lowerthrombosis rate (19.2 vs 126.2/100 patient years, P < 0.05)and intervention rate (21 vs 138.8/100 patient years,P < 0.05). This study is published only in abstract form.
Blood flow surveillance and doppler ultrasound stenosisscreening: systematic review
One systematic review has assessed the effect of screeningusing access blood flow measurements and DUS on vascularaccess outcomes.64 The review included all 11 RCTs detailedabove plus an RCT of preemptive PTCA, as the AVF steno-sis were detected by blood flow screening. A total of 1,164participants were included in the review. Outcomes assessedwere access thrombosis, access loss (defined as access aban-donment) and resource use. Outcomes for AVG and AVFwere reported separately.For AVG, no reduction was seen in either the risk of
thrombosis (RR 0.94, 95% C.I. 0.77 – 1.16, 6 trials) or
The CARI GuidelinesS4

access loss (RR 1.08, 95% C.I. 0.83 – 1.40, 4 trials). Accessscreening significantly increased the number of angioplas-ties (relative rate 1.29, 95% C.I. 1.04 – 1.60, 5 trials) whilethe number of catheter insertions was significantly reduced(relative rate 0.59, 95% C.I. 0.37 – 0.93, 1 trial).In contrast to AVG, a significant reduction in AVF
thrombosis was seen with screening (RR 0.47, 95% C.I.0.28 – 0.77, 4 trials), In the 2 trials that reported accessloss, no effect was seen in screening (RR 0.65, 0.28 –1.51). One trial reported both a reduction in catheterinsertions (relative rate 0.20, 95% C.I. 0.04 – 0.88) andhospitalisations with screening (relative rate 0.37, 95%C.I. 0.16 – 0.87).
Other screening techniques: randomised controlled trials
Numerous other techniques have been advocated for use inscreening for vascular access stenosis. These include physi-cal examination, the measurement of access recirculation(AR), DVP and/or SVP. Of these techniques, only SVP hasbeen the subject of randomised trials. Physical examinationof the access remains very important with physical findingssuggesting a significant venous stenosis include oedema ofthe access extremity, prolonged bleeding post-venipunctureand changes in the physical characteristics of the pulse orthrill.AR resulting in reduced dialysis efficiency occurs when
the dialysed blood, returning via the venous needle of theextracorporeal circuit is taken up again through the arterialneedle, by-passing the systemic circulation. It occurs onceQa within the AVG or AVF is less than the dialyser bloodflow (Qb).65 The presence of AR signifies reduced Qa result-ing from the presence of a haemodynamically significantstenosis. The clinical usefulness of AR measurements inAVG surveillance is limited as the risk of thrombosis inAVG is high once Qa is reduced to 500–800 mL/min, arange of blood flow which is too high to cause AR. UnlikeAVG, AVF blood flow can decrease to lower than prescribeddialyser blood flow while still maintaining patency. Thus,the measurement of AR can be a useful tool to detect AVFstenosis although there have been no RCTs performed todate. The measurement of AR using saline dilution failed todetect a significant number of patients with documentedlow AVF blood flow (low specificity) and thus does not addany extra benefit to Qa monitoring.51,66,67
Venous pressure is measured either at the venous dripchamber during dialysis (DVP) or with the blood pumpstopped (SVP). The standardised methods for measuringboth DVP and SVP are outlined in detail in the NFK-KDOQI guidelines.19 Schwab et al.68 first described anassociation between raised DVP and the presence of AVGstenosis at the venous anastomosis and subsequently devel-oped a screening/monitoring protocol.69 Serial measure-ments need to be performed with the trend being moreimportant than single values and note that any lesionswithin the body of an AVG will not be detected if it isproximal to the venous needle.66 Screening using DVP hasnot been assessed in an RCT and is often used as the control
screening technique. The measurement of intra-access pres-sure has also been described but not tested by an RCT.66,70
Dember et al.71 performed an RCT of SVP monitoringversus clinical evidence of access dysfunction in AVG.Screening using SVP with angioplasty did not prolong AVGsurvival with a trend to a poorer outcome in the SVP group(HR 1.75, 95% CI 0.80, 3.83, P = 0.16). After adjustmentfor gender, diabetes, PVD, and access location, the SVPgroup has a significantly greater risk of access abandonment(HR 2.91, 95% CI 1.17, 7.20, P = 0.02) despite a signifi-cantly higher intervention rate. With the presence of col-laterals preventing the rise in venous pressure with areduction on Qa due to a stenosis, using DVP to detectsignificant stenoses in AVF is not recommended.
SUMMARY OF THE EVIDENCE
Blood flow surveillance: AVG
For AVG, three of the four RCTs did not demonstratea benefit of Qa surveillance despite significantly higherintervention rates in the surveillance groups.52,53,55 The onlypositive trial was small and suffers from significant method-ological issues. In all three negative trials, there were moreinterventions performed in the Qa surveillance groups com-pared to the control groups suggesting that more stenosiswere detected. This was particularly evident in the two mostrecent studies.52,53 In addition, the studies of Ram et al.53 andMoist et al.52 both performed pre-emptive angioplasty exclu-sively, while in the study by Smits et al.55 over 90% of theinterventions were using angioplasty. The negative resultsraise questions regarding the efficacy of the angioplasty pro-cedure in the Qa group. An increase in Qa immediatelypost-angioplasty and not necessarily radiological success,predicts outcome post-angioplasty.72,73 Only Moist et al.52
reported Qa results post-PCTA procedure and there wasno difference between the two groups in terms of a post-angioplasty rise in Qa (although this was not measuredimmediately post-procedure). Finally the only systematicreview also failed to show a benefit of screening on AVGthrombosis or survival.64 There is evidence that surgicalrevisions may be superior to angioplasty in the treatment ofAVG thrombosis but whether this applies to the treatmentof AVG stenosis is unknown.74 Thus, currently blood flowscreening with percutanous angioplasty of any underlyingstenosis cannot be recommended on the basis of the currentRCTs.
Blood flow surveillance: AVF
For AVF, two trials demonstrate a significant reduction inthrombosis rate or AVF survival with Qa surveillance.54,56 Athird trial,57 while not assessing a surveillance technique perse, provides evidence for the benefit of angioplasty in pro-longing AVF survival. Hence, these studies provide prelimi-nary evidence for a survival benefit for AVF screening. Thisdata is supported by the results of the systematic reviewsuggesting a benefit of screening in AVF on thrombosis.64
Vascular Access S5

However, a larger multi-centre study would need to be per-formed in order to conclusively confirm the previous resultsand in particular assess AVF survival (loss). For example,assuming an annual AVF thrombosis/revision rate of 12% to15% per year75 at least 300 subjects in each arm would beneeded to detect a reduction of 30% (RR 0.70, 90% power)in AVF thrombosis/revision rates as a result of Qa screen-ing.48 In addition, whether AVF screening is cost effectivealso needs to be determined using data from a suitablypowered RCT.76
Doppler ultrasound screening: AVG
Two of the six trials59,62 using DUS in AVG demonstrated asignificant increase in patency rates while a third60 demon-strated a significant reduction at 6 months but not at 12months follow up. In addition, a sub-analysis of the studyby Lumdsen et al. assessing only the new AVG (n=21)63
demonstrated a significant prolongation of AVG patency(P = 0.035) and a reduction in thrombosis rate in the treat-ment group (0.10 versus 0.44 thrombosis per patient-dialysisyear). The three other trials did not demonstrate a survivalbenefit for DUS screening. A further analysis of the study byRam et al.53 suggests that while not prolonging AVG sur-vival, screening reduced morbidity and costs through thereduction in thrombosis (non significant in the study) andless interruption to the haemodialysis treatment.77 Like thediscussion of the trials using Qa surveillance above, thelargely negative results of the trials raises questions aboutthe efficacy of angioplasty to correct the underlying stenosisalthough the only study to use surgery also did not demon-strate a conclusive survival benefit.60 These conclusions arealso supported by the results of the systematic review of theRCTs.64
Doppler ultrasound screening: AVF
There have been no RCTs of DUS screening in AVF.
Other screening techniques
While DVP monitoring is widely practised, there have beenno randomised trials assessing the benefits of DVP screeningon AVG outcome. Static venous pressure did not result inan AVG survival benefit in the one trial performed to date.71
Dynamic venous pressure should not be used in AVF.
WHAT DO THE OTHER GUIDELINES SAY?
Kidney Disease Outcomes Quality Initiative:19
GUIDELINE 4. DETECTION OFACCESSDYSFUNCTION:MONITORING, SURVEILLANCE, AND DIAGNOS-TIC TESTING4.1 Physical examination (monitoring): Physical examina-tion should be used to detect dysfunction in fistulae andgrafts at least monthly by a qualified individual. (B)
4.2 Surveillance of grafts: Techniques, not mutually exclu-sive, that may be used in surveillance for stenosis in graftsinclude:4.2.1 Preferred:4.2.1.1 Intra-access flow by using 1 of several methodsthat are outlined in Table 7 usingsequential measurements with trend analysis. (A)4.2.1.2 Directly measured or derived static venous dialy-sis pressure by 1 of several methods. (A) (Protocol pro-vided in Table 8 for using transducers on HD machinesto measure directly; criteria in Table 9 for derivedmethods.)4.2.1.3 Duplex ultrasound. (A)4.2.2 Acceptable:4.2.2.1 Physical findings of persistent swelling of thearm, presence of collateral veins, of collateral veins, pro-longed bleeding after needle withdrawal, or alteredcharacteristics of pulse or thrill in the pulse or thrill in agraft. (B)4.2.3 Unacceptable:4.2.3.1 Unstandardized dynamic venous pressures(DVPs) should not be used. (A)
4.3 Surveillance in fistulae: Techniques, not mutuallyexclusive, that may be used in surveillance for stenosis inAVFs include:4.3.1 Preferred:4.3.1.1 Direct flow measurements. (A)4.3.1.2 Physical findings of persistent swelling of thearm, presence of collateral veins, prolonged bleedingafter needle withdrawal, or altered characteristics ofpulse or thrill in the outflow vein. (B)4.3.1.3 Duplex ultrasound. (A)4.3.2 Acceptable:4.3.2.1 Recirculation using a non–urea-based dilutionalmethod. (B)4.3.2.2 Static pressures (B), direct or derived. (B)
4.4 When to refer for evaluation (diagnosis) and treatment:4.4.1 One should not respond to a single isolated abnor-mal value. With all techniques, prospective trend analy-sis of the test parameter has greater power to detectdysfunction than isolated values alone. (A)4.4.2 Persistent abnormalities in any of the monitoringor surveillance parameters should prompt referral foraccess imaging. (A)4.4.3 An access flow rate less than 600 mL/min in graftsand less than 400 to 500 mL/min in fistulae. (A)4.4.4 A venous segment static pressure (mean pressures)ratio greater than 0.5 in grafts or fistulae. (A)4.4.5 An arterial segment static pressure ratio greaterthan 0.75 in grafts. (A)
UK Renal Association:78
Guideline 7.7 Investigation of the AVF or graft to assess forevidence of arterial or venous stenoses or access recircula-tion is required if there is a significant fall in the blood flowrate that can be achieved, a reduction in delivered dialysisdose or a persistent rise in venous pressure in sequentialdialysis sessions.
The CARI GuidelinesS6
Canadian Society of Nephrology:79
1. Measure access flow bimonthly in AV fistulae and venouspressure (grade D) or access flow monthly in AV grafts(grade D).2. Perform angiography if fistula flow decreases to <500 ml/min or drops >20% from baseline (grade D); if AV graft flowdecreases to <650 ml/min or drops >20% from baseline(grade D).European Best Practice Guidelines:80
Guideline 5.1. Prior to any cannulation, autogenous arte-riovenous fistulae and grafts should be assessed by physicalexamination (Evidence level IV).Guideline 5.2. Objective monitoring of access functionshould be performed at a regular base by measuring accessflow (Evidence level II).International Guidelines: No recommendation.
IMPLEMENTATION AND AUDIT
Screening either by directly measured blood flow or byDoppler ultrasound will depend on the availability anddirect costs of the screening techniques.
SUGGESTIONS FOR FUTURE RESEARCH
1. Conduct an adequately powered RCT of blood flowscreening with repair in AVF.2. Conduct an adequately powered RCT of blood flowscreening with surgical repair in AVG.
CONFLICT OF INTEREST
Kevan Polkinghorne has no relevant financial affiliationsthat would cause a conflict of interest according to theconflict of interest statement set down by CARI.
REFERENCES
1. Feldman HI, Held PJ, Hutchinson JT, Stoiber E, Hartigan MF,
Berlin JA. Hemodialysis vascular access morbidity in the United
States. Kidney Int 1993; 43:1091–6.
2. Feldman HI, Kobrin S, Wasserstein A. Hemodialysis vascular
access morbidity. Journal of the American Society of Nephrology
1996; 7:523–35.
3. Manns B, Tonelli M, Yilmaz S, et al. Establishment and mainte-
nance of vascular access in incident hemodialysis patients: a pro-
spective cost analysis. J Am Soc Nephrol 2005; 16:201–9.
4. USRDS. The economic cost of ESRD, vascular access procedures,
and Medicare spending for alternative modalities of treatment.
USRDS. United States Renal Data System. Am J Kidney Dis 1997;
30:S160–77.
5. Lee H, Manns B, Taub K, et al. Cost analysis of ongoing care of
patients with end-stage renal disease: the impact of dialysis modal-
ity and dialysis access. Am J Kidney Dis 2002; 40:611–22.
6. Pastan S, Soucie JM, McClellan WM. Vascular access and
increased risk of death among hemodialysis patients. Kidney Int
2002; 62:620–6.
7. Polkinghorne KR, McDonald SP, Atkins RC, Kerr PG. Vascular
access and all-cause mortality: a propensity score analysis. J Am Soc
Nephrol 2004; 15:477–86.
8. Xue JL, Dahl D, Ebben JP, Collins AJ. The association of initial
hemodialysis access type with mortality outcomes in elderly medi-
care ESRD patients. Am J Kidney Dis 2003; 42:1013–9.
9. Begin V, Ethier J, Dumont M, Leblanc M. Prospective evaluation
of the intra-access flow of recently created native arteriovenous
fistulae. Am J Kidney Dis 2002; 40:1277–82.
10. Dixon BS, Novak L, Fangman J. Hemodialysis vascular access
survival: Upper-arm native arteriovenous fistula. Am J Kidney Dis
2002; 39:92–101.
11. Polkinghorne KR, Atkins RC, Kerr PG. Determinants of native
arteriovenous fistula blood flow.Nephrology (Carlton) 2004; 9:205–
11.
12. Besarab A, Frinak S. Strategies for the prospective detection of
access dysfunction. In: Conlon P, Schwab S, Nicholson M, eds.
Hemodialysis Vascular Access: Practice and Problems. Oxford: Oxford
University Press, 2000:157–82.
13. Besarab A, Frinak S, Mohammad AA. Pressure measurements in
the surveillance of vascular accesses. In: Gray RJ, Sands JJ, eds.
Dialysis Access: A Multidisciplinary Approach. Philadelphia: Lippin-
cott Williams and Wilkins, 2002:137–50.
14. Yeun JY, Depner TA. Role of access flow measurement. In:
Gray RJ, Sands JJ, eds.Dialysis Access: A Multidisciplinary Approach.
Philadelphia: Lippincott Williams and Wilkins, 2002:119–32.
15. Besarab A, Hall B, El-Ajel F, Deane C, Zasuwa G. The relation of
brachial artery flow to access flow. J Am Soc Nephrol 1995; 6:483A
(abstract).
16. Besarab A, Frinak S. The prevention of access failure: pressure
monitoring. ASAIO J 1998; 44:35–7.
17. Besarab A, Lubkowski T, Vu A, Aslam A, Frinak S. Effects of
systemic hemodynamics on flow within vascular accesses used for
hemodialysis. ASAIO J 2001; 47:501–6.
18. Sullivan KL, Besarab A, Bonn J, Shapiro MJ, Gardiner GA, Jr.,
Moritz MJ. Hemodynamics of failing dialysis grafts. Radiology 1993;
186:867–72.
19. NKF. KDOQI Clinical Practice Guidelines and Clinical Practice
Recommendations for 2006 Updates: Hemodialysis Adequacy,
Peritoneal Dialysis Adequacy and Vascular Access. Am J Kidney
Dis 2006; 48:S1–S322.
20. Krivitski NM. Novel method to measure access flow during hemo-
dialysis by ultrasound velocity dilution technique. ASAIO J 1995;
41:M741–5.
21. Krivitski NM. Theory and validation of access flow measurement
by dilution technique during hemodialysis. Kidney Int 1995;
48:244–50.
22. Lindsay RM, Blake PG, Malek P, Posen G, Martin B, Bradfield E.
Hemodialysis access blood flow rates can be measured by a differ-
ential conductivity technique and are predictive of access clotting.
Am J Kidney Dis 1997; 30:475–82.
23. Lindsay RM, Bradfield E, Rothera C, Kianfar C, Malek P,
Blake PG. A comparison of methods for the measurement of
hemodialysis access recirculation and access blood flow rate.
ASAIO Journal 1998; 44:62–7.
24. Yarar D, Cheung AK, Sakiewicz P, et al.Ultrafiltration method for
measuring vascular access flow rates during hemodialysis. Kidney
Int 1999; 56:1129–35.
25. Schneditz D, Fan Z, Kaufman A, Levin NW. Measurement of
access flow during hemodialysis using the constant infusion
approach. ASAIO Journal 1998; 44:74–81.
26. Weitzel WF, Rubin JM, Swartz RD, Woltmann DJ, Messana JM.
Variable flow Doppler for hemodialysis access evaluation: theory
and clinical feasibility. Asaio J 2000; 46:65–9.
27. Steuer RR, Miller DR, Zhang S, Bell DA, Leypoldt JK. Noninva-
sive transcutaneous determination of access blood flow rate. Kidney
Int 2001; 60:284–91.
Vascular Access S7

28. Magnasco A, Alloatti S, Martinoli C, Solari P. Glucose pump test:
a new method for blood flow measurements. Nephrol Dial Trans-
plant 2002; 17:2244–8.
29. Depner TA, Krivitski NM. Clinical measurement of blood flow in
hemodialysis access fistulae and grafts by ultrasound dilution.
ASAIO J 1995; 41:M745–9.
30. Krivitski NM, MacGibbon D, Gleed RD, Dobson A. Accuracy of
dilution techniques for access flow measurement during hemodi-
alysis. American Journal of Kidney Diseases 1998; 31:502–8.
31. National Kidney Foundation – K/DOQI Clinical Practice Guide-
lines for Vascular Access: update 2000. Am J Kidney Dis 2001; 37
(Suppl 1):S137-S81.
32. Krivitski N, Schneditz D. Arteriovenous vascular access flow
measurement: accuracy and clinical implications. In: Ronco C,
Levin NW, eds. Contrib Nephrol. Vol. 142. Basel: Karger,
2004:269–84.
33. Bos C, Smits JH, Zijistra JJ, Blankestijn PJ, Bakker CJ,
Viergever MA. Underestimation of access flow by ultrasound dilu-
tion flow measurements. Phys Med Biol 2002; 47:481–9.
34. Sands J, Glidden D, Jacavage W, Jones B. Difference between
delivered and prescribed blood flow in hemodialysis. ASAIO J
1996; 42:M717–9.
35. Polkinghorne KR, Atkins RC, Kerr PG. Native arteriovenous
fistula blood flow and resistance during hemodialysis. Am J Kidney
Dis 2003; 41:132–9.
36. Sands J, Glidden D, Miranda C. Access flow measured during
hemodialysis. ASAIO J 1996; 42:M530–2.
37. Schneditz D, Fan Z, Kaufman A, Levin NW. Stability of
access resistance during haemodialysis [erratum in Nephrol Dial
Transplant 17: 1539, 2002]. Nephrol Dial Transplant 1998; 13:739–
44.
38. Gill RW. Measurement of blood flow by ultrasound: accuracy and
sources of error. Ultrasound Med Biol 1985; 11:611–25.
39. Oates CP, Williams ED, McHugh MI. The use of Diasonics
DRF400 duplex ultrasound scanner to measure volume flow in
arteriovenous fistulae in patients undergoing hemodialysis: an
analysis of measurement uncertainties. Ultrasound Med Biol 1990;
16:571–9.
40. Winkler AJ, Wu J, Case T, Ricci MA. An exprimental study of the
accuracy of volume flow measurements using commerical ultra-
sound systems. J Vasc Technol 1995; 19:175–80.
41. May RE, Himmelfarb J, Yenicesu M, et al. Predictive measures of
vascular access thrombosis: a prospective study. Kidney Int 1997;
52:1656–62.
42. Sands J, Glidden D, Miranda C. Hemodialysis access flow
measurement. Comparison of ultrasound dilution and duplex
ultrasonography. ASAIO J 1996; 42:M899–901.
43. Zanen AL, Toonder IM, Korten E, Wittens CH, Diderich PN.
Flow measurements in dialysis shunts: lack of agreement between
conventional Doppler, CVI-Q, and ultrasound dilution. Nephrol
Dial Transplant 2001; 16:395–9.
44. Oudenhoven LF, Pattynama PM, De Roos A, Seeverens HJ,
Rebergen SA, Chang PC. Magnetic resonance, a new method for
measuring blood flow in hemodialysis fistulae. Kidney Int 1994;
45:884–9.
45. Bosman PJ, Boereboom FT, Bakker CJ, et al. Access flow measure-
ments in hemodialysis patients: in vivo validation of an ultrasound
dilution technique. J Am Soc Nephrol 1996; 7:966–9.
46. Bosman PJ, Boereboom FT, Eikelboom BC, Koomans HA,
Blankestijn PJ. Graft flow as a predictor of thrombosis in hemodi-
alysis grafts. Kidney Int 1998; 54:1726–30.
47. Neyra NR, Ikizler TA, May RE, et al. Change in access blood flow
over time predicts vascular access thrombosis. Kidney Int 1998;
54:1714–9.
48. Polkinghorne KR, Lau KK, Saunder A, Atkins RC, Kerr PG. Does
monthly native arteriovenous fistula blood-flow surveillance
detect significant stenosis – a randomized controlled trial. Nephrol
Dial Transplant 2006.
49. Strauch BS, O’Connell RS, Geoly KL, Grundlehner M, Yakub YN,
Tietjen DP. Forecasting thrombosis of vascular access with
Doppler color flow imaging. Am J Kidney Dis 1992; 19: 554–7.
50. Tonelli M, Jhangri GS, Hirsch DJ, et al. Best threshold for diag-
nosis of stenosis or thrombosis within six months of access flow
measurement in arteriovenous fistulae. J Am Soc Nephrol 2003;
14:3264–9.
51. Tonelli M, Jindal K, Hirsch D, Taylor S, Kane C, Henbrey S.
Screening for subclinical stenosis in native vessel arteriovenous
fistulae. J Am Soc Nephrol 2001; 12:1729–33.
52. Moist LM, Churchill DN, House AA, et al. Regular monitoring of
access flow compared with monitoring of venous pressure fails to
improve graft survival. J Am Soc Nephrol 2003; 14:2645–53.
53. Ram SJ, Work J, Caldito GC, Eason JM, Pervez A, PaulsonWD. A
randomized controlled trial of blood flow and stenosis surveillance
of hemodialysis grafts. Kidney Int 2003; 64:272–80.
54. Sands JJ, Jabyac PA, Miranda CL, Kapsick BJ. Intervention based
on monthly monitoring decreases hemodialysis access thrombosis.
ASAIO J 1999; 45:147–50.
55. Smits JH, van der Linden J, Hagen EC, et al. Graft surveillance:
venous pressure, access flow, or the combination? Kidney Int 2001;
59:1551–8.
56. Tessitore N, Lipari G, Poli A, et al. Can blood flow surveillance
and pre-emptive repair of subclinical stenosis prolong the useful
life of arteriovenous fistulae? A randomized controlled study.
Nephrol Dial Transplant 2004; 19:2325–33.
57. Tessitore N, Mansueto G, Bedogna V, et al. A prospective con-
trolled trial on effect of percutaneous transluminal angioplasty on
functioning arteriovenous fistulae survival. J Am Soc Nephrol 2003;
14:1623–7.
58. Lumsden AB, MacDonald MJ, Kikeri D, Cotsonis GA, Harker LA,
Martin LG. Prophylactic balloon angioplasty fails to prolong the
patency of expanded polytetrafluoroethylene arteriovenous grafts:
results of a prospective randomized study. J Vasc Surg 1997;
26:382–90; discussion 390–12.
59. Malik J, Slavikova M, Svobodova J, Tuka V. Regular ultrasono-
graphic screening significantly prolongs patency of PTFE grafts.
Kidney Int 2005; 67:1554–8.
60. Mayer DA, Zingale RG, Tsapogas MJ. Duplex scanning of
expanded polytetrafluroethylene dialysis shunts: impact on patient
management and graft survival. Vasc Surg 1993; 27:647–658.
61. Robbin ML, Oser RF, Lee JY, Heudebert GR, Mennemeyer ST,
Allon M. Randomized comparison of ultrasound surveillance and
clinical monitoring on arteriovenous graft outcomes. Kidney Int
2006; 69:730–5.
62. Sands J, Gandy D, Finn M, Johnson A, Burrows S, Miranda C.
Ultrasound-angioplasty program decreases thrombosis rate and
cost of PTFE graft maintenance. J Am Soc Nephrol 1997; 8:171A
(abstr).
63. Martin LG, MacDonald MJ, Kikeri D, Cotsonis GA, Harker LA,
Lumsden AB. Prophylactic angioplasty reduces thrombosis in
virgin ePTFE arteriovenous dialysis grafts with greater than 50%
stenosis: subset analysis of a prospectively randomized study. J Vasc
Interv Radiol 1999; 10:389–96.
64. Tonelli M, James M, Wiebe N, Jindal K, Hemmelgarn B.
Ultrasound monitoring to detect access stenosis in hemodia-
lysis patients: a systematic review. Am J Kidney Dis 2008; 51:
630–40.
65. Besarab A, Sherman R. The relationship of recirculation to access
blood flow. Am J Kidney Dis 1997; 29:223–9.
The CARI GuidelinesS8
66. Besarab A, Lubkowski T, Frinak S, Ramanathan S, Escobar F.
Detection of access strictures and outlet stenoses in vascular
accesses. Which test is best? ASAIO J 1997; 43:M543–7.
67. Besarab A, Lubkowski T, Frinak S, Ramanathan S, Escobar F.
Detecting vascular access dysfunction. ASAIO J 1997; 43:M539–
43.
68. Schwab SJ, Saeed M, Sussman SK, McCann RL, Stickel DL.
Transluminal angioplasty of venous stenoses in polytetrafluoroet-
hylene vascular access grafts. Kidney Int 1987; 32:395–8.
69. Schwab SJ, Raymond JR, Saeed M, Newman GE, Dennis PA,
Bollinger RR. Prevention of hemodialysis fistula thrombosis. Early
detection of venous stenoses. Kidney Int 1989; 36:707–11.
70. Besarab A, Sullivan KL, Ross RP, Moritz MJ. Utility of intra-
access pressure monitoring in detecting and correcting venous
outlet stenoses prior to thrombosis. Kidney Int 1995; 47:1364–
73.
71. Dember LM, Holmberg EF, Kaufman JS. Randomized controlled
trial of prophylactic repair of hemodialysis arteriovenous graft
stenosis. Kidney Int 2004; 66:390–8.
72. Ahya SN, Windus DW, Vesely TM. Flow in hemodialysis grafts
after angioplasty: Do radiologic criteria predict success? Kidney Int
2001; 59:1974–8.
73. van der Linden J, Smits JH, Assink JH, et al. Short- and long-
term functional effects of percutaneous transluminal angioplasty
in hemodialysis vascular access. J Am Soc Nephrol 2002; 13:715–
20.
74. Green LD, Lee DS, Kucey DS. A metaanalysis comparing surgical
thrombectomy, mechanical thrombectomy, and pharmacome-
chanical thrombolysis for thrombosed dialysis grafts. J Vasc Surg
2002; 36:939–45.
75. Polkinghorne KR, Kerr PG. Vascular Access. In: Russ GR, ed.
ANZDATA Registry Report 2002. Adelaide: Australia and New
Zealand Dialysis and Transplant Registry, 2003:102–7.
76. Tonelli M, Klaarenbach S, Jindal K, Manns B. Economic implica-
tions of screening strategies in arteriovenous fistulae. Kidney Int
2006; 69:2219–26.
77. Dossabhoy NR, Ram SJ, Nassar R, Work J, Eason JM,
PaulsonWD. Stenosis surveillance of hemodialysis grafts by duplex
ultrasound reduces hospitalizations and cost of care. Semin Dial
2005; 18:550–7.
78. Mactier R, Davies S. Clinical Practice Guidelines for Haemodi-
alysis UK Renal Association (4th Edition). Accessed at: http://
www.renal.org/guidelines/print/HD210606.pdf 2006.
79. Jindal K, Chan CT, Deziel C, et al. Hemodialysis clinical practice
guidelines for the Canadian Society of Nephrology. J Am Soc
Nephrol 2006; 17:S1–27.
80. Tordoir J, Canaud B, Haage P, et al. EBPG on Vascular Access.
Nephrol Dial Transplant 2007; 22 Suppl 2:ii88–117.
Vascular Access S9

AP
PE
ND
ICE
S
Tab
le1Randomisedcontrolledtrialsassessingtheeffectofaccessbloodflowsurveillanceontheaccessthrombosisrates*
StudyID
Access
type
Number
Controlgroup
Surveillance
group
Qathresholdf
Blinding
Intention-to-treat
analysis
Intervention
Thrombosis
ratea
Follow-up
Sands
etal
.541999
AVF
68
Nilb
SVP+Qab
<750
NS
NS
PCTA
0.27vs0.17†
6months
AVG
35
Nilb
SVP+Qab
<750
NS
NS
PCTA
2.5vs0.2†
6months
Smits
etal
.552001
AVG
53
DVP
Qa
<600
NS
No
PCTAd
0.19vs0.24
37.8pt-years
72
DVP
DVP+Qa
<600
NS
No
PCTAd
0.32vs0.28
42.7pt-years
Ram
etal
.532003c
AVG
101
Clinical+DVP
Qa
<600
Yes
Yes
PCTA
0.68vs0.91†
2years
Moist
etal
.522003
AVG
112
Clinical+DVP
Clinical+Qa
<650or20%
↓Yes
Yes
PCTA
0.41vs0.51
1year
Tessitore
etal
.562004
AVF
79
Clinical
Qa
<750or25%
↓No
Yes
PCTAd
HR3.93‡e
5years
*Measuredbyultrasounddilution;AVG
=arteriovenousgraft;AVF=arteriovenousfistula;Qa=accessbloodflow(allmeasuredusingultrasounddilution);SVP=Staticvenouspressure;
DVP=Dynamicvenouspressure;PCTA
=Percutaneoustransluminalangioplasty;NS=NotStated;aControlversustreatmentrateperpatient-years;bDUalsoperformedevery6monthsinallpatients;
c resultsherefortheQaarmversuscontrol;d10%hadfurthersurgicalintervention;e OverallfailureincludingthrombosisandabandonmentHRcontrolvstreatment(95%CI1.42,10.93);f mL/min,
allmeasuredmonthlyexceptSmits
etal
.8weeklyandTessitore
etal
.3monthly;†P
<0.05;‡P
<0.01
Tab
le2RandomisedcontrolledtrialsassessingtheeffectofultrasoundstenosisscreeningonAVGpatencyorthrombosis
StudyID
Number
Controlgroup
Surveillancegroup
BlindingIntention-to-treat
analysis
Intervention
Patencya
Follow-up
Mayer
etal
.601993
70
Clinical
3monthlyUSS
No
Yes
Surgery
80%versus62%
2years
Lumsden
etal
.58
1997
64
Nointervention
3monthlyUSS
No
Yes
PCTA
51%vs47%
2years
Sands
etal
.621997
55
Examination
USS
NS
NS
PCTA
126vs19b*
NS
Ram
etal
.532003c
101
Clinical+DVP
3monthlyUSS
Yes
Yes
PCTA
34%vs36%d
2years
Malik
etal
.592005
192
Clinical/DVP/Qa3monthlyUSS+Clinical/DVP/Qa
No
NS
PCTA
RRcontrol3.75e **
2years
Robbin
etal
.612006
126
Clinical
4monthlyUSS
No
Yes
PCTA/Surgery38monthsvs37monthsf
2years
PCTA
=percutaneoustransluminalangioplasty;DVP=dynamicvenouspressure;USS=Dopplerultrasound;NS=Notstated;a Treatmentversuscontrol,12monthpatencyunlessotherwisestated;
bper100patientyears;c resultsherefortheUSSarmversuscontrol;dpatencydefinedasthrombosisorneedforpre-emptivePCTA;ePatencydatanotpresentedinreport,unadjustedrelativeriskofaccess
failureincontrolwas3.75(95%CI1.7,8.1);
f cumulativesurvival;*P
<0.05;**P
<0.001
The CARI GuidelinesS10
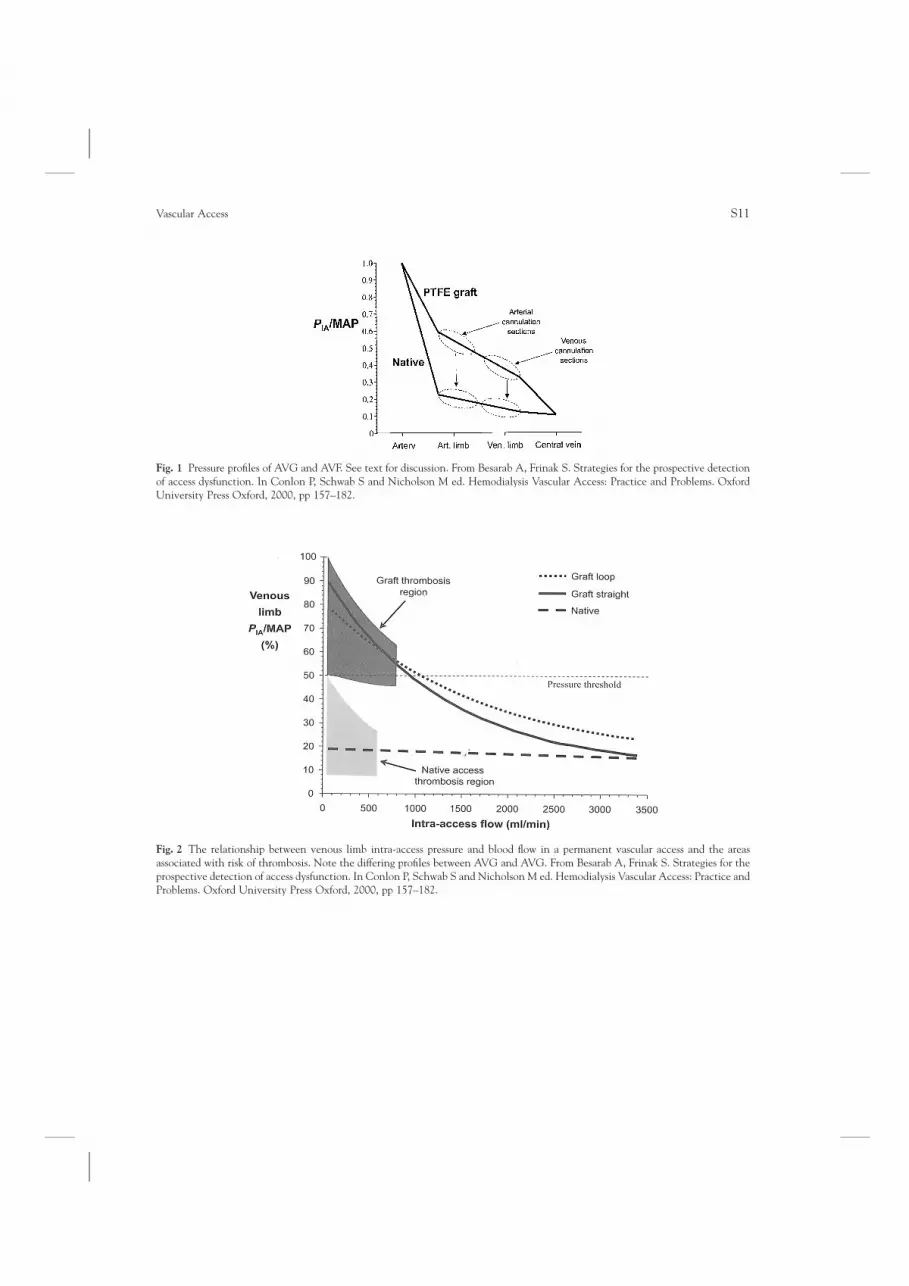
Fig. 1 Pressure profiles of AVG and AVF. See text for discussion. From Besarab A, Frinak S. Strategies for the prospective detection
of access dysfunction. In Conlon P, Schwab S and Nicholson M ed. Hemodialysis Vascular Access: Practice and Problems. Oxford
University Press Oxford, 2000, pp 157–182.
Fig. 2 The relationship between venous limb intra-access pressure and blood flow in a permanent vascular access and the areas
associated with risk of thrombosis. Note the differing profiles between AVG and AVG. From Besarab A, Frinak S. Strategies for the
prospective detection of access dysfunction. In Conlon P, Schwab S and Nicholson M ed. Hemodialysis Vascular Access: Practice and
Problems. Oxford University Press Oxford, 2000, pp 157–182.
Vascular Access S11


