Embed Size (px)
Citation preview

Variation in the Incarceration Length-Recidivism Dose-Response Relationship
Jason Rydberg, Ph.D.
Assistant Professor
School of Criminology and Justice Studies
University of Massachusetts Lowell
Health and Social Sciences Building 495
113 Wilder Street
Lowell, MA 01854
P: 978-934-4173
(Corresponding Author)
Kyleigh Clark, M.A.
Doctoral Student
School of Criminology and Justice Studies
University of Massachusetts Lowell
Health and Social Sciences Building 460
113 Wilder Street
Lowell, MA 01854
Acknowledgements: The research presented in this manuscript was originally developed at the
ICPSR Summer Program Workshop on the Quantitative Analysis of Crime and Criminal Justice,
sponsored by the Bureau of Justice Statistics. We would like to thank Drs. Shelley Listwan and
Francis Cullen for their helpful comments.
Version accepted for publication, forthcoming in Journal of Criminal Justice.
Rydberg, J., & Clark, K. (Forthcoming). Variation in the Incarceration Length-Recidivism Dose-
Response Relationship. Journal of Criminal Justice.

1
Variation in the Incarceration Length-Recidivism Dose-Response Relationship
ABSTRACT
Purpose: This research seeks to examine whether the dose-response relationship between
incarceration length and recidivism varies across different conviction offense categories and
measures of parole failure.
Methods: We approximate a large fixed panel of parolees from the National Corrections
Reporting Program (NCRP) to implement a dose-response analysis of the relationship between
incarceration length and the prevalence and timing of recidivism. Marginal mean weighting
through stratification (MMW-S) is utilized to limit confounding effects from selection bias.
Results: We observe that incremental doses of incarceration length increase the likelihood and
hastens the timing of parole revocations, and reduces the likelihood and slows the timing of new
sentences. Considerable heterogeneity was observed in these effects across conviction offenses,
as the direction of effects changed beyond certain thresholds, and were not constant across
offender groups.
Conclusions: These results do not provide consistent support for a suppressive, criminogenic, or
null effect for incarceration length on recidivism.
Keywords: Incarceration Effects; Parole; Reentry; Recidivism; Propensity Scores

2
Variation in the Incarceration Length-Recidivism Dose-Response Relationship
Patterns in incarceration and recidivism over the past several decades have drawn
increased attention from criminologists to the effects of the incarceration experience on
offenders. Relative to previous decades, prisoners at the turn of the century were experiencing
significantly longer periods of incarceration before release (Petersilia, 2003). This trend has
continued into the current decade, particularly for certain offender groups, as the median length
of stay for homicide offenders increased by 150% between 2002 and 2012, and sex offenders
experiencing a 26% increase (Carson, 2014). Despite the relatively longer periods of
incarceration, unprecedented incarceration rates are producing high rates of release and turnover
among correctional populations. The vast majority of those incarcerated will eventually be
released, as approximately 2% of prison admissions are sentenced to life or death (Carson &
Golinelli, 2014). Additionally, more than half of those currently incarcerated will be released
within a year, and nearly three-quarters of current inmates will be released within two years
(West & Sabol, 2011). These high rates of release and turnover have been accompanied by high
rates of failure, with successful discharges decreasing from 70% in 1984 to just over 50% in
2012, although successes had dropped as low as 49% in 2008 (Maruschak & Bonczar, 2015).
Given these troubling trends in incarceration, release, and recidivism, criminologists have
begun to take a more critical view towards the relationship between incarceration and crime
reduction (Verma, 2016; Lofstrom & Raphael, 2016), and more specifically incarceration length
and subsequent reoffending (Nagin, Cullen, & Jonson, 2009). Recent research examining the
incremental contribution of incarceration length to criminal reoffending has produced mixed
results (Loughran et al., 2009; Meade, Steiner, Makarios, & Travis, 2012). Utilizing data from
the National Corrections Reporting Program (NCRP), the current inquiry attempts to contribute

3
to knowledge on the relationship between incarceration length and recidivism in two ways. First,
previous research has left reason to suspect that the effect of incarceration is not uniform across
inmates (e.g., Listwan, Colvin, Hanley, & Flannery, 2010). We consider whether the relationship
between incarceration length and parole failure varies across different instant offense types.
Second, previous research has focused solely on the effect of incarceration length on criminal
reoffending. The current inquiry takes an explicitly prisoner reentry oriented perspective
(Rydberg & Grommon, 2016), considering how variation in incarceration length is associated
with variation in indicators of parole failure (i.e., new sentences and technical revocations).
These issues are pursued using a dose-response framework, examining how incremental
increases in incarceration length affects the probability and timing of failure. Building on the
strengths of recent research, efforts are made to reduce selection bias through the application of
marginal mean weighting through stratification (Hong, 2012), subsequently improving internal
validity of the findings so that they may be of increased utility to scholars and policymakers.
LITERATURE REVIEW
The Effect of Incarceration Length on Recidivism
Incarceration length as suppressive. Classically, incarceration length has been
theorized to have a specific deterrent, or suppressive, effect on offending behavior (Nagin et al.,
2009). Specific deterrence holds that more severe sanctions (i.e., longer sentences) will more
effectively deter future criminal behavior by intensifying the perception of the severity of
punishment (Orsagh & Chen, 1988). This perspective would predict that those offenders who
experience longer prison terms would be less willing to recidivate in the future and face a
similarly long incarceration again. However, lacking explicit data on how prisoners perceive the
proportionality and severity of their incarceration (i.e., as with most studies utilizing secondary

4
or official record data to examine recidivism) implies that research has only been able to assess
whether incarceration length demonstrates an effect consistent with specific deterrence, rather
than testing deterrence itself. To this extent, we refer to this as a suppressive effect.
Existing empirical research to date has produced mixed support for a suppression effect
of incarceration length, generally recognizing either a drop off or null effect of length of stay on
recidivism (Nagin et al., 2009; Nagin, 2013). More recently, researchers have attempted to utilize
dose-response research designs capable of capturing non-linear relationships between
incarceration length and reoffending. Research conducted by Meade et al. (2012) on adult
recidivism found that incarceration length produced a modest but significant decrease in
recidivism only among those serving the relatively longest periods of incarceration (i.e., adults
serving more than 5 years).
Incarceration length as criminogenic. Conversely, incarceration length has been
posited to serve as a catalyst for reoffending behavior, rather than a suppressor of future crime
(Sykes, 1958). This criminogenic effect is thought to occur through the adaptation of inmates to
the prison environment over extended periods of time, as well as strain resulting from the
exposure of inmates to deleterious conditions (Massoglia, 2008). In terms of adaptation, prison
has been referred to as a “school of crime,” where conditions necessitate conforming to codes of
violence (Sykes, 1958; cf. Irwin & Cressey, 1962), while deprived of positive social outlets and
ties to conventional society (Gendreau, Goggin, & Cullen, 1999). As such, those incarcerated for
longer periods may view the prison climate more positively (Casey, Day, & Reynolds, 2016).
Further, using general strain theory as a framework (Agnew, 1992, 2001), researchers
have posited that lengthy terms of incarceration may increase the likelihood of subsequent
offending. Studies conducted by Blevins and colleagues (2010) and Zweig et al. (2014)
5
concluded that these attributes foster negative emotions that encourage inmates to act out and
adopt antisocial behavior and attitudes. These propositions are consistent with existing
knowledge on the primary correlates of recidivism, as prisons require near-constant exposure to
anti-social peers (Blevins et al., 2010; Nagin et al., 2009), potentially resulting in low risk
inmates becoming worse (Andrews & Bonta, 2006). Additionally, incarceration can lead to a
number of negative effects that encourage criminality, including stigmatization of released
prisoners (Nagin, 2013), a lower likelihood of employment (van der Geest, Bijleveld, Blokland,
Nagin, 2016), or poor health outcomes (Kim, 2016).
To date, there is little research to suggest that incarceration length has a systematic
criminogenic effect on recidivism (Cullen, Jonson, & Nagin, 2011; Meade et al., 2012). A small
number of quasi-experimental inquiries have observed a criminogenic effect for incarceration
length on recidivism, but these estimated effects have been weak and could not be distinguished
from chance variation (Berecohea & Jaman, 1981; Jaman, Dickover, & Bennet, 1972; Nagin et
al., 2009). Comparing across levels of recidivism risk, Gottfredson and colleagues (1977) noted a
curvilinear effect of incarceration length, in which increases in the length of stay increased
returns to prison, but only up until just over 4 years of confinement.
Incarceration length as having a minimal effect. A third perspective contends that
incarceration length may have little to no discernable effect on reoffending (Gendreau et al.,
1999). In this view, prison is seen as neither a suppressor nor a catalyst for criminal behavior; but
rather that reoffending is dependent on salient characteristics which the inmates bring with them
into prison (Gendreau, Goggin, & Law, 1997). That is, recidivism is considered a function of
pre-incarceration risk factors on which incarceration length has little effect. Contrary to a
criminogenic perspective, among these risk factors are coping deficits which inmates import into

6
prison, such as number of prior incarcerations (Toman, Cochran, Cochran, & Bales, 2015) or
psychological disorders (Boduszek, Dhingra, & Debowska, 2016), change little during
incarceration, and then influence recidivism following release (Zamble & Porporino, 1988). On
the other hand, even to the extent those incarcerated for long periods of time may reoffend at
lower rates, such a reduction in recidivism may be due to aging rather than a suppressive effect.
The curvilinear-decreasing relationship between age and crime (Hirschi & Gottfredson, 1983) is
consistent with an incapacitation effect, in that a lower proportion of those serving very long
periods of incarceration may be expected to offend simply because they have aged, as they were
incapacitated for their years at the highest risk of recidivism. As such, an inverse relationship
between incarceration length and recidivism may instead be due to confounding factors, such as
maturation (Doherty & Ensminger, 2014) or incapacitation (Levitt, 2004).
Given that the minimalist perspective posits the impact of incarceration length on
recidivism is likely confounded with other factors, conclusions about its empirical support is
problematic. The majority of the regression-based studies identified by Nagin and colleagues
(2009) observed null effects. By comparing arrest trajectories of individuals prior to and
following incarceration, Bhati and Piquero (2008) found that prison most likely has no effect on
subsequent offending. Additionally, Loughran and colleagues (2009) observed a null dose-
response curve for a sample of juvenile detainees, with increased duration making little
difference in reoffending.
Methodological challenges. In their review of the existing research on the incarceration
length-recidivism relationship, Nagin and colleagues (2009) note that previous literature has
typically suffered from methodological shortcomings. Specifically, few inquiries have made
adjustments to account for selection bias – meaning that the average inmate receiving a relatively

7
long period of incarceration differs significantly from the average inmate receiving a relatively
short period of incarceration. These pre-incarceration differences confound the estimated
association between incarceration length and recidivism (Shadish, Cook, & Campbell, 2002).
Such shortcomings are to be expected in existing studies, given that researchers have no control
over the incarceration terms that offenders are sentenced to and eventually serve.
To compensate, recent inquiries have made use of propensity score methods to adjust for
selection as a threat to internal validity. The propensity score reflects the estimated probability of
a unit receiving a treatment (or dosage level of a treatment) given a set of observed covariates
(Rosenbaum & Rubin, 1983). Once estimated, the researcher can then stratify the sample on the
propensity score, essentially comparing treatment and comparison units that are otherwise
similar. When properly estimated, stratifying on the propensity score produces covariate balance
between each of the different levels of treatment dosage, approximating random assignment, and
producing less biased estimates of treatment effects (Joffe & Rosenbaum, 1999). Loughran and
colleagues (2009) use this approach to estimate a dose-response relationship between
incarceration length and rearrests and self-reports of reoffending among a sample of juveniles,
and as noted, observe null effects. With a sample of adult Ohio prisoners, Meade and colleagues
(2012) observe a curvilinear decreasing relationship dose-response curve using felony rearrests
as the dependent variable. With each of these inquiries utilizing different offender groups,
outcomes, and incarceration doses, further research is necessary to gain a more generalizable
understanding of the incarceration length-recidivism relationship.1
Differential Effects across Offender Groups
1 Specifically, given the distribution of their incarceration length variable, Loughran and colleagues (2009) use
relatively short length categories as their treatment variable (i.e., lengths of 0-6, 6-10, 10-13, and > 13 months).
Meade and colleagues (2012) use longer intervals to better represent incarceration lengths of interest to policy
makers (i.e., ≤ 12, 13-24, 25-36, 37-60, and ≥ 61 months).

8
Beyond the more general question of clarifying the impact of incarceration length on
recidivism, Nagin, Cullen, & Jonson (2009: 134) speculate that the dose-response relationship
between incarceration length and reoffending “may vary across offender characteristics in ways
that are important for science and public policy,” including across conviction offense types. That
is, suppressive or criminogenic effects observed for offenders in general may not hold when
disaggregated across violent, sex, and property offenders. Yet, this variation has been subject to
little systematic empirical examination, with previous findings mixed or subject to selection bias
effects. For instance, previous research has observed that incarceration (compared to non-
custodial sanctions) has criminogenic effects on drug offenders and violent offenders, but null
effects on others (Spohn and Holleran, 2002; Weatherburn, 2010). Concerning incarceration
length specifically, older research has found opposite suppressive and criminogenic effects for
both robbery offenders and property offenders (Gottfredson, Neithercutt, Nuffield and O’Leary,
1973; Orsagh and Chen, 1988). More recently, Haerle (2016) observed an inverse dose-response
relationship for violent juvenile offenders, compared to Loughran et al. (2009) null effect for a
general sample of juveniles, further suggesting that more intense dosage may only produce
desirable effects with particular subsets of the correctional population.
Additionally, there is evidence that prisoners experiencing harsher conditions, including
violence and victimization in prison, recidivate at higher levels, and these conditions vary across
offender groups (Chen and Shapiro, 2007; Listwan et al., 2010; Listwan et al., 2013; Zweig et
al., 2014). For instance, sex offenders occupy a lower status in prison, as compared to property
or drug offenders, possibly increasing their risk of being harassed or victimized by other
prisoners and correctional officers (Dumond, 2000; McGrath, Cumming, Livingston, & Hoke,
2003). Stadler and colleagues (2012) found that white-collar criminals fare better than other

9
types of offenders, reporting lower levels of difficulty in prison, including having more friends
and less fear of inmates and staff. As such, if incarceration length has a strain-based
criminogenic effect, we may anticipate that sex offenders will be disproportionately subject to
this impact. This research will consider whether the dose-response relationship between
incarceration length and parole failure is invariant across different conviction offenses.
Differential Effects on Parole Failure versus New Criminal Behavior
With little exception, the existing research examining the effects of incarceration length
has focused exclusively on its impact on criminal reoffending. The studies most similar in
approach to the current inquiry have utilized total rearrests (Loughran et al., 2009) and felony
rearrests (Meade et al., 2012) as dependent variables. Studies capturing multiple types of
reoffending have condensed them into a binary measure – such as a favorable or unfavorable
supervision outcome (Beck & Hoffman, 1976; Gottfredson, 1977). While the consideration of
criminal recidivism is an important issue for public policy, parolees can also be returned to
prison by having their supervision revoked as a result of a technical violation (i.e., conditions of
supervision are violated) (Rydberg & Grommon, 2016). Failing to distinguish between returns to
prison due to new offenses and to supervision revocations would have the effect of
overestimating recidivism rates (Ostermann, 2015), as well as obscuring differences in criminal
reoffending and non-compliance.
This is an important distinction for the examination of incarceration length and
recidivism, particularly as it concerns the possible criminogenic effects of the incarceration
experience. Increased length of stay is theorized to potentially increase the likelihood of
reoffending through the adoption of codes for violence (Blevins et al., 2010; Sykes, 1958). On
the other hand, even if such learning mechanisms do not operate, lengthy periods of incarceration

10
can still worsen parole outcomes by deteriorating the ability of parolees to comply with the
conditions of their supervision and succeed in the community (Petersilia, 2003; Visher & Travis,
2003). While individuals are incarcerated, employable skills can degrade or become obsolete,
reducing the prospects of employment following release (Holzer, Raphael, & Stoll, 2006;
Western, Kling, & Weiman, 2001). Social capital resources can also degrade during
incarceration, weakening returning prisoners’ ties to potential sources of social support during
their transition into the community (Visher & Courtney, 2007; Wolff & Draine, 2004). As
parolees draw heavily on social support networks (Nelson, Deess, & Allen, 1999), the
deterioration of these networks may impede the ability of parolees to adjust to community life
and subsequently maintain compliance with their supervision conditions.
To this extent, failure to consider the spectrum of non-compliance and criminal
reoffending provides an incomplete picture of the impact of the incarceration experience on the
reentry process (Rydberg & Grommon, 2016). Simultaneously, if the impact of incarceration
length is constant across different measures of reoffending, this enhances the external validity of
conclusions regarding these effect. For the purposes of informing theory, failure to make
distinctions in measures of recidivism would potentially produce a null estimate for the effect of
incarceration duration, and only examining one or the other will potentially produce an
incomplete picture of incarceration effects. To better understand the impact of length of stay, we
utilize a measure of parole failure as the outcome, distinguishing between returns to prison due to
receiving a new criminal sentence, and those returned via supervision revocation.
THE CURRENT INQUIRY
The purpose of the present study is to contribute to the knowledge base concerning the
incremental effect of incarceration duration on recidivism. This research pursues two questions:

11
Research Question 1: What is the dose-response relationship between time served in
prison and the prevalence and timing of parole failure?
Research Question 2: Does the dose-response relationship between time served in
prison and the prevalence and timing of parole failure vary across instant offense types?
This section of the manuscript will outline the data source utilized to pursue these questions, the
measures available for this research, the handling of missing data, and counterfactual estimation.
Data and Measures
Sample generation and data reduction. This analysis utilizes data from the National
Corrections Reporting Program (NCRP) 2000-2012 parole exit data (File C), available from the
National Archive of Criminal Justice Data (ICPSR 34984) (US DOJ, 2014). Annually,
participating state departments of corrections report data on individuals exiting parole
supervision (either successfully or unsuccessfully) in the previous year to the US Census Bureau
(US DOJ, 2014). Specifically, the NCRP parole exit file reports information on 113 assorted
variables, including demographic data, incarceration length, and offense type. The full dataset
includes records for 3.57 million individuals released from supervision.
To prepare the data for analysis, four states were selected based on relative data quality
and geographic variability, and include Michigan, Missouri, New York, and Utah.2 These states
are similar to a subset utilized in earlier analyses of these data (Steen & Opsal, 2007). We
utilized records from these states to construct cohorts of parolees released between 2004 and
2008. This timeframe was chosen to maximize statistical power and allow for sufficient time at
risk for recidivism (i.e., up to three full years of observation). Further data reduction was
employed to produce a sample highly relevant to research questions, resulting in a dataset of
2 Specifically, these states had relatively less missing data than other reporting states, and showed realistic variation
in the supervision outcome variable after data reduction.

12
104,447 parolees released to the study states during the specified period.3 By concentrating on
particular cohorts of released parolees through 3 years of observation, we approximate a fixed
panel study for this analysis.
Dependent variable. The outcome variable is a three-category factor, indicating whether
the individual’s parole supervision ended via a successful discharge, a supervision revocation via
a technical violation, or a return to prison via a new criminal sentence. These outcomes differ
from recent, similar inquiries (Meade et al., 2012) in that they are designed to capture variation
in parole failure stemming from both lack of supervision compliance and criminal recidivism. As
a baseline, half the sample (50.5%) exited parole via successful discharge, while 34.5% returned
via revocation, and 15% via a new sentence. These proportions were very similar to national
trends reported by BJS during the study period (Glaze & Bonczar, 2008). Additionally, the time
at risk for each parolee was calculated as the duration (in days) between their release from prison
and the successful or unsuccessful completion of their supervision. To allow for variation in
supervision term duration and sufficient time for recidivism to unfold (Huebner & Berg, 2011),
time at risk was capped at 3 years. This duration should translate to a higher proportion
recidivating than similar studies using a shorter follow-up period (e.g., Meade et al., 2012), but
should minimize right censoring. Descriptive statistics for all variables are included in Table 1.
Independent variables. The primary independent variable is the length of incarceration,
measured as the duration between prison admission and prison release. Implementing a dose-
3 A rigorous procedure was used to reduce the sample to allow for valid conclusions to the research questions. We
eliminated a number of cases which were inappropriate for these aims, including the removal of: any non-parolees
from the data (i.e., probationers); people who spent no time (0), negative time (< 0), or an unknown amount of time
in prison; anyone for which their time at risk (supervision time) was greater than 3 years; any juveniles (i.e., under
18); and anyone who was admitted to prison prior to 1964. We specifically retained cases necessary for the analysis,
including: only those who successfully or unsuccessfully completed their supervision (i.e., no transfers or deaths);
individuals released from prisons, meaning that no one was released from a jail or an 'other' institution; people who
received a prison sentence of at least 12 months; individuals whose most recent incarceration was a new
commitment (i.e., they were not reincarcerated from a failed parole and then released again); and people for which
their instant offense type was known.

13
response framework, the continuous incarceration length was transformed into a five-category
ordinal variable. The length between cutoffs was 12 months, creating categories of less than 12
months, 12 to 23 months, 24 to 35 months, 36 to 48 months, and greater than 48 months. The
choice of these categories was based on a compromise between the natural quintiles of the
incarceration length distribution, and the policy relevance of the analysis categories (Meade et
al., 2012).4 The second independent variable captures the instant offense type for which the
parolee had served their incarceration. This was operationalized as the most serious conviction
offense, and grouped into five categories – violent (e.g., most common - armed robbery),
property (e.g., burglary), drug (e.g., drug trafficking), public order (e.g., driving while
intoxicated), and sex offense (e.g., sexual abuse). With the exception of sex offenses, these
categories are similar to those used in previous analyses of the NCRP (Steen & Opsal, 2007).5
Control variables. Several additional variables in the NCRP were available as controls.
Parolee demographics included age (categorized as 18 to 29 [reference], 30 to 49, and 50+), sex
(female), and race (black).6 Information concerning the parolee’s offense severity was captured
through several indicators – the number of counts for the conviction offense (categorized as one
[reference], two or three or more counts), and the length of sentence (in months). Because of
variation in time served before parole release, length of sentence and incarceration length are
only moderately correlated (r = 0.44), allowing it to be used as an indicator of offense severity. A
4 Specifically, utilizing the natural quintiles would have created categories of < 11 months, 12 to 19 months, 20 to 30
months, 31 to 55 months, and greater than 55 months. Our measure allows for a more standardized examination of
the incremental impact of incarceration length on parole failure. 5 Also with the exception of sex offenses, these offenses have relatively similar parole requirements in each state
respectively, constituting generally “standard” requirements such as supervision, travel restrictions, and weapons
prohibitions. For sex offenders, each state has additional requirements, including required treatment and electronic
monitoring. The states also use similar procedures for the revocation of supervision. 6 Due to low prevalence, and for consistency with previous work (Meade et al., 2012; Steen & Opsal, 2007),
parolees of ‘other’ race were excluded. Concerning ethnicity, Hispanic parolees were not included in the data for
several reasons. Communication with the Bureau of Justice Statistics suggested that this variable was not as reliably
recorded as others, particularly across states. Additionally, Hispanic parolees were missing a large amount of data on
other indicators in the analysis. As such, these analyses are restricted to non-Hispanic white and black parolees.
14
binary variable for whether the parolee had a prior felony incarceration was included as an
indicator of criminal history / recidivism risk. These variables represent the “minimum set” of
covariates that must be accounted for when estimating the effect of incarceration on recidivism
(Nagin et al., 2009). Additional categorical variables were included to account for static
differences across release cohorts and each state in the analysis.
Missing data. A limitation of the NCRP concerns missing data. After data reduction, a
trivial number of cases (n = 1,039, 1.0%) were missing data for several indicators (i.e., age, sex,
race, offense counts, sentence length), and these cases were removed from the analysis, leaving
an analysis sample of 103,438. However, a considerable proportion of parolees were missing
data for prior felony incarceration (27.0%). Given the importance of this measure for indicating
recidivism risk, and the amount of valid information which would be discarded if these cases
were removed from the analysis, we utilized a multiple imputation procedure. We applied an
expectation maximization (EMB) algorithm as implemented in the ‘Amelia’ package in R, which
utilizes available data to predict plausible values for missing cases (Honaker, King, & Blackwell,
2014; R Core Team, 2015).7
[Table 1 about here]
Selection Bias Adjustment
When estimating the causal effect of incarceration length on recidivism, selection bias
presents a pertinent threat to internal validity (Shadish et al., 2002). Recent inquiries have used
stratification on the propensity score to adjust for this confounding (Loughran et al., 2009;
7 We took several steps to ensure the validity of the imputed values and subsequent analyses. First, based on
recommendations in the literature, we utilized a large number of imputed datasets (m = 40) (Graham, Olchowski, &
Gilreath, 2007). Second, we included interactions between variables to maximize the information available for the
imputations. Third, to compensate for the degree of missingness and correlation between predictors, we
implemented a ridge prior of 1% of the number of observations (Honaker et al., 2014). The distribution of imputed
values for prior felony incarceration was highly stable across imputed datasets, and subsequent analyses reported
here are conducted separately on each of these 40 datasets and pooled to a single set of results.

15
Meade et al., 2012). We adopt a more recent innovation in causal inference, specifically designed
for multi-valued treatments. Marginal mean weighting through stratification (MMW-S) is a non-
parametric combination of propensity score stratification and inverse probability of treatment
weighting (IPTW) (see Peters, Hochstetkler, DeLisi, & Kuo, [2015] for a description of these
methods), which approximates random assignment to treatment by weighting each treatment
group to represent the sample as a whole (Hong, 2012).
To produce the marginal mean weights, we first estimated an ordinal logistic regression
model using the ordinal incarceration length variable as the outcome, and all control variables as
predictors to produce the balancing (propensity) score. Interactions and polynomials were
included in the models to improve predictions. Scores were estimated for the overall sample and
each instant offense type. The range of balancing scores within each dosage level were assessed,
and scores not represented in each dosage level were removed (Hong, 2012). Common support
was high, retaining 99% of the overall sample, more than 95% of violent, property, drug, and
public order offenders, and 90% of sex offenders. The overall sample and each offender group
were then stratified on the balancing score. As previous research suggests that five or six strata
are sufficient for a significant reduction in selection bias (Rosenbaum & Rubin, 1983), the large
sample allowed us to stratify the sample into deciles.
The marginal mean weights were then calculated for the overall sample and each
offender group as the following,
𝑛𝑠 × Pr(𝑍 = 𝑧)
𝑛𝑍=𝑧,𝑠
(1)
Where 𝑛𝑠 represents the number of units in balancing score strata s, z represents the specific
dosage level of incarceration length Z, and 𝑛𝑍=𝑧,𝑠 is the number of units in dosage in
incarceration length z in stratum s. In Equation 1, the numerator represents the number of units in

16
a given stratum that would have been assigned to dosage level z in a randomized experiment,
while the denominator is the actual number of units in a given stratum assigned to a given dosage
level (Hong, 2012). Applying the resulting weight balances each dosage level so that each one
represents the sample as a whole, allowing the estimation of a counterfactual proportion failing
that would have been obtained had the entire sample been incarcerated for a given duration.
Covariate balance for the overall sample and each offender group was assessed prior to
and following the application of the MMW-S. Per Austin (2011), we utilize a standardized
difference (d) measure that does not rely on sample size. These calculations were carried out for
all pairwise combinations of incarceration length dosage levels and averaged. The resulting
average pairwise standard differences are displayed in Table 2. Standard differences smaller than
0.1 suggest balance on that covariate. The results suggest that the application of the weights
resulted in a substantial reduction in the standard difference across dosage levels.
[Table 2 about here]
Analysis Plan
To investigate the impact of incarceration length on parole failure, we pursue two
analyses. First, we estimate the weighted dose-response curves for parole failure (revocations
and new sentences) across each of the incarceration length categories – initially for the overall
sample as a baseline, and then each individual offender group to examine variation in the curve.
These curves will provide a visualization of the incremental effect of incarceration length on
parole failure, allowing for the comparison of failure as the length of stay increases across
offender groups. As opposed to including incarceration length as a ratio-level predictor in a
regression model, this approach allows non-linear effects to be captured. Second, we utilize
parametric survival regression models to examine whether incremental doses of incarceration

17
accelerate or decelerate failure time. These findings allow for a different look at potential
suppressive or criminogenic effects, as similar studies have focused solely on failure prevalence
(Meade et al., 2012; Loughran et al., 2009).
RESULTS
Prevalence of Parole Failure
In the weighted overall sample, the total proportion failing was 48.5%, with 33%
returning on a revocation, and 15.5% returning on a new sentence. The weighted dose-response
curves are presented in Figure 1. The point estimates represent the weighted proportion of the
sample experiencing a return to prison on supervision revocation, or through a new criminal
sentence, and vertical lines represent the bootstrapped 95% confidence interval around these
estimates. The position of the points are staggered to avoid overlap. The unweighted failure
proportions displayed in Table 1 indicated an upward trend in revocations as the dosage level of
duration increased (from 28% to 41%), and a downward trend in new sentences (from 17% to
12%). These general trends for the overall sample did not change after applying marginal mean
weights, but larger differences were observed for revocations whereas weighted failure for those
receiving more than 24 months in prison were lower than in the unweighted sample.
In the weighted overall sample, incremental increases in incarceration length increased
revocations, from 29% (SE = .005) for those receiving less than 12 months, and 37.4% (SE
= .007) for those incarcerated more than 48 months. To preserve the Type I error rate, the
statistical significance for pairwise dosage category comparisons was estimated using Tukey
honest significant difference tests, and are displayed in Table 3. For the overall sample, all
pairwise comparisons but for the highest two categories were significant at the p < .05 alpha
level. Conversely, the dose-response curve for new sentences indicates that incremental increases

18
in incarceration length resulted in decreases in the failure rate. These proportions moved from
17% (SE = .004) at less than 12 months of incarceration, to 12.7% (SE = .005) at the highest
dosage level. Pairwise comparisons indicated that only differences in new sentences for the first
and second, and third and fourth dosage categories failed to reach significance.
Considerable heterogeneity in the dose-response curves was observed both within and
across the individual conviction offense types. Reflecting the overall trend, increasing revocation
dose-response curves were observed for those convicted of drug offenses, where longer periods
of incarceration increased the likelihood of revocation. For violent convictions, initial increases
in incarceration length significantly increase the revocation rate, but stabilize after 36 months in
prison. Revocations for property offenders appear as a step function, significantly increasing
between 12-23 and 24-35 months, but stable on either end of the curve. Those convicted of
public order and sex offenses demonstrated curvilinear patterns, decreasing revocations to a
certain dosage level and then increasing, though differences were significant (see Table 3).
For new sentences, dose-response curves for individual offense type were somewhat
flatter. For violent, property, and drug offenders, significant differences were observed when
comparing extreme dosage levels, as those in the highest dosage levels had lower proportions
with new sentences than those in lower categories (see Table 3). For drug, public order, and sex
offenders, significant differences were observed in comparison to the lowest dosage level, which
had the highest proportion of returns. It is worth noting that across all dosage categories, sex
offenders had the highest revocations, but the lowest new sentences. However, due to the small
number of offenders in the lowest category for sex offenders (n = 142), there is a relatively large
confidence interval for these estimates.
[Figure 1 about Here]
[Table 3 about Here]

19
Timing of Parole Failure
In the second component of the analysis we estimate a series of parametric, accelerated
failure time (AFT) regression models to examine the effect of incarceration length on the timing
of parole failure.8 We estimate separate models across each offense type, rotating the dosage
level’s reference category, which allows us to consider the effect of spending less or more time
in prison, relative to each dosage level. Exponentiating the estimates produce AFT ratios, where
ratios above 1 indicate that (relative to the reference category) the covariate increases (i.e.,
slows) the time to failure, and ratios below 1 indicate that the covariate decreases (i.e., hastens)
the time to failure. Because multiple comparisons are made across offense types and dosage
levels, a conservative Bonferroni adjustment was made to the alpha level to preserve the Type I
error rate.9 As some covariate imbalance persisted, all covariates were included in the weighed
models, and estimates for revocations and new sentences are displayed in Table 4.
Concerning the effect of incarceration length on the timing of parole revocations (Table
4), the results for the full sample and individual offense types suggest that spending relatively
more time incarcerated decreases (i.e., quickens) the time to failure, while spending relatively
less time increases (i.e., slows) the time to failure. For instance, relative to those who spend less
than 12 months in prison, those who spend more time fail almost 20% more quickly (Exp(b) =
0.81), while relative to those who spend more than 48 months, spending less time extends
survival time by about 20% (Exp(b) = 1.19). Effect size and significance varied across individual
offense types, whereas incarceration length was largely unassociated with failure time for violent
8 Analysis of the baseline hazard distribution and null model AIC suggested that a Weibull distribution described the
hazard for both revocations and new sentences, outperforming other parametric survival distributions and the semi-
parametric Cox proportional hazards model. 9 Specifically, 30 models are estimated for each dependent variable across six different sample subsections and five
dosage category indicators. The standard alpha level of p < .05 was adjusted to p < .00167 (i.e., 0.05 ÷ 30) to
decrease the likelihood of Type I error.

20
and sex offenders, but had relatively larger effects for drug and public order offenders. The
Weibull shape parameter suggests that the hazard of revocation increases over time.
The effect of incarceration length on the timing of new sentences was more muted, and
reversed from revocations (see Table 4). That is, spending less time in prison was associated
with faster failure times, while those who spent relatively longer periods of incarceration failed
more slowly. Although incarceration length was unrelated to the timing of revocations for violent
offenders, it was particularly salient for the timing of new sentences. Relative to those who spent
less than 12 months in prison, those who spent more time survived approximately 16% longer
during supervision (Exp(b) = 1.16). Mostly null effects were observed for property, drug, public
order, and sex offenders, indicating that incarceration length was not associated with increasing
or decreasing the time to failure for these parolees.
[Table 4 about Here]
DISCUSSION
In their review of the effect of incarceration length on recidivism, Nagin and colleagues
(2009) observed that the previous research on this relationship has produced mixed results, and
suffered from a variety of threats to internal validity. More recent research has adopted
propensity score approaches to account for differences between offenders who receive the
shortest and longest sentences, also producing mixed results (Loughran et al., 2009; Meade et al.,
2012). We sought to examine the dose-response relationship between incarceration length and
the prevalence and timing of recidivism, drawing on a large dataset of parolees from several
states. We build on the findings of recent research by considering whether the dose-response
relationship varies depending on the conviction offense, and whether the patterning of the

21
relationship is similar for multiple measures of parole failure – returns to prison by way of
supervision revocation and by conviction on a new criminal sentence.
In general, the findings from the analyses presented here suggest that longer periods of
incarceration were associated with a higher likelihood and faster occurrence of revocations, and a
lower likelihood and slower occurrence of new criminal sentences. Consistent with the
prediction of Nagin and colleagues (2009), considerable heterogeneity was observed in these
dose-response effects across different conviction offenses. As previous research has indicated
that incarceration length can potentially have a suppressive, criminogenic, or minimal effect on
recidivism, taken as a whole, the results of these analyses do not provide clear support for any of
these theoretical perspectives. Instead, the results suggest the need for a more nuanced
explanation to account for the differential effects of incarceration length on parole compliance
and criminal reoffending, as well as differential responses conditional on conviction offense
type. We suggest that policymakers need to consider whether the modest benefits in terms of
criminal recidivism reduction are worth the relatively stronger direct effect on revocations.
Specifically, the observed inverse relationship between incarceration length and returns
to prison on a new criminal sentence is consistent with recent research utilizing a similar
propensity score method and felony rearrest as the outcome (Meade et al., 2012). On initial
inspection, this dose-response curve suggests a potential suppression effect; a 4.5 percentage
point difference between the lowest and highest categories. However, the patterning of the
disaggregated offense type curves is reflective of both suppression and null effects, sometimes
changing following particular thresholds. For property offenders, an initial increase in the
likelihood of recidivism subsequently decreases with increasing doses – mirroring the curve
produced by Meade and colleagues (2012). Yet, for these property and violent offenders,

22
significant decreases in recidivism are only achieved when comparing the lowest and highest
dosage categories (decreases of 3.9 and 5.7 percentage points, respectively), suggesting that
relatively long periods (> 48 months) are necessary to achieve reductions in recidivism. Given
these observed effects, policymakers will be required to weigh the relative benefits of new
sentence reductions with the increased financial cost of maintaining longer periods of
incarceration, particularly when treatment may deliver similar decreases (Andrews & Bonta,
2006). While some reductions were observed for sex and public order offenders, the relationship
is nullified or reverses beyond a certain point – past 36-48 months for public order offenders, and
beyond 12-23 months for sex offenders. Echoing the conclusions of Meade et al. (2012), the
estimated dose-response curves for sex and public order offenders suggest that the incarceration
duration for these offenders could be reduced without subsequently endangering public safety.
Such reductions are made more important by findings concerning the effect of incarceration
length on parole revocations.
A troubling aspect of the results concerns the estimated positive relationship between
incarceration length and the prevalence and timing of returns to prison on a technical revocation.
Moving from one dosage category to the next increases revocations by approximately 2
percentage points, with an 8.5 percentage point difference between the lowest and highest
categories. Additionally, the AFT survival models suggest that incremental increases in
incarceration dosage result in parolees failing more quickly. Overall, these findings suggest a
criminogenic, deleterious effect for incarceration length on supervision compliance. Among
individual offense types, this effect is mirrored or amplified. It is important to note that the
criminogenic effect is particularly pronounced for drug offenders, as spending relatively less
time incarcerated is estimated to slow failure time by 22 to 29%. Because the criminogenic effect

23
stabilizes after 36-48 months of incarceration, reducing time served for drug offenders would be
expected to produce the largest benefit in regard to revocation prevalence and timing.
Although the estimated curves and AFT effects may be considered consistent or
inconsistent with theoretical responses to incarceration, identifying the specific mechanisms
underlying these observed associations is more difficult, and beyond the scope of the current
inquiry. In particular, the data drawn on for these analyses does not allow for us to account for
what Mears, Cochran, and Cullen (2015: 1) refer to as the “heterogeneity of incarceration,” or
heterogeneity in prior sanction experiences of parolees, heterogeneity in the parolee’s within
prison experiences, and heterogeneity in their post-release experiences. Being unable to capture
measures of the within-prison setting limits our ability to understand the mechanisms underlying
the incarceration length-recidivism relationship. For instance, Listwan and colleagues (2013)
found that returning prisoners’ perceptions of their prison environment as placing them at a
relatively high likelihood of being assaulted or threatened was positively associated with rearrest
and recommitment to prison. It is possible that this sort of within prison experience interacts with
or is structured by conviction offense type to shape post-release outcomes (Stadler et al., 2013).
Although this research was unable to include such covariates in the analysis, the findings raise
questions concerning how heterogeneity in within prison experiences can simultaneously reduce
the likelihood of a new criminal sentence, but increase the likelihood of parole revocation.
One possibility is that these effects are simply two sides of the same coin. Lengthy
periods of incarceration produce effects consistent with specific deterrence, reducing the
likelihood of an individual committing a relatively serious criminal offense, at the cost of
deteriorating the parolee’s capacity to comply with the conditions of their supervision. That is,
increased duration may serve to decrease the parolees’ resources for community adjustment (i.e.,

24
social capital, employment skills) and subsequently promote reentry failure, despite the parolee
being rationally deterred from committing a new crime - effectively neutralizing the impact of
the custodial sanction. This is important considering the concept of supervision regimes, in
which parolees are enmeshed in the differential tolerance for and capacity to detect non-
compliance (Grattet, Lin, & Petersilia, 2011). It is possible that increased scrutiny on certain
offenders compounds adjustment problems stemming from a lengthy incarceration, as this would
explain why sex offenders were observed to have the highest revocations but lowest new
sentences. As these effects require further explication, we encourage future research using a
broad array of recidivism indicators, capturing the spectrum of non-compliance and reoffending
(Rydberg & Grommon, 2016).
Although the mechanisms underlying the observed effects cannot be empirically
examined in the scope of the current inquiry, the patterning of results suggest that pre-release
planning and wrap-around reentry efforts may need to be amplified for prisoners spending
relatively long periods of incarceration, particularly for sex offenders. Because increasing doses
of incarceration hastens revocation, front-loading reentry services to stabilize the initial reentry
transition may be instrumental in reducing non-compliance issues among parolees who have
been incarcerated for extended periods. Broadly, the findings presented here should elevate the
status of length of incarceration as a pertinent barrier to successful reentry (Petersilia, 2003).
Beyond this point concerning mechanisms, several additional limitations are noteworthy,
and largely stem from the nature of the NCRP data. First, the validity of the conclusions are
contingent on the nature of the NCRP data collection and the variables therein. Ultimately
derived from official records, the quality of the data in the NCRP is subject to the attentiveness
of individual parole offices within reporting states. For instance, variation in the quality of

25
reporting parolee ethnicity necessitated that we exclude Hispanic parolees from the current
analysis. To compensate, we restricted the analysis to several states with relatively higher data
quality, which had been utilized in previous analyses of the NCRP parole exit data (Steen &
Opsal, 2007). Second, and similarly, one measure (prior felony incarceration) was missing a non-
trivial number of cases (~27%). As deletion of these cases would discard a large amount of valid
data, we employed multiple imputation to substitute plausible values for these cases. We took
several precautions to decrease the likelihood of the imputation procedure introducing bias into
the analyses (see Footnote 7). As the imputed values were highly stable across imputed datasets,
it is unlikely that employing this procedure significantly biased the results obtained.
Third, by utilizing a secondary dataset, the imputation and marginal mean weighting were
limited by the number of covariates available in the NCRP, resulting in a relatively low
explained variance in the survival models (see Tables 4 and 5), and the possibility of omitted
variable bias as an explanation for the results. Ideally, an exhaustive list of empirically and
theoretically relevant measures would be at our disposal for analysis. Although the NCRP
contains a limited set of covariates, they do include what Nagin and colleagues (2009) refer to as
the “minimum set” of variables necessary for a credible assessment of the effect of incarceration
on recidivism – age, sex, race, prior criminal record, and conviction offense type. With that being
said, the unavailability of salient measures may bias the results. For instance, the inclusion of an
actuarial assessment of recidivism risk (e.g., LSI-R) would allow for the MMW-S procedure to
weight the sample so that dosage categories had similar predicted likelihoods of reoffending.
As noted, this same limitation impedes our ability to include measures of incarceration
heterogeneity (Mears et al., 2015). For instance, our measure of incarceration length cannot be
considered as a direct measure of exposure to potentially criminogenic environments, and we

26
lack the covariates necessary to make such a distinction (Listwan et al., 2013). Similarly, we lack
the individual-level measures which could potentially moderate the effect of prison experiences
on recidivism, such as psychopathy (Sandvik, Hansen, Hystad, Johnsen, & Bartone, 2015).
Additionally, we are unable to control for variation in the supervision regimes constructed
around offenders, leaving supervision intensity as a possible explanation for observed patterns.
While this is a shortcoming of most of the existing literature to date, future research drawing on
samples from rich, individual state department of correction data systems may be able to rectify
this shortcoming. Further, the lack of detailed criminal history information for the parolees
complicates the designation of offense type. It is possible that an offender convicted of a violent
offense has previous convictions for other types of offenses, or that an offender is versatile as to
commit a multitude of different offenses, but was detected for a specific offense in these data and
recorded as such. We temper the conclusions of this research in that they reflect patterns in
incarceration length and recidivism for individuals most recently convicted for a particular type
of offense, as opposed to reflecting distinct “types” of offenders.
Finally, the generalizability of the findings is limited by the fact that the NCRP does not
represent a random sample or population of individuals exiting parole supervision. Only
particular states report data to the NCRP, resulting in a sample of parolees which is not
nationally representative. We have attempted to improve the generalizability of the results by
including data from states from different regions of the nation, and utilize multiple cohorts of
parolees released over a period of 5 years. Static differences between these states are statistically

27
controlled for in the analyses presented here. We encourage researchers to attempt to replicate
these findings across different geographies.10
Despite these limitations, we believe that several conclusions can be drawn from these
results regarding the dose-response relationship between incarceration length and recidivism.
Primarily, this research adds to the body of evidence supporting the contention that the impact of
the incarceration experience is sufficiently heterogeneous as to not be boiled down to a simple
suppressive or criminogenic effect (Cullen et al., 2011). We encourage policymakers to consider
multiple measures of parole failure - findings consistent with a suppression effect for new
sentences are tempered by a potentially criminogenic effect for parole revocations, and
considerable heterogeneity among individual offense types. This research helps to inform a
policy debate occurring in the wake of moving on from mass incarceration (Nagin et al., 2009;
Travis & Western, 2014). That is, if the criminal justice system is to incarcerate less, what are
the conditions under which incarceration will be the most effective? Future research utilizing
strong counterfactuals will be instrumental in addressing this issue.
10 A sensitivity analysis re-estimated the dose-response curves for the overall samples in each state (available upon
request). This check observed that the inverse dose-response relationship for incarceration length and new sentences
was largely consistent across states, while the direct association for revocations was restricted to New York and
Utah, with Michigan and Missouri demonstrating null effects. This check reinforces the need for additional research
to examine incarceration length effects in a variety of contexts.

28
REFERENCES
Ackerman, A. R., & Sacks, M. (2012). Can general strain theory be used to explain recidivism
among registered sex offenders? Journal of Criminal Justice, 40(3), 187–193.
Agnew, R. (1992). Foundation for a general strain theory of crime and delinquency.
Criminology, 30(1), 47-87.
Agnew, R. (2001). Building on the foundation of general strain theory: Specifying the types of
strain most likely to lead to crime and delinquency. Journal of Research in Crime &
Delinquency, 38(4), 319-361.
Andresen, M. A., Frank, R., & Felson, M. (2013). Age and the distance to crime. Criminology
and Criminal Justice, 14(3), 314–333.
Andrews, D. A., & Bonta, J. (2006). The psychology of criminal conduct. Cincinnati: Anderson.
Austin, P. C. (2011). An introduction to propensity score methods for reducing the effects of
confounding in observational studies. Multivariate Behavioral Research, 46(3), 399–424.
Beck, J. L., & Hoffman, P. B. (1976). Time served and release performance: A research note.
Journal of Research in Crime and Delinquency, 13(2), 127-132.
Berecochea, J. E., & Jaman, D. R. (1981). Time served in prison and parole outcome: An
experimental study. Sacramento: California Department of Corrections.
Bhati, A. S., & Piquero, A.R. (2008). Estimating the impact of incarceration on subsequent
offending trajectories: deterrent, criminogenic, or null effect? The Journal of Criminal
Law and Criminology, 98(1), 207-253.
Blevins, K. R., Listwan, S. J., Cullen, F. T., & Jonson, C. L. (2010). A general strain theory of
prison violence and misconduct: An integrated model of inmate behavior. Journal of
Contemporary Criminal Justice, 26(2), 148-166.
Blumstein, A., & Cohen, J. (1987). Characterizing criminal careers. Science, 237(4818), 985-
991.
Boduszek, D., Dhingra, K., & Debowska, A. (2016). The moderating role of psychopathic traits
in the relationship between period of confinement and criminal social identity in a sample
of juvenile prisoners. Journal of Criminal Justice, 44, 30-35.
Carson, E. A. (2014). Prisoners in 2013. Washington, DC: US Department of Justice, Office of
Justice Programs, Bureau of Justice Statistics.
Carson, E. A. & Golinelli, D. (2014). Prisoners in 2012: Trends in admissions and releases,
1991-2012. Washington, DC: US Department of Justice, Office of Justice Programs,
Bureau of Justice Statistics.
Casey, S., Day, A., Reynolds, J. (2016). The influence of incarceration length and protection
status on perceptions of prison social climate. Criminal Justice and Behavior, 43(2), 285-
296.
Chen, M. K., & Shapiro, J. M. (2007). Do harsher prison conditions reduce recidivism? A
discontinuity-based approach. American Law and Economics Review, 9(1), 1-29.
Cullen, F. T., Jonson, C. L., & Nagin, D. S. (2011). Prisons do not reduce recidivism: The high
cost of ignoring science. The Prison Journal, 91(3), 48S-65S.
Doherty, E. E., & Ensminger, M. E. (2014). Do the adult criminal careers of African Americans
fit the “facts”? Journal of Criminal Justice, 42(6), 517–526.
Dumond, R. W. (2000). Inmate sexual assault: The plague that persists. The Prison Journal,
80(4), 407-414.
Gendreau, P., Goggin, C., & Cullen, F. T. (1999). The effects of prison sentences on recidivism.

29
Ottawa, ON: Solicitor General Canada.
Gendreau, P., Goggin, C. E., & Law, M. A. (1997). Predicting prison misconducts. Criminal
Justice and Behavior, 24(4), 414-431.
Glaze, L. E. & Bonczar, T. P. (2008). Probation and parole in the United States, 2006.
Washington DC: US Department of Justice.
Graham, J. W., Olchowski, A. E., & Gilreath, T. D. (2007). How many imputations are really
needed? Some practical clarifications of multiple imputation theory. Prevention Science,
8(3), 206-213.
Grattet, R., Lin, J., & Petersilia, J. (2011). Supervision regimes, risk, and official reactions to
parolee deviance. Criminology, 49(2), 371–399.
Gottfredson, D. M., Gottfredson, M. R., & Garofalo, J. (1977). Time served in prison and parole
outcomes among parolee risk categories. Journal of Criminal Justice, 5(1), 1-12.
Gottfredson, D.M., Neithercutt, M.G., Nuffield, J. & O.Leary, V. (1973). Four thousand
lifetimes: A study of time served and parole outcomes. Davis, CA: National Council on
Crime and Delinquency.
Haerle, D. R. (2016). Dosage matters: Impact of a violent offender treatment program on
juvenile recidivism. Youth Violence and Juvenile Justice, 14(1), 3-25.
Hirschi, T., & Gottfredson, M. (1983). Age and the explanation of crime. American Journal of
Sociology, 89(3), 552-584.
Holzer, H. J., Raphael, S., & Stoll, M. A. (2006). Perceived criminality, criminal background
checks, and the racial hiring practices of employers. Journal of Law and Economics,
49(2), 451-480.
Honaker, J., King, G., & Blackwell, M. (2014). Amelia II: A program for missing data.
Available from http://cran.r-project.org/web/packages/Amelia/vignettes/amelia.pdf.
Hong, G. (2012). Marginal mean weighting through stratification: A generalized method for
evaluating multivalued and multiple treatments with nonexperimental data. Psychological
Methods, 17(1), 44.
Huebner, B. M., & Berg, M. T. (2011). Examining the sources of variation in risk for recidivism.
Justice Quarterly, 28(1), 146-173.
Irwin, J., & Cressey, D. R. (1962). Thieves, convicts and the inmate culture. Social Problems,
10(2), 142-155.
Jaman, D. R., Dickover, R. M., & Bennett, L. A. (1972). Parole outcome as a function of time
served. British Journal of Criminology 12(1), 5–34.
Joffe, M. M., & Rosenbaum, P. R. (1999). Invited commentary: Propensity scores. American
Journal of Epidemiology, 150(4), 327-333.
Kim, Y. (2015). The effect of incarceration on midlife health: A life-course approach.
Population Research and Policy Review, 34(6), 827-849.
Levitt, S. D. (2004). Understanding why crime fell in the 1990s: Four factors that explain the
decline and six that do not. The Journal of Economic Perspectives, 18(1), 163-190.
Listwan, S. J., Colvin, M., Hanley, D., & Flannery, D. (2010). Victimization, social support, and
psychological well-being: A study of recently released prisoners. Criminal Justice and
Behavior, 37(10), 1140-1159.
Listwan, S. J., Sullivan, C. J., Agnew, R., Cullen, F. T., & Colvin, M. (2013). The pains of
imprisonment revisited: The impact of strain on inmate recidivism. Justice Quarterly,
30(1), 144–168.

30
Lofstrom, M., & Raphael, S. (2016). Incarceration and crime: Evidence from California's Public
Safety Realignment Reform. Annals of the American Academy of Political and Social
Science, 664(1), 196-220.
Loughran, T. A., Mulvey, E. P., Schubert, C. A., Fagan, J., Piquero, A. R., & Losoya, S. H.
(2009). Estimating a dose-response relationship between length of stay and future
recidivism in serious juvenile offenders. Criminology, 47(3), 699–740.
Maruschak, L. M., & Bonczar, T. P. (2015). Probation and parole in the United States, 2012.
Washington, DC: US Department of Justice.
Massoglia, M. (2008). Incarceration as exposure: The prison, infectious disease, and other stress-
related illnesses. Journal of Health and Social Behavior, 49(1), 56–71.
Matza, D. (1964). Delinquency and drift. New York: Wiley.
McGrath, R. J., Cumming, G., Livingston, J. A., & Hoke, S. E. (2003). Outcome of a treatment
program for adult sex offenders from prison to community. Journal of Interpersonal
Violence, 18(1), 3-17.
Meade, B., Steiner, B., Makarios, M., & Travis, L. (2012). Estimating a dose-response
relationship between time served in prison and recidivism. Journal of Research in Crime
and Delinquency, 50(4), 525–550.
Mears, D. P., Cochran, J. C., & Cullen, F. T. (2015). Incarceration heterogeneity and its
implications for assessing the effectiveness of imprisonment on recidivism. Criminal
Justice Policy Review, 26(7), 691-712.
Nagin, D. S. (2013). Deterrence: A review of the evidence by a criminologist for economists.
Annual Review of Economics, 5(1), 83-105.
Nagin, D. S., Cullen, F. T., & Jonson, C. L. (2009). Imprisonment and reoffending. In Michael
Tonry (Ed.), Crime and justice: A review of research, Volume 38 (pp.115-200). Chicago:
University of Chicago Press.
Nelson, M., Deess, P., & Allen, C. (1999). The first month out: Post-incarceration experiences
in New York City. New York: Vera Institute of Justice.
Ostermann, M. (2015). How do former inmates perform in the community? A survival analysis
of rearrests, reconvictions, and technical parole violations. Crime & Delinquency, 61(2),
163-187.
Orsagh, T., & Chen, J. R. (1988). The effect of time served on recidivism: An interdisciplinary
theory. Journal of Quantitative Criminology, 4(2), 155–171.
Peters, D. J., Hochstetler, A., DeLisi, M., & Kuo, H. J. (2015). Parolee recidivism and successful
treatment completion: Comparing hazard models across propensity methods. Journal of
Quantitative Criminology, 31(1), 149-181.
Petersilia, J. (2003). When prisoners come home: parole and prisoner reentry. New York:
Oxford University Press.
R Core Team. (2015). R: A language and environment for statistical computing. R Foundation
for Statistical Computing, Vienna, Austria. http://R-project.org.
Rosenbaum, P. R., & Rubin, D. B. (1983). The central role of the propensity score in
observational studies for causal effects. Biometrika, 70(1), 41-55.
Rydberg, J., & Grommon, E. (2016). A multi-method examination of the dynamics of recidivism
during reentry. Corrections: Policy, Practice, and Research, 1(1), 1-20.
Sandvik, A. M., Hansen, A. L., Hystad, S. W., Johnsen, B. H., & Bartone, P. T. (2015).
Psychopathy, anxiety, and resiliency–Psychological hardiness as a mediator of the

31
psychopathy–anxiety relationship in a prison setting. Personality and Individual
Differences, 72(1), 30-34.
Shadish, W. R., Cook, T. D., & Campbell, D. T. (2002). Experimental and quasi-experimental
designs for generalized causal inference. Belmont, CA: Wadsworth Cengage Learning.
Spohn, C., & Holleran, D. (2002). The effect of imprisonment on recidivism rates of felony
offenders: a focus on drug offenders. Criminology, 40(2), 329-358.
Stadler, W. A., Benson, M. L., & Cullen, F. T. (2013). Revisiting the special sensitivity
hypothesis: The prison experience of white-collar inmates. Justice Quarterly, 30(6),
1090-1114.
Steen, S., & Opsal, T. (2007). “Punishment on the installment plan:” Individual-level predictors
of parole revocation in four states. The Prison Journal, 87(3), 344-366.
Sykes, G. (1958). The society of captives. Princeton: Princeton University Press.
Toman, E. L., Cochran, J. C., Cochran, J. K., Bales, W. D. (2015). The implications of sentence
length for inmate adjustment to prison life. Journal of Criminal Justice, 43(6), 510-521.
Travis, J., & Western, B. (2014). The growth of incarceration in the United States: Exploring
causes and consequences. Washington, D.C.: The National Academies Press.
United States Department of Justice, Office of Justice Programs, Bureau of Justice Statistics [US
DOJ]. (2014). National Corrections Reporting Program, 2000-2012. ICPSR 34984-v1.
Ann Arbor, MI: Inter-university Consortium for Political and Social Research.
van der Geest, V. R., Bijleveld, C. C. J. H., Blokland, A. A. J., & Nagin, D. S. (2016). The
effects of incarceration on longitudinal trajectories of employment: A follow-up in high-
risk youth from ages 23 to 32. Crime and Delinquency, 62(1), 107-140.
Verma, A. (2016). A turning point in mass incarceration? Local imprisonment trajectories and
decarceration under California's Realignment. Annals of the American Academy of
Political and Social Science, 664(1), 108-135.
Visher, C. A. & Courtney, S. M. E. (2007). One year out: Experiences of prisoners returning to
Cleveland. Washington, DC: The Urban Institute.
Visher, C. A. & Travis, J. (2003). Transitions from prison to community: Understanding
individual pathways. Annual Review of Sociology, 29, 89-113.
Weatherburn, D. (2010). The effect of prison on adult re-offending. Crime and Justice Bulletin,
(143), 1-11.
West, H. C., & Sabol, W. J. (2011). Prisoners in 2009. Washington, DC: US Department of
Justice, Office of Justice Programs, Bureau of Justice Statistics.
Western, B., Kling, J. R., & Weiman, D. F. (2001). The labor market consequences of
incarceration. Crime & Delinquency, 47(3), 410-427.
Wolff, N., & Draine, J. (2004). Dynamics of social capital of prisoners and community reentry:
Ties that bind? Journal of Correctional Health Care, 10(3), 457-490.
Zamble, E., & Porporino, F. J. (1988). Coping, behavior, and adaptation in prison inmates. New
York: Springer-Verlag.
Zweig, J. M., Yahner, J., Visher, C. A., & Lattimore, P. K. (2014). Using general strain theory to
explore the effects of prison victimization experiences on later offending and substance
use. The Prison Journal, 95(1), 84–113.

Table 1. Descriptive Statistics across Incarceration Length Categories (Prior to Missing Data Imputation) (N = 103,438)
Incarceration Length
Measure ↓
Overall
(N = 103,438)
< 12 Months
(N = 23,269)
12-23 Months
(N = 28,749)
24-35 Months
(N = 17,106)
36-48 Months
(N = 9,679)
> 48 Months
(N = 24,635)
M (SD) / N (%) M (SD) / N (%) M (SD) / N (%) M (SD) / N (%) M (SD) / N (%) M (SD) / N (%)
Parole Failure
Successful Discharge 52,282 (50.5%) 12,833 (55.2%) 14,959 (52.0%) 8,487 (49.6%) 4,439 (45.9%) 11,564 (46.9%)
Revocation 35,669 (34.5%) 6,509 (28.0%) 9,162 (31.9%) 6,055 (35.4%) 3,830 (39.6%) 10,113 (41.1%)
New Sentence 15,487 (15.0%) 3,927 (16.9%) 4,628 (16.1%) 2,564 (15.0%) 1,410 (14.6%) 2,958 (12.0%)
Time at Risk (Days) 499.5 (258.9) 520.9 (248.9) 490.2 (248.1) 481.9 (261.8) 497.6 (271.8) 502.8 (271.4)
Offense Type
Violent 20,945 (20.2%) 1,714 (7.4%) 3,975 (13.8%) 3,232 (18.9%) 2,414 (24.9%) 9,610 (39.0%)
Property 27,811 (26.9%) 7,145 (30.7%) 9,032 (31.4%) 4,777 (27.9%) 2,415 (25.0%) 4,442 (18.0%)
Drug 32,545 (31.5%) 9,419 (40.5%) 8,962 (31.2%) 4,881 (28.5%) 2,859 (29.5%) 6,424 (26.1%)
Public Order 16,816 (16.3%) 4,849 (20.8%) 5,955 (20.7%) 3,240 (18.9%) 1,263 (13.0%) 1,509 (6.1%)
Sex 5,321 (5.1%) 142 (0.6%) 825 (2.9%) 976 (5.7%) 728 (7.5%) 2,650 (10.8%)
Demographics
Age
18-29 35,851 (34.7%) 11,455 (49.2%) 9,925 (35.0%) 5,938 (34.5%) 3,326 (34.4%) 5,256 (21.3%)
30-49 59,337 (57.4%) 10,521 (45.2%) 16,561 (57.6%) 9,984 (57.5%) 5,634 (58.2%) 16,780 (68.1%)
50 and Over 8,250 (8.0%) 1,303 (5.6%) 2,263 (7.9%) 1,387 (8.0%) 719 (7.4%) 2,559 (10.6%)
Femalea 8,447 (8.2%) 2,819 (12.1%) 2,795 (9.7%) 1,217 (7.1%) 581 (6.0%) 1,035 (4.2%)
Blackb 58,649 (56.7%) 11,626 (50.0%) 14,875 (51.7%) 9,588 (56.1%) 5,885 (60.8%) 16,675 (67.7%)
Criminal History
Offense Counts
One Count 66,677 (64.5%) 16,249 (69.8%) 19,356 (67.3%) 10,959 (64.1%) 6,097 (63.0%) 14,016 (56.9%)
Two Counts 21,119 (20.4%) 4,485 (19.3%) 5,599 (19.5%) 3,450 (20.7%) 1,976 (20.4%) 5,519 (22.4%)
Three+ Counts 15,642 (15.1%) 2,535 (10.9%) 3,794 (13.2%) 2,607 (15.2%) 1,606 (16.6%) 5,100 (20.7%)
Sentence Lengthc 60.0 (35.6) 36.0 (17.8) 48.0 (17.8) 60.0 (35.6) 63.0 (31.1) 108.0 (89.0)
Prior Incarceration 40,975 (54.3%) 5,431 (36.5%) 12,378 (56.7%) 7,703 (60.1%) 4,486 (62.2%) 10,977 (58.5%)
Missing 27,913 (27.0%) 8,399 (36.1%) 6,908 (24.0%) 4,281 (25.0%) 2,461 (25.4%) 5,864 (22.9%) a Reference category is male parolees. b Reference category is white parolees. c Due to the right skew of sentence length, the median and median absolute deviation (MAD) are presented in place of the mean and SD.

1
Table 1. Continued
Incarceration Length
Measure ↓
Overall
(N = 103,438)
< 12 Months
(N = 23,269)
12-23 Months
(N = 28,749)
24-35 Months
(N = 17,106)
36-48 Months
(N = 9,679)
> 48 Months
(N = 24,635)
M (SD) / N (%) M (SD) / N (%) M (SD) / N (%) M (SD) / N (%) M (SD) / N (%) M (SD) / N (%)
Cohort
2004 17,233 (16.7%) 4,071 (17.5%) 5,212 (18.1%) 2,804 (16.4%) 1,550 (16.0%) 3,596 (14.6%)
2005 17,421 (16.8%) 4,138 (17.8%) 5,174 (18.0%) 2,988 (17.5%) 1,517 (15.7%) 3,604 (14.6%)
2006 20,141 (19.5%) 4,834 (20.8%) 5,536 (19.3%) 3,275 (19.1%) 1,940 (20.0%) 4,556 (18.5%)
2007 24,185 (23.4%) 5,232 (22.5%) 6,362 (22.1%) 3,927 (23.0%) 2,325 (24.0%) 6,339 (25.7%)
2008 24,458 (23.6%) 4,994 (21.5%) 6,465 (22.5%) 4,112 (24.0%) 2,347 (24.2%) 6,540 (26.5%)
State
Michigan 32,522 (31.4%) 7,318 (31.4%) 9,521 (33.1%) 5,194 (30.4%) 2,713 (28.0%) 7,776 (31.6%)
Missouri 10,646 (10.3%) 2,995 (12.9%) 3,046 (10.6%) 1,654 (9.7%) 913 (9.4%) 2,038 (8.3%)
New York 57,368 (55.5%) 12,069 (51.9%) 14,971 (52.1%) 9,912 (57.9%) 5,889 (60.8%) 14,527 (59.0%)
Utah 2,902 (2.8%) 887 (3.8%) 1,211 (4.2%) 346 (2.0%) 164 (1.7%) 294 (1.2%)

2
Table 2. Average Pairwise Standard Difference between Incarceration Length Categories by Offense Type, Before and After
Marginal Mean Weighing (N = 102,092)
Measure Overall Violent Property Drug Public Order Sex
Offense Type Before After Before After Before After Before After Before After Before After
Property 0.148 0.007 -- -- -- -- -- -- -- -- -- --
Drug 0.130 0.016 -- -- -- -- -- -- -- -- -- --
Public Order 0.218 0.009 -- -- -- -- -- -- -- -- -- --
Sex 0.231 0.048 -- -- -- -- -- -- -- -- -- --
Demographics
Age 30-49 0.191 0.041 0.183 0.009 0.199 0.058 0.308 0.018 0.074 0.084 0.211 0.038
Age 50 and Over 0.070 0.010 0.077 0.002 0.081 0.020 0.074 0.024 0.023 0.006 0.133 0.042
Female 0.146 0.037 0.092 0.007 0.190 0.038 0.118 0.019 0.136 0.039 0.001 0.016
Black 0.183 0.018 0.171 0.009 0.124 0.004 0.232 0.008 0.295 0.085 0.058 0.069
Criminal History
Two Counts 0.036 0.014 0.077 0.022 0.029 0.009 0.038 0.021 0.077 0.048 0.202 0.101
Three+ Counts 0.128 0.023 0.188 0.034 0.123 0.009 0.060 0.036 0.254 0.040 0.076 0.011
Sentence Length 0.421 0.053 0.447 0.051 0.316 0.017 0.339 0.020 0.427 0.027 0.396 0.053
Prior Incarceration 0.127 0.027 0.100 0.086 0.253 0.022 0.250 0.009 0.272 0.050 0.107 0.025
Cohort
2005 0.047 0.002 0.001 0.034 0.089 0.011 0.032 0.010 0.102 0.037 0.046 0.033
2006 0.019 0.015 0.136 0.002 0.001 0.016 0.009 0.033 0.012 0.033 0.052 0.029
2007 0.039 0.025 0.021 0.008 0.063 0.013 0.037 0.016 0.075 0.037 0.045 0.028
2008 0.056 0.011 0.036 0.011 0.069 0.013 0.041 0.041 0.096 0.018 0.038 0.001
State
Michigan 0.021 0.069 0.001 0.099 0.103 0.018 0.101 0.062 0.064 0.028 0.177 0.065
Missouri 0.067 0.007 0.036 0.001 0.098 0.007 0.108 0.011 0.161 0.035 0.077 0.043
Utah 0.098 0.039 0.048 0.006 0.100 0.074 0.152 0.047 0.099 0.016 0.066 0.044
Average Std Diff. 0.125 0.025 0.108 0.026 0.122 0.022 0.127 0.025 0.144 0.039 0.112 0.040
% Reduction -80.0% -76.3% -82.3% -80.1% -73.1% -64.5% Note: Standard differences less than 0.1 are considered as indicative of trivial differences between groups.
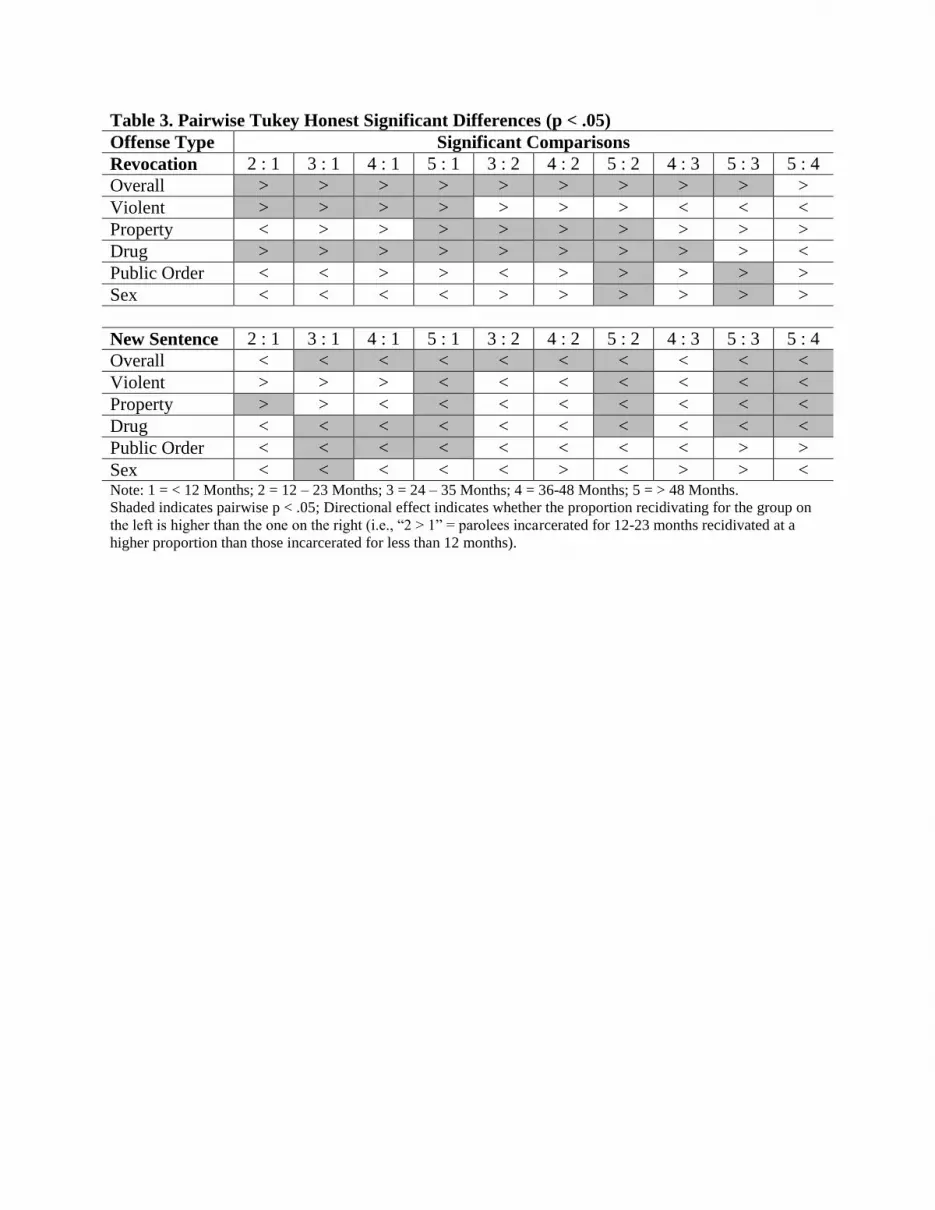
Table 3. Pairwise Tukey Honest Significant Differences (p < .05)
Offense Type Significant Comparisons
Revocation 2 : 1 3 : 1 4 : 1 5 : 1 3 : 2 4 : 2 5 : 2 4 : 3 5 : 3 5 : 4
Overall > > > > > > > > > >
Violent > > > > > > > < < <
Property < > > > > > > > > >
Drug > > > > > > > > > <
Public Order < < > > < > > > > >
Sex < < < < > > > > > >
New Sentence 2 : 1 3 : 1 4 : 1 5 : 1 3 : 2 4 : 2 5 : 2 4 : 3 5 : 3 5 : 4
Overall < < < < < < < < < <
Violent > > > < < < < < < <
Property > > < < < < < < < <
Drug < < < < < < < < < <
Public Order < < < < < < < < > >
Sex < < < < < > < > > < Note: 1 = < 12 Months; 2 = 12 – 23 Months; 3 = 24 – 35 Months; 4 = 36-48 Months; 5 = > 48 Months.
Shaded indicates pairwise p < .05; Directional effect indicates whether the proportion recidivating for the group on
the left is higher than the one on the right (i.e., “2 > 1” = parolees incarcerated for 12-23 months recidivated at a
higher proportion than those incarcerated for less than 12 months).

1
Table 4. Weighted Accelerated Failure Time Survival Models across Conviction Offenses
and Outcomes Overall Violent Property Drug Pub Order Sex
Rev NS Rev NS Rev NS Rev NS Rev NS Rev NS
< 12 Months More Time 0.81 1.06 0.92 1.17 0.86 0.97 0.74 1.08 0.72 1.03 1.18 1.54
12-23 Months
Less Time 1.14 0.99 1.09 0.95 1.08 1.06 1.22 0.96 1.23 0.98 0.74 0.79
More Time 0.89 1.08 1.01 1.13 0.87 1.05 0.83 1.05 0.95 1.04 0.85 1.23
24-35 Months
Less Time 1.14 0.95 1.05 1.01 1.18 1.02 1.23 0.97 1.13 0.94 1.05 0.66
More Time 0.93 1.04 1.04 1.23 0.98 1.07 0.90 1.07 0.94 0.95 0.91 0.83
36-48 Months
Less Time 1.12 0.95 0.98 0.95 1.10 0.99 1.30 0.97 1.15 0.95 1.04 1.04
More Time 0.93 1.05 0.99 1.23 0.92 1.08 1.00 1.10 0.97 0.90 0.90 1.10
> 48 Months
Less Time 1.19 0.91 1.00 0.78 1.17 0.92 1.26 0.88 1.18 1.06 1.15 0.93
N 102,092 20,238 26,455 31,474 16,368 4,828
Scale 0.73 0.61 0.70 0.57 0.74 0.65 0.69 0.61 0.69 0.59 0.82 0.68
Cox-Snell R2 0.08 0.09 0.13 0.08 0.09 0.10 0.06 0.10 0.09 0.07 0.21 0.15 Notes: Rev. = Revocation; NS = New Sentence. Coefficients are odds ratios. Bold indicates p < 0.00167.
Accelerated failure time represent pooled estimates from 40 imputed datasets. R2 and scale parameters were
invariant across models within offense types, reported as point estimates to avoid redundancy. Models control for
all additional covariates.
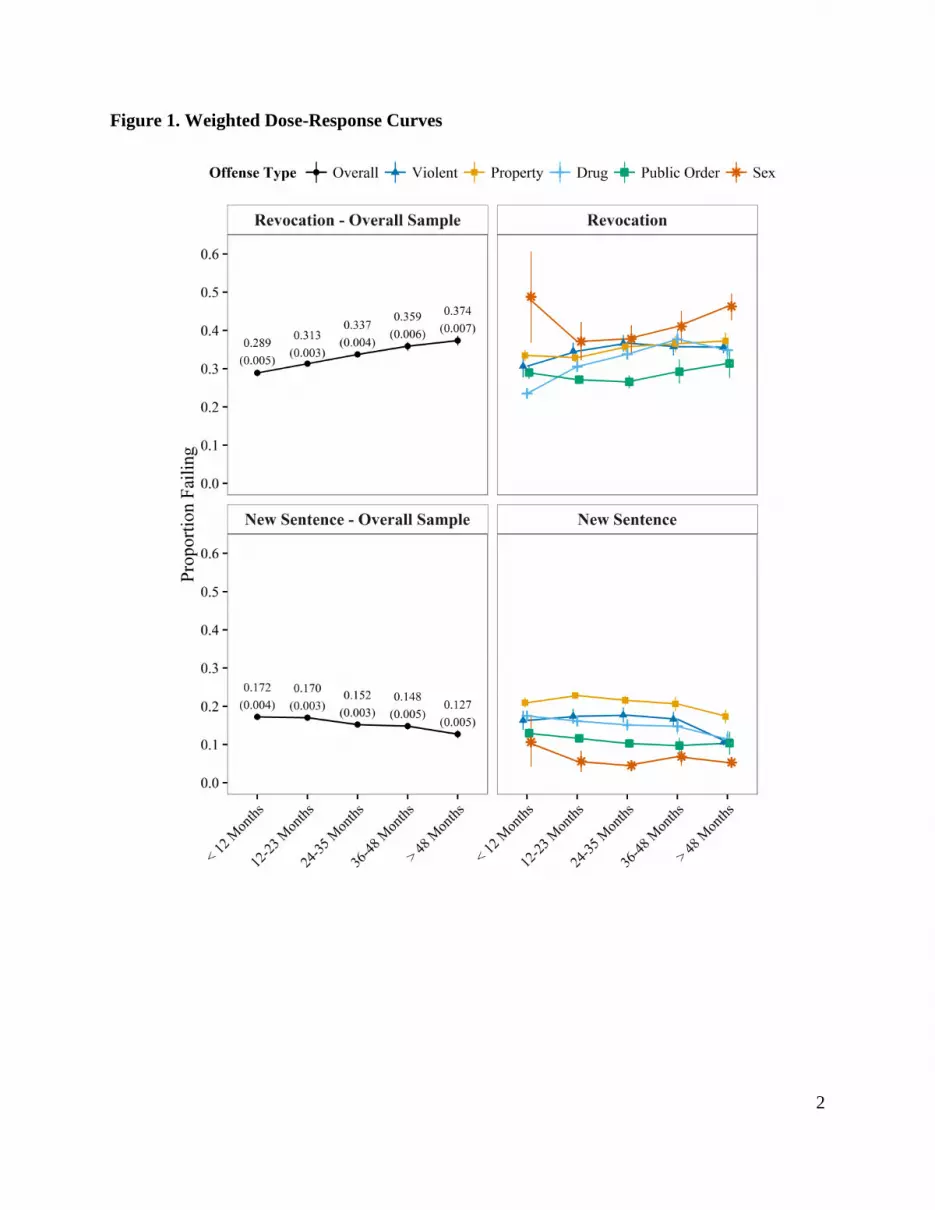
2
Figure 1. Weighted Dose-Response Curves


