Embed Size (px)
Citation preview
VALIDATED COMPUTER SIMULATION MODELLING FOR COMPLETE CONVEYOR TRANSFER DESIGN
D.B. Hastie1, A.P. Grima2 and P.W. Wypych1
1 Centre for Bulks Solids and Particulate Technologies, University of Wollongong, Northfields Avenue,
Wollongong, NSW, 2522, Australia 2 School of Mechanical, Materials and Mechatronic Engineering, Faculty of Engineering, University of
Wollongong, Northfields Avenue, Wollongong, NSW, 2522, Australia
SUMMARY This paper presents the chute flow analysis for a granular cohesionless material in a hood and spoon style transfer chute and bench scale testing methods to calculate the coefficient of restitution, particle rotation restraint and the coefficient of friction between particles of granular material. The experimental chute flow investigations were performed on a conveyor transfer research facility located at the University of Wollongong, using high-speed video to capture the granular flow and subsequently analysed with the Image Pro Plus software package. The bench scale tests were analysed to determine the input parameters for the DEM simulations of the trajectories and hood and spoon transfer chutes. Continuum-based analyses were used to predict the flow through the conveyor transfer. DEM provided a third means of quantification and prediction of the particle velocity through the transfer spoon. These methods were then compared to determine whether continuum and/or discrete element methods allow for accurate prediction of chute flow. INTRODUCTION The velocity and momentum of the material flow through a conveyor transfer should be controlled in such a way that the exit velocity of the material closely matches the speed of the receiving conveyor. Consequences of the flow velocity being too high or having too high a momentum include, particle attrition, dust generation, chute wear and excessive noise. Conversely, if the flow velocity is too low, stagnation zones could develop, resulting in issues such as spillage or chute blockage. Transfer chutes are generally of two main designs, “hood and spoon” type chutes and rock boxes for more heavy duty applications. Various methods can be employed to determine the velocity of the flow stream; experimental analysis, continuum-based methods and discrete element method (DEM) simulations. The continuum and DEM based analysis of the particle flow at each of the individual zones of the conveyor transfer should be able to be combined to predict the overall particle behaviour and result in comparisons with the experimental equivalents. NOTATION B average width of stream through transfer hood m FD drag force N g gravity m/s2 H0 initial height of stream at impact with transfer hood m K constant of integration - Kv pressure ratio - L length m ms material feed rate tph N normal force N N number of particles - Qm material feed rate tph R transfer hood radius m Vb belt speed m/s v stream velocity m/s v0 initial stream velocity m/s Vave average particle velocity around hood m/s Vmax maximum particle velocity around hood m/s Vmin minimum particle velocity around hood m/s Δm mass element kg θ angular position around spoon (measured from horizontal) º
1
θ0 initial angular position of material impact with spoon º μe equivalent friction - μw coefficient of wall friction - Φ initial angle of spoon with horizontal º 1. PARTICLE CHARACTERISATION As with most bulk solid applications, the accurate determination of particle characteristics is vital in the design process. In terms of the application being presented in this paper, the bench scale data will be used both in the numerical chute flow analysis and discrete element modelling sections of the research. The test material chosen for the experimental test program was polyethylene pellets. The particle properties are listed in Table 1.
Loose-poured bulk density 514.5 kg/m3 Particle density 919.2 kg/m3 Equivalent volume diameter (based on 50 particles) 4.65 mm
Particle sphericity 0.873 Particle size range (sieve) 2.36 – 4.75 mm Particle size distribution (4.00 – 4.75 mm) 85.37 % Wall friction angle (3mm smooth Aerobelt) 25.7 º Wall friction angle (6mm acrylic) 19.1 º Wall friction angle (Polystone) 15.75 º Instantaneous yield loci (IYL) 44 º Coefficient of restitution (average) 0.650 Terminal velocity (based on sphericity) 6.675 m/s
Table 1 Particle properties of polyethylene pellets
2. DISCRETE ELEMENT MODELLING Using discrete element modelling (DEM) to simulate particle flow behaviour has become a more widely accepted method in recent years, however there is still a general lack of detailed validation occurring. Accurate calibration of the simulation package is a must, as without this, there can be no confidence that the outputs generated are accurate representations of that which is occurring in reality. To overcome this uncertainty, it is highly recommended that a series of DEM simulations be completed and then corresponding bench scale experimental tests performed as validation. The Chute MavenTM discrete element software has been used for this research. Three dimensional CAD models are first imported into the software after which the particle properties can be set, including; particle size, particle density, coefficient of restitution, particle/particle friction, flow rate and particle restrain. System geometry parameters such as; belt speed, particle/belt friction, particle/chute friction can also be set. These particle and geometric properties are generally determined based on bench scale tests as previously detailed in section 1. An injection box is created where the particles are generated during the simulation, based on the material feed rate. Particle restrain is a measure of the degree of particle rotation allowed. A value of 0% restrain indicates that all particles are free to rotate whereas a value of 100% indicates that all particles must slide. A percentage value between these two limits will result in a combination of both rolling and sliding. This parameter is one of the most important in the Chute MavenTM package, having the most impact on the simulation results, thus requires calibration based on experimental comparisons, detailed below. It should also be noted that Chute MavenTM can only simulate spherical particles, meaning simulation results could have slight variations to the experimental equivalents due to particle shape effects.
2
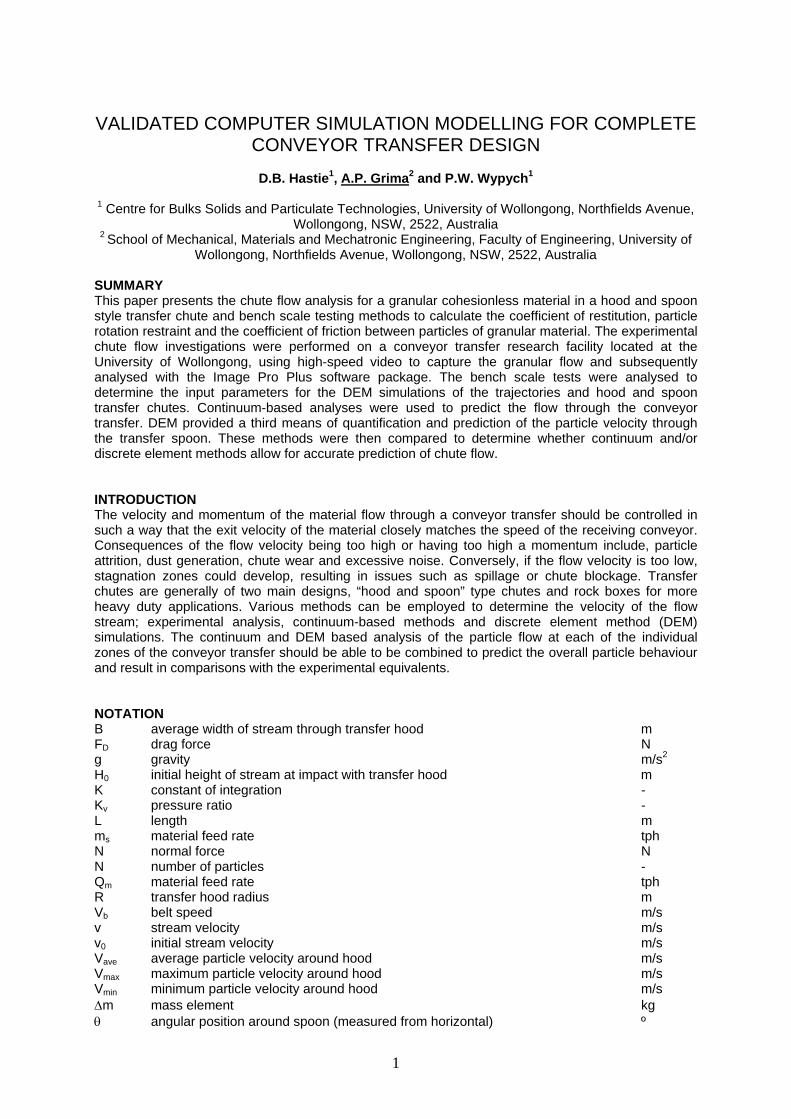
2.1 Validation Of Bulk Material Properties Using Discrete Element Modelling Before accurate chute flow simulations could be performed, a range of small scale static and dynamic validations were undertaken to calibrate the Chute MavenTM discrete element modelling package for the material being tested. 2.1.1 Slump model An experimental slump test was developed (Kamaras, 2007) to determine the particle restrain of the test material on a section of smooth conveyor belt under static conditions. An acrylic tube (NB 64mm, L=184mm) was placed on the conveyor belt and filled with material. Using a high speed camera the formation of the heap was recorded while the acrylic tube was slowly lifted from the belt surface. A representative outcome is shown in Figure 1.
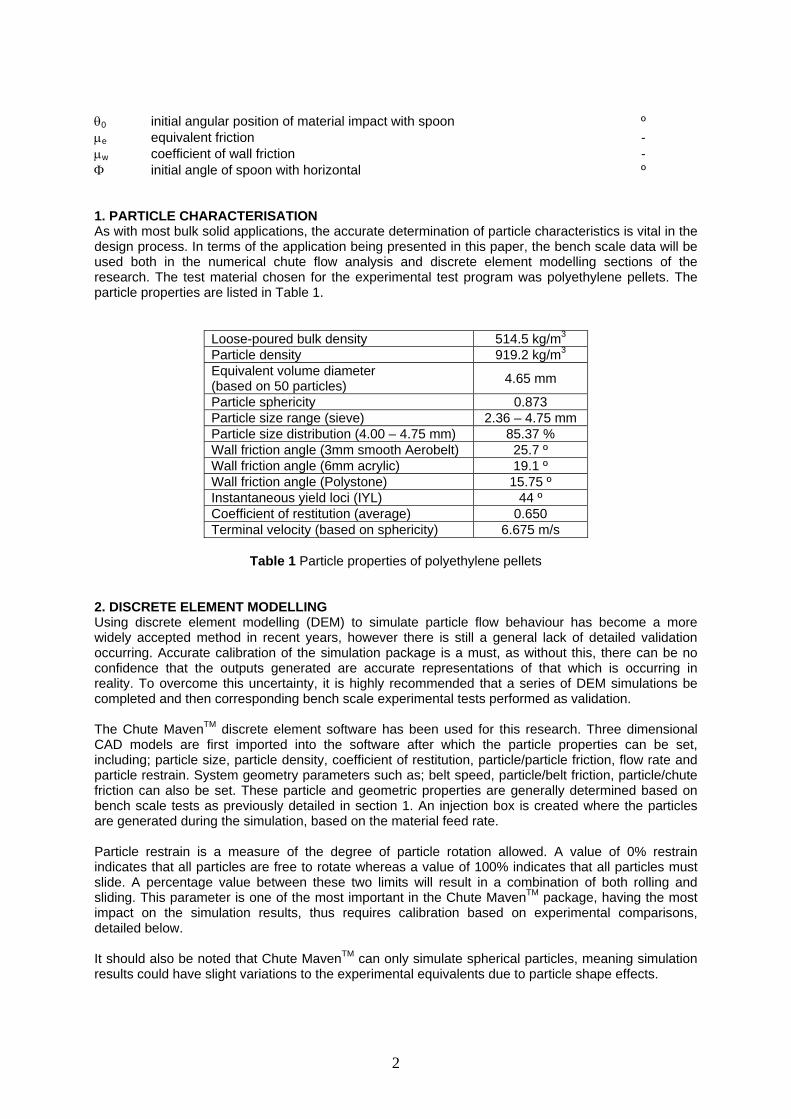
Figure 1 The results of an experimental slump test A three dimensional CAD model of the acrylic tube was produced, comprising 23 ring cells and imported into Chute MavenTM. Each of these cells can be removed, simulating the lifting of the tube. Two simulations were performed, for 0% and 100% restrain. By interpolating the experimental results within the DEM results, based on heap diameter, heap height and time to form the heap, a percentage restrain was obtained for each of the three measured quantities and an overall particle restrain of 63% for the slump test was determined. A further DEM simulation was then performed with this restrain and compared to the experimental equivalent, Figure 2. The compared results showed an averaged error of 8.5%.
(a)
(b)
Figure 2 Comparison of (a) experimental and (b) DEM slump test with restrain = 63%
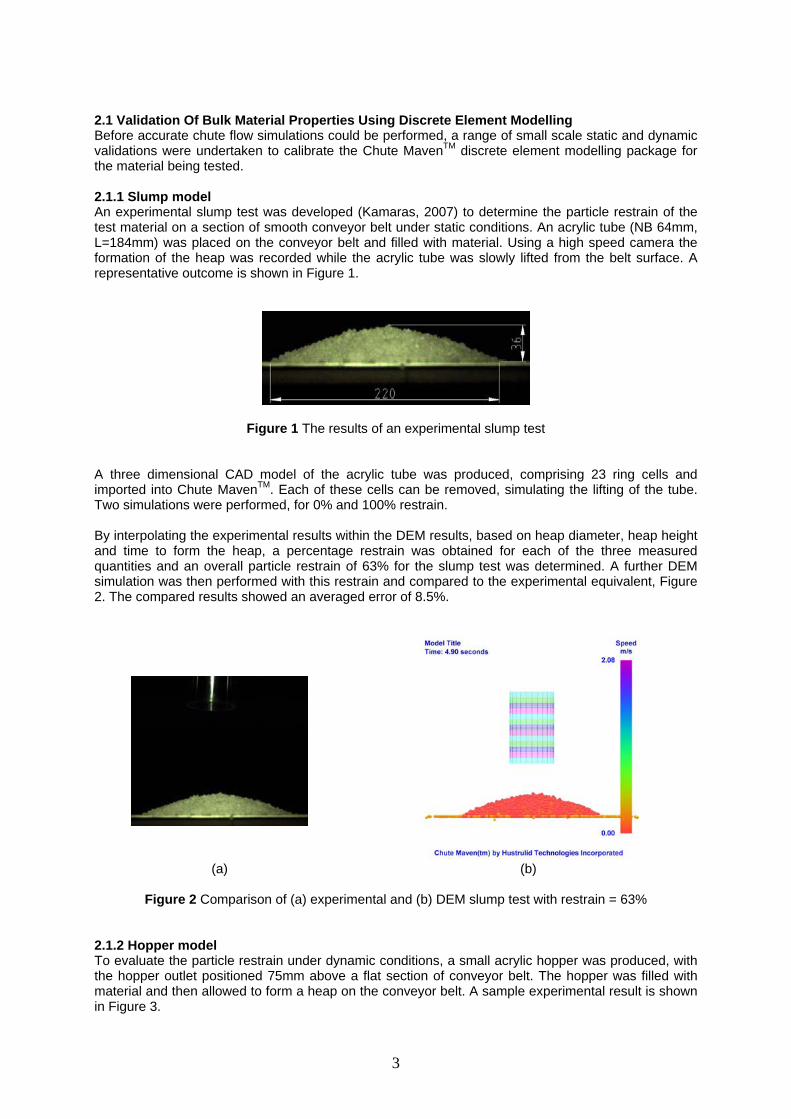
2.1.2 Hopper model To evaluate the particle restrain under dynamic conditions, a small acrylic hopper was produced, with the hopper outlet positioned 75mm above a flat section of conveyor belt. The hopper was filled with material and then allowed to form a heap on the conveyor belt. A sample experimental result is shown in Figure 3.
3
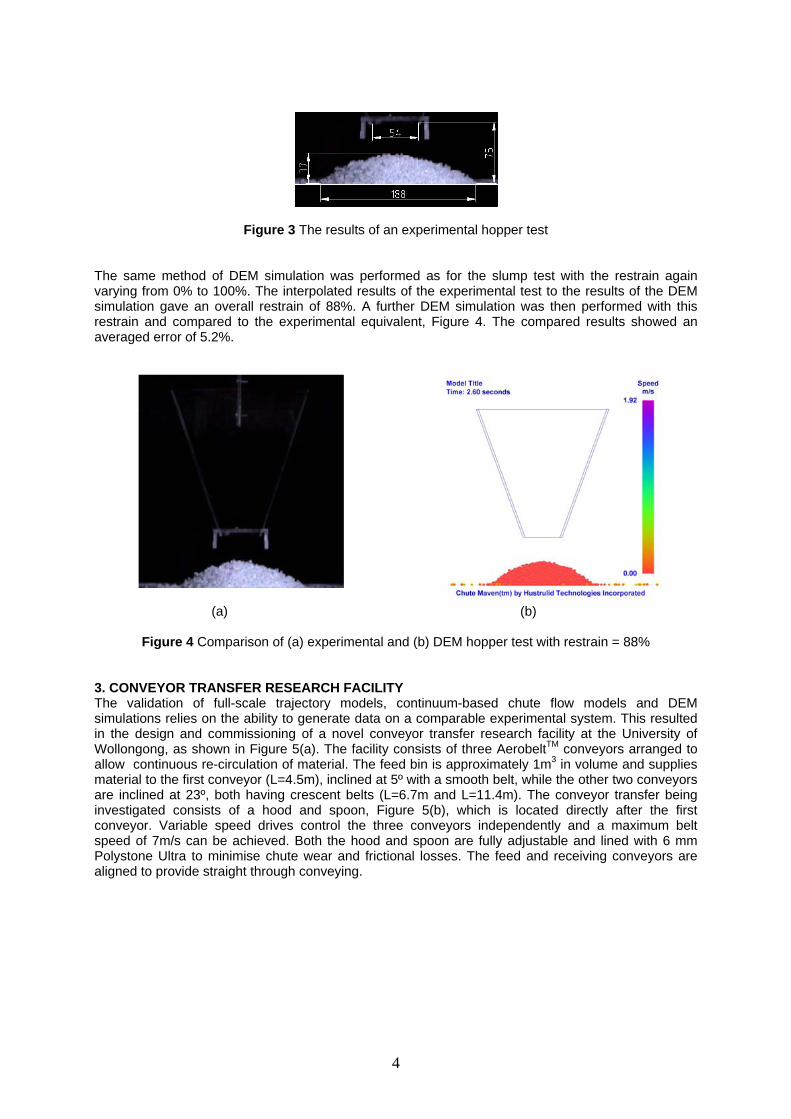
Figure 3 The results of an experimental hopper test The same method of DEM simulation was performed as for the slump test with the restrain again varying from 0% to 100%. The interpolated results of the experimental test to the results of the DEM simulation gave an overall restrain of 88%. A further DEM simulation was then performed with this restrain and compared to the experimental equivalent, Figure 4. The compared results showed an averaged error of 5.2%.
(a)
(b)
Figure 4 Comparison of (a) experimental and (b) DEM hopper test with restrain = 88% 3. CONVEYOR TRANSFER RESEARCH FACILITY The validation of full-scale trajectory models, continuum-based chute flow models and DEM simulations relies on the ability to generate data on a comparable experimental system. This resulted in the design and commissioning of a novel conveyor transfer research facility at the University of Wollongong, as shown in Figure 5(a). The facility consists of three AerobeltTM conveyors arranged to allow continuous re-circulation of material. The feed bin is approximately 1m3 in volume and supplies material to the first conveyor (L=4.5m), inclined at 5º with a smooth belt, while the other two conveyors are inclined at 23º, both having crescent belts (L=6.7m and L=11.4m). The conveyor transfer being investigated consists of a hood and spoon, Figure 5(b), which is located directly after the first conveyor. Variable speed drives control the three conveyors independently and a maximum belt speed of 7m/s can be achieved. Both the hood and spoon are fully adjustable and lined with 6 mm Polystone Ultra to minimise chute wear and frictional losses. The feed and receiving conveyors are aligned to provide straight through conveying.
4
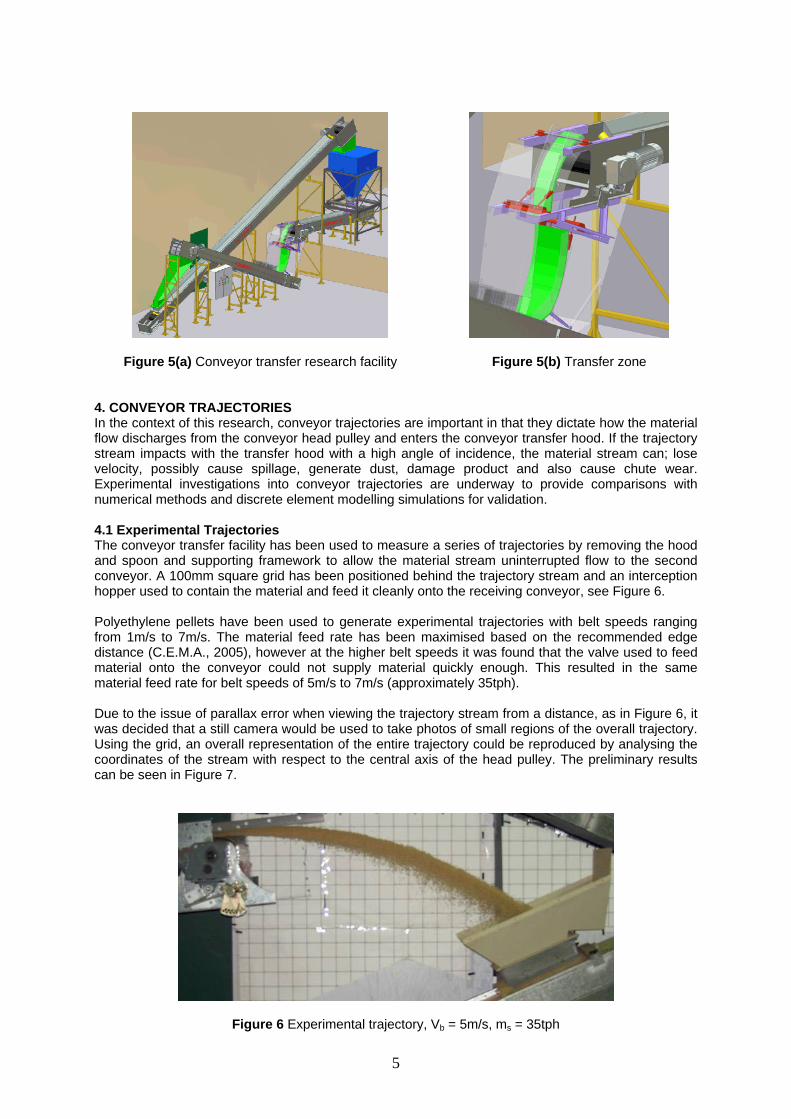
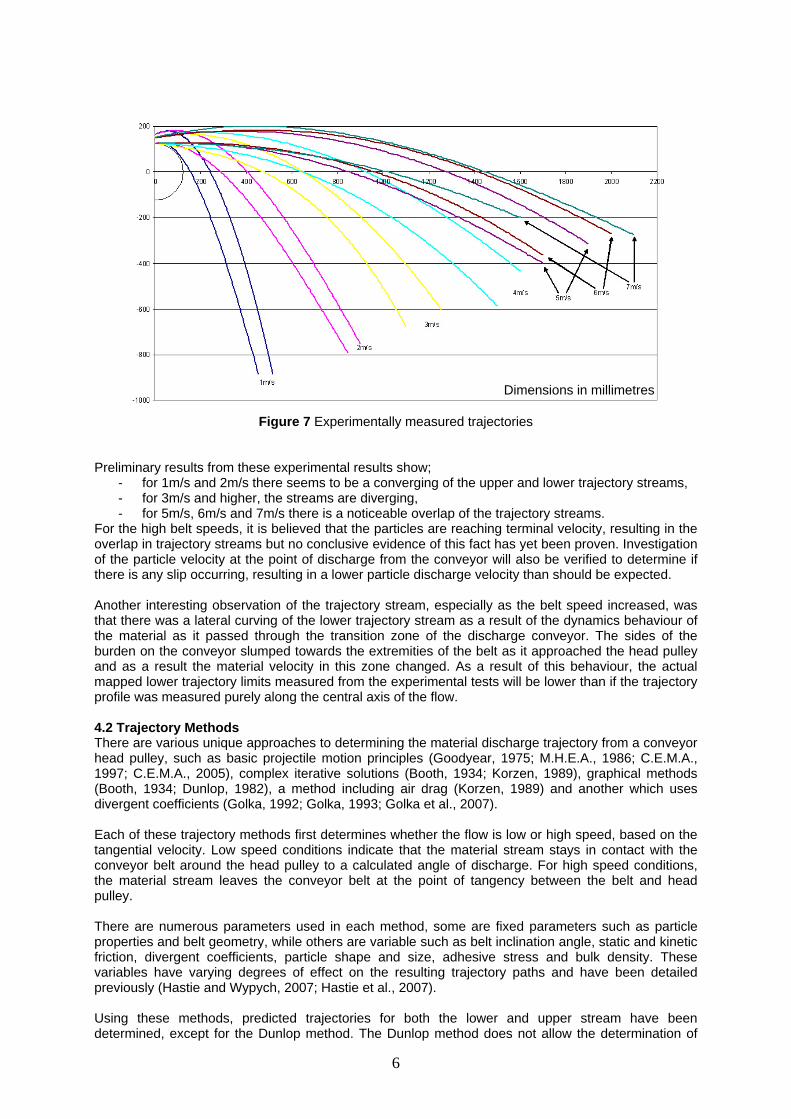
Figure 5(a) Conveyor transfer research facility Figure 5(b) Transfer zone 4. CONVEYOR TRAJECTORIES In the context of this research, conveyor trajectories are important in that they dictate how the material flow discharges from the conveyor head pulley and enters the conveyor transfer hood. If the trajectory stream impacts with the transfer hood with a high angle of incidence, the material stream can; lose velocity, possibly cause spillage, generate dust, damage product and also cause chute wear. Experimental investigations into conveyor trajectories are underway to provide comparisons with numerical methods and discrete element modelling simulations for validation. 4.1 Experimental Trajectories The conveyor transfer facility has been used to measure a series of trajectories by removing the hood and spoon and supporting framework to allow the material stream uninterrupted flow to the second conveyor. A 100mm square grid has been positioned behind the trajectory stream and an interception hopper used to contain the material and feed it cleanly onto the receiving conveyor, see Figure 6. Polyethylene pellets have been used to generate experimental trajectories with belt speeds ranging from 1m/s to 7m/s. The material feed rate has been maximised based on the recommended edge distance (C.E.M.A., 2005), however at the higher belt speeds it was found that the valve used to feed material onto the conveyor could not supply material quickly enough. This resulted in the same material feed rate for belt speeds of 5m/s to 7m/s (approximately 35tph). Due to the issue of parallax error when viewing the trajectory stream from a distance, as in Figure 6, it was decided that a still camera would be used to take photos of small regions of the overall trajectory. Using the grid, an overall representation of the entire trajectory could be reproduced by analysing the coordinates of the stream with respect to the central axis of the head pulley. The preliminary results can be seen in Figure 7.
Figure 6 Experimental trajectory, Vb = 5m/s, ms = 35tph
5
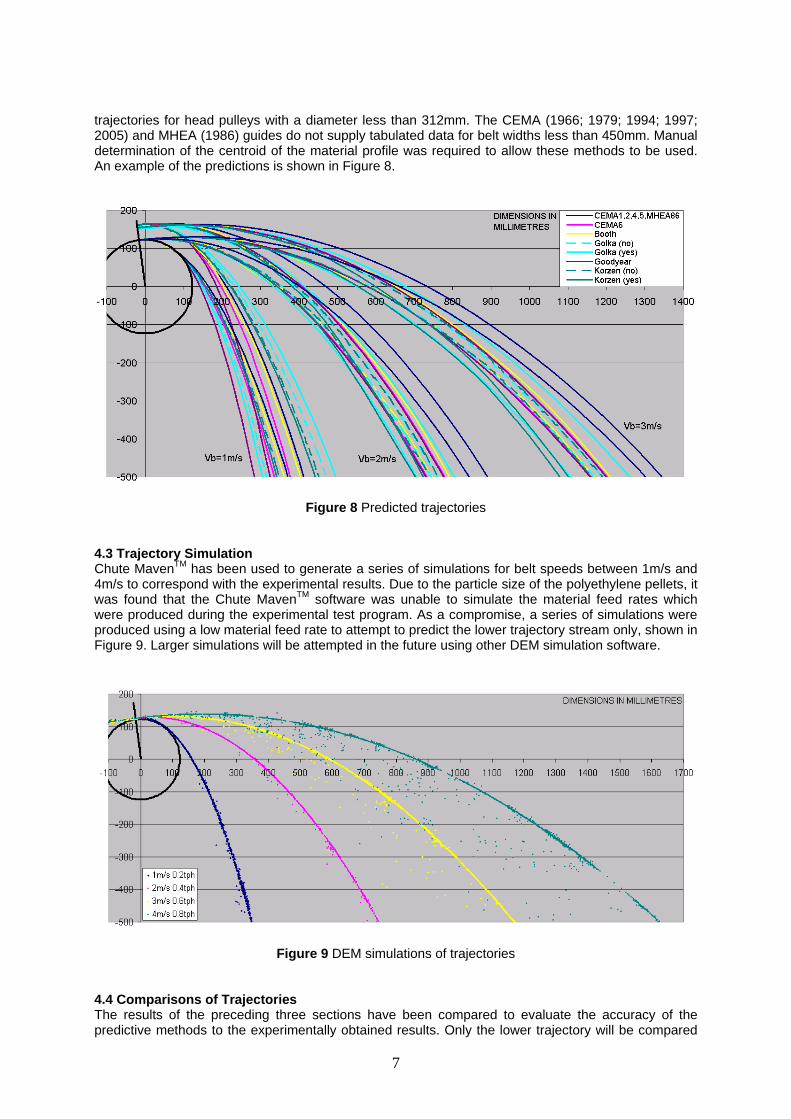
Dimensions in millimetres
Figure 7 Experimentally measured trajectories Preliminary results from these experimental results show;
- for 1m/s and 2m/s there seems to be a converging of the upper and lower trajectory streams, - for 3m/s and higher, the streams are diverging, - for 5m/s, 6m/s and 7m/s there is a noticeable overlap of the trajectory streams.
For the high belt speeds, it is believed that the particles are reaching terminal velocity, resulting in the overlap in trajectory streams but no conclusive evidence of this fact has yet been proven. Investigation of the particle velocity at the point of discharge from the conveyor will also be verified to determine if there is any slip occurring, resulting in a lower particle discharge velocity than should be expected. Another interesting observation of the trajectory stream, especially as the belt speed increased, was that there was a lateral curving of the lower trajectory stream as a result of the dynamics behaviour of the material as it passed through the transition zone of the discharge conveyor. The sides of the burden on the conveyor slumped towards the extremities of the belt as it approached the head pulley and as a result the material velocity in this zone changed. As a result of this behaviour, the actual mapped lower trajectory limits measured from the experimental tests will be lower than if the trajectory profile was measured purely along the central axis of the flow. 4.2 Trajectory Methods There are various unique approaches to determining the material discharge trajectory from a conveyor head pulley, such as basic projectile motion principles (Goodyear, 1975; M.H.E.A., 1986; C.E.M.A., 1997; C.E.M.A., 2005), complex iterative solutions (Booth, 1934; Korzen, 1989), graphical methods (Booth, 1934; Dunlop, 1982), a method including air drag (Korzen, 1989) and another which uses divergent coefficients (Golka, 1992; Golka, 1993; Golka et al., 2007). Each of these trajectory methods first determines whether the flow is low or high speed, based on the tangential velocity. Low speed conditions indicate that the material stream stays in contact with the conveyor belt around the head pulley to a calculated angle of discharge. For high speed conditions, the material stream leaves the conveyor belt at the point of tangency between the belt and head pulley. There are numerous parameters used in each method, some are fixed parameters such as particle properties and belt geometry, while others are variable such as belt inclination angle, static and kinetic friction, divergent coefficients, particle shape and size, adhesive stress and bulk density. These variables have varying degrees of effect on the resulting trajectory paths and have been detailed previously (Hastie and Wypych, 2007; Hastie et al., 2007). Using these methods, predicted trajectories for both the lower and upper stream have been determined, except for the Dunlop method. The Dunlop method does not allow the determination of
6
trajectories for head pulleys with a diameter less than 312mm. The CEMA (1966; 1979; 1994; 1997; 2005) and MHEA (1986) guides do not supply tabulated data for belt widths less than 450mm. Manual determination of the centroid of the material profile was required to allow these methods to be used. An example of the predictions is shown in Figure 8.
Figure 8 Predicted trajectories 4.3 Trajectory Simulation Chute MavenTM has been used to generate a series of simulations for belt speeds between 1m/s and 4m/s to correspond with the experimental results. Due to the particle size of the polyethylene pellets, it was found that the Chute MavenTM software was unable to simulate the material feed rates which were produced during the experimental test program. As a compromise, a series of simulations were produced using a low material feed rate to attempt to predict the lower trajectory stream only, shown in Figure 9. Larger simulations will be attempted in the future using other DEM simulation software.
Figure 9 DEM simulations of trajectories 4.4 Comparisons of Trajectories The results of the preceding three sections have been compared to evaluate the accuracy of the predictive methods to the experimentally obtained results. Only the lower trajectory will be compared
7
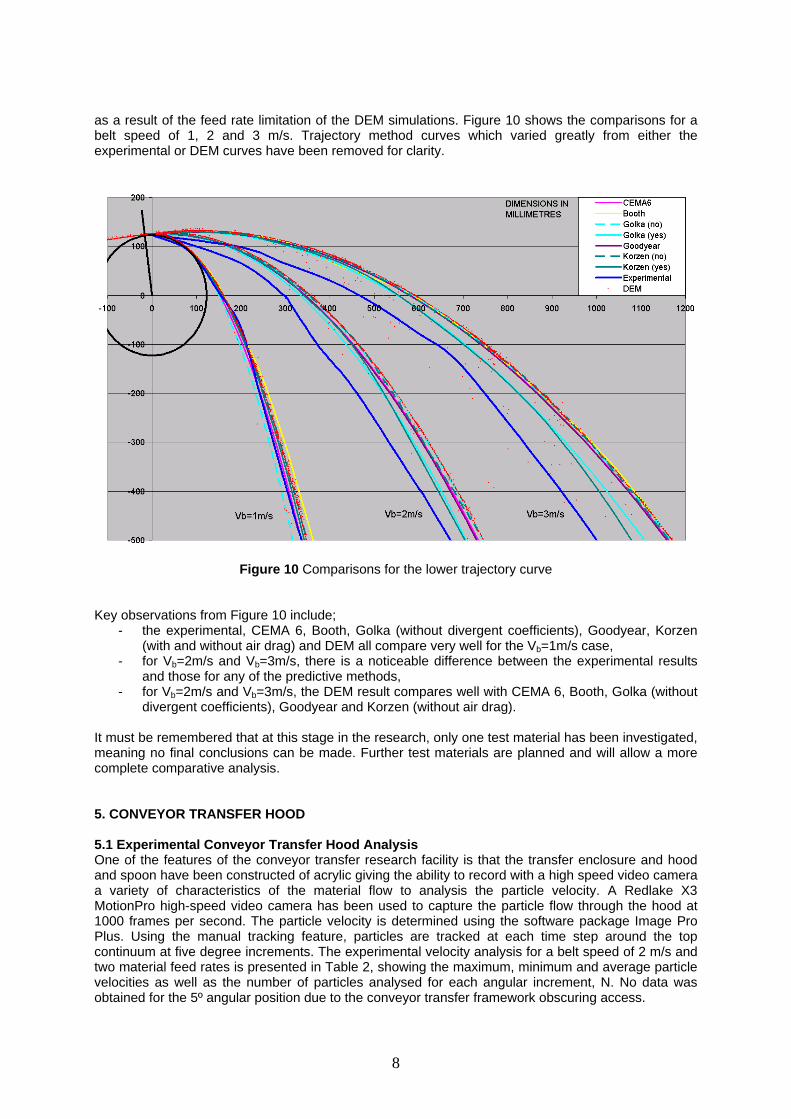
as a result of the feed rate limitation of the DEM simulations. Figure 10 shows the comparisons for a belt speed of 1, 2 and 3 m/s. Trajectory method curves which varied greatly from either the experimental or DEM curves have been removed for clarity.
Figure 10 Comparisons for the lower trajectory curve Key observations from Figure 10 include;
- the experimental, CEMA 6, Booth, Golka (without divergent coefficients), Goodyear, Korzen (with and without air drag) and DEM all compare very well for the Vb=1m/s case,
- for Vb=2m/s and Vb=3m/s, there is a noticeable difference between the experimental results and those for any of the predictive methods,
- for Vb=2m/s and Vb=3m/s, the DEM result compares well with CEMA 6, Booth, Golka (without divergent coefficients), Goodyear and Korzen (without air drag).
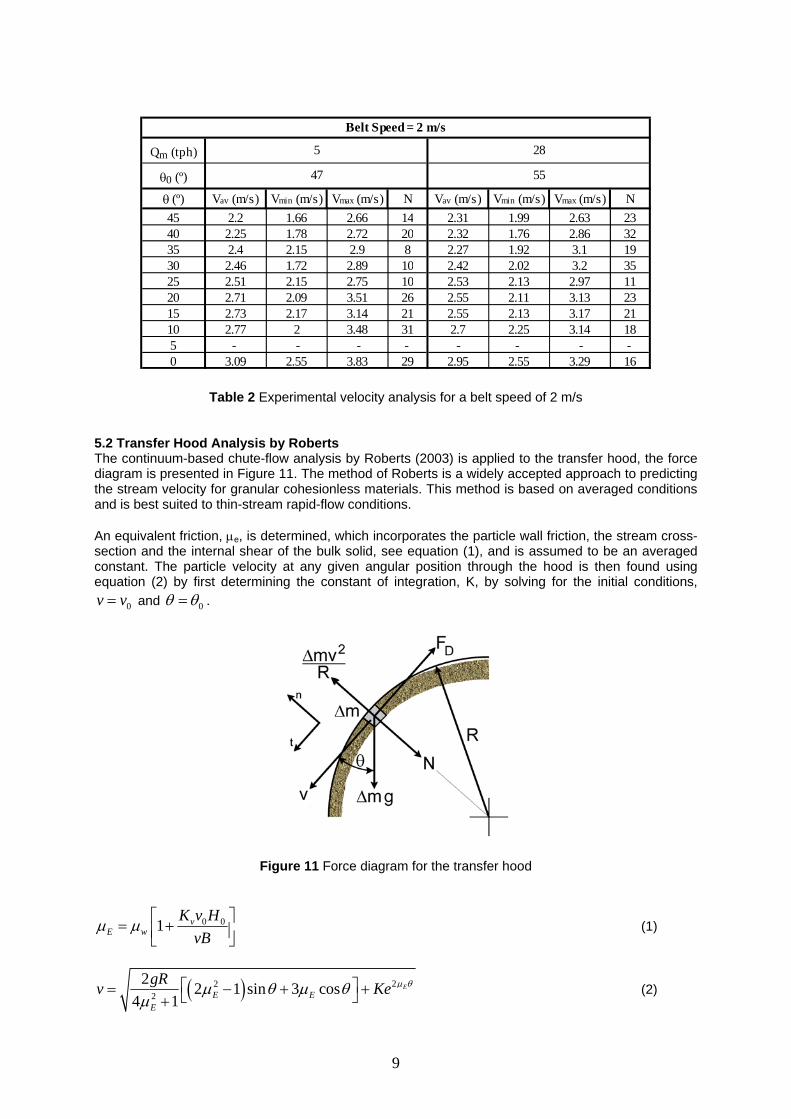
It must be remembered that at this stage in the research, only one test material has been investigated, meaning no final conclusions can be made. Further test materials are planned and will allow a more complete comparative analysis. 5. CONVEYOR TRANSFER HOOD 5.1 Experimental Conveyor Transfer Hood Analysis One of the features of the conveyor transfer research facility is that the transfer enclosure and hood and spoon have been constructed of acrylic giving the ability to record with a high speed video camera a variety of characteristics of the material flow to analysis the particle velocity. A Redlake X3 MotionPro high-speed video camera has been used to capture the particle flow through the hood at 1000 frames per second. The particle velocity is determined using the software package Image Pro Plus. Using the manual tracking feature, particles are tracked at each time step around the top continuum at five degree increments. The experimental velocity analysis for a belt speed of 2 m/s and two material feed rates is presented in Table 2, showing the maximum, minimum and average particle velocities as well as the number of particles analysed for each angular increment, N. No data was obtained for the 5º angular position due to the conveyor transfer framework obscuring access.
8
Qm (tph)
θ0 (º)
θ (º) Vav (m/s) Vmin (m/s) Vmax (m/s) N Vav (m/s) Vmin (m/s) Vmax (m/s) N45 2.2 1.66 2.66 14 2.31 1.99 2.63 2340 2.25 1.78 2.72 20 2.32 1.76 2.86 3235 2.4 2.15 2.9 8 2.27 1.92 3.1 1930 2.46 1.72 2.89 10 2.42 2.02 3.2 3525 2.51 2.15 2.75 10 2.53 2.13 2.97 1120 2.71 2.09 3.51 26 2.55 2.11 3.13 2315 2.73 2.17 3.14 21 2.55 2.13 3.17 2110 2.77 2 3.48 31 2.7 2.25 3.14 185 - - - - - - - - 0 3.09 2.55 3.83 29 2.95 2.55 3.29 16
Belt Speed = 2 m/s
5 28
47 55
Table 2 Experimental velocity analysis for a belt speed of 2 m/s
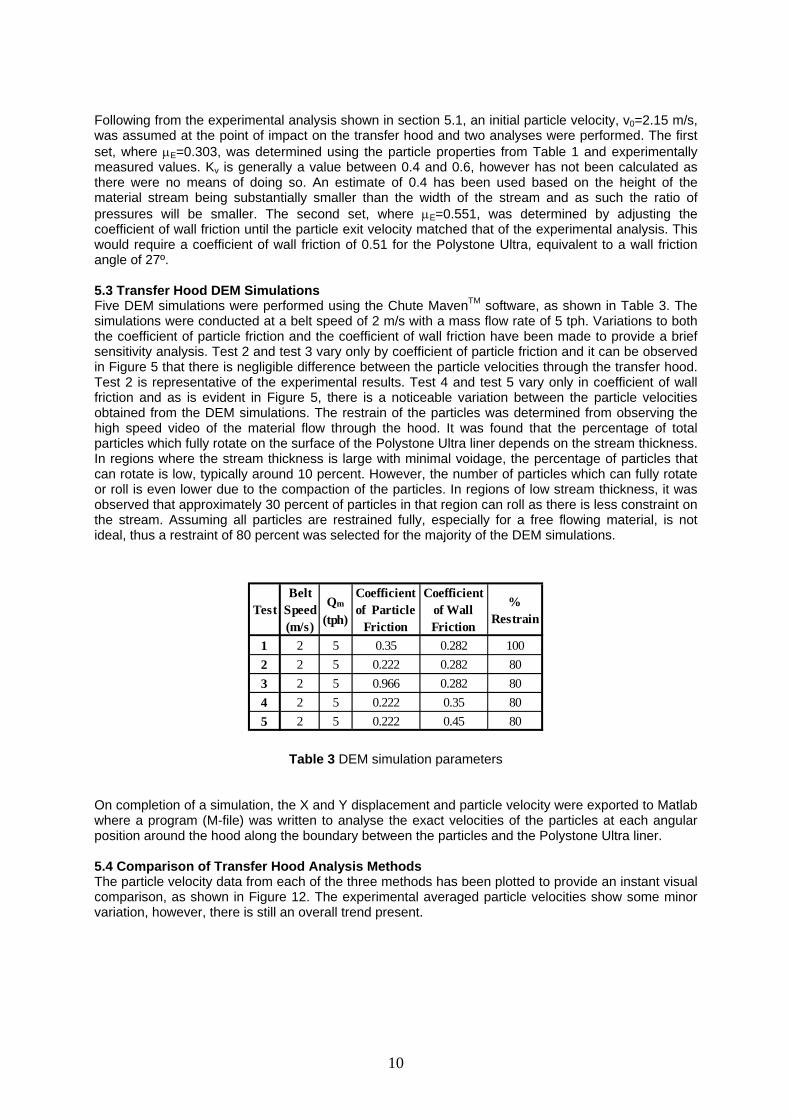
5.2 Transfer Hood Analysis by Roberts The continuum-based chute-flow analysis by Roberts (2003) is applied to the transfer hood, the force diagram is presented in Figure 11. The method of Roberts is a widely accepted approach to predicting the stream velocity for granular cohesionless materials. This method is based on averaged conditions and is best suited to thin-stream rapid-flow conditions. An equivalent friction, μe, is determined, which incorporates the particle wall friction, the stream cross-section and the internal shear of the bulk solid, see equation (1), and is assumed to be an averaged constant. The particle velocity at any given angular position through the hood is then found using equation (2) by first determining the constant of integration, K, by solving for the initial conditions,
and 0v v= 0θ θ= .
Figure 11 Force diagram for the transfer hood
0 01 vE w
K v HvB
μ μ ⎡ ⎤= +⎢⎣ ⎦⎥ (1)
( ) 222
2 2 1 sin 3 cos4 1
EE E
E
gRv Ke μ θμ θ μ θμ
⎡= − + +⎣+⎤⎦ (2)
9
Following from the experimental analysis shown in section 5.1, an initial particle velocity, v0=2.15 m/s, was assumed at the point of impact on the transfer hood and two analyses were performed. The first set, where μE=0.303, was determined using the particle properties from Table 1 and experimentally measured values. Kv is generally a value between 0.4 and 0.6, however has not been calculated as there were no means of doing so. An estimate of 0.4 has been used based on the height of the material stream being substantially smaller than the width of the stream and as such the ratio of pressures will be smaller. The second set, where μE=0.551, was determined by adjusting the coefficient of wall friction until the particle exit velocity matched that of the experimental analysis. This would require a coefficient of wall friction of 0.51 for the Polystone Ultra, equivalent to a wall friction angle of 27º. 5.3 Transfer Hood DEM Simulations Five DEM simulations were performed using the Chute MavenTM software, as shown in Table 3. The simulations were conducted at a belt speed of 2 m/s with a mass flow rate of 5 tph. Variations to both the coefficient of particle friction and the coefficient of wall friction have been made to provide a brief sensitivity analysis. Test 2 and test 3 vary only by coefficient of particle friction and it can be observed in Figure 5 that there is negligible difference between the particle velocities through the transfer hood. Test 2 is representative of the experimental results. Test 4 and test 5 vary only in coefficient of wall friction and as is evident in Figure 5, there is a noticeable variation between the particle velocities obtained from the DEM simulations. The restrain of the particles was determined from observing the high speed video of the material flow through the hood. It was found that the percentage of total particles which fully rotate on the surface of the Polystone Ultra liner depends on the stream thickness. In regions where the stream thickness is large with minimal voidage, the percentage of particles that can rotate is low, typically around 10 percent. However, the number of particles which can fully rotate or roll is even lower due to the compaction of the particles. In regions of low stream thickness, it was observed that approximately 30 percent of particles in that region can roll as there is less constraint on the stream. Assuming all particles are restrained fully, especially for a free flowing material, is not ideal, thus a restraint of 80 percent was selected for the majority of the DEM simulations.
TestBelt
Speed (m/s)
Qm
(tph)
Coefficient of Particle
Friction
Coefficient of Wall Friction
% Restrain
1 2 5 0.35 0.282 1002 2 5 0.222 0.282 803 2 5 0.966 0.282 804 2 5 0.222 0.35 805 2 5 0.222 0.45 80
Table 3 DEM simulation parameters
On completion of a simulation, the X and Y displacement and particle velocity were exported to Matlab where a program (M-file) was written to analyse the exact velocities of the particles at each angular position around the hood along the boundary between the particles and the Polystone Ultra liner.
5.4 Comparison of Transfer Hood Analysis Methods The particle velocity data from each of the three methods has been plotted to provide an instant visual comparison, as shown in Figure 12. The experimental averaged particle velocities show some minor variation, however, there is still an overall trend present.
10
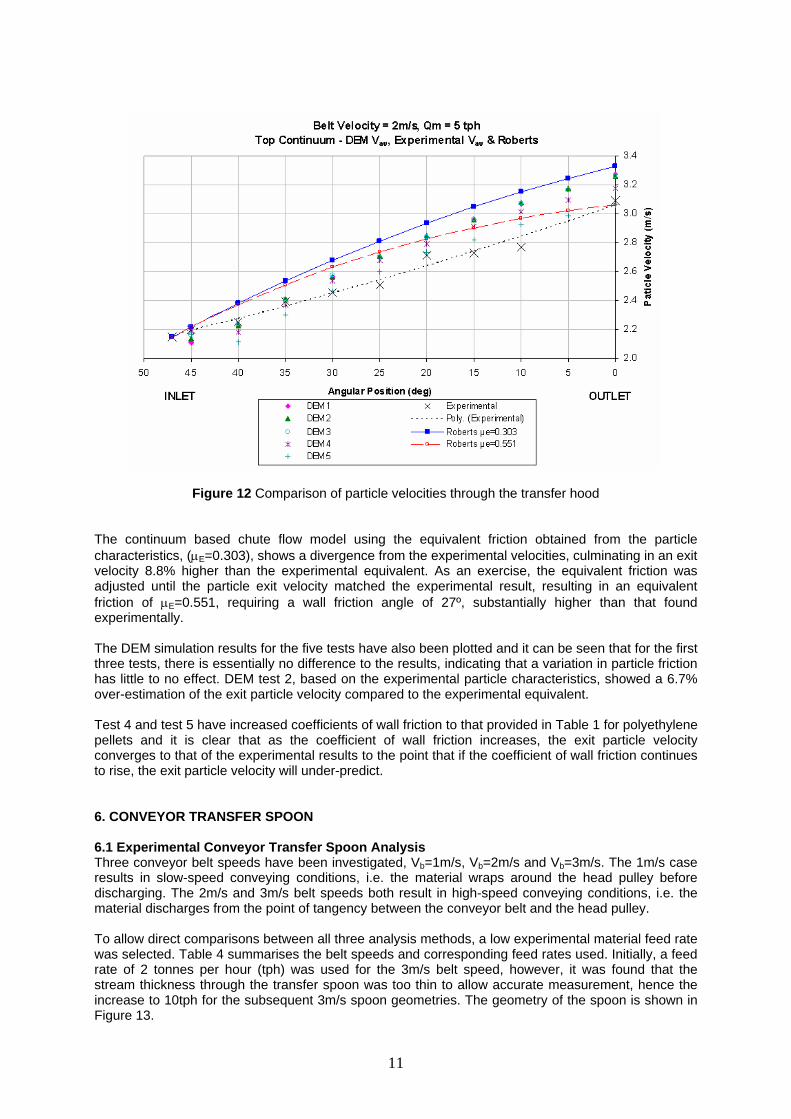
Figure 12 Comparison of particle velocities through the transfer hood
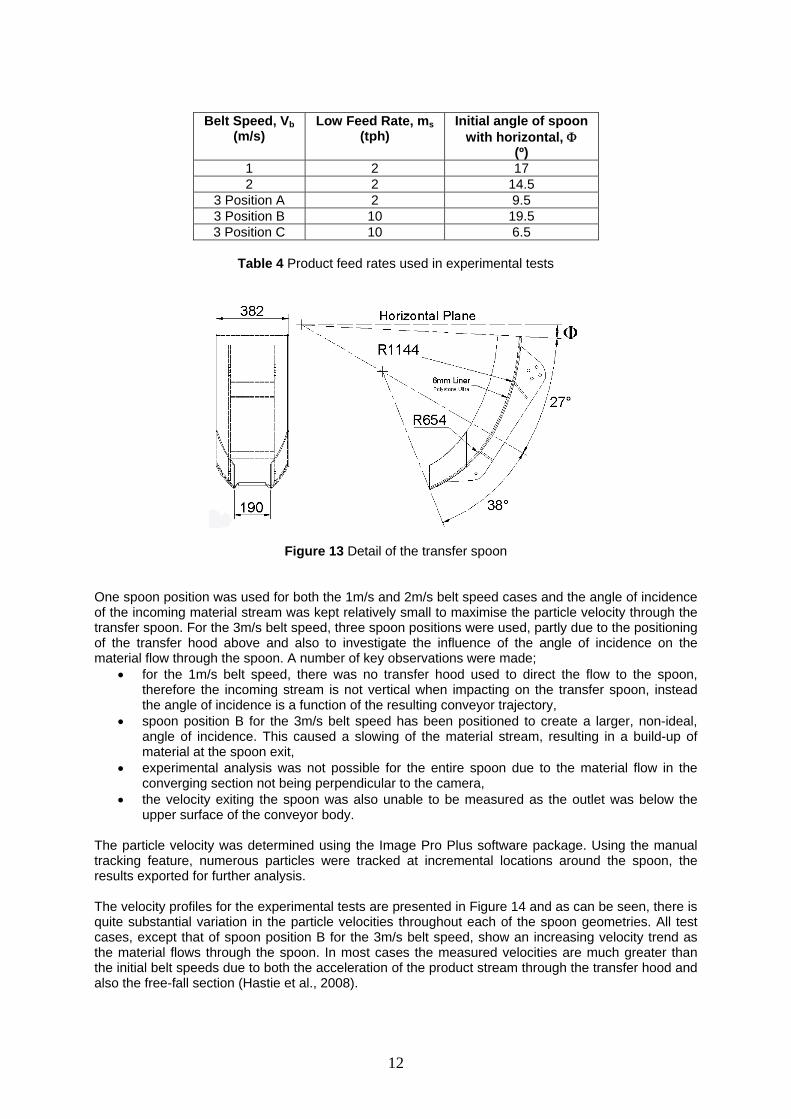
The continuum based chute flow model using the equivalent friction obtained from the particle characteristics, (μE=0.303), shows a divergence from the experimental velocities, culminating in an exit velocity 8.8% higher than the experimental equivalent. As an exercise, the equivalent friction was adjusted until the particle exit velocity matched the experimental result, resulting in an equivalent friction of μE=0.551, requiring a wall friction angle of 27º, substantially higher than that found experimentally. The DEM simulation results for the five tests have also been plotted and it can be seen that for the first three tests, there is essentially no difference to the results, indicating that a variation in particle friction has little to no effect. DEM test 2, based on the experimental particle characteristics, showed a 6.7% over-estimation of the exit particle velocity compared to the experimental equivalent. Test 4 and test 5 have increased coefficients of wall friction to that provided in Table 1 for polyethylene pellets and it is clear that as the coefficient of wall friction increases, the exit particle velocity converges to that of the experimental results to the point that if the coefficient of wall friction continues to rise, the exit particle velocity will under-predict. 6. CONVEYOR TRANSFER SPOON 6.1 Experimental Conveyor Transfer Spoon Analysis Three conveyor belt speeds have been investigated, Vb=1m/s, Vb=2m/s and Vb=3m/s. The 1m/s case results in slow-speed conveying conditions, i.e. the material wraps around the head pulley before discharging. The 2m/s and 3m/s belt speeds both result in high-speed conveying conditions, i.e. the material discharges from the point of tangency between the conveyor belt and the head pulley. To allow direct comparisons between all three analysis methods, a low experimental material feed rate was selected. Table 4 summarises the belt speeds and corresponding feed rates used. Initially, a feed rate of 2 tonnes per hour (tph) was used for the 3m/s belt speed, however, it was found that the stream thickness through the transfer spoon was too thin to allow accurate measurement, hence the increase to 10tph for the subsequent 3m/s spoon geometries. The geometry of the spoon is shown in Figure 13.
11
Belt Speed, Vb (m/s)
Low Feed Rate, ms (tph)
Initial angle of spoon with horizontal, Φ
(º) 1 2 17 2 2 14.5
3 Position A 2 9.5 3 Position B 10 19.5 3 Position C 10 6.5
Table 4 Product feed rates used in experimental tests
Figure 13 Detail of the transfer spoon One spoon position was used for both the 1m/s and 2m/s belt speed cases and the angle of incidence of the incoming material stream was kept relatively small to maximise the particle velocity through the transfer spoon. For the 3m/s belt speed, three spoon positions were used, partly due to the positioning of the transfer hood above and also to investigate the influence of the angle of incidence on the material flow through the spoon. A number of key observations were made;
• for the 1m/s belt speed, there was no transfer hood used to direct the flow to the spoon, therefore the incoming stream is not vertical when impacting on the transfer spoon, instead the angle of incidence is a function of the resulting conveyor trajectory,
• spoon position B for the 3m/s belt speed has been positioned to create a larger, non-ideal, angle of incidence. This caused a slowing of the material stream, resulting in a build-up of material at the spoon exit,
• experimental analysis was not possible for the entire spoon due to the material flow in the converging section not being perpendicular to the camera,
• the velocity exiting the spoon was also unable to be measured as the outlet was below the upper surface of the conveyor body.
The particle velocity was determined using the Image Pro Plus software package. Using the manual tracking feature, numerous particles were tracked at incremental locations around the spoon, the results exported for further analysis. The velocity profiles for the experimental tests are presented in Figure 14 and as can be seen, there is quite substantial variation in the particle velocities throughout each of the spoon geometries. All test cases, except that of spoon position B for the 3m/s belt speed, show an increasing velocity trend as the material flows through the spoon. In most cases the measured velocities are much greater than the initial belt speeds due to both the acceleration of the product stream through the transfer hood and also the free-fall section (Hastie et al., 2008).
12
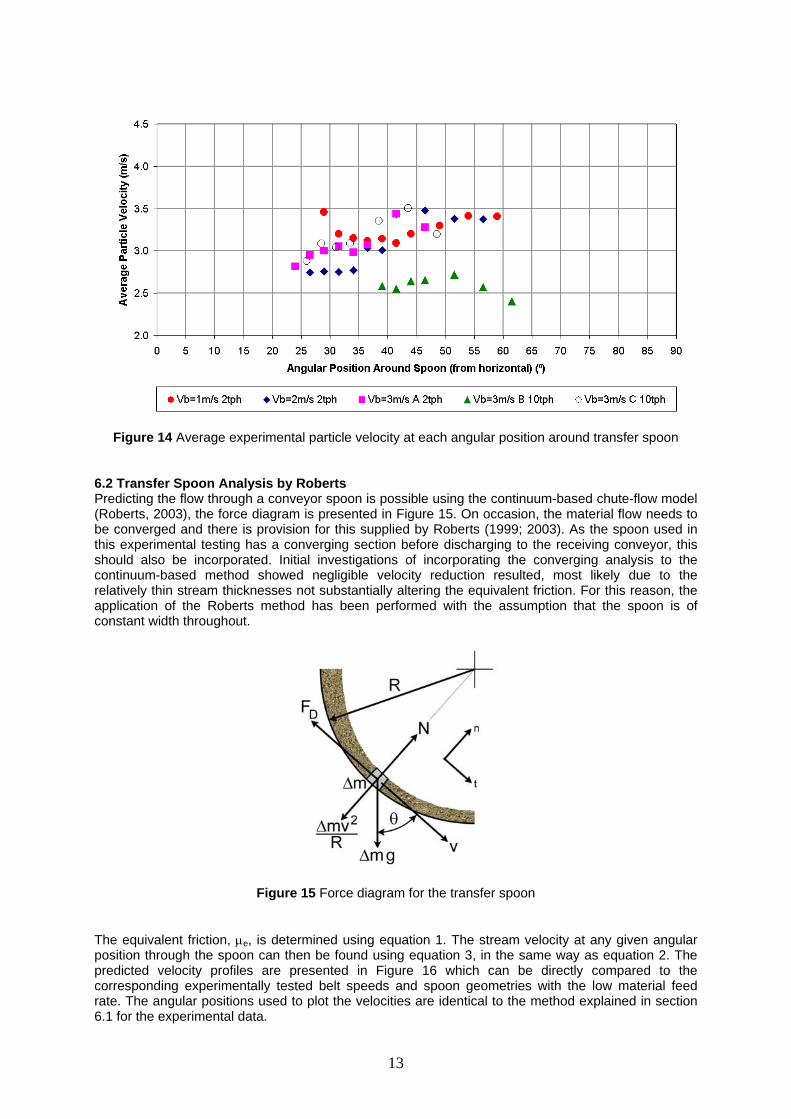
Figure 14 Average experimental particle velocity at each angular position around transfer spoon
6.2 Transfer Spoon Analysis by Roberts Predicting the flow through a conveyor spoon is possible using the continuum-based chute-flow model (Roberts, 2003), the force diagram is presented in Figure 15. On occasion, the material flow needs to be converged and there is provision for this supplied by Roberts (1999; 2003). As the spoon used in this experimental testing has a converging section before discharging to the receiving conveyor, this should also be incorporated. Initial investigations of incorporating the converging analysis to the continuum-based method showed negligible velocity reduction resulted, most likely due to the relatively thin stream thicknesses not substantially altering the equivalent friction. For this reason, the application of the Roberts method has been performed with the assumption that the spoon is of constant width throughout.
Figure 15 Force diagram for the transfer spoon The equivalent friction, μe, is determined using equation 1. The stream velocity at any given angular position through the spoon can then be found using equation 3, in the same way as equation 2. The predicted velocity profiles are presented in Figure 16 which can be directly compared to the corresponding experimentally tested belt speeds and spoon geometries with the low material feed rate. The angular positions used to plot the velocities are identical to the method explained in section 6.1 for the experimental data.
13
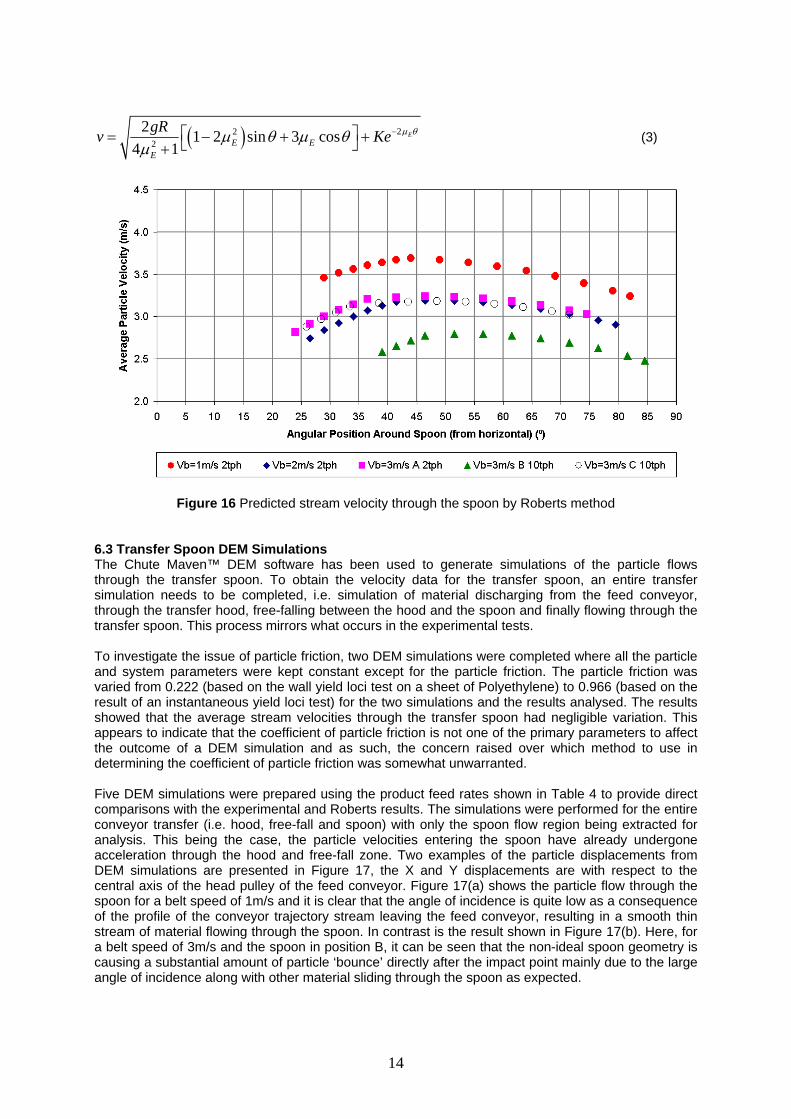
( ) 222
2 1 2 sin 3 cos4 1
EE E
E
gRv Ke μ θμ θ μ θμ
−⎡= − + +⎣+⎤⎦ (3)
Figure 16 Predicted stream velocity through the spoon by Roberts method 6.3 Transfer Spoon DEM Simulations The Chute Maven™ DEM software has been used to generate simulations of the particle flows through the transfer spoon. To obtain the velocity data for the transfer spoon, an entire transfer simulation needs to be completed, i.e. simulation of material discharging from the feed conveyor, through the transfer hood, free-falling between the hood and the spoon and finally flowing through the transfer spoon. This process mirrors what occurs in the experimental tests. To investigate the issue of particle friction, two DEM simulations were completed where all the particle and system parameters were kept constant except for the particle friction. The particle friction was varied from 0.222 (based on the wall yield loci test on a sheet of Polyethylene) to 0.966 (based on the result of an instantaneous yield loci test) for the two simulations and the results analysed. The results showed that the average stream velocities through the transfer spoon had negligible variation. This appears to indicate that the coefficient of particle friction is not one of the primary parameters to affect the outcome of a DEM simulation and as such, the concern raised over which method to use in determining the coefficient of particle friction was somewhat unwarranted. Five DEM simulations were prepared using the product feed rates shown in Table 4 to provide direct comparisons with the experimental and Roberts results. The simulations were performed for the entire conveyor transfer (i.e. hood, free-fall and spoon) with only the spoon flow region being extracted for analysis. This being the case, the particle velocities entering the spoon have already undergone acceleration through the hood and free-fall zone. Two examples of the particle displacements from DEM simulations are presented in Figure 17, the X and Y displacements are with respect to the central axis of the head pulley of the feed conveyor. Figure 17(a) shows the particle flow through the spoon for a belt speed of 1m/s and it is clear that the angle of incidence is quite low as a consequence of the profile of the conveyor trajectory stream leaving the feed conveyor, resulting in a smooth thin stream of material flowing through the spoon. In contrast is the result shown in Figure 17(b). Here, for a belt speed of 3m/s and the spoon in position B, it can be seen that the non-ideal spoon geometry is causing a substantial amount of particle ‘bounce’ directly after the impact point mainly due to the large angle of incidence along with other material sliding through the spoon as expected.
14
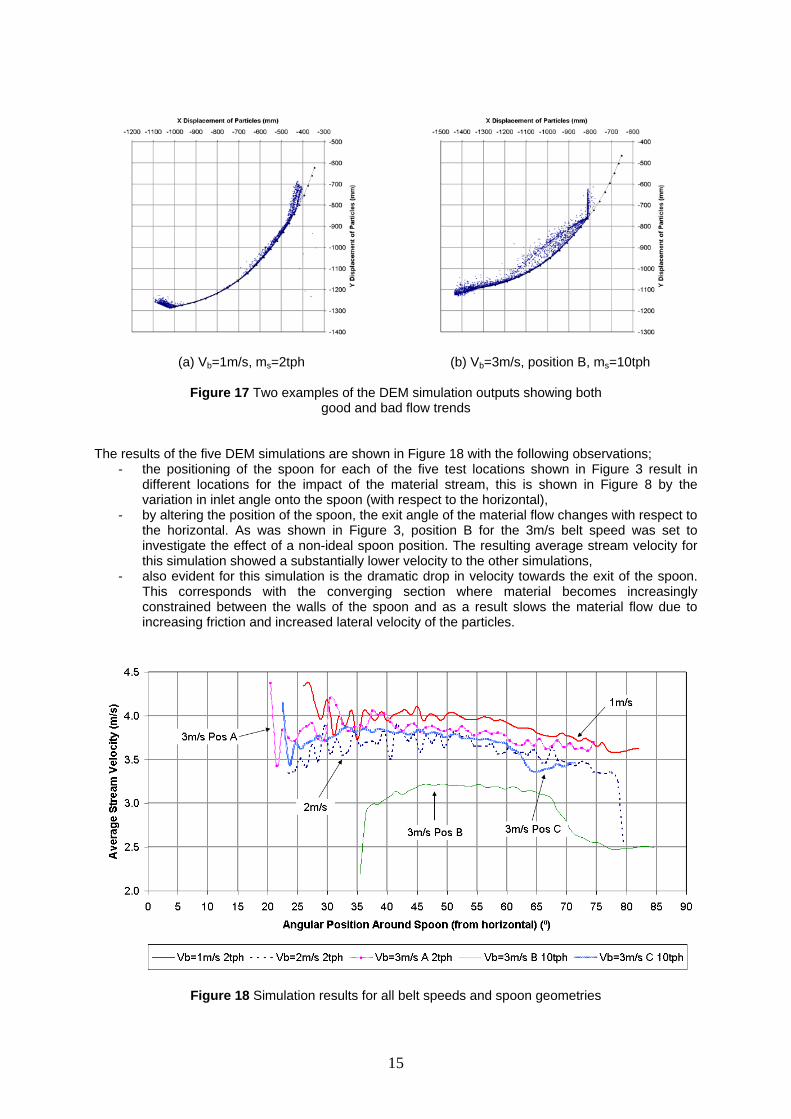
(a) Vb=1m/s, ms=2tph
(b) Vb=3m/s, position B, ms=10tph
Figure 17 Two examples of the DEM simulation outputs showing both good and bad flow trends
The results of the five DEM simulations are shown in Figure 18 with the following observations;
- the positioning of the spoon for each of the five test locations shown in Figure 3 result in different locations for the impact of the material stream, this is shown in Figure 8 by the variation in inlet angle onto the spoon (with respect to the horizontal),
- by altering the position of the spoon, the exit angle of the material flow changes with respect to the horizontal. As was shown in Figure 3, position B for the 3m/s belt speed was set to investigate the effect of a non-ideal spoon position. The resulting average stream velocity for this simulation showed a substantially lower velocity to the other simulations,
- also evident for this simulation is the dramatic drop in velocity towards the exit of the spoon. This corresponds with the converging section where material becomes increasingly constrained between the walls of the spoon and as a result slows the material flow due to increasing friction and increased lateral velocity of the particles.
Figure 18 Simulation results for all belt speeds and spoon geometries
15
6.4 Comparison of Transfer Spoon Analysis Methods At this preliminary stage of the investigations, every attempt has been made to make the comparisons as valid as possible between methods, however there are some points which need to be reiterated;
- the experimental spoon analysis is an extract from the complete transfer analysis (i.e. discharge, hood flow, free-fall and spoon flow),
- the experimental results have only been obtained up to the location on the spoon where the converging section commences. As a result of this, comparisons between the experimental results and those of the Roberts and DEM methods can only be made for this region, whereas comparisons for the entire spoon can be made between the Roberts and DEM methods,
- the Roberts method has been applied to the spoon only using the initial experimental particle velocity of the stream entering the spoon, to allow a direct comparison with the experimental results.,
- the DEM simulations of the spoon are an extract from the complete transfer analysis in the same way that the experimental results were obtained. This means that direct comparisons between the Roberts method and the DEM simulations cannot be made at this point as the initial stream velocity entering the spoon for the DEM simulations has been influenced by the acceleration of the stream through both the hood and free-fall zones, which does not incorporate any aerodynamic effects,
- the DEM simulations all show over-predicted particle velocities compared to the experimental results due to acceleration of the particles in both the hood and free-fall zones.
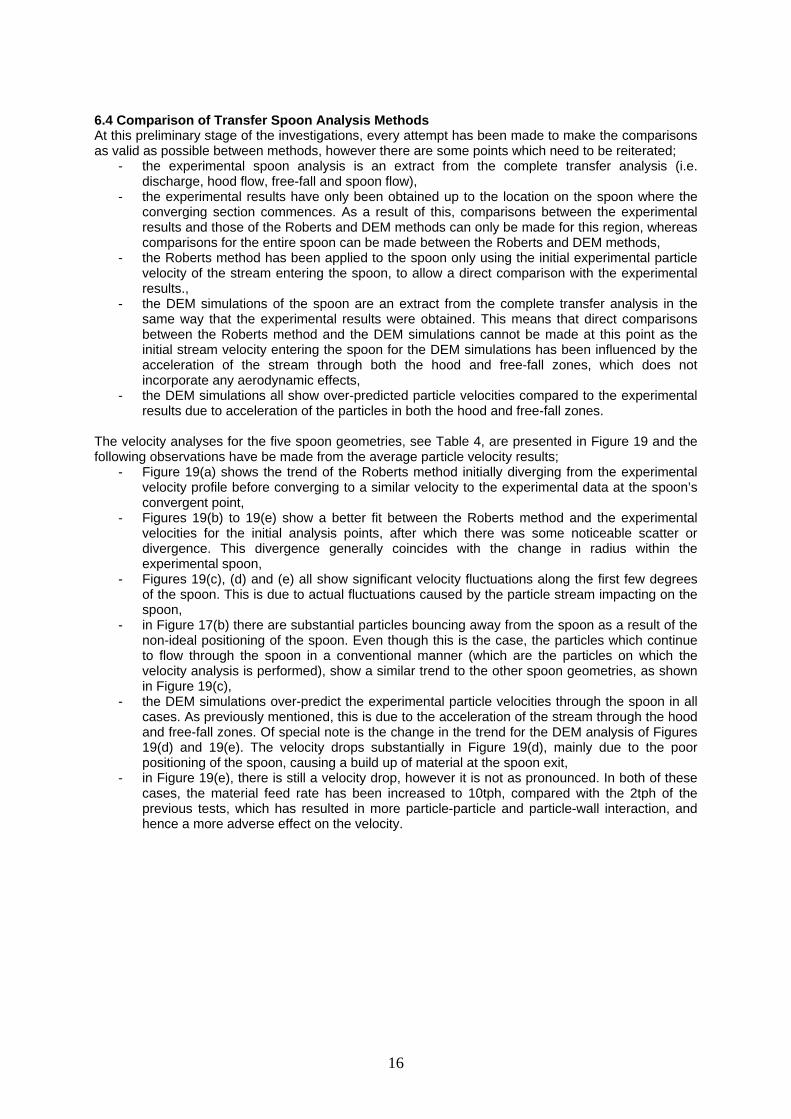
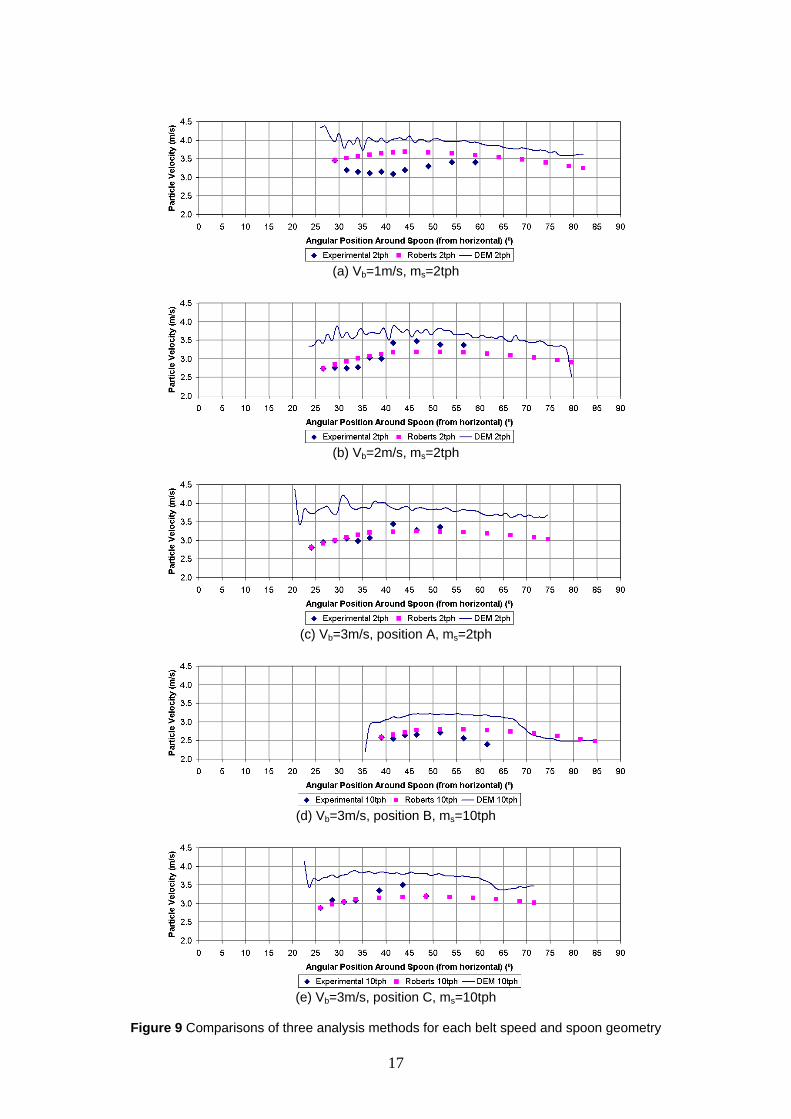
The velocity analyses for the five spoon geometries, see Table 4, are presented in Figure 19 and the following observations have be made from the average particle velocity results;
- Figure 19(a) shows the trend of the Roberts method initially diverging from the experimental velocity profile before converging to a similar velocity to the experimental data at the spoon’s convergent point,
- Figures 19(b) to 19(e) show a better fit between the Roberts method and the experimental velocities for the initial analysis points, after which there was some noticeable scatter or divergence. This divergence generally coincides with the change in radius within the experimental spoon,
- Figures 19(c), (d) and (e) all show significant velocity fluctuations along the first few degrees of the spoon. This is due to actual fluctuations caused by the particle stream impacting on the spoon,
- in Figure 17(b) there are substantial particles bouncing away from the spoon as a result of the non-ideal positioning of the spoon. Even though this is the case, the particles which continue to flow through the spoon in a conventional manner (which are the particles on which the velocity analysis is performed), show a similar trend to the other spoon geometries, as shown in Figure 19(c),
- the DEM simulations over-predict the experimental particle velocities through the spoon in all cases. As previously mentioned, this is due to the acceleration of the stream through the hood and free-fall zones. Of special note is the change in the trend for the DEM analysis of Figures 19(d) and 19(e). The velocity drops substantially in Figure 19(d), mainly due to the poor positioning of the spoon, causing a build up of material at the spoon exit,
- in Figure 19(e), there is still a velocity drop, however it is not as pronounced. In both of these cases, the material feed rate has been increased to 10tph, compared with the 2tph of the previous tests, which has resulted in more particle-particle and particle-wall interaction, and hence a more adverse effect on the velocity.
16
(a) Vb=1m/s, ms=2tph
(b) Vb=2m/s, ms=2tph
(c) Vb=3m/s, position A, ms=2tph
(d) Vb=3m/s, position B, ms=10tph
(e) Vb=3m/s, position C, ms=10tph
Figure 9 Comparisons of three analysis methods for each belt speed and spoon geometry
17
7. CONCLUSIONS 7.1 Conveyor Trajectories There are numerous trajectory methods available to predict the flow of material from conveyors. The results of comparisons to date show a noticeable difference between some methods and an obvious conclusion to draw from this is that they cannot all be correct. The experimental conveyor transfer facility is being used to validate these trajectory models to determine which are most appropriate to use. It may be found that certain methods are more accurate for low speed conveying than high speed conveying and/or visa-versa. To draw conclusions on this possibility more testing is required with a wider range of materials to evaluate the influence of such parameters as particle shape, particle size range and particle density. Preliminary DEM simulations of conveyor trajectories have shown a close comparison with several numerical methods but a deviation from the experimental results. This needs further investigation. Additional simulation work needs to be performed to allow generation of larger capacity material flows to provide direct comparisons for both the lower and upper trajectory streams. 7.2 Transfer Hood Preliminary comparisons have been made of the velocity of material flowing through a conveyor transfer hood with data generated from experimental trials, analytical chute analysis and DEM simulations. These early investigations have shown a slight over prediction of the exit particle velocity from the hood by both the analytical method of Roberts (2003) (8.8%) and the Chute Maven DEM software (6.7%). It is hoped that further investigations with other products and transfer geometries/designs will provide more comprehensive trends that can be broadly applied. The DEM simulations have the potential to reproduce the experimental behaviour of the material flow to a higher degree than the continuum based method due to the bulk flow being simulated. There is also the added advantage that the velocity scatter can be extracted from the data. The equivalent friction, μE, has the largest influence on the predicted velocities for the continuum based chute flow method of Roberts (2003). The larger the value of equivalent friction becomes, the closer the predicted velocity comes to matching that found experimentally. This needs further investigation. 7.3 Transfer Spoon Experimentally, 1, 2 and 3m/s conveyor belt speeds have been investigated in conjunction with five conveyor spoon positions. Three of these spoon positions were for the 3m/s belt speed, to investigate the influence of spoon position with respect to the angle of incidence of the incoming particle stream and hence the overall influence of the particle velocity through the transfer spoon. The continuum-based method of Roberts (2003) has been used for prediction of chute flows for some time, however the results presented here show that there are some inaccuracies with this method compared to the results obtained experimentally. The Roberts’ method is suited to rapid-flow thin-stream analyses, which could account for some of the variation between the results obtained and those of the experimental tests. Also, there is no facility to account for non-spherical particles and degree of particle rolling. To account for the non-spherical nature of the material being used, a sphericity factor could be incorporated into the analyses but this will need further investigation. Although not previously discussed here, the conveyor trajectory model of Korzen (1989) addresses the effect of air drag on the particle stream and perhaps this could also be adapted to the chute flow model of Roberts. Another option worth consideration is the use of other friction models rather than Coulomb friction. The Chute Maven™ discrete element modelling software only allows for spherical particles to be simulated. With the inability to simulate true particle shape, differences between the DEM and experimental results will be observed, including differing particle-particle and particle-wall interactions and also the fact that air drag effects cannot be modelled. As with the continuum-based methods, the sphericity of the particles used could be applied to the resulting velocity analyses, but again, further investigations would be required.
18
The particle stream outputs of the DEM simulations, showed similar visual characteristics to the experimental results. This indicates that the DEM software is capable of simulating the behaviour of the material flow stream reasonably well, whereas the continuum-based model has difficulty in predicting such dynamic and transient behaviour. 7.4 Future Direction Further research will be continued in a number of areas, including the following;
- investigate the effect of material feed rate on velocity trends for the experimental, Roberts and DEM methods,
- the behaviour of different materials through the same transfer spoon will be investigated in an attempt to establish trends which can be applied in a broader context,
- the applicability of integrating particle sphericity into both the continuum-based method and the results from the DEM simulations,
- producing further DEM simulations to analyse only the spoon where the particle velocity at the point of impact with the spoon will be set to match that determined from the experimental tests to allow direct comparisons.
8. ACKNOWLEDGEMENTS The authors wish to acknowledge the support of the Australian Research Council, Rio Tinto Technology and Innovation and Rio Tinto Iron Ore Expansion Projects for their financial and in-kind contributions to the Linkage Project which allows this research to be pursued. 9. REFERENCES
Booth, E. P. O. (1934). "Trajectories from Conveyors - Method of Calculating Them Corrected". Engineering and Mining Journal, Vol. 135, No. 12, December, pp. 552 - 554.
C.E.M.A. (1966). Belt Conveyors for Bulk Materials. 1st Ed, Conveyor Equipment Manufacturers Association. pp. 332.
C.E.M.A. (1979). Belt Conveyors for Bulk Materials. 2nd Ed, Conveyor Equipment Manufacturers Association. pp. 346.
C.E.M.A. (1994). Belt Conveyors for Bulk Materials. 4th Ed, Conveyor Equipment Manufacturers Association. pp. 374.
C.E.M.A. (1997). Belt Conveyors for Bulk Materials. 5th Ed, Conveyor Equipment Manufacturers Association. pp. 430.
C.E.M.A. (2005). Belt Conveyors for Bulk Materials. 6th Ed, Conveyor Equipment Manufacturers Association. pp. 599.
Dunlop (1982). "Dunlop Industrial Conveyor Manual".
Golka, K. (1992). "Discharge Trajectories of Bulk Solids". 4th International Conference on Bulk Materials Storage, Handling and Transportation, Wollongong, NSW, Australia, 6th - 8th July, pp. 497 - 503.
Golka, K. (1993). "Prediction of the Discharge Trajectories of Bulk Materials". Bulk Solids Handling, Vol. 13, No. 4, November, pp. 763 - 766.
Golka, K., Bolliger, G. and Vasili, C. (2007). Belt Conveyors Principles for Calculation and Design. Lugarno, N.S.W., Australia, K. Golka, G. Bolliger, C. Vasili. pp. 288.
Goodyear (1975). "Goodyear Handbook of Conveyor & Elevator Belting", pp. Section 11.
Hastie, D. B., Grima, A. P. and Wypych, P. W. (2008). "Validation of Particle Flow Through a Conveyor Transfer Hood Via Particle Velocity Analysis". 4th International Symposium Reliable Flow of Particulate Solids: (RelPowFlo IV), Tromsø, Norway, 10 - 12 June, Proceedings on USB, pp. 583 - 587.
Hastie, D. B. and Wypych, P. W. (2007). "Conveyor Trajectory Discharge Angles". 9th International Conference on Bulk Materials Handling and Transportation, ICBMH 2007, Newcastle, Australia, 9 - 11 October, Australian Society for Bulk Solids Handling, pp. 10.
19
20
Hastie, D. B., Wypych, P. W. and Arnold, P. C. (2007). "The Profile of Conveyor Trajectories". 9th International Conference on Bulk Materials Handling and Transportation, ICBMH 2007, Newcastle, Australia, 9 - 11 October, Australian Society for Bulk Solids Handling, pp. 10.
Kamaras, C. (2007). "Experimental Validation of DEM Simulation Modelling of Particle Flows Through Conveyor Transfers", B.E. (Mech. Eng.) Thesis, University of Wollongong, Wollongong, New South Wales, Australia. pp. 106.
Korzen, Z. (1989). "Mechanics of Belt Conveyor Discharge Process as Affected by Air Drag". Bulk Solids Handling, Vol. 9, No. 3, August, pp. 289 - 297.
M.H.E.A. (1986). Recommended Practice for Troughed Belt Conveyors, Mechanical Handling Engineer’s Association. pp. 199.
Roberts, A. W. (1999). "Feeders and Transfers – Recent Developments". Bulkex 1999, Bulk Materials Handling Conference, Homebush Bay, Sydney, Australia, 29th June - 1st July, pp. 1.1 - 1.27.
Roberts, A. W. (2003). "Chute Performance and Design for Rapid Flow Conditions". Chemical Engineering and Technology, Vol. 26, No. 2, pp. 163 - 170.


