Embed Size (px)
Citation preview
AC 2007-2533: USING CASE STUDIES TO TEACH INTRODUCTORY DESIGNCONCEPTS TO FIRST YEAR ENGINEERS
Colin Campbell, TechnicalMastery.com Corp.Colin Campbell, BMath is the Assistant Director of the Design Case Studies Group in the Facultyof Engineering at the University of Waterloo. (http://design.uwaterloo.ca). Other cases Colin hasbeen involved with include the following industries: trucking, HVAC, steel-making, powergeneration, and bottling.
Steve Lambert, University of WaterlooSteve Lambert, PhD, PEng is the Director of the Design Case Studies Group in the Faculty ofEngineering at the University of Waterloo. (http://design.uwaterloo.ca). His other researchinterests include: monitoring fatigue crack growth in welded joints with the direct currentpotential drop method; variable amplitude corrosion fatigue of welded structures; fracture of girthweld defects subject to high longitudinal strains; and stress corrosion cracking of pipeline steels.
© American Society for Engineering Education, 2007
Page 12.1539.1
Using Case Studies to Teach
Introductory Design Concepts to First Year Engineers
1. Introduction
This paper presents the authors’ first experiences with delivering case studies on a large scale
(1000+ students). The authors used multimedia (mostly video) in place of in-class delivery to
gauge its effectiveness at such a large scale. The results in terms of the student responses to a
questionnaire and their performance on the case studies are presented. These results will be used
to improve the case studies. It is hoped that this paper will give others a glimpse into the process
of continuous improvement of case studies. To that end temporary weaknesses in our products
and processes are explored in detail.
A new group called the Design Case Studies Group (http://design.uwaterloo.ca) has been
created in the Faculty of Engineering at the University of Waterloo to create case studies for use
in courses throughout the curriculum. A good case study represents reality: a real situation
(context), a real problem faced by an engineer, and uses real data. The following criteria are also
used in evaluating a case study for use in a course:
1. Contains incomplete/extraneous data
2. Requires judgment and evaluation as well as analysis
3. Requires problem formulation and refinement
4. Involves an element of Design
5. There is no single correct solution
6. The company’s actual solution is available for comparison with student work
Cases must map well onto the curriculum, and are most effective if they can be used in more
than one course. The group’s first case studies were presented in the Fall of 2006, and are the
subject of this paper. The purpose of the case studies was to introduce the engineering design
process to first year students in every Engineering department. This is consistent with other
“Engineering in Context” approaches to first year engineering courses. [1, 2, 3, 4]
Two case studies were chosen: A Hydro Quebec case study which involves selecting from
among alternative energy sources, and an Engineers Without Borders (Canada) case study on
drinking water supply.
The first case study was used to introduce the engineering design process and its terminology,
and the second case was used to give the students hands-on experience working through the steps
of the engineering design process.
In the second case, the students ultimately had to enter and run an Excel simulation to determine
the optimum size for a rainwater storage tank that would carry an average household through
drought periods using the excess rainwater collected in wetter periods.
Page 12.1539.2
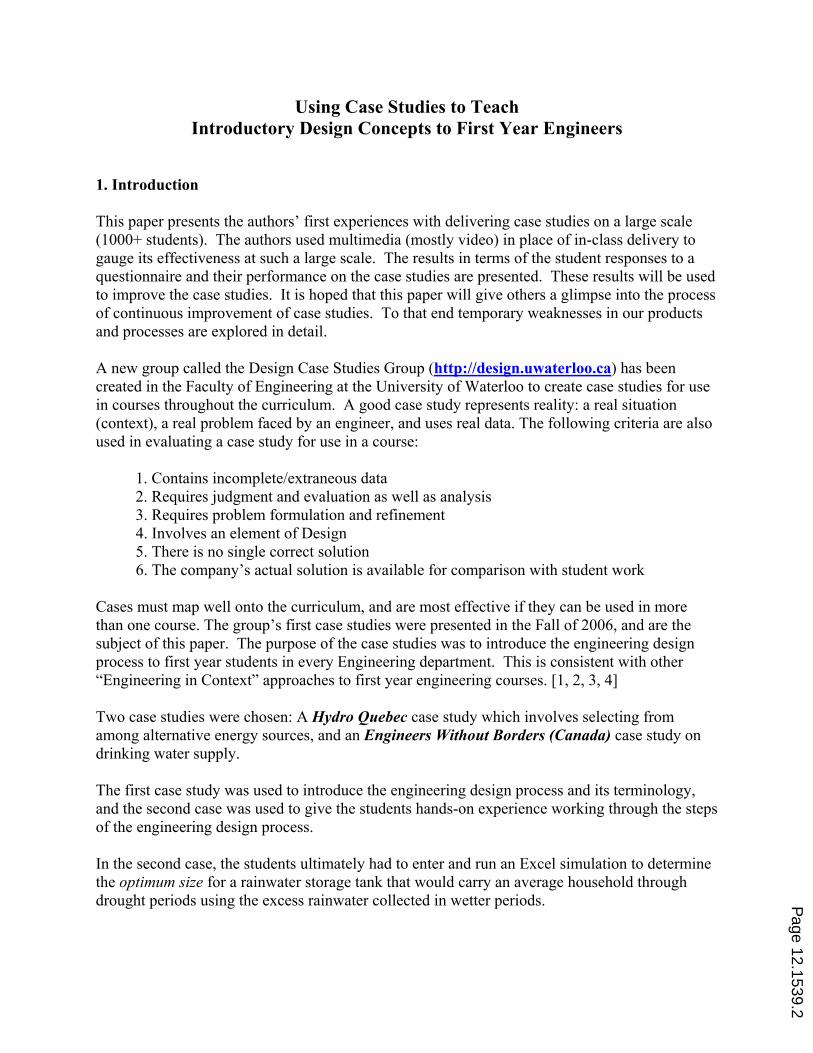
At the end of each case study, the students were presented with an Engineering Design Process
Summary document, outlining the design steps they followed. The Summary document for the
EWB case study is shown in Table 1. The students were encouraged to fill out a blank summary
form (available on-line at: http://design.uwaterloo.ca/cases/Drinking_Water/summary) when
doing their own design projects to emphasize the design process.
1. Needs Problem Statement: Provide drinking water to villagers in Mavukall
Analysis: Order of Magnitude Calcs: Annual drinking water demand is met by runoff rain water supply in worst year
Requirements: Safe to drink. Cost suits villagers’ incomes.
Constraints: Amount of water available from any given source is limited.
Ranking Criteria: Quality of Water; Legalities of Using Source; Impact on Others;
Cost/Ease of Operation/Maintenance; Capital Cost; Quantity of Water
2. Conceptual Brainstorm Concepts: Rainwater Harvesting; Dam Stream; Hydro Reservoir; Spring; Well
Design: Rank Concepts: (1) Rainwater Harvesting, (2) Hydro Reservoir, (3) Spring, …
Select Concept(s): (1) Rainwater Harvesting
3. Preliminary Select Components: Storage Tank, Gutters, Down Pipe, Gate Valve, Filter Unit
Design: Simplified Sizing: Storage Tank needs to hold ~4 months of demand
Simplified Analysis: 4 x 2880 litres = 11,520 litres
4. Detailed Materials & Assembly: Ferrocement chosen after Detailed Sizing done
Design: Detailed Sizing: Simulation: Tank Size:
100% Reliability 13,400 litres
95% Reliability 10,000 litres
90% Reliability 8,100 litres
Detailed Analyses: Simulation: Tank Size: Total Cost
100% Reliability 13,400 litres $813.50
95% Reliability 10,000 litres $677.50
90% Reliability 8,100 litres $601.50
Solution Statement: The chosen design is to use Rainwater Harvesting with tanks constructed from
ferrocement, and where villagers are given a choice in tank size from the above
table, depending on their means and their comfort level for reliability.
5. Implementation:
Manufacturing &
Distribution:
Locate storage tank in shade.
Train users on sanitary use, and maintenance.
Keep away from pedestrian traffic to avoid damage.
6. Operation:
Actual Use &
Maintenance:
The gutters should be kept clear of debris and wildlife (guard should be used).
The filter should be kept clean.
The tanks and pipes should be checked for leaks periodically.
Proper water treatment procedures with chlorine should be followed to ensure
the water is safe to drink at all times.
7. Retirement:
Deactivation &
Disposal:
The concrete could be broken down into small pieces and used as road bed.
The iron bars could be sent to a scrap metal yard for recycling.
Table 1: “Engineering Design Process Summary” for EWB Case Study
Page 12.1539.3
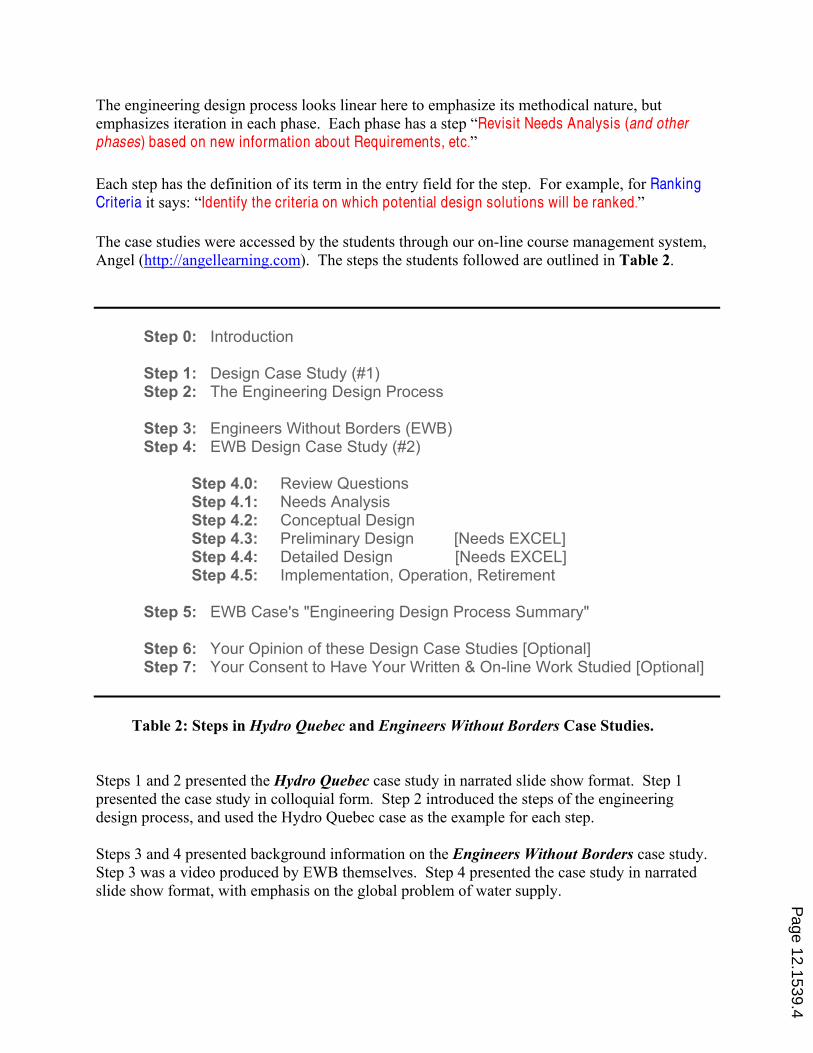
The engineering design process looks linear here to emphasize its methodical nature, but
emphasizes iteration in each phase. Each phase has a step “Revisit Needs Analysis (and other phases) based on new information about Requirements, etc.”
Each step has the definition of its term in the entry field for the step. For example, for Ranking Criteria it says: “Identify the criteria on which potential design solutions will be ranked.”
The case studies were accessed by the students through our on-line course management system,
Angel (http://angellearning.com). The steps the students followed are outlined in Table 2.
Step 0: Introduction Step 1: Design Case Study (#1) Step 2: The Engineering Design Process Step 3: Engineers Without Borders (EWB) Step 4: EWB Design Case Study (#2) Step 4.0: Review Questions Step 4.1: Needs Analysis Step 4.2: Conceptual Design Step 4.3: Preliminary Design [Needs EXCEL] Step 4.4: Detailed Design [Needs EXCEL] Step 4.5: Implementation, Operation, Retirement Step 5: EWB Case's "Engineering Design Process Summary" Step 6: Your Opinion of these Design Case Studies [Optional] Step 7: Your Consent to Have Your Written & On-line Work Studied [Optional]
Table 2: Steps in Hydro Quebec and Engineers Without Borders Case Studies.
Steps 1 and 2 presented the Hydro Quebec case study in narrated slide show format. Step 1
presented the case study in colloquial form. Step 2 introduced the steps of the engineering
design process, and used the Hydro Quebec case as the example for each step.
Steps 3 and 4 presented background information on the Engineers Without Borders case study.
Step 3 was a video produced by EWB themselves. Step 4 presented the case study in narrated
slide show format, with emphasis on the global problem of water supply.
Page 12.1539.4
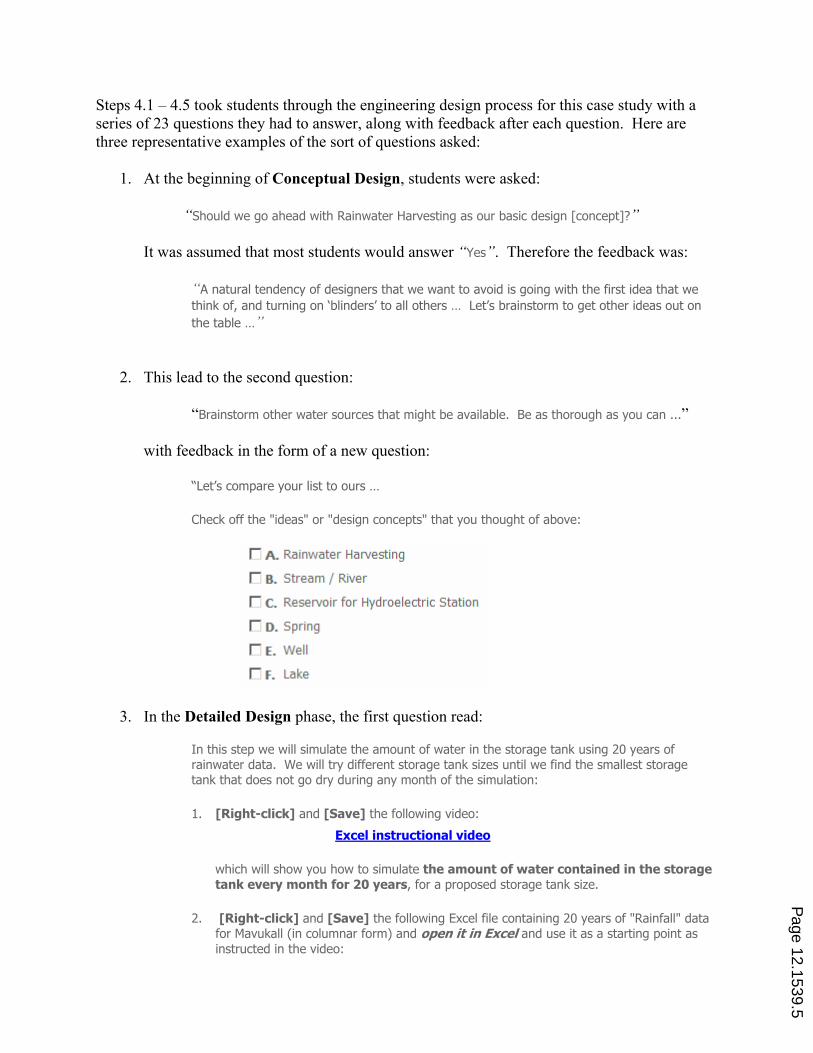
Steps 4.1 – 4.5 took students through the engineering design process for this case study with a
series of 23 questions they had to answer, along with feedback after each question. Here are
three representative examples of the sort of questions asked:
1. At the beginning of Conceptual Design, students were asked:
“Should we go ahead with Rainwater Harvesting as our basic design [concept]?”
It was assumed that most students would answer “Yes”. Therefore the feedback was:
“A natural tendency of designers that we want to avoid is going with the first idea that we
think of, and turning on ‘blinders’ to all others … Let’s brainstorm to get other ideas out on
the table …”
2. This lead to the second question:
“Brainstorm other water sources that might be available. Be as thorough as you can ...”
with feedback in the form of a new question:
“Let’s compare your list to ours …
Check off the "ideas" or "design concepts" that you thought of above:
3. In the Detailed Design phase, the first question read:
In this step we will simulate the amount of water in the storage tank using 20 years of rainwater data. We will try different storage tank sizes until we find the smallest storage tank that does not go dry during any month of the simulation:
1. [Right-click] and [Save] the following video:
Excel instructional video
which will show you how to simulate the amount of water contained in the storage
tank every month for 20 years, for a proposed storage tank size.
2. [Right-click] and [Save] the following Excel file containing 20 years of "Rainfall" data for Mavukall (in columnar form) and open it in Excel and use it as a starting point as
instructed in the video:
Page 12.1539.5
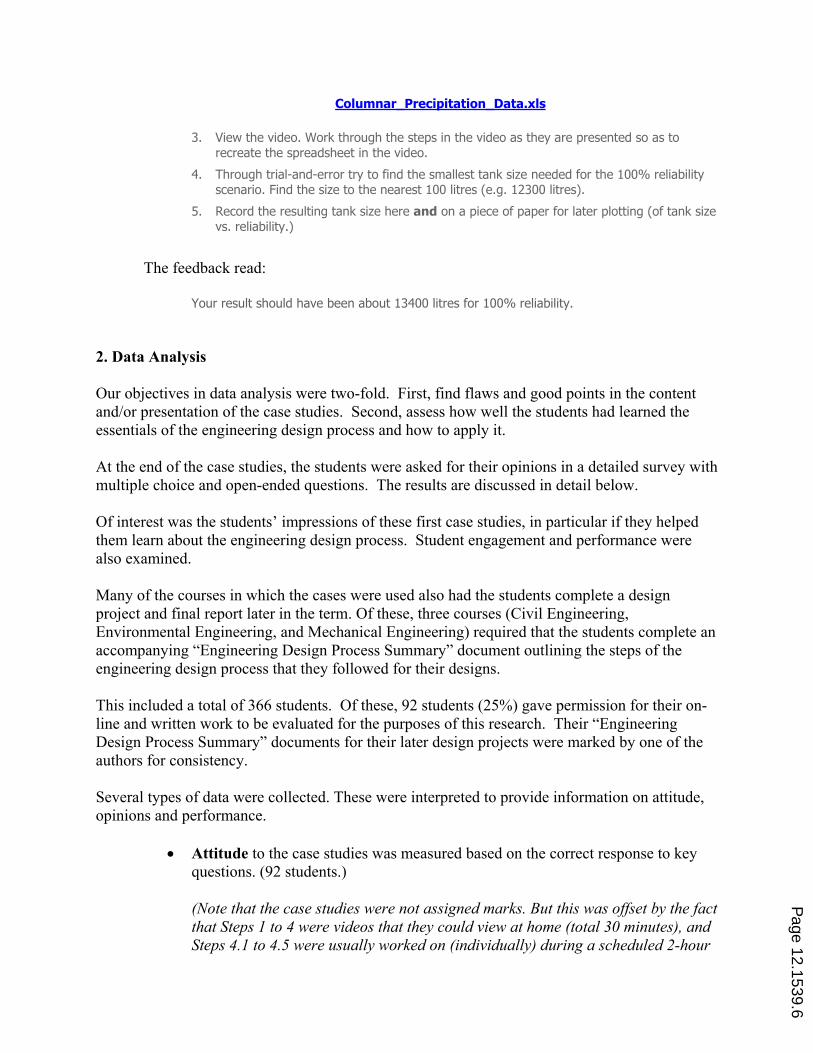
Columnar_Precipitation_Data.xls
3. View the video. Work through the steps in the video as they are presented so as to
recreate the spreadsheet in the video.
4. Through trial-and-error try to find the smallest tank size needed for the 100% reliability scenario. Find the size to the nearest 100 litres (e.g. 12300 litres).
5. Record the resulting tank size here and on a piece of paper for later plotting (of tank size vs. reliability.)
The feedback read:
Your result should have been about 13400 litres for 100% reliability.
2. Data Analysis
Our objectives in data analysis were two-fold. First, find flaws and good points in the content
and/or presentation of the case studies. Second, assess how well the students had learned the
essentials of the engineering design process and how to apply it.
At the end of the case studies, the students were asked for their opinions in a detailed survey with
multiple choice and open-ended questions. The results are discussed in detail below.
Of interest was the students’ impressions of these first case studies, in particular if they helped
them learn about the engineering design process. Student engagement and performance were
also examined.
Many of the courses in which the cases were used also had the students complete a design
project and final report later in the term. Of these, three courses (Civil Engineering,
Environmental Engineering, and Mechanical Engineering) required that the students complete an
accompanying “Engineering Design Process Summary” document outlining the steps of the
engineering design process that they followed for their designs.
This included a total of 366 students. Of these, 92 students (25%) gave permission for their on-
line and written work to be evaluated for the purposes of this research. Their “Engineering
Design Process Summary” documents for their later design projects were marked by one of the
authors for consistency.
Several types of data were collected. These were interpreted to provide information on attitude,
opinions and performance.
‚ Attitude to the case studies was measured based on the correct response to key
questions. (92 students.)
(Note that the case studies were not assigned marks. But this was offset by the fact
that Steps 1 to 4 were videos that they could view at home (total 30 minutes), and
Steps 4.1 to 4.5 were usually worked on (individually) during a scheduled 2-hour
Page 12.1539.6
tutorial in a computer lab. Therefore, they had minimal additional homework as
a result of the case studies.)
‚ Opinions on the effectiveness of the cases studies and the use of multimedia, both
positive and negative, were assessed directly with a survey. (103 students = 28%
of 366.)
‚ Performance was based on an evaluation of the “Design Summary” documents
submitted later in the term to accompany design project reports. (40 of 92
“Design Summaries” were used.)
2.1. Attitude
Attitude was measured based on whether the students submitted the correct answers after
carrying out intricate Excel simulations. It was assumed that if they had worked this deeply into
the case study, and had proceeded with sufficient care to obtain an accurate result, then they had
taken the case studies seriously. Out of 92 students, 77 students (84%) worked diligently enough
to get the correct answer in the simulation. This indicates that a large proportion of the students
took the case studies seriously.
2.2. Opinions
Students were asked their opinion of the case studies using the following statement: “Case
studies are an effective means of learning about the engineering design process.” Possible
comments were: Strongly Disagree (SD), Disagree (D), No Opinion (N), Agree (A), and
Strongly Agree (SA).
A similar statement was used to assess the effectiveness of the multimedia presentations:
“Interactive multimedia (videos, explorations) is effective in making case studies about the
engineering design process more engaging”, with the same comment options.
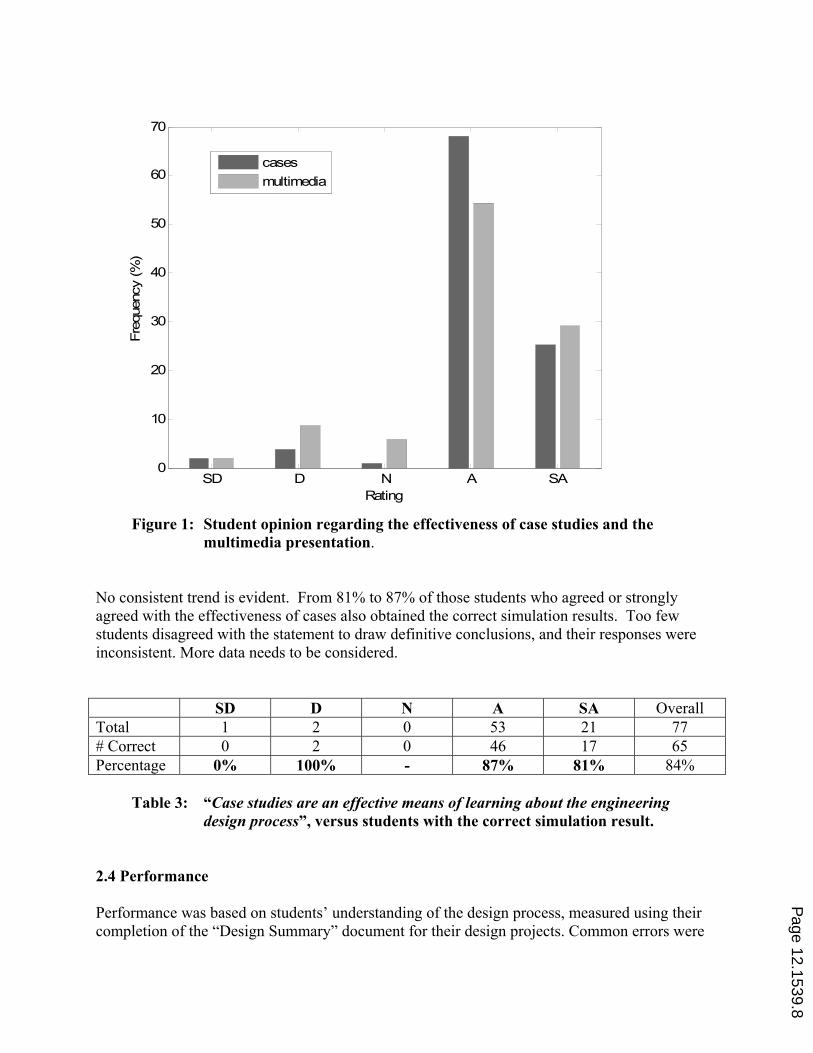
The overall results are summarized in Figure 1 on the following page. The overwhelming
majority of students “agree” (A) or “strongly agree” (SA) with both assertions. Students
generally believe that case studies are an effective means of learning about the engineering
design process, and that multimedia makes the case studies more engaging.
2.3. Attitude vs Opinion
Table 3 on the following page shows the number of students in each category for the question
relating to the effectiveness of case studies. Of the 92 students who gave permission to use their
work, opinion data was available for only 77. Also included is the number of students in each
category who performed the simulation correctly. This was divided by the number of responses
in each category to obtain a percentage.
Page 12.1539.7
SD D N A SA0
10
20
30
40
50
60
70
Rating
Fre
quency (%
)
cases
multimedia
Figure 1: Student opinion regarding the effectiveness of case studies and the
multimedia presentation.
No consistent trend is evident. From 81% to 87% of those students who agreed or strongly
agreed with the effectiveness of cases also obtained the correct simulation results. Too few
students disagreed with the statement to draw definitive conclusions, and their responses were
inconsistent. More data needs to be considered.
SD D N A SA Overall
Total 1 2 0 53 21 77
# Correct 0 2 0 46 17 65
Percentage 0% 100% - 87% 81% 84%
Table 3: “Case studies are an effective means of learning about the engineering
design process”, versus students with the correct simulation result.
2.4 Performance
Performance was based on students’ understanding of the design process, measured using their
completion of the “Design Summary” document for their design projects. Common errors were
Page 12.1539.8
(1) students confusing “Requirements” with “Constraints”, and (2) students confusing
“Requirements” with “Ranking Criteria”. Problem statements were generally entered correctly.
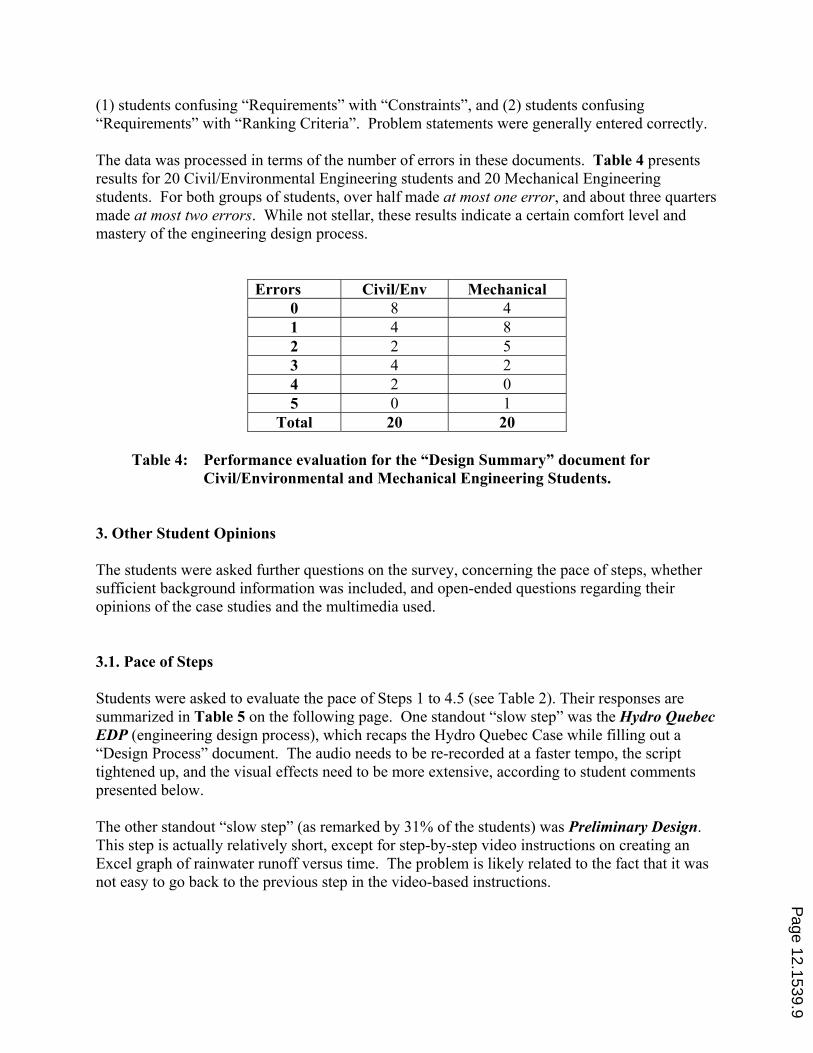
The data was processed in terms of the number of errors in these documents. Table 4 presents
results for 20 Civil/Environmental Engineering students and 20 Mechanical Engineering
students. For both groups of students, over half made at most one error, and about three quarters
made at most two errors. While not stellar, these results indicate a certain comfort level and
mastery of the engineering design process.
Errors Civil/Env Mechanical
0 8 4
1 4 8
2 2 5
3 4 2
4 2 0
5 0 1
Total 20 20
Table 4: Performance evaluation for the “Design Summary” document for
Civil/Environmental and Mechanical Engineering Students.
3. Other Student Opinions
The students were asked further questions on the survey, concerning the pace of steps, whether
sufficient background information was included, and open-ended questions regarding their
opinions of the case studies and the multimedia used.
3.1. Pace of Steps
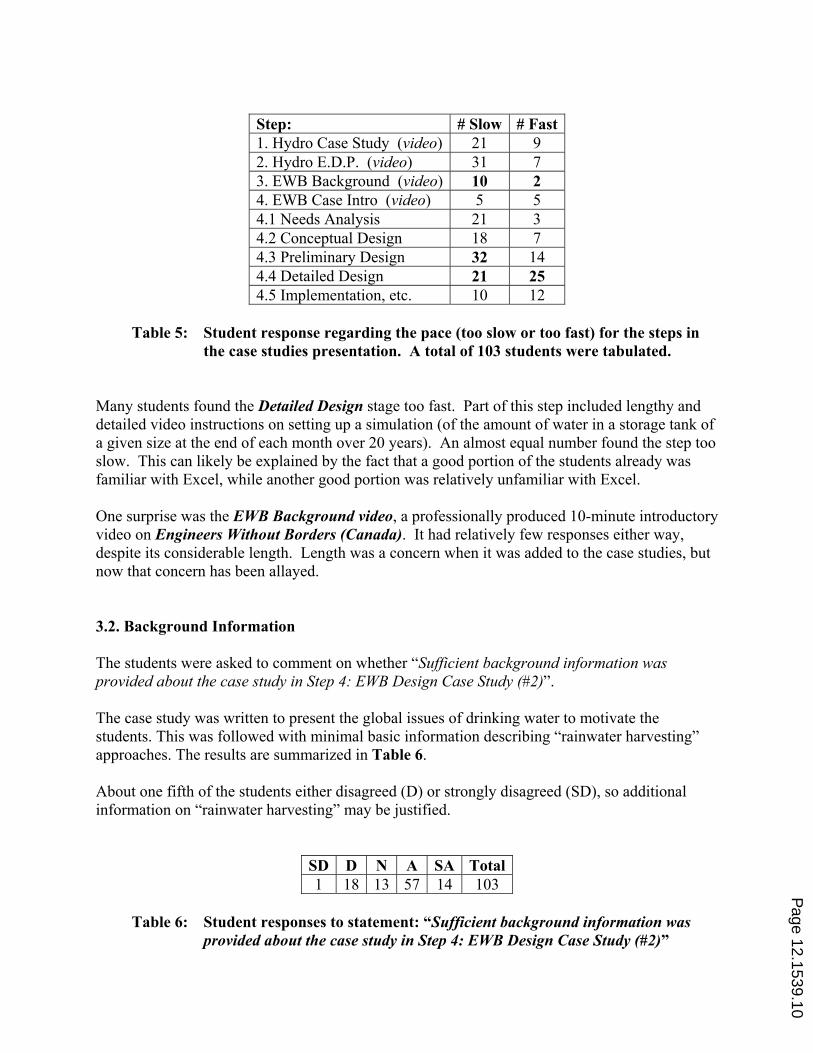
Students were asked to evaluate the pace of Steps 1 to 4.5 (see Table 2). Their responses are
summarized in Table 5 on the following page. One standout “slow step” was the Hydro Quebec
EDP (engineering design process), which recaps the Hydro Quebec Case while filling out a
“Design Process” document. The audio needs to be re-recorded at a faster tempo, the script
tightened up, and the visual effects need to be more extensive, according to student comments
presented below.
The other standout “slow step” (as remarked by 31% of the students) was Preliminary Design.
This step is actually relatively short, except for step-by-step video instructions on creating an
Excel graph of rainwater runoff versus time. The problem is likely related to the fact that it was
not easy to go back to the previous step in the video-based instructions.
Page 12.1539.9
Step: # Slow # Fast
1. Hydro Case Study (video) 21 9
2. Hydro E.D.P. (video) 31 7
3. EWB Background (video) 10 2
4. EWB Case Intro (video) 5 5
4.1 Needs Analysis 21 3
4.2 Conceptual Design 18 7
4.3 Preliminary Design 32 14
4.4 Detailed Design 21 25
4.5 Implementation, etc. 10 12
Table 5: Student response regarding the pace (too slow or too fast) for the steps in
the case studies presentation. A total of 103 students were tabulated.
Many students found the Detailed Design stage too fast. Part of this step included lengthy and
detailed video instructions on setting up a simulation (of the amount of water in a storage tank of
a given size at the end of each month over 20 years). An almost equal number found the step too
slow. This can likely be explained by the fact that a good portion of the students already was
familiar with Excel, while another good portion was relatively unfamiliar with Excel.
One surprise was the EWB Background video, a professionally produced 10-minute introductory
video on Engineers Without Borders (Canada). It had relatively few responses either way,
despite its considerable length. Length was a concern when it was added to the case studies, but
now that concern has been allayed.
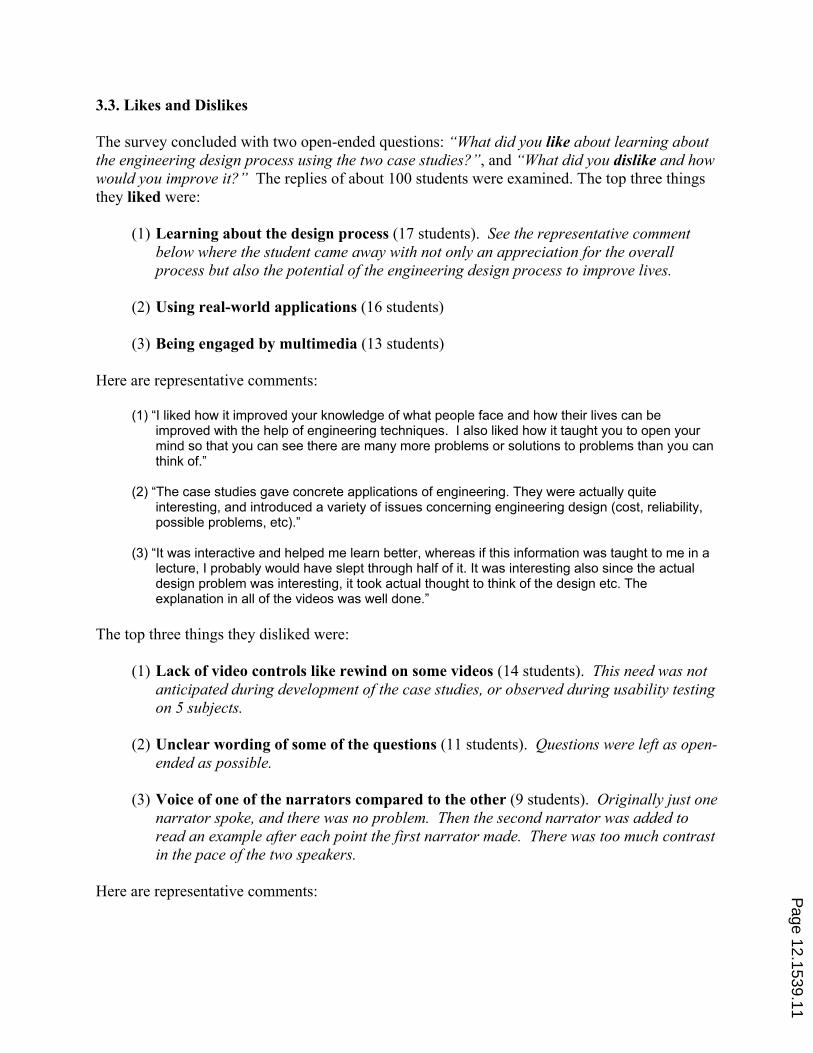
3.2. Background Information
The students were asked to comment on whether “Sufficient background information was
provided about the case study in Step 4: EWB Design Case Study (#2)”.
The case study was written to present the global issues of drinking water to motivate the
students. This was followed with minimal basic information describing “rainwater harvesting”
approaches. The results are summarized in Table 6.
About one fifth of the students either disagreed (D) or strongly disagreed (SD), so additional
information on “rainwater harvesting” may be justified.
SD D N A SA Total
1 18 13 57 14 103
Table 6: Student responses to statement: “Sufficient background information was
provided about the case study in Step 4: EWB Design Case Study (#2)”
Page 12.1539.10
3.3. Likes and Dislikes
The survey concluded with two open-ended questions: “What did you like about learning about
the engineering design process using the two case studies?”, and “What did you dislike and how
would you improve it?” The replies of about 100 students were examined. The top three things
they liked were:
(1) Learning about the design process (17 students). See the representative comment
below where the student came away with not only an appreciation for the overall
process but also the potential of the engineering design process to improve lives.
(2) Using real-world applications (16 students)
(3) Being engaged by multimedia (13 students)
Here are representative comments:
(1) “I liked how it improved your knowledge of what people face and how their lives can be
improved with the help of engineering techniques. I also liked how it taught you to open your mind so that you can see there are many more problems or solutions to problems than you can think of.”
(2) “The case studies gave concrete applications of engineering. They were actually quite
interesting, and introduced a variety of issues concerning engineering design (cost, reliability, possible problems, etc).”
(3) “It was interactive and helped me learn better, whereas if this information was taught to me in a
lecture, I probably would have slept through half of it. It was interesting also since the actual design problem was interesting, it took actual thought to think of the design etc. The explanation in all of the videos was well done.”
The top three things they disliked were:
(1) Lack of video controls like rewind on some videos (14 students). This need was not
anticipated during development of the case studies, or observed during usability testing
on 5 subjects.
(2) Unclear wording of some of the questions (11 students). Questions were left as open-
ended as possible.
(3) Voice of one of the narrators compared to the other (9 students). Originally just one
narrator spoke, and there was no problem. Then the second narrator was added to
read an example after each point the first narrator made. There was too much contrast
in the pace of the two speakers.
Here are representative comments:
Page 12.1539.11
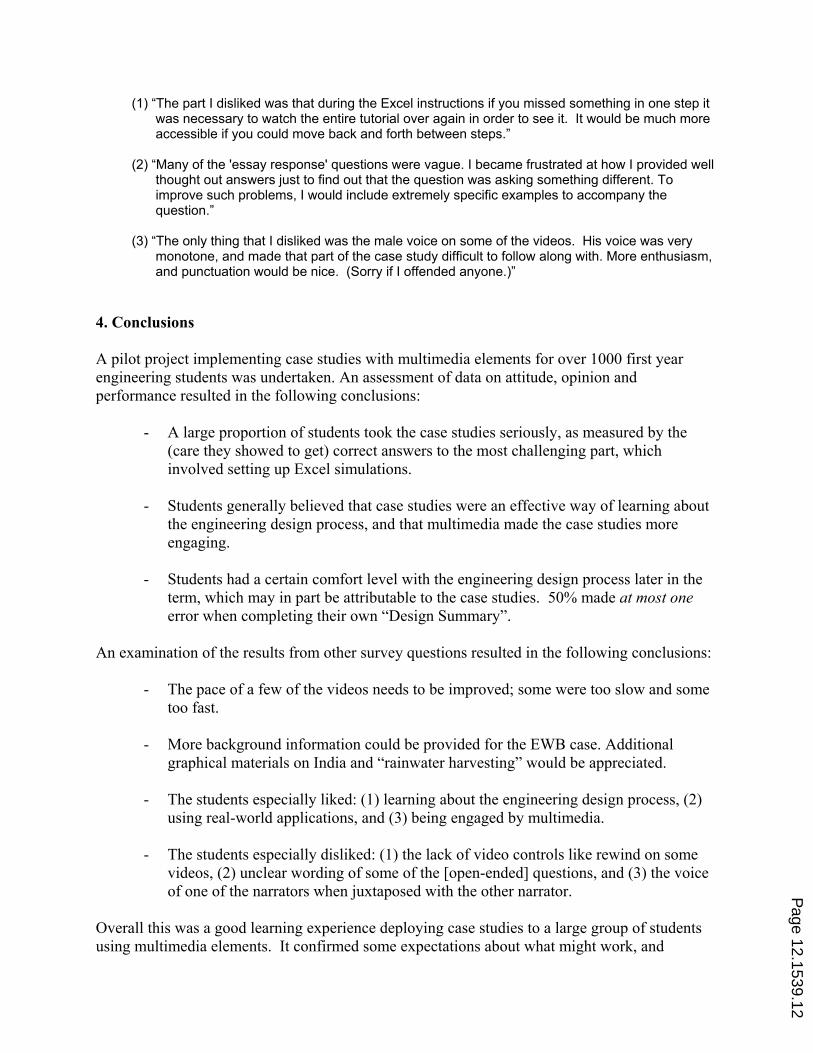
(1) “The part I disliked was that during the Excel instructions if you missed something in one step it was necessary to watch the entire tutorial over again in order to see it. It would be much more accessible if you could move back and forth between steps.”
(2) “Many of the 'essay response' questions were vague. I became frustrated at how I provided well
thought out answers just to find out that the question was asking something different. To improve such problems, I would include extremely specific examples to accompany the question.”
(3) “The only thing that I disliked was the male voice on some of the videos. His voice was very
monotone, and made that part of the case study difficult to follow along with. More enthusiasm, and punctuation would be nice. (Sorry if I offended anyone.)”
4. Conclusions
A pilot project implementing case studies with multimedia elements for over 1000 first year
engineering students was undertaken. An assessment of data on attitude, opinion and
performance resulted in the following conclusions:
- A large proportion of students took the case studies seriously, as measured by the
(care they showed to get) correct answers to the most challenging part, which
involved setting up Excel simulations.
- Students generally believed that case studies were an effective way of learning about
the engineering design process, and that multimedia made the case studies more
engaging.
- Students had a certain comfort level with the engineering design process later in the
term, which may in part be attributable to the case studies. 50% made at most one
error when completing their own “Design Summary”.
An examination of the results from other survey questions resulted in the following conclusions:
- The pace of a few of the videos needs to be improved; some were too slow and some
too fast.
- More background information could be provided for the EWB case. Additional
graphical materials on India and “rainwater harvesting” would be appreciated.
- The students especially liked: (1) learning about the engineering design process, (2)
using real-world applications, and (3) being engaged by multimedia.
- The students especially disliked: (1) the lack of video controls like rewind on some
videos, (2) unclear wording of some of the [open-ended] questions, and (3) the voice
of one of the narrators when juxtaposed with the other narrator.
Overall this was a good learning experience deploying case studies to a large group of students
using multimedia elements. It confirmed some expectations about what might work, and
Page 12.1539.12
provided valuable feedback on what needs to be done to improve the case studies and
multimedia.
Finally, the Design Case Study Group learned that case studies delivered via multimedia to
1000+ students can still be a very motivating and engaging way for the students to learn more
about the engineering design process in practice, beyond what is introduced in lectures.
5. References
1. Elzey, D. “Teaching Intro to Engineering in Context – UVA Engineering’s New
Cornerstone”. Proceedings of the 2006 American Society for Engineering Education
Annual Conference and Exposition. (On-line at http://www.asee.org.)
2. Collura, M. A., Aliane, B., Daniels, S., Nocito-Gobel, J. “Learning the Methods of
Engineering Analysis Using Case Studies, Excel and VBA – Course Design”.
Proceedings of the 2004 American Society for Engineering Education Annual Conference
and Exposition. (On-line at http://www.asee.org.)
3. Richards, L. G., Gorman, M. E. “Using Case Studies to Teach Engineering Design
and Ethics”. Proceedings of the 2004 American Society for Engineering Education
Annual Conference and Exposition. (On-line at http://www.asee.org.)
4. Jensen, J. N. “A Case Study Approach to Freshman Engineering Courses”.
Proceedings of the 2003 American Society for Engineering Education Annual Conference
and Exposition. (On-line at http://www.asee.org.)
Page 12.1539.13