Embed Size (px)
Citation preview
1
2
3
4Q4
5Q5
6
78
91011121314
30
3132
33
34
3536
37
38
39
40
41
42
43
44
45
46
47
48
49
50
51
52
53
54
Computational and Structural Biotechnology Journal xxx (2014) xxx–xxx
CSBJ-00019; No of Pages 10
Contents lists available at ScienceDirect
journa l homepage: www.e lsev ie r .com/ locate /csb j
Mini review
Using biological networks to improve our understanding ofinfectious diseases
FNicola J. Mulder ⁎, Richard O. Akinola, Gaston K. Mazandu, Holifidy RapanoelComputational Biology Group, Department of Clinical Laboratory Sciences, IDM, University of Cape Town Faculty of Health Sciences, Anzio Road, Observatory, Cape Town, South Africa
O⁎ Corresponding author. Tel.: +27 21 4066058.E-mail addresses: [email protected] (N.J. Mulde
(R.O. Akinola), [email protected] (G.K. Mazandu),
http://dx.doi.org/10.1016/j.csbj.2014.08.0062001-0370/© 2014 Mulder et al.
Please cite this article as: Mulder NJ, et al,dx.doi.org/10.1016/j.csbj.2014.08.006
Oa b s t r a c t
a r t i c l e i n f o15
Available online xxxx 1617 Q618
19
20
21
Keywords:Biological networksTuberculosisPathogenEvolutionProtein–protein interaction
22
23
24
25
26
27
28
29
TED P
R
Infectious diseases are the leading cause of death, particularly in developing countries. Althoughmany drugs areavailable for treating themost common infectious diseases, inmany cases themechanism of action of these drugsor even their targets in the pathogen remain unknown. In addition, the key factors or processes in pathogens thatfacilitate infection and disease progression are often not well understood. Since proteins do notwork in isolation,understanding biological systems requires a better understanding of the interconnectivity between proteins indifferent pathways and processes, which includes both physical and other functional interactions. Such biologicalnetworks can be generated within organisms or between organisms sharing a common environment usingexperimental data and computational predictions. Though different data sources provide different levels ofaccuracy, confidence in interactions can be measured using interaction scores. Connections between interactingproteins in biological networks can be represented as graphs and edges, and thus studied using existingalgorithms and tools from graph theory. There are many different applications of biological networks, and herewe discuss three such applications, specifically applied to the infectious disease tuberculosis, with its causativeagent Mycobacterium tuberculosis and host, Homo sapiens. The applications include the use of the networks forfunction prediction, comparison of networks for evolutionary studies, and the generation and use of host–pathogen interaction networks.
© 2014 Mulder et al.
C EContentsUNCO
RR1. Introduction . . . . . . . . . . . . . . . . . . . . . . . . . . . . . . . . . . . . . . . . . . . . . . . . . . . . . . . . . . . . . . . 0
2. Use of biological networks for function prediction . . . . . . . . . . . . . . . . . . . . . . . . . . . . . . . . . . . . . . . . . . . . . . 02.1. Protein function and Gene Ontology . . . . . . . . . . . . . . . . . . . . . . . . . . . . . . . . . . . . . . . . . . . . . . . . . 02.2. Protein function prediction algorithms . . . . . . . . . . . . . . . . . . . . . . . . . . . . . . . . . . . . . . . . . . . . . . . 02.3. Deploying GO in genome annotation analysis . . . . . . . . . . . . . . . . . . . . . . . . . . . . . . . . . . . . . . . . . . . . 0
3. Use of networks for evolutionary studies . . . . . . . . . . . . . . . . . . . . . . . . . . . . . . . . . . . . . . . . . . . . . . . . . . 03.1. Functional interaction networks for the three mycobacteria . . . . . . . . . . . . . . . . . . . . . . . . . . . . . . . . . . . . . . 03.2. Pairwise network comparison of important proteins . . . . . . . . . . . . . . . . . . . . . . . . . . . . . . . . . . . . . . . . . 03.3. Evolutionary differences between the three mycobacterial species . . . . . . . . . . . . . . . . . . . . . . . . . . . . . . . . . . . 0
4. Prediction and use of host–pathogen interaction networks . . . . . . . . . . . . . . . . . . . . . . . . . . . . . . . . . . . . . . . . . . 04.1. Prediction using interologs . . . . . . . . . . . . . . . . . . . . . . . . . . . . . . . . . . . . . . . . . . . . . . . . . . . . . 04.2. Prediction using protein domain and structure . . . . . . . . . . . . . . . . . . . . . . . . . . . . . . . . . . . . . . . . . . . . 04.3. Prediction using machine learning . . . . . . . . . . . . . . . . . . . . . . . . . . . . . . . . . . . . . . . . . . . . . . . . . 04.4. Assessment and use of host–pathogen PPIs . . . . . . . . . . . . . . . . . . . . . . . . . . . . . . . . . . . . . . . . . . . . . 0
5. Summary and outlook . . . . . . . . . . . . . . . . . . . . . . . . . . . . . . . . . . . . . . . . . . . . . . . . . . . . . . . . . . 0Acknowledgements . . . . . . . . . . . . . . . . . . . . . . . . . . . . . . . . . . . . . . . . . . . . . . . . . . . . . . . . . . . . . . 0References . . . . . . . . . . . . . . . . . . . . . . . . . . . . . . . . . . . . . . . . . . . . . . . . . . . . . . . . . . . . . . . . . . 0
55Q7
56
57r), [email protected]@aims.ac.za (H. Rapanoel).
Using biological networks to
1. Introduction
The biology of organisms is complex and involves the interplaybetween numerous factors, including proteins, nucleic acids and small
improve our understanding of infectious diseases, (2014), http://
T
58
59
60
61
62
63
64
65
66
67
68Q8
69
70
71
72
73
74
75
76
77
78
79
80
81
82
83
84
85
86
87
88
89
90
91
92Q9
93
94
95
96
97
98
99
100
101
102
103
104
105
106
107
108
109Q10
110
111
112
113
114
115Q11
116
117
118
119
120
121
122
123
124
125
126
127
128
129
130
131
132
133
134
135
136
137
138
139
140
141
142
143
144
145
146
147
148Q12
149
150
151
152
153
154
155
156
157
158
159
160
161Q13
162
163
164
165
166
167
168
169
170
171
172
173
174Q14
175
176
177
178
179
180
181
182
183Q15
184
2 N.J. Mulder et al. / Computational and Structural Biotechnology Journal xxx (2014) xxx–xxx
UNCO
RREC
molecules. These, in turn, are influenced by the environment and evolveto enable adaptation to environmental niches. Bacterial pathogens haveevolved to infect their hosts through multiple mechanisms, includinghorizontal gene transfer [1], mutations [2], gene duplications [3] andgene loss [4]. In order to study infectious diseases caused by bacterialpathogens, we need to improve our understanding of the underlyingmolecular biology of these organisms so that we can determine howthey infect, persist and cause disease, as well as better understand thepharmacokinetic and pharmacogenomic actions of anti-bacterial drugs.
The functioning of a biological system is largely driven by proteins,which interact andwork together in pathways and processes. Thereforeto understand the system, proteins must be studied within the contextof their interactions with other proteins, rather than in isolation.Proteins can interact through direct physical binding, or through indi-rect associations, such as contributing to the same biological process.Protein–protein interaction networks are probably the most usedexample of biological networks, and can include interactions fromboth physical protein–protein binding as well as other functionalinteractions [5]. The vast amount of data generated over the years bydifferent high-throughput biological technologies has raised the needfor an integrative approachwhere datasets fromheterogeneous sourcesaremerged into a single network of interactingproteins. In these biolog-ical networks, the nodes are proteins and the edges represent functionalinteractions between proteins which can be derived from a variety ofdifferent data sources [6]. These sources include direct physical binding,for which there are a number of protein–protein interaction databases(e.g. IntAct, DIP, BIND), co-expression, functional similarity, text-mining, co-localization and other functional genomics data sources [6].
Biological networks provide the starting point for a number ofanalyses that aim to improve our understanding of biological systems[7]. Since biological networks are depicted as network graphs, manyof these analysis tools draw on concepts and algorithms from graphtheory. These allow us to, for example, determine the properties ofnodes, such as their degree (number of neighbours), betweenness andcentrality, which provide a feeling of how important that node is infacilitating communication between other nodes in the network andin holding connected components of the network together. We canalso perform in silico knock-out studies to determine the potentialimpact of targeting a particular protein. Identifying the essentiality ofproteins and the effect of knocking out the protein in the biologicalnetwork of a pathogen has the potential to enable in silico predictionof potential drug targets when studying infectious diseases. There aremany other applications of biological networks, and in this article wereview some of these applications in studying human pathogens,using examples from our work on Mycobacterium tuberculosis andrelatedmycobacteria.M. tuberculosis is the causative agent of tuberculo-sis (TB), an infectious disease of epidemic proportions in developingcountries. First we review the use of protein–protein functional interac-tion (PPI) networks for protein function prediction (note, functionalinteractions include all functional connections between proteins, notonly physical binding), and then we demonstrate how networks canfacilitate evolutionary studies between pathogenic and non-pathogenicstrains with differing genome sizes by comparing three different net-works. Finally, we review somemethods for generating host–pathogeninteraction networks to improve our understanding of the interplaybetween host and pathogen during infection, not only using theM. tuberculosis–human interaction network as an example but alsoproviding use cases from other host–pathogen studies.
2. Use of biological networks for function prediction
The completion of several sequencing projects and other high-throughput biological technologies has generated complete genomesequences and functional genomics data for several organisms. Theabundance of these diverse biological data from various sources consti-tutes a rich source of knowledge, providing valuable insights into the
Please cite this article as: Mulder NJ, et al, Using biological networks todx.doi.org/10.1016/j.csbj.2014.08.006
ED P
RO
OF
dynamics driving collective and specific features of these organisms,and shedding light on the targeted organism's biology. Despite theuncontested successes recorded from comparative and functionalgenomics in gaining a better understanding of these organisms' biologyand evolution, a number of challenges still remain. One of the mainchallenges is the lack of functional annotations for a relatively highproportion of genes and thus proteins within genomes. From 20 to50% of genes within a genome are still annotated as ‘unknown’,‘uncharacterized’ or ‘hypothetical’, and this limits our ability to exploitthese data [8], leading to the paradigm of “a world which is data richyet information poor”. M. tuberculosis contains a large number of“uncharacterised” or “hypothetical” proteins, which limits our abilityboth to understand their role in thepathogenesis of TB and to determinetheir potential as drug targets.
Proteins perform an astonishing range of biological functions in anorganism, including roles as structural proteins, as enzymes and forthe transportation of materials within and between cells. Each proteinis a gene product that interacts with the cellular environment insome way to promote the cell's growth and function, implying thatknowledge of protein functions and their biological pathways is crucialfor understanding an organism's behaviour. Thus, one of themajor tasksin the post-genomic era is genome annotation, or assigning functions togene products in order to capitalize on the knowledge gained throughdifferent biological data produced. This requires a systematic descrip-tion of the attributes of genes and proteins without any ambiguityusing a standardized syntax and semantics in a format that is humanreadable and understandable, as well as interpretable computationally[9]. One of the biggest accomplishments in this area is the creation ofthe Gene Ontology (GO), which currently serves as the dominant andmost popular functional classification scheme for annotation and func-tional representation of genes and their products [10].
The initial computational approach for assigning functions to anuncharacterized protein uses sequence similarity search tools, such asthe Basic Local Alignment Search Tool (BLAST) [11]. This approach isreferred to as homology-based annotation transfer, providing a straight-forward scheme for suggesting possible functions for uncharacterizedproteins. The key assumption driving this approach is that two proteinswith significantly similar sequences are evolutionarily linked andmight thus share common functions. However, some factors limit itsapplicability; for example, no known sequence may be similar to thenovel protein sequence in the database, and above all, the most signifi-cant database hit may perform a different function due to gene duplica-tion events [12,13], domain shuffling events (deletions), or single pointmutations [14]. Several approaches that do not rely directly on sequencesimilarity have also been implemented, which include using informa-tion about gene fusions, phylogenetic profiles of protein families, geneadjacency in genomes and expression patterns [15]. Below we describethe concept of and algorithms for function prediction and the use of GOand biological networks to achieve this.
2.1. Protein function and Gene Ontology
From a mathematical point of view, transference of a functionallabel from a set A to a set B is a rule which associates each object(input) ‘x’ in A with most one object (output) ‘y’ in B. In this case, ‘y’represents the realization of ‘x’, called a function of ‘x’. For a functionto be well-defined one needs to know the two sets A and B and therule of associations of objects or realizations of all objects of A. Withoutloss of generality, a set is a collection of well-defined objects, and if Aand B are well described, then a function is completely determined byknowing just the realizations of objects. Similarly, assuming the contextand the scope of interest are known, protein function is a concept usedto describe all types of realizations or activities to which the proteincontributes, which take place within an organism, and which have con-sequences at the cellular and system levels [16]. Thus, the concept
improve our understanding of infectious diseases, (2014), http://
T
185
186
187
188
189
190
191
192
193
194
195
196
197
198
199
200
201
202
203
204
205
206
207
208Q16
209
210
211
212
213
214
215
216Q17
217
218
219
220
221
222
223
224
225
226Q18
227
228
229
230
231
232
233
234
235
236
237
238
239
240
241
242
243
244
245
246
247
248
249
250
251
252
253
254
255
256
257
258
259
260
261
262
263
264
265
266
267
268
269
270
t1:1
t1:2
t1:3
t1:4
t1:5
t1:6
t1:7
t1:8
t1:9
t1:10
t1:11
t1:12t1:13
t1:14Q1t1:15
t1:16
t1:17
t1:18
t1:19
t1:20
t1:21
t1:22
t1:23
t1:24
3N.J. Mulder et al. / Computational and Structural Biotechnology Journal xxx (2014) xxx–xxx
RREC
“protein function”maybe subjective and ambiguouswithout describingthe context and the scope of interest.
This observation suggests that protein function assignment requiresthe characterization of protein contributions using well-definedand structured vocabularies specifying the aspect and the context sur-rounding these contributions. GO [10] provides a way of consistentlydescribing genes and proteins in three key biological aspects of genesin a living cell, namely, description of the tasks that are carried out bythe proteins (molecular function, MF), their broad biological goals(biological process, BP), and the subcellular components, or locationswhere the activities are taking place (cellular component, CC) [8].These ontologies are engineered as a directed acyclic graph (DAG),and produce a well-adapted platform to computationally process dataat the functional level [17]. GOhas beenwidely adopted and successfullydeployed in several biological and biomedical applications, rangingfrom theoretical to experimental and computational biology [9].
2.2. Protein function prediction algorithms
Producing high-quality and accurate protein functions is challeng-ing, as manual or experimental approaches are expensive and time-consuming, so the number of manually determined protein functionsavailable for a particular genome is usually far fewer than that producedby computational or electronic approaches. Furthermore, findingfunctions of uncharacterized proteins experimentally is challengingfor several reasons; for example function may be specifically related tothe native environment in which a particular organism lives, the genemay have no use in the laboratory environment, or it may be impossibleto imitate the natural host, with its myriad of other micro-organisms.Therefore we cannot always determine the exact function of a gene orgene product by experiments alone [16]. As a result, protein functionsassigned using computational approaches are dominant and this isthe most likely future trend as they currently represent more than99% of annotations in the GO annotation (GOA-UniProtKB) dataset(http://www.ebi.ac.uk/GOA/uniprot_release).
As an illustration, for the pathogen M. tuberculosis (MTB) strainCDC1551, available data shows 4202 protein coding genes, but only2694 are annotated, with a total of 1114, 2282 and 2322 proteins char-acterized with respect to the CC, MF and BP ontologies, respectively, asextracted from the latest version of GOA (version 130, released on 15April, 2014: http://www.ebi.ac.uk/GOA/proteomes). From these, only166, 44 and 98 entries contain annotations manually assigned withrespect to the CC, MF and BP ontologies, respectively. It is worth men-tioning that the GO evidence codes found from the Experimental
UNCOTable 1
Proteins in MTB strain CDC1551 annotated with the same BP and MF ontology terms from elecassuming that the root of each ontology is located at level 0. The manual evidence code is prov
Protein GO ID GO term
Biological processQ7D8E1 GO:0045454 Cell redox homeostasisQ7D8E1 GO:0055114 Oxidation–reduction processP95276 GO:0008152 Metabolic processO07218 GO:0016998 Cell wall macromolecule catabolic processP71937 GO:0006355 Regulation of transcription, DNA-templatedP71971 GO:0006979 Response to oxidative stress
Molecular functionO53294 GO:0004497 Monooxygenase activityP0CF99 GO:0043750 Phosphatidylinositol alpha-mannosyltransferP96291 GO:0016747 Transferase activity, transferring acyl groupsQ7D4L9 GO:0008745 N-acetylmuramoyl-L-alanine amidase activityP71855 GO:0016747 Transferase activity, transferring acyl groupsP95001 GO:0004764 Shikimate 3-dehydrogenase (NADP+) activiO33342 GO:0004356 Glutamate-ammonia ligase activityP71828 GO:0003840 Gamma-glutamyltransferase activityQ7D8E1 GO:0015035 Protein disulfide oxidoreductase activityO53665 GO:0004316 3-Oxoacyl-[acyl-carrier-protein] reductase (NP96830 GO:0016791 Phosphatase activity
Please cite this article as: Mulder NJ, et al, Using biological networks todx.doi.org/10.1016/j.csbj.2014.08.006
ED P
RO
OF
category are: Inferred from Direct Assay (IDA), Inferred from PhysicalInteraction (IPI), Inferred from Mutant Phenotype (IMP), Inferredfrom Genetic Interaction (IPI) and Inferred from Expression Pattern(IEP), but the evidence code Inferred from Experiment (EXP) was notfound at all for this organism. Furthermore, we identified some cases(see Table 1 for five examples for BP and eleven for MF) of functionalinference inwhich functions predicted computationally or electronicallywere experimentally validated or vice versa.
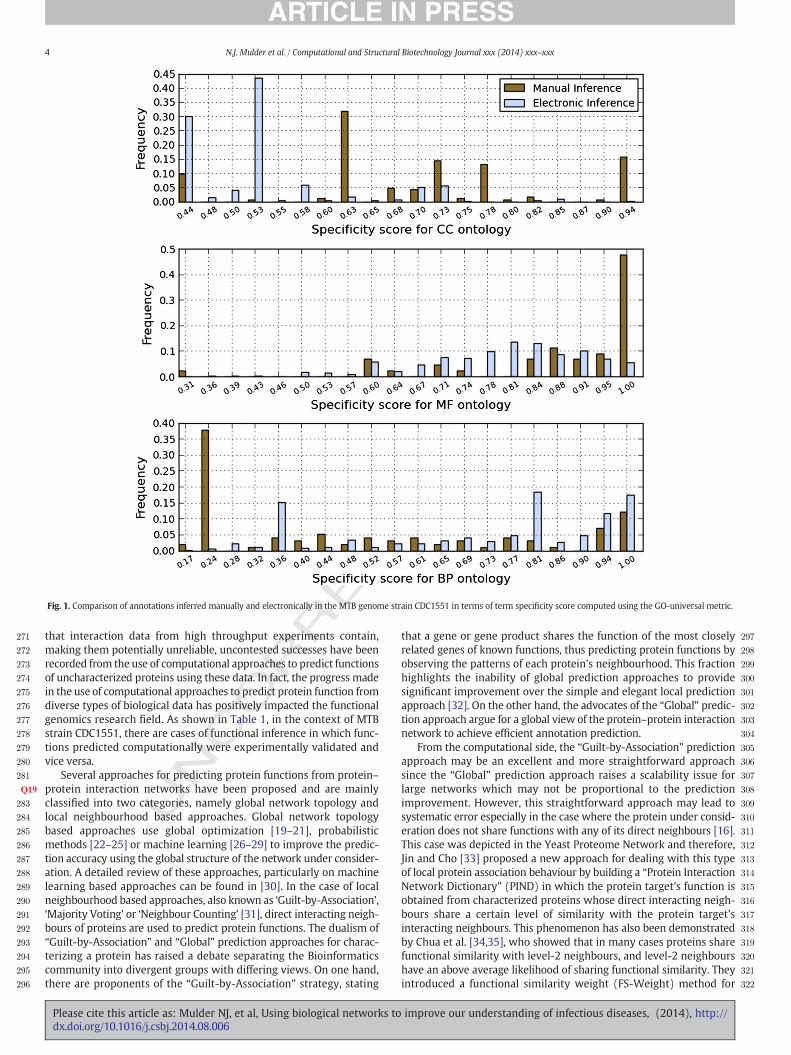
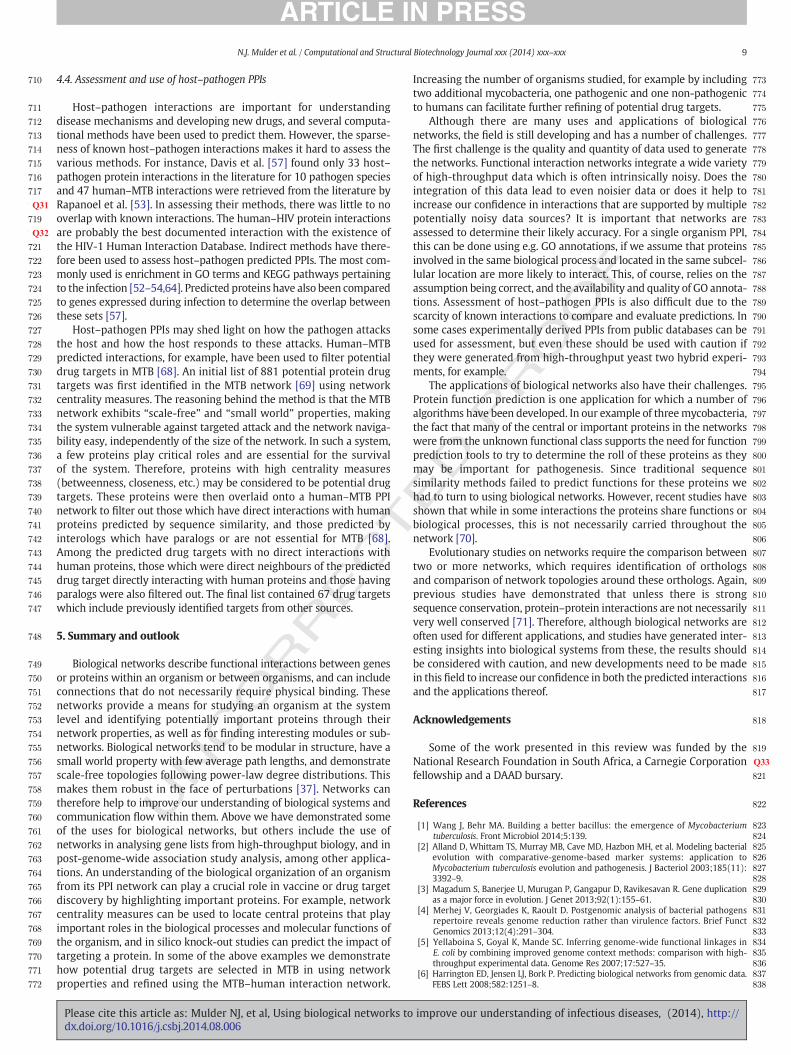
Before using computational methods for protein function predictionand annotationwith GO terms, we first analysed the specificity of termsinferred computationally and manually in annotated MTB proteins,using the GO-universal metric [8] to compute similarity betweenterms in a given ontology. Semantic similarity measures provide anumerical value for the similarity between two GO terms based ontheir position in the DAG and are used to differentiate between termsthat are related but differ because of their different levels of specificityand those that appear in different paths and are thus unrelated. Theresults in Fig. 1 indicate that sometimes computational approachesproduce more specific annotations, e.g. for the BP ontology, whilemanual inference provides more specific annotations for the CC andMF ontologies. The ideal is to predict the most specific term in theontology when annotating an uncharacterized protein, but this is hardto achieve since it requires enough experimental evidence when usingmanual inference or more information for electronic inference. Fig. 1indicates that there are instances where manual inference producesmore specific annotations compared to electronic inference and otherswhere electronic inference provides more specific annotationsthan manual inference. This suggests that the best route toward theelucidation of the function of uncharacterized proteins may include acombination of experimental approaches and predictions throughcomputational analysis [5]. Here we focus on computational prediction.
Based on the fact that a protein does not achieve its function alonebut cooperates with other proteins to perform that function, severalapproaches have been adopted for the use of the structure of protein–protein interaction networks for predicting protein functions. Thisapproach provides the advantage of alleviating the impact of thereliability issue of data from different experiments which can be noisy.Combining information frommultiple sources into one unified networkshould lead to higher confidence and increased coverage, and improvethe prediction analyses performed on the basis of these networks [18].There are several goals that a function prediction algorithm needs tomeet, which include improvement in annotation quality and genomiccoverage, i.e., to increase the proportion of genes or gene products in agenome which are annotated [16]. Despite the high degree of noise
tronic and manual inferences. The level indicates the level of the GO term in the GO DAG,ided, together with the source of electronic inferences.
Level Evidence code, source
5 TAS/IDA, InterPro3 IDA, GOC1 IDA, GOC6 IDA, InterPro8 IDA, InterPro3 IMP, InterPro
3 IDA, UniProt, IEA UniProtase activity 5 IDA, UniProtother than amino-acyl groups 4 IDA, InterPro
5 IDA, InterProother than amino-acyl groups 4 IDA, InterProty 5 TAS/IDA, InterPro/UniProt
6 IDA, InterPro6 IDA, InterPro/UniProt5 IDA, InterPro
ADPH) activity 6 IDA, UniProt5 IDA, InterPro
improve our understanding of infectious diseases, (2014), http://
ECTED P
RO
OF
271
272
273
274
275
276
277
278
279
280
281
282Q19
283
284
285
286
287
288
289
290
291
292
293
294
295
296
297
298
299
300
301
302
303
304
305
306
307
308
309
310
311
312
313
314
315
316
317
318
319
320
321
322
Fig. 1. Comparison of annotations inferred manually and electronically in the MTB genome strain CDC1551 in terms of term specificity score computed using the GO-universal metric.
4 N.J. Mulder et al. / Computational and Structural Biotechnology Journal xxx (2014) xxx–xxx
UNCO
RRthat interaction data from high throughput experiments contain,
making them potentially unreliable, uncontested successes have beenrecorded from the use of computational approaches to predict functionsof uncharacterized proteins using these data. In fact, the progress madein the use of computational approaches to predict protein function fromdiverse types of biological data has positively impacted the functionalgenomics research field. As shown in Table 1, in the context of MTBstrain CDC1551, there are cases of functional inference in which func-tions predicted computationally were experimentally validated andvice versa.
Several approaches for predicting protein functions from protein–protein interaction networks have been proposed and are mainlyclassified into two categories, namely global network topology andlocal neighbourhood based approaches. Global network topologybased approaches use global optimization [19–21], probabilisticmethods [22–25] or machine learning [26–29] to improve the predic-tion accuracy using the global structure of the network under consider-ation. A detailed review of these approaches, particularly on machinelearning based approaches can be found in [30]. In the case of localneighbourhood based approaches, also known as ‘Guilt-by-Association’,‘Majority Voting’ or ‘Neighbour Counting’ [31], direct interacting neigh-bours of proteins are used to predict protein functions. The dualism of“Guilt-by-Association” and “Global” prediction approaches for charac-terizing a protein has raised a debate separating the Bioinformaticscommunity into divergent groups with differing views. On one hand,there are proponents of the “Guilt-by-Association” strategy, stating
Please cite this article as: Mulder NJ, et al, Using biological networks todx.doi.org/10.1016/j.csbj.2014.08.006
that a gene or gene product shares the function of the most closelyrelated genes of known functions, thus predicting protein functions byobserving the patterns of each protein's neighbourhood. This fractionhighlights the inability of global prediction approaches to providesignificant improvement over the simple and elegant local predictionapproach [32]. On the other hand, the advocates of the “Global” predic-tion approach argue for a global view of the protein–protein interactionnetwork to achieve efficient annotation prediction.
From the computational side, the “Guilt-by-Association” predictionapproach may be an excellent and more straightforward approachsince the “Global” prediction approach raises a scalability issue forlarge networks which may not be proportional to the predictionimprovement. However, this straightforward approach may lead tosystematic error especially in the case where the protein under consid-eration does not share functions with any of its direct neighbours [16].This case was depicted in the Yeast Proteome Network and therefore,Jin and Cho [33] proposed a new approach for dealing with this typeof local protein association behaviour by building a “Protein InteractionNetwork Dictionary” (PIND) in which the protein target's function isobtained from characterized proteins whose direct interacting neigh-bours share a certain level of similarity with the protein target'sinteracting neighbours. This phenomenon has also been demonstratedby Chua et al. [34,35], who showed that in many cases proteins sharefunctional similarity with level-2 neighbours, and level-2 neighbourshave an above average likelihood of sharing functional similarity. Theyintroduced a functional similarity weight (FS-Weight) method for
improve our understanding of infectious diseases, (2014), http://
T
323
324
325
326
327
328
329
330
331
332
333Q20
334
335
336
337
338
339
340
341
342
343
344Q21
345
346
347
348
349
350
351
352
353
354
355
356
357
358
359
360
361
362
363
364
365
366
367
368
369
370
371
372
373
374
375
376
377
378
379
380
381
382
383
384
385
386
387
388
389Q22
390
391
392
393
394
395
396
397
398
399
400
401
402
403
5N.J. Mulder et al. / Computational and Structural Biotechnology Journal xxx (2014) xxx–xxx
REC
predicting protein functions from protein interaction data using level-1and level-2 neighbours.
2.3. Deploying GO in genome annotation analysis
A general shortcoming of different function prediction approachesand genome annotation analyses is that they do not always effectivelyconsider the structure of the ontology being used to predict thesefunctions. In some cases, such as in the use of GO slim, the level atwhich a term can be considered to be specific or informative in theontology hierarchy isfixed in order to doGO termcomparison. However,it is evident thatwhile using a subset of GO terms or a reduced version ofGO, such as GO slim, to compare genes which makes GO terms andannotations easier to work with, valuable information is lost in thesimplification [9]. This partial coverage of the annotation structuremay, therefore, compromise the prediction outcomes and annotationanalyses [16].
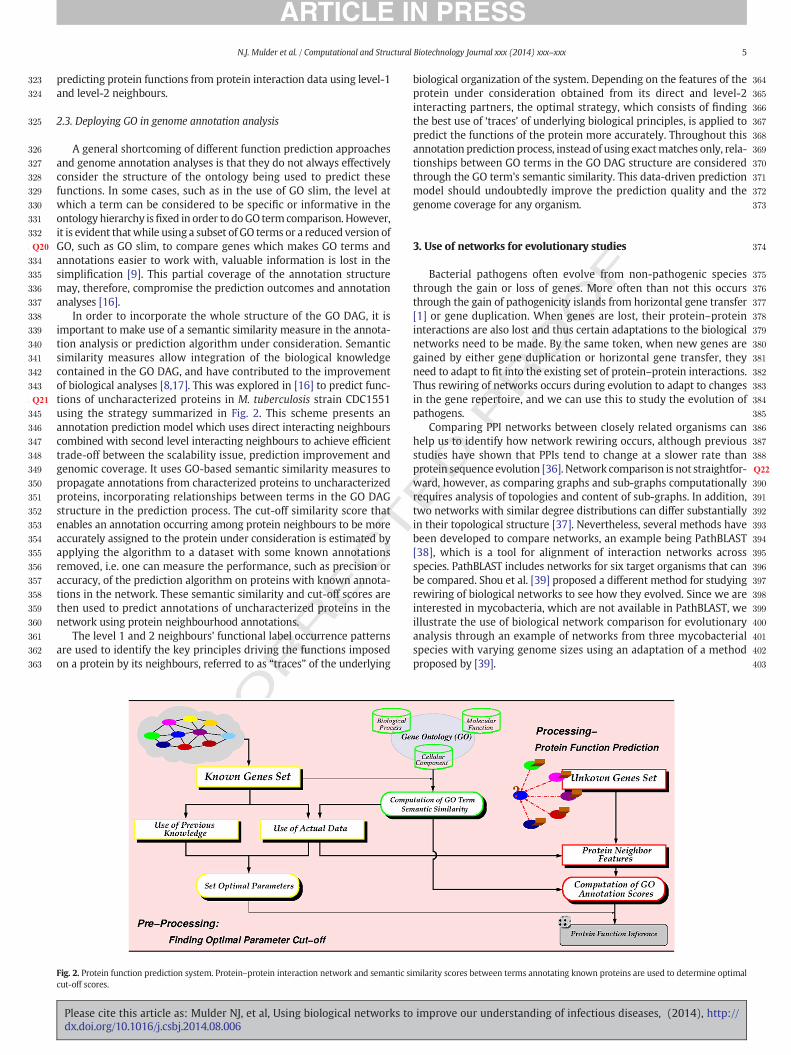
In order to incorporate the whole structure of the GO DAG, it isimportant to make use of a semantic similarity measure in the annota-tion analysis or prediction algorithm under consideration. Semanticsimilarity measures allow integration of the biological knowledgecontained in the GO DAG, and have contributed to the improvementof biological analyses [8,17]. This was explored in [16] to predict func-tions of uncharacterized proteins in M. tuberculosis strain CDC1551using the strategy summarized in Fig. 2. This scheme presents anannotation prediction model which uses direct interacting neighbourscombined with second level interacting neighbours to achieve efficienttrade-off between the scalability issue, prediction improvement andgenomic coverage. It uses GO-based semantic similarity measures topropagate annotations from characterized proteins to uncharacterizedproteins, incorporating relationships between terms in the GO DAGstructure in the prediction process. The cut-off similarity score thatenables an annotation occurring among protein neighbours to be moreaccurately assigned to the protein under consideration is estimated byapplying the algorithm to a dataset with some known annotationsremoved, i.e. one can measure the performance, such as precision oraccuracy, of the prediction algorithm on proteins with known annota-tions in the network. These semantic similarity and cut-off scores arethen used to predict annotations of uncharacterized proteins in thenetwork using protein neighbourhood annotations.
The level 1 and 2 neighbours' functional label occurrence patternsare used to identify the key principles driving the functions imposedon a protein by its neighbours, referred to as “traces” of the underlying
UNCO
R
Fig. 2. Protein function prediction system. Protein–protein interaction network and semantic scut-off scores.
Please cite this article as: Mulder NJ, et al, Using biological networks todx.doi.org/10.1016/j.csbj.2014.08.006
biological organization of the system. Depending on the features of theprotein under consideration obtained from its direct and level-2interacting partners, the optimal strategy, which consists of findingthe best use of ‘traces’ of underlying biological principles, is applied topredict the functions of the protein more accurately. Throughout thisannotation prediction process, instead of using exactmatches only, rela-tionships between GO terms in the GO DAG structure are consideredthrough the GO term's semantic similarity. This data-driven predictionmodel should undoubtedly improve the prediction quality and thegenome coverage for any organism.
ED P
RO
OF
3. Use of networks for evolutionary studies
Bacterial pathogens often evolve from non-pathogenic speciesthrough the gain or loss of genes. More often than not this occursthrough the gain of pathogenicity islands from horizontal gene transfer[1] or gene duplication. When genes are lost, their protein–proteininteractions are also lost and thus certain adaptations to the biologicalnetworks need to be made. By the same token, when new genes aregained by either gene duplication or horizontal gene transfer, theyneed to adapt to fit into the existing set of protein–protein interactions.Thus rewiring of networks occurs during evolution to adapt to changesin the gene repertoire, and we can use this to study the evolution ofpathogens.
Comparing PPI networks between closely related organisms canhelp us to identify how network rewiring occurs, although previousstudies have shown that PPIs tend to change at a slower rate thanprotein sequence evolution [36]. Network comparison is not straightfor-ward, however, as comparing graphs and sub-graphs computationallyrequires analysis of topologies and content of sub-graphs. In addition,two networks with similar degree distributions can differ substantiallyin their topological structure [37]. Nevertheless, several methods havebeen developed to compare networks, an example being PathBLAST[38], which is a tool for alignment of interaction networks acrossspecies. PathBLAST includes networks for six target organisms that canbe compared. Shou et al. [39] proposed a different method for studyingrewiring of biological networks to see how they evolved. Since we areinterested in mycobacteria, which are not available in PathBLAST, weillustrate the use of biological network comparison for evolutionaryanalysis through an example of networks from three mycobacterialspecies with varying genome sizes using an adaptation of a methodproposed by [39].
imilarity scores between terms annotating known proteins are used to determine optimal
improve our understanding of infectious diseases, (2014), http://
T
404
405
406
407
408
409
410
411
412
413
414
415
416
417
418
419
420
421
422
423
424
425
426
427
428
429
430
431
432
433
434
435
436
437
438
439
440
441
442
443
444
445Q23
446
447
448
449
450
451
453453
454
455
456
457
458
459
461461
462
463
464
465
466
467
468
469
470
471
472
473
474
475
476
477
478
479
480
481
482
483
484
485
486
487
488
489
490
491
492
493Q24
494
495
496
497
498
499
500
t2:1
t2:2
t2:3
t2:4
t2:5
t2:6
t2:7
t2:8
t2:9
t2:10
t2:11
6 N.J. Mulder et al. / Computational and Structural Biotechnology Journal xxx (2014) xxx–xxx
NCO
RREC
3.1. Functional interaction networks for the three mycobacteria
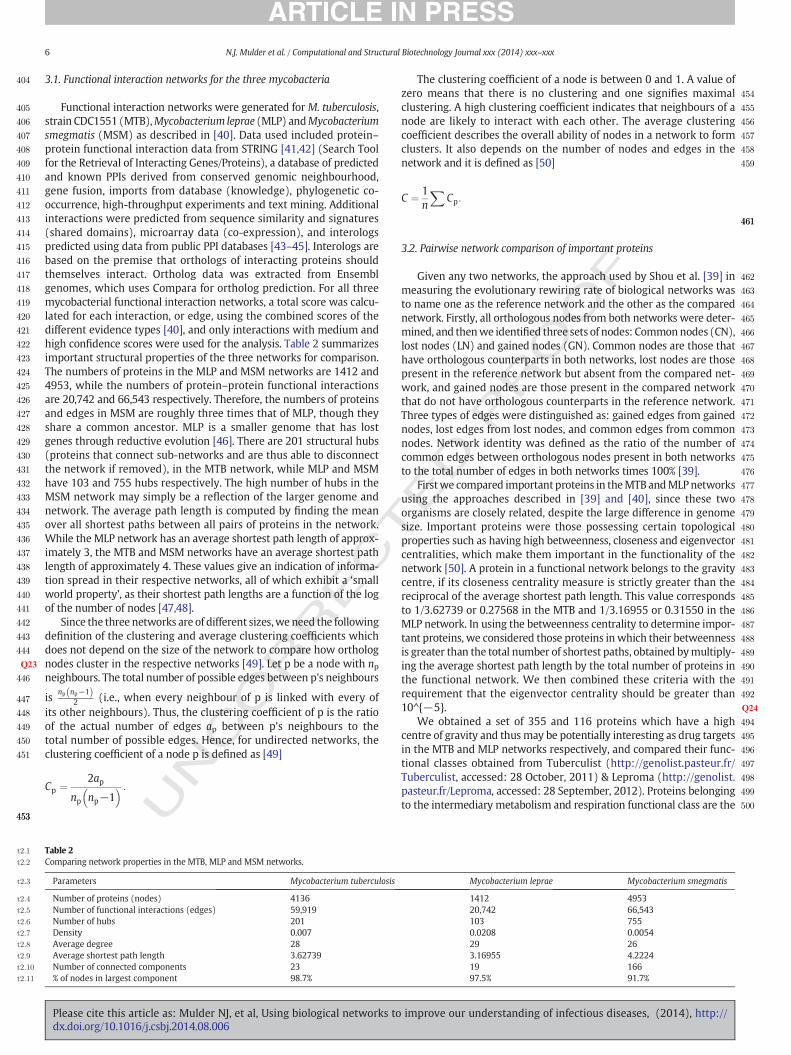
Functional interaction networks were generated for M. tuberculosis,strain CDC1551 (MTB),Mycobacterium leprae (MLP) andMycobacteriumsmegmatis (MSM) as described in [40]. Data used included protein–protein functional interaction data from STRING [41,42] (Search Toolfor the Retrieval of Interacting Genes/Proteins), a database of predictedand known PPIs derived from conserved genomic neighbourhood,gene fusion, imports from database (knowledge), phylogenetic co-occurrence, high-throughput experiments and text mining. Additionalinteractions were predicted from sequence similarity and signatures(shared domains), microarray data (co-expression), and interologspredicted using data from public PPI databases [43–45]. Interologs arebased on the premise that orthologs of interacting proteins shouldthemselves interact. Ortholog data was extracted from Ensemblgenomes, which uses Compara for ortholog prediction. For all threemycobacterial functional interaction networks, a total score was calcu-lated for each interaction, or edge, using the combined scores of thedifferent evidence types [40], and only interactions with medium andhigh confidence scores were used for the analysis. Table 2 summarizesimportant structural properties of the three networks for comparison.The numbers of proteins in the MLP and MSM networks are 1412 and4953, while the numbers of protein–protein functional interactionsare 20,742 and 66,543 respectively. Therefore, the numbers of proteinsand edges in MSM are roughly three times that of MLP, though theyshare a common ancestor. MLP is a smaller genome that has lostgenes through reductive evolution [46]. There are 201 structural hubs(proteins that connect sub-networks and are thus able to disconnectthe network if removed), in the MTB network, while MLP and MSMhave 103 and 755 hubs respectively. The high number of hubs in theMSM network may simply be a reflection of the larger genome andnetwork. The average path length is computed by finding the meanover all shortest paths between all pairs of proteins in the network.While the MLP network has an average shortest path length of approx-imately 3, the MTB and MSM networks have an average shortest pathlength of approximately 4. These values give an indication of informa-tion spread in their respective networks, all of which exhibit a ‘smallworld property’, as their shortest path lengths are a function of the logof the number of nodes [47,48].
Since the three networks are of different sizes,we need the followingdefinition of the clustering and average clustering coefficients whichdoes not depend on the size of the network to compare how ortholognodes cluster in the respective networks [49]. Let p be a node with npneighbours. The total number of possible edges between p's neighbours
isnp np−1ð Þ
2 (i.e., when every neighbour of p is linked with every ofits other neighbours). Thus, the clustering coefficient of p is the ratioof the actual number of edges ap between p's neighbours to thetotal number of possible edges. Hence, for undirected networks, theclustering coefficient of a node p is defined as [49]
Cp ¼ 2ap
np np−1� � :
U
Table 2Comparing network properties in the MTB, MLP and MSM networks.
Parameters Mycobacterium tuberculosis
Number of proteins (nodes) 4136Number of functional interactions (edges) 59,919Number of hubs 201Density 0.007Average degree 28Average shortest path length 3.62739Number of connected components 23% of nodes in largest component 98.7%
Please cite this article as: Mulder NJ, et al, Using biological networks todx.doi.org/10.1016/j.csbj.2014.08.006
ED P
RO
OF
The clustering coefficient of a node is between 0 and 1. A value ofzero means that there is no clustering and one signifies maximalclustering. A high clustering coefficient indicates that neighbours of anode are likely to interact with each other. The average clusteringcoefficient describes the overall ability of nodes in a network to formclusters. It also depends on the number of nodes and edges in thenetwork and it is defined as [50]
C ¼ 1n
XCp:
3.2. Pairwise network comparison of important proteins
Given any two networks, the approach used by Shou et al. [39] inmeasuring the evolutionary rewiring rate of biological networks wasto name one as the reference network and the other as the comparednetwork. Firstly, all orthologous nodes from both networks were deter-mined, and thenwe identified three sets of nodes: Commonnodes (CN),lost nodes (LN) and gained nodes (GN). Common nodes are those thathave orthologous counterparts in both networks, lost nodes are thosepresent in the reference network but absent from the compared net-work, and gained nodes are those present in the compared networkthat do not have orthologous counterparts in the reference network.Three types of edges were distinguished as: gained edges from gainednodes, lost edges from lost nodes, and common edges from commonnodes. Network identity was defined as the ratio of the number ofcommon edges between orthologous nodes present in both networksto the total number of edges in both networks times 100% [39].
Firstwe compared important proteins in theMTB andMLPnetworksusing the approaches described in [39] and [40], since these twoorganisms are closely related, despite the large difference in genomesize. Important proteins were those possessing certain topologicalproperties such as having high betweenness, closeness and eigenvectorcentralities, which make them important in the functionality of thenetwork [50]. A protein in a functional network belongs to the gravitycentre, if its closeness centrality measure is strictly greater than thereciprocal of the average shortest path length. This value correspondsto 1/3.62739 or 0.27568 in the MTB and 1/3.16955 or 0.31550 in theMLP network. In using the betweenness centrality to determine impor-tant proteins, we considered those proteins in which their betweennessis greater than the total number of shortest paths, obtained bymultiply-ing the average shortest path length by the total number of proteins inthe functional network. We then combined these criteria with therequirement that the eigenvector centrality should be greater than10^{−5}.
We obtained a set of 355 and 116 proteins which have a highcentre of gravity and thusmay be potentially interesting as drug targetsin the MTB and MLP networks respectively, and compared their func-tional classes obtained from Tuberculist (http://genolist.pasteur.fr/Tuberculist, accessed: 28 October, 2011) & Leproma (http://genolist.pasteur.fr/Leproma, accessed: 28 September, 2012). Proteins belongingto the intermediary metabolism and respiration functional class are the
Mycobacterium leprae Mycobacterium smegmatis
1412 495320,742 66,543103 7550.0208 0.005429 263.16955 4.222419 16697.5% 91.7%
improve our understanding of infectious diseases, (2014), http://
T
501
502
503
504
505
506
507
508
509
510
511
512Q25
513
514
515
516
517
518
519
520
521
522
523
524
525
526
527
528
529
530
531
532
533Q26
534
535
536
537
538
539
540
541
542
543
544
545
546
547
548
549
550
551
552Q27
553
554
555
556
557
558
559
560
561
562
563
564
565
566
567
568
569
570
571
572
573
574
575
576
577Q28
578
579
580
581
582
583
584
t3:1
t3:2
t3:3
t3:4Q2
t3:5
t3:6
t3:7
t4:1Table 4t4:2Number of common nodes, edges and network identity of the compared sub-networkst4:3containing only orthologous proteins.
t4:4A B # of Q3edgesin A only
# of edgesin B only
# of commonproteins
# of commonedges
Networkidentity
t4:5MLP MTB 13,670 9941 1001 2820 11.9%t4:6MLP MSM 13,670 5086 1001 1849 9.8%t4:7MSM MTB 5086 9941 1001 656 4.3%
7N.J. Mulder et al. / Computational and Structural Biotechnology Journal xxx (2014) xxx–xxx
UNCO
RREC
most represented in these lists of potential drug targets, followed by theunknown classes for MTB and information pathways for MLP. Amongthese potential drug targets, we extracted those proteins with highcloseness which are classified as central proteins, and influentialproteins, which are those with high eigenvector centralities. 241 and69 are the central and influential targets respectively in the MTBnetwork, while 95 and 37 are the central and influential targets respec-tively in MLP. Due to the unavailability of curated functional classes forMSM at the time of writing, we were unable to make the same kind ofcomparison as with MLP. However, we identified 294 potential drugtargets in the MSM network and of these, 184 were central targetproteins and 16 were influential target proteins.
We used the technique described in [39] to identify a total of 2859proteins in the MTB network without a corresponding ortholog inthe MLP network and 135 proteins in the MLP network without corre-sponding orthologs in the MTB network. In total, 1277 proteins haveorthologous counterparts in both networks as shown in Table 3.Similarly, 2148 distinct proteins belong to the MTB network withoutcorresponding orthologs in the MSM network, 2965 proteins in theMSM network have no corresponding orthologs in the MTB network,and 1988 proteins have orthologous counterparts in both networks.Out of the 1412 proteins in the MLP proteome, only 342 have noorthologous counterpart in the MSM network, and 3883 proteins inMSM have no corresponding ortholog in MLP. Table 3 includes thetotal number of common edges to the two organisms being compared.A common edge is an edge in which both protein pairs are correspond-ing orthologs in both networks and are interologs. There are 3693functional interactions or edges common to theMTBandMLPnetworks,2284 edges are common to the MSM and MTB networks, while 1901edges are common to MLP andMSM.We found a total of 1001 proteinswhich have orthologous counterparts in all three organisms, and thesenetworks all share 297 common edges. Based on the classification ofproteins as drug central and influential targets and using the 1001orthologs in their intersection, we found eight drug targets and oneinfluential target overlapping among the three organisms.
3.3. Evolutionary differences between the three mycobacterial species
Wecompared the three networks using orthologs [39] and followinga three-way approach: slow grower MTB versus slow grower MLP, fastgrower MSM versus MLP, and MTB versus MSM [51]. From the originalnetworks, we removed proteins and functional interactions involvingproteins that were not among the 1001 orthologs shared by all threeorganisms to produce three sub-networks each consisting of 1001proteins. We then determined the number of shared edges for theorthologs and used this to calculate network identities for the threesub-networks (Table 4). The results in Tables 3 and 4 show that theMLP and MTB sub-networks are more similar than the MTB versusMSM and MLP versus MSM sub-networks, which makes sense as theyare more closely related and both are slow growers [51].
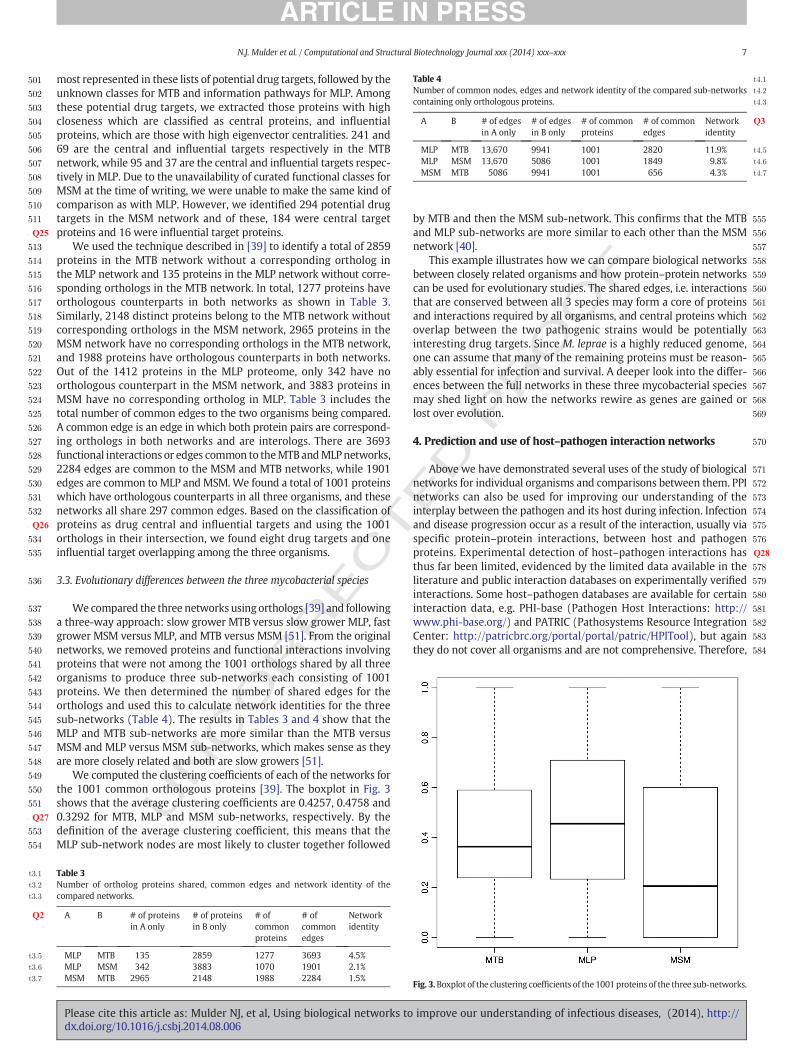
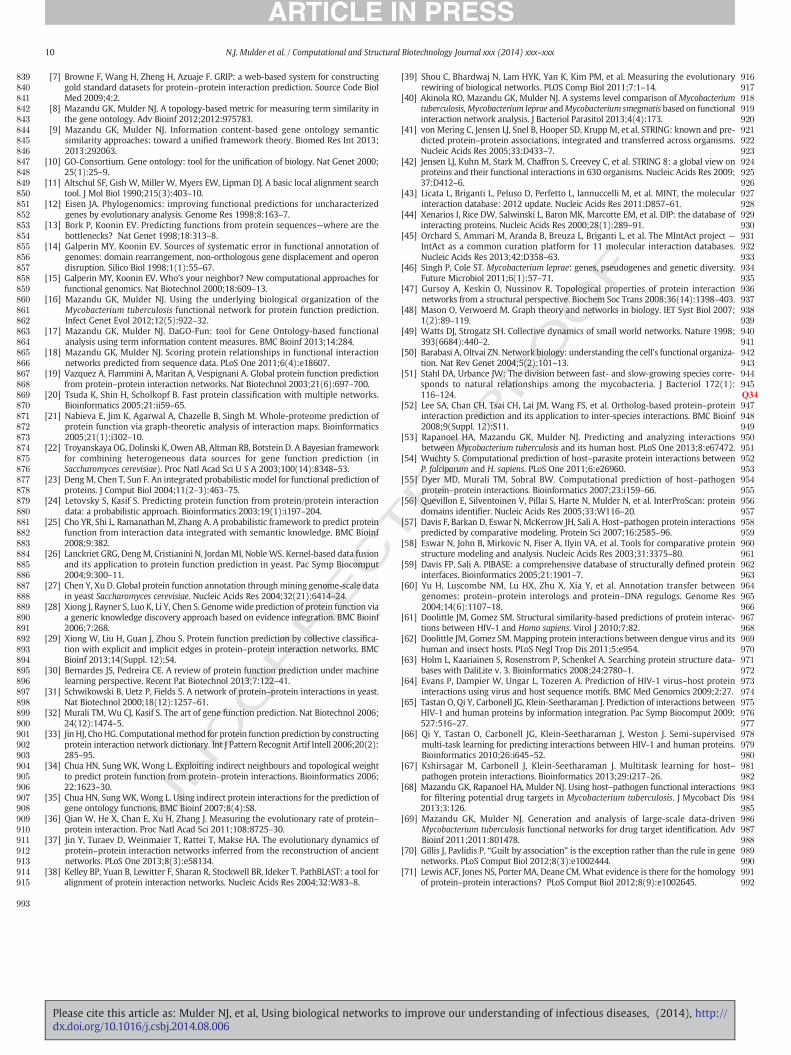
We computed the clustering coefficients of each of the networks forthe 1001 common orthologous proteins [39]. The boxplot in Fig. 3shows that the average clustering coefficients are 0.4257, 0.4758 and0.3292 for MTB, MLP and MSM sub-networks, respectively. By thedefinition of the average clustering coefficient, this means that theMLP sub-network nodes are most likely to cluster together followed
Table 3Number of ortholog proteins shared, common edges and network identity of thecompared networks.
A B # of proteinsin A only
# of proteinsin B only
# ofcommonproteins
# ofcommonedges
Networkidentity
MLP MTB 135 2859 1277 3693 4.5%MLP MSM 342 3883 1070 1901 2.1%MSM MTB 2965 2148 1988 2284 1.5%
Please cite this article as: Mulder NJ, et al, Using biological networks todx.doi.org/10.1016/j.csbj.2014.08.006
ED P
RO
OF
by MTB and then the MSM sub-network. This confirms that the MTBand MLP sub-networks are more similar to each other than the MSMnetwork [40].
This example illustrates how we can compare biological networksbetween closely related organisms and how protein–protein networkscan be used for evolutionary studies. The shared edges, i.e. interactionsthat are conserved between all 3 species may form a core of proteinsand interactions required by all organisms, and central proteins whichoverlap between the two pathogenic strains would be potentiallyinteresting drug targets. Since M. leprae is a highly reduced genome,one can assume that many of the remaining proteins must be reason-ably essential for infection and survival. A deeper look into the differ-ences between the full networks in these three mycobacterial speciesmay shed light on how the networks rewire as genes are gained orlost over evolution.
4. Prediction and use of host–pathogen interaction networks
Above we have demonstrated several uses of the study of biologicalnetworks for individual organisms and comparisons between them. PPInetworks can also be used for improving our understanding of theinterplay between the pathogen and its host during infection. Infectionand disease progression occur as a result of the interaction, usually viaspecific protein–protein interactions, between host and pathogenproteins. Experimental detection of host–pathogen interactions hasthus far been limited, evidenced by the limited data available in theliterature and public interaction databases on experimentally verifiedinteractions. Some host–pathogen databases are available for certaininteraction data, e.g. PHI-base (Pathogen Host Interactions: http://www.phi-base.org/) and PATRIC (Pathosystems Resource IntegrationCenter: http://patricbrc.org/portal/portal/patric/HPITool), but againthey do not cover all organisms and are not comprehensive. Therefore,
Fig. 3.Boxplot of the clustering coefficients of the 1001 proteins of the three sub-networks.
improve our understanding of infectious diseases, (2014), http://
T
585
586
587
588
589
590
591
592
593
594
595
596
597
598
599
600
601
602
603
604
605
606
607
608
609
610
611
612
613
614
615
616
617
618
619
620
621
622
623
624
625
626
627
628
629
630
631
632
633
634
635
636
637
638
639
640
641
642
643
644
645
646
647
648
649
650
651
652
653
654
655
656
657
658
659
660
661
662
663
664
665
666
667
668
669
670
671
672
673
674
675
676
677
678Q29
679
680
681
682
683
684
685
686
687
688
689
690
691
692
693
694
695
696
697
698
699
700
701
702
703
704Q30
705
706
707
708
709
8 N.J. Mulder et al. / Computational and Structural Biotechnology Journal xxx (2014) xxx–xxx
UNCO
RREC
many computational biologists have turned to the computationalprediction of these interactions. Prediction of host–pathogen protein–protein interaction networks can be broadly classified into threegroups depending on the methods used to predict the interactions.The first group consists of methods using interologs, the second usesprotein domains and structure, and the last group uses machinelearning.
4.1. Prediction using interologs
Interologs, which are conserved interactions between a pair ofproteins which have interacting orthologs in another organism, havebeen widely applied to predict inter-species interactions. Starting froman intra-species (or inter-species) protein interaction AB (also referredto as a template interaction), the orthologs A′ and B′ of A and B in thespecies of interest are determined and an interaction between A′ andB′ is inferred. Interactions betweenHomo sapiens and various pathogenssuch as Plasmodium falciparum (PF) and M. tuberculosis have beenpredicted using this method [52,53]. Although the interolog methodsyield a large number of interactions, most of them are not likely totake place in vivo. Therefore the interactions predicted by interologsneed to be filtered to obtain plausible interactions. For instance, Leeet al. [52] applied two filters to the human–PF predicted interactions.In thefirstfilter, humanproteins annotatedwithGO cellular componentmaking their interactions with PF proteins impossible were removed,and in the second, only PF proteins having the specific translocationsignal RELXE/Q required to translocate the proteins into erythrocytecytoplasm, at the N-terminal were retained. Wuchty [54] applied arandom forest algorithm to assess the quality of the interactions basedon the sequence composition of the proteins. The interactions werefurther filtered based on molecular characteristics of the PF proteinsthat allow interactions with the human host and localization of theprotein pair which are more probable for an interaction to take place.Rapanoel et al. [53] applied various filters to the human–MTBinteractions. Using experimentally verified interactions, only predictedinteractionswhich are neighbours of the knownones in the PPI networkwere retained, and interactions where both proteins were differentiallyexpressed in microarray data relevant to the infection process wereprioritized.
4.2. Prediction using protein domain and structure
Protein domains determine the structure and function of proteins.Interactions between two proteins are mediated by these domains;this idea has been used to predict PPIs. For instance, Dyer et al. [55]used protein domain profiles combined with Bayesian statistics topredict interactions between human and P. falciparum. Starting withintra-species PPI datasets, they use Bayesian statistics to first calculatethe probability that two proteins containing two functional domainsinteract. Then, the domains in all human and PF proteins were foundusing InterProScan [56] and the previously computed probability wasused to compute the probability of every human–PF protein pair tointeract. A cut-off of 0.5 was used to decide whether two proteinsinteract or not.
Another hypothesis used in PPI prediction is that a pair of proteinshaving structures similar to known interacting protein pairs is likely tointeract. Davis et al. [57] used sequence and structural similarities topredict interactions between human and 10 different pathogens. Theprotein structure of the host and parasite proteins was modelled usingMODPIPE [58] and pairs of human–pathogen proteins with similarityto known interactions from PIBASE [59] were then identified. Sequencesimilarity was used in the absence of structure. In this case, two humanand pathogen proteins interact if each of the two proteins has at least50% sequence similarity to components of binary protein interactionswith joint sequence identity N80% from IntAct [45], where thejoint sequence identity is the geometric mean of individual percent
Please cite this article as: Mulder NJ, et al, Using biological networks todx.doi.org/10.1016/j.csbj.2014.08.006
ED P
RO
OF
identities [60]. Biological filters such as expression in tissues targetedby the pathogen and expression on the cell surface were furtherapplied. Predicted interactions based on templates used in morethan 1% of the total predictions were also removed, since they lackspecificity.
Protein structural similarity has also been used by Doolittle andGomez to predict interactions between HIV and human [61], andbetween dengue virus (DENV) and its two hosts, H. sapiens and themosquito vector Aedes aegypti[62]. In this method, human proteinsstructurally similar to HIV (or DENV) proteins were identified usingthe Dali Database [63]. The interactions of these HIV-similar (orDENV-similar) proteinswith other human proteins, referred to as targetproteins were then identified from the Human Protein ReferenceDatabase (HPRD: http://www.hprd.org/). After refinement, a physicalinteraction was predicted between the HIV protein and the humantarget protein. Interaction prediction between DENV and A. aegyptifollowed a similar procedure, except that Drosophila melanogaster wasfirst used to find the DENV-similar and target proteins. The orthologsof the D. melanogaster target proteins in the real host A. aegypti werethen used.
Evans et al. [64] used sequence motifs to predict HIV-1 and humanprotein interactions. In this case, the two previous methods by Dyeret al. and Davis et al. could not be applied because HIV-1 proteinshave few domains and their structures are hard to find. HIV-1 proteinswere annotated with short eukaryotic linear motifs (ELMs) using theELM resource, and counter domains (CDs) or proteins known to interactwith these ELMswere retrieved. The CDswere thenmapped to PROSITEdomains. In addition, PROSITE domains and ELMs on human proteinsequences from HPRD were also determined, and a host protein waspredicted to interact with a virus protein if the former binds to orcompetes with the latter. More precisely, a host protein P having a CDknown to interactwith the ELMof a virus protein can bind to it, whereasa host protein having an ELM similar to a virus protein competes with itfor interaction with P.
4.3. Prediction using machine learning
Tastan et al. [65] trained a random forest classifier to classify anHIV-1–human protein pair as interacting or non-interacting. The features forthe classification are based on human protein features such as expres-sion during or presence in tissues susceptible to HIV-1 infection.Graph properties of the human interactome, such as degree, clusteringcoefficient and betweenness centrality were also used as features.They also looked at some properties of HIV-1/human protein pairssuch as GO and sequence similarity. Qi et al. [66], on the other hand,used multi-task learning for predicting interactions between HIV-1and human proteins. Having two reference sets, labelled and partiallylabelled, they train a supervised classification using the labelled dataand the partially labelled data was then used to improve the supervisedclassification in a semi-supervised auxiliary task.
Kshirsagar et al. [67] applied a multi-task pathway-based learningmethod to computationally predict interactions between human andfour pathogens, namely Yersinia pestis, Francisella tularensis, Salmonellaand Bacillus anthracis. In this case, a task was the set of host–pathogenproteins involved in one disease. They integrated interactions fromseveral tasks by using the task regularization framework andmodifyingthe regularization term to encode the biological hypothesis, whichis that the bacterial species will target the same biological pathwayin their human host. An advantage of the machine-learning approachis its ability to integrate various biological information resourcesin a statistical learning framework. However, a machine-learningapproach requires a large amount of training data, which is notavailable for many organisms. Furthermore, defining the features isnot straightforward and sometimes does not carry any biologicalmeaning.
improve our understanding of infectious diseases, (2014), http://
T
710
711
712
713
714
715
716
717
718Q31
719
720Q32
721
722
723
724
725
726
727
728
729
730
731
732
733
734
735
736
737
738
739
740
741
742
743
744
745
746
747
748
749
750
751
752
753
754
755
756
757
758
759
760
761
762
763
764
765
766
767
768
769
770
771
772
773
774
775
776
777
778
779
780
781
782
783
784
785
786
787
788
789
790
791
792
793
794
795
796
797
798
799
800
801
802
803
804
805
806
807
808
809
810
811
812
813
814
815
816
817
818
819
820Q33
821
822
823824825826827828829830831832833834835836837838
9N.J. Mulder et al. / Computational and Structural Biotechnology Journal xxx (2014) xxx–xxx
UNCO
RREC
4.4. Assessment and use of host–pathogen PPIs
Host–pathogen interactions are important for understandingdisease mechanisms and developing new drugs, and several computa-tional methods have been used to predict them. However, the sparse-ness of known host–pathogen interactions makes it hard to assess thevarious methods. For instance, Davis et al. [57] found only 33 host–pathogen protein interactions in the literature for 10 pathogen speciesand 47 human–MTB interactions were retrieved from the literature byRapanoel et al. [53]. In assessing their methods, there was little to nooverlap with known interactions. The human–HIV protein interactionsare probably the best documented interaction with the existence ofthe HIV-1 Human Interaction Database. Indirect methods have there-fore been used to assess host–pathogen predicted PPIs. The most com-monly used is enrichment in GO terms and KEGG pathways pertainingto the infection [52–54,64]. Predicted proteins have also been comparedto genes expressed during infection to determine the overlap betweenthese sets [57].
Host–pathogen PPIs may shed light on how the pathogen attacksthe host and how the host responds to these attacks. Human–MTBpredicted interactions, for example, have been used to filter potentialdrug targets in MTB [68]. An initial list of 881 potential protein drugtargets was first identified in the MTB network [69] using networkcentrality measures. The reasoning behind the method is that the MTBnetwork exhibits “scale-free” and “small world” properties, makingthe system vulnerable against targeted attack and the network naviga-bility easy, independently of the size of the network. In such a system,a few proteins play critical roles and are essential for the survivalof the system. Therefore, proteins with high centrality measures(betweenness, closeness, etc.) may be considered to be potential drugtargets. These proteins were then overlaid onto a human–MTB PPInetwork to filter out those which have direct interactions with humanproteins predicted by sequence similarity, and those predicted byinterologs which have paralogs or are not essential for MTB [68].Among the predicted drug targets with no direct interactions withhuman proteins, those which were direct neighbours of the predicteddrug target directly interacting with human proteins and those havingparalogs were also filtered out. The final list contained 67 drug targetswhich include previously identified targets from other sources.
5. Summary and outlook
Biological networks describe functional interactions between genesor proteins within an organism or between organisms, and can includeconnections that do not necessarily require physical binding. Thesenetworks provide a means for studying an organism at the systemlevel and identifying potentially important proteins through theirnetwork properties, as well as for finding interesting modules or sub-networks. Biological networks tend to be modular in structure, have asmall world property with few average path lengths, and demonstratescale-free topologies following power-law degree distributions. Thismakes them robust in the face of perturbations [37]. Networks cantherefore help to improve our understanding of biological systems andcommunication flow within them. Above we have demonstrated someof the uses for biological networks, but others include the use ofnetworks in analysing gene lists from high-throughput biology, and inpost-genome-wide association study analysis, among other applica-tions. An understanding of the biological organization of an organismfrom its PPI network can play a crucial role in vaccine or drug targetdiscovery by highlighting important proteins. For example, networkcentrality measures can be used to locate central proteins that playimportant roles in the biological processes and molecular functions ofthe organism, and in silico knock-out studies can predict the impact oftargeting a protein. In some of the above examples we demonstratehow potential drug targets are selected in MTB in using networkproperties and refined using the MTB–human interaction network.
Please cite this article as: Mulder NJ, et al, Using biological networks todx.doi.org/10.1016/j.csbj.2014.08.006
ED P
RO
OF
Increasing the number of organisms studied, for example by includingtwo additional mycobacteria, one pathogenic and one non-pathogenicto humans can facilitate further refining of potential drug targets.
Although there are many uses and applications of biologicalnetworks, the field is still developing and has a number of challenges.The first challenge is the quality and quantity of data used to generatethe networks. Functional interaction networks integrate a wide varietyof high-throughput data which is often intrinsically noisy. Does theintegration of this data lead to even noisier data or does it help toincrease our confidence in interactions that are supported by multiplepotentially noisy data sources? It is important that networks areassessed to determine their likely accuracy. For a single organism PPI,this can be done using e.g. GO annotations, if we assume that proteinsinvolved in the same biological process and located in the same subcel-lular location are more likely to interact. This, of course, relies on theassumption being correct, and the availability and quality of GO annota-tions. Assessment of host–pathogen PPIs is also difficult due to thescarcity of known interactions to compare and evaluate predictions. Insome cases experimentally derived PPIs from public databases can beused for assessment, but even these should be used with caution ifthey were generated from high-throughput yeast two hybrid experi-ments, for example.
The applications of biological networks also have their challenges.Protein function prediction is one application for which a number ofalgorithms have been developed. In our example of threemycobacteria,the fact that many of the central or important proteins in the networkswere from the unknown functional class supports the need for functionprediction tools to try to determine the roll of these proteins as theymay be important for pathogenesis. Since traditional sequencesimilarity methods failed to predict functions for these proteins wehad to turn to using biological networks. However, recent studies haveshown that while in some interactions the proteins share functions orbiological processes, this is not necessarily carried throughout thenetwork [70].
Evolutionary studies on networks require the comparison betweentwo or more networks, which requires identification of orthologsand comparison of network topologies around these orthologs. Again,previous studies have demonstrated that unless there is strongsequence conservation, protein–protein interactions are not necessarilyvery well conserved [71]. Therefore, although biological networks areoften used for different applications, and studies have generated inter-esting insights into biological systems from these, the results shouldbe considered with caution, and new developments need to be madein this field to increase our confidence in both the predicted interactionsand the applications thereof.
Acknowledgements
Some of the work presented in this review was funded by theNational Research Foundation in South Africa, a Carnegie Corporationfellowship and a DAAD bursary.
References
[1] Wang J, Behr MA. Building a better bacillus: the emergence of Mycobacteriumtuberculosis. Front Microbiol 2014;5:139.
[2] Alland D, Whittam TS, Murray MB, Cave MD, Hazbon MH, et al. Modeling bacterialevolution with comparative-genome-based marker systems: application toMycobacterium tuberculosis evolution and pathogenesis. J Bacteriol 2003;185(11):3392–9.
[3] Magadum S, Banerjee U, Murugan P, Gangapur D, Ravikesavan R. Gene duplicationas a major force in evolution. J Genet 2013;92(1):155–61.
[4] Merhej V, Georgiades K, Raoult D. Postgenomic analysis of bacterial pathogensrepertoire reveals genome reduction rather than virulence factors. Brief FunctGenomics 2013;12(4):291–304.
[5] Yellaboina S, Goyal K, Mande SC. Inferring genome-wide functional linkages inE. coli by combining improved genome context methods: comparison with high-throughput experimental data. Genome Res 2007;17:527–35.
[6] Harrington ED, Jensen LJ, Bork P. Predicting biological networks from genomic data.FEBS Lett 2008;582:1251–8.
improve our understanding of infectious diseases, (2014), http://
T
839840841842843844845846847848849850851852853854855856857858859860861862863864865866867868869870871872873874875876877878879880881882883884885886887888889890891892893894895896897898899900901902903904905906907908909910911912913914915
916917918919920921922923924925926927928929930931932933934935936937938939940941942943944945946Q34947948949950951952953954955956957958959960961962963964965966967968969970971972973974975976977978979980981982983984985986987988989990991992
993
10 N.J. Mulder et al. / Computational and Structural Biotechnology Journal xxx (2014) xxx–xxx
UNCO
RREC
[7] Browne F, Wang H, Zheng H, Azuaje F. GRIP: a web-based system for constructinggold standard datasets for protein–protein interaction prediction. Source Code BiolMed 2009;4:2.
[8] Mazandu GK, Mulder NJ. A topology-based metric for measuring term similarity inthe gene ontology. Adv Bioinf 2012;2012:975783.
[9] Mazandu GK, Mulder NJ. Information content-based gene ontology semanticsimilarity approaches: toward a unified framework theory. Biomed Res Int 2013;2013:292063.
[10] GO-Consortium. Gene ontology: tool for the unification of biology. Nat Genet 2000;25(1):25–9.
[11] Altschul SF, Gish W, Miller W, Myers EW, Lipman DJ. A basic local alignment searchtool. J Mol Biol 1990;215(3):403–10.
[12] Eisen JA. Phylogenomics: improving functional predictions for uncharacterizedgenes by evolutionary analysis. Genome Res 1998;8:163–7.
[13] Bork P, Koonin EV. Predicting functions from protein sequences—where are thebottlenecks? Nat Genet 1998;18:313–8.
[14] Galperin MY, Koonin EV. Sources of systematic error in functional annotation ofgenomes: domain rearrangement, non-orthologous gene displacement and operondisruption. Silico Biol 1998;1(1):55–67.
[15] Galperin MY, Koonin EV. Who's your neighbor? New computational approaches forfunctional genomics. Nat Biotechnol 2000;18:609–13.
[16] Mazandu GK, Mulder NJ. Using the underlying biological organization of theMycobacterium tuberculosis functional network for protein function prediction.Infect Genet Evol 2012;12(5):922–32.
[17] Mazandu GK, Mulder NJ. DaGO-Fun: tool for Gene Ontology-based functionalanalysis using term information content measures. BMC Bioinf 2013;14:284.
[18] Mazandu GK, Mulder NJ. Scoring protein relationships in functional interactionnetworks predicted from sequence data. PLoS One 2011;6(4):e18607.
[19] Vazquez A, Flammini A, Maritan A, Vespignani A. Global protein function predictionfrom protein–protein interaction networks. Nat Biotechnol 2003;21(6):697–700.
[20] Tsuda K, Shin H, Scholkopf B. Fast protein classification with multiple networks.Bioinformatics 2005;21:ii59–65.
[21] Nabieva E, Jim K, Agarwal A, Chazelle B, Singh M. Whole-proteome prediction ofprotein function via graph-theoretic analysis of interaction maps. Bioinformatics2005;21(1):i302–10.
[22] Troyanskaya OG, Dolinski K, Owen AB, Altman RB, Botstein D. A Bayesian frameworkfor combining heterogeneous data sources for gene function prediction (inSaccharomyces cerevisiae). Proc Natl Acad Sci U S A 2003;100(14):8348–53.
[23] DengM, Chen T, Sun F. An integrated probabilistic model for functional prediction ofproteins. J Comput Biol 2004;11(2–3):463–75.
[24] Letovsky S, Kasif S. Predicting protein function from protein/protein interactiondata: a probabilistic approach. Bioinformatics 2003;19(1):i197–204.
[25] Cho YR, Shi L, Ramanathan M, Zhang A. A probabilistic framework to predict proteinfunction from interaction data integrated with semantic knowledge. BMC Bioinf2008;9:382.
[26] Lanckriet GRG, DengM, Cristianini N, JordanMI, NobleWS. Kernel-based data fusionand its application to protein function prediction in yeast. Pac Symp Biocomput2004;9:300–11.
[27] Chen Y, Xu D. Global protein function annotation throughmining genome-scale datain yeast Saccharomyces cerevisiae. Nucleic Acids Res 2004;32(21):6414–24.
[28] Xiong J, Rayner S, Luo K, Li Y, Chen S. Genomewide prediction of protein function viaa generic knowledge discovery approach based on evidence integration. BMC Bioinf2006;7:268.
[29] Xiong W, Liu H, Guan J, Zhou S. Protein function prediction by collective classifica-tion with explicit and implicit edges in protein–protein interaction networks. BMCBioinf 2013;14(Suppl. 12):S4.
[30] Bernardes JS, Pedreira CE. A review of protein function prediction under machinelearning perspective. Recent Pat Biotechnol 2013;7:122–41.
[31] Schwikowski B, Uetz P, Fields S. A network of protein–protein interactions in yeast.Nat Biotechnol 2000;18(12):1257–61.
[32] Murali TM, Wu CJ, Kasif S. The art of gene function prediction. Nat Biotechnol 2006;24(12):1474–5.
[33] Jin HJ, ChoHG. Computationalmethod for protein function prediction by constructingprotein interaction network dictionary. Int J Pattern Recognit Artif Intell 2006;20(2):285–95.
[34] Chua HN, Sung WK, Wong L. Exploiting indirect neighbours and topological weightto predict protein function from protein–protein interactions. Bioinformatics 2006;22:1623–30.
[35] Chua HN, SungWK,Wong L. Using indirect protein interactions for the prediction ofgene ontology functions. BMC Bioinf 2007;8(4):S8.
[36] Qian W, He X, Chan E, Xu H, Zhang J. Measuring the evolutionary rate of protein–protein interaction. Proc Natl Acad Sci 2011;108:8725–30.
[37] Jin Y, Turaev D, Weinmaier T, Rattei T, Makse HA. The evolutionary dynamics ofprotein–protein interaction networks inferred from the reconstruction of ancientnetworks. PLoS One 2013;8(3):e58134.
[38] Kelley BP, Yuan B, Lewitter F, Sharan R, Stockwell BR, Ideker T. PathBLAST: a tool foralignment of protein interaction networks. Nucleic Acids Res 2004;32:W83–8.
Please cite this article as: Mulder NJ, et al, Using biological networks todx.doi.org/10.1016/j.csbj.2014.08.006
ED P
RO
OF
[39] Shou C, Bhardwaj N, Lam HYK, Yan K, Kim PM, et al. Measuring the evolutionaryrewiring of biological networks. PLOS Comp Biol 2011;7:1–14.
[40] Akinola RO, Mazandu GK, Mulder NJ. A systems level comparison of Mycobacteriumtuberculosis,Mycobacterium leprae andMycobacterium smegmatis based on functionalinteraction network analysis. J Bacteriol Parasitol 2013;4(4):173.
[41] von Mering C, Jensen LJ, Snel B, Hooper SD, Krupp M, et al. STRING: known and pre-dicted protein–protein associations, integrated and transferred across organisms.Nucleic Acids Res 2005;33:D433–7.
[42] Jensen LJ, Kuhn M, Stark M, Chaffron S, Creevey C, et al. STRING 8: a global view onproteins and their functional interactions in 630 organisms. Nucleic Acids Res 2009;37:D412–6.
[43] Licata L, Briganti L, Peluso D, Perfetto L, Iannuccelli M, et al. MINT, the molecularinteraction database: 2012 update. Nucleic Acids Res 2011:D857–61.
[44] Xenarios I, Rice DW, Salwinski L, Baron MK, Marcotte EM, et al. DIP: the database ofinteracting proteins. Nucleic Acids Res 2000;28(1):289–91.
[45] Orchard S, Ammari M, Aranda B, Breuza L, Briganti L, et al. The MIntAct project —IntAct as a common curation platform for 11 molecular interaction databases.Nucleic Acids Res 2013;42:D358–63.
[46] Singh P, Cole ST. Mycobacterium leprae: genes, pseudogenes and genetic diversity.Future Microbiol 2011;6(1):57–71.
[47] Gursoy A, Keskin O, Nussinov R. Topological properties of protein interactionnetworks from a structural perspective. Biochem Soc Trans 2008;36(14):1398–403.
[48] Mason O, Verwoerd M. Graph theory and networks in biology. IET Syst Biol 2007;1(2):89–119.
[49] Watts DJ, Strogatz SH. Collective dynamics of small world networks. Nature 1998;393(6684):440–2.
[50] Barabasi A, Oltvai ZN. Network biology: understanding the cell's functional organiza-tion. Nat Rev Genet 2004;5(2):101–13.
[51] Stahl DA, Urbance JW: The division between fast- and slow-growing species corre-sponds to natural relationships among the mycobacteria. J Bacteriol 172(1):116–124.
[52] Lee SA, Chan CH, Tsai CH, Lai JM, Wang FS, et al. Ortholog-based protein–proteininteraction prediction and its application to inter-species interactions. BMC Bioinf2008;9(Suppl. 12):S11.
[53] Rapanoel HA, Mazandu GK, Mulder NJ. Predicting and analyzing interactionsbetween Mycobacterium tuberculosis and its human host. PLoS One 2013;8:e67472.
[54] Wuchty S. Computational prediction of host–parasite protein interactions betweenP. falciparum and H. sapiens. PLoS One 2011;6:e26960.
[55] Dyer MD, Murali TM, Sobral BW. Computational prediction of host–pathogenprotein–protein interactions. Bioinformatics 2007;23:i159–66.
[56] Quevillon E, Silventoinen V, Pillai S, Harte N, Mulder N, et al. InterProScan: proteindomains identifier. Nucleic Acids Res 2005;33:W116–20.
[57] Davis F, Barkan D, Eswar N, McKerrow JH, Sali A. Host–pathogen protein interactionspredicted by comparative modeling. Protein Sci 2007;16:2585–96.
[58] Eswar N, John B, Mirkovic N, Fiser A, Ilyin VA, et al. Tools for comparative proteinstructure modeling and analysis. Nucleic Acids Res 2003;31:3375–80.
[59] Davis FP, Sali A. PIBASE: a comprehensive database of structurally defined proteininterfaces. Bioinformatics 2005;21:1901–7.
[60] Yu H, Luscombe NM, Lu HX, Zhu X, Xia Y, et al. Annotation transfer betweengenomes: protein–protein interologs and protein–DNA regulogs. Genome Res2004;14(6):1107–18.
[61] Doolittle JM, Gomez SM. Structural similarity-based predictions of protein interac-tions between HIV-1 and Homo sapiens. Virol J 2010;7:82.
[62] Doolittle JM, Gomez SM. Mapping protein interactions between dengue virus and itshuman and insect hosts. PLoS Negl Trop Dis 2011;5:e954.
[63] Holm L, Kaariainen S, Rosenstrom P, Schenkel A. Searching protein structure data-bases with DaliLite v. 3. Bioinformatics 2008;24:2780–1.
[64] Evans P, Dampier W, Ungar L, Tozeren A. Prediction of HIV-1 virus–host proteininteractions using virus and host sequence motifs. BMC Med Genomics 2009;2:27.
[65] Tastan O, Qi Y, Carbonell JG, Klein-Seetharaman J. Prediction of interactions betweenHIV-1 and human proteins by information integration. Pac Symp Biocomput 2009;527:516–27.
[66] Qi Y, Tastan O, Carbonell JG, Klein-Seetharaman J, Weston J. Semi-supervisedmulti-task learning for predicting interactions between HIV-1 and human proteins.Bioinformatics 2010;26:i645–52.
[67] Kshirsagar M, Carbonell J, Klein-Seetharaman J. Multitask learning for host–pathogen protein interactions. Bioinformatics 2013;29:i217–26.
[68] Mazandu GK, Rapanoel HA, Mulder NJ. Using host–pathogen functional interactionsfor filtering potential drug targets in Mycobacterium tuberculosis. J Mycobact Dis2013;3:126.
[69] Mazandu GK, Mulder NJ. Generation and analysis of large-scale data-drivenMycobacterium tuberculosis functional networks for drug target identification. AdvBioinf 2011;2011:801478.
[70] Gillis J, Pavlidis P. “Guilt by association” is the exception rather than the rule in genenetworks. PLoS Comput Biol 2012;8(3):e1002444.
[71] Lewis ACF, Jones NS, Porter MA, Deane CM.What evidence is there for the homologyof protein–protein interactions? PLoS Comput Biol 2012;8(9):e1002645.
improve our understanding of infectious diseases, (2014), http://


