Embed Size (px)
Citation preview

Communicable Diseases Intelligence
SupplementAntimicrobial Resistance in Australia
Volume 27 2003
Communicable Diseases Network AustraliaA national network for communicable diseases surveillance

Communicable Diseases Intelligence
Antimicrobial resistance in Australia
Volume 27
Supplement
2003

© Commonwealth of Australia 2002
ISBN: 0 642 82030 9
This work is copyright. Apart from any use as permitted under the Copyright Act 1968, no part may bereproduced by any process without prior written permission from the Commonwealth available from theDepartment of Communications, Information Technology and the Arts. Requests and inquiries concerningreproduction and rights should be addressed to the Manager, Copyright Services, Info Access, GPO Box 1920,Canberra ACT 2601.
EditorJenean Spencer
Editorial and Production StaffJenean Spencer, Paul Roche, Ming Lin, Alison Milton, Lynne Hawker, Patricia Hurtado
Editorial Advisory BoardCharles Watson (Chair), Mary Beers, Margaret Burgess, Scott Cameron, John Kaldor, Cathy Mead
Websitehttp://www.health.gov.au/pubhlth/cdi/cdihtml.htm
Subscriptions and contactsCommunicable Diseases Intelligence is produced every quarter by:
Surveillance and Epidemiology SectionCommunicable Diseases and Health Protection BranchDepartment of Health and AgeingGPO Box 9848, (MDP 6)CANBERRA ACT 2601;Phone: +61 2 6289 8245Facsimile: +61 2 6289 7791E-mail: [email protected].
This journal is indexed by Index Medicus, Medline and the Australasian Medical Index.
Disclaimer
Opinions expressed in Communicable Diseases Intelligence are those of the authors and not necessarily thoseof the Department of Health and Ageing or the Communicable Diseases Network Australia. Data may besubject to revision.
Front cover: prepared by PPU, Department of Health and Ageing
Printed by Union Offset, Canberra
Publications Approval number: 3249 (JN7560)

ContentsEditorial: Antimicrobial resistance in Australia ..........................................................................S1Paul Roche, Jenean Spencer
Introduction: progress in the development of a national antibiotic resistance management program ..............................................................................................................S5Alexandra Geue
Regulation of veterinary antibiotics in Australia ........................................................................S6TM Dyke
Improving antibiotic use: 25 years of antibiotic guidelines and related initiatives ......................S9
Ken Harvey, Jonathan Dartnell, Mary Hemming
Active promotion of antibiotic guidelines: an intensive program ..............................................S13Susan M Tiley, Jennifer J MacDonald, Paula L Dohert y, John K Ferguson, John E Fergusson
State-wide surveillance of in-hospital antimicrobial utilisation in South Australia ......................S19
Catherine M Dollman, Celia M Cooper
Restriction of third generation cephalosporin use reduces the incidence of Clostridium difficile–associated diarrhoea in hospitalised patients ............................................S28Claudia Thomas, Thomas V Riley
Changing GPs’ antibiotic prescribing: a randomised controlled trial..........................................S32
Eileen J Wilson, Dilruba Nasrin, Keith B G Dear, Robert M Douglas
Antibiotic prescribing for upper respiratory-tract infections in primary care ..............................S39Craig A Patterson, Judith M Mackson, Lynn M Weekes
Consumer activities on antimicrobial resistance in Australia ....................................................S42Jan Donovan
Fifteen years of surveillance by the Australian Group for Antimicrobial Resistance (AGAR) ......S47
Graeme R Nimmo, Jan M Bell, Peter J Collignon
Australian hospital morbidity data on antibiotic resistance ......................................................S55
Jenny Hargreaves, Jenny Kok
SENTRY Antimicrobial Surveillance Program Asia-Pacific region and South Africa ....................S61
Jan Bell, John Turnidge
TSN® Database Australia, a new tool to monitor antimicrobial resistance in Australia..............S67
John Turnidge, Laurence R McCarthy, Ronald N Master, Douglas E Kepner, James Weslock
Monitoring antimicrobial resistance for public health action ....................................................S70John W Tapsall
Ciprofloxacin resistance emerges in Neisseria gonorrhoeae in Victoria, 1998 to 2001 ..............S75Mark G K Veitch, Julia M Griffith, Melissa L Morgan
Antimicrobial Resistance in Australia iii

Antibiotic resistance in Campylobacter jejuni isolated from humans in the Hunter Region, New South Wales....................................................................................................................S80Hemant Sharma, Leanne Unicomb, Wendy Forbes, Steve Djordjevic, Mary Valcanis, Craig Dalton, John Ferguson
Low levels of fluoroquinolone resistance in Escherichia coli. A five-year trend in Australiameasured through the use of TSN® database Australia............................................................S89
John Turnidge, Laurence R McCarthy, Ronald N Master, Douglas E Kepner
Surveillance of hospital-acquired methicillin-resistant Staphylococcus aureus in South Australia ....S92Celia Cooper, Meredith A Ochota
Screening and electronic labelling of ward contacts of vancomycin–resistantEnterococcus faecium vanB carriers during a single-strain hospital outbreak andafter discharge from hospital ..................................................................................................S97
John W Pearman, Peta L Perry, Frank P Kosaras, Charles R Douglas, Rosie C Lee, Allison Peterson, C Terri Orrell, Claire H Khinsoe, Christopher H Heath, Keryn J Christiansen
Polymerase chain reaction screening for integrons can be used to complement resistancesurveillance programs ..........................................................................................................S103
Louisa A Jones, Christopher J McIver, William D Rawlinson, Peter A White
Towards a national surveillance program for antimicrobial resistance in animals and animal-derived food ..............................................................................................................S111Jonathan Webber, Angelo Valois
Surveillance for antibiotic resistant Escherichia coli in food animals ......................................S117David Jordan
Antibiotic resistance in animals ............................................................................................S121
Mary D Barton, Rachael Pratt, Wendy S Hart
Surveillance for antibiotic resistance in veterinary pathogens from the perspective of a regional diagnostic laboratory ........................................................................................S127Carol P Stephens
Australian Council on Healthcare Standards infection control clinical indicators ....................S132Kay L Richards, Dolly Olesen, Michael Whitby
Antibiotic resistance and the potential impact of pneumococcal conjugate vaccines..............S135Ron Dagan
Non-antibiotic therapies for infectious diseases ....................................................................S144
Christine F Carson, Thomas V Riley
Reviewers for CDI supplement 2003 on antimicrobial resistance ............................................S148
iv Antimicrobial Resistance in Australia

Editorial: Antimicrobial resistance in AustraliaPaul Roche, Jenean Spencer
Surveillance and Epidemiology Section, Department of Health and Ageing, Canberra, Australian Capital Territory
This supplement of Communicable Diseases Intelligence contains articles describing various aspects ofthe problem of antimicrobial resistance (AMR) in Australia. Three years ago, the Joint ExpertCommittee on Antibiotic Resistance (JETACAR) released a landmark report entitled The use ofantibiotics in food-producing animals: antibiotic-resistant bacteria in animals and humans. This reportreviewed the scientific evidence on the link between the use of antibiotics in food-producing animals,the emergence and selection of antibiotic resistant bacteria and their spread to humans. In addition,evidence based recommendations were made for the future management of antibiotic use in Australia.In all, 22 recommendations covering areas such as regulatory controls, monitoring and surveillance,infection prevention, education, research, communication and coordination were made. Thissupplement is an attempt to inform Australian prescribers, regulators and stakeholders on the currentstate of knowledge about various aspects of antimicrobial use, resistance and surveillance in humansand animals.
Articles were invited from recognised experts in January 2002. Thirty-two abstracts were received ofwhich 28 were peer-reviewed and accepted for this supplement. Papers have been grouped under thefollowing themes.
Introduction
Alexandra Geue, former Director of the Infection Management Section, Department of Health andAgeing, describes the progress towards a national antibiotic resistance management program sincethe JETACAR report. Tim Dyke from the National Registration Authority for Agricultural and VeterinaryChemicals, describes the regulation of veterinary antibiotics in Australia.
Education and prescribing
Management of antibiotic resistance starts with rational and appropriate use of antibiotics. The Antibiotic Guidelines has been an essential resource for Australian physicians to prescribeaccording to best practice. Harvey and colleagues describe 25 years of development of the Guidelinesand innovations designed to improve access to the Guidelines, for example by integration intoclinician’s electronic desktops.
Promotion of best practice prescribing guidelines in a tertiary hospital setting is described in thepaper by Tiley and colleagues. Guidelines for appropriate antibiotic use in the management ofpneumonia, surgical prophylaxis and wound infection were developed with restrictions on the use ofcertain antibiotics. Implementation of these guidelines in a variety of novel ways with regular reviewsseems to have already had an impact on the prevalence of vancomycin resistant enterococci andClostridium difficile infection in this hospital.
Innovative methods to measure antibiotic usage in South Australian hospitals are described byDollman and Cooper. Eight metropolitan public and private hospitals now electronically provide dataon antibiotic prescribing for four major classes of antibiotics to the Communicable Disease ControlBranch of the Department of Human Services, South Australia. These data will be used to monitortrends in antibiotic usage and to compare with trends in AMR. This experience will be useful indeveloping similar surveillance systems in other Australian jurisdictions.
Thomas and Riley provide evidence that restriction in the use of third generation cephalosporins canreduce the prevalence of Clostridium difficile associated diarrhoea, an indicator of inappropriateantibiotic use and antibiotic resistant bacteria. Rational use of antibiotics can control and evenreverse levels of antibiotic resistance in hospital settings.
Antimicrobial Resistance in Australia S1

Changing antibiotic prescribing practices in general practitioners (GPs) in Canberra was assessed bymeans of a randomised control trial conducted by Wilson and colleagues. Involving GPs in thedevelopment of evidence-based clinical guidelines for the treatment of acute respiratory infections ledto a significant decrease in the rate of prescribing. The National Prescribing Service offers GPseducation and audit of antibiotic prescribing. Patterson and colleagues describe the results of twoaudits of GP prescribing practices for otitis media (in 1999) and sinusitis (in 2000). Rates of inappro-priate antibiotic prescribing for upper respiratory tract infections by Australian GPs, however, remainshigh at around 50 per cent.
Consumer education programs through National Medicines Weeks (1996–1998) are described byDonovan. Consumer education has also been incorporated into the recent National Prescribing Servicecampaign Common colds need common sense, which aims to discourage inappropriate antibioticprescribing and consumption in people with common colds. Consumer education is an importantcontribution to the appropriate consumption of antibiotics in Australia.
Surveillance
Several groups and networks have been, and continue to be active in the surveillance of AMR inAustralia. The Australian Group for Antimicrobial Resistance have provided data on the prevalence ofAMR in important pathogens in Australia for the past 15 years. The paper by Nimmo and colleaguesprovides important high quality data on the prevalence of resistance to major antibiotics in importantpathogens in Australia.
The Australian Hospital Morbidity Database managed by the Australian Institute of Health and Welfareis a source of important data on antimicrobial resistance in Australian hospitals. An analysis of thesedata by International Classification of Disease codes specific for AMR infections between 1994–1995and 1998–1999 is given in the paper by Hargreaves and Kok.
Australian laboratories are part of regional surveillance networks monitoring AMR in the Asia Pacificregion and South Africa through the SENTRY antimicrobial surveillance program. The paper by Bell andTurnidge shows relatively moderate prevalence of antimicrobial resistance in Australia compared withother regional countries. The SENTRY program has published a number of significant reports over theyears and this paper provides regional data of importance to the management of antibiotic resistancein Australia.
Rapid and timely data on antimicrobial resistance has been difficult to achieve in Australia. Turnidgeand members of the Surveillance Network (TSN), describe a recent development in the automaticcollection and analysis of data from Australian laboratories. TSN has accumulated more than 14 million results since 1996 and provides subscribers with an interactive access to a database whichis growing at 300,000 records per month. Unfortunately access to these data are limited, althoughthe collection is now undoubtedly the most comprehensive in Australia.
John Tapsall describes the role of surveillance in the management of AMR illustrating this with dataon quinolone resistant gonococci and penicillin resistant meningococci in New South Wales between1995 and 2001. Development of resistance to quinolones in the gonococci has impacted on thetreatment of these infections, while penicillin remains a useful first-line treatment for meningococcalinfections since resistance to this antibiotic has not developed to the same extent.
A similar picture of increasing resistance to ciprofloxacin in gonococcal isolates in Victoria since thelate 1990s, with a particularly large increase in resistance in gonococcal infections acquired outsideAustralia, is shown in the paper by Veitch. Similarly, higher rates of resistance in Campylobacterinfections acquired overseas were observed by Sharma et al in their study of isolates from residentsof the Hunter region of New South Wales. This paper also provides evidence of the utility of ‘resisto-typing’ for describing the epidemiology of this common cause of bacterial gastroenteritis.
S2 Antimicrobial Resistance in Australia

Surveillance of major nosocomial infections are described in a trio of papers. Cooper describes anotherinnovative surveillance system from South Australia where state-wide monitoring of methicillinresistant Staphylococcus aureus has been in place since December 2000. Pearman describes anoutbreak of vancomycin resistant Enterococcus faecium in a Western Australian hospital in 2001 andnovel contact tracing and screening methods. An analysis of five years of data on quinolone resistancein E. coli in Australia from the TSN database is presented by Turnidge et al. Levels of resistance tothese antibiotics in this organism remain at low levels in Australia.
Rapid methods of identifying resistant organisms are urgently needed. Jones and colleagues describepolymerase chain reaction methods that screen for antibiotic resistance genes in integrons.Polymerase chain reaction methods may allow the rapid identification of resistance and aid in timelysurveillance.
Antibiotic resistance in animals
The JETACAR report confirmed that there was evidence of the spread of antibiotic resistant bacteriafrom animals to humans and recommended that the use of antibiotics in animals as growth promotantsbe limited. Further, JETACAR recommended the surveillance of antibiotic resistance bacteria in food-producing animals and veterinary areas. Four papers in this supplement address the surveillance ofantibiotic resistant bacteria in animals.
Webber and Valois survey the recommendations of the JETACAR report as regards surveillance inanimals, review surveillance programs in other countries and discuss strategies to implementsurveillance in Australia. Jordan discusses sampling methodologies for the surveillance of antibioticresistant Escherichia in food animals and describes a novel sampling method that has beensuccessfully trialed in dairy cattle in New South Wales.
Barton and colleagues review Australian data on resistance in bacteria from food producing andveterinary animals. Although data are sparse the resistance patterns detected are similar to thoseoverseas and reflect antibiotics used for growth promotion and treatment in animals. Veterinary datafrom a regional laboratory on cattle and pigs in Queensland (1999 to 2001) are presented in the paperby Stephens. This laboratory services an area that has 45 per cent of the State’s cattle and more thanhalf of Queensland’s pigs. Patterns of resistance detected in this setting need, however, to beinterpreted with caution because of the small and selective sample of animals tested.
Infection control
Two papers discuss methods and policies to reduce health care acquired infections. Nosocomialinfections in hospitals are frequently resistant to multiple antibiotics and are increasingly untreatablewith available medications. Prevention of such infections is a high priority in the management ofantibiotic resistance in Australia.
Richards and colleagues describe the work of the Australian Council on Healthcare Standards (ACHS)which has been developing infection control indicators in collaboration with medical associations andthe Australian Infection Control Association. These have been published in the 2002 edition of theACHS clinical indicators users’ manual. Standardised indicators aid surveillance and allowcomparisons of rates of antibiotic resistance over time and between institutions.
The Australian Council for Safety and Quality in Health Care provides a summary of the outcomes fromthe April 2002 National workshop to reduce health care associated infection. Five priority areas identifiedby the workshop have been passed on to the Council and Australian Health Ministers to guide policyin reducing health care associated infections.
Antimicrobial Resistance in Australia S3

Vaccines and alternative approaches to treatment.
The supplement concludes with two papers which discuss the potential impacts of vaccines andalternative therapies on the prevalence of AMR. Dagan discusses the potential for new seven-valentconjugate pneumococcal vaccines to reduce the levels of penicillin resistant Streptococcuspneumoniae. As this vaccine was recently introduced into Australia in a program aimed at children withvery high rates of disease and a substantial proportion of isolates from these cases are resistant totreatment with penicillin, the potential for this vaccine to control antibiotic resistance is of greatinterest.
Finally, Carson and Riley review non-antibiotic approaches to the treatment of infectious diseases.Probiotics, bacteriophages and phytomedicines are all approaches with potential for the control ofantibiotic resistance and there will be much activity in developing these therapies in the future.
The editors thank all contributors to this supplement on antibiotic resistance in Australia. We wouldlike to thank Alexandra Geue, Robyn Leader and Lindsay Blackburn of the Infection Management andTSE Section, Department of Health and Ageing, for initiating and coordinating the contributions forthis supplement. The editors believe this collection of articles will be an important referencecollection as national surveillance for antibiotic resistance commences and the management ofantibiotic resistance in Australia moves forward.
S4 Antimicrobial Resistance in Australia

Introduction: progress in the development of anational antibiotic resistance management program
Alexandra Geue, Infection Management Section, Department of Health and Ageing, Canberra, Australian Capital Territory
Since the release of The Commonwealth Government Response to the Report of the Joint Expert TechnicalAdvisory Group on Antibiotic Resistance (JETACAR) in October 2000, the government has continued itswork toward the development of a national antibiotic resistance management program.113
Two committees were established to further this aim:
• The Expert Advisory Group for Antimicrobial Resistance (EAGAR), was set up in April 2001 underthe auspices of the National Health and Medical Research Council, to provide continuing advice onantibiotic resistance and related matters; and
• The Commonwealth Interdepartmental JETACAR Implementation Group was established inNovember 2000, to oversee and coordinate the continuing government response to JETACAR, torespond to the policy advice received from EAGAR and to seek funding for implementationpurposes.
During 2001, EAGAR developed and commenced the use of a protocol to assess the risk of antibioticresistance developing in new and existing antibiotics.
Activities undertaken by the Commonwealth Interdepartmental JETACAR Implementation Group andits member agencies in 2001 include:
• an informal consultation meeting in March—The Monitoring of the Distribution of Antibiotics forVeterinary and Human Use in Australia; and
• the release in April of the draft report, National surveillance of healthcare associated infection inAustralia, for consultation.
Other important activities included:
• the workshop on Antibiotic Resistance Surveillance (4 May);
• the National Summit on Antibiotic Resistance (30 and 31 May);
• a nationwide consultation toward Development of a National Antibiotic Resistance SurveillanceSystem for Antibiotic Resistance Management (July to September); and
• the initiation of the EAGAR website—http://www.health.gov.au/pubhlth/strateg/jetacar/eagar.htm.
Progress reports on implementation of the Government Response are available on the implementingJETACAR website—http://www.health.gov.au/pubhlth/strateg/jetacar/index.htm.
Through the National Summit on Antibiotic Resistance, representatives from governments, health,agricultural, industry and consumer groups identified priorities for action. In particular, the need forthe development of a national system of surveillance for antibiotics was recognised. This system willinform improvements in current practice and health outcomes, including:
• improved education and awareness, leading to more appropriate use of antibiotics;
• clearer research focuses, and better communication and regulation;
• more effective linkages between corporate and peak organisational bodies;
• measurable reductions in prevalence of antibiotic resistance; and
• reduced incidence of health care–associated infections in Australia.
The Commonwealth Department of Agriculture, Fisheries and Forestry—Australia and the Departmentof Health and Ageing undertook a collaborative consultation process to develop a national system ofsurveillance for antibiotic resistance.
Antimicrobial Resistance in Australia S5

Regulation of veterinary antibiotics in AustraliaTM Dyke
AbstractThe Australian Pesticides and Veterinary Medicines Authority (APVMA)* registers veterinary antibioticproducts before they can be supplied, distributed or sold in Australia. Extensive scientific assessmenton all new veterinary antibiotic products is undertaken for the APVMA by experts in other governmentagencies including the Therapeutic Goods Administration (toxicology), the National OccupationalHealth and Safety Commission (occupational health and safety), Environment Australia (environmentalhazards) and state departments of agriculture or primary industry (efficacy and safety) as well asAPVMA assessments on food residues, trade and manufacturing. The National Health and MedicalResearch Council Expert Advisory Group on Antimicrobial Resistance provides advice to the APVMAon the potential transfer of antibiotic resistance from the use of antibiotics in animals to humans, andthe impact transfer may have on public health. Food Standards Australia New Zealand (previouslyAustralia New Zealand Food Authority) set maximum residue levels for human foods. The APVMAmonitors registered product use through compliance activities and an adverse experience reportingprogram, and reviews registered products as necessary. The import, manufacture, supply and use ofveterinary antibiotics are regulated by Commonwealth and State governments in Australia. CommunDis Intell 2003;27 Suppl:S6–S8.
Keywords: veterinary antibiotics, Australian Pesticides and Veterinary Medicines Authority
Import
All antibiotics must be imported since no antibiotics are manufactured in Australia. Antibiotics maybe imported in bulk or as a final product. Imported antibiotics, considered prohibited imports underCustoms legislation, can only pass border controls if accompanied by an import permit, issued by theTherapeutic Goods Administration. Data on imports are collected.
Manufacture
The Australian Pesticides and Veterinary Medicines Authority (APVMA) licenses all manufacturers ofproducts containing antibiotics for animal use, provided manufacturers demonstrate compliance withthe Good Manufacturing Practice principles.
Registration
The APVMA registers veterinary antibiotic products before they can be supplied, distributed or sold inAustralia. In basic terms the APVMA receives, evaluates and finalises applications to:
• approve active constituents;
• register products;
• approve labels; and
• vary particulars of active constituents, products or labels e.g., to allow use in another animalspecies.
S6 Antimicrobial Resistance in Australia
Correspondence: Dr Timothy Dyke, Principal Scientist, Veterinary Medicines, Australian Pesticides and Veterinary MedicinesAuthority, PO Box E240, Kingston ACT 2604. Telephone: +61 2 6272 5870. Facsimile: +61 2 6272 5249. Email: [email protected].

Extensive scientific assessment is undertaken for the APVMA by experts in other governmentagencies including the Therapeutic Goods Administration (toxicology, scheduling, and determining anacceptable daily intake), the National Occupational Health and Safety Commission (occupationalhealth and safety), Environment Australia (environmental hazards) and State departments ofagriculture or primary industry (efficacy and safety). In addition, the APVMA assesses residues infood. Maximum residue limits are established and are nominated to the Food Standards Australia NewZealand for inclusion in the Foods Standards Code. The National Health and Medical Research CouncilExpert Advisory Group on Antimicrobial Resistance provides advice to the APVMA on the potential fortransfer of antibiotic resistance from the use of antibiotics in animals to humans, and the impact thatsuch transfer may have on public health. A risk assessment approach for new antibiotics andsignificant extensions to the use of registered antibiotics is used. The important concepts of this riskassessment approach are:
1. Hazard: Antibiotic resistant microorganisms or plasmids coding for antibiotic resistance within ananimal species, arising from the use of an antibiotic in an animal species, have the potential totransfer to humans.
2. Exposure: the degree and frequency of exposure of susceptible humans to antibiotic-resistantmicroorganisms (or their plasmids) from animal sources;
3. Impact: the impact of infections caused by antibiotic-resistant pathogens of animal origin insusceptible humans;
4. Risk: the probability of infections caused by antibiotic-resistant pathogens of animal origin insusceptible humans AND the impact of such infections.
The focus is on commensals and enteric pathogens (and transferable genetic elements) that may beimportant to susceptible humans, not on target animal pathogens. Further development of thisapproach will occur as a result of an initiative to develop an internationally harmonised guideline fordata required for such risk assessments.
In order to register a product, the APVMA must be satisfied that the product is in accordance with therecommendations for its use that the APVMA proposes to approve:
• would not be an undue hazard to the safety of people exposed to it during its handling or to peopleusing anything containing its residues; and
• would not be likely to have an effect that is harmful to human beings; and
• would not be likely to have an unintended effect that is harmful to animals, plants, or to theenvironment; and
• would not unduly prejudice trade or commerce between Australia and places outside Australia;
• would be effective according to criteria determined by the APVMA for the product.
Post-registration
After product registration, the APVMA monitors product use through compliance activities and anadverse experience reporting program, and reviews registered products as necessary. In 2002, theAPVMA began reviewing the registration of products containing virginiamycin, tylosin, oleandomycinand kitasamycin, as recommended by the Joint Technical Expert Technical Advisory Committee onAntibiotic Resistance report.
Most veterinary antibiotic products are prescription remedies, restricting supply by veterinarians tofarmers and animal owners. While general medical practitioners must prescribe through pharmacists,veterinarians are allowed to supply antibiotics without pharmacist involvement. Selected antibioticsfor certain purposes are open sellers when incorporated in stock feed e.g., ionophores for diseaseprevention.
Fur ther information on APVMA activities can be found at the APVMA website from:http://www.apvma.gov.au.
Antimicrobial Resistance in Australia S7

Use
State and territory governments regulate the use of veterinary antibiotic products after retail sale.State and territory legislation are currently being amended with the intent that similar laws will applyacross Australia.
Alternatives to antibiotics
The APVMA considers registration of all veterinary chemical products in Australia. The registration ofproducts undergoes scientific assessment with respect to safety in humans, animals and theenvironment and to efficacy in target animals. Evaluation of applications for alternatives to antibioticssuch as vaccines and probiotics are similar to other veterinary chemical products, and the APVMAneeds to be satisfied as to such products’ efficacy and safety, irrespective of their potential use asantibiotic alternatives.
S8 Antimicrobial Resistance in Australia

Improving antibiotic use: 25 years of antibioticguidelines and related initiatives
Ken Harvey,1 Jonathan Dartnell,2 Mary Hemming3
AbstractIn the late 1970s concern in Melbourne teaching hospitals over the increasing incidence of antibiotic-resistant microorganisms and inappropriate antibiotic prescribing, led to the establishment of aworking party to produce guidelines on appropriate antimicrobial therapy. Therapeutic Guidelines:Antibiotic is now produced, marketed and sold by Therapeutic Guidelines Limited, an independent, not-for-profit enterprise that distils best-practice prescribing guidelines for Australian health professionals.Therapeutic Guidelines now cover all major therapeutic areas. Mere distribution of the guidelines hadlittle impact on prescribing habits. However, targeted education campaigns have helped to improveantibiotic prescribing. The Antibiotic title remains the flagship of Therapeutic Guidelines Limited withsales, surveys and endorsements over 11 editions attesting to its wide acceptance and use.Therapeutic Guidelines: Antibiotic is one of many initiatives that have contributed to improvingantibiotic use and it serves as a valuable foundation on which to build other strategies. There isdemand for a consumer friendly version of the guidelines. In addition, the increasing use of comput-erised prescribing programs has highlighted the need for electronic guidelines to be closely integratedwith decision support software. Commun Dis Intell 2003;27 Suppl:S9–S11.
Keywords: antibiotic guidelines, antibiotic resistance
History
The Therapeutic Guidelines story started in Australia in the late 1970s. There was concern inMelbourne teaching hospitals that an increasing incidence of antibiotic-resistant microorganismsreflected inappropriate antibiotic prescribing.1 A working party was set up to produce conciseguidelines on appropriate antimicrobial therapy. The aim was to improve patient outcomes by distillingthe world literature on best-practice management of common clinical conditions, tempered by theexperience and wisdom of Australian experts.
The first edition of Antibiotic Guidelines was a slim booklet of 30 pages designed to fit into a hospitaldoctor's white coat pocket. A modest grant from the Hospitals and Charities Commission made thepublication available free of charge to Victorian resident medical officers. Twenty-five years later, the11th edition of Therapeutic Guidelines: Antibiotic has grown to 330 pages; addresses clinical problemsin both hospital and general practice; and has national authorship together with the approval of manyprofessional organisations.
Therapeutic Guidelines: Antibiotic is now produced, marketed and sold by Therapeutic GuidelinesLimited, a self-sufficient, independent, not-for-profit enterprise that distils best-practice prescribingguidelines for Australian health professionals. Therapeutic Guidelines now covers all major therapeuticareas.2 While print versions are still produced, there are now electronic versions for installation onpersonal computers, for use on health department Intranets, and for integrating with prescribingsoftware. Preliminary versions have also been developed for use on hand-held computers (e.g., PalmPilots and Pocket PCs).
Antimicrobial Resistance in Australia S9
1. Board Member, Therapeutic Guidelines Limited and Senior Lecturer, School of Public Health, La Trobe University, Bundoora,Victoria
2. Production Manager, Therapeutic Guidelines Limited, North Melbourne, Victoria
3. Chief Executive Officer, Therapeutic Guidelines Limited, North Melbourne, Victoria
Corresponding author: Dr Ken Harvey, Senior Lecturer, School of Public Health, La Trobe University, Bundoora Vic 3086. Telephone:+61 3 9479 1750. Facsimile: +61 3 9479 1783. Mobile: 0419 181 910. Email: [email protected]

As many studies have noted, initial audits of antibiotic prescribing showed that the mere distributionof Therapeutic Guidelines had little impact on prescribing habits.3 However, when specific educationcampaigns targeted the discrepancy between what was practised and what the guidelinesrecommended, antibiotic prescribing improved.4,5,6 These concepts were ultimately incorporated intothe Quality Use of Medicines pillar of Australian Medicines Policy and put into operation by thePharmaceutical Health and Rational Use of Medicines committee and later the National PrescribingService.7 National indicators show that antibiotic use in Australia is now slowly improving.8 TherapeuticGuidelines: Antibiotic though only one of many initiatives that has contributed to this result, is afoundation upon which other strategies have built.
While the Antibiotic title remains the flagship of Therapeutic Guidelines Limited the sales of othertitles are now approaching that of Therapeutic Guidelines: Antibiotic. Clinicians, endorsements, andsales attest to the wide acceptance, use and perceived value of Therapeutic Guidelines.9 This hasbeen recognised by groups in Japan, China, Spain and Russia who have adapted the AustralianTherapeutic Guidelines content in order to improve prescribing in their countries.
The business model for this international exchange is as follows. While the distillation of best-practicetherapeutic guidelines has international applicability, disease patterns vary in different countries, asdo the drugs available, their prices and local prescribing habits. In addition, if Therapeutic Guidelinesis to have an impact, there is a need for local endorsement and ownership by respected opinionleaders. Furthermore, Therapeutic Guidelines need to be incorporated into broader programs includingdrug utilisation studies and targeted educational campaigns. Thus, there is a need for local groups toadapt overseas guidelines to their local situation. To assist this process, Therapeutic GuidelinesLimited makes available Australian guideline content in electronic format for modification by organ-isations having similar aims in other countries. A modest licence fee is charged depending on thecountry’s circumstances. This process avoids duplication of effort while maintaining local autonomy.
Current challenges
Integration of Therapeutic Guidelines with computerised prescribing programs
The increasing use of computerised prescribing programs in Australia has highlighted the need forelectronic Therapeutic Guidelines (and other resources) to be closely integrated with decision supportsoftware and ultimately with the emerging electronic record.10 The long-term goal is to providesuccinct advice, tailored to a particular patient at the time of prescribing, together with automatedmonitoring of prescribing habits for self-audit and education. The literature shows that such systemscan substantially improve patient safety, assist best-practice prescribing and be cost-effective.Despite these benefits, Australian hospitals have been slow to implement such systems and thesoftware currently available in general practice lacks many desirable features.11
Therapeutic Guidelines Limited has won competitive research grants to pursue the integration of itselectronic products into computerised prescribing and decision support systems. The Antibiotic titleis currently partially integrated into Medical Director (HCN) prescribing software and it has previouslybeen integrated with MIMS Script.
Some software groups have indicated a desire to integrate the complete electronic therapeuticguidelines suite into their products. However, a number of barriers exist including uncertainty overwhether an integrated product will generate additional revenue and questions about who will pay forthe development work required. Another problem is the different business models used. Someprescribing software vendors generate revenue by displaying advertisements for the drugs but this isa practice not undertaken by Therapeutic Guidelines Limited. Other barriers to integration include thelack of agreed coding systems (for clinical problems and drugs) and common decision support anddata interchange standards.
S10 Antimicrobial Resistance in Australia

Improving versatility
Our initial title, Antibiotic Guidelines, was designed to fit into a doctor’s white coat pocket thusinformation access by mobile clinicians was relatively assured. Today, most Australian doctors do notwear white coats, the Therapeutic Guidelines series (and other evidence-based information) haveproliferated, and the numerous resources necessary for good clinical practice no longer fit intopockets. Therapeutic Guidelines is now available on state health department intranets such as theNew South Wales Clinical Information Access Program and the Victorian Clinician's Health Channel,but access to these services is still not available in many busy clinical settings.
One modern equivalent of the health workers white coat pocket is the handheld computer PersonalDigital Assistant.12 These devices are getting cheaper, they still fit into pockets, they have substantialmemory and computing power, they can be radio-linked to hospital networks and the Internet, andfuture versions are likely to become the computing platform of choice for mobile health care workers.Consequently, we have already converted several Guideline titles to Personal Digital Assistant format(for both Palm and MS Pocket PC operating systems).
There is also demand for a consumer friendly version of the guidelines to perhaps be made availableover the Commonwealth Web Portal. These initiatives await further development.
Conclusion
Therapeutic Guidelines Limited has a long track record of producing best-practice evidence-basedtherapeutic guidelines for both general and hospital practices. The organisation has also beenproactive in developing a variety of electronic formats of the guidelines with the aim of integratingthese into computerised prescribing and decision support programs. Currently, a number of barriersare impeding these developments. These could be overcome by cooperation and collaborationbetween the government and relevant organisations. There has been agreement for at least the last10 years as to what constitutes a core set of knowledge resources for the therapeutic domain. Itonly remains to integrate this knowledge into the clinician’s electronic desktop; such an investmentwould improve patient safety and facilitate best-practice drug therapy.
Acknowledgments
We thank our colleagues: microbiologists, clinical pharmacologists, physicians, surgeons, paedia-tricians, general practitioners, dental surgeons, pharmacists, administrators and computer scientists,who have shared the vision and helped Therapeutic Guidelines Limited become a self-sustaining reality.
References
1. Pavillard R, Harvey K, Douglas D, Hewstone A, Andrew J, Collopy B, et al. Epidemic of hospital-acquired infectiondue to methicillin-resistant Staphylococcus aureus in major Victorian hospitals. Med J Aust 1982;1:451–454.
2. Therapeutic Guidelines Limited. http://www.tg.com.au/home/index.html.
3. Harvey K, Stewart R, Hemming M, Moulds R. Use of antibiotic agents in a large teaching hospital. The impact ofAntibiotic Guidelines. Med J Aust 1983;2:217–222.
4. Harvey KJ, Stewart R, Hemming M, Naismith N, Moulds RF. Educational antibiotic advertising. Med J Aust1986;1:28–32.
5. Landgren FT, Harvey KJ, Mashford ML, Moulds RF, Guthrie B, Hemming M. Changing antibiotic prescribing byeducational marketing. Med J Aust 1988;149:595–599.
6. De Santis G, Harvey KJ, Howard D, Mashford ML, Moulds RF. Improving the quality of antibiotic prescriptions ingeneral practice. The role of educational intervention. Med J Aust 1994;1:502–505.
Antimicrobial Resistance in Australia S11

7. Harvey K, Murray M. Medicinal drug policy. In: Gardner H, ed. The Politics of Health, 2nd edition. ChurchillLivingstone, Melbourne, 1995;238–283.
8. Roughead EE, Gilbert AL, Primrose JG, Harvey KJ, Sansom LN. Report of the national indicators: Evaluating thequality use of medicines component of Australia's National Medicines Policy. Publications Production Unit,Commonwealth Department of Health and Aged Care, Canberra, 1999.
9. Hemming M. Therapeutic Guidelines: an Australian experience. International Journal of Pharmaceutical Medicine.2000;14:259–264.
10. Nolan AM, Norquay CA, Dartnell JGA, Harvey KJ. Electronic prescribing and computer-assisted decision supportsystems. MJA 1999;171:541–543.
11. Harvey K. Medication management 2000: e-Scripts, e-Promotion. e-Health? Health Issues 2000;63:10–14.
12. Wilcox RA, La Tella RR. The personal digital assistant: a new medical instrument for the exchange of clinicalinformation at the point of care. Med J Aust 2001;175:659–662.
S12 Antimicrobial Resistance in Australia

Active promotion of antibiotic guidelines: an intensive program
Susan M Tiley,1 Jennifer J MacDonald,2 Paula L Dohert y,2 John K Ferguson,1,3 John E Fergusson2
AbstractJohn Hunter Hospital, a 600 bed tertiary referral centre, has an antimicrobial working party comprisingrepresentatives from pharmacy, microbiology and infectious diseases areas, which is responsible forthe development, implementation and evaluation of guidelines for the appropriate use of anti-microbials. Activities include the development and promotion of a restricted antimicrobial policy, andspecific guidelines for the management of pneumonia, and surgical prophylaxis and wound infection.These guidelines are available on the hospital intranet, in hard copies in all wards, and on laminatedcards (10 x 6.5 cm) attached to the hospital identification tag. Active promotion of the guidelines isundertaken at orientation and via a 2 week intensive period four times per year (corresponding withthe registrar rotation), weekly meetings and follow up of non-compliance courses directly with theattending medical officer. Education and feedback to specific groups is provided as required. Otherprojects include a campaign to encourage oral antibiotics where indicated. Regular drug utilisationevaluations are undertaken to measure outcomes, along with other indicators of antibiotic use suchas the prevalence of antimicrobial resistance. Appropriate prescribing of third generationcephalosporins has increased from 21 per cent to 52 per cent (p = 0.008) of courses betweenDecember 1999 and June 2001. Commun Dis Intell 2003;27 Suppl S13–S18.
Keywords: antibiotic guidelines, antibiotic resistance
Introduction
The John Hunter Hospital, which is a 600 bed tertiary referral centre, has an antimicrobial workingparty (AWP) comprising representatives from pharmacy, microbiology and infectious diseases fields ofknowledge. This group, which reports to the Hunter Area Health Service Quality Use of MedicinesCommittee, is responsible for the monitoring of antibiotic usage and the development, implementationand evaluation of guidelines for the appropriate use of antimicrobials. Activities include thedevelopment and promotion of a restricted antimicrobial policy including specific guidelines for themanagement of pneumonia, surgical prophylaxis and wound infection and approved indications forantibiotics identified as requiring restrictions. The Hunter Area Health Service adopted this restrictedanti-infective policy in 2001. Support for the implementation of this policy at smaller hospitals withinthe area is provided by members of the AWP.
Monitoring
Antibiotic utilisation is monitored using World Health Organization Defined Daily Dose measures per1,000 bed days and trends are evaluated at the end of each month. Increases in usage areinvestigated and interventions developed as necessary. A template of the spreadsheet is available onrequest by sending an email to [email protected]. Data can be entered into thespreadsheet to produce graphs such as the example shown (Figure).
Antimicrobial Resistance in Australia S13
1. Department of Microbiology, Hunter Area Pathology Service, John Hunter Hospital, New Lambton, New South Wales
2. Department of Pharmacy, John Hunter Hospital, New Lambton, New South Wales
3. Department of Infectious Disease and Immunology, John Hunter Hospital, New Lambton, New South Wales
Corresponding author: Dr Susan Tiley, Department of Microbiology, Hunter Area Pathology Service, John Hunter Hospital, LookoutRoad, New Lambton NSW 2135. Telephone: +61 2 4921 4423. Facsimile: +61 2 4921 4440. Email: [email protected]

Figure. Third generation cephalosporin usage at John Hunter Hospital, January 1997 to April 2002,example of graphs which can be produced by the John Hunter Hospital spreadsheet
Drug Utilisation Evaluation (DUE) is a structured ongoing system for monitoring drug use throughcomparisons with existing standards and guidelines. DUE is a cycle of audit, educational interventionand review, which aims to measure prescribing of target drugs and provide feedback to prescribers.The Greater Newcastle Sector has a dedicated team who conducts DUE projects throughout theregion.
Promotion of guidelines
Restricted antibiotic guidelines
Hospital specific guidelines have been developed, in line with the Therapeutic Guidelines: Antibiotic,1
taking into consideration input from relevant clinical units, published evidence (where available) andlocal resistance data. The main aims of the guidelines are to promote appropriate use of broad-spectrum antimicrobials in order to limit the development and spread of antimicrobial resistance, andto ensure appropriate use of specific agents. These guidelines are available on the hospital intranet,the VAX network system and in hard copy on all wards. The guidelines are reviewed regularly accordingto clinical needs and formulary changes. Active promotion of the guidelines is undertaken at medicalstaff orientation and during a 2 week intensive audit and intervention period four times per year,corresponding with the registrar rotation. Education and feedback to specific groups is undertakenas required. Clinical pharmacists consult with prescribing doctors regarding their choice of antibioticand the Infectious Diseases (ID) service is available around the clock to review requests outside ofthe guidelines.
Table 1. Use of restricted antibiotics, 2 January to 15 February 2001
S14 Antimicrobial Resistance in Australia
0
5
10
15
20
25
30
Jan-97
Jul Jan-98
Jul Jan-99
Jul Jan-00
Jul Jan-01
July Jan-02
Jul
Month and year
John Hunter hospitalincluding intensivecare unit
Dai
ly d
efin
ed d
ose
per
1,00
0 be
d da
ys +
day
sta
ys
Division Courses of Approved Not approved Approved but usedrestricted antibiotics (% for Division) (% for Division) outside guidelines
Medicine 51 (39.5%) 42 (82.3%) 9 (17.7%) 13 (25.5%)
Obstetrics and 1 (0.7%) 0 1 0Gynaecology
Paediatrics 24 (18.6%) 21 (87.5%) 3 (12.5%) 6 (25.0%)
Surgery 53 (41.1%) 41 (77.4%) 9 (17.0%) 11 (20.8%)

Antimicrobial Resistance in Australia S15
Adherence to the guidelines for prescribing of restricted antimicrobials is monitored rather thanpoliced, and feedback is intended to be educational. Clinical pharmacists review all restricted anti-microbials dispensed (capturing about 85% of all courses) daily, and note non-compliance with theguidelines. If the clinical pharmacist considers it necessary, the prescribing team is contacted and theissue is discussed. Reference is made to the hospital guidelines and the Therapeutic Guidelines:Antibiotic. If, however, the clinical team is reluctant to change their anti-infective choice then a consultation with the ID service can occur. Clinical pharmacists undertake this level of interventionas part of their ward-based service. Having the support of the ID team allows the pharmacists to avoida proscriptive approach. Members of the AWP meet weekly and review the use of restricted anti-microbials outside the guidelines, and feedback to individual medical officers is undertaken wherenecessary. Specific education and feedback to a particular clinical unit or group of prescribers hasalso occurred as required. Over time, this united, educative approach has reinforced the importanceof appropriate anti-infective prescribing and improved discussion surrounding prescribing choices.
During the quarterly audit and intervention period, all courses of restricted antimicrobials arereviewed, including those non-dispensed, i.e., from imprest stocks. Non-adherence to the guidelines isaddressed by members of the AWP within 24 hours. The ID consultant, after reviewing the indicationfor antibiotic therapy, contacts the prescribing team, suggests alternative therapy if indicated andexplains the guidelines. The emphasis is on education. Data collected on the use of restrictedantibiotics between 2 and 15 February 2001 is presented in the Table. Of the 22 courses of antibioticsnot approved, 7 (32%) were for (suspected or proven) intra-abdominal sepsis, 6 (27%) for respiratorytract infection, 3 (14%) for urinary tract infection, and 6 (27%) for other reasons (including surgicalprophylaxis, cellulitis, surgical wound infection). The main reasons for non-concordance with thehospital guidelines were either the availability of less broad-spectrum antimicrobials that wouldprovide adequate cover for the condition or organism concerned, or that antibiotic therapy was notconsidered necessary by the ID team.
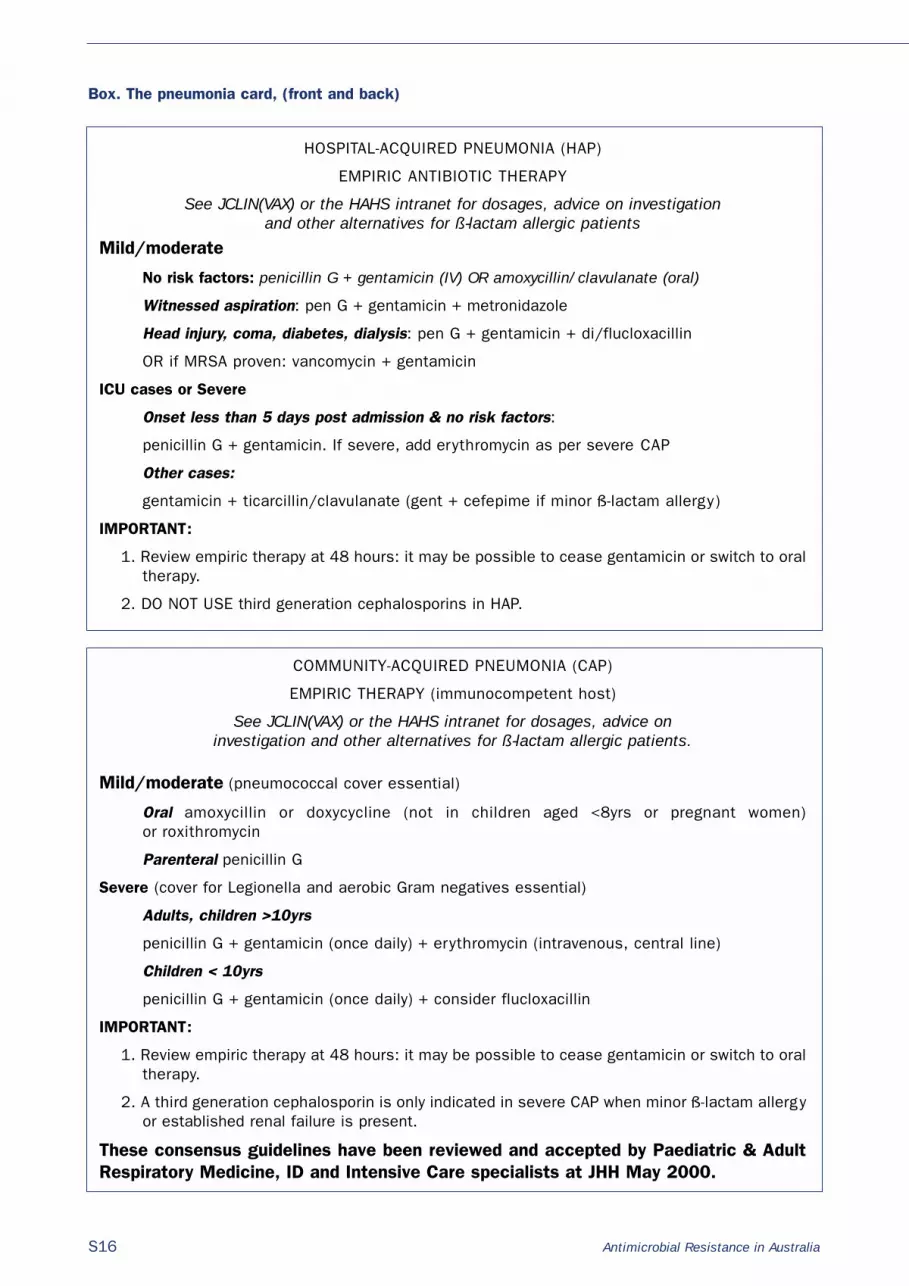
Pneumonia guidelines
The Pneumonia Guidelines were developed by the AWP in September 1998 in conjunction with theevidence-based review of pneumonia management that took place for the Therapeutic Guidelines:Antibiotic, edition 10.2 Consultation was undertaken with the Respiratory Medicine, Accident andEmergency and Intensive Care units at John Hunter Hospital, and the guidelines were updated andratified in May 2001. The pneumonia card (Box), was developed as a tool for ready reference byclinical staff. This card is small enough to attach to the hospital identification tag and has beendistributed widely amongst medical officers. Every junior medical officer is given a card with educationat orientation. Active promotion of the card is undertaken, including intensive promotion each yearleading into the winter months. Anecdotal feedback and requests for cards from clinicians indicatethat this is a worthwhile method of information dissemination.At the John Hunter Hospital DUE projects have been conducted twice yearly (in June and December)since 1998, to assess utilisation of third generation cephalosporins and the appropriateness ofprescribing. Inappropriate prescribing is defined as that which is outside the hospital anti-infectiveguidelines and where the infectious diseases physician considers that an alternative anti-infectiveshould have been used. Appropriate prescribing of third generation cephalosporins has increased from21 per cent to 52 per cent (p=0.008) of courses between December 1999 and June 2001. Whilst thismay seem a modest improvement it is in line with the compliance achieved by other workers.3
Surgical prophylaxis
Surgical prophylaxis and wound infection antibiotic guidelines were developed in 2001 after consul-tation between the AWP and Surgery. These guidelines detail the choice of antibiotic, timing forsurgical prophylaxis and the appropriate length of treatment. A laminated card for quick reference wasalso developed and is promoted and distributed within Surgery. An audit of surgical prophylaxispractices was conducted by the DUE team in March 2000. As a result of this audit agreements havebeen developed with Gynaecology, relating to cefotetan usage, and with the Cardiac Surgery teamregarding vancomycin prophylaxis.
S16 Antimicrobial Resistance in Australia
Box. The pneumonia card, (front and back)
HOSPITAL-ACQUIRED PNEUMONIA (HAP)
EMPIRIC ANTIBIOTIC THERAPY
See JCLIN(VAX) or the HAHS intranet for dosages, advice on investigation and other alternatives for ß-lactam allergic patients
Mild/moderate
No risk factors: penicillin G + gentamicin (IV) OR amoxycillin/clavulanate (oral)
Witnessed aspiration: pen G + gentamicin + metronidazole
Head injury, coma, diabetes, dialysis: pen G + gentamicin + di/flucloxacillin
OR if MRSA proven: vancomycin + gentamicin
ICU cases or Severe
Onset less than 5 days post admission & no risk factors:
penicillin G + gentamicin. If severe, add erythromycin as per severe CAP
Other cases:
gentamicin + ticarcillin/clavulanate (gent + cefepime if minor ß-lactam allergy)
IMPORTANT:
1. Review empiric therapy at 48 hours: it may be possible to cease gentamicin or switch to oraltherapy.
2. DO NOT USE third generation cephalosporins in HAP.
COMMUNITY-ACQUIRED PNEUMONIA (CAP)
EMPIRIC THERAPY (immunocompetent host)
See JCLIN(VAX) or the HAHS intranet for dosages, advice on investigation and other alternatives for ß-lactam allergic patients.
Mild/moderate (pneumococcal cover essential)
Oral amoxycillin or doxycycline (not in children aged <8yrs or pregnant women) or roxithromycin
Parenteral penicillin G
Severe (cover for Legionella and aerobic Gram negatives essential)
Adults, children >10yrs
penicillin G + gentamicin (once daily) + erythromycin (intravenous, central line)
Children < 10yrs
penicillin G + gentamicin (once daily) + consider flucloxacillin
IMPORTANT:
1. Review empiric therapy at 48 hours: it may be possible to cease gentamicin or switch to oraltherapy.
2. A third generation cephalosporin is only indicated in severe CAP when minor ß-lactam allergyor established renal failure is present.
These consensus guidelines have been reviewed and accepted by Paediatric & AdultRespiratory Medicine, ID and Intensive Care specialists at JHH May 2000.
Antimicrobial Resistance in Australia S17
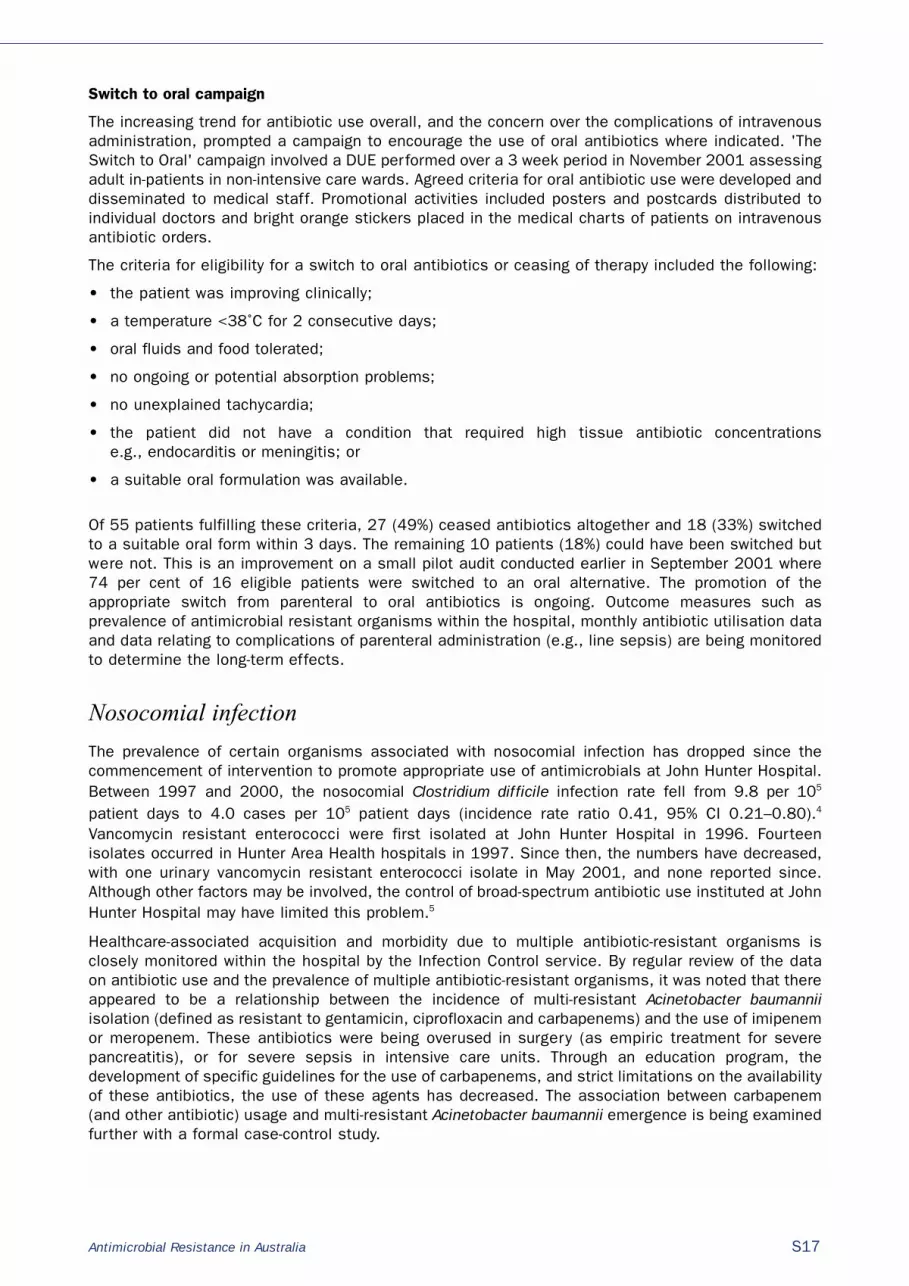
Switch to oral campaign
The increasing trend for antibiotic use overall, and the concern over the complications of intravenousadministration, prompted a campaign to encourage the use of oral antibiotics where indicated. 'TheSwitch to Oral' campaign involved a DUE performed over a 3 week period in November 2001 assessingadult in-patients in non-intensive care wards. Agreed criteria for oral antibiotic use were developed anddisseminated to medical staff. Promotional activities included posters and postcards distributed toindividual doctors and bright orange stickers placed in the medical charts of patients on intravenousantibiotic orders.
The criteria for eligibility for a switch to oral antibiotics or ceasing of therapy included the following:
• the patient was improving clinically;
• a temperature <38˚C for 2 consecutive days;
• oral fluids and food tolerated;
• no ongoing or potential absorption problems;
• no unexplained tachycardia;
• the patient did not have a condition that required high tissue antibiotic concentrations e.g., endocarditis or meningitis; or
• a suitable oral formulation was available.
Of 55 patients fulfilling these criteria, 27 (49%) ceased antibiotics altogether and 18 (33%) switchedto a suitable oral form within 3 days. The remaining 10 patients (18%) could have been switched butwere not. This is an improvement on a small pilot audit conducted earlier in September 2001 where74 per cent of 16 eligible patients were switched to an oral alternative. The promotion of theappropriate switch from parenteral to oral antibiotics is ongoing. Outcome measures such asprevalence of antimicrobial resistant organisms within the hospital, monthly antibiotic utilisation dataand data relating to complications of parenteral administration (e.g., line sepsis) are being monitoredto determine the long-term effects.
Nosocomial infection
The prevalence of certain organisms associated with nosocomial infection has dropped since thecommencement of intervention to promote appropriate use of antimicrobials at John Hunter Hospital.Between 1997 and 2000, the nosocomial Clostridium difficile infection rate fell from 9.8 per 105
patient days to 4.0 cases per 105 patient days (incidence rate ratio 0.41, 95% CI 0.21–0.80).4
Vancomycin resistant enterococci were first isolated at John Hunter Hospital in 1996. Fourteenisolates occurred in Hunter Area Health hospitals in 1997. Since then, the numbers have decreased,with one urinary vancomycin resistant enterococci isolate in May 2001, and none reported since.Although other factors may be involved, the control of broad-spectrum antibiotic use instituted at JohnHunter Hospital may have limited this problem.5
Healthcare-associated acquisition and morbidity due to multiple antibiotic-resistant organisms isclosely monitored within the hospital by the Infection Control service. By regular review of the dataon antibiotic use and the prevalence of multiple antibiotic-resistant organisms, it was noted that thereappeared to be a relationship between the incidence of multi-resistant Acinetobacter baumanniiisolation (defined as resistant to gentamicin, ciprofloxacin and carbapenems) and the use of imipenemor meropenem. These antibiotics were being overused in surgery (as empiric treatment for severepancreatitis), or for severe sepsis in intensive care units. Through an education program, thedevelopment of specific guidelines for the use of carbapenems, and strict limitations on the availabilityof these antibiotics, the use of these agents has decreased. The association between carbapenem(and other antibiotic) usage and multi-resistant Acinetobacter baumannii emergence is being examinedfurther with a formal case-control study.
S18 Antimicrobial Resistance in Australia
Conclusions
The John Hunter Hospital sought to develop antibiotic guidelines using a multi-disciplinary evidencebased approach. With approval from the relevant clinical units, regular evaluations were carried outand individual were feedback was given. The guidelines were disseminated in multiple ways tomaximise access by clinical staff. Implementation of the guidelines was via drug bulletins, clinicalmeetings, educational sessions, and individual contact. Regular review and update of the guidelineswas undertaken to ensure relevance. Promotion of appropriate prescribing is an ongoing activity.
This report has described how active promotion of antibiotic guidelines along with educationalactivities leads to more appropriate prescribing.
References
1. Therapeutic Guidelines Limited. Therapeutic Guidelines: Antibiotic. 11th edition. North Melbourne, Australia, 2000.
2. Therapeutic Guidelines Limited. Therapeutic Guidelines: Antibiotic. 10th edition. North Melbourne, Australia, 1998.
3. Robertson MB, Korman TM, Dartnell JG, Ioannides-Demos LL, Kirsa SW, Lord JA, et al. Ceftriaxone and cefotaximeuse in Victorian hospitals. Med J Aust 2002:176;524–529.
4. MacDonald J, Ferguson JK. How education influences prescribing at John Hunter Hospital. Australian Prescriber2001;24:32.
5. Quale J, Landman D, Saurina G, Atwood E, DiTore V, Patel K. Manipulation of a hospital antimicrobial formularyto control an outbreak of vancomycin-resistant enterococci. Clin Infect Dis 1996;23:1020–1025.

Antimicrobial Resistance in Australia S19
State-wide surveillance of in-hospital antimicrobial utilisation in South Australia
Catherine M Dollman,1 Celia M Cooper2
AbstractIn late 2001, a group of South Australian metropolitan public and private hospitals commencedvoluntary contribution of data on in-hospital utilisation of antimicrobials to the Communicable DiseaseControl Branch of the Department of Human Services. Where possible, hospitals contributed data onall antimicrobials dispensed for use within the institution each month. These data were stratified intoantimicrobials issued to intensive care units and antimicrobials issued to all other areas within thehospital. In the first instance, only data relating to four antimicrobial classes have been analysed.These classes are third or fourth generation cephalosporins, carbapenems, glycopeptides and fluoro-quinolones. Utilisation of these four classes was presented as a monthly utilisation rate i.e., totaldefined daily doses for each antimicrobial class per month per 1,000 occupied bed days. Theseutilisation rates were calculated for each individual hospital and for the combined group of contributinghospitals (state-wide rate). Although limited data are currently available, results to date demonstratea much higher antimicrobial usage rate in intensive care units than other in-patient areas for theclasses currently analysed. Considerable variation in the usage of various antimicrobials has beennoted for individual hospitals, and analysis of trends over a longer time period, in conjunction withresistance surveillance data, will be required. Commun Dis Intell 2003;27 Suppl:S19–S27.
Keywords: antimicrobial utilisation, cephalosporin, carbapenem, glycopeptide, fluoroquinolone, antibiotic resistance
Introduction
Antimicrobial resistance is now regarded as a significant and growing threat to public healthworldwide. The emergence and dissemination of antimicrobial resistant organisms are known to beassociated with antimicrobial use, and various strategies have been developed in recent years to alterantibiotic usage patterns to assist in the containment of this problem.
Educational programs, including the development and promulgation of evidence-based clinicalguidelines; continuing education sessions and media-based programs aimed at promoting morerational antibiotic use and feedback on prescribing to individual clinicians have been developed for usein both community and health-care settings, with variable success.1,2,3,4,5,6 In some institutions,restrictive measures such as antibiotic cycling, formulary restriction of certain antibiotics and theimplementation of stop-orders and ‘prior approval’ requirements, either involving computer-basedprograms or requiring specialist consultation, have also been employed in an attempt to modifyprescribing patterns.7,8,9 Dosing based on pharmacokinetic and pharmacodynamic parameters has alsobeen proposed as a potential tool to minimise resistance to some antimicrobial classes.10,11
Broad-based surveillance of both antimicrobial resistance and antimicrobial consumption has nowbeen recognised as essential for planning future strategies aimed at controlling resistance. Programsfor the surveillance of antimicrobial resistance and antimicrobial usage have been recommended bythe World Health Organization,12,13 the European Union14 and the Centers for Disease Control and
1. Project Pharmacist, Communicable Disease Control Branch, South Australian Department of Human Services, Adelaide, SouthAustralia
2. Head of Infection Control Service, Communicable Disease Control Branch, South Australian Department of Human Services,Adelaide, South Australia
Corresponding author: Dr Celia M Cooper, Head of Infection Control Service, Communicable Disease Control Branch, South Australian Department of Human Services, 162 Grenfell Street, Adelaide SA 5000. Telephone: +61 8 226 7177. Facsimile: +61 8 226 7187. Email: [email protected]

Prevention15 in the United States of America USA). The European Surveillance of AntibioticConsumption project has recently been set up to co-ordinate international surveillance and promoteworld-wide collaboration.16 In the USA, the Centers for Disease Control and Prevention HospitalInfections Program began Project ICARE (Intensive Care Antibiotic Resistance Epidemiology) in 1994to provide data on the prevalence of antibiotic resistance and antibiotic use in USA hospital settings.17
In Australia, the Joint Expert Technical Advisory Committee on Antibiotic Resistance (JETACAR), agroup of 15 experts from public health, human medicine, veterinary medicine, molecular biology andprimary industries, was formed by the Commonwealth Government in December 1997. The finalJETACAR report,18 released in October 1999, concluded that the use and overuse of antibiotics inhuman medicine is the major factor contributing to the development of antibiotic resistance. TheCommonwealth Government Response to the Report of the JETACAR,19 published in August 2000,supported the surveillance of both antimicrobial-resistant organisms and antimicrobial consumptionat a national level, and invited proposals for the development of such programs.
In response to recommendations resulting from the JETACAR report, surveillance systems for anti-microbial utilisation, multi-resistant organisms, and other organisms linked to antimicrobial use, wereestablished within the Communicable Disease Control Branch of the Department of Human Servicesin South Australia in late 2001. These surveillance systems incorporate data from major metropolitanpublic and private hospitals in South Australia, and will allow antimicrobial utilisation data to be linkedwith the incidence of particular organisms within the same institution. Published data suggest thatconcomitant surveillance of both antibiotic resistance and antimicrobial use is helpful in interpretingresistance patterns within a particular unit or hospital.20
This paper describes the methods used and problems encountered in setting up an antimicrobialsurveillance program to monitor in-patient antibiotic usage in major South Australian metropolitanhospitals. A brief summary of preliminary data obtained from contributing hospitals is provided,however, interpretation of these data is at present limited by the short time period over which datahas been collected and a correlation with resistance surveillance data has not yet been examined.
Methods
The antimicrobial utilisation surveillance program in South Australia was initially modelled on ProjectICARE17 in the USA, with data submitted by contributing hospitals stratified into use by the intensivecare unit (ICU) and pooled use by other in-patient areas (non-ICU). Outpatient use, and use by day-stayor home treatment units are not included. ICU data have not been stratified by ICU type, as in ProjectICARE, due to the small number of ICUs involved. Stratification of non-ICU data by clinical unit islimited by the ability of pharmacy service providers to provide accurate unit specific data, and in mostcontributing institutions this is not possible.
All contributors supply antimicrobial usage data on a voluntary basis. Usage reports for all antimi-crobials are generated each month by the pharmacy departments of public hospitals or contractedpharmacy service providers for private hospitals. Details of the in-hospital consumption of oral andparenteral antimicrobials are provided, in terms of units or packs used for each dosage form andstrength.
For larger hospitals with ICUs, data are supplied separately for this area, and pooled for other in-patient areas (non-ICU). Where a small number of designated ICU beds are incorporated into the samearea as high dependency or coronary care beds, specific data relating to ICU use cannot be obtained,and all usage is pooled to provide total hospital usage rates.
Data collection has been complicated by the four different computerised pharmacy dispensingsystems used by contributors, with the reporting format depending on the system used by thepharmacy. Datasets are transmitted electronically to the Communicable Disease Control Branch eachmonth and centrally loaded into a FoxPro database for calculation of usage density rates. Thedatabase has been specifically designed to accept data generated by different pharmacy systems,whether dispensing is by individual unit of use or by manufacturer’s pack, as is the case where the
S20 Antimicrobial Resistance in Australia

Antimicrobial Resistance in Australia S21
Pharmaceutical Benefits Scheme is involved. Usage density rates for each antimicrobial agent arecalculated using the total number of grams of the antimicrobial used, the defined daily dose for thatantimicrobial, and the number of occupied bed days as provided by the contributor.
The usage density rate is defined as the number of defined daily doses used per 1,000 occupied bed-days and is calculated as follows:
Antimicrobial usage rate =
Defined daily doses assigned by the WHO21 have been used to enable benchmarking with Europeancentres in the future, although some values may not be consistent with common clinical practice inAustralia.
Although most contributing hospitals have supplied data for a broad range of antimicrobials, usagerates are currently reported for only four antimicrobial classes: third or fourth generationcephalosporins (ceftriaxone, cefotaxime, ceftazidime, cefepime), carbapenems (meropenem,imipenem), glycopeptides (vancomycin, teicoplanin) and fluoroquinolones (ciprofloxacin, gatifloxacin,moxifloxacin, norfloxacin). Rates are reported both for individual antimicrobial agents and pooledrates for antimicrobial classes. Reporting of additional classes will be undertaken as required byparticipating hospitals.
Although formal reports had not been distributed at the time of submission of this paper, discussionswith interested clinicians had taken place and a format for data presentation was agreed upon.Programming to enable automated monthly reporting is now underway. Monthly reports will beforwarded to each contributor, displaying hospital and state-wide usage for total hospital, ICU and non-ICU for each of the four antimicrobial classes, and will also provide usage rates for individual agentswithin classes.
State-wide utilisation rates are calculated for the total group of contributing hospitals for the purposeof comparison. Individual contributing hospitals, however, have access only to their own rates and tothe pooled state-wide rate to ensure confidentiality. Benchmarking with other Australian or overseasantimicrobial utilisation data is planned for the future.
Results
The limited results presented in this report have been calculated from antimicrobial utilisation datasupplied by the eight hospitals for the period November 2001 to May 2002. Five of these hospitalshad ICUs. Six public and two private hospitals are included. One paediatric hospital and two privatehospitals with incomplete datasets for that time period have been excluded.
The state-wide rates for the period November 2001 to May 2002 for each of the four reported anti-microbial classes are shown in Figure 1. Monthly state-wide usage rates have not shown largevariations to date.
total grams for the particular antimicrobial x 1,000
defined daily dose for the particular antimicrobial x OBD

S22 Antimicrobial Resistance in Australia
Figure 1. State-wide usage rates for total hospital use of third or fourth generation cephalosporins,glycopeptides, carbapenems and fluoroquinolones
Comparative state-wide rates for ICU and non-ICU usage for the four classes are shown in Figures 2,3, 4 and 5. Antimicrobial usage rates for ICUs in all contributing hospitals are markedly higher thanrates for pooled usage in other hospital areas for the antibiotic classes currently reported.
Figure 2. State-wide usage rates for Intensive Care Unit and non-Intensive Care Unit use of third orfourth generation cephalosporins (includes ceftriaxone, cefotaxime, ceftazidime and cefepime)
0
10
20
30
40
50
60
Nov-01 Dec Jan-02 Feb Mar Apr May
Cephalosporins (3/4) Glycopeptides
Carbapenems Fluoroquinolones
Month and year
Def
ined
dai
ly d
oses
per
1,0
00 b
ed d
ays
0
20
40
60
80
100
120
140
160
180
200
Nov-01 Dec Jan-02 Feb Mar Apr May
Intensive Care Unit
Non-Intensive Care Unit
Dai
ly d
efin
ed d
ose
per
1,00
0 be
d da
ys
Month and year

Antimicrobial Resistance in Australia S23
Figure 3. State-wide usage rates for Intensive Care Unit and non-Intensive Care Unit use ofglycopeptides (includes vancomycin and teicoplanin)
Figure 4. State-wide usage rates for Intensive Care Unit and non-Intensive Care Unit use ofcarbapenems (includes meropenem and imipenem-cilastatin)
0
20
40
60
80
100
120
140
Nov-01 Dec Jan-02 Feb Mar Apr May
Intensive Care Unit
Non-Intensive Care Unit
Month and year
Dai
ly d
efin
ed d
ose
per
1,00
0 be
d da
ys
0
20
40
60
80
100
120
140
Nov-01 Dec Jan-02 Feb Mar Apr May
Intensive Care Unit
Non-Intensive Care Unit
Month and year
Dai
ly d
efin
ed d
ose
per
1,00
0 be
d da
ys

S24 Antimicrobial Resistance in Australia
Figure 5. State-wide usage rates for Intensive Care Unit and non-Intensive Care Unit use of fluoro-quinolones (includes ciprofloxacin, gatifloxacin, moxifloxacin and norfloxacin)
Figures 6 and 7 show comparative usage rates for third or fourth generation cephalosporin and fluoro-quinolone classes for public and private hospitals, as well as corresponding state-wide rates, withpreliminary data suggesting higher usage rates in some private hospitals in comparison with publichospitals for some antimicrobials, as shown in Figures 6 and 7. These rates have been calculatedusing pooled preliminary data for the six public and two private hospitals included in this report.
Figure 6. Usage rates for individual third and fourth generation cephalosporins in a public hospitalIntensive Care Unit
Nov-01 Dec Jan-02 Feb Mar Apr May
Intensive Care Unit
Non-Intensive Care Unit
Month and year
Dai
ly d
efin
ed d
ose
per
1,00
0 be
d da
ys
0
20
40
60
80
100
120
140
160
180
200
Nov-01 Dec Jan-02 Feb Mar Apr May
Intensive Care Unit
Non-Intensive Care Unit
Month and year
Dai
ly d
efin
ed d
ose
per
1,00
0 be
d da
ys
0
20
40
60
80
100
120
140
160
180
200
0
10
20
30
40
50
60
70
Nov-01 Dec Jan-02 Feb Mar Apr May
Public
Private
Statewide
Month and year
Def
ined
dai
ly d
oses
per
1,0
00 b
ed d
ays

Figure 7. Usage rates for individual third and fourth generation cephalosporins in a private hospitalIntensive Care Unit
Discussion
It is anticipated that complete data will be available for 13 hospitals in the near future. Althoughpaediatric usage data has been submitted by one specialist paediatric hospital, analysis of such datais difficult due to the lack of standard defined daily doses applicable to the paediatric population.Usage is therefore reported as total grams used per month for particular antimicrobials. Whileutilisation rates are currently presented in the form of simple charts showing both hospital and state-wide usage rates over time, it is anticipated that more sophisticated models may be used when alarger pool of data is available for analysis. Use of these models may enable linking of both antimi-crobial usage and resistance surveillance data.22,23 Comparison of South Australian usage withEuropean and possibly other Australian centres is planned, however, differences in antimicrobialgroupings analysed and defined daily doses used in other centres have made this impractical atpresent.
As limited data are available for analysis at this stage and no specific recommendations forintervention programs have as yet been made, some areas for future consideration have beenidentified. The high usage rates for third generation cephalosporins, particularly ceftriaxone andcefotaxime, by most contributors, may require the introduction of intervention programs on a state-wide basis.
Further comparisons between prescribing patterns in the private and public sectors are also plannedfor the future. It should be noted, however, that complete data for only two private hospitals wereavailable for analysis at the time of preparation of this paper. While mechanisms such as restrictedformularies and prior approval requirements may be implemented in public hospitals to influenceprescribing, in the private sector the Pharmaceutical Benefits Scheme restrictions are currently theonly regulatory mechanism in place. Interventions to modify prescribing practices in the private sectorare therefore limited to education. A regulatory mechanism at state level may be necessary in thefuture if antimicrobial use is to be successfully controlled in both the public and private settings.
Reporting of antimicrobial usage rates for specific hospital areas or units would enable greatercomparison between similar hospitals, or particular units within hospitals. The identification ofspecific wards or units such as haematology or specialised transplant units, where there is high usageof antimicrobials, may be a future focus for collection and analysis of unit-specific data where this canbe accurately provided. For general surgical or medical wards, accurate data are difficult to obtain dueto the complex or diverse patient mix within these areas. At present in South Australia, no hospital isable to provide complete, accurate data for antimicrobial consumption at the individual patient level.
Antimicrobial Resistance in Australia S25
0
10
20
30
40
50
60
70
80
Nov-01 Dec Jan-02 Feb Mar Apr May
Public
Private
Statewide
Def
ined
dai
ly d
oses
per
1,0
00 b
ed d
ays
Month and year

The expansion of resistance and antimicrobial utilisation surveillance programs to include data fromregional centres may reveal differences in the prevalence of resistance and antimicrobial usagepatterns compared with metropolitan hospitals.
The initial phase of the program has highlighted many problems relating to the availability of therequired data. The use of the Pharmaceutical Benefits Scheme by private hospitals, the diversity ofcomputer systems and methods of cataloguing drugs within the participating group of hospitals, havenecessitated the design of a central program to accept and analyse data presented in a number ofdifferent formats. If larger programs involving both hospital and community use are to be instituted inthe future it will be necessary to ensure that data can be collected in a standardised format. Futureintroduction of new pharmacy computer systems in the public or private sectors may represent anopportunity to institute standardisation of drug cataloguing, perhaps using the World HealthOrganization Anatomical Therapeutic Chemical code.21 Incorporation of a standard reporting functioninto such systems would facilitate regular reporting of usage data for antimicrobials and other druggroups.
Hospitals are encouraged to use caution when comparing their own usage rates with those for thepooled state-wide data, as significant differences exist in casemix complexity and in the burden ofmulti-resistant organisms between hospitals contributing data to this program.
It is hoped that this program will assist participating hospitals identify areas where qualityimprovements in antimicrobial use can be made, and encourage restraint in the use of certain anti-microbial classes, particularly within the ICU setting. Analysis of antimicrobial usage data inconjunction with resistance surveillance data may enable planning of more effective strategies tocombat antimicrobial resistance.
Acknowledgments
Mr Chris Horwood for developing and managing the database and assisting with other aspects of theproject.
References
1. Centers for Disease Control and Prevention campaign to prevent antimicrobial resistance in health-care settings.MMWR Morb Mortal Wkly Rep 2002;51:343.
2. Emmer CL, Besser RE. Combating antimicrobial resistance: intervention programs to promote appropriateantibiotic use. Infect Med 2002;19:160–173.
3. Sbarbaro JA. Can we influence prescribing patterns? Clin Infect Dis 2001;33 Suppl 3:S240–S244.
4. Watson DA. Antibiotic guidelines: improved implementation is the challenge. Med J Aust 2002;176:513–514.
5. Bell DM. Promoting appropriate antimicrobial drug use: perspective from the Centers for Disease Control andPrevention. Clin Infect Dis 2001;33;Suppl 3:S245–S250.
6. Wilton P, Smith R, Coast J, Millar M. Strategies to contain the emergence of antimicrobial resistance: asystematic review of effectiveness and cost-effectiveness. J Health Serv Res Policy 2002;7:111–117.
7. Empey KM, Rapp RP, Evans ME. The effect of an antimicrobial formulary change on hospital resistance patterns.Pharmacotherapy 2002;22;81–87.
8. Lawton RM, Fridkin SK, Gaynes RP, McGowan JE Jr. Practices to improve antimicrobial use at 47 US hospitals:the status of the 1997 SHEA/IDSA position paper recommendations. Society for Healthcare Epidemiology ofAmerica/Infectious Diseases Society of America. Infect Control Hosp Epidemiol 2000;21:256–259.
9. Landman D, Chockalingam M, Quale JM. Reduction in the incidence of methicillin-resistant Staphylococcus aureusand ceftazidime-resistant Klebsiella pneumoniae following changes in a hospital antibiotic formulary. Clin Infect Dis1999;28:1062–1066
10. MacGowan AP. Role of pharmacokinetics and pharmacodynamics: Does the dose matter? Clin Infect Dis 2001;33Suppl 3:S238–S239.
11. Craig WA. Does the dose Matter? Clin Infect Dis 2001;33 Suppl 3:S233–S237.
S26 Antimicrobial Resistance in Australia

12. World Health Organization consultation on global principles for the containment of antimicrobial resistance dueto antimicrobial use in livestock. Geneva, June 2000. Available from: http://www.who.int./emc/diseases/zoo/drafting.html
13. World Health Organization global strategy for containment of antimicrobial resistance. Geneva, June 2001.Available from: http://www.who.int/emc/amrpdfs/WHO_Global_Strategy_English.pdf
14. The Copenhagen Recommendations: Report from the Invitational European Union Conference on The MicrobialThreat. Copenhagen: Ministry of Food, Agriculture and Fisheries. September 1998:1-52. Available from:http://www.tour.info.fr/tours/pap/articles/copen2.htm
15. Centers for Disease Control and Prevention. A public health action plan to combat antibiotic resistance. June2000. Available from: http://www.cdc.gov/drugresistance/actionplan/html/index.htm
16. European Surveillance of Antimicrobial Consumption. ESAC project description. Laboratory of Microbiology,University of Antwerp. Available from: http://www.uia.ac.be/esac/ESAC_project.htm. Accessed: 2002.
17. Fridkin SK, Steward CD, Edwards JR, Pryor ER, McGowan JE Jr, Archibald Lk, et al. Surveillance of antimicrobialuse and antimicrobial resistance in United States hospitals: project ICARE phase 2. Project Intensive CareAntimicrobial Resistance Epidemiology (ICARE) hospitals. Clin Infect Dis 1999;29:245–252.
18. Commonwealth Department of Health and Aged Care. The use of antibiotics in food-producing animals: antibiotic-resistant bacteria in animals and humans. Commonwealth Department of Health and Aged Care, CommonwealthDepartment of Agriculture, Fisheries and Forestry—Australia. October 1999.
19. Commonwealth Department of Health and Aged Care. Commonwealth Government response to the report of theJoint Expert Technical Advisory Committee on Antibiotic Resistance (JETACAR). Commonwealth Department ofHealth and Aged Care, Commonwealth Department of Agriculture, Fisheries and Forestry—Canberra, August2000.
20. Monnet DL, Archibald LK, Phillips L, Tenovar FC, McGowan JE Jr, Gaynes RP. Antimicrobial use and resistance ineight US hospitals: complexities of analysis and modelling. Intensive Care Antimicrobial Resistance. EpidemiologyProject and National Nosocomial Infections Surveillance System Hospitals. Infect Control Hosp Epidemiol1998;19:388–394.
21. World Health Organization Collaborative Centre for Drug Statistics Methodology. Available from:http://www.whocc.no/atcddd. Accessed: 2002.
22. Monnet DL, Lopez-Lozano JM, Campillos P, Burgos A, Gonzalo N. Making sense of antimicrobial use and resistancesurveillance data: application of ARIMA and transfer function models. Clin Microbiol Infect 2001;7 Suppl 5:S29–S36
23. Lopez-Lozano JM, Monnet DL, Yague A, Burgos A, Gonzalo N, Campillos P, et al. Modelling and forecasting anti-microbial resistance and its dynamic relationship to antimicrobial use: a time series analysis. Int J AntimicrobAgents 2000;14:21–31.
Antimicrobial Resistance in Australia S27

S28 Antimicrobial Resistance in Australia
Restriction of third generation cephalosporin usereduces the incidence of Clostridium difficile–associated diarrhoea in hospitalised patients
Claudia Thomas,1,2 Thomas V Riley1,3
AbstractThird generation cephalosporin antibiotics (3GC) have become the antibiotics of choice in manyhospitals in recent years for the treatment of infections such as community-acquired pneumonia.However, increased use of 3GCs has also been associated with a rise in the occurrence of antibiotic-associated diarrhoea due to Clostridium difficile, as well as an increase in the prevalence of antibioticresistant organisms such as methicillin resistant Staphylococcus aureus, vancomycin resistantentrococci, and extended-spectrum beta-lactamase–producing gram negative bacilli. In WesternAustralia, greater use of 3GCs was shown to correlate with more Clostridium difficile–associateddiarrhoea (CDAD) in a large acute care teaching hospital during the 1980s. During the 1990s, the useof 3GCs in this hospital remained high and, at the end of 1998, a policy was introduced to prevent theuse of ceftriaxone (the only 3GC in use) without prior approval. This resulted in a decline in 3GC useand a 50 per cent reduction in the incidence of CDAD during 1999 and 2000. To strengthen theseobservations, the impact of the 3GC policy on the occurrence of CDAD was analysed using time-seriesintervention analysis that showed a statistically significant decrease in the occurrence of CDAD duringthe post-intervention period after controlling for exogenous factors. Thus, changes in antibioticprescribing practices can influence the incidence of CDAD and, potentially, antibiotic resistantpathogens. Commun Dis Intell 2003;27 Suppl:S28–S31.
Keywords: Clostridium difficile, Staphylococcus aureus, antibiotic resistance
Introduction
Clostridium difficile is an anaerobic toxin–producing bacterium, with an ability to form spores that allowit to survive in the environment for extended periods of time. Exposure to C. difficile can result inasymptomatic carriage or produce clinically apparent disease ranging from mild to acute diarrhoea, orthe more severe pseudomembranous colitis. Mortality associated with CDAD is usually low, due toclinicians' widespread knowledge of the illness, resulting in prompt diagnosis and treatment.Information regarding the pathogenesis and clinical manifestation of CDAD is available from severalreviews.1,2,3
The main risk factor for C. difficile colonisation and disease is prior exposure to antibiotics, particularlyclindamycin and broad-spectrum antibiotics such as the cephalosporins.4 Biological evidence indicatesthat antibiotics disrupt the normal gut flora allowing subsequent colonisation and/or infection with C. difficile.3 However, not all hospitalised patients exposed to C. difficile become ill, or even colonised.These differences have still not been clearly explained.5 There are different levels of risk associatedwith different antibiotic classes, the number of antibiotics used and the duration of antibioticexposure, however, a paucity of good quality studies prevents firm conclusions from being drawn.4
Increased age, patient length of hospital stay and underlying co-morbidities are important confounders
1. Department of Microbiology, The University of Western Australia, Queen Elizabeth II Medical Centre, Perth, Western Australia
2. Department of Public Health, The University of Western Australia, Perth, Western Australia
3. Division of Microbiology, The Western Australian Centre for Pathology and Medical Research, Perth, Western Australia
Corresponding author: Professor Thomas V Riley, Department of Microbiology, Queen Elizabeth II Medical Centre, Nedlands, Perth WA 6009. Telephone: +618 9346 3690. Facsimile: +618 9382 8046. Email: [email protected]

Antimicrobial Resistance in Australia S29
to be considered for all hospital-acquired infections,6 and these risk factors, in addition to thevirulence of specific C. difficile strains,7 may determine whether a patient develops clinical disease.The ecology and epidemiology of C. difficile diarrhoea are similar to that of antibiotic resistant bacteriaand the incidence of CDAD may be a good surrogate measure for the impact of interventions aimed atreducing antibiotic resistance through restricting antibiotic use.
Methods and results
The Sir Charles Gairdner Hospital (SCGH) in Perth, Western Australia, is a 560-bed teaching hospitalwith specialist services that include neurosurgery and liver transplantation. The epidemiology of CDADhas been studied at SCGH since the early 1980s when it became apparent that this was an importanthospital pathogen with the potential to cause considerable morbidity.8 Early work showed that CDADincreased substantially during the 1980s, from 23 cases per 100,000 patient days in 1983 to 50 cases per 100,000 patient days in 1992, equating to approximately 100 cases per year.9 At thesame time third generation cephalosporin (3GC) use rose and there appeared to be a relationshipbetween the increase in 3GC use and the incidence of CDAD.9,10 During most of the 1990s, theincidence of CDAD remained at approximately 50 cases per 100,000 patient days annually, butunexpectedly fell to 20 cases per 100,000 patient days in 1999 and fell further still in 2000.11 Thissuggested that a significant event(s) with a lasting effect took place at the end of 1998 which dramat-ically reduced the incidence of CDAD. No changes were made to infection control procedures at thistime. While some investigators have reported significant reductions in the incidence of CDADfollowing changes in infection control practices,12,13 others have found infection control strategies arerelatively ineffective in reducing endemic C. difficile transmission.14
Given the previously demonstrated relationship between 3GC use and CDAD at SCGH, this relationshipwas re-examined. Some important changes had occurred during the period of time under investigation.A hospital-wide restriction policy on the prescription of 3GC antibiotics was introduced by the hospitalDrug and Therapeutics Committee in October 1998. This involved getting approval from a clinicalmicrobiologist or infectious diseases physician before prescribing 3GCs. Prior to this change, from1997, ceftriaxone was the only 3GC in use at the hospital. Despite the removal of other 3GCs and theintroduction of a 72-hour stop order policy at the end of 1996, the overall gram amounts of 3GCs fellno more rapidly than the decreasing trend seen since 1993. After the introduction of the restrictionpolicy in 1998, ceftriaxone use fell from 8,000 g in 1998 to 1,400 g in 1999 and 1,200 g in 2000.11
Although the use of 3GCs had been falling gradually during the 1990s, the introduction of therestriction policy resulted in an immediate fall to almost negligible levels. It was only when 3GC usehad reached such low levels that the incidence of CDAD also fell.11
Time series analysis
Time series analysis is a method suitable for analysing ecologic-level data over time, which hasrecently been used to study the relationship between antimicrobial consumption and the evolution ofresistant organisms.15 We used time series analysis to test the effect of the change in antibiotic policyon the subsequent monthly count of CDAD episodes from 1993 to 2000.16 Consumption of 3GC fellfrom 28.95 defined daily doses per 1,000 patient days (95%CI 28.63-29.26) prior to October 1998 to3.29 defined daily doses per 1,000 patient days (95%CI 3.12-3.46) after the policy was introduced.The average incidence of CDAD during the pre-intervention period was 0.61 episodes per 1,000patient days (95% CI 0.56-0.65). During the post-intervention period, the average incidence was 0.28episodes per 1,000 patient days (95% CI 0.23-0.33), a statistically significant reduction. Based on ourprevious estimations of the cost of CDAD to SCGH,17 such a reduction would result in a potentialsaving, either real or opportunity, of more than A$800,000 annually.

Discussion
Several others have reported falls in CDAD after reduced use of antibiotics known to be associatedwith C. difficile infection, such as clindamycin,18 and cephalosporins, particularly 3GCs.19,20,21 The aimof the policy restricting 3GC use in SCGH was not primarily to control CDAD. The policy was introduceddue to concerns about increased numbers of antibiotic resistant microorganisms within the hospital.Cephalosporin use has been implicated in the increased prevalence of methicillin resistantStaphylococcus aureus,22,23 vancomycin resistant enterococci,24 and extended-spectrum beta-lactamase producing gram-negative organisms.25 There is now increasing evidence that reduction inthe use of this class of antibiotics can lead to reduced rates of methicillin resistant Staphylococcusaureus,22 vancomycin resistant enterococci25 and extended-spectrum beta-lactamase-producingKlebsiella pneumoniae.25 The effectiveness of the policy introduced in SCGH is currently beingevaluated regarding these types of organisms.
Although evidence from the literature indicates that a reduction in the use of antibiotics results indecreased rates of resistant organisms, the exact approaches to antibiotic control are beingdebated.26,27 The requirement for approval of orders for ceftriaxone at SCGH resulted in a sustainedreduction in ceftriaxone use over the 2-year period following implementation of the policy. The successof this policy must be attributed to the hospital Drug and Therapeutic Committee that regularly auditsand reviews antibiotic use in the hospital. However, methods to assess the effectiveness of suchinterventions are contentious.28 Using a time series approach not only accounts for auto-correlationof the data, but also controls for exogenous factors that influence the data series.29 We havedemonstrated that a restrictive prescribing policy for 3GCs can significantly reduce the incidence ofCDAD and may, potentially, reduce antibiotic resistant organisms.
References
1. Kelly CP, LaMont JT. Clostridium difficile infection. Annu Rev Med 1998;49:375–390.
2. Riley TV. Clostridium difficile: a pathogen of the nineties. Eur J Clin Microbiol Infect Dis 1998;17:137–141.
3. Borriello SP. Pathogenesis of Clostridium difficile infection. J Antimicrob Chemother 1998;41:13–19.
4. Bignardi GE. Risk factors for Clostridium difficile infection. J Hosp Infect 1998;40:1–15.
5. Johnson S, Gerding DN. Clostridium difficile–associated diarrhea. Clin Infect Dis 1998;26:1027–1034.
6. Harris AD, Karchmer TB, Carmeli Y, Samore MH. Methodological principles of case-control studies that analyzedrisk factors for antibiotic resistance: a systematic review. Clin Infect Dis 2001;32:1055–1061.
7. Poxton IR, McCoubrey J, Blair G. The pathogenicity of Clostridium difficile. Clin Microbiol Infect 2001;7:421–427.
8. Riley TV, Bowman RA, Carroll SM. Diarrhoea associated with Clostridium difficile in a hospital population. Med JAust 1983;1:166–169.
9. Riley TV, O'Neill GL, Bowman RA, Golledge CL. Clostridium difficile–associated diarrhoea: epidemiological datafrom Western Australia. Epidemiol Infect 1994;113:13–20.
10. Golledge CL, McKenzie T, Riley TV. Extended spectrum cephalosporins and Clostridium difficile. J AntimicrobChemother 1989;23:929–931.
11. Thomas C, Stevenson M, Williamson DJ, Riley TV. Clostridium difficile–associated diarrhea: epidemiological datafrom Western Australia associated with a modified antibiotic policy. Clin Infect Dis 2002;35:1457–1462.
12. Johnson S, Gerding DN, Olson MM, Weiler MD, Hughes RA, Peterson LR. Prospective controlled study of vinylglove use to interrupt Clostridium difficile nosocomial transmission. Am J Med 1990;88:137–140.
13. Zafar AB, Gaydos LA, Furlong WB, Nguyen MH, Mennonna PA. Effectiveness of infection control program incontrolling nosocomial Clostridium difficile. Am J Infect Control 1998;26:588–593.
14. Sanderson PJ. What should we do about patients with Clostridium difficile? J Hosp Infect 1999;43:251–253.
15. López-Lozano JM, Monnet DL, Yagüe A, Burgos A, Gonzalo N, Campillos P, et al. Modelling and forecasting antimi-crobial resistance and its dynamic relationship to antimicrobial use: a time series analysis. Int J Antimicrob Agents,2000;14:21–31.
S30 Antimicrobial Resistance in Australia

16. Thomas C, Beyaert A, López-Lozano J-M, Stevenson M, Riley TV. Evaluation of a hospital-wide policy restricting3rd generation cephalopsorin use to reduce Clostridium difficile–associated diarrhoea: a time-series analysis. Inpress.
17. Riley TV, Codde JP, Rouse IL. Increased length of stay due to Clostridium difficile–associated diarrhoea. Lancet1995;345:455–456.
18. Climo MW, Israel DS, Wong ES, Williams D, Coudron P, Markowitz SM. Hospital-wide restriction of clindamycin:effect on the incidence of Clostridium difficile–associated diarrhea and cost. Ann Intern Med 1998;128:989–995.
19. Ludlam H, Brown N, Sule O, Redpath C, Coni N, Owen G. An antibiotic policy associated with reduced risk ofClostridium difficile–associated diarrhoea. Age Ageing 1999;28:578–580.
20. Jones EM, Kirkpatrick BL, Feeney R, Reeves DS, MacGowan AP. Hospital-acquired Clostridium difficile diarrhoea.Lancet 1997;349:1176–1177.
21. McNulty C, Logan M, Donald IP, Ennis D, Taylor D, Baldwin RN, et al. Successful control of Clostridium difficileinfection in an elderly care unit through use of a restrictive antibiotic policy. J Antimicrob Chemother1997;40:707–711.
22. Fukatsu K, Saito H, Matsuda T, Ikeda S, Furukawa S, Muto T. Influences of type and duration of antimicrobialprophylaxis on an outbreak of methicillin-resistant Staphylococcus aureus on the incidence of wound infection. ArchSurg 1997;132:1320–1325.
23. Hill DA, Herford T, Parratt D. Antibiotic usage and methicillin-resistant Staphylococcus aureus: an analysis ofcausality. J Antimicrob Chemother 1998;42:676–677.
24. Schentag JJ, Hyatt JM, Carr JR, Paladino JA, Birmingham MC, Zimmer GS, et al. Genesis of methicillin-resistantStaphylococcus aureus (MRSA), how treatment of MRSA infections has selected for vancomycin-resistantEnterococcus faecium, and the importance of antibiotic management and infection control. Clin Infect Dis1998;26:1204–1214.
25. Patterson JE. Antibiotic utilization. Is there an effect on antimicrobial resistance? Chest 2001;119 Suppl2:S426–S430.
26. Shlaes DM, Gerding DN, John JF Jr, Craig WA, Bornstein DL, Duncan RA, et al. Society for Healthcare Epidemiologyof America and Infectious Diseases Society of America Joint Committee on the Prevention of AntimicrobialResistance: guidelines for the prevention of antimicrobial resistance in hospitals. Clin Infect Dis1997;25:584–599.
27. Cunha BA. Effective antibiotic-resistance control strategies. Lancet 2001;357:1307–1308.
28. McGowan JE Jr. Strategies for study of the role of cycling on antimicrobial use and resistance. Infect Control HospEpidemiol 2000;21 Suppl:S36–S43.
29. Morrell S. Time series (Box-Jenkins) analysis. In: Kerr C, Taylor R, Heard G, eds. Handbook of Public HealthMethods. Sydney: McGraw-Hill Book Company Australia Pty Ltd; 1998:354–371.
Antimicrobial Resistance in Australia S31

S32 Antimicrobial Resistance in Australia
Changing GPs’ antibiotic prescribing: a randomised controlled trial
Eileen J Wilson,1 Dilruba Nasrin,1 Keith B G Dear,2 Robert M Douglas3
AbstractA randomised controlled trial involving 54 general practitioners (GPs) was conducted in Canberra,Australian Capital Territory from September 1997 to November 1999. In the first year of the study, 24 GPs, who constituted the active arm of the intervention group, were involved in the considerationof evidence and the development and implementation of a set of clinical guidelines for the treatmentof acute respiratory infections. These guidelines were then endorsed in a meeting together withspecialist colleagues. In the second year of the study the group of GPs who had been acting ascontrols, received a moderate intervention consisting of a brief educational event and distribution ofthe locally developed guidelines. We obtained data from January 1997 to December 1999 from theHealth Insurance Commission on prescribing rates for 40 of the doctors in the study. The rate ofprescribing was calculated as the number of antibiotic prescriptions per 100 Medicare services. Theaverage yearly prescribing decreased significantly in the intensive intervention group and increased inthe moderate intervention group, (p=0.026). A mixed effects longitudinal time series model was fittedto the data to account for seasonal variation of antibiotic prescribing and trends over time. Theintensive intervention group significantly reduced their antibiotic prescribing over time compared tothe moderate intervention group, (p<0.001). This study has shown that an intensive intervention inwhich general practitioners were actively engaged in development and consideration of the evidencebase for the guidelines resulted in a significant fall in general antibiotic prescribing. Commun Dis Intell2003;27 Suppl:S32–S38.
Keywords: acute respiratory infections, antibiotic prescribing, antibiotic resistance
Introduction
Acute respiratory infections (ARI) are a very significant part of the workload of general practitioners(GPs). Antibiotics are frequently used to treat these generally self-limiting infections. For differenttypes of respiratory infections, the antibiotic prescribing rate in general practice ranges from 50 to 90 per cent.1
Numerous studies have demonstrated that antibiotics offer at best a modest benefit for most acuterespiratory infections. Antibiotics are not indicated for simple upper respiratory tract infections.2,3,4
However, upper respiratory tract infection is often associated with bronchitis, pharyngitis, otitis mediaor sinusitis. These conditions can sometimes benefit from antibiotic treatment in a subset ofpatients.5,6,7,8,9,10,11,12,13 The difficulty for the clinician is to distinguish, at the time of the consultation,which subset of patients would benefit from antibiotics and which would not. The signs and symptomsof these illnesses may not clearly differentiate between these groups of patients. A watchful approachmay often be justified,14,15 but the pressures of modern practice are such that clinicians currently tendto overuse these drugs.
1. PhD Scholar, National Centre for Epidemiology and Population Health, Australian National University, Canberra, AustralianCapital Territory
2. Senior Fellow, National Centre for Epidemiology and Population Health, Australian National University, Canberra, AustralianCapital Territory
3. Director, National Centre for Epidemiology and Population Health, Australian National University, Canberra, Australian CapitalTerritory
Corresponding author: Dr Eileen J Wilson, Epidemiologist, Defence Links Branch, Department of Veterans’ Affairs, Canberra ACT2602. Telephone: +61 2 6289 1110. Facsimile: +61 2 6289 6173. Email: [email protected]

Antimicrobial Resistance in Australia S33
In light of growing antibiotic resistance and the modesty of the clinical benefit16 calls have been madefor a more judicious use of antibiotics for the treatment of acute respiratory infections.17 Yet the taskof altering established practices of antibiotic use remains an unmet challenge.18
This paper reports on the effect on general prescribing practices of a randomised controlled trial thattested two different approaches to the implementation of clinical guidelines for antibiotic use inmanagement of childhood respiratory infections.
Methods
We undertook a two year randomised controlled trial to explore the effects of a unique method ofclinical practice guideline development and implementation on antibiotic use for acute respiratoryinfections in young children. The recruitment of participants and methods of guideline developmentare described fully elsewhere.19 Briefly, 54 GPs from practices in Canberra, Australian Capital Territory(one GP per practice) were recruited into the study beginning in September 1997. GPs were randomlyallocated into an intensive intervention group or a moderate intervention group. The intensiveintervention consisted of a series of focus groups with parents of young children and workshops withthe study GPs (beginning in the first quarter of 1998). Clinical practice guidelines for the managementof childhood ARI were collaboratively developed in these focus groups and workshops. Evidence forantibiotic treatment of ARI from Cochrane reviews and other studies was explored and examined inlight of the experiences and expectations of GPs and consumers in the management of theseillnesses. Barriers to the judicious use of antibiotics for ARI were identified and discussed and animplementation package developed which addressed these barriers to change. This packageconsisted of:
• Guidelines for GPs: The guidelines were entitled Principles of Practice and stated the principles ofmanagement of ARI that the GPs had agreed upon during the development process. The guidelineswere flexible and allowed for the realities of general practice and patient preference. Theyincorporated the evidence and were tailored to GP and patient concerns to allow for ownership ofthe guidelines.
• Information sheets on otitis media and sore throat: Copies of these sheets were given to GPs todistribute to patients. The sheets were developed by Dr Chris Del Mar, one of the authors for theCochrane review on antibiotic treatment of otitis media11 and sore throat8 and kindly given to usfor use in this study. The information sheets allowed for the education of patients in a time efficientmanner.
• ARI management prescription pad: These prescription-like pads allowed the GP to tick a series ofboxes that explained the diagnosis, recommended symptomatic treatment, and caution on thewarning signs if the patient did not have any improvement. The prescription pads also contributedto the education of the patient by providing clear advice on self-management.
• Poster: We developed a colourful poster to be displayed in the GPs surgery that advocated thejudicious use of antibiotics. The poster helped to market the new way of practice.
The implementation package was distributed to the intensive intervention group in the first year of thestudy shortly after the last workshop session (April 1998). The moderate intervention group acted asa control for the ensuing year.
In the second quarter of 1999, the moderate intervention group was provided with the locallydeveloped guidelines and implementation package at an evening educational event. At this time theintensive intervention group received prescribing feedback and reinforcement of the guidelineprinciples at a follow-up evening group meeting. Thus the study tested the comparative effects overtime of two levels of intervention, an intensive intervention and a moderate intervention. Although notpart of this analysis, the study also provided guidelines to parents and education through newsletters.

S34 Antimicrobial Resistance in Australia
GP antibiotic prescribing was monitored using Health Insurance Commission (HIC) data obtained withGP’s permission from 40 of the 49 GPs still active in the study by the end of 1999, 20 from eachintervention group. The total number of antibiotic prescriptions filled for patients eligible forPharmaceutical Benefits Scheme subsidy and total number of Medicare services provided by the GPsin the two groups were calculated by calendar quarter from 1997 through 1999 and by calendar year.The variable of interest was the number of subsidised antibiotic prescriptions per 100 Medicareservices.
A mean rate of prescribing was calculated for each year of the study and the change in prescribingfrom the baseline year (1997) to the intervention years of 1998 and 1999 were compared using t-tests. To account for the seasonal variation in antibiotic prescribing, detail which is lost using ayearly mean rate, a mixed effects longitudinal time series model was fitted to the HIC data using Stataversion 7 software.20 The model incorporated a random effect clustered by GP and fixed effects ofintervention group and sine and cosine terms to account for the seasonal variation of antibioticprescribing. In addition, a linear term in time was added to measure trend within the interventiongroups.
ResultsAntibiotic prescribing followed a cyclical seasonal pattern. Prescribing was lowest in the summermonths (first quarter) and highest in the winter months (third quarter). Table 1 details the number ofantibiotic prescriptions per 100 Medicare services by intervention group and quarter.
Table 1. Mean number of antibiotic prescriptions per 100 Medicare services by intervention group andyearly quarter
Q1 – 1997 IIG 6.67 ± 2.7 5.4, 7.9MIG 5.68 ± 1.7 4.8, 6.5
Q2 – 1997 IIG 7.66 ± 2.6 6.4, 8.9MIG 7.61 ± 3.3 6.1, 9.1
Q3 – 1997 IIG 8.73 ± 2.8 7.4, 10.1MIG 8.39 ± 2.5 7.2, 9.6
Q4 – 1997 IIG 7.01 ± 2.4 5.9, 8.1MIG 6.96 ± 1.9 6.1, 7.8
Q1 – 1998 IIG 5.92 ± 2.1 4.9, 6.9MIG 5.82 ± 1.7 5.0, 6.6
Q2 – 1998 IIG 6.16 ± 2.3 5.1, 7.2MIG 7.14 ± 2.2 6.1, 8.2
Q3 – 1998 IIG 8.00 ± 3.3 6.5, 9.5MIG 7.92 ± 2.1 6.9, 8.9
Q4 – 1998 IIG 7.53 ± 2.8 6.2, 8.8MIG 7.61 ± 2.4 6.5, 8.7
Q1 – 1999 IIG 6.43 ± 2.4 5.3, 7.6MIG 6.33 ± 2.4 5.2, 7.4
Q2 – 1999 IIG 6.47 ± 2.3 5.4, 7.5MIG 7.14 ± 2.5 6.0, 8.3
Q3 – 1999 IIG 7.16 ± 3.5 5.5, 8.8MIG 8.60 ± 2.5 7.4, 9.8
Q4 – 1999 IIG 6.90 ± 3.1 5.5, 8.3MIG 8.00 ± 2.6 6.8, 9.2
Quarter* Group Mean ± SD 95% CI
* Recruitment into the study started at the end of Q3 1997. Intensive intervention began from Q1 1998 and moderateintervention began from Q2 1999.
IIG Intensive intervention group.
MIG Moderate intervention group.

Antimicrobial Resistance in Australia S35
Antibiotic prescribing during the baseline year of 1997 was not significantly different between theintensive and moderate intervention groups as shown in Table 2. Over the course of the study themean rate of prescribing for the intensive intervention group decreased by –0.78 prescriptions per 100Medicare services whereas the mean rate of prescribing increased by 0.35 prescriptions in themoderate intervention group, a difference of –1.13, 95 per cent CI (-2.1, –0.1) and p=0.026 (Table 2).
Table 2. Baseline level of antibiotic prescribing and mean yearly change
* Mean yearly difference ± standard deviation.
The seasonal pattern of prescribing was accounted for by a mixed effects longitudinal time seriesmodel fitted to the HIC data. There was a highly significant interaction between intervention groupand time, p<0.001, whereby the intensive intervention group reduced their antibiotic prescribing overtime compared to the moderate intervention group (ß coefficient = –0.15, 95% CI –0.22, –0.07). TheFigure shows the fitted curve of the model with the data for mean rates of prescribing by quarter foreach intervention group.
Figure. Prescriptions per 100 Medicare services in groups of GPs before and after intensive ormoderate interventions to revise prescribing practices for upper respiratory tract infections, meansand fitted values
Source: Data from the Health Insurance Commission
Group Baseline prescribing in Mean change* from Mean change from 1997 (number of 1997 to 1998 1997 to 1999prescriptions per 100 Medicare services)
Intensive intervention 7.52 ± 2.4 –0.62 ± 1.3 –0.78 ± 1.3group
Moderate intervention 7.16 ± 2.2 –0.04 ± 0.8 0.35 ± 1.7group
p value 0.630 0.100 0.02695% confidence interval (–1.1, 1.8) (–1.3, 0.1) (–2.1, –0.1)
5.00
5.50
6.00
6.50
7.00
7.50
8.00
8.50
9.00 Intensive intervention GP
Moderate intervention GP
Fitted values-IIGFitted values-MIG
Pre
scrip
tions
per
100
Med
icar
e se
rvic
es
Quarter
Q1-
97
Q2-
97
Q3-
97
Q4-
97
Q1-
98
Q2-
98
Q3-
98
Q4-
98
Q1-
99
Q2-
99
Q3-
99
Q4-
99
Intensive intervention begins Moderate intervention begins

Discussion
A detailed analysis of the randomised trial that involved 54 general practitioners and 502 of their childpatients has been presented elsewhere.21 That report showed that GPs in the intensive interventiongroup changed their prescribing practices in relation to the study children. The analysis in the presentpaper was undertaken to test whether this change in prescribing behaviour, which was evident forchildren enrolled in the study, carried over into the overall practices of the doctors, including patientswho were not enrolled in the very intense diary keeping study. This study has shown that a multi-faceted evidence-based approach to guideline development and implementation was effective inreducing general antibiotic prescribing.
The use of the Pharmaceutical Benefits Scheme and Medicare data involved some limitations butprovided an objective measure of prescribing behaviour over time. The Health Insurance Commissionwill hold a record of a prescription only if the cost of the drug is higher than the patient contribution,approximately A$21.00 at the time of the study. However, prescriptions from pensioners and holdersof concession cards is recorded. Thus the data capture for antibiotic prescriptions, which generallycost less than the patient contribution, was incomplete. This incomplete data capture, however, wouldhave been equal for both intervention groups and not a source of bias. Furthermore, HIC data has beenused previously to monitor antibiotic prescribing.28 Only 40 of the 49 GPs active at the end of the studygave written permission to obtain their prescribing information from the HIC. Those that did notcomply, however, were equally distributed between the two groups.
Clinical practice guidelines have long been seen as a way to enhance best practice in health care. TheNational Health and Medical Research Council has published a series of handbooks detailing the mainstages of clinical practice guideline development and implementation.22 However, observed change instudies of guideline development and implementation have often been modest.23,24,25 Singleinterventions frequently resulted in little or no change in behaviour but complex interventions usingseveral methods had a better chance of producing change.26,27 Nevertheless, all make it clear that, asOxman et al declare, ‘there are no magic bullets’.25 There is no one method that will effectively changeclinical behaviour.
Grol and Grimshaw18 provide a general framework for integration of evidence with clinical practice.They advocate an evidence-based multi-faceted approach, the careful assessment of barriers tochange, and tailoring interventions to specifically address the barriers. This general framework wasused to guide the approach of guideline development and implementation described in this study. Wefirst started with the evidence for the judicious use of antibiotics for ARI. Then the barriers to incorp-orating the evidence into practice for GPs and consumers were assessed through the process ofguideline development using focus groups and workshops. The identification of these barriers havebeen presented previously.19 Discussing the evidence, identifying the barriers to incorporate theevidence into practice, openly exploring these issues with the GPs in a collaborative peer environment,and devising an implementation package to address these barriers contributed to the development ofguidelines that were effective for changing practice in the intensive intervention group of GPs.Furthermore, ongoing contact was maintained with the intensive intervention group through feedbackreports and reinforcement of guidelines. A moderate intervention of distribution of the locallydeveloped guidelines and implementation package with a brief educational component was notsufficient to reduce antibiotic prescribing in the moderate intervention cohort of GPs.
Although labour intensive, the workshops, which were the main difference between the intensive andmoderate interventions, were effective in changing clinical behaviour. The process of examining theevidence and discussing this with their colleagues during several sessions, with the support ofacademic GPs to clarify the evidence, was more influential in changing GP behaviour than distributionof the evidence-based guideline package with a brief educational event (moderate intervention).
Others have shown that passive dissemination of guidelines,23 unsolicited feedback reports,28 ordidactic continuing medical education28 are generally ineffective in changing clinical behaviour. Thisstudy has shown that antibiotic prescribing can be significantly reduced using methods that discuss
S36 Antimicrobial Resistance in Australia

Antimicrobial Resistance in Australia S37
the evidence in a peer-supported environment. The need for effective methods to reduce antibioticprescribing becomes more urgent in light of the results from companion research to this study thathas shown antibiotic use in the community directly correlates with the level of antibiotic resistance.29
In Australia there may be a role for the Divisions of General Practice, in conjunction with academicinstitutions, to organise workshop series with GPs and focus groups with consumers for the openexamination of evidence, experiences, and preferences to enhance the practice of evidence-basedhealth care.
Acknowledgments
This work was supported by a grant from the General Practice Evaluation Program of the GeneralPractice Branch of the Commonwealth Department of Health and Ageing. We would also like to thankthe Health Insurance Commission for providing the data for the evaluation and all the GPs who partic-ipated in the study.
References
1. Bridges-Webb C, Britt H, Miles DA, Neary S, Charles J, Traynor` V. Morbidity and treatment in general practice inAustralia 1990–1991. Med J Aust 1992;157 Suppl:S1–S56.
2. Rosenstein N, Phillips WR, Gerber MA, Marcy SM, Schwartz B, Dowell SF. The common cold — principles ofjudicious use of antimicrobial agents. Pediatrics 1998;101 Suppl:S181–S184.
3. Mashford ML, Beaves M, Hogg G, Kucers A, Robinson G, Spicer JW, et al. Antibiotic Guidelines 9th edition.Victorian Medical Postgraduate Foundation Inc; Melbourne, 1996.
4. Arroll B, Kenealy T. Antibiotics versus placebo in the common cold (Cochrane review). In: The Cochrane Library.Oxford, Issue 1, 1999.
5. Becker L, Glazier R, McIsaac W, Smucny J. Antibiotics for acute bronchitis. Cochrane Database Syst Rev 1997;4.
6. Orr PH, Scherer K, Macdonald A, Moffatt ME. Randomized placebo-controlled trials of antibiotics for acutebronchitis: a critical review of the literature. J Fam Pract 1993;36:507–512.
7. O'Brien K, Dowell S, Schwartz B, Marcy S, Phillips W, Gerber M. Cough illness/bronchitis — principles of judicioususe of antimicrobial agents. Pediatrics 1998;101 Suppl:S178–S181.
8. Del Mar C, Glasziou P. Antibiotics for the symptoms and complications of sore throat. In: The Cochrane Library.Oxford, 1996.
9. Zwart S, Sachs AP, Ruijs GJ, Gubbels JW, Hoes AW, de Melker RA. Penicillin for acute sore throat: randomiseddouble blind trial of seven days versus three days treatment or placebo in adults. BMJ 2000;320:150–154.
10. Froom J, Culpepper L, Jacobs M, DeMelker RA, Green LA, van Buchem L, et al. Antimicrobials for acute otitismedia? A review from the International Primary Care Network. BMJ 1997;315:98–102
11. Glasziou P, Hayem M, Del Mar C. Treatments for acute otitis media in children: antibiotic versus placebo. In: TheCochrane Library. Oxford, 1996.
12. O'Brien KL, Dowell SF, Schwartz B, Marcy SM, Phillips WR, Gerber MA. Acute sinusitis — principles of judicioususe of antimicrobial agents. Pediatrics 1998;101 Suppl:S174–S177.
13. Winther B, Brofeldt S, Gronborg H, Mygind N, Pedersen M, Vejlsgaard R. Study of bacteria in the nasal cavity andnasopharynx during naturally acquired common colds. Acta Otolaryngol 1984;98:315–320.
14. Little P, Gould C, Williamson I, Moore M, Warner G, Dunleavey J. Pragmatic randomised controlled trial of twoprescribing strategies for childhood acute otitis media. BMJ 2001;322:336–342.
15. Little P, Gould C, Williamson I, Warner G, Gantley M, Kinmonth A. Reattendance and complications in arandomised trial of prescribing strategies for sore throat: the medicalising effect of prescribing antibiotics. BMJ1997;315:350–352.
16. Turnidge JD, Bell JM, Collignon PJ. Rapidly emerging antimicrobial resistances in Streptococcus pneumoniae inAustralia. Med J Aust 1999;170:152–155.

17. The Commonwealth Government Response to the Report of the Joint Expert Technical Advisory Committee onAntibiotic resistance (JETACAR). Commonwealth Department of Health and Aged Care, CommonwealthDepartment of Agriculture, Fisheries and Forestry—Australia, Canberra, 2000:39.
18. Grol R, Grimshaw J. Evidence-based implementation of evidence-based medicine. Jt Comm J Qual Improv1999;25:503–513.
19. Wilson EJ, Nasrin D, Banwell C, Broom D, Douglas RM. Realities of practice. Engaging parents and GPs indeveloping clinical practice guidelines. Aust Fam Physician 2000;29:498–503.
20. Stata Statistical Software 6.0 version. College Station, TX: Stata Corporation, 1999.
21. Wilson E. Realities of practice: development and implementation of clinical practice guidelines for acuterespiratory infections in young children (PhD thesis). The Australian National University, 2002.
22. National Health and Medical Research Council. Series of handbooks on the main stages involved in thedevelopment of clinical practice guidelines. Biotex Canberra, 2000. Available from:http://www.health.gov.au/nhmrc/publications/synopses/cp65syn.htm. Accessed 2001.
23. Davis DA, Taylor-Vaisey A. Translating guidelines into practice. A systematic review of theoretic concepts,practical experience and research evidence in the adoption of clinical practice guidelines. CMAJ1997;157:408–416.
24. Lomas J. Words without action? The production, dissemination, and impact of consensus recommendations. AnnuRev Public Health 1991;12:41–65.
25. Oxman A, Thomson M, Davis D, Haynes B. No magic bullets: a systematic review of 102 trials of interventions toimprove professional practice. CMAJ 1995;153:1423–1431.
26. Bero LA, Grilli R, Grimshaw JM, Harvey E, Oxman AD, Thomson MA. Closing the gap between research andpractice: reviews of interventions to promote implementation of research findings by health care professionals.In: Haines A, Donald A, editors. Getting Research Findings into Practice. London: BMJ Publishing, 1998:160.
27. Grol R. Successes and failures in the implementation of evidence-based guidelines for clinical practice. Med Care2001;39 Suppl 2:II46–II54.
28. O'Connell DL, Henry D, Tomlins R. Randomised controlled trial of effect of feedback on general practitioners'prescribing in Australia. BMJ 1999;318:507–511.
29. Nasrin D, Collignon PJ, Roberts L, Wilson EJ, Pilotto LS, Douglas RM. Effect of beta lactam antibiotic use inchildren on pneumococcal resistance to penicillin: prospective cohort study. BMJ 2002;324:28–32.
S38 Antimicrobial Resistance in Australia

Antimicrobial Resistance in Australia S39
Antibiotic prescribing for upper respiratory-tractinfections in primary care
Craig A Patterson,1 Judith M Mackson,2 Lynn M Weekes3
AbstractThe use and overuse of antibiotics in humans is a major contributor to the selection of antibioticresistance organisms. Recent evidence has shown that primary care prescribing selects forresistances of clinical importance. The National Prescribing Service runs both educational and auditactivities. The latter provide some insight into general practice attitudes toward antibiotic prescribing.Commun Dis Intell 2003;27 Suppl:S39–S41.
Keywords: antibiotic resistance, upper respiratory-tract infections, antibiotic prescribing, primary care
Introduction
The use and overuse of antibiotics in humans is a major contributor to the selection of antibioticresistant organisms. Recent evidence has shown that primary care prescribing selects for resistancesof clinical importance.1
Managing upper respiratory-tract infections (URTIs) in general practice is very common; secondbehind hypertension as the most frequently managed problem and the most common ‘new problem’seen by general practitioners (GPs).2 Many URTIs and acute bronchitis are viral in origin and of a self-limiting nature. However, data from the Bettering the evaluation and care of health study indicate thatantibiotic prescribing for URTIs is inappropriately high: around 50 per cent of patients who presentwith an URTI to their GP receive an antibiotic, a rate of prescribing which has remained virtuallyunchanged in the last few years.3
The National Prescribing Service (NPS) is an independent organisation promoting quality use ofmedicines in Australia. To encourage rational antibiotic prescribing, the NPS provides both educationaland audit activities to primary care practitioners and has conducted an antibiotics program each yearduring the winter months from 1999 to 2001. These programs have offered an insight into generalpractice attitudes and barriers to optimising antibiotic prescribing for URTI and acute bronchitis.
Methods
In addition to print materials circulated to GPs (e.g., NPS News, Prescribing Practice Review, individualprescribing feedback, and educational visits), the NPS has offered case studies and clinical audits toGPs as part of their professional development. Participation by GPs in these activities assists themin satisfying the requirements for payment under the Practice Incentives Program for theCommonwealth Government’s Quality Prescribing Initiative.
Hypothetical case scenarios were provided for GPs on otitis media in 1999 and sinusitis in 2001. Theresponses to the case study questions were aggregated and, together with expert commentarydiscussion of the results, supplied in a report to participating GPs.
1. Information Officer, National Prescribing Service
2. Education, Quality and Prescribing Program Manager, National Prescribing Service
3. Chief Executive Officer, National Prescribing Service
Corresponding author: Mr Craig Patterson, National Prescribing Service, Level 1, 31 Buckingham Street, Surry Hills NSW 2010.Telephone: +612 9699 4499. Facsimile: +61 2 9699 5155. E-mail: [email protected]

Clinical audits have been offered each winter in 1999, 2000 and 2001. An audit form was designedallowing GPs to record their own prescribing for 20 patients presenting with any of the following:common cold; sore throat; acute otitis media; otitis media with effusion; acute sinusitis; acutebronchitis; or chronic bronchitis. Prescribing was measured for concordance with recommendations inthe Therapeutic guidelines: antibiotic for the various conditions. A report containing individual responses,together with aggregated results and an expert commentary, was provided to participating GPs.
Results
A small number of GPs (n=107) responded to the first case study on otitis media in 1999. Ninety-twoper cent of GPs chose to prescribe an antibiotic in a case which the microbiologist’s expertcommentary described as not requiring antibiotic therapy. Eighty-six per cent of the prescriptionswritten were intended for immediate use. Furthermore, while 73 per cent chose amoxycillin as theirfirst-line agent (in line with Therapeutic guidelines recommendations), some antibiotics selected wereinappropriate for the likely causative pathogens, including cephalexin, co-trimoxazole, penicillin V, androxithromycin.
In 2001, GP participation in NPS case studies had increased such that 962 responses had beenreceived for the study on sinusitis; the responses from a sample of 150 participants were analysed.Ninety per cent of GPs considered an antibiotic was required; some of this prescribing wasaccompanied by symptomatic treatments such as a decongestant and an analgesic. Amoxycillin was the first-choice antibiotic in 77 per cent of cases in accordance with Therapeutic guidelinesrecommendations.
The antibiotic clinical audits measured concordance with Therapeutic guidelines recommendations.Overall, concordance included occasions when an antibiotic was not indicated and was not prescribed,or when an antibiotic was indicated and the appropriate first-line agent was selected.
Concordance for all conditions (common cold, sore throat, acute otitis media, otitis media witheffusion, acute sinusitis, acute bronchitis and chronic bronchitis) was moderately good (around 70%)for the three audits. Certain conditions were managed in accordance with recommendations betterthan others: that common colds are viral and do not require antibiotics was recognised by over 90 percent of respondents, yet acute bronchitis was poorly managed with around 50 per cent of respondentsprescribing antibiotics despite this condition viral most often having a viral cause.
In general, the levels of antibiotic prescribing were high, particularly for sore throats, acute sinusitis,acute otitis media, and acute bronchitis. The overall amount of antibiotic prescribing was 42.6 percent, 50.3 per cent, and 50.9 per cent for 1999, 2000, and 2001, respectively. With respect toantibiotic selection, although higher use of the first-line agents amoxycillin and penicillin V, ispromising in comparison with other agents, inappropriate choices for treating URTIs such ascephalexin, cefaclor, and macrolides, continues.
Discussion
Results from the case studies and clinical audits are not comparable as some data are derived forhypothetical cases whereas the clinical audits are self-reported with no assurance of standardiseddiagnostic labelling. However, they do provide an insight into conditions for which GPs are more likelyto prescribe antibiotics.
Overall, the antibiotic prescribing rate of around 50 per cent still allows room for improvement giventhat these conditions are primarily viral or self-limiting in nature. Antibiotic prescribing for theseconditions remains high and with only moderate accord with national best practice guidelines. This isdespite mounting evidence from systematic reviews and meta-analyses that prescribing antibioticsdoes little to affect the course of many URTIs.
S40 Antimicrobial Resistance in Australia

Some areas pose greater diagnostic and therapeutic dilemmas for prescribers. GPs are aware of theevidence regarding antibiotic prescribing for otitis media and there appears to be a willingness todelay antibiotic use (around 10% of antibiotic prescriptions in the audits were to be filled at a laterdate), yet there is still an inappropriate level of prescribing for acute bronchitis which is almost alwaysviral in nature. Similarly, acute sore throat was treated with antibiotics too frequently for what is mostoften a viral infection; an antibiotic is indicated in severe tonsillitis only. Perhaps some conditionspresent greater diagnostic ambiguity, for example concern that acute bronchitis may be pneumonia,and this concern drives antibiotic prescribing outside evidence-based recommendations.
The NPS receives feedback on GP perceptions of antibiotic prescribing for URTIs via activity reportssubmitted by NPS facilitators following educational visits and small-group peer discussions with GPs.Through these reports, the NPS has become aware that focusing on resistance patterns can divertthe emphasis away from the self-limiting nature of most URTIs and the limited benefit of antibiotics.However, practitioners often receive information concentrating on bacterial sensitivities andresistance to primary care antibiotics, either through pharmaceutical industry detailing or the datapresented in product information documents.
An overemphasis on increasing rates of resistance for common respiratory pathogens deflects fromthe issue of judiciousness in the decision to prescribe (if at all) and can prompt inappropriateresponses, for example, selecting second-line antibiotics as first-line choices or using antibiotics inconditions where they are of limited benefit.
Another problem for GPs is reconciling the public health necessity of reduced antibiotic resistancethrough less prescribing with the potential individual benefits of prescribing antibiotics for the patientbefore them. GPs need to be able to offer patients alternatives to antibiotics in the management oftheir URTI to help find this balance should prescribing be deemed unnecessary.
Consequently, the NPS has provided tools for GPs to facilitate alternative approaches to managingURTIs, including symptomatic management ‘non-prescription’ pads, patient materials on sore throatsand acute bronchitis, as well as consumer campaigns (such as the Common colds need common sensecampaign) that raise community awareness of the limitations of antibiotics for certain infections andhighlight the possible side-effects of antibiotics.
In conclusion, activities to address excessive antibiotic use need to include primary care settings asthere is evidence that the management of URTIs by this group is less than optimal. However, globalarguments on developing resistance can sometimes overwhelm quality issues surrounding antibioticprescribing in this arena. Messages for general practitioners must focus on the benefits and risk tothe patient which can be applied in daily practice. Promoting appropriate prescribing for URTIs will initself contribute to reducing antibiotic resistance as there is room for improvement in the currentattitudes toward the management of these conditions.
Acknowledgments
We wish to thank the NPS staff involved in the development and analysis of the case studies andclinical audits. We also recognise the efforts of the NPS facilitators and appreciate their constantfeedback.
References:
1. Nasrin D, Collignon PJ, Roberts L, Wilson EJ, Pilotto LS, Douglas RM. Effect of beta lactam antibiotic use inchildren on pneumococcal resistance to penicillin: prospective cohort study. BMJ 2002;324:28–30.
2. Britt H, Miller GC, Knox S, Charles J, Valenti L et al. General practice activity in Australia 2000–01. AIHW Cat.No. GEP 8. Canberra: Australian Institute of Health and Welfare (General Practice Series No. 8).
3. National Prescribing Service. Antibiotics in primary care. Prescribing Practice Review May 2002;18:2–3.
Antimicrobial Resistance in Australia S41

S42 Antimicrobial Resistance in Australia
Consumer activities on antimicrobial resistance in Australia
Jan Donovan
Australian Pharmaceutical Advisory Council (APAC)
AbstractThe focus of this article is the role of consumer education campaigns in Australia and overseas as animportant step in helping people develop a more considered use of antibiotics. Evidence of thesuccess of campaigns in Australia, New Zealand and the United Kingdom is presented. On the basisof this evidence, the paper argues that education campaigns are central to reducing inappropriateantibiotic use and lowering the chances of antibiotic resistance building up in the populations ofdeveloped countries. Commun Dis Intell 2003;27 Suppl:S42–S46.
Keywords: antimicrobial resistance, JETACAR, public health, education campaigns
Introduction
The Pharmaceutical Benefits Scheme provides consumers with equitable and affordable access tonecessary antibiotics in the community. This access to antibiotic treatments has worked well forAustralians, but many viral infections, such as upper respiratory tract infections are still being inappropriatelytreated with antibiotics.1 In the 1940s coinciding with the introduction of penicillin, antibiotic-resistant bacteria were isolated in Australian hospitals. The implications and public health importanceof antibiotic resistance have been well understood by health professionals such as microbiologists andinfectious disease physicians but consumers lacked information about the health risks associatedwith antimicrobial resistance. This may partly explain the lack of political will to address this problemuntil recently.
In the late 1980s, the Consumers Health Forum produced a document titled Towards a NationalMedicinal Drug Policy. This work by consumers stimulated a quality use of medicines policy formulatedby the Pharmaceutical Health and Rational Use of Medicines (PHARM) Committee and accepted aspart of National Medicinal Drug Policy by government in the early 1990s. In 2000, the NationalMedicinal Drug Policy was revised and the National Medicines Policy was endorsed by government.The Joint Expert Technical Advisory Committee on Antibiotic Resistance (JETACAR) assisted thisprocess, but until recently was not integrated with National Medicines Policy activities.
National focus on antibiotic resistance
The JETACAR, a Commonwealth Government initiative, was a group of experts from human health,veterinary medicine and primary industry. They had the task of assessing the scientific evidence fora link between the use of antibiotics in food producing animals, and the emergence of antibioticresistant bacteria in humans (JETACAR, 1999).2 JETACAR reported to Government in 1999 and wasthen disbanded. A Government response to JETACAR was released in 2000 and this is now beingimplemented.
In May 2001 the Commonwealth Government sought participation from all of the key stakeholders ina National Summit on antimicrobial resistance, to assist in the implementation and consultationprocess. Five priority areas for action are: regulatory controls, monitoring and surveillance, infectionprevention, and education and research.3 These issues require governments, health professionals,consumers, veterinary professionals and agriculture producers to work cooperatively towards asolution to the problem.
Correspondence: Ms Jan Donovan, 25 New Street, Brighton Beach VIC 3186. Telephone: +61 3 521 8293. Email: [email protected]

The Summit reinforced the importance of educating the public, as well as the medical and veterinaryprofessions and farmers about the appropriate use of antibiotics and flagged this as a priority. Otherpriorities identified included the greater involvement of consumer organisations in the development ofcommunity education initiatives, and establishing links with general practice and veterinaryinitiatives. Maintaining Australia’s commitment to the World Health Organization’s strategy to reducereliance on antibiotics was also viewed as crucial.4
National Medicines Policy
The quality use of medicines component of the National Medicines Policy is now the cornerstone forcommunity action to minimise the inappropriate use of antibiotics in Australia. According to theNational Medicines Policy 2000 all medicines should be used;
• judiciously: medicines should be used only when appropriate, with non medicinal alternatives alsoconsidered;
• appropriately: choosing the most appropriate medicine taking account of clinical condition, risksand benefits, dose, length of treatment and cost;
• safely: misuse, including overuse and under use should be minimised; and
• efficaciously: the medicines must achieve the goals of therapy by delivering beneficial changes inactual health outcomes.
In March 2002, the National Strategy for the Quality Use of Medicines was released by theCommonwealth Department of Health and Ageing.5 The National Strategy is an important step forwardas it acknowledges that there are still significant problems linked to the use of medicines in Australia.For example, the National Strategy points out that problems remain despite successful initiativespromoting the quality use of medicines in areas such as improved use of antibiotics and non-steroidalanti-inflammatory drugs with fewer hospitalisations and deaths associated with the adverse effects ofthese medicines. However, there is still no room for complacency as there are now around 140,000hospital admissions each year associated with problems with the use of medication.6 Older people onmultiple medicines are at increased risk of medication misadventure and increasing risk of antibioticresistance.6
Community use of antibiotics
The number of prescriptions written for antibiotics declined from 26.5 million in 1993–94 to just under23.3 million in 1998–99. One of the challenges has been to change community attitudes and promoteongoing and regular consumer information and education about the appropriate use of antibiotics. Thisincludes such matters as their ineffectiveness in treating viral infections such as coughs and colds.Since 1992, the Commonwealth Government has actively sought to address the problem of antibioticprescribing and use in the community, through consumer education campaigns. The National Strategyfor the Quality Use of Medicines highlights education as an essential process to increase theawareness of communities, their knowledge and skills and motivation in relation to the quality use ofmedicines.
Consumer medicines education
Australia has now become a leader in tackling the problems related to appropriate prescribing and useof antibiotics. Early work done by PHARM included the National Medicines Week campaigns on theappropriate use of medicines. The 1996 campaign specifically targeted the appropriate use ofantibiotics by consumers. Themes of the 1996 National Medicines Week campaign in Australia were to:
• ask your doctor or your pharmacist about your medicines;
Antimicrobial Resistance in Australia S43
S44 Antimicrobial Resistance in Australia
• encourage people to be more aware of the risks and benefits of medicines; and
• ask for and read Consumer Medicines Information.
The National Medicines Week campaign produced a range of promotional materials for use in localcommunities including a brochure titled Antibiotics, your questions answered and a booklet Be wise withmedicines with a section ‘When antibiotics will not help’. (Commonwealth Department of Health andFamily Services, 1996).
Other activities included a National Phone-in Medicines Information Service, media and radiocampaigns, written information in pharmacies and GPs' surgeries, community grants and educationalsessions on the quality use of medicines.
An evaluation of the National Medicines Week campaigns 1996 to 1998 showed they were effectivein terms of increasing community awareness of the 'be wise with medicines' messages. Knowledge ofthe messages increased from 19 per cent in 1996 to 26 per cent in 1998 and rose to 30 per cent inthe older population. The evaluation found that the National Medicines Week campaigns had an impacton consumer attitudes, knowledge and behaviour in relation to medicines. Consumers who were awareof the National Medicines Week messages were more likely to take action such as asking questions,discussing the use of their medicines with their doctor or pharmacist and asking for a medicinesreview.
According to the report evaluating the quality use of medicines component of the National MedicinesPolicy, over 70 per cent of the population considered it inappropriate to take antibiotics for colds, theflu or a sore throat, while more than 20 per cent of people considered it inappropriate to takeantibiotics for bronchitis. In 1999 the National Prescribing Service (NPS) ran its first consumer surveyas part of the NPS evaluation activity in order to achieve a better understanding of the attitudes andbeliefs of consumers towards the use of antibiotics for coughs and colds. Similar surveys were alsoconducted in 2000 and 2001. There was a perception in younger people (particularly young males)that antibiotics promote recovery and prevent deterioration. Consequently, the NPS campaigns in2001 and 2002 developed messages to address this erroneous perception and specifically targetedyounger people, those in the workforce and parents of young children.
National Medicines Week consumer projects
As part of the 1996 National Medicines Week consumer activities, the Council on the Ageing(Australia) ran a major national project funded by the Commonwealth Department of Health andAgeing to coincide with National Medicines Week. Eighty peer educators were trained to disseminateinformation on the appropriate use of medicines including antibiotics. Peer educators held localdiscussion groups using the materials provided by the Commonwealth Department of Health andAgeing for National Medicines Week.
The formal evaluation funded by the Department of Health and Ageing identified a number of positiveelements of this sort of approach. For example, the evaluation found that:
‘Important processes were established through the peer education program that continue to yield benefits…a significant feature of the program was the extent to which resources were maximised… the grass rootsnetworking and promotion that occurred would have been costly to run otherwise.’
The evaluation of the 1996 consumer project also made the general point that the projects were acommunity development activity bringing together community members and professionals in a waythat encouraged partnerships.
A more recent project conducted by Council on the Ageing in 2000–2001, focused on all medicines(including complementary). It adopted a community/business partnership approach to work withhealth professionals through the involvement of pharmacists in training older people about the wiseuse of medicines.

Outcomes of consumer campaigns
There are major advantages for health professionals and government working in partnership withconsumer organisations on antimicrobial resistance. The materials produced for consumers such asthose produced for the National Medicines Week campaigns are widely disseminated at the local level.With input from the target groups, written information is designed to meet the needs of consumersand is widely disseminated and discussed. A more informed network of locally based peer educatorsis established and awareness is raised about the problem. A better understanding of the problems ofantibiotic use and antimicrobial resistance greatly assists in changing attitudes and addressing theissue in the community.
Unfortunately, the National Medicines Week campaigns about the wise use of medicines includingantibiotics were not ongoing. However, the NPS has broadened its work, focusing on the communitywith a ‘wise use of antibiotics’ message 'common cold needs common sense'. During the winters of2001 and 2002, this message was widely publicised in local press, community grants enabled locallevel discussion and the messages were reinforced on billboards in some capital cities. The NPScampaign works with diverse groups of consumers, including non-English speaking consumers.Consumer activity at the local level is encouraged through a community grants process. The winter2002 campaign is being evaluated.
Consumer strategies in other countries
Other countries such as the United Kingdom (UK), the USA and New Zealand are also concerned aboutthe appropriate use of antibiotics in the community. Both the United Kingdom and New Zealand runcampaigns targeted to both consumers and prescribers on the ineffectiveness of antibiotics forcoughs and colds. For example, the UK has recently targeted campaigns on the appropriate use ofantibiotics for viral upper respiratory tract infections to both prescribers and consumers. In the UK, a9 per cent reduction in consumption of anti-microbials was achieved. The UK and New Zealandcampaigns produce posters and leaflets for use by consumers and health professionals.
In New Zealand, written materials about colds and flu are also disseminated to the community throughgeneral practitioners. The Pharmaceutical Management Agency in New Zealand has run thecampaigns in the years 1998–2001 from May to September. The New Zealand campaign aims toeducate prescribers, consumers and the general public about the appropriate use of antibiotics inrespiratory infections. An evaluation component is included with each campaign. The evaluation of the2000 campaign showed that prescriptions for antibiotics were reduced by 14.8 per cent from Januaryto December 2000 compared to the same period in 1999. There was also a shift in prescribing frombroad spectrum to narrow spectrum antibiotics, improved public understanding of the role ofantibiotics and changing consumer expectations about receiving antibiotics.
The future
To be effective, future Australian consumer campaigns need to work in partnership with and engageconsumer organisations. Health professionals and other stakeholders need to foster consumerpartnerships to ensure antibiotic awareness campaigns are coordinated. Consumer campaigns, suchas the National Medicines Week campaigns and the National Prescribing Service Common colds needcommon sense campaign are part of Australia’s contribution to the World Health Organization’s globalstrategy to address antimicrobial resistance.
To continue to be effective, these campaigns need to be ongoing, engage consumers and work at thelocal as well as the national level. The consumer education funding announced in the last Federalbudget 2001–02 will be an important resource for additional consumer activity in curbing inappropriateuse of antibiotics in the future. The issue of antimicrobial resistance in Australia is a major publichealth issue and consumers have an important role in ensuring its growth is curbed.
Antimicrobial Resistance in Australia S45

References
1. National Prescribing Service. Evaluation report No. 2. National Prescribing Service; Sydney, November 2000:8.
2. Commonwealth Department of Health and Aged Care. Report of the Joint Expert Technical Advisory Committeeon Antibiotic Resistance (JETACAR). Commonwealth Department of Health and Aged Care, CommonwealthDepartment of Agriculture, Fisheries and Forestry—Australia. Biotex Canberra, 1999.
3. Commonwealth Department of Health and Aged Care. Communique National Summit on Antibiotic Resistance2001, Commitment and Communication, Issue 1.
4. World Health Organization. Global strategy for containment of antimicrobial resistance. World HealthOrganization, 2001.
5. Department of Health and Ageing. The National Strategy for Quality Use of Medicines. Department of Health andAgeing, Canberra, 2002:4.
6. Commonwealth Department of Health and Aged Care. National Medicines Policy. Commonwealth Department ofHealth and Aged Care, 2000:3.
S46 Antimicrobial Resistance in Australia

Antimicrobial Resistance in Australia S47
Fifteen years of surveillance by the Australian Groupfor Antimicrobial Resistance (AGAR)
Graeme R Nimmo,1 Jan M Bell,2 Peter J Collignon,3 on behalf ofthe Australian Group for Antimicrobial Resistance
AbstractThe Australian Group for Antimicrobial Resistance (AGAR) has played a unique role in surveillance ofantimicrobial resistance in Australia. It has a broad laboratory membership representing the majorteaching hospitals in all Australian capitals and more recently major private pathology laboratories inmost states. The use of an active surveillance strategy with standard methodology for collection andexamination of clinically significant isolates has produced data accurately reflecting the changingprevalence of antimicrobial resistance in major hospitals as well as the community. AGAR hasdocumented the spread of methicillin-resistant Staphylococcus aureus in Australian hospitals in thelate 1980s and throughout the 1990s. Surveys of antimicrobial resistance in enterococci havemonitored the emergence of vancomycin-resistant enterococci as an important nosocomial pathogenin Australia. AGAR has also conducted major national surveys of resistance in Streptococcuspneumoniae, community isolates of Staphylococcus aureus, Haemophilus influenzae and in theEnterobacteriaceae. These and other activities have given AGAR a unique perspective on emergingpatterns of resistance in key pathogens in Australia. The recent extension of membership to includemore private pathology laboratories may provide the opportunity to conduct more representativecommunity based surveys. Commun Dis Intell 2003;27 Suppl:S47–S54.
Keywords: methicillin-resistant Staphylococcus aureus, vancomycin-resistant enterococci,Streptococcus pneumoniae, antimicrobial resistance
Introduction
The Australian Group for Antimicrobial Resistance (AGAR) has conducted surveillance of antimicrobialresistance in Australian teaching hospitals since 1986. AGAR membership has always includes verybroad representation of the major teaching hospitals in all Australian capitals (Figure 1). The spreadof methicillin-resistant Staphylococcus aureus (MRSA) was a major concern in the 1980s andsurveillance of hospital staphylococcal infections was the first activity of AGAR. Periodic surveys ofthe prevalence of resistance in hospital isolates of S. aureus have now been conducted for 15 years.1,2
This represents the most complete prospective national description of the evolution of resistance inhospital isolates of S. aureus.
1. Director of Mircobiology, Queensland Health Pathology Services, Brisbane, Queensland.
2. Senior Scientist, Mircobiology and Infectious Disease, Women’s and Children’s Hospital, North Adelaide, South Australia.
3. Director of Microbiology and Infectious Diseases, Canberra Hospital, Garran, Australian Capital Territory.
The Australian Group for Antimicrobial Resistance is (in alphabetical order): John Andrew (Gribbles Pathology Victoria Pty Ltd,Victoria), Jan Bell (Women’s and Children’s Hospital, South Australia), Richard Benn, Sue Benson (St John of God Pathology,Western Australia), Susan Bradbury (Canberra Hospital, Australian Capital Territory), Keryn Christiansen, Peter Collignon, GeoffCoombs (Royal Perth Hospital, Western Australia), Marion Easton, Joan Faoagali, Clarence Fernandes (Royal North Shore Hospital,New South Wales), Graham Francis (Fremantle Hospital, Western Australia), Glenn Funnell (Concord Repatriation General Hospital,New South Wales), Sue Garland, Narelle George (QHPS, Royal Brisbane Hospital, Queensland), Gena Gonis, Iain Gosbell, TomGottlieb, Jacqueline Harper, Linda Joyce (St Vincent’s Hospital, Victoria), PC Lee (Gribbles Pathology, South Australia), Irene Lim,Gary Lum (Royal Darwin Hospital, Northern Territory), David McGechie, Alistair McGregor (Royal Hobart Hospital, Tasmania), DavidMitchell (Westmead Hospital, New South Wales), Leigh Mulgrave (PathCentre, Western Australia), Stephen Neville (South WesternArea Pathology Service, New South Wales), Graeme Nimmo, Miriam Paul (Douglas Henley Moir Pathology, New South Wales), JohnPearman, Hendrik Pruul (Flinders Medical Centre, South Australia), Jenny Robson (Sullivan Nicolaides Pathology, Queensland),David Rose (Nepean Hospital, New South Wales), Jacqueline Schooneveldt (QHPS, Princess Alexandra Hospital, Queensland), DenisSpelman (Clare Franklin Alfred Hospital, Victoria), Joanne Stylianopoulos, Anastasia Stylianopoulos (Royal Children’s and Women’sHospitals, Victoria), John Turnidge, Alison Vickery, Mary Jo Waters, Bruce Winter (Institute of Medical and Veterinary Science,South Australia), Barbara Yan (Royal Prince Alfred Hospital, New South Wales).
Corresponding author: Dr Graeme Nimmo, Director of Microbiology, Queensland Health Pathology Service, c/– Princess AlexandraHospital, Brisbane QLD 4102. Telephone: +61 7 3240 2389. Facsimile: +61 7 3240 5786. Email: [email protected]

S48 Antimicrobial Resistance in Australia
Figure 1. Distribution of participating teaching hospital laboratories in capital cities
The emergence of resistance in other groups of bacteria has prompted AGAR to conduct a number oforganism specific surveys. An extensive study of resistance in Haemophilus influenzae was conductedprior to the introduction of vaccination for H. influenzae type b.3 The emergence of antimicrobialresistance in Streptococcus pneumoniae has caused worldwide concern and AGAR has been able todemonstrate over four surveys the trend towards multiple antimicrobial resistance and penicillinresistance in pneumococci in Australia.4,5 Ongoing surveys of antimicrobial resistance in enterococcihave also been conducted in response to increasing interest in vancomycin-resistant enterococci.Changing patterns of resistance in the Enterobacteriaceae and the emergence of extended-spectrumß-lactamases (ESBL) led to surveys of resistance trends in Escherichia coli and Klebsiella pneumoniae.
Methods
The AGAR surveys have been conducted prospectively with standardised methods for data collection,isolate collection and laboratory examination. Collections consisting of unique clinically significantsequential isolates, excluding duplicates and screening isolates, have been stored for futurereference. Methods for identification, susceptibility testing and typing have been described in detailelsewhere.1,2,3,4,5 Standard quality control organisms were included in each susceptibility testing batchwith results validated by a coordinating laboratory.
Results
Resistance in Staphylococcus aureus
The first three surveys of the prevalence of resistance in teaching hospital isolates of S. aureus wereconducted during 1986 and 1987.1 This first national study involved 14 teaching hospital laboratoriesin the national capital and all mainland state capitals. The study established that the prevalence ofMRSA as a proportion of clinically significant isolates of S. aureus was 14.4 per cent. Annual surveyswere conducted from 1989 to 1999 and the results have been published2 or submitted for publication.The total number of isolates collected in each year and the number of MRSA isolates are shown in

Antimicrobial Resistance in Australia S49
Figure 2. In the initial study most MRSA isolates were multiresistant. In the subsequent annualsurveys MRSA was divided into two groups based on resistance to erythromycin, tetracycline,trimethoprim, gentamicin, rifampicin, fusidic acid, ciprofloxacin and mupirocin. Isolates which wereresistant to three or more of the above were defined as multiresistant (mMRSA), and those resistantto less than three as non-multiresistant (nmMRSA). Data collected by AGAR and others showed thatthis latter non-multiresistant group appeared to arise more often in the community setting.6,7,8 Thetrends in prevalence of mMRSA and nmMRSA are shown in Figure 3. Both show marked and sustainedincreases in the late 1990s.
Figure 2. Number of MRSA and MSSA isolates collected from 1989 to 1999
MRSA Methicillin-resistant Staphylococcus aureus.
MSSA Methicillin-senstive Staphylococcus aureus.
Figure 3. mMRSA and nmMRSA isolates collected from 1989 to 1999 as a proportion of allStaphylococcus aureus isolates
0
200
400
600
800
1000
1200
1400
1600
1800
1989 1990 1991 1992 1993 1994 1995 1996 1997 1998 1999
Total MRSA
Total MSSA
Num
ber
of is
olat
es
Year
0
5
10
15
20
25
30
35
1989 1990 1991 1992 1993 1994 1995 1996 1997 1998 1999
nmMRSA
mMRSA
Per
cen
t
Year

S50 Antimicrobial Resistance in Australia
Resistance in Haemophilus influenzae
Thirty-four laboratories were involved in the collection of 970 isolates of H. influenzae between 1988and 1990.3 Minimal Inhibitory Concentrations (MICs) to 16 different antibiotics were determined. Theoverall rate of beta-lactamase production was 16 per cent but there was wide variation between thestates. In Adelaide the rate was 4.5 per cent and in Canberra 28.6 per cent. There was also a markeddifference between invasive strains (e.g., blood) and non-invasive strains (e.g., sputum). In invasivestrains beta-lactamase production was 22.3 per cent but in respiratory tract isolates it was 35.3 percent. Most strains were resistant to erythromycin. Variable resistance was seen to most otherantibiotics with geographical differences as well as differences between invasive and non-invasivestrains. In non-invasive strains the resistance to amoxicillin-clavulanate, chloramphenicol,tetracycline, trimethoprim and co-trimoxazole were 2.1 per cent, 1.8 per cent, 4.5 per cent, 12.2 percent and 5.7 per cent respectively.
Resistance in Streptococcus pneumoniae
Antimicrobial resistance in Streptococcus pneumoniae has been monitored by the AGAR group in threesurvey periods, 1989, 1994 and 1999. Up to 100 consecutive clinically significant isolates werecollected from each participating laboratory. All isolates collected for the 1994 and 1999 surveys hada penicillin MIC determined using Etest strips (AB Biodisk, Solna, Sweden). Erythromycin,tetracycline, chloramphenicol and co-trimoxazole were tested using disc diffusion. Penicillinresistance increased significantly between 1989 and 1994, however, this trend levelled out in 1999.Overall 86 per cent of invasive isolates and 75 per cent of non-invasive isolates were penicillinsusceptible (MIC < 0.064 mg/L). High-level penicillin resistance (MIC > 1 mg/L) was found in 2.6 percent of invasive isolates and 6.9 per cent of non-invasive isolates. Prevalence of penicillin resistancein invasive and non-invasive isolates in each state is shown in Figures 4 and 5. Multi-drug resistantstrains were common with over 8 per cent resistant to three or more antimicrobial agents tested in1994. In 1999, 6.8 per cent of invasive and 16.7 per cent of non-invasive isolates were multi-drugresistant. Another survey was conducted in 2002.
Figure 4. Proportion of penicillin resistance in Streptococcus pneumoniae in invasive isolates by state,1999
0
5
10
15
20
25
ACT42
NSW131
Qld44
SA53
Tas0
Vic43
WA54
Aust381
MIC 0.125-1
MIC >1
Pen
icill
in r
esis
tanc
e pe
rcen
tage
States

Antimicrobial Resistance in Australia S51
Figure 5. Proportion of penicillin resistance in Streptococcus pneumoniae in non-invasive isolates bystate, 1999
Resistance in enterococci
Two surveys to study the prevalence of antimicrobial resistance in Enterococcus spp. in hospitalswere conducted, one in 1995 and another in 1999. For each study period, up to 100 consecutiveclinically significant strains were identified and antimicrobial susceptibility tests performed using theparticipating institutions routine methods. Any strain demonstrating resistance to ampicillin,vancomycin or high level aminoglycoside resistance, and all non E. faecalis isolates were referred to acentral testing laboratory for confirmation. Correct identification of enterococci to species level wasproblematic. The proportion of E. faecium increased from 5 per cent of all isolates in 1995 to nearly10 per cent in 1999. No vancomycin resistance was detected in the first study period, however, in1999, six (0.3%) strains were resistant. Ampicillin resistance in E. faecium increased from 57 per centin 1995 to 77 per cent in 1999. Beta-lactamase production remains uncommon, with only one ß-lactamase producing E. faecalis detected.
During 1999, 18 institutions collected all enterococci isolated from blood cultures. Over 370 strainswere isolated, of which 74 per cent were E. faecalis, and 20 per cent were E. faecium. Vancomycin-resistance was detected in 8 per cent of all E. faecium isolates. All were vanB and were from threeinstitutions.
Resistance in Escherichia coli and Klebsiella spp.
Surveys of resistance and multi-resistance in Escherichia coli and Klebsiella spp. have been conductedbiannually since 1992. Up to 50 isolates from each species were collected from 14–20 institutionsthroughout Australia. MICs to 14 antimicrobial agents (from 8 drug classes) were determined using acustomised conventional MicroScan broth microdilution panel (Dade Behring, West Sacramento,California). In E. coli ampicillin resistance has been prevalent since the beginning of surveillance atapproximately 50 per cent, while non-susceptibility to amoxicillin-clavulanate has remained at under10 per cent. Multi-resistant E. coli ( resistance to 4 or more drug classes) were uncommon (<4%). K. pneumoniae with an extended-spectrum ß-lactamase phenotype were prevalent in some institutions(Figure 6). Overall 8 per cent (range 0–26%) of K. pneumoniae were ceftazidime resistant (MIC > 1 mg/L).While most institutions demonstrated a decline in the number of K. pneumoniae with ESBL phenotypessince 1992, others have shown a steady increase since 1996. The number of E. coli that wereceftazidime resistant has remained steady at less than 1.5 per cent since 1992 (Figure 7). Between
0
5
10
15
20
25
ACT42
NSW131
Qld44
SA53
Tas0
Vic43
WA54
Aust381
MIC 0.125-1
MIC >1
Pen
icill
in r
esis
tanc
e pe
rcen
tage
States

S52 Antimicrobial Resistance in Australia
0
2
4
6
8
10
12
1992 1994 1996 1998 1992 1994 1996 1998
MIC >8 mg/L
MIC 2-8 mg/L
Res
ista
nce
perc
enta
ge
YearE.coli K. pneumoniae
1992 and 1998, the rate of ceftazidime resistant K. pneumoniae varied between 6–10 per cent withan increasing proportion of isolates with an MIC > 8 mg/L (Figure 7). Gentamicin resistance was alsocommon in some institutions and closely paralleled ESBLs (Figure 8). Ciprofloxacin non-susceptibility (MIC > 1 mg/L) was uncommon in E. coli (< 1%). Ciprofloxacin non-susceptible K. pneumoniae decreased from 6–7 per cent in 1992–1996 to less than 3 per cent in 1998 (Figure 9).No carbapenem resistance has been detected. An increase in co-trimoxazole resistance (MIC > 8 mg/L)was observed between 1992 and 1994 (11% to 19%), but the level of resistance has since remainedsteady at approximately 20 per cent (data not shown).
Figure 6. Extended-spectrum ß-lactamase phenotype in Escherichia coli and Klebsiella pneumoniae in20 institutions, 1992 to 1998
Figure 7. Proportion of ceftazidime resistance in Escherichia coli and Klebsiella pneumoniae, 1992 to 1998
0%
50%
100%
150%
200%
250%
300%
350%
400%
1 1 2 3 4 5 1 1 2 1 2 3 1 2 3 4 5 1 2 3
K. pneumoniae
E. coli
Per
cent
age
of a
ll is
olat
es
Institutions by stateACT NSW NTQLD SA VIC WA

Antimicrobial Resistance in Australia S53
Figure 8. Proportion of gentamicin resistance in Escherichia coli and Klebsiella pneumoniae, 1992 to 1998
Figure 9. Proportion of ciprofloxacin resistance in Escherichia coli and Klebsiella pneumoniae, 1992 to 1998
Future directions
AGAR will continue to publish surveys of antimicrobial resistance in bacteria causing serious healthproblems within Australia. Organisms of interest will include Staphylococcus aureus, pneumococcus,Enterococcus spp, E.coli, Klebsiella spp. and Enterobacter spp. As significant problems emerge in otherorganisms they will also be subject to survey where practicable. AGAR may also test organisms otherthan bacteria where there is currently little or no data but potential for antimicrobial resistance tocompromise clinical care (e.g., fungi).
0
2
4
6
8
10
12
1992 1994 1996 1998 1992 1994 1996 1998
MIC >8 mg/L
MIC 8 mg/L
Res
ista
nce
perc
enta
ge
YearE.coli K. pneumoniae
1992 1994 1996 1998 1992 1994 1996 1998
MIC >2 mg/L
MIC 2 mg/L
Res
ista
nce
perc
enta
ge
YearE.coli K. pneumoniae
0
1
2
3
4
5
6
7
8

S54 Antimicrobial Resistance in Australia
Additional major private laboratories have joined AGAR recently so that private pathology is nowrepresented in each mainland state. This has given AGAR the ability to conduct valid surveys ofcommunity-acquired as well as health care-associated infections. Opportunities also exist for closerliaison with other groups involved in surveillance of health care-associated infections (e.g., withAustralian Infection Control Association on national surveillance of wound and blood streaminfections). A collaborative approach should provide better quality national data on all aspects ofinfection including antimicrobial resistance. AGAR surveys to date have mainly been limited to majorteaching hospitals in capital cities. While we believe those results reflect the situation in thoseinstitutions, we have not attempted any population based surveys. Recent consolidation of pathologyservice provision and the availability of more flexible information technology may both serve to makesuch surveys a more practical possibility. Matching of data from such surveys to other informationsuch as antimicrobial consumption may also be possible in future creating a powerful tool formonitoring the effectiveness of initiatives aimed at encouraging rational prescribing.
Continued funding of AGAR is a vexed issue. While funding for the survey activities of AGAR has beenprimarily by the participating laboratories, one major pharmaceutical company sponsored biannualmeetings of participants from 1986 to May 2002. AGAR must now identify stable ongoing sources offunds to enable it to continue its current program and where appropriate broaden the scope of itsactivities, for example in the area of community-acquired infection. Whether funding can be sourcedfrom the pharmaceutical industry or from government remains to be seen. The former possibility maybe problematic given the reduction in development and marketing of antimicrobials in recent years.
For 15 years AGAR has provided data on the evolution of antimicrobial resistance in major pathogensin Australia. In the future it is hoped AGAR will not only continue this important task but also broadenthe range of its surveys to cover emerging resistance in all organisms of importance in communityand health care-associated infection. Efforts need to be made to ensure sampling is representative ofhospital and community trends, to correlate results with other relevant data and to disseminateresults widely in a more timely manner.
Acknowledgment
Eli Lilly Australia Pty Ltd was the major sponsor of AGAR from 1986 to 2002. We also acknowledgethe significant contribution by Mrs Pam Catanach.
References
1. Turnidge J, Lawson P, Munro R, Benn R. A national survey of antimicrobial resistance in Staphylococcus aureus inAustralian teaching hospitals. Med J Aust 1989;150:65–72.
2. Turnidge JD, Nimmo GR, Francis G. Evolution of resistance in Staphylococcus aureus in Australian teachinghospitals. Med J Aust 1996;164:68-–71.
3. Collignon P, Bell J, MacInnes S, Gilbert G, Toohey M. A national collaborative study of resistance to antimicrobialagents in Haemophilus influenzae in Australian hospitals. J Antimicrob Chemother 1992;30:153–163.
4. Collignon P, Bell J. Streptococcus pneumoniae: How common is penicillin resistance in Australia? Aust N Z JMed 1992;22:473.
5. Collignon P, Bell J. Drug-resistant Streptococcus pneumoniae: The beginning of the end for many antibiotics? MedJ Aust 1996;164:64–67.
6. Collignon P, Gosbell I, Vickery A, Nimmo G, Stylianopoulos T, Gottlieb T. Community-acquired methicillin-resistantStaphylococcus aureus in Australia. Lancet 1998;352:146–147.
7. Nimmo GR, Schooneveldt J, O'Kane G, McCall B, Vickery A. Community acquisition of gentamicin-sensitive MRSAin south-east Queensland. J Clin Microbiol 2000;38:3926–3931.
8. Gosbell IB, Mercer JL, Neville SA, Crone SA, Chant KG, Jalaludin BB, et al. Non-multiresistant and multiresistantmethicillin-resistant Staphylococcus aureus in community-acquired infections. Med J Aust 2001;174:627–630.

Antimicrobial Resistance in Australia S55
Australian hospital morbidity data on antibiotic resistance
Jenny Hargreaves,1 Jenny Kok2
AbstractReports of infections with drug-resistant microorganisms are included in the National HospitalMorbidity Database (NHMD) at the Australian Institute of Health and Welfare. This database includesdata on diagnoses of patients admitted to Australian hospitals, recorded using codes from theAustralian version of the International Classification of Diseases, 9th Revision, Clinical Modification(ICD-9-CM), and the International Statistical Classification of Diseases and Related Health Problems,10th Revision, Australian Modification. Reports of infections with drug-resistant microorganisms,recorded as either the patient’s principal diagnosis, or as a co-morbidity or complication, increasedmarkedly between 1994–95 (when the first reports were included) and 2000–01. Infections resistantto penicillins were the most commonly recorded. The national introduction of the Australian versionsof ICD-9-CM in 1995, and of casemix-based funding and management from the mid-1990s, has possiblyled to more accurate medical record documentation and improved coding of these infections and arelikely explanations for the observed increase in reporting. The NHMD should be considered as acomponent of a national surveillance system for antibiotic resistance. Its routine data collectioncovers almost all hospital separations in Australia and is supported by a comprehensive national datacollection infrastructure. Commun Dis Intell 2003;27 Suppl:S55–S60.
Keywords: hospital morbidity, antibiotic resistance
Introduction
Antibiotic resistance is a public health issue of major importance, with impacts on health costsresulting from consequent needs to use more expensive antibiotics, multiple courses of antibiotics,increased length of hospital stay, and increased morbidity and mortality.1 Systems for resistancesurveillance in human bacterial isolates seem to be well established.1 However, efforts to reduce theoccurrence and impact of antibiotic resistance, such as those coordinated by the CommonwealthInterdepartmental JETACAR Implementation Group, could usefully be additionally informed by othermonitoring activities.
Hospital morbidity data are routinely collected for all patients admitted in Australian hospitals. Thesedata, which include codes for infections with antibiotic resistant organisms, have the advantage ofessentially fully covering hospital separations (discharges, deaths or changes in type of care)throughout Australia, and being supported by substantial national data collection infrastructures.These data (collated nationally as the Australian Institute of Health and Welfare’s National HospitalMorbidity Database, NHMD) could therefore potentially be used as a component of a nationalsurveillance system for antibiotic resistance. However, the nature of this data collection, and itslimitations, need to be taken into consideration.
1. Head, Hospitals and Mental Health Services Unit, Australian Institute of Health and Welfare, Canberra, Australian CapitalTerritory
2. Hospitals and Mental Health Services Unit, Australian Institute of Health and Welfare, Canberra, Australian Capital Territory
Corresponding author: Ms Jenny Hargreaves, Head, Hospitals and Mental Health Services Unit, Australian Institute of Health andWelfare, GPO Box 570, Canberra ACT 2601. Telephone: +61 2 6244 1121. Facsimile: +61 2 6244 1299. Email: [email protected].

S56 Antimicrobial Resistance in Australia
The National Hospital Morbidity Database
The NHMD is a compilation of electronic summary records collected in admitted patient morbidity datacollection systems in almost all Australian hospitals.2 The data are provided by state and territoryhealth authorities and are based on the agreed National Minimum Data Set for Admitted Patient Careendorsed by the National Health Information Management Group and detailed in the National HealthData Dictionary.3
The data relate to hospital episodes of care or separations (discharges, deaths or changes in type ofcare), compiled by the date of separation: data for 1997–98, for example, include separations from 1 July 1997 to 30 June 1998. As the records relate to separations, rather than to individual patients,a patient who had been hospitalised more than once will have more than one record in the database.
Included in the NHMD are demographic, administrative and length of stay data, and data on diagnoses,procedures and external causes of injury and poisoning. A principal diagnosis is reported for allseparations and is defined as the diagnosis established after study to be chiefly responsible foroccasioning the patient’s episode of care in hospital.3
A majority of records also have one or more additional diagnoses. These are defined as conditions orcomplaints which either coexisted with the principal diagnosis or arose during the episode of care.3
For diagnoses of injuries and poisonings (which can include adverse events such as nosocomialinfections), ‘external causes’ are reported, defined as the environmental events, circumstances andconditions as the cause of injury, poisoning and other adverse effects.
Infections (such as those reported with antibiotic resistant organisms) can be recorded as theprincipal diagnosis or as an additional diagnosis. A secondary code is assigned (as an additionaldiagnosis) if the infection was caused by an antibiotic resistant organism. More than one drug-resistant organism, or more than one type of antibiotic resistance, can be reported within a singlerecord.
Diagnoses and external causes have been assigned codes based on the International StatisticalClassification of Diseases and Health Related Problems, 10th Revision, Australian Modification (ICD-10-AM)4 since 1998-99 in four states or territories, and since 1999-00 in the other four (Table 1). From1995-96 to the implementation of ICD-10-AM, the Australian editions of the InternationalClassification of Diseases, 9th Revision, Clinical Modification (ICD-9-CM)5,6 were used. Various otherversions of ICD-9-CM (for example, United States’ versions) were used prior to 1 July 1995.
Codes for infections with antibiotic resistant organisms were available in ICD-9-CM versions usedsince 1994-95, but only in ICD-10-AM since 2000-01. In ICD-9-CM, infections with drug-resistantorganisms were classified and coded to V09 (Infection with drug-resistant microorganism), with sub-categories available for different types of antibiotic resistance. In ICD-10-AM, a single code for drugresistance of any type (Z06) was available for data from 1 July 2000,7 and separate codes formultidrug-resistant Staphylococcus aureus and vancomycin resistant enterococci were included fromJuly 2002.8
Reports of infections with drug-resistant microorganisms
Between 1994-95 and 1997-98, there were marked increases in reports of infections with drug-resistant microorganisms, and of hospital separations for which they were reported (Table 2). Themost common type of antibiotic resistance reported was resistance to penicillins. Reports continuedto increase (by 16%) in 1998–99 for the four jurisdictions that continued to use ICD-9-CM in that year(Queensland, Western Australia, South Australia and Tasmania) (data not shown). Nationally, therewas a decline between 1997-98 and 1998-99, reflecting the introduction of the first edition of ICD-10-AM(which did not include a relevant code) in four jurisdictions from July 1998. In 2000-01 (in which thesecond edition of ICD-10-AM was used, with a relevant code), there were 21,704 separations reportednationally with infections with drug-resistant organisms, 25 per cent more than for 1997–98.

Antimicrobial Resistance in Australia S57
ICD version Edition Date of effect Codes Description
ICD-9-CM First 1 July 1995* V09.0 Infection with microorganisms resistant Australian version to penicillins
Second 1 July 1996 V09.1 Infection with microorganisms resistant to cephalosporins and other ß-Lactam antibiotics
V09.2 Infection with microorganisms resistant to macrolides
V09.3 Infection with microorganisms resistant to tetracyclines
V09.4 Infection with microorganisms resistant to aminoglycosides
V09.5 Infection with microorganisms resistant to quinolones and fluoroquinolones
V09.50 Without mention of resistance to multiple quinolones and fluroquinolones
V09.51 With resistance to multiple quinolones and fluoroquinolones
V09.6 Infection with microorganisms resistant to sulfonamides
V09.7 Infection with microorganisms resistant to other specified anti-mycobacterial agents
V09.70 Without mention of resistance to multiple anti-mycobacterial agents
V09.71 With resistance to multiple anti-mycobacterial agents
V09.8 Infection with microorganisms resistant to other specified drugs
V09.80 Without mention of resistance to multiple drugs
V09.81 With resistance to multiple drugs
V09.9 Infection with microorganisms resistant to unspecified drugs
V09.90 Without mention of multiple drug resistance
V09.91 With multiple drug resistance
ICD-10-AM First 1 July 1998† No codes to indicate infection with drug- resistant microorganisms
Second 1 July 2000 Z06 Infection with drug-resistant microorganism
Third 1 July 2002 Z06.1 Infection with multidrug-resistant Staphylococcus aureus
Z06.2 Infection with vancomycin resistant enterococci
Z06.8 Infection with other drug-resistantmicroorganism
Z06.9 Infection with drug-resistant microorganism, unspecified
* Prior to 1 July 1995, ICD-9 and various versions of the United States' ICD-9-CM were used.
† ICD-10-AM first edition was used in New South Wales, Victoria, the Australian Capital Territory and the Northern Territory from1 July 1998, and in all states and territories from 1 July 1999.
Table 1. International classification of disease codes used for infection with drug-resistant microorganisms

S58 Antimicrobial Resistance in Australia
ICD-9-CM Code Description 1994-95 1995-96 1996-97 1997-98 1998-99† 2000-01
V09.0 Penicillins 2,160 5,901 9,764 12,592 6,532 ‡
V09.1 Cephalosporins and 68 560 1,090 1,459 827 ‡other ß-Lactam antibiotics
V09.2 Macrolides 9 228 450 544 325 ‡
V09.3 Tetracyclines 46 180 385 494 290 ‡
V09.4 Aminoglycosides 32 234 331 451 282 ‡
V09.5 Quinolones and fluoroquinolones
V09.50 Without mention 7 48 137 166 87 ‡of resistance to multiple quinolones and fluroquinolones
V09.51 With resistance to 0 39 86 150 41 ‡multiple quinolones and fluoroquinolones
V09.6 Sulfonamides 35 75 90 85 19 ‡
V09.7 Other specified anti-mycobacterial agents
V09.70 Without mention of 8 28 34 43 22 ‡resistance to multipleanti-mycobacterial agents
V09.71 With resistance to 9 51 77 164 67 ‡ multiple anti-mycobacterial agents
V09.8 Other specified drugs
V09.80 Without mention of 20 362 780 1,005 555 ‡resistance to multiple drugs
V09.81 With resistance to 148 850 1,782 2,283 1,001 ‡multiple drugs
V09.9 Unspecified drugs ‡
V09.90 Without mention of 19 100 87 131 100 ‡multiple drug resistance
V09.91 With multiple drug 59 416 838 1,157 643 ‡resistance
Z06 (ICD-10-AM) Infection with drug- ‡ ‡ ‡ ‡ ‡ 21,824resistant micro-organism
Total infections with 2,620 9,072 15,931 20,724 10,791 21,824drug-resistant microorganisms
Total separations 2,451 7,752 13,412 17,350 8,920 21,704with infections with drug-resistant organisms
* See Table 1 for information on relevant ICD codes. There was no code available for 1999-00.
† In 1998-99, only Queensland, South Australia, Western Australia and Tasmania were using ICD-9-CM.
‡ Not applicable.
Table 2. Infections with drug-resistant microorganisms reported to the National Hospital MorbidityDatabase, Australia, 1994–95 to 2000–01
Data for 2000-01 provides an illustration of the other information recorded for the separations forwhich infections with drug-resistant microorganisms were reported. For example, males accounted formore separations (12,094 separations, 55.7%) than females (9,610 separations). Fifty-six per cent(12,252 separations) were for patients aged over 65 years, with highest numbers reported for malesin the 75-79 years age group (1,731 separations) and for females aged over 85 years (1,536separations).
The principal diagnoses most frequently reported were infection following a procedure, not elsewhereclassified (code T81.4, 1,309 separations) and care involving a rehabilitation procedure, unspecified(code Z50.9, 1,289 separations). The organisms (within ICD-10-AM Chapter 1 infectious and parasiticdiseases) most commonly reported were Staphylococcus aureus (code B95.6, 13,894 separations) andPseudomonas (code B96.5, 2,444 separations).
The complications of surgical and medical care (ICD-10-AM codes T80-T88) reported most frequentlyas principal or additional diagnosis for these separations were infection following a procedure, notelsewhere classified (code T81.4, 3,813 separations) and infection and inflammatory reaction due toother cardiac and vascular devices, implants and grafts (code T82.7, 1,096 separations). Externalcauses relating to complications (ICD-10-AM codes Y60–Y84) that were commonly reported withinfections with drug-resistant microorganisms included surgical operation with implant of artificialinternal device (code Y83.1, 1,419 separations) and other surgical procedures (code Y83.8, 1,352separations).
Discussion
As noted above, the NHMD covers essentially all admissions to Australian hospitals, and is supportedby substantial national data collection infrastructures. It includes a range of information that couldpotentially be used to supplement other antibiotic resistance surveillance activities.
However, the data on infections with drug-resistant microorganisms collected to date is of limited use.The antibiotic resistance codes available in ICD-9-CM may not have matched priority needs forsurveillance data, without, for example, a code specific for multidrug-resistant Staphylococcus aureus.The first edition of ICD-10-AM (used from July 1998) did not include any codes for antibioticresistance, and the second edition’s single code (used from July 2000 to June 2002) is also unlikelyto suit surveillance needs.
The third edition of ICD-10-AM may prove more suitable for monitoring of infections with drug-resistantmicroorganisms, with its specific codes for infections with multidrug-resistant Staphylococcus aureusand vancomycin resistant enterococci. It will be in use from July 2002 to June 2004 (with 2002–03data available nationally from July 2004), and coders are to be guided in the use of the codes withdefinitions and examples of the correct coding in an accompanying Australian Coding Standard.
Limitations of the data collected to date also arise from the changes in codes available for infectionswith drug-resistant microorganisms since 1994–95, which mean that comparison of the data over timeis currently problematic. In addition, the increase in separations with antibiotic resistant organismssince 1994-95 is unlikely to represent increased numbers of these infections with these organisms.Improvements in coding quality, associated with the introduction of casemix-based funding andmanagement, the introduction of the Australian editions of ICD-9-CM, major national andstate/territory coder and clinician education initiatives and coding audit activities could have playedsignificant roles in the increased reporting of these infections.
Importantly, coding of antibiotic resistance is largely dependant on the accuracy and completeness ofentries made by clinical and laboratory staff in patients’ medical records. Definitions for drugresistance have not been included within ICD-10-AM, so coding is likely to have reflected thedefinitions used for clinician documentation of the drug resistance in the medical record. Hence, it isnot certain that all the reported resistance was laboratory-confirmed. In addition, although coders areinstructed to code infectious organisms only if a clinically significant infection has been documented,some colonisations may also have been included.
Antimicrobial Resistance in Australia S59

S60 Antimicrobial Resistance in Australia
Association of the antibiotic resistance information with the principal diagnosis, additional diagnosisor the external cause information in a record cannot be assumed. More detailed analysis of the data(using information on the sequencing of the codes) could allow associations to be clarified, as wouldbetter linkage of these data within separation records.
Hence, whilst increased numbers of reports provide some indication of increased coding quality inrelation to infections with drug-resistant microorganisms, and the introduction of the new codes for2002 may better reflect surveillance needs, the use of these data will continue to require caution, andfurther refinements to data collection may be required. ICD-10-AM is revised every two years, sorefinement of relevant codes and coding standards could be sought as necessary. In addition, theAustralian Council for Safety and Quality in Health Care is working to improve the use of morbidity datasets for adverse event monitoring,9 and this work could encompass enhancements relating toinfections with antibiotic resistant organisms. With such alterations, hospital morbidity datacollections such as the NHMD could be considered as potential components of a national surveillancesystem for antibiotic resistance in Australia.
References
1. Joint Expert Technical Advisory Committee on Antibiotic Resistance 1999. The use of antibiotics in food-producing animals: antibiotic-resistant bacteria in animals and humans. Commonwealth Department of Health andAged Care and Commonwealth Department of Agriculture, Fisheries and Forestry.
2. Australian Institute of Health and Welfare (AIHW) 2002. Australian hospital statistics 2000–01. AIHW Cat. No.HSE 20 (Health Services Series). Canberra: AIHW.
3. Australian Institute of Health and Welfare (AIHW) 2002. National health data dictionary version 11. AIHW Cat.No. HWI 36. Canberra: AIHW.
4. National Centre for Classification in Health 1998. International statistical classification of diseases and relatedhealth problems, 10th revision, Australian modification. First edition. Sydney: University of Sydney.
5. National Coding Centre 1995. The Australian version of the International Classification of Diseases, 9th Revision,Clinical modification (ICD-9-CM), first edition. Sydney: University of Sydney.
6. National Coding Centre 1996. The Australian version of the International Classification of Diseases, 9th Revision,Clinical modification (ICD-9-CM), second edition. Sydney: University of Sydney.
7. National Centre for Classification in Health 2000. International statistical classification of diseases and relatedhealth problems, 10th revision, Australian modification. Second edition. Sydney: University of Sydney.
8. National Centre for Classification in Health 2002. International statistical classification of diseases and relatedhealth problems, 10th revision, Australian modification. Third edition. Sydney: University of Sydney.
9. Australian Council for Safety and Quality in Health Care. Safety through action. Third report to the AustralianHealth Ministers’ Conference 19 July 2002.

Antimicrobial Resistance in Australia S61
SENTRY Antimicrobial Surveillance ProgramAsia-Pacific region and South Africa
Jan Bell,1 John Turnidge2
AbstractThe SENTRY Antimicrobial Surveillance Program was initiated in January 1997 and was designed tomonitor the predominant pathogens and antimicrobial resistance for both nosocomial and community-acquired infections globally by using validated, reference-quality identification and susceptibilitytesting methods performed in a central laboratory. Consecutive bacterial or fungal isolates, deemedclinically significant by local criteria, are forwarded to the local reference laboratory from various studyobjectives. The major objectives include blood stream infections, community-acquired respiratory tractinfections (Streptococcus pneumoniae, Haemophilus influenzae and Moraxella catarrhalis),pneumonias in hospitalised patients, skin and soft tissue infections, and urinary tract isolates fromhospitalised patients. In 2001, special objectives were introduced to examine gastroenteritispathogens and ß-haemolytic streptococcal isolates. Over 22 nations participate in SENTRYsurveillance globally. The Women’s and Children’s Hospital, Adelaide has been the reference centrefor the Asia-Pacific region and South Africa since 1998, and three other Australian institutions, fromBrisbane, Perth, and Adelaide, are part of the global network. All isolates received from our region aretested against up to 29 antimicrobial agents using custom-made broth microdilution panels. The datagenerated from SENTRY allows Australia to compare our antimicrobial resistance patterns and trendswith our regional neighbours. Commun Dis Intell 2003;27 Suppl:S61–S66.
Keywords: antimicrobial surveillance
Introduction
Surveillance programs are necessary to identify changes in the spectrum of microbial pathogenscausing serious infection and to monitor trends in antimicrobial resistance patterns in nosocomial andcommunity-acquired infections.1,2 The information gleaned from surveillance efforts is integral to thedesign of empirical approaches to the therapy of serious infection and also to defining appropriatecontrol measures for antimicrobial-resistant pathogens.1 Such information has been provided in recentyears by programs such as the National Nosocomial Infection Surveillance (NNIS) system,3 theSurveillance and Control of Pathogens of Epidemiologic Importance (SCOPE) program, and theIntensive Care Antimicrobial Resistance Epidemiology (ICARE) project.4 Australia currently has noformal mechanism for national antimicrobial resistance surveillance. The National AntimicrobialResistance Surveillance Program (NARSP) was set up in 19911 but funding and contribution has beenintermittent. Other surveillance is also being conducted on targeted pathogens by the AustralianGroup on Antimicrobial Resistance. These programs have been limited by their focus on nosocomialinfections (NNIS and SCOPE) and by the lack of validated identification and antimicrobial susceptibilitytesting performed in a central laboratory (NNIS, ICARE and NARSP).
The SENTRY Antimicrobial Surveillance Program was initiated in January 1997 and was designed tomonitor the predominant pathogens and antimicrobial resistance for both nosocomial and community-acquired infections globally by using reference quality identification and susceptibility testing methodsperformed in a central laboratory.
1. Microbiology and Infectious Diseases, Women’s and Children’s Hospital, Adelaide, South Australia
2. Director of Microbiology and Infectious Diseases, Women’s and Children’s Hospital, Microbiology Department, North Adelaide,South Australia
Corresponding author: Ms Jan Bell, Microbiology and Infectious Diseases, Women’s and Children’s Hospital, Adelaide SA 5006.Telephone: +61 8 8161 6359. Facsimile: +61 8 8161 6051. Email: [email protected]

S62 Antimicrobial Resistance in Australia
Methods
Consecutive bacterial or fungal isolates, deemed clinically significant by local criteria, are forwardedto the local reference laboratory from five study objectives (Table 1). SENTRY sentinel sites for theAsia-Pacific and South Africa region (APAC) are shown in Table 2. The Women’s and Children’sHospital, Adelaide has been the reference centre for the SENTRY-APAC since 1998. Recentpublications from the SENTRY-APAC group have appeared elsewhere.5,6,7,8,9,10,11,12 All isolates weretested against more than 25 antimicrobials by the broth microdilution method using commerciallyprepared trays (TREK™ Diagnostic Systems Limited, United Kingdom), according to NationalCommittee for Clinical Laboratory Standards (NCCLS).13 Breakpoints for resistance were thoserecommended by the NCCLS.14 During the first four years, over 21,500 isolates from our region weretested.
Table 1. Major objectives under SENTRY surveillance, 1998 to 2001
Objective Infections and organisms
A Blood stream infections (bacteria and yeast)
B Community-acquired respiratory tract infections(Streptococcus pneumoniae, Haemophilus influenzae, Moraxella catarrhalis)
C Pneumonias in hospitalised patients
D Skin and soft tissue infections from hospitalised patients
E Urinary tract infections in hospitalised patients
Special objectives (2001)
G Pathogens causing gastroenteritis
H ß-haemolytic Streptococci
I Pathogens from infected intensive care patients
NM Neisseria meningitidis
Country Site location
Australia Princess Alexandra Hospital, Brisbane; Royal Perth Hospital, Perth; Royal Adelaide Hospital, Adelaide; Women’s and Children’s Hospital, Adelaide
Mainland China Beijing Medical University, Beijing; First Municipal Peoples Hospital of Guangzhou, Guangzhou; Guangzhou Medical College First Affiliated Hospital, Guangzhou
Hong Kong China Queen Mary Hospital, Hong Kong
Japan Kitasato University Hospital, Kitasato; Nagasaki University Hospital, Nagasaki; Teikyo University Hospital, Tokyo
Philippines Mataki Medical Centre, Manila
Singapore Singapore General Hospital (till 1999); Tan Tock Seng Hospital (since 2000)
Taiwan Chang Gung Memorial Hospital, Taoyuan; National Taiwan University Hospital, Taipei; Veterans General Hospital, Taipei
South Africa Drs du Buisson, Bruinette and Partners, Johannesburg
Table 2. SENTRY sentinel sites (Asia-Pacific Region and South Africa)
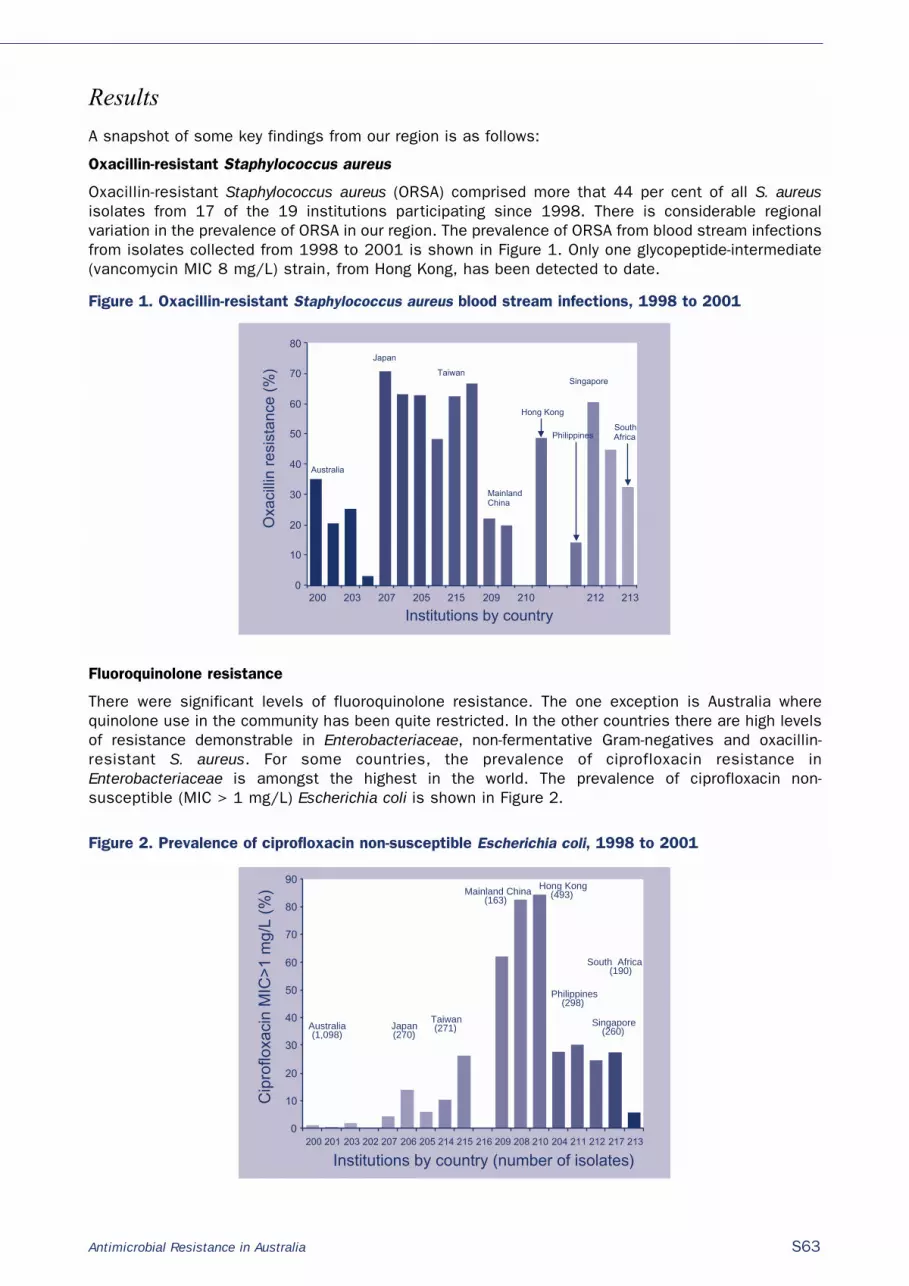
Antimicrobial Resistance in Australia S63
Results
A snapshot of some key findings from our region is as follows:
Oxacillin-resistant Staphylococcus aureus
Oxacillin-resistant Staphylococcus aureus (ORSA) comprised more that 44 per cent of all S. aureusisolates from 17 of the 19 institutions participating since 1998. There is considerable regionalvariation in the prevalence of ORSA in our region. The prevalence of ORSA from blood stream infectionsfrom isolates collected from 1998 to 2001 is shown in Figure 1. Only one glycopeptide-intermediate(vancomycin MIC 8 mg/L) strain, from Hong Kong, has been detected to date.
Figure 1. Oxacillin-resistant Staphylococcus aureus blood stream infections, 1998 to 2001
Fluoroquinolone resistance
There were significant levels of fluoroquinolone resistance. The one exception is Australia wherequinolone use in the community has been quite restricted. In the other countries there are high levelsof resistance demonstrable in Enterobacteriaceae, non-fermentative Gram-negatives and oxacillin-resistant S. aureus. For some countries, the prevalence of ciprofloxacin resistance inEnterobacteriaceae is amongst the highest in the world. The prevalence of ciprofloxacin non-susceptible (MIC > 1 mg/L) Escherichia coli is shown in Figure 2.
Figure 2. Prevalence of ciprofloxacin non-susceptible Escherichia coli, 1998 to 2001
0
10
20
30
40
50
60
70
80
200 203 207 205 215 209 210 212 213
Institutions by country
Australia
Japan
Taiwan
MainlandChina
Hong Kong
Philippines
Singapore
South Africa
Oxa
cilli
n re
sist
ance
(%
)
0
10
20
30
40
50
60
70
80
90
200 201 203 202 207 206 205 214 215 216 209 208 210 204 211 212 217 213
Australia(1,098)
Taiwan(271)
Mainland China(163)
Hong Kong(493)
Singapore(260)Japan
(270)
Philippines(298)
South Africa(190)
Cip
roflo
xaci
n M
IC>
1 m
g/L
(%)
Institutions by country (number of isolates)

S64 Antimicrobial Resistance in Australia
Respiratory tract pathogens
Our region has some of the highest rates of penicillin resistance in Streptococcus pneumoniae in theworld. Resistance was more prevalent in isolates from patients with respiratory tract infections(Figure 3) than those with blood stream infections (Figure 4). High-level resistance (MIC > 1 mg/L)was common in all participating countries except the Philippines, where S. pneumoniae were rarelyrecovered.
Figure 3. Respiratory tract isolates for penicillin resistant Streptococcus pneumoniae, 1998 to 2001
Figure 4. Penicillin resistant Streptococcus pneumoniae, blood stream isolates, 1998 to 2001
Twenty-eight S. pneumoniae isolates, 15 of 130 (11.5%) from Hong Kong, 8 of 215 (3.7%) from oneinstitution in Australia, 4 of 201 (2%) from two institutions in Japan and one from China, demonstratedhigh level resistance to fluoroquinolones (defined as an MIC > 32 mg/L). All isolates were resistantto all the recent agents (gatifloxacin, trovofloxacin, grepafloxacin, ofloxacin, levofloxacin).
Of interest is the increasing incidence of ampicillin-resistant ß-lactamase negative Haemophilusinfluenzae (BLNAR) (Figure 5). In Japan, these isolates account for nearly 10 per cent of all respiratoryisolates and 58 per cent of those strains that were ampicillin resistant. BLNAR have now beendetected in Australia. Alarming levels of resistance are seen in Taiwan, with many of the isolates beingmulti-drug resistant.
0
10
20
30
40
50
60
70
80
90
MIC >1 mg/L
MIC 0.125-1 mg/L
Country (number of isolates)
Pen
icill
in r
esis
tanc
e (%
)
Aus
tral
ia
Japa
n
Tai
wan
Chi
na
Hon
g K
ong
Phi
lippi
nes
Sin
gapo
re
Sou
th A
fric
a
(502
)
(294
)
(168
)
(43)
(94) (4
)
(80)
(167
)
0
10
20
30
40
50
60
70
80MIC >1 mg/L
MIC 0.125-1 mg/L
Country (number of isolates)
Pen
icill
in r
esis
tanc
e (%
)
Aus
tral
ia
Japa
n
Tai
wan
Chi
na
Hon
g K
ong
Phi
lippi
nes
Sin
gapo
re
Sou
th A
fric
a
(324
)
(15) (0
)
(1)
(21) (7)
(17)
(20)

Antimicrobial Resistance in Australia S65
Figure 5. Respiratory tract isolates for amp(amox)icillin resistant Haemophilus influenzae, 1998 to 2001
Extended-spectrum ß-lactamases
Australia had the lowest incidence of extended-spectrum ß-lactamase (ESBL) producing K. pneumoniae and E. coli in the APAC region. Over 30 per cent of K. pneumoniae isolates from patientswith blood stream infection from Mainland China, Philippines, Singapore and South Africa wereconfirmed as having an ESBL (Table 3). Mainland China and Hong Kong China also had significantnumbers of ESBL-producing E. coli (24% and 13% respectively). Although multi-resistance wascommon, no carbapenem resistance was detected. More than one third of isolates were also resistantto cefoxitin, consistent with them also possessing Class 1 cephalosporinases. Nearly half of theseisolates were from a single institution, and in two species, (E. coli and K. pneumoniae) suggesting bothclonal dissemination and plasmid transfer of resistance. Over 75 per cent of cefoxitin-resistant ESBLisolates were found in three countries (Philippines, China and Hong Kong).15
Table 3. Variation in rates of extended spectrum ß-lactamase production among Escherichia coli andKlebsiella pneumoniae blood isolates by region at SENTRY-APAC centres, 1998 to 1999
0
10
20
30
40
50
60
70
80MIC >2 mg/L, BLP
MIC >2 mg/L, BLN
MIC 2 mg/L, BLN
Am
p(am
ox)ic
illin
res
ista
nce
(%)
Aus
tral
ia
Japa
n
Tai
wan
Chi
na
Hon
g K
ong
Phi
lippi
nes
Sin
gapo
re
Sou
th A
fric
a
(646
)
(217
)
(108
)
(23)
(143
)
(3)
(115
)
(124
)
Country (number of isolates)
Country E. coli K. pneumoniae
n %* n %*
Australia 286 0.0 51 2.0
Hong Kong 138 13.0 38 7.9
Japan 74 1.4 44 15.9
Mainland China 75 24.0 23 65.2
Philippines 65 6.2 44 31.8
Singapore 50 4.0 39 41.0
South Africa 30 3.3 22 45.5
Taiwan 29 13.8 56 5.4
Total 774 6.1 290 24.1
* Reduction in ceftazidime, ceftriaxone or aztreonam MIC in presence to 4 mg/L clavulanate.

S66 Antimicrobial Resistance in Australia
DiscussionThe global nature of antimicrobial resistance requires that resistance data from both developed anddeveloping countries be collected. New resistance phenotypes remain on the rise while multidrug-resistant pathogens continue to spread. The data generated from SENTRY allows Australia to compareour antimicrobial resistance patterns and trends with our regional neighbours, who have some of thehighest reported resistances in the world. Ongoing surveillance such as obtained by the SENTRYprogram is essential to monitor the emerging resistances, and also to evaluate new antimicrobialagents as they become available.
AcknowledgmentThe SENTRY Program is funded by an educational grant from the Bristol-Myers Squibb Pharmaceuticalcompany.
References1. Turnidge J, Bell J, Collignon P. The battle against antibiotic resistance. Microbiology Australia 1996;17:27-31.
2. Jones RN. The emergent needs for basic research, education, and surveillance of antimicrobial resistance.Problems facing the report from the American Society for Microbiology Task Force on Antibiotic Resistance. DiagnMicrobiol Infect Dis 1996;25:153-161.
3. Emori TG, Culver DH, Horan TC, Jarvis WR, White JW, Olson DR, et al. National nosocomial infections surveillancesystem (NNIS): description of surveillance methods. Am J Infect Control 1991;19:19–35.
4. Archibald L, Phillips L, Monnet D, McGowan JE, Tenover F, Gaynes R. Antimicrobial resistance in isolates frominpatients and outpatients in the United States: increasing importance of the intensive care unit. Clin Infect Dis1997;24:211–215.
5. Diekema DJ, Pfaller MA, Turnidge J, Verhoef J, Bell J, Fluit AC, et al. Genetic relatedness of multidrug-resistant,methicillin (oxacillin)-resistant Staphylococcus aureus bloodstream isolates from SENTRY antimicrobial resistancesurveillance centers worldwide, 1998. Microb Drug Resis 2000;6:213–221.
6. Turnidge JD, Bell JM. Methicillin-resistant Staphylococcus aureus evolution in Australia over 35 years. Microb DrugResis 2000;6:223–229.
7. Diekema DJ, Pfaller MA, Schmitz FJ, Smayevski J, Bell JM, Jones RN, et al. Survey of infections due toStaphylococcus species: frequency of occurrence and antimicrobial susceptibility of isolates collected in theUnited States, Canada, Latin America, Europe and the western Pacific for the SENTRY Antimicrobial SurveillanceProgram, 1997–1999. Clin Infect Dis 2001;32 Suppl 2:S114–S132.
8. Bell JM, Turnidge JD, SENTRY APAC. High prevalence of oxacillin-resistant Staphylococcus aureus isolates fromhospitalised patients in Asia-Pacific and South Africa: Results from the SENTRY Antimicrobial SurveillanceProgram, 1998–1999. Antimicrob Agents Chemother 2002;46:879–881.
9. Bell JM, Turnidge JD, Gales AC, Pfaller MA, Jones RN, the SENTRY APAC Study Group. Prevalence of extendedspectrum beta-lactamase (ESBL)-producing clinical isolates in the Asia-Pacific region and South Africa: regionalresults from SENTRY Antimicrobial Surveillance Program, (1998–99). Diagn Microbiol Infect Dis2002;42:193–198.
10. Bell JM, Turnidge JD, Jones RN, the SENTRY Regional Participants Group. Antimicrobial resistance trends incommunity-acquired respiratory tract pathogens in the Western Pacific Region and South Africa: report from theSENTRY Antimicrobial Surveillance Program, (1998–1999) including an in vitro evaluation of BMS284756. Int JAntimicrob Agents 2002;19:125–132.
11. Bell JM, Turnidge JD, Pfaller MA, Jones RN. In vitro assessment of gatifloxacin spectrum and potency testedagainst Haemophilus influenzae, Moraxella catarrhalis, and Streptococcus pneumoniae isolates from the Asia-Pacificcomponent of the SENTRY Antimicrobial Surveillance Program (1998–1999). Diagn Microbiol Infect Dis2002;43:315–318.
12. Turnidge JD, Bell JM, Biedenbach DJ, Jones RN. Pathogen occurrence and antimicrobial resistance trends amongurinary tract infection isolates in the Asia-Western Pacific Region: Report from the SENTRY AntimicrobialSurveillance Program, 1998–1999. Int J Antimicrob Agents 2002;20:10–17.
13. National Committee for Clinical Laboratory Standards. Methods for dilution antimicrobial susceptibility tests forbacteria that grow aerobically; Approved Standard–Fifth Edition [M7–A5]. National Committee for ClinicalLaboratory Standards, Wayne, Pennsylvania, 2000.
14. National Committee for Clinical Laboratory Standards. Performance standards for antimicrobial susceptibilitytesting; Twelfth informational supplement [M100–S12]. National Committee for Clinical Laboratory Standards,Wayne, Pennsylvania, 2002.
15. Bell JM, Turnidge JD, the SENTRY Western Pacific Plus Participants. Paper C2–1477 39th InterscienceConference on Antimicrobial Agents and Chemotherapy, 26–29 September 1999, San Francisco.

Antimicrobial Resistance in Australia S67
TSN® Database Australia, a new tool to monitorantimicrobial resistance in Australia
John Turnidge,1 Laurence R McCarthy,2 Ronald N Master,3 Douglas E Kepner,4 James Weslock5
AbstractAn electronic network of Australian microbiology laboratories was established to monitor theemergence and occurrence of antimicrobial resistance among clinically relevant bacteria. It isbelieved that the data network collected approximately 42 per cent of all antibacterial susceptibilitytest results generated by Australian laboratories. The network comprised 94 hospitals and 9 privatecommercial laboratories. Selected data elements were extracted and electronically transmitted to acentral location. Upon receipt, all data were first normalised and thereafter examined for errors.Duplicate results for the same patient were identified to prevent skewing of the data towardresistance. All data passing quality assessment was staged for release of a new database release thatoccurred monthly. Unusual test results were first validated prior to their inclusion into the database.Using an Internet-based query tool, individual institutions could query their own data, but could onlyquery aggregated data for other regional or national analyses. Individual patient results could beexamined nor could the results of any individual institution other than their own. As of March 2002,TSN Database Australia contained 14,648,752 test results, from 2,000,394 strains (453 differenttaxa) and 1,213,605 patients. Since the same database concept has been established in 10 othercountries (United States of America, Europe, and Canada), observations made in Australia may becompared to those observed elsewhere in the world. This article will describe TSN in greater detail,describe the query tool and some of the analyses that are possible. Commun Dis Intell 2003;27Suppl:S67–S69.
Keywords: antimicrobial resistance, TSN database, monitoring
Introduction
Several years before the beginnings of TSN in Australia, the infectious disease community, concernedabout growing antimicrobial resistance formed a program called the National Antibiotic ResistanceSurveillance Program (NARSP). This program was directed by a NARSP committee, a group of leadingexperts in the field of infectious diseases including government representation from theCommonwealth Department of Health and Ageing. This national program was constructed to act asan antibiotic resistance surveillance system capturing susceptibility testing results from approxi-mately 50 private and public infectious disease testing laboratories across the country. The programwas voluntary and with government funding the program was able to compile data, mostly manuallyand publish the combined data yearly (usually from 1–2 years earlier). The testing sites involved withthe NARSP program acted as the foundation for the automation of the surveillance system (TSNDatabase Australia).
1. Director of Microbiology and Infectious Diseases, Women’s and Children’s Hospital, Microbiology Department, North Adelaide,South Australia
2. President and CEO, Focus Technologies Inc, Virginia, United States of America
3. Director, TSN Operations, Focus Technologies Inc, Virginia, United States of America
4. TSN Microbiology Analyst, Focus Technologies Inc, Virginia, United States of America
5. Country Manager Australasia and Canada, Focus Technologies Inc, Ontario, Canada
Corresponding author: Associate Professor John Turnidge, Director of Microbiology and Infectious Diseases, Women’s and Children’sHospital, Microbiology Department, 72 King William Road North Adelaide SA 5006. Telephone: +61 8 8161 6873. Email: [email protected].

S68 Antimicrobial Resistance in Australia
In 1998, the NARSP committee was contacted by Focus Technologies (owners of TSN) and consultedon the development of an automated resistance surveillance system. The goal was to capture abalanced dataset: a representative percentage of the susceptibility testing to effectively monitorantimicrobial resistance in Australia. NARSP suggested the sites to be approached and providedguidance on the development of TSN Database Australia in the very early stages. Subsequently, Focusformed a TSN Australian Advisory Board to assist in the process. The pool of approximately 50 NARSPtesting laboratories were reviewed and 30 geographically and demographically diversified TSN testingsites (e.g., public, private, hospital and pathology services) were selected across Australia. The TSNdata were divided into 4 distinct regional datasets as was advised by the TSN Australian AdvisoryBoard. Focus incorporated a sufficient number of sites in each region to provide a representativeregional sample and to maintain TSN site anonymity.
Each testing site was visited and received a formal presentation about the goals and details of theTSN program. Interested sites were required to complete a comprehensive evaluation questionnaire toestablish the use of acceptable microbiology practices, quality control and their informationtechnology capabilities in providing the necessary data for capture. Upon an acceptable evaluationreview, each testing laboratory signed a written TSN Participation Agreement indicating theircommitment to the program and terms for data and site confidentiality. In all, 30 sites signed on. Sitesnot signing on were usually unable to provide susceptibility testing data electronically through aLaboratory Information System and were subsequently considered ineligible. Replacement sites fromthe original list of 30 were chosen with the consultation of TSN Advisory Board members.
Installation of TSN in Australian sites began in August 1998. The national TSN Database Australia wasreleased to participants in November 2000. At the time of writing it was estimated that TSN DatabaseAustralia captured approximately 42 per cent of all susceptibility testing done in the country annually.
Methods The participant’s susceptibility results were gathered from either a laboratory information system ordirectly from an automated susceptibility testing instrument through an extraction program. Patientprivacy and the anonymity of each institution’s data were ensured by encryption of files prior totransmission and the exclusion of patient names. Each institution’s data was maintained anonymouslywithin the TSN database. Only the submitting institution had access to its own segregated data. Allfiles were further encrypted prior to transmission to Focus Technologies in Herndon, Virginia USA.
In Herndon, VA the data were normalised. Normalisation subjects the data to a number of processesincluding validating each line of data, and cross referencing the significant parts of each data line witha master data dictionary provided by the participant. The master data dictionary includes definitionsfor patient wards, specimen source, organism name, antimicrobial agent name, patient type (ICU, in-patient, outpatient), test method, and sub-institution. The result is two types of files, a mrg fileand/or rpr file. The mrg file contains data ready for merging into the participant’s main database. Therpr file contains data that requires manual resolution by a TSN Site Analyst or Microbiology Analyst.Upon resolution of the manual issues, the rpr file is re-entered into the normalisation process andbecomes an mrg file.
Each month, newly created mrg files were loaded into the TSN database and software programs wereapplied. The programs eliminated duplicates, address interpretation or test method issues and reviewcritical organism-antimicrobial agent issues. Critical organism-antimicrobial agent issues involvedthose instances where a particular organism-antimicrobial agent result was unusual, or hadn’t beenreported in the clinical literature. Examples such as vancomycin-resistant Staphylococcus aureus orfluoroquinolone-resistant Streptococcus pneumoniae would be flagged and withheld from the databasepending confirmation of the result by the participating laboratory.
When these issues were resolved, the data was finally released into the TSN database and becameavailable for use by the participant to perform queries. There were six different query types availableusing the Query III tool. The most common type of query was the ‘SIR’ query, which providedsusceptible, intermediate and resistant results for a single organism-antimicrobial agent combinationor to a group of organisms versus a group of antimicrobial agents over time. Trending provided theopportunity to examine the data by month, by quarter or by year. An antibiogram in which the userdefined the susceptibility interpretation (S only, R only, S and I, R and I) was also available.Antibiograms could also be exported to Excel, Word, Crystal Reports, or Rich Text Format. MinimumInhibitory Concentrations (MIC) and zone size data distribution reports were also available, as wereIncidence reports.

Antimicrobial Resistance in Australia S69
Three datasets were defined, national, regional and institutional. All participants could look at thenational data and their individual institutional data, but security programs prevented one participantfrom looking at another individual participant’s data.
Nine different query parameters provided a wide range of criteria available to generate queries. S,I,RSub-select offered the opportunity to look at the susceptibility patterns of alternative antimicrobialagents against organisms such as MRSA or gentamicin-resistant Pseudomonas aeruginosa. Specimen,patient type (ICU, in-patient, outpatient), ward, age, gender, institution type, bed size and test methodwere the other parameters available. Selection of organisms and antimicrobial agents were availablefrom two different tables, a ‘Top 25’ list or a more comprehensive list. The query and the parametersused to generate the query could be saved for future reference. Each query could be customised inthe Select Query Output Parameters window.
Results
The TSN Database Australia contained data from 103 sites, 453 taxa, and 99 antimicrobial agents.There were 14,648,752 results from 2,000,394 strains obtained from 1,213,605 patients. Eachmonth approximately 300,000 records were entered into the database. The data could be analysed bymultiple factors including any combination of the following: age and gender of the patient, specimensource, organism, susceptibility test method, drugs tested, and quantitative and qualitative testresults. An example of data generated by the Query III SIR tool is shown in the Table.
Table. Trends in the susceptibility of Staphylococcus aureus to methicillin/oxacillin, Australia, 1996to 2001
S I R
Year Total N % N % N %
1996 16,972 15,277 90.0 0 0.0 1,695 10.0
1997 36,596 32,951 90.0 0 0.0 3,645 10.0
1998 54,542 48,667 89.2 0 0.0 5,875 10.8
1999 71,995 62,366 86.6 1 0.0 9,628 13.4
2000 93,104 80,026 86.0 2 0.0 13,076 14.0
2001 98,490 83,655 84.9 1 0.0 14,834 15.1
S Susceptible.
I Intermediate.
R Resistant.
Discussion
TSN Database Australia has demonstrated the feasibility and utility of an electronic surveillancesystem. The system monitors the trends of resistance in key organisms to provide timely informationthat can be used by physicians and pharmacists to guide patient management decisions. Data areprovided to all laboratories participating in the system in the form of queries that can be performedon their own information, that of their region, and nationally. The proprietary nature of the system doesnot allow wider dissemination of data at this stage, although discussions are ongoing to make thisdata available nationally.
Acknowledgments
We would like to thank the members of the TSN Australia Advisory Board and the participatinginstitutions.

S70 Antimicrobial Resistance in Australia
Monitoring antimicrobial resistance for public health action
John W Tapsall
AbstractAntibiotics are used both to treat infections in individual patients and in public health interventions tocontrol disease outbreaks. In both circumstances the outcome, as measured by morbidity andmortality, is compromised by antimicrobial resistance (AMR) in the causative organism. Of necessity,antibiotics are frequently given empirically and their selection is based on presumptions of efficacyand the susceptibility of the infecting agent. AMR surveillance provides reassurance with regard toefficacy and guides the formulation of standard treatment regimens. However, AMR surveillance is notalways appropriately performed nor are the data generated necessarily used to best advantage.Optimal use of AMR surveillance data requires for each disease of importance: an understanding ofthe applications of AMR surveillance and a clear definition of the type of data required: the 'triggersfor surveillance'; construction of AMR surveillance programs appropriate to differing requirements;and better linkages between AMR surveillance data and disease control functions so that thethresholds for initiating public health action are clearly defined. Examples which illustrate theapplication of these principles are provided from experience with surveillance of AMR in thepathogenic Neisseria (N. gonorrhoeae and N. meningitidis). Commun Dis Intell 2003;27Suppl:S70–S74.
Keywords: Neisseria gonorrhoeae, Neisseria meningitidis, antibiotic resistance, gonococci, meningococci
Introduction
The most obvious application of antibiotic susceptibility testing and surveillance is to facilitate use ofthe most appropriate treatment in infected individuals. Equally relevant is the role of antibiotics inpublic health interventions in infectious disease control. Control of certain diseases of public healthimportance is materially assisted by the ability of antibiotic treatment, either therapeutic or prophylactic,to decrease transmission between individuals and reduce the duration of infectiousness of affectedpatients. Conversely, increasing or high levels of resistance to the antibiotics used for these purposespose the very real prospect of increased morbidity and mortality and prolongation of diseaseoutbreaks. This is not to suggest that antibiotic treatment alone is the sole or even major interventionrequired, but rather that it is one component, albeit a key one, of an integrated public health approachto infectious disease management and control.1
Treatment of an individual infection or use of an antibiotic in a disease outbreak is often commencedbefore the diagnosis is confirmed and almost always before the susceptibility or resistance to thepathogen can be fully ascertained. In either circumstance, treatments are based on an assumedresponse to the antibiotic chosen. One important consideration in this choice of agent is the level ofresistance to that antibiotic that is likely to be encountered. For example, the use of antibiotics suchas rifampicin or ciprofloxacin for prophylaxis in an outbreak of meningococcal disease is predicatedon the assumption that the meningococcus remains susceptible to their action. Similarly where a caseof invasive meningococcal disease occurs, reassurance that there is no clinically significantresistance in Australia to the penicillins2 means that, in keeping with current recommendations,treatment with this antibiotic can be initiated in general practice before transfer to hospital.
Correspondence: Assoc. Professor John Tapsall, Director, WHO Collaborating Centre for STD and HIV, Microbiology Department, The Prince of Wales Hospital, Randwick NSW 2031. Telephone: +61 2 9382 9079. Facsimile: +61 2 9398 4275. Email: [email protected]

Antimicrobial Resistance in Australia S71
Antimicrobial resistance surveillance thus has an integral place in helping to determine the mostappropriate choice of antibiotics for both individual and public health management. It also follows thatfor public health purposes, this surveillance should be of high quality so that data generated areaccurate, and focussed on those diseases and organisms where therapeutic options may be severelylimited by antimicrobial resistance (AMR). Further, AMR surveillance for broader public healthpurposes should be linked with public health disease surveillance and control functions i.e., aneffector arm, if value from surveillance is to be fully realised.1
The need for AMR surveillance for public health purposes is therefore based on certain 'triggers'including among others, the importance of the disease in terms of mortality and morbidity, the diseaseincidence in Australia, and the potential for disease transmission in Australia. The diseases involvedwould be those where the public health response (in the broad sense) is important and wheretherapeutic options and disease control are affected by AMR. There are many well establishedlaboratory based programs in Australia for AMR surveillance at a local, national and even internationallevel. What is sometimes lacking however, is a link between these programs and disease surveillanceand control. Even when these AMR surveillance systems are in place and links between AMR anddisease surveillance are established, there is still a requirement for a definition of 'thresholds foraction'. That is, at certain defined and established stages in the evolution of antibiotic resistance,interventions with regard to treatment options, as opposed to separate issues of control of AMR, mustbe commenced.
To illustrate these principles and their differential applications in various diseases, the example of theplace of AMR surveillance in the treatment and control of gonococcal and meningococcal infection inAustralia will be used. For Neisseria gonorrhoeae, the specific instance of the emergence and spreadof quinolone resistant gonococci in New South Wales is examined. For Neisseria meningitidis theconsequences of resistance to antibiotics used for either treatment or prophylaxis would besignificant. Examples of surveillance of antibiotic resistance are drawn from published studies,including those of the National Neisseria Network.
Methods
Data were derived from the New South Wales component of the Australian Gonococcal SurveillanceProgramme and the National Neisseria Network. The program of surveillance of antimicrobialresistance in N. gonorrhoeae has been established for over 20 years and is based on the results ofexaminations of gonococci obtained from public and private sectors.3,4 Quinolone resistant gonococci(QRNG) were subdivided into 'less sensitive' and 'resistant' subgroups on the basis of MIC levels andcorrelation with patient demographics were as previously described.4,5 The World Health Organizationcriteria of critical levels of antibiotic resistance in gonococcal populations, namely, a resistance levelof 5 per cent or more,6 was used in this example. Meningococcal resistance data for invasive isolatesof N. meningitidis in Australia were recently reviewed2 and were also based on data gathered since1999.7,8 Methods and criteria of resistance have also been previously published.2
Results
Surveillance of quinolone antibiotic resistance in N. gonorrhoeae in New South Wales
Quinolone resistance in gonococci was first detected in New South Wales in 1984 but for the nextdecade generally remained at a low level, was seen almost exclusively in gonococcal infectionacquired overseas and was not associated with sustained domestic transmission.9 Quinoloneantibiotics, especially ciprofloxacin, were increasingly used successfully in the management ofgonorrhoea despite occasional instances of treatment failures.10,11 These cases of treatment failurewere infections with gonococci with higher levels of quinolone resistance and again were isolatedexamples of imported gonococcal disease.

S72 Antimicrobial Resistance in Australia
From 1995 to the end of 2001 considerable volatility in the patterns of quinolone resistance wasobserved in gonococci isolated in New South Wales (Figure) and sustained endemic transmission ofQRNG became established. There were several subsets of patients identified with domestic disseminationof QRNG at different times including clients of sex workers and homosexually active males.4,11 Theeffect of the emergence and local spread of QRNG in New South Wales since 1995 has been a rapidescalation of the rate of QRNG and maintenance of this rate well above the 'critical' 5 per cent levelfor many years. As a consequence quinolone antibiotics are no longer recommended treatments forgonococcal infection in New South Wales.
Figure. Quinolone resistant gonococci as a percentage of all gonococci isolated in New South Wales,1991 to 2001
Surveillance of antibiotic resistance in N. meningitidis in Australia
The data obtained by the National Neisseria Network from 1994 to 19992 showed a trend towardsdecreased sensitivity to penicillin in invasive meningococcal isolates in Australia between 1994 and1996, but no further decrease in sensitivity thereafter.2,7,8 This decrease in susceptibility did notindicate clinical resistance and only two isolates which would be regarded as potentially resistant tothe penicillin group of antibiotics were isolated between 1994 and 2001. All isolates examinedremained susceptible to the third generation cephalosporin antibiotics. Nine instances of N. meningitidis resistant to rifampicin2,8 and a single quinolone resistant isolate were identifiedbetween 1994 and 2001.12
Discussion
There are several criteria to be met for establishing meaningful AMR surveillance for public healthpurposes. The disease must be of public health importance e.g., readily transmissible and of sufficientincidence; therapeutic options and disease control must be affected by AMR and measures must bein place to alter antibiotic treatments when surveillance data reveal a significant change in AMR.
Both of the pathogenic Neisseria, the gonococcus and the meningococcus, warrant active surveillancefor emergence and spread of antibiotic resistant strains for public health purposes by the abovecriteria. Both are of obvious public health importance in terms of incidence, transmissibility, potentialmorbidity and, in the case of the meningococcus, mortality. Antibiotic therapy is important not onlyfor their treatment but is also integral for disease control. In gonorrhoea, effective antibiotic treatment
0
5
10
15
20
25
30
1991 1992 1993 1994 1995 1996 1997 1998 1999 2000 2001
Year
Per
cen
t

Antimicrobial Resistance in Australia S73
decreases the duration of infectiousness and the transmissibility of the organism, both key factors indisease control. Public health management of invasive meningococcal disease is heavily reliant onearly treatment with an effective antibiotic if the disease is suspected clinically. In Australia, this iswith penicillin. Antibiotic prophylaxis is one means of reducing secondary cases of invasive mening-ococcal disease in close contacts of an index case. However, other agents used for chemoprophylaxissuch as sulphonamides have had to be discarded for this application because of antibiotic resistance.2
Australia has well established systems for surveillance of AMR in these two closely relatedorganisms.4,8 Results and analyses of AMR surveillance of both of these organisms are publishedregularly in Communicable Diseases Intelligence and elsewhere. Despite these similarities, there areimportant differences in the approaches, principles and methods of AMR surveillance and the publichealth responses that follow detection of AMR in these two organisms.
With regard to the gonococcus, it is well established that a level of resistance of 5 per cent to anantibiotic in prevalent strains of N. gonorrhoeae should result in that antibiotic being removed fromrecommended treatment schedules.6 The gonococcus has a particular capacity to become resistantto antibiotics and this has seen the progressive removal of penicillins, tetracyclines and nowquinolones from treatment regimens in New South Wales. In other parts of Australia, penicillinscontinue to be standard treatment because AMR surveillance continues to demonstrate susceptibilityto these agents. This '5 per cent' tolerance level is indicative only and in many instances a change instandard treatment would occur at a lower level and in 'high frequency transmitters' of the disease orin small communities, any level of resisitance warrants an alteration of recommendations.6 In general,the threshold levels for action as currently defined are such that it is considered sufficient to samplea representative number and distribution of gonococci for public health purposes.
In contrast with gonococci, antibiotic resistance in meningococci in Australia has been slower todevelop. Penicillin resistance in meningococci would have wide ranging consequences. Instances ofbeta-lactamase producing N. meningitidis have been reported overseas and on occasion chemopro-phylaxis has been rendered ineffectual.2 In vitro models have revealed the potential for meningococcito become resistant to quinolone antibiotics.13 For these reasons and because of the relatively lownumber of isolates involved, it is necessary to examine all available isolates from invasive cases ofmeningococcal disease for AMR. and to alter treatment schedules sooner rather than later i.e. a ‘zerotolerance’ approach.
From these examples, it would seem necessary to have in place active surveillance of AMR in thecausative organisms of those diseases meeting the criteria outlined above. Just as importantly it isnecessary to have the data so gathered, critically analysed and interpreted and integrated into widerpublic health control effective mechanism, which includes a plan for action once defined thresholds ofAMR are reached. While some of these thresholds of AMR for action have been determined and usedfor some time e.g., in gonorrhoea, in most instances they remain intuitive and variable e.g., inmeningococcal disease. The nature and amount of AMR define these thresholds and predicate therequirements of optimal AMR surveillance for a particular organism, disease and antibioticcombination. For optimal use of AMR surveillance in a public health context, definition and implemen-tation of these thresholds for action is required.
Acknowledgments
Athena Limnios, Tiffany Hogan and members of the National Neisseria Network of Australia generateddata used in the references below.
References
1. World Health Organization. Surveillance standards for antimicrobial resistance. 2001.WHO/CDS/CSR/DRS/2001.5P.
2. Tapsall JW, Shultz T, Limnios E, Munro R, Mercer J, Porritt R, et al. Surveillance of antibiotic resistance in invasiveisolates of Neisseria meningitidis in Australia, 1994–1999. Pathology 2001;33:359–361.

3. Tapsall JW, Phillips EA, Cossins YM et al. Penicillin sensitivity of gonococci in Australia: the development of anAustralian Gonococcal Surveillance Programme. Br J Vener Dis 1984,60:226–230.
4. Australian Gonococcal Surveillance Programme. Annual report of the Australian Gonococcal SurveillanceProgramme, 2001. Commun Dis Intell 2002;26:242-247.
5. Tapsall JW, Limnios EA, Shultz TR. Continuing evolution of the pattern of quinolone resistance in Neisseriagonorrhoeae isolated in Sydney, Australia. Sex Transm Dis 1998;25:415–417.
6. World Health Organization. Guidelines for the management of sexually transmitted infections.WHO/HIV_AIDS/2001.01 WHO/RHR/01.10:pp 1–5. World Health Organization, Geneva; 2001.
7. Australian Meningococcal Surveillance Programme. Annual report of the Australian Meningococcal SurveillanceProgramme, 2000. Commun Dis Intell 2001;25:113–121.
8. Australian Meningococcal Surveillance Programme. Annual report of the Australian Meningococcal SurveillanceProgramme, 2001. Commun Dis Intell 2002;26:407–418.
9. Tapsall JW, Shultz TR, Phillips EA. Characteristics of Neisseria gonorrhoeae isolated in Australia showing decreasedsensitivity to quinolone antibiotics. Pathology 1992,24:27–31.
10. Tapsall JW, Shultz TR, Lovett R, Munro R. Failure of 500 mg ciprofloxacin therapy in male urethral gonorrhoea.Med J Aust 1992;156:143.
11. Tapsall JW, Limnios EA, Thacker C, Donovan B, Lynch SD, Kirby LJ, et al. High level quinolone resistance inNeisseria gonorrhoeae: a report of two cases. Sex Transm Dis 1995;22:310–311.
12. Shultz TR, Tapsall JW, White PA, Newton PJ. An invasive isolate of Neisseria meningitidis showing decreasedsusceptibility to quinolones. Antimicrob Agents Chemother 2000;44:1116.
13. Shultz TR, Tapsall J. GyrA and ParC changes in ciprofloxacin resistant meningococci parallel those seen ingonococci. Abstract 217, Abstract guide of the Twelfth International Pathogenic Neisseria Conference GalvestonUSA; 12–17 November 2000.
S74 Antimicrobial Resistance in Australia

Antimicrobial Resistance in Australia S75
Ciprofloxacin resistance emerges in Neisseriagonorrhoeae in Victoria, 1998 to 2001
Mark G K Veitch,1 Julia M Griffith,1 Melissa L Morgan,2
AbstractNotifications of gonorrhoea in Victoria increased suddenly in the late 1990s, from an average of 375cases per year from 1993 to 1997, to over 700 cases in 2000. This paper describes the susceptibilityto ciprofloxacin of isolates of N. gonorrhoeae in Victoria from 1998 to 2001, and relates these to thereported epidemiologic characteristics of the cases. The proportion of all isolates of N. gonorrhoeaethat was resistant to ciprofloxacin rose from 3 per cent in 1998 to 11 per cent in 2001. Amonghomosexual and bisexual men, resistant isolates remained rare (< 1 per cent). Among heterosexualmen and women whose infection was acquired overseas, the proportion of resistant isolates increasedfrom 14 per cent to 51 per cent. Among heterosexual men and women whose infection was acquiredin Australia, the proportion of resistant isolates increased from 6 per cent to 14 per cent, and dispro-portionately involved persons born overseas. Patterns of antibiotic resistance are intimately linked toepidemiological characteristics of cases. Clinical treatment and public health and control strategiesfor resurgent sexually transmitted infections benefit from the insights of collaborative microbiologicaland epidemiological surveillance. Commun Dis Intell 2003;27 Suppl:S75–S79.
Keywords: Neisseria gonorrhoeae, ciprofloxacin, antibiotic resistance
Introduction
Notifications of gonorrhoea in Victoria in the late 1990s echoed worldwide trends. Numbers of casesof gonorrhoea in Victoria declined from the mid-1980s and were relatively low (averaging 375 casesper year) from 1993 to 1997, but then surged to 552 cases in 1998, 742 cases in 2000 and 718cases in 2001.1,2
A widely used Australian guideline3 recommends a single dose of either 500 milligrams of orallyadministered ciprofloxacin or a 250-milligram intramuscular injection of ceftriaxone to treat suspectedor proven uncomplicated urogenital gonorrhoea. Epidemiologically relevant trends in antimicrobialsusceptibility should guide this choice.4 Treatment should also include azithromycin or doxycycline totreat co-existing Chlamydia infection.
The proportion of Australian isolates of Neisseria gonorrhoeae with reduced susceptibility tociprofloxacin increased from 5 per cent in 1998 to 17 per cent in 1999 and 18 per cent in 2000.5 In2000, the prevalence of reduced susceptibility to ciprofloxacin exceeded 50 per cent in most of thelarger countries of the Western Pacific Region.6
This review describes the susceptibility to ciprofloxacin of isolates of N. gonorrhoeae in Victoria from1998 to 2001, and relates these to the reported epidemiologic characteristics of the cases.
1. Microbiological Diagnostic Unit, Public Health Laboratory, Department of Microbiology and Immunology, the University ofMelbourne, Victoria
2. Sexually Transmissible Infections and Hepatitis C Program, Communicable Diseases Section, Victorian Department of HumanServices, Victoria
Corresponding author: Dr Mark Veitch, Public Health Physician, Microbiological Diagnostic Unit, Public Health Laboratory,Department of Microbiology and Immunology, the University of Melbourne, Melbourne VIC 3010. Telephone: +61 3 8344 7735.Facsimile: +61 3 8344 7833. E-mail: [email protected]

S76 Antimicrobial Resistance in Australia
Methods
The Communicable Diseases Section of the Victorian Department of Human Services (DHS) and theMicrobiological Diagnostic Unit of the University of Melbourne (MDU) collaborate in surveillance ofgonorrhoea in Victoria. Legislation requires that cases of gonorrhoea in Victoria be notified to the DHSboth by the diagnosing clinician, and by the laboratory that makes the diagnosis. Information in thenotification includes an anonymous identifier (first two letters of last and first names), sex, date ofbirth or age, residential postcode and details of the diagnosing doctor or laboratory. Further details,including sexual orientation, and putative source of infection are routinely sought from the notifyingclinician.
Primary diagnostic laboratories send cultures of N. gonorrhoeae to the MDU, where antibiotic susceptibilityis determined by agar plate dilution methods developed by the Australian National NeisseriaNetwork.5,7
We defined the ciprofloxacin susceptibility of isolates of N. gonorrhoeae as fully sensitive (minimuminhibitory concentration (MIC) less than or equal to 0.03 mg/L), less sensitive (MIC 0.06 to 0.5 mg/L) or resistant (MIC equal to or greater than 1 mg/L).
This review examined cases of gonorrhoea infections for which the specimens were: collectedbetween 1 January 1998 and 31 December 2001; diagnosed by culture in Victoria; and for whichciprofloxacin susceptibility was established.
Results
N. gonorrhoeae was identified by Victorian diagnostic laboratories in 2,827 cultures from one or moreanatomic sites of persons between 1 January 1998 and 31 December 2001 and referred to the MDUfor antibiotic susceptibility testing. Twenty-eight cultures were not tested for ciprofloxacin susceptibility.When multiple cultures from the same or different anatomic site of the same person within 28 days were identified, the isolate least susceptible to ciprofloxacin was retained and the others(163 isolates) were excluded, leaving isolates from 2,636 cases for this analysis.
Almost all isolates (97 per cent) from heterosexual men and women were from urogenital anatomicsites. Seventy-five per cent of isolates from homosexual men were urethral, 18 per cent rectal and 7 per cent pharyngeal.
The proportion N. gonorrhoeae isolates resistant to ciprofloxacin rose from 3 per cent in 1998 to 11 per cent in 2001 (Table 1).
Table 1. Ciprofloxacin susceptibility of cases of culture-proven gonorrhoea in Victoria, 1998 to 2001
Year Fully sensitive Less sensitive Resistant Total number of isolates(%) (%) (%)
1998 95 2 3 535
1999 77 18 5 700
2000 79 14 7 756
2001 84 5 11 645
In mid-1999, locally acquired isolates of N. gonorrhoeae that were less sensitive (but not fullyresistant) to ciprofloxacin emerged suddenly, concentrated in, but not limited to, homosexual andbisexual men. These persisted during 2000 and then declined in 2001.

Antimicrobial Resistance in Australia S77
Over the four years, the prevalence of ciprofloxacin-resistant N. gonorrhoeae among heterosexual menand women was 16 per cent (155/942), far greater than among homosexual and bisexual men (0.4 per cent, 6/1,501, Chi-square=240, p<0.001) (Table 2). Only one of 287 male rectal isolates wasresistant to ciprofloxacin.
Table 3 describes the ciprofloxacin susceptibility of the 2,358 (89 per cent) isolates with completedata on the sexual orientation of the case and the location where the infection was reportedlyacquired.
Table 2. Ciprofloxacin susceptibility of cases of culture-proven gonorrhoea in Victoria, 1998 to 2001,by sex and reported sexual orientation
Sex and sexual Location acquired Year Fully Less Resistant Totalorientation sensitive sensitive (%) number of
(%) (%) isolates
Male and female, heterosexual Australia 1998 93 1 6 114
1999 79 12 9 178
2000 76 10 14 184
2001 83 3 14 206
Overseas 1998 72 14 14 50
1999 57 18 24 49
2000 44 16 40 55
2001 37 12 51 57
Male, homosexual Australia 1998 >99 0 <1 306and bisexual
1999 79 20 <1 418
2000 86 14 <1 434
2001 94 6 <1 282
Overseas 1998 83 17 0 6
1999 83 0 17 6
2000 33 67 0 6
2001 86 0 14 7
Sex Sexual orientation Fully sensitive Less sensitive Resistant Total number(%) (%) (%) of isolates
Male Heterosexual 74 10 16 806
Homosexual 89 11 <1 1,501or bisexual
Not reported 80 14 6 177
Female Heterosexual 76 5 18 136
Homosexual 100 0 0 4or bisexual
Not reported 67 8 25 12
Table 3. Temporal trends in ciprofloxacin susceptibility of cases of culture-proven gonorrhoea inVictoria, 1998 to 2001, by sex, sexual orientation and location where the infection was reported tohave been acquired

S78 Antimicrobial Resistance in Australia
Among heterosexual men and women whose infection was acquired overseas, the proportion ofciprofloxacin-resistant isolates increased from 14 per cent in 1998 to 51 per cent in 2001 (Chi-squarefor trend=18.97, p<0.001). Eighty-three per cent (148/179) of the overseas-acquired infections ofheterosexual men and women for which a country or region was specified were acquired in Asia. Ofthese, 39 per cent were resistant to ciprofloxacin.
Among heterosexual men and women whose infection was acquired in Australia, the proportion ofciprofloxacin-resistant isolates of N. gonorrhoeae increased from 6 per cent in 1998 to 14 per cent in2001 (Chi-square for trend=5.94, p=0.015). Of infections acquired heterosexually by Australian-bornpersons, 7 per cent (34/518) were ciprofloxacin-resistant. In contrast, 30 per cent (35/118) ofinfections acquired heterosexually in Australia by overseas-born persons were ciprofloxacin-resistant(Chi-square=53, p<0.001).
From 1998 to 2001, ciprofloxacin-resistant isolates remained rare among homosexual and bisexualmen. Four (one each year) were acquired in Australia, and two were acquired overseas.
Three of 2,636 isolates (0.1 per cent) demonstrated clinically insignificant slightly altered suscept-ibility to ceftriaxone (MIC 0.06 mg/L). Two of these were acquired in Asia.
Discussion
From 1998 to 2001 the annual incidence of ciprofloxacin resistant N. gonorrhoeae in Victoria tripled.However, the distribution of ciprofloxacin-resistant isolates of N. gonorrhoeae differed markedly inpersons of different sexual orientation.
The increase in clinically significant ciprofloxacin resistance was entirely due to infections amongheterosexual men and women. The high prevalence of resistance among infections acquired byVictorian travellers to Asia is typical of infections in this region.6,8
The high prevalence of ciprofloxacin resistance among infections acquired in Australia by persons whowere born outside Australia may be due to misclassification of the source of the infection, or to chainsof transmission and sexual networks that were several links from an imported resistant infection.
Regardless of the specific source of the infection, the overall prevalence of ciprofloxacin resistanceamong heterosexually acquired gonorrhoea diagnosed in Victoria is sufficiently high to renderciprofloxacin inappropriate for presumptive therapy of such infections.5
In contrast, less than one per cent of locally acquired infections of homosexual and bisexual men wereresistant to ciprofloxacin. Ciprofloxacin therefore remains useful as first-line therapy foruncomplicated urogenital gonorrhoea acquired locally by homosexual and bisexual men.
The wave of ciprofloxacin-‘less sensitive’ N. gonorrhoeae that peaked in 1999 and ebbed in 2000demonstrates the vulnerability of this population to the emergence of resistant strains. Infections withstrains with reduced susceptibility to ciprofloxacin are more likely to fail treatment with the conven-tional single-dose therapy,5 and may be precursors to highly resistant strains.9
New methods are being used to diagnose gonorrhoea by nucleic acid amplification.4 These currentlyprovide no information about the antimicrobial susceptibility of the organism causing the infection.Diagnostic strategies that recover isolates for antimicrobial susceptibility testing will be needed toensure that the shifting patterns of antimicrobial susceptibility of N. gonorrhoeae are monitored.
The antimicrobial susceptibilities of isolates of N. gonorrhoeae are intimately linked to epidemiologicalcharacteristics of cases, and illuminate the transmission dynamics of this resurgent infection.Collaborative microbiological and epidemiological surveillance guide the choice of antibiotics that willefficiently cure uncomplicated gonorrhoea at first presentation, and may help avoid the clinical andpublic health consequences of selection and dissemination of resistant strains.

Antimicrobial Resistance in Australia S79
Acknowledgements
We thank Beth Hatch, Jane Tomnay, Tom Carter, Megan Counahan, Vesna de Petra, Rachel Neill,Natasha Cooper, Geoff Hogg, Joc Forsyth, the treating clinicians, and microbiology scientists, for theircontributions to gonorrhoea surveillance in Victoria.
References
1. O’Grady K-A, Tallis G, eds. Surveillance of Notifiable Infectious Diseases in Victoria 2000. Communicable DiseasesSection, Public Health Division, Victorian Department of Human Services; 2001.
2. Surveillance report. Victorian Infectious Diseases Bulletin 2002;5:7–15.
3. Spicer J. (Chairman of Writing Group) Therapeutic guidelines: antibiotic. (Version 11) North Melbourne: TherapeuticGuidelines Limited; 2000.
4. Bowden FJ, Tabrizi SN, Garland SM, Fairley CK. Sexually transmitted infections: new diagnostic approaches andtreatments. Med J Aust 2002;176:551–557.
5. Australian Gonococcal Surveillance Programme. Annual report of the Australian Gonococcal SurveillanceProgramme, 2000. Commun Dis Intell 2001;25:59–63.
6. WHO Western Pacific Gonococcal Antimicrobial Surveillance Programme. Surveillance of antibiotic resistance inNeisseria gonorrhoeae in the WHO Western Pacific Region, 2000. Commun Dis Intell 2001;25:274–276.
7. Australian Gonococcal Surveillance Programme. Use of a quality assurance scheme in a long-term multicentricstudy of antibiotic susceptibility of Neisseria gonorrhoeae. Genitourin Med 1990;66:437–444.
8. Berglund T, Unemo M, Olcen P, Giesecke J, Fredlund H. One year of Neisseria gonorrhoeae isolates in Sweden: theprevalence study of antibiotic susceptibility shows relation to the geographic area of exposure. Int J STD AIDS2002;13:109–114.
9. Tapsall JW. The biology of Neisseria gonorrhoeae: a model of adaptation and survival. Venereology 2000;13:63–69.

S80 Antimicrobial Resistance in Australia
Antibiotic resistance in Campylobacter jejuni isolatedfrom humans in the Hunter Region, New South Wales
Hemant Sharma,1 Leanne Unicomb,2 Wendy Forbes,3 Steve Djordjevic,3
Mary Valcanis,4 Craig Dalton,5 John Ferguson1
AbstractCampylobacter is a common cause of bacterial gastroenteritis in Australia. Antibiotic resistanceamong Campylobacter is an emerging problem in Europe and the United States of America. Monitoringmay detect emerging resistance. Since there is no epidemiologically validated subtyping system forCampylobacter, antimicrobial resistance patterns may prove useful as an epidemiological marker.Campylobacter isolates from residents of the Hunter region were differentiated by PCR into twocategories: C. jejuni and non-C. jejuni. Minimal inhibitory concentrations (MIC) were determined for 10 antibiotics using the National Committee for Clinical Laboratory Standards (NCCLS) agar dilutionmethodology. Risk factor information including travel history were obtained as part of a case-controlstudy by conducting telephone interviews with infected individuals. Sixty-four per cent, 3.4 per cent,3.4 per cent and 11.2 per cent of C. jejuni isolates were resistant to ampicillin (at MIC > 8 mg/L),erythromycin (> 8 mg/L), nalidixic acid (> 32 mg/L) and tetracycline (> 8 mg/L), respectively. A diverse pattern of antibiotic resistance (‘resistotypes’) was detected with some change occurringover time. Several possible clusters of Campylobacter infections were identified based on resistotype.Of seven infections acquired during overseas travel, 57 per cent (4/7) were resistant to more thanone antibiotic class compared to 10 per cent (14/144) of locally-acquired isolates (p=0.004, Fisherexact). The potential usefulness of resistotyping as an epidemiological marker is worthy of furtherexploration. Commun Dis Intell 2003;27 Suppl:S80–S88.
Keywords: antibiotic resistance, Campylobacter jejuni
Introduction
Campylobacter is the most common bacterial cause of foodborne disease in Australia. More than15,000 cases of Campylobacter infection are reported in Australia each year, excluding New SouthWales where the disease is not notifiable (Communicable Diseases Network Australia — NationalNotifiable Diseases Surveillance System, personal communication). Antibiotic therapy is generally notrecommended for the treatment of campylobacteriosis, however, antimicrobials are prescribed attimes (Hunter Public Health Unit, 2002, unpublished data) and therapy is warranted in some circum-stances.1
Antimicrobial resistance among Campylobacter isolates was first observed in the early 1990s.2
Resistance among Campylobacter isolates has been reported from the United States of America(USA),3 Europe,4,5,6 the United Kingdom,7,8 Asia,9,10 the Middle East11 and Australia.12 In particular,resistance to quinolones has been widely observed.4,5,6,13,14 Recently, reports describing increasingprevalence of quinolone resistances have been made in the Netherlands,6 the USA3 and the UnitedKingdom.7,8 However, resistance to macrolides such as erythromycin remains low among isolates fromhumans9 and animals.5
1. University of Newcastle and Hunter Area Pathology Service, Newcastle, New South Wales
2. Coordinator, OzFoodNet, Wallsend, New South Wales
3. Elizabeth Macarthur Agricultural Institute, Camden, New South Wales
4. Microbiological Diagnostics Unit, University of Melbourne, Melbourne, Victoria
5. Hunter Public Health Unit, Wallsend, New South Wales
Corresponding author: Dr John Ferguson, HAPS, Locked Bag 1, Newcastle Mail Centre NSW 2310. Telephone: +61 2 4921 4422.Facsimile: +61 2 4921 4440. Email: [email protected]

Antimicrobial Resistance in Australia S81
There have been at least two previous surveys of Campylobacter resistance in Australia. Huysman andTurnidge15 examined 79 clinical strains of C. jejuni from South Australian patients isolated prior to1997. Riley (personal communication T. Riley, University of Western Australia, 2001) examined 50 clinical and 50 environmental strains of Campylobacter species isolated in Western Australiabetween 1999 and 2000. These studies were descriptive only and did not explore the use ofresistance typing as an epidemiological marker.
Antibiotics are used in the livestock industry and it has been suggested that their use in food animalshas contributed to the development of antibiotic resistance in human isolates. Increases in thedetection of quinolone resistant Campylobacter were reported from the UK after licensing ofenrofloxacin for veterinary use16 and experimental evidence suggests that the use of quinolones inbroiler chickens leads to the selection of resistant Campylobacter organisms.17 In Australia, legislationlimits the use of particular antibiotics such as fluoroquinolones, cephalosporins, gentamicin, andchloramphenicol in food producing animals.18 However, use of these agents is widespread in somecountries and therefore imported foods may be a source of resistant organisms.
With the global concern with the increasing prevalence of resistance among clinically importantbacterial pathogens, the Joint Expert Technical Advisory Committee on Antibiotic Resistance(JETACAR) examined the use of antibiotics in food producing animals and its association withemergence of resistance. The JETACAR report made several recommendations for regulatory controlof antibiotic use, monitoring and surveillance of resistance in clinical isolates, strategies for antibioticuse, infection prevention and hygiene, education, research, communication and coordination ofresistance management programs.18
A study of antibiotic resistance among Campylobacter isolates from residents of the Hunter region wasinitiated as part of monitoring and surveillance efforts. This report describes antibiotic resistanceprofiles of human Campylobacter isolates and is part of an evaluation of multiple typing methods fortheir usefulness to examine specific risk factors for Campylobacter infection.
Methods
Epidemiological methods
A case control study was conducted in the Hunter region of New South Wales, which has a populationof 570,000 and includes urban, rural and semi-rural areas. Cases were recruited using voluntary notifi-cations from two participating laboratories of the three major pathology service providers for thepopulation. A total of 355 cases were enrolled between January 1999 and July 2001. Telephoneinterviews were conducted after verbal consent was given and information on illness, travel, foodsconsumed, dining locations, drinking and recreational water sources, animal contact anddemographics was obtained.
Isolates
Of the 355 enrolled cases, 240 Campylobacter isolates were detected at the public laboratory (HunterArea Pathology Service, HAPS). Of these, 171 stored isolates were available for inclusion in this study.An additional 29 Hunter isolates obtained between July to September 2001 from patients not enrolledin the case control study were included to bring the total tested up to 200.
Laboratory methods
Diarrhoeal stool was cultured on charcoal blood-free agar with cefoperazone and amphotericin B(Biomerieux). Plates were incubated microaerobically at 42˚C for 48 hrs. Campylobacter species weremotile isolates with characteristic gram stain appearance and oxidase positivity. Isolates were storedat –70˚C in glycerol broth until analysed.

Speciation of each isolate was determined by hippurate hydrolysis and polymerase chain reaction(PCR) targeted at C. jejuni specific hippuricase and putative oxidoreductase genes as describedpreviously.19,20,21 There was complete concordance between tested hippurate and PCR species status.Template DNA for PCR was prepared using Instagene matrix as outlined in the manufacturer'sinstructions (BioRad, California, USA). PCR amplifications were performed by previously describedmethods19,20,21 and the amplification products were analysed on one per cent agarose gels. Thisenabled classification of the isolates as either C. jejuni or non-C. jejuni.
Susceptibility testing was performed by agar dilution methodology utilising Mueller-Hinton agar with5 per cent lysed sheep blood in accord with National Committee for Clinical Laboratory Standards(NCCLS) methodology for Helicobacter species.22 The inoculum was prepared as a saline suspensionequivalent to a 2.0 McFarland standard from a 48-hour blood agar subculture and inoculated with areplicator machine. This technique places 1 µl of suspension per spot onto the agar dilution medium.Media were prepared containing doubling dilutions through a full range of concentrations for quinoloneagents (nalidixic acid, norfloxacin and ciprofloxacin), tetracycline, ampicillin, gentamicin andmacrolide agents (erythromycin, azithromycin, clarithromycin, roxithromycin). The inoculated plateswere incubated microaerobically for 48 hours. The Minimal Inhibitory Concentration (MIC) was definedas the lowest concentration giving complete inhibition of visible growth on the plate. Interpretation ofMIC levels were made with reference to accepted breakpoint values where available. E. coli ATCC25922 and S. aureus ATCC 29213 were used as quality control strains. The MIC50 and MIC90 valuesfor each antibiotic were calculated from the distribution of the MIC values of all isolates. MIC50 valuesrepresent the concentration of antibiotic below which growth of 50 per cent of isolates were inhibitedand MIC90 value represent the concentration of antibiotic below which growth of 90 per cent ofisolates were inhibited.
Statistical methods
Comparison of the proportions was performed using the Fisher exact test or Yates corrected X2 testas appropriate and comparison of proportion of resistance over time was performed using X2 for trendusing Epi Info version 6.04c.
Results
The isolates included in this report comprised those stored at one of the two participating labora-tories. HAPS is the public laboratory for the Hunter Health Area, and services a different populationfrom many of the private laboratories. Of the 240 HAPS-identified cases that participated in the casecontrol study, 90 (37.5%) were admitted to hospital compared to three (3%) hospitalised cases of the115 identified through the other pathology service provider (Yates corrected Chi-square=47.2,p<0.001). Thus, cases of C. jejuni included in this study probably represent more severe cases.
PCR analysis confirmed 180 of the 200 isolates to be C. jejuni (151 of which were enrolled in the casecontrol study) and only the susceptibility results for the C. jejuni isolates are described in this paper.
MIC50 and MIC90 values for each antibiotic are shown in Table 1 together with resistance levels forthose agents with accepted breakpoint values. Ampicillin resistance was common (64%) withtetracycline resistance at 11 per cent. Levels of erythromycin and quinolone resistance were low.Sixty-eight per cent of locally acquired isolates were resistant to at least one class of antibiotic.
Figures 1a and 1b show the MIC distributions for macrolide and quinolone antibiotics respectively. TheMIC distribution curves were bimodal with a small outlying peak made up of high-level resistantisolates. For macrolides, the isolates were most susceptible to azithromycin and least susceptible toroxithromycin. All the erythromycin resistant isolates were pan-resistant to other macrolides.
S82 Antimicrobial Resistance in Australia

Antimicrobial Resistance in Australia S83
Resistant %
MIC50 mg/L MIC90 mg/L Breakpoint All Isolates Locally- Overseasacquired acquired†
Nalidixic acid 4 8 > 32 mg/L 3.4 1.4 43*
Norfloxacin 0.5 1.0
Ciprofloxacin 0.25 0.5 > 4 mg/L 2.9 0 43*
Tetracycline 0.25 8 > 8 mg/L 11 10 43*
Ampicillin 8 64 > 8 mg/L 64 66 57
Erythromycin 1 2 > 8 mg/L 3.4 3 0
Azithromycin 0.125 0.25
Clarithromycin 1 4
Roxithromycin 4 16 > 8 mg/L 48 40 57
Gentamicin 0.5 1.0 > 8 mg/L 0 0 0
Resistance 12 9 43*> 1 class
Total number n=180† n=148 n=7of isolates
Table 1. Resistance of Campylobacter jejuni isolates in Hunter region (n =180)
* Significant difference (p<0.05) local versus overseas-acquired cases. Fisher exact test.
† Travel history information was available for 155 of 180 isolates.
0
10
20
30
40
50
60
70
80
90
0.06 0.125 0.25 0.5 1 2 4 8 16 32 >32
Azithromycin
Erythromycin
Clarithromycin
Roxithromycin
Num
ber
of is
olat
es
MIC value (mg/L)
Figure 1a. Macrolide MIC distribution for C. jejuni isolates (n=180)

S84 Antimicrobial Resistance in Australia
Figure 1b. Quinolone MIC distribution for C. jejuni isolates (n=180)
0
20
40
60
80
100
120
0.06 0.125 0.25 0.5 1 2 4 8 16 32 64 > 64
Ciprofloxacin
Norfloxacin
Nalidixic acid
Num
ber
of is
olat
es
MIC value (mg/L)
0
2
4
6
8
10
12
14
16zNIL
r
at
ar
ae
a
Num
ber
of is
olat
es
Month
Feb
-99
Apr
-99
Jun-
99
Aug
-99
Oct
-99
Dec
-99
Feb
-00
Apr
-00
Jun-
00
Aug
-00
Oct
-00
Dec
-00
Feb
-01
Apr
-01
Jun-
01
Aug
-01
For quinolones, isolates were most susceptible to ciprofloxacin and least susceptible to nalidixic acid.Two isolates with high-level ciprofloxacin resistance were identified (MIC ≥ 32 mg/L), one acquiredoverseas, one where it was not known whether it was acquired locally or overseas. Two nalidixic acidresistant isolates (both locally-acquired) were susceptible to ciprofloxacin and norfloxacin implying adifferent resistance genotype.
Table 2 shows the variation in resistance patterns (‘resistotypes’) that occurred over the three yearsof this study. Ampicillin resistance increased from 59 per cent in 1999 to 69 per cent in 2001 androxithromycin resistance from 36 to 51 per cent over the same time, however these trends were notstatistically significant. Temporal distribution of resistotypes was examined by year (Table 2) andmonth (Figure 2). There were 15 unique resistance patterns seen among the 180 isolates. Threedominant resistotypes occurred throughout the years of the study. Resistance to ampicillin,roxithromycin, and ampicillin-roxithromycin was observed in each year. Many resistotypes were foundover the study period. Ampicillin-tetracycline resistance was found in May 1999 and then again fromFebruary 2001 until the end of the study period (Figure 2).
Figure 2. Temporal distribution of the major resistotypes, February 1999 to December 2001
A = Azithromycin, ae = Azithromycin-Erythromycin, ar = Azithromycin-Roxithromycin, at = Azithromycin-Tetracycline, r = Roxithromycin, zNIL = no resistance.

Antimicrobial Resistance in Australia S85
Table 2. Annual distribution of C. jejuni resistotypes, 1999 to 2001
Count of resistance patterns by year
Resistance pattern (resistotype) 1999 2000 2001 Total
a 20 14 21 55
act 2 2
ae 1 1 3 5
aet 1 1
ant 1 1 2
ar 8 10 23 41
arc 1 1
art 2 2 4
at 1 4 5
ct 1 1
r 7 3 11 21
rc 1 1
rt 1 1 2
t 1 2 3
Nil 13 12 11 36
Total 56 41 83 180
a=ampicillin, c=ciprofloxacin, e=erythromycin, n=nalidixic acid (ciprofloxacin susceptible), r=roxithromycin (erythromycinsusceptible), t=tetracycline
Four potential clusters of Campylobacter infection were identified on the basis of resistotype. Amongthe resistotypes of more than 10 isolates (ampicillin (a) resistance, ampicillin-roxithromycin (ar)resistance, and roxithromycin (r) resistance), a cluster was defined as more than two-times theaverage number of cases in a one month period. One cluster of ampicillin resistant isolates wasdetected in November to December 1999 (n=7), one from January to March 2001 (n=7) and one inJuly to August 2001 (n=7). A further cluster of ampicillin-roxithromycin resistance was detected inFebruary to March 2001(n=13) (Figure 2).
All seven isolates acquired during overseas travel were resistant to at least one class of antibiotic.There were two nalidixic acid (one with coincident ciprofloxacin resistance) and three tetracyclineresistant isolates. Fifty-seven per cent (4/7) of overseas-acquired isolates were resistant to more thanone antibiotic class compared to 10 per cent (14/144) of locally-acquired isolates (p=0.004, Fisherexact). Isolates acquired overseas had similar levels of ampicillin resistance to locally acquiredisolates. Quinolone and tetracycline resistance were significantly more frequent in overseas isolates(Table 1).
Eight per cent (12/150) of the patients took antibiotic therapy in the month prior to Campylobacterinfection. The resistance rates among those exposed to antibiotics (11/12, 92%) was highercompared to unexposed subjects (109/138, 79%; Odds ratio 2.95, 95% CI 0.37–23.8, p=0.46). Thiswas not statistically significant, possibly due to the low power to detect a difference, limited by thesmall sample size.

S86 Antimicrobial Resistance in Australia
Discussion
Patterns of antibiotic resistance among the isolates included in this study were similar to previousstudies conducted in Australia. A prevalence of ampicillin resistance of 64 per cent (MIC >8) wassimilar to the levels seen in South Australia16 and Spanish paediatric isolates.23 The majority of thisresistance is due to ß-lactamase production in that the majority of resistance is abolished by theaddition of clavulanate. In the latter study, amoxycillin/clavulanate resistance began to emergeimplying an alternative resistance mechanism.
Seven isolates with quinolone resistance were detected in the current study. Quinolone resistance wasmore common in the isolates acquired overseas. Binotto et al12 described two cases of quinoloneresistant Campylobacter infection in travellers returning to Australia from the United Kingdom. Rileyfound 4 of 50 (8%) Western Australian clinical strains had ciprofloxacin resistance (MIC ≥4) (personalcommunication T. Riley, University of Western Australia, 2001). Huysman et al found no quinoloneresistance in isolates from South Australia.15
The usual evolution of quinolone resistance involves mutations in the quinolone resistance-determiningregion of the gyrA (topoisomerase II) gene.24 Initial mutations produce high-level nalidixic acidresistance, with additional changes leading to increasing ciprofloxacin resistance. Active multi-drugefflux mechanisms for quinolone resistance in Campylobacter are also described25 and may beresponsible for reducing susceptibility to quinolones, ß-lactams, tetracycline, chloramphenicol andother agents.26 The molecular mechanisms of resistance in the present study's isolates are to beconfirmed through further study.
Levels of erythromycin resistance were low in the present study (3.4%) as previously described inAustralia16 and other countries.9 None of the overseas-acquired isolates in the current study showedmacrolide resistance. Roxithromycin resistance (48%) was more prevalent and therefore provided amore useful contribution to resistotype diversity than erythromycin.
Gentamicin resistance was not detected among these isolates similar to findings from the otherAustralian studies. Studies of Campylobacter gentamicin susceptibility overseas have mostly shownuniversal susceptibility.7,27 However, Reina et al,23 documented 12 resistant isolates (2.2%) in the lasttwo years (1992–93) of that study.
In addition to the descriptive epidemiology of resistotypes, antibiotic resistance was explored for itspotential usefulness as an epidemiological marker. Outbreaks of campylobacteriosis are rarelydetected, due to the inability to recognise the existence of a cluster by serotype or phage type distri-butions. The small clusters of resistotypes that were observed in this study possibly representedoutbreaks. Furthermore, a temporal trend was detected for one pattern (ampicillin-tetracyclineresistance). The diversity of antibiotic resistance found among these isolates suggests that resistancepatterns may be useful as an epidemiological marker. Resistotyping is being evaluated for its epidemi-ological value in comparison with eight Campylobacter subtyping methods. Comparison of the majorresistotypes with respect to range of food, water and environmental exposures for infection from thiscase set will also be undertaken. The difference in resistance between overseas and locally acquiredisolates in these human isolates further supports its potential use as an epidemiological marker.
The findings outlined in this report suggest that routine antibiotic resistance testing for Campylobactermay prove useful to assess emerging resistance and to detect clusters. If resistotyping is to beperformed on a routine basis, standardised testing protocols will need to be developed.

Antimicrobial Resistance in Australia S87
Acknowledgements
This study was funded by the OzFoodNet enhanced surveillance program of the Department of Healthand Ageing, Australia.
References
1. Chin J ed. Control of Communicable Diseases Manual, 2000, 17th edition. American Public Health Association.
2. Allos BM. Campylobacter jejuni infections: update on emerging issues and trends. Clin Infect Dis2001;32:1201–1206.
3. Smith KE, Besser JM, Hedberg CW, Leano FT, Bender JB et al. Quinolone-resistant Campylobacter jejuni infectionsin Minnesota, 1992–1998. N Engl J Med 1999;340:1525–1532.
4. Sjogren E, Lindblom G-B, Kaijser B. Norfloxacin resistance in Campylobacter jejuni and Campylobacter coli isolatesfrom Swedish patients. J Antimicrob Chemother 1997;40:257–261.
5. Saenz Y, Zarazaga M, Lantero M, Gastanares MJ, Baquero F, Torres C. Antibiotic resistance in Campylobacterstrains isolated from animals, foods, and humans in Spain in 1997–1998. J Antimicrob Chemother2000;44:267–271.
6. Talsma E, Goettsch WG, Nieste HL, Schrijnemakers PM, Sprenger MJ. Resistance in Campylobacter species:increased resistance to fluoroquinolones and seasonal variation. Clin Infect Dis 1999;29:845–848.
7. Thwaites RT, Frost JA. Drug resistance in Campylobacter jejuni, C. coli and C. lari isolated from humans in northwest England and Wales, 1997. J Clin Pathol 1999;52:812–814.
8. Sam WIC, Lyons MM, Waghorn DJ. Increasing rates of ciprofloxacin resistant Campylobacter. J Clin Pathol1999;52:709–710.
9. Isenbarger DW, Hoge CW, Srijan A, Pitarangsi C, Vithayasai N, Bodhidatta L, et al. Comparative antibioticresistance of diarrheal pathogens from Vietnam and Thailand, 1996–1999. Emerg Infect Dis 2002;8:175–180.
10. Ananthan S, Swarna SR, Alavandi SV. Isolation of nalidixic acid resistant Campylobacters from cases of paediatricdiarrhoea in Chennai. J Commun Dis 1998;30:159–162.
11. Wasfy MO, Oyofo BA, David JC, Ismail TF, el-Gendy AM, Mohran ZS, et al. Isolation and antibiotic susceptibilityof Salmonella, Shigella, and Campylobacter from acute enteric infections in Egypt. J Health Popul Nutr2000;18:33–38.
12. Binotto E, McIver CJ, Hawkins GS. Ciprofloxacin-resistant Campylobacter jejuni infections. Med J Aust2000;172:244–245.
13. Prasad KN, Mathur SK, Dhole TN, Ayyagari A. Antimicrobial susceptibility and plasmid analysis of Campylobacterjejuni isolated from diarrhoeal patients and healthy chickens in northern India. J Diarrhoeal Dis Res1994;12:270–273.
14. Hoge CW, Gambel JM, Srijan A Pitarangsi C, Echeverria P. Trends in antibiotic resistance among diarrhealpathogens isolated in Thailand over 15 years. Clin Infect Dis 1998;26:341–345.
15. Huysmans MB, Turnidge JD. Disc susceptibility testing for thermophilic Campylobacters. Pathology1997;29:209–216.
16. World Health Organization. Use of quinolones in food animals and potential impact on human health. Report andproceedings of a WHO meeting, Geneva, Switzerland, 2-5 June, 1998. Geneva: World Health Organization, 1998.
17. McDermott PF, Bodeis SM, English LL, White DG, Walker RD, Zhao S, et al. Ciprofloxacin resistance inCampylobacter jejuni evolves rapidly in chickens treated with fluoroquinolones. J Infect Dis 2002;185:837–840.
18. Joint Expert Technical Advisory Committee on Antibiotic Resistance (JETACAR). The use of antibiotics in food-producing animals: antibiotic resistant bacteria in animals and humans. Commonwealth Department of Health andAged Care, Commonwealth Department of Agriculture, Fisheries and Forestry—Australia. Prepared for JETACARby Biotex Canberra, 1999, Commonwealth of Australia. Available from: http://www.health.gov.au/pubs/jetacar.htm. Accessed: July 2002.

19. Linton D, Lawson AJ, Owen RJ, Stanley J. PCR detection, identification to species level, and fingerprinting ofCampylobacter jejuni and Campylobacter coli direct from diarrhoeic samples. J Clin Microbiol 1997;35:2568–2572.
20. Harmon KM, Ransom GM, Wesley IV. Differentiation of Campylobacter jejuni and Campylobacter coli by polymerasechain reaction. Mol Cell Probes 1997;11:195–200.
21. Bolton FJ, Wareing DRA, Skirrow MB, Hutchinson DN. Identification and biotyping of Campylobacters. In: BoardGR, Jones D, Skinner FA eds. Identification methods in applied and environmental microbiology. Blackwell ScientificPublications, Oxford, United Kingdom, 1992:151–161.
22. National Committee for Clinical Laboratory Standards. Methods for dilution antimicrobial susceptibility tests forbacteria that grow aerobically, 11th edition. Approved standard. National Committee for Clinical LaboratoryStandards document M7–A5. Villanova, Pennsylvania, USA, 2001.
23. Reina J, Ros MJ, Serra A. Susceptibilities to 10 antimicrobial agents of 1,220 Campylobacter strains isolated from1987 to 1993 from feces of pediatric patients. Antimicrob Agents Chemother 1994;38:2917–2920.
24. Wang Y, Huang WM, Taylor DE. Cloning and nucleotide sequence of the Campylobacter jejuni gyrA gene and charac-terization of quinolone resistance mutations. Antimicrob Agents Chemother 1993;37:457–463.
25. Charvalos E, Tselentis Y, Hamzehpour MM, Kohler T, Pechere JC. Evidence for an efflux pump in multidrug-resistant Campylobacter jejuni. Antimicrob Agents Chemother 1995;39:2019–2022.
26. Ferguson JK, Dalton CB, McGettigan P, Hill S. Antimicrobial resistance in animal enteric bacteria and humandisease — a review of the scientific literature. Commissioned report to the Joint Expert Technical AdvisoryCommittee on Antibiotic Resistance (JETACAR). Canberra; National Health and Medical Research Council, 1998.
27. Aquino MH, Filgueiras AL, Ferreira MC, Oliveira SS, Bastos MC, Tibana A. Antimicrobial resistance and plasmidprofiles of Campylobacter jejuni and Campylobacter coli from human and animal sources. Lett Appl Microbiol2002;34:149–153.
S88 Antimicrobial Resistance in Australia

Antimicrobial Resistance in Australia S89
Low levels of fluoroquinolone resistance in Escherichia coli. A five-year trend in
Australia measured through the use of TSN® Database Australia
John Turnidge,1 Laurence R McCarthy,2 Ronald N Master,3 Douglas E Kepner4
AbstractIn many countries, fluoroquinolones are among the most commonly used antibacterial drugs. Concernsabout bacterial resistance to these and other frequently used drugs have been raised by the medicaland scientific communities. While fluoroquinolone resistance has not yet developed among manybacteria, emergence of resistance in Escherichia coli would be a problem as multiple resistances toother antibiotics is now a common problem. This paper examines trends in resistance to fluoro-quinolones in Escherichia coli through analysis of data collected from Australian institutions between1997 and 2001. During the study period, norfloxacin and ciprofloxacin were the most frequentlytested fluoroquinolones in Australian laboratories. An examination of results for strains tested simult-aneously against both drugs indicated that testing against either drug accurately predicted resistanceor susceptibility for the other (99.7% agreement). Over 400,000 tests were performed to determinethe fluoroquinolone susceptibility of E. coli. Data were analysed by the test method used (CalibratedDichotomous Sensitivity (CDS) or National Committee for Clinical Laboratory Standards (NCCLS)). Thedata indicate that fluoroquinolone resistance in E. coli has not yet emerged as a significant problemin Australia, but there are some indications of low level increases in resistance rates. Norfloxacinresults are likely to be a better guide to fluoroquinolone resistance in this species using this methodof surveillance. Commun Dis Intell 2003;27 Suppl:S89–S91.
Keywords: fluoroquinolone resistance, Escherichia coli, antibiotic resistance
Introduction
The fluoroquinolones are a potent class of antimicrobial agents that have a wide range of activityagainst both gram-negative and gram-positive bacterial pathogens. In many countries, this hasresulted in widespread use of these agents as treatment modalities for a broad range of infections. Bycontrast, in Australia the widespread use of quinolones has been prevented, in part through restrictedaccess on the Pharmaceutical Benefits Scheme. The initial quinolone agents (e.g., norfloxacin andciprofloxacin) were approved for use mainly against gram-negative pathogens including those in thefamily Enterobacteriaceae and the genus Pseudomonas. The more recent derivatives (e.g., moxifloxacinand gatifloxacin) retain much of the gram-negative activity, but have enhanced gram positive activity.Over the years these agents have demonstrated continued success, but there is concern about thedevelopment of resistance, especially in E. coli where multi-resistance to other antibiotic classes isnow seen regularly.
1. Director of Microbiology and Infectious Diseases, Women’s and Children’s Hospital, Microbiology Department, North Adelaide,South Australia
2. President and CEO, Focus Technologies Inc, Virginia, United States of America
3. Director, TSN Operations, Focus Technologies Inc, Virginia, United States of America
4. TSN Microbiology Analyst, Focus Technologies Inc, Virginia, United States of America
Corresponding author: Associate Professor John Turnidge, Director of Microbiology and Infectious Diseases, Women’s and Children’sHospital, Microbiology Department, 72 King William Road, North Adelaide, SA 5006. Telephone: +61 8 8161 6873. Email: [email protected]

It is important to monitor the activity of fluoroquinolones using a strategy that provides an accurateand timely picture. TSN Database Australia was used as the system to monitor the activity of twofluoroquinolones; ciprofloxacin and norfloxacin, against Escherichia coli in Australia over the past fiveyears.
Methods
The Surveillance Network (TSN) Database was first initiated in 1994 by Focus Technologies, Inc.(formerly 'MRL,' Herndon, Virginia). TSN assimilates antimicrobial susceptibility testing and patientdemographic data from over 100 laboratories across Australia, into a database. Laboratories areincluded in TSN based on factors such as hospital bed size, patient population, geographic location,and the antimicrobial susceptibility test methods used. Antimicrobial susceptibility testing of patientisolates is conducted onsite by each participating laboratory as a part of their routine diagnostictesting. TSN uses a series of quality-control filters (i.e., critical rule sets) to screen susceptibility testresults for patterns suggestive of testing error and 'quarantines' such results pending laboratoryconfirmation. TSN Database Australia reflects current testing practices in Australian laboratories andconnects a significant number of laboratories in the country in an automated surveillance effort. Asof 31 March 2002 TSN Database Australia contained more than 15 million antimicrobialagent/organism susceptibility test results. These results are from approximately 2 million bacterialstrains isolated from 1.2 million patients across Australia since 1995.
For analysis of trends, all strains of E. coli tested were included. Significance of trends in rates ofresistance was analysed using the Chi-square test for linear trend.
Isolates tested concurrently against ciprofloxacin and norfloxacin were also analysed to examine thedegree of concordance.
Results
Data from TSN Database Australia demonstrated continued excellent activity of both ciprofloxacin andnorfloxacin against E. coli, with a small but steady decrease in susceptibility over five years, as shownin Table 1. Both drugs showed increasing trends to resistance, and both trends were significant atp<0.0001; but more than 97 per cent of isolates were susceptible. This was true for isolates testedby both CDS and NCCLS methods. The ciprofloxacin rate of resistance changed from 1.7 per cent in1997 to 4.7 per cent in 2001, and the norfloxacin resistance rate increased from 0.3 per cent in 1997to 1.1 per cent in 2001.
There appear to be differences in the resistance rates between ciprofloxacin and norfloxacin testedby either CDS or NCCLS test methods. These differences are likely to be due to selective testing ofciprofloxacin, in strains demonstrating intermediate or resistant result to norfloxacin. There are largedifferences in the number of tests with norfloxacin being tested significantly more frequently thanciprofloxacin. For the CDS test method in 2001 there were 1,654 ciprofloxacin results versus 67,320norfloxacin results. For the NCCLS test methods in 2001 there were 13,643 ciprofloxacin resultsversus 69,535 results for norfloxacin. Norfloxacin is the fluoroquinolone most frequently routinelytested in Australia and as such is the better indicator of resistance trends using this method ofsurveillance. We do not believe that the ciprofloxacin results from the TSN Database Australia providean accurate guide to true rates of fluoroquinolone resistance in E. coli at this time.
The activities of the two fluoroquinolones were compared using 3 by 3 analyses for data from both2000 and 2001. Of the 11,225 strains of E. coli examined in 2000 for this study, 99.7 per cent wereconcordant (data not shown), and for the 13,445 strains examined in 2001, the same percentagewere concordant (Table 2). The rates of concordance were high and no differences were observedbetween the CDS and NCCLS methodologies.
S90 Antimicrobial Resistance in Australia

Antimicrobial Resistance in Australia S91
Table 1. Ciprofloxacin and norfloxacin against E. coli, number and per cent susceptible, intermediateand resistant
S I R
Year Drug n % n % n %
1997 Ciprofloxacin 4,987 99.5 0 0 25 0.5
Norfloxacin 45,307 99.7 0 0 121 0.3
1998 Ciprofloxacin 6,480 99.2 0 0 53 0.8
Norfloxacin 61,834 99.6 0 0 234 0.4
1999 Ciprofloxacin 11,054 98.7 3 0 145 1.3
Norfloxacin 84,044 99.5 16 0 380 0.5
2000 Ciprofloxacin 15,697 98.4 2 0 260 1.6
Norfloxacin 126,325 99.3 20 0 851 0.7
2001 Ciprofloxacin 18,240 97.8 1 0 409 2.2
Norfloxacin 138,202 99.0 34 0 1,306 0.9
Table 2. E. coli, ciprofloxacin versus norfloxacin, 2001
Norfloxacin
S I R% % %
Cip
roflo
xaci
n
S Susecptible.
I Intermediate.
R Resistant
Discussion
This study demonstrates several interesting findings. Firstly, both ciprofloxacin and norfloxacin remainhighly active against E. coli in Australia. Secondly, a direct comparison of ciprofloxacin and norfloxacintested concurrently demonstrates a high degree of concordance between the two when tested againstAustralian isolates of E. coli. Testing either drug predicted resistance or susceptibility for the otherdrug. Thirdly, while fluoroquinolone resistance in Australia has not yet emerged as a significantproblem, there are indications of increasing resistance rates at low levels. The overall rate ofresistance to norfloxacin increased from 0.3 per cent in 1997 to 0.9 per cent in 2001. This trend ofincreasing resistance rates suggests the need for continued surveillance.
Acknowledgments
We would like to thank the members of the TSN Australia Advisory Board and the participatinginstitutions.
S % 97.11 0.00 0.19n (13,057) (0) (25)
I % 0.02 0.00 0.01n (3) (0) (1)
R % 0.13 0.01 2.54n (17) (1) (341)

S92 Antimicrobial Resistance in Australia
Surveillance of hospital-acquired methicillin-resistantStaphylococcus aureus in South Australia
Celia Cooper,1 Meredith A Ochota2
AbstractIn September 2001, the South Australian state-wide methicillin-resistant Staphylococcus aureus(MRSA) surveillance system was expanded to include three surveillance indicators namely: estimatedMRSA burden, MRSA morbidity and estimated MRSA acquisition. The last two indicator rates havebeen stratified into intensive care unit (ICU) versus non-ICU. Between September 2001 and March2002, state-wide MRSA burden rates (prevalence) ranged from 27.5 to 39.8 per 10,000 occupied beddays (OBDs). Acquisition rates ranged from 28.2 to 69.0 per 10,000 OBDs (ICU) and 6.3 to 10.1 per10,000 OBDs (non-ICU). Morbidity rates ranged from 12.9 to 43.1 per 10,000 OBDs (ICU) and 3.0 to5.0 per 10,000 OBDs (non-ICU). In association with the changes to surveillance indicators, a newmonthly surveillance report was developed. Assuring confidentiality to individual contributing hospitalshas been a major consideration in the development of the data collection system. Individualcontributors have access only to their own indicator rates and pooled state-wide indicator rates.Contributing institutions are urged to use great caution if wishing to compare their own rates withstate-wide rates. In particular, contributors are asked to take inter-institutional differences in MRSAburden and casemix complexity into account when making such comparisons. Commun Dis Intell2003;27 Suppl:S92–S96.
Keywords: methicillin-resistant Staphylococcus aureus, antibiotic resistance
Introduction
Antibiotic-resistant organisms are now regarded as a significant and growing threat to public healthworldwide.1 In October 2000, the Australian Commonwealth Government released its response to thereport of the Joint Expert Technical Advisory Committee on Antibiotic Resistance (JETACAR) in whichit supported surveillance of antibiotic-resistant organisms at the national level and at the level ofindividual states and territories.2
In response to the Commonwealth Government recommendations, the surveillance system formethicillin-resistant Staphylococcus aureus (MRSA) established in South Australia (December 2000),incorporating all the major public and private hospitals, was expanded in September 2001. The primaryaim of this enhanced surveillance is to better understand the epidemiology of MRSA infection andcolonisation in South Australia; this is seen as an important first step towards the development ofeffective local control programs.
1. Head, Infection Control Service, Communicable Disease Control Branch, South Australian Department of Human Services,Adelaide, South Australia
2. Infection Control Practitioner, Infection Control Service, Communicable Disease Control Branch, South Australian Department of Human Services, Adelaide, South Australia
Corresponding author: Dr Celia Cooper, Infection Control Service, Communicable Disease Control Branch, South AustralianDepartment of Human Services, 162 Grenfell Street, Adelaide SA 5000. Telephone: +61 8 226 7177. Facsimile: +61 8 226 7187.Email: [email protected]

Antimicrobial Resistance in Australia S93
Methods
Sixteen hospitals (eight public and eight private) currently contribute MRSA infection and colonisationdata to the South Australian Department of Human Services (SADHS). The definitions andmethodology used are based on those for multi-resistant organisms developed by the AustralianInfection Control Association National Advisory Board, which are currently published in draft form.3
MRSA is defined as Staphylococcus aureus with acquired resistance to methicillin (usually reported asflucloxacillin- or oxacillin-resistant).
Each month the infection control practitioner responsible for MRSA surveillance at each contributinghospital supplies the following data about discharged patients.
Documented as infected or colonised:
• The number of patients with previously diagnosed MSRA. These patients may either have aninfection (defined as an event associated with a sterile site isolate or an event associated with anon-sterile site clinical isolate where MSRA-specific antibiotic therapy was administered by aclinician) or colonisation (defined as a non-sterile site isolate and specific MRSA therapy has notbeen instituted).
• The number of patients with newly-acquired, healthcare-related MRSA (either colonised orinfected). Newly-acquired is defined as, not previously documented as infected or colonised, firstdetected more than 48 hours after admission or within 48 hours of discharge from the healthcarefacility.
• The number of newly-acquired healthcare-related MRSA infections (these may occur in patientspreviously known to be colonised) where the infection is first detected more than 48 hours afteradmission or within 48 hours of discharge from the healthcare facility.
For newly-acquired, healthcare-related MRSA cases (infected or colonised) the following patient datais also collected: medical record number; specialty unit (i.e., ICU or non-ICU); processing laboratoryand laboratory identification number of isolate; infection status (i.e., infected or colonised); andinfection site (i.e., sterile or non-sterile).
In order to calculate rates, the following hospital separations data are also captured each month(excluding day cases): the number of inpatient separations; the number of inpatient occupied bed days(OBDs); and the number of ICU OBDs.
Upon receipt of a hospital dataset at the SADHS, the data are manually entered into a Microsoft Excel97 workbook. When all the MRSA and separations data for a month have been entered, the new dataare then processed to calculate the following three rates, firstly for each individual hospital, and thenfor all the hospitals combined.
Estimated MRSA burden (estimated prevalence), calculated as follows:
The number of patients (infected or colonised) with MRSA (previously diagnosed) x 10,000
OBD
Estimated MRSA acquisition (estimated incidence), calculated as follows:
The number of patients (infected or colonised) with newly-acquired, healthcare-related MRSA x 10,000
OBD
MRSA morbidity calculated as follows:
The number of newly-acquired MRSA infections x 10,000
OBD
The incidence and morbidity rates are also stratified by ICU or non-ICU.

S94 Antimicrobial Resistance in Australia
These rates, along with those for previous months, are incorporated into individual hospital reports,which allow readers to both assess changes over time within their own hospitals and to compare theirown rates for the three surveillance indicators with those for all hospitals combined. The highly-automated production of these reports (by way of Excel ‘Automation’4) helps to ensure that reportsare delivered to contributors in a timely manner.
Results
Using combined hospital data for the period 1 September 2001 to 31 March 2002, estimated burdenrates range from 27.5 to 39.8 per 10,000 OBD per month (Figure 1). Estimated acquisition rates forthe same period range from 28.2 to 69.0 per 10,000 OBD per month (for ICU) and from 6.3 to 10.1per 10,000 OBD per month (non-ICU) (Figure 2). Morbidity rates range from 12.9 to 43.1 per 10,000OBD per month (ICU) and from 3.0 to 5.0 per 10,000 OBD per month (non-ICU) (Figure 3).
Figure 1. State-wide estimated methicillin-resistant Staphylococcus aureus burden rates for the period1 September 2001 to 31 March 2002
OBD Occupied bed days
Figure 2. State-wide estimated methicillin-resistant Staphylococcus aureus acquisition rates for theperiod 1 September 2001 to 31 March 2002
OBD Occupied bed days
ICU Intensive care unit
0
5
10
15
20
25
30
35
40
45
Ra
tes
pe
r 1
0,0
00
OB
Ds
Month and year
Sep-01 Oct Nov Dec Jan-02 Feb Mar
0
10
20
30
40
50
60
70
80
Sep-01 Oct Nov Dec Jan-02 Feb Mar
State ICU acquisition rate
State non-ICU acquisitionrate
Ra
tes
pe
r 1
0,0
00
OB
Ds
Month and year

Antimicrobial Resistance in Australia S95
Figure 3. State-wide methicillin-resistant Staphylococcus aureus morbidity rates for the period 1 September 2001 to 31 March 2002
OBD Occupied bed days
ICU Intensive care unit
Discussion
The release of the JETACAR report and the Commonwealth Government response to JETACAR heraldedincreased national concern over the public health threat posed by antibiotic-resistant bacteria. This isparticularly the case for South Australia, where in 2002, media attention focused on several investi-gations into antibiotic-resistant bacteria in major public hospitals, helping to highlight the concernthat rates of hospital-acquired infection due to antibiotic-resistant bacteria (including MRSA) may beincreasing. Information from the Australian Group for Antimicrobial Resistance shows that theproportion of methicillin-resistant Staphylococcus aureus isolates in South Australia increased from 4 per cent in 1995 to 23 per cent in 1999 (Dr Peter Collignon, Chair of the Australian Group forAntimicrobial Resistance, personal communication).
Surveillance forms the cornerstone of control programs for all antibiotic-resistant organisms, includingMRSA. The surveillance system described in this article has established baseline rates of MRSAacquisition and infection, and is enabling a better understanding of the epidemiology of this organismwithin South Australian public and private hospitals. We are now better positioned to both monitor theeffects of new control measures, such as the use of new hand-hygiene products, or the use of anti-bacterial coated intravascular catheters, and to deal with new challenges, such as the introduction ofnew epidemic clones. Data collected will enable us to determine the common antibiotic resistancepatterns in hospital-acquired MRSA in South Australia. This analysis has not yet been performed.
With regards to the reports produced by this surveillance system, the advice given by the SADHS tohospital staff is to focus primarily on improving their own rates over time. While there is a place forcomparison with state-wide rates, at least in establishing whether or not a hospital’s baseline ratesare high, hospital staff are urged to do so with great caution. One factor affecting comparability isthat South Australian hospitals vary with respect to factors known to influence rates of MRSAacquisition, such as the casemix and the burden of MRSA within the hospital. We are currentlyworking with the contributing hospitals to develop a measure of relative casemix complexity, with theview to possibly adjusting rates according to this measure.
In order to generate high-quality information from this system, it is important to ensure that thecontributing hospitals all implement the same surveillance methodology. The SADHS has confirmedthat surveillance case definitions and MRSA screening policies (such as screening transfers fromother healthcare institutions) are effectively the same for all the contributing hospitals; however, it isimportant to ensure that hospitals continue to comply with these policies over time.
0
10
20
30
40
50
60
70
80
Sep-01 Oct Nov Dec Jan-02 Feb Mar
State ICU acquisition rate
State non-ICU acquisitionrate
Ra
tes
pe
r 1
0,0
00
OB
Ds
Month and year

Involvement in the South Australian MRSA surveillance system is voluntary. This decision was basedon the view that mandatory data collection (particularly if attached to punitive consequences) maylead to under-reporting. The SADHS has implemented several strategies in order to encouragehospitals to contribute monthly data. Firstly, regular meetings are convened involving both SADHSstaff and hospital infection control staff; these have helped to establish a collaborative relationshipwith contributing hospitals. Secondly, the system has been designed to ensure that informationgenerated relating to individual hospitals remains confidential. Thirdly, contributors receive feedbackin a timely manner, in part due to the high degree of automation achieved in the generation of reports.
Another strength of the South Australian MRSA surveillance system is the inclusion of privatehospitals. These hospitals account for a large percentage (32%) of the total number of beds across allthe contributing hospitals, and are undertaking increasingly complex procedures. Furthermore, themovement of patients and staff between public and private hospitals in South Australia is such that itmakes little epidemiological sense to examine either system in isolation.
In conclusion, this recently-established enhanced surveillance system has improved our understandingof the epidemiology of hospital-acquired MRSA infections in South Australia. Our plan is now todevelop similar systems in South Australia to study other resistant organisms, and to look at ways ofrelating resistance rates to rates of antibiotic usage.
Acknowledgments
We would like to thank the following people for their assistance; members of the South AustralianNosocomial Infection Taskforce and the 16 contributing public and private hospitals for assisting withthe development of the surveillance system, Mr Chris Horwood for developing and managing thedatabase and assisting with other aspects of the project and Ms Caroline Gale for assisting with datacollection.
References
1. World Health Organization. World Health Organization consultation on global principles for the containment ofantimicrobial resistance due to antimicrobial use in livestock, 5–6 June 2000, Geneva, Switzerland. Availablefrom: http://www.who.int/emc/diseases/zoo/drafting.html.
2. Commonwealth Department of Health and Aged Care. The Commonwealth Government Response to the Report ofthe Joint Expert Technical Advisory Committee on Antibiotic Resistance (JETACAR). Commonwealth Department ofHealth and Aged Care, Commonwealth Department of Agriculture, Fisheries and Forestry—Australia, Canberra2000.
3. Australian Infection Control Association National Advisory Board. Draft surveillance indicator definitions: multi-resistant organisms. Australian Infection Control 2001;6:136–139.
4. McFedries P. Visual basic for applications unleashed. SAMS publishing; Indianapolis, 1997:1000.
S96 Antimicrobial Resistance in Australia

Antimicrobial Resistance in Australia S97
Screening and electronic labelling of ward contacts of vancomycin–resistant Enterococcus faecium vanBcarriers during a single-strain hospital outbreak and
after discharge from hospitalJohn W Pearman,1 Peta L Perry,2 Frank P Kosaras,3 Charles R Douglas,4 Rosie C Lee,5
Allison Peterson,6 C Terri Orrell,5 Claire H Khinsoe,2 Christopher H Heath,7 Keryn J Christiansen8
AbstractA large single-strain outbreak of vancomycin–resistant Enterococcus faecium (VREF) vanB occurredin Royal Perth Hospital from July to December 2001. When a VREF–carrying patient was discoveredon a ward, all patients on the ward were screened with rectal swabs. A total of 172 patients werecolonised, four with infections, but no deaths were attributable to VREF. The number of rectal swabsrequired to detect each carrier was recorded. On average four rectal swabs, each collected onseparate days, were needed to detect more than 90 per cent of the 172 VREF carriers who wereepidemiologically linked to the Royal Perth Hospital outbreak. An electronic alert system (Micro-Alert)was used to identify ward contacts of VREF carriers and enabled those who had not been screenedbefore discharge to be followed-up and screened. Ninety-six contacts were actively followed-up inOctober 2001 and 32 (33.3%) were found to be VREF carriers. From 28 September 2001 to 30 April2002, a total of 1,977 ward contacts were screened after discharge from hospital and 54 (2.73%)were found to be carrying VREF. We conclude that during single-strain outbreaks of vancomycin-resistant enterococci in hospitals, patient contacts need to be screened on more than three occasionsin order to detect most of the carriers and control the outbreak. Secondly, electronic labelling andactive follow-up of patients with VREF resulted in a significant number of carriers being detected whootherwise posed a risk of initiating further outbreaks in hospitals if they were readmitted. CommunDis Intell 2003;27 Suppl:S97–S102.
Keywords: vancomycin-resistant enterococci, Enterococcus faecium vanB, alert systems, screening
Introduction
The control of spread of vancomycin-resistant enterococci (VRE) in hospitals depends largely on theprompt detection of asymptomatic carriers which, in turn, depends on two factors; the collection of asufficient number of specimens from exposed individuals and the laboratory’s ability to promptly andaccurately detect VRE. The sensitivity of a single rectal swab is low, being only 79 per cent in onerecent study1 and 58 per cent in another.2 Since the diagnostic accuracy of one rectal swab is poor,the Division of Public Health, Georgia, United States of America, has recommended that threenegative rectal swabs are needed before isolation precautions are discontinued.3
1. Head, Department of Microbiology and Infectious Diseases, Royal Perth Hospital, Perth, Western Australia
2. Senior Medical Scientist, Department of Microbiology and Infectious Diseases, Royal Perth Hospital, Perth, Western Australia
3. Senior Medical Scientist in charge, Department of Microbiology and Infectious Diseases, Royal Perth Hospital, Perth, WesternAustralia
4. Director, Eastern Perth Public and Community Health Unit, Perth, Western Australia
5. Clinical Nurse Specialist, Infection Control, Royal Perth Hospital, Perth, Western Australia
6. Clinical Nurse, Infection Control, Royal Perth Hospital, Perth, Western Australia
7. Infectious Diseases Physician and Clinical Microbiologist, Department of Microbiology and Infectious Diseases, Royal PerthHospital, Perth, Western Australia
8. Clinical Microbiologist, Department of Microbiology and Infectious Diseases, Royal Perth Hospital, Perth, Western Australia
Corresponding author: Professor John W Pearman, Head, Department of Microbiology and Infectious Diseases, Royal Perth Hospital,Perth WA 6000. Telephone: +61 8 9224 2442. Facsimile: +61 8 9224 1989. Email: [email protected]

S98 Antimicrobial Resistance in Australia
On 18 July 2001, a 58-year-old male was admitted to Royal Perth Hospital (RPH) Intensive Care Unit(ICU) with pneumococcal pneumonia. The man had been receiving haemodialysis in the RPH In-centreDialysis Unit (IDU) three times a week during the previous six weeks. A central venous catheter wasinserted on 18 July 2001 and he was given benzylpenicillin intravenously. Five days later he developedbacteraemia and blood cultures collected on 23 July 2001 yielded vancomycin–resistant Enterococcusfaecium (VREF) vanB which was susceptible to teicoplanin. He was treated with teicoplanin 400 mgintravenously after each haemodialysis from 28 July 2001 to 20 August 2001 and survived.
The index patient was a resident of a hostel for people from country areas receiving specialisedmedical treatment in Perth. Twenty-five residents of the hostel who attended Perth hospitals from 28 July 2001 to 31 December 2001 were screened and 10 of them were found to be carrying theoutbreak strain of VREF. All 10 carriers were being dialyzed; nine at RPH and one at another hospital.
Screening of 589 patients on the ICU, IDU, Nephrology ward and Satellite Dialysis Unit (SDU) onmultiple occasions from 28 July 2001 to 31 December 2001 detected a total of nine VREF carriers onthe ICU, four carriers attending the IDU, 13 carriers on the Nephrology ward and four carriers attendingthe SDU. Swabbing of these areas demonstrated environmental contamination with VREF on the ICUand Nephrology ward.
Patients carrying VREF were strictly isolated and ward contacts were segregated, cohorted andscreened. Wards where carriers were detected were closed and thoroughly cleaned and disinfected intwo steps with an anionic detergent followed by a phenolic disinfectant. The wards were then swabbedand not reopened until all environmental swabs were negative for VREF. Despite these measures,transmission of VREF between patients within the RPH continued for five months. Twenty-three wardsor units in the hospital and one outpatient unit (SDU) were involved.
As previous studies1,2 had reported the low sensitivity of a single rectal swab for detecting thecarriage of VRE, patients who had been on wards where VREF carriers had been detected (wardcontacts) were screened on multiple occasions during their in-patient stay. Screening of patients whilethey were in RPH detected a total of 118 carriers. The last hospital-acquired colonisation by theoutbreak strain of VREF of an in-patient in RPH was detected on 28 December 2001.
It was of concern that many ward contacts of VREF carriers had been discharged from hospital beforethey had been screened on at least four occasions and it was decided to screen as many dischargedward contacts as possible by collecting at least four rectal swabs on separate days from each of them.Screening of ward contacts after they had been discharged from hospital detected a further 54carriers, making a total of 172 patients who were colonised.
As a result of the outbreak, four patients were clinically infected with VREF; bacteraemia associatedwith an intravenous catheter, urinary tract infection associated with an indwelling urethral catheter,peritonitis associated with continuous ambulatory peritoneal dialysis and deep wound infection andsubphrenic abscesses following abdominal surgery. No deaths were attributable to VREF but 53patients have died from causes unrelated to VREF, indicating that many of those who became carrierswere suffering from terminal illnesses. Pulsed–field gel electrophoresis of all the isolates and plasmidanalysis of 13 isolates demonstrated a single-strain outbreak.
Methods
Screening specimen
The screening specimen used was the rectal swab, which was obtained by dipping a cotton wooltipped swab into sterile water and then gently inserting the swab into the rectum. When the first swabwas negative for VREF, further swabs were collected on separate days until at least four negativeswabs were obtained. Some patients whose first four swabs were negative had further swabscollected and some of the later swabs were positive. (Table 1).

Antimicrobial Resistance in Australia S99
Table 1. Sensitivity of single and multiple rectal swabs for detecting vancomycin–resistantEnterococcus faecium carriers
Number of carriers
Number of rectal swabs 1 2 3 4 5 6 7 or more
VREF carriers detected for first time 96 31 17 15 4 2 7
Cumulative number of carriers detected 96 127 144 159 163 165 172
Cumulative percentage of carriers 56 74 84 92 95 96 100detected (sensitivity)
VREF vancomycin–resistant Enterococcus faecium.
Contact
A contact was defined as a patient who had been on the same ward as a known carrier of VREF.
Negative contact
A negative contact was defined as a contact who had subsequently had at least four negative rectalswabs collected on separate days.
Laboratory methods
Rectal swabs were first inoculated directly onto CHROMagar®‚ Orientation medium4,5 (CHROMagar,Paris, France) containing added vancomycin 6 mg/L and gentamicin 8 mg/L and then placed inEnterococcosel™ broth (BBL Products, Becton Dickinson Microbiology Systems, Maryland, USA)containing added vancomycin 8 mg/L. CHROMagar®‚ was incubated in air at 35 ± 1ºC for 36 hours(first examined at 24 hours). Enterococcosel™ broth was incubated in air at 35 ± 1ºC for a minimumof 24 hours. Blue colonies resembling enterococci on CHROMagar®‚ were assayed for vanA and vanBgenes by polymerase chain reaction (PCR). Brown/black Enterococcosel™ broths were subculturedonto CHROMagar®‚ not containing added antibiotics and incubated in air at 35 ± 1ºC for 24 hours.Blue colonies resembling enterococci on CHROMagar®‚ were screened for vancomycin resistanceusing brain heart infusion agar (BHIA)(CM375, Oxoid Ltd, Basingstoke, England) containing addedvancomycin 6 mg/L and BHIA containing added vancomycin 16 mg/L. Both BHIA plates wereincubated in air at 35 ± 1ºC for 48 hours (first examined at 24 hours). If there was growth on the BHIAvancomycin screening plates, the colonies were Gram-stained and Gram-positive coccal colonies weretested for pyrrolidonyl-ß-naphthylamide production and were assayed for vanA and vanB genes by PCR.Isolates which were likely to be VRE were identified using motility and standard biochemical tests.Antimicrobial susceptibility tests for ampicillin, gentamicin and vancomycin were performed by diskdiffusion according to the National Committee on Clinical Laboratory Standards guidelines.6 Minimuminhibitory concentrations of vancomycin and teicoplanin for each VRE isolate were determined byEtest®‚ (AB Biodisk, Sola, Sweden).
Electronic alert system
All public hospitals in the Perth metropolitan area use the same medical record numbering system.Each patient attending a public hospital in Perth is given a unique medical record number whichapplies in all other Perth public hospitals. The system has several alerts, including Micro-Alert whichidentifies known carriers of antibiotic-resistant organisms, including methicillin–resistantStaphylococcus aureus (MRSA). Micro-Alert was established in 1981 and VRE was included from 1996.

S100 Antimicrobial Resistance in Australia
Screening of VREF contacts after discharge from hospital
On 28 September 2001 a new category of Micro-Alert (Micro-Alert ‘F’) was introduced to identifypatients who had been ward contacts of patients found to be VREF carriers and who therefore requiredfour negative swabs to be cleared. These patients were labelled Micro-Alert ‘F’ and during theoutbreak 4,155 contacts were discharged from hospital before they had been swabbed four times.
A program to actively follow-up discharged ward contacts of VREF carriers was undertaken. The aimwas to screen as many discharged ward contacts as possible by collecting at least four rectal swabson separate days from each of them. The swabs were collected in one or more of the following places;the RPH outpatient clinics, on readmission to RPH or on admission to other hospitals. In addition,swabs were collected at the VRE Screening Clinic as described below.
A database was set up which provided demographic details of all VREF carriers and contacts, theiradmission history by ward and speciality and the number and results of rectal screening swabscollected. From this database all patients from specialities considered high-risk or who had been inhigh risk wards were identified. The high-risk units were the Nephrology ward and Dialysis Units,Haematology ward and Bone Marrow Transplant Unit and the Intensive Care Unit. In addition, from thedatabase which records the information about all admissions to public hospitals in the Perthmetropolitan area, all VREF contacts were stratified according to the number of times they had beenadmitted to hospital in the previous 12 months. Combining these two lists, patients from high-riskspecialities who were frequent attenders were given the highest priority, whilst those who had beenadmitted to low-risk specialities only once or twice were considered to be very low-risk. A VREScreening Clinic (VSC) was set up to screen patients on an outpatient basis, to complement the otherscreening programs which included the screening of inpatients and those attending the pre-admissionclinics for routine procedures. Patients were grouped according to priority, and between the monthsOctober 2001 to March 2002 letters were sent to patients, starting with the highest priority group.The letters provided them with information about VREF, informed them that they had been in contactwith a carrier and offered them four appointments to be screened and, if all swabs were negative,cleared of their ‘contact’ status. The hospital’s voluntary transport scheme was made available forpatients who were unable to get to the hospital by themselves. The clinic operated on Monday toFriday from 22 October 2001 to 19 April 2002. In February 2002, those patients on Category 1 and2 surgical wait lists were included in the program. (The urgency categories for elective admissionwere: Category 1, within 30 days; Category 2, within 90 days; Category 3, beyond 90 days.) Over theperiod 22 October 2001 to 19 April 2002, a total of 4,561 appointments were made and 3,241appointments were kept (response rate 71.06%).
Results
Screening for VRE carriage with rectal swabs
The number of negative rectal swabs collected from each of the 172 VREF carriers before the firstpositive rectal swab was used to estimate the sensitivity of single and multiple rectal swabs fordetecting the gastrointestinal carriage of VREF (Table 1).
Screening of ward contacts after discharge from hospital
From 28 September 2001 to 30 April 2002, 1,977 discharged ward contacts of VREF carriers werescreened. The number of negative contacts and the number of contacts found to be carrying VREFeach month are listed in Table 2.

Antimicrobial Resistance in Australia S101
Table 2. Vancomycin-resistant Enterococcus faecium vanB carriers detected by screening afterdischarge from hospital
Period Total number of ward contacts Number of negative Number of VREF VREF acquisition VREF carriers screened contacts carriers detected rate (%)
afterdischarge or on subsequent presentations to RPH or other hospitals
2001
28 Sep 96 64 32 33.3–31 Oct
November 349 340 9 2.6
December 351 345 6 1.7
2002
January 403 402 1 0.25
February 331 330 1 0.3
March 290 288 2 0.7
April 157 154 3 1.9
Total 1,977 1,923 54 2.73
RPH Royal Perth Hospital.
VREF vancomycin–resistant Enterococcus faecium.
Discussion
Screening for VRE carriage with rectal swabs
In small outbreaks of VRE, three consecutive negative rectal swabs may be sufficient to discontinueisolation, as recommended by the Division of Public Health, Georgia, USA.3 However, in larger orprolonged outbreaks, ward contacts of VRE carriers need to have rectal screening swabs collected onmore than three separate days before they can be considered not to have acquired VRE.
Screening of ward contacts after discharge from hospital
During previous single-strain MRSA outbreaks in the RPH, a special category of Micro-Alert was usedto identify unscreened discharged ward contacts. The alert facilitated their recognition on subsequentpresentations to RPH or other hospitals and assisted in successful termination of MRSA outbreaks inthe RPH.7 This technique has now been used for identifying unscreened, discharged, ward contactsduring a single-strain hospital outbreak of VREF.
Of the 96 contacts screened at the height of the outbreak (28 September to 31 October 2001), 32(33.3%) were found to be carrying VREF. In the following months the yields were progressively lower.In the first four months of 2002, 1,181 contacts were screened, resulting in the detection of sevencarriers (0.6%) (Table 2). Since the yield declined over time, the VRE Screening Clinic was closed on19 April 2002 and the Micro-Alert ‘F’ label will be removed from contacts who have not been screenedwithin 12 months of being labelled.
The post-hospitalisation screening program detected a significant number of carriers who wouldotherwise have posed a risk to other patients on subsequent admission to hospital, however, thedeclining yield over time as lower risk patients were being screened allowed the program to be wounddown. Active screening of ward contacts after discharge was shown to be a valuable strategy thatcontributed to the control of this outbreak.

Acknowledgments
We thank Ms Myra Book, Nurse in Charge of the VRE Screening Clinic, and her staff for their dedicatedwork, the staff of the Royal Perth Hospital Department of Microbiology and Infectious Diseases fortheir expertise and commitment, Ms Julie Pearson for performing PFGE and Ms Frances O’Brien at theMolecular Genetics Research Unit, Curtin University of Technology, for performing the plasmidanalyses.
References
1. Weinstein JW, Tallapragada S, Farrel P, Dembry LM. Comparison of rectal and perirectal swabs for detection ofcolonisation with vancomycin-resistant enterococci. J Clin Microbiol 1996;34:210–212.
2. D’Agata EM, Gautam S, Green WK, Tang YW. High rate of false-negative results of the rectal swab culture methodin detection of gastrointestinal colonisation with vancomycin-resistant enterococci. Clin Infect Dis2002;34:167–172.
3. Recommendations for the control of vancomycin-resistant Enterococcus (VRE) in healthcare facilities in Georgia.The Georgia VRE Task Force in conjunction with the Division of Public Health, Georgia Department of HumanResources, 1998:6.
4. Merlino J. Detecting enterococci and vancomycin resistance. Today’s Life Science 1998;10:37–39.
5. Ohkusu K. Cost-effective and rapid presumptive identification of Gram-negative bacilli in routine urine, pus andstool cultures : evaluation of the use of CHROMagar Orientation Medium in conjunction with simple biochemicaltests. J Clin Microbiol 2000;38:4586–4592.
6. National Committee on Clinical Laboratory Standards. Performance Standards for Antimicrobial SusceptibilityTests; Approved Standard – Seventh edition. Document M2–A7 (ISBN 1–56238–393–0). National Committee onClinical Laboratory Standards; Wayne, Pennysylvania USA, 2000.
7. Pearman JW, Christiansen KJ, Annear DI, Goodwin CS, Metcalf C, Donovan FP, et al. Control ofmethicillin–resistant Staphylococcus aureus (MRSA) in an Australian metropolitan teaching hospital complex. Med J Aust 1985;142:103–108.
S102 Antimicrobial Resistance in Australia

Antimicrobial Resistance in Australia S103
Polymerase chain reaction screening for integrons can be used to complement
resistance surveillance programsLouisa A Jones,1,2 Christopher J McIver,1,2,3 William D Rawlinson,1,2,3 Peter A White1,2
AbstractIntegrons have been recognised as important contributors to the acquisition and dissemination ofantibiotic resistance in Gram-negative bacteria. In a collection of 19 multi-antibiotic resistant Gram-negative clinical isolates, 47 per cent (9/19) of strains were found to contain one or more integron,using a polymerase chain reaction (PCR) based screening method. Resistance gene cassettes withinthe integrons were amplified, sequenced and characterised. Antibiotic susceptibility testingdemonstrated that resistance phenotypes correlated with the resistance conferred by gene cassettesidentified. PCR-screening for integrons and gene cassettes provides a rapid technique for the identifi-cation of genetic determinants of resistance in Gram-negative bacteria. Such screening could assistin guiding treatment regimens and complement existing antibiotic resistance surveillance programsby providing information on molecular mechanisms of both resistance and resistance dissemination.Commun Dis Intell 2003;27 Suppl:S103–S110.
Keywords: antibiotic resistance, polymerase chain reaction screening, integrons resistance surveillanceprograms
Introduction
Antibiotic resistance is a serious clinical problem worldwide. Acquisition of resistance genes in Gram-negative bacteria is facilitated by mobile genetic elements called integrons, which are associated withresistance plasmids and transposons.1 Integrons encode an enzyme, termed integrase, which allowsthem to capture antibiotic resistance gene cassettes (Figure).2,3 Over 80 cassettes have beenidentified to date, conferring resistance to almost all classes of antibiotic. The length of genecassettes varies considerably from 262 base pairs (bp) to 1,549 bp,4,5 however, a common feature ofall gene cassettes is a specific recombination site [termed 59-base element (59–be)], locateddownstream of the gene. The 59–be is recognised by the integron-encoded integrase (IntI),6 whichenables the gene cassette to be inserted into the integron at a second recombination site (attI),located immediately upstream of the integrase gene (intI) (Figure).7,8,9,10 Gene cassette arrays inintegrons can consist of up to nine cassettes,11 which are expressed from an upstream promoter(Figure).2,12,13 Integrons involved in antibiotic resistance can be divided into three classes, class 1, 2and 3, based on the amino acid sequence of their respective integrases.
1. Virology Division, Department of Microbiology, SEALS, Prince of Wales Hospital, Randwick, New South Wales
2. Department of Microbiology and Immunology, School of Biotechnology and Biomolecular Sciences, Faculty of Science, TheUniversity of New South Wales, Randwick, New South Wales
3. School of Medical Sciences, Faculty of Medicine, The University of New South Wales, Randwick, New South Wales
Corresponding author: Dr Peter White, Virology Division, Department of Microbiology, SEALS, Prince of Wales Hospital, RandwickNSW 2031. Telephone: +61 2 9382 9096. Facsimile: +61 2 9398 4275. Email: [email protected]

S104 Antimicrobial Resistance in Australia
Figure. The insertion of a gene cassette into an integron
The preferential integration of gene cassettes at the attI recombination site (indicated by a black box), is catalysed by the productof intI, the integrase gene (open box). Two gene cassettes are indicated in the cassette region after the integration event. Thefilled circle represents the recombination site (59–be) of the gene cassette. A promoter for the expression of integrated genecassettes, found upstream of the cassette region is also shown.
Integrons are prevalent amongst Gram-negative bacteria and have been associated with antibioticresistance in clinical isolates.14,15,16,17,18,19 In a previous study we showed that integrons are signifi-cantly associated with multi-resistance in urinary isolates of Enterobacteriaceae.14 Investigations intothe prevalence of integrons and characterisation of gene cassettes in clinical isolates provideinformation on the evolution of multiple-antibiotic resistant strains, the prevalence of antibioticresistance genes and the molecular mechanisms of antibiotic resistance. This is important whenconsidering strategies for effective antibiotic treatment of bacterial infections.
The present study investigates integrons and gene cassettes in a random selection of Gram-negativeclinical isolates that were identified as multi-drug resistant. The presence of antibiotic resistancegene cassettes was correlated with the phenotypic antibiotic resistance profiles to evaluate thecontribution of integrons to resistance.
Materials and methods
Clinical isolates
Nineteen randomly selected multi-resistant strains of Gram-negative bacteria from a laboratorycollection of clinical isolates were examined (Table 1). All isolates were obtained in 2000 and wereconsidered multi-resistant if resistant to more than four classes of antibiotic. Escherichia coli Top 10and E. coli NCTC 10418 were used as integron negative controls, while strains containing class 1, 2and 3 integrons were also included as positive controls in all experiments.

Antimicrobial Resistance in Australia S105
Table 1. Integron status of bacterial strains studied
Strain Organism* Source of isolation† Integron
INSJ04 Proteus mirabilis N/A +
INSJ07 Klebsiella sp. Urine –
INSJ08 Klebsiella sp. Urine –
INSJ09 Klebsiella sp. Urine –
INSJ10 Proteus mirabilis Urine +
INSJ11 Klebsiella sp. Blood +
INSJ12 Enterobacter cloaceae Wound –
INSJ14 Stenotrophomonas maltophilia Wound –
INSJ15 Acinetobacter baumanii Sputum –
INSJ16 Klebsiella sp. Urine +
INSJ17 Acinetobacter baumanii Urine –
INSJ18 Acinetobacter baumanii Urine –
INSJ19 Acinetobacter baumanii Sputum –
INSJ20 Proteus mirabilis Urine +
INSJ21 Escherichia coli Blood +
INSJ22 Pseudomonas sp. Sputum –
INS95 Salmonella typhimurium Stool +
INSTR2 Citrobacter freundii Urine +
INSTR5 Enterobacter cloaceae Urine +
* Classification based on standard biochemical criteria.
† N/A: information not available.
Antibiotic susceptibility testing
Susceptibility to antimicrobial agents was determined using the Calibrated Dichotomous Sensitivitymethod.20 The antibiotics tested included: aminoglycosides (amikacin, gentamicin, kanamycin,netilmicin, streptomycin and tobramycin), ß-lactams (ampicillin, augmentin, cefotaxime, cefotetan,cephalexin, imipenem and timentin), quinolones (nalidixic acid, norfloxacin), chloramphenicol, nitro-furantoin, sulphafurazole, tetracycline, and trimethoprim.
Detection and classification of integrons and gene cassettes
Methods used to extract bacterial DNA and detect integrons were as previously described by ourgroup.14,21 Briefly, integrons were detected using polymerase chain reaction (PCR), with primerstargeting conserved regions of integron-encoded integrases intI1, intI2, and intI3.14,21 Integrase PCRproducts were subjected to restriction fragment length polymorphism (RFLP) analysis, using HinfI andRsaI to determine integron class as previously described.14 Gene cassette regions were amplified byPCR and characterised by sequencing and RFLP.14,21 Analysis of sequence data was performed usingprograms provided in WebANGIS, by the Australian National Genomic Information Service.

S106 Antimicrobial Resistance in Australia
Results
Resistance profiles
All strains tested were resistant to ampicillin, while 18 of 19 (95%) organisms were resistant tocefotaxime, 17 of 19 (89%) organisms were resistant to cephalexin, streptomycin, tobramycin andnitrofurantoin (Table 2). Most strains were susceptible to imipenem, with only 37 per cent oforganisms resistant to this antibiotic (Table 2). All strains were resistant to at least 50 per cent ofthe range of antibiotics tested and one strain, Acinetobacter baumanii INSJ18, was resistant to allantibiotics tested (data not shown).
Table 2. Percentage of organisms resistant to antibiotics tested
Antibiotic Resistant organisms%
Amikacin 63
Gentamicin 79
Kanamycin 84
Netilmicin 68
Streptomycin 89
Tobramycin 89
Ampicillin 100
Augmentin 74
Cefotaxime 95
Cefotetan 47
Cephalexin 89
Imipenem 37
Timentin 84
Nalidixic acid 68
Norfloxacin 58
Chloramphenicol 84
Nitrofurantoin 89
Sulphafurazole 74
Tetracycline 79
Trimethoprim 74
Integron detection and classification
Organisms were screened for the presence of integrase genes by PCR in order to determine theprevalence of integrons in the multi-resistant collection. Nine of 19 (47%) strains contained at leastone integron. RFLP analysis revealed that six isolates contained a single class 1 integron, one straincontained two class 1 integrons, one strain contained both a class 1 and a class 2 integron, and inone other strain, a single class 2 integron was detected (Table 3). Class 3 integrons were not detectedin this study.

Antimicrobial Resistance in Australia S107
Res
ista
nt t
o an
tibi
otic
s*
Str
ain
Cas
sett
es c
onta
ined
by
Cas
sett
es c
onta
ined
by
AK
CN
KN
ETS
TOB
AM
PSF
Win
tegr
on 1
†in
tegr
on 2
†
P. m
irabi
lisIN
SJ0
4aa
cA4
, aa
cC1
, or
fXa,
dfrA
1,
sat1
, aa
dA1‡
RR
RR
RR
RR
Ror
fXb,
aad
A1
P. m
irabi
lisIN
SJ1
0df
rA1,
sat1
, aa
dA1‡
–R
RR
RR
RR
RR
Kle
bsie
llasp
. IN
SJ1
1ox
a1,
aadA
1–
SR
RR
RR
RR
R
K.
pneu
mon
iae
INS
J16
aadB
–R
RR
RS
RR
RS
P. m
irabi
lisIN
SJ2
0aa
cA4
, ox
a2,
orfD
aadB
, aa
dA1
SR
RR
RR
RR
R
E. c
oliI
NS
J21
dfrA
1,
aadA
1–
RS
SS
RS
RR
R
S.
typh
imur
ium
IN
S9
5aa
dA2
–S
RS
SR
RR
RS
C.
freu
ndii
INS
TR2
NA
–R
SR
RR
RR
RR
E. c
loac
eae
INS
TR5
aadA
1–
RR
RR
RR
RS
S
*Abb
revi
atio
ns g
iven
as
stan
dard
Cal
ibra
ted
Dic
hoto
mou
s S
ensi
tivi
ty c
odes
: AK
am
ikac
in;
CN
gen
tam
icin
; K
kan
amyc
in;
NET
net
ilmic
in;
S s
trep
tom
ycin
; TO
B t
obra
myc
in;
AMP
ampi
cilli
n;S
F su
lpha
fura
zole
; W
trim
etho
prim
. R
esis
tanc
e (R
) an
d se
nsitiv
ity
(S)
are
base
d on
int
erpr
etat
ion
of t
he C
alib
rate
d D
icho
tom
ous
Sen
sitivi
ty m
etho
d of
sen
sitivi
ty t
esting
. R
esis
tanc
eph
enot
ypes
enc
oded
by
inte
gron
-ass
ocia
ted
resi
stan
ce g
enes
are
und
erlin
ed.
†Ar
bitr
arily
den
oted
as
inte
gron
1 a
nd 2
in
the
case
of
stra
ins
cont
aini
ng m
ore
than
one
int
egro
n. C
asse
ttes
are
ind
icat
ed a
s in
sert
ed i
nto
the
inte
gron
fro
m 5
’ to
3’.
NA:
not
am
plifi
ed.
‡C
lass
2 int
egro
ns a
re ind
icat
ed in
bold
typ
e.
Tabl
e 3.
Inte
gron
cas
sett
e ar
rays
and
inte
gron
-ass
ocia
ted
anti
biot
ic r
esis
tanc
e pr
ofile
s of
inte
gras
e po
siti
ve o
rgan
ism
s

Gene cassette characterisation
Analysis of the cassette regions revealed class 1 integrons contained between one and five differentgene cassettes (Table 3). Class 2 integrons contained the three gene cassettes associated with Tn7,namely dfrA1 (trimethoprim resistance),22 sat1 (streptothricin resistance)4 and aadA1(streptomycin/spectinomycin resistance).23 A predominance (15/23) of gene cassettes wereidentified that confer resistance to the aminoglycosides (Table 3). These cassettes were identified asaadA1 and aadA2,24 aadB ( resistance to gentamicin, kanamycin and tobramycin),12 aacA4 ( resistanceto amikacin, netilmicin and tobramycin),25 and aacC1 ( resistance to gentamicin, astromicin andsisomicin).26 Gene cassettes conferring resistance to trimethoprim (dfrA1) and the ß-lactams (oxa1and oxa2) (i.e., oxacillin and ampicillin resistance)27,28 were also identified (Table 3). Resistanceconferred by the gene cassette correlated with phenotypic resistance as determined by susceptibilitytesting (Table 3). In addition, all strains containing a class 1 integron with the exception ofEnterobacter cloaceae INSTR5, were resistant to sulphonamides (Table 3). This sulfonamide resistanceis probably due to the presence of a sul1 gene that is nearly always found downstream of the cassettearray in class 1 integrons.
Discussion
Integrons have been recognised as important contributors to antibiotic susceptibility profile of Gram-negative isolates.14,15,16,17,18,19 Nine of 19 (47%) multi-resistant Gram-negative clinical isolatescontained at least one integron, and 2 of 19 (11%) strains contained two integrons. The proportion ofstrains in this collection of bacteria carrying integrons is comparable to other studies. For example,49 per cent of 120 urinary isolates of Enterobacteriaceae in Sydney were found to carry integrons,14
52 per cent of 54 clinical isolates of E. coli in Taiwan,15 and 43 per cent of 163 Gram-negative isolatesin European hospitals contained class 1 integrons.18
Integrons have not only been found in isolates from human infection. They have also been reported inenvironmental and animal isolates, for example, integrons have been reported in bacteria fromdiseased poultry,29 fish,30 pigs and cattle31 and retail ground meats.32 Thus, there is potential for thetransfer of integron-carrying bacteria from these sources to humans.
Up to 50 per cent of multi-resistant strains of A. baumanii have been previously reported to carry class1 and 2 integrons.33 However, integrons were not detected in the four strains of Acinetobacter baumaniiin this study although they were resistant to most antibiotics tested (data not shown). These strains,along with the 53 per cent of bacteria that were integron negative, demonstrate that althoughintegrons are significantly associated with a multi-resistance phenotype,14 multi-resistance in someisolates appears to be mediated by other mechanisms.
In 2000, an outbreak of shigellosis spread rapidly through a community of homosexual men in Sydneyand was attributed to a Shigella sonnei biotype g strain.34 Retrospective PCR screening of outbreakstrains by our group revealed that they all harboured class 2 integrons that contain resistance genesto streptomycin, streptothricin and trimethoprim.34 This study highlighted the need for improvedcontrol of the spread of resistance-carrying bacteria and demonstrates usefulness of molecularscreening techniques for rapid identification of resistance genes. Information provided could havebeen used to alter the continuation of ineffective antibiotic treatments that occurred during theoutbreak.
Integron-screening and gene cassette characterisation can potentially be utilised as a rapid PCR-based method of resistance profile analysis that allows the identification of genetic resistancedeterminants. Integrons are a marker for multi-resistance, hence integron screening can be used topredict phenotypic antibiotic resistance. The presence of integrons in clinical isolates is of concerndue to their ability to capture further gene cassettes. This gives the host organism the potential toacquire resistance against a wide variety of antibiotics, since gene cassettes exist to nearly allclasses of antibiotic. Additionally, integron-screening provides the potential for identification of new
S108 Antimicrobial Resistance in Australia

Antimicrobial Resistance in Australia S109
resistance gene cassettes, demonstrated by characterisation of two novel gene cassettes aadA5 anddfrA17 by our group in 2000.35 In the present study of Gram-negative multi-resistant bacteria, we havefound that integrons contribute considerably to the resistance profiles of nearly 50 per cent of theseorganisms. This information complements antibiotic resistance surveillance programs, providinginformation on the molecular mechanisms of resistance in addition to elucidating means of resistancegene acquisition.
Acknowledgments
We are grateful to Professor Sydney Bell, Dr Jeannette Pham and Dr Barrie Gatus, Antibiotic ReferenceLaboratory, Department of Microbiology (SEALS), Prince of Wales Hospital, for the provision of strainsused in this study.
References
1. Hall RM, Collis CM. Antibiotic resistance in Gram-negative bacteria—the role of gene cassettes and integrons.Drug Resist Updat 1998;1:109–119.
2. Stokes HW, Hall RM. A novel family of potentially mobile DNA elements encoding site-specific gene-integrationfunctions: integrons. Mol Microbiol 1989;3:1669–1683.
3. Hall RM, Collis CM. Mobile gene cassettes and integrons: capture and spread of genes by site-specific recom-bination. Mol Microbiol 1995;15:593–600.
4. Wohllenben W, Arnold W, Bissonnette L, Pelletier A, Tanguay A, Roy PH, et al. On the evolution of Tn21-likemultiresistant transposons: sequence analysis of the gene (aacC1) for gentamicin acetyltransferase-3–I(AAC–(3)–I), another member of the Tn21-based expression cassette. Mol Gen Genet 1989;217:202–208.
5. Bissonnette L, Champetier S, Buisson JP, Roy PH. Characterisation of the nonenzymatic chloramphenicolresistance (cmlA) gene of the In4 integron of Tn1696: Similarity of the product to transmembrane transportproteins. J Bacteriol 1991;173:4493–4502.
6. Hall RM, Brookes DE, Stokes HW. Site-specific insertion of genes into integrons: role of the 59-base element anddetermination of the recombination cross-over point. Mol Microbiol 1991;5:1941–1959.
7. Collis CM, Hall RM. Gene cassettes from the insert region of integrons are excised as covalently closed circles.Mol Microbiol 1992;6:2875–2885.
8. Collis CM, Hall RM. Site-specific deletion and rearrangement of integron insert genes catalysed by the integronDNA integrase. J Bacteriol 1992;174:1574–1585.
9. Collis CM, Grammaticopoulos G, Briton J, Stokes HW, Hall RM. Site-specific insertion of gene cassettes intointegrons. Mol Microbiol 1993;9:41–52.
10. Recchia GD, Stokes HW, Hall RM. Characterisation of specific and secondary recombination sites recognised bythe integron DNA integrase. Nucleic Acids Res 1994;22:2071–2078.
11. Naas T, Mikami Y, Imai T, Poirel L, Nordmann P. Characterisation of In53, a class 1 plasmid-and compositetransposon-located integron of Escherichia coli which carries an unusual array of gene cassettes. J Bacteriol2001;183:235–249.
12. Cameron FH, Groot Obbink DJ, Ackerman VP, Hall RM. Nucleotide sequence of the AAD(2'') aminoglycosideadenylyltransferase determinant aadB. Evolutionary relationship of this region with those surrounding aadA inR538–1 and dhfrII in R388. Nucleic Acids Res 1986;14:8625–8635.
13. Collis CM, Hall RM. Expression of antibiotic resistance genes in the integrated cassettes of integrons. AntimicrobAgents Chemother 1995;39:155–162.
14. White PA, McIver CJ, Rawlinson WD. Integrons and gene cassettes in the Enterobacteriaceae. Antimicrob AgentsChemother 2001;45:2658–2661.
15. Chang C, Chang L, Chang Y, Lee T, Chang S. Characterisation of drug gene cassettes associated with class 1integrons in clinical isolates of Escherichia coli from Taiwan, ROC. J Med Microbiol 2000;49:1097–1102.

16. Lee JC, Oh JY, Cho JW, Park JC, Kim JM, Seol SY, et al. The prevalence of trimethoprim-resistance-conferringdihydrofolate reductase genes in urinary isolates of Escherichia coli in Korea. J Antimicrob Chemother2001;47:599–604.
17. Levesque C, Piche L, Larose C, Roy PH. PCR mapping of integrons reveals several novel combinations ofresistance genes. Antimicrob Agents Chemother 1995;39:185–191.
18. Martinez-Freijo P, Fluit AC, Schmitz FJ, Grek VSC, Verhoef J, Jones ME. Class I integrons in Gram-negative isolatesfrom different European hospitals and association with decreased susceptibility to multiple antibiotic compounds.J Antimicrob Chemother 1998;42:689–696.
19. Senda K, Arakawa Y, Ichiyama S, Nakashima K, Ito H, Ohsuka S, et al. PCR detection of metallo-beta-lactamasegene (blaIMP) in gram-negative rods resistant to broad-spectrum ß -lactams. J Clin Microbiol 1996;34:2909–2913.
20. Bell SM, Gatus BJ, Pham JN. Antibiotic susceptibility testing by the CDS method. A concise laboratory manual.Arthur Productions Pty Ltd, Sydney. NSW: The antibiotic reference laboratory, South Eastern Area LaboratoryServices; 1999.
21. White PA, McIver CJ, Deng YM, Rawlinson WD. Characterisation of two new gene cassettes, aadA5 and dfrA17.FEMS Microbiol Lett 2000;182:265–269.
22. Fling ME, Richards C. The nucleotide sequence of the trimethoprim-resistant dihydrofolate reductase geneharbored by Tn7. Nucleic Acids Res 1983;11:5147–5158.
23. Sundstrom L, Radstrom P, Swedberg G, Skold O. Site-specific recombination promotes linkage betweentrimethoprim– and sulfonamide resistance genes. Sequence characterization of dhfrV and sulI and a recombinationactive locus of Tn21. Mol Gen Genet 1988;213:191–201.
24. Bito A, Susani M. Revised analysis of aadA2 gene of plasmid pSa. Antimicrob. Agents Chemother1994;38:1172–1175.
25. Tolmasky ME. Sequencing and expression of aadA, bla, and tnpR from the multiresistance transposon Tn1331.Plasmid 1990;24:218–226.
26. Tenover FC, Phillips KL, Gilbert T, Lockhart P, O'Hara PJ, Plorde JJ. Development of a DNA probe from the deoxyri-bonucleotide sequence of a 3–N–aminoglycoside acetyltransferase [AAC(3)–I] resistance gene. Antimicrob AgentsChemother 1989;33:551–559.
27. Ouellette M, Bissonnette L, Roy PH. Precise insertion of antibiotic resistance determinants into Tn21–liketransposons: nucleotide sequence of the oxa–1 ß -lactamase gene. Proc Natl Acad Sci USA 1987;84:7378–7382.
28. Hall RM, Vockler C. The region of the IncN plasmid R46 coding for resistance to ß -lactam antibiotics,streptomycin/spectinomycin and sulphonamides is closely related to antibiotic resistance segments found inIncW plasmids and in Tn21-like transposons. Nucleic Acids Res 1987;15:7491–7501.
29. Bass L, Liebert CA, Lee MD, Summers AO, White DG, Thayer SG, et al. Incidence and characterisation ofintegrons, genetic elements mediating multiple-drug resistance, in avian Escherichia coli. Antimicrob AgentsChemother 1999;43:2925–2929.
30. Schmidt AS, Bruun MS, Larsen JL, Dalsgaard I. Characterisation of class 1 integrons associated with R-plasmidsin clinical Aeromonas salmonicida isolates from various geographical areas. J Antimicrob Chemother2001;47:735–743.
31. Sandvang D, Aarestrup FM. Characterisation of aminoglycoside resistance genes and class 1 integrons in procineand bovine gentamicin-resistant Escherichia coli. Microb Drug Resist 2000;6:19–27.
32. White DG, Zhao S, Sudler R, Ayers S, Friedman S, Chen S, et al. The isolation of antibiotic-resistant Salmonellafrom retail ground meats. N Engl J Med 2001;345:1147–1154.
33. Koeleman JG, Stoof J, Van der Bijl MW, Vadenbrouke-Grauls CMJE, Savelkoul PHM. Identification of epidemicstrains of Acinetobacter baumanii by integrase gene PCR. J Clin Microbiol 2001;39:8–13.
34. McIver CJ, White PA, Jones LA, Karagiannis T, Harkness J, Marriott D, et al. Epidemic strains of Shigella sonneiBiotype g carrying integrons. J Clin Microbiol 2002;40:1538–1540.
35. White PA, Rawlinson WD. Current status of the aadA and dfr gene cassette families. FEMS Microbiol Lett2001;182:265–269.
S110 Antimicrobial Resistance in Australia

Antimicrobial Resistance in Australia S111
Towards a national surveillance program for antimicrobial resistance in animals
and animal-derived foodJonathan Webber, Angelo Valois
AbstractOne of the major recommendations of the JETACAR report was that a comprehensive nationalsurveillance system be established to measure antimicrobial resistance to cover medical, food-producing and veterinary areas. While there are a number of existing passive surveillance programson a national, regional and state basis in the medical field, there are few analogous programs in theveterinary area, and none with a particular emphasis on the food chain. The CommonwealthInterdepartmental JETACAR Implementation Group is working with stakeholders to develop this aspectof the national surveillance program based on the Guidelines published by the world organisation foranimal health, the Office International des Épizooties. Commun Dis Intell 2003;27 Suppl:S111–S116.
Keywords: antimicrobiotic resistance, surveillance programs
Introduction
The Joint Expert Technical Advisory Committee on Antibiotic Resistance (JETACAR) made 22recommendations1 for an antimicrobial resistance management program that focuses on the use ofantimicrobials in both animals and humans. The proposed program covers regulatory controls;monitoring and surveillance; infection prevention strategies; education; and research; communication;and implementation.
A key component of the national program is monitoring and surveillance for antimicrobial resistance—this was addressed in recommendation 10:
'That a comprehensive surveillance system be established to measure antibiotic-resistance covering allareas of antibiotic use, including medical, food-producing animal and veterinary areas. Where possible,this should use, enhance and extend currently available systems and organisational structures'.
The Commonwealth Government response to the report in August 2000 largely supported theJETACAR recommendations and supported the development of a national antimicrobial resistancemanagement program.2 An important component of the Government’s response was to institute areview of existing systems of surveillance and monitoring of antimicrobial resistant bacteria in thehuman and animal health fields. Tenders were advertised in February 2001 and contractors have beenworking with departmental officers in the Commonwealth as well as holding consultations withindustry and State government stakeholders to develop a national antimicrobial surveillance program.
The consultations identified few antimicrobial resistance surveillance programs in the veterinary areathat could be readily adapted into a national surveillance program. There is limited passivesurveillance of veterinary pathogens via diagnostic submissions, some passive surveillance ofzoonotic organisms (Salmonella) and some targeted surveillance undertaken by some industries. Themain limitations to using existing veterinary data as the basis of a national program are:
• the existing antimicrobial susceptibility test data has not been generated using standardised testmethods;
Correspondence: Dr Jonathan Webber, Principal Research Scientist, Office of the Chief Veterinary Officer, Department ofAgriculture, Fisheries and Forestry—Australia, GPO Box 858, Canberra ACT 2601. Telephone: +61 2 6272 5975. Facsimile: +61 2 6272 3150. Email: [email protected]

• most of the available data are for antimicrobial resistance in clinically significant animal pathogenscovering therapeutic antimicrobials used in veterinary medicine;
• there is a lack of data on resistance in commensal bacteria and to those antimicrobials that areused for growth promotant purposes and for some classes of antimicrobials that are not used infood animals in Australia (e.g., fluoroquinolones), but for which resistance is a particular humanhealth concern.
Monitoring and surveillance of antimicrobial resistance derived from the veterinary and agriculturaluse of antimicrobials will require a new approach. Existing systems are unlikely to meet the animalhealth and welfare requirements of the animal industries and do not address the public healthconcerns about resistance that originates from antimicrobial use in animals.
International monitoring and surveillance programs
A number of programs have been instituted in other countries in the past 10 years.
DANMAP (Denmark)3
DANMAP which is a collaborative project between the Danish Veterinary Laboratory, the DanishVeterinary and Food Administration, the Statens Serum Institut and the Danish Medicines Agencycommenced in 1995. Annual reports cover antimicrobial resistance in bacteria from humans, food andfood animals as well as statistics on the consumption of antimicrobials in humans and animals.
National Antimicrobial Resistance Monitoring System (USA)4
The National Antimicrobial Resistance Monitoring System was established in 1996 as a collaborativeproject involving the Food and Drug Administration’s Center for Veterinary Medicine, US Departmentof Agriculture and the Centers for Disease Control and Prevention. The program monitors changes inthe susceptibilities of human and animal enteric bacteria to a range of antimicrobials. It is designedto address equally the human and the animal components with bacterial isolates collected from humanand animal clinical specimens, from healthy farm animals and from raw products derived from foodanimals.
Swedish Veterinary Antimicrobial Resistance Monitoring (Sweden)5
The Swedish Veterinary Antimicrobial Resistance Monitoring program focuses on both antimicrobialusage statistics as well as on resistance of bacteria of animal origin. To obtain samples representativeof the animal population, the number collected at each abattoir is determined in proportion to thenumber of animals slaughtered at the abattoir each year.
RESABO (France)6
RESABO is a network of regional veterinary laboratories in France. The program is managed by acentral reference laboratory (CNEVA, Lyon). Features of the program include standardised methods forall laboratories, collation and reporting of data on resistance and undertaking specific studies onmechanisms for resistance.
The appropriate aspects of these programs, together with the international standard developed by theworld organisation for animal health, the Office International des Épizooties (OIE), could form the basisfor the design of an Australian program.
S112 Antimicrobial Resistance in Australia

Antimicrobial Resistance in Australia S113
The international standard
The OIE is the international standards setting organisation recognised by the World Trade Organizationfor the elaboration of international standards, guidelines and recommendations on matters of animalhealth and zoonoses relevant for trade in animals and animal products. The OIE has produced a numberof guideline documents7 outlining a comprehensive strategy that can form the blueprint for membercountries to manage antimicrobial resistance arising from the agricultural and veterinary use of anti-microbials. The guidelines cover:
• risk analysis methodology for the potential impact on public health of antimicrobial resistantbacteria of animal origin;
• prudent and responsible use of antimicrobial agents in veterinary medicine;
• monitoring the quantities of antimicrobials used in animal husbandry;
• standardisation and harmonisation of laboratory methodologies used for the detection and quantifi-cation of antimicrobial resistance; and
• harmonisation of national antimicrobial resistance monitoring and surveillance programs in animalsand animal derived food.
Application of the OIE Guideline on monitoring and surveillance toAustralia
The OIE Guideline was developed by an ad hoc group of experts on antimicrobial resistance of the OIE.The objective is to allow the generation and consolidation of comparable results on a national leveland to compare the situations on a national, regional and international level. National systems shouldbe able to detect the emergence of resistance and to determine the prevalence of resistant bacteria.The resulting data can then be used in the assessment of risks to public health and form the basis ofrisk management policy. Specific factors identified for harmonisation include antimicrobial usagepatterns, animal species, food commodities, bacterial species, antimicrobials to be tested, laboratorymethods, and data reporting.
Risk assessment
A comprehensive risk assessment should take account of agricultural production systems, animalhusbandry and antimicrobial usage patterns in Australia. This, together with the subsequent issuesdiscussed in this paper, will be used in the development of a surveillance program for antimicrobialresistance of food-animal origin.
Antimicrobial usage patterns
Acquired antimicrobial resistance arises from the selection pressure exerted on bacteria by anti-microbials in their immediate environment. The types of antimicrobials used and the extent, quantitiesand patterns of their use should be taken into account in designing a surveillance program.Mechanisms to collect these data objectively are needed.
Animals to be sampled
A risk assessment should take account of the relative importance of the various categories oflivestock in potentially contributing to antimicrobial resistance. A key consideration will be knowledgeof antimicrobial use patterns in the various livestock industry sectors. Categories of livestock thatshould be considered for sampling include cattle and calves, slaughter pigs, broiler chickens, layerhens, and farmed aquatic animals.

S114 Antimicrobial Resistance in Australia
Food to be sampled
Contaminated food is the principal route of transmission of antimicrobial resistance from animals tohumans, either by pathogens or by transfer of resistance genes carried by commensal bacteria. Theearlier in the processing chain that samples can be taken, the more likely it is that susceptibility testresults can be associated with on-farm management issues.
Sampling strategies
Once the objectives of any program are decided, an early decision is whether reliance can be made onexisting passive surveillance programs (usually based on data from veterinary diagnosticsubmissions), whether existing programs need to be modified or whether a new active surveillanceprogram should be undertaken to meet the objectives.
The sampling strategy should ensure the representativeness of the population of interest. Options forsampling8 are simple random, random systematic, stratified random collection (e.g., by age group orproduction system) or purposive sampling (targeted at specific groups e.g., cull dairy cows) withrandom sampling within each group. If the sampling strategy is robust then use of statistically basedsample sizes will allow a more accurate estimate of the prevalence of antimicrobial resistance in thepopulation of interest.
Some knowledge of the expected prevalence of resistance will allow decisions to be made on thenumber of samples that will be required to give the desired level of precision of the prevalenceestimate. For example, if the expected prevalence in a large population were 10 per cent, then thenumber of samples required to give a statistically valid estimate of the prevalence with 5 per centprecision and 95 per cent level of confidence would be 138 samples.
Sample specimens to be collected
Ideally samples should be taken on-farm. While this may be an option for individual sick animals, themost practical point of sampling is at the abattoir or processing plant where animals from a numberof properties can be sampled over a relatively short period of time. In these circumstances, the bestspecimen for investigating resistance is faeces (10–50 gm) in livestock and whole caeca in poultry.If the interest is surveillance of resistance in the food chain after slaughter, then tissue or swabsamples should be taken from the carcass or food product.
Bacteria to be tested
The bacteria of interest are listed in Table 1 and can be divided into three groups.
Table 1. Bacteria for potential inclusion in a surveillance program
Target animals Pathogens Zoonotics Commensals
Cattle Pasteurella spp. Salmonella spp. Escherichia coliHaemophilus somnus Enterococcus faecium/faecalisStaphylococcus aureusStreptococcus agalactiae/uberis
Pigs Actinobacillus pleuropneumoniae Salmonella spp. Escherichia coliBrachyspira Enterococcus faecium/faecalisStreptococcus suis
Poultry Escherichia coli Campylobacter Escherichia coliSalmonella spp. Enterococcus faecium/faecalis
Fish Vibrio spp.Aeromonas spp.
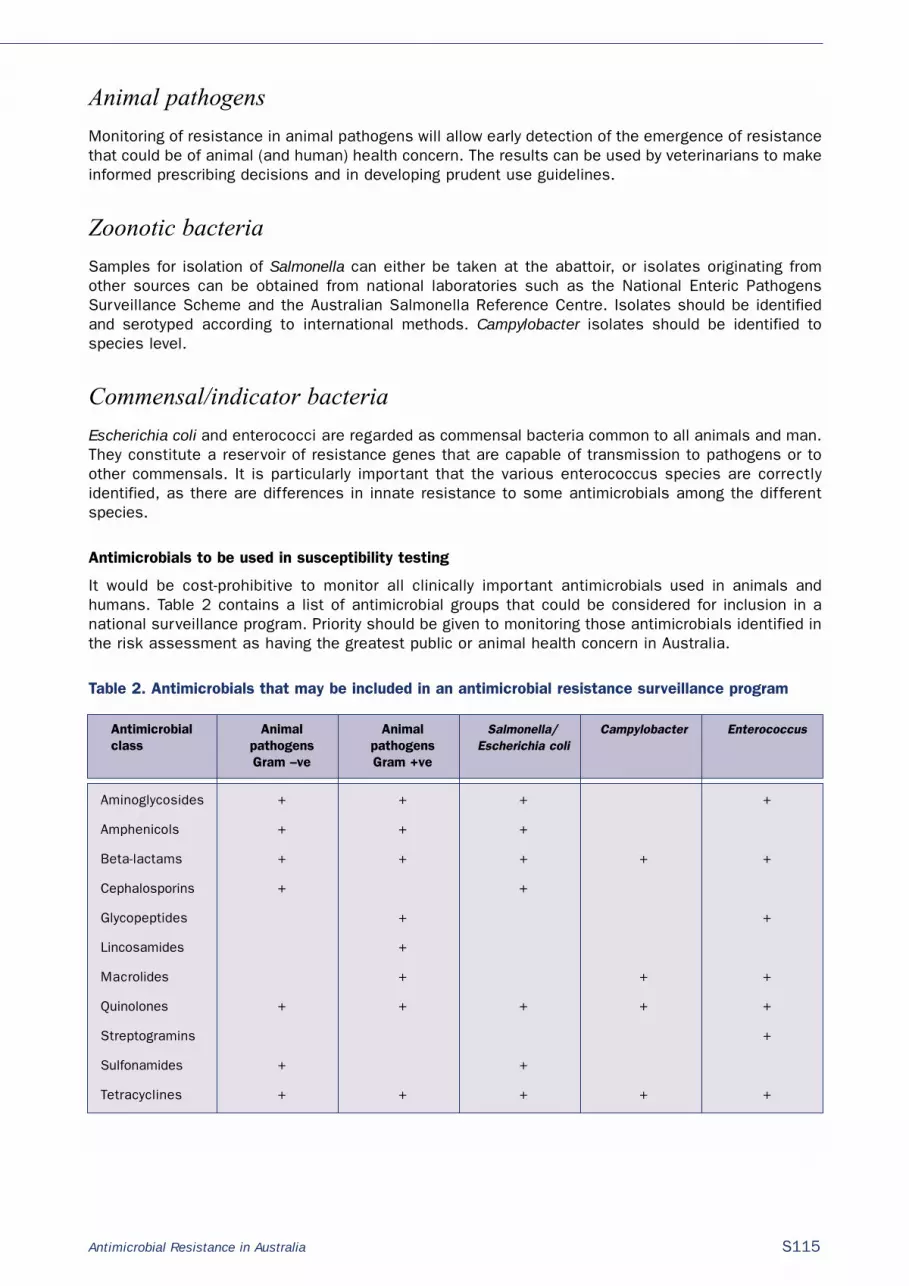
Antimicrobial Resistance in Australia S115
Animal pathogens
Monitoring of resistance in animal pathogens will allow early detection of the emergence of resistancethat could be of animal (and human) health concern. The results can be used by veterinarians to makeinformed prescribing decisions and in developing prudent use guidelines.
Zoonotic bacteria
Samples for isolation of Salmonella can either be taken at the abattoir, or isolates originating fromother sources can be obtained from national laboratories such as the National Enteric PathogensSurveillance Scheme and the Australian Salmonella Reference Centre. Isolates should be identifiedand serotyped according to international methods. Campylobacter isolates should be identified tospecies level.
Commensal/indicator bacteria
Escherichia coli and enterococci are regarded as commensal bacteria common to all animals and man.They constitute a reservoir of resistance genes that are capable of transmission to pathogens or toother commensals. It is particularly important that the various enterococcus species are correctlyidentified, as there are differences in innate resistance to some antimicrobials among the differentspecies.
Antimicrobials to be used in susceptibility testing
It would be cost-prohibitive to monitor all clinically important antimicrobials used in animals andhumans. Table 2 contains a list of antimicrobial groups that could be considered for inclusion in anational surveillance program. Priority should be given to monitoring those antimicrobials identified inthe risk assessment as having the greatest public or animal health concern in Australia.
Table 2. Antimicrobials that may be included in an antimicrobial resistance surveillance program
Antimicrobial Animal Animal Salmonella/ Campylobacter Enterococcusclass pathogens pathogens Escherichia coli
Gram –ve Gram +ve
Aminoglycosides + + + +
Amphenicols + + +
Beta-lactams + + + + +
Cephalosporins + +
Glycopeptides + +
Lincosamides +
Macrolides + + +
Quinolones + + + + +
Streptogramins +
Sulfonamides + +
Tetracyclines + + + + +

S116 Antimicrobial Resistance in Australia
Standardised testing methods and quality control
A wide variety of antimicrobial sensitivity test (AST) methods are used around the world. The mostcommonly used methods are disk diffusion, broth dilution and agar dilution. Regardless of the ASTmethod used, all aspects of the method must be rigorously standardised to ensure accurate andreproducible results. Appropriate reference organisms should be included in every AST run as a qualitycontrol measure to ensure the accuracy of the test results. Where a number of laboratories areinvolved in a testing program, it is advisable that the same method is used in all laboratories and thatthe performance of laboratories is monitored through regular participation in a proficiency testingprogram.
Data collation and reporting
In choosing an AST method, it is preferable that the result can be recorded quantitatively (minimuminhibitory concentration in mg/Litre or inhibition zones in millimetres) rather than qualitatively as'resistant' or 'susceptible'. This will allow the early detection of emerging resistance and trends to befollowed. Consideration needs to be given to having the raw data sent to a central point for entry intoa national database to facilitate evaluation of the data in response to various questions and for thegeneration of regular reports for the information of national regulatory agencies and the public.
Conclusion
This paper has provided some background and made recommendations for factors to be considered inthe development of an antimicrobial resistance surveillance program for Australia. It may benecessary to develop the program in an incremental way based on priorities established through a riskassessment that considers animal husbandry conditions in Australia and their associated antimi-crobial use patterns.
References
1. Commonwealth Department of Health and Aged Care. Joint Expert Advisory Committee on Antibiotic Resistance(JETACAR). The use of antibiotics in food-producing animals: antibiotic-resistant bacteria in animals and humans.Commonwealth Department of Health and Aged Care, Commonwealth Department of Agriculture, Fisheries andForestry—Australia. September 1999. Available from: http://www.health.gov.au/pubs/jetacar.pdf.
2. Commonwealth Department of Health and Aged Care. Commonwealth Government response to the report of theJETACAR. Commonwealth Department of Health and Aged Care, Commonwealth Department of Agriculture,Fisheries and Forestry—Australia. August 2000. Available from: http://www.health.gov.au/pubhlth/publicat/document/jetacar.pdf.
3. Danish Veterinary Institute. The Danish Integrated Antimicrobial resistance Monitoring and Research Programme(DANMAP) 2001. Available from: http://www.vetinst.dk/high_uk.asp?page_id=180.
4. US Food and Drug Administration. National Antimicrobial Resistance Monitoring System. US Food and DrugAdministration, Center for Veterinary Medicine. Available from: http://www.fda.gov/cvm/index/narms/narms_pg.html.
5. National Veterinary Institute of Sweden. Swedish Veterinary Antimicrobial Resistance Monitoring, 2001. NationalVeterinary Institute, Uppsala, Sweden. Available from: http://www.sva.se/dokument/stdmall.html?id=341&lang=e.
6. Martel J-L, Brisabois A, Tardy F, Chaslus-Dancla E. The French Antibiotic Resistance Monitoring Programmes.Antibiotic Resistance in Bacteria from Animal Origin, Concerted action FAIR5-CT97-3654. European Symposium.Institut Pasteur Paris 29–30 November 1999. French Agency for Food Safety. Available from:http://www.fougeres.afssa.fr/arbao/martel.html.
7. Office International des Épizooties. OIE guidelines. 2nd OIE International Conference on Antimicrobial Resistance.Use of antimicrobials and protection of public health. 2001. Available from: http://www.anmv.afssa.fr/oiecc/conference/guidelines.htm.
8. Graat EAM, Frankena K, Bos H. Principles and methods of sampling in animal disease surveys. In: NoordhuizenJPTM, Frankena K, Van der Hoofd CM, Graat EAM editors. Application of Quantitative Methods in VeterinaryEpidemiology. Wageningen, The Netherlands: Wageningen Press, 1997:33–36.

Antimicrobial Resistance in Australia S117
Surveillance for antibiotic resistant Escherichia coli in food animals
David Jordan
AbstractA successful surveillance program for antibiotic resistant Escherichia coli in Australia should accountfor the heterogenous nature of the food-animal population. Studies that rely on measurements madeon several hundred isolates can only satisfy limited objectives because they risk imprecise and biasedestimation of the presence and distribution of resistance traits. Observations on a larger number ofisolates are needed to ensure animal, herd and region effects are adequately represented so thatfindings can be extrapolated to the appropriate population of interest. An efficient methodology formeasuring the resistance traits of a large number of isolates is described. Commun Dis Intell 2003;27Suppl:S117–S120.
Keywords: Escherichia coli, antibiotic resistance, food animals, livestock
Introduction
Generic indicator organisms such as Escherichia coli play a prominent role in many existingsurveillance systems for antibiotic resistance in animals.1 E. coli is regarded as a useful indicator ofantibiotic resistance in the bacterial flora of livestock and food because it responds to the selectivepressures of antibiotics, because it is ubiquitous in the gut of food animals, and because it readilypersists in raw foods and the environment. Individual E. coli isolates are easily studied in the laboratoryto yield results that can be interpreted using standard criteria. E. coli is therefore a strong candidatefor inclusion in future studies of the spatial and temporal distribution of antibiotic resistance inAustralian livestock and livestock products.
Practical considerations
Future surveillance systems for antibiotic resistance will need to allow for the extreme heterogeneitythat characterises livestock production in Australia. There are a plethora of animal species, animalbreeds and management systems located within many different climatic regions. Hence, food-animalproduction occurs in diverse environments resulting in variable degrees of exposure to possiblesources of resistant organisms (other herds or flocks, humans, wildlife and environmental contamination).Even at a particular locality and within a specific industry there can be large differences in husbandrypractices. Antibiotic usage patterns range from continuous inclusion of low-concentrations in rationsin some intensive production systems to extremely rare, highly selective or even absent in theextensive beef and sheep grazing industries.
The underlying complexity of the animal industries impacts on the ways in which surveillance forresistant E. coli could be conducted. In particular, the low profitability of some production systems andthe low monetary value of most individual animals explains why veterinary laboratories receive only asmall number of requests for antibiotic resistance testing of E. coli isolates from food animals.Moreover, the selective nature of veterinary diagnostic submissions means that the E. coli isolatesobtained from diagnostic testing are not likely to be representative of those entering the food chain.Thus, passively acquired data appear to be poorly suited to accommodating the complexity present inthe underlying population of E. coli derived from animals. Purposefully designed surveys of thelivestock population and livestock products are best suited to providing data forming a basis fornational policies.
Correspondence: Dr David Jordan, Senior Research Scientist, New South Wales Agriculture, Bruxner Highway Wollongbar NSW2477. Telephone: +61 2 6626 1240. Facsimile: +61 2 6628 1744. Email: [email protected]

S118 Antimicrobial Resistance in Australia
Implementation of active surveillance
Active surveillance for resistant E. coli in animal populations should be designed and analysed toaccount for the sources of variation in the population of isolates and valid confidence limits for theproportion of E. coli with a specific resistance trait can be generated. Confidence limits need only beas narrow as required by the study objectives which in turn should reflect how the surveillance findingswill contribute to decision making. It is also a requirement that the strength of association betweenrisk factors and the occurrence of resistance be estimated without bias. To meet these aims a numberof sampling issues need to be addressed. One of these is the requirement to test a sufficient numberof isolates, a sufficient number of animals, herds (flocks), and at a sufficient number of points in timeto allow firm inferences to be made about the distribution of resistance and sources of variation. Asecond requirement is the need to ensure that sampling is performed to account for the likely‘contagious’ or ‘clustered’ pattern of distribution of resistant isolates. A third consideration is todesign sampling methods that allow confidence interval estimates of prevalence to be produced thatare based on all of the sources of variation in the population. The latter requirement can usually besatisfied by using statistical techniques for estimation of variance components provided anappropriate study design is implemented.2 However, the first two of these requirements have hithertobeen difficult to satisfy because the high cost of assessing a large number of E. coli isolates hasrestricted the options available for study design. Thus, only small numbers of herds, productconsignments, or regions appear to be represented in most existing data and it is difficult toextrapolate the findings beyond those animals or products included in the study.
To illustrate the importance of sample size and sampling error one can make the simplifyingassumption that the resistance phenotypes of interest occur at random throughout the populations ofE. coli, animals and herds. The required sample size for estimating prevalence can then be calculatedfrom the binomial probability distribution. If the objective is to estimate the prevalence of tetracyclineresistance (at a particular concentration) amongst E. coli isolates from intensively-raised animals,such that the 95 per cent confidence limits are each within 5 per cent of the point estimate, thenabout 400 isolates would require evaluation (this assumes the expected prevalence is close to 50 percent — an assumption that is justified on the basis of published estimates from pigs and poultry,3,4,5
and because it is appropriate to err closer to 50 per cent to ensure a sufficient sample size). Therequired sample size is between 1.3 and 2 times greater that number relied upon in various nationalsurveys to assess the proportion of resistant E. coli from a single animal species or product.4,5,6
Moreover, this sample size calculation is probably an underestimate because it assumes that the onlyvariation is due to random error, that is, it takes no account of the likely non-random distribution ofresistance isolates in the population of interest.
‘Clustering’ (likeness amongst observations close in time or space) is a term used to describe thenon-random source of variation that is commonly associated with the distribution of infectious agentsor disease events. In the case of antibiotic resistance in animal populations, clustering could feasiblybe induced by a range of determinants of resistance (known or unknown) such as exposure toantibiotics in rations or exposure to human effluent contaminating the environment. In veterinaryepidemiology clustering is often exaggerated because of the way that animals are managed incommercial units (herds or flocks), and by the way that herds and flocks at a similar geographiclocation tend to have a common set of risk factors.7 Sometimes clustering occurs for no obviousreason and this has been shown to be the case for the clustering of particular resistant E. coliphenotypes within individual pigs housed in the same pen.8 The pervasiveness of clustering preventsthe indiscriminate use of binomial probabilities (or any approximations thereof) for generatingconfidence limits or sample sizes. Unfortunately, the estimation of sample sizes (number of isolates,number of animals, number of herds or flocks etc.) is difficult in the absence of any estimates ofvariance. The number of isolates required to be evaluated could be several times greater than what ispredicted by the approach described above. Consequently, during the initial phases of surveillancethere is a need to estimate components of variance attributable to the different levels of sampling(isolates, animals, herds, or flocks etc.) to aid in the design of subsequent sampling plans.

Antimicrobial Resistance in Australia S119
New methodology
To overcome the difficulties of study design and sampling, a laboratory technique for assessing largenumbers of E. coli isolates per specimen has been adopted in a pilot study of dairy cattle in north-eastern New South Wales. The aims are to develop methodology that could be used to efficiently studythe distribution of resistance in animals, humans and environmental samples. The approach has beenadapted from work on E. coli in pig populations in Canada3 and is based on hydrophobic grid membranefiltration (HGMF). Key elements of the procedure are: the growth of E. coli by filtering diluted animalfaeces through HGMF grids, incubation of grids on selective agar, replication of colonies onto HGMFgrids that are either incubated on chromogenic agar (for E. coli identification) or on agar containingantibiotics and made to standard specifications.9 The final and critical step for achieving economy ofscale is to use computer software to perform image analysis of HGMF grids to detect the growth ofE. coli, to compute multiple resistance patterns for each isolate, and to incorporate the findings foreach specimen in a surveillance database. The process is summarised in the Table.
Table. Summary of steps performed during antibiotic resistance testing of Escherichia coli derived fromcattle faeces using the HGMF procedure and image analysis
Step 1. Fresh cattle faeces obtained during farm visits.
Step 2. Tenfold serial dilution of specimens prepared and stored.
Step 3. Preliminary estimation of the concentration of E. coli per gram of faeces determined by spread plate or HGMF enumeration technique.
Step 4. A master HGMF grid is produced by filtering an appropriate volume of diluted cow faeces to provide100 to 200 colonies following incubation.
Step 5. Colonies are replicated from the master grid onto grids placed on chromogenic agar for presumptive identification of E. coli.
Step 6. Colonies are replicated from the master grid onto grids placed on agar containing antimicrobials at National Centre for Clinical Laboratory Standards (NCCLS) recommended concentrations. A copy is also placed on agar containing no antimicrobials.
Step 7. Chromogenic, antimicrobial and control agar plates are incubated overnight.
Step 8. Consistent interpretation of colony growth is achieved by capturing digital images of HGMF grids and analysing using specific software.
Step 9. Collation and standardised reporting of single and multiple resistance traits is achieved within the software.
The advantages of the HGMF approach are that it can be used to appraise single and multipleresistance traits of up to 200 colonies per specimen. The use of image analysis provides a standardinterpretation of results and avoids errors encountered with manual data recording. In the New SouthWales study this has enabled deployment of a study design for deriving variance components followedby calculation of intracluster (intra-herd) correlation. The latter is useful for quantifying the extent oflikeness within groups (in this case the clustering of E. coli resistance trait within herds of cattle)which impinges on the interpretation and analysis of data and is of interest in the design of futurestudies.10 The study will also provide prevalence estimates (proportion of isolates, proportion of herds)for single and multiple resistance traits for four antibiotics (gentamycin, ampicillin, tetracycline andsulfamethoxazole) at NCCLS ‘intermediate’ concentrations9 based on observations made on approx-imately 10,000 isolates from 30 randomly-selected dairy herds. Test-retest reliability11 is also beingevaluated on pooled faecal samples from 20 dairy farms. Overall, the study will help generate thestatistical assumptions required for a more comprehensive survey of livestock. The Figure summarisesthe design of this study.
Conventional approaches to surveillance for antimicrobial resistance in livestock and food usually relyon disk diffusion, agar dilution or broth dilution techniques. These methods are suited to compre-hensive screening of individual isolates against a large number of drugs and drug concentrations. Theyare often chosen because they can provide data for commensals, animal pathogens, and zoonoticpathogens that can be compared to the data being obtained for human pathogens. Furthermore,because many technicians are familiar with these methods they are a convenient basis for standard-isation of measurement systems. However, because these techniques are costly on a per isolate basisthey are less appealing for ecological and population based studies that demand the evaluation ofresistance traits of a large number of indicator organisms, such as E. coli.

S120 Antimicrobial Resistance in Australia
Figure. Design of the pilot study for assessing prevalence of resistance, intra-herd clustering, andtest-retest reliability
Although there is no limit to the number of antibiotics or concentrations that may be evaluated in theHGMF resistance test, restricting the number of antibiotics avoids the difficulty of having to interpretdata for a large number of resistance patterns (if a is the number of antibiotics evaluated then the testproduces information on 2a resistance patterns). HGMF resistance testing is therefore suited toscreening a very large number of isolates against a panel of the most important antibiotics. It isattractive to combine HGMF testing with other research on the biology of resistance by removing asub-sample of screened isolates for more detailed analysis by conventional resistance tests ormolecular techniques.
References1. Wray C, Gnanou JC. Antibiotic resistance monitoring in bacteria of animal origin: analysis of national monitoring
programmes. Int J Antimicrob Agents 2000;14:291–294.
2. Littell RC, Milliken GA, Stroup WW, Wolfinger RD. SAS system for mixed models. Cary, N.C.: SAS Institute Inc.;1996.
3. Dunlop RH, McEwen SA, Meek AH, Clarke RC, Friendship RM, Black WD et al. Measurement of antimicrobial-resistant Escherichia coli in pig feces with a hydrophobic grid membrane filter interpreter system. Appl EnvironMicrobiol 1998;64:366–369.
4. Barton MD, Wilkins J. Antibiotic resistance in bacteria isolated from poultry. Canberra: Rural Industries Researchand Development Corporation; 2001.
5. Barger F Editor. DANMAP 99 — Consumption of antimicrobial agents and occurrence of antimicrobial resistancein bacteria from food animals, food and humans in Denmark. Copenhagen: Danish Veterinary Laboratory; 1999.
6. Bengtsson B, Franklin A, Greko C, Karlsson MWC. SVARM 2000 — Swedish veterinary antimicrobial resistancemonitoring. Uppsala: National Veterinary Institute, Sweden.
7. Bohning D, Greiner M. Prevalence estimation under heterogeneity in the example of bovine trypanosomosis inUganda. Prev Vet Med 1998;36:11–23.
8. Dunlop RH, McEwen SA, Meek AH, Friendship RM, Black WD, Clarke RC. Sampling considerations for herd-levelmeasurement of faecal Escherichia coli antimicrobial resistance in finisher pigs. Epidemiol Infect1999;122:485–496.
9. National Centre for Clinical Laboratory Standards, Document M07-A5 'Methods for dilution antimicrobial suscept-ibility tests for bacteria that grow aerobically', Approved Standard. 5th edition; 2000.
10. Baskerville NB, Hogg W, Lemelin J. The effect of cluster randomization on sample size in prevention research. J Fam Pract 2001;50:W241–W246.
11. Streiner DL, Norman GR. Health Measurement Scales. Second edition. Oxford, UK: Oxford University Press;1995:231.

Antimicrobial Resistance in Australia S121
Antibiotic resistance in animalsMary D Barton,1 Rachael Pratt,2 Wendy S Hart3
AbstractThere is currently no systematic surveillance or monitoring of antibiotic resistance in Australiananimals. Registration of antibiotics for use in animals is tightly controlled and has been very conservative.Fluoroquinolones have not been registered for use in food producing animals and other products havebeen removed from the market because of human health concerns. In the late 1970s, the AnimalHealth Committee coordinated a survey of resistance in Salmonella and Escherichia coli isolates fromcattle, pigs and poultry and in bovine Staphylococcus aureus. Some additional information is availablefrom published case reports. In samples collected prior to the withdrawal of avoparcin from themarket, no vancomycin resistant Enterococcus faecium or Enterococcus faecalis were detected insamples collected from pigs, whereas some vanA enterococci, including E. faecium and E. faecalis,were found in chickens. No vanB enterococci were detected in either species. Virginiamycinresistance was common in both pig and poultry isolates. Multiple resistance was common in E. coliand salmonellae isolates. No fluoroquinolone resistance was found in salmonellae, E. coli orCampylobacter. ß-lactamase production is common in isolates from bovine mastitis, but no methicillinresistance has been detected. However, methicillin resistance has been reported in canine isolates ofStaphylococcus intermedius and extended spectrum ß-lactamase producing E. coli has been found indogs. Commun Dis Intell 2003;27 Suppl:S121–S126.
Keywords: antibiotic resistance, food-producing animals
Introduction
There is no formal system for monitoring or surveillance of antibiotic resistance in animal bacterialisolates in Australia. Although some investigations were conducted in the late 1970s and into the1980s, there was little standardisation of sensitivity testing methods so it is difficult to compare thishistorical data with that which may be produced in the future. The lack of historical data iscompounded by the fact that little, if any was published in readily available form and/or was lost withthe rationalisation of veterinary laboratories that began in the late 1980s and continues to this day.However, in response to the JETACAR report1 there is an opportunity to establish de novo, a newsystem of antibiotic resistance surveillance, if agreement can be reached between the relevantgovernment and industry stakeholders on how it should be funded.
Background
Australia has had a conservative approach to registration of antibiotics for use in food-producinganimals, particularly since the Swann report2 recommended that antibiotics important in animal andhuman health not be used as growth promotants or production enhancers. Initially, the main purposeof controls was to ensure minimal antibiotic (chemical) residues in meat and dairy products, but sincethe early 1980s the potential for transfer of resistant bacteria and genes from animals to humans hasbeen taken into account. As a result of this approach, neither fluoroquinolones nor gentamicin havebeen registered for use in food-producing animals and chloramphenicol, furazolidone and carbadoxwere removed from use in food-producing animals because of human toxicity concerns. Only one thirdor fourth generation cephalosporin (Ceftiofur) has been registered for use in animals. This product was
1. Professor and Head of School of Pharmaceutical, Molecular and Biomedical Sciences, University of South Australia, Adelaide,South Australia
2. Hospital Scientist, Institute of Medical and Veterinary Science, Rundle Mall, Adelaide, South Australia
3. PhD Student, University of South Australia, Adelaide, South Australia
Corresponding author: Professor Mary D Barton, Professor and Head of School of Pharmaceutical, Molecular and BiomedicalSciences, University of South Australia, GPO Box 2471, Adelaide SA 5001. Telephone: +61 8 8302 2933. Facsimile: +61 8 8302 2389. Email: [email protected]

S122 Antimicrobial Resistance in Australia
registered specifically for treatment of respiratory infections in cattle, but inconsistencies in state andterritory ‘control of use’ legislation has meant that in some states and territories it has been used inother food-producing animals. Work is underway to have uniform 'control of use' legislation operatingin most states and territories by mid-2003.
Antibiotics are used in animals to treat and prevent infections. In food-producing animals, antibioticshave also been used for growth promoting or production enhancing purposes. Antibiotics used in thisway are fed to animals at subtherapeutic concentrations for extended periods of time. Invariably, suchuse is not under the control of a veterinary surgeon—farmers and stock feed manufacturers purchasethese products direct from retailers and wholesalers. A restricted range of products is registered for'growth promotant' use, with the most contentious (from a human health perspective) being avoparcin(a glycopeptide), virginiamycin (a streptogramin) and tylosin (a macrolide). Such antibiotics are usedin Australia primarily for the control of chronic enteric infections such as necrotic enteritis in meatchickens and swine dysentery and ileitis in pigs, rather than as 'pure' growth promotants. In addition,ionophores, which are not used in human medicine, are used for control of coccidiosis in chickens andlactic acidosis in cattle and sheep fed high grain rations. Ionophores account for a very largeproportion of growth promotant antibiotics used in Australia.
Intensively farmed pigs, poultry, feedlot cattle and sheep account for most antibiotic use in food-producing animals. Therapeutic and prophylactic use (as well as growth promotant use) is often bymass medication through feed or water because of the numbers of animals involved. Antibiotics arerarely used in extensively grazed beef cattle or sheep but individual dairy cows may be treated onoccasion and in-feed products can be used to control lactic acidosis. Mass medication(intramammary) can be used at the end of lactation to help control mastitis. Intramammary use duringlactation is contra-indicated and is obvious in milk of treated animals through the presence of a bluedye which is a mandatory inclusion in these products.
The extent to which antibiotics are used in aquaculture in Australia is largely unknown. In line withinternational trends, there is increasing pressure being brought to bear on industry and regulators touse antibiotics to minimise the adverse effects of bacterial and protozoan diseases. Interestingly,Codex Alimentarius, the joint World Health Organization and Food and Agriculture Organization bodycharged by the World Trade Organization with developing de facto international food standards,including maximum residue limits (MRLs), has not yet addressed the issue of MRLs for antibiotics inaquaculture. Nationally, the National Residue Survey (NRS)* has initiated, primarily for marketprotection purposes, a series of programs to monitor for the presence of antibiotics (and otherchemical residues) in a variety of predominantly wild-caught seafood. Reports of these monitoringprograms can be found on the NRS website (www.affa.gov.au/nrs).
A wider range of antibiotics is registered for the treatment of disease in cats, dogs and horses withhuman products frequently used off-label (at least in cats and dogs). Animals are treated individually.
Enteric bacteria
Information on resistance in enteric bacteria isolated from animals is limited. In the late 1970s thethen Animal Health Committee (AHC) coordinated a survey of antibiotic resistance in Escherichia coliand salmonellae isolates from livestock, and bovine mastitis Staphylococcus aureus isolates. Thepreviously unpublished results for E. coli from pigs, cattle and miscellaneous sources are shown inTable 1. The results are difficult to interpret and presumably reflect the variation in sources of isolatesbetween years. However, it is clear that in both cattle and pigs resistance to streptomycin andtetracycline was prevalent even 25 years ago. In cattle isolates particularly, there was significantresistance to ampicillin. One thousand two hundred and eighty-seven Salmonella isolates from cattle,pigs and poultry were tested between 1975 and 1982.3 The same antibiotics were used as in the E. coli study—resistance to streptomycin and tetracycline was most common. A number of isolateswere resistant to more than one antibiotic with the co-resistant combinations of tetracycline andstreptomycin (6%) or tetracycline, streptomycin and ampicillin (2%) being the most common.
* The National Residue Survey is part of the Department of Agriculture Fisheries and Forestry—Australia; see:http://www.affa.gov.au/nrs
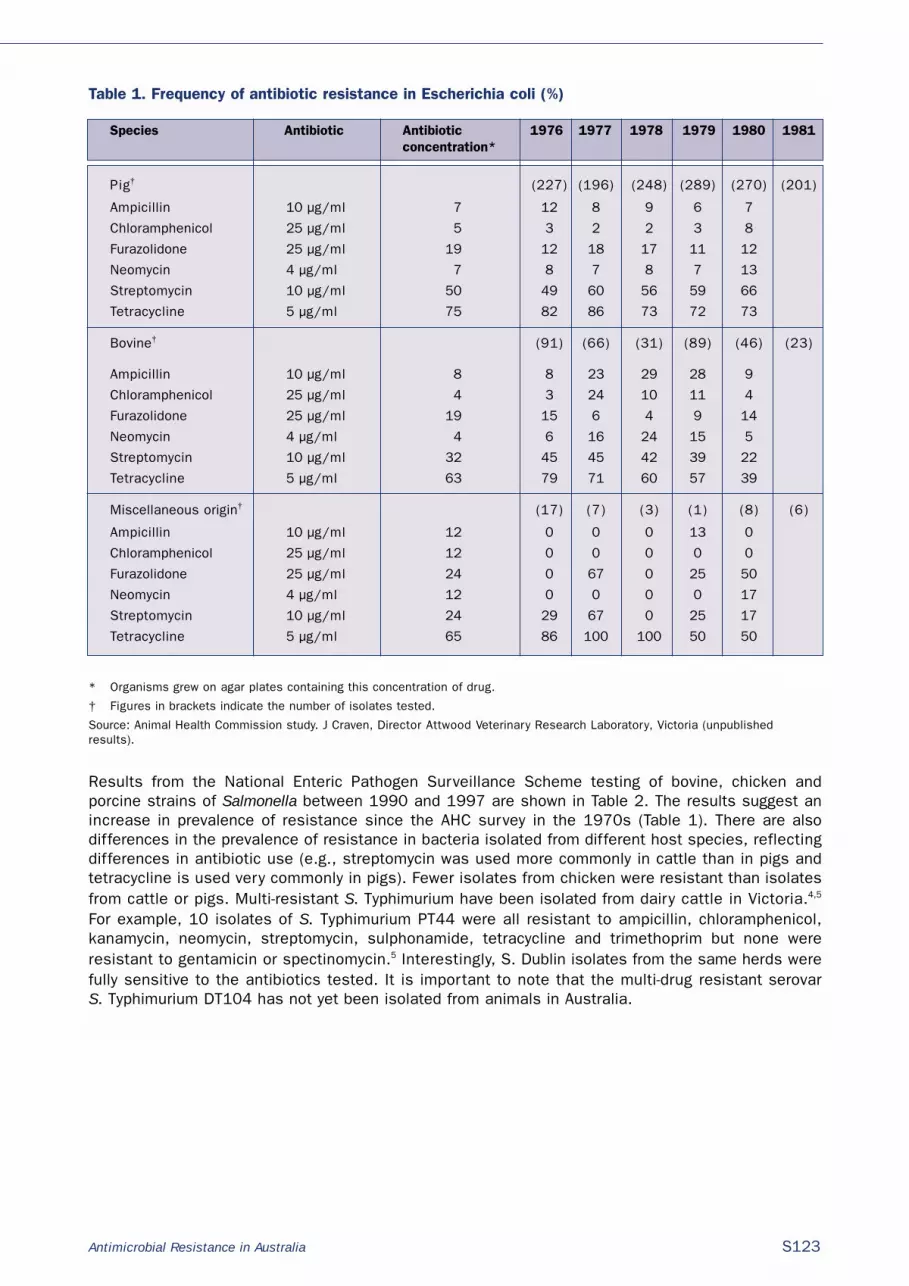
Antimicrobial Resistance in Australia S123
Table 1. Frequency of antibiotic resistance in Escherichia coli (%)
Species Antibiotic Antibiotic 1976 1977 1978 1979 1980 1981concentration*
Pig† (227) (196) (248) (289) (270) (201)
Ampicillin 10 µg/ml 7 12 8 9 6 7
Chloramphenicol 25 µg/ml 5 3 2 2 3 8
Furazolidone 25 µg/ml 19 12 18 17 11 12
Neomycin 4 µg/ml 7 8 7 8 7 13
Streptomycin 10 µg/ml 50 49 60 56 59 66
Tetracycline 5 µg/ml 75 82 86 73 72 73
Bovine† (91) (66) (31) (89) (46) (23)
Ampicillin 10 µg/ml 8 8 23 29 28 9
Chloramphenicol 25 µg/ml 4 3 24 10 11 4
Furazolidone 25 µg/ml 19 15 6 4 9 14
Neomycin 4 µg/ml 4 6 16 24 15 5
Streptomycin 10 µg/ml 32 45 45 42 39 22
Tetracycline 5 µg/ml 63 79 71 60 57 39
Miscellaneous origin† (17) (7) (3) (1) (8) (6)
Ampicillin 10 µg/ml 12 0 0 0 13 0
Chloramphenicol 25 µg/ml 12 0 0 0 0 0
Furazolidone 25 µg/ml 24 0 67 0 25 50
Neomycin 4 µg/ml 12 0 0 0 0 17
Streptomycin 10 µg/ml 24 29 67 0 25 17
Tetracycline 5 µg/ml 65 86 100 100 50 50
* Organisms grew on agar plates containing this concentration of drug.
† Figures in brackets indicate the number of isolates tested.
Source: Animal Health Commission study. J Craven, Director Attwood Veterinary Research Laboratory, Victoria (unpublishedresults).
Results from the National Enteric Pathogen Surveillance Scheme testing of bovine, chicken andporcine strains of Salmonella between 1990 and 1997 are shown in Table 2. The results suggest anincrease in prevalence of resistance since the AHC survey in the 1970s (Table 1). There are alsodifferences in the prevalence of resistance in bacteria isolated from different host species, reflectingdifferences in antibiotic use (e.g., streptomycin was used more commonly in cattle than in pigs andtetracycline is used very commonly in pigs). Fewer isolates from chicken were resistant than isolatesfrom cattle or pigs. Multi-resistant S. Typhimurium have been isolated from dairy cattle in Victoria.4,5
For example, 10 isolates of S. Typhimurium PT44 were all resistant to ampicillin, chloramphenicol,kanamycin, neomycin, streptomycin, sulphonamide, tetracycline and trimethoprim but none wereresistant to gentamicin or spectinomycin.5 Interestingly, S. Dublin isolates from the same herds werefully sensitive to the antibiotics tested. It is important to note that the multi-drug resistant serovar S. Typhimurium DT104 has not yet been isolated from animals in Australia.

S124 Antimicrobial Resistance in Australia
Table 2. Frequency of resistance in salmonella 1990 to 1997 (%)a
Chemotherapeutic concentration Bovine (396) Chicken (108) Porcine (51)
Ampicillin 32 µg/ml 31 17 35
Chloramphenicol 10 µg/ml 18 5 10
Streptomycin 25 µg/ml 86 5 10
Tetracycline 20 µg/ml 47 44 92
Sulphathiazole 550 µg/ml 70 19 41
Trimethoprim 50 µg/ml 29 17 35
Kanamycin 10 µg/ml 28 15 31
Nalidixic acid 50 µg/ml 0.5 0 0
Spectinomycin 50 µg/ml 0.6 4 5
Gentamicin 25 µg/ml 0.6 4 5
Ciprofloxacin 0.06 µg/ml 0 5 7
Figures extracted from results provided to the AHC from National Enteric Pathogen Surveillance Scheme by the MicrobiologicalDiagnostic Unit, Department of Microbiology and Immunology, University of Melbourne.
Anecdotal accounts indicate that treatment failure, in part due to antibiotic resistance, is notuncommon in neonatal enteritis in calves and post-weaning diarrhoea in pigs.
The JETACAR report1 included some results of testing by the Central Veterinary Diagnostic Laboratoryof small numbers of Salmonella isolates from a range of species with resistance more apparent incattle and equine isolates than in chicken, cat or dog isolates. Multiple resistance was noted inSalmonella isolates from several cattle and one equine isolate. The JETACAR report1 also included anaccount of resistance patterns of avian E. coli from three chicken meat production companies (T Grimes, personal communication), with widespread resistance to tetracycline and significantresistance to ampicillin and sulphonamides-trimethoprim evident. A study of E. coli and Salmonellaisolates from horses6 found all 39 isolates resistant to streptomycin and 7 resistant to multipleantibiotics. Resistance to streptomycin was also widespread in E. coli isolates and a number ofisolates were resistant to at least three antibiotics.
There is very little published Australian information on antimicrobial resistance in Campylobacter. A study of 79 chicken isolates7 found widespread resistance to erythromycin and significantresistance to doxycycline but no resistance to enrofloxacin. Similarly unpublished studies (R Pratt, WS Hart and MD Barton, personal communication) have found significant rates of resistance toerythromycin, tylosin, lincomycin, ampicillin and tetracycline (but no resistance to ciprofloxacin) inpig, pig carcass and pig meat isolates. A study of chickens8 has reported significant resistance toampicillin, ceftazidime and tetracycline in C. jejuni and C. coli isolates. No fluoroquinolone resistancewas detected and there was relatively little resistance to erythromycin or tylosin. This study alsonoted differences in resistance patterns in isolates from different sources, reflecting differences inantibiotics used.
There are no published Australian reports of antibiotic resistance patterns in animal isolates ofenterococci. A conference poster9 reported isolation of one vanA and one vanB isolate from animalsin the Hunter Valley. Pratt, Hart and Barton (unpublished data) did not detect any vanA or vanB E. faecium or E. faecalis in isolates from pigs, pig carcasses or pig meats. Virginiamycin resistance wasfound in E. faecium isolates, however, no resistance to ampicillin was detected. In the study ofchickens mentioned previously8 about 10 per cent of chicken carcass rinse samples contained vanApositive enterococci. In keeping with overseas findings that vanB vancomycin resistance is notassociated with avoparcin use in animals, no vanB resistance was detected in the isolates fromchickens. Virginiamycin resistance was detected in E. faecium isolates in this study.

Antimicrobial Resistance in Australia S125
Staphylococcus aureus
Frost and Boyle10 reported the results of testing the 1,657 bovine mastitis S. aureus isolates collectedin the AHC survey mentioned previously. Sixty-two per cent of the isolates produced penicillinase andaround 10 per cent were resistant to streptomycin. Resistance to other antibiotics was negligible andno isolates were resistant to methicillin.
A Tasmanian study of S. aureus isolates from bovine milk (Mark Broxton, unpublished results) found49 per cent of 133 isolates collected in 1992-93 were resistant to penicillin, 11 per cent resistant tostreptomycin and none resistant to methicillin. Similarly, Barton (unpublished data) found that of 144S. aureus isolates from South Australian bovine milk samples collected in 1993-94, 54 per cent wereresistant to penicillin, 9 per cent were resistant to streptomycin and none were resistant tomethicillin.
Bacterial isolates from cats and dogs
Documentation of antimicrobial resistance in isolates from cats and dogs is very limited. A 1995study11 of staphylococcal isolates from dogs found that a very high proportion of S. aureus and S. intermedius isolates were ß-lactamase producers, but all isolates were sensitivecloxacillin/oxacillin. There was considerable resistance to trimethoprim, sulphamixazole andlincomycin. More recently, methicillin resistant S. intermedius have been isolated from infections indogs (J Lucas, personal communication). A Queensland clinic12 has recently reported isolation of multi-drug resistant E. coli with extended spectrum ß-lactamase activity and fluoroquinolone resistancefrom a nosocomial outbreak of infections in dogs.
Conclusion
Data on antimicrobial resistance in bacterial isolates from Australian animals is sparse but resistancepatterns are not dissimilar from those reported from overseas countries and reflect the antibioticswhich have been used for treatment. The situation relating to antibiotic resistance in aquacultureneeds investigation. It is critical for Australian animal production that there is continued access toantibiotics for treatment and prevention of disease. Use of antibiotics must however, be in accordancewith guidelines that minimise the risk of emergence or amplification of resistant bacteria.
References
1. Commonwealth Department of Health and Aged Care. Report of the Joint Expert Technical Advisory Committeeon Antibiotic Resistance (JETACAR). Commonwealth Department of Health and Aged Care, CommonwealthDepartment of Agriculture, Fisheries and Forestry—Australia. Prepared for JETACAR by Biotex Canberra. 1999.
2. Swann MM. Report of the Joint Committee on the Use of Antibiotics in Animal Husbandry and VeterinaryMedicine. Cmnd. 4190. London: Her Majesty’s Stationery Office, 1969.
3. Murray CJ, Ratcliff RM, Cameron PA, Dixon SF. The resistance of antimicrobial agents in Salmonella fromveterinary sources in Australia from 1975 to 1982. Aust Vet J 1986;63:286–292.
4. Valcanis M, Lightfoot D, Li H, Powling J, Truong B, Forsyth JRL. Multi-resistance in enzootic strains of SalmonellaTyphimurium. In: Goldsmid JM, editors. Proceedings of the Annual Scientific Meeting of the Australian Society forMicrobiology, Melbourne, 1994. Hobart: Australian Society for Microbiology; 1994;15:56.
5. Mackie JT, Lightfoot D, Adamson M, Wishart M. Antibiotic resistant phage types of Salmonella Typhimurium indairy cattle. Aust Vet J 1996;73:194–195.

S126 Antimicrobial Resistance in Australia
6. Bucknell DG, Gasser RB, Irving A, Whithear K. Antimicrobial resistance in Salmonella and E. coli isolated fromhorses. Aust Vet J 1997;75:355–356.
7. Korolik V, Chang J, Coloe PJ. Variation in antimicrobial resistance in Campylobacter spp. isolated from animals inthe last 5 years. In: Newell DG, Ketley J, Feldman RA, editors. Campylobacters, helicobacters, and relatedorganisms. New York; Plenum Publishing Corporation, 1996.
8. Barton MD, Wilkins J. Antibiotic resistance in bacteria isolated from poultry. A report for the Rural IndustriesResearch and Development Corporation. RIRDC Publication No 01/105, Canprint. 2001.
9. Butt H, Bell J, Ferguson J. Are vancomycin-resistant enterococci prevalent in Hunter region farm animals?Australian Society for Microbiology Annual Conference; October 1997. Adelaide, South Australia. Abstract PO4.8,1997.
10. Frost AJ, O’Boyle D. The resistance to antimicrobial agents of Staphylococcus aureus isolated from the bovineudder. Aust Vet J 1981;57:262–267.
11. Barrs VR, Malik R and Love DN. Antimicrobial susceptibility of staphylococci isolates from various diseaseconditions in dogs: a further survey. Aust Vet Pract 1995;25:37–42.
12. Warren A, Townsend K, King T, Moss S, O’Boyle D, Yates M, et al. Multi-drug resistant Escherichia coli withextended-spectrum beta-lactamase activity and fluoroquinolone resistance isolated from clinical infections indogs. Aust Vet J 2001;79:621–623.

Antimicrobial Resistance in Australia S127
Surveillance for antibiotic resistance in veterinary pathogens from the perspective
of a regional diagnostic laboratoryCarol P Stephens
AbstractThe Toowoomba Veterinary Laboratory tests for antibiotic resistance through passive surveillance ofbacterial pathogens from diseased, frequently intensively managed, animals. Testing is carried out onthe basis of the number of animals involved, the nature and severity of the disease and the identityand significance of the bacterium, the results guiding the submitting veterinarian in implementingappropriate treatment. The antibiotics chosen for testing are those that are currently registered forveterinary use and are considered effective in the given situation. Testing is carried out according tothe current National Committee for Clinical Laboratory Standards Approved Standard for DiscSusceptibility Tests. This paper presents some results of testing bacterial pathogens from cattle andpigs. Commun Dis Intell 2003;27 Suppl:S127–S131.
Keywords: antibiotic resistance, veterinary pathogens, Staphylococcus aureus, Escherichia coli,Pseudomonas aeruginosa
Introduction
The Toowoomba Veterinary Laboratory is operated by the Animal and Plant Health Service of theQueensland Department of Primary Industries. The laboratory provides a comprehensive diseaseinvestigation and surveillance service for commercial livestock producers throughout South-EastQueensland and receives approximately 4,000 accessions per year. Samples may be submitted to thelaboratory from either live or dead animals or whole animals may be brought to the laboratory fornecropsy. Diagnostic testing of commercial livestock is provided free of charge to primary producersand veterinarians. The diagnostic service provided by the laboratory assists producers to maintainsustainable production levels by implementation of appropriate treatment and control programs. Thelaboratory maintains a surveillance program for both exotic and endemic disease, helping to ensuremarket access for animals and animal products and the provision of wholesome animal products toconsumers.
As the area serviced by the Toowoomba Veterinary Laboratory contains 45 per cent of the State’scattle and more than half of Queensland’s pigs, bacterial pathogens from these animals are of majorinterest. The laboratory routinely carries out susceptibility testing on bacterial pathogens isolatedfrom diseased tissues. Susceptibility testing of organisms involved in mastitis is also performed.
Methods
The Toowoomba Veterinary Laboratory is accredited for Veterinary Testing by the National Associationof Testing Authorities to Australian Standard AS ISO/IEC 17025. The method used for susceptibilitytesting is that specified by the National Committee for Clinical Laboratory Standards for disc suscep-tibility tests.1,2 Quality control is carried out weekly using the type strains Staphylococcus aureus ATCC25923, Escherichia coli ATCC 25922 and Pseudomonas aeruginosa ATCC 27853.
Correspondence: Ms Carol Stephens, Senior Microbiologist, Toowoomba Veterinary Laboratory, Animal and Plant Health Service,Department of Primary Industries, PO Box 102, Toowoomba, QLD 4350. Telephone: +61 7 4688 1355 Facsimile: +61 7 4688 1195.Email [email protected]

S128 Antimicrobial Resistance in Australia
Antibiotic susceptibility testing is not carried out on all bacteria isolated from diseased animals. Thedecision to proceed with susceptibility testing is based on the number and value of animals involved,the nature and severity of the disease and the identity and significance of the bacterium isolated. Asusceptibility result is only provided for isolates obtained in pure or almost pure culture that areconsidered to be primary or significant contributing factors in the disease syndromes under investi-gation. Susceptibility testing is only carried out on rapidly growing, aerobic bacteria. Antibioticsusceptibility test results are generally provided within 48 hours of receipt of the submission.
The antibiotics chosen for testing reflect those drugs that are currently registered for veterinary usein Australia and are considered most effective by veterinarians. A panel of antibiotics is tested againsteach of the pathogen groups. While reasonably stable, the composition of these panels may changefrom time to time according to the registration or de-registration of particular antibiotics and theiravailability, cost and effectiveness in the field. The Toowoomba Veterinary Laboratory runs between400 and 450 susceptibility test panels per annum, each consisting of from seven to nine antibiotics.
Currently enteric pathogens are tested against the antibiotics ampicillin, apramycin, ceftiofur,cotrimoxazole, lincospectin, neomycin and tetracycline. Non-enteric pathogens are tested againstampicillin, ceftiofur, cotrimoxazole, lincospectin, neomycin, tetracycline and penicillin. Organismsisolated from cases of mastitis are tested against ampicillin, cefuroxime, clindamycin, cloxacillin,neomycin, novobiocin, penicillin and tetracycline.
Results
Bovine
Mastitis is an ongoing problem in dairy cows, from which the most frequently isolated aetiologicalagent is Staphylococcus aureus. Nine antibiotics, listed above, are routinely tested against bacterialisolates from bovine mastitis (Table 1). Over a three-year period, from 1999 to 2001, one third ofisolates were found to be resistant to ampicillin and penicillin, while a small number were resistant tonovobiocin. No other resistance was detected.
Table 1. Results of antibiotic susceptibility testing of strains of Staphylococcus aureus isolated frombovine mastitic milk between 1999 and 2001
Antibiotic AMP10 CXM30 DA2 N30 NV30 OB5 P10 TE30
Number of strains tested 121 107 121 121 120 121 121 121
Number of strains resistant 40 0 0 0 3 0 40 0
Strains resistant (%) 33.1 0 0 0 2.5 0 33.1 0
AMP10 = ampicillin (10 µg); CXM30 = cefuroxime (30 µg); DA2 = clindamycin 2 µg); N30 = neomycin (30 µg); novobiocin (30 µg); OB5 = cloxacillin (5 µg); P10 = penicillin (10 i.u.); TE30 = tetracycline (30 µg).
Scours as a result of non-haemolytic Escherichia coli infection is a common problem in young calves.For the purposes of comparison, the results of antibiotic testing of these isolates in 1999 and 2001in are given in Table 2. Resistance was detected in tetracycline, ampicillin and cotrimoxazole, withlevels appearing to increase, particularly against tetracycline. Levels of resistance to neomycin appearstable, while a single isolate demonstrated resistance to apramycin in 2001.

Antimicrobial Resistance in Australia S129
Table 2. Results of antibiotic sensitivity testing of strains of non-haemolytic Escherichia coli isolatedfrom the intestine of calves with scours between 1999 and 2001
1999 2001
Tested Resistant Resistant Tested Resistant Resistant% %
AMP10 11 4 36.3 18 11 61.1
APR15 11 0 0.0 18 1 5.6
EFT30 11 0 0.0 18 0 0.0
N30 11 6 54.5 18 9 50.0
SXT25 11 3 27.2 18 8 44.4
TE30 11 4 36.3 18 14 77.8
AMP10 = ampicillin (10 µg); CXM30 = cefuroxime (30 µg); DA2 = clindamycin 2 µg); N30 = neomycin (30 µg); novobiocin (30 µg); OB5 = cloxacillin (5 µg); P10 = penicillin (10 i.u.); TE30 = tetracycline (30 µg).
Salmonellosis is also diagnosed in cattle, in calves as well as mature animals. Results of testingbetween 1999 and 2001, presented in Table 3, reveal that half of the isolates of Salmonella testedwere resistant to tetracycline, while one isolate was resistant to cotrimoxazole.
Table 3. Results of antibiotic sensitivity testing of strains of Salmonella sp. isolated from the intestineof calves diagnosed with salmonellosis between 1999 to 2001
Antibiotic AMP10 APR15 EFT30 N30 SXT25 TE30
No. of strains tested 21 22 22 22 22 22
No. of strains resistant 0 0 0 0 1 11
Strains resistant (%) 0 0 0 0 9.1 50
AMP10 = ampicillin (10 µg); CXM30 = cefuroxime (30 µg); DA2 = clindamycin 2 µg); N30 = neomycin (30 µg); novobiocin (30 µg); OB5 = cloxacillin (5 µg); P10 = penicillin (10 i.u.); TE30 = tetracycline (30 µg).
Porcine
Scours in neo-natal and young animals due to infection with haemolytic Escherichia coli is one of thedisease syndromes most frequently diagnosed in pigs and one associated with higher levels ofantibiotic resistance. Nonetheless, with the exception of tetracycline to which 100 per cent ofisolates obtained in 2001 were resistant, levels of resistance do not appear to have increasedbetween 1999 and 2001. These results are given in Table 4.

S130 Antimicrobial Resistance in Australia
AMP10 = ampicillin (10 µg); CXM30 = cefuroxime (30 µg); DA2 = clindamycin 2 µg); N30 = neomycin (30 µg); novobiocin (30 µg); OB5 = cloxacillin (5 µg); P10 = penicillin (10 i.u.); TE30 = tetracycline (30 µg).
Antibiotic susceptibility testing is also carried out against respiratory pathogens isolated from pigs.Results of testing Pasteurella multocida isolated from cases of porcine respiratory disease are givenin Table 5. While levels of resistance to penicillin and tetracycline rose over this time, resistance toother antibiotics was not detected.
Table 5. Results of antibiotic sensitivity testing of strains of Pasteurella multocida isolated from therespiratory tract of pigs with pneumonia between March 1998 and March 1999 and between March2001 and March 2002
Table 4. Results of antibiotic sensitivity testing of strains of haemolytic Escherichia coli isolated fromthe intestine of pigs with enteric disease between 1999 and 2001
1999 2001
Tested Resistant Resistant Tested Resistant Resistant% %
AMP10 34 12 35.3 34 8 23.5
APR15 34 13 38.2 34 12 35.3
EFT30 34 0 0.0 34 0 0.0
N30 34 12 35.3 34 15 44.1
SXT25 34 21 61.8 34 16 47.1
TE30 34 30 88.2 34 34 100.0
March 1998 to March 1999 March 2001 to March 2002
Tested Resistant Resistant Tested Resistant Resistant% %
AMP10 20 0 0.0 17 0 0.0
EFT30 20 0 0.0 17 0 0.0
LS109 20 0 0.0 5 0 0.0
N30 20 0 0.0 17 0 0.0
P10 19 3 15.8 16 6 37.5
SXT25 20 0 0.0 17 0 0.0
TE30 20 1 5.0 17 4 23.5
AMP10 = ampicillin (10 µg); CXM30 = cefuroxime (30 µg); DA2 = clindamycin 2 µg); N30 = neomycin (30 µg); novobiocin (30 µg); OB5 = cloxacillin (5 µg); P10 = penicillin (10 i.u.); TE30 = tetracycline (30 µg).

Antimicrobial Resistance in Australia S131
Discussion
The Toowoomba Veterinary Laboratory provides a veterinary diagnostic and disease surveillanceservice for commercial animal production in south-east Queensland. An integral component of thisactivity is the provision of antibiotic susceptibility testing of bacteria isolated from diseased livestockand believed to be significant with respect to the disease under investigation. Providing the results ofsuch testing in a timely manner promotes the judicious and targeted use of antibiotics for thetreatment of animal disease. Such treatment is necessary in order to contain disease, to maintainproduction and to ensure the welfare of the animals. The Toowoomba Veterinary Laboratory hasactively encouraged the prudent use of antibiotics for animal treatment based on results of in vitrotesting and field experience. Over the past three years, significant increases in antimicrobialresistance have generally not been observed. Exceptions to this are resistance to tetracycline and toa lesser extent, ampicillin and penicillin.
References
1. National Committee for Clinical Laboratory Standards. Performance standards for antimicrobial susceptibilitytesting; twelfth informational supplement, NCCLS M100-S12 Vol 21 No 1 NCCLS, Pennsylvania, USA; 2002.
2. National Committee for Clinical Laboratory Standards. Performance standards for antimicrobial disk susceptibilitytests; approved standard, 7th edition NCCLS M2-A7 Vol 20 No 1, NCCLS, Pennsylvania, USA; 2000.

S132 Antimicrobial Resistance in Australia
Australian Council on Healthcare Standards infection control clinical indicators
Kay L Richards,1 Dolly Olesen,2 Michael Whitby3
The Australian Council on Healthcare Standards (ACHS) has recently published the Australian Councilon Healthcare Standards Clinical Indicator Users’ Manual 2003, which includes the recently developedInfection Control Indicators. This article describes the indicator development process undertaken withthe Australian Infection Control Association (AICA) National Advisory Board.
For over 10 years, the Australian Council on Healthcare Standards has developed speciality specificclinical indicators. The earliest set of Hospital Wide Medical Indicators, measured (among other areas)hospital acquired infections including wound infection and bacteraemia. As clinical practice changedover time, it had become obvious that the indicators were not meeting the needs of clinicians inproviding useful information for monitoring or improving infection rates.
From inception, all ACHS indicators have been developed in collaboration with the appropriate medicalcollege, society or association. It was the ACHS and the Australian Infection Control Association thatdeveloped a specific set of Infection Control Indicators. Indicators need to be reflective of today’shealthcare environment, be easily collectable and assist in providing information that can flagpotential areas requiring improvement.
The ACHS has recently published the Australian Council on Healthcare Standards Clinical Indicator Users’Manual 2003, which includes the Infection Control Indicators. The indicators are in accord with thosedeveloped by the National Advisory Board to the Australian Infection Control Association (AICA-NAB).The AICA-NAB is a multi-disciplinary group with representation of infection control expertise from allregions of Australia and includes representation from the ACHS.
The published AICA indicators1 were used as the basis for the development of the ACHS indicators.Surgical site infection surveillance targeted specific clinical areas either of high risk for a woundinfection or of considerable socioeconomic consequence if infection occurred. These include hip andknee prosthesis, coronary artery bypass grafting, femoro-popliteal bypass procedures, open abdominalaortic aneurysm procedures, lower segment caesarean sections and hysterectomies.
As reported in the Australian Council on Healthcare Standards Clinical Indicator Users’ Manual 2003,central line-associated blood stream infections (CLAB’s) are responsible for 20–40 per cent ofhealthcare-associated blood stream infections and risk for occurrence differs amongst clinical unitsdependent on the type of line used and patient intrinsic factors. Therefore, CLAB’s were targeted inintensive care units, haematology and oncology units.
The AICA-NAB developed standardised definitions of infection and of clinical indicators with the aimthat in-house comparison of rates between surveillance periods could reliably identify a trend in, ormaintenance of an acceptable rate. However, the AICA-NAB is mindful that the ACHS Evaluation andQuality Improvement Program members participating in the ACHS Comparative Report Service receivesix monthly reports providing national aggregated rates to stimulate quality improvement. Individualresults may be compared with the data presented in the ACHS Comparative Report, and the previoussurveillance period. The aim is to reduce an organisation’s rate to the comparative rate, or to that of
1. Team Leader, Australian Council on Healthcare Standards, Performance and Outcomes Service, Ultimo, New South Wales
2. President, Australian Infection Control Association, on behalf of the National Advisory Board, Wilston, Queensland
3. Chair National Advisory Board; Director, Infection Management Services Southern Queensland, Princess Alexandra Hospital,Brisbane, Queensland
Corresponding author: Ms Kay Richards, Team Leader, Australian Council on Healthcare Standards, Performance and OutcomesService, Australian Council on Healthcare Standards, 5 Macarthur Street, Ultimo NSW 2007. Telephone: +61 2 8218 2720. Email:[email protected].

the previous surveillance period, whichever is the lowest. As such, comparisons depend on samplesize for surgical site infection surveillance, and the ACHS, in accord with the AICA-NAB, recommendthat organisations which perform less than 100 major procedures of the same type, use alternativestatistical analytical methods, for example process control charts, in conjunction with other qualityimprovement tools.
These indicators are in a pilot phase and data received will be analysed, taking into considerationissues such as validity, ease of collection and usefulness for quality improvement. The length of thepilot phase will be dependent on the volume and timeliness, which governs time to analyse the datareceived.
Areas such as multi-resistant organism surveillance have not been included in the 2002 collectionperiod, as definitions are still under development. However, the ACHS have recommended thathealthcare organisations continue to monitor those resistant microorganisms that are important totheir patient population.
The ACHS have sought feedback and comment from its members regarding the use of the indicators.Health care organisations have received the results for the first half of 2002 and expect to receive theresults for the second half of 2002 around April 2003. The indicators are available from the ACHS andmember organisations can access the ACHS Clinical Indicator Users’ Manual via the ACHS Website(www.achs.org.au). Other interested parties can also obtain copies using the order form found on theACHS Publications Service section of the Website.
The published indicators have targeted either speciality specific or unit specific areas. Therefore,smaller organisations that do not provide those services will not currently have indicator data to sendto the ACHS for comparative reporting. The ACHS are therefore working towards developing indicatorsthat may more accurately reflect the care provided by the smaller organisations. These may take theform of process indicators. The ACHS has advised those organisations with a small volume of cases(i.e., less than 100 surgical procedures of the same type per year) to continue to monitor theirinfection rates utilising other statistical techniques in preference to rate based indicators. Manyorganisations regard such infections as sentinel events and perform root cause analysis reviews whenan infection occurs.
The ACHS and the AICA-NAB will continue to improve the current indicators and aim to develop futureindicators that will assist organisations to collect relevant information, monitor infections within astatistically sound methodology. The process will include steps that identify indicators that measurevarious dimensions of quality, e.g., safety and effectiveness but also will focus on measuringoutcomes. Professor Robert Gibberd at the Health Services Research Group, University of Newcastle,conducts the analysis and review of the ACHS indicator data results. Particular focus is directed atthe potential gains that can be made when identifying the difference between the aggregated rate andcomparing it to the 20th centile rate. The statistical methodology used for this is outlined in the ACHSpublication ‘Determining to Improve the Quality of Care in Australian Health Care Organisations Resultsform the ACHS Clinical Indicators Data 1998 and 1999’. This type of analysis is dependent upon the sizeof the dataset and it will only be after the 2002 data becomes available that the ACHS and AICA-NABwill be able to decide on the most appropriate way of reporting the results. The review process alsoconsiders the indicator in terms of how easily the data can be collected, how useful the indicator hasbeen for quality improvement, and any other feedback provided by the users. It is envisaged that theindicators will be due for review in 2003–04.
Reference
1. Auricht E, Borgert J, Butler M, Cadwallader H, Collignon P, Cooper C, et al. Uniform national denominatordefinitions for infection control clinical indicators: surgical site and healthcare associated blood stream infection.Australian Infection Control 2001;6:47–51.
Antimicrobial Resistance in Australia S133

Over the past few decades, the global emergence of antibiotic-resistant pneumococcal strains hascomplicated disease management. Thus, healthcare practitioners have begun to place more emphasison the judicious use of antibiotics and prevention of disease through routine immunisation.8,9 Thisarticle reviews the increasing incidence of pneumococcal antibiotic resistance and the potential roleof pneumococcal conjugate vaccines in reducing antibiotic use and the spread of antibiotic-resistantpneumococcal strains.
Antimicrobial Resistance in Australia S135
Antibiotic resistance and the potential impact of pneumococcal conjugate vaccines
Ron Dagan
AbstractStreptococcus pneumoniae is a major cause of morbidity and mortality in young children throughoutthe world, causing both invasive (meningitis, bacteraemia) and non-invasive (pneumonia, acute otitismedia, sinusitis) infections. Over the past few decades, the global emergence of antibiotic-resistantpneumococcal strains has complicated disease management. Thus, healthcare practitioners havebegun to place more emphasis on the judicious use of antibiotics and prevention of disease throughroutine immunisation. Researchers have developed several pneumococcal conjugate vaccines, whichdue to their technology, are effective in infants and young children. Currently, one 7-valent pneumo-coccal conjugate vaccine (PNCRM7; Prevenar®, Wyeth) is available in various parts of the world andhas demonstrated excellent efficacy against vaccine-type invasive disease and efficacy againstpneumonia and otitis media caused by the serotypes included in the vaccine. Furthermore, there isevidence suggesting that the use of these conjugate vaccines will reduce the need for antibiotics andthe subsequent spread of antibiotic-resistant pneumococci. Ultimately, when routine pneumococcalconjugate vaccination of infants and young children is accompanied by supportive education andactive disease surveillance as well as judicious use of antibiotics, there should be a favourable impacton pneumococcal disease incidence in and beyond the vaccinated population. Commun Dis Intell2003;27 Suppl:S135–S143.
Keywords: Streptococcus pneumoniae, antibiotic resistance, pneumococcal conjugate vaccine, PNCRM7
Introduction
Streptococcus pneumoniae is a major cause of morbidity and mortality in young children throughout theworld.1 The leading cause of bacterial meningitis in infants and children,2 S. pneumoniae also causesother invasive infections, such as bacteraemia and bacteraemic pneumonia. Non-invasive infectionscommonly caused by S. pneumoniae include non-bacteraemic pneumonia, acute otitis media (AOM)and sinusitis.1
The annual incidence of invasive pneumococcal disease in Australia ranges from 31.7 to 2,053 casesper 100,000 population, depending on the geographic region, age, and ethnic background of thepopulation studied.3,4,5,6,7 As shown in Figure 1, the incidence of disease is high among childrenyounger than 2 years, with the highest incidence seen in indigenous children.
Correspondence: Dr Ron Dagan, Pediatric Infectious Disease Unit, Soroka University Medical Center, PO Box 151, Beer-Sheva84101, Israel. Telephone: +011 972 8 6400547. Facsimile: +011 972 8 6232334. Email: [email protected]

S136 Antimicrobial Resistance in Australia
Figure 1. Annual incidence of invasive pneumococcal disease in various regions of Australia3,4,5,6,7
Microbiology, transmission, and carriage of pneumococci
Microbiology
Pneumococci are gram-positive, lancet-shaped bacteria that occur in chains (streptococci) or in pairs(diplococci) and are typically surrounded by a large complex polysaccharide capsule. Based ondifferences in the composition of the polysaccharide capsule, there are approximately 90 knownserotypes of S. pneumoniae. The prevalence of different serotypes varies by age, geographic location,and type of disease.10 In the Australian population, 7 serotypes (4, 6B, 9V, 14, 18C, 19F, 23F) causebetween 62 per cent and 88 per cent of invasive pneumococcal disease among children younger than5 years (Figure 2).3,5,6,11 Interestingly, the proportion of invasive pneumococcal disease caused bythese serotypes is somewhat lower among young children of indigenous descent.5,12
Figure 2. Proportion of invasive pneumococcal disease cases attributed to serotypes 4, 6B, 9V, 14,18C, 19F, and 23F, by region3,5,6,11
Annual incidence (per 100,000 population)
0 500 1000 1500 2000 2500
Central Australia
Indigenous < 2 y
Far North Queensland
Indigenous < 2 y
Indigenous < 5 y
Non-Indigenous < 2 y
Non-Indigenous < 5 y
New South Wales < 2 y
Victoria < 2 y
Sydney < 2 y
Sydney < 5 y
Annual incidence (per 100,000 population)
0 500 1000 1500 2000 2500
Central Australia
Indigenous < 2 y
Far North Queensland
Indigenous < 2 y
Indigenous < 5 y
Non-Indigenous < 2 y
Non-Indigenous < 5 y
New South Wales < 2 y
Victoria < 2 y
Sydney < 2 y
Sydney < 5 y

Nasopharyngeal carriage and transmission
Asymptomatic nasopharyngeal carriage of pneumococci is widely prevalent among young children(ranging from 28% to 86% throughout the United States of America and Europe) and is often the firststep in disease transmission.13,14,15,16 Consequently, young children play an important role in thetransmission of pneumococcal disease in the community because of their high carriage rate and theease with which they can transmit the disease through expulsion of respiratory droplets. Consistentwith the findings from other countries, studies in southern Australia among children younger than 5 years of age have found pneumococcal nasopharyngeal carriage rates ranging between 37 per centand 52 per cent.17 Of particular note, half of these isolates were resistant to antibiotic treatment.17
Pneumococcal antibiotic resistance
Historically, penicillin has been the agent of choice for treatment of pneumococcal disease; however,the widespread use and overuse of penicillin has resulted in the development of penicillin-non-susceptible pneumococcal strains and necessitated changes in treatment.8,9,18,19,20 Penicillin non-susceptibility—the degree of resistance to treatment—is classified according to minimum inhibitoryconcentrations (MICs), defined as the minimum concentration of a particular antibiotic needed to stoppneumococcal growth in vitro (Table 1).21,22
Table 1. Definition of penicillin resistance21,22
Antimicrobial Resistance in Australia S137
Level of resistance* Minimum inhibitory concentration
Susceptible ≤0.06 µg/mL
Intermediate susceptibility 0.1-1 µg/mL
Resistant ≥ 2 µg/mL
* As defined by the United States of America National Committee for Clinical and Laboratory Standards.
Rates of pneumococcal non-susceptibility vary geographically and are rising throughout the world. Forexample, penicillin non-susceptibility in Spain increased from 6 per cent in 1979 to 44.3 per cent in1989. By 1999, approximately 60 per cent of all pneumococcal isolates were penicillin non-susceptible.23,24 Similarly, in the United States of America (USA), an 11-fold increase in the rate ofpenicillin non-susceptibility was observed between the years 1986 (3.8%) and 1997 (43.8%).25 Theproportion of penicillin-non-susceptible pneumococci has increased in south-eastern Australia as well.In 1990, approximately 2 per cent of isolates were intermediately resistant to penicillin; by 2000,approximately 10 per cent of isolates from blood and cerebrospinal fluid (CSF) cultures and just over35 per cent of isolates from sites other than blood and CSF exhibited non-susceptibility to penicillin.19
Further evidence of the dramatic increase in antibiotic resistance is provided by a 1997 Australian-wide surveillance study showing that approximately 25 per cent of the 1,020 isolated strains werenon-susceptible to penicillin (16.8% were intermediately resistant and 8.6% were resistant).26 Ratesof resistance to other drugs were also relatively high, with 15.6 per cent of strains resistant toerythromycin, 15.7 per cent resistant to tetracycline, 21.4 per cent resistant to cefaclor, 33.4 percent resistant to cotrimoxazole, and 3.1 per cent each resistant to amoxicillin-clavulanate andceftriaxone.26

S138 Antimicrobial Resistance in Australia
Not surprisingly, the problem of multidrug-resistant strains has been growing at an alarming rateworldwide.9,19,26 For example, a 1997 USA surveillance study reported that 36.7 per cent of penicillin-intermediate and 65.6 per cent of penicillin-resistant isolates were also resistant to macrolideantibiotics.27 With respect to Australia, Gratten and colleagues identified 27 cases of multidrug-resistant S. pneumoniae in Queensland between 1995 and 1996.28 All 27 isolates demonstratedresistance to cotrimoxazole, 19 strains (70%) were resistant to chloramphenicol, 25 strains (93%)were resistant to erythromycin, and 25 strains (93%) were resistant to tetracycline. Penicillin-non-susceptible strains were recovered from 18 of the 27 multidrug-resistant cases (66.7%). Furthermore,14 penicillin-resistant isolates were also resistant to ceftriaxone. The serotype distribution of thesemultidrug-resistant pneumococci included serotype 19F (15 isolates), serotype 14 (6 isolates),serotype 23F (4 isolates), serotype 6A (1 isolate), and serotype 19A (1 isolate).
The spread of antibiotic-resistant pneumococci has been associated with out-of-home childcareattendance and previous antibiotic use.29,30,31 Day care attendance increases the risk of resistantpneumococcal disease due to frequent contact with other children, exposure to a greater number ofserotypes, and difficulty in maintaining hygienic conditions.30.31 Furthermore, Levine and colleaguesreported that children in day care are more likely to have had a recent ear infection and more likelyto have one recent course of antibiotics.30
Taken together, the dramatic increase in the prevalence of antibiotic-resistant pneumococci and thepersistently high morbidity and mortality associated with pneumococcal infections has shifted thefocus of disease management from antibiotic therapy to the prevention of infection through immun-isation.2,8,9
Role of vaccination in reducing antibiotic resistance
Although pneumococcal polysaccharide vaccines have been available since the 1980s, they areineffective in children younger than 2 years because they produce a T-cell–independent immuneresponse.32 To overcome this problem, researchers have developed several pneumococcal conjugatevaccines based on the same principles used to develop the highly successful Haemophilus influenzaetype b vaccine. Table 2 shows the serotypes and carriers used in the various pneumococcal conjugatevaccines. The only pneumococcal conjugate vaccine available to date is a 7-valent vaccine (serotypes 4,6B, 9V, 14, 18C, 19F, and 23F) conjugated to a non-toxic diphtheria variant (CRM197) (PNCRM7;Prevenar®; Wyeth).
Table 2. Composition of pneumococcal conjugate vaccines
Vaccine Protein carrier Serotypes Manufacturer
PNCRM7 Non-toxic variant (CRM197) 4, 6B, 9V, 14, 18C, Wyeth
19F, 23F
PNCRM9 CRM197 1, 4, 5, 6B, 9V, 14, 18C, Wyeth
19F, 23F
PNCOMP7 Outer membrane of Neisseria 4, 6B, 9V, 14, 18C, meningitidis group B 19F, 23F Merck and Co.
PNC–D/T Diphtheria and tetanus toxoids 1, 3, 4, 5, 6B, 7F, 9V, Aventis-Pasteur14, 18C, 19F, 23F
PNC–protein D Haemophilus influenzae protein D 1, 3, 4, 5, 6B, 7F, 9V, GlaxoSmithKline14, 18C, 19F, 23F

Antimicrobial Resistance in Australia S139
PNCRM7 has demonstrated excellent efficacy against vaccine-type invasive disease and moderateefficacy against vaccine-type AOM. In the first of two safety and efficacy trials, the Northern CaliforniaKaiser Permanente (NCKP) study, subjects were randomly assigned to immunisation with PNCRM7 orthe meningococcal group C conjugate vaccine (control).2 Efficacy of PNCRM7 against vaccine-serotype-specific invasive disease was 97.4 per cent in the per-protocol analysis (received ≥ 3 doses)and 93.9 per cent in the intent-to-treat analysis (received ≥ 1 dose). In addition, there was a 6.4 percent decrease in otitis media episodes, a 9.1 per cent reduction in frequent AOM episodes, and a 20.3 per cent reduction in tympanostomy tube insertions.
Postlicensure surveillance from this trial has shown that the incidence of invasive disease among allchildren in the NCKP healthcare system (vaccinated and unvaccinated) after licensure and routine useof the vaccine was reduced in children younger than 1 year, 2 years, and 5 years by 87.3 per cent,58.1 per cent, and 62.4 per cent, respectively, thus suggesting that the benefits of pneumococcalimmunisation may extend to the non-vaccinated population as well (i.e., indirect or herd immunity).33
The second PNCRM7 study used a vaccination schedule similar to that of the NCKP study; 1,662subjects were randomly assigned to immunisation with PNCRM7 or the hepatitis B vaccine (control).34
Similar to the previous study, vaccination with PNCRM7 reduced the incidence of all AOM episodes by6 per cent, while the incidence of culture-confirmed AOM episodes and vaccine-serotype episodesdecreased by 34 per cent and 57 per cent, respectively. However, an increase of 33 per cent wasobserved for episodes caused by non-vaccine serotypes.
The potential effects of the pneumococcal conjugate vaccines on antibiotic resistance have beenexamined in 876 children with pneumococcal AOM in southern Israel.35 Analysis of middle ear fluidisolates showed that 68 per cent were resistant to one or more antibiotic, 61 per cent were resistantto penicillin, and 13 per cent were resistant to three or more antibiotic classes. Taken together withthe serotype composition of such isolates (primarily 6B, 9V, 14, 19F, and 23F), it is likely thatpneumococcal conjugate immunisation will have a significant impact on the spread of antibioticresistance, as these five serotypes are included in all of the pneumococcal conjugate vaccines.
Evidence suggesting that the benefits of pneumococcal vaccination extend beyond the prevention ofdisease to reducing the need for antibiotic treatment has been demonstrated. In the NCKP trialdescribed previously, it was found that PNCRM7 reduced antibiotic use by 5.3 per cent.36 In anotherstudy conducted in children attending day care centers in Israel, researchers compared respiratorymorbidity and antibiotic use among children receiving a 9-valent pneumococcal conjugate vaccine(PNCRM9) with that of children immunised with a meningococcal C conjugate (control) vaccine.37
Overall reductions were seen in the incidence of upper respiratory infections (15% decrease), lowerrespiratory infections (16% decrease), and AOM (17% decrease). In addition, the overall number ofdays of antibiotic use was significantly reduced (by 17%, p≤0.005). When analysed by site of infection,antibiotic use in children with upper respiratory infections, lower respiratory infections, and AOMdecreased by 10 per cent, 47 per cent, and 20 per cent, respectively (p≤0.005 for all comparisons).37
Finally, preliminary data from the United States of America (presented at the American Society forMicrobiology’s Third International Symposium on Pneumococci and Pneumococcal Diseases inAnchorage, Alaska in May of 2002) suggest that the universal immunisation of infants and toddlershas dramatically reduced the incidence of antibiotic-resistant pneumococcal disease amongindividuals of all ages.

S140 Antimicrobial Resistance in Australia
Recommendations for use of PNCRM7 in Australia
PNCRM7 is indicated for the active immunisation of children 6 weeks to 9 years of age againstinvasive disease, pneumonia, and otitis media caused by those pneumococcal serotypes included inthe vaccine (4, 6B, 9V, 14, 18C, 19F, and 23F). At this time, the Australian Technical Advisory Groupon Immunisation (ATAGI) recommends free (federally funded) vaccination with PNCRM7 to thosechildren at greatest risk for pneumococcal disease.38 All eligible children (Table 3) should receive a 3-dose series, given at 2, 4, and 6 months of age. No booster dose is necessary for the majority ofchildren, with 2 important exceptions: children with impaired immunity should receive a fourth boosterdose, and certain Aboriginal and Torres Strait Islander children should receive a booster dose of the23-valent polysaccharide vaccine (Pneumovax 23®, Merck and Co., West Point, PA). Therecommended ‘catch-up’ schedule for eligible children older than 2 months of age is provided in Table 4.38
Finally, ATAGI is also currently considering inclusion of a pneumococcal conjugant vaccine as part ofthe routine, free immunisation schedule for all children, regardless of risk group.
Table 3. Children eligible for free vaccination with PNCRM738
Group Age limit
All Aboriginal and Torres Strait Islander children < 24 months
Non-Aboriginal children in Central Australia < 24 months
Aboriginal children in Central Australia or any region with similarly 24–59 monthshigh incidence of pneumococcal infections
Children with medical risk factors for pneumococcal infection* < 5 years
* Children with impaired immunity (e.g., hemoglobinopathies, congenital immune deficiency, asplenia, human immunodeficiencyvirus infection, relapsing or persistent nephrotic syndrome), and anatomical abnormalities predisposing to pneumococcalinfection (e.g., congenital cyanotic heart disease, cerebrospinal fluid leak).
Age at first Primary schedule Boosterdose (months) (PNCRM7)
Aboriginal and Torres Strait Islander children 3-6 3 doses* 23V PS at in the Northern Territory, the desert and tropical 7-17 2 doses* 18-24 monthsregions of Western Australia and Queensland, 18-24 1 doseand the desert regions of New South Wales 23V PS and southern Australia 2 months later
Aboriginal children in Central Australia 24-59 1 dose 23V PS 2 months(and other regions of similarly high pneumococcal laterdisease incidence)
Aboriginal and Torres Strait Islander children in 3-6 3 doses* Noneall other regions, non-Aboriginal children in 7-23 2 doses* NoneCentral Australia only, and children with anatomical abnormalities
Children with impaired immunity 3-6 3 doses* PNCRM7 at 7-11 2 doses* 12 months12-59 2 doses* None
* Doses given 2 months apart.
PNCRM7, Prevenar®, Wyeth-Lederle Vaccines; 23V PS, Pneumovax 23®, Merck and Co.
Table 4. Recommended catch-up PNCRM7 immunisation schedule38

Antimicrobial Resistance in Australia S141
Potential impact in Australia with widespread use of pneumococcal conjugate vaccines
Widespread use of PNCRM7 should lead to a decreased incidence of pneumococcal disease, indirectlyreducing antibiotic use and the spread of antibiotic resistance. Epidemiology studies indicate that theseven serotypes included in PNCRM7 are responsible for 62–88 per cent of cases of invasive pneumo-coccal disease,3,5,6,11 suggesting that the majority of pneumococcal infections in children could beprevented by vaccination with PNCRM7. Although vaccine coverage would be expected to be loweramong indigenous children (62%), the high incidence of disease in this group suggests that thevaccine will still be of substantial value.
In addition to the disease prevention effects in vaccinated individuals, immunisation of infants andyoung children with pneumococcal conjugate vaccines may indirectly extend disease prevention to alarger population (i.e., indirect or herd immunity), as observed in Northern California.
Conclusions
To realise the full potential of pneumococcal conjugate vaccines, the implementation of vaccinationprograms must be accompanied by the education of medical practitioners and the public on theappropriate use of antibiotics. Moreover, continued disease surveillance is crucial for understandingwhether replacement carriage or disease with non-vaccine serotypes occurs. To date, clinical trialshave shown that immunisation with pneumococcal conjugate vaccines has resulted in decreasedcarriage of vaccine-type pneumococci and increased carriage of non-vaccine-typepneumococci;39,40,41,42 however, some replacement disease has only been observed for AOM.34
No replacement disease has been observed for invasive pneumococcal disease.33
It also remains to be determined if non-vaccine serotypes will begin to develop antibiotic resistance.Ultimately, when routine pneumococcal conjugate vaccination of infants and young children isaccompanied by supportive education and active disease surveillance as well as judicious use ofantibiotics, a favourable impact on the incidence of pneumococcal disease in and beyond thevaccinated population should be observed.
References
1. Van Beneden CA, Whitney CG, Levine OS. Preventing pneumococcal disease among infants and young children.MMWR Morb Mortal Wkly Rep 2000;49:1–38.
2. Black S, Shinefield H, Fireman B, Lewis E, Ray P, Hansen JR, et al. Efficacy, safety and immunogenicity ofheptavalent pneumococcal conjugate vaccine in children. Northern California Kaiser Permanente Vaccine StudyCenter Group. Pediatr Infect Dis J 2000;19:187–95.
3. McIntyre PB, Gilmour RE, Gilbert GL, Kakakios AM, Mellis CM. Epidemiology of invasive pneumococcal diseasein urban New South Wales, 1997–1999. Med J Aust 2000;173 Suppl:S22–S26.
4. Torzillo PJ, Hanna JN, Morey F, Gratten M, Dixon J, Erlich J, et al. Invasive pneumococcal disease in CentralAustralia. Med J Aust 1995;162:182–186.
5. Fagan RL, Hanna JN, Messer RD, Brookes DL, Murphy DM. The epidemiology of invasive pneumococcal diseasein children in Far North Queensland. J Paediatr Child Health 2001;37:571–575.
6. Hogg GG, Strachan JE, Lester RA. Invasive pneumococcal disease in the population of Victoria. Med J Aust2000;173 Suppl:S32–S35.
7. Liddle JL, McIntyre PB, Davis CW. Incidence of invasive pneumococcal disease in Sydney children, 1991–96. J Paediatr Child Health 1999;35:67–70.
8. Dowell SF, Schwartz B. Resistant pneumococci: protecting patients through judicious use of antibiotics. Am FamPhysician 1997;55:1647–1648.
9. Collignon PJ, Turnidge JD. Antibiotic resistance in Streptococcus pneumoniae. Med J Aust 2000;173Suppl:S58–S64.

10. Hausdorff WP, Bryant J, Paradiso PR, Siber GR. Which pneumococcal serogroups cause the most invasivedisease: implications for conjugate vaccine formulation and use, part I. Clin Infect Dis 2000;30:100–121.
11. Gratten M, Carlisle J, Hanna J, Bapty G, George N, Nuttall N, et al. Seroepidemiology of invasive pneumococcaldisease in Queensland, 1990 to 1997. Commun Dis Intell 1998;22:265–269.
12. Butler JC, Bulkow LR, Parks DJ, et al. Epidemiology of pneumococcal bacteremia and meningitis during the first5 years of life in Alaska: implications for conjugate pneumococcal vaccine use [abstract]. 39th InterscienceConference on Antimicrobial Agents and Chemotherapy 2000;672.
13. Syrjänen R, Kilpi T, Herva E, et al. Pneumococcal carriage during health and respiratory infection [abstract].International Symposium on Pneumococci and Pneumococcal Disease Abstract Book 1998;29.
14. Appelbaum PC, Gladkova C, Hryniewicz W, Kojouharov B, Kotulova D, Mihalcu F, et al. Carriage of antibiotic-resistant Streptococcus pneumoniae by children in eastern and central Europe—a multi-center study with use ofstandardized methods. Clin Infect Dis 1996;23:712–717.
15. Garcia-de-Lomas J, Gimeno C, Millas E, Bermejo M, Lazaro MA, Navarro D, et al. Antimicrobial susceptibility ofStreptococcus pneumoniae isolated from pediatric carriers in Spain. Eur J Clin Microbiol Infect Dis 1997;16:11–13.
16. Shackley F, Heath PT, Diggle L, et al. Carriage of Streptococcus pneumoniae (Spn) in Oxford children [abstract].International Symposium on Pneumococci and Pneumococcal Diseases 1998;36.
17. Skull SA, Shelby-James T, Morris PS, Perez GO, Yonovitz A, Krause V, et al. Streptococcus pneumoniae antibioticresistance in Northern Territory children in day care. J Paediatr Child Health 1999;35:466.
18. Nasrin D, Collignon PJ, Roberts L, Wilson EJ, Pilotto LS, Douglas RM. Effect of beta-lactam antibiotic use inchildren on pneumococcal resistance to penicillin: prospective cohort study. BMJ 2002;324:28–30.
19. Butler JC, Dowell SF, Breiman RF. Epidemiology of emerging pneumococcal drug resistance: implications fortreatment and prevention. Vaccine 1998;16:1693–1697.
20. Gosbell IB, Neville SA. Antimicrobial resistance in Streptococcus pneumoniae: a decade of results from south-western Sydney. Commun Dis Intell 2000;24:340–343.
21. National Committee for Clinical Laboratory Standards. Performance standards for antimicrobial susceptibilitytesting; 11th informational supplement. National Committee for Clinical Laboratory Standards, Wayne,Pennsylvania, 2001;21:1–123.
22. American Academy of Paediatrics Committee on Infectious Diseases. Therapy for children with invasive pneumo-coccal infections. Paediatrics 1997;99:289–299.
23. Fenoll A, Martin BC, Munoz R, Vicioso D, Casal J. Serotype distribution and antimicrobial resistance ofStreptococcus pneumoniae isolates causing systemic infections in Spain, 1979–1989. Rev Infect Dis1991;13:56–60.
24. Fenoll A, Jado I, Vicioso D, Berron S, Yuste JE, Casal J, et al. Streptococcus pneumoniae in children in Spain:1990–1999. Acta Paediatr 2000;89 Suppl:44–50.
25. Doern GV, Pfaller MA, Kugler K, Freeman J, Jones RN. Prevalence of antimicrobial resistance among respiratorytract isolates of Streptococcus pneumoniae in North America: 1997 results from the SENTRY antimicrobialsurveillance program. Clin Infect Dis 1998;27:764–770.
26. Turnidge JD, Bell JM, Collignon PJ. Rapidly emerging antimicrobial resistance in Streptococcus pneumoniae inAustralia. Med J Aust 1999;170:152–155.
27. Jacobs MR, Bajaksouzian S, Zilles A, Lin G, Pankuch GA, Appelbaum PC, et al. Susceptibilities of Streptococcuspneumoniae and Haemophilus influenzae to 10 oral antimicrobial agents based on pharmacodynamic parameters:1997 U.S. Surveillance Study. Antimicrob Agents Chemother 1999;43:1901–1908.
28. Gratten M, Nimmo G, Carlisle J, Schooneveldt J, Seneviratne E, Kelly R, et al. Emergence of further serotypes ofmultiple drug-resistant Streptococcus pneumoniae in Queensland. Commun Dis Intell 1997;21:133–136.
29. Arnold KE, Leggiadro RJ, Breiman RF, Lipman HB, Schwartz B, Appleton MA, et al. Risk factors for carriage ofdrug-resistant Streptococcus pneumoniae among children in Memphis, Tennessee. J Pediatr 1996;128:757–764.
30. Levine OS, Farley M, Harrison LH, Lefkowitz L, McGeer A, Schwartz B, et al. Risk factors for invasive pneum-ococcal disease in children: a population-based case-control study in North America. Pediatrics 1999;103:E28.
31. Givon-Lavi N, Dagan R, Fraser D, Yagupsky P, Porat N. Marked differences in pneumococcal carriage andresistance patterns between day care centers located within a small area. Clin Infect Dis 1999;29:1274–1280.
32. Black S, Shinefield H. Issues and challenges: pneumococcal vaccination in paediatrics. Paediatr Ann1997;26:355–360.
S142 Antimicrobial Resistance in Australia

Antimicrobial Resistance in Australia S143
33. Black SB, Shinefield HR, Hansen J, Elvin L, Laufer D, Malinoski F, et al. Postlicensure evaluation of theeffectiveness of seven valent pneumococcal conjugate vaccine. Pediatr Infect Dis J 2001;20:1105–1107.
34. Eskola J, Kilpi T, Palmu A, Jokinen J, Haapakoski J, Herva E, et al. Efficacy of a pneumococcal conjugate vaccineagainst acute otitis media. N Engl J Med 2001;344:403–409.
35. Dagan R, Givon-Lavi N, Shkolnik L, Yagupsky P, Fraser D. Acute otitis media caused by antibiotic-resistantStreptococcus pneumoniae in southern Israel: implication for immunizing with conjugate vaccines. J Infect Dis2000;181:1322–1329.
36. Shinefield H. Pneumococcal conjugate vaccines and ongoing lessons. Int J Clin Pract 2001;118 Suppl:23–25.
37. Dagan R, Sikuler-Cohen M, Zamir O, Janco J, Givon-Lavi N, Fraser D. Effect of a conjugate pneumococcal vaccineon the occurrence of respiratory infections and antibiotic use in day-care center attendees. Pediatr Infect Dis J2001;20:951–958.
38. Information for Immunisation Providers National Childhood Pneumococcal Vaccination Program. Available from:http://www.health.gov.au/pubhlth/immunise/publications.htm. Accessed: May 2002.
39. Mbelle N, Huebner RE, Wasas AD, Kimura A, Chang I, Klugman KP. Immunogenicity and impact on nasopharyngealcarriage of a nonavalent pneumococcal conjugate vaccine. J Infect Dis 1999;180:1171–1176.
40. O'Brien KL, Bronsdon MA, Carlone GM, et al. Effect of a 7-valent pneumococcal conjugate vaccine on naso-pharyngeal (NP) carriage among Navajo and White Mountain Apache (N/WMA) infants [abstract]. 19th AnnualMeeting of the European Society for Paediatric Infectious Diseases 2001;22.
41. Dagan R, Givon S, Yagupsky P, et al. Effect of a 9-valent pneumococcal CRM197 vaccine (PncCRM9) on naso-
pharyngeal (NP) carriage of vaccine type and non-vaccine type S. pneumoniae (Pnc) strains among day care center(DCC) attendees (abstract). Program and Abstracts of the 38th Annual Interscience Conference on AntimicrobialAgents and Chemotherapy 1998;299.
42. Obaro SK, Adegbola RA, Banya WAS, Greenwood BM. Carriage of pneumococci after pneumococcal vaccination.Lancet 1996;348:271–272.

S144 Antimicrobial Resistance in Australia
Non-antibiotic therapies for infectious diseasesChristine F Carson,1 Thomas V Riley1,2
AbstractThe emergence of multiple antibiotic resistant organisms in the general community is a potentiallyserious threat to public health. The emergence of antibiotic resistance has not yet prompted a radicalrevision of antibiotic utilisation. Instead it has prompted the development of additional antibiotics.Unfortunately, this does not relieve the underlying selection pressure that drives the development ofresistance. A paradigm shift in the treatment of infectious disease is necessary to prevent antibioticsbecoming obsolete and, where appropriate, alternatives to antibiotics ought to be considered. Thereare already several non-antibiotic approaches to the treatment and prevention of infection includingprobiotics, phages and phytomedicines. There is some evidence that probiotics such as Lactobacillusspp. or Saccharomyces boulardii are useful in the prevention and treatment of diarrhoea, includingClostridium difficile-associated diarrhoea that can be difficult to treat and recurs frequently.Bacteriophages have received renewed attention for the control of both staphylococcal and gastro-intestinal infections. Phytomedicines that have been utilised in the treatment of infections includeartesunate for malaria, tea tree oil for skin infections, honey for wound infections, mastic gum forHelicobacter pylori gastric ulcers and cranberry juice for urinary tract infections. Many infections mayprove amenable to safe and effective treatment with non-antibiotics. Commun Dis Intell 2003;27Suppl:S144–S147.
Keywords: non-antibiotic therapies, phytomedicines, bacteriophages, probiotics, antimicrobial agents
Introduction
Increased use of alternative medicines has come about largely as a result of the general community’sinterest in alternative therapies rather than by demand from healthcare professionals for alternativeagents. Both groups have their own prejudices; lay people often assume natural products arecompletely safe and effective while many health professionals dismiss therapeutic agents or methodsthat do not fit the conventional paradigm. Both groups often maintain their biases in the face of contra-dictory evidence, or view the absence of evidence as evidence in its own right. A survey published in1996 indicated that nearly 50 per cent of the Australian population had used at least one non-medically prescribed alternative medicine.1 With specific regard to antimicrobials, there are severalnon-antibiotic approaches to the treatment and prevention of infection including probiotics, bacterio-phages and phytomedicines.
Probiotics
Probiotics have been suggested as an alternative therapy for the treatment of infectious gastro-enteritis, or the treatment and prevention of antibiotic-associated diarrhoea due to Clostridium difficile.Probiotics are preparations of ostensibly non-pathogenic organisms known to have a beneficial effecton the digestive and other systems by conferring resistance to infection or eliminating infectiousagents. Both bacteria and yeasts have been used as probiotics. The mechanisms of action ofprobiotics have been summarised by Filho-Lima et al.2 Four possibilities exist: 1. antagonism throughproduction of inhibitory substances; 2. competition with the pathogen for adhesion sites or nutrients;3. immunomodulation of the host; and 4. inhibition of toxins.
1. Department of Microbiology, The University of Western Australia, Crawley, Western Australia
2. Western Australian Centre for Pathology and Medical Research, Nedlands, Perth, Western Australia
Corresponding author: Professor Thomas V Riley, Department of Microbiology, Queen Elizabeth II Medical Centre, Nedlands, Perth WA 6009. Telephone: +618 9346 3690. Facsimile: +618 9382 8046. Email: [email protected]

Antimicrobial Resistance in Australia S145
Lactobacillus GG has been the most widely studied of probiotic agents. In addition to having been used,with varying degrees of success, for treating or preventing urinary tract infections, vulvo-vaginalcandidiasis and bacterial vaginosis,3 Lactobacillus GG, in the form of a milk preparation, was recentlyreported as having some modest but consistent benefits in terms of preventing and reducing theseverity of respiratory infections at day care centres.4 While the relevance of this latter observationto the prevention of antibiotic resistance may not be immediately apparent, any intervention whichresults in reduced use of antibiotics in a particular setting will eventually lead to a decline in antibioticresistance. Another well-studied probiotic is Saccharomyces boulardii, a yeast that is effective inpreventing relapses of Clostridium difficile-associated diarrhoea and treating various types of infectiousdiarrhoea.5 Several other possible probiotics have been looked at, such as non-toxigenic strains of C. difficile and a strain of Enterococcus faecium. However, enthusiasm for enterococci as probiotics haswaned since the emergence of vancomycin resistant enterococci.
Bacteriophages as antimicrobial agents
An old idea ignored since the beginning of the antibiotic era by all but a few former Soviet bloccountries is bacteriophage therapy where phages are used to lyse bacterial pathogens. There has beenrenewed interest in bacteriophage therapy with the emergence of antibiotic resistance as a majorproblem in modern medicine.6 Several reports from Poland in the 1980s described the treatment ofvarious infections, the majority of which were staphylococcal and included bacteraemia. In vitrotesting indicated that bacteriophages were active against specific pathogens. Efficacy in vivo wasassessed on a clinical basis alone and positive results were obtained in over 90 per cent of cases,however, there were no untreated controls.7 Similar studies were carried out in the former Soviet Unionfrom the early 1970s. In those studies where staphylococci (presumably Staphylococcus aureus) wereinvolved, bacteria were eliminated after phage therapy in the majority of cases.6 Phages were appliedeither topically, sub-cutaneously, or via irrigation or drains.
Studies in the United Kingdom have predominantly concentrated on the treatment of diarrhoealdisease, mainly caused by Escherichia coli, using animal models.8 Soothill9 treated experimental S. aureus infections in mice with bacteriophage. Bacteriophage and S. aureus (the same strains as hadbeen used in some of the Polish studies) were injected intraperitoneally simultaneously. In thissituation bacteriophage was not protective although infections involving Acinetobacter baumanii andPseudomonas aeruginosa could be prevented by their respective bacteriophages.
As with other alternative therapies, there have been concerns about the safety of bacteriophagetherapy. One concern has been the development of antiphage antibody during therapy. This wasassessed in Poland in 57 patients following oral administration of bacteriophage and found nomeasurable antibody in 44 patients during treatment. In two cases high titre antibody developed.10
Another major problem has been the presence of various toxins in crude phage lysates, however, thiscan now be addressed during preparative process.11 The bioavailability of phage administered systemat-ically has also been a concern, with early studies indicating that phage was quickly cleared by thereticuloendothelial system. Mutant phages with the ability to evade the reticuloendothelial systemhave now been produced.11 It is possible that bacteria will ultimately become resistant to phage lysisin the same way that antibiotic resistance has emerged. However, phage used as a single dose, maybe less likely to result in resistance than using antibiotics for a long period. Other problems includethe observation that some methicillin-resistant S. aureus (MRSA) seem to be inherently lesssusceptible to bacteriophages than antibiotic-susceptible S. aureus. Finally, there is concern of thepossibility of lysogenic conversion, whereby bacteriophage could acquire various toxin genes andintroduce these into susceptible bacteria. The likelihood of this occurring, or of virulence genes beingintroduced by transduction, is unknown.

S146 Antimicrobial Resistance in Australia
PhytomedicinesPhytomedicines are plant-derived remedies and many, such as tea tree oil (TTO), honey and cranberryjuice, are targeted towards infectious diseases. TTO is the essential oil derived from certain speciesof Australian native plants in the genus Melaleuca, mainly Melaleuca alternifolia.12 Originally developedin the pre-antibiotic era, its antimicrobial properties were first reported in the 1920s when it wasshown to be more active than one of the widely used disinfectants of the day, phenol.12 The anti-microbial activity and tolerability of TTO made it a popular skin antiseptic for the next 20 years. Thedawn of the antibiotic era precipitated the demise of interest in TTO which could not compete withthe potency and selective toxicity of the new agents. Consequently, TTO was discarded as an anti-microbial agent before its properties could be elucidated fully. Sixty years later, the widespreadoccurrence of multiple antibiotic-resistant organisms in hospital and community settings suggestsnew antimicrobial agents, preferably with novel mechanisms of action, are required and it seemsprudent to re-examine previously superseded products such as TTO. In vitro, TTO has broad spectrumantibacterial activity13 including activity against MRSA.14 Antifungal and antiviral properties have alsobeen demonstrated in vitro and preliminary in vivo work suggests that it may be useful in the treatmentof acne15 and oral candidiasis,16 and in the decolonisation of MRSA carriage.17 An understanding of itsmechanisms of action against bacteria is being reached18,19 and it appears that multiple mechanismsare involved, perhaps diminishing the rate at which resistance is likely to develop.
In contrast to TTO, honey has a much longer recorded history of medicinal use. Scattered reports inthe medical literature describe the antibacterial properties of honey and honey products, and theirpotential as antimicrobial agents, particularly in wound care.20 More recently, in vitro antibacterialactivity has been described and a wide range of organisms is inhibited by honey including E. coli,Proteus mirabilis, Ps. aeruginosa, Enterococcus faecalis 21 and Helicobacter pylori.22 The activity of honeyhas been attributed to the high osmolarity, the low pH and the presence of hydrogen peroxide.However, these factors alone or in combination do not account for all of the antibacterial activity andthe identity of the main antimicrobial component of some honeys and its mechanism of action remainsunclear.
Cranberries were used by North American Indians for food and medicine and they still enjoy popularitytoday. Commercially available cranberry juice may be useful in the treatment and prevention of urinarytract infections. Its putative medicinal properties have been partly investigated with occasionalpapers appearing in the medical literature. In a recent study, the effect of regular cranberry juiceconsumption on the recurrence of urinary tract infections was examined.23 The time to first recurrenceof a symptomatic urinary tract infection was compared in three groups of women randomised toreceive daily 50 mL of European cranberry juice, 100 mL of a Lactobacillus GG drink or no intervention.Of the 50 patients randomised to cranberry juice, the cumulative rate of first recurrence of urinarytract infections during the 12-month follow-up was significantly reduced compared to the 50 patientsreceiving no intervention. In contrast, consumption of the Lactobacillus GG drink offered no benefit.Earlier work by Avorn et al.24 suggested that daily ingestion of 300 mL of cranberry juice reduced thefrequency of bacteriuria with pyuria in older women. A number of mechanisms have been postulatedalthough a direct antibacterial effect and acidification of the urine have been excluded as the primarymechanisms of action. Exposure of uropathogenic E. coli to cranberry juice or extracts diminishesexpression of P-fimbriae and inhibits their adherence to uroepithelial cells.25 Similar work has shownthat a high molecular weight constituent of cranberry juice can inhibit H. pylori adhesion to gastricmucosa.26 While cranberry juice may not prove to be an effective treatment for current urinary tractor H. pylori infections, it may prevent de novo infections or prevent reinfection.
ConclusionsAlternative therapies are viewed favourably by many patients because they are often not being helpedby conventional therapy and they believe there are fewer detrimental side effects. In addition, manyreport significant improvement while taking complementary and alternative medicines. Unfortunately,the medical profession has been slow to embrace these therapies and good scientific data are scarceat present.3 However, as we approach the 'post-antibiotic era' the situation is changing. Furtherresearch is needed to validate the claims made for alternative therapies.

Antimicrobial Resistance in Australia S147
References1. MacLennan AH, Wilson DH, Taylor AW. Prevalence and cost of alternative medicine in Australia. Lancet
1996;347:569–573.
2. Filho-Lima JVM, Viera EC, Nicoli JR. Antagonistic effect of Lactobacillus acidophilus, Saccharomyces boulardii andEscherichia coli combination against experimental infections with Shigella flexneri and Salmonella enteritidis subsp.Typhimurium in gnotobiotic mice. J Appl Microbiol 2000;88:365–370.
3. Golledge CL, Riley TV. 'Natural' therapies for infectious diseases. Med J Aust 1996;164:94–95.
4. Hatakka K, Savilahti E, Ponka A, Meurman JH, Poussa T, Nase L, et al. Effect of long term consumption ofprobiotic milk on infections in children attending day care centres: double blind, randomised trial. BMJ2001;322;1327–1331.
5. McFarland LV, Bernasconi P. A review of a novel biotherapeutic agent: Saccharomyces boulardii. Microb EcologyHealth Dis 1993;6:157–171.
6. Alisky J, Iczkowski K, Rapoport A, Troitsky N. Bacteriophages show promise as antimicrobial agents. J Hosp Infect1998;36:5–15.
7. Slopek S, Weber-Dabrowska B, Dabrowski M, Kucharewicz-Krukowska A. Results of bacteriophage treatment ofsuppurative bacterial infections in the years 1981–1986. Arch Immunol Ther Exp 1987;35:569–583.
8. Smith HW, Huggins MB. Successful treatment of experimental Escherichia coli infections in mice using phage: itsgeneral superiority over antibiotics. J Gen Microbiol 1982;128:307–318.
9. Soothill JS. Treatment of experimental infections of mice with bacteriophages. J Med Microbiol 1992;37:258–261.
10. Kucharewicz-Krukowska A, Slopek S. Immunogenic effect of bacteriophage in patients subjected to phagetherapy. Arch Immunol Ther Exp (Warsz) 1987;35:553–561.
11. Merril CR, Biswas B, Carlton R, Jensen NC, Creed GJ, Zullo S, et al. Long-circulating bacteriophage as anti-bacterial agents. Proc Natl Acad Sci USA 1996;93:3188–3192.
12. Carson CF, Riley TV. Antimicrobial activity of the essential oil of Melaleuca alternifolia. Lett Appl Microbiol1993;16:49–55.
13. Hammer KA, Carson CF, Riley TV. Susceptibility of transient and commensal skin flora to the essential oil ofMelaleuca alternifolia (tea tree oil). Am J Infect Control 1996;24:186–189.
14. Carson CF, Cookson BD, Farrelly HD, Riley TV. Susceptibility of methicillin-resistant Staphylococcus aureus to theessential oil of Melaleuca alternifolia. J Antimicrob Chemother 1995;35:421–424.
15. Bassett IB, Pannowitz DL, Barnetson RStC. A comparative study of tea tree oil versus benzoylperoxide in thetreatment of acne. Med J Aust 1990;153:455–458.
16. Jandourek A, Vaishampayan JK, Vazquez JA. Efficacy of Melaleuca oral solution for the treatment of fluconazolerefractory oral candidiasis in AIDS patients. AIDS 1998;12:1033–1037.
17. Caelli M, Porteous J, Carson CF, Heller R, Riley TV. Tea tree oil as an alternative topical decolonization agent formethicillin-resistant Staphylococcus aureus. J Hosp Infect 2000;46:236–237.
18. Cox S, Mann CM, Markham JL, Bell HC, Gustafson JE, Warmington JR, et al. The mode of action of the essentialoil of Melaleuca alternifolia (tea tree oil). J Appl Microbiol 2000;88:170–175.
19. Carson CF, Mee BJ, Riley TV. Mechanism of action of Melaleuca alternifolia (tea tree) oil on Staphylococcus aureusdetermined by time-kill, lysis, leakage, and salt tolerance assays and electron microscopy. Antimicrob AgentsChemother 2002;46:1914–1920.
20. Cooper RA, Molan PC, Krishnamoorthy L, Harding KG. Manuka honey used to heal a recalcitrant surgical wound.Eur J Clin Microbiol Infect Dis 2001;20:758–759.
21. Allen KL, Molan PC, Reid GM. A survey of the antibacterial activity of some New Zealand honeys. J PharmPharmacol 1991;43:817–822.
22. Al Somal N, Coley KE, Molan PC, Hancock BM. Susceptibility of Helicobacter pylori to the antibacterial activity ofmanuka honey. J R Soc Med 1994;87:9–12.
23. Kontiokari T, Sundqvist K, Nuutinen M, Pokka T, Koskela M, Uhari M. Randomised trial of cranberry-lingonberryjuice and Lactobacillus GG drink for the prevention of urinary tract infections in women. BMJ2001;322:1571–1575.
24. Avorn J, Monane M, Gurwitz JH, Glynn RJ, Choodnovskiy I, Lipsitz LA. Reduction of bacteriuria and pyuria afteringestion of cranberry juice. JAMA 1994;271:751–754.
25. Foo LY, Lu Y, Howell AB, Vorsa N. The structure of cranberry proanthocyanidins which inhibit adherence of uropathogenicP-fimbriated Escherichia coli in vitro. Phytochemistry 2000; 54:173–181.
26. Burger O, Ofek I, Tabak M, Weiss E I, Sharon N, Neeman I. A high molecular mass constituent of cranberry juiceinhibits Helicobacter pylori adhesion to human gastric mucus. FEMS Immunol Med Microbiol 2000;29:295–301.

Reviewers for CDI supplement 2003on antimicrobial resistance
The Communicable Diseases Intelligence editors thank the following reviewers for their assistance inproducing this supplement.
Mary Barton, Lindsay Blackburn, Angus Cameron, Keryn Christiansen, Peter Collignon, Celia Cooper,Scott Crear, Kevin Doyle, Gary Dowse, John Ferguson, Sandra Gebbie, Alex Geue, Stephen Glanville,Lyn Gilbert, Rod Givney, Ruth Hall, Linda Halliday, Martyn Kirk, Robyn Leader, Gary Lum, PeterMacIsaacs, John Mathews, Moira McKinnon, Graeme Nimmo, Eddie O’Brien, Kerry-Ann O’Grady, JohnPearman, Tom Riley, Lance Sanders, Terry Spencer, Ashley Watson, Lynn Weeks, Edwina Wright.
S148 Antimicrobial Resistance in Australia


