Embed Size (px)
Citation preview


National Libmy Bibliothèque nationale du Canada
Acquisitions and Acquisitions et Bibliographie Services services bibliographiques 395 Weüington Street 395. rue Wellington OttawaON K1AON4 OtiawaON K1AON4 Canada canada
The author has granted a non- exclusive licence allowing the National Lïbrary of Canada to reproduce, loan, distniute or sell copies of this thesis in m i c r o f q paper or electronic formats.
The author retains ownership of the copyright in this thesis. Neither the thesis nor substantial extracts fiom it may be printed or otherwise reproduced without the author's permission.
L'auteur a accordé une licence non exclusive permettant à la Bibliothèque nationale du Canada de reproduire, prêter, disidmer ou vendre des copies de cette thèse sous la forme da microfichelnlm, de reproduction sur papier ou sur format électronique.
L'auteur conserve la propriété du droit d'auteur qui protège cette thèse. Ni la thèse ni des extraits substantiels de celle-ci ne doivent être imprimés ou autrement reproduits sans son autorisation.

ABSTRACT
Worldwide, a great deal of research is currently being conducted concerning the use of fibre
reinforced plastic wraps or laminates in the repair and strengthening of reinforced concrete
members. It has been shown that such techniques can be both effective and economical when
compared to the existing practice of retrofitting with steel plates. One of the most significant
advantages of such systems is the labour cost savings achieved through their ease of
application. A novel technique which M e r simplifies the application procedure is to apply
the fibre using a spraying process. By spraying the fibres onto the member surface
concurrently with a suitable matrit resin, a two dimensional random distribution of
discontinuous fibres is obtained.
This work reports the first usage of a sprayed glass fibre reinforced plastic (GFRP) retrofit
system on reinforced concrete beams. Using E-glass fibres embedded in a polyester matrix, it
was shown that significant increases in load carrying capacity, member stifhess and fracture
energy can be achieved with such a system. A cornparison of results obtained fiom small
scale specimens with those available from current Literature was performed. The sprayed
glass FRP procedure produced results similar to those obtained with FRP fabric wraps or
plate bonding techniques for flexural strengthening. When used for shear strengthening, the
sprayed FRP outperformed a11 of the other techniques. An analysis technique was developed
to predict the ultimate load carrying ability of FRP retrofitted bearns as well as their load-
deflection behaviour up to failwe.

ABSTRACT
In the rehabilitation of large scale bridge channe1 beams, the sprayed FRP technique was
found to be more effective than a cornrnercially available continuous fabric system at
upgrading structural properties. An economic cornparison revealed that the material costs
associated with the sprayed approach c m result in a significant savings compared to that
same system.

TABLE OF CONTENTS
. . ............................................................... Abstract ri
....................................................... Table of Contents iv
........................................................ List of Symbols xiv
................................................... Acknowledgements xvii
... ........................................................... Dedication ~ ~ 1 1 1
Chapter 1 . Introduction 1.1.Overview ....................................................... 1
............................................... 1.2 . Problem Description 1 ...................................... 1.3 . Strengthening With Steel Plates 3
......................... 1.4 . Strengthening With Fibre Reinforced Polymers 3 1.5 . Shidy Objective .................................................. 5
Chapter 2 . Literature Survey 2.l.Introduction ..................................................... 6 2.2.FRPMaterials .................................................... 8
............................................... 2.3 - Previous Research 11
Chapter 3 . Materials ............................................... 3.1 . Concrete Materials 24
............................................ . 3.1.1 Portland Cernent 24 3.1.2.Water .................................................... 25
................................................ 3.1.3 - Aggregates 25 3.1.4-Admixtures ................................................ 25
............................................... 3.2 - Mix Proportioning 26 ................................................. 3.3 - GFRP Materials 27
..................................................... 3.3.1-Resin 27 ................................................... 3.3.2 - Catalyst 28
............................................ 3.3.3 - Coupling Agent 29 ......................................... 3.3.4 - Glass Fiber Rovings 29
.......................................... 3.3.5 - Glass Fiber Fabrics 31 ............................................ 3.3.6 - race@ system 32
3.3.7-Solvent ................................................... 33

TABLE OF CONTENTS
Chapter 4 . Sprayed GFRP Application Process 4.14ntroduction .................................................... 34 4.2-Equipment ...................................................... 35 4.3-GeneralOperation ............................................... 39
Chapter 5 . Sprayed GFRP Material Properties 5.1.Introduction .................................................... 42
................................................ 5.2 - Tensile Properties 42 ............................................. 5.2.1 - Test Procedure 43
........................................ 5.2.2 - Results & Discussion 48 5.3-Density ........................................................ 51
............................................. 5.3.1 -Testprocedure 51 ........................................ 5.3.2 - Results & Discussion 52
............................................ 5.4 - Fiber Volume Fraction 54 ............................................. 5.4.1 - Test Procedure 54
........................................ 5.4.2 - Results & Discussion 55 .............................................. 5.5 - Theoretical Analysis 56
............................................ 5.5.1 - Tensile Strength 56
............................................ 5.5.2 - Elastic Modulus 69
Chapter 6 . Beam Strengthening 6.1.Introduction .................................................... 73
............................................ 6.2 - Laboratory Specimens 74 ........................................ 6.2.1 - Specimen Preparation 74
........................................... 6.2.2 - Testing Procedure 75
........................................... 6.2.3 - Retrofit Schemes 78 6.2.4 - Flexural Strengthening
.......................................... 6.2.4.1 -BearnDesig-n 82 ........................................ 6.2.4.2 - Testing Program 83
.................................... 6.2.4.3 - Results & Discussion 85 ......................................... 6.2.5 - Shear Strengthening 96
.......................................... 6.2.5.1 - Beam Design 96 ..................... 6.2.5.2 - Initial Study on Repair & Strengthening 97
. . . . . . . . . . . . . . . . . . . . . . . . . . . 6.2.5.2.1 - Normal Strength Concrete 98 ............................ 6.2.5.2.2 - High Strength Concrete 108
.................................. 6.2.5.3-EffectofFRPStrength 113 ................................. 6.2.5.4 - Effect of FRP Thickness 124
.................................. 6.2.5.5 - Effect of Fiber Length 132

TABLE OF CONTENTS
Chapter 6 . Beam Strengthening (cont'd) 6.2.5.6 . Comparison of Fabric Wraps & Sprayed FRP
6.2.5.6.1 . Fabric Wrapped Specimens ......................... 139 6.2.5.6.2 . Sprayed Specimens ................................ 148 6.2.5.6.3 . Cornparison ...................................... 156
6.2.6 . Cornparison With Published Data ............................. 162 6.2.6.1 . Flexural Strengthening .................................. 162 6.2.6.2 . Shear Strengthening .................................... 167
6.2.7 . Result Variability .......................................... 170 6.3 . Full-Scale Specimens ............................................ 171
6.3.1 -BeamDescription .......................................... 171 6.3.2 . Specimen Preparation ....................................... 173 6.3.3.TestingProgram ........................................... 177 6.3.4 . Results & Discussion ....................................... 179
Chapter 7 . Theoretical Analysis of Sprayed FRP Beam Retrofits 7.14ntroduction ................................................... 187 7.2 - Ultimate Load Prediction
7.2.1 - Material Characteristics ..................................... 188 7.2.2 - Flexural Strength .......................................... 192 7.2.3 - Effect of Confinement ...................................... 206 7.2.4 - Shear Strength ............................................ 208
7.2.4.1 - Sirnplified Method ..................................... 209 7.2.4.2-GeneralMethod ....................................... 212
7.2.5 - Cornparison with Experimental Results ......................... 215 7.2.5.1 - Flexural Strengthening Specimens ......................... 216 7.2.5.2 - Shear Strengthening Specïmens ........................... 220
7.3 - Load-Deflection Prediction ....................................... 224 7.3.1 - Matenal Characteristics ..................................... 225 7.3.2 - Flexural Strengthening Specimens . . . . . . . . . . . . . . . . . . . . . . . . . . . . . 232 7.3.3 - Shear Strengthening Specimens . . . . . . . . . . . . . . . . . . . . . . . . . . . . . . . 238
7.4 - Discussion 7.4.1 - Beam Faihre Mechanism .................................... 243 7.4.2 - Bond Performance ......................................... 244
Chapter 8 . Economic Evaluation 8.14ntroduction ................................................... 249 8.2 . Material Cost . Sprayed GFRP ..................................... 250 8.3 . Material Cost . race@ ~ystern ................................... 252 8.4.Comparison .................................................... 254

TABLE OF CONTENTS
Chapter 9 . Conclusions & Recommendations 9.1.Conclusions ................................................... 256
.............................. 9.1 - Recomrnendations for Fume Research 259
References ..................................................... 262
Appendices ..................................... A . Matenal Property Testing Data 273
............................................ B . Flexural Strengthening 283 C . Shear Strengthening . Initial Study (Normal Strength Concrete) ............ 289
.............. D . Shear Strengthening . Initial Study (High Strength Concrete) 296 .......................... . . E Shear Strengthening Effect of FRP Strength 302 ......................... . . F Shear Strengthening Effect of FRP Thickness 309
.......................... . . G Shear Strengthening Effect of Fiber Length 315 ........................ H . Shear Strengthening . Wrap/Spray Cornparison 321
...................... 1 . Rehabilitation of Full Scale Bridge Channel Beams 330 .......................................... J . Theoretical Analysis Data 333

LIST OF TABLES
Table 3.1. Mix proportions . normal strength (-45 MPa) concrete . . . . . . . . . . . . . . . . 26 Table 3.2. Mix proportions . high strength (-80 MPa) concrete .................. 27 Table 3.3. Properties of K-1907 polyester resin ............................... 28 Table 3.4. Properties of Derakane 8 0 8 4 ~ vinyl ester resin ....................... 30 Table 3.5. Properties of ~ d v a n t e x ~ @ass fiber ................................ 30 Table 3.6. Properties ofMB saturantm epoxy resin ............................ 32 Table 5.1. GFRP average tensile properties .................................. 48 Table 5.2. Average composite density ...................................... 53 Table 5.3. Average fiber content ........................................... 55 Table 5.4. Empirical volume fiactions by fiber length .......................... 66 Table 6.1. Project phase descriptions . labomtory beam testing ................... 74 Table 6.2. Flexural strengthening specimen groups ............................ 84 Table 6.3. Flexural strengthening test results ................................. 86 Table 6.4. Sbear strengthening investigations ................................ 96 Table 6.5: Shear strengthening . Phase 2 specimen groups (initial study. normal
strengthconcrete) ................................................. 99 Table 6.6: Shear strengthening - Phase 2 test results (initial study, normal strength
....................................................... concrete) Table 6.7: Shear strengthening . Phase 2 specimen groups (initial study. high
................................................ ~ t r e n ~ c o n c r e t e ) Table 6.8: Shear strengthening - Phase 2 test results (initial study, high strength
concrete) ....................................................... Table 6.9. Shear strengthening - Phase 3 specimen groups (FRP strength effect) .... Table 6.10. Shear strengthening - Phase 3 test results (FRP strength effect) ........ Table 6.11: Shear strengthening - Phase 3 combined test results (FRP strength effect) Table 6.12: Shear strengthening - comparison of test results for different
FWstrenMs ................................................... Table 6.13. Shear strengthening - Phase 4 specimen groups (FRP thickness) ....... Table 6.14. Equivalent thickness of passAayer combinations ................... Table 6.15. Shear strengthening - Phase 4 test results (FRP thickness) ............ Table 6.16. Fiber lengths available with 12-blade rotor ........................ Table 6.17. Shear strengthening -Phase 5 specimen groups (fiber lengîh) ......... Table 6.18. Shear strengthening - Phase 5 test results (fiber length) .............. Table 6.19. Shear strengthening - Phase 6 specirnen groups (fabnc wrapping) ...... Table 6.20. Shear strengthening - Phase 6 test results (fabric wrapping) ...........

LIST OF TABLES
Table 6.21. Shear strengthening . Phase 6 specimen groups (sprayed) ............ 148 Table 6.22. Shear strengthening . Phase 6 test results (sprayed) ................. 149 Table 6.23. Shear strengthening . Phase 6 wrap/spray cornparison (Scheme C) ..... 157 Table 6.24. Shear strengthening . Phase 6 wrap/spray cornparison (Scheme D) ..... 158 Table 6.25. Flexural strengthening results compared to literature survey .......... 163 Table 6.26: Comparison with previously published results . flexural strengthening . . 165 Table 6.27. Cornparison with previously published results . shear strengthening . . . . 168
................................ Table 6.28: MOTH channel beam test results 179 ................ Table 6.29. MOTH channe1 beams . stiffening effect of retrofits 180
...................... Table 7.1. GFRP stress-strain relationship by fiber length 191 Table 7.2: Flexural strength analysis sequences and results . flexural
.......................................... strengthening specimens 217 Table 7.3. Shear streagth analysis results . fiexural strengthening specimens ....... 218 Table 7.4: Comparison of theoretical vs . experimental results . flexural
.......................................... strengthening specimens 219 Table 7.5: Flexural strength analysis sequences and results . shear
strengtheningspecimens .......................................... 221 . . . . . . . . . Table 7.6. Shear strength analysis results . shear strengthening specimens 222
Table 7.7: Comparison of theoretical vs . experimental results . shear .......................................... strengthening specimens 222
Table 7.8: Comparison of theoretical vs . experimental results . flexural strengtheningspecimens .......................................... 238
Table 7.9: Cornparison of theoretical vs . experimental results . shear .......................................... strengthening specimens 242
Table 8.1. Pricing, densities and coverage of sprayed GFRP components .......... 250 ...................... Table 8.2. Pricing and coverage of MBraceB components 252
Table 8.3. Matenal cost comparison . race@ system vs . sprayed GFRP ......... 254

LIST OF FIGURES
Figure 2.1. FRP delamination due to shear cracking ........................... 13 Figure 4.1. GFRP spraying equipment ...................................... 35 Figure 4.2. GFRP spraying equipment . slave arm arrangement .................. 36 Figure 4.3. GFRP spraying equipment O spraylchopper gun details ................ 38
....................................... Figure 4.4. GFRP spraying operation 40 Figure 5.1. GFRP tensile strength specimen dimensions ........................ 44 Figure 5.2. GFRP tensiie strength specimen spraying .......................... 46
............... Figure 5.3. GFRP tensile strength specimen fabrication orientation 46 Figure 5.4. GFRP elongation measurement apparatus . . . . . . . . . . . . . . . . . . . . . . . . . . 47
................................. Figure 5.5. GFRP average tensile properties 50 ..................................... Figure 5.6. GFRP stress-strain response 50
Figure 5.7. Typical fiber and matrix stress-strain behavior for glass/polyester ....... 58 Figure 5.8. Variation of FRP tensile strength with fiber volume fraction ........... 59
................................ Figure Sb: Composite density by fiber length 64 Figure 5.10: Comparison of theoretical vs . experirnental tensile strengths of
........................................... sprayed FRP composites 68 Figure 5.11: Comparison of theoretical vs . experirnental elastic moduli of sprayed
.................................................. FRP composites 72 Figure 6.1. Laboratory scale beam test setup ................................. 75
.............................................. Figure 6.2. Retrofit schemes 79 ........................................ Figure6.3. Beam retrofit technique 80
. . . . . . . . . . . . . . . . . . . . . . . . . . . . . Figure 6.4. Flexural strengthening . beam design 82 Figure 6.5. Flexural strengthening . stimip location and spacing ................. 83 Figure 6.6: Flexural strengthening specimens . load-deflection curves
(undamagedlstrengthened bearns) .................................... 88 Figure 6.7: Flexural strengthening specimens . load-deflection curves
.......................................... (damagedrepaired beams) 88 Figure 6.8: Flexural strengthening specimens . typical load-deflection curves
................................. (strengthened vs . repaired specimens) 89 Figure 6.9. Flexural strengthening specimens . typical load-deflection curves ....... 90 Figure 6.10. Flexural strengthening specimens . typical energy absorption curves .... 91 Figure 6.11: Flexural strengthening specimens . typical failure of Scheme C specimens 92 Figure 6.12: Flexural strengthening specimens . typical failure of Scheme D specimens 94 Figure 6.13: Flexural strengthening specimens . typical failure of Scheme E specimens 95 Figure 6.14. Shear strengthening . beam design ............................... 97 Figure 6.15: Shear strengthening . Phase 2 typical load-deflection curves (initial
study. strengthened vs . repaired specimens. normal strength concrete) ...... 103 Figure 6.16: Shear strengthening . Phase 2 typical load-deflection curves (initial
.................................... study. normal strength concrete) 104

LIST OF FIGURES
Figure 6.17: Shear strengthening - Phase 2 typical energy absorption curves (initial study, normal strength concrete) ....................................
Figure 6-18: Shear strengthenùig - Phase 2 typical shear failure of control specimens, ........................................... side view (initial study)
Figure 6.19: Shear strengthening - Phase 2 typical GFRP debonding, Scheme C .................................... specimen top view (initial study)
Figure 6.20: Shear strengthening - Phase 2 typical GFRP tensile failure in Scheme D specirnens, side view (initial study) ..................................
Figure 6.21: Shear strengthening - Phase 2 typical load-deflection curves (initial study, strengthened vs. repaired specimens, high strength concrete) . .
Figure 6.22: Shear strengthening - Phase 2 typical energy absorption curves (initial study, high strength concrete) ................................
Figure 6.23: Shear strengthening - Phase 3 typical load-deflection curves ......... Figure 6.24: Shear strengthening - comparison of typical load-deflection curves
........................................ for different FRP strengths Figure 6.25: Shear strengthening - Phase 3 typical energy absorption curves
(104MPaFRP) ................................................. Figure 6.26: Shear strengthening - Phase 3 typical energy absorption curves
........................................ (104MPaFRP,rnagnified) Figure 6.27: Shear strengthening - f hase 4 typical load-deflection curves by
FRPthickness .................................................. Figure 6.28: Shear strengthening - Phase 4 typical load-deflection curves by
FRPthickness(SchemeC) ........................................ Figure 6.29: Shear strengthening - Phase 4 typical load-deflection curves by
........................................ FRP thickness (Scheme D) Figure 6.30: Shear strengthening - Phase 4 typical energy absorption curves by
FRPthickness .................................................. Figure 6-31: Shear strengthening - Phase 5 typical load-deflection curves by
fiberlength ..................................................... Figure 6.32: Shear strengthening - Phase 5 typical energy absorption curves by
fiberlength ..................................................... Figure 6.33: Shear strengthening - Phase 6 load-deflection curves for
.................................. Scheme C bearns (fabric wrapping) Figure 6.34: Shear strengthening - Phase 6 load-deflection curves for
.................................. Scheme D bearns (fabric wrapping) Figure 6.35: Shear strengthening - Phase 6 energy absorption curves for
.................................. Scheme C bearns (fabric wrapping) Figure 6.36: Shear strengthening - Phase 6 energy absorption curves for
.................................. Scheme D bearns (fabric wrapping)

Figure 6.37: Shear strengthening . Phase 6 energy absorption curves for 1 layer (fabricwrapping) ................................................ 147
Figure 6.38: Shear strengthening . Phase 6 energy absorption curves for 3 layers (fabricwrapping) ........................................... 147
Figure 6.39: Shear strengthening . Phase 6 typical load-deflection curves (sprayed) . 15 1 Figure 6.40: Shear strengthening . Phase 6 typical energy absorption curves
(sprayed) .................................................... 152 Figure 6.41: Shear strengthening - Phase 6 typical energy absorption curves
(sprayed. magnified) ............................................. 152 Figure 6.42. Shear strengthening . typical failure of control specimens ........... 153 Figure 6.43. Shear strengthening . typical debonding failure (Scheme A) ......... 154 Figure 6.44. Shear strengthening . typical crushing failure (Scheme C) ........... 155 Figure 6.45. Shear strengthening . typicaI FRP tensile failure (Scheme D) ......... 155 Figure 6.46: Shear strengthening . Phase 6 typical load-deflection curves
................................. (wraplspray cornparison. Scheme C) 159 Figure 6.47: Shear strengthening . Phase 6 typical load-deflection curves
................................. (wraplspray cornparison. Scheme D) 160 .............................. Figure 6.48. MOTH channel beam dimensions 172
Figure 6.49. MOTH channel beam reinforcement details ...................... 172 ..................... Figure 6.50. MOTH channel bearn sprayed GFRP location 176
.......... Figure 6.51. MOTH channel beam wrapped specimen fabric orientation 176 ..................... Figure 6.52. Schematic of MOTH channel bearn test setup 178
Figure 6.53. Photograph of MOTH channel beam test setup .................... 178 Figure 6.54. MOTH charnel bearns . initial stiffhess results .................... 181 Figure 6.55. MOTH channel beams . peak load results ........................ 182 Figure 6.56. MOTH channel beams . energy absorption results . . . . . . . . . . . . . . . . . 182 Figure 6.57. MOTH channel beams . load-deflection curves .................... 183 Figure 6.58. MOTH channel bearns . energy absorption curves ................. 184
..... Figure 6.59. Failure of MOTH channel bearn retrofitted with MBracea system 186 ....... Figure 6.60. Failure of MOTH channel beam retrofitted with sprayed GFRP 186
Figure 7.1. Stress-strain relationship . reinforcing steel ........................ 189 Figure 7.2. Stress-strain relationship . sprayed GFRP ......................... 191
....... Figure 7.3. Flexural analysis of conventionally reinforced concrete sections 192 ...... . Figure 7.4. Flexurat analysis of RC sections retrofitted with FRP Scheme E 196
....... Figure 7.5. Cracking pattern exhibited by sprayed GFRP on sides of beams 199 Figure 7.6: Flexural analysis of RC sections retrofitted with FRP . Scheme C
............................................. VRP in tension only) 201 Figure 7.7: Flexural analysis of RC sections retrofitted with FRP . Scheme C
..................................... (includes F M in compression) 201

Figure 7.8. Flexural analysis of RC sections retrofitted with FRP . Scherne D ...... 204 Figure 7.9. Effective compressive strength determination for confined concrete .... 207 Figure 7.10. Shear design of conventionally reinforced concrete sections ......... 209 Figure 7.11. Shear design of reinforced concrete sections retrofitted with FRP ..... 211 Figure 7.12: Tensile and compressive strength as a function of fiber orientation
for a unidirectional fiber composite .................... ,. ............ 214 . Figure 7.13. Stress-strain relationship reinforcing steel ..... .. .. .............. 227
Figure 7.14. Mander mode1 for confined concrete ............................ 228 . Figure 7.15. Stress-strain relationship concrete (flexural beams) . . . . . . . . . . . . . . . 230 . Figure 7.16. Stress-strain relationship concrete (shear bearns) ................. 231 . Figure 7.17. Load-deflection curves flexural beams (controls) ................. 233 . Figure 7.18. Load-deflection curves flexural beams (Scheme E) ............... 234 . Figure 7.19. Load-deflection curves flexural beams (Scheme C) ............... 235 . Figure 7.20. Load-deflection c w e s flexural beams (Scheme D) ............... 236 . Figure 7.21. Load-deflection curves flexural beams (Scheme D extended) . . . . . . . 237 . Figure 7.22. Load-deflection curves shear beams (controls) ................... 239 . Figure 7.23. Load-deflection curves shear bearns (Scheme A) ................. 240 . Figure 7.24. Load-deflection curves shear bearns (Scheme C) ................. 241 . ................. Figure 7.25. Load-deflection curves shear beams (Scheme D) 242
..................... Figure 7.26. Stress distribution in a laminate at a fiee edge 247

LIST OF SYMBOLS
a = depth of compression block A, = area of fiber A, = area of FRP on bottorn of beam A, = area of longitudinal reinforcing steel A, = area of steel shear reinforcement b = b, = width of beam c = depth fiom top of beam to neutral axis Cc = compressive force in concrete C , = compressive force in FRP on side of bearn above neutral axis C , = compressive force in FRP on top of bearn C , = strength correction factor for voids d = d, = effective depth fiom top of beam to centroid of reinforcing steel &= diameter of fiber
= effective depth fiom top of beam to centroid of bottom FRP E, = longitudinal elastic modulus of a continuous unidirectional fiber composite E, = transverse elastic modulus of a continuous unidirectional fiber composite E, = elastic modulus of fiber E,, = elastic modulus of a random discontinuous fiber composite E, = elastic modulus of matrix Pc = ultimate compressive strength of concrete f',, = confmed compressive strength of conçrete f,= f, = f,, = f, = f, = Fm = ultirnate tensile strength of FRP f, = yield strength of steel F,, = ultirnate longitudinal tensile strength of a continuous unidirectional fiber composite F,, = ultimate transverse tensile strength of a continuous unidirectional fiber composite F, = inplane shear strength of a continuous unidirectional fiber composite G, = shear modulus of fiber G, = shear modulus of matrYr h = height of beam 4 = height of FRP on side of beam K = confined strength ratio K, = confinement effectiveness coefficient L = length of beam L, = length of fiber %, = maximum moment
= moment resistance of beam Pu,, = ultimate load carrying capacity of beam R = mean fiber separation in composite R, = radius of curvature of bearn

LIST OF SYMBOLS
& = radius of fiber s = spacing of shear stirrups t = t, = thickness of FRP T, = tensile force in FRP on bottom of beam T,, = tensile force in ERP on side of beam below neutral axis T, = tensile force in steel V, = V, = shear resistance contribution of concrete V, = volume of catalyst V, = volume fraction of fiber V, ,, = minimum effective volume fraction of fiber V, = volume of fiber V, = V, = shear resistance contribution of FRP V, = volume fraction of matrix V, = V, = shear resistance of concrete beam V, = volume of resin V, = V, = shear resistance contribution of steel reinforcement V, = volume fraction of voids a, = longitudinal tensile stress in a continuous unidirectional fiber composite a, = stress in fiber a', = stress in fiber at E,, a, = ultimate strength of fiber a, = stress in matrix a,,, = ultimate strength of matrix E, = strain in concrete E,, = strain at extreme upper surface of concrete beam E, = ultimate compressive strain of concrete E, = ultimate confined compressive strain of concrete E, = strain in FRP on bottom of beam cfsb = strain in FRP on side of beam below neutral axis r;,, = strain in FRP on side of beam above neutral axis E~ = strain in FRP on top of beam eh = ultimate strain of fiber s,, = ultirnate strain of rnatrix E, = strain in steel v, = Poisson's ratio of fiber v, = Poisson's ratio of rnatrix 6 = 6, = deflection at midspan 6,, 6, = settlement in testing supports A = adjusted deflection at midspan

LIST OF SYMBOLS
t, = shear stress in matrix rmu = ultimate shear strength of matrix p, = density of fiber pfm = density of FRP composite
- density of matrix P m - p, = transverse reinforcement area ratio in x-direction p, = transverse reinforcement area ratio in y-direction 4 = curvature of bearn (0, = resistance factor for concrete (0, = resistance factor for FRP 4, = resistance factor for steel B = coeficient of diaision qr = efficiency factor for discontinuous fibers q = correction factor for fiber shape C = shape parameter of fiber

The author would like to extend sincere gratitude to those who contributed to this research
and to those who made it possible. First and foremost the author wishes to thank Dr. Nemy
Banthia for his invaluable understanding, s u p e ~ s i o n and guidance. Without these, this work
would never have been completed. Recognition is also due to the organizations and agencies
who contributed to this research project, particularly the Network of Centres of Excellence
ISIS program, the Natural Sciences and Engineering Research Council of Canada and the
Ministry of Transportation and Highways of British Columbia.
For their outstanding performance, acknowIedgment is owed to the technical staff of the
Civil Engineering Department, especially Harald Schrempp, John Wong and Doug Smith. In
many instances, these technicians went out of their way to assist the author with equipment
fabrication and setup. Their efforts are much appreciated. Also appreciated are the efforts of
the many graduate and undergraduate students who participated in this project, particularly
David Flynn, Martin Johnson and Sherrill Ross.

For Edith;
Without whose help. support. consoling and comforting ... I would never have made
it. And without whose love ... 1 wouZdn 't have cared. nank you from the bottom of my heart,

Introduction
1.1 - Overview
The research project described within this thesis deals with the strengthening or
rehabilitation of existing reinforced concrete beams through the use of a sprayed fiber
reinforced polyrner composite. By applying a coating of fiber reinforced polyrner to the outer
surface(s) of a concrete beam to provide additional reinforcement, it is possible to increase
the load canying capacity, stifmess and energy absorption potential of the member.
1.2 - Problem Description
One of the biggest probiems facing the construction industry today is the structural
inadequacy of a large proportion of our transportation infrastructure. Throughout the world,
transportation agencies are constantly faced with the need to upgrade, repair and maintain
deteriorathg structures, a task which is made even more dificult by shrinking resources,

budgets and manpower. lJ A great many of these structures were designed in the 1950s and
60s and no longer meet the demands placed on them. As an example of the magnitude of this
problem, over 40% of al1 bridges in the United States are currently considered to be
stmcturally deficient.
Such structural deficiency could be a result of several factors. From a repair viewpoint,
deterioration or damage to the structure fkom durabiiiq related issues or vehicle inipact are
probably the most significant factors. Revisions to building codes or changes in the original
purpose of a structure, such as the need to ca ry heavier loads or higher traffic volumes can
spawn the need to upgrade its structural capacity. *"" In addition, the greater importance
placed upon the seismic response of structures in recent years also adds to the need for
rehabilitation of older structures.
Of particular relevance to the upgrading or strengthening issue is the shear strength of
reinforced concrete beams. Existing beams can be deficient in shear strength for several
reasons, including shear deficient design procedures in older codes, increased service loads
on the structure and corrosion of the shear stirrups (which are typically placed outside the
flexural reinforcement and are thus protected by less cover concrete). '24S
The obvious solution to this problem is to sirnply demolish the deficient structures and
replace them with new ones. Unfortunately, the econornics of today's world make this
solution impractical. l" The o d y remaining alternative then, is to repair andor upgrade these
structures to modern standards. Some form of extemal reinforcement is needed to repair and
2

strengthen these deficient structures.
1.3 - Strengthening With Steel Plates
In the past, post-reinforcement of concrete structures was primarily accomplished through
the use of steel plates bonded to the surface of the structural rnernbers. Though it has been in
use for over 25 years now, there are a nurnber of concems associated with this technique.
Difficulties in handling the heavy steel plates, susceptibility to corrosion at the steeVadhesive
interface, difficulties in fonming acceptable butt joints in the field (necessary due to the
lirnited available lengths of steel plate) and the sheer amount of labor and time involved
make this technique much less attractive. 1v3J"8~11~1"19
1.4 - Strengthening With Fiber Reinforced Polymers
In recent years, a great deal of research has been conducted into the use of fiber reinforced
polymers in place of steel for the strengthening of reinforced concrete mernbers. A fiber
reinforced polymer (Fm) is a composite material made up of two distinct, independent
elements. The primary structural component is the fibers, which are encapsulated by a matrix
composed of some type of polymer. The basic theory behind the creation of such a material
is to use the fibers, which are significantly stronger than the rnatrix in tension, to carry any
tensile stresses applied to the composite matenal. A variety of different fiber types can be
used for this purpose, with the most common being glass, carbon and aramid.
3

The polymer whîch makes up the matrix portion of the composite typically serves a dual
purpose:
1. protect the fibers Çom extemal darnage or environmental attack and
2. transfer tensile stresses fiom one fiber to another and from an external load source
to the fibers.
For fiber reinforced polymers loaded in flexure, the polyrneric matrix is also responsible for
providing compressive strength in the region above the neutral axis while the fibers provide
the tensile strength necessary below the neutral axis, much like the roles of concrete and steel
in reinforced concrete beams. Due to a low compressive strength of most polymers and the
inefficiency of the fibers in such loading configurations, fiber reinforced polymers are rarely
used solely to resist compressive stresses or moments. Corntnon matrix polymers include
polyesters, vinyl esters and epoxies.
There are a number of significant advantages associated with these materials. Unlike steel,
FRPs possess excellent corrosion resistance. Thcy also exhibit good fatigue resistance and a
very low coefficient of thermal expansion in the fiber orientation. High specific stiffness and
strength characteristics contribute to structural efficiency and their low densities rnake
physical implementation much easier. I J.7.9.1 O. 16,1750-22 Their electrornagnetic neutrality
(electrical neutrality as well in the cases of glass and ararnid fibers) c m be a usefiil benefit in
certain types of structures. The higher costs associated with these FRP materials is typically
offset by savings in labour when compared to the difficulty of steel plate jacketing. 3 * 1 6 ~ 1 7

Up to now, the majority of research into FRP strengthening has revolved around the use of
laminated plates or woven fiber fabrics which are epoxy-bonded to the concrete surface.
Strengthening of unreinforced concrete specimens with sprayed FRP was fxst studied at the
University of British Columbia by Banthia et alzJ4. The work presented here is part of a
continuing research program that investigates the effectiveness of this technique on
reinforced concrete members.
1.5 - Study Objective
The scope of this project was to investigate the use of sprayed fiber reinforced polyners as a
strengthening and repair method for existing reinforced concrete beams. The pnmary
objective was to determine whether such a system could be a feasible alternative to existing
techniques.

Literature Survey
2.1 - Introduction
As mentioned in Chapter 1, the research performed throughout this project invoived the use
of a sprayed FRP for the rehabilitation of reinforced concrete members. Since this is a novel
approach to the problem of rehabilitation, there has been limited research perfomed using
this technique and hence a limited number of publications available refemng to it. Though
the sprayed FRP technique itself has not been investigated extensively before, it is
essentially an extension of previous work done on other rehabilitation techniques.
Fundarnentally, these various approaches are al1 alike in that they al1 involve the attachent
of additional reinforcement to the outside of existing reinforced concrete members. This
chapter will discuss some of this other research and cover the different techniques used.
The initial work in this field revolved around the use of steel plates epoxy bonded to the face
of the concrete structure. 2553 This concept has moved well beyond the research stage and

has been used in practice for many years. The steel plates were typically bonded to the
tension face of concrete members and were effective at providing increased load carrying
ability and flexural stiffhess, while at the same time reducing deflections and cracking in the
member. '*17
Though, stnicturally, steel plate bonding is a very effective rehabilitation technique, there are
a number of serious problems associated with the use of steel in this manner; difficulties in
handling the heavy plates, susceptibility to corrosion at the steel/adhesive interface,
difficulties in forming acceptable butt joints in the field and the requirement of large
arnounts of labor and turie. 12596-8~'1~16-L3 StiIl, the use of steel plate bonding remained the
technique of choice for several years before alternatives began to appear.
The single largest problem with steel plate bonding is the interfacial corrosion issue since it
leads directly to bond failure and exfoliation of the steel plates. A matenal was needed that
could provide the necessary structural properties, while at the same time avoiding this
corrosion problern. Thus, in the mid 1980s the focus of plate bonding research shifted toward
fiber reinforced polymers (FRPs). Their immunity to the corrosion problems inherent with
ferrous metals made these materials an ideal substitute from a durability standpoint. Adding
their high specific stiffness and strength characteristics, as well as their low densities, made
FRPs a very appealing alternative to steel. 12*79*'0~L6~1720-22 The initial research into the use of
FRPs was conducted by U. Meier et al the Swiss Federal Laboratones for Materials Testing
and Research (EMPA). 2114135 This original research investigated the use of laminated FRP
plates as the reinforcement material.
7

Following the promising results reported at EMPA, a number of other researchers around the
world began their own investigations into this new area, though the motivation behind such
work tended to Vary fkom one region to another. 'O one of the earliest and largest programs
originated in Japan where the primary interest seemed to be in developing a sirnpler and
more efficient technique for upgrading the transportation structure. In North Arnerica,
the emphasis was on the repair of decaying structures, primarily due to corrosion of steel
reinforcement, though seismic upgrading was also a major thmst on the west Coast. Many
European researchers began looking at implementing the approach to upgrade or restore
damaged historical structures.
Other deviations began to appear as different fibers, resins and adhesives were investigated.
One of the major advances came fkom Japan, where the laminated FRP plates were replaced
by much thinner pre-impregnated sheets that significantly simplified field application.
Further modifications followed as woven or unidirectional fabrics became popular. Most of
the commercially available systems today consist of such fabrics which are applied dry and
irnpregnated manually by the contractor.
2.2 - FRP Materials
As mentioned in Section 1.1, the fiber types used in FRP strengthening procedures include
carbon, glass and ararnid, with carbon being by far the most popular due to its superior
stiffhess characteristics. 192136 Typical matrix resins include epoxies, vinyl esters and
polyesters, with epoxies being the material of choice due to their superior bonding
8
capabiiities with both the concrete and the fiber reinforcement and improved durability. 36
Between these two variables alone, a significant number of diffèrent FRP matenals have thus
far been investigated.
There are also a number of different formats that the FRP retrofit materials are used in- FRP
plate bonding techniques are typically perforrned using 0.5-2 mm thick unidirectional FRP
laminates. l h The FRP tow sheets preferred by the Japanese researchers (arnong others) are
significantly thinner, only 0.1 to 0.5 mm thick. " Both formats can be fabricated to the
desired width, whether it be the hl1 width of the retrofitted member or narrow strips spaced
at intervals similar to shear stirrups.
These FRP plates and sheets are manufactured using the pultrusion process and are thus
unidirectional with fibers ninning only in the longitudinal direction. As a result, the FRPs are
anisotropic, with their strength in the fiber direction being very high but witb very Little
strength perpendicular to the fiber direction. They do not exhibit a definite yield point, but
instead tend to behave linearly elastic up to failure. hherent in the manufachuing process,
these materials can be made to any required length, with the sheet materials being available
on endless bobbins, effectively eliminating the need for joints. '
Fabric reinforcement for FRPs cornes in a multitude of weave, fiber orientation and weight
combinations. In many cases, the fabrics are composed of unidirectional fibers with lines of
stitching running perpendicular to the fiber direction simply to hold the material together. A
combination of orientations can also be manufactured simply by aligning successive layers
9

of unidirectional fabrics at varying orientations and then stitching these layers together.
Originally, woven fabrics were used but later rejected since the changes in fiber direction as
they pass around each other can lead to reinforcement inefficiencies and stress
concentrations.
Application of a fabnc reinforced FRP generally consists of these basic steps:
- preparing concrete surface(cleaning, sealing cracks, rust proofing existing steel
reinforcement, smoothing, etc.),
- applying primer coat or coupling agent,
- appiying resin undercoat,
- placing fabric sheet,
- applying resin top coat and working the resin into the fabnc and
- applying finish coat or protective layer.
The laminated FRP plates or pre-impregnated sheets, on the other hand, require only that the
concrete surface be prepared (as above) and a layer of epoxy adhesive spread over the
surface onto which the FRP is placed. However, in order to optimize the composite action
between the FRP and concrete, the FRP surface must first ground to rernove the outermost
matrix-rich layer and expose the fibers. Pnor to placement, the bonding surface of the FRP
must be carefùlly cleaned with a solvent.

2.3 - Previous Research
As previously mentioned, FRPs were first used as external reinforcement to strengthen
reinforced concrete beams at the Swiss Federal Laboratones for Materials Testing and
Research (EMPA). 3fiw7*16~1734J5J7 This groundbreaking research was conducted by U. Meier
et al and examined the effectiveness of epoxy bonding thin CFRP plates to the underside of
reinforced concrete beams.
Meier et found that FRP strengthening of short, under-reinforced RC beams (2 m in
length) with CFRP laminates resulted in a significant increase in the ultimate load (nearly
100%) which was accompanied by a corresponding decrease in the deflection at this load
(-50%). In the case of a seven metre long RC bearn containing properly designed steel
reinforcement, the increase in ultimate load was 22%. The reduction in bearn deflection at
failure was a direct result of the CFRP's higher stifThess compared to steel.
Since these bearns were under-reinforced in flexure, the failure mode they exhibited was
tensile fiacture of the CFRP in the tension zone at the bottom of the member. Meier
described the failure process of these beams as follows:
"Af er the appearance of the first cracks in the concrete, the intemal steel reinforcement and the extemal CFRP laminate are carrying the tensile stresses. A soon as the intemal steel bars reach yielding, only the CFRP laminate contributes to an additional increase in the load. Finally, the laminate fails in a brittle manner (tensile failure). .... there is less rotation of the strengthened beams but it is still sufficient to predict impending failure." "
Though these initial specimens did fail due to tensile fracture of the CFRP, later studies did
1 I

not always produce the same results due to differences in beam reinforcement. The failure
modes that were encountered by Meier et al include: 3y7*17-WJ5
- Tensile failure of the CFRP.
- Compressive failure of the concrete in the compression zone of the beam..
- Progressive delamination of the CFRP due to an uneven concrete surface.
- Abrupt delamination at the location of shear cracks in the concrete (see Figue 2.1).
- Interlaminar shear faiIure within the CFRP sheet.
- Tensile failure of the reinforcing steel in the tension zone.
- Shear failure of the concrete in the shear span.
There were also a nurnber of other faiIure modes that were hypothesized, though they were
not actually encountered, including: 7 ,343
- Cohesion failure within the adhesive.
- Adhesion failure at the CFRPfadhesive interface .
- Adhesion failure at the concrete/adhesive interface.
Figure 2.1 illustrates the initiation of delamination that can be caused due to formation of a
shear crack in the concrete. This effect became more pronounced as the thickness of the
laminate was increased. l7

Shear crack 1 Cracks due to bendin~ l
Peeling of the larntnate
Figure 2.1: FRP delamination due to shear cracking. "
Another effect induced by the CFRP larninate involves the pattern of flexural cracking
exhibited by the beams. It was discovered that the cracks became more evenly distributed
and that the total crack width was reduced. ' Though shear cracking tended to initiate
delamination (as described above), flexural cracks were spanned by the CFRP sheet and did
not influence loading capacity. '13' This trait bodes well for the use of such strengthening
techniques for the repair of damaged members.
Meier et al also exarnined the economic factors involved in using FRP strengthening to
replace steel plates. At the time (199 l), carbon fiber reinforced polymers were estirnated to
be about 50 times more expensive, per kilogram, than steel plate. 7*'6J4 However, the
13

difference in mass needed to carry out a rehabilitation project can quickly make up for a
great deal of this difference. For example, the repair of the Ibach bridge in Lucerne,
Switzerland would have required 175 kg of steel plating. When the bridge was actually
retrofitted, this steel was replaced with only 6.2 kg of CFRP. 35
Moreover, it must also be considered that in this type of constniction, the cost of materials is
typically onIy 20% of the total cost while the costs associated with labor amount to the
remaining 80%. In the Ibach bridge upgrade, the much lighter pieces of matenal allowed
the work to be performed fkom a mobile platform, as opposed to the heavier sca~olding that
would have been necessary for steel plate jacketing. 3~734 AS a more specific example, a 94
kg steel plate that would have been required in the project was replaced by a CFRP laminate
weighing only 4.5 kg. l7 Such weight reductions would lead to very large savings in labor
costs.
Additionally, when considering the price of CFEW, nearly two thirds is governed by the price
of the fibers themselves, with the rest controlled by the cost of the matrix, processing and
overhead. Currently, the price of reinforcing fibers is relatively high, though it should drop
as such large scale usage becomes more prevalent.
Chajes et al investigated the FRP bonding technique for use in a combination of flexural and
shear strengthening. 1558 The beams in this study were intentionally designed so as to be
under-reinforced and fail in flexure. CFRP sheets were then incrementally added to the
bottom (flexural reinforcement) and sides (shear reinforcement). The reinforcing material
14

used in this case was a 0.1 1 mm thick unidirectional fiber CFRP tow-sheet.
Applying a single sheet to the bottom face of the beam resulted in a significant increase in
ultimate load of nearly 160%, though it also resulted in a change in failure mode from
concrete crushing in the compression zone to shear. A second sheet was then added in the
transverse direction, with the fibers running at 90" to the beam a i s . This sheet was also
continued up both sides of the member to provide shear reinforcement. Though the increase
in load carrying ability was only slightly higher (a 175% improvement) due to the extra
transverse layer, it did manage to prevent a shear failure. These specimens failed due to
tensile fiacture of the CFRP in the tension zone.
Further studies by Chajes et a1 38 exarnined the effect of different fiber types on shear
strengthening of reinforced concrete beams. Three fiber types were investigated, including
glass, carbon and aramid. Bi-directional fiber fabrics were applied to the bottom and sides of
the beams and oriented with the fiber directions at 0/90°. The ultimate strength was increased
by 80, 85 and 88%, respectively, by the aramid, glass and carbon fiber fabncs. A further pair
of beams was retrofitted with the carbon fiber fabric, this tirne oriented at *4S0, which
produced a 122% increase in peak load. This study again indicated that an applied FRP
material can act as shear, as well as flexural, reinforcement but also showed that a 45" fiber
orientation is more effective for such strengthening.
The authors identified a number of drawbacks related to FRP plate bonding, including the
necessity of extensive surface preparation to provide a flat surface for bonding, increased
15

costs related to the production of large FRP plates and difficulties in achieving a sufficient
bond between the concrete and FRP. Continuous fiber fabrics, on the other hand, can
codorm to minor irregularities in the surface, are available in rolls of virtually any length
and tend to develop much stronger bonds with the concrete. ' This improved bonding ability
is thought to be related to the fact that the adhesive actually penetrates into the reinforcement
fabric which it cannot do with pre-made FRP plates.
Triantafillou et al conducted a great deal of research into a nurnber of facets related to
reinforced concrete beams strengthened with FRPs. i'~18~1921223941 They looked at both shear
and flexurd strengthening, used FRPs to prestress concrete beams, and made atternpts to
mode1 the various failure mechanisms.
These authors first identified a nurnber of failure mechanisms associated with such FRP
retrofit techniques, including:
- reinforcement yielding followed by FRP fracture.
- reinforcement yielding followed by concrete crushing.
- concrete crushing.
- debonding. "J"
After fbrther investigation into each of these major failure mechanisms, expressions were
denved to predict the ultimate bending moments for each case. "v2' The equations related to
the first three of these failure modes are:

Reinforcement yielding followed by FRP fracture,
Reinforcement yielding foiïowed by concrete crushing.
Concrete crushing.
where:
Mu = ultimate bending moment b = beam width h = beam depth d = bearn effective depth c = beam neutral mis depth y = distance fiom centroid of
concrete stress distribution to top fiber
f,' = concrete compressive stren-@h % = steel yield stress p, = AJbd = area fiaction of steel reinforcement p, = t/d = area fraction of fiber composite E, = FRP plate Young's modulus E,* = FRP plate tensile failure strain Es = steel Young's modulus
The authors also investigated the debonding failure mode, concluding that debonding occurs
due to the catastrophic propagation of a crack along the concretelFRP interface. Such cracks
could be induced by a number of factors, inchding inconsistencies in the distribution of the
adhesive, cracking of the concrete, peeling-off of the composite fiom concrete faces that are
17

not perfectly flat and fatigue Loading. ''
Since the authors considered only FRP applied to the bottom face of the beam, and this FRP
is loaded in tension, they could assume that the bonding agent is pnmarily subjected to shear
stresses. Thus, the adhesive must possess sufficient shear strength to provide the necessary
bond between the concrete and FRP. It was then concluded that propagation of the interfacial
crack wouId resemble a mode II fracture. II
They went on to mode1 the debonding failure mechanism and derive an expression to predict
the ultimate moment capacity of a beam which fails due to debonding. Further research
suggested that such a failure mode could be avoided altogether by providing a clarnping
mechanism at either end of the laminate. 21
Another study by Triantafillou et al investigated the variability inherent in the design
variables associated with CFRP strengthening of reinforced concrete beams. 21-'9 The
variables considered in this study included geometric parameters of concrete (such as beam
width, depth and reinforcement location) as well as strength and elasticity values of the
matenals involved. It was found that the flexural strength of a retrofitted beam was
influenced the most by variations in concrete strength and CFRP failure strain and area
fraction.
Saadatrnanesh et al also performed a great deal of research into the strengthening of
reinforced concrete beams with FRPs. Their research investigated a number of aspects,
18

including shear strengthening, " flexural strengthening, 294*4245 analytical and predic tive
approaches 4652 and the properties of various FRP materials themselves. 3653 The majority of
results reported by the authors coincide with previously discussed research, with the
exception of the modeling techniques employed. The authors used a finite element approach
to predict the effect of the FRP and were quite successfùl in simulating load-deflection
cuves similar to those reported in experirnental studies.
Probably the most concise attempt to develop a design procedure for FRP retrofit of
reinforced concrete beams is now in the process of final revisions of ISIS ", which is
working on a design manual which will provide designers of rehabilitation projects with
useful guidelines and procedures to effectively and safely carry out their work. This design
manual applies not only to beam retrofit but to colurnn strengthening as well. It also goes
well beyond the actual design of FRP retrofits by discussing the evaluation of existing
structures, the proper usage of FRP materials (including their specification, handling, storage
and installation) and methods for ensuring that the entire rehabilitation project work is
carried out properly. This document is till in the draft stages, though a final version is
expected soon.
A very important issue that arises when dealing with the use of FRPs in this manner is the
performance of the adhesive bond between the FRPs and the concrete. A number of
researchers have studied the characteristics of this bond. Many of the test methods and
theories developed by this work will prove helpful in future attempts to investigate the bond
created by the sprayed FRP technique. However, there are a number of significant physical
19

differences between the bonds created by fabric or FRP plate bonding and those inherent in
the sprayed FRP approach.
The application of FRP fabrics or plates typically involve an adhesive layer which is used to
bond the fabric or plate to the concrete surface. Since this adhesive is applied separately
fiom the FRP itself it essentially creates two bonds; one between the adhesive layer and the
concrete and the second between the adhesive and the applied FRP. Achieving a good bond
between the adhesive and the FRP is relatively easy due to the compatibility between the
adhesive and the F W matrix resin. It is the bond between the adhesive and the concrete
which is the more dificult case and thus of utmost importance. With the sprayed FRP
technique, the adhesive and the matrix resin are the same entity, resulting in a single bond
which leads to a number of difficulties fiom a testing standpoint.
For the former case of bonding the fabncs or FRP plates to concrete, testing the adhesive's
bonding ability with concrete is a relatively simple matter. Typically, the adhesive is used to
bond a steel plate or h e to the concrete and then apply load to the steel component to
induce bond failure. 5547 Other researchers have used actual FRP plates bonded to the
surface, applying the load to the FRP plate itself. 35.58-6 1 In both approaches, the advantage is
in the use of a loading apparatus with a precisely defined shape and size (the steel or FRP
plate).
In the sprayed FRP technique, the finished FRP plate is not as well deflned geometrically.
The thickness is difficult to control to the exacting tolerances that would be needed to endure
20

proper stress transfer to the bond during loading. Even worse, it is virtualiy impossible to
control the contact area between the sprayed FRP and the concrete due to overspray beyond
the desired limits. Though this can be alleviated by masking the surface around the desired
contact area, it still leaves the problem of trying to get an even stress transfer f?om the
loading apparatus to the bond through a material where geometric uniformity is difficult to
achieve.
To make matters more difficult, this stress transfer mechanism is also affected by the nature
of the fiber reinforcement, which is discontinuous and randomly oriented. As a result, it is
necessary to include the FRP in the test in order to get usefiil results so simply testing the
resins ability to bond to concrete is insufficient.
There has also been a nurnber of attempts at analyzing the rnechanisms involved in bond
failures. These studies have ifidicated two bond failure modes that typically occur; peeling
failure 17"' and shear failure." Karbhari 62 suggests that the peel test is a more representative
measure of the actual bond strength as it relates to FRP retrofits in the field since this is the
most common mode of debonding failue encountered. In general, the issues of bond
strength and bond failure have been investigated but the consensus opinion appears to
indicate that there is a very large variety of adhesive materials with an even larger variation
in bond properties. This variability is further cornplicated by the influence of concrete
surface condition preparation.

Karbhari et went on to examine the effect of environmental exposure on the FRP-
concrete bond strength. Exposure conditions included in his work included b e r s i o n in
fiesb water, immersion in sea water, exposure to fieezing temperatures and exposure to
freeze-thaw cycling. In general, al1 exposure conditions had detrimental effects on the bond
sîrength, though the magnitude of the deterioration varied widely depending on the adhesive
as well as the FRP material involved. It was noticed that carbon fiber based systems were
Iess susceptible to environmental exposure, thus contributing to the resistance of these
materials to debonding.
Another investigation into the effect of environmental exposure on FRP retrofit performance
and on the FRP-concrete bond was conducted by Homam el al. 64 This study included
exposure to alkaline solutions, high temperature cycling and freeze-thaw cycling. Their
results indicated that both the CFRP and GFRP themselves are well suited to resist these
environmental conditions but that the FRP-concrete bond was adversely affected by high
akalinity and both temperature cycling ranges for both materials.
Further durability studies c m be divided into two major groups; those that examine the
durability of the FRP material and its cornponents and those that investigate the effect of
environmental exposure on the performance of an FRP retrofitted member. In the former
group, it quickly becomes obvious that carbon fiber is the reinforcement of choice since
glass fiber is particularly susceptible to alkaline environrnents and UV radiation. Regarding
the matrix resins, it appears that epoxies are the most durable, followed by polyesters and
vinyl esters.62"
22
Research into the effect of long-term environmental exposure on the performance of
retrofitted structural members reveals an extremely important phenornenon. The durability of
the FRP materials themselves quickly becomes a secondary issue since, in virtually every
combination of FRP and adhesive, the FRP-concrete bond d e p d e s far faster, resulting in a
debonding f a i l~ r e .~~ - '~
A new field of research beginning to develop in this area is the use of non-destructive testing
methods for determinhg the presence and extent of damage to the FRP retrofit materials and,
more applicably, to the FRP-concrete bond.74v75 Such test methods are particularly useful for
detecting delarninations, whether they occur within FRP material itself or at the interface
between the FRP and concrete.
In addition to the researchers mentioned here, there are rnany others who have investigated
the use of FRPs for repairing and strengthening reinforced concrete beams. The results of
these nurnerous research projects al1 point to the same conclusion - the use of fiber
reinforced polymers to strengthen reinforced concrete bearns is an effective, economical and
very promising technique. Further discussion of these other investigations will be curtailed
due to the repetitive nature of the fidings and due to the fact that many are aimed at very
specific issues that do not directly apply to the sprayed FRP material used in this project.

3.1 - Concrete Materials
The following section consists of a description of the general properties and characteristics
related to the various cornponents used to make the concrete used throughout this research
project.
3.1.1 - Porîland Cernent
There were two brands of cernent used in the concrete cast for this project. The first brand
was manufactured by Lafarge Canada Inc., the second by Tilbury Cernent Ltd. Both were
classified as Type 10 Normal Portland Cernent. During the batching and mixing operation,
care was taken to ensure only fiesh cernent was used in order to avoid possible detrimental
effects or inconsistencies in test results associated with the use of partially hydrated cernent.

3.1.2 - Water
A11 mWng water used in the concrete was taken directly fiom the City of Vancouver
drinking water supply. This water source is considered acceptable for use in concrete.
3.1.3 - Aggregates
The coarse aggregate used in the concrete for this research project was a combination of 12.5
and 22 mm torpedo gravels obtained fiom the Lafarge Canada Inc. Vancouver ready mix
plant. These two gravels were combined in equal proportions to make up the total coarse
aggregate content. This aggregate was found to have a relative density 2.7 1, an SSD
absorption value of 1.24% and a dry rodded density of 1550 kg/m3.
The fine aggregate consisted of Lafarge Concrete Sand also obtained fiom the Lafarge
Canada Xnc. Vancouver ready mix plant. This sand was found to have a relative density of
2.70, an SSD absorption value of 1.00% and a fineness modulus of 2.35.
3.1.4 - Admixtures
A high range water reducing admixture was required during beam casting due to the limited
spacing between reinforcing bars and between the outside reinforcing bars and mold walIs.
The water reducer used in this project was WRDA-19, manufactured by W.R. Grace & Co.
Addition rates varied depending upon mix composition. These rates are discussed later in
25

Section 3.2 dong with mix proportions,
3.2 - Mix Proportioning
The were two different mix designs used within this research project, one for normal strength
concrete (-45 MPa) and another for high strength concrete (-80 MPa). The rnajority of
specimens were cast using the former design, with a single group of specimens cast using the
high strength mix (see Section 6.1.5.2.2.). The proportions of constituent materials for the
normal strength mix are provided in Table 3.1 while those for the high strength are shown in
Table 3.2.
1 Table 3.1: Mix proportions - normal strength (-45 MPa) concrete. 1
A fine aggregate proportion of 36% by mass of the total aggregate content was used in the
normal strength concrete, though this proportion was increased to 60% in the high strength
mix. The addition of silica fume to the high strength mix actually resulted in a reduction in
water reducer demand, even though the water to cernentitious materials (WKM) ratio was
reduced fiom 0.50 to 0.33.
Cornponent
Water
Cernent
Fine Aggregate
Coarse Aggregate
Water Reducer
Ratios
0.50
1 .O0
2-00
3.50
kg per m3 of Concrete
175
3 50
700
1225
Dosage Rate = 15 mVkg CM A

3.3 - GFRP Materials
The following section i
Table 3.2: Mix proportions - high strength (-80 MPa) concrete.
s a c
Component
Water
Cernent
SiIica Fume
Fine Aggregate
Coarse Aggregate
Water Reducer
ompil ation of the general descriptions and characteristics of the
various materials used to make the glass fiber reinforced plastics for this research project.
Materials used in both the spraying technique and the wrapping procedure are included.
Ratios
0.33
0.86
O. 14
1.57
1 .O4
3.3.1 - Resin
kg per m3 o f Concrete
202
526
86
961
636
Though there were actually three different resins used within this project, only two of them
will be discussed in this section. Since the third resin is part of the fully comprehensive
MBraceB retrofit system, it will be covered in Section 3.3.6., which deals with that system.
Dosage Rate = 12 mVkg CM
The primary resin used throughout the research project, regardless of spraying location, was
the K- 1907 polyester resin manufactured by Ashland Chernical Canada Ltd. Physical
properties for a clear casting fabricated fiom this resin, as per the manufacturer's literature,
are listed below in Table 3 -3.

Table 33: Properties of K-1907 polyester resin.
~ Property I VaIue I unit
Tensile Strength I 75.8 l MPa
Density
S hear Strength 1 48 1 MPa
1 .O7
Elastic Modulus r
Efongation @ FaiIure 1 2.4 1 %
g/cm3
It must be noted that these properties refer to a clear casting, as opposed to a sprayed
material. Actual laboratory testing of specimens fabricated fiom a sheet of clear sprayed
resin varied significantly. Refer to the matenal properties testing chapter (Section 5.2) for
Eurther details.
-
3 -77
The secondary resin used in the initial phases of the project, in which the beams were
sprayed elsewhere was a polyurethane resin, also manufactured by Ashland Chemical
Canada Ltd. Both of these resins were supplied in a fully promoted form to simpliS
application.
GPa
3.3.2 - Catalyst
The catalyst which was used to initiate curing of the resin was Methyl Ethyl Ketone Peroxide
(MEKP), again rnanufactured by Ashland Chemical Canada Ltd. under the product name
Lupersol DDM-9. The typical addition rate used throughout the project was 3% by volume.

This resulted in a gel time of approximately 15 minutes at 20°C, sunicient to allow
compaction of the sprayed material but quick enough so that the specimens could be moved
within an hour of spraying without fear of damaging the GFRP coating.
During wami dry weather the spraying operation was performed outdoors, often under
significantly higher ternperatures. In such case, the catalyst content was reduced to 2% or
even 1%, depending on conditions. Generally, a 15 minute gel tirne was targeted.
3.3.3 - Coupling Agent
The couplhg agent used to improve the GFRP to concrete bond was ~erakane' 8084, a vinyl
ester resin manufactured by The Dow Chemical Company and supplied in a fùlly promoted
form. Original implernentation of this resin as a coupling agent was done on the advice of the
supplier, Ashland Chemical Canada Ltd., when consulted as to potential methods of
improving the FRP to concrete bond. Though data is not available with respect to the actual
adhesion strength of the resin to concrete, the supplier did point out that this is a common use
for the ~erakane@ 8084 resin and that it would indeed be the most suitable resin for our
purpose. Selected physical and mechanical properties of ~ e r a k a n b 8084 are provided in
Table 3.4.
3.3.4 - Glass Fiber Rovings
The glass fiber used in the GFRP spraying process was ~dvantex@ 360R.R chopper roving
29

manufactured by Owens Coming. ~ d v a n t e x ~ is an improved fonn of E-glass which
combines the mechanical properties of E-glass with the corrosion resistance of E-CR glass.
The roving format refers to a number of conhiiuous glas filaments which are gathered
together into a single bundle or yarn, without introduction of a mechanical twist. These
rovings are then wound and packaged in a tubeless confi~guration specifically designed for
use with the chopper gun application technique used here. Physical properties, as per the
manufacturer's literature, are listed in Table 3 .S.
Table 3.4: Properties of Derakane 8 0 8 3 ~ vinyl ester resin,
Property
Density
Tensile Strength
Elastic Modulus
l ~ Table 3.5: Properties of ~dvantex@ gIass fiber.
Value
1.15
Elongation @ Failure
Adhesive Strength to Metals Carbon Steel 304 Stainless Steel 2024T3 Aluminum
Unit
g/cm3
72
4.6
Density 1 2.62 l g/cm3
MPa
GPa
10.0
1430 1530 970
Property
%
psi psi mi
Elongation @ Break 1 4.6 1 YO
Value
Diameter
Tensile Strength
Elastic Modulus
Unit
1 1
3 100-3800
80-8 1
Pm
MPa
GPa

33.5 - Glass Fiber Fabrics
Though there were four different glass fiber fabrics used in this project, only two will be
c-iiscussed in this section. The other two are part of the race@ retrofit system and will be
included in the section dealing soIely with that system (Section 4.3.6). The two which will be
covered are the NEWF 230 and NEMP 240 fabrics rnanufactured and supplied by Brunswick
Technologies Inc. These particular products were chosen for strengthening laboratory scale
specimens because they are composed of the exact same glass fiber used in the spraying
operation (~dvantex?.
Both fabrics are knitted, as opposed to woven, which means that two planes of glass fiber
rovings mnning in orthogonal directions are laid one on top of the other and then stitched
together. According to the manufacturer, weaving induces stress concentrations at the
crossover points due to the necessary change in direction of the fibers as they pass around
those running in the other direction. Knitting allows al1 of the fibers to nui in a straight line,
with the stitching thread holding the two orthogonal planes together.
The nomenclature used for the two fabrics (NEWF 230 and NEMP 240) also identifies the
arrangement and weight of the material. The frrst letter identifies the fabric type, with N
representing a knitted fabric. The second letter identifies the fiber type, with E being E-glass.
The final two letters indicate the fiber directions, where:

M = minus axis layer (-45") P = plus axis layer (+4S0) W = warp axis layer (-O0) F = fil1 axis layer (-90")
The number following the letter combination identifies the weight of the fabric in ounces
(and tenths) pet square yard. Thus, the NEWF 230 would be a 23.0 oz/yd2 knitted E-glass
fabric with fibers running at O0 and 90". NEMP 240 would be a 24.0 odyd2 laitted E-glass
fabric with fibers nuuiing at * 4 5 O .
3.3.6 - MBraceB System
The race@ Composite Strengthening System is an all-inclusive retrofit process produced
by Master Builders Technologies, Inc. The system includes a coupling agent (MB Primer),
an epoxy matrix resin (Ml3 Saturant) and a 27 o ~ . / ~ d * unidirectional E-glass sheet (EG 900).
PhysicaI and mechanical properties of the MB Saturant epoxy resin, as per the
manufacturer's literature, are listed in Table 3.6.
Table 3.6: Properties of MB saturanta epoxy resin.
Density 1 0.98 1 g/crn3
Property
Tensile Strength 1 54.0 1 MPa
-- -- - -
Value
Elongation @ Failure 1 2.5 1 '%O
Unit
EIastic Modulus 3 .O3 GPa

33.7 - Solvent
An effective solvent is aIways useful for cleaning purposes when working with resins, but in
the GFRP spraying operation it is an absoIute necessity. The spraying equipment requires
periodic flushing to prevent resin ftom hardening within the nozzle of the gun. The solvent
used throughout this project was acetone, supplied by Ashland Chernical Canada Ltd.

Sprayed GFRP Application Process
4.1 - Introduction
There are a variety of techniques available for fabricating fiber reinforced polymer
components or, in this case, applying an FRP coating to an existing object. Some of the most
comrnon include hand lay-up, filament winding, pultmsion and spraying. Hand lay-up,
filament winding and spraying can be applied directly to the surface being strengthened
while the pultmsion method is normally used to produce FRP plates which are later bonded
to the surface with some form of adhesive.
The sprayed FRP system used throughout this project is not a new technology. It has been
used for years in the boat building and automotive industries, as well as for many other more
specialized applications. It is the application of this technology to the structural retrofit of
reinforced concrete which is unique to this research. Due to the novel nature of this
technique, a bnef description of the equipment, its operation and the resulting FRP follows.

4.2 - Equipment
There are a number of different manufacturers of FRP spraying equipment. Though there are
slight variations between these types of equipment, they al1 possess the sarne general
components. The equipment used throughout this research project was a Venus-Gusmer
H.I.S. Chopper Unit equipped with a Pro Gun spray gun-
Figure 4.1: GFRP sprâying equipment.
Figure 4.1 is a photograph of a typical setup for this particular piece of spraying system. The
entire apparatus is completely self-contained and mounted on a portable cart for easier on-
site operation. There are three basic components; the resin pump (R), the catalyst pump (C)
and the spray or chopper gun unit (G). The only external equipment needed is a compressed
air source (0.5 m3/min minimum). Al1 three of the major components are cornpletely driven
by the compressed air supply. No electrical power supply is required unless the optional resin
35

heater is added for use in cooler weather (recornmended below 16°C).
One unique feature of this particular piece of apparatus is the configuration of the two pumps
(catalyst and resin). The catalyst pump is actually rnounted on the side of the resh pump
using a slave a m arrangement, as depicted in Figure 4.2.
Resin Pump j mr Catatyst Pump - ' -, - I-
Cataiysl Proportion / /
Holes - ù
Figure 4.2: GFRP spraying equipment - slave arm arrangement.
n i e slave a m apparatus is made up of three parts; the upper and lower rails and the vertical
stnit which comects the two together. The lower rail of the slave arm is fixed in a horizontal
position as shown in the figure. The outer end of the upper rail is connected to the lower rail
via the vertical strut while the inner end is attached to the piston of the resin pump. As the
resin pump cycles, the inner end of the upper rail moves up and down with it, thus driving
the catalyst pump.

There are two distinct advantages ro this arrangement- First, it eliminates the need for a
separate air supply feed to the catalyst pump. Second, it provides a simple method for
adjusting the catalyst proportion of the final resdcatalyst mixture. The distance between the
upper and lower rails decreases as the catalyst pump is moved outward. This shortens the
stroke of the pump and reduces the amount of catalyst being supplied to the spray gun.
Since the amount of resin is unaffected, the proportion of catalyst in the final mixture is
controlled by the position of the catalyst pump. With this particular piece of equipment, the
catalyst content can be varied fiom a minimum of 0.75% to a maximum of 3.0% (*O. 1%).
The proportion of catalyst in the final product directly affects the curing time required for the
composite to harden. Since curing tirne is also affected by temperature, the catalyst content
c m be varied to offset this effect.
Since the resin and catalyst purnps have separate outlets, the two components are transported
to and fed into the spray gun separately. Figure 4.3 consists of a photo of the spray gun. The
resin (R) and catalyst (C) lines.are labelled in the photo, as are the spraying gun (S) and the
chopper unit (Ch) mounted on top of the gun. There are also inlets for air, which is needed to
power the chopper unit and assist trigger operation and solvent, which is used to flush the
resin and catalyst from the gun between uses. It should be noted that the resin and catalyst
actually pass through the gun block separately and do not actually corne into contact until
they reach the mixing nozzle at the front of the gun (not shown in photo). Here they are
forced through a turbulent mixer immediately before exiting the gun as a mixture.

Figure 4.3: GFRP spraying equipment - spraylchopper gun details.
The prirnary advantage of this arrangement is ease of cleaning. Since the resin and catalyst
only corne into contact with each other within the spray nozzle, this is the only part that
needs to be removed and cleaned during shutdown. The equipment does not require
disassembly or flushing unless it is expected to remain idle for extended periods.
The glass fiber is supplied in a roving format, which is simply a large number of fibers
bundled together and wound ont0 a spool. One or two rovings (depending upon the desired
fiber content range) are fed into the chopper unit, where they pass between a pair of rollers.
One of the rollers has a number of blades embedded in its surface at evenIy spaced intervals
around its circumference. These blades break the glass fiber into shorter lengths, with that
length dependent entireiy upon the number and spacing of blades on the wheel, allowing
production of fibers of consistent length, adjustable from 8 to 48 mm.
38

The chopped fibers are forced out the fiont of the chopper unit by a combination of their own
momentum (as they are pulled through by the rollen) and air flow (since air is also fed into
the chopper housing) fiom the rear. The air motor which powers the rollers has an adjustable
air feed which allows the operator to control the speed at which the rollers spin. Combining
this adjustment option with the choice between single or dual roving feeds provides a large
range in the amount of chopped fiber being produced thus affecting the overall fiber volume
fiaction of the finished composite.
4.3 - General Operation
Operation of the GFRP sprayhg equipment is actually quite simple. The only difficult part of
the process is being able to judge the thiclcness of the material that has been applied since
there is no effective way to actually measure it during application. Also, since the rate of
increase in thickness depends on how fast the operator moves the gun and how much each
pass overlaps the previous one, it will be entirely operator dependent. In other words, being
able to determine the thickness applied during spraying will take practice and experience
until the operator develops a feel for it using their own technique.
In operation, the gun sprays the residcatalyst mixture fkom the lower spray nozzle while, at
the same time, spraying the fibers fiom the top-mounted chopper unit. ïhese two strearns or
fans combine and continue on to the spraying surface together (Figure 4.4). The result is a
two dimensional random distribution of fibers encapsulated by a fùlly catalysed resin. This
approach allows the operator to build up the GFRP matenal to whatever thickness is
39

required. After spraying, a ridged aluminum compaction roller is used to force out any
entrapped air voids and to work the material into a consistent thickness.
Figure 4.4: GFRP spraying operaiion.
One of the difficulties that may arise during application is the need to apply the FRP around
a corner. Though this procedure is much easier with the sprayed FRP technique than with
conventional fabric wrapping procedures, it still poses a problem since the fibers tend to
straighten again after being rolled around the corner. This problem is discussed m e r in
Section 6.1.3 which details preparation of the laboratory test specimens.
Some precautions that need to be taken include assuring that the air supply is free of
moisture and that the sprayed material remains dry until it has completely cured. Overspray
40

can also be a problem due to the width of the spray fan and proper masking techniques
should be used. Finally, as with any operation involving potentially hazardous materials,
proper safety procedures and equipment must be utilized.

Sprayed GFRP Material Properties
5.1 - Introduction
In order to properly characterize the effect of using sprayed glass fiber reinforced polymers
for retrofitting existing concrete beams, it is first necessary to define their material
properties. This chapter deals with a number of experimental investigations aimed at
determining the relevant physical and mechanical properties of this type of composite.
5.2 - Tensile Properties
As an extemal retrofit matenal applied in a thin skin to the concrete surface, the sprayed
GFRP will be primarily used to cany tensile stresses, in addition to some shear. Whether
these materials are placed on the bottom face of the beam to assist in flexue or applied to the
side to reinforce the beam in shear, the performance of the GFRP itself will be governed by
its tensile properties. Thus, it is imperative that the tensile properties of these materials are

known. The fist step is to experimentally measure the tensile strength of the sprayed GFRP.
To this end, a series of tensile strength coupons was fabricated.
5.2.1 - Test Procedure
ASTM does not publish a specific test method which they deern to be applicable to this
particular type of material. However, there x e two standards which are close. The fust of
these is D628 Tensile Properties of Plastics, which states (Note 4) that composites
eontaining discontinuous fibers with high moduli (E > 20 GPa) are to be tested under Test
Method D3039 Tensile Properties of Fibre-Resin Composites. The latter test method,
however, states in its Scope section that it applies only to unidirectional composites or
laminates of symmetric, orthotropic construction. Thus, neither standard applies to this
particular matenal.
The majority of test results reported by the manufacturers of the matenals used refer to the
ASTM D628 method. Thus, the tensile specimens in this research program were tested in
general accordance with that standard, the single variation fiom the prescribed procedure
being specimen size. Since the specimen size dictated by the ASTM standard was considered
to be too small to accurately predict the tensile strength of composites containing the longer
fiber lengths, the specimens were scaled upward to a more applicable size. Figure 5.1 details
the dimensions of the actual specirnens used.
The problem inherent in the original ASTM D638 specimen size involves the specified width
43

of the narrow section, which is stipulated as IO mm. Since the tensiie strength coupons to be
tested contained fibers up to 48 mm in length, a 10 mm width would result in any fibers
oriented at a significant angle being discounted h m the overall composite strength. Thus,
the specimen was scaled upward to make this narrow section 60 mm in width.
80 mm min. 45 mm 60 mm - * 45 mm 80 mm min. t
Gauge Length
Figure 5.1: GFRP tensile strength specimen dimensions.
Specimen thickness was not defined prior to specimen fabrication. Rather, the sprayed FRP
plates fiom wbich the specimens were to be cut were built up to any arbitrary thickness.
Specimen thickness was then measured during testing, with the actual measured value being
iised in the determination of FRP strength.
Fabrication of the tensile strength coupons involved spraying a flat sheet or plate of GFRP
material fiom which the coupons could later be cut. This was accomplished by spraying the
glass fiber and resin onto a pane of glass (Figure 5.2), which was first covered with a thin
sheet of plastic. The plastic was used to prevent the sprayed resin from bonding to the glass
44

surface. After hardening, the GFRP plate could be removed fiom the g l a s and the plastic
sheet peeled off the back. The tensile strength coupons were then cut out and machined to the
proper tolerances.
The top surface of the composite plate was then ground in order to remove the outemost
resin layer. This step has no significant effect on the load carried by the specimen but will
affect the measurement of cross-sectional area used in strength calculations. The removed
layer consists solely of resin which is forced to the surface during the rolling or compaction
process. Since the thickness of this resin layer (0.5 - 1.0 mm) is relatively constant regardless
of overall composite thichess, it would act to distort calculated strength values by making
overall thickness proportionally higher for thuuier plates. As a result, it was decided that this
layer should be removed prior to testing. Thus, only that portion of the composite containing
reinforcing fibers was counted in the determination of tensile strength.
To examine the effect of fiber length on composite tensile properties, a number of different
fiber lengths were tested (8, 16, 24,32 and 48 mm). For each of these lengths, six tensile
strength coupons were fabricated and tested. In order to determine whether the distribution of
fibers truly promoted planar isotropie behavior in the composite material, these specimens
were cut fiom the GFRP sheet in three different orientations, as shown in Figure 5.3. The
specimen numbers indicated in the figure correspond to the specimen ID numbers shown in
the individual specimen result table (Appendix A).

Figure 5.2: GFRP tensile strength specimen spraying.
Figure 5.3: GFRP tensile strength specimen fabrication orientation.

In addition, four coupons were fabricated fiom a sheet of GFRP which had been prepared
using the original spraying equipment at GU Manhole Liners Ltd. Due to a limited amount of
material, only two orientations were tested for this material (horizontal and vertical).
Testing of the coupons was carried out using a Baldwin 400 kip U.T.M. set to its low load
range (16000 Ibs. maximum capacity). Friction wedge grips were used to grip the ends of the
specimens during testing and care was taken to ensure that the specirnen remained
completely vertical throi:ghout the test. Elongations were measured using an LVDT mounted
on an extensometer, whicb was then attached to the specimen. Figure 5.4 depicts the testing
apparatus setup.
Figure 5.4: GFRP elongation measurement apparatus.
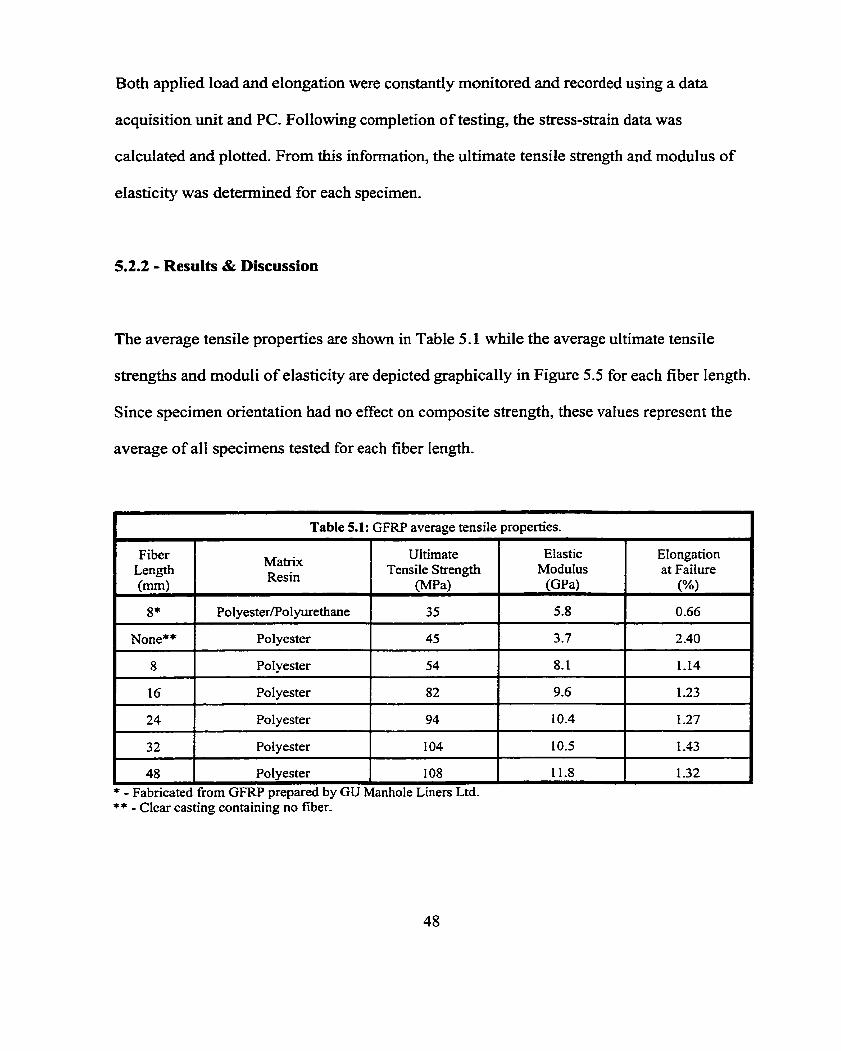
Both applied load and elongation were constantly monitored and recorded usîng a data
acquisition unit and PC. Following completion of testing, the stress-strain data was
calculated and plotted. From th is information, the ultimate tensile strength and modulus of
elasticity was determined for each specimen.
5.2.2 - Results & Discussion
The average tensile properties are shown in Table 5.1 while the average ultimate tensile
strengths and moduli of elasticity are depicted graphically in Figure 5.5 for each fiber Iength.
Since specimen orientation had no effect on composite strength, these values represent the
average of al1 specimens tested for each fiber Iength.
- -
Table 5.1: GFRP average tensile properties.
Fiber Length (-1
8*
None**
8
16
Elastic Modulus
( G W
5.8
3.7
8.1
9.6
Elongation at Failure
(%>
0.66
2.40
1.14
1.23
Matrix Resin
Polyester/Polyurethane
Polyester
Polyester
Polyester
1.27
1.43
1.32
24
32
48
UItimate Tensile Strength
W a )
35
45
54
82
* - Fabricated fiom GFRP prepared by GU Manhole Liners Ltd. ** - Clear casting containing no fiber.
Polyester
Polyester
Polyester
94
1 04
1 08
10.4
10.5
11.8

The values for elastic modulus reported in Table 5.1 refer to a secaut modulus. This approach
was used due to the nonlïnear behavior of some of the FRP materials which made
detemination of the actual initial modulus very difficult. The choice of secant endpoints was
based on a sirnilar approach, used for determining the elastic modulus of concrete, which
uses endpoints of 50 pstrain and 40% of ultirnate stress ".
Though the same upper limit was used (40% of the ultimate stress), the lower point was
raised to 500 pstrain for three reasons. First, the precision of the recorded data made
definition of the 50 pstrain level very difficult since this value was very close to the
resolution of the equipment used. Second, the typical strains exhibited by the sprayed FRP
are much higher than those associated with concrete. Finally, the initial part of the stress-
strain curve tends to be very noisy as the loading apparatus and specimen seat themselves.
The choice of 500 pstrain as the secant endpoint assured that this region would not be
included in the elastic modulus detennination.
As indicated by the results, both the composite tensile strength and modulus of elasticity
increase with fiber length. The coefficient of variation within each set of specimens (for al1
three values) tended to decrease as fiber length increased. It is beiieved that this trend toward
improved consistency with increased fiber length is due to the greater ease of compaction
associated with longer fiber lengths. Since this phenornenon also affects the density of the
material, it will be discussed m e r in the section on density (Section 5.2).

GU 8 8 16 24 32 48 Fibre Length (mm)
Figure 5.5: GFRP average tensile properties.
Figure 5.6: GFRP stress-strain response.

Typical stress-strain curves for the sprayed GFRP material are shown in Figure 5.6. For the
polyester matrix specimens, it is interesting to note that the stress-strain response became
more linear as the fiber length, and thus strength, was increased. This effect can be attributed
to better stress transfer between the fibers as the fiber length increases. A decrease in fiber
length means that the stresses must be transferred from one fiber to another more often along
the length of the composite. Such an increase in the nurnber of stress transfers essentially
increases the effect of the rnatrix on the overall composite strength since it is the matrix that
must act as the stress transfer mechanism. It is this increased rnatrix contribution that induces
the increasing non-linearity evident as the fiber length decreases.
5.3 - Density
One physical property of GFRP that becomes important when considering the use of such
materials as a retrofit technique is its density. Inherent in the concept of retrofitting an
existing structure is the fact that more material, and thus more dead load, is being added to
the structure. If this extra material is to be accounted for in design calculations, it is first
necessary to know its density.
5.3.1 - Test Procedure
Determination of composite density requires only a small amount of the actual material,
typically around 25 cm2 square (25-35 g mass). Additionally, it is not necessary to use a
single piece to perform the test. Due to size limitations of the balance used to detennine the
5 1

specimen masses, it was decided that each sample would be made up of two or three srnaller
pieces. These pieces were easily obtained fiom the scraps lefi over during fabrication of the
tensile specimens described above.
The density was deterrnined for each variation in fiber length to determine whether fiber
length has any influence on the result. A total of six separate sarnples were prepared and
tested for each such variation. The actual detemination of densities was performed in
accordance with ASTM D792 Speczfic Gravity (Relative Density) and Density of Plastics by
Displacement.
5.3.2 - Results & Discussion
A full tabdation of results for each specirnen tested has been included in Appendix A.
Average densities for each fiber length are summarized below in Table 5.2.
The coefficient of variation was below 3.0% for al1 fiber lengths, indicating very good
consistency within each group of results. Examining the polyester matrix composites
indicates an upward trend in density as fiber length increases. The variation in density over
this range is not statistically significant (COV = 3.0% over entire range) but is intriguing due
to the consistency exhibited by the increase. From a material application point of view (i.e.
the spraying process itself) the final composite density should be consistent.

1 Table 5.2: Average Composite Density
1 8 1 Polyester 1 1289
Fiber Length (-1
8'
None*.
1 32 1 Polyester 1 1382
Matrix Resir? Type
Polyester/Polyurethane
Polyester
16
24
I 48 1 Polyester 1 1394 - Fabricated fiom GFRP prepared by GU Manhole Liners Ltd. - Clear casting containing no fiber.
Density Ocg/m')
1263
1 070
The respective quantities of fiber and resin deposited on the surface during the spraying
- - --
Polyester
Polyester
operation should be consistent regardless of fiber length. The rate of fiber movement through
1343
1374
the chopper unit is constant and will thus produce a constant volume of chopped fiber over a
given time period. The quantity of resin sprayed ont0 the surface is entirely independent of
fiber production and is thus unaffected as well.
The only other component of the fabrication procedure which could account for this
discrepancy is the rolling or compaction of the deposited material. Throughout the
investigation into different fiber Lengths, it was noted that the shorter lengths were rnuch
harder to roll out since the physical application of the roller tended to move the fibers around
a great deal. This would result in fibers being pushed or pulled into piles if too much
pressure was applied. Thus, iess pressure could be applied to the GFRP during the
compaction process. With the longer fibers lengths, however, this problem did not occur.

More pressure could be applied without actually moving the fibers.
It is likely that this difference in compaction efficiency could be responsible for the noted
variation in density wiîh respect to fiber length- If so, a similar trend should appear in
measurements of fiber volume fiaction. The volume proportion occupied by the fiber would
be lower in cases where the compaction eficiency was inferior since the non-fiber volume
would be higher if air voids remained in the system. This phenomenon is discussed fbrther
during the analysis of the FRP mechanical properties Section 5.5.
5.4 - Fiber Voiume Fraction
The fiber volume fkaction of a composite is typically determined on a mass basis by simply
removing the malrur material and measuring the remaining mass of fiber. This mass fraction
can then be converted to volume fiaction if the densities of the fiber and the overall
composite are known.
5.4.1 - Test Procedure
There are two different ASTM Standard Test Methods which can be used to determine the
fiber content of polymer ma& composites. ASTM D3 171 Fiber Content of Resin-Mate
Composites by MatrUr Digestion uses an acidic solution to dissolve the matrix material while
ASTM D2584 Ignition Loss of Cured Reinforced Resins uses high temperature to burn off
the resin material.
54

For a couple of reasons, it was decided to that the latter test method would be used for the
composites utilized in this testing program. Firstly, the glas fiber itself is completely
unaffected by the high temperatures required in the test, though it wiI1 lose rnass when
exposed to strong acidic solutions. Secondly, the ignition loss procedure is far safer and
easier to perforrn, with minimal chance of operator error.
5.4.2 - Results & Discussion
There is one important concept to note with respect to the results obtained fiom this test.
Since the polyester resin itself is completely decomposed to volatile materials under the high
temperatures involved, no trace of the resin will remain. Thus, the reported fiber proportion
of each composite should be accurate. However, the matrix proportion can not tmly be
deterrnined fkom these values unless the quantities of any other volatiles present (Le. water,
residual solvent) are small enough to be considered insignificant. Results have been tabulated
in Table 5.3.
1 Table 5.3: Average fiber content. 1

As for the original GFRP prepared by GU Manhole Liners Ltd., this test proved to be
ineffective at determining fiber volume hc t ion due to the inclusion of a fire retarding filler
during production. This filIer prevented the resin fkom being completely decomposed at the
temperatures that could be reached by the equipment used. According to personnel at GU
Manhole Liners Ltd., however, external testing performed in the past indicated that the
volume fiaction of their material is typically in the 8% range.
Similar to the trend with densities, there is also an upward trend in fiber volume fraction as
fiber length increases. This is likely a function of compaction as well. Menor compaction
would result in a larger overall volume of material, with the extra volume being included in
the non-fiber portion of the composite.
5.5 - Theoretical Analysis
in this section, predictive tools are derived to estimate the tensile strength and elastic
modulus of sprayed fiber reinforced polyrners based upon the mechanical properties of their
constituent materials and the proportions at which they are combined.
5.5.1 - Tensile Strength
According to Barbero ", the tensile strength of a fiber reinforced plastic containing randomly
onented continuous fibers can be deterrnined fiom the strength parameters of a fictitious
unidirectional material made up of the same matenals and containing the same volume
56

fraction of fiber. The first strength value that must be detemiined is the longitudinal tensile
strength of the fictitious unidirectional continuous fiber composite. When such a material is
subjected to a tensile load, the most cornmon mode1 used to detennine the longitudinal stress
carried by the composite is the Ruie of Mixtures expression, which states that the total stress
is simply a proportional surn of the stress carried by the fibers plus the stress carried by the
ma&
However, this expression only applies to the distribution of stresses while both materials are
coniributing. Once the maximum load or strain level of either the matrix or fiber is reached,
the Rule of Mixtures must be modified to account for the change in load distribution. In the
case of a polyester matrix reinforced with glass fibers, the fibers are far stiffer than the
matrix material and also more ductile (Le. they exhibit higher elongation). This combination
is referred to as a stiff fiber-bnttle rnatrix system. With such a combination, the matrix
material will always fail first as the applied load is increased. Figure 5.7 indicates the relative
ideal performances of these two materials.
Once the strain in the composite material reaches the ultimate strain of the polyester resin
(E,,), the ma& will fail and shed its portion of the load to the fibers. Since the entire applied
load must now be transferred to the fibers, the load associated with this point c m be
determined by calculating the stress camed by the fibers at the sarne strain level.

Stress 1
Figure 5.7: Typical fiber and matrix stress-strain behavior Cor gIass/polyester.
For the polyesterlglass combination used here, this value becomes
Whether the composite itself fails at this point depends entirely upon whether the fibers are
capable of carrying the additional load that is shed by the rnatrix. At very low fiber volume
fractions, the matrix may very well be carrying more load than the fibers are capabte of
supporting, thus resulting in imrnediate failure when the matrix reaches its failure strain. In
this scenario, the overall strength of the composite will be the ultimate strength of the matrix
plus the stress in the fibers at the same applied strain. This value is represented by writing the
Rule of Mixtures equation at this specific strain level

At higher volume fiactions, the fibers are capable of carrying the additional load transferred
to them by the matrix when it fails. In this scenario, the matrix cm no longer carry any load
and the overal composite strength is equal to the load carrying ability of the fibers
themselves.
Plotting these two governing equations against the fiber volume fraction of the composite
results in the graph shown in Figure 5.8.
O Vhin 1 Fiber Volume Fraction
Figure 5.8: Variation of FRP tende strength with fiber volume fraction.
The point where these two lines cross represents the minimum fiber volume hc t ion beyond
which composite failure no longer occurs at the same tirne as matrix failure. In other words,
59

volume fiactions above this point provide sufficieut fibers to carry the Load transferred to
them when the rnatrix f d s .
The actual value of this minimum volume fiaction can be cornputed as the intersection
between the two equations and can be expressed as
For a glass fiber/polyester matrix combination, the minimum fiber volume fraction is about
3%. It should be noted that this value, in fact the entire concept described here, relates to
continuous unidirectional fiber systems. In a general sense, randomly oriented or
discontinuous fibers will not be governed by the sarne minimum fiber volume fiaction since
they require the contribution of the rnatrix to transfer stresses Fom one fiber to another. In an
ideal continuous unidirectional fiber composite, the load is applied directly to the fibers
themselves. A randomly oriented or discontinuous fiber system requires that the matrix
transfer the applied load from one fiber to another along the length of the composite.
However, the essence of the mode1 is a relationship between the properties of a randomly
oriented fiber material and those of a fictitious unidirectional material made up of the same
materials. Since the fiber volume fiactions obtained in the spraying operation are typically
well above the 3% minimum volume fraction determined for the polyester/glass
combination, it will be assumed that the latter of the two equations for longitudinal tensile
60

stress applies and thus
Furthemore, for our case the resulting value still needs to be adjusted to take into account
the effect of the discontinuity of the fibers used in the sprayed FRP technique. This is
typically accomplished through the use of an efficiency factor which relates the effectiveness
of the load transfer between the discontinuous fibers with a continuous fiber system. Cox
developed an expression for such an efficiency factor (q3, which took the form
where L, is the length of the discontinuous fibers and P i s defined as
in which A$ the cross sectional area of the fiber, RIis the radius of the fiber and R is
the mean separation between fibers. For the purpose of this analysis, the packing geometry of
the fibers was assumed to be a square array in which the mean fiber separation R can be
detemined using the expression

The efficiency factor q, represents the effect of discontinuous fibers as opposed to
continuous fibers and will thus be applicable to the longitudinal strength calculations only.
The expression for longitudinal tensile strength becornes
The transverse tensile strength of a unidirectional fiber reinfbrced composite is not
significantly affected by fiber strength but is instead controlled by the strength of the matrix,
the matrix-fiber bond strength, and the presence of voids or defects in the materials. The
basic forrn of this relationship is
where K is a strain concentration factor that is designed to account for the strain
concentrations in the matrix surrounding the fibers. Gibson 79 suggcsts a relationship for K
which takes the fonn
where d,is the fiber diameter and R is the mean fiber spacing. The ratio dI/R is
directly related to the fiber volume fraction. Barbero breaks the stress concentration factor
62

into two expressions, one to embody the effect of fiber volume fraction and the other to
account for the detrimental effect of voids.
This eq~ation takes the form
where C,, represents the void effect and is expressed as
A sllnilar expression proposed by Chamis eliminates the dependence on E, and results in
For the sprayed FRP material used throughout this research program, it was not possible to
experirnentally determine the volume fiaction of voids within the material. For the purpose
of this analysis, however, an attempt was made to determine the void ratio empiricaIIy, based
on density variations arnong the different fiber lengths.
As mentioned earlier in Section 5.2.2, the density of the sprayed FRP matenal tended to
63

increase with fiber length. Since the actual delivery of the two components to the sprayïng
surface remains constant regardless of fiber length, it could be concluded that this variability
in density is due to the degree of compaction achieved with the different fiber lengths. Such a
conclusion is supported by the difficulties encountered during the rolling out process, also
described in Section 5.2.2.
Menor compaction would result in a larger number of voids in the final composite and thus
a reduction in transverse tende strength. Since rneasurement of the void volume fraction
could not be made directly, an empincal approach was devised. Figure 5.9 depicts the
measured composite densities plotted against fiber length. With the aid of a statistical curve
fitting program, a relationship was obtained which matched the data extremely well(3 =
0.9998), as indicated in the figure.
I
I 1400 1
l -. - - --t
n- . -. m - -
a el 13501 s * 1300 ;4
2 1 - 8 12501 I y = a + b - exp(-O.d(l n ( x / c) l d)2) ,
1*00\ a=1070.0092 b=324.85795
115Qi c=57.242277 d=2.2101607
llOOi' f=0.99975030&
1 050-L- - - - _ _ _ --_C?
O 10 20 30 40 50
Fiber Length (mm)
Figure 5.9: Composite density by fiber length.

Examining the graphical representation of this relationship, it appears that the density not
only increases with fiber length but that the rate of increase actually slows at the high end of
the fiber lengths used. This corresponds exactly with compaction difficulties encountered in
the laboratory. The 8 mm fibers were very difficult to roll out but this task became
progressively easier as the fiber length increased. With the 48 mm fibers, it was possible to
put a great deal more pressure on the roller during the compaction process.
Upon fùrther investigation, it was discovered that the fitted equation actually becomes
asymptotic to a density of 1395 kg/m3, which is only slightly higher than the 1394 kg/m3
measured for the 48 mm fiber length. For the purpose of this analysis, therefore, it was
assumed that full compaction (i.e. no voids remaining) would produce a density of 1395
k g / d and that any discrepancy would represent the voids present in the material.
Furthemore, the basic Rule of Mixtures for combining materials of different densities can be
used to determine the expected fiber volume fraction given a final composite density of 1395
kg/m3.
This results in a theoretical fiber volume fiaction of 0.209, nine percent higher than the 0.190
actually measured for the 48 mm fiber length. Implementation of the empirical relationship
described in Figure 5.9 results in the voIume fractions shown below in Table 5.4.

1 Table 5.4: Empin'cal volume hctions by fiber length-
Fiber Volume Fraction (%) Length (mm) Fiber M a t . Voids
8 17.0 75.4 7.6
Determination ofthe inpiane shear strength of a unidirectional continuous fiber reinforced
composite is very similar to the procedure for calculating transverse tensile strength. The
matrix tensile strength and the elastic moduli in the previous equation are replaced with the
matrix shear strength and the shear moduli of the components to give
The shear moduli of the fiber and matrix (Gfand G,) were calculated fiom their respective
elastic moduli and Poisson's ratios using the relationship
Upon examination of a number of material property sources, it was found that the Poisson's
ratios for glass fiber and polyester resin tend to be very consistent and were taken to be v,=
0.22 and v, = 0.38 ''.

Once values are obtained for the longitudinal tensile, transverse teosile and inplane shear
strengths (F,, F, and F,, respectively) of the fictitious continuous, unidirectional composite,
the tensile strength of the randody onented continuous fiber composite can be determined.
The relationship used for making this transition is represented by one of the following
equations ''
where the tems a, and rr, are defined as
According to Hahn 82, this predictive relationship tends to work well for fiber reinforced
polyrners with fiber volume fiactions of up to 20%. Using Barbera's approach to determine
the tensile strengths of the sprayed FRP used in this project produced the results shown in
Figure 5.10. Actual calculations and fbrther details have been included in Appendix A.

8 16 24 32 48 Fiber Length (mm)
Figure 5.10: Cornparison of theoretical vs. experimentai tensile strengths of sprayed FRP composites.
The variation between theoretical values and experimental results is well below the
individual coefficients of variation reported for the different fiber lengths during laboratory
testing, with the sole exception being the 8 mm fiber length. Actually, al1 of the theoretical
predictions, again with the exception of the 8 mm fiber length, are within 10% of their
respective experimental values. This appears to indicate that this approach is an effective
means for predicting the tensile strength of this specific combination of matenals, at least at
the low fiber volume fractions used here.

5.5.2 - Elastic Modulus
Estimation of the elastic modulus of the sprayed FRP matenal utilizes a similar approach to
that followed in the previous section. Basically, the elastic properties of a fictitious
unidirectional composite are again determined independently and then combined to produce
the properties of the randomly oriented fiber system.
The elastic modulus in the fiber direction of a unidirectional fiber reinforced matrix is
normally assumed to follow the Rule of Mixtures equation
In order to modiQ this expression to account for the discontinuity of the fibers, the sarne
efficiency factor used earlier in the tensile strength portion of the analysis is implemented to
correct the fiber contribution portion.
The transverse modulus of a unidirectional fiber reinforced composite is typically determined
using the inverse Rule of Mixtures, which takes the form.

However, unless the fiber volume fi-action is very hiph, the fibers do not contribute to the
transverse stiffness of the composite. 57 E2 is thus a ma& dominated property and the above
equation does not provide accunite results for low fiber volume fkactions. A more accurate
prediction can be obtained with the Halpin-Tsai " expression
where C is an empincal parameter that can be approxïmated by 2.0 for circula or
square fibers and q is a correction factor of the form
Combining the expressions for longitudinal and transverse stiffness of the fictitious
unidirectional fiber composite to produce a relationship for randomly onented fibers involves
idealizing the composite as a laminate with nurnerous layers, each with a slightly different
orientation. The resulting expression derived by Barbero " is

where A = l-v,, v,, and G,2, v,, and v,, are determhed using the expressions
According to Hull 84, the expression for Eh cm be approximated by the much simpler
expression.
Both the Barbero and Hull relationships were used to predict the composite elastic rnodulus
for the sprayed FRP material. The results are shown in Figure 5.1 1 while M e r details have
been included in Appendix A.

Fiber Length (mm)
Figure 5.11: Comparison of theoretical vs. experimentai elastic moduli of sprayed FRP composites.
Surprisingly, the approximation proposed by Hull actually produced better results when
compared with the experimentally measured values. The theoretical results were generally
within the coefficient of variation found during laboratory testing of the sprayed composite
matenal, with the exception of the FRP containing 8 mm fibers. As with the tensile strength
predictions discussed in the previous section, this approach appears to be an effective means
for predicting the elastic modulus of this specific combination of materials.

Beam Strengthening
6.1 - Introduction
The primary testing done for this research project involved the reîrofit or rehabilitation of
existing reinforced concrete beams. It should be noted here that the terms retrofit and
rehabilitation are used interchangeably to describe the upgrading of existing structures.
Throughout this text, these terms are meant to include both the strengthening and repair of
such structures.
The majority of the beams tested in this research were small in size due to the large nurnber
of specimens required. This smaller size allowed the researcher to prepare al1 of the required
specimens in the laboratory, with the sole exception of the final project phase descnbed in
Section 6.3. The final set of specimens were fiil1 scale bridge channel bearns generously
provided by the Ministry of Transportation and Highways of British Columbia.

6.2 - Laboratory Specimens
Due to the large number of laboratory size specimens tested and the number of variables
studied throughout this project, the results will be broken down into the different project
phases, as shown in Table 6.1 below.
1 Table 6.1: Project phase descriptions - laboratory bearn testing.
Project Phase
1
2
3
4
5
6 J
Specimen Tme 1 Variables Considered 1 section
Flexural Strengthening Beam Condition (DamagedKJndamaged) Concrete Strength (NormaVHigh) 1 6.2.4
S hear Strengthening
-
Cornparison with Fabric Wraps
Beam Condition (DamagedAJndamaged)
FRP Strength FRP Configuration Reinforcement Configuration
GFRP Thickness
Fiber Length
6.2.1 - Specimen Preparation
6.2.5.2
6.2.5.3
6.2.5.4
6.2.5.5
Al1 laboratory specimens were identical in size and proportion, with the only difference
between the flexural strengthening and sbear strengthening specimens being the
reinforcement design. These beams were 1 m in length, 96 mm in width and 125 mm in
overall depth. Casting was done on a vibrating table to ensure proper consolidation of the
concrete and to ensure flow around and between reinforcing bars.

Specimens were demoulded after one day and immersed in lime saturated water. At 28 days
of age, the beams were removed fiom the curing bins and set out to dry under normal
laboratory conditions. A minimum of one week of such drying was allowed p ior to any
testing, preloading, sandblasting or spraying.
6.2.2 - Testing Procedure
For the laboratory cast spechens, al1 of the beams were tested in third-point loading using a
Baldwin 400 kip universal testing machine. These beams were 1 m in total Iength and were
teçted over a 900 mm span, using the loading arrangement shown schematically in Figure
6.1.
1 LVDT C
Support I
Support
Figure 6.1: Laboratory scale bearn test setup,

Though this testing procedure was not specifically intended to fully conform to any
particular ASTM standard, the load application rate used throughout the testing program was
denved f?om ASTM C78 FZmral Strength of Concrete. This standard specifies a rate of
increase in the flexural stress of 0.86 - 1.2 1 MPahin for flexural testing. The flexural stress
in the concrete R was deterrnined as:
where: R = flexural stress in concrete ( m a ) P = applied load (N) 1 = span length (mm) b = specimen width (mm) d = specirnen depth (mm)
Rearranghg this equation for the applied load P gives
Substituting the previously mentioned ASTM C78 flexural stress range endpoints (0.86 and
1.21 MPa), along with values for b (96 mm), d (125 mm) and 1 (900 mm) allows
determination of a recomrnended range for load application rate. As a result, a loading range
of 1433-2017 N/mh (322-453 lbs/min), with a target of 1780 N h i n (400 lbshin), was used
for the small scale specimens in this research project. Though automation of this load rate
was not possible with the equipment used, the load rate was monitored visually throughout
the testing and was maintained within this range as consistently as possible.

The reported deflection value A for each specirnen is a corrected quantity which was taken to
be the mid-span deflection 4 less the average support settlement indicated by the other two
LVDTs (4 and 4).
In the early stages of loading, the settiement values (4 and 4) were as high as 5% of the
rnidspan deflection, though the amount of settlement quickly leveled off and became
virtually constant. This maximum settlement was attained even though the Ioad was still
increasing, and the settlernent deflections typically amounted to about 1% of midspan
deflection at the same load level and much less than 1% of the final midspan deflection. The
upper LVDTs used to measure this settlement were removed once the settlement leveled off.
This was done to protect these sensitive devices from darnage due to any sudden upward
movement of the specirnen during failure. Dunng the initial phases of testing, it was
detennined that a load of 10000 Ibs was sufficient to reach maximum settlement and the
upper LVDTs were removed once the applied load reached this level.
To allow cornparisons with respect to the performance of the different beams, data
acquisition software was used to monitor and collect both the applied load and the three
LVDT readings. After adjusting the measured deflection values, load-deflection curves were
produced for each specimen. From these curves, the initia1 member stiffness and peak load
were identified. Another quantity calculated fiom this data was the energy absorbed by the
specimen durhg loading, with energy absorption being represented by the area under the
77

load-deflection curve. The k a 1 piece of information that was noted for each specimen was
the mode of failure, which consisted of the event causing the load to drop after reaching its
ultimate value.
There is one major shortcoming to the use of this definition of "failure". In many cases the
failed beam was still capable of carrying far more load than the peak load associated with its
control specimen. Though such bearns would obviously need to be repaired, labeling it as
failed when it is still carrying significantly more load than it was capable of before being
retrofitted is surely a loose definition of the word.
6.2.3 - Retrofit Schemes
Ln order to determine the effectiveness of the sprayed GFRP system for rehabilitation of
reinforced concrete beams, it was necessary to examine several different approaches or
configurations that could be irnplemented. Specifically, the number of surfaces around the
beam to be sprayed and the effect of the various combinations of these surfaces was of
utmost interest. Throughout the project, a total of five different retrofit schemes were
studied. These schemes are depicted schematically in Figure 6.2.
Generally, it was anticipated that spraying the sides of the member would contribute to the
shear strength of the beam while spraying the bottom face would provide fiexural
reinforcement. The various retrofit schemes were thus designed so as to provide information
for each of these cases. To provide shear reinforcement only, the two vertical sides of the
78

beam were sprayed (Scheme A) while pure flexural reinforcement was provided by spraying
only the bottom of the beam (Scheme E).
Figure 6.2: Retrofit schemes.
Schemes C and D provided a combination of shear and flexural reinforcement and are more
typical of the type of retrofit procedure that would be used in the field. Scheme B was added
to the early phases of the project to help determine the contribution, if any, of the upper plate
in the Scherne D specimens. The retrofit scheme of the most interest fkom a practical
standpoint is Scheme C due to the inability, in most cases, to gain access to the upper surface
of in situ reinforced concrete beams. Such access would often be blocked by the roof deck,
bridge deck or floor slab that the beam is supporting.
One difficulty that was encountered during the retrofit process was the inability of the fibers
to stay in place when bent around sharp corners. The stifThess of these fibers was sufficient
to cause a tendency for them to straighten after being bent around a corner. This would cause
a continuous air pocket to form along the edge of the beam and prevent the fibers fkom
bonding to the adjacent face. A special application technique was developed to offset this
problem. Figure 6.3 depicts the procedure that was used throughout this project.
79

Figure 63: Bearn retrofit technique.
The fmt step was simply to spray only one surface of the beam at a time. Prior to spraying
any particular surface, the adjacent faces were masked with masking tape to prevent any
resin overspray fkom accumulating. The first surface, typically the bottom, was sprayed with
no attempt to force the fibers around the corners (Step 1). They were simply allowed to
project outward fkom the edge of the surface. A nbbed aluminurn roller was used to compact
the material as described in Section 4.2. (Step 2). Afier the resin had hardened, the projecting
edges were trimrned off and a 45" bevel was ground into the edge of the GFRP plate (Step 3).
The beam was then flipped 180" and steps I through 3 were repeated for the top face, if
necessary for the particular retrofit scheme being used.
Once the GFRP applied to the top and bottom faces had cured sufficiently, the beam was
80

tumed 90" (Step 4) and one of the sides side was sprayed. This t h e , during the compaction
process, the GFRP material was rolled around the 45" bevels at the corners (Step S), allowed
to cure, and any excess material was then trimmed (Step 6). The beam was then flipped 180"
and steps 4 through 6 were repeated for the opposite side.
The above description details the technique used when spraying a11 four faces of the bearn, as
in Scheme D. For the other schemes, steps were omitted as needed depending on the number
of faces sprayed and the number of corners where sprayed faces met. For retrofit schemes
where sprayed faces were adjacent to unsprayed faces (i.e. Schemes A, B, C, and E), the
edge of the plates were sirnply trimmed off square without being beveled.
FoIlowing completion of the spraying process, the retrofitted beams were lefi for a minimum
of 48 hours under laboratory conditions. Though the exposure temperature does affect the
setting tirne of the resin, this effect is insignificant in this case since full resin strength is
reached in a matter of hours even at relatively low temperature. The 48 hour delay was
chosen more for scheduling reasons than due to any concerns over curing time.

6.2.4 - Flexural Strengthening
6.2.4.1 - Beam Design
To examine the effectiveness of the sprayed GFRP material in the flexural rehabilitation of
reinforced concrete members, a series of 20 beams was cast using normal strength (45 MPa)
concrete. These beams contained full reinforcement cages (flexural and shear reinforcement)
designed in accordance with CSA Standard A23.3-94 to produce a typical flexural failure
mode. Details of the beam cross section and reinforcernent sizes are provided in Figure 6.4
while stimp location and spacing are indicated in Figure 6.5.
Figure 6.4: Flexural strengthening - beam design.
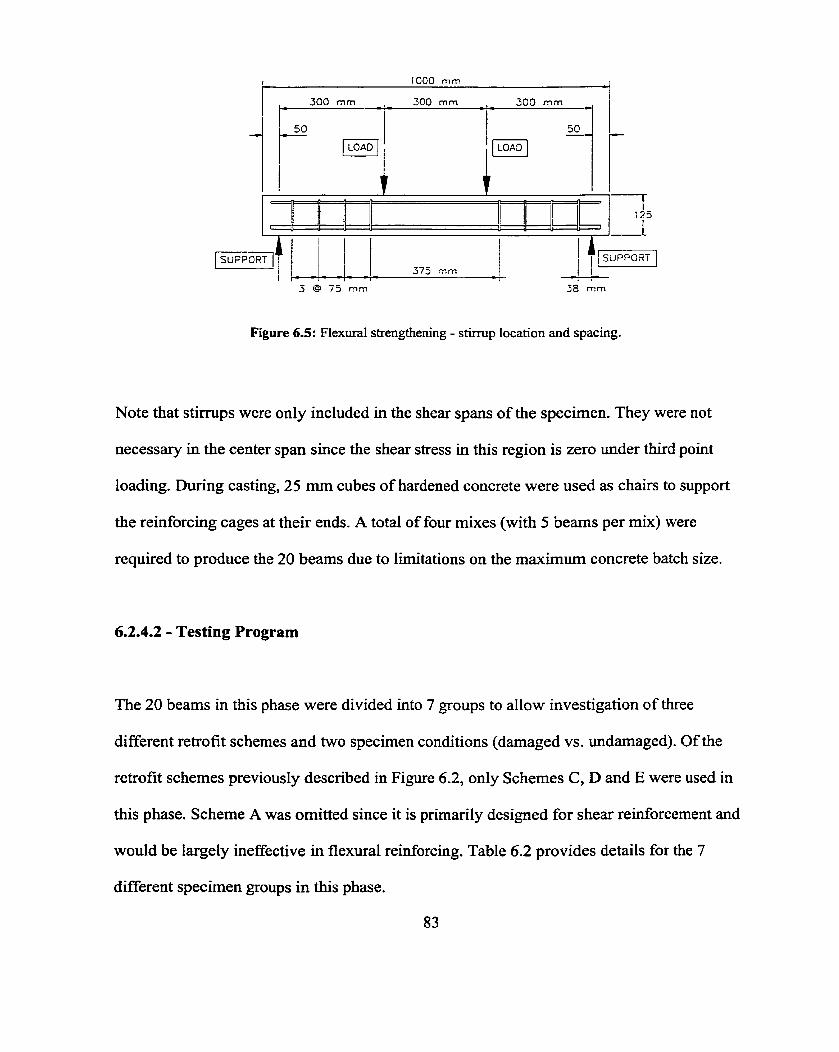
Figure 6.5: FlexuraI strengthening - stimip location and spacing.
Note that stirrups were only included in the shear spans of the specimen. They were not
necessary in the center span since the shear stress in this region is zero under third point
loading. During casting, 25 mm cubes of hardened concrete were used as chairs to support
the reinforcing cages at their ends. A total of four mixes (with 5 beams per mix) were
required to produce the 20 bearns due to limitations on the maximum concrete batch size.
6.2.4.2 - Testing Program
The 20 beams in this phase were divided into 7 groups to allow investigation of three
different retrofit schemes and two specimen conditions (damaged vs. undamaged). Of the
retrofit schemes previously described in Figure 6.2, only Schemes C, D and E were used in
this phase. Scheme A was omitted since it is primarily designed for shear reinforcement and
would be largely ineffective in flexural reinforcing. Table 6.2 provides details for the 7
different specimen groups in this phase.

1 Table 6.2: FlexuraI strengthenine; specimen a o u ~ s . 1
1 Retro fit Scherne Testhg Condition I I Specirnens I Number of
Control
Darnaged --L4 -
Damaged 2 D
Undarnaged 2
Care was taken to ensure that each of the groups containing four specimens (Groups 1-3) was
made up of one specimen fkom each mix. The remaining groups (containhg two specimens
each) were made up of two specimens fiom the same mix. Complete information for each
beam has been compiled in Appendix B.
E
The beams indicated in Table 6.2 as being damaged were subjected to a preloading stage
before rehabilitation with sprayed GFRP. Beams were tested in both the damaged and
undamaged condition in order to determine the effectiveness of sprayed GFRP in both
strengthening and repair applications. Preloading consisted of subjecting the beams to third
point loading until the center point deflection reached 5 mm (L1180). This damage Ievel was
also chosen during testing of the shear strength deficient bearns described in Section 6.2.5.
For those specimens, it corresponded to the appearance of the first shear crack, though it
preceded beam failure. For the flexural strengthening beams in this phase, this preloading
Damaged
Undarnaged
- -- - - - - - -
- 7
2

resulted in the appearance of several fine flexural cracks (approximately O. 1 mm in widui) at
this deflection level.
Following the preloading or damaging stage, the surfaces of both the damaged and
undarnaged specirnens were sandblasted in an attempt to optimize the GFRP-concrete bond
and then sprayed as described in Section 6.2.3. Spraying for this phase of the project was
performed by the author at the University of British Columbia.
This was the first set of specimens prepared with the equipment purchased for this project
and the fiber length was, at that tirne, limited to 32 mm. The material properties for this
material are discussed further in Chapter 5 (1, = 32 mm, a,,, = 104 MPa, E = 10.5 GPa, A, =
1.43 %, V, = 18 %). Application thickness was approximately 8 mm.
6.2.4.3 - Results & Discussion
The test results for the flexural strengthening phase are compiled below in Table 6.3. Note
that the values reported in the table represent the averages of al1 the bearns in each group.
Presented along with each test result is the percent change ('+' being an increase and ' - y
representing a decrease) induced by the retrofitting process, calculated with respect to the
control specimens. As discussed previously in Section 6.2.2, the failure modes reported in
Table 6.3 refer to the event occurring as the load reaches its peak value and then drops off.
For example, Table 6.3 indicates that the Scheme E specimens failed due to a debonding of
85
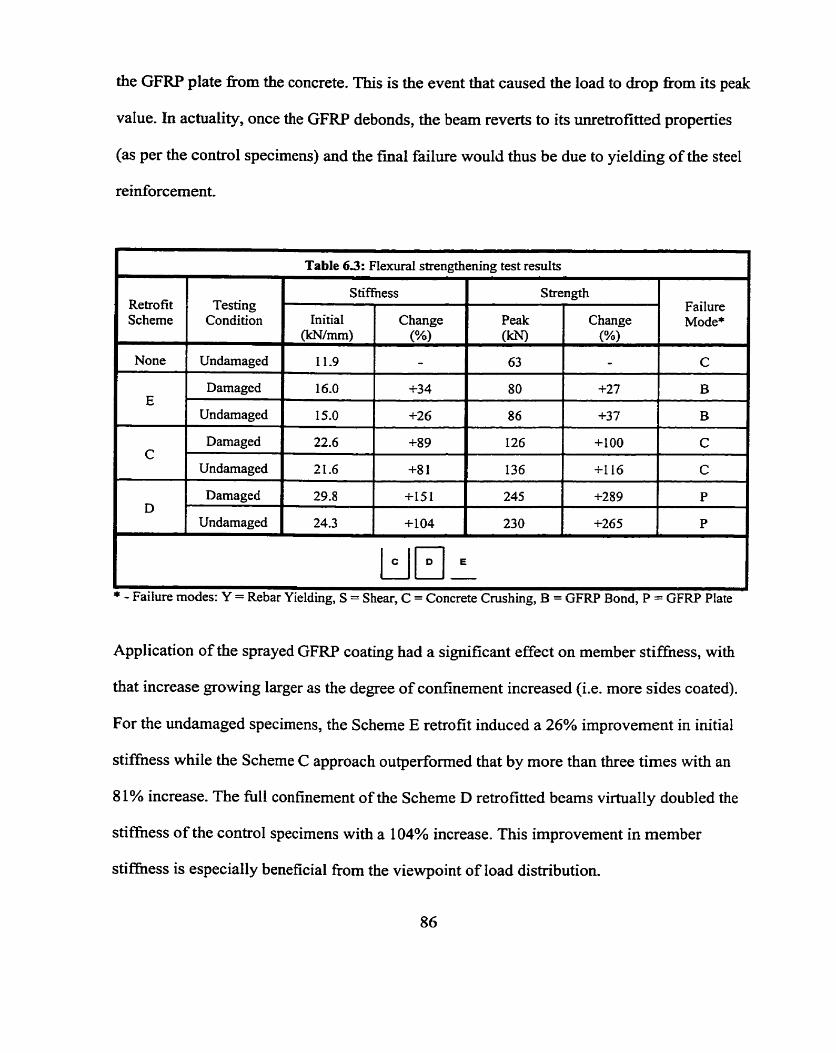
the GFRP plate fiom the concrete. This is the event that caused the load to drop from its peak
value. In actuality, once the GFRP debonds, the bearn reverts to its unretrofittzd properties
(as per the control specimens) and the fmal failure would thus be due to yielding of the steel
reinforcement.
1 Table 63: Flexural strengthening test results
lr1EI1 * - Failure modes: Y = Rebar Yielding, S = Shear, C = Concrete Cmshing, B = GFRP Bond, P = GFRP Plate
Retrofit Scheme
None
E
C
D
Application of the sprayed GFRP coating had a significant effect on mernber stiffness, with
that increase growing larger as the degree of confinement increased (Le. more sides coated).
For the undarnaged specimens, the Scheme E retrofit induced a 26% improvement in initial
stifhess while the Scheme C approach outperformed that by more than three times with an
8 1% increase. The full confinement of the Scheme D retrofitted beams virtually doubled the
stiffhess of the control specimens with a 104% increase. This improvement in member
stifniess is especially beneficial from the viewpoint of load distribution.
Testing Condition
Undarnaged
Damaged
Undarnaged
Darnaged
Undarnaged
Darnaged
Undamaged
S tiffness
Initial
11.9
16.0
15.0
22.6
21.6
29.8
24.3
Failure Mode*
C
B
B
C
C
P
P
Change (%)
-
+34
+26
+89
+8 1
+151
+IO4
Sîrengîh
Peak (W
63
8 O
86
126
136
245
230
Change (%)
-
+27
+3 7
+IO0
+II6
+289
+265

A very interesting trend appeared in these results as well. In al1 three retrofit schemes, the
repaired beams (i.e. damaged specirnens) showed slightly higher improvements in stiffness
than the strengthened beams (Le. undamaged specimens). The differences were, for the most
part, fairly small relative to the improvement over the control specimens and cannot be
considered statistically significant due to the small sample size, but were intriguing due to
the consistency in the results. One possible explanation that may explain this phenornenon is
the effect of the polyester resin on the cracks. It was noted that the resin does enter the
damage cracks during the spraying process. This penetrating resin may be acting as
reinforcement for the crack by adhesively bonding to both sides and thus resisting M e r
crack opening.
The second test result to be examined was the peak load camed by the specimens
imrnediately before failure. This is probably the most important value determined for each
beam since it signifies the ultimate load carrying capability of the beam and represents the
point beyond which failure occurs. As with the initial stiffness values, the peak load
exhibited by the specimens also increased with the nurnber of sides coated. Contrary to the
stifhess results, however, the darnaged specimens did not consistently outperform the
undamaged beams. In fact, there was very little difference between the two groups.
Other than the actual calculated values reported thus far in this section, there is a great deal
to be leamed fiom the load-deflection cui-ves of the different specimen types. The load-
deflection curves for the undamaged/strengthened specimens are shown in Figure 6.6 while
the respective curves for the damagedkepaired beams are provided in Figure 6.7.
87

on (mm)
Figure 6.6: FIexural strengthening specimens - Ioad-deflection curves (undarnagedstrengthened beams).
O 10 20 30 40 50 60
Deflection (mm)
Figure 6.7: Flexural strengthening specimens - load-deflection curves (darnaged repaired beams).

These figures include aU of the beams tested in this phzse of the project and have been
included prïmarily to indicate the consistency between identical specimens within each
specimen group (i.e. each retrofit scherne and testing condition combination).
For each of these specimen groups, a typicai cuve was determined using a curve fitting
software package. These typical curves are shown in Figure 6.8. As c m be seen fiom this
figure, there is no significant difference in performance between the damaged and the
undamaged specimens. Actually, there is not even a consistent trend as to which of these two
subgroups perfonns better.
O 10 20 30 40 50 60 Det7ectlon (mm)
Figure 6.8: FIexural strengthening specimens - m i c a l load-deflection curves (strengthencd vs, repaïred specimens).
For the Scheme D retrofit approach, the damaged beams seem to be slightly stronger while
the Scheme C specimens performed better in the undamaged condition. In the Scheme E
89

bearns, on the other hand, the curves actually crossed, though only after the damaged
specimen curve reached its peak load and began to drop.
Removing the curves related to the damaged specimens provides a very clear picture of the
improvement in performance exhibited by the retrofitted beams (Figure 6.9). The increases
in both stiffhess and peak load are easily discerned in this figure.
10 20 30 40 50 60
Deflection (mm)
Figure 6.9: Flexural strengthening specirnens - typical load-deflection curves.
Another important property related to beam performance is the energy absorbed by the
specimen during loading, which is represented by the area under the load-deflection curve.
Figure 6.10 indicates that the energy absorbed by the retrofitted specimens increased quite
dramatically as well.

O 10 20 30 40 50 60
Deflection (mm)
Figure 6.10: FIexural strengthening specimens - typical energy absorption curves.
A better cornparison can be obtained by determining the energy absorbed at similar
deflection levels. Figure 6.10 depicts the cumulative absorbed energy for each retrofit
scheme. Now it becomes obvious that the Scheme E beams absorb more energy than the
control specimens at al1 defiection levels. The Scheme C and D specirnens perform
incrementally better.
Another issue that had a significant effect on the results reported in this section is the failure
mode exhibited by the test specimens. As mentioned in Table 6.3, the control specimens
failed due to yielding of the longitudinal reinforcement, as expected in an under-reùiforced
bearn. In practice, this faiiure mode involves the formation of fine flexural cracks along the
bottom face of the bearn. These cracks grow wider and longer as the steel yields, causing the
91

neutral axis of the member to move upward, eventually leading to crushing of the concrete at
the upper surface of the beam. In a balanced section, the flexural cracking and the concrete
crushing should begin at the same tirne, though it is more typical for the failure to be initiated
by the flexural cracks as described above.
In the Scheme C specimens, the extra tensile reinforcement provided by the GFRP applied to
the bottom face of the bearn disrupted the balanced reinforcement condition. As would be
expected for an over-reinforced member, these beams tended to fail due to crushing of the
concrete in the compression zone at the upper surface of the beam before steel yielding. A
typical example of this faiiure is s h o w in Figure 6.1 1. This photograph shows the crushed
concrete in the compression zone.
Figure 6.1 1: Flexural strengthening specimens - typical failure of Scheme C specimens.

It should be noted here that this photograph was taken weli &er faifure of the specimen to
provide a better view of the cmshing zone once the GFRP had buckled. The debonding of the
GFRP which is evident along the side of the beam occurred due to the large deflections after
member failure and did not contribute to it.
The Scheme D specimens failed due to tensile fracture of the sprayed GFRP in the tension
zone at the bottom surface of the beam. Figure 6.12 provides a typical example of this failure
mode. This photograph shows the side of the beam shortly after failure. Initially, the GFRP
fails in tension at the bottom face, though the GFRP on the sides of the beam does not
immediately fail. Actually, the beam is still capable of carrying a significant amount of load
at this point.
As the load-defiection curve in Figure 6.9 indicates, even after failure of the GFRP takes
place (indicated by the large drop in load imrnediately folIowing the ultimate load) these
bearns can still carry a load of about 100 kN. This residual strength remains virtually
constant as cracks begin to propagate upward form both ends of the original failure.
Eventually, the GFRP on the upper surface buckles and the load carrying capability drops to
negligible values. The deflections associated with this point are extremely large and virtually
impossible to obtain with the available loading apparatus.

Figure 6.12: Flexural strengthening specimens - typical failure of Scheme D specimens.
Though both the Scheme C and D specimen failure modes tended to take full advantage of
the applied GFRP, a significant problem transpired in the Scheme E specirnens where the
GFRP was applied to the bottom face only. These beams tended to fail due to debonding of
the GFRP fiom the bottom face, resulting in specimen failure occurring before the GFW
could reach its Ml effectiveness. The photograph in Figure 6.13 depicts a typical example of
this failure mode.

Figure 6.13: Flexural strengthening specimens - typical failure of Scheme E specimens.
Again, this photograph was taken after specimen failure and shows both flexural cracking
and crushing of the concrete. Both of these damage mechanisms, however, occurred after the
initia! failure of the specimen due to debonding of the GFRP. Also apparent in the
photograph is the debonded GFRP layer along the bottom. This type of debonding begins at
one end of the GFRP and progresses inward toward the midspan, occurring very quickly and
leading to the appearance of flexural cracking and eventual crushing of the concrete.

6.2.5 - Shear Strengthening
The largest single portion of this project involved the strengthenuig of beams intentionally
designed to be deficient in shear strength. Shear strength deficiency is particdarly a problem
in structures designed in accordance with older building codes since newer codes place more
emphasis on this aspect of their performance. It can also be quite common in structures
exposed to chlorides, either fkom deicing salts or seawater, since corrosion of the
reinforcement will begin at the outermost steel, the shear stirrups. Effectively, the shear
capacity of the section will begin to deteriorate immediately.
A number of different investigations were conducted in this part of the research program and
these are summarized below in Table 6.4.
- -. - - - - - -
Table 6.4: Shear strengthening investigations. 1
--I S hear Strengthening
-
Project Phase
2
6.2.5.1 - Beam Design
Specirnen Type
To ensure shear failure in these beams, the flexural reinforcement was enlarged fi-om the two
96
Variables Considered
Beam Condition (Darnaged~Undarnaged)
FRP Strength FRP Confi,ouration Reinforcernent Configuration
GFRP Thiclcness
Fiber Length
Cornparison with Fabric Wraps
Section
6.2.5.2
6.2.5.3
6.2.5.4
6.2.5.5
6.2.5.6

10M bars used in rhe flexural strengthening specimens) to two 1 SM bars and the shear
stirmps completely eliminated - a worst case scenario. Typical beam dimensions and details
are shown in Figure 6.14.
Figure 6.14: Shear strengthening - beam design.
With the exception of one subgroup of beams to be discussed in this section, al1 of the beams
dealt with in this section were cast with normal strength concrete exhibiting a design
compressive strength of 45 MPa. As mentioned previously in Section 6.2.1 ., these beams
were 1 m in length, 96 mm in width and 125 mm in overall depth.
6.2.5.2 - Initial Study on Repair & Strengthening
This section describes the initial round of testing for shear strength deficient beams, which
was designed to examine the effectiveness of four different retrofit schemes in both the
97

strengthening and repair of shear strength deficient beams- There was a total of 3 1 beams
included in this phase, 22 cast fiom normal strength concrete and a further 9 cast fiorn high
strength concrete. As previously reported in Section 3.2. the design strengths for normal and
high strength concretes were 45 and 80 MPa, re~pecti~ely. These two sets of specimens will
be discussed separately, the normal strength specimens now and the high strength specimens
later in this section.
6.2.5.2.1 - Normal Strength Concrete
The 22 normal strength beams in this phase were divided into 9 groups to allow investigation
of four different retrofit schemes and two specimen conditions (darnaged vs. undarnaged). Of
the retrofit schemes previously described in Figure 6.2, Schemes A, B, C, and D were used.
Scheme E was omitted since it is primarily designed for flexura! reinforcement and was not
expected to contribute significantly to the shear strength of the mernber. Table 6.5 provides
details for these 9 different specimen groups.
The beams indicated in Table 6.5 as being damaged were subjected to the same preloading
stage descnbed in Section 6.2.4.2. which consisted of subjecting the beams to third point
loading until the center point deflection reached 5 mm (LA 80). For these specimens, this
deflection level corresponded to the appearance of the first shear crack, though it preceded
beam failure in most cases.

Unfortunately, the difference in load between the appearance of this initial crack and full
failure of the member in shear was very small. Occasionally, a bearn would fail before the
loading could be stopped. Such bearns were exciuded fiom the study. There was also a
second problem involving confusion on the part of the spray operator conceming specimen
identification which resulted in the specimens being unevenly distributed between groups
@oth the normal strength specimens discussed here and the high strength concrete specimens
covered in the next section).
Table 6.5: Shear strengthening - Phase 2 specimen groups (initial study, normal strength concrete).
Following the preloading or damaging stage, the surfaces of both the damaged and
undamaged specimens were sandblasted in an attempt to optimize the GFRP-concrete bond
and then sprayed as described in Section 6.2.3. Spraying for this phase of the project was
Retrofit Scheme
None
A
B
C
D
Testing Condition
Conîrol
Damaged
Undamaged
Damaged
Undarnaged
Damaged
Undamaged
Darnaged
Undamaged
Number o f Specimens
5
1
2
3
I
1
4
3
2

performed by GU Manhole Liners Ltd. of Aldergrove, BC. Strength properties for the
applied GFRP matenal are discussed in Chapter 5 (If= 8 mm, ou,, = 35 MPa, E = 5.8 GPa, A,
= 0.66 %, V, = 8 %). The GFRP was applied in a coating approxirnately 6 mm thick.
Test results for the normal strength specimens are compiled in Table 6.6. The values reported
in the table represent the averages of al1 the beams in each group.
1 Table 6.6: Shear strengthening - Phase 2 test results (initial study, normal strength concrete). 1 Retrofit Testing Scheme Condition
Strength Absorbed Energy Failure Mode* Change
None Undamaged
Darnaged A
Undamaged
Damaged B
Undamaged
I Damaged : C
Darnaged
~ k- Undamaged
* - Failure modes: Y = Rebar Yield, S = Shear, C = Concrete Crushing, B = GFRP Bond, P = GFRP Plate
Examining the results fkom Table 6.6, it appears that the GFRP applied to the sides of the
beam has no effect on stifhess. The Scheme B and Scheme C specimens, however, indicate
that GFRP applied to either the top or bottom surface will make the specirnen more rigid.

The lack of M e r increases in stifkess among the Scheme D specimens implies that
spraying both of these surfaces does not produce a cumulative effect. It also confms the
Scheme A results by showing that coating the side faces makes no contribution to stifbess.
As found in the flexural strengthening phase, there appears to be no significant difference
between the repaired and strengthened beams.
Udike the initial stiffness values, the peak load exhibited by the specimens increased for
every retrofit scheme. Similarly to stiffness, however, is the appearance of two distinct
groups of irnprovement. The Scheme A and B specimens reported similar peak load
increases while the Scheme C and D retrofits produced nearly identical improvements. These
two groups can also be identified by the placement of the retrofitted sides (i-e the two groups
each receive contributions from specific retrofitted surfaces). The improvements in the
Scheme A and B specimens seems to be due solely to the two vertical sides while the
increase in load carrying ability exhibited by the Scheme C and D specimens seems to be a
combination of this and the addition of the bottom face.
Though the stiffness results indicated that the top and bottom faces have virtually the same
effect on member stiffness, they do not have the same effect on ultimate load. In the latter
case, the top face does not appear to contribute significantly to load carrying ability while the
bottom face provides a significant amount of strength.
Again, the peak load results indicate no consistent difference between the GFRP
strengthened specirnens and those damaged and then repaired with sprayed GFRP. The
101

Scheme A and B beams reported slightly higher values for the undamaged beams while the
Scheme C and D retrofits exhibited the opposite, slightly lower values for the undamaged
members. None of these differences can be considered to be significant.
The results for energy absorbed by the specirnens up to peak Ioad show that the the Scheme
A specimens exhibited a 300% increase in absorbed energy with respect to the control
specimens while the Scheme B specimens showed an increase of only 270%. Though this
difference is not statistically significant, there is a specific reason for its occurrence. As will
be shown later in this section, the drop in absorbed energy between the Scherne A specimens
to those retrofitted using Scheme B can be directly attributed to the increased stifmess in the
Scheme B members. The resulting shifi in the load-deflection curve causes the area under
that curve to be reduced. This additional stifbess also appeared in the Scheme C and D
beams but its eEect on the energy absorbed was overshadowed by the much Iarger increases
in energy absorption exhibited by these specimens.
Again there was no consistent difference between the damaged and undarnaged specimens
with respect to energy absorbed. A significant difference was reported for the Scheme B
specirnens but the trend was not consistent among the other schemes and was thus considered
to be an anomaly.
For each of the specimen groups, a typical curve was detemiined using curve fitting
software. These typical curves are shown in Figure 6.15. Further figures showing each
particular combination beam separately, along with the average or typical value for each, can
102

be found in Appendix C.
5 10 f 5 ôeflecüon (mm)
Figure 6.15: Shear strengthening - Phase 2 typical Ioad-deflection curves (initial study, strengthened vs, repaired specimens, normal strength concrete).
Elirninating the curves representing the damaged specimens leaves Figure 6.16. This diagram
shows the distinct differences arnong the four different retrofit schemes. First, the increased
stiffness in the Scheme B, C and D members, with respect to the control specimens and
Scheme A beams, is readily apparent. Second, the increase in peak load which was virtually
the same for the Scheme A and B specimens, as well as for the Scheme C and D beams, is
also evident. Finally, the reason for the drop in absorbed energy between the Scheme A
Scheme B retrofits is also clear. The increased stifhess of the Scheme B specimens shifted
the load-deflection curve leftward toward the y-mis, resulting in a reduction in the measured
area under the curve.
I O3

Scherne D h
5 10 15 Deflection (mm)
Figure 6.16: Siiear strengthening - Phase 2 typical load-deflection curves (initial study, normal strength concrete).
n
Deflection (mm)
Figure 6.17: Shear strengthening - Phase 2 typical energy absorption curves (initial study, normal strength concrete).

It must be pointed out that this apparent reduction in absorbed energy only exists because the
cornparison was made between the energies absorbed up to the point of ultimate load.
Comparing the cumulative energy absorbed at similar deflection levels (as shown in Figure
6.17) makes it obvious that the Scheme B bearns actually absorbed more energy than the
Scheme A specimens at al1 deflection levels.
Actually, the Scheme B, C and D specimens al1 absorbed energy at the same rate, up to the
successive points where the first bvo specimen types failed. The Scheme A specimens, on
the other hand, were virtually identical to the control beams pnor to failure of the latter
specimens.
Before discussing the failure modes of the various retrofitted specimens, it is first necessary
to describe the failure mode exhibited by the control spscirnens. These specimens exhibited a
typical shear failure as depicted in Figure 6.18 below.
Looking at the typical failure modes indicated in Table 6.6 reveals that a significant probtem
arose with respect to the bond strength of the sprayed GFRP material. Other than the Scheme
D specimens, al1 of the retrofitted beams tended to fail due to debonding of the GFEW.
Though this should not affect the shape of the load-deflection curves up to the point of bond
failure, it does essentially act to stop the curve at that point, preventing the GFRP fkom
reaching its full potential.
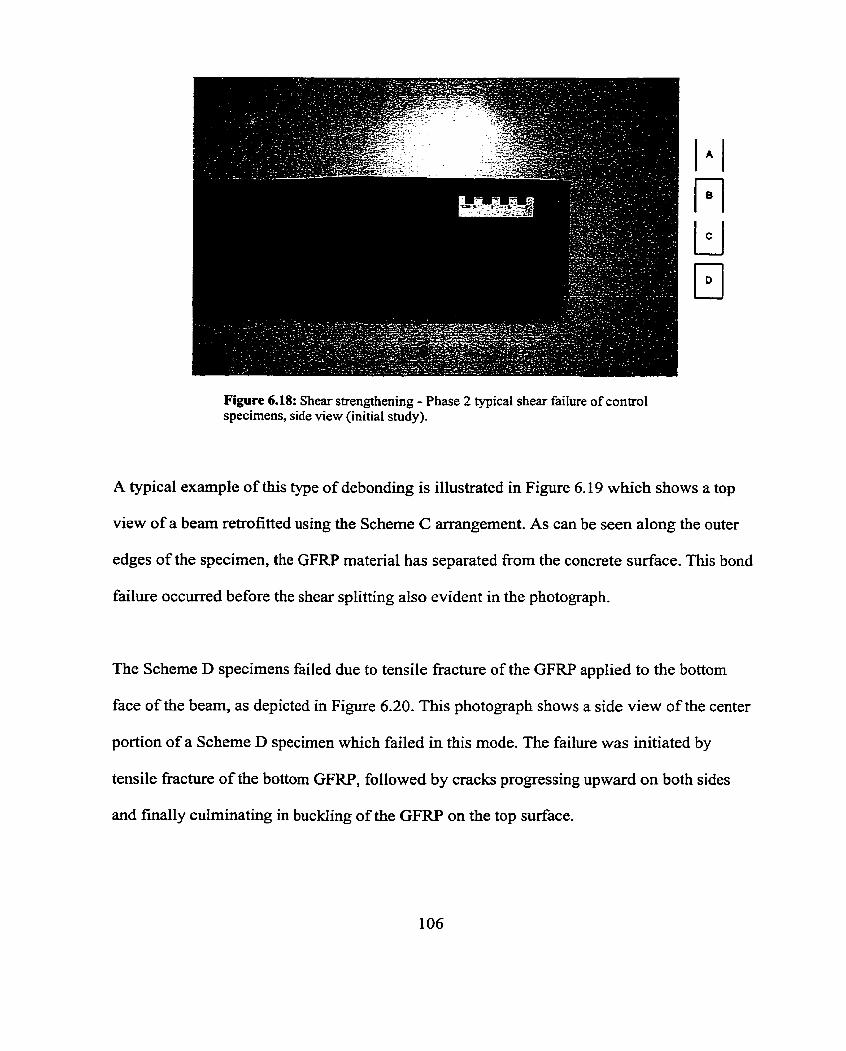
Figure 6.18: Shen strengthening - Phase 2 typical shear failure of control specimens, side view (initial study).
A typical example of this type of debonding is illustrated in Figure 6.19 which shows a top
view of a bearn retrofitted using the Scheme C arrangement. As can be seen along the outer
edges of the specimen, the GFRP material has separated fkom the concrete surface. This bond
failure occurred before the shear splitting also evident in the photograph.
The Scheme D specimens failed due to tensile fracture of the GFRP applied to the bottom
face of the beam, as depicted in Figure 6.20. This photograph shows a side view of the center
portion of a Scheme D specimen which failed in this mode. The failure was initiated by
tensile fracture of the bottom GFRP, followed by cracks progressing upward on both sides
and finally culminating in buckling of the GFRP on the top surface.

Figure 6.19: Shear strengthening - Phase 2 typical GFRP debonding, Scheme C specimen top view (initia1 study).
I A I F l 1 - 1
Figure 6.20: Shear strengthening - Phase 2 typical GFRP tensile faihre in Scheme D specimens, side view (initial study).
1 O7

6.2.5.2.2 - High Strength Concrete
To detennine whether the sprayed GFRP rehabilitation technique would be effective for
concrete members cast from high strength concrete (which tends to be more brittle), a second
series of specimens was added to this project phase. This series consisted of 9 beams which
were divided into 5 groups to allow investigation of the two most effective retrofit schemes
along with both the strengthening and repair approaches. Of the retro fit schernes previously
described in Figure 6.2.3, only Schemes C a ~ d D were investigated. Table 6.7 provides
details for the 5 different specirnen groups in this phase.
-- - - - - - - - - - - - -
Table 6.7: Shear strengthening - Phase 2 specimen groups (initial study, hi& strength concrete).
Retro fit Scheme 1 Testing Condition Number of Specimens
None 1 Control 1 2
I
The bearns indicated in Table 6.7 as being damaged were subjected to the sarne preloading
stage originally descnbed in Section 6.2.4.2. The problem previously discussed in Section
6.2.5.2.1. concerning premature failure of the beam during the preloading stage was even
I Damaged
Undamaged
i
1
Damaged
Undamaged
3
2

more prevalent with the hi& strengtli concrete specimens. Since these beams could no
longer be used in the study, the number of remaining specimens was limited. Though the
original plan called for the testing of three retrofit schemes (A, C and D), the wrnber of
specimens remaining resulted in the study being Iimited to the two retrofit schemes included
in the table.
Following the preloading, the surfaces of al1 specimens were sandblasted and then sprayed as
previously described in Section 6.2.3. Spraying was again performed by GU Manhole Liners
Ltd. of Aldergrove, BC. Strength properties for the applied GFRP material were discussed in
Section 5.2 (a,,, = 35 MPa, E = 5.8 GPa, A,= 0.66 %, V, = 8 %, t = 6 mm).
Test results for the hi& strength specimens are compiled in Table 6.8. The values reported in
the table represent the averages of al1 the beams in each group. Both the Scheme C and
Scheme D specimens exhibited significant increases in member stiffness, with the repaired
specimens showing a larger improvement in both cases. The Scheme C retrofit actually
produced larger improvements than the Scheme D retrofit, though the difference between the
two was deemed to be statistically insignificant, primarily due to the small sample size.
Complete data for these specimens has been included in Appendix D. The peak load results
indicate that, again, there is a large increase in load carrying ability imparted by both retrofit
schemes but that there is very little difference between them or between the damaged and
~mdamaged specimens.

1 Table 6.8: Shear strengthening - Phase 2 test results (initia1 study, high strength concrete:
Failure Mode*
Retrofit Scheme
L
None
C
D
L
* - Failure modes: Y = Rebar Yielding, S = Shear, C = Concrete Cmshing, B = GFRP Bond, P = G m Plate
Though the performance of the Scheme C and D specimens were, for ail practical purposes,
identical with respect to member stiffhess and ultirnate load carrying ability, the amount of
Testing Condition
Undarnaged
Darnaged
Undamaged
Damaged
Undamaged
energy absorbed by the specimens up to peak load was significantly different. The Scheme D
retrofit produced much larger increases in absorbed energy, with the undamaged specimens
performing much better than the repaired members for both schemes. It should also be noted
here that the degree of improvement obsewed in the high strength concrete members was
very similar to that exhibited by the normal strength concrete specimens.
Typical load-deflection curves were determined for each specimen group and are shown in
Figure 6.21. As can be seen from this figure, the strengthened (undarnaged) bearns in each
group performed slightly better than their repaired (darnaged) counterparts.
Stiffriess
Initial WI-)
21.0
30.7
27.8
27.6
24.9
Change (%)
-
46
32
3 1
18
Strength Absorbed Energy
Peak OrN)
52
1 44
152
143
152
To Peak CN-m)
77
674
785
1017
1182
Change (W -
177
192
175
19 1
Change (%) ,
775
9 19
122 1
1434

5 10 15 20 OefIecüon (mm)
Figure 6.21: Shear strengthening - Phase 2 typical load-deflection curves (initial study, strengthened vs. repaired specimens, high strength concrete).
Also visible in this diagram is the difference between the Scheme C and D specimens. It is
apparent that the Scheme D members are capable of carrying load further beyond the point of
reinforcement yielding than those fiom Scheme C before reaching failure. This explains the
increase in energy absorption exhibited by the Scheme D bearns even though the ultimate
load did not change.
Figure 6.22 depicts the cumulative energy absorption for each of the retrofit schemes, as well
as the control specimens. The absorption rates for the Scheme C and Scheme D beams were
much higher than that of the control specimens and were very similar to each other up to the
point where the Scheme C specimens failed.

5 10 15 20 Defiection (mm)
Figure 6.22: Shear strengthening - Phase 2 typical energy absorption curves (initial study, high strength concrete).
Illustrations of failure modes for the high strength specimens are not included since these
modes were identical in appearance to those reported for the normal strength specirnens in
the previous section. The single variation was the tendency of the strengthened Scheme C
specimens to fail due to tensile fracture of bottom GFRP (similar to the Scheme D beams) as
opposed to the debonding failure previously described.

6.2.5.3 - Effect of l?RP Strength
The specimens discussed in the previous section (6.2.5.2) were sprayed by GU Manhole
Liners Ltd. of Aldergrove, BC. After completion of that phase of the testing program, the
University of British Columbia Department of Civil Engineering purchased its own GFRP
spraying equipment, as descnbed in Section 4.2. From this point on, al1 of the sprayed GFRP
applications discussed were perfomed by the author using this new equiprnent.
A longer chopped fiber length (32 mm) and a different resin (polyester) were implemented
along with the new equipment, resulting in a higher GFRP strength and elastic modulus (as
discussed in Section 5.2.2). Consequently, it was decided that a portion of the initial study be
repeated to see the effect of these material improvements. As a result, this porion of the study
was designed to reexarnine the effectiveness of the three primary retrofit schemes used in the
initial study (Schemes A, C and D). Scheme B, which involved coating the sides and top of
the specirnen, was omitted due to its inapplicability to real-life applications. Also, since the
previous testing failed to indicate any significant difference between strengthened and
repaired specimens, it was decided to reduce the number of test specimens by using only
undamaged specimens. Conversely, this project phase was expanded to investigate two other
factors.
First; there was some concern whether the development length of the reinforcement was
sufficient to prevent debonding of the concrete fkom the steel since this failure mode had
been observed in a few specimens. To investigate this problem, the use of hooked
i l 3

reinforcernent was included in the testing program. Basically, the ends of the reinforcing bars
were bent upwards at a 90" angle and continued in this direction for another 50 mm.
Second; another issue that was raised was the continuity of the bottom GFRP over the entire
length of the member. It was felt that continuation of the GFRP over the supports in the
laboratory specimens rnay result in a clamping action as the downward loading force pimed
the GFRP between the concrete beam and the support. Such a clarnping action might work
toward preventing GFRP fiom debonding. In a field application of such materials, the GFRP
would have to be discontinued at the beam supports (i.e column, girder, etc.) due to lack of
access. To investigate this problem, some of the specimen configurations were duplicated,
except that the bottom GFRP was abbreviated (ground off) short of the supports.
Additionally, one of the primary problems encountered to this point in the testing program
was the premature debonding of the GFRP material f?om the concrete surface. Consultation
with the resin manufacturer (Ashland Chemical Canada Ltd.) resulted in their suggestion to
apply a vinyl ester resin to the concrete surface before cornmencing the spraying operation.
According to the manufacturer, vinyl ester possesses superior bonding characteristics with
concrete and should act as a coupling agent between the concrete and the polyester resin used
in the spraying operation. This vinyl ester resin is m e r discussed in Section 3.3.3.
In operation, the vinyl ester was prepared (catalysed) and applied hy hand with a simple
paint bmsh. It was allowed to cure until Cta~kyy, when it was still sticlq to the touch but
would no Longer leave any residue behind on the tester's fmger. At this point, the regular
114

spraying operation, as described in Section 4.3, was performed.
There was a total of 16 bearns included in this phase, all cast fiom normal strength (45 MPa)
concrete. These specimens were divided into 8 groups to allow investigation of the three
retrofit schemes (A, C and D), two lengths of bottom face GFRP (hl1 length and
abbreviated) and two shapes of reinforcement (straight and hooked). The resulting 8 groups
are detailed in Table 6.9 below.
Table 6.9: Shear strengthening - Phase 3 specirnen groups (FRP strength effect).
The surfaces of al1 specirnens were sandblasted in an attempt to optimize the GFRP-concrete
bond and then sprayed as descrïbed in Section 6.1.2. Spraying for this phase of the project
was performed by the author at the University of British Columbia. The mechanical
properties for this matenal are discussed further in Chapter 5 (1, = 32 mm, O,,, = 104 MPa, E
= 10.5 GPa, A, = 1.43 %, V, = 18 %). Application thickness was approximately 6 mm.
Reîro fit Scheme
None
A
C
D
Retrofit Details
None
Full Length
Full Length
Reinforcement Details
Straight
Sîraight
Hooked
Nurnber of Specimens
3
2
2
2
2
2
2
I
Full Length
Full Length
Abbreviated
Fu11 Length
Abbreviated
Straight
Hooked
Hooked
Straight
Hooked

Averaged test results for the Phase C specimens are cornpiled in Table 6.10, with the values
reported being the averages of al1 the beams in each group. Full details are included in
Appendix E.
1 TabIe 6.10: Shear strengthening - Phase 3 test results (FRP strength effect).
To Failure Initial Change Peak Change Peak Change Mode*
O<N/mm) (%) (icN) (%) (%)
18.7 - 47 - 72 - S
* - Failure modes: Y = Rebar Yield, S = Shear, C = Concrete Crushing, B = GFRP Bond, P = GFRP Plate ** - Full = Fui1 length FRP on bottom, Abbr = FRP does not extend over support.
Exarnining the stiffhess values reveals that, again, the Scheme A retrofit has very little effect
on member stiffness while both the Scheme C and D retrofits induce significant increases.
Considering the different variables investigated in this phase of the project, we can see that
the Scheme A specirnens exhibit a slight decrease in stiffiiess between the straight and
hooked reinforcement configurations (for the full length GFRP application) whiie the same
cornparison in the Scheme C specirnens shows completely the opposite trend.

Looking at the effect of GFRP length, we c m see in the Scheme C specimens that the
abbreviated length produced a higher stif£hess than the corresponding full length version.
The Scheme D beams, on the other hand, exhibited a drop in stifiess between the full iength
and the abbreviated GFRP specimens. It appears that neither factor can be said to produce a
consistent, significant effect on initial member stifniess. The overall improvement in
stifniess for each of these schemes was more pronounced than that of the Phase A specimens,
however.
The peak load results exhibit a sirnjlar result. Here, there is no significant difference between
full length and abbreviated GFRP or between straight and hooked reinforcement for any of
the retrofit schemes. What is interesting to note, however, is the effect of retrofit scheme on
the ultimate strength of the members.
Examining the energy absorbed up to peak toad shows that the three retrofit schemes
produced average increases of S67%, 719% and 6525% for Schemes A, C and D,
respectively. The very large increase exhibited by the Scheme D specimens dwarfs that of
the other two schemes, making cornparison difficult.
Since no consistent, significant difference was observed behveen the two GFRP lengths
investigated or between the two shapes of reinforcement used, these variables were
discounted and the average test results were recalculated to include al1 specimens in each
retrofit scheme. These revised results are shown in Table 6.1 1 below.

L I * - Failure modes: Y = Rebar Yield, S = Shear, C = Concrete Cmhing, B = GFRP Bond, P = GFRP Plate
The primary objective of this testing phase was to determine the effect of increasing the FRP
strength from 35 MPa (in the initial sîudy) to 104 MPa in this portion of the study. To allow
a direct cornparison of these two matenals, Table 6.12 summarizes the change in results
between the two sets of specimens. Note that for consistency, only the values corresponding
to the undamagedktrengthened beams were used fkom the initial study results.
The control specimens £tom each testing phase are virtually identical so a direct comparison
is possible. As expected, al1 of the specimens from this testing phase significantly
outperformed their counterparts fiom the initial study, with the exception of the energy
absorption values of the Scheme C beams. This apparent anomaly is related to the change in
stiffhess and failure mode exhibited by these members, as discussed below.

1 Table 6.12: Shear strengthening - cornparison of test results for different FRP strengths.
I A II lm * - Failure modes: Y = Rebar Yield, S = Shear, C = Concrete Crushing, B = GFRP Bond, P = GFRP Plate
These improvernents are a direct result of the change in GFRP retrofit material. The new
material has a higher strength and, apparently, produces a better bond with the concrete
surface, as evidenced by the failure mode exhibited in the Scheme C specimens. The typical
mode of failure is no longer debonding (though it did still occur in some specimens) but
crushing of the concrete in the compression zone at the upper surface of the beams. The load
Iùnit at which debonding occurs is now very close to that required to induce concrete
crushing, which is why some specimens did still debond while others failed in crushing.
Even though the Scheme A specirnens still failed due to debonding, they also registered a
large increase in load carrying abiiity over their initial study counterparts. This is also a
direct result of the improved GFRP-concrete bond strength, which is capable of withstanding
higher loads. The Scheme D specimens, which exhibited the largest increase by far, still
failed due to tensile fracture of the bottom GFRP and were thus able to take full advantage of

the increased GFRP strength.
From an energy absorption standpoint, ody the Scheme C specimens were not significantly
improved by the change in FRP properties, probably due to a change in failure mode.
Though these beams failed at higher load level, they also exhibited an increased stiffhess,
resulting in a leftward shift of the load-deflection curve and a smaller AUC.
Looking at the typical load-deflection curves for each retrofit scheme fiom the higher
strength FRP specimens (Figure 6-23)? it is evident that the Scheme D retrofit is far and away
the most effective approach. Also evident is the increase in stifhess (described previously)
between the Scheme C/D specimens and the control/Scheme A members.
O 1 O 20 30 40 50 60 OeflecUon (mm)
Figure 6.23: Shear strengthening - Phase 3 typical load-deflection curves.

Adding the Load-deflection curves fiom the initial shidy specimens indicates the large
improvements produced by the superior FRP strength used in this part of the study (Figure
6.24). The increascd stiffness induced by the higher strength FRP is also visible in this
figure.
10 20 30 40 Detiection (mm)
Figure 6.24: Shear strengthening - cornparison of typical load-deflection curves for different FRP strengths.
Figures 6.25 and 6.26 illustrate the large differences in fracture energy absorption between
the control specimens and the retrofitted beams for the specimens retrofitted with the higher
strength FRP. Figure 6.25 includes the entire range of results up to the conclusion of testing
for the Scheme D specimens while Figure 6.26 is a magnification of the initial portions of
this graph.

O 1 O 20 30 40 50 60
Deflection (mm)
/ /
6 g 6000
/ ,,/' /
Figure 6.25: Shear strengthening - Phase 3 typical energy absorption curves (1 O4 MPa FRP).
t 3 4000 q
g s
5 1 O Deilecrion (mm)
/
Y ' - ," ,
I
,
Figure 6.26: Shear strengthening - Phase 3 typical energy absorption curves (104 MPa FRP, rnagnified).
Scheme C {

Here we can see that the Scheme C specirnen curve is again identical to that of the Scheme D
specimens until it reaches its ultimate load. The deviation from the Scheme D curve occurs
during the post-peak performance region a d its continuation and shape is a direct result of
the concrete crushing failure mode. This is a relatively ductile failure mode and (as evident
in the figure) has the ability to absorb significant arnounts of fracture energy even after
reaching its ultirnate load.

6.2.5.4 - Effect of FRP Thickness
As described in Chapter 4, the sprayed GFRP application process is fairly straightforward
with the exception of the operator's abilfty to judge the thickness of the applied matenal. Not
only is it difficult to detennine the amount of material that has been placed on the surface,
the additional step of roller compacting the material complicates the issue fiirther. The
arnount of compaction achieved by a given amount of rolling at a specified pressure varies
with fiber length.
The shorter fiber iengths tend to be sensitive to excessive pressure on the roller and thus need
more passes with less applied force. The longer fibers, on the other hand, can be rolled out
very quickly using more roller pressure. Eventually, al1 of the fiber lengths c m be compacted
to the sarne degree (as indicated in the fiber volume fiaction measurements in Section 5.4).
The question becomes; how can the thickness of the material be judged during the spraying
operation.
During initia1 experimentation with the spraying equipment it was discovered that the
arnount of material deposited before rolling should be limited. Too much built up material
makes rolling very difficult as the fibers themselves tend to move around during rolling.
Applying the GFRP in stages, rolling out each stage immediately after it is applied, makes
the process of building up thicker coatings more feasible.
In this phase of the study, an attempt was made to quantify the rate at which the material was
124

deposited and to examine the effect of variations in the applied thickness. Several different
GFRP thicknesses were examined with those thicknesses determhed by the application
process itself. A series of 17 bearns was cast and divided into 9 groups, as indicated in Table
6.13. Only retrofit Schemes C and D were used in this phase of the project and al1 GFRP
contained 32 mm fibers.
Table 6.13 indicates the nominal thickness in miIIimeters for each group of specimens.
However, these values were measured after GFRP application was complete and are thus a
Table 6.13: Shear strengthening - Phase 4 specimen groups (FRP thickness).
h c t i o n of the process, not def'ned values. In the spraying operation itself, there are two
variables which affect the final thickness of the material, the number ofpasses and the
number of layers. While spraying the GFRP, the operator moves the gun in a back and forth
motion while at the same time moving fiom one end of the specimen to the other. When the
Number of Specimens I
3
2
2
2
2
2
1
2
1
Retrofit Scheme L
None
C
D
GFRP Thickness (mm)
NIA
3 -5
4.5
6.0
8 .O
3.5
4.5
6.0
8.0

other end of the specimen is reached, it is considered one full pass. Basically, this means the
entire surface has been covered by one Iayer of the spray with minimal overlap at the edges.
As mentioned previously, there is a limit to the amount of material that c m be built up before
the rolling process starts to becomes difficult. This upper limit appears to be about four
passes, after which the GFRP must be is rolled out. This constitutes one layer. Thus, the
spraying operation consists of a number of passes, followed by the rolling operation, more
passes, another rolling operation, etc. In other words3 each layer is made up of several passes,
in this case either two, three or four. To create the different thichesses needed for the study,
four combinations of passes and layers were used. These combinations are detailed in Table
6.14.
1 Table 6.14: Eauhalent thickness of ~ass/laver cornbinations. 1
I Number I Number of of 1 Equivarenr 1
Layers Passes
The smallest thichess of 3.5 mm was chosen fkom experience as the minimum thickness
that could be applied consistently. Anything Iess than this made it veiy difficult to maintain
thickness consistency due to the small arnount of material involved and the variability in
126

matenal deposition inherent in the spraying process. The rolling process was capable of only
a limited amount of material redistribution since the fibers resisted such movement.
The other thicknesses were determined simply by incrementally increasing the total nurnber
of passes (i.e. number of iayers x nurnber of passes) fiom the original 3 to 4, 6 and fmally 8.
Thicknesses beyond 8 mm were not considered due to their overly large size relative to the
width of the specimen. Measurements indicated that the variation in material thickness was
typically within * 0.5 mm. Test results for the specimens in this phase of the project are
shown below in Table 6.15. Further details are included in Appendix F.
1 Table 6.15: Shear strengthening - Phase 4 test results (FRP thickness).
I * - Failure modes: Y = Rebar Yield, S = Shear, C = Concrete Crushing, B = GFRP Bond, P = GFRP PIate

The initial member stiflhess results show increasing stiffness as the GFRP thickness
increases, with the sole aberration being the 6.0 mm thickness in the Scheme C retrofit. This
result appears to be excessively high and does not seem to fit into the trend exhibited by the
other Scheme C specimens. Otherwise, the remaining Scheme C specimens, and the Scheme
D members follow a definitive upward trend. This type of consistent trend is also apparent in
the peak load results. In this case, both retrofit schemes exhibited consistent trends, though
the rate of increase was much higher in the Scheme D specimens. Al1 of the specimens
showed very large improvements over the control beams.
The increases in energy absorption were very large for al1 specimens, when compared to the
control beams. The variation between thicknesses was quite low in the Scheme C specimens
relative to the Scheme D members.
Typical load-deflection curves for the various combinations of retrofit scheme and GFRP
thiclcness are depicted in Figure 6.27. Both retrofit schemes are included to indicate the
significant difference between them. To provide M e r clarity, Figure 6.28 depicts only
bearns fiom the Scheme C retrofit whiIe Figure 6.29 shows only the Scheme D beams. In
both cases, there is a definite trend of increasing performance with increasing GFRP
thickness. The control curve is also included in both figures for cornparison purposes.

Figure 6.27: Shear strengthening - Phase 4 typical load-deflection cuves by FRP thickness.
O 5 10 15 20 25 30 Defiedon (mm)
Figure 6.28: Shear swengthening - Phase 4 typical load-defiection curves by FRP thickness (Scheme C).

300
I
O 20 40 60 80 1 O0 Defledion (mm)
Figure 6.29: Shear strengthening - Phase 4 typical load-deflection c w e s by FRP thickness (Scheme D).
Figure 6.30 shows the initial portion of the fkacture energy curves for the vanous specimen
configurations. There is a significant irnprovement in absorption rate over the control
specimens for al1 beams. Initialiy, al1 of the retrofitted beams absorb energy at the sarne rate,
though in general the Scherne D retrofit curves appear to exhibit steeper curves than their
Scheme C counterparts. There is also a consistently increasing trend corresponding to the
increases in GFRP thickness, which becomes more accentuated in the post-peak performance
of the beams.

O 5 10 15 20 25 30 Deîlecrion (mm)
Figure 6.30: Shea. strengthening - Phase 4 typical energy absorption cunres by FRP thickness.
The failure modes of this set of specimens tended to be much more consistent than previous
sets. Of the 11 retrofitted beams tested, only one failed due to debonding of the GFRP.
Otherwise, al1 of the Scheme C specimens failed due to cnishing of the concrete in the
compression zone while the Scheme D specimens failed due to fracture of the GFRP in the
tension zone.

6.2.5.5 - Effect of Fiber Length
The material properties of the sprayed GFRP material are directly related to the length of the
fibers, as indicated in Chapter 5. Thus, it is desirable to produce the longest fibers possible.
The initial shear strengthening beams discussed in Section 6.2.5.2 were sprayed by GU
Manhole Liners Ltd. using 8 mm fibers. Up to this point in the project, al1 the beams
retrofitted at the University of British Columbia were done so using a fiber length of 32 mm.
It was decided to see if the fiber length could be further increased and what effects the
different fiber lengths would have on test results.
As previously mentioned in Section 4.2, fiber length is determined within the chopper unit of
the spraying equipment. The chopper rotor has a series of blades embedded around its
circumference and the length of chopped fiber is entirely dependent upon the number and
spacing of these blades. The existing rotor that came installed in the chopper gun possessed
three blade locations (32 mm apart) and was thus limited to producing 32 mm or 96 mm
fibers, assuming a constant fiber length was desired.
First, an attempt was made to increase the fiber length by removing two of the blades and
spraying the maximum 96 mm fiber length. This expenment was entirely unsuccessful as the
fiber would not exit the chopper housing properly, sirnply building up inside it and clogging
the exit. A second attempt was made with two of the blades in place. This should result in a
mixture of 32 mm and 64 mm fibers. Again, the longer fibers could not be sprayed due to
clogging of the chopper housing.
132

During consultation with the spraying equipment manufacturer, it was discovered tbat
alternative cutting rotors designs were available. A multi-length rotor was obtained which
had embedment positions for a maximum of 12 blades. This would allow production of
several different constant fiber lengths, ranging from 8 mm to 96 mm, depending upon the
number of blades present. These combinations are shown in Table 6.16.
1 Table 6.16: Fiber lengths available with 12-blade rotor. 1
As previously mentioned, use of the 96 mm length was not feasible due to clogging problems
so the next step was to try the next Longest constant length of 48 mm. This fiber length did
indeed work and was thus added to this phase of the testing program.
Blades
12
There was a total of 15 beams cast for use in this phase, al1 cast fiom normal strength (45
MPa) concrete. These specimens were divided into 8 groups to allow investigation of four
different fiber lengths (8, 16,24 and 48 mm). The 32 mm fiber length was not included since
it was the standard length used previously on the Phase 3 specimens and did not need to be
(mm) 1
8

repeated. Additionally, only the Scheme C and D retrofits were implemented in this phase.
The 8 specimen groups resdting fiom these variables are detailed below in Table 6.17.
1 Table 6.17: Shear strengthening - Phase 5 specimen groups
Reîrofit I Fiber Length (mm) I Number of Scheme Specimens
None 1 NIA 1 3
Again, the total number of bearns was lirnited due to mixer size. Results from the testing of
these specirnens are provided in Table 6.18 while full details for these specimens have been
included in Appendix G. Matenal properties of the GFRP for the vanous fiber lengths has
been previously discussed in Chapter 5.

Table 6.18: Shear streagthening - Phase 5 test results (fiber Iength).
Retrofit Fiber S tifiess S trength Absorbed Energy - Failure
Length Initial Change Peak Change To Peak Change Mode* e W/-) (%) O (%) (N-0 (%) r
None N/A 19.6 - 49 - 69 S
8 26.4 3 5 132 170 46 1 565 B
C 16 28.5 46 136 179 402 480 B
24 30.8 57 149 205 66 1 854 C
8 3 1.3 60 205 320 19 14 266 1 P
16 33.5 7 1 227 366 2978 4197 P D
24 34.1 74 258 429 39 14 5547 P
48 35.3 80 269 452 479 1 68 13 P
Ml3 ;
* - Failure modes: Y = Rebar Yield, S = Shear, C = Concrete Crushing, B = GFRP Bond, P = GFRP Plate
Al1 of the retrofits produce a significant increase in member stiffuess over the control
specimens and increases in fiber length resulted in a corresponding increase in bearn
stiffness. Looking back at the results fkom Phase 3 (Table 6. IO), we find that the 32 mm
fibers produced an increase of 64% for Scheme C but only 6 1 % for Scheme D. The first
figure fits well into the trend shown above in Table 6.18 but the Scheme D value is very low,
falling between the 8 mm and 16 mm fiber lengths. This value is probably an anomaly since
it was low compared to the other Phase 3 results as well (Le. lower than the Scherne C
retrofit). Though there appears to be no overlap between the Scheme C and the Scheme D
specimens, it should be noted that there was no 48 mm fiber length used in the Scheme C
retrofit. Following the trend indicated in Table 6.18, this length should produce a higher

stifiess than that exhibited by the 8 mm Scheme D specimens.
Examining the peak load results, we find that once again a consistent trend appears and that
there are increasingly larger improvements in peak load as the fiber length is increased.
Looking back, the Phase 3 results (Table 6.10) reveal that the 32 mm fibers produced an
increase of 207% for Scheme C and 507% for Scheme D. Again, the Scherne C figure fits
well into the trend shown in Table 6.18 but this t h e the Scherne D value is very high,
exceeding even the result for the 48 mm fiber length.
Going on to the energy absorption results, we once again see the sarne trend, with the
exception of one anomaly in the Scheme C specimens where the 16 mm fiber length appears
to be too low. The 32 mm results fiom Phase 3 indicate that the Scheme C members
improved by 719% and Scheme D by 6525%. Now, the Scheme D result appears to fit well
into the trend while the Scheme C result is low.
Typical load-deflection curves for each combination of retrofit scheme and fiber length are
shown in Figure 6.3 1. Once again, the trend of improved performance with increased fiber
length is evident, as is the large difference between the Scheme C and Scheme D approaches.
Also evident is the increase in initial member stiffness over the control specimens, though
the difference between retrofit schemes appears to be much less significant than this initial
irnprovement .

O 1 O 20 30 40 50 60 Denedon (mm)
Figure 6.31: Shear strengthening - Phase 5 typical load-deflection curves by fiber length.
Examining the cumulative energy absorbed by the specimens at equivalent deflection levels,
as shown in Figure 6.32 indicates that the initial rate of absorption is very similar, regardless
of retrofit scheme, though this rate is much higher than the control specimens. The post-peak
performance of the specimens indicates that each retrofit scheme has a unique, though
consistent trend. Al1 of the Scheme C specimens remain parallel, as do the Scheme D
members, though they are significantly different fiom each other. The higher slope of the
Scheme D specimens during this stage indicates that they are capable of absorbing larger
amounts of hcture energy during specirnen failure.

O 5 1 O 15 20 25 30
Deflection (mm)
Figure 6.32: Shear strengthening - Phase 5 typical energy absorption curves by fiber Iength.
The failure modes of the beams in this phase also exhibited specific trends. For the Scheme
C specimens, the 8 and 16 mm fiber lengths failed due to debonding of the GFRP while the
24 mm specimens failed due to concrete crushing. Also consistent with this trend was the 32
mm Scheme C specimens fkom Phase 3, which also failed due to concrete crushing. It
appears that an increase in fiber Iength improves the GFRP-concrete bond, likely due to an
improved stress transfer mechanism. The Scheme D specimens, including the 32 m fiber
length from Phase 3, al1 failed due to tensile fracture of the GFRP applied to the bottom face
of the beam.

6.2.5.6 - Cornparison of Fabric Wraps & Sprayed FRP
6.2.5.6.1 - Fabric Wrapped Specimens
As discussed in Chapter 2, the majority of research into the use of fiber reinforced polymers
for the rehabifitation of existing concrete structures has revolved around continuous fiber
fabrics. In the case of beam strengthening, these fabrics are either bonded to the soffit of the
member to provide flexural reinforcernent or applied to the side (usually at a 45" angle) to act
as shear strengthening.
To allow cornparison of the sprayed GFRP system with such wrapping techniques, a series of
12 beams was cast and strengthened with continuous glass fiber fabrics. These beams are
detailed below in Table 6.19. Since the number of beams cast required they be cast in two
separate mixes, one control specimen was taken fkom each mix to ensure unifonnity. Each of
the remaining specimens was retrofitted with a different combination of fabric fiber
orientation and number of layers of fabric. These combinations are indicated in Table 6.12 as
well.
The fabrics used in this project phase are discussed in Section 3.3.5. These fabrics were
applied bonded with the same polyester resin used in the spraying operation. The vinyl ester
coupling agent discussed in Section 3.3.3 was also applied. The application procedure
comrnenced with the application of the vinyl ester coupling agent as described in Section
6.2.5.3. Once it reached the tacky stage, the surface was sprayed with a light coating of the
139

polyester resin using the normal spraying apparatus. The fabnc was placed on the surface
and rolled out to ensure maximum wetting of the material. Another coating of the polyester
resin was sprayed on top of the fabric and it was again rolled out to remove any entrapped air
and to force the fabric fully against the surface of the concrete. Once curing was complete,
any material projecting beyond the edge of the beam was ground off.
Fabric Fiber Orientation
Number of Layers
Number of Specimens
NIA NIA 1 2
It should be noted here that these fabncs were not capable of wrapping around the corners of
the beams. Applying a 45' bevel, as was done with the sprayed material (refer to Section
6.1.3.), was not an option due to the much thimer profile of the fabrics. A single layer of
fabnc created a layer approximately 1.5 mm thick. Even beveled, the corner was too sharp

for the fabnc to wrap around. As a resdt, adjacent sides were not overlapped, simply butted
together.
Table 6.20: Shear strengthening - Phase 6 test results (fabnc wappïng),
Numbe Fabric Fiber
of Orient Layen
Absorbed Energy Failure
The test results for each of the fabric wrapped bearns are presented in Table 6.20. Again, the
control values represent the average of two specimens while the remaining results represent
one beam only. Further details for these specimens can be found in Appendix H.
Examining the stiffiiess values indicates that the initial member stifiess increases to some
extent, though the addition of successive layers does not produce a further increase of the
141

same magnitude, except for the Scheme D specirnens with 3 layers of 0190 fabric. The
remaining values are d l either equivalent to or greater than the control specimens but this
improvement is marginal at best and certainly cannot be considered significant.
The peak load values, on the other hand, did show a marked increase due to the retrofitting.
Al1 of the strengthened beams showed large increases in ultimate load, with that
improvement getting larger as the number of Iayers increased. There did not, however, seem
to be any significant difference between the Scheme C and Scheme D members. This is due
to the failure process exhibited by the beams. In most cases, the bonded fabncs separated at
the corners and thus the resulting pieces were forced to act independently of each other. This
was a direct result of the inability of these fabncs to wrap around the 90' corners at the edges
of the beams.
Examining the energy absorbed by the specimens up to the peak load, the same trend
becomes evident. Al1 of the specimens exhibit large increases, with the addition of extra
layers improving performance even further. Of particular interest here is the superior
performance of the Scheme C specimens retrofitted with three layers of fabric. These
specimens even outperformed the Scheme beams with a sirnilar number of layers.
Another unexpected result is the sirnilarity in performance between the fabrics with fibers
oriented at M5" and those oriented at 0/90°. As depicted in Figure 6.33 for the Scheme C
members and in Figure 6.34 for Scheme D, there is very little difference between the two
orientations. This point is particularly applicable to the Scheme C specimens, which are
142

virtually identical Save for the post-peak performance of the members retro fitted with three
layers of fabric.
100
75 E 4 50 El
25
O O 2 4 6 8 10 12 14 16
Deflection (mm)
Figure 6.33: Shear strengthening - Phase 6 load-deflection curves for Scheme C beams (fabric wrapping).
This discrepancy can be accounted for by the difference in failure mode exhibited by these
two specimens. The *45" retrofit failed due to crushing of the concrete in the compression
zone of the bearn @rior to rebar yielding) while the 0/90° retrofit failed due to debonding of
the GFRP. The crushing failure mode is more ductile and thus extends the load-deflection
curve after the ultimate load is reached. Both of the single layer retrofits failed in shear. The
Scheme D specimens exhibited very similar load-deflection curves regardless of the number
of layers added.

O 2 4 6 8 10 12 14 16 Dendon (mm)
Figure 6.34: Shear strengthening - Phase 6 load-deflection curves for Scheme D beams (fabïic wrapping).
Looking at the energy absorbed by the Scheme C specirnens throughout their testing cycle
(Figure 6.35), we can see that al1 of the specimens absorbed energy at a nearly identical rate
up until their individual points of failure. The change in rate at the point of failure was also
the same for each member, with the exception of the beam with three layers of MSO fabric.
Again, this difference in post-peak performance was due to the change in failure mode to
crusliing .

O 2 4 6 8 10 12 14 16
Detïection (mm)
Figure 635: Shear strengthening - Phase 6 energy absorption curves for Scheme C beams (fabric wrapping).
Exarnining a similar set of curves for the Scheme D specimens (Figure 6.36) reveals that the
absorption rate among these specimens is not consistent. In fact, it continually increases
firstly as the fabric fiber orientation changes fiom &4S0 to 0/90° and seccndly as the number
of layers increases* The sole exception to this pattern is the specimen retrofitted with three
layers of the 0/90° fabric. The energy absorption curves for this beam starts out at a higher
dope than the rest but appears reach its ultimate load prematurely and then exhibits a much
lower post-peak slope than the other retrofits.

O 2 4 6 8 10 12 14 16 Defïection (mm)
Figure 6.36: Shear strengthening - Phase 6 energy absorption curves for Scheme D beams (fabric wrapping).
Figures 6.37 and 6.38 show similar energy absorption c w e s , but this time divided into
specimens retrofitted with one layer or three layers of fabric, respectively. These figures
show that there is very little difference in energy absorption rate between the two different
fabrics or between the two different retrofit Schemes.
The failure mode exhibited by these specimens was very consistent. With a single exception
(the Scheme C specimen retrofitted with three layers of +45" fabric) al1 of the retrofitted
beams failed due to debonding of the GFRP fabric. This failure mode is very common with
continuous fiber fabncs and was indeed the prevalent failure mode reported by other
researchers, as mentioned previously in Chapter 2.

O 2 4 6 8 10
Deffection (mm)
Figure 637: Shear strengthening - Phase 6 energy absorption curves for 1 layer (fabric wrapping).
O 2 4 6 8 10 12 14 16 Deflection (mm)
Figure 638: Shear strengthening - Phase 6 energy absorption curves for 3 layers (fabric wrapping).
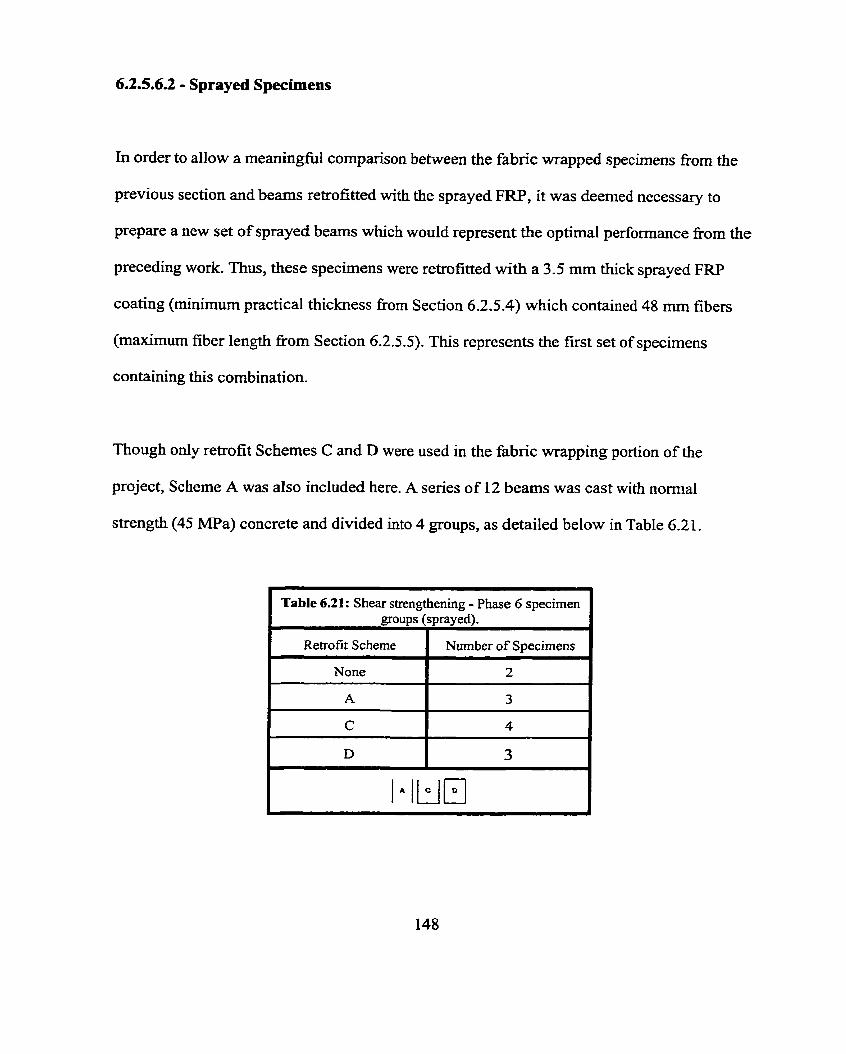
6.2.5.6.2 - Sprayed Specimens
In order to allow a meaningful cornparison between the fabric wrapped specirnens from the
previous section and bearns retrofitted with the sprayed F m , it was deemed necessary to
prepare a new set of sprayed beams which would represent the optimal performance fkom the
preceding work. Thus, these specimens were retrofitted with a 3.5 mm thick sprayed FRP
coating (minimum practical thickness from Section 6.2.5.4) which contained 48 mm fibers
(maximum fiber length nom Section 6.2.5.5). This represents the first set of specimens
containing this combination.
Though only retrofit Schemes C and D were used in the fabnc wrapping portion of the
project, Scheme A was also included here. A series of 12 beams was cast with normal
strength (45 MPa) concrete and divided into 4 groups, as detailed below in Table 6-21.
1 Table 6.21: Shear strengthening - Phase 6 specimen 1 groupi (sprayëd).
Reîrofit Scheme Number of Specimens

The smallest practical application thickness of 3.5 mm was chosen for this portion of the
study in order to minimize the ratio of GFRP thichess to beam width. The maximum
available fibre length of 48 mm was chosen due to its supeiior performance in previous
testing of both retrofitted beams and GFRP tensile coupons. The retrofit schemes were
limited to the chosen three since Scheme E is practical only for flexural strengthening and
Scheme B is not feasible in real-life applications. The results from this phase of testing are
presented in Table 6.22 while more complete details have been included in Appendix H.
Table 6.22: Shear strengthening - Phase 6 test results (sprayed).
* - Failure modes: Y = Rebar Yield, S = Shear, C = Concrete Crushing, B = GFFW Bond, P = G F ~ plate
The results indicated in Table 6.22 for the Scheme C specirnens were divided into two
groups, with two beams in each group. This division was made due to a difference in failure
mode between the two groups, which resulted in a significant difference in member
properties between the groups. The first group failed due to debonding of the GFRP while
the second group failed due to cmsbing of the concrete in the compression zone. It is the

latter failure mode which is of the most interest since it allows the GFRP to reach its
maximum potential effect. Within each group, the two beams behaved very similarly. In the
following figures, the values shown for the Scheme C retrofit represent the testing results
fkom the latter group (crushing failure) unless otherwise noted.
Test results for the sprayed beams indicate, once again, that the Scherne A retrofit was
unable to produce a significant improvement since oniy the sides were sprayed. Applying the
GFRP to the bottom face, as in the Scheme C and D arrangements, did induce a significant
increase in stiffhess. Peak load results showed were large improvements for al1 three retrofit
schemes while the irnprovements in energy absorption up to peak load were even more
dramatic, with extremely large gains delivered by the Scheme D arrangement (more than
5000% improvement over the control specimen).
Typical load-deflection curves for the different retrofit schemes are s h o w in Figure 6.39.
Note that the two groups of Scheme C specirnens are both included in this diagram in order
to show the large difference in performance between them. Their behavior up to ultimate
load is very sirnilar, with the pair exhibiting crushing failures simply being able to carry
higher loads. The other pair failed due to debonding before that ultirnate Ioad couId be
attained.

t Scheme C - Crushing Failure ]
-/ Scheme C - Bond Failure 1 4 Scheme A 1
Figure 6.39: Shear strengthening - Phase 6 typical load-deflection curves (spnyed).
Comparing the Scheme C and Scheme D curves, it becomes apparent that the very large
increase in absorbed energy observed in the Scheme D members is due to their ability to
undergo large amounts of deformation beyond the point where the Scheme C specimens
begin to fail.
The energy absorption cuves are shown in Figure 6.40 while Figure 6.41 gives a magnified
view of the initial portion of these curves. Al1 of the retrofitted bearns behaved sirnilarly up
to their individual failure points, though the control specimens absorbed energy at a
significantly lower rate.

10 20 30 Detlection (mm)
Figure 6.40: Shear strengthening - f hase 6 typical energy absorption curves (sprayed).
Scheme D +
5 10 15 Defïection (mm)
Figure 6.41: Shear strengthening - Phase 6 typical energy absorption curves (sprayed, magni fied).

The typicai failure modes exhibited by the specirnens in this project phase were indicated
previously in Table 6.22. Photographs showing examples of these failure modes are provided
in the following four figures (6.42 - 6.45). Figure 6.42 indicates the typical shear failure
mode exhibited by al1 of the control specimens, not only in this phase, but throughout the
shear strengthening portion of this project. The Scheme A members failed due to debonding
of the GFRP applied to the sides of the specimen. An example of this debonding failure is
shown in Figure 6.43.
Figure 6.42: Shear strengthening - typical shear failure of control specimens.

Figure 6.43: Shear strengthening - typical debonding failure (Scheme A).
Figure 6.44 consists of a photograph depicting the crushing failure exhibited by two of the
Scheme C retrofitted beams. These are the two bearns whose results were presented
throughout this section. This photo was taken well after the point of failure and the concrete
crushing has progressed down to the reinforcement,
Finally, the GFRP tensile fracture exhibited by the Scheme D specimens is shown in Figure
6.45. This photo was also taken well after failure and buckling of the top GFRP coating is
visible.
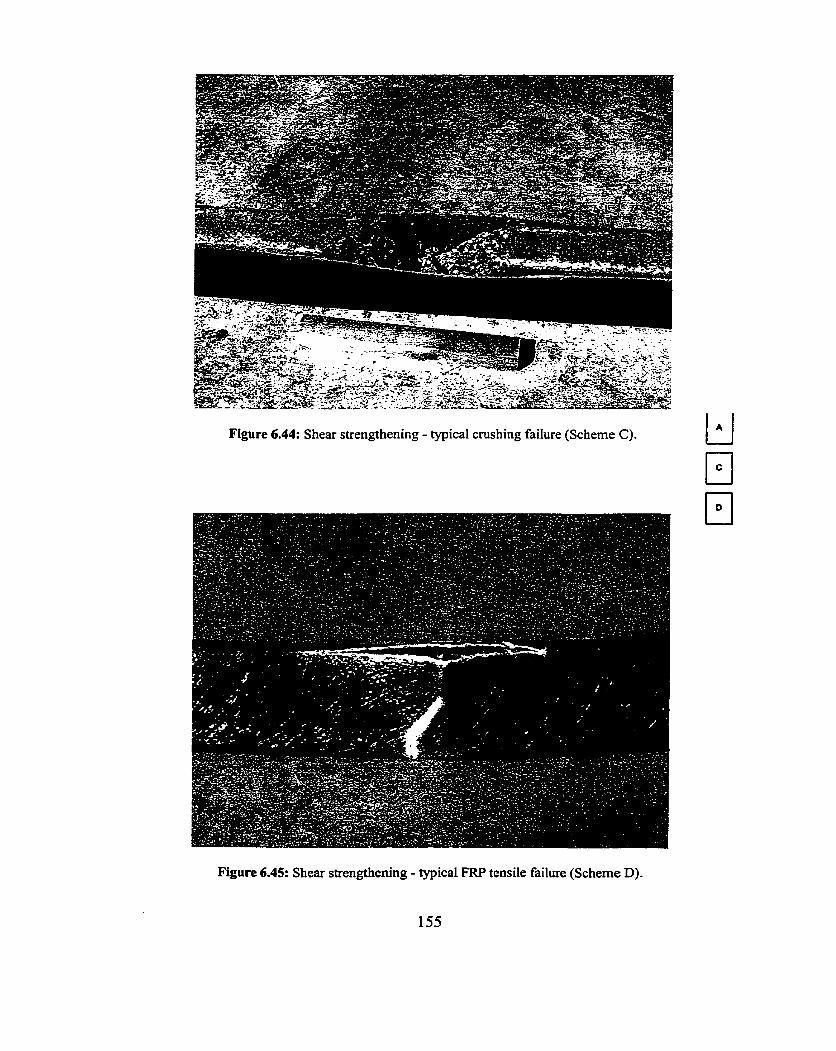
Figure 6.44: Shear strengthening - typical crushing failure (Scheme C).
Figure 6.45: Shear strengthening - typical FRP tende failure (Scheme D).
155

6.2.5.6.3 - Cornparison
Before cornparhg the actual test results fiom the fabric wrapped specimens and the sprayed
specimens, it is fust necessary to discuss the fiber volume fiaction relative to each retrofit
technique. There were two different fabrics used in the wrapping portion of the project; a
0/90° combination with a designated material weight of 23.0 odyd2 (0.78 kg/m2) and a k45"
configuration with at 24.0 odyd2 (0.81 kglm2). A single layer of either material resulted in a
final measured thickness of approximately 1.5 mm.
Assuming that the rolling out process was capable of providing full compaction (Le. zero
void volume fiaction), the theoretical fiber volume fraction would be 19.8% for the 0/90°
fabric and 20.7% for the W5" fabric. Since these values are very close to that obtained with
the spraying operation using the 48 mm fiber length (V,= 19.0%), cornparisons between the
two techniques c m be directly based on FRP thickness (i.e. both techniques will provide the
sarne total fiber at the sarne thickness).
As for the assumption of achieving complete compaction for the fabrics; this is probably a
valid assumption since a great dea! of pressure could be applied to the roller throughout
application the process. An interesting phenomenon was noticed during application of the
first layer of fabric. After rolling, the fabric and resin combination became translucent,
making the underlying concrete surface easily visible. This indicates that the air spaces
between fibers were virtually eliminated. Successive layers made viewing of the concrete
surface more difficult simgly because of the greater thickness of material.
156

The results for the Scheme C retrofitted specimens, both fabric wrapped and sprayed, have
been tabulated in Table 6.23 below.
Tabie 6.23: Shear strengthening - Phase 6 wrap/spray cornparison (Scheme C).
- -
As evident fkom this data, the sprayed technique outperformed the fabric wrapping approach
in virtually every category. The sprayed specimens reported the highest actual values for
stiffness, peak load and energy absorbed of al1 the tested members. Looking at the
percentage improvement figures, however, seems to indicate that wrapping with three layers
(4.5 mm) produced a large improvement than the sprayed technique with respect to the
Reiro f i t
Type
Fabric w r a ~
energy absorbed up to peak load.. There are two things that must be considered before such a
conclusion can be made.
First, the control specimen fiom the fabric wrapping project phase exhibited significantly
lower test results than its counterparts from the sprayed FRP phase. Though the stiffness and
strength values were very similar between the two (19.3 vs. 20.2 kN/mm for stiffhess and 42
157
Fiber Orient
k45
0190
Spray 1 Randorn
FRP ~ i c b i e s s
(-1
1.5
21
Stiaess
3.5
Initial w / m m )
21.3
137 24.4
Change (%1
1 O
13
10
13
188
S trength
525
4.5
1.5
4.5
Peak
97
117
96
123
655
Energy Absorbed
21.8
21.3
21 -8
Change (%)
13 1
179
129
193
Peak (N-m)
292
469
276
496
Change i%)
549
942
513
1002

vs. 48 kN for strength), the energy absorption values showed a dramatic difference (45 vs. 70
N-m). It was this Iow energy absorption value that resulted in the hi& percentage
irnprovements for the wrapped specimens in Table 6.23. The second thing to keep in mind is
the FRP thickness, which was 3.5 mm for the sprayed FRP technique and 4.5 mm for three
layers of fabric.
For the Scheme D specimens, no such ambiguity exists. As shown in Table 6.24, the sprayed
FRP retrofit simply outperformed the fabric wrapping in virtually every instance.
TabIe 6.24: Shear strengthening - Phase 6 wrap/spray comparison (Scheme D). 1 -
FRP Stifiess Strength
mickness '
Initial Orient Change Peak Change (-1 (kN/mm) (%) ( kW (%)
1.5 19.2 O 91 117
In the stifniess results, the sprayed approach performed better than al1 of the wrapping
configurations except three layers at 0/90°. For the other two properties (ultirnate strength
and energy absorption) the sprayed technique outperformed the fabric wrapping technique by

a very large margin.
From the actual test data, it appears that the sprayed FRP retrofit procedure can actually
produce better results than a fabric wrapping approach using the same materials. To M e r
support this observation, the load-deflection curves for the Scheme C specimens have been
plotted in Figure 6.46 while those associated with the Scheme D specimens ae shown in
Figure 6.47.
Figure 6.46: Shear strengthening - Phase 6 typical load-deflection curves (wrapkpray cornparison, Scheme C).

O 10 20 30 40 Oeflecîion (mm)
Figure 6.47: Shear strengthening - Phase 6 typical load-deflection curves (wrapkpray comparison, Scheme D).
These figures indicate that the sprayed FRP technique produce better member performance
in both the Scheme C and Scheme D retrofits. Another interesting result that becarne
apparent during this comparison is the effect of the two techniques on the failure mode of the
specimens. The majority of the fabnc wrapped specimens failed due to debonding of the FRP
from the concrete surface while this failure mode was virtually eliminated in the sprayed
FRP beams. Even though the latter specimens were subjected to higher loads, and thus higher
stresses at the FRP-concrete interface, debonding was not the prevalent failure mode.
Again, this efléct is believed to be related to the difference in stress transfer mechanisms
between the continuous fiber fabrics and the discontinuous, randomly oriented sprayed
fibers. When debonding initiates in the former, it progresses very quickly along the bond line
160

since this is the direction in which al1 of the stresses are acting in the FRP. For the randomly
oriented fibers, the stresses are transferred in ail directions, effectively acting to arrest
growth of the delamination crack and thus prevent debonding.

6.2-6 - Comparison with PubIished Results
As previously discussed in Chapter 2, a great deal of research has been conducted around the
world related to the rehabilitation of reinforced concrete structural members with fiber
reinforced polyrners. Several different approaches have been exarnined, including the use of
FRP plates, fabrics and stnps. A number of fiber types have also been investigated, such as
glass, carbon and aramid. The following section compares the results obtained in this study
using the sprayed GFRP technique with results previously published by some of these other
researchers.
6.2.6.l - Flexural Strengthening
A survey of published literature related to the strengthening effectiveness of various FRP
rehabilitation techniques on conventionally reinforced concrete beams was previously
performed by J. ~ o n a c c i * ~ . Surnrnarizing the results of 10 different studies including 64 total
specimens ranging in length from 950 mm to 4580 mm, it showed that the improvement in
ultimate load carrying ability varied with failure mode. Table 6.25 provides the results from
this survey along with the corresponding results fiom the flexural strengthening portion of
this study. The survey results are composed of &ee values which represent the minimum,
mean and maximum value for each range of results.
Unfortunately, there were a couple of problems associated with the values reported in the
literature survey. For one, it was not specified which retrofit schemes were included, though
162

it is likely that the majority of the results, if not all, referred to the Scheme E approach in
which only the bottom surface of the beam is strengthened. This is by far the most common
approach used in flexural strengthening research. Second, the value corresponding to shear
failure has no counterpart in this research project. Al1 of the Scheme E specirnens failed due
to debonding of the GFRP while the higher confinement schemes produced either crushing
or GFRP tensile fractures.
Source
,
Literature ~urvey *' Spmyed GFRP
Table 6.25: Flexural strengthening results compared to literature survey.
S hear 7 For specirnens exhibiting concrete compression failure, the sprayed GFRP technique
produced far larger improvements (1 16%) than the average, or even the maximum, values
reported in the survey (41% and 55%, respectively). The same can be said for beams failing
due to tensile fiachire of the FRP (265% vs. 41% and 101%). In the debonding category, on
the other hand, the sprayed GFRP results (37%) fell near the bottom end of the survey range
(0% to 335%).
Percentage Improvement by Failure Mode
One very interesting observation made by the author concemed the prevalence of each of the
four failure modes. Shear failure occurred in only 8% of al1 beams included in the survey,
Compression
min
31
Fracture
mean
41
min
7
Debonding
rnax
55
min
O
mean
4 1
rnax
101
mean
78
rnax
335

concrete compression failure in 6% and tensile fracture in 22%. By far the most cornmon
failure mode, FRP debonding, occurred in 64% of ai1 test specirnens.
Due to the unknowns associated with this survey, it is not possible to make a proper
comparison in between the results presented by the author and those obtained in this project
using the sprayed GFRP technique. A more direct approach is needed in which individual
studies could be compared.
Table 6.26 provides just such a comparison for conventionally designed reinforced concrete
bearns which were retrofitted to improve fiexural strength characteristics. The comparative
values shown represent the percentage increase in strength and fiacture energy for each of
the retrofit techniques relative to the respective control specimens.
Though the increases in peak load were calculated directly fiom the ultimate load values
presented by the authors, in most cases the corresponding fracture energy values were not
provided. These values were determined fiom the provided load-deflection curves, whenever
possible. Cases where the fracture energy increase is shown as N/A refer to publications in
which neither fracture energy values nor load-deflection curves were provided.

Table 6.26: Cornparison with previously published results - flexurd strengthening.
Retro fit Scheme
Absorbed Beam Peak Load Energy Length Increase (mm) (%)
Increase (%)
- I
Retro fit Material Format
Reference
- - - - CI
E - - - - - - r
-
Material Type
(Fiber Orient)
Plate
---- -
- Jones et a1 25
Swamy et a1 l6
Plate
Plate
Faza et al "
Spadea et aIH6
Hutchinson et al 87 Plate G (0)
Hutchinson et al 87 Plate C (0)
Plate G (0)
Plate C (0)
Fabric A (0/90)
--
Saadatrnanesh et al 43
Meier et al "
Chajes et al ' Chajes et al ' Chajes et al '
2 100 44 NIA
Heffernan et ai
Fabric 1 C (O)
Spray 1 G (Random) 1 1000 1 116 1 7
Fabric C (0/90) 2900 55 -7
Fabric C (0/90) 2100 64 NIA
Spray G (Random) 1000 265 317
Faza et al "
~ e m e t t ~
This cornparison includes results for plate and strip bonding techniques, as well as the fabric
wrapping approach. In the table, fiber types are indicated by G for glass, C for carbon and A
for aramid while the fiber orientation is shown in parenthesis following the fiber type. Fiber
orientation is specified relative to the longitudinal direction of the member, which is
165


This comparison shows that the sprayed FRP technique can produce results similar to rnany
of the other retrofitting procedures when used for pure flexural strengthening (Scheme E),
though it is obviously inferior to some of the methods shown. Once the degree of
confinement is increased by coating the sides and top of the beam, the sprayed system
becomes favorable. This is probably due to its superior ability to wrap around the corners of
the beam, thus allowing al1 three (or four) of the sprayed sides to act as a single unit,
something the bonded FRP fabrics and plates cannot do.
It is interesting to note that a large proportion of the rehabilitation techniques presented in
Table 6.26 actually resulted in a drop in fiacture energy. As discussed previously in Section
6.1.4., this phenornenon is a direct result of the stiffening effect of the applied FRP materials.
6.2.6.2 - Shear Strengthening
A similar comparison was cornpiled for the effects of the various FRP retrofit techniques on
the rehabilitation of shear strength deficient beams, shown in Table 6.27. Again, the
improvements in load carrying ability and fiacture energy absorption (expressed as percent
increases) are compared to results fiom previously published literature.

Table 6.27: Cornparison with previously published results - shear strengthening-
Retrofit Scheme
L
- r
r
A - - -
L
- - - - -
C I
- I
-
H
- - -
Retro fit Material Matenal Type Format (Fiber Orient)
Re ference
Absorbed Peak Load Energy Increase
(%) Increase
(%)
Bearn Lengîh (-1
Al-Sulaimani et al "
Chaallal et a1 91 Strips C (90) 1 1300 -
Chaallal et a1 9'
Sato et a1 '' Strips 1 c (90) 1
Sato et a1 92
Spray G(Random) 1000
Plate G (0/90) 1250
Stlips c (90) 2200
Fabric c (90) 2200
Fabric G (0/90) 1 O00
- Al-Sulaimani et al '' - -
Sato et a1 92
Sato et a1 '' Deblois et a1 93
Noms et al '' Hisabe et al"
Chajes et al 38
Chajes et a1 38
Chajes et a1 38
Chajes et a1 38
- Hisabe et al "
For this case, a large number of comparable research projects were found for the Scherne A
and the Scheme C retrofit approaches, while only one was uncovered in which the full
confinement of Scheme D was implemented. In al1 instances, the sprayed GFRP produced a

significantly larger increase in both peak load and fiacture energy than any of the other
retrofit techniques. The Scheme A retrofit produced a103% increase in peak load, as
compared to the published data which ranged fiom 20% to 82%. Published results for the
Scheme C approach ranged fkom a low of 33% to a high of 122%, much lower than the
188% increase exhibited by the sprayed GFRP technique. The Scheme D specimens were
improved 3 18% by the sprayed GFRP, compared to a 10 1 % increase attributed to the carbon
fiber fabric wrapping procedure found in the literature.
The hc tu re energy results again showed a much higher variation, with the published
Scheme A results ranging from the minimum of a 9% &op al1 the way to a maximum 273%
increase, still iderior to the sprayed technique's irnprovement of 342%.
Spraying the beams with the Scheme C arrangement produced a 655% improvement, also
significantly higher than published results which ranged fiom a drop of 32% to an increase of
479%. By far the biggest difference, however, appeared in the Sciieme D comparison where
the sole published value of 549% was far lower than the sprayed technique's 5350%
increase.
This comparison indicates that the sprayed FRP approach is far more effective than any of
the other rehabilitation techniques in providing shear strengthening. The primary reason for
this increased effectiveness is related to the 2-D isotropic nature of the sprayed FRP material
and will be discussed M e r in Chapter 7.

An investigation was conducted into the variability inherent in the testing and retrofitting
procedures used throughout this project. The variation in results was different for the three
properties evaluated. The ultimate load values were the most consistent results, with an
average coefficient of variation of 3.6% for groups of similar specimens. The maximum
value for any one group was 9.8% but the majority of values were less than 5%.
Initial member stiffness values were slightly less consistent, with an average coefficient of
variation of 6.0% and a maximum of 13.5%. Most of these coefficients fell within the 4 -
10% range. Finally, the energy absorbed by the beams up to peak load produced the least
consistent results. Though the average coefficient of variation was still only 10.5%, there
was a much wider range of coefficients for this property, with a maximum value of 27.7%
and a typical range of 8 - 13%. No significant difference in variability could be found
between retrofit schemes.
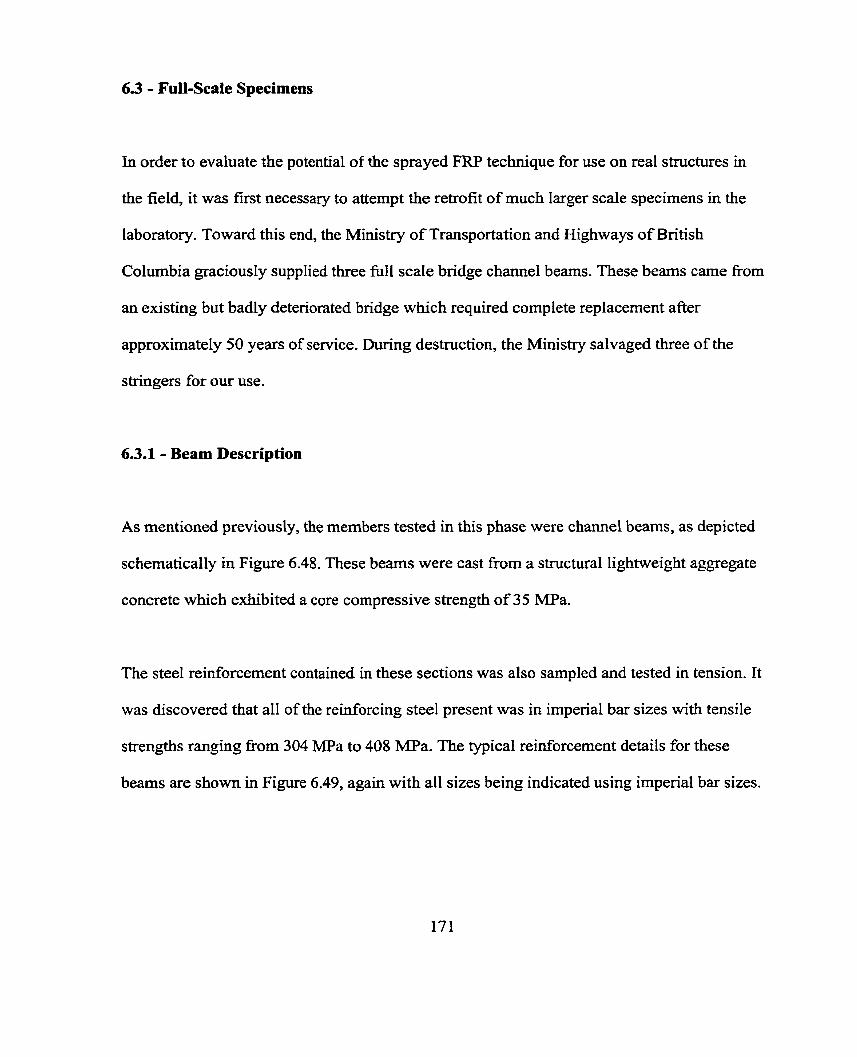
63 - Full-Scaie Specimens
In order to evaluate the potential of the sprayed FRP technique for use on real structures in
the field, it was first necessary to attempt the retrofit of much larger scale specimens in the
laboratory. Toward this end, the Ministry of Transportation and Highways of British
Columbia graciously supplied three full scale bridge channe1 bems. These beams came fiom
an existing but badly deteriorated bridge which required complete replacement afier
approximately 50 years of service. During destruction, the Ministry salvaged three of the
stringers for our use.
6.3.1 - Beam Description
As mentioned previously, the members tested in this phase were channel bearns, as depicted
schematically in Figure 6.48. These beams were cast fkom a structural lightweight aggregate
concrete which exhibited a core compressive strength of 35 MPa.
The steel reir~forcement contained in these sections was also sampled and tested in tension. It
was discovered that al1 of the reinforcing steel present was in irnperial bar sizes with tensile
strengths ranging fkom 304 MPa to 408 MPa. The typical reinforcement details for these
beams are shown in Figure 6.49, again with al1 sizes being indicated using imperial bar sizes.

Figure 6.48: MOTH channel bearn dimensions.
Figure 6.49: MOTH channel beam reinforcement details.
The shear stimips were spaced at varying intervals along the length of the beam, ranging
from a minimum spacing of 125 mm at the ends of the beam to a maximum spacing of 760
mm at rnidspan.
One point that should be made regarding the condition of these channel beams concems the
172

significant variation in darnage between specimens. Ai1 of the members exhibited significant
damage in the form of cracking, concrete cover loss and reinforcement corrosion.
Photographie exarnples of this damage have been included in Appendix 1. The seventy of
damage, relative quantity of each type of damage and the location of the darnage varied fiom
beam to bearn. As a result, comparison of properties between beams can only be performed
on a very general basis.
6.3.2 - Specimen Preparation
Of the three channel beams supplied, one was to be rehabilitated with the sprayed GFRP
technique while a second was to be retrofitted using a comrnercially available continuous
glass fiber fabric system. This Latter approach utilized the race@ system produced by
Master Builder Technologies. The third specimen was to be tested in its original unretrofitted
state to serve as a control specimen.
The surfaces of al1 of the channel beams were sandblasted by the Ministry of Transportation
and Highways before being delivered to UBC. Due to the arnount of deterioration present,
specifically the large sections of missing cover concrete, it was deemed necessary to repair
the more severely damaged regions. Such repair was done by applying a fast setting grout to
these areas to replace the rnissing material and build up the original profile of the beams, thus
creating a continuous flat surface to which the retrofit materials could be applied. This repair
technique required the fabrication of forms to create the desired profile, placement of the
grout itself and curing of the grout following placement.
173
Such repair is particularly important for the continuous fiber fabric systems, which would
dramatically suf5er in efficiency should the material not be applied to a flat surface. Actually,
applying these materials over a region of damage such as this would result in the Longitudinal
stresses in the continuous fibers acting to pull the fabnc away £iom the concrete and thus
initiating bond failure.
The sprayed technique, on the other hand, would be essentially unaffected by these regions
of missing concrete. Due to the nature of the material (Le. built up to the required thiclaiess
during the spraying operation), it need not be applied in a consistent thickness. The GFRP
itself could be used to build up the areas of missing concrete. Though the GFRP material is
more expensive than the grout used in the repair approach described above, the elimination
of this extra step, not to mention the time and effort required for forming the curing tirne
associated with the grout, would easily be worth the ability to perf'orm the entire retrofit in
one step.
For the purpose of this project, it was decided that al1 of the beams would be repaired using
the grouting technique. Doing so meant that comparisons between the two retrofit procedures
would be more significant since both were applied to the same type of surface. Following
placement of the grout, it was covered with damp burlap followed by plastic and allowed to
cure for 24 hours. The curing materials were then removed and the surface of the grout
sandblasted. At this point, it was observed that the original sandblasting performed by
MOTH personnel was not particularly consistent so some non-repaired areas were redone.

In should be noted that in order to sirnplie the work being done on these specimens, the
beams were turned upside down so that al1 work could be perfoxmed on either upper
horizontal surfaces or side vertical surfaces. This includes grouting, sandblasting and
application of the GFRP materials (both sprayed and wrapped). Such an approach would
obviously not be possible in the field on an existing structure, where al1 work would have to
be performed on the bottom or sides of the members.
Field application would present its own problems for both systems. The fabric bonding
technique would require either more personnel or a method for holding the fabric in place
while the bonding agent is applied. The GFRP spraying equipment, on the other hand, is not
capable of spraying directly overhead in its present form. Modifications to the equipment
would be necessary in order to permit such operation. Since neither technique was attempted
under field conditions, cornparisons between the two application procedures are restricted to
the conditions faced in the laboratory.
For the channel bearn retrofitted with the sprayed technique, the procedure involved first
coating the concrete surfaces to be sprayed with the ~erakane@ 8084 vinyl ester resin to act
as a coupling agent. This coupling agent was allowed to cure for approximately 15 minutes.
Then, the sprayed GFRP matenal was applied to al1 bottom surfaces of the member (slab and
leg) as well as to the insides of the legs, as depicted in Figure 6.50. This materia1 was applied
in three layers, with each layer rolled out before application of the successive layer. The
nominal GFRP thickness was 8 mm and contained fibers 48 mm in length (O,,, = 208 MPa,
E = 11.8 GPa, A,= 1.32 %, p = 1394 kg/m3, V, = 19 %).
175

-Sprayed GFRP P Figure 6.50: MOTH channel beam sprayed GFRP location.
The beam retrofitted with the race@' fabric system was also precoated with a coupling
agent or primer. After allowing the primer to cure for 24 hows, the fabric was applied in two
different orientations, as indicated in Figure 6.5 1. Fiber orientation is specified with respect
to the longitudinal axis of the member, which is designated as O". Since the fabric used in this
case contained only unidirectional continuous fibers, each orientation consists of only a
single value as opposed to the dual values mentioned earlier for woven fiber fabrics.
Figure 6.51: MOTH channef beam wrapped specimen fabric orientation.
First, a single layer fabric in which the fibers were oriented at 0" was applied to the lower
surface of the deck portion of the member and to the bottoms of the two vertical legs. Next,
the sarne fabric was applied to the inside of the vertical legs, though this tirne the fabnc was
176

turned 90" so that the fibers ran vertically. This application was lapped over the 0" fabric at
both the top and bottom of the channel legs. At the top, it lapped the 0" fabric by only a
couple of inches while at the bottom it was continued across the entire width of the stem
soffit.
Application of the fabric was performed sirnply by bmshing a thin layer of resin ont0 the
surface, applying the fabric itself and then brushing on another layer of resin. A roller was
then used to ensure full impregnation of the fabric with the epoxy resin. Al1 of the products
used in this retrofitting technique (primer, fabric and epoxy resin) were part of the race@
fabnc system. Both the sprayed and wrapped systems were allowed to cure for several days
before testing.
6.3.3 - Testing Program
Al1 three of the beams were tested under third-point loading using four iarge hydrauIic jacks
as load actuators. Figure 6.52 consists of a schematic diagram of the testing equipment used
for this portion of the project. LVDTs were used to record the deflection of the beam while
the hydraulic pressures in the jacks were monitored to provide load information. Figure 6.53
shows a photograph of the test setup dunng loading of the control specimen.
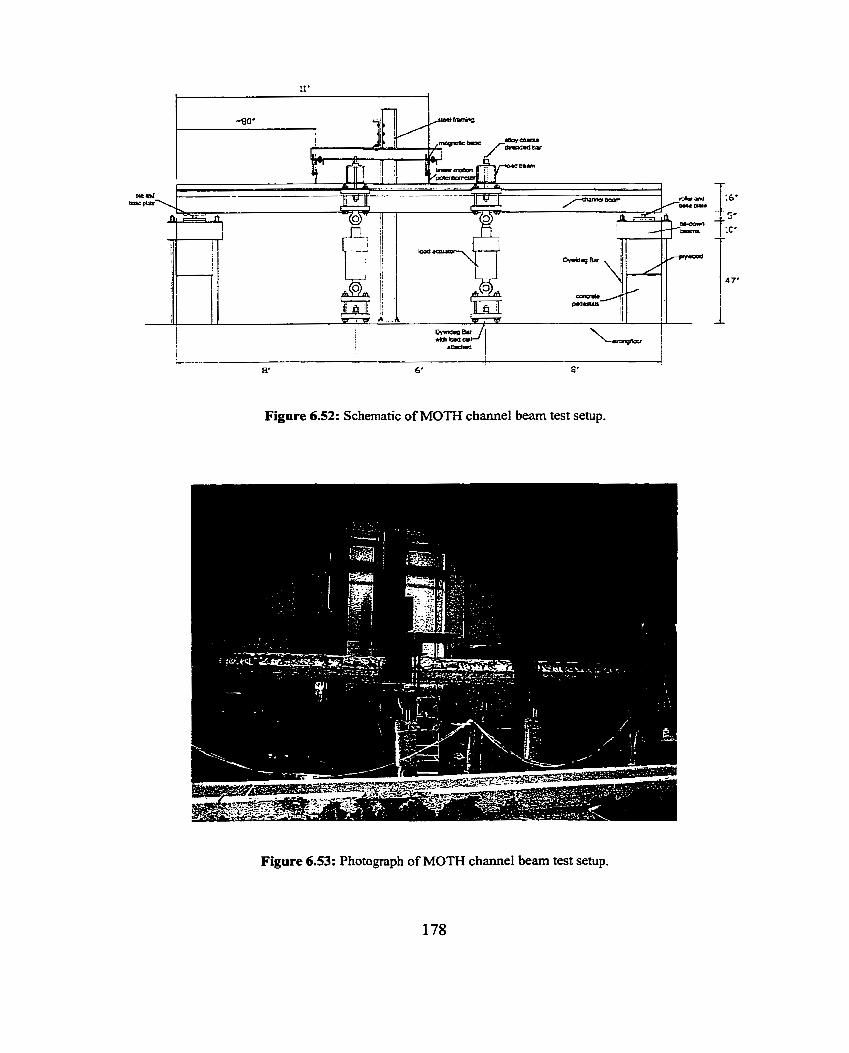
Figure 6.52: Schematic of MOTH channel beam test setup.
Figure 6.53: Photograph of MOTH channel beam test setup.

Before applying the retrofitting materials, each of the stringers was first loaded in the elastic
range in its unretrofitted state to provide a basis for cornparison for the strengthening
techniques. Though ultimate strengths were not reached in this preloading stage, it did allow
us to determine the stifbess of each beam before retrofitting. Upon completion of the test,
we could thus determine the increase in stifiess induced by the retrofitting process relative
to the control specimen and relative to the same beam before rehabilitation.
The bearns were then retrofitted with their respective systems (with the exception of the
control specimen) and again loaded ui the third-point configuration until failure.
6.3.4 - Results & Discussion
Test results for initial member stiffiless, ultimate load carrying capability and fracture energy
absorbed up to peak load are shown in Table 6.28, along with the failure mode exhibited by
the beams. Values shown for the percent change in these results are calculated relative to the
control specimen in al1 cases.
I - - -
Table 6.28: MOTH channel bearn test results.
Retrofit TnJe
Absorbed Energy Failure
None
w r a ~
spray 34095 1 195 1 P , B = GFRP Bond, P = GFRP Plate
Stifîhess
* - Failure modes: Y = Rebar Yield, S = Shear, C = Concrete Cmshin
Initial (kNjmm)
S trength
6.69
7.67
- 9.00
Change ('m
Peak OcN)
2 L4
284
419
-
-
l5
35
Change (W
-
-
3 3
96

As mentioned previously in Section 6.3.2.1 ., there was a significant amount of damage
evident on al1 three of these specimens and this damage was not consistent arnong the
specimens. Thus, cornparisons of the test results from the retrofitted specimens with those
obtained from the control specimen, or with each other, can only be done in a very general
sense.
The primary exception to this is the initial stiffiiess values. As mentioned in Section 6.3.3,
initial stifiess values were detemllned for each specimen before and after retrofitting. Table
6.29 indicates the results of this testing for the wrapped and sprayed specimens. The percent
change in this table represents the improvement in stifhess of each member due to
retro fitting.
1 Table 6.29: MOTH channel bearns - stiffening effect of retrofits. 1
These values are depicted graphically in Figure 6.54 for the two retrofitted members as well
as the control beam. Here we can see that both retrofit techniques tend to increase member
stiaess. Also evident is the fact that the sprayed technique produced greater results, both
with respect to the control specimen and relative to the same member before retrofitting.
Retrofit Type
Wra?
S~rav
Initial Stiffhess Before Retrofit
(kN/mm)
6.90
7.78
Initial Stifhess After Reîro fit
(ml=) 7.67
9.00
Change (%)
1 i
16

The increase in stifniess due to the race@ fabric wrapping system was 15% over the
control specimen and 11% over the unretrofitted value. The sprayed GFRP, on the other
hand, produced an initial member stiffness 35% higher than the control specimen and 16%
better then the unretrofitted value fi-orn the sanie beam.
1 Original Retrofitted 1
Control Wrap spray
Figure 6.54: MOTH channel beams - initial stiffiiess results.
The peak load results are indicated graphically in Figure 6.55. In this case, the fabric
wrapping system produced a 33% increase over the control specimen while the improvement
due to the sprayed GFRP technique nearly tnpled that increase at 96%. Though these figures
may be distorted somewhat due to the variability in darnage among the specimens, the very
large difference between the two techniques is indicative that the sprayed technique is indeed
capable of producing superior results.

Control Wrap spray
Figure 6.55: MOTH channel bearns - peak Ioad results.
Control Wrap Spray
Figure 6.56: MOTH channel bearns - energy absorption results.
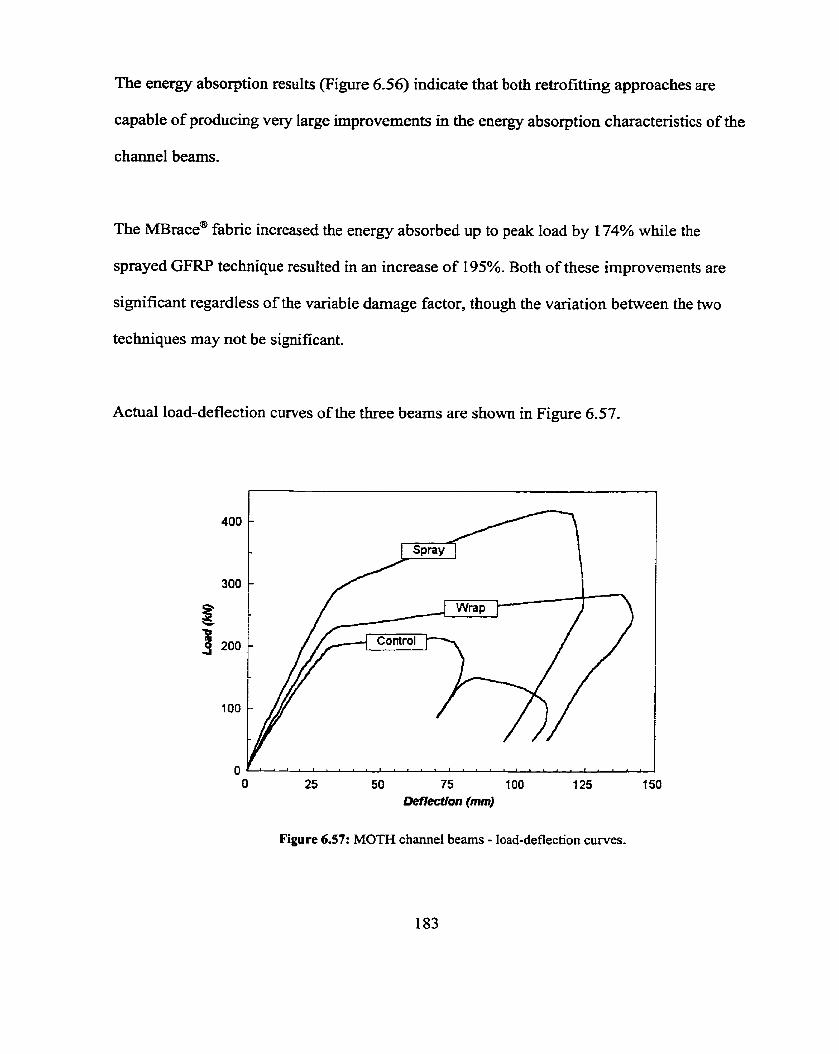
The energy absorption results (Figure 6.56) indicate that both retrofitting approaches are
capable of producing very large improvements in the energy absorption characteristics of the
channel beams.
The MBraceB fabric increased the energy absorbed up to peak load by 174% while the
sprayed GFRP technique resulted in an increase of 195%. Both of these improvements are
significant regardless of the variable damage factor, though the variation between the two
techniques may not be significant.
Actual load-deflection curves of the three beams are shown in Figure 6.57.
O 25 50 75 100 125 t 50 Deflecllon (mm)
Figure 6.57: MOTH channel beams - load-deflection curves.

The increases in initial member stifhess and peak load are very evident in this graph, as are
the increases in energy absorption. Also evident is the reason why the energy absorption for
the wrapped and sprayed specimens is so similar, even though the difference in peak load is
much larger. The wrapped specirnen reached a higher deflection value before failure, thus
extending the load-deflection cuve and increasing the absorbed energy (area under the
curve).
The rate of fracture energy absorption was also increased by both retrofit techniques, as
shown in Figure 6.58. Again, the sprayed approach produced a larger improvernent than the
wrapping technique.
O 25 50 75 100 150
Deflection (mm)
Figure 6.58: MOTH channel beams - energy absorption curves.

As previously noted in Table 6.27, the control specimen failed due to yielding of the flexural
reinforcement. For both of the retrofitted beams, the event corresponding to the failure point
was tende hc ture of the GFRP in the tension zone at the bottom of the member. The
photographs in Figures 6.59 and 6.60 depict the failure modes exhibited by the fabric
wrapped beam and by the GFRP sprayed beam, respectively.
Though, again, exact cornparisons cannot be made due to the variation in damage among the
specimens, it is evident from the test results that both the race@ fabric wrapping system
and the sprayed GFRP technique greatly enhanced the structural performance of the channel
beams. It is also apparent that the sprayed technique produced Iarger improvements than the
fabric wrapping procedure.
One thing that should be noted is the difference in thickness between the two materials. The
sprayed GFRP matenal was applied in an 8 mm thickness while the fabric in the race@
system was only about 1.5 mm thick per layer. The fabric thickness thus varied between
areas where only one Iayer was applied and those areas where a second layer was added.
Even though the sprayed technique consisted of a larger volume of material, the actual cost
of this technique was still less than the fabnc wrapping system. Further details concerning
the cost cornparison between the two systems can be found in Chapter 8.

Figure 6.59: Failure of MOTH channel beam retrofitted with race@ system.
Figure 6.60: Failure of MOTH channel beam retrofitted with sprayed GFRP.

Theoretical Analysis of Sprayed FRP Beam Retrofits
7.1 - Introduction
In order for the sprayed GFRP to be acceptable as a feasible alternative for rehabilitation of
reinforced concrete beams, it is essential that the upgraded properties of these bearns be
predictable. This section is divided into two parts. In the fust part, the ultimate load carrying
capacity of the specimens are predicted while the second part discusses prediction of the
prepeak load-deflection c u v e for each bearn configuration.
In order to predict the load carrying ability for each beam, two possible failure modes must
be examined; flexure and shear. The failure load will be deterrnined for each mode and the
lower of the two wili be taken as the ultimate load for the specimen. A third failure mode is
also potentially possible, a splitting bond failure can occur should the development length of
the longitudinal tension reinforcement be insufficient. For the beam designs used in this
project, however, this third failure mode will not be considered since it did not occur during

laboratory testing of the specimens.
Furthemore, the CSA A23.3-94 Design Code recommends development lengths of 242 mm
for 10M reinforcing bars and 343 mm for 15M bars. The beam design used here provides
325 mm of development length, which is suficient for the 10M bars used in the flexural
strengthening bearns but appears to be insufficient for the 15M bars used for the shear
strengthening specimens. Since none of the laboratory specimens actuaily failed due to
splitting bond failure, it was assumed that the CSA recommended development length of 343
mm was simply a conservative design value and that the 325 mm provided was suEcient to
prevent this failure type.
7.2 - Ultimate Load Prediction
7.2.1 - Material Characteristics
Before analysis of the retrofitted beams is possible, the stress-strain characteristics of the
individual materials must be defined. The concrete was assumed to rernain Iinearly elastic in
tension until failure, while the equivalent rectangular stress block approach described in the
CSA A23.3-94 Design Code was implemented for the compressive behavior. The
compressive strength used varies depending upon which specimens are involved, with the
value used being an average of the mixes fiom which the specimens in question were cast.
For design purposes, the stress-strain relationship for reinforcing steel is normally assumed
188

to be bilinear in nature, as indicated in Figure 7.1. This relationship assumes that the steel's
loading response is perfectly elastic up to the yield point, and then becomes perfectly plastic
until ultimate failure. As a result, the yield and ultimate strengths are considered to be
identical in magnitude. For the purpose of this analysis, a reinforcing steel yield strengthf, of
500 MPa was assumed along with an elastic modulus Es of 200 GPa.
fy = f u ~ = 500 MPa
Figure 7.1: Stress-strain relationship - reinforcing steeI.
These values correspond to a 400 Grade steel as specified by CSA A23.3 for elastic modulus
and CSA G30.18 for strength. In beam design, the yield strength for this grade of steel is
normally taken to be 400 MPa. However, this value actually represents the minimum
allowable strength for the 400 Grade steel and is thus very conservative. For analysis
purposes, a less conservative value must be chosen.
189

The previously mentioned value of 500 MPa was chosen for a couple of reasons. First, CSA
G30.18 specifies the minimum and maximum yield strengths of 400 Grade reinforcement as
400 MPa and 525 MPa, respectively, resulting in an average yield strength of 462 MPa. This
value was raised even M e r to account for the higher load carrying ability of the steel
beyond the yield strength. Though the design guidelines ignore this extra capacity, it was
necessary to include it in the following analyses for accuracy reasons. Since it is the ultimate
load of the beams that is of interest, the steel at this point is well beyond its yield point when
failure OCCM though it has not yet reached its ultimate strain. Since CSA G30.18 specifies
the ultimate tensile strength to be not less than 1.15 times the yield strength, it was decided
that a value of approximately one haIf of this extra strength would be used, and thus 500
MPa was chosen.
The stress-strain properties of the sprayed fiber reinforced polyrner material were taken
directly fkom the GFRP rnatenals testing portion of this project (Section 5.2). Two different
relationships were needed since the two types of bearns to be anaiysed were repaired using
different fiber lengths. The flexural strengthening phase (Section 6.1.4) was performed using
a 32 mm fiber length while the final shear strengthening results were obtained using a 48
mm fiber length. Unfortunately, the stress-strain behaviors of these two materials (depicted
in Figure 7.2) were not linear and thus a relationship was needed to allow determination of
the stress applied to the material at different strain levels.
Such relationships were detennined fiom the experimental stress-strain curves using a
statistical curve fitting program. The resulting relationships for the two fiber lengths in
190

question, along with those corresponding to a11 of the other fiber lengths tested, have been
included in Appendix J.
fi bers
Figure 7.2: Stress-strain relationship - sprayed GFRP.
- - --
Table 7.1: GFRP stress-~train relationship by fiber Iength.
1 Fiber Length 1 Constant

These relationships are of the fonn:
y = a + b x + c ~ ~ + d u ~ ~ + e x ~
where y represents the stress applied to the GFRP VI) and x is the resulting strain in
the GFRP ($. The variables a, b, c, d and e are constants that Vary depending upon the fiber
length in question. Table 7.1 provides the actual values of these constants for each fiber
length.
7.2.2 - Flexural Strength
Cross-Section Strains Forces
Figure 7.3: Flexural analysis of conventionally reinforced concrete sections.
Probably the most important structural property that must be predicted is the ultimate load
carrying ability or moment resistance of the members. The actual bearn design method
described in the CSA Standard A23.3 can be used as a predictive tool for these beams once
adjustments are made for the GFRP material. Figure 7.3 depicts the CSA approach for
flexural design of conventionally reinforced concrete bearns.
a1 fi 4-b -- rr
C P I C . II__ _ -
c c ~t - Neutral
Axis
L

One significant difference between the CSA design approach and the analysis method
described here is the treatrnent of material strength. In design, resistance factors are applied
to material strength values to account for inherent variations in strength and dimensions.
These factors (4, for steel and @c for concrete) contribute to the conservatism which is
necessary in structural design but lead to large uiaccuracies if used in the type of structural
analysis found here. Consequently, al1 resistance factors have been omitted in the following
analysis.
To sirnpliQ the design process, a rectangular compressive stress block is assurned in place of
the typical parabolic distribution normally associated with concrete. The intensity and depth
of this stress block are indicated in Figure 7.3 and are dependent upon the expressions for a,
and 4, respectively. These two terms are defined with respect to the compressive strength of
the concrete and limited to a minimum value of 0.67 as shown below.
Flexural design of reinforced concrete beams is an iterative process based on the principle of
strain compatibility. The concrete strain at the uppermost edge of the compression block 5 is
assumed to be equal to the maximum allowable compressive strain for concrete E,.
This upper limit is designated as 0.0035 in the CSA design standard but for the purpose of
193

analysis a less conservative figure is required. Paulay and ~ r i e s t l e ~ g5 suggest an ultimate
strain of 0.0040 for unconfined concrete subjected to compressive stresses. It is this latter
figure which will be used throughout the structural analysis presented in this work. It should
be noted here, however, that the expressions for a, and p, provided above refer to an ultimate
strain of 0.0035 and have not been modified for the 0.0040 value used in the analysis.
Once the strain at the top of the compression block is set to the ultimate concrete
compressive strain, the resulting strain in the reuiforcing steel can, using the similar triangle
approach, easily be detennined as
At failure, the reinforcing steel is assumed to have aiready yielded, thus making the actual
strain in the steel irrelevant since the steel has already reached its maximum load, which is
defined as
T, = A S + S f ,
Due to its bilinear stress-strain relationship, the steel will continue to cany this maximum
Ioad regardless of any further increase in strain (assuming it does not reach its failure strain
before the beam fails, which is extremely unlikeiy). A neutral axis depth c is assurned and
the resulting compression force in the concrete Cc is calculated in accordance with the
following equation.

where the term a represents the depth of the compression block and is equivalent to
P,c. These two forces, Cc and T', must be equal in magnitude and opposite in direction in
order for static equilibrium to exist. Thus,
Since the value of Cc is dependent upon a, which is in hirn dependent upon the neutral axis c,
the determination of Cc is an iterative process as the assmed value of c is iteratively
modified until the two forces reach equilibriurn. The moment resistance M, of the beam can
then be computed as the force in the steel reinforcernent multiplied by the interna1 moment
arm, the distance between the forces T, and Cc.
The ultimate load carrying capacity of the beam P,, can then be determined fkom the
moment resistance, depending upon the loading configuration. As described earlier in
Section 6.1.2., a third-point loading arrangement was used throughout this project. For this
configuration the maximum moment occurring in the beam is related to the applied load by:

Rearranging this equation for the applied load gives:
To account for the retrofit material applied to the bottom surface of the bearn, the FRP is
simply considered as a second plane of flexural reinforcement. Figure 7.4 illustrates the
modifications that must be made to the previously discussed CSA approach for flexural
design of conventionally reinforced concrete bearns.
Cross-Section Strains Forces
Figure 7.4: FIexural anaiysis of RC sections retrofitted with FRP - Scheme E.
Basically, the original design approach is arnended by adding another force (TB) to account
for this extra reinforcement. At this point, the next step in the analysis depends upon the
failure mode exhibited by the bearn, concrete crushing in the compression zone at the top of
the beam or tensile fracture of the applied FRP.

First, assuming the failure will occur due to concrete crushing, the concrete strain is once
again set to the ultimate concrete strain and the strain in the reùiforcing steel is determined as
before. The strain in the FRP (E,) can be determined, due to the strain compatibility
assumption, using the similar triangle approach. This results in the equation
The stress applied to the FRP is then calculated fiom this strain using the FRP stress-strain
relationship shown in Table 7.1. Since we now know the applied stress and the material area,
the actual force camed by the FRP (T,) can also be computed as
If, on the other hand, the failure mode is assumed to be tensile fracture of the FRP, the
approach is slightly different. In this case, the strain at the lowermost edge of the FRP is set
to the ultimate strain of this material and the strains in the steel and concrete are calculated
relative to this limiting value. Now, the steel and concrete strains are represented by

The force carried by the FRP is also slightly modified as
Regardless of failure mode, the force balance equation is modified to include this force
carried by the FRP and thus becomes
The expression for moment resistance of the member must also be modified to include the
effect of both tensile forces
These modifications take into account only the FRP appiied to the bottom face of the bearn.
Though the FRP applied to the sides of the beam were expected to contribute to the shear
strength of the member, examination of the results f?om the flexural strengthening specimens
reveals that it contributes to flexural strength as well. When comparing specimens retrofitted
with the Scheme E approach (bottom face only) to those retrofitted with Scheme C (bottom
and sides coated), it becomes evident that the addition of the FRP to the sides significantly
increases the flexural strength of these bearns.
198

This conclusion is fiuther supported by the cracking pattern exhiited by the sprayed GFRP
material in the Scheme D retrofit. Following the tensile fiacture of the GFRP applied to the
bottom face, cracks would propagate up either side of the specirnen until they reached the
neutral mis. Here, they would split, with each branch progressing horizontally. The GFRP
above this line would eventually fail in compression due to buckling. This indicates that the
GFRP applied to the side of the beam in the region below the neutral axis is subjected to an
applied tensile stress while the FRP above the neutral axis carries a compressive load. The
photograp h in Figure 7.5 depicts this crac king pattern.
Figure 7.5: Cracking pattern exhibited by sprayed GFRP on sides of beams.
In large scale structures, the FRP material that is actually in compression need not be
considered since its contribution to overall mernber strength would be insignificant. In the
199

srnaII scale specimens being analysed here, however, this contribution cannot be overlooked.
The difference between the two cases lies in the ratio of GFRP thickness to overall beam
size.
As mentioned previousIy in Section 6-1-56., the minimum practical application thickness of
the sprayed GFRP material is 3.5 mm, as used in the shear strength deficient specimens
discussed later. Even at this minimum thiclaiess, the retrofit material makes up almost 7% of
the total beam width and over 5% of its total depth (for Scheme D). This represents a
substantial portion of the cross-sectional area of the specimen and results in a significant
amount of GFRP material being subjected to compression. As long as the GFRP-concrete
bond remains intact, the GFRP will resist buckling and act as compression reinforcement. In
large scale structures, the ratio of GFRP thickness to overall member size would be much
smaller and thus the effect of the GFRP in compression would become minimal, not to
mention that fact that i g n o ~ g its contribution would simply add to the coriservatism of the
design approach anyway.
There are two modifications of the analysis procedure necessary in order to adapt it to the
Scheme C retrofit arrangement. First, the FRP applied to the sides of the beam below the
neutral axis must be included as flexural reinforcement, as shown in Figure 7.6.

1 N.A.
CrossSection Strains Forces
Figure 7.6: Flexural analysis of RC sections retrofitted with FRP - Scheme C (FRP in tension only).
As mentioned previously, this would nonnally be the only modification necessary for large
scale specimens and for designing FRP retrofits. For analysis of the small scale specimens in
this project, however, a further modification is required to account for the side GFRP above
the neutral axis. This material is included as compression reinforcement and the necessary
changes are s h o w in Figure 7.7.
Cross-Section Strains Forces
Figure 7.7: Flexural analysis of RC sections retrofitted with FRP - Scheme C (inchdes FRP in compression).

The biggest complication related to the inclusion of the two components of the side FRP
material involves the fact that their dimensions are relative to the location of the neutral axis.
For the sake of simplicity in the analysis, the side FRP will be considered to include only
that FRP actually in contact with the surface of the beam. The extra material beyond the
bottom face of the concrete (or above in the Scheme D specirnens) will be accounted for by
increasing the width of the bottom andor top FRP by twice the side thickness.
Again, the analysis will depend upon the expected failure mode of the beam. For a concrete
crushing failure, the concrete strain E, is set to its ultimate value E, and the strains in the
steel and the bottom FRP are determined as before. The strains at the mid-heights of the side
GFRP, which are designated qSt for the portion above and qSb for the portion below the
neutral axis, are
Note that the value of % will always be exactly one half the upper surface concrete strain
since its location is midway between the upper surface and the neutral axis. The only
variable relative to 9- will be its location since that depends upon the neutral axis location.
These strains are then converted to stresses, again using the relationship fiom Table 7.1, and
finally to forces using

The force equilibriurn equation now becomes
cc+c/t = T+T-jb+T/,
Subsequently modiwng the moment resistance equation gives
Care must be taken to ensure that a consistent sign convention is followed. Since the
compression force C/, acts below the concrete compression force Cc (the point around which
the moment resistance is calculated), it will act opposite to the moment created by the other
three terms. This analysis assumes that the absolute value (always positive) of each force is
used in the expressions for moment resistance.
The remainïng contribution of the retrofit material that must be considered is that associated
with the FRP applied to the top surface of the beam. This matenal will also act as
compression reinforcement as long as it is prevented from buckling. The modifications to the
beam analysis procedure that are necessary to include the effect of the top surface FRP are
indicated in Figure 7.8.

I 7 1
I /
d dm
4 a.. - I i t
Cross-Section Strains Forces
Figure 7.8: FIexural analysis of RC sections retrofitted with FRP - Scheme D.
Unfortunately, compression testing of the sprayed GFRP material could not be properly
canied out with the available equipment. An extensive literature search of composite
material properties revealed that a compressive strength value of 200 MPa is typical for a
short, randomly distributed glasdpolyester composite containing lS-25% glass ". Once this
value was c ~ ~ r m e d by a second reference ", it was accepted for use in the analysis portion
of the project. Though the compressive strength is not actually used in the calculations, it
does represent the upper limit of stress than c m be camed by the FRP in compression. In no
case did the calculated compressive stress actually approach this limiting value.
Once again, the strain calculations will depend upon the expected failure mode. The first
case to be considered will again be concrete crushing at the upper surface of the member.
Since the upper FRP can only act as compression reinforcement as long as it is prevented
fiom buckling, and its compressive strength is significantly higher than that of the concrete,
the FRP should not fail until after the concrete has (assuming no bond failure). Thus, the
204

previous failure criterion based on ultimate concrete strain still applies and 4 is set to its
ultimate value E,. The strain in the top FRP plate can then be represented as
while the remaining strain caIculations rernain the sarne as before. This strain is first
converted to a stress 6) using the relationship from Table 7.1 and then to the force C' where
Adding this force to the force equilibrium expression gives
Subsequently modieing the moment resistance equation results in
Because the force CA acts above the line of action of Cc, its effect on moment resistance will
be additive with the tension forces, unlike CIH.

7.2.3 - Effect of Confinement
When the previously described analysis techniques were applied to the small scale
specimens cast and tested in this project, an interesting trend was revealed. The accuracy of
the predictions became significantly worse as the nurnber of coated sides increased, with the
predicted strengths getting successively lower ( m e r descnbed in Section 6.3.5.). One
concept that was identified as a possible explanation for this trend was the effect of
confinement on the concrete in the compression zone. In an attempt to offset this effect, it
was decided that the confining eEect should be included in the analysis techniques. The
approach used to accomplish this feat was first described by Mander et alg8 and M e r
detailed by Paulay & Priestley Their relationship was actually designed for use in
colurnns. Its implementation into this analysis is simply an attempt to take the confining
effect into account.
The technique first involves detemination of the ratio of transverse reinforcement area
providing the confrnement (the FRP coating in this case) to concrete area in each direction.
These two ratios are labelled p, and p, and were calculated as
For the Scheme D retrofit, both directions are applicable since the beam is completely
confined due to the GFRP coating on al1 four sides. The Scheme C retrofit arrangement, on
206

the other hand, does not provide complete confinement since only three sides are coated. For
this case, p, was assurned to be zero and p, was calculated using the above formula. No
confinement effect was considered in any of the other retrofit schemes.
Next, the effective confing stress ratio that could be developed by the FRP was determined
in each direction using the formulae
where the term K, is a confinement effectiveness coefficient. The value of K, for
rectangular sections is specified as 0.75 98. Once the effective confining stress ratios are
lcnown, the confined strength ratio K is determined fiom Figure 7.9.
Figure 7.9: Effective compressive strength determination for confined concrete 98.

To use Figure 7.9, the larger of the two effective connning stress ratios described above is
first located on the y-axis. Then, move across horizontally until reaching the curve
corresponding to the smaller effective conflning stress ratio. From there, move vertically
upward to the top of the figure and read off the codined strength ratio K. The confined
concrete compressive strength f :c is then taken to be
Confining stresses not only increase the effective compressive strength of concrete, but also
affect the ultimate concrete compression strain, according to the following formula
where p, = p, + p, for rectangular sections. These two codined concrete values, f 2
and &, are then used in place off 2 and E, in the flexural analysis technique previously
described for the retrofit schemes where confinement is provided by the FRP.
7.2.4 - Shear Strength
Determining the shear resistance of reinforced concrete beams cm be even more
straightfonvard. According to CSA Standard A23.3, the shear resistance of a conventionally

reinforced concrete beam is simply the shear capacity of the concrete plus the added capacity
of the shear reinforcement (typicatly in the form of steel stirmps). The CSA Standard
presents two different approaches for determining these components, a Simplified Method
(Clause 1 1.3) and a General Method (Clause 1 1.4). First, the Sirnplified Method described in
Clause 1 2.3 will be adapted to include the contrïbution of the sprayed GFRP to shear
resistance. Then, a modified version of the Geaeral Method will follow in Section 7.2.4.2.
7.2.4.1 - Simplified Method
To begin with, Figure 7.10 depicts a typical reinforced concrete beam which will be used to
illustrate the CSA approach for shear design of conventionally reinforced concrete bearns.
Cross-Section
Figure 7.10: Shear design of conventionally reinforced concrete sections.
The shear resistance contribution of the concrete is calculated as

where 6, represents the beam width and Ais a correction factor used to account for
low density concrete (otherwîse A = 1 .O). The contribution of the shear reinforcement is
detennined f?om the equation
where the term A, represents the area of shear reinforcement perpendicular to the axis
of the beam within the stirrup spacing distance S.
Thus, the total shear resistance of the member is simply the total of these two components
and is represented by
ModiQing this approach to account for the sprayed GFRP retrofit material involves
inclusion of the FRP applied to the sides of the beam into the shear strength equation. The
contributions fiorn the FRP applied to the top and bottom of the beam are considered to be
insignificant compared to the total shear resistance and are thus ignored.
Figure 7.1 1 indicates the dimensions and areas applicable to the shear analysis of FRP
retrofitted beams.

Cross-Section
Figure 7.11: Shear design of reinforced concrete sections retrofitted with FRP.
Inclusion of the FRP applied to the sides of the member is accomplished simply by
considering the FRP to be contuiuous stimps. Thus, the contribution of the FRP to the
overall shear resistance of the member can be represented by
where fi is the thickness of the FRP, which is equivalent to the horizontal area of FRP
per unit length in the longitudinal direction. The term hfrefers to the overall height of the
FRP. Adding this term to the expression for total shear resistance gives
Finally, the ultimate load canying ability of the bearn for the third-point loading arrangement
c m be calculated as
P,t = 2V,

Ttiough the FRP applied to the top and bottom surfaces of the beam does not directIy
contribute to shear resistance, it does improve the anchorage of the FRP and help prevent
debonding. Thus, this extra material does indirectly affect the shear strength of concrete
beams.
7.2.4.2 - General Method
The CSA General Method also defines the total shear resistance of a reinforced concrete
rnember as the shear resistance provided by the concrete plus the contribution of the shear
reinforcement. However, the approach used to calculate these components is a bit more
complex due to the inclusion of a residual tensile stress factor Pte account for the shear
resistance of cracked concrete and the eftiect of the angle of inclination of the diagonal
compressive stresses 6! The actual values of Band @are determined using modified
compression field theory and tabulated in the CSA code. For the General Method, the shear
capacity of the concrete is calculated as
The contribution of the shear stirrups situated perpendicular to the longitudinal axis of the
member is determined using

For bearns in which the shear stirrups are inclined at an angle crto the longitudinal axis of the
member, the shear contribution is
rr +J,, fydv(cot B + cota) sina
Thus, the total shear resistance of a conventionally reinforced concrete beam would be
Modifjhg this approach to include the contribution of the sprayed GFRP applied to the sides
of the beam would consist of adding a term to represent this additional shear resistance. This
term should be of the same form as for the contribution of shear stirmps located at an angle ct.
to the longitudinal axis. This equation would thus becorne
Furthemore, the value of ashould be taken as 45" at al1 tirnes. The reason for these
assumptions lies in the fact that the sprayed GFRP material is two dimensionally isotropie,
resulting in a shear stimp that acts as an inclined stirrup that is always aligned in the best
213

possible orientation. In the equation shown above for shear contribution of inclined stimps,
this would be a 45" angle.
This isotropie nature is the primary reason behind the supenor shear strengthening
performance of the sprayed FRP matenal when compared to unidirectional fiber systems
such as fabnc wraps or laminated plates. The sprayed material has the same strength in any
direction. Continuous fiber FRPs, on the other hand, quickly lose strength as the direction of
applied stress deviates fiom the fiber direction. 99~'00 This effect is depicted in Figure 7.12 for
a carbon fiber/epoxy composite.
Figure 7.12: Tensile and compressive strength as a function of fiber orientation for a unidirectional fiber composite. 99
Including the contribution of the FRP in the overall shear resistance equation results in the
following expression

Finally, the ultimate load carrying ability of the bearn for the third point loading arrangement
can be calculated as
eh = 2Yg
7.2.5 - Cornparison with Experimental Results
In order to check the accuracy of these analysis methods, ultimate load predictions were
made for each configuration of the small scale beams tested in the project. Since there were
two bearn designs, the flexural strengthening beams discussed in Section 6.2.4 and the sfiear
strengthening beams used throughout the remaining phases of the project, both designs were
included in the analysis. For each of these beam designs, an analysis was performed on the
unretrofitted control specimen as well on each retrofit scheme used.
For the flexural strengthening specimens, this resulted in an analysis of the unretrofitted
control as well as retrofit Schemes E, C and D. As far as the shear strengthening beams are
concemed, the final set of beams from Phase G were examined, resultiag in four
combinations as well, the unstrengthened control along with Schemes A, C and D. In each of
these eight different configurations, both the ultimate flexural and shear strengths were
predicted.
For some configurations this resulted in a nurnber of fiexural analysis attempts, depending
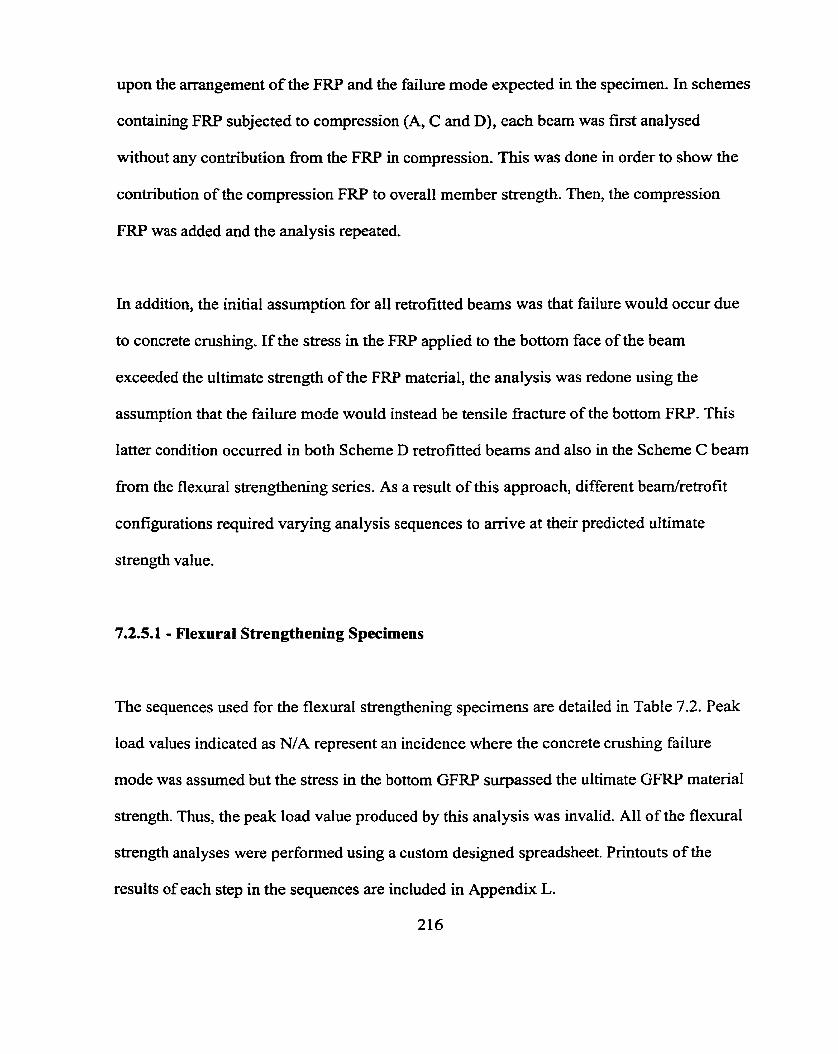
upon the arrangement of the FRP and the failure mode expected in the specimen. In schemes
containing FRP subjected to compression (A, C and D), each beam was first analysed
without any contribution fkom the FRP in compression. This was done in order to show the
contribution of the compression FRP to overall member strength. Then, the compression
FRP was added and the analysis repeated.
In addition, the initial assurnption for al1 retrofitted beams was that failure would occur due
to concrete crushing. If the stress in the FRP applied to the bottom face of the beam
exceeded the ultirnate strength of the FRP material, the analysis was redone using the
assurnption that the failure mode would instead be tensile hc ture of the bottom FRP. This
latter condition occurred in both Scheme D retrofitteci bearns and also in the Scheme C beam
from the flexural strengthening series. As a result of this approach, different bearnketrofit
configurations required varying analysis sequences to arrive at their predicted ultirnate
strength value.
7.2.5.1 - Flexural Strengthening Specimens
The sequences used for the flexural strengthening specimens are detailed in Table 7.2. Peak
load values indicated as N/A represent an incidence where the concrete cmshing failure
mode was assumed but the stress in the bottom GFRP surpassed the ultimate GFRP material
strength. Thus, the peak load value produced by this analysis was invalid. Al1 of the flexural
strength analyses were performed using a custorn designed spreadsheet. Printouts of the
results of each step in the sequences are included in Appendix L.
216

As shown in the table, the contribution from the compression FRP is indeed significant. En
both schemes containing such FRP (C and D), inclusion of the compression FRP resulted in
a change in failure mode fiom concrete crushing to tensile hc ture of the FRP, which was
accompanied by a significant increase in the predicted ultimate load.
Table 7.2: FlexuraI strength anaIysis sequences and results - flexural strengthening specimens.
Predicted Result Retro fit Scheme
Conîrol
E
Specimen Condition
m
-
Concrete Crushing Assumed
Concrete Crushing Assurned
No Compression FRP Concrete Crushing Assumed
Compression FRP Added Concrete Crushing Assumed
- . .
Compression FRP Added FRP Fracture Assurned
No Compression FRP Concrete Crushing Assumed
Compression FRP Added Concrete Crushing Assurned
Peak Load OcN)
FaiIure Mode
Concrete Cmshing
Concrete Crushing
Concrete Cmshing
FRP Fracture - - .
FRP Fracture
Concrete Crushing
FEW Fracture
I
The predicted values reported in Table 7.2 only consider the flexural strength analysis of the
Compression FRP Added FRP Fracture Assumed
beams. A shear strength analysis was also performed on each of these beams to determine
176 I FRP Fracture
whether their ultimate shear strength was sufficiently high to avoid a shear failure. Results
£tom this shear strength analysis are shown in Table 7.3.
Comparing these shear strength predictions with the flexural strength predictions in Table

7.2 reveals one interesting anomaly. Shear strength analysis indicates that the Scheme E
retrofit specimens should fail in shear under a load of 92 kN. Flexural strength analysis
predicted a concrete crushing failure, also at 92 kN.
- -
Retrofit Scheme
Individual Shear Components
Concrete Stimips
Control
specimens.
Ultimate Shear S trength Load
Even though the control beam had significantly more shear strength than necessary to avoid
a shear failure, the Scheme E specimens are borderline and may very well fail in shear. This
situation is not really surprising. By adding the GFRP to the bottom of the beam, we are
effectively increasing its flexural strength without affecting its shear strength. If this trend
were to be continued, eventually a shear failure mode would occur.
Looking at the Scheme C and D specimens, it becomes apparent that the shear strength
contribution from the sprayed GFRP applied to the sides of the beam is extremely large.
Both of these specimen types have more than enough shear reinforcement to avoid a shear
failure and thus they should fail in accordance with their predicted flexural failure modes. By
taking the lowest strength value from either the flexural analysis or the shear analysis of each
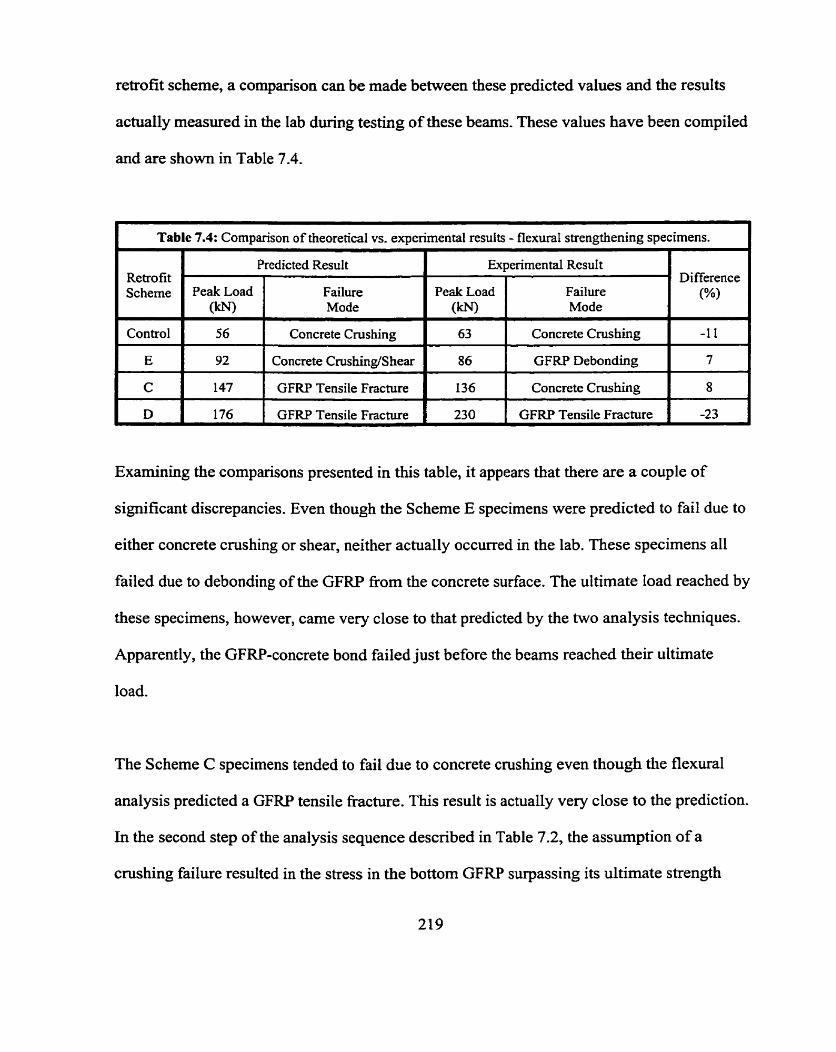
retrofit scheme, a cornparison c m be made between these predicted values and the results
actually measured in the lab during testing of these beams. These values have been compiled
and are shown in Table 7.4.
- - - - - - - - -
1 Table 7.4: Cornparison of theoretical vs. experimental results - flexural strengthening specirnens. 1
Examîning the cornparisons presented in this table, it appears that there are a couple of
significant discrepancies. Even though the Scheme E specirnens were predicted to fail due to
either concrete crushing or shear, neither actually occurred in the lab. These specimens al1
failed due to debonding of the GFRP from the concrete surface. The ultimate load reached by
these specimens, however, came very close to that predicted by the two analysis techniques.
Apparently, the GFRP-concrete bond failed just before the bearns reached their ultimate
load.
Retro fit Scheme
Control
E
C
D
The Scheme C specimens tended to fail due to concrete crushing even though the flexural
analysis predicted a GFRP tensile fracture. This result is actually very close to the prediction.
In the second step of the analysis sequence descnbed in Table 7.2, the assumption of a
crushing failure resulted in the stress in the bottom GFRP surpassing its ultimate strength
Predicted Result
Peak Load O N 56
92
147
Di fference (%)
-1 1
7
8
-23
Failure Mode
Concrete Crushing
Concrete Crushing/Shear
GFRP Tensile Fracture
Experimental Resul t
Peak Load ( kW
63
86
136
230
Failure Mode
Concrete Crushing
GFRP Debonding
Concrete Crushing
GFRP Tende Fracture 176 GFRP Tende Fracture

and led to the next step of assuming a GFRP tensile fi-acture. However, the calculated stress
in the GFRP at the initiation of concrete cmshing in this second step was only 106 MPa, only
2% higher than the ultimate strength of the GFRP which was 104 MPa. Looking back at the
GFRP tensile testing results fkom Section 5.1, the coefficient of variation within the sprayed
GFRP material is typically about 15%. This means that the discrepancy between the
predicted and experimental results for the Scheme C retrofit falls well within the GFRP
material variability.
The Scheme D prediction was M e r off, being 23% low of the experimental value. Again, a
great deal of this discrepancy may be due to the variation within the GFRP material itself.
Increasing the GFRP strength by 15% (one standard deviation) in the flexural strength
analysis results in the predicted strength jumping from the 176 kN shown in Table 7.4 to 204
kN, much closer to the experimental value of 230 kN. This large jump is due not only to the
increased Ioad carrying ability of the GFRP itself but also to the increase in concrete
confinement it provides.
7.2.5.2 - Shear Strengthening Specimens
A similar approach was taken with the final set of shear strength deficient beams fiom Phase
G of the project. First, a flexural strength analysis was performed on the control specimen
and on each retrofit scheme used in this phase (Schemes A, C and D). The analysis sequence
for each of these specimen types is shown in Table 7.5.

Al1 three of the retrofit schemes were first analysed without considering the contribution
from the compression FRP and under the assumption that a concrete crushing failure woutd
occur. Next, the analysis was redoae for the three retrofit schemes with the compression FRP
included but under the same failure mode assumption. This assumption t m e d out to be
correct for the Scheme A and C retrofits, though the Scheme D arrangement produced a
failure stress in the bottom FRP. Analysis of this scheme was then performed once again
under the assurnption that an FRP tensile fracture would ensue.
Predicted Result
No Compression FRP Concrete Crushing Assurned
Specimen Condition
Concrete Crushing Assumed
I lo3 I Concrete Crushing
Compression FRP Added Concrete Crushing Assumed
Peak Load (EcN)
1 O 0
1 105 1 Concrete Crushing
FaiIure Mode
Concrete Crushing
No Compression F M Concrete Crushing Assumed
Table 7.5: Flexural strength analysis sequences and results - shear strengthening specimens.
1 124 1 Concrete Cmshing
Retrofit Scheme
Control
A
C
D
I
-
I
L
I
Compression FRP Added Concrete Crushing Assumed
Compression FRP Added Concrete Crushing Assumed
1 N/A 1 FWFrachm
No Compression FRP Concrete Crus hing Assurned
129
A shear strength analysis was also performed on each of these specimen configurations, with
the results compiled in Table 7.6. As expected, the control specimens had limited shear
Concrete Cmshing
139
Compression FRP Added FRP Fracture Assurned
Concrete Crushing
165 FRP Fracture

resistance compared to other three schemes, which received very large contributions £iom
the sprayed GFRP applied to their sides.
Again, the lowest predicted value for each specimen (fiom the two analyses performed,
flexural and shear) is shown in Table 7.7, along with the average result obtained in the
laboratory for the sarne specimen configuration.
1 Table 7.7: Cornparison of theoretical vs. experirnental results - shear strengthening specimens.
Predicted Result Experimental Result Retrofit Scheme Peak Load Failure Peak Load Failure
(w) Mode CIcN) Mode
~ o n t r o l 1 44 1 S hear 1 48 1 Shear - - -
A 105 Concrete Crushing 96 GFRP Debonding
C 129 Concrete Crushing 137 Concrete Crushing
D 1 165 1 GFRP Tensile Fracture 1 199 1 GFRP Tensile Fracture
The results for this series of beams are even more accurate than the flexural strengthening

specimens. This time, however, it was the Scheme A retrofit specimens that failed due to
debonding of the FRP, as opposed to the predicted failure mode of concrete crushing. Again,
the beams tested in the Iaboratory came very close to their predicted failure load before the
bond failure occurred. They failed at a load of 96 IcN, only 9% below the predicted failure
load of 105 W. All of the other predicted failure modes were identical to the laboratory
results, with the control beams failing in shear, the Scheme C specimens due to concrete
crushing and the Scheme D members by tensile fracture of the FRP.
The control specimens were predicted to fail ru shear at a peak load of 44 kN, only 8% lower
than the actual failure load found in the lab. The Scheme C prediction of 129 ICN was only
6% low and the Scheme D prediction (165 kN) was 17% low. Al1 of these variations can be
explained by the varïability inherent in the materials themselves, predorninantly the GFRP.
It appears that the flexural and shear analysis techniques described in this chapter are
sufficiently accurate for predicting both the ultimate load carrying ability and the failure
mode of reinforced concrete beams retrofitted with sprayed GFRP. Analysis of the hl1 scale
bridge channel beams was performed by S. Ross 'O1 in another work and has not been
included here.

7.3 - Load-Deflection Prediction
To predict the Ioad-deflection response of the beams tested in this project, a sirnilar analysis
technique to that described in Section 7.2.2 was implemented. However, in this case the
various strains were al1 calculated with respect to the strain in the reinforcing steel. The steel
strain value was increased incrementally (in steps of 0.00025) while the strains in the other
materials (concrete and GFRP) were rnonitored to determine when, and how, failure
occurred. Failure was deemed to occur once the strain in any particuiar material reached its
ultimate value.
The applied load and deflection were also calculated at each steel strain increment. Load
values were calculated as per the procedure outlined in Section 7.2.2 while the deflection at
midspan was determined from the bearn curvature. For this purpose, it was assumed that the
curvature of the beam was perfectly circula in shape and that the length of the arc created by
the neutral axis of the beam s remained constant at 900 mm. Specimen curvature 4 was
calcuiated as
where E, is the strain at the extreme upper surface of the concrete. The radius of
curvature R, could then be determined as the inverse of the curvature (145). From these
values, the specimen's midspan deflection Gwas calculated as

Though the exact curvature of the bearn could have been determined and implemented in
place of the circular assumption mentioned above, the circular approximation was used for
simplicity .
Thus, for each incrernent in steel strain, the iterative analysis approach described in Section
7.2.2 was performed until the neutral axis depth corresponding to static equilibnum was
found. Material strains were checked to determine whether failure had occurred and the
values for applied load and deflection were recorded. Al1 calculations were carried out with
the use of a spreadsheet to simpliQ the iteration process. The data were then plotted to show
the load-deflection charactenstics of that particular beam arrangement.
This entire procedure was then repeated for the other specimen configurations. Ln all, 8 5
different beam combinations were examined, four each fi-om the flexural and shear
strengthening portions of the project. This allowed for the inclusion of retrofit Schemes E, C
and D fiom the flexural specimens and Schemes A, C and D fiom the shear specirnens (along
with their respective control specimens).
7.3.1 - Material Characteristics
In the previous section, the ultimate load carrying abilities of the various reinforced concrete
225

beams used throughout this project were predicted. To simplie this procedure, the stress-
strain relationship for reinforcing steel was assumed to be bilinear, as is the typical practice
in reinforced concrete design, while an equivalent rectangular stress block was used for
concrete. Since only one point was of interest (the peak load), this approach was satisfactory.
In order to accurately predict the entire load-deflection curve pnor to this peak load,
however, a more definitive stress-strain relationship is required for each material.
As rnentioned in Section 7.2.1, CSA G30.18 specifies the minimum and maximum yield
strengths of 400 Grade reinforcement as 400 MPa and 525 MPa, respectively, resultïng in an
average yield strength of 462 MPa. The load carrying ability of the steel increases beyond
this yield point until reaching its ultimate load level and failing. For analysis purposes, this
extra load carrying ability must be included into the calculations to improve accuracy.
Toward this end, a stress-strain relationship was developed for the range of steel strains
encountered in the loading history of these beams. This relationship is depicted in Figure
7.13.
The elastic modulus was again assumed to be 200 GPa while the yield strength was lowered
to 460 MPa in order to nominally represent the average value specified by the CSA standard.
Beyond the yield point, the stress-strain behaviour was assumed to follow the trend reported
by Nilson 'O2 and Mander. 'O3 An expression was derived to allow calculation of the load
carried by the steel directly from the strain.

f, = 460 MPa
E = 200 GPa
Figure 7.13: Stress-strain relationship - reinforcing steel.
The stress-strain relationship can thus be described as
for strains in the eiastic range (4 s 0.00230). Beyond this yield point, the steel stress
can be determined using the equation

Developing a similar expression for the stress-strain relationship of concrete was a little more
complex since this relationship would be affected by the two different levels of confinement
provided in the Scheme C and D retrofit arrangements. To M e r compound the problem,
the concrete strength varied between mixes. A general formula was needed to allow
modifications to these variables as needed. The research by Mander et alg8 into confinement
of concrete again provided just such an expression.
A graphical representation of the Mander model for confined concrete is shown in Figure
7.14.
Con fimd Fir s t con cre te, hoop
Compressive Strom , Ec
Figure 7.14: Mander mode1 for confined concreteg8.
This model allows calculation of the concrete stress directly fiom the strain using the
expression

where f :, is the compressive strength of the confined concrete (defined in Section
7.2.3) and x is determined by
where E, is the actual compressive strain applied to the concrete and E, is calculated
fkom the expression
where f represents the concrete's unconfïned compressive strength and E, the strain
corresponding to this strength. Mander et al suggest that G~ can be assumed equal to 0.002
(one half of the ultimate strain for unconfined concrete). The variable r is defined as
where E, is the tangent modulus of elasticity, which can be approximated as

The secant modulus of elasticity E,,, is M e r defined as
The Mander mode1 can also be used to create the stress-strain relationship for unconfined
concrete simply by setting the confined compressive strength f :, equal to the unconfned
strength f é. Applying this mode1 to the two concretes used in the analysis section, for the
flexural strengthening and shear strengthening beams, results in the stress-strain curves
depicted in Figures 7.15 and 7.16, respectively.
Figure 7.15: Stress-strain relationship - concrete (flexural beams).

Scheme D Retrofit
Scheme C Retrofit
No Confinement
Figure 7.16: Stress-strain relationship - concrete (shear beams).
These figures show the curves for unconfined concrete (applicable to the control specimens
as well as the Scheme A and E retrofits) as well as for the two retrofit schemes providing
confinement.
Unfortunately, such a relationship results in a non-linear stress distribution in the concrete.
Typically, the concrete stress distribution would be divided into a number of regions,
depending upon the shape of the stress-strain curve, and a force would be determined for
each of these regions. Calculation of this force would require integrating the stress-strain
relationship over the depth of the region corresponding to that force. In this case, such an
approach was not feasible due to the very large number of calculations required so a
simplified method was devised.
23 1

The concrete compression zone was divided into four regions, with the stress at the rnidpoint
of each region taken to be the average stress over that region. Inherently, this assumes that
the stress distribution within each region is linear, with the midpoint stress being the average
value. By breaking the stress distribution into these smaller segments and determining the
interna1 concrete forces using the midpoint stresses, the calculations could be more easily
adapted for hplementation in the spreadsheet.
These stress-strain relationships (reinforcing steel and concrete) were used throughout the
load-deflection behavior prediction process. For the sprayed GFRP material, the existing
stress-strain behavior described in Section 7.2.1 was again implemented.
7.3.2 - Flexural Strengthening Specimens
The predicted Ioad-deflection curves for each flexural strengthening beam configuration will
be presented in this section. For each case, the actual test results from the flexural
strengthening portion of the project have been plotted along with the predicted behaviour for
cornparison purposes. The actual test result curves are continued a short distance beyond
their peak load points while the predicted curves are terminated once failure occurs.
Though the concrete stress-strain relationships depicted in the previous section irnply that
some fkther load can be carried by the concrete beyond its ultimate load, in practice this
would require closed loop testing equipment in order to avoid catastrophic failure and to
allow accurate measurement of member deflection. Such a system was not used in the
232

laboratory testing, meaning cornparison of the curves beyond the peak load point would not
be valid. The other failure mode (GFRP tensile fracture) is catastrophic by nature and thus no
post-peak performance is relevant. To begin with, the control specirnen results are depicted
in Figure 7.17.
- Individual Beams - Predicted Behavior
5 10 15 &flecZion (mm)
Figure 7.17: Load-deflection curves - flexural bearns (controls).
As shown in this figure, the predicted load-deflection curve for these control specirnens is
very close to those corresponding to the laboratory specimens. The primary deviation occurs
at failure, where the predicted failure deflection is slightly Iower than that measured in the
lab. Figure 7.18 depicts the predicted and actual curves for the flexural specimens retrofitted
with Scheme E.

O 2 4 6 8 10 12 Defledon (mm)
Figure 7.18: Load-deflection curves - flexural bearns (Scheme E).
Here we can see that initially the predicted behaviour closely follows that of the Iaboratory
specimens but soon deviates from them and eventually reaches a higher failure load. This
discrepancy is due to the failure mode exhibited by the specimens tested in the lab. These
beams failed due to debonding of the GFRP coating from the concrete surface, as opposed to
the predictive mode1 which reached failure due to crushing of the concrete in the
compression zone at the upper surface of the beam. In this case, this debonding occurred
slowly, as is typical for the sprayed GFRP material.
Going on to the Scheme C retrofit, the relevant load-deflection curves are presented in Figure
7.19.
234

O 2 4 6 8 10 12 14 16 Deflection (mm)
Figure 7.19: Load-deflection curves - flexuraI bearns (Scheme C).
Here, the predicted curve falls just below the test results, though it is well within the
variation inberent in the materials being used (specifically the GFRP). Otherwise, the
predicted curve corresponds very well with respect to the reinforcement yield point
(evidenced in the figure by the slope change at the end of the initial linear portion of the
curve) and the ultimate load carried by the test beams. On the other band, the predicted
deflection at failure is slightiy higher than those found in the lab.
Figure 7.20 shows the c w e s related to the Scheme D retrofit confiiguration.
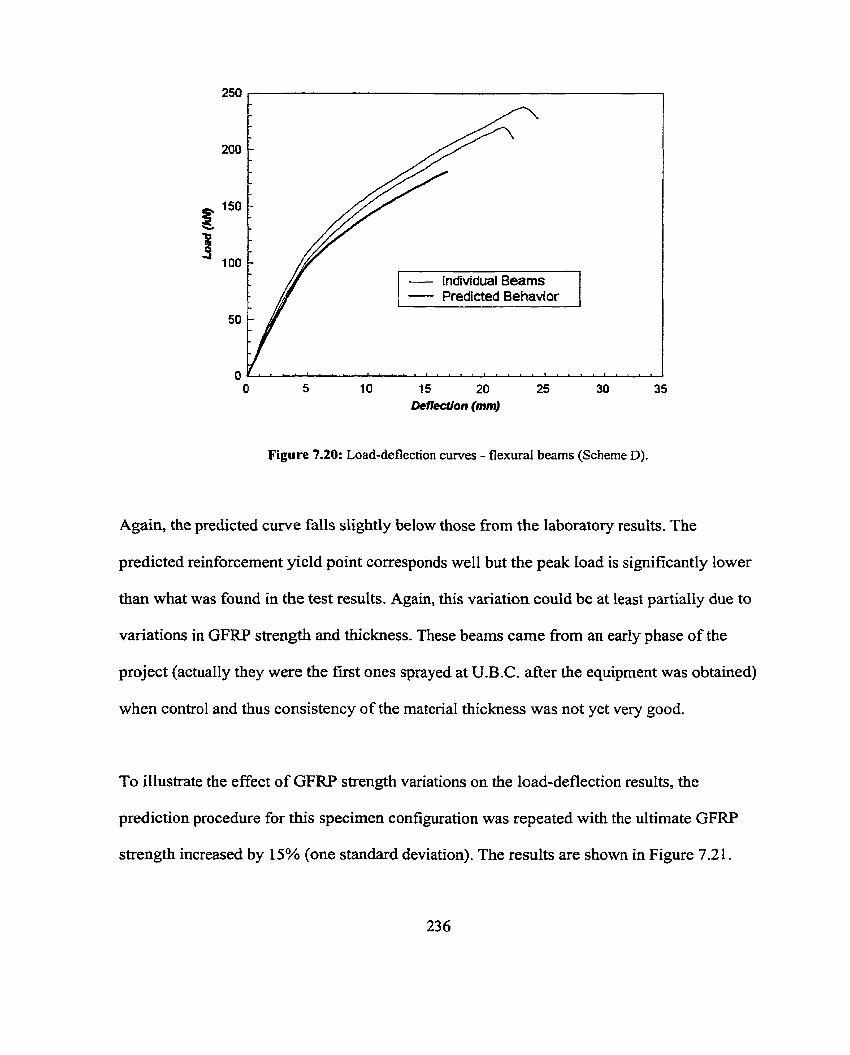
O 5 10 15 20 25 30 35 Denection (mm)
Figure 7.20: Load-deflection curves - flexuraI bearns (Scheme D).
Again, the predicted curve falls slightly below those from the laboratory results. The
predicted reuiforcement yield point corresponds well but the peak load is significantly lower
than what was found in the test results. Again, this variation could be at least partially due to
variations in GFRP strength and thickness. These beams came from an early phase of the
project (actually they were the first ones sprayed at U.B.C. after the equipment was obtained)
when conirol and thus consistency of the material thickness was not yet very good.
To illustrate the effect of GFRP strength variations on the load-deflection results, the
prediction procedure for this specimen configuration was repeated with the ultimate GFRP
strength increased by 15% (one standard deviation). The results are shown in Figure 7.2 1.

O 5 10 15 20 25 30 35 Oeflection (mm)
Figure 7.21: Load-deflection curves - flexural bearns (Scheme D extended).
Though the predicted c w e still falls below the lab results, this exercise does show that
variations in material properties (such as GFRP strength in this case) can have a very large
infiuence on member performance. This revised prediction only takes into account a 15%
increase in GFRP strength to allow for the 15% coefficient of variation found for this
material. However, as the strength increases, so does the stifiess. The coefficient of
variation within the initial elastic modulus results was found to be as high as 10% as well.
Combined, these two variations can have a significant effect on member properties, a fact
that must be taken into serious consideration before this material can be considered for
commercial application.

Revising the predicted peak loadfailure mode table fkom Section 7.1 S. 1 (Table 7.4) to
reflect the results obtained in this section gives Table 7.8.
1 Table 7.8: Cornparison of theoretical vs. experimental results - flexural strengthening specirnens.
Comparing these results with the previous values in Table 7.4 indicates that the analysis
approach used in this section produced results even closer to those obtained in the lab
specimens. It was also capable of producing the correct failure mode for the Scheme C
retrofit, which was previousiy predicted as GFRP tensile fracture. These improvements are
due to the more representative stress-strain relationships that were used for steel and concrete
in this section.
Difference (%)
-5
10
-2
-2 1
Retro fit Scheme
Control
E
C
D
7.3.3 - Shear Strengthening Specimens
Since the shear strengthening specirnens were fundamentally different in their actual design
than the flexural strengthening specimens, load-deflection predictions for the three retrofit
schemes used with these bearns (A, C and D) were also performed. The results fiom the
control specirnens are depicted in Figure 7.22 below.
- -
Predicted Result
Peak Load 0 60
95
133
181
- Experimental ResuIt
Failure Mode
Concrete Crushing
Concrete Crushing
Concrete Crushing
GFRP TensiIe Fracture
Peak Load 0
63
86
136
230
Failure Mode
Concrete Crushing
GFRP Debonding
Concrete Crushing
GFRP TensiIe Fracture

- Individual Bearns - Predicted Behavior
2 4 6 Det7ecüon (mm)
Figure 7.22: Load-deflection curves - shear bearns (controls).
This cornparison really doesn't show much since the control specimens failed in shear while
the analysis procedure used to predict their behaviour examined only their flexural
performance. As a result, the prediction cunied in Figure 7.22 represents what should occur
if these beams had sufficient shear capacity to reach the load ievels indicated. Since these
beams contained no shear reinforcement whatsoever, they failed at much lower loads. The
Scheme A retrofit (coating both sides of the beam) was designed to provide this extra shear
capacity. Unfortunately, these beams tended to fail due to debonding of the GFRP fiom the
concrete surface. Results and predicted behaviour are shown in Figure 7.23.

2 4 6 D e f l d 0 ~ (mm)
Figure 7.23: Load-deflection curves - shear beams (Scheme A).
As with the debonding evidenced in the Scheme E flexural specimens, the load-deflection
curves here also gradually deviate fkom the predicted result and failure typically occurs at
lower load levels. As previously noted in Section 7.2.5.2, these bearns appear to have come
very close to achieving their predicted ultimate loads before the debonding occurred. One of
the laboratory tested beams did manage to reach the predicted load level, though it still failed
due to debonding.
The predicted and lab testing results from Scheme C are depicted in Figure 7.24. In this case,
the correlation between predicted and actual results is very good. In fact, they are vimially
identical until just before the failure load is reached. Though some deviation is evident at this
point, the predicted failure load is within 4% of the average result reported in the lab.
240

O 2 4 6 8 10 Denedon (mm)
Figure 7.24: Load-deflection curves - shear bearns (Scheme C).
Finally, the load-deflection curves for the Scheme D specimens are shown in Figure 7.25.
Again, the correlation between the predicted and laboratory results is extremely close up to
the predicted failure load. As with the flexural specimens, this predicted value falls below
those exhibited by the test specimens. In this case, however, it appears that the variation may
be due to GFRP strength variations alone since the predicted stiffhess is much better.
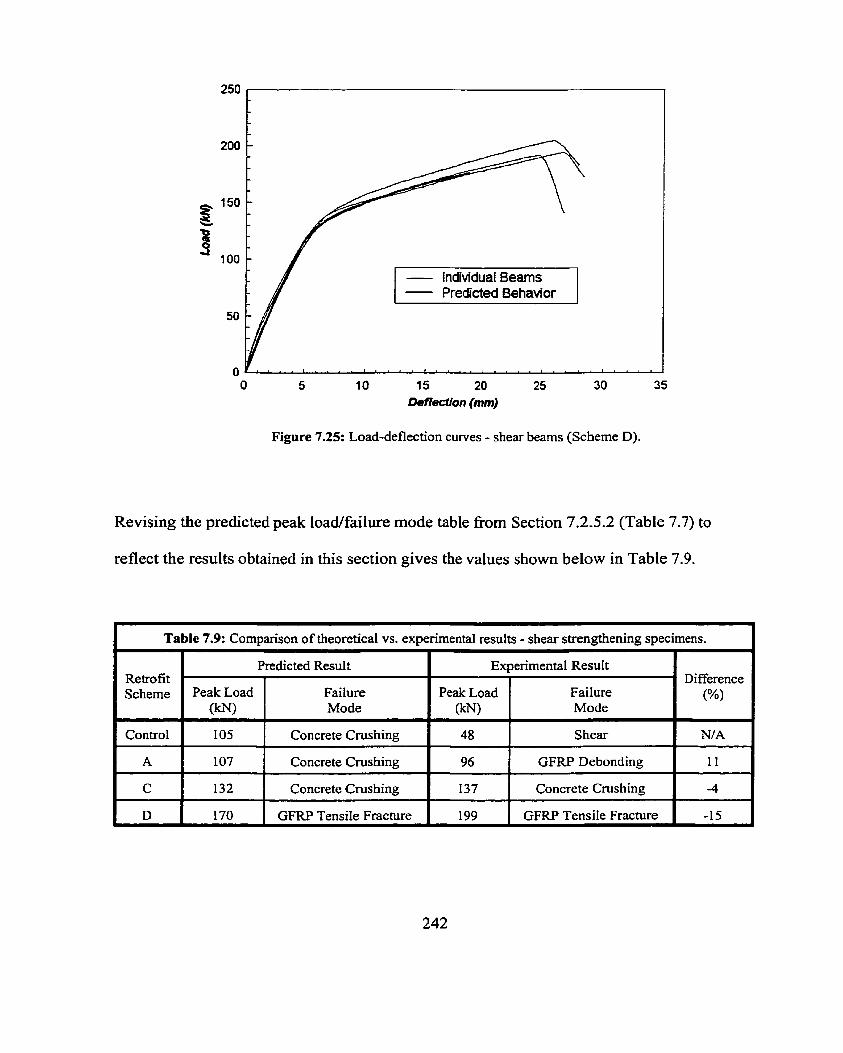
O 5 10 15 20 25 30 35 Deflecrion (mm)
Figure 7.25: Load-deflection curves - shear beams (Scheme D).
Revising the predicted peak loadfailure mode table fiom Section 7.2.5.2 (Table 7.7) to
reflect the results obtained in this section gives the values shown below in Table 7.9.
1 Table 7.9: Cornparison of theoretical vs. experirnental results - shear strengthening specirnens. 1
Retrofit Scheme
Control
A
C
1 D 1 170 1 GFRP Tensile Fracture 1 199 1 GFRP Tensile Fracture 1 -15 1
Predicted Result
Peak Load 0
1 05
107
132
Difference (%)
NIA
1 1
-4
Experimental Result
Failure Mode
Concrete Crushing
Concrete Crushing
Concrete Crushing
Peak Load OcN)
48
96
137
Failure Mode
Shear
GFRP Debonding
Concrete Cmshing

The results for the control specimens cannot be compared since shear strength was not
considered in the load-deflection prediction performed in this section. The other predicted
values have improved slightly and are within tolerances set by material variability.
7.4 - Discussion
7.4.1 - Beam FaiIure Mechanism
Upon examination of the results fiom the structural analysis section, a number of
observations can be made concerning the behavior of the beams during testing. As the
applied load is increased, the midspan deflection of the member also increases in a linear
manner up to the point where the strain in the reinforcing steel reaches its ultimate value. At
this tirne, the steel begins to yield, resulting in a much larger rate of deformation (i.e.
increase in defiection). Identification of the reinforcement yielding point on the load-
deflection diagrams is typically very easy shce it is represented by a significant change in
slope, as can be seen quite clearly for the flexural specimens in Figure 6.9 and for the shear
strengthening specimens in Figure 6.39. For those members with sprayed FRP applied to
their bottom face, the strain in this bottom FRP is below 0.0040 at this tirne.
As loading continues, the strains in al1 materials continue to increase until the next limiting
value is reached. If the beam has no FRP applied to the upper surface (Le. Schemes C and E),
then the next material to reach it ultimate strain will be the concrete in the compression zone
at the upper surface of the specimen and a crushing failure will ensue, as indicated in Figure
6.1 1. For the specimens in which FRP was applied to the top surface as well (Le. Scheme D),
243

the next limiting value will be the ultimate strain of the bottom surface FRP, resulting in
tensiie bcture of this FRP, as depicted in Figure 6.12.
In order for this failure mode to occur, the strain in the concrete at its upper surface must be
able to reach levels well above its ultimate unconfined value. Tiius, tensile fkacture of the
FRP c m only occur in retrofit schemes providing sufficient confining stress to increase the
effective ultimate strain of the concrete to the necessary levels.
There are also two other faiIure modes that can supercede the sequence described above.
First, should the shear capacity of the member be exceeded, then a shear failure will occw at
that point. Second, failure of the FRP - concrete bond may also occur before either concrete
crushing or FRP tensile fracture takes place. Once debonding occurs, any contribution from
the debonded FRP is immediately lost and beam behavior reverts to that of an unretrofitted
specimen.
7.4.2 - Bond Performance
The primas, failure mode reported by other researchers using plate bonding and fabric
wrapping techniques is debonding of the FRP retrofit material. Though the bond itself has
not been studied in the research project presented here, a brief description of the issue
follows.
The actuai strength of the bond is dependent on two properties; the adhesion capacity of the
244

bondùig agent itself and the mechanical interlock produced by the roughened concrete
surface. The debonding issue appears to be less prevalent in the sprayed FRP technique,
likely due to the use of a rougher substrate. Plate bonding and fabric wrapping techniques
require a fairly smooth surface in order to avoid discontinuities which can induce out of
plane stresses and thus lead to localized debonding. This approach is required due to the
continuous nature of the fibers and the constant thichess of the composite.
The sprayed FRP, on the other hand, is much more adaptable to surface defects and is, in
fact, applied to a sandblasted surface. Not o d y does this rougher surface improve the
mechanical interlock between the FRP resin and concrete, but it also permits adhesive
bonding directly to the exposed aggregates. Additionally, the sprayed technique normally
produces a single interface or bond line, with the matrix resin acting as the bonding agent as
well. This direct linkage between the mabyt and the concrete substrate irnproves the
efficiency of the stress transfer across the bond.
For the plate bonding or fabnc wrapping techniques, there are actually two interfaces that
need to be considered, one between the concrete surface and the epoxy adhesive and a
second between the epoxy adhesive and the applied plate or fabnc. Optimizing both of these
interfaces with the same adhesive can be very difficult.
In the later portions of the research, a vinyl ester coupling agent was applied to the concrete
surface pnor to spraying in an attempt to improve the FRP-concrete bond. Since the
polyester matrix resin was applied before setting of the vinyl ester, there was chemical
245

interaction between the two resins, resulting in an excellent chernical bond. Moreover, the
vinyl ester produces a superior adhesive bond with the concrete than the polyester, resulting
in a better FW-concrete bond.
There are a number of factors influencing the required strength of the bond. Two possible
bond failure modes were identified during the testing program. The most prevalent of these
was the Type II or shear failure which was evident in the Scheme A and E retrofitted
members. The Scheme C specimens tended to exhibit Mode 1 delamination as the FRP
applied to the sides of the beam buckled under high member deformaîions, resulting in the
FRP pulling directly away from the concrete surface. This Mode 1 delamination only
occurred after the specimen had reached its ultimate load and is thus much less important
than the shear failure mode.
Examining the bond itself, it is essentially subjected to a shearing stress as the material to
one side (FRP) is subjected to a higher strain than the material on the other side (concrete).
The magnitude of this shearing stress is not constant over the entire bond, and actually
increases in the regions adjacent to the ends of the FRP. This increase is induced by the
transition from a plane stress state near the middle of the FRP to a three-dimensima1 stress
state at and near the free edge represented by the end of the FRP material. 'O9 The variation
in this stress is shown in Figure 7.26.
It is this phenomenon that causes the debonding to initiate at the ends of the applied FRP.
The length of the region over which this interlaminar shear stress acts is directly proportional
246

to the thickness of the FRP, resulting in an increase in shearing stress as FRP thickness
increases. This relationship is actually a drawback for the sprayed FRP technique since the
material thickness is significantly higher with this technique. Adding to the problem is the
fact that a thicker FRP plate is aiso going to be stiffer and thus Iess willing to conform to the
deformed shape of the bearn during loading, resulting in the introduction of a peeling stress
as well. Counteracting these effects, to some extent, is the simple fact that a thicker material
shifts the location of the FRP-concrete bond M e r away from the extreme fiber and thus
lowers the strains to which the bond is subjected.
k Lanination theory \ /
Figure 7.26: Stress distribution in a laminate at a fiee edge 'Og.

Once delamination has initiated, the sprayed FRP requires higher hc tu re energies to
maintain crack propagation than continuous fiber systems. Thus, once debonding has begun,
it proceeds very quickly in the continuous fiber systems while the sprayed material debonds
much more gradualIy.
Another difference between the two materials is their reaction to cracking of the concrete. As
mentioned previously, the sprayed matenal is more adaptable to the out of plane dislocations
that can occur over a crack. It is also better at handling the large stress concentrations created
when a new crack fonns, resulting in very large localized strains. The higher strain
capabilities of the sprayed material allow it to alleviate these localized stress concentrations
quickly and leads to multi-cracking, which in tum, distributes the additional strains due to
cracking over a much wider area.
Thoiigh the preceding discussion covers the general concepts related to bond failure of FRP
retrofit materials, it is by no means a definitive work on the subject. A great deal of
investigation into such bond performance, especially for the sprayed FRP technique, is
necessary before such a system could be safely implemented in the construction industry.

Economic Evaluation
8.1 - Introduction
One other advantage that the sprayed GFRP technique has over the cornrnercially availabie
products is its economy. Specifically, the fiber used in the spraying system is in a roving
format. The fabrics used in the wrapping procedures are typically constmcted fkom these
same rovings, whether they are woven or stitched together. This extra mechanical step tends
to have a significant impact on the final cost of the material.
This section will present a material cost comparison between the sprayed GFRP approach
and the comrnercially available MBraceB system. As descnbed in Section 6.2., these were
the two retrofit techniques used in the rehabilitation of the large scaIe bridge channel bearns.

8.2 - Material Cost - Sprayed GFRP
First, the relevant information (retail price, density and coverage) for the sprayed GFRP
approach has been compiled in Table 8.1.
Table 8.1: Pricing, densities and coverage of sprayed GFRP components. 1
Resin: Derakane 8084 Vinyl Ester 1 7.93 'O1 1 1020 'O5 1 6.5 'O4
Cornponent
GIass Fiber: Advantex 360RR 1 3 -55 IM 1 2620 '" 1 -
Retail Pnce ($/kg)
Resin: KI907 Polyester
Catalyst: Lupersol DDM9 MEKP
The retail prices shown in Table 8.1 came directly fkom the manufacturer/supplier, Ashland
Canada Ltd., as did the density values for their products. These prices were obtained in
October of 1999. The cost per square metre of concrete surface to be sprayed will be
calculated for each of these components.
First, the cost of the coupling agent (Deralcane 8084 Vinyl Ester Resin) can be detemiined
directly since the quantity required is dependent entirely upon the surface area to be covered
and is unaffected by the final thickness of the sprayed GFRP composite.
Density (Wm3>
-
3.38 lw
7.80 I M
1 Composite Resin - KI907 Polyester Resin 1
Coverage (m'/~)
1080 'O4
1 O00 '"
p Retail Pnce IO20 7.93 Cost = - -- - *--
1000 ' Coverage 1000 65 - $1.24 per mZ

As for the composite itself, there are three components that must be included, the polyester
resin, the MEKP catalyst and the glass fiber. As previously discussed in Chapter 5, the
volume fiaction of fiber V' is approxllnately 19%, leaving a matrix volume fraction V , of
8 1%. Since the catalyst content in the matrix was set to 3%, the latter value can be further
subdivided into volume fractions for resin V, and catalyst Y,, which are 78.6% and 2.4%,
respec tively.
The final cost of each of these components will depend upon the applied thickness of the
sprayed GFRP matenal. Consequently, each of these costs will be determined in tems of t,
the composite thickness.
Composite Resin - K1907 Polyester Resin
V, p Retail Price r 0.79 1080- 3.38- t Cost = - -
1000 1000 = $2.88t per m'
1 Composite Catalyst - Lupersol DDM9 MEKP 1 V, p Retail Price - t 0.02 - 1000 - 7.80. t
Cost = - - 1 O00 1000
= $0.19 per m'
Glass Fiber - Advantex 360RR
V, p Retail Price - t 0.1 9 - 2620 3.55. t Cost = - -
1000 1000 = $l.77t per m"

The total cost of the sprayed GFRP laminate wouId t h u s be
Composite Cost = (2.88 + 0.1 5 + 1.77)t = $4.80t per rn2
Adding the cost of the vinyl ester coupling agent results in a total matenal cost of
Total Material Cost = s(1.24 + 4.80t) per m2
where t is the thickness of the sprayed GFRP coating in millimetres.
8.3 - Material Cost - MBrace@ System
The MI3raceB composite strengthening system is made up of a nurnber of components. Those
components used in the rehabilitation of the large scale bridge channel beams in this project
are shown, along with their retail prices and coverage ratings, in Table 8.2.
1 Table 8.2: Pncing and coverage of MBracem components. 1
Ln this case, the retail pricing again cornes directly fiom the manufacturer, Master Builders
Technologies, Inc., and were obtained in September of 1999.
Component r
Primer
Saturant
EG 900 E-Giass Reinforcement
Retail Price 'O7
$20.67 per L
$16.62 per L
% 16.20 per m2
Coverage m2m
J
5-50 'OS
0.73 'O8
-

The cost of each component has again been calculated, though with this system the costs are
not dependent upon the composite thickness but on the number of layers of material applied.
Again, refering to the large scale bridge channel beams fiom Section 6.2, the following
prices are for a single layer of EG 900 E-glass reinforcement.
Primer
Retail Price 20.67 Cost = --- -
55 - $3.76 per rn2
Coverage
Saturant
Retail Pnce 16.62 Cost = --- - - $22.77 per m'
Coverage 0.73
The total cost of the materials for the ME3racem system as used in this project would thus be
Total Cost = 16.20 + 3.76 + 22.77 = $42.73 per m'
It should be noted that this cost does not include a number of items described in the actual
MBraceO manual as being part of the system log. After the primer coat is a applied, a special
putty is suggested in order to fil1 any holes in the concrete surface and to level uneven
surfaces. The manual also mentions the possibility of a second coat of primer and a
protective top coat which is applied over the f i s h e d product. Any of these additional items
will increase the cost of the system even M e r , though pricing was not obtained since they
253

are somewhat optional. The following comparison will not take these extra items into
account.
8.4 - Comparison
As mentioned the total material cost of the race@ system with one layer of EG 900 E-
glass reinforcement is $42.73 per mZ of concrete surface while the cost of the sprayed GFRP
material depends upon the thickness of the applied GFRP. Table 8.3 provides a comparison
of the material costs related to these two systems for a range of sprayed GFRP thicknesses.
The material cost of the MBracem system is equivalent to about 8.6 mm of the sprayed
GFW. In the section dealing with the rehabilitation of large scale bridge channel bearns, a
structural cornparison was done between a single layer of the M13racea system and an 8 mm
coating of the sprayed GFRP material. Ln that case, the sprayed rnaterial performed better.
Now we c m see that it is also more economical fkom a material cost perspective.
Table 8.3: Material cost comparison - MBraceB systern vs. sprayed GFRP. 1 race@
Cost ($lm2)
42.73
Sprayed GFRP
Thickness (mm)
3.5
4.0
6.0
8 .O
8.65
Cost ($lm2)
18.04
20.44
30.04
39.64
42.7 1
Difference (%)
137
1 09
42
8

There are a number of other cost issues that could eventually be added to this cornparison.
The sprayed system should be much easier and less t h e intensive to Mplement in the field,
resulting in a M e r cost savings fiom a reduction in required labour and a shorter downtime
for the structure being retrofitted. Such a cornparison could not be performed at this time
since the spraying equiprnent cannot currently be used for field application where overhead
spraying is required. Modifications to this equipment are necessary to allow such operation.
Another issue is the concrete surface itself. Continuous fiber fabrics, like the MBraceB
system, must be applied to a flat surface. As previously mentioned, the manufacturer
suggests the application of a special putty to achieve this condition 'O8, which would entail
additional labour and downtime costs. Since the sprayed GFRP is a built-up material, it can
be applied directly ont0 the original rough surface immediately after sandblasting (which
both techniques require).

Conclusions & Recommendations
9.1 - Conclusions
In general, the results obtained in this research project support the hypothesis that sprayed
glass fiber reinforced polymers do have the potential to become a feasible alternative to
existing rehabilitation techniques for reinforced concrete beams.
The spraying technique implemented in this project is capable of producing a consistent fiber
reinforced polymer which exhibits two dimensionally isotropic strength properties. With the
actual equipment used for this research, a glass fiber reinforced polyester matrix was
produced. This material exhibited a maximum composite strength of 110 MPa and an elastic
modulus of 12 GPa at a fiber volume fraction of 19%. Strength properties are highty
dependent upon fiber length, with the values shown above referring to a material containing
48 mm fibers, the maximum possible with the equipment used.

It appears to be possible to accurately predict the strength properties of the sprayed FRP
material fkom the properties of the individual components, based upon existing composite
material theory. Modifications must be made to account for the random orientation and the
discontinuous nature of the fibers. A mode1 was developed that worked very weII for the
combination of materials used in this project.
The application process (spraying) is very straightforward and requires a minimal amount of
operator training. Material thickness is directly controlled by the operator, resulting in more
flexibility in the design process when compared to the application of continuous fiber fabrics
(requiring multiple layers) or FRP plates (specified thichesses).
One benefit of the discontinuous fibers is their ability to bend around much sharper corners
than continuous fiber fabrics. This can be extremely important in ensuring that the FRP
applied to adjacent retrofitted sides of the mernber act together instead of behaving as
individual units. Such a response is especially beneficial in preventing debonding of the FRP
on the tension side of the member when the adjacefit sides are retrofitted as well.
The discontinuous and random orientation of the fibers also appears to enhance resistance to
debonding of the sprayed FRP material. Delamination tends to more gradua1 than with
continuous fiber systems, probably due to differences in the fiber-to-fiber stress transfer
mechanism.

The sprayed FRP materid was shown to be capable of significantly increasing both the
strength and stSkess of existing concrete beams, while at the same time dramatically
improving their energy absorption characteristics. In flexural strengthening situations, these
increases appear to be in the same range, or slightly lower, than the improvements typically
produced by FRP fabric and plate bonding techniques. For shear strengthening purposes,
however, the sprayed GFRP material is capable of producing far better results than any of the
other techniques. Direct cornparison of the sprayed FRP technique with a commercially
available fabric wrapping system for the rehabilitation of large scale members confirmed that
this technique is capable of producing superior results .
Prediction of the load carrying ability and load-deflection behavior of retrofitted specimens
is possible and accurate within the bounds induced by material variability. Subsequently,
design parameters for this rehabilitation technique could be devised to make sprayed FRP
rehabilitation projects simple, efficient and safe.
From an economic perspective, the sprayed FRP technique represents a significant reduction
in material cost over the commercially available fabric wrapping system studied. This cost
savings could potentially become much Iarger once labor and structure downtime costs
associated with the application technique are considered.

9.2 - Recommendations for Future Research
Probably the most obvious suggestion for continued research into the sprayed FRP technique
is to investigate the feasibility of implementing this process in the field. The design of the
apparatus used in this process appears to be well adapted for such use since it is completely
portable and requires minimal support equipment. However, in its current configuration on-
site use would be very diff~cult since the spraying of overhead surfaces is virtually
impossible w-ithout modifications to equipment design. Such modifications should be
pursued with the aid of one or more of the manufacturers of this type of apparatus.
The individual components of the sprayed FRP matenal must be optimized to provide the
best possible properties. This would include such issues as determining the best fiber and
resin iypes for both structural and durability performance. The existing combination of glass
fiber and polyester resin is not necessarily the best possible alternative. Unfortunately,
changing fiber types would require M e r equipment modification to eliminate the problems
associated with the other fibers available, including static buildup with carbon fiber and
cutting difficulties with ararnid.
Optimization of the resin may involve a couple of steps. First, the durability of the composite
resin must be investigated to ensure suffkient performance in the field. There is a vast array
of alternative resins available for different exposure conditions. Second, the choice of
coupling agent must be exarnined in order to maximize the FRP to concrete bond. Again, a
large selection of potential products are available, though performance will depend upon the
259

choice of composite resin. Finally, the possibility of combining the two resins should also be
considered. A composite resin with good bonding characteristics would certainly be
beneficial fkom an application perspwtive. Unfortunately, high bond strength resins tend to
be significantly more expensive as well. This was the original reason why a separate
coupling agent was originally chosen instead of simply using it as the composite resin.
One of the prirnary failure modes encountered in FRP retro fit of concrete structures is
debonding of the FRP. Though this problem is less cornmon with the sprayed FRP technique,
it does still exist. There is a definite need to investigate this interface to develop a better
understanding of the mechanisms involved in the debonding process and to identiQ methods
or materials that will assist in avoiding this issue altogether.
In this project, it was found that the sprayed FRP technique is not quite as effective as some
of the continuous fiber fabric or plate bonding techniques for flexural strengthening of
reinforced concrete beams. On the other hand, the sprayed material was found to be much
more effective in shear strengthening. In order to take advantage of the optimum
performance of both techniques, a hybrid system using continuous fiber materials and
sprayed F W at the same time would be feasible. An economic evaluation would be
necessary to determine whether such a hybrid system should be considered or if it would
simply be better to apply a thicker coating of the sprayed FRP.
The final step in deciding whether this is a useful rehabilitation technique is to determine its
ability to withstand the elements and other detrimental influences out there in the field. The
260

durability characteristics of the material must be fdly investigated. Of particular concem is
the FRP-concrete interface. One specific problem associated with the FRP-concrete interface
is the potential for moisture buildup along this interface due to the vast difference in
permeabilities between the two materials. In a freezing environment this could result in the
formation of an ice lense and lead to edoliation of the FRP reinforcement.
1. Chajes, M.J., T.A. Thomson, Jr., T. F. Januszka and W. W. Finch. Fl-ral Strengthening of Concrete Beams Using Externally Bonded Composite Materials. Construction and Building Materials, Vol. 8, No. 3, 1994, pp 19 1-20 1.
2. Ehsani, M.R. Rehabilitation of the inji-astructure with Advanced Composite Materials. Repair and Rehabilitation of the Infrastructure of the Americas, Proceedings, National Science Foundation, Mayaguez, Puerto Rico, 1994, pp 193-205.
3. Meier, U. Carbon Fibre-Reinforceci Polymers: Modem Materials in Bridge Engineering. Structural Engineering International, Vol. 1, No. 12, 1992, pp 7-12.
4. Ehsani, M.R. and H. Saadatmanesh. Fiber Composite Plates for Strengthening Bridge Beams. Composite Structures, Vol. 15, No. 4, 1990, pp 343-355.
5. Chajes, M.J., T.A. Thomson, Jr. and B. Tarantino. Reinforcement of Concrete Structures Using ExternaZZy Bon& Composite Materïals. Non-Metailic (Fm) Reinforcement for Concrete Structures, Proceedings of the Second International RILEM Symposium, REEM, Ghent, Belgiurn, 1995, pp 501-508.
6. Meier, U. and A. Winistorfer. Retrofiting of Structures ntrough Extemal Bonding of CFRP Sheets. Non-Metaiiic (FRP) Reinforcement for Concrete Structures, Proceedings of the Second International RILEM Symposium, W E M , Ghent, Belgium, 1995, pp 466-472.
7. Meier, U., M. Dewing, H. Meier and G. Schwegler. Strengthening of Structures with Advanced Composites. Alternative Materials for the Reinforcement and Prestressing of Concrete, Blackie Academic and Professional, Glasgow, UK, 1993, pp 153- 17 1.
8. Nanni, A. Concrete Repair with ExternaZZy Bonded FRP Reinforcement. Concrete International, Vol. 17, No. 6, June 1995, pp 22-26.
9. Nanni, A., M.S. Noms and N.M. Bradford. Lateral Confinement of Concrete Using FRP ReinfOrcement. Fiber-Reinforced-Plastic Reinforcernent for Concrete Structures, International Symposium, ACT, SP-l38,1993, pp 193-209.
10. Noms, M.S. and A. Nanni. Constmcîion and Repair of Concrete Members with FRP Reinforcement. Construction Technology Update, Adapted From Information Presented at the CIB '92 World Building Congres, National Research Council of Canada, 1993, Vol. 3, pp 2-3.

1 1. Triantafillou, T.C. and H. Plevrîs. Strengthening of RC Beams with Epoxy-Bonded Fiber- Composite Materials. Materials and Structures, Vol. 25, 1992, pp 20 1-2 1 1.
12. Al-Sulaimani, G.J., A. Sharif, I.A. Basunbul, M.H. Baluch, and B.N. Ghaleb. Shear Repair for Reinforced Concrete by Fiberglass Plate Bonding. AC1 Structural Journal, Vol. 9 1, NO. 3, July-August 1994, pp 458-464.
1 3. Shehâta, E., R. Morphy and S. Rizkalla. FRP as Shear Reinforcement for Concrete Structures. Presentation, 1997 AC1 Fall Convention , Atlanta, GA, U.S.A., November 9- 14, 1997.
14. Dorton, R.A. Development of Canadian Bridge Codes. Developments in Short and Medium Span Bridge Engineering, 4"' International Conference, CSCE, Halifax, NS, Canada, 1994, pp 1-12.
15. Bonneau, I., and B. Massicotte. Strengthening of Shear Deficient Reinforced Concrete Beams by Extemal Prestressing. Developments in Short and Medium Span Bridge Engineering, 4" International Conference, CSCE, Halifax, NS, Canada, 1994, pp 767-778.
16. Meier, U. and M. Deuring. The Application of Fibre Composites in Bridge Repair. Strasse und Verkehr, Vol. 77, No. 9, September 1991, pp 534-535.
17. Meier, U. and H. Kaiser. Strengthening of Structures with CFRP Laminates. Advanced Composites Materials in Cinl Engineering Structures, Proceedings of the Specialty Conference, ASCE, Las Vegas, NV, U.S.A., 199 1, pp 224-232.
18. Plevris, N. and T.C. TriantafiIlou. Time-Dependent Behavior of RC Members Strengthened with FRP Laminates. Journal of Stmctural Engineering, Vol. 120, No. 3, March 1994, pp 1016-1042 . Correction - Vol. 120, No. 6, June 1994, pp 1940.
1 9. Triantafillou, T.C. and N. Plevris. Post-Strengthening of W C Beams with Epoxy-Bonded Fibre Composite Materials. Advanced Composites Materials in Civil Engineering Structures, Proceedings of the Specialty Conference, ASCE, Las Vegas, NV, U.S.A., 199 1 , pp 245-256.
20. Berset, J.D. Strengthening of Reinforced Concrete Beams for Shear Using FRP Composites. M.Sc. Thesis, Department of Civil Engineering, Massachusetts hstitute of Technology, Cambridge, MA, U.S.A., 1992.

2 1. Tnantzfillou T.C. and N. Plevris. Reliability Analysis of Reinforced Concrete Beams Strengthened Mth CFRP Laminates. Non-Metaiïic (FRP) Reinforcement for Concrete Structures, Proceedings of the Second International RILEM Symposium, RILEM, Ghent, Belgium, 1995, pp 576-583.
22. Triantafillou, TC., N. Deskovic and M. Deuring. Strengthening of Concrete Shuctures with Prestressed Fiber Reinforced Plastic Sheets. AC1 Structural Journal, Vol. 89, No. 3, May-June 1992, pp 235-244.
23. Banthia, N., C. Yan and N. Nandakumar. Sprayed Fibre Reinforced Plastics (FRPs) for Repair of Concrete Structures. Advanced Composite Materials in Bridges and Structures, 2nd International Conference, CSCE, Montreal, QC, Canada, 1996, pp 537-545.
24. Banthia, N. et al. Repair and Retroft of Darnaged Concrete Structures Using Sprayed Fibre Reinforced Plastics. Department of Civil Engineering, University of British Columbia, Vancouver, BC, Canada, 1996.
25. Jones, R. and R.N. Swamy. Plate Bonding - m a t Can It Do to Your Bearns? Construction Repair, VoI. 9, No. 3, May-June 1995, pp 43-47.
26. Swarny, R.N., R. Jones and J.W. Bloxham. Structural Behavior of Reinforced Concrete Beams Strengthened by Epoxy-Bonded Steel Plates. The Structural Engineer, Vol. 65A, No. 2, Feb. 1987, pp 59-68.
27. Faza, S.S., H.V.S. GangaRao, and E.J. Barbero. Fiber Composite Wrap for Rehabilitation of Concrete Structures. Repair and Rehabilitation of the Infrastructure of the Americas, Proceedings, National Science Foundation, Mayaguez, Puerto Rico, 1994, pp 181-192.
28. MacDonald, M.D. and A. S. J. Calder. Bonded Steel Plating for Sheng~hening Concrete Structures. InternationaI Journal of Adhesion and Adhesives, Vol. 2, No. 2, A p d 1982, pp 119-127.
29. MacDonald, M.D. The Flaural Behaviour of Concrete Beams with Bonded Extemal Reinforcement. Supplementary Report 4 15, Transport and Road Research Laboratory, Crowthorne, UK, 1978.

30. Oehlers, D.J., M.S.M. Ali and W. Luo. Upgrading Continuous Reinforced Concrete Beams by GIuing Steel Plates to their Tension Faces. Journal of Structural Engineering, Vol. 124, No. 3, March 1998, pp 224-232.
3 1. Oehlers, D. J. Reinforced Concrete Beams With Plates Glued to their Soffis. Journal o f Structural Engineering, Vol. 1 18, No. 8, August 1992, pp 2023-2038.
32. Hussain, M., A. Sharif, I.A. Basunbul, M.H. Baluch and G.J. Al-Suiaimani. FZmral Behaviour of Precracked Reinforced Concrete Beams Strengthened Extemally by Steel Plates. AC1 Structural Journal, Vol. 92, No. 1, January-Februaq 1995, pp 14-22.
33. Kaushik, S.K., V.K. Gupta, S.K. Tomar, R.K. Luthra, S. Narayan and R. Verma. Performance of RC Beams Repoired with Extemal Plate Reinforcement. Rehabltation, Renovation and Repairs of Structures, International Conference, Tata McGraw-Hill, New Delhi, India, 1994, pp 124-132.
34. Meier, U., M. Deuring, H. Meier and G. Schwegler. CFRP Bonded Sheets. Fiber- Reinforced-Plastic (FRP) Reinforcement for Concrete Structures: Properties and Applications, A. Nanni, editor, Elsevier, New York, 1993, pp 435-434.
35. Meier, U., M. Deuring, H. Meier and G. Schwegler. Strengthening of Structures with CFRP Laminates: Research and Applications in Switzerland. Advanced Composite Materials in Bridges and Structures, 1st International Conference, CSCE, Sherbrooke, Québec, Canada, 1992, pp 243-25 1.
3 6. Malek, A.M. and H. Saadaûnanesh. Physical and Mechanical Properties of Typical Fibers and Resins. Fiber Composites in Infrastructure, Proceedings of the First International Conference, ICCI, Tucson, AZ, USA, 1996, pp 68-79.
37. Meier, U. Réparation des Ponts avec des Matériaux Composites Hautes Pe$ormances. Material und Technik, No. 4, 1987, pp 125-128. French]
38. Chajes, M.J., T.F. Januszka, D.R. Mertz, T.A. Thomson, Jr. and W.W. Finch. Shear Strengthening of Reinforced Concrete Beams Using Extemally Applied Composite Fabrics. AC1 Structural Journal, Vol. 92, No. 3, May-June 1995, pp 295-303.
39. Plevris, N., T.C. Triantafiliou and D. Veneziano. Reliability of RC Members Strengthened with C F W Laminates. Journal of Structural Engineering, Vol. 12 1, No. 7, July 1995, pp 1067-1044.

40. Triantafillou, TC. and N. Deskovic. Innovative Prestressing with FRP Sheets: Mechanics of Short-Tem Behavior. Journal of Engineering Mechanics, Vol. 117, No. 7, July 199 1, pp 1652-1 672.
4 1. Triantafillou, T.C. Shear Strengthening of Rein forced Concrete Beams Using Epoxy- Bonded FRP Composites. AC1 Structural Journal, Vol. 95, No. 2, March-Apnl 1998, pp 107-1 15.
42. Noms, T., H. Saadatmanesh and M.R Ehsani. Shear and Flexural Strengthening of WC Beams With Carbon Fiber Sheets. Journal of Structural Engineering, Vol. 123, No. 7, July 1997, pp 903-9 1 1.
43. Saadatmanesh, H. and M.R Ehsani. Fiber Composite P lates Can Strengthen Beams. Concrete International, Vol. 12, No. 3, March 1990, pp 65-71.
44. Saadatmanesh, H. and M.R. Ehsani. Flmral Strength of Externali'y Reinforced Concrete Beams. Sewiceability and Durability of Construction Materials, Proceedings of the First Materials Engineering Congress, ASCE, Denver, Colorado, U.S.A., 1 990, pp 1 1 52- 1161.
45. Char, M.S., H. Saadaûnanesh and M.R. Ehsani. Concrete Girders ExternalZy Prestressed With Composite Plates. PCI Journal, Vol. 39, No. 3, May-June 1994, pp 40-5 1.
46. Saadatmanesh, H. and M.R. Ehsani. RC Beams Strengthened with GFRP Plates. 1: Experimental Study. Journal of Structural Engineering, Vol. 1 17, No. 1 1, November 1991, pp 3417-3433.
47. An, W., H. Saadatrnanesh, and M.R. Ehsani. RC Beams Strengthened with FRP Plates. il: Anabsis and Parametric Study. Journal of Structural Engineering, Vol. 1 17, No. 1 1, November 199 1, pp 3434-3455.
48. Saadatmanesh, H. and A.M. Malek. Design Guidelines for FZexural Strengthening of RD Beams With FRP Plates. Journal of Composites for Construction, Vol. 2, No. 4, November 1998, pp 158-164.
49. Malek, A.M., H. Saadahnanesh and M.R. Ehsani. Prediction of the Failure Load of WC Beams Strengthened with FRP Plate Due to Stress Concentration at the Plate End. AC1 Structural Journal, Vol. 95, No. 2, March-Apnl 1998, pp 142- 152.

50. Malek, A.M. and H. Saadatmanesh. 07timate Shear Cupacity of Reinforced Concrete Beams Sh-engthened with Web-Bonded Fiber-Reinforced Plastic Plates. AC1 Structural Journal, Vof. 95, No. 4, July-August 1998, pp 391-399.
5 1. Malek, A.M. and H. Saadatmanesh. Anabtical Study of Reinforced Concrete Beams Strengrhened with Web-Bonded Fiber Reinforced Plastic Plates or Fabrics. AC1 Structural Journal, Vol. 95, No. 3, May-June 1998, pp 343-352.
52. Malek, A.M., H. Saadatmanesh and M.R. Ehsani. Shear and Normal Stresses in RC Beams Strengthened wirh FRP Plates. Advanced Composite Materials in Bridges and Structures, Proceedings of the Second International Conference, CSCE, Montréal, QU, Canada, 1996, pp 629-637.
53. Saadatmanesh, H. Fiber Composites for Nav and Existing Structures. AC1 Structural Journal, Vol. 9 1, No. 3, May-June 1994, pp 346-354.
54. ISIS. Strengthening Reinforced Concrete Structures with Externaiiy-Bonded Fibre Reinforced Polymers @raft). The Canadian Network of Centres of Excellence on Intelligent Sensing for Innovative Structures (ISIS), Winnipeg, MB, Canada, Spring 2000.
55. Swarny, R.N., R. Jones, A. Charif. Shear Adhesion Properties of Epoxy Resin Adhesives. Adhesion Between Polymers and Concrete, H.R. Sasse (Editor), RILEM, 1986, pp 741-755.
56. Ziraba, Y.N., M.H. Baluch, I.A. Basunbul, A.K. Azad, G.J. Al-Sulaimani and A. Sharif. Corn bined Experirnental-Numerical Approach to the Characterization of the Steel-Glue- Concrete Inteface. Materials and Structures, Vol. 28, 1 995, pp 5 1 8-525.
57. Jones, R., R N , Swamy, J. Bloxham and A. Bouderbalah. Composite Behavior of Concrete Beams with Epoxy Bonded ExternaZ Reinforcement. International Journal of Cernent Composites, Vol. 2, No. 2, 1980, pp 9 1- 107.
5 8. Bizindavyi, L. and K. W. Neale. Experimental and Theoretical Investigation of Transfer Lengths for Composite Laminates Bonded to Concrete. Proceedings, Annuai Conference of the CSCE, Sherbrooke, QC, Canada, May 27-30, 1997, pp 5 1-60.
59. FORCA Tow Sheets Technical Notes. Autocon Composites Inc., Noah York, ON, Canada, 1994.

60. Kobatake, Y., K. Kirnura and H. Katsumata. A Retrofitting Methoafor Reinforced Concrete Structures Using Carbon Fiber. Fiber-Reinforced-Plastic (FRP) Reinforcement for Concrete Structures: Properties and Applications, A. Nanni, editor, Elsevier, New York, 1993, pp 435-450.
6 1. Karbhari, V.M. and M. Engineer. Assessrnent of inteflacialfi-acture energy between concrete and glass reinforced composites. Journal of Materials Science Letters, Vol. 14, 1995, pp 1210-2213.
62. Karbhari, V.M., M. Engineer and D.A. Eckel II. On the durability of composite rehabiiitation schemes for concrete: use of a peel test. Journal of Materials Science, Vol. 32, 1997, pp 147- 156.
63. Karbhari, V.M. and M. Engineer. Effect of Environmental Exposure on the Extemal Strengthening of Concrete wîth Composites - Short Term Bond Durability. Journal of Reinforced Plastics and Composites, Vol. 15, December, 1996, pp 1 194- 12 16.
64. Homam, S.M., S.A. Sheikh and P.K. Mukhe rjee. Durability of Fibre Reinforced P o h e r (FRP) Wraps and Extemal FRP-Concrete Bond. Proceedings, CONSEC '01, Vancouver, BC, Canada, June, 200 1.
65. Chin, J.W., T. Nguyen and K. Aouadi. Eflects of Environmental Exposure on Fiber- Reinforced Plastic (FRP) Materials Used in Construction. Journal of Composites Technology & Research, Vol. 19, No. 4, October, 1997, pp 205-2 13.
66. Gomez, J. and B. Casto. Freeze-Thaw Durability of Composite Materials. Fiber Composites in Infrastructure, Proceedings of the First International Conference, ICCI, Tucson, AZ, USA, 1996, pp 947-955.
67. Fan, TC. Service Lijk andDurability of Composites. Fiber Composites in Infrastructure, Proceedings of the First International Conference, ICCI, Tucson, AZ, USA, 1996, pp 1021-1030.
68. Fyfe, E.R., R.J. Watson and S.C. Watson. Long Term Durability of Composites Based on Field Pe$omance and Laboratory Testing. Fiber Composites in Infrastructure, Proceedings of the First International Conference, ICCI, Tucson, AZ, USA, 1996, pp 982-995.

69. Chajes, M.J., T.A. Thomson, Jr. and C.A. Farschman. Durability of Concrete Beams Extemally Reinforced with Composite Fabrics. Construction and Building Materials, Vol. 9, No. 3, 1995, pp 141-148.
70. Chajes, M.J., D.R. Mertz, T.A. Thomson, Jr. and C.A. Farschman. Durability of Composite Material Reinforcement. Infrastructure: New Materials and Methods of Repair, Proceedings of the Third Materials Engineering Conference, ASCE, San Diego, California, U.S.A., 1994, pp 598-605.
7 1. Karbhari, V. M. and D.A. Eckel. Effect of Cold Regions Climate on Composite Jacketed Concrete Columns. Journal of Cold Regions Engineering, Vol. 8, No. 3, September 1994, pp 73-85.
72. Toutanji, H.A. and W. Gomez. Durability Charactenstics of Concrete Beams Externally Bonded with FRP Composite Sheets. Cernent and Concrete Composites, Vol. 19, No. 4, 1997, pp 351-358.
73. Katawaki, K., 1. Nishizaki and 1. Sasaki. Evaluation of the Durabiliv of Advanced Composites for Applications to Prestressed Concrete Bridges. Advanced Corn posite Materials in Bridges and Structures, 1st International Conference, CSCE, Sherbrooke, Québec, Canada, 1992, pp 1 19- 12%
74. Forde, M.C. and R.I. Mackie. Non-Destructive Evaluation of a Bonded Extemally Rein forced Bridge using the Frequency Response Function Method. Fiber Composites in Infrastructure, Proceedings of the First International Conference, ICCI, Tucson, AZ, LJSA, 1996, pp 1031-1038.
75. Hawkins, G.F., E.C. Johnson, D.A. Tingley and R.J. Leichti. Nondeshuctive Evaluation of Composites in Infastructure Applications. Fiber Composites in Infrastructure, Proceedings of the First International Conference, ICCI, Tucson, AZ, USA, 1996, pp 1039-1044.
76. Mehta, P.K. Concrete: Structure, Properties, and Materials. Prentics-Hall, New Jersey, NJ, USA, 1986.
77. Barbero, E.J. Introduction to Composite Materials Design. Taylor & Francis, Philadelphia, PA, USA, 1999.
78. Cox, H. L. The Elasticity and Strength of Paper and Other Fibrous Materials. British Journal of Applied Physics, Vol. 3, pp 72-79,1952.

79. Gibson, R.F. Principles of Composite Material Mechanics. McGraw-Hill, New York, NY, USA, 1994.
80. Chamis, CC. Simplz3ed composite micromechanics equations for m a l , thermal, and mechanicalproperties. SAMPE Quarterly, Vol. 14, April, 1984.
8 1. Gdoutos, E.E., K. Pilakoutas and C.A. Rodopoulos Failure Analysis of Industrial Composite Materials, McGraw-Hill, New York, NY, USA, 2000.
82. Hahn, H.T. On approximation for strength of randomfiber composites. Journal o f Composite Materials, Vol. 9, pp 3 16-326, 1975.
83. Halpin, J., and S.W. Tsai Effects of Environmental Factors on Composite Materials. Air Force Materials Lab - Technical Report 67-423, Department of Defense, USA, 1969.
84. Hull, D. An Introduction to Composite Materials. Cambridge university Press, Cambridge, UK, 198 1.
85. Bonacci, J.F. Strength, Failtire Mode and DefomabiZity of Concrete Bearns Strengthened Exremal!y with Advanced Composites. Advanced Composite Materials in Bridges and Structures, Proceedings of the Second International Conference, CSCE, Montréal, QC, Canada, 1996, pp 419-426.
86. Spadea, G., F. Bencardino and R.N. Swarny. Sfmctural Behavior of Composite RC Beams With ExternaZZy Bonded CFRP. Journal of Composites for Construction, Vol. 2, NO. 3, Aupst 1998, pp 132-137.
87. Hutchinson, A.R. and H. Rahirni. FZmral Strengthening of Concrete Beams with Externally Bonded FRP Reinforcement. Advanced Composite Materials in Bridges and Structures, Proceedings of the Second International Conference, CSCE, Montréal, QC, Canada, 1996, pp 5 19-526.
88. Heffernan, P.J. and M.A. Erki. Equivalent Capaciîy and Eflciency of Reinforced Concrete Beams Strengthened with Carbon Fibre Reinforced Plastic Sheets. Can adian Journal of Civil Engineering, Vol. 23, No. 1, February 1996, pp 2 1-29.
89. Nakamura, M., H. Sakai, K. Yagi and T. Tanaka. Expeninenfal Studies on the Flexural Reinforcing Eflect of Carbon Fiber Sheet Bonded to Reinforced Concrete Beam. Fiber Composites in Infrastructure, Proceedings of the First International Conference, ICCE, Tucson, AZ, USA, 1996, pp 760-773.

90. Bennett, K.J.. Strengthening by Carbon Fibre Tissue Bonding. Proceedings, Structural Faults & Repair, 8" Internationai Conference. London, UK, July 1999.
9 1. Chaallal, O, M.-J. Nollet and D. Perraton. Renforcement au cisaillement de poutres en béton armé par des lamelles composites collées à l'aide de résine époxy. Bulletin des Laboratories des Ponts et Chaussees, No. 212, 1997, pp 87-93. [French]
92. Sato, Y., T. Ueda, Y. Kakuta and T. Tanaka. Shear Reinforcing Eflect of Carbon Fiber Sheet Attached to Side of Reinforced Concrete Beams. Advanced Composite Materials in Bridges and Structures, Proceedings of the Second International Conference, CSCE, Montréal, QC, Canada, 1996, pp 62 1-628.
93. Deblois, M., A. Picard and D. Beaulieu. Renforcement de Poutres en Béton Armé à L 'Aide de Matériaux Composites: tud des niéorique et Expérimentale. Advanced Composite Materials in Bridges and Structures, 1st International Conference, CSCE, Sherbrooke, QC, Canada, 1992, pp 265-275. French]
94. Hisabe, N., H. Sakai and H. Ootaguro. Experimental Study on Carbon Fiber Sheet for Shear Strengthening. International Conference on Engineering Materiais, Proceedings, CSCE, Ottawa, ON, Canada, 1997, pp 557-564.
95. Paulay, T. and M.J.N. Pnestley. Seismic Design of Reinforced Concrete and Masonry Buildings. John Wiley & Sons, New York, NY, USA, 1992.
96. Lubin, G. Handbook of Composites. Van Nostrand Reinhold Company, New York, NY, USA, 1982.
97. Hollaway, L. Glass Reinforced Plastics in Construction: Engineering Aspects. Surrey University Press, Glasgow, UK, 1978.
98. Mander, J.B., M.J.N. Pnestley and R Park. neoretical Stress-Strain Model for Confied Concrete. Journal of Structural Engineering, Vol. 1 14, No. 8, August 1988, pp 1804- 1826.
99. Friedrich, K. Application of Fracture Mechanics to Composite Materials. Elsevier Science Publishers, Amsterdam, The Netherlands, 1989.
100. Morley, J.G. High-Performance Fibre Composites. Academic Press Limited, London, UK, 1987.

10 1. Ross, S. Evatuation of Deteriorated Reinforced Concrete Channel Beam Bridge Decks Retrofit with Glass Fibre Reinforced Polymers. M.Sc. Thesis, Department of Civil Engineering, University of British Columbia, Vancouver, BC, Canada, 2000.
102. Nilson, A.H. Design of Concrete Structures, 12" Edition. McGraw-Hill, Boston, MA, USA, 1997.
103. Mander, J.B., M.J.N. Priestley and R. Park. Obsewed Stress-Sirain Behavior of Confined Concreie. Journal of Structural Engineering, Vol. 1 14, No. 8, August 1988, pp 1827-1 849.
f 04. Gracey, J. Telephone conversation. Ashland Canada Inc., Vancouver, BC, Canada, October 1999
105. D E - - Epoxy Vinyl Ester Resins Technical Product Infornation Dow Chemical Company, Midland, MI, USA, 1995.
106. ~ d v a n t e x ~ Glass Fiber: A New Era in Composites Technology. Owens Coming, Toledo, OH, USA, 1997.
107. Lamb, D. E-mail communication. Master Builders, Inc., Cleveland, OH, USA, September 1999.
108. race@ Composite Sirengthening System. Master Builders, Inc., Cleveland, OH, USA, 1998.
109. Chawla, K.K. Composite Materials: Science and Engineering. Springer-Verlag, New York, NY, USA, 1987.

Material Property Testing Data

Table Al: Concrete compressive strength, 1
Mix TD
L
A
B
C
D
E
F
G
L
M
N
O
P
Q R
S
T
U
V
W
X
Y
Z
AA
AB
Specimen 1
47.6
46.9
42.7
49.1
42.8 .
41.8
71.6
46.4
51.8
60.4
55.1
48.6
44.3
45.5
44.7
48.3
53.8
56.0
50.1
51.0
54.0
51.5
53 .O
52.0
Compressive
Specimen 2
45.5
45.0
45.3
50.5
42.8
42.2
81.5
48.8
50.2
58.7
55.1
50.5
50.6
40.4
44.4
45.8
53.8
56.1
53.7
52.3
53 -4
55.0
56.7
53 -2
Strength @Pa)
Specimen 3
45.8
45.7
41.7
5 1.9
40.9
41.2
84.2
49. i
54.3
60.6
6 1.2
51.8
48.9
40.5
48.3
42.7
52.1
55.9
5 1.6
49.9
52.6
53.1
52.1
56.0
Average
46.3
45.9
43.2
50.5
42.2
41.7
79.1
48.1
52.1
59.9
57.1
50.3
47.9
42.1
45.8
45.6
53.2
56.0
5 1.8
51.1
53.3
53 -2
53.9
53.7

Table A2: Sprayed FRP I
Specimen ID
08 #1 08 #2 08 #3 08 #4 08 #5 08 #6
16 #lA 16 #2A 16 #4A 16 #SA 16 #4B 16 #5B 16 #6B
24 #1 24 #2 24 #3 24 #4 24 #5 24 #6
32 #l 32 #2 32 #3 32 #4 32 #5 32 #6
48 #l 48 #2
GU #2 GU #3 GU #4
Fiber Length (-1
Standard Deviation
m ' a )
Resin Q - P ~
C.O.V. W)
Average (MPa)
Polyester
Polyester
Polyester
Polyester
Polyester
Polyester 3-
Polyurethane

Table A3: Sprayed FRP - elastic modulus results.
Elastic Modulus
(GPa)
Standard Deviation
(GW
0.4 1
C.O.V. (%)
Polyester
Polyester
Polyester
Polyester
Polyester
Polyester +
Polyurethane

Table A4: Sprayed FRP tende property testing - ultimate strain results,
Standard Deviation
(%)
Specimen ID
Resin Type
Average (%)
C.O.V. ('w
Polyester
Polyester
Polyester
Polyester
Polyester
Polyester +
Polyurethane

Table
Fiber Length (mm)
Density 23C
(km3) 1288 1301 1285 1278 1279 1300
Standard Deviation
( k m 3 >
Specimen ID
1
08 #1 08 #2 08 #3 08 #4 08 #5 08 #6
16 #1 16 #2 16 #3 16 #4 16 #5 16 #6
24 #1 24 #2 24 #3 24 #4 24 #5 24 #6
32 #1 32 #2 32 #3 32 #4 32 #5 32 #6
48 #1 48 #2 48 #3 48 #4
GU #4 GU #5 GU #6
Polyester
Polyester
Polyester
Polyester
Polyester
Polyester +
Polyurethane

Specimen ID
Table A6: Sprayed FRP material property testing - fiber content results.
Fiber Length Resin
(mm) Type
8 1 Polyester
Polyester
Polyester
Polyester
Mass Volume Fraction Fraction Average
(%) ('w (%)

Calculation of Theoretical Tensile Strength of Sprayed FRP Composites
Mechanical Properties of Components
Glass Fiber Polyester Resin FRP Composite ahi (Tensile Strengthj 3450 MPa am" (Tensile Strenytt 45 MPa php Uitimate Density 1395 kglm3 Er (Elastic Modulus) 80.5 GPa Em (Elastic Modulus) 3.7 GPa v i (Poissan's Ratio) 0.22 vm (Poisson's Ratio) 0.38 di (Fiber Diameter) 11 pm rm (Shear Strength) 48 MPa Gi (Shear Modulus) 32.99 GPa Gm (Shear Modulus) 1.34 GPa Ar (Fi ber Area) 95.03 pm2
Determination of Expected Tensile Strength
Li Fiber
Length
Vr V v Cv R P fl L Fiber Void Voids Fiber diffusion Efficiency
Fraction Fraction Correctionseparation coeff. Factor (%) (%) ( 1 (iim) (lm2) ( )
Correction for Fiber Length
Lr hi F21 Fs ai a2 Ff r~ Ffrp Fiber Long. Transverse lP Shear Theoretical Measured
Length Strength Strength Strength Strength Strength Oifference (mm) ( M W ( M W ( M W ( 1 ( ) ( M W (MPa) (%)

Calculation of Theoretical Elastic Modulus of Sprayed FRP Composites
Mechanical Properties of Components
Glass Fiber Polyester Resln FRP Composite or (Tensile Strength) 3450 MPa am (Tensile Strengthl 45 MPa prrp Ultimate Density 1395 kglm3 €1 (Elastic Modulus) 80.5 GPa Em (Elastic Modulus) 3,7 GPa C 2 vr (Poisson's Ratio) 0.22 vm (Poisson's Ratio) 0.38 'l 0.874 di (Fiber Diameter) 11 pm Tm (Shear Strength) 48 MPa Gr (Shear Modulus) 32.99 GPa Gm (Shear Modulus) 1.34 GPa Ai (Fiber Area) 95.03 pm2
Determination of Expected Elastic Modulus
Lr Fiber
Length
VI Fiber
Fraction
(%)
v v
Void Fraction
(%)
V m R P '-IL
Matrix Fiber diffusion Efficiency Fraction Soparation coeff. Factor
(W (lm2) ( 1
Correction for Fiber Length
Lr El €2 S3 G12 v12 v21 A f f r ~ E f rp Fiber longitud. transverse TheoroticalMeasured
Length modulus modulus Modulus Modulus Difference (mm) (GP4 ( G W ( 1 (GPa) ( 1 ( ( ( G W (GPa) (W

Calculation of Theoretical Elastic Modulus of Sprayed FRP Composites
Mechanical Properties of Cornponents
Glass Fiber Polyester Resin FRP Composite or (Tensile Strength) 3450 MPa am (Tensile Strength: 45 MPa pirp Ultimate Density Er (Elastic Modulus) 80.5 GPa Em (Elastic Modulus) 3.7 GPa vf (Poisson's Ratio) 0,22 vm (Poisson's Ratio) 0.38 dl (f iber Diameter) 11 pm rm (Shear Strength) 48 MPa C 2 Gr (Shear Modulus) 32.99 GPa Gm (Shear Modulus) 1,34 GPa 7 0.874 Ar (Fiber Area) 95,03 t(m2
Determination of Expected Elastic Modulus
L f Fiber
Length
(mm)
Vf Vv Flber Void
Fraction Fraction
(%) (%)
Vm R P Matrix Fiber diffusion
Fraction Separation coeff.
(W (pm) (lm2)
Correction for Fiber Length
Li E 1 E2 Ef r~ Fiber longitud. transverseTheoretical Measured
Length modulus modulus Modulus Modulus Difference (mm) (GPa) (GPa) (GPa) (GPa) (%)
'l~ Eiiïciency
Factor
( )

Flexural Strengthening

orma mal Strength Concrete ( - 45 MPa) i
L
External Sprayed GFRP Reinforcement Testing Data Summary - Phase I
- Failure modes: Y = Rebar Yielding, S = Shear. C = Concrete Crushing, B = GFRP Bond. P = GFRP Plate
Beam ID
Peak Load (kN )
1
Initial Stiffness (kN/mm )
Lnergy Absorbed to Peak Load
(N-m)
Testing Condition
Retrofit âcheme
Failure Mode

-
Ail Beams
20 30 40 Deflection (mm)
20 Deflection (mm)

20 30 Deflection (mm)
Darnaged Bearn 1 1 Undamageci Bearnl
40 60 Defiecfion (mm)

10 20 30 40 Deflection (mm)
10 20 30 Deflection (mm)

150
125
100
s s 2 75 O 4
50
25
O O 10 20 30 40 50
Deflection (mm)
1 - Individual Beam 1 1 - Average l
- lndividual Beam - Averaae
I
Scheme D
O 20 40 60 80 100 Deflection (mm)

Shear Strengthening - Initial Study (Normal Strength Concrete)

' - Failure modes: Y = Rebar Yietding. S = Shear. C = Concrete Crushing, B = GFRP Bond. P = GFRP Plate
Extemal Sprayed GFRP Reinforcemenf Tesfing. Data Summary - Phase 2
Beam ID
l~ormal Strength Concrete ( - 45 MPa) 1
Peak Load (kN)
nergy Absorbe4 to Peak Load
(N-m)
Retrofit Scherne
Testing Condition
Failure Mode

r 1 Scheme A
4 6 8 Deflection (mm)
4 6 Oeflecfion (mm)

Scheme C
5 10 Deflection (mm)
10 15 Denecfion (mm)

1 Control Specirnens /
r/ 1 A v e r a g e
2 Deflection (mm)
Scherne A 1
4 6 8 Denecfion (mm)

i - Individual Beam 1 - Average 1
4 6 Deflection (mm)
1 Scherne C 1
5 10 Oeflecfion (mm)

r Scheme D
10 15 Deflection (mm)

Shear Strengthening - Initial Study (High Strength Concrete)

) ~ i g h Strength Concrete ( - 80 MPa) 1
Entemal Sprayed GFRP Reinforcement Tesünq Data Summary - Phase 2
Beam ID
" - Failure modes: Y = Rebar Yielding, S = Shear, C = Concrete Crushing, B = GFRP Bond, P = GFRP Plate
Fi F2 F3 F4 F5 G1 6 2 G3 G4
(kN ) (kN/mrn) (N-m) k
Peak Load
57 160 136 1 44 1 54 47
149 152 132
Initial Stiffness
21 .O 28.9 26.8 30.7 24.3 21 .O 25.5 27.8 27.0
Fnergy Absorbed to Peak Load
78 1228 870 674
1165 76
1198 785 ,
952
Control Damaged Damaged Damaged Undamaged Control Undamaged JJndamaged Darnaqed
Retrofit Scheme
Testing Condition
Failure Mode
None O D C D
None D C D
S P P B P S P P P
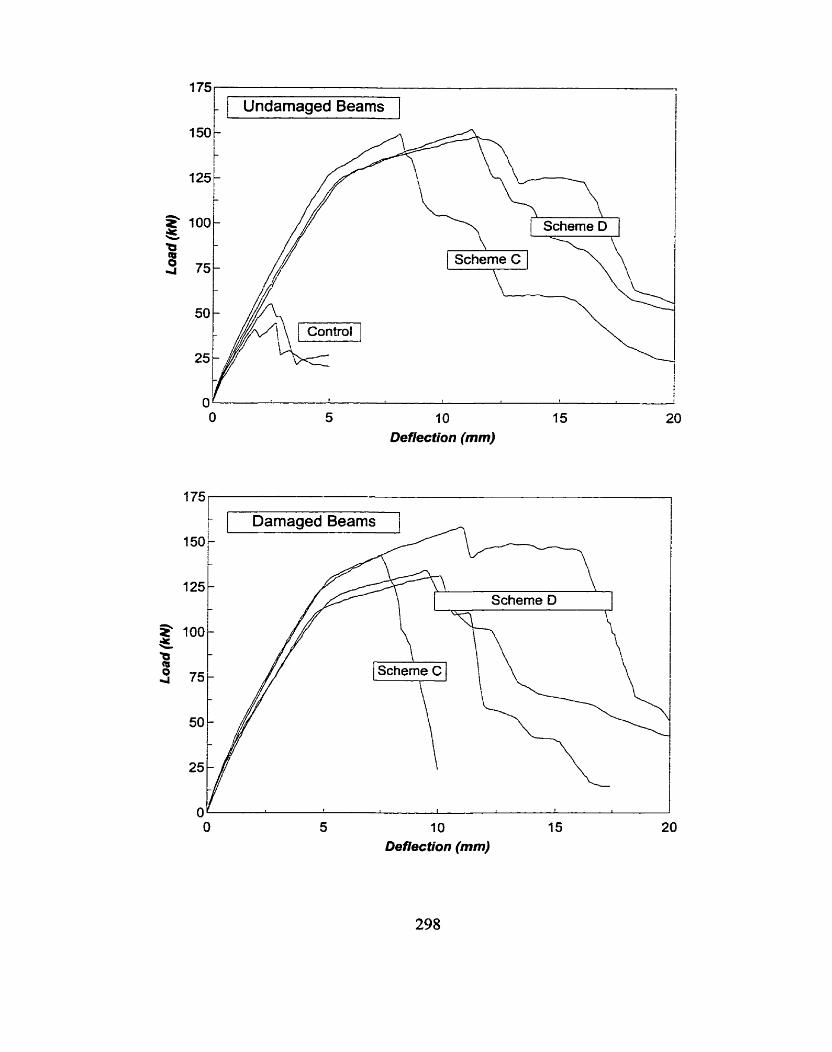
1 Undamaged Beams
10 Deflection (mm)
Damaged Beams 1
10 Deflection (mm)

1 Scheme C 1
5 10 Defiecfion (mm)
10 15 Defiection (mm)

/ Control Specimens 1
2 3 Deflection (mm)
Scheme C 1
1 - Individual Beam 1 / - Average
5 10 Deflection (mm)

O 5 10 15 20 25 Deffection (mm)

Shear Strengthening - Effect of FRP Strength

1 Extemal Sprayed GFRP Reinforcement 1
I~ormal Stren~th Concrete ( - 45 MPa) i
Tes- Data Summary - Phase 3
- Failure modes: Y = Rebar Yielding, S = Shear, C = Concrete Crushing. B = GFRP Bond. P = GFRP Plate
Notes: 1. A coupling agent (vinyl ester) was used to improve FRP - concrete bond. 2. FRP was applied in 3 layers, each consisting of 3 passes.
Beam ID
Retrofit Details
Peak Load (kN)
Initial Stiffness (kNimm)
Failure Mode
Retrofit Scheme
Energy Absorùed to Peak Load
(N-m)
Rebar Details

20 30 40 Deflection (mm)
4 6 8 Deflecfion (mm)

7 1 - Hooked Rebar 1
10 15 Deflection (mm)
10 15 Deffecfion (mm)

- Abbreviated FRP / - Full FRP
20 30 40 Deflection (mm)
2 3 Deflection (mm)

4 6 8 Deflection (mm)
10 15 Deffecfion (mm)

- Individual Beam - Average i
20 30 40 Denection (mm)

Shear Strengthening - Effect of FRP Thickness

l- Ekfemal Sprayed GFRP Reinforcement 1
- Failure modes: Y = Rebar Yielding, S = Shear, C = Concrete Cmshing. B = GFRP Bond, P = GFRP Plate
test in^ Data Summary - Phase 4
l!lsmsL 1. A coupling agent (vinyl ester) was used to irnprove FRP - concrete bond. 2. Previous standard application = 3 passes x 3 layers.
Beam 10
I ~ o m i a l Strength Concrete ( - 45 MPa) 1
Peak Load (kN)
Initial Stiffness (kN/mm)
Energy Absorbed Retrofit # Cayers x
#Passes to Peak Load
(N-m) Scheme
Average Thickness
(mm)
Faiiure Mode*
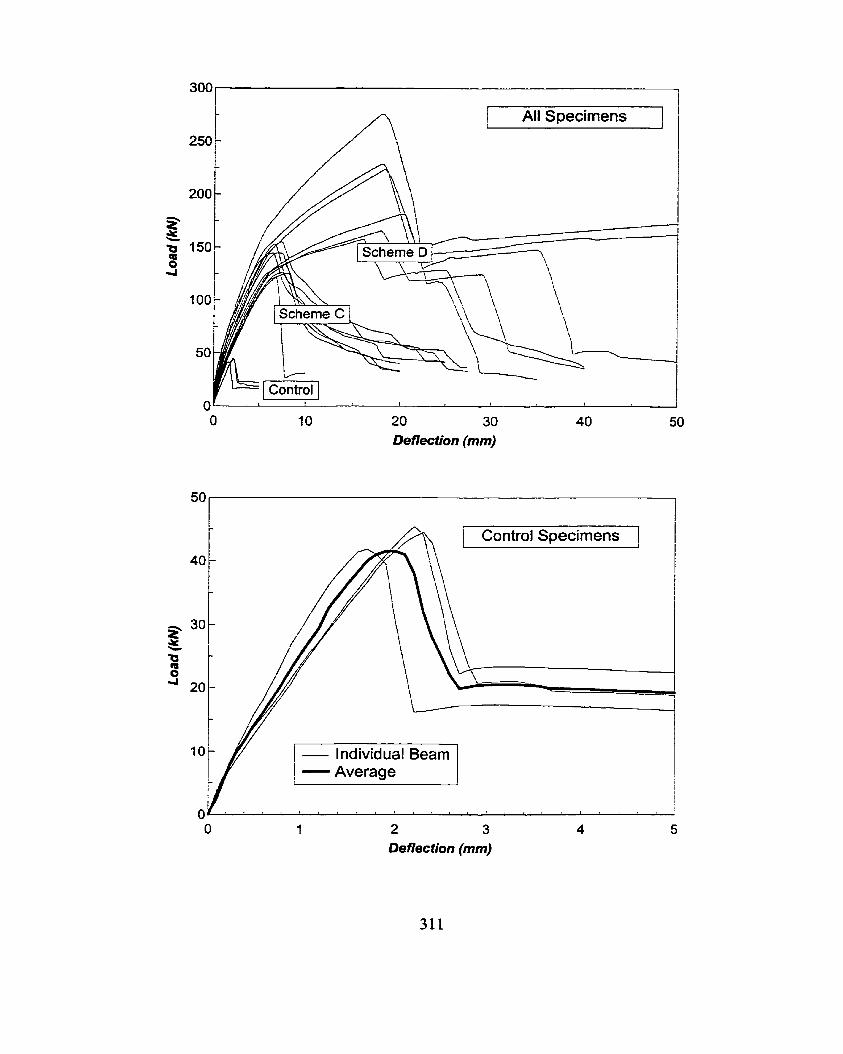
Al1 Specimens 1
20 30 Detlection (mm)
2 3 Deflection (mm)

i Scheme C-3 .5 mm 1
10 Deflection (mm)
10 Deflection (mm)

1 - Individual Beam 1 - Average
I O Deflection (mm)
1 O Defiecfion (mm)

Scheme D - 3.5 mm 1
20 Deffection (mm)

Shear Strengthening - Effect of Fiber Length

1 Extemal Spmyed GFRP Reinforcement 1
)~onnal Strength Concrete ( - 45 MPa) 1
Tèsting Data Summary - Phase 5
' - Failure modes: Y = Rebar Yielding, S = Shear, C = Concrete Cmshing, B = GFRP Bond, P = GFRP Plate
Beam ID
Fibre Length (mm)
Failure Mode
Peak Load (kN)
Notes: 1. A coupling agent (vinyl ester) was used to improve
FRP - concrete bond. 2. FRP was applied in 2 layers, each consisting of 3 passes.
- Previous standard application
L
# Rotor Blades
12 6 4 3 2
Fibre Length 8 mm 16 mm 24 mm 32 mm 48 mm
Initial Stiffness (kN/mm)
Energy Absorbed to Peak Load
(N-rn)
Retrofit Scheme

20 30 40 Defiection (mm)
1 Control Specimens 1
2 3 4 Deflecfion (mm)

1 Sche /1
2
3 E / - Individual Beam 1 1- Average 1
Deflection (mm)
5 10 15 Denection (mm)

10 Deflection (mm)
- Individual Beam - Average 1
20 30 40 Deflection (mm)

I 1 Scheme D - 24 mm ] 250 -
-
- Individual Bearn - Average
, ,
20 30 40 Deflection (mm)

Shear Strengthening - WrapBpray Cornparison

I Fabric Wrap GFRP Reinforcement 1
I~ormal Strength Concrete ( - 45 MPa) I
Testing Data Summary - Phase 6
- Failure modes: Y = Rebar Welding. S = Shear, C = Concrete Cmshing. B = GFRP Bond. P = GFRP Plate
N!m!z 1. A coupting agent (vinyl ester) was used to improve FRP - concrete bond.
Beam ID
Peak Load
Initial Energy Absorbec
(kN )
Fabric Fiber Stiffness
Prientatio~ to Peak Load
Layers
Retrofit Scherne
(kN1mm) (N-m)
Number of
Failure Mode

All Specirnens
100
75
50
25
O 6 8 10
Deflection (mm)
- lndividual Beam
2 3 Deflection (mm)

- - [ Scheme C i45 1 -
100 - - -
Deffection (mm)
O 2 4 6 8 10 12 14 16 Deffection (mm)

125- , 1 Scheme D 145 1
- 100 -
-
Deflecfion (mm)
Scherne D 0190
O 2 4 6 8 10 12 14 16 Deflecfhn (mm)

1 EkternaI Sprayed GFRP Reinforcement 1
l ~ o n n a l Strenqth Concrete ( - 45 MPa) 1
Tesfing Data Summary - Phase 6 L
- Failure modes: Y = Rebar Yielding. S = Shear, C = Concrete Crushing 6 = GFRP Bond. P = GFRP Plate
Beam ID
- 1. A coupling agent (vinyl ester) was used to improve FRP - concrete bond. 2. GFRP thickness = 3.5 mm for al1 beams. 3. Fibre Length = 48 mm.
Peak Load (kN)
Initial Stiffness (kN/rnm)
Energy Absorbet to Peak Load
(N-m)
Retrofit Scheme
Failure Mode

Ail Specimens 1
20 Deflection (mm)
1 Control Specirnens
2 3 Deflection (mm)

Scheme A 1
1
O 2 4 6 8 10 Deflecfion (mm)
/ Scheme C - Bond Failure 1
5 10 Deflection (mm)

- lndividual Bearn - Average
10 15 Deflection (mm)
Individual Beam 1
20 Denection (mm)

Rehabilitation of Full Scale Bridge Channel Beams

Figure Il: MOTH bridge charme1 beams - damage exarnple 1.
Figure 12: MOTH bridge channel bearns - damage exarnple 2.

Figure 13: MOTH bridge channel beams - damage example 3.
Figure 14: MOTH bridge channel beams - damage example 4.

Theoretical Analysis Data

GU 8 mm Fiber Length Eqn 2071 y=a+bx-~$~+dx~
CF AC! r2-r0.599513292 FitSdErr=0.215SS933 Fstat=:5222.362
- 0.002 0.004 O.Qû6
Strain ( )
8 mm Fiber Length Eqn 2071 y=a+ b x + c ~ ~ . ~ + d x ~
r2=0.999387322 OF Adj r2=0.999313058 FitStdErr=O 40221 1699 Fstat=18486.6971 a=l 3026633 b=8626.56
--- - c=-6523681 2dz30629216 60
- - -- - - - - -
O i --- -.
O 0.0025 0.005 0.0075 0.01 0.0 125 Strain ( )

16 mm Fiber Length Eqn 2039 y=a+bx+~x&dx*.~
r2=0.9999ûû84 DFAdj r2=0.9999!5&89 FilSldm.151852f24 Fstal=314934.ï79 a=0.69809509 b=10863.554
--- - - -. --- c-5677983 47 d=2033606.8
. 0- -- O 0.0025 0.005 0.0075 0.01 0.01 25
Strain ( )
24 mm Fiber Length Eqn 2071 y=a+bx+cx2.5+dx3
r2=0.999926306 DF Adj rZ=0.99991854S FitSldErr=0.234557474 Fstal=17639 a=0.33313942 b40892.662 r-54 18454.7 d=24495788
100 1 -- --- -. - - -- - -- - - - - - -
Strain ( )

32 mm Fiber Length Eqn 2039 y-=a+bx+cx&d~~~
r2=0.999940605 DF Adj r2=0.99993544 FitStdErr=0.2331518fS Fstam2637549ï3 a=0.75181198 b=12347.288 ~-633310.76 d=2283722.4
125 ; l
1 I
0.01 Strain ( )
48 mm Fiber Length Eqn 4341 y=a+bx+cx*+d~~-~+ex~
r2=0.999927889 DF Adj r2=0.999918401 FitStdErr=0.299343364 FstaL=135198.938 a=-0.9481 139 b=15445.11 c=-2478366.1
d=32184530 e=-1.3W6045&8 125 r --- --

Flexural Strengthening Beams - Control 2
Flexural Analysis Rebar Yielding Failure Assumed
Comp Concrete
Tension Steel
Neutral Axis
Strains 0.0040
0.0087
C
30.12343 mm
0.836 0.769
25.2 mm
Stresses Forces 100.000 kN
500.000 MPa 100.000 kN
SUM 0.0000 kN (Equi[= 0)
Mr Pult
Area of Steel (As) 200 mm2
Steel Strength (fy) 500 MPa
Beam Dimensions Steel Modulus (Es) b 96 mm 200 GPa d 96 mm Concrete Strength (f'c) h 125 mm 53.8 MPa
1 Shear Analysis 1 theta 41
fi 0.162 alphas 90
Area of Stirrups (Av) 50 mm2
Concrete Strength (f'c) 53.8 MPa
Pult 91.9 kN
Legend: Formuta Entered Value

Flexural Strengthening Beams - Scherne E Retrofit
Flexura 1 Analysis Concrete Crushing Failure Assumed
Strains Stresses Comp Concrete 0.0040
Tension Steel 0.0041 Bot frp 0.0069
Neutra1 c Axis 47.2751 mm
Beam Dimensions b 96 mm d 96 mm h 125 mm
dfb 129.0 mm
500.000 MPa 63.547 MPa
Area of Steel (As) 200 mm2
Steel Strength (fy) 500 MPa
Steel Modulus (Es) 200 GPa
Concrete Strength (f'c) 53.8 MPa
FRP TensiIe Strength (f'f) 104 MPa
Forces 156.938 kN
SUM 0.0000 kN (Equil = 0)
Mr 13.85 kN*m Pmax 92.30 kN
Thickness frp (tf) 8 mm
Area of Bottom frp (Afb) 896 mm2
FRP Stress-Strain Relationship Constants
a 0.751812 b 12147.29 c -633311 d 2283722 e O
theta 4 1 B 0.162
alphas 90
Puit 91.9 kN Area of Stirrups (Av)
50 mm2 Concrete Strength (f'c)
53.8 MPa Legend: Formula
Entered Value

Flexural Strengthening Beams - Scheme C Retrofit
Flexural Analysis Compression FRP Not lncluded - Concrete Cnishing Failure Assumed
Comp Concrete
Side frp Tension Steel
Bot frp
Neutra1 Axis
81 alpha1
a
Strains 0.01 17
0.0060 0.0066 0.0128
C
61 SI134 mm
0-797 0.746
49.0 mm
Beam Dimensions b 96 mm d 96 mm h 125 mm
dfb 129.0 mm
Stresses
57.478 MPa 500.000 MPa 94.962 MPa
Forces 243.474 kN
58.387 kN 100.000 kN 85.086 kN
Area of Steel (As) 200 mm2
Steel Strength (fy) 500 MPa
Steel Modulus (Es) 200 GPa
Concrete Strength (f'c) 69.4 MPa
FRP Tensile Strength (f'f) 104 MPa
SUM 0.0000 kN (Equil = 0)
Mr 20.06 kN*m Pmax 133.7 kN
Thickness frp (tf) 8 mm
Area of Side frp T (Afsb) 1016 mm2
Area of Bottorn frp (Afb) 896 mm2
FRP Stress-Strain Relationship Constants
a 0.751812 b 12147.29 c -63331 1 d 2283722 e G
1 Shear Analysis 1 theta 4 1
13 0.162 alphas 90 alphaf 45
s 75 mm dv 86.4 mm
Pult 724.4 kN Area of Stirrups (Av)
50 mm2 Concrete Strength (foc)
53.8 MPa Legend: Formula
Entered Value

Flexural Strengthening Beams - Scheme C Retrofit
Flexural Analysis Compression FRP included - Concrete Crushing Failure Assumed
Strains Comp Consete 0.01 1 T
Side frp 0.0059
Side frp 0.0075 Tension Steel 0.0088
Bot frp 0.01 58
Neutra1 c Axis 54.81813 mm
Bearn Dimensions b 96 mm d 96 mm h 125 mm
dfb 129.0 mm
Stresses
61 -425 MPa
67.291 MPa 500.000 MPa 106.355 MPa
Area of Steel (As) 200 mm2
Steel Strength (fy) 500 MPa
Steel Modulus (Es) 200 GPa
Concrete Strength (f'c) 69.4 MPa
FRP Tensile Strength (f'f) 104 MPa
FRP Modulus (€0 10.5 GPa
Forces 21 6.981 kN
53.875 kt4
SUM 0.0000 kN (Equil = 0)
Mr Pmax
Thickness frp (tf) 8 mm
Area of Side frp T (Afsb) 1123 mm2
Area of Bottom frp (Afb) 896 mm2
Area of Side frp C (Afst) 877 mm2
FRP Stress-Strain Relationship Constants
a 0.751812 b 12147.29 c -633311 d 2283722 e O
1 Shear Analysis 1
theta 41 i3 0.162
alphas 90 alphaf 45
s 75 mm dv 86.4 mm
Area of Stirrups (Av) 50 mm2
Concrete Strength (f'c) 53.8 MPa
vrg 362.2 kN
Pult 724.4 kN
Legend: Formula Entered Value

Flexural Strengthening Beams - Scheme C Retrofit
Flexural Anatysis Compression FRP lncluded - GFRP Tension Failure Assumed
Strains Cornp Concrete 0.0105
Side frp 0,0053
Side frp 0,0068 Tension Steel 0 -0080
Bot frp 0.01 52
Neutrai c Axis 54.5202 mm
Beam Dimensions b 96 mm d 96 mm h 125 mm
dfb 129.0 mm
Stresses
55.315 MPa
Forces 21 5.802 kN 48.252 kN
62.846 MPa 70.870 kN 500.000 MPa 100.000 kN 104.000 MPa 93.1 84 kN
SUM 0.0000 kN (€quit= 0)
Mr Pmax
Area of Steel (As) 200 mm2
Steel Strength (fy) 500 MPa
Steei ModuIus (Es) 200 GPa
Concrete Strength (f'c) 69.4 MPa
FRP Tensile Strength (f'f) 104 MPa
FRP Modulus (Ef) 10.5 GPa
Thickness frp (tf) 8 mm
Area of Side frp T (Afsb) 1128 mmz
Area of Bottom frp (Afb) 896 mm2
Area of Side frp C (Afst) 872 mmz
FRP Stress-Strain Relationship Constants
a 0.751812 b 12147.29 c -63331 1 d 2283722 e O
1 Shear Analysis 1
theta 41 13 0.162
alphas 90 alphaf 45
s 75 mm dv 86.4 mm
Area of Stimps (Av) 50 mm2
Concrete Strength (f'c) 53.8 MPa
Pult 724.4 kN
Legend: Formula Entered Value

Flexural Strengthening Beams - Scheme D Retrofit
Flexural Analysis Compression FRP Not lncluded - Concrete Crushing Failure Assumed
Strains Comp Concrete 0.01 01
Tension Side frp 0.0069 Steel 0.0082 Bot frp 0.0145
Neutral c Axis 52.94105 mm
Beam Dimensions b 96 mm d 96 mm h 125 mm
dfb 129.0 mm
Stresses Forces 263.974 kN
63.272 MPa 72.948 kN 500.000 MPa 100.000 kN 101.591 MPa 91 -025 kN
SUM 0.0000 kN (Equil = 0)
Area of Steel (As) 200 mm2
Steel Strength (fy) 500 MPa
Steel Modutus (Es) 200 GPa
Concrete Strength (f'c) 107.6 MPa
FRP Tensile Strength (f'f) 104 MPa
Mr 22.93 kN-rn Pmax 152.9 kN
Thickness frp (tf) 8 mm
Area of Side frp (Afsb) 1153 mm2
Area of Bottom frp (Afb) 896 mm2
FRP Stress-Strain Relationship Constants
a 0,751812 b 12147.29 c -633311 d 2283722 e O
1 Shear Analysis 1 theta 41
fi 0.162 alphas 90 alphaf 45
s 75 mm dv 86.4 mm
Pult 724.4 kN Area of Stimps (Av)
50 mm2 Concrete Strength (f'c)
53.8 MPa Legend: Formula
Entered Value

Flexural Strengthening Beams - Scheme D Retrofit
Flexural Analysis Compression FRP lncluded - Concrete Crushing Faiiure Assumed
Strains TOP frp 0.01 11
Comp Concrete 0.01 01 Side frp 0-0051
Side frp 0.01 10 Tension Steel 0.0146
Bot frp 0.0230
Stresses 116.841 MPa
53.025 MPa
86.761 MPa 500.000 MPa 128.461 MPa
Forces 104.689 kN 196.012 kN 33.351 kN
Neutral c Axis 39.31095 mm
Beam Dimensions b 96 mm d 96 mm h 125 mm
dfb 129.0mm
Area of Steel (As) 200 mm2
Steel Strength (fy) 500 MPa
Steel Modulus (Es) 200 GPa
Concrete Strength (Tc) 107.6 MPa
FRP Tensile Strength (f'f) 104 MPa
FRP Modulus (Ef) 10.5 GPa
SUM 0.0000 kN (Equil = 0)
Thickness frp (tf) 8 mm
Area of Side frp T (Afsb) 1371 mm2
Area of Bottom frp (Afb) 896 mm2
Area of Top frp (Aft) 896 mm2
Area of Side frp C (Afst) 629 mm2
FRP Stress-Strain Relationship Constants
a 0-751812 b 12147.29 c -633311 d 2283722 e O
I - - --
Shear Analvsis 1
theta 41 13 0.162
alphas 90 alphaf 45
s 75 mm dv 86.4 mm
Pult 724.4 kN Area of Stimips (Av)
50 mm2 Concrete Strength (f'c)
53.8 MPa Legend: Formula
Entered Value

Flexural Strengthening Beams - Scheme D Retrofit
Flexural Analysis Compression FRP lncluded - GFRP Tension Failure Assumed
Strains TOP frp 0.0069
Comp Concrete 0-0063 Side frp 0.0032
Side frp 0.0069 Tension Steel 0.0092
Bot frp 0.01 52
Stresses 72.974 MPa
33.097 MPa
63.698 MPa 500.000 MPa 104.000 MPa
Forces 65.384 kN
1 94.71 6 kN 20.679 kN
Neutral c Axis 39.051 18 mm
Beam Dimensions b 96 mm d 96 mm h 125 mm
dfb 129.0 mm
Area of Steel (As) 200 mm2
Steel Strength (fy) 500 MPa
Steel Modulus (Es) 200 GPa
Concrete Strength (f'c) 107.6 MPa
FRP Tensile Strength (f'f) 104 MPa
FRP Modulus (Ef) 10.5 GPa
- - - - - - - - - -
SUM 0.0000 kN (Equil = 0)
Mr 26.37 kNm Pmax 175.8 kN
Thickness frp (t) 8 mm
Area of Side frp T (Afsb) A375 mm2
Area of Bottorn frp (Afb) 896 mm2
Area of Top frp (Aft) 896 mm2
Area of Side frp C (Afst) 625 mmz
FRP Stress-Strain Relationship Constants
a 0.751812 b 12147.29 c -633311 d 2283722 e O
1 Shear Analysis j
theta 4 1 IS 0.162
alphas 90 alphaf 45
s 75 mm dv 86.4 mm
Area of Stirrups (Av) 50 mm2
Concrete Strength (f'c) 53.8 MPa
vrg 362.2 kN
Pult 724.4 kN
Legend: Formula Entered Value 1

Shear Strengthening Beams - Control
Flexural Analysis Rebar Yielding Failure Assumed
Strains Comp Concrete 0.0040
Stresses Forces 200.000 kN
Steel 0.0027 500.000 MPa 200.000 kN
Neutral c Axis 59.67933 mm
Rl 0.834 alphal 0.768 Area of Steel (As)
400 mm2 a 49.8 mm Steel Strength (fy)
500 MPa Beam Dimensions Steel Modulus (Es)
b 96 mm 200 GPa d 100 mm Concrete Strength (f'c) h 125 mm 54.5 MPa
SUM 0.0000 kN (€quit= 0)
Mr 15.02 kN-rn Pmax 100.2 kN
-- -
1 Shear Analysis 1
theta 32 R 0.263
alphas 90
Area of Stimps (Av) O mm2
Concrete Strength (f'c) 54.5 MPa
Pult 43.6 kN
Legend: Formula Entered Value

Shear Strengthening Beams - Scheme A Retrofit
Flexural Analysis Compression FRP Not lncluded - Concrete Crushing Failure Assumed
Strains Comp Concrete 0.0040
Tension Side frp 0.0020 Steel 0.0024
Neutral c Axis 62.85786 mm
Stresses
24.488 MPa 500.000 MPa
81 0.834 alpha1 0.768 Area of Steel (As)
400 mmz a 52.4 mm Steel Strength (S)
500 MPa Beam Dimensions Steel Modulus (Es)
b 96 mm 200 GPa d 100 mm Concrete Strength (f'c) h 125 mm 54.5 MPa
FRP Tensile Strength (f'f) 108 MPa
Forces 21 0.652 kN
SUM 0.0000 kN (€quit= 0)
Mr 15.48 kN-m Pmax 103.2 kN
Thickness frp (ff) 3.5 mm
Area of Side frp (Afsb) 435 mm2
FRP Stress-Strain Relationship Constants
a -0.9481 139 b l W S . l l c -2478366.1 d 32184530 e -1.30E+08
1 Shear Analysis 1
theta 32 l3 0.263
alphas 90 a!phaf 45
s 75 mm dv 90 mm
Area of Stimps (Av) O mm2
Concrete Strength (f'c) 54.5 MPa
Pult 391 .l kN
Legend: Formula Entered Value

Shear Strengthening Beams - Scheme A Retrofit
Flexural Analysis Compression FRP lncluded - Concrete Crushing Failure Assumed
Comp Concrete Side frp
Tension Side frp Steel
Neutra1 Axis
S trains 0.0040 0.0020
0.0021 0.0026
C
60.27445 mm
0.834 0.768
50.3 mm
Beam Dimensions b 96 mm d 100 mm h 125 mm
Stresses
23.600 MPa
Forces 20 1.994 kN
9.957 kN
26.379 MPa 11.952 kN 500.000 MPa 200.000 kN
SUM 0.0000 kN (Equil: = 0)
Mr 15.73 kN*m Pmax 104.9 kN
Area of Steel (As) 400 mm2
Steel Strength (fy) 500 MPa
Steel Modulus (Es) 200 GPa
Concrete Strength (f'c) 54.5 MPa
FRP Tensile Strength (f'f) 108 MPa
FRP Modulus (Ef) 11.8 GPa
Thickness frp (tf) 3.5 mm
Area of Side frp T (Afsb) 453 mm2
Area of Side frp C (Afst) 422 mm2
FRP Stress-Strain Relationship Constants
a -0.9481139 b 15445.11 c -2478366.1 d 32184530 e -i.30E+08
1 S hear Analysis 1
theta 32 13 0.263
alphas 90 alphaf 45
s 75 mm dv 90 mm
Area of Stimps (Av) O mm2
Concrete Strength (f'c) 54.5 MPa
Vrg 195.6 kN
Pult 391 -1 kN
Legend: Formula

Shear Strengthening Beams - Scheme C Retrofit
Flexural Analysis Compression FRP Not lncluded - Concrete Cnishing failure Assumed
Strains Comp Concrete 0,0071
Side frp 0.0034 Tension Steel 0.0040
Bot frp 0.0070
Neutral c Axis 63.86476 mm
Beam Dimensions b 96 mm d 100 mm h 125 mm
dfb 126.8 mm
Stresses
39.465 MPa 500.000 MPa 72.847 MPa
Area of Steel (As) 400 mm2
Steel Strength (Q) 500 MPa
Steel Modulus (Es) 200 GPa
Concrete Strength (f'c) 65.4 MPa
FRP Tensile Strength (f'f) 108 MPa
Forces 243.150 kN
SUM 0.0000 kN (Equii = 0)
Mr 18.66 k N m Pmax 124.4 kN
Thickness frp (tf) 3.5 mm
Area of Side frp T (Afsb) 428 mm2
Area of Bottom frp (Afb) 361 mm2
FRP Stress-Strain Relationship Constants
a -0.9481 139 b 15445.11 c -2478366.1 d 32184530 e -1.30E+08
1 Shear Analysis 1 theta 32
13 0.263 alphas 90 alphaf 45
s 75 mm dv 90 mm
Pult 391.1 kN Area of Stirrups (Av)
O mm2 Concrete Strength (f'c)
54.5 MPa Legend: Formula
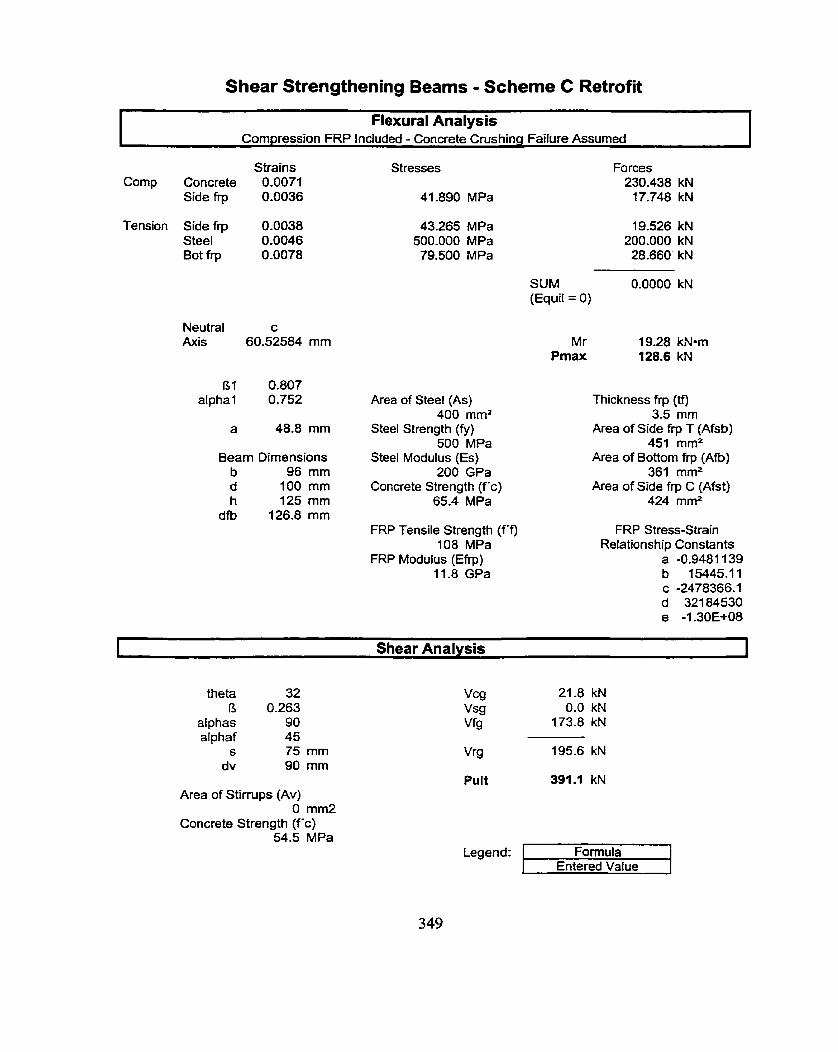
Shear Strengthening Beams - Scheme C Retrofit
Flexural Analysis Compression FRP lncluded - Concrete Crushinq Failure Assumed
Strains Comp Concrete 0.0071
Side frp 0.0036
Tension Side frp 0.0038 Steel 0.0046 80t frp 0.0078
Stresses
41 -890 MPa
43.265 MPa 500.000 MPa 79.500 MPa
Forces 230.438 kN
17.748 kN
Neutral c Axis 60.52584 mm
Beam Dimensions b 96 mm d 100 mm h 125 mm
dfb 126.8 mm
Area of Steel (As) 400 mm2
Steel Strength (fy) 500 MPa
Steel ModuIus (Es) 200 GPa
Concrete Strength (f'c) 65.4 MPa
SUM 0.0000 kN (Equil = 0)
Mr 19.28 kNam Pmax 128.6 kN
Thickness frp (tf) 3.5 mm
Area of Side frp T (Afsb) 451 mmz
Area of Bottom frp (Afb) 361 mm2
Area of Side frp C (Afst) 424 mm2
FRP Tensile Strength (f'f) FRP Stress-Strain 108 MPa Relationship Constants
FRP Modulus (Efrp) a -0.9481 139 11.8 GPa b 15445.11
c -2478366.1 d 32184530 e -1.30E+08
1 Shear Analysis 1
theta 32 13 0.263
alphas 90 alphaf 45
s 75 mm dv 90 mm
Area of Stirrups (Av) O mm2
Concrete Strength (f'c) 54.5 MPa
Legend: Formula Entered Value

Shear Strengthening Beams - Scheme D Retrofit
Flexural Analysis Compression FRP Not lnciuded - Concrete Cmshing Failure Assumed
Strains Comp Concrete 0.0083
Side frp 0-0048 Tension Steel 0.0060
Bot frp 0.0098
Neutral c Axis 58.1 9268 mm
Beam Dimensions b 96 mm d 100 mm h 125 mm
dfb 126.8 mm
Stresses
52.699 MPa 500-000 MPa 95.438 MPa
Area of Steel (As) 400 mm2
Steel Strength (fy) 500 MPa
Steel ModuIus (Es) 200 GPa
Concrete Strength (f'c) 84.5 MPa
FRP Tensile Strength (f'f) 108 MPa
Forces 259.050 kN
SUM 0.0000 kN (Equil = 0)
Mr 20.90 kN*m Pmax 139.3 kN
Thickness frp (tf) 3.5 mm
Area of Side frp T (Afsb) 468 mm2
Area of Bottom frp (Afb) 361 mm2
FRP Stress-Strain Relationship Constants
a -0.9481139 b 15445.11 c -2478366.1 d 32184530 e -1.30E+08
1 Shear Analysis 1
theta 32 B 0.263
alphas 90 alphaf 45
s 75 mm dv 90 mm
Area of Stirrups (Av) O mm2
Concrete Strength (f'c) 54.5 MPa
vrg 195.6 kN
Pult 391.1 kN
Legend: Formula

Shear Strengthening Beams - Scheme D Retrofit
Ffexural Analysis Compression FRP lncluded - Concrete Cnrshing Failure Assumed
Strains TOP f r ~ 0.0086
Comp Concrete 0.0083 Side frp 0.0042
Side frp 0.0062 Tension Steel 0.0083
Bot frp 0.0 1 28
Neutra1 c Axis 49.90161 mm
Beam Dimensions b 96 mm d 100 mm h 125 mm
dfb 126.8 mm
Stresses 101.375 MPa
48.970 MPa
66.272 MPa 500.000 MPa 113.604 MPa
Area of Steel (As) 400 mm2
Steel Strength (fy) 500 MPa
Steel Modulus (Es) 200 GPa
Concrete Strength (f'c) 84.5 MPa
FRP Tensile Strength (f'f) 108 MPa
FRP Modulus (Et) 11.8 GPa
Forces 36.546 kN
222.141 kN 17.106 kN
SUM 0.0000 kN (Equil = 0)
Mr 23.74 kNm Pmax 158.3 kN
Thickness frp (tf) 3.5 mm
Area of Side frp T (Afsb) 526 mm2
Area of Bottom frp (Afb) 361 mm2
Area of Top frp (Aft) 361 mm2
Area of Side frp C (Afst) 349 mm2
FR? Stress-Strain Relationship Constants
a -0.9481 139 b 15445.11 c -2478366.1 d 32184530 e -1.30€+08
1 Shear Analysis 1 theta 32
C3 0.263 alphas 90 alphaf 45
s 75 mm dv 90 mm
Pult 391.1 kN Area of Stirmps (Av)
O mm2 Concrete Strength (f'c)
54.5 MPa Legend: Formula
Entered Value

Shear Strengthening Beams - Scheme D Retrofit
Flexuraf Analysis Compression FRP lncluded - GFRP Tension Failure Assumed
Strains Top frp 0.0316
Comp Concrete 0.01 12 Side frp 0.0056
Tension Side frp 0.0089 Steel 0.01 20 Bot frp 0.01 86
Neutral c Axis 48.27756 mm
Beam Dimensions b 96 mm d 100 mm h 125 mm
dfb 126.8 mm
Stresses 136.845 MPa
66.029 MPa
88.677 MPa 500.000 MPa 108.000 MPa
Area of Steel (As) 400 mm2
Steel Strength (fy) 500 MPa
Steel Modulus (Es) 200 GPa
Concrete Strength (f'c) 84.5 MPa
FRP Tensile Strength (f'f) 108 MPa
FRP Modulus (Ef) 11.8 GPa
Forces 49.333 kN
214.912 kN 22-31 4 kN
47.625 kN 200.000 kN
38.934 kN
SUM 0.0000 kN (Equil = 0)
Mr 24.74 kNam Pmax 164.9 kN
Thickness frp (tf) 3.5 mm
Area of Side frp T (Afsb) 537 mm2
Area of Bottom frp (Afb) 361 mm2
Area of Top frp (Aft) 361 mm2
Area of Side frp C (Afst) 338 mm2
FRP Stress-Strain Relationship Constants
a -0.9481 1 39 b 15445.11 c -2478366.1 d 32184530 e -1.30E+08
1 Shear Analysis 1
theta 32 l3 0.263
alphas 90 alphaf 45
s 75 mm dv 90 mm
Area of Stimps (Av) O mm2
Concrete Strength (f'c) 54.5 MPa
Legend: Formula Entered Value


