Embed Size (px)
Citation preview
UNIT –II
NETWORK ANALYSIS
Network analysis is one of the most popular techniques used for planning, scheduling, monitoring and
coordinating large and complex projects comprising a number of activities. It involves the development
of a network to indicate logical sequence of work content elements of a complex situation. It involves
three basic steps:
1. Defining the job to be done
2. Integrating the elements of the job in a logical time sequence
3. Controlling the progress of the project.
Network analysis is concerned with minimizing some measure of performance of the system such as the
total completion time for the project, overall cost and so on. By preparing a network of the system, a
decision maker can identify,
(i) The physical relationship (properties) of the system
(ii) The inter relationships of the system components
Network analysis is especially suited to project which are not routine or repetitive and which will be
conducted only once or a few times.
Objectives:
Network analysis can be used to serve the following objectives:
1. Minimization of total time: Network analysis is useful in completing a project in the minimum possible
time. A good example of this objective is the maintenance of production line machinery in a factory. If
the cost of down time is very high, it is economically desirable to minimize time despite high resource
costs.
2. Minimization of total cost: Where the cost of delay in the completion of the project exceeds cost of extra
effort, it is desirable to complete the project in time so as to minimize total cost.
3. Minimization of time for a given cost: When fixed sum is available to cover costs, it may be preferable
to arrange the existing resources so as to reduce the total time for the project instead of reducing total
cost.
4. Minimization of cost for a given total time: When no particular benefit will be gained from completing
the project early, it may be desirable to arrange resources in such a way as to give the minimum cost for
the project in the set time.
5. Minimization of idle resources: The schedule should be devised to minimize large fluctuations in the
use of limited resources. The cost of having men/machines idle should be compared with the cost of
hiring resources on a temporary basis.

6. Network analysis can also be employed to minimize production delays, interruptions and conflicts.
Managerial Applications:
Network analysis can be applied to very wide range of situations involving the use of time, labour and
physical resources. Some of the more common applications of network analysis in project scheduling
are as follows:
1. Construction of bridge, highway, power plant etc.
2. Assembly line scheduling.
3. Installation of a complex new equipment. Eg. Computers, large machinery.
4. Research and Development
5. Maintenance and overhauling complicated equipment in chemical or power plants, steel and petroleum
industries, etc.
6. Inventory planning and control.
7. Shifting of manufacturing plant from one site to another.
8. Development and testing of missile system.
9. Development and launching of new products and advertising campaigns.
10. Repair and maintenance of an oil refinery.
11. Construction of residential complex.
12. Control of traffic flow in metropolitan cities.
13. Long range planning and developing staffing plans.
14. Budget and audit procedures.
15. Organization of international conferences.
16. Launching space programmes, etc.
A network is a graphic representation of a project’s operations and is composed of activities and events
(or nodes) that must be completed to reach the end objective of a project, showing the planning sequence
of their accomplishments, their dependence and inter relationships.
Network Diagram Representation
In a network representation of a project certain definitions are used
1. Activity
Any individual operation which utilizes resources and has an end and a beginning is called activity.
An arrow is commonly used to represent an activity with its head indicating the direction of progress
in the project. These are classified into four categories
1. Predecessor activity – Activities that must be completed immediately prior to the start of another activity
are called predecessor activities.
2. Successor activity – Activities that cannot be started until one or more of other activities are completed
but immediately succeed them are called successor activities.
3. Concurrent activity – Activities which can be accomplished concurrently are known as concurrent
activities. It may be noted that an activity can be a predecessor or a successor to an event or it may be
concurrent with one or more of other activities.
4. Dummy activity – An activity which does not consume any kind of resource but merely depicts the
technological dependence is called a dummy activity.
The dummy activity is inserted in the network to clarify the activity pattern in the following two situations
• To make activities with common starting and finishing points distinguishable
• To identify and maintain the proper precedence relationship between activities that is not connected by
events.
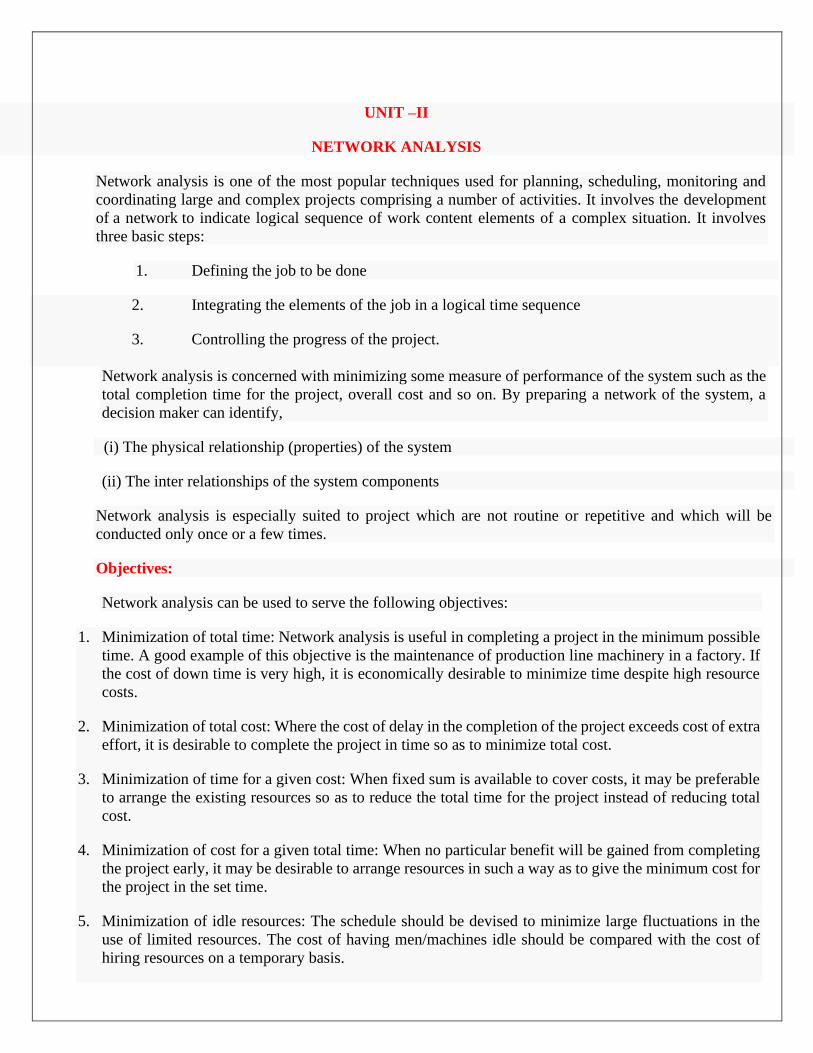
For example, consider a situation where A and B are concurrent activities. C is dependent on A and D is
dependent on A and B both. Such a situation can be handled by using a dummy activity as shown in the figure.
2.Event
An event represents a point in time signifying the completion of some activities and the beginning of new ones.
This is usually represented by a circle in a network which is also called a node or connector.
The events are classified in to three categories
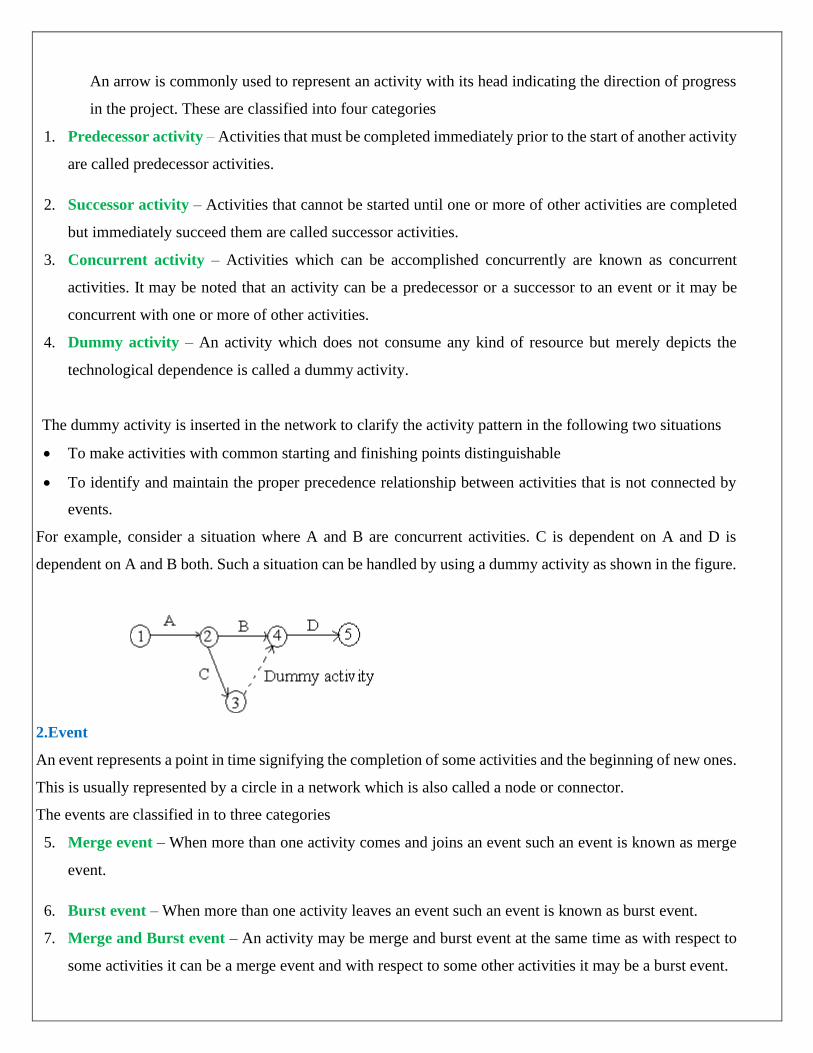
5. Merge event – When more than one activity comes and joins an event such an event is known as merge
event.
6. Burst event – When more than one activity leaves an event such an event is known as burst event.
7. Merge and Burst event – An activity may be merge and burst event at the same time as with respect to
some activities it can be a merge event and with respect to some other activities it may be a burst event.
2. Sequencing
The first prerequisite in the development of network is to maintain the precedence relationships. In order to
make a network, the following points should be taken into considerations
• What job or jobs precede it?
• What job or jobs could run concurrently?
• What job or jobs follow it?
• What controls the start and finish of a job?
Since all further calculations are based on the network, it is necessary that a network be drawn with full care.
Rules for Drawing Network Diagram
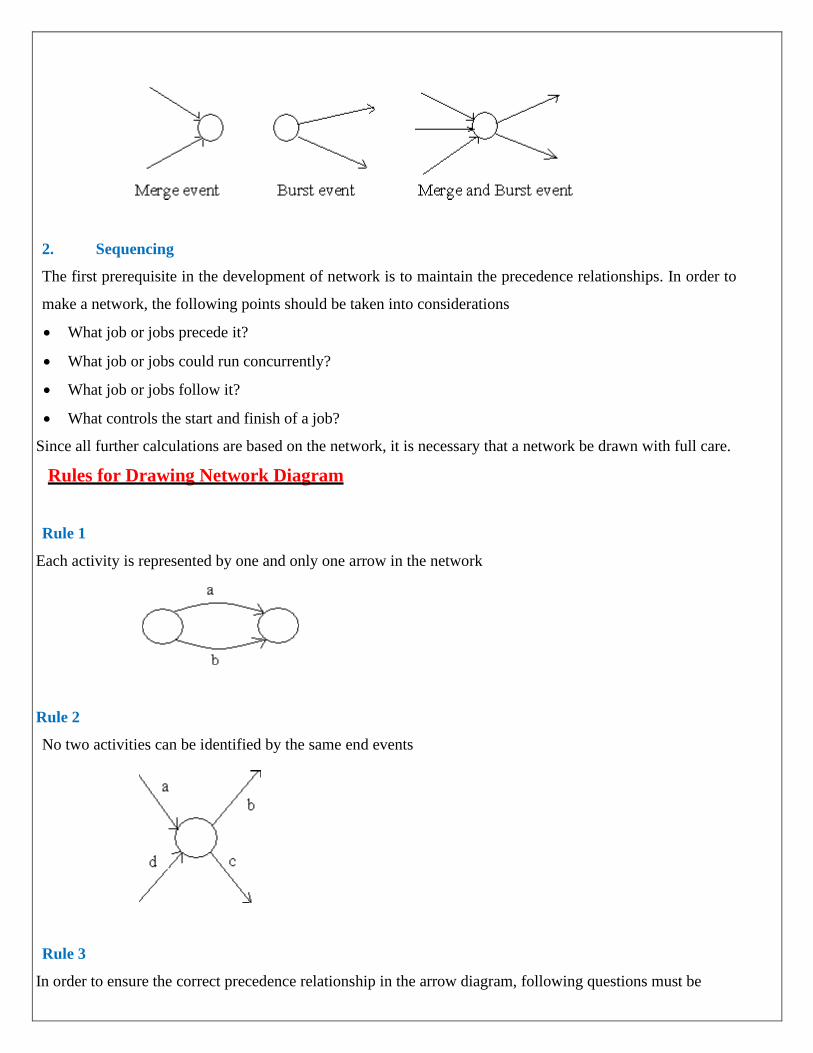
Rule 1
Each activity is represented by one and only one arrow in the network
Rule 2
No two activities can be identified by the same end events
Rule 3
In order to ensure the correct precedence relationship in the arrow diagram, following questions must be
checked whenever any activity is added to the network
• What activity must be completed immediately before this activity can start?
• What activities must follow this activity?
• What activities must occur simultaneously with this activity?
In case of large network, it is essential that certain good habits be practiced to draw an easy to follow
Network
• Try to avoid arrows which cross each other
• Use straight arrows
• Do not attempt to represent duration of activity by its arrow length
• Use arrows from left to right. Avoid mixing two directions, vertical and standing arrows may be used if
necessary.
• Use dummies freely in rough draft but final network should not have any redundant dummies.
• The network has only one entry point called start event and one point of emergence called the end event.
Common Errors in Drawing Networks
The three types of errors are most commonly observed in drawing network diagrams
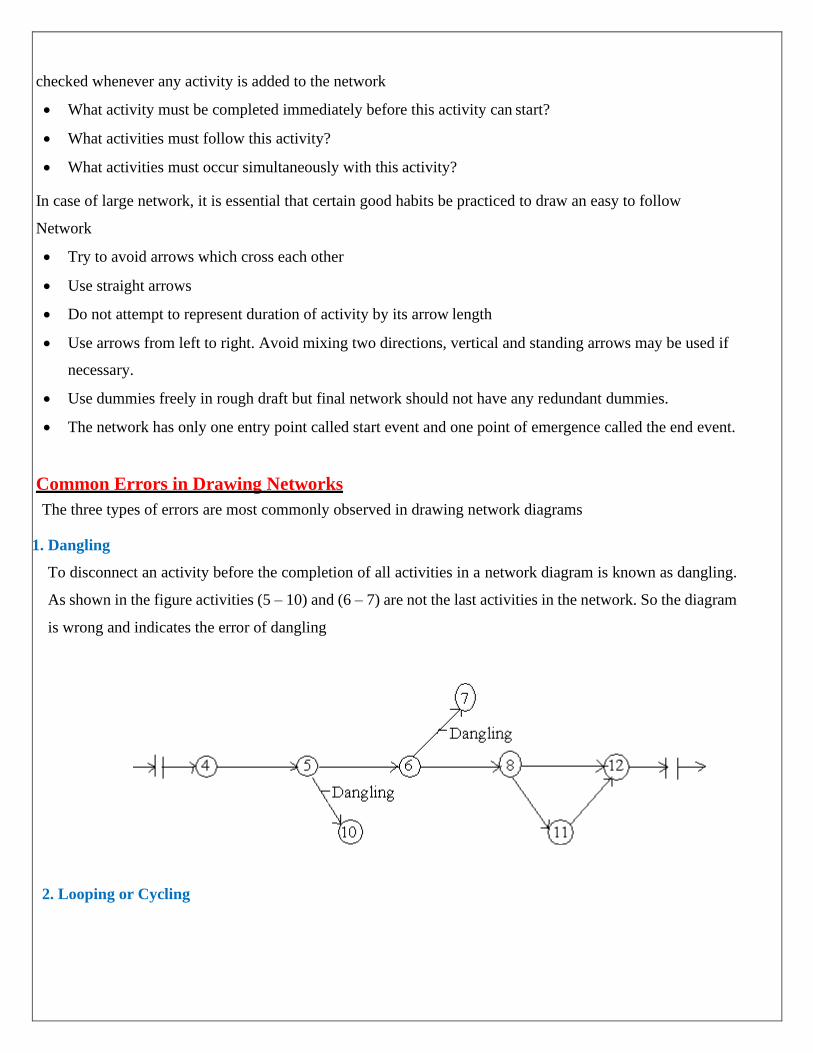
1. Dangling
To disconnect an activity before the completion of all activities in a network diagram is known as dangling.
As shown in the figure activities (5 – 10) and (6 – 7) are not the last activities in the network. So the diagram
is wrong and indicates the error of dangling
2. Looping or Cycling
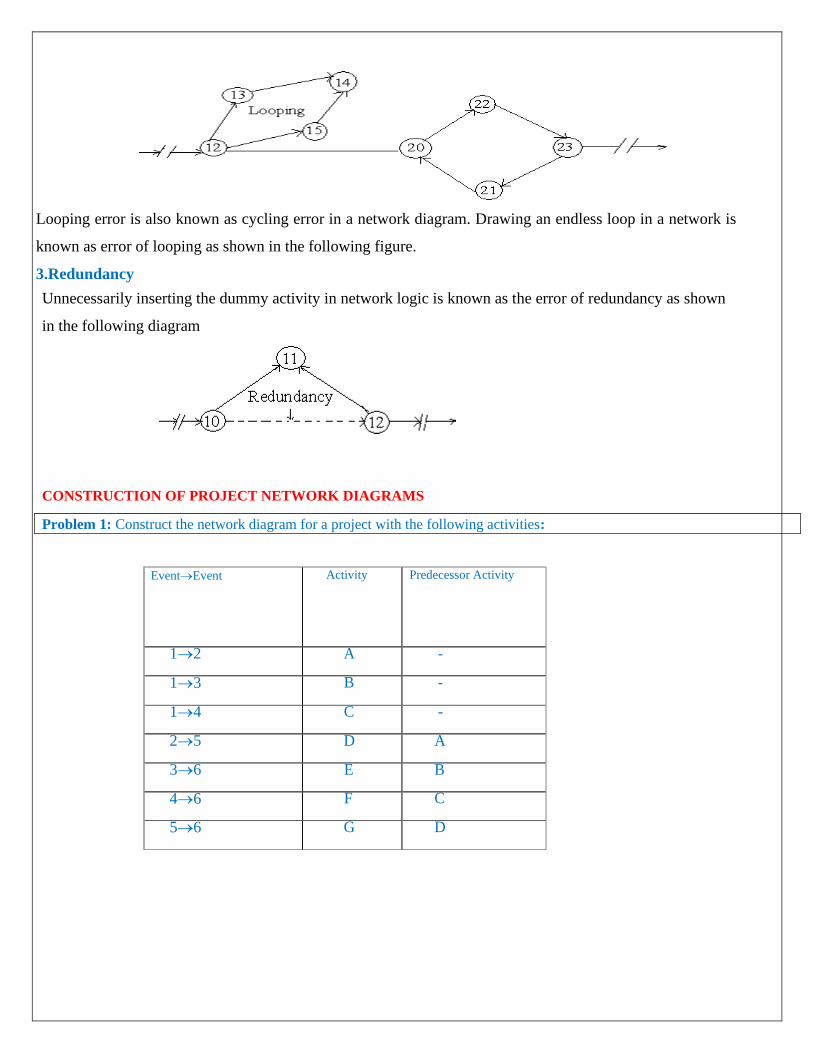
Looping error is also known as cycling error in a network diagram. Drawing an endless loop in a network is
known as error of looping as shown in the following figure.
3.Redundancy
Unnecessarily inserting the dummy activity in network logic is known as the error of redundancy as shown
in the following diagram
CONSTRUCTION OF PROJECT NETWORK DIAGRAMS
Problem 1: Construct the network diagram for a project with the following activities:
Event→Event Activity Predecessor Activity
1→2 A -
1→3 B -
1→4 C -
2→5 D A
3→6 E B
4→6 F C
5→6 G D
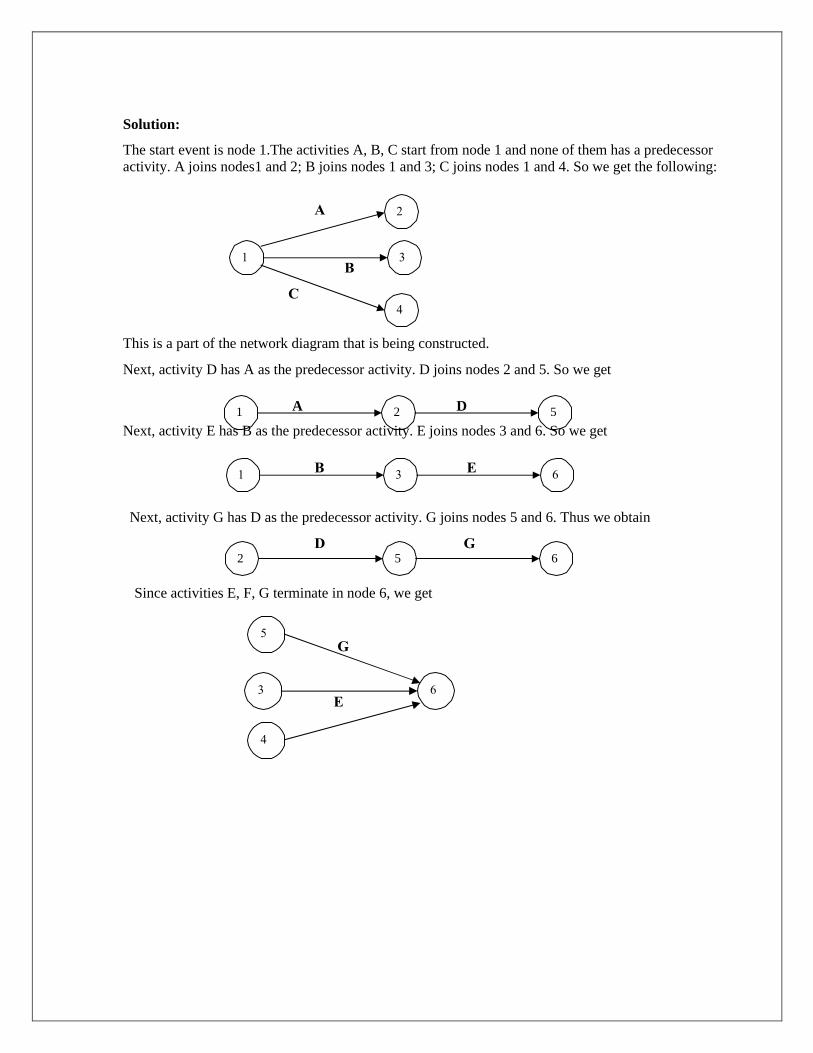
Solution:
The start event is node 1.The activities A, B, C start from node 1 and none of them has a predecessor
activity. A joins nodes1 and 2; B joins nodes 1 and 3; C joins nodes 1 and 4. So we get the following:
This is a part of the network diagram that is being constructed.
Next, activity D has A as the predecessor activity. D joins nodes 2 and 5. So we get
1 A 2 D 5
Next, activity E has B as the predecessor activity. E joins nodes 3 and 6. So we get
Next, activity G has D as the predecessor activity. G joins nodes 5 and 6. Thus we obtain
Since activities E, F, G terminate in node 6, we get
2 5 6
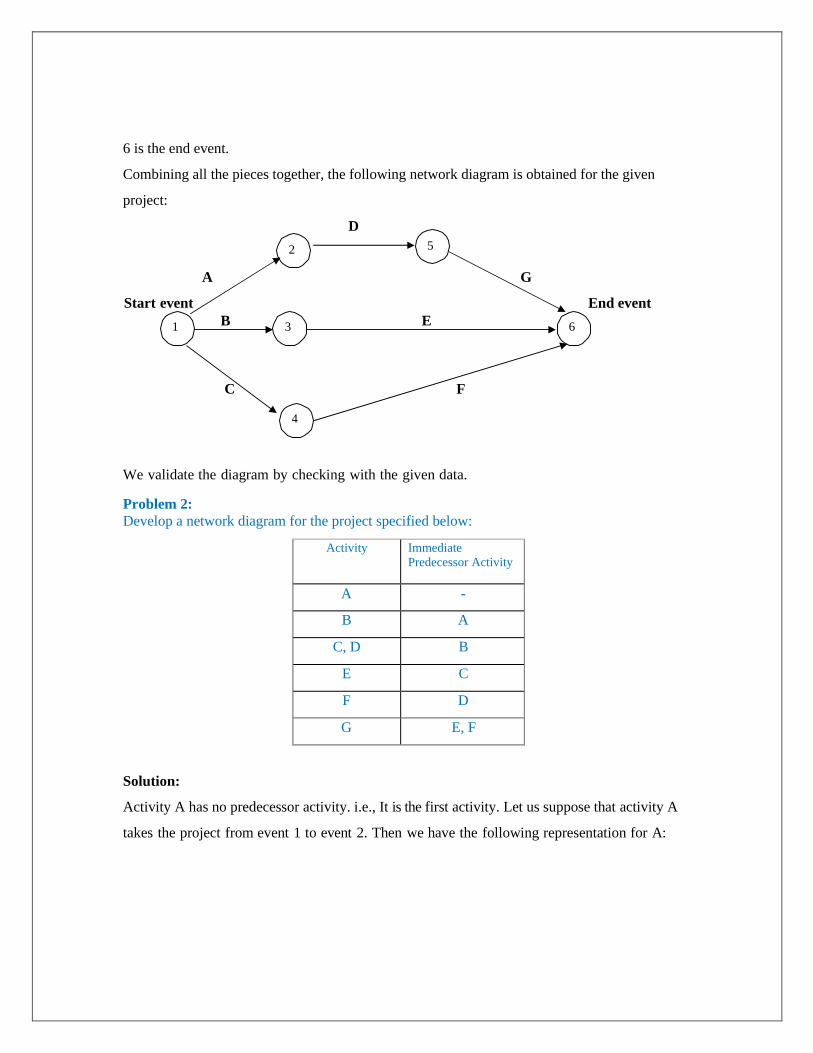
6 is the end event.
Combining all the pieces together, the following network diagram is obtained for the given
project:
D
2 5
A G
Start event End event
1 B 3 E 6
C F
4
We validate the diagram by checking with the given data.
Problem 2:
Develop a network diagram for the project specified below:
Activity Immediate
Predecessor Activity
A -
B A
C, D B
E C
F D
G E, F
Solution:
Activity A has no predecessor activity. i.e., It is the first activity. Let us suppose that activity A
takes the project from event 1 to event 2. Then we have the following representation for A:
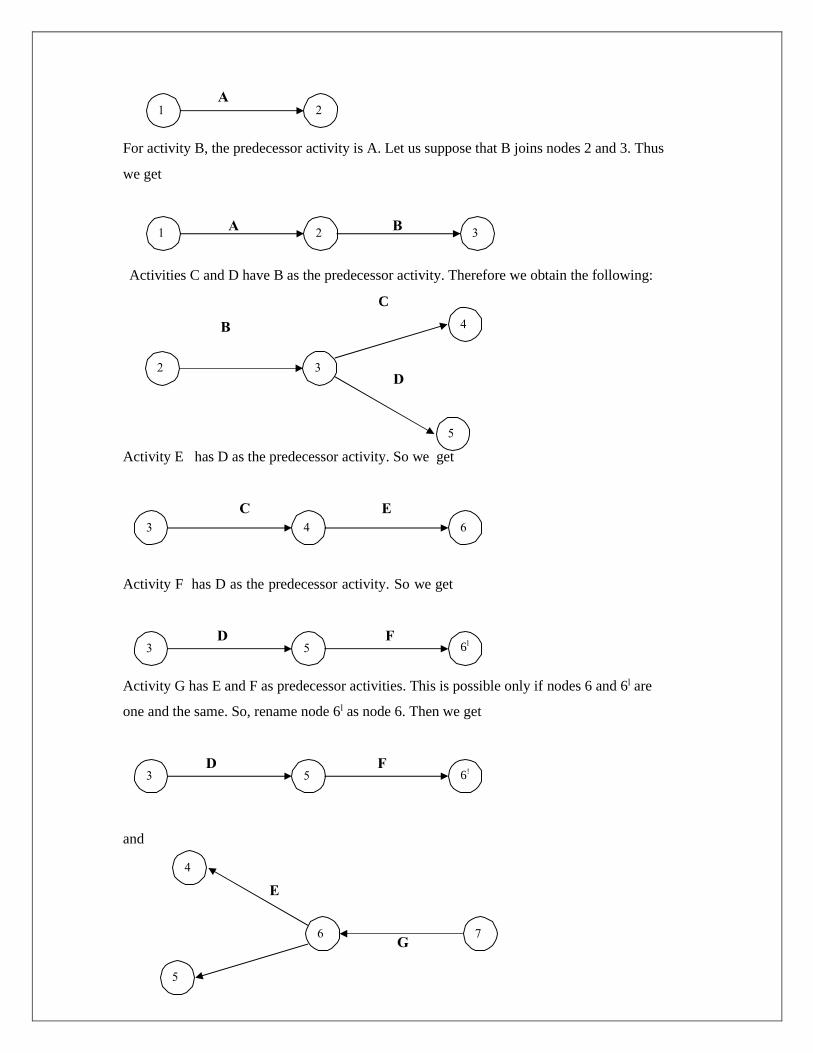
For activity B, the predecessor activity is A. Let us suppose that B joins nodes 2 and 3. Thus
we get
Activities C and D have B as the predecessor activity. Therefore we obtain the following:
C
Activity E has D as the predecessor activity. So we get
Activity F has D as the predecessor activity. So we get
Activity G has E and F as predecessor activities. This is possible only if nodes 6 and 6l are
one and the same. So, rename node 6l as node 6. Then we get
and
6l
6!
F
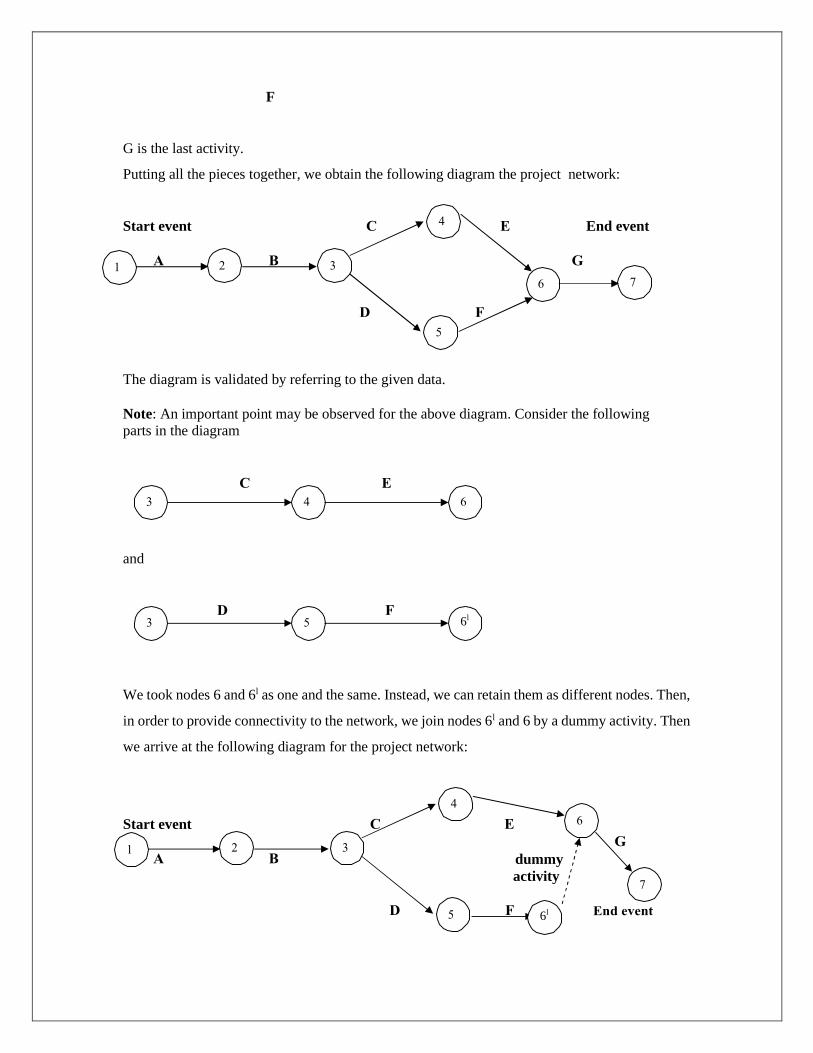
G is the last activity.
Putting all the pieces together, we obtain the following diagram the project network:
The diagram is validated by referring to the given data.
Note: An important point may be observed for the above diagram. Consider the following
parts in the diagram
and
We took nodes 6 and 6l as one and the same. Instead, we can retain them as different nodes. Then,
in order to provide connectivity to the network, we join nodes 6l and 6 by a dummy activity. Then
we arrive at the following diagram for the project network:
Start event End event
6l
Start event
dummy
activity
6l
CRITICAL PATH METHOD (CPM ) AND
PROGRAM EVALUATION AND REVIEW TECHNIQUE ( PERT)
Any project involves planning, scheduling and controlling a number of interrelated activities with use of limited resources, namely,
men, machines, materials, money and time. The projects may be extremely large and complex such as construction of a power plant, a
highway, a shopping complex, ships and aircraft, introduction of new products and research and development projects. It is required that
managers must have a dynamic planning and scheduling system to produce the best possible results and also to react immediately to the
changing conditions and make necessary changes in the plan and schedule. A convenient analytical and visual technique of PERT and CPM
prove extremely valuable in assisting the managers in managing the projects.
Both the techniques use similar terminology and have the same purpose. PERT stands for Project Evaluation and Review Technique
developed during 1950s. The technique was developed and used in conjunction with the planning and designing of the Polaris missile
project. CPM stands for Critical Path Method which was developed by DuPont Company and applied first to the construction projects in
the chemical industry. Though both PERT and CPM techniques have similarity in terms of concepts, the basic difference is, PERT is used
for analysis of project scheduling problems. CPM has single time estimate and PERT has three time estimates for activities and uses
probability theory to find the chance of reaching the scheduled time.
The methods are essentially network-oriented techniques using the same principle. PERT and CPM are basically time-oriented
methods in the sense that they both lead to determination of a time schedule for the project. The significant difference between two
approaches is that the time estimates for the different activities in CPM were assumed to be deterministic while in PERT these are described
probabilistically. These techniques are referred as project scheduling techniques.In CPM activities are shown as a network of precedence
relationships using activity-on- node network construction
Applications of CPM / PERT
These methods have been applied to a wide variety of problems in industries and have found acceptance even in government
organizations. These include
1. Construction of a dam or a canal system in a region
2. Construction of a building or highway
3. Maintenance or overhaul of airplanes or oil refinery
4. Space flight
5. Cost control of a project using PERT / COST
6. Designing a prototype of a machine
7. Development of supersonic planes
Basic Steps in PERT / CPM
Project scheduling by PERT / CPM consists of four main steps
1. Planning
The planning phase is started by splitting the total project in to small projects. These smaller projects in turn are divided into activities and
are analyzed by the department or section. The relationship of each activity with respect to other activities are defined and established and
the corresponding responsibilities and the authority are also stated. Thus the possibility of overlooking any task necessary for the completion
of the project is reduced substantially.
2. Scheduling
The ultimate objective of the scheduling phase is to prepare a time chart showing the start and finish times for each activity as well as its
relationship to other activities of the project. Moreover the schedule must pinpoint the critical path activities which require special attention
if the project is to be completed in time. For non-critical activities, the schedule must show the amount of slack or float times which can be
used advantageously when such activities are delayed or when limited resources are to be utilized effectively.
3. Allocation of resources
Allocation of resources is performed to achieve the desired objective. A resource is a physical variable such as labour, finance, equipment
and space which will impose a limitation on time for the project.
When resources are limited and conflicting, demands are made for the same type of resources a systematic method for allocation of resources
become essential.Resource allocation usually incurs a compromise and the choice of this compromise depends on the judgment of managers.
4. Controlling
The final phase in project management is controlling. Critical path methods facilitate the application of the principle of management by
expectation to identify areas that are critical to the completion of the project. By having progress reports from time to time and updating the
network continuously, a better financial as well as technical control over the project is exercised.Arrow diagrams and time charts are used
for making periodic progress reports. If required, a new course of action is determined for the remaining portion of the project.
Advantages and Disadvantages
PERT/CPM has the following advantages
➢ A PERT/CPM chart explicitly defines and makes visible dependencies (precedence relationships) between the elements,
➢ PERT/CPM facilitates identification of the critical path and makes this visible,
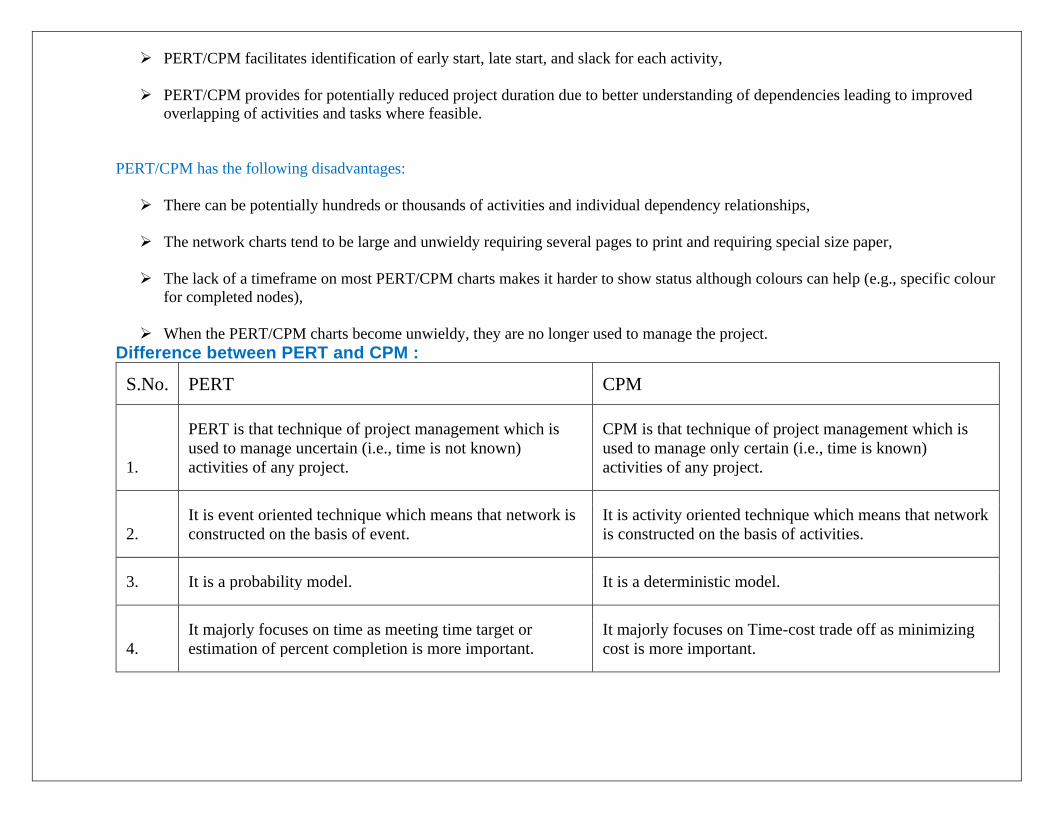
➢ PERT/CPM facilitates identification of early start, late start, and slack for each activity,
➢ PERT/CPM provides for potentially reduced project duration due to better understanding of dependencies leading to improved
overlapping of activities and tasks where feasible.
PERT/CPM has the following disadvantages:
➢ There can be potentially hundreds or thousands of activities and individual dependency relationships,
➢ The network charts tend to be large and unwieldy requiring several pages to print and requiring special size paper,
➢ The lack of a timeframe on most PERT/CPM charts makes it harder to show status although colours can help (e.g., specific colour
for completed nodes),
➢ When the PERT/CPM charts become unwieldy, they are no longer used to manage the project.
Difference between PERT and CPM :
S.No. PERT CPM
1.
PERT is that technique of project management which is
used to manage uncertain (i.e., time is not known)
activities of any project.
CPM is that technique of project management which is
used to manage only certain (i.e., time is known)
activities of any project.
2.
It is event oriented technique which means that network is
constructed on the basis of event.
It is activity oriented technique which means that network
is constructed on the basis of activities.
3. It is a probability model. It is a deterministic model.
4.
It majorly focuses on time as meeting time target or
estimation of percent completion is more important.
It majorly focuses on Time-cost trade off as minimizing
cost is more important.
S.No. PERT CPM
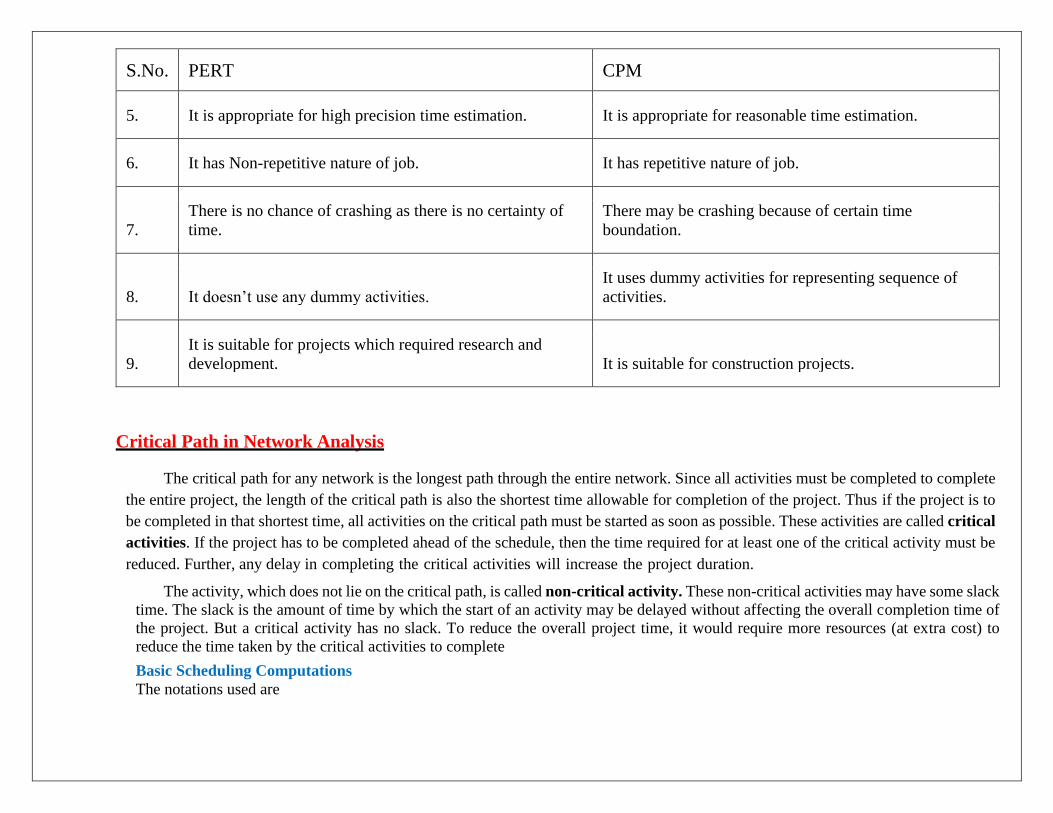
5. It is appropriate for high precision time estimation. It is appropriate for reasonable time estimation.
6. It has Non-repetitive nature of job. It has repetitive nature of job.
7.
There is no chance of crashing as there is no certainty of
time.
There may be crashing because of certain time
boundation.
8. It doesn’t use any dummy activities.
It uses dummy activities for representing sequence of
activities.
9.
It is suitable for projects which required research and
development. It is suitable for construction projects.
Critical Path in Network Analysis
The critical path for any network is the longest path through the entire network. Since all activities must be completed to complete
the entire project, the length of the critical path is also the shortest time allowable for completion of the project. Thus if the project is to
be completed in that shortest time, all activities on the critical path must be started as soon as possible. These activities are called critical
activities. If the project has to be completed ahead of the schedule, then the time required for at least one of the critical activity must be
reduced. Further, any delay in completing the critical activities will increase the project duration.
The activity, which does not lie on the critical path, is called non-critical activity. These non-critical activities may have some slack
time. The slack is the amount of time by which the start of an activity may be delayed without affecting the overall completion time of
the project. But a critical activity has no slack. To reduce the overall project time, it would require more resources (at extra cost) to
reduce the time taken by the critical activities to complete
Basic Scheduling Computations
The notations used are
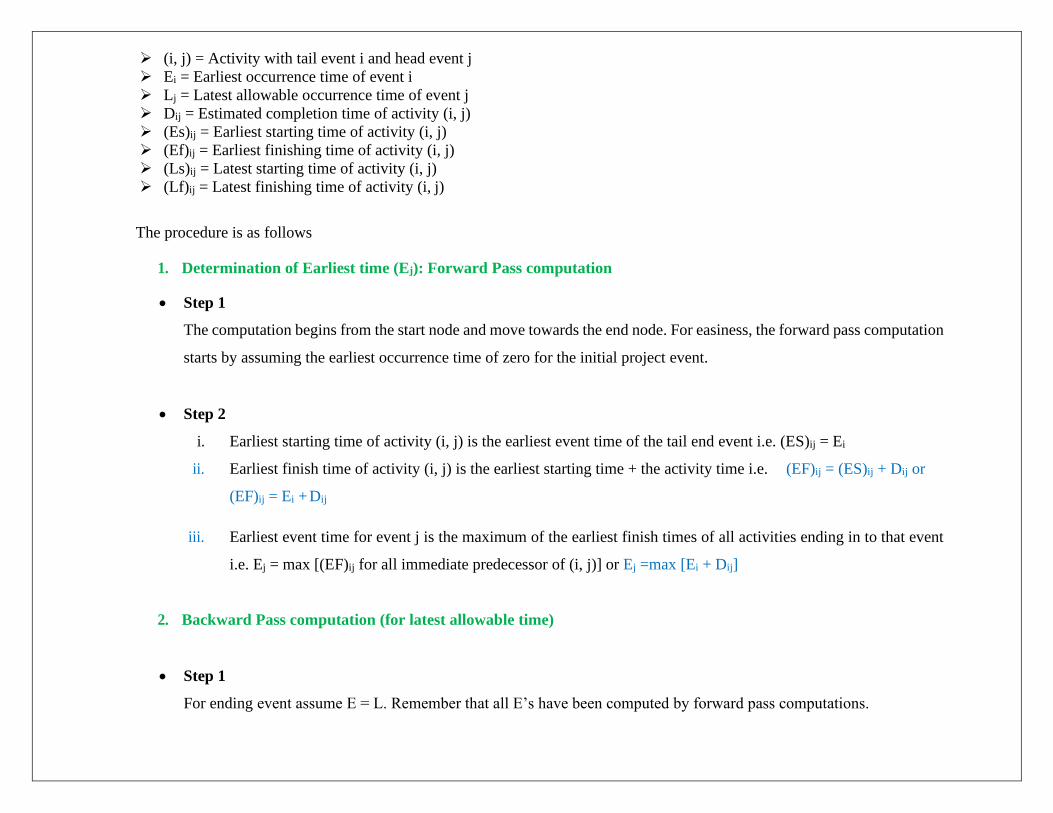
➢ (i, j) = Activity with tail event i and head event j
➢ Ei = Earliest occurrence time of event i
➢ Lj = Latest allowable occurrence time of event j
➢ Dij = Estimated completion time of activity (i, j)
➢ (Es)ij = Earliest starting time of activity (i, j)
➢ (Ef)ij = Earliest finishing time of activity (i, j)
➢ (Ls)ij = Latest starting time of activity (i, j)
➢ (Lf)ij = Latest finishing time of activity (i, j)
The procedure is as follows
1. Determination of Earliest time (Ej): Forward Pass computation
• Step 1
The computation begins from the start node and move towards the end node. For easiness, the forward pass computation
starts by assuming the earliest occurrence time of zero for the initial project event.
• Step 2
i. Earliest starting time of activity (i, j) is the earliest event time of the tail end event i.e. (ES)ij = Ei
ii. Earliest finish time of activity (i, j) is the earliest starting time + the activity time i.e. (EF)ij = (ES)ij + Dij or
(EF)ij = Ei + Dij
iii. Earliest event time for event j is the maximum of the earliest finish times of all activities ending in to that event
i.e. Ej = max [(EF)ij for all immediate predecessor of (i, j)] or Ej =max [Ei + Dij]
2. Backward Pass computation (for latest allowable time)
• Step 1
For ending event assume E = L. Remember that all E’s have been computed by forward pass computations.
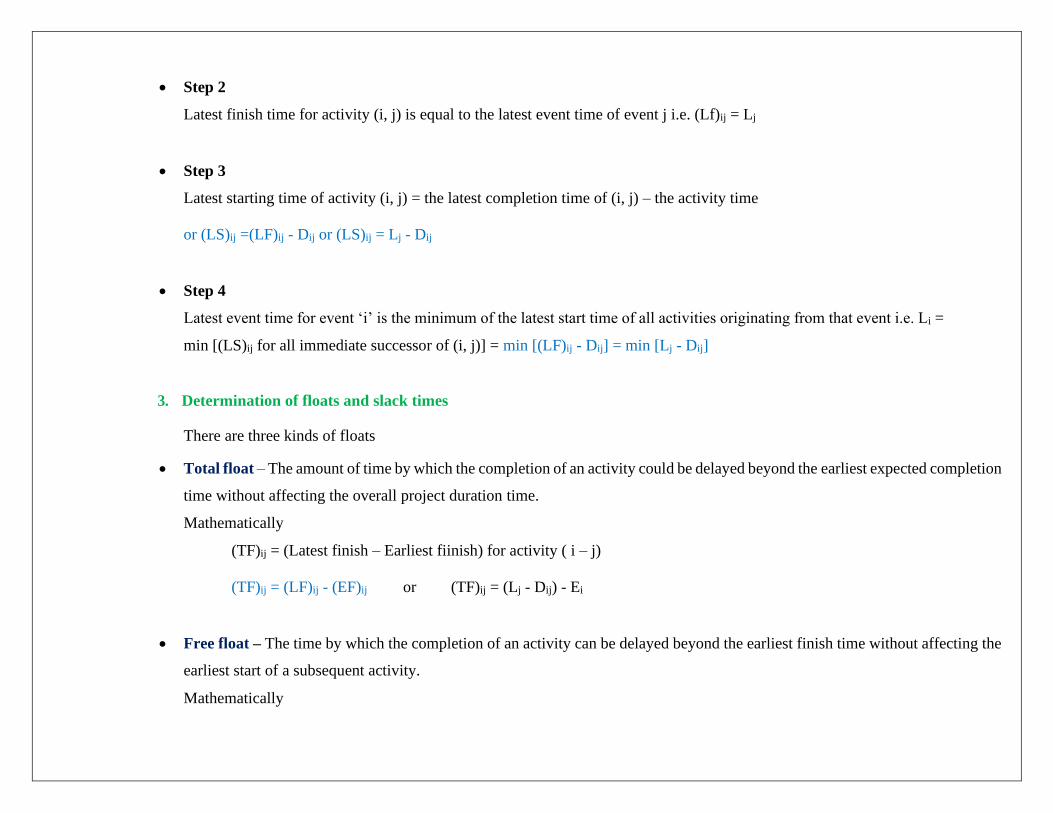
• Step 2
Latest finish time for activity (i, j) is equal to the latest event time of event j i.e. (Lf)ij = Lj
• Step 3
Latest starting time of activity (i, j) = the latest completion time of (i, j) – the activity time
or (LS)ij =(LF)ij - Dij or (LS)ij = Lj - Dij
• Step 4
Latest event time for event ‘i’ is the minimum of the latest start time of all activities originating from that event i.e. Li =
min [(LS)ij for all immediate successor of (i, j)] = min [(LF)ij - Dij] = min [Lj - Dij]
3. Determination of floats and slack times
There are three kinds of floats
• Total float – The amount of time by which the completion of an activity could be delayed beyond the earliest expected completion
time without affecting the overall project duration time.
Mathematically
(TF)ij = (Latest finish – Earliest fiinish) for activity ( i – j)
(TF)ij = (LF)ij - (EF)ij or (TF)ij = (Lj - Dij) - Ei
• Free float – The time by which the completion of an activity can be delayed beyond the earliest finish time without affecting the
earliest start of a subsequent activity.
Mathematically
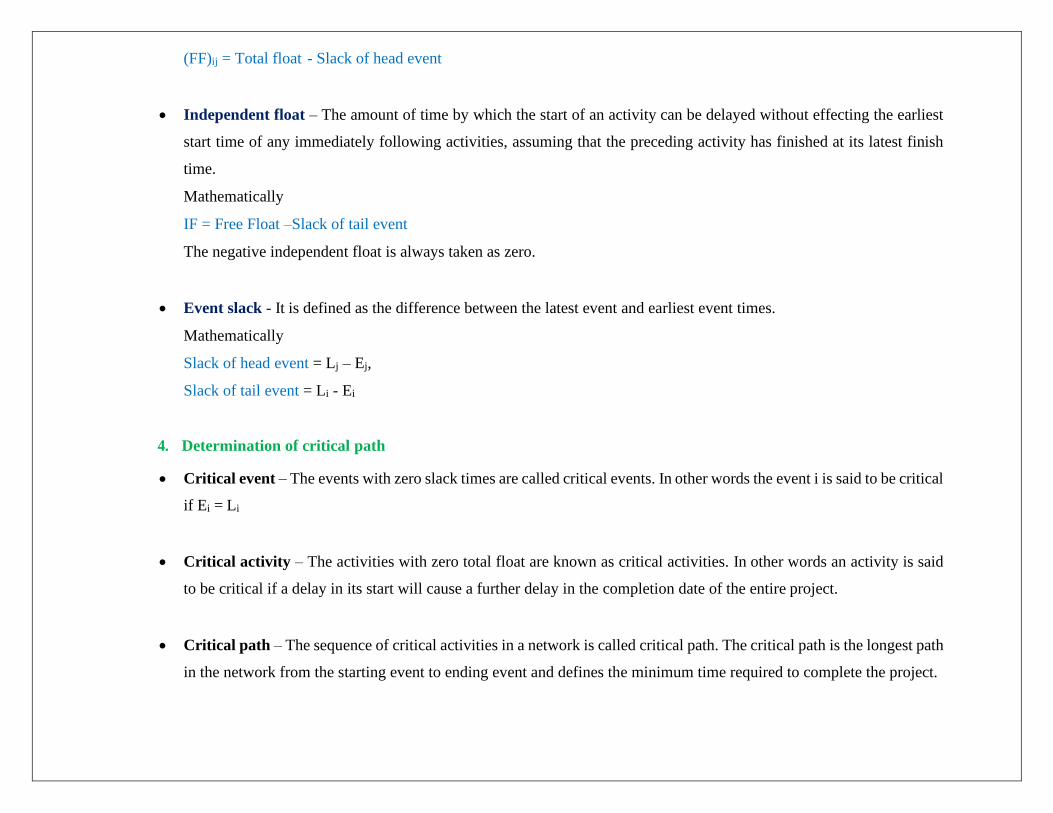
(FF)ij = Total float - Slack of head event
• Independent float – The amount of time by which the start of an activity can be delayed without effecting the earliest
start time of any immediately following activities, assuming that the preceding activity has finished at its latest finish
time.
Mathematically
IF = Free Float –Slack of tail event
The negative independent float is always taken as zero.
• Event slack - It is defined as the difference between the latest event and earliest event times.
Mathematically
Slack of head event = Lj – Ej,
Slack of tail event = Li - Ei
4. Determination of critical path
• Critical event – The events with zero slack times are called critical events. In other words the event i is said to be critical
if Ei = Li
• Critical activity – The activities with zero total float are known as critical activities. In other words an activity is said
to be critical if a delay in its start will cause a further delay in the completion date of the entire project.
• Critical path – The sequence of critical activities in a network is called critical path. The critical path is the longest path
in the network from the starting event to ending event and defines the minimum time required to complete the project.
Worked Examples on CPM
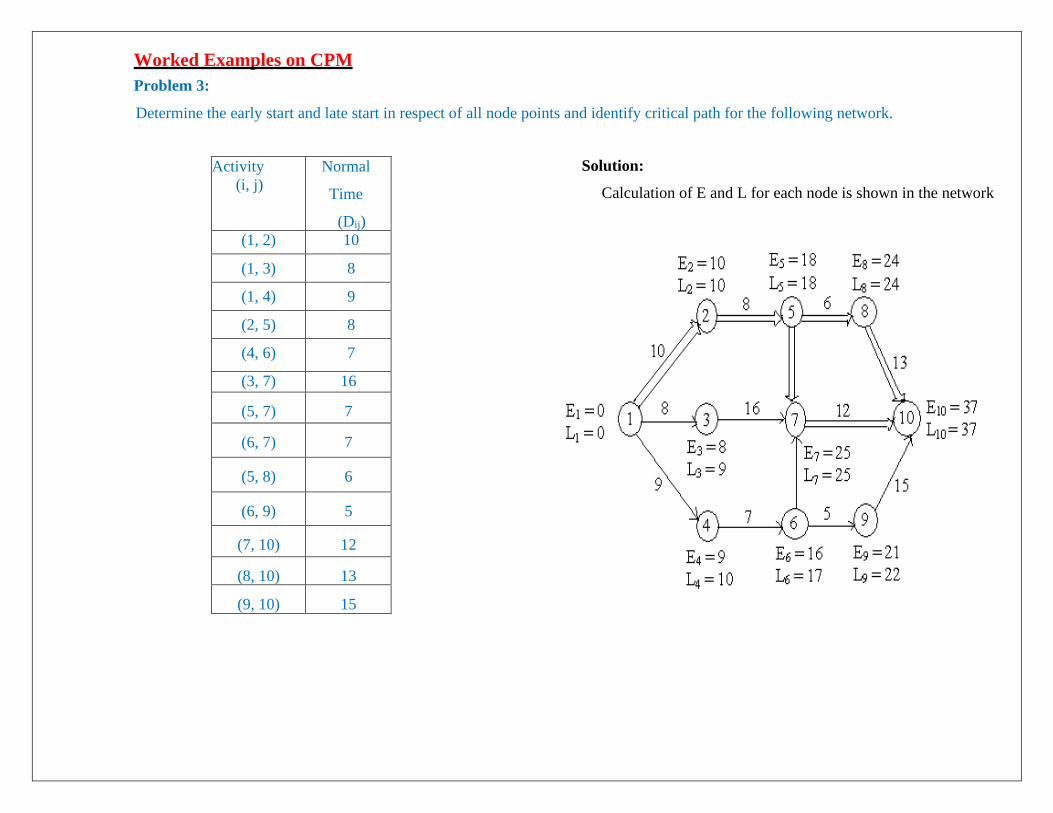
Problem 3:
Determine the early start and late start in respect of all node points and identify critical path for the following network.
Activity
(i, j)
Normal
Time
(Dij)
(1, 2) 10
(1, 3) 8
(1, 4) 9
(2, 5) 8
(4, 6) 7
(3, 7) 16
(5, 7) 7
(6, 7) 7
(5, 8) 6
(6, 9) 5
(7, 10) 12
(8, 10) 13
(9, 10) 15
Solution:
Calculation of E and L for each node is shown in the network
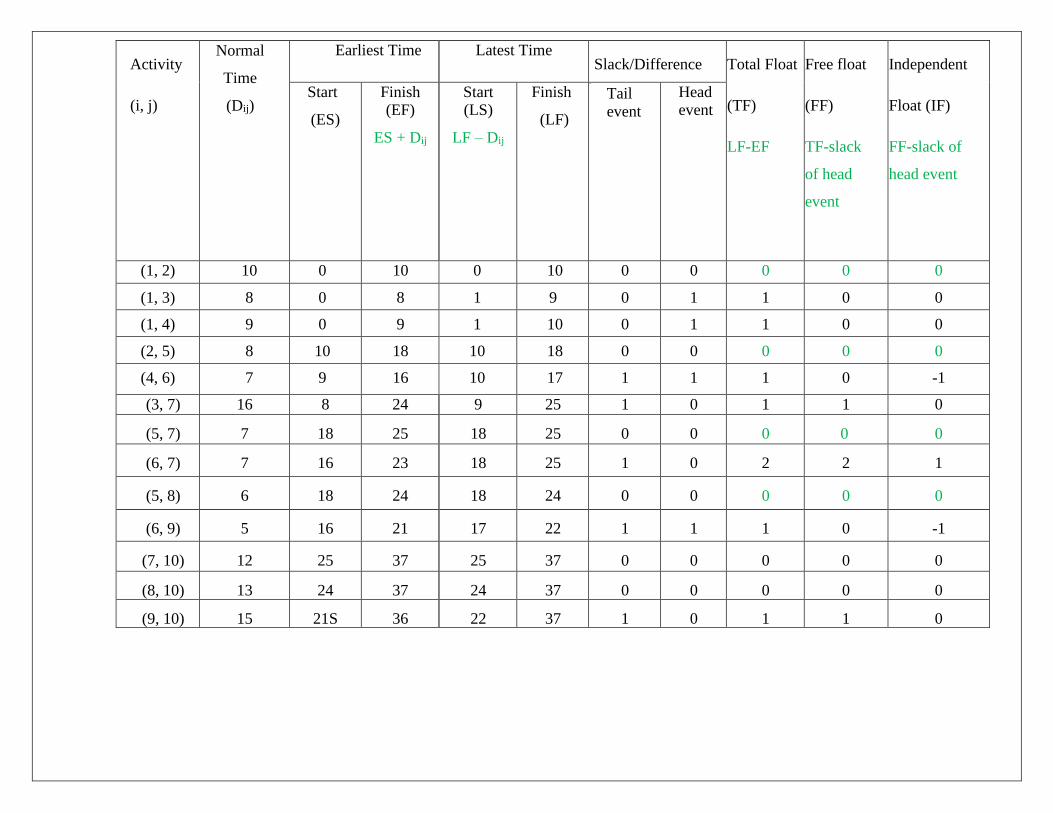
Activity
(i, j)
Normal
Time
(Dij)
Earliest Time Latest Time Slack/Difference Total Float
(TF)
LF-EF
Free float
(FF)
TF-slack
of head
event
Independent
Float (IF)
FF-slack of
head event
Start
(ES)
Finish (EF)
ES + Dij
Start (LS)
LF – Dij
Finish
(LF)
ttail
Tail event
Head event
(1, 2) 10 0 10 0 10 0 0 0 0 0
(1, 3) 8 0 8 1 9 0 1 1 0 0
(1, 4) 9 0 9 1 10 0 1 1 0 0
(2, 5) 8 10 18 10 18 0 0 0 0 0
(4, 6) 7 9 16 10 17 1 1 1 0 -1
(3, 7) 16 8 24 9 25 1 0 1 1 0
(5, 7) 7 18 25 18 25 0 0 0 0 0
(6, 7) 7 16 23 18 25 1 0 2 2 1
(5, 8) 6 18 24 18 24 0 0 0 0 0
(6, 9) 5 16 21 17 22 1 1 1 0 -1
(7, 10) 12 25 37 25 37 0 0 0 0 0
(8, 10) 13 24 37 24 37 0 0 0 0 0
(9, 10) 15 21S 36 22 37 1 0 1 1 0
Answer:
a) From the table, the critical nodes are
(1, 2), (2, 5), (5, 7), (5, 8), (7, 10) and (8, 10)
b) Duration of the project = 37
c) From the table, there are two possible critical paths
i. 1 → 2 → 5 → 8 → 10
ii. 1 → 2 → 5 → 7 → 10
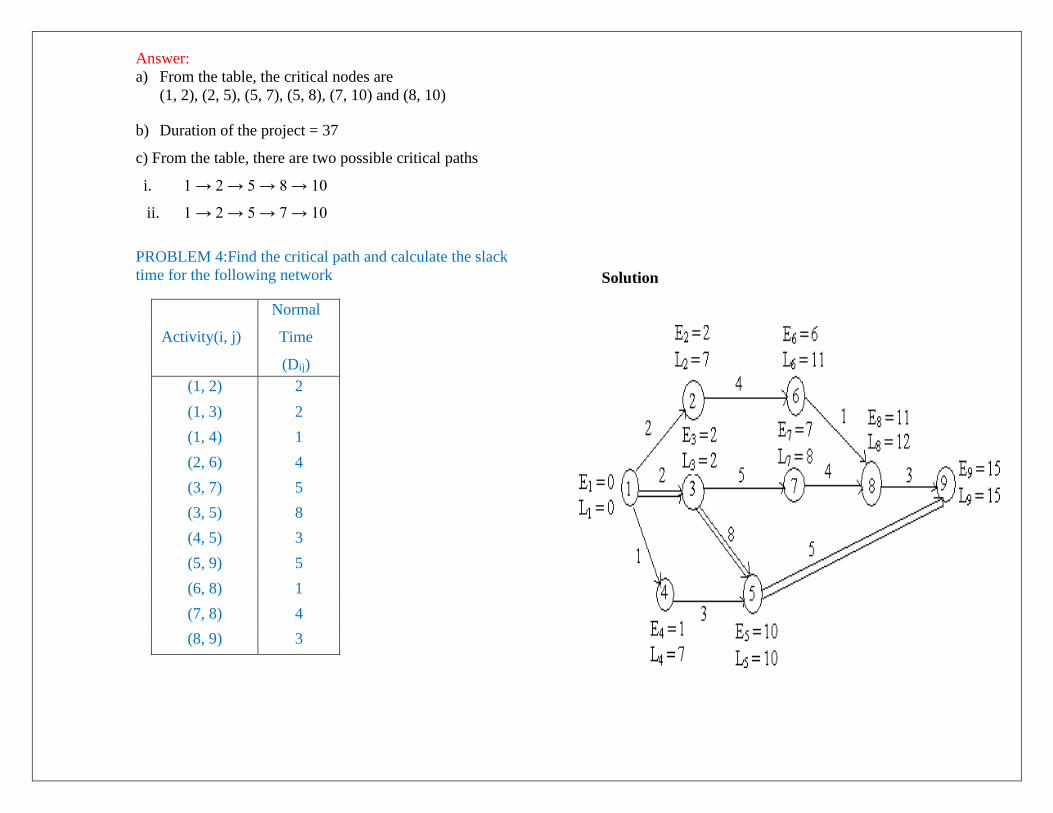
PROBLEM 4:Find the critical path and calculate the slack
time for the following network
Activity(i, j)
Normal
Time
(Dij)
(1, 2) 2
(1, 3) 2
(1, 4) 1
(2, 6) 4
(3, 7) 5
(3, 5) 8
(4, 5) 3
(5, 9) 5
(6, 8) 1
(7, 8) 4
(8, 9) 3
Solution
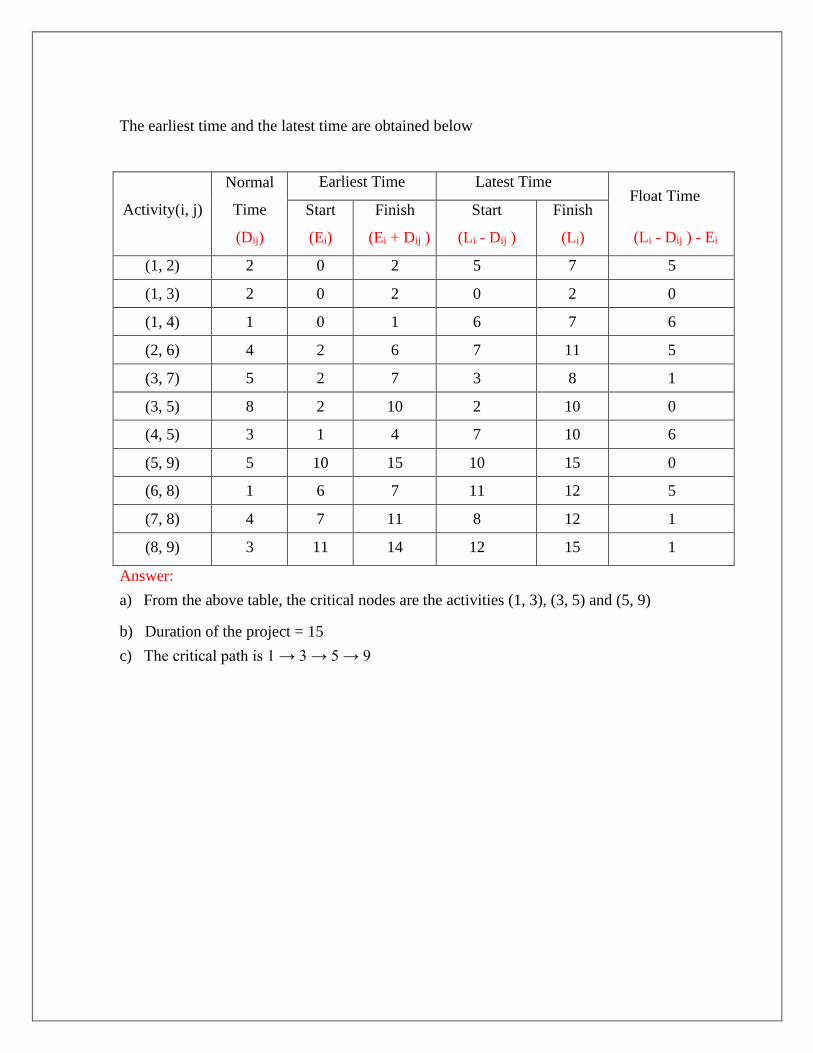
The earliest time and the latest time are obtained below
Activity(i, j)
Normal
Time
(Dij)
Earliest Time Latest Time Float Time
(Li - Dij ) - Ei
Start
(Ei)
Finish
(Ei + Dij )
Start
(Li - Dij )
Finish
(Li)
(1, 2) 2 0 2 5 7 5
(1, 3) 2 0 2 0 2 0
(1, 4) 1 0 1 6 7 6
(2, 6) 4 2 6 7 11 5
(3, 7) 5 2 7 3 8 1
(3, 5) 8 2 10 2 10 0
(4, 5) 3 1 4 7 10 6
(5, 9) 5 10 15 10 15 0
(6, 8) 1 6 7 11 12 5
(7, 8) 4 7 11 8 12 1
(8, 9) 3 11 14 12 15 1
Answer:
a) From the above table, the critical nodes are the activities (1, 3), (3, 5) and (5, 9)
b) Duration of the project = 15
c) The critical path is 1 → 3 → 5 → 9
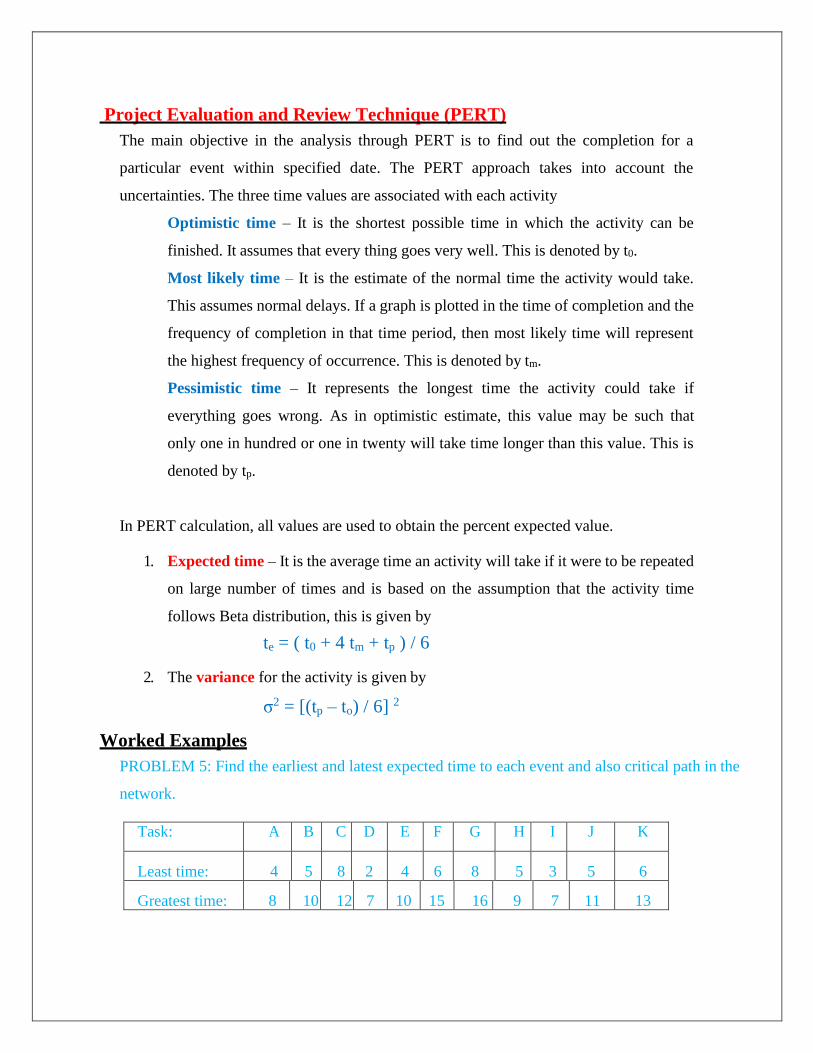
Project Evaluation and Review Technique (PERT)
The main objective in the analysis through PERT is to find out the completion for a
particular event within specified date. The PERT approach takes into account the
uncertainties. The three time values are associated with each activity
Optimistic time – It is the shortest possible time in which the activity can be
finished. It assumes that every thing goes very well. This is denoted by t0.
Most likely time – It is the estimate of the normal time the activity would take.
This assumes normal delays. If a graph is plotted in the time of completion and the
frequency of completion in that time period, then most likely time will represent
the highest frequency of occurrence. This is denoted by tm.
Pessimistic time – It represents the longest time the activity could take if
everything goes wrong. As in optimistic estimate, this value may be such that
only one in hundred or one in twenty will take time longer than this value. This is
denoted by tp.
In PERT calculation, all values are used to obtain the percent expected value.
1. Expected time – It is the average time an activity will take if it were to be repeated
on large number of times and is based on the assumption that the activity time
follows Beta distribution, this is given by
te = ( t0 + 4 tm + tp ) / 6
2. The variance for the activity is given by
σ2 = [(tp – to) / 6] 2
Worked Examples
PROBLEM 5: Find the earliest and latest expected time to each event and also critical path in the
network.
Task: A B C D E F G H I J K
Least time: 4 5 8 2 4 6 8 5 3 5 6
Greatest time: 8 10 12 7 10 15 16 9 7 11 13
Most likely time:
5 7 11 3 7 9 12 6 5 8 9
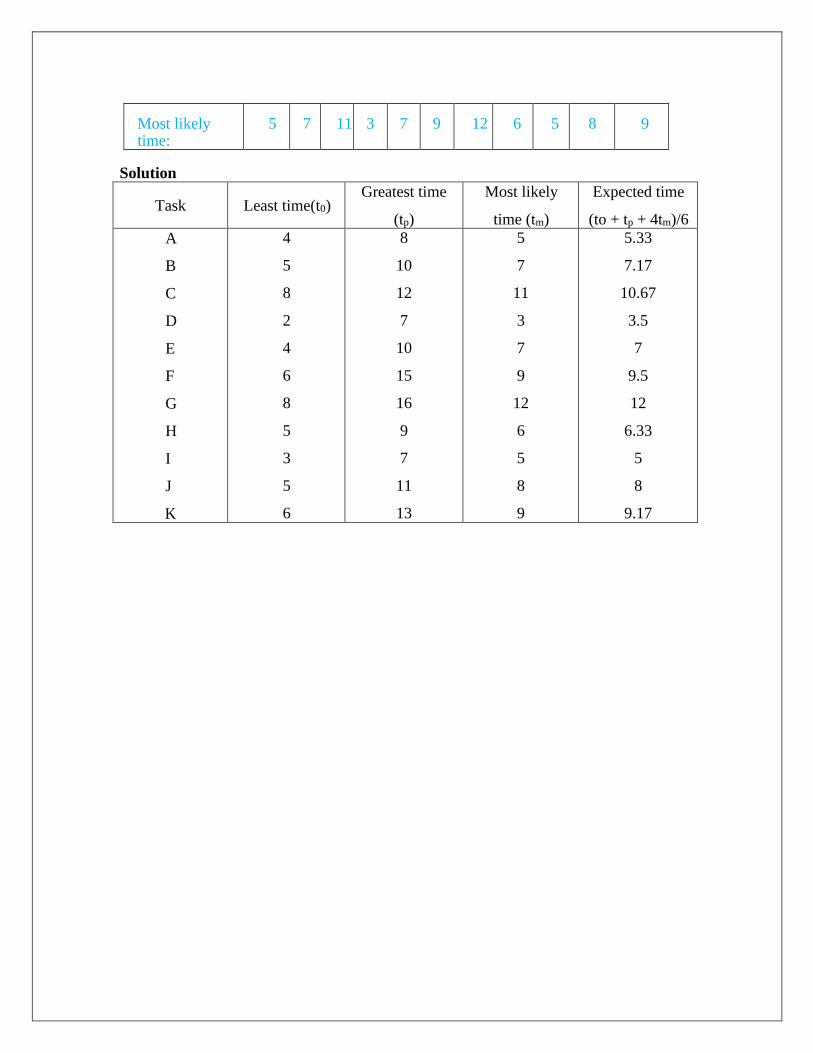
Solution
Task Least time(t0) Greatest time
(tp)
Most likely
time (tm)
Expected time
(to + tp + 4tm)/6
A
B
C
D
E
F
G
H
I
J
K
4
5
8
2
4
6
8
5
3
5
6
8
10
12
7
10
15
16
9
7
11
13
5
7
11
3
7
9
12
6
5
8
9
5.33
7.17
10.67
3.5
7
9.5
12
6.33
5
8
9.17
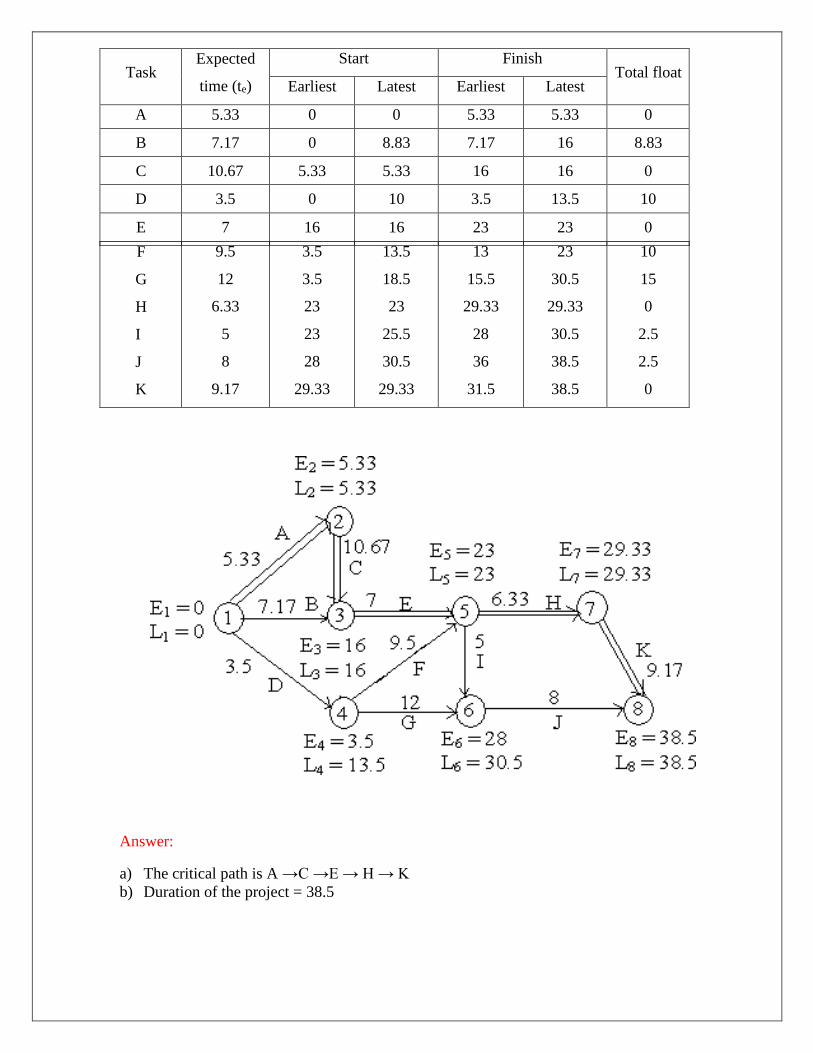
Answer:
a) The critical path is A →C →E → H → K
b) Duration of the project = 38.5
Task Expected
time (te)
Start Finish Total float
Earliest Latest Earliest Latest
A 5.33 0 0 5.33 5.33 0
B 7.17 0 8.83 7.17 16 8.83
C 10.67 5.33 5.33 16 16 0
D 3.5 0 10 3.5 13.5 10
E 7 16 16 23 23 0
F
G
H
I
J
K
9.5
12
6.33
5
8
9.17
3.5
3.5
23
23
28
29.33
13.5
18.5
23
25.5
30.5
29.33
13
15.5
29.33
28
36
31.5
23
30.5
29.33
30.5
38.5
38.5
10
15
0
2.5
2.5
0
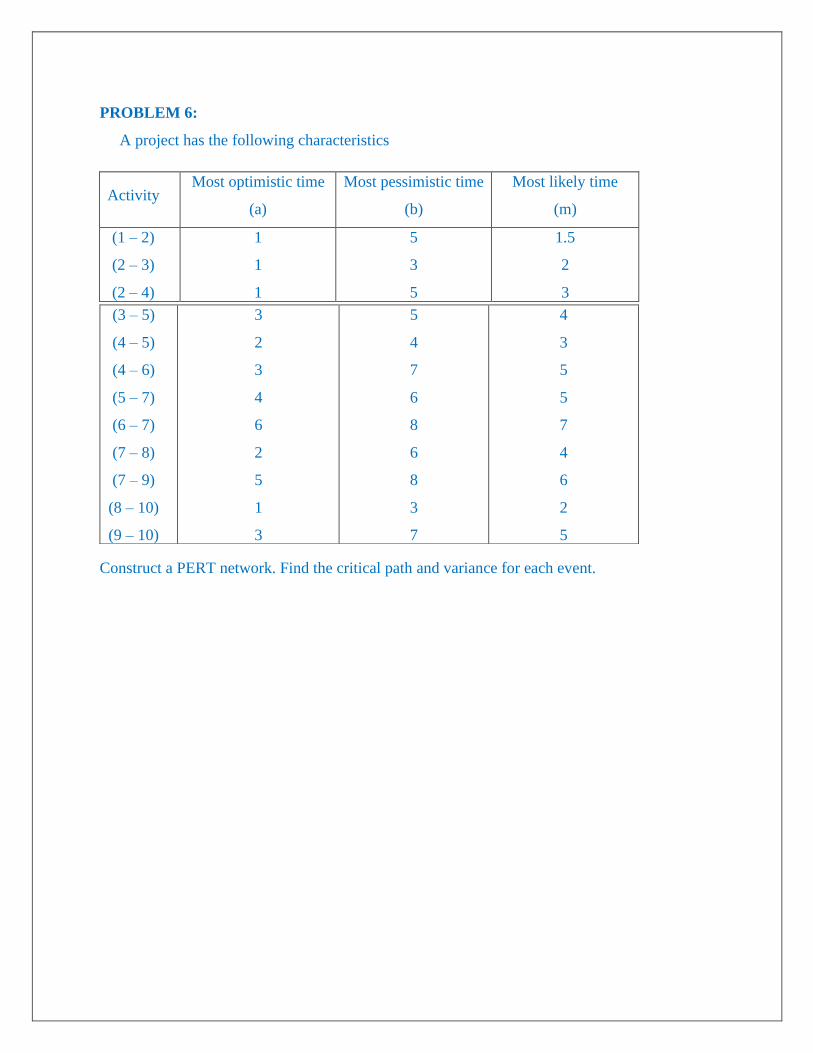
PROBLEM 6:
A project has the following characteristics
Activity Most optimistic time
(a)
Most pessimistic time
(b)
Most likely time
(m)
(1 – 2)
(2 – 3)
(2 – 4)
1
1
1
5
3
5
1.5
2
3
Construct a PERT network. Find the critical path and variance for each event.
(3 – 5)
(4 – 5)
(4 – 6)
(5 – 7)
(6 – 7)
(7 – 8)
(7 – 9)
(8 – 10)
(9 – 10)
3
2
3
4
6
2
5
1
3
5
4
7
6
8
6
8
3
7
4
3
5
5
7
4
6
2
5
(1 – 2)
(2 – 3)
(2 – 4)
(3 – 5)
(4 – 5)
(4 – 6)
(5 – 7)
(6 – 7)
(7 – 8)
(7 – 9)
(8 – 10)
(9 – 10)
1
1
1
3
2
3
4
6
2
5
1
3
5
3
5
5
4
7
6
8
6
8
3
7
1.5
2
3
4
3
5
5
7
4
6
2
5
6
8
12
16
12
20
20
28
16
24
8
20
2
2
3
4
3
5
5
7
4
6.17
2
5
4/9
1/9
4/9
1/9
1/9
4/9
1/9
1/9
4/9
1/4
1/9
4/9
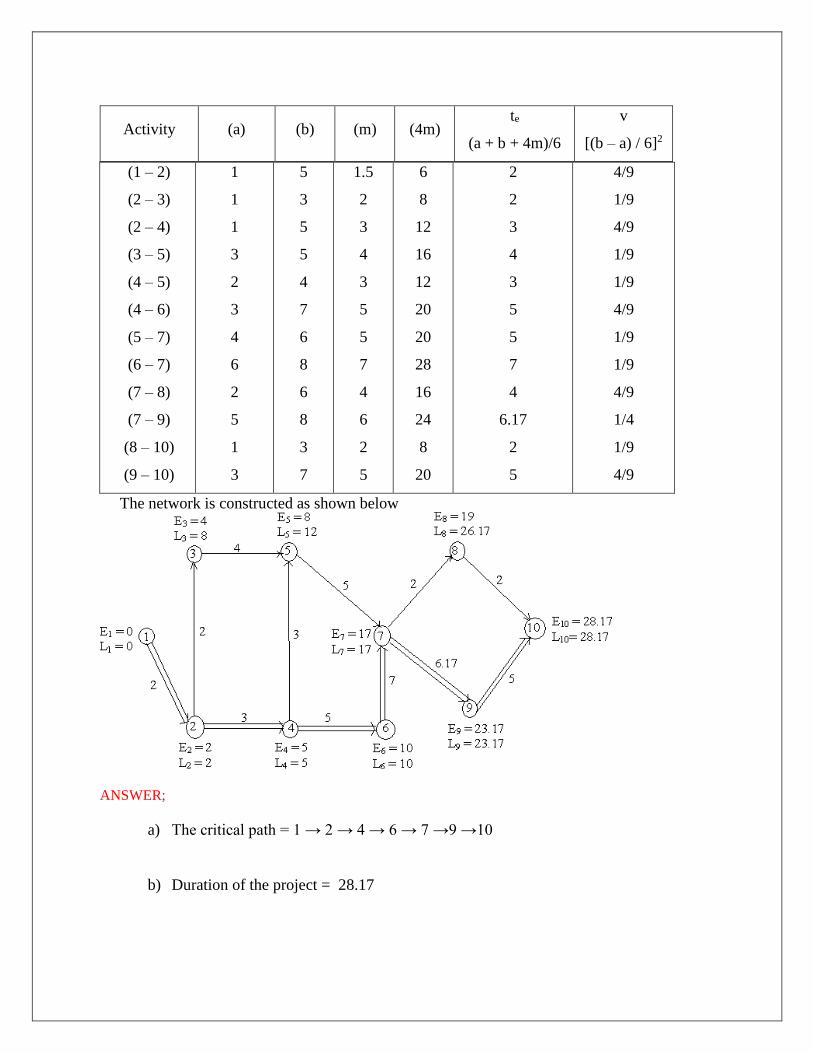
The network is constructed as shown below
ANSWER;
a) The critical path = 1 → 2 → 4 → 6 → 7 →9 →10
b) Duration of the project = 28.17
Activity (a) (b) (m) (4m) te
(a + b + 4m)/6
v
[(b – a) / 6]2
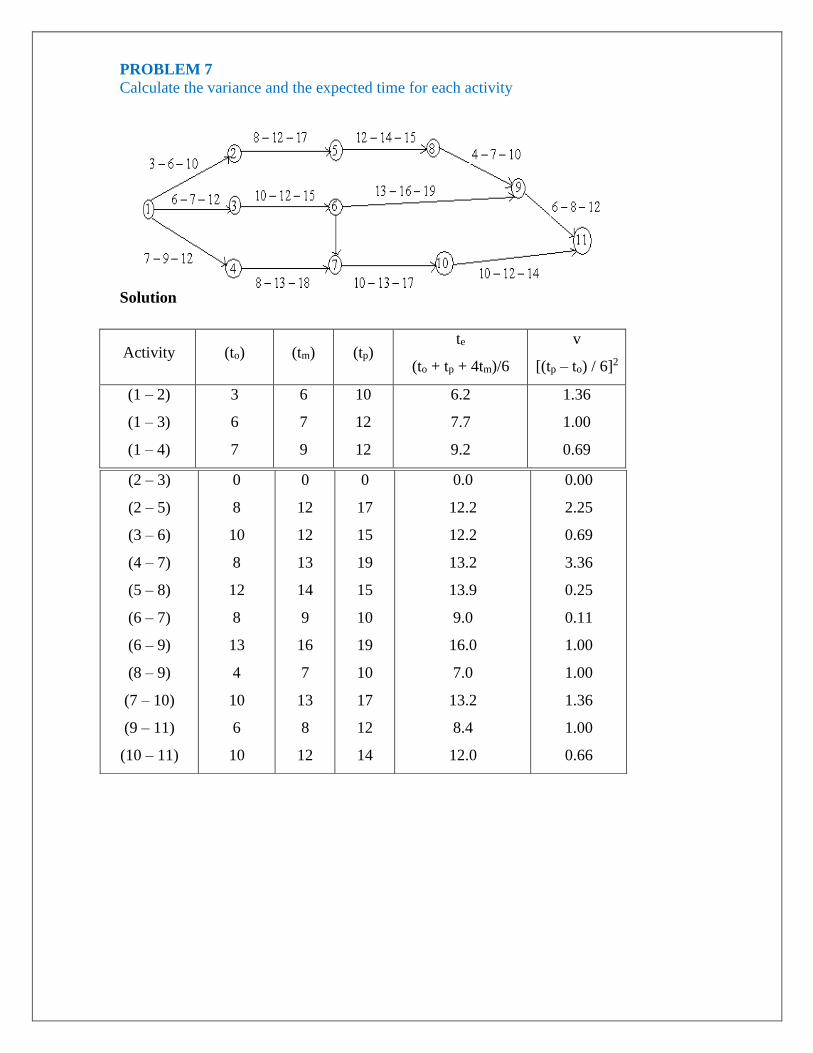
PROBLEM 7 Calculate the variance and the expected time for each activity
Solution
Activity (to) (tm) (tp) te
(to + tp + 4tm)/6
v
[(tp – to) / 6]2
(1 – 2)
(1 – 3)
(1 – 4)
3
6
7
6
7
9
10
12
12
6.2
7.7
9.2
1.36
1.00
0.69
(2 – 3)
(2 – 5)
(3 – 6)
(4 – 7)
(5 – 8)
(6 – 7)
(6 – 9)
(8 – 9)
(7 – 10)
(9 – 11)
(10 – 11)
0
8
10
8
12
8
13
4
10
6
10
0
12
12
13
14
9
16
7
13
8
12
0
17
15
19
15
10
19
10
17
12
14
0.0
12.2
12.2
13.2
13.9
9.0
16.0
7.0
13.2
8.4
12.0
0.00
2.25
0.69
3.36
0.25
0.11
1.00
1.00
1.36
1.00
0.66
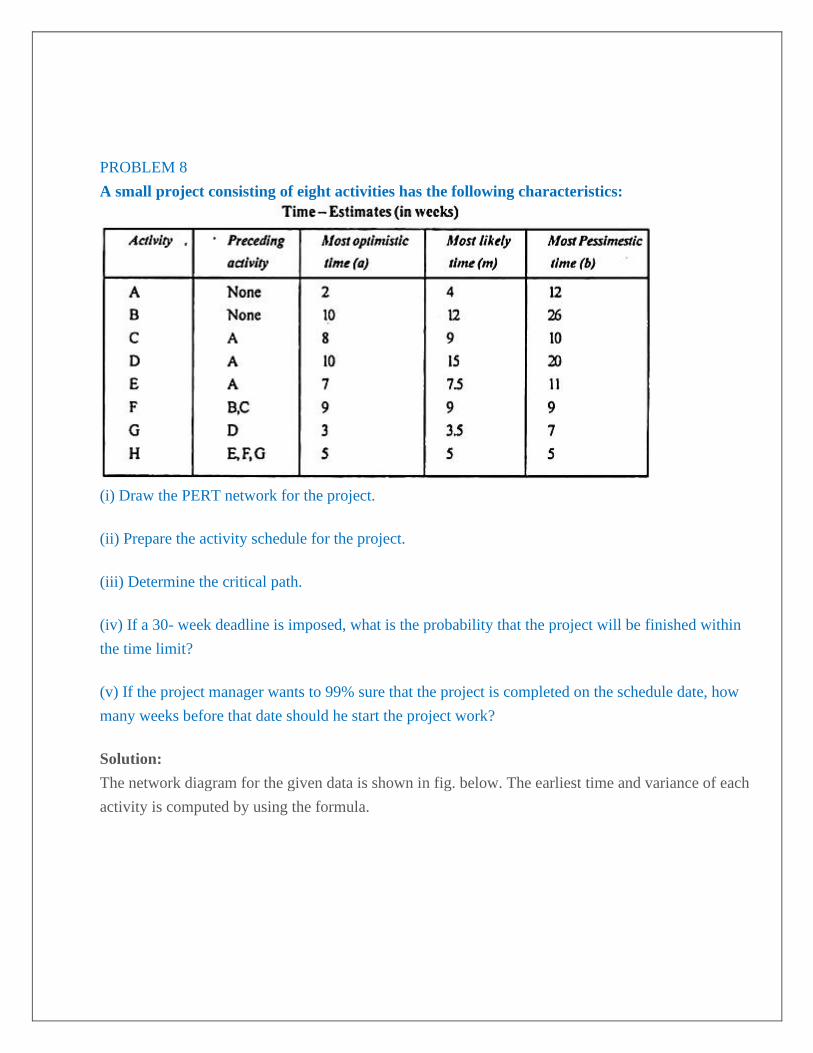
PROBLEM 8
A small project consisting of eight activities has the following characteristics:
(i) Draw the PERT network for the project.
(ii) Prepare the activity schedule for the project.
(iii) Determine the critical path.
(iv) If a 30- week deadline is imposed, what is the probability that the project will be finished within
the time limit?
(v) If the project manager wants to 99% sure that the project is completed on the schedule date, how
many weeks before that date should he start the project work?
Solution:
The network diagram for the given data is shown in fig. below. The earliest time and variance of each
activity is computed by using the formula.
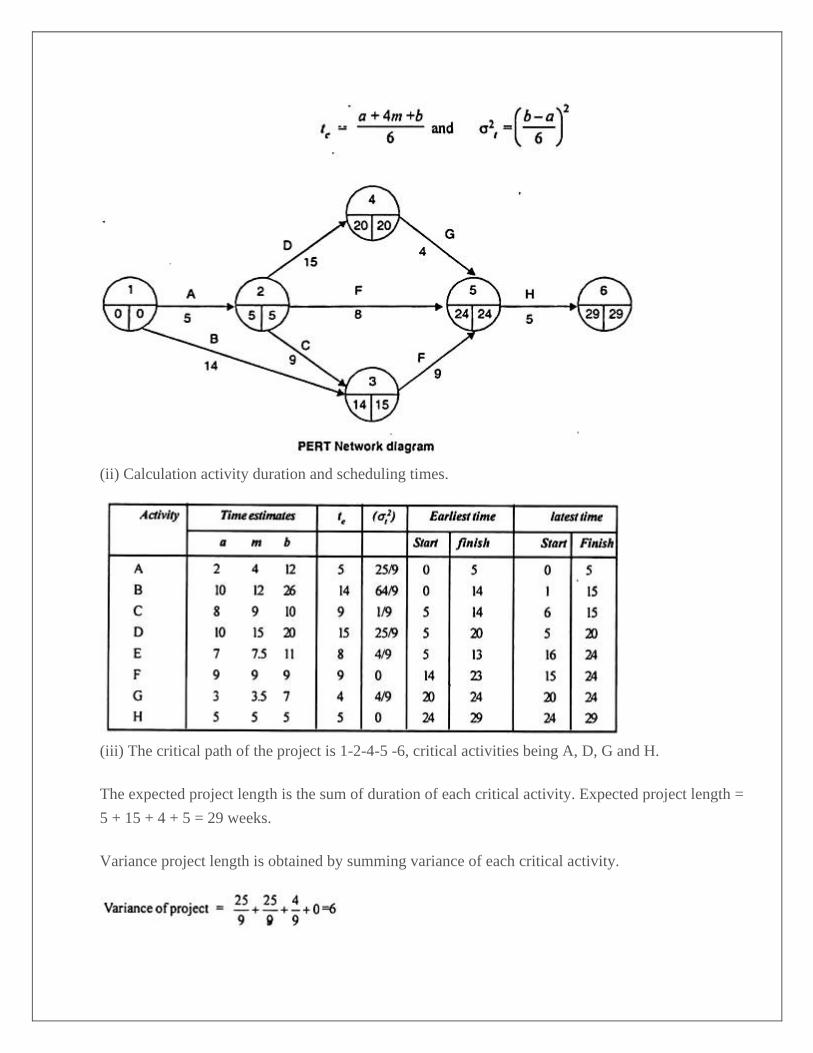
(ii) Calculation activity duration and scheduling times.
(iii) The critical path of the project is 1-2-4-5 -6, critical activities being A, D, G and H.
The expected project length is the sum of duration of each critical activity. Expected project length =
5 + 15 + 4 + 5 = 29 weeks.
Variance project length is obtained by summing variance of each critical activity.
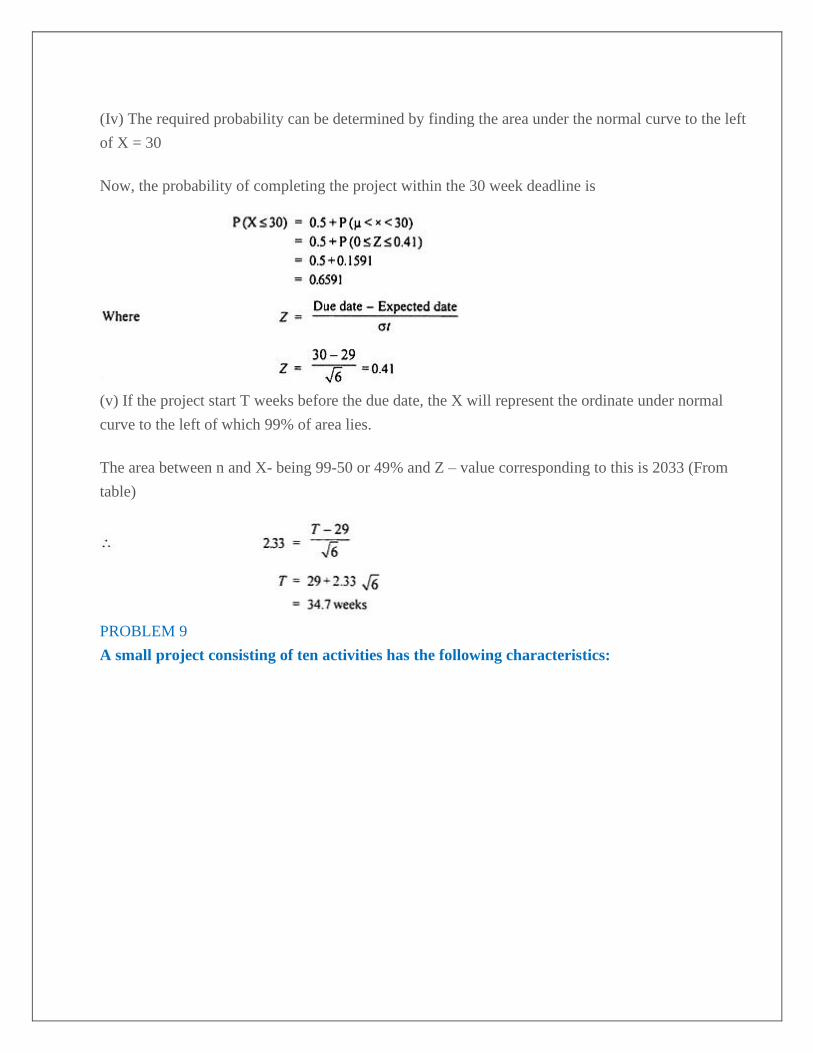
(Iv) The required probability can be determined by finding the area under the normal curve to the left
of X = 30
Now, the probability of completing the project within the 30 week deadline is
(v) If the project start T weeks before the due date, the X will represent the ordinate under normal
curve to the left of which 99% of area lies.
The area between n and X- being 99-50 or 49% and Z – value corresponding to this is 2033 (From
table)
PROBLEM 9
A small project consisting of ten activities has the following characteristics:
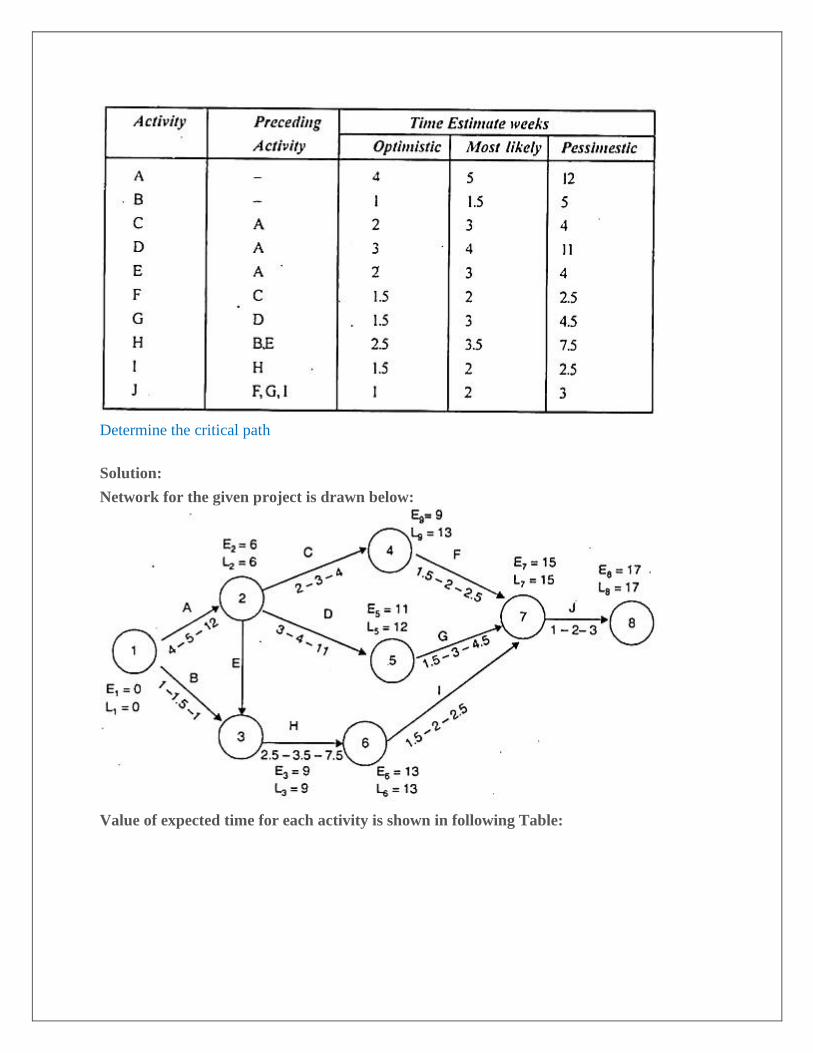
Determine the critical path
Solution:
Network for the given project is drawn below:
Value of expected time for each activity is shown in following Table:
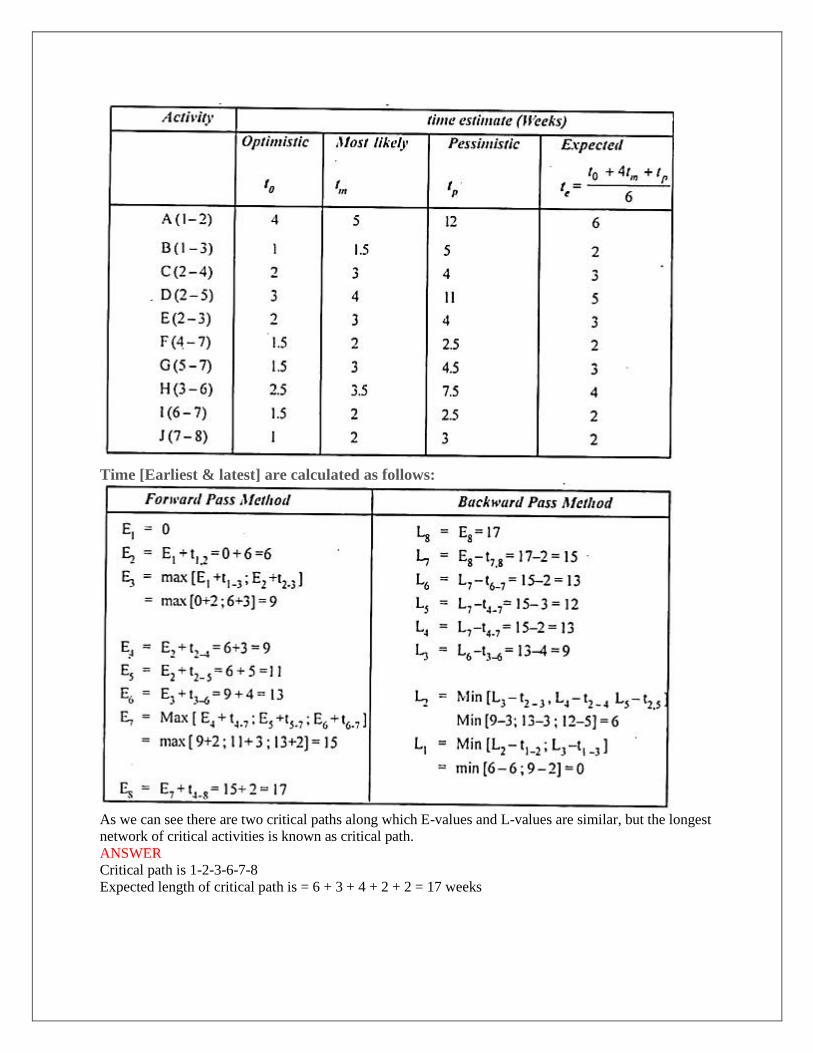
Time [Earliest & latest] are calculated as follows:
As we can see there are two critical paths along which E-values and L-values are similar, but the longest
network of critical activities is known as critical path.
ANSWER
Critical path is 1-2-3-6-7-8
Expected length of critical path is = 6 + 3 + 4 + 2 + 2 = 17 weeks
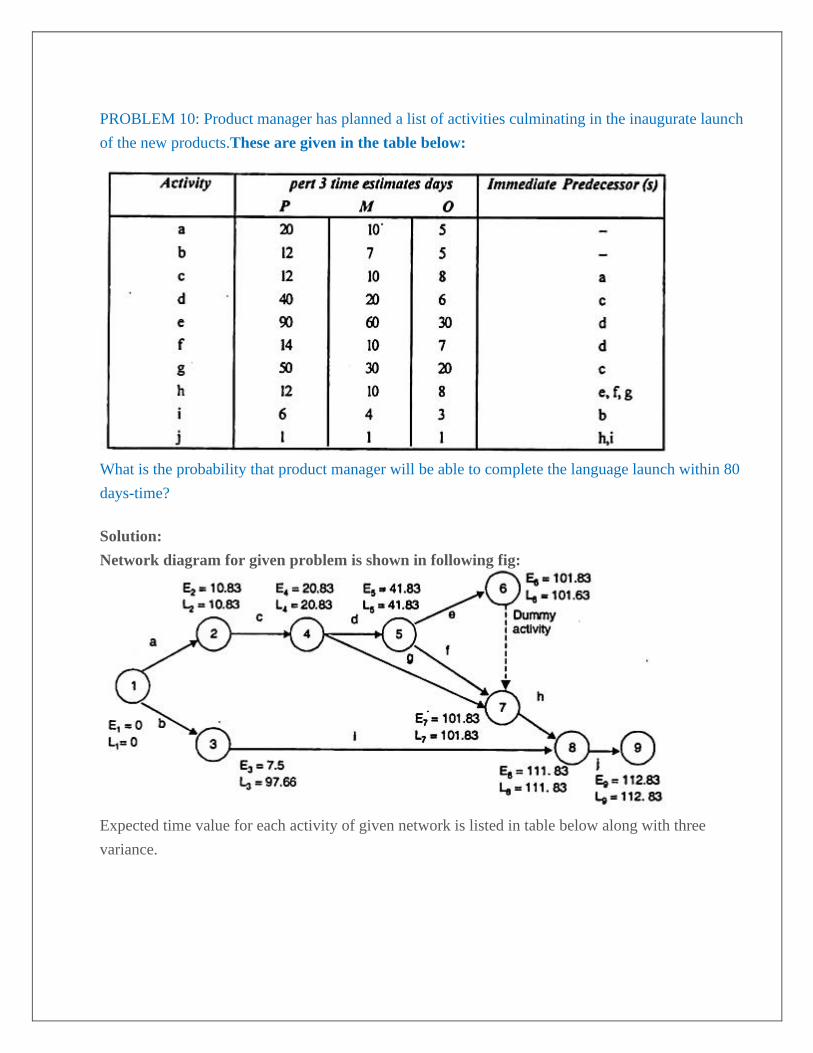
PROBLEM 10: Product manager has planned a list of activities culminating in the inaugurate launch
of the new products.These are given in the table below:
What is the probability that product manager will be able to complete the language launch within 80
days-time?
Solution:
Network diagram for given problem is shown in following fig:
Expected time value for each activity of given network is listed in table below along with three
variance.
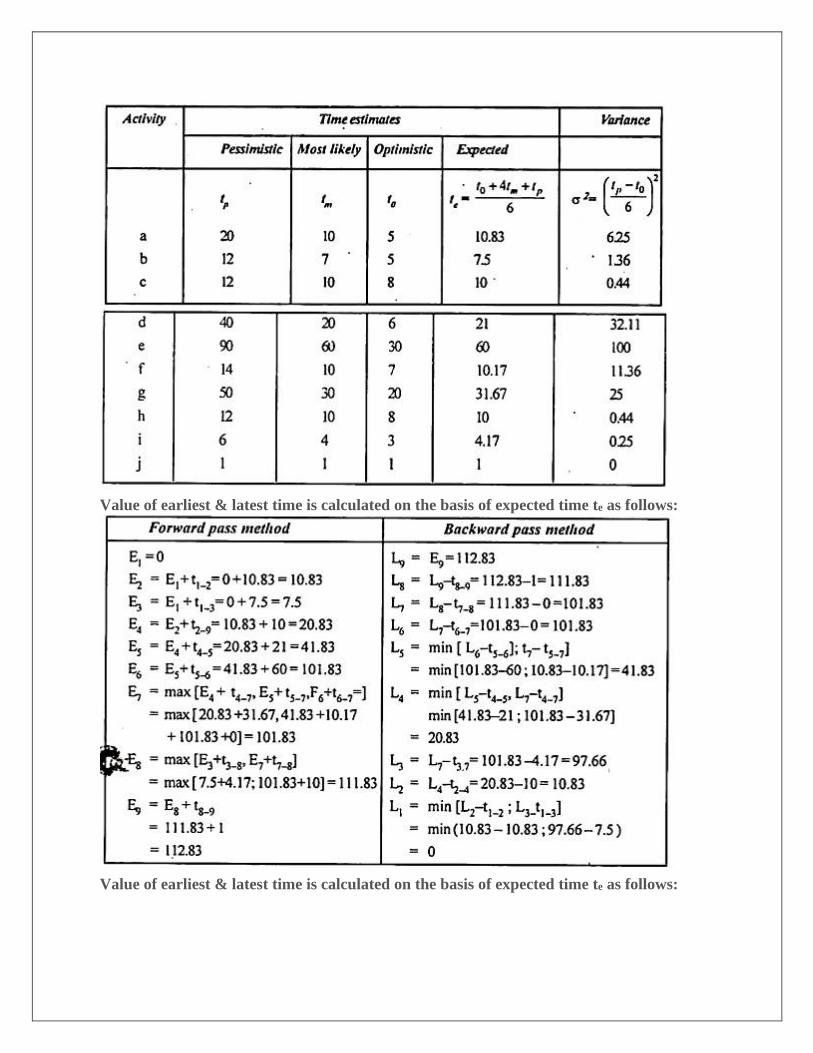
Value of earliest & latest time is calculated on the basis of expected time te as follows:
Value of earliest & latest time is calculated on the basis of expected time te as follows:
Hence critical path along with E-value and L- value are same i.e., 1- 2-4-5-6-7- 8-9 Expected project
duration is 172.83 days
Variance of project length = Sum of variance of each critical activity = 6.25 + 0.44 + 32.11
+100+1.36+.44+0= 140.6
For Z = -2.77 Probability of completing the project with 80 days-time i.e., 0.3%.
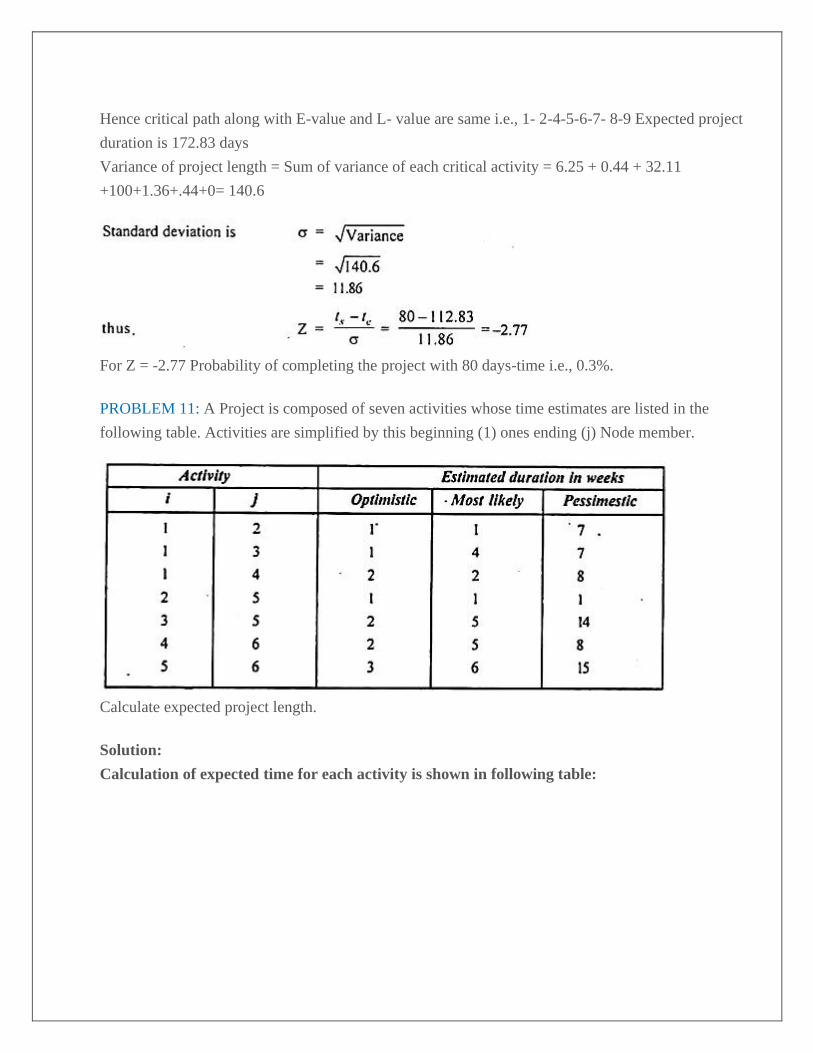
PROBLEM 11: A Project is composed of seven activities whose time estimates are listed in the
following table. Activities are simplified by this beginning (1) ones ending (j) Node member.
Calculate expected project length.
Solution:
Calculation of expected time for each activity is shown in following table:
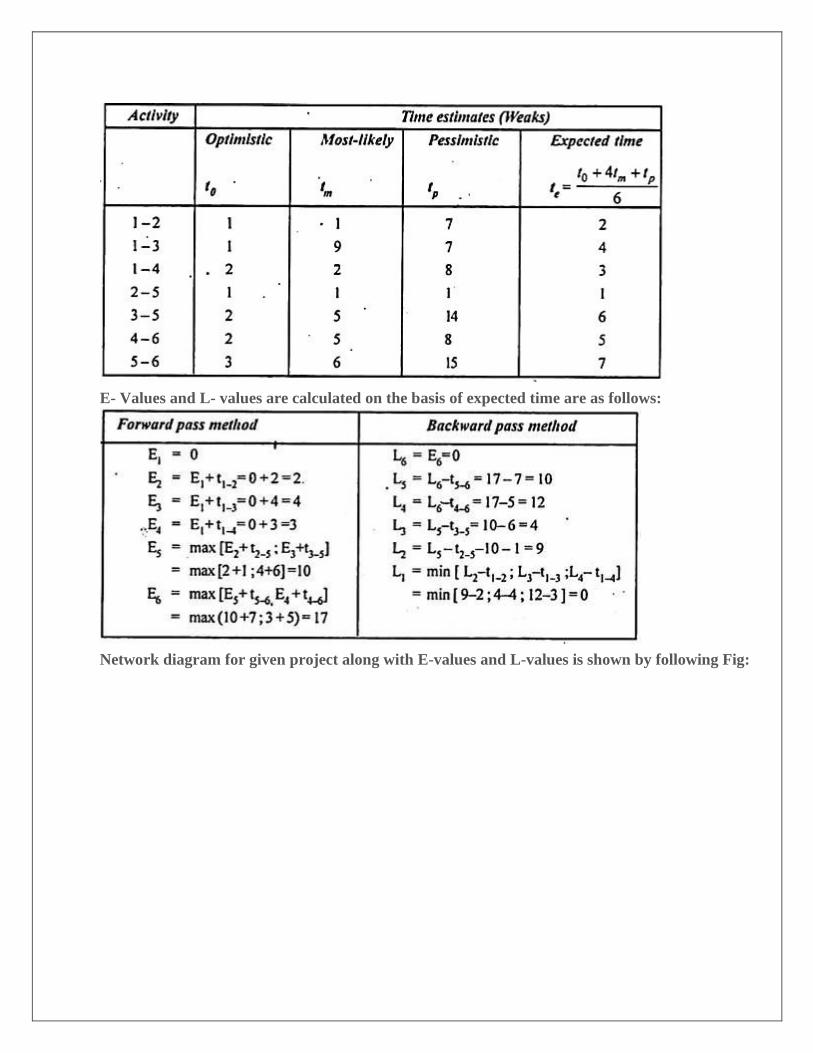
E- Values and L- values are calculated on the basis of expected time are as follows:
Network diagram for given project along with E-values and L-values is shown by following Fig:
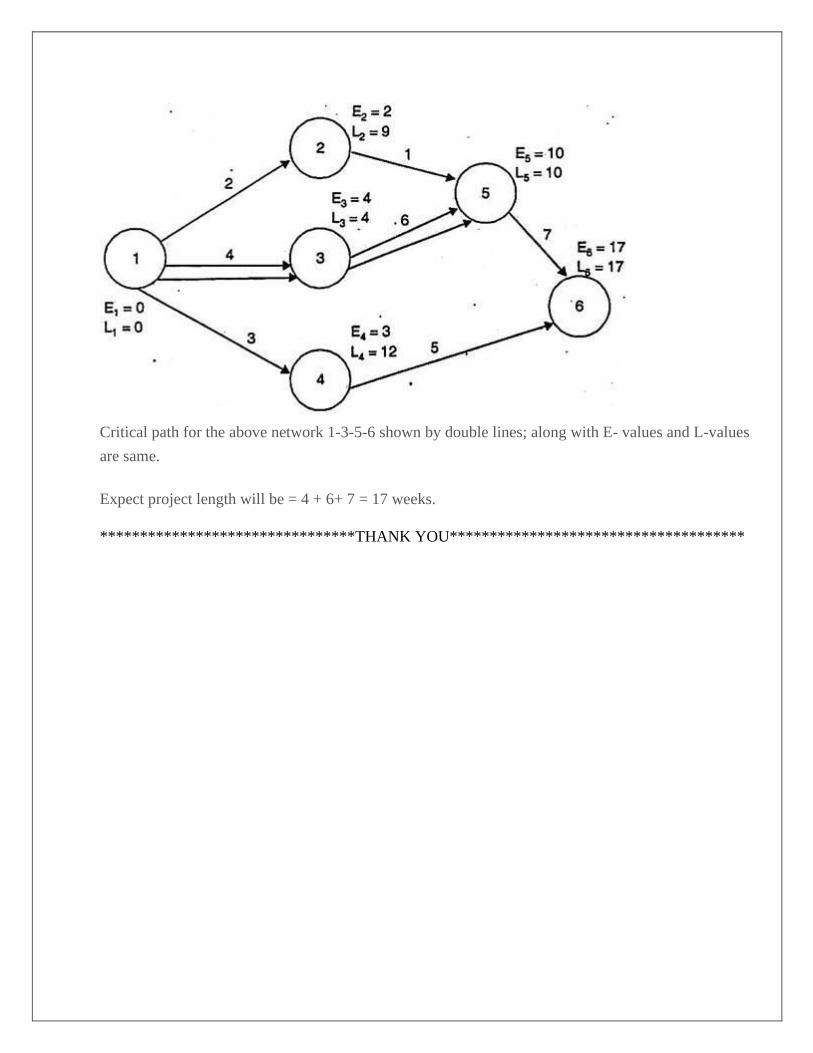
Critical path for the above network 1-3-5-6 shown by double lines; along with E- values and L-values
are same.
Expect project length will be = 4 + 6+ 7 = 17 weeks.
********************************THANK YOU*************************************